UNITED STATES
SECURITIES AND EXCHANGE COMMISSION
Washington, D.C. 20549
FORM N-CSR
CERTIFIED SHAREHOLDER REPORT OF REGISTERED
MANAGEMENT INVESTMENT COMPANIES
Investment Company Act file number 811-04367
Columbia Funds Series Trust I
(Exact name of registrant as specified in charter)
50606 Ameriprise Financial Center, Minneapolis, Minnesota 55474
(Address of principal executive offices) (Zip code)
Scott R. Plummer
5228 Ameriprise Financial Center
One Financial Center
Minneapolis, MN 55474
(Name and address of agent for service)
Registrant’s telephone number, including area code: 1-612-671-1947
Date of fiscal year end: March 31
Date of reporting period: March 31, 2010
Form N-CSR is to be used by management investment companies to file reports with the Commission not later than 10 days after the transmission to stockholders of any report that is required to be transmitted to stockholders under Rule 30e-1 under the Investment Company Act of 1940 (17 CFR 270.30e-1). The Commission may use the information provided on Form N-CSR in its regulatory, disclosure review, inspection, and policymaking roles.
A registrant is required to disclose the information specified by Form N-CSR, and the Commission will make this information public. A registrant is not required to respond to the collection of information contained in Form N-CSR unless the Form displays a currently valid Office of Management and Budget (“OMB”) control number. Please direct comments concerning the accuracy of the information collection burden estimate and any suggestions for reducing the burden to Secretary, Securities and Exchange Commission, 450 Fifth Street, NW, Washington, DC 20549-0609. The OMB has reviewed this collection of information under the clearance requirements of 44 U.S.C. § 3507.
| Item 1. | Reports to Stockholders. |

Annual Report
March 31, 2010
Columbia U.S. Treasury
Index Fund
Not FDIC Insured Ÿ May Lose Value Ÿ No Bank Guarantee
Table of Contents
The views expressed in this report reflect the current views of the respective parties. These views are not guarantees of future performance and involve certain risks, uncertainties and assumptions that are difficult to predict, so actual outcomes and results may differ significantly from the views expressed. These views are subject to change at any time based upon economic, market or other conditions and the respective parties disclaim any responsibility to update such views. These views may not be relied on as investment advice and, because investment decisions for a Columbia Fund are based on numerous factors, may not be relied on as an indication of trading intent on behalf of any particular Columbia Fund. References to specific securities should not be construed as a recommendation or investment advice.
President’s Message

Dear Shareholder:
On May 3, 2010, Ameriprise Financial, Inc. announced that it had completed the acquisition of the long-term asset management business of Columbia Management from Bank of America. This includes the business of managing its equity and fixed-income mutual funds. Ameriprise Financial has combined its current U.S. asset management business, RiverSource Investments, LLC, with Columbia Management. This transaction puts together two leading asset management firms to create one entity that ranks as the eighth largest manager of long-term mutual fund assets in the United States.1 This combined business will operate under the well-regarded Columbia Management brand, where we will build on the strengths of our combined investment capabilities and
talent, our broad and diversified product lineup and exceptional service.
Our combined business has a new breadth and depth of investment choices. William “Ted” Truscott, CEO, U.S. asset management and president of annuities for Ameriprise Financial, leads the combined U.S. asset management business. Michael Jones serves as president, U.S. asset management. Colin Moore continues to serve as chief investment officer. I am also continuing in my role as head of mutual funds, responsible for the delivery of mutual fund products and services to investors. The Columbia funds’ advisers, distributor and transfer agent are now subsidiaries of our parent company, Ameriprise Financial but operate under the Columbia Management name. You will begin to see these names used in communications and statements going forward.
| | |
| | | Service Provider Name |
| Advisers | | Columbia Management Investment Advisers, LLC Columbia Wanger Asset Management, LLC |
| Distributor | | Columbia Management Investment Distributors, Inc. |
| Transfer Agent | | Columbia Management Investment Services Corp. |
As a valued investor in Columbia funds, please know that our goal is to ensure a smooth transition and provide the highest quality products and services. Transition teams across the organization continue their efforts to build on best practices from both legacy organizations with integration efforts including rebranding, vendor and system consolidations and client communications. Additionally, we want to assure you that the funds’ portfolio managers also continue to focus on providing uninterrupted service to all fund shareholders.
Although we have a lot of work ahead of us in 2010, Columbia Management and Ameriprise Financial are excited about the opportunities for our combined organization. I share this optimism and believe it positions us as a best-in-class asset management business with the ability to deliver more for our clients than ever before.
Sincerely,

J. Kevin Connaughton
President, Columbia Funds
| 1 | Source: Ameriprise Financial, Inc., based on March 31, 2010 data from the Investment Company Institute |
Investors should consider the investment objectives, risks, charges and expenses of a mutual fund carefully before investing. For a free prospectus, which contains this and other important information about the funds, visit columbiamanagement.com. Read the prospectus carefully before investing.
Securities products offered through Columbia Management Investment Distributors, Inc. (formerly known as RiverSource Fund Distributors, Inc.), member FINRA. Advisory services provided by Columbia Management Investment Advisers, LLC (formerly known as RiverSource Investments, LLC).
© 2010 Columbia Management Investment Advisers, LLC. All rights reserved.
Fund Profile – Columbia U.S. Treasury Index Fund
Performance data quoted represents past performance and current performance may be lower or higher. Past performance is no guarantee of future results. The investment return and principal value will fluctuate so that shares, when redeemed, may be worth more or less than the original cost. Please visit www.columbiafunds.com for daily and most recent month-end performance updates.
Summary
1-year return as of 03/31/10
| | |
| |
 | | –1.53% Class A shares |
| | (without sales charge) |
| |
| | –1.22% Citigroup Bond U.S. Treasury Index1 |
Summary
| n | | For the 12-month period that ended March 31, 2010, the fund’s Class A shares returned negative 1.53% without sales charge. |
| n | | U.S. Treasury securities underperformed most other fixed-income asset classes. |
| n | | Long-term rates rose during the period, while short-term yields remained at historically low levels. |
Portfolio Management
Jonathan P. Carlson has managed the fund since March 2008 and has been associated with the advisor or its predecessors since 2007.
Effective May 1, 2010, William Finan and Orham Imer became co-managers of the fund replacing Jonathan P. Carlson. Mr. Finan and Mr. Imer have been associated with the advisor or its predecessor since 2009.
Effective May 1, 2010, RiverSource Investments, LLC, a subsidiary of Ameriprise Financial, Inc., became the investment advisor to the fund and changed its name to Columbia Management Investment Advisers, LLC. Please see the fund’s prospectus, as supplemented, for more information regarding the change in investment advisor and certain other changes.
| 1 | The Citigroup Bond U.S. Treasury Index is composed of all U.S. Treasury notes and bonds with remaining maturities of at least one year and outstanding principal of at least $25 million that are included in the Citigroup Broad Investment-Grade Bond Index. Securities in the Citigroup Bond U.S. Treasury Index are weighted by market value, that is, the price per bond or note multiplied by the number of bonds or notes outstanding. Indices are not available for investment, are not professionally managed and do not reflect sales charges, fees, brokerage commissions, taxes or other expenses of investing. Securities in the fund may not match those in an index. |
1
Economic Update – Columbia U.S. Treasury Index Fund
After a deep and difficult recession, the U.S. economy regained its footing midway through calendar year 2009. Gross domestic product (GDP) turned positive in the third quarter of 2009, rising 2.2%, and then gained 5.6% in the fourth quarter according to the estimate released by the Bureau of Economic Analysis. Growth was primarily the result of a slowdown in inventory reduction and of federal government stimulus spending. Hopes for a sustained recovery now depend on a variety of factors, including continued improvement in consumer spending, an increase in revenues to keep business profits moving higher and a turnaround in the labor market.
The housing market showed some signs of stabilizing, but stopped short of meaningful improvement during the period. Home sales moved higher in 2009 as new homebuyers took advantage of a federal tax credit. However, as the tax credit was set to expire in November 2009, sales slipped — and did not revive even though the tax credit was expanded and extended through April 2010. Housing prices remained relatively flat over the past year, but that was progress compared to 2008. The average home price fell sharply in 2008; and since then distressed properties, which account for approximately 40% of all housing sales, have held prices down because they are heavily discounted.
In the beleaguered labor market, there was some good news. While businesses continued to shed jobs through most of 2009, raising the unemployment rate to 9.7% at the end of period*, job data turned positive in March 2010, buoyed by a swell of temporary workers hired to conduct the national once-in-a-decade census. Consumer spending also trended higher in the second half of the period. In fact, March year-over-year sales made a significant jump upward. Despite these improvements, consumer confidence, as measured monthly by The Conference Board, an independent research organization, failed to gain much ground during the year. Consumers surveyed continue to cite uncertain business conditions and still-weak labor prospects for their concerns.
On the business side of the economy, manufacturing activity gained momentum. A key measure of the nation’s manufacturing situation — the Institute for Supply Management’s Index — rose above 50 in July 2009 then rose for eight consecutive months to remain well above 50 for the remainder of the period. (An index value of 50+ indicates a growing economy.) Industrial production moved higher for eleven out of the past 12 months, and durable goods orders took off, with a big jump upward in January. Manufacturing capacity utilization inched upward to 72.7%.
Bonds returns ranged from solid to strong
As hopes for a recovery materialized, bonds from non-Treasury sectors delivered solid returns. The Barclays Capital Aggregate Bond Index1 returned 7.69%. Municipal bonds gained more than taxable investment-grade bonds even without factoring in potential tax advantages to investors in higher income-tax brackets. The Barclays
| * | Source: U.S. Bureau of Labor Statistics |
| 1 | The Barclays Capital Aggregate Bond Index is a market value-weighted index that tracks the daily price, coupon, pay-downs, and total return performance of fixed-rate, publicly placed, dollar-denominated, and non-convertible investment grade debt issues with at least $250 million par amount outstanding and with at least one year to final maturity. |
Summary
For the 12-month period that ended March 31, 2010
| | n | | As investors grew more comfortable with risk, non-Treasury sectors of the bond market rebounded. The Barclays Capital Aggregate Bond Index delivered solid results. High-yield bonds outperformed stocks, as measured by the BofA Merrill Lynch U.S. High Yield Cash Pay Index. | |
| | |
| Barclays Aggregate Index | | BofA ML Index |
| |

| |
|
7.69% | | 55.67% |
| | n | | Stock markets rebounded around the world, as measured by the S&P 500 Index and the MSCI EAFE Index. | |
| | |
| S&P Index | | MSCI Index |
| |
| |
|
49.77% | | 54.44% |
2
Economic Update (continued) – Columbia U.S. Treasury Index Fund
Capital Municipal Bond Index2 returned 9.69%. The high-yield bond market was even stronger than the broad stock market during the period. For the 12 months covered by this report, the BofA Merrill Lynch U.S. High Yield Cash Pay Index3 returned 55.67%.
The yield on the 10-year U.S. Treasury, a common bellwether for the bond market, rose from 2.7% to 3.8% during the 12-month period. Yet despite the pickup in economic activity, the Federal Reserve Board (the Fed) kept a key short-term interest rate — the federal funds rate — close to zero throughout the period.
Stocks staged a solid comeback
Against a strengthening economic backdrop, a stock market rally that began in mid-March 2009 continued with little interruption through the end of the period. The U.S. stock market returned 49.77% for the 12-month period, as measured by the S&P 500 Index.4 Mid-cap stocks outperformed large- and small-cap stocks, and value stocks outperformed growth stocks by a solid margin, as measured by their respective Russell indices.5 Outside the United States, stock market returns were slightly stronger. The MSCI EAFE Index,6 a broad gauge of stock market performance in foreign developed markets, gained 54.44% (net of dividends, in U.S. dollars) for the period. Emerging stock markets were caught in a downdraft in 2008, but they bounced back stronger than domestic or developed world markets as their economic growth generally outpaced the developed world. The MSCI Emerging Markets Index7 returned 81.08% (net of dividends, in U.S. dollars) for the 12-month period, after giving back some gains in the first quarter of 2010.
Past performance is no guarantee of future results.
| 2 | The Barclays Capital Municipal Bond Index is considered representative of the broad market for investment-grade, tax-exempt bonds with a maturity of at least one year. |
| 3 | The BofA Merrill Lynch U.S. High Yield Cash Pay Index tracks the performance of non-investment-grade corporate bonds. |
| 4 | The Standard & Poor’s (S&P) 500 Index tracks the performance of 500 widely held, large-capitalization U.S. stocks. |
| 5 | The Russell 1000 Index tracks the performance of 1,000 of the largest U.S. companies, based on market capitalization. The Russell MidCap Index measures the performance of the 800 smallest companies in the Russell 1000 Index, which represents approximately 25% of the total market capitalization of the Russell 1000 Index. The Russell 2000 Index measures the performance of the 2,000 smallest companies in the Russell 3000 Index, which represents approximately 8% of the total market capitalization of the Russell 3000 Index. The Russell 3000 Growth Index measures the performance of those Russell 3000 Index companies with higher price-to-book ratios and higher forecasted growth values. The stocks in this index are also members of either the Russell 1000 Growth or the Russell 2000 Growth indexes. The Russell 3000 Value Index measures the performance of those Russell 3000 Index companies with lower price-to-book ratios and lower forecasted growth values. The stocks in this index are also members of either the Russell 1000 Value or the Russell 2000 Value indices. |
| 6 | The Morgan Stanley Capital International Europe, Australasia, Far East (MSCI EAFE) Index is a capitalization-weighted index that tracks the total return of common stocks in 21 developed-market countries within Europe, Australasia and the Far East. |
| 7 | The Morgan Stanley Capital International Emerging Markets Index (MSCI EMI) is a free float-adjusted market capitalization index that is designed to measure equity market performance in the global emerging markets. As of June 2009, the MSCI Emerging Markets Index consisted of the following 22 emerging market country indices: Brazil, Chile, China, Colombia, Czech Republic, Egypt, Hungary, India, Indonesia, Israel, Korea, Malaysia, Mexico, Morocco, Peru, Philippines, Poland, Russia, South Africa, Taiwan, Thailand and Turkey. |
Indices are not available for investment, are not professionally managed and do not reflect sales charges, fees, brokerage commissions, taxes or other expenses of investing. Securities in the fund may not match those in an index.
3
Performance Information – Columbia U.S. Treasury Index Fund
Performance data quoted represents past performance and current performance may be lower or higher. Past performance is no guarantee of future results. The investment return and principal value will fluctuate so that shares, when redeemed, may be worth more or less than the original cost. Please visit www.columbiafunds.com for daily and most recent month-end performance updates.
| | |
| Annual operating expense ratio (%)* |
| |
Class A | | 0.66 |
Class B | | 1.41 |
Class C | | 1.41 |
Class Z | | 0.41 |
| * | The annual operating expense ratio is as stated in the fund’s prospectus that is current as of the date of this report. Differences in expense ratios disclosed elsewhere in this report may result from including fee waivers and expense reimbursements as well as different time periods used in calculating the ratios. |
|
| Performance of a $10,000 investment 04/01/00 – 03/31/10 |
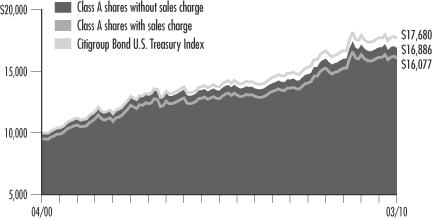
The chart above shows the change in value of a hypothetical $10,000 investment in Class A shares of Columbia U.S. Treasury Index Fund during the stated period, and does not reflect the deduction of taxes that a shareholder may pay on fund distributions or on the redemption of fund shares.
| | | | |
| Performance of a $10,000 investment 04/01/00 – 03/31/10 ($) |
| | |
| Sales charge: | | without | | with |
Class A | | 16,886 | | 16,077 |
Class B | | 15,986 | | 15,986 |
Class C | | 16,159 | | 16,159 |
Class Z | | 17,175 | | n/a |
| | | | | | | | | | | | | | |
| Average annual total return as of 03/31/10 (%) |
| | | | |
| Share class | | A | | B | | C | | Z |
| Inception | | 11/25/02 | | 11/25/02 | | 11/25/02 | | 06/04/91 |
| Sales charge | | without | | with | | without | | with | | without | | with | | without |
1-year | | –1.53 | | –6.20 | | –2.26 | | –7.04 | | –2.12 | | –3.07 | | –1.38 |
5-year | | 4.71 | | 3.70 | | 3.93 | | 3.58 | | 4.08 | | 4.08 | | 4.94 |
10-year | | 5.38 | | 4.86 | | 4.80 | | 4.80 | | 4.92 | | 4.92 | | 5.56 |
The “with sales charge” returns include the maximum initial sales charge of 4.75% for Class A shares and the applicable contingent deferred sales charge of 5.00% in the first year, declining to 1.00% in the sixth year and eliminated thereafter for Class B shares and 1.00% for Class C shares for the first year only. The “without sales charge” returns do not include the effect of sales charges. If they had, returns would be lower.
Performance results reflect any fee waivers or reimbursements of fund expenses by the investment advisor and/or any of its affiliates. Absent these fee waivers or expense reimbursement arrangements, performance results would have been lower.
All results shown assume reinvestment of distributions. Class Z shares are sold at net asset value with no distribution and service (Rule 12b-1) fees. Class Z shares have limited eligibility and the investment minimum requirements may vary. Please see the fund’s prospectus for details. Performance for different share classes will vary based on differences in sales charges and fees associated with each class.
Class A, Class B, Class C and Class Z share performance information includes returns of Trust shares of the Galaxy II U.S. Treasury Index Fund, the predecessor to the Fund and a series of the Galaxy Fund (the “Predecessor Fund”), for periods prior to November 25, 2002, the date on which Class A, Class B, Class C and Class Z shares were initially offered by the Fund. These returns shown for all share classes reflect any differences in sales charges, but have not been restated to reflect any differences in expenses between the Predecessor Fund share class and the newer share classes. If differences in expenses had been reflected, the returns shown for periods prior to November 25, 2002 would be lower for Class A, Class B and Class C shares.
The tables do not reflect the deduction of taxes that a shareholder may pay on fund distributions or on the redemption of fund shares.
4
Understanding Your Expenses – Columbia U.S. Treasury Index Fund
Estimating your actual expenses
To estimate the expenses that you paid over the period, first you will need your account balance at the end of the period:
| | n | | For shareholders who receive their account statements from Columbia Management Services, Inc., your account balance is available online at www.columbiafunds.com or by calling Shareholder Services at 800.345.6611. | |
| | n | | For shareholders who receive their account statements from their financial intermediary, contact your financial intermediary to obtain your account balance. | |
| | 1. | Divide your ending account balance by $1,000. For example, if an account balance was $8,600 at the end of the period, the result would be 8.6. | |
| | 2. | In the section of the table below titled “Expenses paid during the period,” locate the amount for your share class. You will find this number in the column labeled “Actual.” Multiply this number by the result from step 1. Your answer is an estimate of the expenses you paid on your account during the period. | |
If the value of your account falls below the minimum initial investment requirement applicable to you, your account generally will be subject to a $20 annual fee. This fee is not included in the accompanying table. If you are subject to the fee, keep it in mind when you are estimating the ongoing expenses of investing in the fund and when comparing the expenses of this fund with other funds.
As a fund shareholder, you incur two types of costs. There are transaction costs, which generally include sales charges on purchases and may include redemption fees or exchange fees. There are also ongoing costs, which generally include investment advisory fees, distribution and service (Rule 12b-1) fees and other fund expenses. The information on this page is intended to help you understand the ongoing costs of investing in the fund and to compare these costs with the ongoing costs of investing in other mutual funds.
Analyzing your fund’s expenses by share class
To illustrate these ongoing costs, we have provided an example and calculated the expenses paid by investors in each share class during the period. The information in the following table is based on an initial investment of $1,000, which is invested at the beginning of the period and held for the entire period. Expense information is calculated two ways and each method provides you with different information. The amount listed in the “Actual” column is calculated using the fund’s actual operating expenses and total return for the period. The amount listed in the “Hypothetical” column for each share class assumes that the return each year is 5% before expenses and is calculated based on the fund’s actual operating expenses. You should not use the hypothetical account values and expenses to estimate either your actual account balance at the end of the period or the expenses you paid during this period.
Compare with other funds
Since all mutual funds are required to include the same hypothetical calculations about expenses in shareholder reports, you can use this information to compare the ongoing costs of investing in the fund with other funds. To do so, compare the 5% hypothetical example with the 5% hypothetical examples that appear in the shareholder reports of other funds. As you compare hypothetical examples of other funds, it is important to note that hypothetical examples are meant to highlight the ongoing costs of investing in a fund and do not reflect any transaction costs, such as sales charges, redemption fees or exchange fees.
| | | | | | | | | | | | | | |
| 10/01/09 – 03/31/10 |
| | | | |
| | | Account value at the
beginning of the period ($) | | Account value at the
end of the period ($) | | Expenses paid
during the period ($) | | Fund’s annualized
expense ratio (%) |
| | | Actual | | Hypothetical | | Actual | | Hypothetical | | Actual | | Hypothetical | | Actual |
Class A | | 1,000.00 | | 1,000.00 | | 996.30 | | 1,022.69 | | 2.24 | | 2.27 | | 0.45 |
Class B | | 1,000.00 | | 1,000.00 | | 992.60 | | 1,018.95 | | 5.96 | | 6.04 | | 1.20 |
Class C | | 1,000.00 | | 1,000.00 | | 993.30 | | 1,019.70 | | 5.22 | | 5.29 | | 1.05 |
Class Z | | 1,000.00 | | 1,000.00 | | 997.50 | | 1,023.93 | | 1.00 | | 1.01 | | 0.20 |
Expenses paid during the period are equal to the annualized expense ratio for the share class, multiplied by the average account value over the period, then multiplied by the number of days in the fund’s most recent fiscal half-year and divided by 365.
Had the investment advisor and/or any of its affiliates not waived fees or reimbursed a portion of expenses, account value at the end of the period would have been reduced.
It is important to note that the expense amounts shown in the table are meant to highlight only ongoing costs of investing in the fund and do not reflect any transaction costs, such as sales charges, redemption fees or exchange fees. Therefore, the hypothetical examples provided may not help you determine the relative total costs of owning shares of different funds. If these transaction costs were included, your costs would have been higher.
5
Portfolio Manager’s Report – Columbia U.S. Treasury Index Fund
Performance data quoted represents past performance and current performance may be lower or higher. Past performance is no guarantee of future results. The investment return and principal value will fluctuate so that shares, when redeemed, may be worth more or less than the original cost. Please visit www.columbiafunds.com for daily and most recent month-end performance updates.
| | |
| Net asset value per share |
|
as of 03/31/10 ($) |
Class A | | 11.12 |
Class B | | 11.12 |
Class C | | 11.12 |
Class Z | | 11.11 |
| | |
| Distributions declared per share |
|
04/01/09 – 03/31/10 ($) |
Class A | | 0.34 |
Class B | | 0.26 |
Class C | | 0.27 |
Class Z | | 0.37 |
For the 12-month period that ended March 31, 2010, the fund’s Class A shares returned negative 1.53% without sales charge. The fund’s Class Z shares returned negative 1.38%. The Citigroup Bond U.S. Treasury Index posted a total return of negative 1.22% over the same period. The fund incurs expenses while the index does not, and fees generally accounted for the slight difference between the fund’s return and that of the index. For this reason, we routinely lend the fund’s securities in an effort to offset the impact of fees, but the effect that this activity had on the portfolio over the last twelve months was not enough to offset the fees charged by the fund. In a challenging environment for Treasury securities, the fund held up considerably better than the average fund in its peer group, the Lipper General U.S. Treasury Funds Classification,1 which lost 4.48% for the period.
It is a relatively unusual circumstance for the Treasury index to produce negative returns for a 12-month period. In this case the unfavorable results were caused by several factors. One was that short-term Treasury yields were kept at historically low levels by the Federal Reserve Board as part of its ongoing efforts to stimulate the national economy. In addition, the supply/demand picture for longer maturities was unfavorable. As the macroeconomic picture improved, fixed-income investors sought riskier, higher-yielding alternatives to Treasury securities, but Treasury issuance remained extremely high as the government funded its various stimulus programs. The combination forced yields higher and long-term bond prices lower. The yield on the 30-year Treasury increased from 3.5 percent to 4.7 percent between March of 2009 and March of 2010, and the prices of longer-term bonds sustained double-digit percentage losses.
Inflation outlook
A widely-held belief that inflation would return to the national economic landscape also hurt the performance of longer-term Treasuries during the period. Our view was that this fear was either premature or exaggerated. We felt that the ongoing weakness in the housing market, coupled with a powerful trend toward deleveraging of financial and corporate balance sheets, would keep inflation at bay in the near term, and indeed the Consumer Price Index rose only moderately over the past 12 months.
Looking forward, however, the idea that vast quantities of stimulus money will eventually prove inflationary has widespread backing, and arguably becomes more likely as the economy improves. The Federal Reserve Board has yet to raise short-term rates in response to the inflation threat and may wait until late 2010 or even 2011 before acting. Yet, some upward move from today’s depressed levels appears inevitable. Weighing all of these factors, we take a cautious view of the Treasury market in the year ahead.
| 1 | Lipper Inc., a widely respected data provider in the industry, calculates an average total return (assuming reinvestment of distributions) for mutual funds with investment objectives similar to those of the fund. Lipper makes no adjustment for the effect of sales loads. |
6
Portfolio Manager’s Report (continued) – Columbia U.S. Treasury Index Fund
| | |
| Maturity breakdown |
|
as of 03/31/10 (%) |
1-5 years | | 63.8 |
5-10 years | | 22.2 |
10-20 years | | 7.7 |
20 years and over | | 6.3 |
| | |
| Asset allocation |
|
as of 03/31/10 (%) |
Government obligations | | 98.6 |
Cash & Equivalents | | 1.4 |
Maturity breakdown and asset allocation are calculated as a percentage of total investments, excluding securities lending collateral. The fund is actively managed and the composition of its portfolio will change over time.
Portfolio holdings and characteristics are subject to change periodically and may not be representative of current holdings and characteristics. The outlook for the fund may differ from those presented for other Columbia Funds.
The value of the fund may be affected by interest rate changes and the creditworthiness of issuers held in the fund. When interest rates go up, bond prices typically drop, and vice versa.
The fund is subject to indexing risk. Your investment in the fund will typically decline in value when its index declines. Since the fund is designed to track its index, the fund cannot purchase other securities that may help offset declines in its index. In addition, because the fund may not hold all issues included in its index, may not always be fully invested and bears transaction costs and expenses, the fund’s performance may fail to match the performance of its index, after taking expenses into account. Security prices in a market, sector or industry may fall, reducing the value of your investment. Fund shares are not guaranteed or backed by the U.S. government or any agency.
7
Investment Portfolio – Columbia U.S. Treasury Index Fund
March 31, 2010
Government & Agency Obligations – 99.3%
| | | | |
| | | Par ($) | | Value ($) |
| U.S. Treasury Bonds – 16.7% | | | | |
3.500% 02/15/39 (a) | | 4,160,000 | | 3,366,351 |
4.375% 11/15/39 (a) | | 3,140,000 | | 2,969,263 |
4.500% 02/15/36 (a) | | 4,710,000 | | 4,600,347 |
4.500% 05/15/38 | | 3,750,000 | | 3,638,085 |
4.500% 08/15/39 (a) | | 3,080,000 | | 2,974,125 |
4.625% 02/15/40 | | 3,325,000 | | 3,277,203 |
5.000% 05/15/37 (a) | | 1,870,000 | | 1,969,052 |
5.500% 08/15/28 (a) | | 2,665,000 | | 2,985,216 |
6.125% 11/15/27 (a) | | 4,690,000 | | 5,617,738 |
6.125% 08/15/29 | | 1,310,000 | | 1,577,321 |
6.250% 05/15/30 | | 510,000 | | 624,272 |
6.875% 08/15/25 | | 2,005,000 | | 2,562,328 |
7.250% 08/15/22 (a) | | 3,210,000 | | 4,171,998 |
7.500% 11/15/16 (a) | | 7,115,000 | | 8,985,469 |
7.875% 02/15/21 (a) | | 8,015,000 | | 10,780,175 |
8.125% 08/15/21 (a) | | 735,000 | | 1,008,558 |
8.750% 05/15/17 | | 1,020,000 | | 1,378,593 |
| | | | |
U.S. Treasury Bonds Total | | | | 62,486,094 |
| | | | |
| U.S. Treasury Notes – 82.6% | | | | |
0.750% 11/30/11 (a) | | 11,555,000 | | 11,539,204 |
0.875% 01/31/12 (a) | | 16,205,000 | | 16,186,008 |
1.000% 07/31/11 (a) | | 8,070,000 | | 8,111,609 |
1.000% 08/31/11 (a) | | 11,750,000 | | 11,804,156 |
1.000% 09/30/11 (a) | | 12,900,000 | | 12,951,897 |
1.000% 10/31/11 | | 5,895,000 | | 5,915,497 |
1.125% 06/30/11 (a) | | 10,160,000 | | 10,233,823 |
1.125% 01/15/12 (a) | | 3,935,000 | | 3,949,449 |
1.375% 05/15/12 (a) | | 7,040,000 | | 7,083,451 |
1.375% 09/15/12 (a) | | 3,760,000 | | 3,768,227 |
1.375% 01/15/13 (a) | | 3,950,000 | | 3,937,348 |
1.750% 08/15/12 (a) | | 2,165,000 | | 2,191,556 |
1.875% 06/15/12 (a) | | 6,475,000 | | 6,580,724 |
1.875% 02/28/14 (a) | | 9,160,000 | | 9,082,708 |
1.875% 04/30/14 (a) | | 10,805,000 | | 10,674,162 |
2.125% 11/30/14 | | 3,950,000 | | 3,898,156 |
2.250% 01/31/15 (a) | | 12,055,000 | | 11,924,095 |
2.375% 08/31/14 (a) | | 3,730,000 | | 3,738,743 |
2.375% 09/30/14 (a) | | 5,285,000 | | 5,286,649 |
2.375% 10/31/14 | | 9,865,000 | | 9,851,899 |
2.500% 03/31/13 (a) | | 6,390,000 | | 6,565,227 |
2.625% 06/30/14 (a) | | 10,370,000 | | 10,523,123 |
2.625% 07/31/14 | | 3,100,000 | | 3,142,383 |
2.625% 04/30/16 | | 4,620,000 | | 4,522,906 |
2.750% 02/15/19 (a) | | 8,135,000 | | 7,550,931 |
3.125% 04/30/13 | | 960,000 | | 1,003,500 |
3.125% 09/30/13 (a) | | 12,500,000 | | 13,034,175 |
3.125% 01/31/17 | | 9,440,000 | | 9,372,891 |
3.375% 11/15/19 (a) | | 6,980,000 | | 6,735,156 |
| | | | | |
| | | Par ($) | | Value ($) | |
3.500% 02/15/18 (a) | | 5,670,000 | | 5,687,276 | |
3.625% 08/15/19 | | 5,925,000 | | 5,852,786 | |
3.625% 02/15/20 | | 2,575,000 | | 2,531,145 | |
3.875% 02/15/13 (a) | | 7,695,000 | | 8,211,404 | |
3.875% 05/15/18 (a) | | 5,425,000 | | 5,561,894 | |
4.000% 02/15/15 | | 7,195,000 | | 7,703,147 | |
4.000% 08/15/18 | | 7,905,000 | | 8,142,767 | |
4.250% 08/15/14 (a) | | 4,445,000 | | 4,820,047 | |
4.250% 11/15/17 (a) | | 8,150,000 | | 8,621,168 | |
4.500% 09/30/11 (a) | | 3,065,000 | | 3,237,167 | |
4.500% 04/30/12 (a) | | 7,780,000 | | 8,334,325 | |
4.500% 02/15/16 (a) | | 4,500,000 | | 4,901,836 | |
4.750% 05/15/14 (a) | | 11,170,000 | | 12,332,373 | |
4.750% 08/15/17 (a) | | 2,265,000 | | 2,477,520 | |
| | | | | |
U.S. Treasury Notes Total | | 309,574,508 | |
| | | | | |
Total Government & Agency Obligations (cost of $364,779,882) | | 372,060,602 | |
| |
Securities Lending Collateral – 24.8% | | | |
| | | Shares | | | |
State Street Navigator Securities Lending Prime Portfolio (b)
(7 day yield of 0.219%) | | 92,543,709 | | 92,543,709 | |
| | | | | |
Total Securities Lending Collateral
(cost of $92,543,709) | | 92,543,709 | |
| |
Short-Term Obligation – 1.4% | | | |
| | | Par ($) | | | |
Repurchase agreement with Fixed Income Clearing Corp., dated 03/31/10 due 04/01/10 at 0.000%, collateralized by a U.S. Treasury obligation maturing 11/30/16, market value $5,285,250 (repurchase proceeds $5,181,000) | | 5,181,000 | | 5,181,000 | |
| | | | | |
Total Short-Term Obligation (cost of $5,181,000) | | | | 5,181,000 | |
| | | | | |
Total Investments – 125.5% (cost of $462,504,591)(c) | | | | 469,785,311 | |
| | | | | |
Obligation to Return Collateral for Securities Loaned – (24.8)% | | (92,543,709 | ) |
| | | | | |
Other Assets & Liabilities, Net – (0.7)% | | (2,780,464 | ) |
| | | | | |
Net Assets – 100.0% | | | | 374,461,138 | |
See Accompanying Notes to Financial Statements.
8
Columbia U.S. Treasury Index Fund
March 31, 2010
Notes to Investment Portfolio:
| (a) | All or a portion of this security was on loan at March 31, 2010. The total market value of securities on loan at March 31, 2010 is $87,382,767. |
| (b) | Investment made with cash collateral received from securities lending activity. |
| (c) | Cost for federal income tax purposes is $464,271,826. |
The following table summarizes the inputs used, as of March 31, 2010, in valuing the Fund’s assets:
| | | | | | | | | | | | |
Description | | Quoted Prices
(Level 1) | | Other
Significant
Observable
Inputs
(Level 2) | | Significant
Unobservable
Inputs
(Level 3) | | Total |
Total Government & Agency Obligations | | $ | 372,060,602 | | $ | — | | $ | — | | $ | 372,060,602 |
| | | | | | | | | | | | |
Total Short-Term Obligation | | | — | | | 5,181,000 | | | — | | | 5,181,000 |
Total Securities Lending Collateral | | | 92,543,709 | | | — | | | — | | | 92,543,709 |
| | | | | | | | | | | | |
Total Investments | | $ | 464,604,311 | | $ | 5,181,000 | | $ | — | | $ | 469,785,311 |
| | | | | | | | | | | | |
For more information on valuation inputs, and their aggregation into the levels used in the table above, please refer to the Security Valuation section in the accompanying Notes to Financial Statements.
At March 31, 2010, the Fund held investments in the following:
| | | |
Holdings by Revenue Source (Unaudited) | | % of
Net Assets | |
U.S. Treasury Notes | | 82.6 | |
U.S. Treasury Bonds | | 16.7 | |
| | | |
| | 99.3 | |
Securities Lending Collateral | | 24.8 | |
Short-Term Obligation | | 1.4 | |
Obligation to Return Collateral for Securities Loaned | | (24.8 | ) |
Other Assets & Liabilities, Net | | (0.7 | ) |
| | | |
| | 100.0 | |
| | | |
See Accompanying Notes to Financial Statements.
9
Statement of Assets and Liabilities – Columbia U.S. Treasury Index Fund
March 31, 2010
| | | | | |
| | | | | ($) | |
| Assets | | Investments, at cost | | 462,504,591 | |
| | | | | |
| | Investments at value (including securities on loan of $87,382,767) | | 469,785,311 | |
| | Cash | | 842 | |
| | Receivable for: | | | |
| | Investments sold | | 43,202,198 | |
| | Fund shares sold | | 242,451 | |
| | Interest | | 2,367,068 | |
| | Securities lending | | 4,908 | |
| | Expense reimbursement due from investment advisor | | 67,630 | |
| | Trustees’ deferred compensation plan | | 24,296 | |
| | | |
| | Total Assets | | 515,694,704 | |
| | |
| Liabilities | | Collateral on securities loaned | | 92,543,709 | �� |
| | Payable for: | | | |
| | Investments purchased | | 33,948,490 | |
| | Fund shares repurchased | | 14,162,953 | |
| | Distributions | | 390,624 | |
| | Investment advisory fee | | 33,127 | |
| | Administration fee | | 99,381 | |
| | Trustees’ fees | | 688 | |
| | Distribution and service fees | | 29,877 | |
| | Trustees’ deferred compensation plan | | 24,296 | |
| | Other liabilities | | 421 | |
| | | |
| | Total Liabilities | | 141,233,566 | |
| | | |
| | Net Assets | | 374,461,138 | |
| | |
| Net Assets Consist of | | Paid-in capital | | 368,556,990 | |
| | Overdistributed net investment income | | (1,436,450 | ) |
| | Accumulated net realized gain | | 59,878 | |
| | Net unrealized appreciation (depreciation) on investments | | 7,280,720 | |
| | | |
| | Net Assets | | 374,461,138 | |
See Accompanying Notes to Financial Statements.
10
Statement of Assets and Liabilities (continued) – Columbia U.S. Treasury Index Fund
March 31, 2010
| | | | | | |
| | | | | | |
| Class A | | Net assets | | $ | 47,104,885 | |
| | Shares outstanding | | | 4,237,821 | |
| | Net asset value per share | | $ | 11.12 | (a) |
| | Maximum sales charge | | | 4.75 | % |
| | Maximum offering price per share ($11.12/0.9525) | | $ | 11.67 | (b) |
| | |
| Class B | | Net assets | | $ | 5,809,865 | |
| | Shares outstanding | | | 522,688 | |
| | Net asset value and offering price per share | | $ | 11.12 | (a) |
| | |
| Class C | | Net assets | | $ | 19,568,018 | |
| | Shares outstanding | | | 1,760,483 | |
| | Net asset value and offering price per share | | $ | 11.12 | (a) |
| | |
| Class Z | | Net assets | | $ | 301,978,370 | |
| | Shares outstanding | | | 27,169,209 | |
| | Net asset value, offering and redemption price per share | | $ | 11.11 | |
| (a) | Redemption price per share is equal to net asset value less any applicable contingent deferred sales charge. |
| (b) | On sales of $50,000 or more the offering price is reduced. |
See Accompanying Notes to Financial Statements.
11
Statement of Operations – Columbia U.S. Treasury Index Fund
For the Year Ended March 31, 2010
| | | | | |
| | | | | ($) | |
| Investment Income | | Interest | | 10,516,780 | |
| | Securities lending | | 263,348 | |
| | | |
| | Total Investment Income | | 10,780,128 | |
| | | | | |
| Expenses | | Investment advisory fee | | 374,018 | |
| | Administration fee | | 1,122,055 | |
| | Distribution fee: | | | |
| | Class B | | 56,393 | |
| | Class C | | 184,245 | |
| | Service fee: | | | |
| | Class A | | 148,960 | |
| | Class B | | 18,798 | |
| | Class C | | 61,427 | |
| | Trustees’ fees | | 34,895 | |
| | Other expenses | | 1,808 | |
| | | |
| | Expenses before interest expense | | 2,002,599 | |
| | Interest expense | | 47 | |
| | | |
| | Total Expenses | | 2,002,646 | |
| | |
| | Fees waived or expenses reimbursed by investment advisor | | (659,969 | ) |
| | Fees waived by distributor – Class C | | (36,843 | ) |
| | | |
| | Net Expenses | | 1,305,834 | |
| |
| | | |
| | Net Investment Income | | 9,474,294 | |
| | |
| Net Realized and Unrealized Gain (Loss) on Investments | | Net realized gain on investments | | 3,023,496 | |
| | Net change in unrealized appreciation (depreciation) on investments | | (18,819,863 | ) |
| | | |
| | Net Loss | | (15,796,367 | ) |
| |
| | | |
| | Net Decrease Resulting from Operations | | (6,322,073 | ) |
See Accompanying Notes to Financial Statements.
12
Statement of Changes in Net Assets – Columbia U.S. Treasury Index Fund
| | | | | | | | |
| | | | | Year Ended March 31, | |
| Increase (Decrease) in Net Assets | | 2010 ($) | | | 2009 ($) | |
| Operations | | Net investment income | | 9,474,294 | | | 11,467,061 | |
| | Net realized gain on investments | | 3,023,496 | | | 4,990,291 | |
| | Net change in unrealized appreciation (depreciation) on investments | | (18,819,863 | ) | | 10,008,567 | |
| | | |
| | Net increase (decrease) resulting from operations | | (6,322,073 | ) | | 26,465,919 | |
| | | |
| Distributions to Shareholders | | From net investment income: | | | | | | |
| | Class A | | (1,809,403 | ) | | (1,679,605 | ) |
| | Class B | | (172,057 | ) | | (176,569 | ) |
| | Class C | | (598,810 | ) | | (535,850 | ) |
| | Class Z | | (9,187,511 | ) | | (11,238,690 | ) |
| | From net realized gains: | | | | | | |
| | Class A | | (8,095 | ) | | — | |
| | Class B | | (985 | ) | | — | |
| | Class C | | (3,463 | ) | | — | |
| | Class Z | | (43,196 | ) | | — | |
| | | |
| | Total distributions to shareholders | | (11,823,520 | ) | | (13,630,714 | ) |
| | | |
| | Net Capital Stock Transactions | | (23,765,633 | ) | | 91,137,254 | |
| | | | | | | | |
| | Total increase (decrease) in net assets | | (41,911,226 | ) | | 103,972,459 | |
| | | |
| Net Assets | | Beginning of period | | 416,372,364 | | | 312,399,905 | |
| | End of period | | 374,461,138 | | | 416,372,364 | |
| | Overdistributed net investment income at end of period | | (1,436,450 | ) | | (1,601,721 | ) |
See Accompanying Notes to Financial Statements.
13
Statement of Changes in Net Assets (continued) – Columbia U.S. Treasury Index Fund
| | | | | | | | | | | | |
| | | Capital Stock Activity | |
| | | Year Ended
March 31, 2010 | | | Year Ended
March 31, 2009 | |
| | | Shares | | | Dollars ($) | | | Shares | | | Dollars ($) | |
Class A | | | | | | | | | | | | |
Subscriptions | | 2,609,304 | | | 29,342,018 | | | 10,949,753 | | | 124,386,787 | |
Distributions reinvested | | 118,760 | | | 1,337,514 | | | 109,889 | | | 1,251,843 | |
Redemptions | | (5,286,491 | ) | | (59,286,808 | ) | | (5,844,659 | ) | | (67,488,577 | ) |
| | | | | | | | | | | | |
Net increase (decrease) | | (2,558,427 | ) | | (28,607,276 | ) | | 5,214,983 | | | 58,150,053 | |
Class B | | | | | | | | | | | | |
Subscriptions | | 79,716 | | | 903,954 | | | 842,126 | | | 9,545,620 | |
Distributions reinvested | | 13,425 | | | 151,199 | | | 13,789 | | | 156,456 | |
Redemptions | | (444,946 | ) | | (5,010,830 | ) | | (301,843 | ) | | (3,434,104 | ) |
| | | | | | | | | | | | |
Net increase (decrease) | | (351,805 | ) | | (3,955,677 | ) | | 554,072 | | | 6,267,972 | |
Class C | | | | | | | | | | | | |
Subscriptions | | 491,532 | | | 5,532,053 | | | 3,253,184 | | | 36,876,432 | |
Distributions reinvested | | 42,325 | | | 476,675 | | | 39,088 | | | 445,060 | |
Redemptions | | (1,560,413 | ) | | (17,516,830 | ) | | (1,100,021 | ) | | (12,591,972 | ) |
| | | | | | | | | | | | |
Net increase (decrease) | | (1,026,556 | ) | | (11,508,102 | ) | | 2,192,251 | | | 24,729,520 | |
Class Z | | | | | | | | | | | | |
Subscriptions | | 15,215,394 | | | 170,416,067 | | | 15,939,555 | | | 180,155,451 | |
Distributions reinvested | | 438,084 | | | 4,930,440 | | | 574,256 | | | 6,414,532 | |
Redemptions | | (13,798,165 | ) | | (155,041,085 | ) | | (16,430,119 | ) | | (184,580,274 | ) |
| | | | | | | | | | | | |
Net increase | | 1,855,313 | | | 20,305,422 | | | 83,692 | | | 1,989,709 | |
See Accompanying Notes to Financial Statements.
14
Financial Highlights – Columbia U.S. Treasury Index Fund
Selected data for a share outstanding throughout each period is as follows:
| | | | | | | | | | | | | | | | | | | | |
| | | Year Ended March 31, | |
| Class A Shares | | 2010 | | | 2009 | | | 2008 | | | 2007 | | | 2006 | |
Net Asset Value, Beginning of Period | | $ | 11.64 | | | $ | 11.27 | | | $ | 10.53 | | | $ | 10.45 | | | $ | 10.72 | |
| | | | | |
Income from Investment Operations: | | | | | | | | | | | | | | | | | | | | |
Net investment income (a) | | | 0.27 | | | | 0.33 | | | | 0.43 | | | | 0.42 | | | | 0.39 | |
Net realized and unrealized gain (loss) on investments | | | (0.45 | ) | | | 0.45 | | | | 0.78 | | | | 0.12 | | | | (0.24 | ) |
| | | | | | | | | | | | | | | | | | | | |
Total from investment operations | | | (0.18 | ) | | | 0.78 | | | | 1.21 | | | | 0.54 | | | | 0.15 | |
| | | | | |
Less Distributions to Shareholders: | | | | | | | | | | | | | | | | | | | | |
From net investment income | | | (0.34 | ) | | | (0.41 | ) | | | (0.47 | ) | | | (0.46 | ) | | | (0.42 | ) |
From net realized gains | | | — | (b) | | | — | | | | — | | | | — | | | | — | |
| | | | | | | | | | | | | | | | | | | | |
Total distributions to shareholders | | | (0.34 | ) | | | (0.41 | ) | | | (0.47 | ) | | | (0.46 | ) | | | (0.42 | ) |
| | | | | |
Net Asset Value, End of Period | | $ | 11.12 | | | $ | 11.64 | | | $ | 11.27 | | | $ | 10.53 | | | $ | 10.45 | |
Total return (c)(d) | | | (1.53 | )% | | | 7.13 | % | | | 11.77 | %(e) | | | 5.30 | % | | | 1.38 | % |
| | | | | |
Ratios to Average Net Assets/Supplemental Data: | | | | | | | | | | | | | | | | | | | | |
Net expenses before interest expense | | | 0.48 | % | | | 0.55 | %(f) | | | 0.57 | %(f) | | | 0.60 | % | | | 0.63 | % |
Interest expense (g) | | | — | % | | | — | % | | | — | % | | | — | % | | | — | % |
Net expenses | | | 0.48 | % | | | 0.55 | %(f) | | | 0.57 | %(f) | | | 0.60 | % | | | 0.63 | % |
Waiver/Reimbursement | | | 0.18 | % | | | 0.11 | % | | | 0.09 | % | | | 0.06 | % | | | 0.03 | % |
Net investment income | | | 2.44 | % | | | 2.91 | %(f) | | | 3.94 | %(f) | | | 4.05 | % | | | 3.60 | % |
Portfolio turnover rate | | | 118 | % | | | 126 | % | | | 47 | % | | | 39 | % | | | 36 | % |
Net assets, end of period (000s) | | $ | 47,105 | | | $ | 79,114 | | | $ | 17,817 | | | $ | 5,235 | | | $ | 3,208 | |
| (a) | Per share data was calculated using the average shares outstanding during the period. |
| (b) | Rounds to less than $0.01 per share. |
| (c) | Total return at net asset value assuming all distributions reinvested and no initial sales charge or contingent deferred sales charge. |
| (d) | Had the investment advisor and/or any of its affiliates not waived fees or reimbursed a portion of expenses, total return would have been reduced. |
| (e) | Total return includes a voluntary reimbursement by the investment advisor for a realized investment loss due to a trading error. This reimbursement increased total return and net asset value per share by less than 0.01% and less than $0.01, respectively. |
| (f) | The benefits derived from expense reductions had an impact of less than 0.01%. |
| (g) | Rounds to less than 0.01%. |
See Accompanying Notes to Financial Statements.
15
Financial Highlights – Columbia U.S. Treasury Index Fund
Selected data for a share outstanding throughout each period is as follows:
| | | | | | | | | | | | | | | | | | | | |
| | | Year Ended March 31, | |
| Class B Shares | | 2010 | | | 2009 | | | 2008 | | | 2007 | | | 2006 | |
Net Asset Value, Beginning of Period | | $ | 11.64 | | | $ | 11.27 | | | $ | 10.53 | | | $ | 10.45 | | | $ | 10.72 | |
| | | | | |
Income from Investment Operations: | | | | | | | | | | | | | | | | | | | | |
Net investment income (a) | | | 0.19 | | | | 0.25 | | | | 0.35 | | | | 0.35 | | | | 0.31 | |
Net realized and unrealized gain (loss) on investments | | | (0.45 | ) | | | 0.45 | | | | 0.78 | | | | 0.11 | | | | (0.24 | ) |
| | | | | | | | | | | | | | | | | | | | |
Total from investment operations | | | (0.26 | ) | | | 0.70 | | | | 1.13 | | | | 0.46 | | | | 0.07 | |
| | | | | |
Less Distributions to Shareholders: | | | | | | | | | | | | | | | | | | | | |
From net investment income | | | (0.26 | ) | | | (0.33 | ) | | | (0.39 | ) | | | (0.38 | ) | | | (0.34 | ) |
From net realized gains | | | — | (b) | | | — | | | | — | | | | — | | | | — | |
| | | | | | | | | | | | | | | | | | | | |
Total distributions to shareholders | | | (0.26 | ) | | | (0.33 | ) | | | (0.39 | ) | | | (0.38 | ) | | | (0.34 | ) |
| | | | | |
Net Asset Value, End of Period | | $ | 11.12 | | | $ | 11.64 | | | $ | 11.27 | | | $ | 10.53 | | | $ | 10.45 | |
Total return (c)(d) | | | (2.26 | )% | | | 6.32 | % | | | 10.95 | %(e) | | | 4.52 | % | | | 0.62 | % |
| | | | | |
Ratios to Average Net Assets/Supplemental Data: | | | | | | | | | | | | | | | | | | | | |
Net expenses before interest expense | | | 1.23 | % | | | 1.30 | %(f) | | | 1.32 | %(f) | | | 1.35 | % | | | 1.38 | % |
Interest expense (g) | | | — | % | | | — | % | | | — | % | | | — | % | | | — | % |
Net expenses | | | 1.23 | % | | | 1.30 | %(f) | | | 1.32 | %(f) | | | 1.35 | % | | | 1.38 | % |
Waiver/Reimbursement | | | 0.18 | % | | | 0.11 | % | | | 0.09 | % | | | 0.06 | % | | | 0.03 | % |
Net investment income | | | 1.69 | % | | | 2.19 | %(f) | | | 3.25 | %(f) | | | 3.31 | % | | | 2.85 | % |
Portfolio turnover rate | | | 118 | % | | | 126 | % | | | 47 | % | | | 39 | % | | | 36 | % |
Net assets, end of period (000s) | | $ | 5,810 | | | $ | 10,179 | | | $ | 3,610 | | | $ | 1,488 | | | $ | 1,615 | |
| (a) | Per share data was calculated using the average shares outstanding during the period. |
| (b) | Rounds to less than $0.01 per share. |
| (c) | Total return at net asset value assuming all distributions reinvested and no contingent deferred sales charge. |
| (d) | Had the investment advisor and/or any of its affiliates not waived fees or reimbursed a portion of expenses, total return would have been reduced. |
| (e) | Total return includes a voluntary reimbursement by the investment advisor for a realized investment loss due to a trading error. This reimbursement increased total return and net asset value per share by less than 0.01% and less than $0.01, respectively. |
| (f) | The benefits derived from expense reductions had an impact of less than 0.01%. |
| (g) | Rounds to less than 0.01%. |
See Accompanying Notes to Financial Statements.
16
Financial Highlights – Columbia U.S. Treasury Index Fund
Selected data for a share outstanding throughout each period is as follows:
| | | | | | | | | | | | | | | | | | | | |
| | | Year Ended March 31, | |
| Class C Shares | | 2010 | | | 2009 | | | 2008 | | | 2007 | | | 2006 | |
Net Asset Value, Beginning of Period | | $ | 11.64 | | | $ | 11.27 | | | $ | 10.53 | | | $ | 10.45 | | | $ | 10.72 | |
| | | | | |
Income from Investment Operations: | | | | | | | | | | | | | | | | | | | | |
Net investment income (a) | | | 0.21 | | | | 0.26 | | | | 0.36 | | | | 0.36 | | | | 0.32 | |
Net realized and unrealized gain (loss) on investments | | | (0.46 | ) | | | 0.45 | | | | 0.78 | | | | 0.12 | | | | (0.23 | ) |
| | | | | | | | | | | | | | | | | | | | |
Total from investment operations | | | (0.25 | ) | | | 0.71 | | | | 1.14 | | | | 0.48 | | | | 0.09 | |
| | | | | |
Less Distributions to Shareholders: | | | | | | | | | | | | | | | | | | | | |
From net investment income | | | (0.27 | ) | | | (0.34 | ) | | | (0.40 | ) | | | (0.40 | ) | | | (0.36 | ) |
From net realized gains | | | — | (b) | | | — | | | | — | | | | — | | | | — | |
| | | | | | | | | | | | | | | | | | | | |
Total distributions to shareholders | | | (0.27 | ) | | | (0.34 | ) | | | (0.40 | ) | | | (0.40 | ) | | | (0.36 | ) |
| | | | | |
Net Asset Value, End of Period | | $ | 11.12 | | | $ | 11.64 | | | $ | 11.27 | | | $ | 10.53 | | | $ | 10.45 | |
Total return (c)(d) | | | (2.12 | )% | | | 6.48 | % | | | 11.09 | %(e) | | | 4.67 | % | | | 0.77 | % |
| | | | | |
Ratios to Average Net Assets/Supplemental Data: | | | | | | | | | | | | | | | | | | | | |
Net expenses before interest expense | | | 1.08 | % | | | 1.15 | %(f) | | | 1.17 | %(f) | | | 1.20 | % | | | 1.23 | % |
Interest expense (g) | | | — | % | | | — | % | | | — | % | | | — | % | | | — | % |
Net expenses | | | 1.08 | % | | | 1.15 | %(f) | | | 1.17 | %(f) | | | 1.20 | % | | | 1.23 | % |
Waiver/Reimbursement | | | 0.33 | % | | | 0.26 | % | | | 0.24 | % | | | 0.21 | % | | | 0.18 | % |
Net investment income | | | 1.83 | % | | | 2.28 | %(f) | | | 3.30 | %(f) | | | 3.44 | % | | | 3.01 | % |
Portfolio turnover rate | | | 118 | % | | | 126 | % | | | 47 | % | | | 39 | % | | | 36 | % |
Net assets, end of period (000s) | | $ | 19,568 | | | $ | 32,440 | | | $ | 6,702 | | | $ | 973 | | | $ | 1,060 | |
| (a) | Per share data was calculated using the average shares outstanding during the period. |
| (b) | Rounds to less than $0.01 per share. |
| (c) | Total return at net asset value assuming all distributions reinvested and no contingent deferred sales charge. |
| (d) | Had the investment advisor and/or any of its affiliates not waived fees or reimbursed a portion of expenses, total return would have been reduced. |
| (e) | Total return includes a voluntary reimbursement by the investment advisor for a realized investment loss due to a trading error. This reimbursement increased total return and net asset value per share by less than 0.01% and less than $0.01, respectively. |
| (f) | The benefits derived from expense reductions had an impact of less than 0.01%. |
| (g) | Rounds to less than 0.01%. |
See Accompanying Notes to Financial Statements.
17
Financial Highlights – Columbia U.S. Treasury Index Fund
Selected data for a share outstanding throughout each period is as follows:
| | | | | | | | | | | | | | | | | | | | |
| | | Year Ended March 31, | |
| Class Z Shares | | 2010 | | | 2009 | | | 2008 | | | 2007 | | | 2006 | |
Net Asset Value, Beginning of Period | | $ | 11.64 | | | $ | 11.27 | | | $ | 10.53 | | | $ | 10.45 | | | $ | 10.72 | |
| | | | | |
Income from Investment Operations: | | | | | | | | | | | | | | | | | | | | |
Net investment income (a) | | | 0.30 | | | | 0.37 | | | | 0.46 | | | | 0.45 | | | | 0.41 | |
Net realized and unrealized gain (loss) on investments | | | (0.46 | ) | | | 0.44 | | | | 0.77 | | | | 0.12 | | | | (0.23 | ) |
| | | | | | | | | | | | | | | | | | | | |
Total from investment operations | | | (0.16 | ) | | | 0.81 | | | | 1.23 | | | | 0.57 | | | | 0.18 | |
| | | | | |
Less Distributions to Shareholders: | | | | | | | | | | | | | | | | | | | | |
From net investment income | | | (0.37 | ) | | | (0.44 | ) | | | (0.49 | ) | | | (0.49 | ) | | | (0.45 | ) |
From net realized gains | | | — | (b) | | | — | | | | — | | | | — | | | | — | |
| | | | | | | | | | | | | | | | | | | | |
Total distributions to shareholders | | | (0.37 | ) | | | (0.44 | ) | | | (0.49 | ) | | | (0.49 | ) | | | (0.45 | ) |
| | | | | |
Net Asset Value, End of Period | | $ | 11.11 | | | $ | 11.64 | | | $ | 11.27 | | | $ | 10.53 | | | $ | 10.45 | |
Total return (c)(d) | | | (1.38 | )% | | | 7.40 | % | | | 12.04 | %(e) | | | 5.53 | % | | | 1.62 | % |
| | | | | |
Ratios to Average Net Assets/Supplemental Data: | | | | | | | | | | | | | | | | | | | | |
Net expenses before interest expense | | | 0.23 | % | | | 0.30 | %(f) | | | 0.33 | %(f) | | | 0.38 | % | | | 0.39 | % |
Interest expense (g) | | | — | % | | | — | % | | | — | % | | | — | % | | | — | % |
Net expenses | | | 0.23 | % | | | 0.30 | %(f) | | | 0.33 | %(f) | | | 0.38 | % | | | 0.39 | % |
Waiver/Reimbursement | | | 0.18 | % | | | 0.11 | % | | | 0.09 | % | | | 0.07 | % | | | 0.04 | % |
Net investment income | | | 2.64 | % | | | 3.31 | %(f) | | | 4.24 | %(f) | | | 4.28 | % | | | 3.83 | % |
Portfolio turnover rate | | | 118 | % | | | 126 | % | | | 47 | % | | | 39 | % | | | 36 | % |
Net assets, end of period (000s) | | $ | 301,978 | | | $ | 294,640 | | | $ | 284,271 | | | $ | 138,132 | | | $ | 136,609 | |
| (a) | Per share data was calculated using the average shares outstanding during the period. |
| (b) | Rounds to less than $0.01 per share. |
| (c) | Total return at net asset value assuming all distributions reinvested. |
| (d) | Had the investment advisor and/or any of its affiliates not waived fees or reimbursed a portion of expenses, total return would have been reduced. |
| (e) | Total return includes a voluntary reimbursement by the investment advisor for a realized investment loss due to a trading error. This reimbursement increased total return and net asset value per share by less than 0.01% and less than $0.01, respectively. |
| (f) | The benefits derived from expense reductions had an impact of less than 0.01%. |
| (g) | Rounds to less than 0.01%. |
See Accompanying Notes to Financial Statements.
18
Notes to Financial Statements – Columbia U.S. Treasury Index Fund
March 31, 2010
Note 1. Organization
Columbia U.S. Treasury Index Fund (the “Fund”), a series of Columbia Funds Series Trust I (the “Trust”), is a diversified fund. The Trust is registered under the Investment Company Act of 1940, as amended (the “1940 Act”), as an open-end management investment company organized as a Massachusetts business trust.
Investment Objective
The Fund seeks total return that corresponds to the total return of the Citigroup Bond U.S. Treasury Index, before fees and expenses.
Fund Shares
The Trust may issue an unlimited number of shares, and the Fund offers four classes of shares: Class A, Class B, Class C and Class Z. Each share class has its own expense structure and sales charges, as applicable. Effective June 22, 2009, the Fund no longer accepts investments from new or existing investors in the Fund’s Class B shares, except in connection with the reinvestment of any dividend and/or capital gain distributions in Class B shares of the Fund and exchanges by existing Class B shareholders of the other Columbia Funds.
Class A shares are subject to a maximum front-end sales charge of 4.75% based on the amount of initial investment. Class A shares purchased without an initial sales charge in accounts aggregating $1 million to $50 million at the time of purchase are subject to a 1.00% contingent deferred sales charge (“CDSC”) if the shares are sold within one year after purchase. Class B shares are subject to a maximum CDSC of 5.00% based upon the holding period after purchase. Class B shares will convert to Class A shares eight years after purchase. Class C shares are subject to a 1.00% CDSC on shares sold within one year after purchase. Class Z shares are offered continuously at net asset value. There are certain restrictions on the purchase of Class Z shares, as described in the Fund’s prospectus.
Note 2. Significant Accounting Policies
The preparation of financial statements in accordance with accounting principles generally accepted in the United States of America (“GAAP”) requires management to make certain estimates and assumptions that affect the reported amounts of assets and liabilities, the disclosure of contingent assets and liabilities at the date of the financial statements and the reported amounts of revenue and expenses during the reporting period. Actual results could differ from those estimates.
The following is a summary of significant accounting policies consistently followed by the Fund in the preparation of its financial statements.
Security Valuation
Debt securities generally are valued by pricing services approved by the Trust’s Board of Trustees, based upon market transactions for normal, institutional-size trading units of similar securities. The services may use various pricing techniques which take into account appropriate factors such as yield, quality, coupon rate, maturity, type of issue, trading characteristics and other data, as well as broker quotes. Debt securities for which quotations are readily available may also be valued based upon an over-the-counter or exchange bid quotation.
Short-term investments maturing in 60 days or less are valued at amortized cost, which approximates market value.
Investments for which market quotations are not readily available, or that have quotations which management believes are not reliable, are valued at fair value as determined in good faith under consistently applied procedures established by and under the general supervision of the Board of Trustees. If a security is valued at fair value, such value is likely to be different from the last quoted market price for the security. The determination of fair value often requires significant judgment. To determine fair value, management may use assumptions including but not limited to future cash flows and estimated risk premiums. Multiple inputs from various sources may be used to determine value.
GAAP establishes a hierarchy that prioritizes the inputs to valuation techniques used to measure fair value giving the highest priority to unadjusted quoted prices in active markets for identical securities (level 1 measurements) and the lowest priority to unobservable inputs (level 3 measurements) when market prices are not readily available or reliable. The three levels of the fair value hierarchy are described below:
| n | | Level 1 — quoted prices in active markets for identical securities |
19
Columbia U.S. Treasury Index Fund
March 31, 2010
| n | | Level 2 — prices determined using other significant observable inputs (including quoted prices for similar securities, interest rates, prepayment speeds, credit risk and others) |
| n | | Level 3 — prices determined using significant unobservable inputs. In situations where quoted prices or observable inputs are unavailable or less reliable, unobservable inputs may be used. Unobservable inputs may include management’s own assumptions about the factors market participants would use in pricing an investment |
The inputs or methodology used for valuing securities are not necessarily an indication of the risk associated with investing in those securities.
On Jan. 21, 2010, the FASB issued an Accounting Standards Update (the amendment), Fair Value Measurements and Disclosures (Topic 820): Improving Disclosures about Fair Value Measurements, which provides guidance on how investment assets and liabilities are to be valued and disclosed. Specifically, the amendment requires reporting entities to disclose the input and valuation techniques used to measure fair value for both recurring and nonrecurring fair value measurements for Level 2 or Level 3 positions. The amendment also requires that transfers between all levels (including Level 1 and Level 2) be disclosed on a gross basis (i.e., transfers out must be disclosed separately from transfers in), and the reason(s) for the transfer. Additionally purchases, sales, issuances and settlements must be disclosed on a gross basis in the Level 3 rollforward. The effective date of the amendment is for interim and annual periods beginning after Dec. 15, 2009, however, the requirement to provide the Level 3 activity for purchases, sales, issuances and settlements on a gross basis will be effective for interim and annual periods beginning after Dec. 15, 2010. At this time, management is evaluating the implications of the amendment and the impact to the financial statements.
Security Transactions
Security transactions are accounted for on the trade date. Cost is determined and gains (losses) are based upon the specific identification method for both financial statement and federal income tax purposes.
Repurchase Agreements
The Fund may engage in repurchase agreement transactions with institutions that Columbia Management Advisors, LLC (“Columbia”), the Fund’s investment advisor, has determined are creditworthy. The Fund, through its custodian, receives delivery of the underlying securities collateralizing a repurchase agreement. Columbia is responsible for determining that the collateral is at least equal, at all times, to the value of the repurchase obligation including interest. A repurchase agreement transaction involves certain risks in the event of default or insolvency of the counterparty. These risks include possible delays in or restrictions on the Fund’s ability to dispose of the underlying securities and a possible decline in the value of the underlying securities during the period while the Fund seeks to assert its rights.
Income Recognition
Interest income is recorded on the accrual basis. Premium and discount are amortized and accreted, respectively, on all debt securities, unless otherwise noted.
Corporate actions and dividend income are recorded on the ex-date.
Expenses
General expenses of the Trust are allocated to the Fund and other series of the Trust based upon relative net assets or other expense allocation methodologies determined by the nature of the expense. Expenses directly attributable to the Fund are charged to the Fund.
Determination of Class Net Asset Value
All income, expenses (other than class-specific expenses, as shown on the Statement of Operations) and realized and unrealized gains (losses) are allocated to each class of the Fund on a daily basis for purposes of determining the net asset value of each class. Income and expenses are allocated to each class based on the settled shares method, while realized and unrealized gains (losses) are allocated based on the relative net assets of each class.
Federal Income Tax Status
The Fund intends to qualify each year as a “regulated investment company” under Subchapter M of the Internal Revenue Code, as amended, and will distribute substantially all of its taxable income, if any, for its tax year, and as such will not be subject to federal income taxes. In addition, the Fund intends to distribute in each calendar year substantially
20
Columbia U.S. Treasury Index Fund
March 31, 2010
all of its net investment income, capital gains and certain other amounts, if any, such that the Fund should not be subject to federal excise tax. Therefore, no provision is made for federal income or excise taxes.
Distributions to Shareholders
Distributions from net investment income are declared daily and paid monthly. Net realized capital gains, if any, are distributed at least annually. Income distributions and capital gain distributions are determined in accordance with federal income tax regulations which may differ from GAAP.
Indemnification
In the normal course of business, the Fund enters into contracts that contain a variety of representations and warranties and which provide general indemnities. The Fund’s maximum exposure under these arrangements is unknown because this would involve future claims against the Fund. Also, under the Trust’s organizational documents and by contract, the Trustees and officers of the Trust are indemnified against certain liabilities that may arise out of actions relating to their duties to the Trust. However, based on experience, the Fund expects the risk of loss due to these representations, warranties and indemnities to be minimal.
Note 3. Federal Tax Information
The timing and character of income and capital gain distributions are determined in accordance with income tax regulations, which may differ from GAAP. Reclassifications are made to the Fund’s capital accounts for permanent tax differences to reflect income and gains available for distribution (or available capital loss carryforwards) under income tax regulations.
For the year ended March 31, 2010, permanent book and tax basis differences resulting primarily from differing treatments for discount accretion/premium amortization on debt securities and market discount reclasses were identified and reclassified among the components of the Fund’s net assets as follows:
| | | | |
| | | | | |
Overdistributed Net Investment
Income | | Accumulated Net Realized
Gain | | Paid-In Capital |
| $2,458,758 | | $(2,458,756) | | $(2) |
Net investment income and net realized gains (losses), as disclosed on the Statement of Operations, and net assets were not affected by this reclassification.
The tax character of distributions paid during the years ended March 31, 2010 and March 31, 2009 was as follows:
| | | | | | |
| | | March 31, 2010 | | March 31, 2009 |
| Distributions paid from: | | |
Ordinary Income* | | $ | 11,767,781 | | $ | 13,626,250 |
Long-Term Capital Gains | | | 55,739 | | | 4,464 |
| * | For tax purposes short-term capital gains distributions, if any, are considered ordinary income distributions. |
As of March 31, 2010, the components of distributable earnings on a tax basis were as follows:
| | | | |
| | | | | |
Undistributed
Ordinary Income | | Undistributed Long-Term Capital Gains | | Net Unrealized Appreciation* |
| $405,125 | | $402,747 | | $5,513,485 |
| * | The differences between book-basis and tax-basis net unrealized appreciation are primarily due to deferral of losses from wash sales. |
Unrealized appreciation and depreciation at March 31, 2010, based on cost of investments for federal income tax purposes were:
| | | | |
| | | | |
Unrealized appreciation | | $ | 6,678,385 | |
Unrealized depreciation | | | (1,164,900 | ) |
Net unrealized appreciation | | $ | 5,513,485 | |
Management is required to determine whether a tax position of the Fund is more likely than not to be sustained upon examination by the applicable taxing authority, including resolution of any related appeals or litigation processes, based on the technical merits of the position. The tax benefit to be recognized by the Fund is measured as the largest amount of benefit that is greater than fifty percent likely of being realized upon ultimate settlement. Management is not aware of any tax positions for which it is reasonably possible that the total amounts of unrecognized tax benefits will significantly change in the next twelve months. However, management’s conclusions may be subject to review and adjustment at a later date based on factors including, but not limited to, new tax laws, regulations, and administrative interpretations (including relevant court decisions). The
21
Columbia U.S. Treasury Index Fund
March 31, 2010
Fund’s federal tax returns for the prior three fiscal years remain subject to examination by the Internal Revenue Service.
Note 4. Fees and Compensation Paid to Affiliates
Investment Advisory Fee
Columbia, an indirect, wholly owned subsidiary of Bank of America Corporation (“BOA”), provides investment advisory services to the Fund. In rendering investment advisory services to the Fund, Columbia may use the portfolio management and research resources of Columbia Management Pte, Ltd., an affiliate of Columbia. Columbia receives a monthly investment advisory fee at the annual rate of 0.10% of the Fund’s average daily net assets.
Bank of America, N.A., an indirect parent company of Columbia, entered into an agreement dated September 29, 2009, to sell a portion of the asset management business of Columbia Management Group, LLC to Ameriprise Financial, Inc. (“Ameriprise Financial”). The transaction (“Transaction”) includes the sale of the part of the asset management business that advises long-term mutual funds, including the Fund. The Transaction is subject to certain approvals and other conditions to closing, and is currently expected to close on or about April 30, 2010 (the “Closing”).
In connection with the Closing, certain changes will occur, including a change in the entities serving as the investment advisor, administrator, distributor and transfer agent of the Fund. RiverSource Investments, LLC (the “New Advisor”), a subsidiary of Ameriprise Financial, will become the investment advisor of the Fund upon the Closing. On March 3, 2010, the Fund’s shareholders approved, among other matters, the proposed investment management services agreement with the New Advisor. The New Advisor will serve as investment advisor under a new investment management services agreement effective upon the Closing. The New Advisor will change its name to Columbia Management Investment Advisers, LLC upon or shortly after the Closing. Effective upon the Closing, as the context requires, references to Columbia shall be deemed to refer to the New Advisor.
Administration Fee
Columbia provides administrative services to the Fund pursuant to an administrative services agreement. Columbia, from the administration fee it receives from the Fund, pays all expenses of the Fund, except the fees and expenses of the Trustees who are not interested persons, service and distribution fees, brokerage fees and commissions, interest expense and extraordinary expenses. Columbia receives a monthly administration fee for its services as administrator at the annual rate of 0.30% of the average daily net assets of the Fund.
The New Advisor will become the administrator of the Fund under a new administrative services agreement effective upon the Closing.
Underwriting Discounts, Service and Distribution Fees
Columbia Management Distributors, Inc. (the “Distributor”), an affiliate of Columbia and an indirect, wholly owned subsidiary of BOA, is the principal underwriter of the Fund’s shares. For the year ended March 31, 2010, the Distributor has retained net underwriting discounts $9,858 on sales of the Fund’s Class A shares and received net CDSC fees of $20,761 and $45,774 on Class B and Class C share redemptions, respectively.
RiverSource Fund Distributors, Inc. (the “New Distributor”), a subsidiary of Ameriprise Financial, will become the distributor of the Fund upon the Closing. The New Distributor will change its name to Columbia Management Investment Distributors, Inc. upon or shortly after the Closing.
The Fund has adopted plans pursuant to Rule 12b-1 under the 1940 Act (the “Plans”) which require the payment of a monthly service fee to the Distributor at the maximum annual rate of 0.25% of the average daily net assets attributable to Class A, Class B and Class C shares of the Fund. The Plans also require the payment of a monthly distribution fee to the Distributor at the maximum annual rate of 0.75% of the average daily net assets attributable to Class B and Class C shares only. The Distributor has voluntarily agreed to waive a portion of the distribution fee for Class C shares so that the combined distribution and service fees do not exceed 0.85% annually of the average daily net assets attributable to Class C shares. This arrangement may be modified or terminated by the Distributor at any time.
The CDSC and the distribution fees received from the Plans are used principally as repayment to the Distributor for amounts paid by the Distributor to dealers who sold such shares.
22
Columbia U.S. Treasury Index Fund
March 31, 2010
Minimum Account Balance Fee
An annual minimum account balance fee of up to $20 may apply to certain accounts with a value below the Fund’s initial minimum investment requirements to reduce the impact of small accounts on transfer agent fees. These minimum account balance fees are recorded as a reduction of total expenses on the Statement of Operations. For the year ended March 31, 2010, no minimum account balance fees were charged by the Fund.
Fee Waivers and Expense Reimbursements
Effective August 1, 2009, Columbia has voluntarily agreed to reimburse a portion of the Fund’s expenses so that the Fund’s ordinary operating expenses (excluding any distribution and service fees, brokerage commissions, interest, taxes and extraordinary expenses, but including custodian charges relating to overdrafts, if any), after giving effect to any balance credits from the Fund’s custodian, do not exceed 0.20% of the Fund’s average daily net assets on an annualized basis. Columbia, in its discretion, may revise or discontinue this arrangement at any time. Prior to August 1, 2009, Columbia contractually agreed to reimburse the Fund so that ordinary operating expenses (excluding any distribution and service fees, brokerage commissions, interest, taxes and extraordinary expenses, but including custodian charges relating to overdrafts, if any), after giving effect to any balance credits from the Fund’s custodian, did not exceed 0.30% of the Fund’s average daily net assets on an annualized basis.
Fees Paid to Officers and Trustees
All officers of the Fund are employees of Columbia or its affiliates and, with the exception of the Fund’s Chief Compliance Officer, receive no compensation from the Fund. The Board of Trustees has appointed a Chief Compliance Officer to the Fund in accordance with federal securities regulations.
Trustees are compensated for their services to the Fund, as set forth on the Statement of Operations. The Trust’s eligible Trustees may participate in a deferred compensation plan which may be terminated at any time. Obligations of the plan will be paid solely out of the Fund’s assets.
Note 5. Portfolio Information
For the year ended March 31, 2010, the cost of purchases and proceeds from sales of securities, excluding short-term obligations, for the Fund were $436,252,963 and $453,348,203, respectively, all of which were U.S. Government securities.
Note 6. Line of Credit
The Fund and other affiliated funds participate in a $280,000,000 committed, unsecured revolving line of credit provided by State Street. The maximum amount that may be borrowed by any fund is limited to the lesser of $200,000,000 and the Fund’s borrowing limit set forth in the Fund’s registration statement. Borrowings are available for short-term liquidity or temporary or emergency purposes.
Effective October 15, 2009, interest is charged to each participating fund based on the fund’s borrowings at a rate per annum equal to the greater of the Federal Funds Rate plus 1.25% or the overnight LIBOR Rate plus 1.25%. In addition, a commitment fee of 0.15% per annum is accrued and apportioned among the participating funds pro rata based on their relative net assets.
Prior to October 15, 2009, interest was charged to each participating fund based on the fund’s borrowings at a rate per annum equal to the greater of the Federal Funds Rate plus 0.50% or the overnight LIBOR Rate plus 0.50%. In addition, an annual operations agency fee of $20,000, an amendment fee of 0.02% and a commitment fee of 0.12% per annum were accrued and apportioned among the participating funds pro rata based on their relative net assets.
For the year ended March 31, 2010, the average daily loan balance outstanding on days where borrowing existed was $1,200,000 at a weighted average interest rate of 1.424%.
Note 7. Securities Lending
The Fund may lend its securities to certain approved brokers, dealers and other financial institutions. Each loan is collateralized by cash, in an amount at least equal to the market value of the securities loaned plus accrued income from the investment of collateral. The market value of the loaned securities is determined at the close of business of the Fund and any additional required collateral is delivered to the Fund on the next business day. The collateral received is invested and the income generated by the investment of the collateral, net of any fees remitted to State Street as the lending agent and borrower rebates, is paid to the Fund. Generally, in the event of borrower default, the Fund has the right to use the collateral to offset any losses incurred. In the
23
Columbia U.S. Treasury Index Fund
March 31, 2010
event the Fund is delayed or prevented from exercising its right to dispose of the collateral, there may be a potential loss to the Fund. The Fund bears the risk of loss with respect to the investment of collateral.
Note 8. Shares of Beneficial Interest
As of March 31, 2010, 37.4% of the Fund’s shares outstanding were beneficially owned by two participant accounts over which BOA and/or any of its affiliates had either sole or joint investment discretion.
As of March 31, 2010, no other shareholders owned more than 5% of the outstanding shares of the Fund.
Subscription and redemption activity of these accounts may have a significant effect on the operations of the Fund.
Note 9. Significant Risks and Contingencies
Information Regarding Pending and Settled Legal Proceedings
In June 2004, an action captioned John E. Gallus et al. v. American Express Financial Corp. and American Express Financial Advisors Inc. was filed in the United States District Court for the District of Arizona. The plaintiffs allege that they are investors in several American Express Company (now known as RiverSource) mutual funds and they purport to bring the action derivatively on behalf of those funds under the Investment Company Act of 1940. The plaintiffs allege that fees allegedly paid to the defendants by the funds for investment advisory and administrative services are excessive. The plaintiffs seek remedies including restitution and rescission of investment advisory and distribution agreements. The plaintiffs voluntarily agreed to transfer this case to the United States District Court for the District of Minnesota (the District Court). In response to defendants’ motion to dismiss the complaint, the District Court dismissed one of plaintiffs’ four claims and granted plaintiffs limited discovery. Defendants moved for summary judgment in April 2007. Summary judgment was granted in the defendants’ favor on July 9, 2007. The plaintiffs filed a notice of appeal with the Eighth Circuit Court of Appeals (the Eighth Circuit) on August 8, 2007. On April 8, 2009, the Eighth Circuit reversed summary judgment and remanded to the District Court for further proceedings. On August 6, 2009, defendants filed a writ of certiorari with the U.S. Supreme Court (the Supreme Court), asking the Supreme Court to stay the District Court proceedings while the Supreme Court considers and rules in a case captioned Jones v. Harris Associates, which involves issues of law similar to those presented in the Gallus case. On March 30, 2010, the Supreme Court issued its ruling in Jones v. Harris Associates, and on April 5, 2010, the Supreme Court vacated the Eighth Circuit’s decision in the Gallus case and remanded the case to the Eighth Circuit for further consideration in light of the Supreme Court’s decision in Jones v. Harris Associates.
In December 2005, without admitting or denying the allegations, American Express Financial Corporation (AEFC, which is now known as Ameriprise Financial, Inc. (Ameriprise Financial)), entered into settlement agreements with the Securities and Exchange Commission (SEC) and Minnesota Department of Commerce (MDOC) related to market timing activities. As a result, AEFC was censured and ordered to cease and desist from committing or causing any violations of certain provisions of the Investment Advisers Act of 1940, the Investment Company Act of 1940, and various Minnesota laws. AEFC agreed to pay disgorgement of $10 million and civil money penalties of $7 million. AEFC also agreed to retain an independent distribution consultant to assist in developing a plan for distribution of all disgorgement and civil penalties ordered by the SEC in accordance with various undertakings detailed at http://www.sec.gov/litigation/admin/ia-2451.pdf. Ameriprise Financial and its affiliates have cooperated with the SEC and the MDOC in these legal proceedings, and have made regular reports to the RiverSource Funds’ Boards of Directors/Trustees.
On November 7, 2008, RiverSource Investments, LLC, a subsidiary of Ameriprise Financial, Inc., acquired J. & W. Seligman & Co. Incorporated (Seligman). In late 2003, Seligman conducted an extensive internal review concerning mutual fund trading practices. Seligman’s review, which covered the period 2001-2003, noted one arrangement that permitted frequent trading in certain open-end registered investment companies managed by Seligman (the Seligman Funds); this arrangement was in the process of being closed down by Seligman before September 2003. Seligman identified three other arrangements that permitted frequent trading, all of which had been terminated by September 2002. In January 2004, Seligman, on a voluntary basis, publicly disclosed these four arrangements to its clients and to shareholders of the Seligman Funds. Seligman also provided information concerning mutual fund trading practices to the
24
Columbia U.S. Treasury Index Fund
March 31, 2010
SEC and the Office of the Attorney General of the State of New York (NYAG).
In September 2006, the NYAG commenced a civil action in New York State Supreme Court against Seligman, Seligman Advisors, Inc. (now known as RiverSource Fund Distributors, Inc.), Seligman Data Corp. and Brian T. Zino (collectively, the Seligman Parties), alleging, in substance, that the Seligman Parties permitted various persons to engage in frequent trading and, as a result, the prospectus disclosure used by the registered investment companies then managed by Seligman was and had been misleading. The NYAG included other related claims and also claimed that the fees charged by Seligman to the Seligman Funds were excessive. On March 13, 2009, without admitting or denying any violations of law or wrongdoing, the Seligman Parties entered into a stipulation of settlement with the NYAG and settled the claims made by the NYAG. Under the terms of the settlement, Seligman paid $11.3 million to four Seligman Funds. This settlement resolved all outstanding matters between the Seligman Parties and the NYAG. In addition to the foregoing matter, the New York staff of the SEC indicated in September 2005 that it was considering recommending to the Commissioners of the SEC the instituting of a formal action against Seligman and Seligman Advisors, Inc. relating to frequent trading in the Seligman Funds. Seligman responded to the staff in October 2005 that it believed that any action would be both inappropriate and unnecessary, especially in light of the fact that Seligman had previously resolved the underlying issue with the Independent Directors of the Seligman Funds and made recompense to the affected Seligman Funds. There have been no further developments with the SEC on this matter.
Ameriprise Financial and certain of its affiliates have historically been involved in a number of legal, arbitration and regulatory proceedings, including routine litigation, class actions, and governmental actions, concerning matters arising in connection with the conduct of their business activities. Ameriprise Financial believes that the Funds are not currently the subject of, and that neither Ameriprise Financial nor any of its affiliates are the subject of, any pending legal, arbitration or regulatory proceedings that are likely to have a material adverse effect on the Funds or the ability of Ameriprise Financial or its affiliates to perform under their contracts with the Funds. Ameriprise Financial is required to make 10-Q, 10-K and, as necessary, 8-K filings with the Securities and Exchange Commission on legal and regulatory matters that relate to Ameriprise Financial and its affiliates. Copies of these filings may be obtained by accessing the SEC website at www.sec.gov.
There can be no assurance that these matters, or the adverse publicity associated with them, will not result in increased fund redemptions, reduced sale of fund shares or other adverse consequences to the Funds. Further, although we believe proceedings are not likely to have a material adverse effect on the Funds or the ability of Ameriprise Financial or its affiliates to perform under their contracts with the Funds, these proceedings are subject to uncertainties and, as such, we are unable to estimate the possible loss or range of loss that may result. An adverse outcome in one or more of these proceedings could result in adverse judgments, settlements, fines, penalties or other relief that could have a material adverse effect on the consolidated financial condition or results of operations of Ameriprise Financial.
Note 10. Subsequent Events
In connection with the preparation of the financial statements of the Fund as of and for the fiscal year ended March 31, 2010, events and transactions through the date the financial statements were issued have been evaluated by the Fund’s management for possible adjustment and/or disclosure. No subsequent events or transactions have occurred that would require adjustment of the financial statements as presented. On April 30, 2010, the Transaction disclosed in Note 4 closed. Effective May 1, 2010, the New Advisor became the investment advisor and administrator of the Fund and subsequently changed its name to Columbia Management Investment Advisers, LLC. On that date, the New Transfer Agent became the transfer agent of the Fund and changed its name to Columbia Management Investment Services Corp. Also on that date, the New Distributor became the distributor of the Fund and changed its name to Columbia Management Investment Distributors, Inc.
25
Report of Independent Registered Public Accounting Firm
To the Trustees of Columbia Funds Series Trust I and the Shareholders of Columbia U.S. Treasury Index Fund
In our opinion, the accompanying statement of assets and liabilities, including the investment portfolio, and the related statements of operations and of changes in net assets and the financial highlights present fairly, in all material respects, the financial position of Columbia U.S. Treasury Index Fund (the “Fund”) (a series of Columbia Funds Series Trust I) at March 31, 2010, and the results of its operations, the changes in its net assets and the financial highlights for the periods indicated, in conformity with accounting principles generally accepted in the United States of America. These financial statements and financial highlights (hereafter referred to as “financial statements”) are the responsibility of the Fund’s management. Our responsibility is to express an opinion on these financial statements based on our audits. We conducted our audits of these financial statements in accordance with the standards of the Public Company Accounting Oversight Board (United States). Those standards require that we plan and perform the audit to obtain reasonable assurance about whether the financial statements are free of material misstatement. An audit includes examining, on a test basis, evidence supporting the amounts and disclosures in the financial statements, assessing the accounting principles used and significant estimates made by management, and evaluating the overall financial statement presentation. We believe that our audits, which included confirmation of securities at March 31, 2010 by correspondence with the custodian, provide a reasonable basis for our opinion.
PricewaterhouseCoopers LLP
Boston, Massachusetts
May 21, 2010
26
Federal Income Tax Information (Unaudited) – Columbia U.S. Treasury Fund
The Fund hereby designates as a capital gain dividend with respect to the taxable year ended March 31, 2010, $481,410 or, if subsequently determined to be different, the net capital gain of such year.
27
Fund Governance
The Trustees serve terms of indefinite duration. The names, addresses and ages of the Trustees and Officers of the Funds in Columbia Funds Series Trust I, the year each was first elected or appointed to office, their principal business occupations during at least the last five years, the number of Funds overseen by each Trustee and other directorships they hold are shown below. Each officer listed below serves as an officer of each Fund in the Columbia Funds Complex.
Independent Trustees
| | |
Name, Address and Year of
Birth, Position with Funds, Year
First Elected or Appointed to Office | | Principal Occupation(s) During Past Five Years, Number of Funds in the
Columbia Funds Complex Overseen by Trustee, Other Directorships Held |
| |
| John D. Collins (Born 1938) | | |
c/o Columbia Management Advisors, LLC One Financial Center Boston, MA 02111 Trustee (since 2005) | | Retired. Consultant, KPMG, LLP (accounting and tax firm) from July 1999 to June 2000; Partner, KPMG, LLP from March 1962 to June 1999. Oversees 65; Mrs. Fields Famous Brands LLC (consumer products); Suburban Propane Partners, L.P.; and Montpelier Re (insurance underwriting firm) |
| |
| Rodman L. Drake (Born 1943) | | |
c/o Columbia Management Advisors, LLC One Financial Center Boston, MA 02111 Trustee (since 1994) and Chairman of the Board (since 2009) | | Co-Founder of Baringo Capital LLC (private equity) since 2002; CEO of Crystal River Capital Inc. (real estate investments trust) since 2003; President, Continuation Investments Group, Inc. from 1997 to 2001. Oversees 65; Jackson Hewitt Tax Service Inc. (tax preparation services); Crystal Capital River Inc. (real estate investment trust); Student Loan Corporation (student loan provider); Celgene Corporation (global biotechnology company); and The Helios Funds (exchange-traded funds) |
| |
| Douglas A. Hacker (Born 1955) | | |
c/o Columbia Management Advisors, LLC One Financial Center Boston, MA 02111 Trustee (since 1996) | | Independent business executive since May 2006; Executive Vice President–Strategy of United Airlines (airline) from December 2002 to May 2006; President of UAL Loyalty Services (airline marketing company) from September 2001 to December 2002; Executive Vice President and Chief Financial Officer of United Airlines from July 1999 to September 2001. Oversees 65; Nash Finch Company (food distributor); Aircastle Limited (aircraft leasing) |
|
| Janet Langford Kelly (Born 1957) |
c/o Columbia Management Advisors, LLC One Financial Center Boston, MA 02111 Trustee (since 1996) | | Senior Vice President, General Counsel and Corporate Secretary, ConocoPhillips (integrated energy company) since September 2007; Deputy General Counsel–Corporate Legal Services, ConocoPhillips from August 2006 to August 2007; Partner, Zelle, Hofmann, Voelbel, Mason & Gette LLP (law firm) from March 2005 to July 2006; Adjunct Professor of Law, Northwestern University, from September 2004 to June 2006; Director, UAL Corporation (airline) from February 2006 to July 2006; Oversees 65; None |
| |
| Charles R. Nelson (Born 1942) | | |
c/o Columbia Management Advisors, LLC One Financial Center Boston, MA 02111 Trustee (since 1981) | | Professor of Economics, University of Washington, since January 1976; Ford and Louisa Van Voorhis Professor of Political Economy, University of Washington, since September 1993; Adjunct Professor of Statistics, University of Washington, since September 1980; Associate Editor, Journal of Money Credit and Banking, 1993-2008 Consultant on econometric and statistical matters. Oversees 65; None |
28
Fund Governance (continued)
Independent Trustees (continued)
| | |
Name, Address and Year of
Birth, Position with Funds, Year
First Elected or Appointed to Office | | Principal Occupation(s) During Past Five Years, Number of Funds in the
Columbia Funds Complex Overseen by Trustee, Other Directorships Held |
| |
| John J. Neuhauser (Born 1943) | | |
c/o Columbia Management Advisors, LLC One Financial Center Boston, MA 02111 Trustee (since 1984) | | President, Saint Michael’s College, since August 2007; University Professor, Boston College from November 2005 to August 2007; Academic Vice President and Dean of Faculties, Boston College from August 1999 to October 2005. Oversees 65; Liberty All-Star Equity Fund and Liberty All-Star Growth Fund, Inc. (closed-end funds) |
| |
| Jonathan Piel (Born 1938) | | |
c/o Columbia Management Advisors, LLC One Financial Center Boston, MA 02111 Trustee (since 1994) | | Cable television producer and website designer; The Editor, Scientific American from 1984 to 1994; Vice President, Scientific American, Inc., from 1984 to 1994; Member, Advisory Board, Stone Age Institute, Bloomington, Indiana (research institute that explores the effect of technology on human evolution); Member, Board of Directors of the National Institute of Social Sciences, New York City; Member, Board of Trustees of the William Alanson White Institute, New York City (institution for training psychoanalysts); and Member, Advisory Board, Mount Sinai Children’s Environmental Health Center, New York. Oversees 65; None |
| |
| Patrick J. Simpson (Born 1944) | | |
c/o Columbia Management Advisors, LLC One Financial Center Boston, MA 02111 Trustee (since 2000) | | Partner, Perkins Coie LLP (law firm). Oversees 65; None |
| |
| Anne-Lee Verville (Born 1945) | | |
c/o Columbia Management Advisors, LLC One Financial Center Boston, MA 02111 Trustee (since 1998) | | Retired since 1997 (formerly General Manager–Global Education Industry (from 1994 to 1997), President–Application Systems Division (from 1991 to 1994), Chief Financial Officer–US Marketing & Services (from 1988 to 1991), and Chief Information Officer (from 1987 to 1988), IBM Corporation (computer and technology)). Oversees 65; None |
29
Fund Governance (continued)
Interested Trustee
| | |
Name, Address and Year of Birth,
Position with Funds, Year First
Elected or Appointed to Office | | Principal Occupation(s) During Past Five Years, Number of Funds in the Columbia
Funds Complex Overseen by Trustee, Other Directorships Held |
| |
| William E. Mayer1 (Born 1940) | | |
c/o Columbia Management Advisors, LLC One Financial Center Boston, MA 02111 Trustee (since 1994) | | Partner, Park Avenue Equity Partners (private equity) since February 1999; Dean and Professor, College of Business, University of Maryland from 1992 to 1997. Oversees 65; Lee Enterprises (print media), WR Hambrecht + Co. (financial service provider); BlackRock Kelso Capital Corporation (investment company) |
| 1 | The Funds currently treat Mr. Mayer as an “interested person” (as defined in the Investment Company Act of 1940) by reason of his affiliation with WR Hambrecht + Co., a registered broker/dealer that may execute portfolio transactions for or engage in principal transactions with the Funds or other funds or accounts advised/managed by the Advisor or other Bank of America affiliates. |
The Statement of Additional Information includes additional information about the Trustees of the Funds and is available, without charge, upon request by calling 1-800-345-6611.
30
Fund Governance (continued)
Officers
| | |
| Name, Year of Birth and Address | | Principal Occupation(s) During the Past Five Years |
| |
| J. Kevin Connaughton (Born 1964) | | |
One Financial Center Boston, MA 02111 President (since 2009) | | Senior Vice President and General Manager–Mutual Fund Products, Columbia Management Investment Advisers, LLC since May 2010; President, Columbia Funds, since 2009, and RiverSource Funds, since May 2010 (previously Senior Vice President and Chief Financial Officer, Columbia Funds, from June 2008 to January 2009, Treasurer, Columbia Funds, from October 2003 to May 2008, and senior officer of various other affiliated funds since 2000); Managing Director, Columbia Management Advisors, LLC from December 2004 to April 2010. |
| |
| Michael G. Clarke (Born 1969) | | |
One Financial Center Boston, MA 02111 Senior Vice President and Chief Financial Officer (since 2009) | | Vice President, Columbia Management Investment Advisers, LLC since May 2010; Managing Director of Fund Administration, Columbia Management Advisors, LLC, from September 2004 to April 2010; senior officer of Columbia Funds and affiliated funds since 2002. |
| |
| Scott R. Plummer (Born 1959) | | |
5228 Ameriprise Financial Center Minneapolis, MN 55474 Senior Vice President, Secretary and Chief Legal Officer (since 2010) | | Chief Legal Officer and Assistant Secretary, Columbia Management Investment Advisers, LLC since June 2005; Vice President and Lead Chief Counsel–Asset Management, Ameriprise Financial, Inc. since May 2010 (previously Vice President and Chief Counsel–Asset Management, from 2005 to April 2010, and Vice President–Asset Management Compliance from 2004 to 2005); Vice President, Chief Counsel and Assistant Secretary, Columbia Management Investment Distributors, Inc. since 2008; Vice President, General Counsel and Secretary, Ameriprise Certificate Company since 2005; Chief Counsel, RiverSource Distributors, Inc. since 2006; Vice President, General Counsel and Secretary, RiverSource Funds, since December 2006; Senior Vice President, Secretary and Chief Legal Officer, Columbia Funds, since May 2010. |
| |
| Linda J. Wondrack (Born 1964) | | |
One Financial Center Boston, MA 02111 Senior Vice President and Chief Compliance Officer (since 2007) | | Vice President and Chief Compliance Officer, Columbia Management Investment Advisers, LLC since May 2010; Chief Compliance Officer, Columbia Funds, since 2007, and RiverSource Funds, since May 2010; Director (Columbia Management Group, LLC and Investment Product Group Compliance), Bank of America, from June 2005 to April 2010; Director of Corporate Compliance and Conflicts Officer of MFS Investment Management (investment management) from August 2004 to May 2005. |
| |
| William F. Truscott (Born 1960) | | |
53600 Ameriprise financial Center Minneapolis, MN 55474 Senior Vice President (since 2010) | | Chairman of the Board, Columbia Management Investment Advisers, LLC since May 2010 (previously President, Chairman of the Board and Chief Investment Officer, from 2001 to April 2010); Chief Executive Officer, U.S. Asset Management & President, Annuities, Ameriprise Financial, Inc. since May 2010 (previously President–U.S. Asset Management and Chief Investment Officer from 2005 to April 2010, and Senior Vice President–Chief Investment Officer, from 2001 to 2005); Director, President and Chief Executive Officer, Ameriprise Certificate Company since 2006; Director, Columbia Management Investment Distributors, Inc. since May 2010 (previously Chairman of the Board and Chief Executive Officer from 2008 to April 2010); Chairman of the Board and Chief Executive Officer, RiverSource Distributors, Inc. since 2006. |
31
Fund Governance (continued)
Officers (continued)
| | |
Name, Year of Birth and Address | | Principal Occupation(s) During the Past Five Years
|
| |
| Colin Moore (Born 1958) | | |
One Financial Center Boston, MA 02111 Senior Vice President (since 2010) | | Director and Chief Investment Officer, Columbia Management Investment Advisers, LLC since May 2010; Manager, Managing Director and Chief Investment Officer of Columbia Management Advisors, LLC from 2007 to April 2010; Head of Equities, Columbia Management Advisors, LLC from 2002 to 2007. |
| |
| Michael A. Jones (Born 1959) | | |
100 Federal Street Boston, MA 02110 Senior Vice President (since 2010) | | Director and President, Columbia Management Investment Advisers, LLC since May 2010; President and Director, Columbia Management Investment Distributors, Inc. since May 2010; Manager, Chairman, Chief Executive Officer and President, Columbia Management Advisors, LLC from 2007 to April 2010; Chief Executive Officer, President and Director, Columbia Management Distributors, Inc. from November 2006 to April 2010; previously, co-president and senior managing director at Robeco Investment Management. |
| |
| Amy Johnson (Born 1965) | | |
5228 Ameriprise Financial Center Minneapolis, MN 55474 Senior Vice President (since 2010) | | Senior Vice President and Chief Operating Officer, Columbia Management Investment Advisers, LLC since May 2010 (previously Chief Administrative Officer, from 2009 until April 2010, Vice President–Asset Management and Trust Company Services, from 2006 to 2009, and Vice President–Operations and Compliance from 2004 to 2006). |
| |
| Joseph F. DiMaria (Born 1968) | | |
One Financial Center Boston, MA 02111 Treasurer (since 2009) and Chief Accounting Officer (since 2008) | | Vice President, Mutual Fund Administration, Columbia Management Investment Advisers, LLC, since May 2010; Director of Fund Administration, Columbia Management Advisors, LLC from January 2006 to April 2010; Head of Tax/Compliance and Assistant Treasurer, Columbia Management Advisors, LLC, from November 2004 to December 2005. |
| |
| Marybeth Pilat (Born 1968) | | |
One Financial Center Boston, MA 02111 Deputy Treasurer (since 2010) | | Vice President, Mutual Fund Administration, Columbia Management Investment Advisers, LLC, since May 2010; Vice President, Investment Operations, Bank of America, from October 2008 to April 2010; Finance Manager, Boston Children’s Hospital from August 2008 to October 2008; Director, Mutual Fund Administration, Columbia Management Advisors, LLC, from May 2007 to July 2008; Vice President, Mutual Fund Valuation, Columbia Management Advisors, LLC, from January 2006 to May 2007; Vice President, Mutual Fund Accounting Oversight, Columbia Management Advisors, LLC from January 2005 to January 2006. |
| |
| Julian Quero (Born 1967) | | |
One Financial Center Boston, MA 02111 Deputy Treasurer (since 2008) | | Vice President, Mutual Fund Administration, Columbia Management Investment Advisers, LLC since May 2010; Director of Fund Administration, Columbia Management Advisors, LLC, from August 2008 to April 2010; Senior Tax Manager, Columbia Management Advisors, LLC from August 2006 to July 2008; Senior Compliance Manager, Columbia Management Advisors, LLC from April 2002 to August 2006. |
| |
| Stephen T. Welsh (Born 1957) | | |
One Financial Center Boston, MA 02111 Vice President (since 2006) | | President and Director, Columbia Management Investment Services Corp. since May 2010; President and Director, Columbia Management Services, Inc. from July 2004 to April 2010; Managing Director, Columbia Management Distributors, Inc. from August 2007 to April 2010. |
32
Board Consideration and Approval of Advisory Agreements
The Advisory Fees and Expenses Committee of the Board of Trustees meets several times annually to review the current advisory agreements (collectively, the “Agreements”) of the funds for which the Trustees serve as trustees (each a “fund”) and to determine whether to recommend that the full Board approve the continuation of the Agreements for an additional one-year period. After the Committee has made its recommendation, the full Board, including the Independent Trustees, determines whether to approve the continuation of the Agreements. In addition, the full Board, including the Independent Trustees, considers matters bearing on the Agreements at most of its other meetings throughout the year and meets regularly with senior management of the funds and Columbia, the funds’ investment adviser, including the senior manager of each investment area within Columbia. Through the Board’s Investment Oversight Committees, Trustees also meet with selected fund portfolio managers, research analysts and traders at various times throughout the year.
The Trustees receive and review all materials that they, their legal counsel or Columbia believe to be reasonably necessary for the Trustees to evaluate the Agreements and to determine whether to approve the continuation of the Agreements. Those materials generally include, among other items, (i) information on the investment performance of each fund relative to the performance of peer groups of mutual funds and the fund’s performance benchmarks, and additional information assessing performance on a risk-adjusted basis, (ii) information on each fund’s advisory fees and other expenses, including information comparing the fund’s expenses to those of peer groups of mutual funds and information about any applicable expense caps and fee “breakpoints,” (iii) information about the profitability of the Agreements to Columbia, including potential “fall-out” or ancillary benefits that Columbia and its affiliates may receive as a result of their relationships with the funds and (iv) information obtained through Columbia’s response to a questionnaire prepared at the request of the Trustees by counsel to the funds and independent legal counsel to the Independent Trustees. The Trustees also consider other information such as (v) Columbia’s financial results and financial condition, (vi) each fund’s investment objective and strategies and the size, education and experience of Columbia’s investment staffs and their use of technology, external research and trading cost measurement tools, (vii) the allocation of the funds’ brokerage and the use of “soft” commission dollars to pay for research products and services, (viii) Columbia’s resources devoted to, and its record of compliance with, the funds’ investment policies and restrictions, policies on personal securities transactions and other compliance policies and legal and regulatory requirements, (ix) Columbia’s response to various legal and regulatory proceedings since 2003 and to the recent period of volatility in the securities markets and (x) the economic outlook generally and for the mutual fund industry in particular. In addition, the Advisory Fees and Expenses Committee confers with the independent fee consultant (the “Fee Consultant”) appointed by the Independent Trustees pursuant to an assurance of discontinuance entered into by Columbia with the New York Attorney General (“NYAG”) to settle a civil complaint filed by the NYAG relating to trading in mutual fund shares (the “NYAG Settlement”) and reviews materials relating to the funds’ relationships with Columbia provided by the Fee Consultant. Under the NYAG Settlement, the Fee Consultant’s role is to manage the process by which management fees are negotiated so that they are negotiated in a manner that is at arms’ length and reasonable. Throughout the process, the Trustees have the opportunity to ask questions of and to request additional materials from Columbia and to consult with the Fee Consultant and independent legal counsel to the Independent Trustees.
The Board of Trustees most recently approved the continuation of the Agreements at its October, 2009 meeting, following meetings of the Advisory Fees and Expenses Committee held in December, 2008 and February, May, June, August, September and October, 2009.
The Board of Trustees also unanimously approved new advisory agreements (the “New Agreements”) for the funds with RiverSource Investments, LLC (to be renamed Columbia Management Investment Advisers, LLC) (“RiverSource”) at a meeting held on December 17, 2009. The New Agreements have since been approved by shareholders of the funds and are expected to take effect upon the closing of the acquisition of the long-term asset management business of Columbia by Ameriprise Financial, Inc. (“Ameriprise”), the parent company of RiverSource Investments, LLC (the “Transaction”).
The Advisory Fees and Expenses Committee met on multiple occasions to review the New Agreements for the funds. On
33
December 14, 2009, the Advisory Fees and Expenses Committee recommended that the full Board approve the New Agreements. On December 17, 2009, the full Board, including a majority of the Independent Trustees, approved the New Agreements. Prior to their approval of the New Agreements, the Advisory Fees and Expenses Committee and the Independent Trustees requested and evaluated materials from, and were provided materials and information about the Transaction and matters related to the proposals by, Bank of America Corp., Columbia, RiverSource and Ameriprise. In connection with their most recent approval of the Agreements (as discussed above) on October 28, 2009, the Advisory Fees and Expenses Committee and the Trustees requested and evaluated materials from Columbia, and discussed such materials with representatives of Columbia. The Advisory Fees and Expenses Committee, at meetings held on August 11, 2009, September 23, 2009, October 27, 2009, November 30, 2009, December 7, 2009 and December 14, 2009, and the Independent Trustees, at meetings held on August 12, 2009, August 20, 2009, October 28, 2009, December 8, 2009, December 14, 2009 and December 17, 2009, discussed the materials provided in connection with the October 28, 2009 approvals and the materials provided in connection with their consideration of the New Agreements and other matters relating to the Transaction with representatives of Bank of America Corp., Columbia, RiverSource and Ameriprise. The Trustees consulted with experienced legal counsel, who advised on the legal standards for consideration by the Trustees. The Independent Trustees also discussed the proposed approvals with independent legal counsel in private sessions.
The Trustees reviewed each New Agreement, as well as certain information obtained through RiverSource’s responses to initial and supplemental questionnaires prepared at the request of the Trustees by counsel to the funds and independent legal counsel to the Independent Trustees. The Advisory Fees and Expenses Committee and the Trustees also met with, and reviewed and considered a report prepared and provided by, the Fee Consultant (as discussed above).
In considering whether to approve the New Agreements and to approve the continuation of the Agreements, the Trustees, including the Independent Trustees, did not identify any single factor as determinative, and each weighed various factors as he or she deemed appropriate. In particular, the Trustees considered the following matters:
Matters Relating to the Agreements and the New Agreements
The nature, extent and quality of the services provided or to be provided to the funds under the Agreements and the New Agreements. The Trustees considered the nature, extent and quality of the services provided and the resources dedicated by Columbia and its affiliates (or to be provided and dedicated by RiverSource and its affiliates) to the funds.
Among other things, the Trustees considered, with respect to Columbia and its affiliates, (i) Columbia’s ability (including its personnel and other resources, compensation programs for personnel involved in fund management, reputation and other attributes) to attract, motivate and retain highly qualified research, advisory and supervisory investment professionals; (ii) the portfolio management services provided by those investment professionals; and (iii) the trade execution services provided on behalf of the funds. For each fund, the Trustees also considered the benefits to shareholders of investing in a mutual fund that is part of a family of funds offering exposure to a variety of asset classes and investment disciplines and providing a variety of fund and shareholder services.
Among other things, the Trustees considered, with respect to RiverSource and its affiliates, (i) the expected effect of the Transaction on the operations of the funds, (ii) the information provided by RiverSource with respect to the nature, extent and quality of services to be provided by it, (iii) RiverSource’s compliance program and compliance record, (iv) the ability of RiverSource (including personnel and other resources, compensation programs for personnel involved in fund management, reputation and other attributes) to attract, motivate and retain highly qualified research, advisory and supervisory investment professionals, (v) the trade execution services to be provided on behalf of the funds and (vi) the quality of RiverSource’s investment research capabilities and the other resources that it indicated it would devote to each fund. As noted above, the Trustees also considered RiverSource’s representations that the Chief Investment Officer of Columbia would serve as the Chief Investment Officer of RiverSource following the Transaction, and that the process for determining the portfolio management team for each Fund would be substantially the
34
same process as has customarily been followed by Columbia, and reported to the Trustees, in evaluating the performance of Columbia’s portfolio management teams. The Trustees also noted the professional experience and qualifications of the senior personnel of RiverSource. The Trustees also considered the compliance programs of and the compliance-related resources proposed to be provided to the funds by RiverSource and its affiliates, including discussions with the funds’ Chief Compliance Officer regarding RiverSource’s compliance program. The Trustees also discussed RiverSource’s compliance program with the Chief Compliance Officer for the RiverSource funds. The Trustees also considered RiverSource’s representation that the funds’ Chief Compliance Officer would serve as the Chief Compliance Officer of RiverSource following the Transaction. The Trustees considered RiverSource’s ability to provide administrative services to the funds, noting that while some Agreements contemplated the provision of certain administrative services, following the Transaction, all administrative services were anticipated to be provided pursuant to a new administrative services agreement. The Trustees also considered RiverSource’s ability to coordinate the activities of each fund’s other service providers. The Trustees considered performance information provided by RiverSource with respect to other mutual funds advised by RiverSource, and discussed with senior executives of RiverSource its process for identifying which portfolio management teams of the legacy Columbia and RiverSource organizations would be responsible for the management of the funds following the Transaction.
After reviewing those and related factors, the Trustees concluded, within the context of their overall conclusions, that the nature, extent and quality of services provided by Columbia supported the continuation of the Agreements, and that the nature, extent and quality of services expected to be provided by RiverSource supported approval of the New Agreements.
The costs of the services provided and profits realized by Columbia and its affiliates, and the expected costs of the services to be provided and the profits expected to be realized by RiverSource and its affiliates, from their relationships with the funds. With respect to Columbia and its affiliates, the Trustees considered the fees charged to the funds for advisory services as well as the total expense levels of the funds. That information included comparisons (provided by management and by an independent third-party data provider) of each fund’s advisory fees and total expense levels to those of the fund’s peer groups and information about the advisory fees charged by Columbia to comparable institutional accounts. In considering the fees charged to those accounts, the Trustees took into account, among other things, management’s representations about the differences between managing mutual funds as compared to other types of accounts, including differences in the services provided, differences in the risk profile of such business for Columbia, and the additional resources required to manage mutual funds effectively. In evaluating each fund’s advisory fees, the Trustees also took into account the demands, complexity and quality of the investment management of the fund. The Trustees considered existing advisory fee breakpoints, and Columbia’s use of advisory fee waivers and expense caps, which benefited a number of the funds. The Trustees also noted management’s stated justification for the fees charged to the funds, which included information about the investment performance of the funds and the services provided to the funds.
The Trustees considered that Columbia U.S. Treasury Index Fund’s total expenses were in the fifth quintile and actual management fees were in the fourth quintile (where the lowest fees and expenses would be in the first quintile) of the peer group selected by an independent third-party data provider for purposes of expense comparisons.
The Trustees also considered the compensation directly or indirectly received by Columbia and its affiliates from their relationships with the funds. The Trustees reviewed information provided by management as to the profitability to Columbia and its affiliates of their relationships with each fund, and information about the allocation of expenses used to calculate profitability. When reviewing profitability, the Trustees also considered court cases in which adviser profitability was an issue in whole or in part, the performance of the relevant funds, the expense level of each fund, and whether Columbia had implemented breakpoints and/or expense caps with respect to the fund.
In connection with the integration of the legacy Columbia and RiverSource organizations, the Trustees considered, among other things, RiverSource’s projected annual net expense synergies (reductions in the cost of providing services to the funds), the timetable over which such synergies are expected
35
to be realized and the extent to which any such synergies are expected to be shared with the funds. The Trustees also considered information provided by RiverSource regarding their respective financial conditions. The Trustees considered that RiverSource proposed to continue voluntary expense caps currently in effect for the funds and that RiverSource had undertaken not to change these caps without further discussion with the Independent Trustees.
After reviewing those and related factors, the Trustees concluded, within the context of their overall conclusions, that the advisory fees charged to each fund, and the related profitability to Columbia and its affiliates of their relationships with the fund, supported the continuation of the Agreement pertaining to that fund, and that the expected profitability to RiverSource and its affiliates from its relationship with each fund supported the approval of the New Agreements.
Economies of Scale. With respect to Columbia and its affiliates, the Trustees considered the existence of any economies of scale in the provision by Columbia of services to each fund, to groups of related funds, and to Columbia’s investment advisory clients as a whole and whether those economies were shared with the funds through breakpoints in the investment advisory fees or other means, such as fee waivers/expense reductions and additional investments by Columbia in investment, trading and compliance resources. The Trustees noted that many of the funds benefited from breakpoints, fee waivers/expense caps, or both. In considering those issues, the Trustees also took note of the costs of the services provided (both on an absolute and a relative basis) and the profitability to Columbia and its affiliates of their relationships with the funds, as discussed above.
With respect to RiverSource and its affiliates, the Trustees considered the existence of any anticipated economies of scale in the provision by RiverSource of services to each fund, to groups of related funds and to RiverSource’s investment advisory clients as a whole, and whether those economies of scale were expected to be shared with the funds. The Trustees considered Ameriprise’s anticipated net expense synergies resulting from the Transaction, and considered the possibility that the funds might benefit from economies of scale over time as part of the larger, combined fund complex. The Trustees considered how expected synergies and potential economies of scale might benefit the funds and their shareholders. The Trustees considered the potential effect of the Transaction on the distribution of the funds, and noted that the proposed management fee schedules for the funds generally contained breakpoints that would reduce the fee rate on assets above specified threshold levels.
After reviewing those and related factors, the Trustees concluded, within the context of their overall conclusions, that the extent to which economies of scale were shared or expected to be shared with the funds supported the continuation of the Agreements and the approval of the New Agreements.
Matters Relating to the Agreements
Investment performance of the funds and Columbia. The Trustees reviewed information about the performance of each fund over various time periods, including information prepared by an independent third-party data provider that compared the performance of each fund to the performance of peer groups of mutual funds and performance benchmarks. The Trustees also reviewed a description of the third party’s methodology for identifying each fund’s peer group for purposes of performance and expense comparisons. The Trustees also considered additional information that the Advisory Fees and Expenses Committee requested from Columbia relating to funds that presented relatively weaker performance and/or relatively higher fees or expenses. In the case of each fund whose performance lagged that of a relevant peer group for certain (although not necessarily all) periods, the Trustees concluded that other factors relevant to performance were sufficient, in light of other considerations, to warrant continuation of the fund’s Agreements. Those factors varied from fund to fund, but included one or more of the following: (i) that the fund’s performance, although lagging in certain recent periods, was stronger over the longer term; (ii) that the underperformance was attributable, to a significant extent, to investment decisions that were reasonable and consistent with the fund’s investment strategy and policies and that the fund was performing within a reasonable range of expectations, given those investment decisions, market conditions and the fund’s investment strategy; (iii) that the fund’s performance was competitive when compared to other relevant performance benchmarks or peer groups; (iv) that Columbia had taken or was taking steps designed to help improve the fund’s investment performance,
36
including, but not limited to, replacing portfolio managers or modifying investment strategies; and (v) that Columbia proposed to waive advisory fees or cap the expenses of the fund.
The Trustees noted that, through April 30, 2009, Columbia U.S. Treasury Index Fund’s performance was in the fourth quintile (where the best performance would be in the first quintile) for the one-, three-, five- and ten-year periods, of the peer group selected by an independent third-party data provider for purposes of performance comparisons.
The Trustees also considered Columbia’s performance and reputation generally, the funds’ performance as a fund family generally, and Columbia’s historical responsiveness to Trustee concerns about performance and Columbia’s willingness to take steps intended to improve performance. After reviewing those and related factors, the Trustees concluded, within the context of their overall conclusions regarding each of the Agreements, that the performance of each fund and Columbia was sufficient, in light of other considerations, to warrant the continuation of the Agreement pertaining to that fund.
Other Factors. The Trustees also considered other factors with respect to Columbia and its affiliates, which included but were not limited to the following:
| n | | the extent to which each fund had operated in accordance with its investment objective and investment restrictions, the nature and scope of the compliance programs of the funds and Columbia and the compliance-related resources that Columbia and its affiliates were providing to the funds; |
| n | | the nature, quality, cost and extent of administrative and shareholder services overseen and performed by Columbia and its affiliates, both under the Agreements and under separate agreements for the provision of transfer agency and administrative services; |
| n | | so-called “fall-out benefits” to Columbia and its affiliates, such as the engagement of its affiliates to provide distribution, brokerage and transfer agency services to the funds, and the benefits of research made available to Columbia by reason of brokerage commissions generated by the funds’ securities transactions, as well as possible conflicts of interest associated with those fall-out and other benefits, and the reporting, disclosure and other processes in place to disclose and monitor those possible conflicts of interest; and |
| n | | the report provided by the Fee Consultant, which included information about and analysis of the funds’ fees, expenses and performance. |
Matters Relating to the New Agreements
The Trustees considered all materials that they, their legal counsel or RiverSource believed reasonably necessary to evaluate and to determine whether to approve the New Agreements. In their deliberations, the Trustees did not identify any particular information that was all-important or controlling, and individual Trustees may have attributed different weights to the various factors. The material factors that formed the basis for the Trustees’ approvals included the factors set forth below:
| | (i) | the reputation, financial strength, regulatory histories and resources of RiverSource and its parent, Ameriprise; |
| | (ii) | the capabilities of RiverSource with respect to compliance, including an assessment of RiverSource’s compliance system by the funds’ Chief Compliance Officer; |
| | (iii) | the qualifications of the personnel of RiverSource that would be expected to provide advisory services to each fund, including RiverSource’s representations that the Chief Investment Officer of Columbia would serve as the Chief Investment Officer of RiverSource, and that the process for determining the portfolio management team for each fund would be substantially the same process as has customarily been followed by Columbia, and reported to the Trustees, in evaluating the performance of Columbia’s portfolio management teams; |
| | (iv) | the terms and conditions of the New Agreements, including the differences between the New Agreements and the Agreements; |
| | (v) | the terms and conditions of other agreements and arrangements relating to the future operations of the funds, including an administrative services agreement and a Master Services and Distribution Agreement; |
| | (vi) | the commitment of RiverSource and Ameriprise that there would not be any diminution in the nature, quality and extent of services provided to each fund or its shareholders following closing of the Transaction; |
37
| | (vii) | that the Trustees recently had completed a full annual review of the Agreements, as required by the 1940 Act, for each fund and had determined that they were satisfied with the nature, extent and quality of services provided thereunder and that the management fee rate for each fund were sufficient to warrant their approval; |
| | (viii) | that the advisory fee rates payable by each fund would not change; |
| | (ix) | that RiverSource and Bank of America, and not any fund, would bear the costs of obtaining approvals of the New Agreement; |
| | (x) | that Ameriprise and RiverSource had agreed to exercise reasonable best efforts to assure that, for a period of two years after the closing of the Transaction, there would not be imposed on any fund any “unfair burden” (within the meaning of Section 15(f) of 1940 Act) with respect to the Transaction; and |
| | (xi) | that certain members of RiverSource’s management have a significant amount of experience integrating other fund families; that certain current Columbia personnel that would be integrated into RiverSource and its affiliates as a result of the Transaction also have experience in integrating fund families; and that the senior management of RiverSource following the Transaction would include certain senior executives of Columbia who are currently responsible for oversight of services provided to the funds. |
Investment Advisory Fee Rates and Other Expenses. The Trustees considered the fact that the advisory fee rates payable by each fund to RiverSource under the New Agreements are the same as those currently paid by each fund to Columbia under the Agreements. The Trustees noted that in connection with their October 28, 2009 approval of the continuance of the Agreements, they had concluded, within the context of their overall conclusions regarding each such agreement, that the advisory fees charged to each fund supported the continuation of the agreement pertaining to that fund.
The Trustees noted that in certain cases the effective advisory fee rate for a RiverSource fund was lower than the proposed investment advisory fee rate for a fund with generally similar investment objectives and strategies. The Trustees also noted that RiverSource’s investment advisory fee rates for equity and balanced funds generally are subject to adjustments based on investment performance, whereas the proposed investment advisory fee rates for the funds, consistent with those in the Agreements, do not reflect performance adjustments. The Trustees considered existing advisory fee breakpoints and RiverSource’s undertaking not to change expense caps previously implemented by Columbia with respect to the funds without further discussion with the Independent Trustees.
The Trustees received and considered information about the advisory fees charged by RiverSource to institutional accounts. In considering the fees charged to those accounts, the Trustees took into account, among other things, RiverSource’s representations about the differences between managing mutual funds as compared to other types of accounts, including differences in the services provided, differences in the risk profile of such business for RiverSource and the additional resources required to manage mutual funds effectively. In evaluating each fund’s expected advisory fees, the Trustees also took into account the demands, complexity and quality of the investment management of the fund.
The Trustees also considered that for certain funds, certain administrative services that are provided under the Agreements would not be provided under the New Agreements, but under a separate administrative services agreement. The Trustees noted that, unlike fees under an advisory agreement, fees under the administrative services agreement could be changed without shareholder approval, although RiverSource had not proposed any increase in such administrative fees and any such increase would require Board approval. The Trustees also noted Ameriprise’s and RiverSource’s covenants regarding compliance with Section 15(f) of the 1940 Act.
After reviewing these and related factors, the Trustees concluded, within the context of their overall conclusions, that the expected advisory fee rates and expenses of each fund supported the approval of the New Agreements.
Other Benefits to RiverSource. The Trustees received and considered information regarding any expected “fall-out” or ancillary benefits to be received by RiverSource and its affiliates as a result of their relationships with the funds, such as the engagement of RiverSource to provide administrative services to the funds and the engagement of RiverSource’s
38
affiliates to provide distribution and transfer agency services to the funds. The Trustees considered that the funds’ distributor, which would be an affiliate of RiverSource, retains a portion of the distribution fees from the funds and receives a portion of the sales charges on sales or redemptions of certain classes of shares of the funds. The Trustees also considered the benefits of research made available to RiverSource by reason of brokerage commissions generated by the funds’ securities transactions, and reviewed information about RiverSource’s practices with respect to allocating portfolio brokerage for brokerage and research services. The Trustees considered the possible conflicts of interest associated with certain fall-out or other ancillary benefits and the reporting, disclosure and other processes that would be in place to disclose and to monitor such possible conflicts of interest. The Trustees recognized that RiverSource’s profitability would be somewhat lower without these benefits.
Conclusions
Based on their evaluation of all factors that they deemed to be material, including those factors described above, and assisted by the advice of independent counsel and the Fee Consultant, the Trustees, including the Independent Trustees, (i) approved the continuance of each of the Agreements through October 31, 2010 and (ii) approved each New Agreement.
39
Summary of Management Fee Evaluation by Independent Fee Consultant (Columbia Management Advisors, LLC)
EXCERPTS FROM REPORT OF INDEPENDENT FEE CONSULTANT TO THE FUNDS SUPERVISED BY THE COLUMBIA ATLANTIC BOARD
Prepared Pursuant to the February 9, 2005 Assurance of Discontinuance among the Office of Attorney General of New York State, Columbia Management Advisors, LLC, and Columbia Management Distributors, Inc. November 6, 2009
I. Overview
On February 9, 2005, Columbia Management Advisors, LLC (“CMA”) and Columbia Management Distributors, Inc.1 (“CMDI”) agreed to the New York Attorney General’s Assurance of Discontinuance (“AOD”). Among other things, the AOD stipulates that CMA may manage or advise a Columbia Fund (“Columbia Fund” and, together with some or all of such funds, the “Columbia Funds”) only if the Independent Members of the Columbia Fund’s Board of Trustees appoint a Senior Officer or retain an Independent Fee Consultant (“IFC”) who is to manage the process by which proposed management fees are negotiated. The AOD further stipulates that the Senior Officer or IFC is to prepare a written annual evaluation of the fee negotiation process.
With effect from January 1, 2007, the Independent Members of the Board of Trustees for certain Columbia Funds known collectively as the “Atlantic Funds” (together with the other members of that Board, the “Trustees”) retained me as IFC for the Atlantic Funds.2 In this capacity, I have prepared the fifth annual written evaluation of the fee negotiation process. As was the case with the 2007 and 2008 reports, my immediate predecessor as IFC, John Rea, provided invaluable assistance in the preparation of this year’s report.
A. Role of the Independent Fee Consultant
The AOD charges the IFC with “managing the process by which proposed management fees … to be charged the Columbia Fund are negotiated so that they are negotiated in a manner which is at arms’ length and reasonable and consistent with this Assurance of Discontinuance.” The AOD also provides that CMA “may manage or advise a Columbia Fund only if the reasonableness of the proposed management fees is determined by the Board of Trustees … using … an annual independent written evaluation prepared by or under the direction of … the Independent Fee Consultant.” Therefore, the AOD makes clear that the IFC does not supplant the Trustees in negotiating management fees with CMA, nor does the IFC substitute his or her judgment for that of the Trustees with respect to the reasonableness of proposed fees or any other matter that is committed to the business judgment of the Trustees.
B. Elements Involved in Managing the Fee Negotiation Process
In preparing the report required by the AOD, the IFC must consider at least the following six factors set forth in the AOD:
| 1. | The nature and quality of CMA’s services, including the Fund’s performance; |
| 2. | Management fees (including any components thereof) charged by other mutual fund companies for like services; |
| 3. | Possible economies of scale as the Fund grows larger; |
| 4. | Management fees (including any components thereof) charged to institutional and other clients of CMA for like services; |
| 5. | Costs to CMA and its affiliates of supplying services pursuant to the management fee agreements, excluding any intra-corporate profit; and |
| 6. | Profit margins of CMA and its affiliates from supplying such services. |
C. Organization of the Annual Evaluation
This report, like last year’s, focuses on the six factors and contains a section for each factor except that CMA’s costs and profits from managing the Funds are treated in a single section. In addition to a discussion of these factors, the report offers recommendations to improve the fee review process in future years. A review of the status of recommendations made in the 2008 Report is being provided separately with the materials for the October meeting.
| 1 | CMA and CMDI are subsidiaries of Columbia Management Group, LLC (“CMG”), and are the successors to the entities named in the AOD. |
| 2 | I have no material relationship with Bank of America, CMG or any of its affiliates, aside from serving as IFC, and I am aware of no material relationship with any of their affiliates. I retained John Rea, an independent economic consultant, to assist me with this report. |
| | Unless otherwise stated or required by the context, this report covers only the Atlantic Funds, which are also referred as the “Funds.” |
40
II. Summary of Findings
A. General
| 1. | Based upon my examination of the information supplied by CMG in the light of the six factors set forth in the AOD, I conclude that the Trustees have the relevant information necessary to evaluate the reasonableness of the proposed management fees for each Atlantic Fund. |
| 2. | In my view, the process by which the proposed management fees of the Funds have been negotiated in 2009 thus far has been, to the extent practicable, at arms’ length and reasonable and consistent with the AOD. |
B. Nature and Quality of Services, Including Performance
| 3. | The performance of the Funds has been relatively strong in recent years, although the one-year record was weaker than longer-term records. Based upon 1-, 3-, 5-, and 10-year returns through April 30, 2009, at least half of all the Funds were in the first and second performance quintiles in each of the three longest performance periods; for the one-year period, 40% of the Funds were in the top two quintiles. No more than 13% of the Funds were in the fifth quintile in any one performance period. Domestic equity, quantitative equity, and taxable fixed-income Funds were the strongest performers in 2009, while most foreign equity Funds lagged behind their competitors. |
| 4. | Performance rankings were similar in 2008 and 2009: the 1- and 3-year rankings declined slightly over the previous year, while the 5-year rankings improved modestly. Year over year, for the 1- and 3-year periods, the performance of equity Funds, both domestic and international, declined, while that of fixed-income Funds improved. Between three-fifths to two-thirds of the Funds changed quintile rankings in 2009 in the 1-, 3-, and 5-year performance periods. |
| 5. | The performance of the domestic equity Funds against their benchmarks was good for the 3- and 5-year performance periods. In contrast, gross returns of international equity and fixed-income Funds typically fell short of their benchmarks. The performance of equity Funds against their benchmarks was highly correlated to performance versus their peers; no such correlation was observed for fixed-income Funds. |
| 6. | The Atlantic equity Funds’ overall performance adjusted for risk was solid. Based upon 3-year returns, nearly 57% of the equity Funds had a combination of risk-adjusted and unadjusted returns that placed them in the top half of their performance universes. About one quarter of the fixed-income Funds posted high returns and low risk relative to comparable funds. Just over half of the fixed-income Funds, primarily tax-exempt Funds, took on more risk than the typical fund in their performance universes. |
| 7. | The industry-standard procedure used by Lipper that includes all share classes in the performance universe tends to bias a Fund’s ranking upward within that universe. The bias occurs because either no-12b-1 fee or low-12b-1 fee share classes of the Atlantic Funds are compared with funds in performance universes that include all share classes of multi-class funds with 12b-1 fees of up to 100 basis points. Correcting this bias by limiting the performance universe to classes of comparable funds with low or no 12b-1 fees (a “filtered universe”) lowers the relative performance for the Funds, but not to a material extent. The filtering process, however, did identify one Fund for further review that had not been identified as a review fund using unfiltered universes. Conversely, two Funds that had been identified as review funds in the unfiltered universe lost that status in filtered universes. |
| 8. | A small number of Funds have consistently underperformed over the past five years. The exact number depends on the criteria used to evaluate longer-term performance. For example, only three Funds had below-median performance in each 1- and 3-year period from 2005 to 2009. |
| 9. | The services performed by CMG professionals beyond portfolio management, such as compliance, legal, information technology, risk management, finance, and fund administration, are critical to the success of the Funds and appear to be of high quality. |
C. Management Fees Charged by Other Mutual Fund Companies
| 10. | The Funds’ management fees and total expenses are generally low relative to those of their peers, with over half of the Funds in the most favorable two quintiles. Only 26% of the Funds ranked in the two most expensive quintiles for actual management fees, and 18% in those quintiles for total expenses. Two Funds are in the fifth quintile for total |
41
| | expenses; four Funds are in the fifth quintile for actual management fees. |
| 11. | The highest concentration of low-expense Funds is found among the foreign equity Funds. The 12 former Excelsior Funds have relatively high fees and expenses, with two-thirds ranking in either the fourth or fifth quintiles for actual management fees. The higher actual management fee rankings of certain former Excelsior Funds are due in part to fee schedules that are higher than standard Columbia Fund fee schedules at current asset levels. |
| 12. | The distribution of total expense and management fee rankings has improved over the prior two years. The implementation of the voluntary standardized cap system has contributed significantly to the improved rankings in 2009. |
| 13. | The management fees of the Atlantic Funds are generally in line with those of Columbia Funds supervised by the Nations Board of Trustees (the “Nations Funds”). To the extent that Atlantic Funds have higher average fees in certain investment categories than Nations Funds, the difference reflects either differences in asset size, different fee structures of the former Excelsior Funds, or special circumstances of the Funds included in the investment categories. |
D. Trustees’ Advisory Contract Review Process
| 14. | The Trustees’ evaluation process identified 16 Funds in 2009 for further review based upon long-standing criteria relating to their relative performance or expenses or both. When compared in filtered universes, one additional Fund met the criteria for further review. CMG provided further information about each of those Funds to assist the Trustees in their evaluation. |
E. Potential Economies of Scale
| 15. | CMG presented to the Trustees its analysis of the sources and sharing of potential economies of scale. CMG views economies of scale as arising at the complex level and would regard estimates of scale economies for individual funds as unreliable. In its analysis, CMG did not identify specific sources of economies of scale or provide any estimates of any economies of scale that might arise from future asset growth. CMG’s analysis included measures taken by the Trustees and CMG that seek to share any potential economies of scale through breakpoints in management fee schedules, the establishment of expense limits for each Fund, enhanced shareholder services, fund mergers, and operational consolidation. |
| 16. | An examination of the contractual fee schedules for five Atlantic Funds shows that those with standard fee structures are generally in line with those of their competitors. The fee schedules of the former Excelsior Funds, however, have high initial fees relative to competitors but otherwise have comparable breakpoint structures. |
F. Management Fees Charged to Institutional Clients
| 17. | CMG has provided Trustees with comparisons of mutual fund management fees and institutional fees based upon standardized fee schedules and upon actual fees. The results show that, consistent with industry practice, actual and scheduled institutional fees are generally lower than the Funds’ management fees. CMG provided additional data this year demonstrating that at small asset levels, the effective fee of certain Funds may be equal to or less than institutional fee levels at those asset levels, due to the effect of expense limits on small funds with high gross expenses. CMG also analyzed the differences between the services provided and risks borne on the one hand by a manager of mutual funds and on the other by institutional advisers, and suggested that these differences should be kept in mind when Trustees review the reasonableness of the Funds’ management fees. |
G. Revenues, Expenses, and Profits
| 18. | The activity-based cost allocation methodology employed by CMG to allocate costs, both direct and indirect, for purposes of calculating Fund profitability is thoughtful and detailed. This year, CMG further refined the technique by allocating additional indirect expenses on an activity basis. |
| 19. | The materials provided on CMG’s revenues and expenses with respect to the Funds and the methodology underlying their construction form a sufficient basis for Trustees to evaluate the expenses of and profitability to CMG arising out of its relationships with the Funds. |
42
| 20. | CMG provided a firm-wide pro forma 2009 income statement demonstrating the effect of market events beginning in the fourth quarter of 2008 on its revenues and profitability to provide an additional perspective on calendar 2008 profitability data. In particular, 2008 revenues reflected the higher market prices prevailing during the first three quarters of that year, while expenses dropped due to cost cutting in the wake of the market downturn late in 2008. The continuing effects of this downturn are expected to produce a significant decline in profitability this year. |
| 21. | In 2008, CMG’s pre-tax post-distribution margin on the Atlantic Fund complex was above industry medians, based on the limited data available for publicly held mutual fund managers. However, as is to be expected in a large fund complex, some Atlantic Funds had relatively high pre-tax profit margins in 2008, when calculated solely with respect to management revenues and expenses, while other Atlantic Funds operated at a loss. There is a positive relationship between Fund size and profitability to CMG, with smaller Funds generally operating at a loss to CMG. |
| 22. | CMG pays a fixed percentage of its management fee revenues to an affiliate, U.S. Trust, Bank of America Private Wealth Management, with respect to assets of its clients invested in Atlantic Funds to compensate it for services it performs with respect to those client assets and for the effect of state law limitations on affiliates charging multiple fees. Based on our analysis of the services provided by this affiliate, we have concluded that all payments other than those for sub-transfer agent or sub-accounting services should be treated as a distribution expense. |
III. Recommendations
| 1) | Criteria for review. The Trustees may wish to consider modifying the criteria for identifying a Fund for further review (a “Review Fund”) to include criteria that focus exclusively on performance. The Trustees’ supplementary data request included one such criterion. They may also wish to consider whether it would be useful to apply CMG’s own internal monitoring standards for Fund performance to the contract review process, or whether such criteria are more relevant to their ongoing investment oversight. |
| 2) | Presentation of Review Fund discussion. CMG should consider whether it could more systematically present in one discussion all relevant information regarding each Review Fund, which is now split into several different portions of the 15(c) materials. For any Fund that has been a Review Fund in consecutive years, CMG should address under what circumstances it could reasonably be anticipated that the Fund would lose that status. |
| 3) | Refinement of tax-exempt performance data. Certain single-state tax-exempt Funds compete in extremely small universes and are compared to a multi-state benchmark of uncertain relevance. Notwithstanding the difficulties, CMG should work to improve the reliability of the calculation of relative performance of these Funds. If that is not possible, CMG should provide guidance on how the Trustees should judge the quality of CMG’s management of these Funds. |
| 4) | Development of risk metrics for asset-allocation, tax-exempt, and money market funds. CMG has developed and shared with the Trustees quantitative risk metrics comparing equity and taxable fixed-income Funds against their peers. However, reliable risk metrics have not been developed for asset-allocation, tax-exempt fixed income, and money market funds. We urge CMG to continue its efforts to provide reliable risk measures for these categories of Funds, especially in the cases of asset-allocation and money market funds, because their investors are likely to be motivated at least in part by a desire to manage risk. |
| 5) | Profitability data. For any period during which CMG is an affiliate of U.S. Trust, Bank of America Private Wealth Management, CMG should continue to present to the Trustees the profitability of each Fund, each investment style and each complex (of which Atlantic is one) calculated as follows: |
| | a. | Management-only profitability should be calculated without reference to any Private Bank expense. |
| | b. | Profitability excluding distribution (which essentially covers the management and transfer agency functions) should be adjusted by removing from the expense calculation any portion of the Private Bank payment not attributable to the performance by the Private Bank of sub-transfer agency or sub-accounting functions. |
| | c. | Total profitability, including distribution: No adjustment for Private Bank expenses should be made, because all such expenses represent legitimate fund |
43
| | expenses to be taken into account in calculating CMG’s profit margin including distribution. |
| | d. | Distribution only: This should include all Private Bank expenses other than those attributable to sub-transfer agency services. |
| 6) | Contractual fee analysis. This year CMG presented a new Lipper report comparing the contractual management fees of Funds with those of competitors in similar investment styles. However, the reliability of the conclusion – that Fund management fee breakpoints compared favorably with competitive fee rates – was limited by the use of competitive funds at all asset levels. The sponsors of a $100 million mutual fund may not have given much thought to breakpoints at $5 billion; therefore, that fund’s contractual fee at that level is unlikely to compare favorably with that of a $5 billion Fund. Limiting the competitors to the Lipper expense group, whose constituents are similar in size to the relevant Fund, would make the results more meaningful. In addition, the breakpoints of a select group of Atlantic Funds (which would differ each year) should continue to be compared to those of industry rivals to ensure that the Funds’ breakpoint schedules remain within industry norms. As breakpoint schedules change relatively little each year, performing such a comparison for each Atlantic Fund each year would not be an efficient use of Trustee and CMG resources. |
| 7) | Pro forma profitability data. In any year in which CMG or the Trustees believe that the prior year’s profitability is unlikely to be representative of current business results due to changes in markets or for any other reason, CMG should, consistent with this year’s practice, prepare a pro forma income statement based on year-to-date actual data and reasonable projections used for its own business planning purposes. |
| 8) | Additional institutional data and analysis. While CMG provided a substantial amount of information on its institutional business, including a virtually complete database of all institutional accounts, we suggest some additional items for future years: (a) profitability data for the institutional business in the format, and based upon the same allocation methodologies, used to present Fund profitability, (b) an explanation of how CMA sets institutional fee breakpoints, which normally begin at asset levels far lower than those found in Fund management fee breakpoints, and (c) an analysis of differences in actual fees within specific investment categories, with special attention given to accounts established before and after the implementation of the standardized institutional fee schedules in 2005. |
| 9) | Management fee disparities. In any future study of management fees, CMG and the Atlantic Trustees should analyze the differences in management fee schedules, including those arising out of the reorganization of the former Excelsior Funds as Atlantic Funds. As part of that analysis, CMG should provide an explanation for any significant fee differences among comparable funds across fund families sponsored by CMG, such as differences in the management styles of different Funds included the same Lipper category. Finally, if CMG proposes a management fee change or an expense cap for any mutual fund managed by CMA that is comparable to any Atlantic Fund, CMG should provide the Trustees with sufficient information about the proposal to allow the Trustees to assess the applicability of the proposed change to the relevant Atlantic Fund or Funds. |
| 10) | Explanation of data supplied to Lipper. Each year, as part of the 15(c) process, CMG retains Lipper to compare the fees and expenses of each Fund to a group of competitors. In many cases, CMG, with the approval of the Trustees, adjusts the actual expense data, which is based on the most recent full fiscal year of the Fund (and each competitive fund) to reflect changes in fees or expense limits that occurred during or after the relevant fiscal year. This improves the reliability and usefulness of the comparison. However, to ensure that the Trustees know when and how CMG adjusted the data, we recommend that CMG prepare a table listing for each Fund what adjustments were made, e.g., to reflect a new expense limitation of x basis points that commenced on y date. |
Reduction of volume of paper documents submitted. The effort to streamline and better organize the data presented to the Trustees and the process by which that data was prepared and organized continued to be well-received by all parties. Notwithstanding past success, it is always appropriate to look for opportunities to reduce and simplify the presentation of 15(c) data. One possibility would be to remove the 124 pages of biographical data, most if not all of which the Trustees have
44
previously seen as part of their ongoing investment oversight duties, from the paper volume and post it on the Internet-based document storage and retrieval system used by the Funds to provide reference data to Trustees.
Respectfully Submitted,
Steven E. Asher
45
Summary of Management Fee Evaluation by Independent Fee Consultant (RiverSource Investments, LLC)
EXCERPTS FROM REPORT OF INDEPENDENT FEE CONSULTANT TO THE FUNDS SUPERVISED BY THE COLUMBIA ATLANTIC BOARD
Prepared Pursuant to the February 9, 2005
Assurance of Discontinuance among the Office of Attorney General of New York State, Columbia Management Advisors, LLC, and Columbia Management Distributors, Inc. December 21, 2009
I. Overview
On February 9, 2005, Columbia Management Advisors, LLC (“CMA”) and Columbia Management Distributors, Inc.1 (“CMD”) agreed to the New York Attorney General’s Assurance of Discontinuance (“AOD”). Among other things, the AOD stipulates that CMA may manage or advise a Columbia Fund (“Columbia Fund” and, together with some or all of such funds, the “Columbia Funds”) only if the Independent Members of the Columbia Fund’s Board of Trustees appoint a Senior Officer or retain an Independent Fee Consultant (“IFC”) who is to manage the process by which proposed management fees are negotiated. The AOD further stipulates that the Senior Officer or IFC is to prepare a written annual evaluation of the fee negotiation process.
With effect from January 1, 2007, the Independent Members of the Board of Trustees for certain Columbia Funds known collectively as the “Atlantic Funds” (together with the other members of that Board, the “Trustees”) retained me as IFC for the Atlantic Funds.2 In this capacity, I have prepared this written evaluation of the fee negotiation process. As was the case with the last three annual reports, my immediate predecessor as IFC, John Rea, provided invaluable assistance in the preparation of this report.
On September 29, 2009, Ameriprise entered into an asset purchase agreement with Bank of America, N.A. and its parent, Bank of America Corporation (together, the “Bank”) pursuant to which the Bank agreed to sell certain CMG assets relating to Columbia’s long-term asset management business, including management of the Atlantic Funds (the “Transaction”).3 The Transaction if completed would result in the termination of the existing Investment Management Agreements with CMA. Therefore, the Trustees have been requested to approve and recommend to the shareholders of each Atlantic Fund new Investment Management and Sub-Advisory Agreements (together, the “Management Agreements”) with RiverSource Investments, LLC (“RI”),4 investment manager of the RiverSource Funds and a subsidiary of Ameriprise. This report is intended to fulfill the requirements of the AOD with respect to the Trustees’ consideration of the new Management Agreements.
A. Role of the Independent Fee Consultant
The AOD charges the IFC with “managing the process by which proposed management fees … to be charged the Columbia Fund are negotiated so that they are negotiated in a manner which is at arms’ length and reasonable and consistent with this Assurance of Discontinuance.” The AOD also provides that CMA “may manage or advise a Columbia Fund only if the reasonableness of the proposed management fees is determined by the Board of Trustees … using … an annual independent written evaluation prepared by or under the direction of … the Independent Fee Consultant.” Therefore, the AOD makes clear that the IFC does not supplant the Trustees in negotiating management fees with CMA (or RI), nor does the IFC substitute his or her
judgment for that of the Trustees with respect to the reasonableness of proposed fees or any other matter that is committed to the business judgment of the Trustees.
| 1 | CMA and CMD are subsidiaries of Columbia Management Group, LLC (“CMG”), and are the successors to the entities named in the AOD. |
| 2 | I have no material relationship with Bank of America, CMG or Ameriprise Financial, Inc. (“Ameriprise”), aside from serving as IFC, and I am aware of no material relationship with any of their affiliates. I retained John Rea, an independent economic consultant, to assist me with this report. |
| | Unless otherwise stated or required by the context, this report covers only the Atlantic Funds. |
| 3 | Preliminary Response of Ameriprise to Information Request of Columbia Atlantic Board dated October 21, 2009 (hereafter, the “Preliminary Response”), p. 1. The one money market Atlantic Fund, Money Market Fund VS, was included in the Transaction because it was an integral part of CMG's array of Funds used as investment vehicles by variable annuity and similar insurance products. |
| 4 | Ameriprise intends to re-brand RI with the “Columbia” name (which is one of the assets being sold in the Transaction). Preliminary Response, pp. 4-5. In the case of new Sub-Advisory Agreements, the current sub-adviser would also be a party. |
46
B. Elements Involved in Managing the Fee Negotiation Process
In preparing the report required by the AOD, the IFC must consider at least the following six factors set forth in the AOD:
| 1. | The nature and quality of the adviser’s services, including the Fund’s performance; |
| 2. | Management fees (including any components thereof) charged by other mutual fund companies for like services; |
| 3. | Possible economies of scale as the Fund grows larger; |
| 4. | Management fees (including any components thereof) charged to institutional and other clients of the adviser for like services; |
| 5. | Costs to the adviser and its affiliates of supplying services pursuant to the management fee agreements, excluding any intra-corporate profit; and |
| 6. | Profit margins of the adviser and its affiliates from supplying such services. |
C. Data Presented to the Trustees
In considering the proposed new Management Agreements with RI, the Trustees relied in part on the data that had been prepared as part of their annual contract review process, which concluded in late October. This data remained relevant because the fees in the proposed Management Agreements were identical to the fees approved at that time. The annual review materials included a Lipper report on the performance of each Atlantic Fund compared to its peers and its benchmark, comparisons of the fees and expenses of each Atlantic Fund to similar CMG-sponsored Funds, comparable competitive funds chosen by Lipper, and institutional accounts advised by CMA, revenues, expenses, and profits of CMG from managing the Atlantic Funds, calculated both by Fund and collectively, and CMG’s views on the existence and sharing of economies of scale.
In addition, the Trustees reviewed materials specific to the proposed new Management Agreements with RI in response to requests for information made on behalf of the Trustees, including the following:
| n | | Performance data for the RiverSource Funds showing percentile and quartile rankings of each fund within its Lipper performance universe for periods up to five years and net returns of each fund relative to its benchmark returns. This data was arguably relevant due to the possibility that some RiverSource investment teams would be providing investment management services to certain Columbia Funds. 5 |
| n | | tables comparing the fee schedules and effective fee rates of funds managed by CMA and RI and institutional accounts advised by the two firms. |
| n | | extensive discussion of the process by which the various components of the two asset management businesses would be integrated including investment management, compliance, transfer agency, custody, fund accounting, and distribution. |
| n | | information about the financial condition of Ameriprise, including its most recent annual report on Form 10-K, RI’s profit margins from managing the RiverSource Funds in 2007 and 2008, and pro forma income statements for the combined Columbia and RiverSource fund complex. |
| n | | disclosure that certain senior CMG executives, including President Michael Jones, Chief Investment Officer Colin Moore, Head of Mutual Funds J. Kevin Connaughton, and Chief Compliance Officer Linda Wondrack would continue in analogous capacities following the consummation of the Transaction, and |
| n | | a breakdown of the synergies RI expects to realize in the two years following the Transaction and the extent to which those potential synergies are expected to be shared with shareholders of funds advised by RI. |
II. Findings
| 1. | Based upon my examination of the information supplied by CMG and Ameriprise in the light of the six factors set forth in the AOD, I conclude that the Trustees have the relevant information necessary to evaluate the reasonableness of the proposed management fees for each Atlantic Fund. |
| 2. | In my view, the process by which the proposed management fees of the Atlantic Funds have been negotiated with RI thus far has been, to the extent practicable, at arms’ length and reasonable and consistent with the AOD. |
Respectfully submitted,
Steven E. Asher
| 5 | On page 20 of its Supplemental Response to the Atlantic Trustees (undated but delivered November 24, 2009), Ameriprise said that “most personnel decisions, including with respect to the portfolio management teams for the Atlantic Funds . . . will be made primarily by [current CMA CIO] Colin Moore using the Columbia 5P process.” |
47
Proxy Voting Results
Columbia U.S. Treasury Index Fund
On March 3, 2010, a special meeting of shareholders of Columbia Funds Series Trust I was held to consider the approval of several proposals listed in the proxy statement for the meeting. Proposal 1 and Proposal 2 were voted on at the March 3, 2010 meeting of shareholders and Proposal 3 was voted on at an adjourned meeting of shareholders held on March 31, 2010. The shareholder meeting results are as follows:
Proposal 1: A proposed Investment Management Services Agreement with Columbia Management Investment Advisers, LLC (formerly, RiverSource Investments, LLC) (CMIA) was approved as follows:
| | | | | | |
| | | | | | | |
| Votes For | | Votes Against | | Abstentions | | Broker Non-Votes |
| 228,209,609 | | 6,446,980 | | 4,570,708 | | 30,594,675 |
Proposal 2: A proposal authorizing CMIA to enter into and materially amend subadvisory agreements for the Fund in the future, with the approval of the Trust’s Board of Trustees, but without obtaining additional shareholder approval, was approved as follows:
| | | | | | |
| | | | | | | |
| Votes For | | Votes Against | | Abstentions | | Broker Non-Votes |
| 206,007,721 | | 28,644,587 | | 4,574,956 | | 30,594,708 |
Proposal 3: Each of the nominees for trustees was elected to the Trust’s Board of Trustees, as follows:
| | | | | | |
| | | | | | | |
| Trustee | | Votes For | | Votes Withheld | | Abstentions |
| John D. Collins | | 30,977,072,412 | | 859,827,038 | | 0 |
| Rodman L. Drake | | 30,951,179,004 | | 885,720,446 | | 0 |
| Douglas A. Hacker | | 30,989,793,279 | | 847,106,171 | | 0 |
| Janet Langford Kelly | | 30,999,020,814 | | 837,878,636 | | 0 |
| William E. Mayer | | 16,291,139,483 | | 15,545,759,967 | | 0 |
| Charles R. Nelson | | 30,997,700,700 | | 839,198,750 | | 0 |
| John J. Neuhauser | | 30,988,095,661 | | 848,803,789 | | 0 |
| Jonathon Piel | | 30,968,801,048 | | 868,098,402 | | 0 |
| Patrick J. Simpson | | 30,999,065,030 | | 837,834,420 | | 0 |
| Anne-Lee Verville | | 30,996,227,913 | | 840,671,537 | | 0 |
48
Important Information About This Report
The fund mails one shareholder report to each shareholder address. If you would like more than one report, please call shareholder services at 1-800-345-6611 and additional reports will be sent to you. This report has been prepared for shareholders of Columbia U.S. Treasury Index Fund.
A description of the policies and procedures that the fund uses to determine how to vote proxies and a copy of the fund’s voting records are available (i) at www.columbiamanagement.com, (ii) on the Securities and Exchange Commission’s website at www.sec.gov, and (iii) without charge, upon request, by calling 1-800-368-0346. Information regarding how the fund voted proxies relating to portfolio securities during the 12-month period ended June 30 is available from the SEC’s website. Information regarding how the fund voted proxies relating to portfolio securities is also available from the fund’s website, www.columbiamanagement.com.
The fund files a complete schedule of portfolio holdings with the SEC for the first and third quarters of each fiscal year on Form N-Q. The fund’s Form N-Q is available on the SEC’s website at www.sec.gov and may be reviewed and copied at the SEC’s Public Reference Room in Washington, D.C. Information on the operation of the Public Reference Room may be obtained by calling
1-800-SEC-0330.
Investors should consider the investment objectives, risks, charges and expenses of a mutual fund carefully before investing. For a free prospectus, which contains this and other important information about the funds, visit columbiamanagement.com. Read the prospectus carefully before investing.
On April 30, 2010, Ameriprise Financial, Inc., the parent company of RiverSource Investments, LLC, acquired the long-term asset management business of Columbia Management Group, LLC, including certain of its affiliates, which were, prior to this acquisition, part of Bank of America. In connection with the acquisition of the long-term assets, the Columbia Funds have a new investment adviser, RiverSource Investments, LLC, which is now known as Columbia Management Investment Advisers, LLC. For those clients that use the services of a subadviser, those arrangements are continuing unless notified otherwise. RiverSource Fund Distributors, Inc., now known as Columbia Management Investment Distributors, Inc., member FINRA, will act as the principal distributor of the Columbia Funds.
Transfer Agent*
Columbia Management Investment Services Corp.
P.O. Box 8081
Boston, MA 02266-8081
1-800-345-6611
Distributor*
Columbia Management Investment
Distributors, Inc.
One Financial Center
Boston, MA 02111
Investment Advisor*
Columbia Management Investment Advisers, LLC
100 Federal Street
Boston, MA 02110
* As of May 1, 2010.
49

One Financial Center
Boston, MA 02111-2621
Columbia U.S. Treasury Index Fund
Annual Report, March 31, 2010
©2010 Columbia Management Investment Advisers, LLC. All rights reserved.
One Financial Center, Boston, MA 02111-2621
800.345.6611 www.columbiafunds.com
SHC-42/44508-0310 (05/10) 10/JOB1D5

Annual Report
March 31, 2010
Columbia World Equity Fund
Not FDIC Insured Ÿ May Lose Value Ÿ No Bank Guarantee
Table of Contents
The views expressed in this report reflect the current views of the respective parties. These views are not guarantees of future performance and involve certain risks, uncertainties and assumptions that are difficult to predict, so actual outcomes and results may differ significantly from the views expressed. These views are subject to change at any time based upon economic, market or other conditions and the respective parties disclaim any responsibility to update such views. These views may not be relied on as investment advice and, because investment decisions for a Columbia Fund are based on numerous factors, may not be relied on as an indication of trading intent on behalf of any particular Columbia Fund. References to specific securities should not be construed as a recommendation or investment advice.
President’s Message

Dear Shareholder:
On May 3, 2010, Ameriprise Financial, Inc. announced that it had completed the acquisition of the long-term asset management business of Columbia Management from Bank of America. This includes the business of managing its equity and fixed-income mutual funds. Ameriprise Financial has combined its current U.S. asset management business, RiverSource Investments, LLC, with Columbia Management. This transaction puts together two leading asset management firms to create one entity that ranks as the eighth largest manager of long-term mutual fund assets in the United States.1 This combined business will operate under the well-regarded Columbia Management brand, where we will build on the strengths of our combined investment capabilities and talent, our broad and diversified product lineup and exceptional service.
Our combined business has a new breadth and depth of investment choices. William “Ted” Truscott, CEO, U.S. asset management and president of annuities for Ameriprise Financial, leads the combined U.S. asset management business. Michael Jones serves as president, U.S. asset management. Colin Moore continues to serve as chief investment officer. I am also continuing in my role as head of mutual funds, responsible for the delivery of mutual fund products and services to investors. The Columbia funds’ advisers, distributor and transfer agent are now subsidiaries of our parent company, Ameriprise Financial but operate under the Columbia Management name. You will begin to see these names used in communications and statements going forward.
| | |
| | | Service provider name |
| Advisers | | Columbia Management Investment Advisers, LLC Columbia Wanger Asset Management, LLC |
| Distributor | | Columbia Management Investment Distributors, Inc. |
| Transfer Agent | | Columbia Management Investment Services Corp. |
As a valued investor in Columbia funds, please know that our goal is to ensure a smooth transition and provide the highest quality products and services. Transition teams across the organization continue their efforts to build on best practices from both legacy organizations with integration efforts including rebranding, vendor and system consolidations and client communications. Additionally, we want to assure you that the funds’ portfolio managers also continue to focus on providing uninterrupted service to all fund shareholders.
Although we have a lot of work ahead of us in 2010, Columbia Management and Ameriprise Financial are excited about the opportunities for our combined organization. I share this optimism and believe it positions us as a best-in-class asset management business with the ability to deliver more for our clients than ever before.
Sincerely,

J. Kevin Connaughton
President, Columbia Funds
| 1 | Source: Ameriprise Financial, Inc., based on March 31, 2010 data from the Investment Company Institute |
Investors should consider the investment objectives, risks, charges and expenses of a mutual fund carefully before investing. For a free prospectus, which contains this and other important information about the funds, visit columbiamanagement.com. Read the prospectus carefully before investing.
Securities products offered through Columbia Management Investment Distributors, Inc. (formerly known as RiverSource Fund Distributors, Inc.), member FINRA. Advisory services provided by Columbia Management Investment Advisers, LLC (formerly known as RiverSource Investments, LLC).
© 2010 Columbia Management Investment Advisers, LLC. All rights reserved.
Fund Profile – Columbia World Equity Fund
Summary
| n | | For the 12-month period that ended March 31, 2010, the fund’s Class A shares returned 52.96% without sales charge. |
| n | | The fund did slightly better than it benchmark, the MSCI World Index,1 which returned 52.37%, and better than the average return of the funds in its peer group, the Lipper Global Large-Cap Core Funds Classification,2 which returned 50.90%. |
| n | | The recent growth in the stock market has helped to produce short-term returns for some asset classes that are not typical and may not continue in the future. Because of ongoing market volatility, fund performance may be subject to substantial short-term changes. |
| n | | Allocations to Columbia Greater China Fund and Columbia Emerging Markets Fund, which cover markets that are not included in the index, aided performance. A relative underweight in Japan also aided results, as did an underweight in utilities, a defensive sector. |
Portfolio Management
Fred Copper has co-managed the fund since 2005 and has been associated with the advisor or its predecessors since September 2005.
Colin Moore has co-managed the fund since 2004 and has been associated with the advisor or its predecessors since 2002.
Effective May 1, 2010, RiverSource Investments, LLC, a subsidiary of Ameriprise Financial, Inc., became the investment advisor to the fund and changed its name to Columbia Management Investment Advisers, LLC. Please see the fund’s prospectus, as supplemented, for more information regarding the change in investment advisor and certain other changes.
| 1 | The Morgan Stanley Capital International (MSCI) World Index is an index that tracks the performance of global stocks. Indices are not available for investment, are not professionally managed and do not reflect sales charges, fees, brokerage commissions, taxes or other expenses of investing. Securities in the fund may not match those in an index. |
| 2 | Lipper Inc., a widely respected data provider in the industry, calculates an average total return (assuming reinvestment of distributions) for mutual funds with investment objectives similar to those of the fund. Lipper makes no adjustment for the effect of sales loads. |
Performance data quoted represents past performance and current performance may be lower or higher. Past performance is no guarantee of future results. The investment return and principal value will fluctuate so that shares, when redeemed, may be worth more or less than the original cost. Please visit www.columbiafunds.com for daily and most recent month-end performance updates.
Summary
1-year return as of 03/31/10
| | |
| |
 | | +52.96% Class A shares |
| | (without sales charge) |
| |
| | +52.37% MSCI World Index |
Morningstar Style Box™
Equity Style

The Morningstar Style BoxTM reveals a fund’s investment strategy. For equity funds, the vertical axis shows the market capitalization of the stocks owned, and the horizontal axis shows investment style (value, blend or growth). Information shown is based on the most recent data provided by Morningstar.
1
Economic Update – Columbia World Equity Fund
Summary
For the 12-month period that ended March 31, 2010
| | n | | After a sharp decline, stock markets rebounded around the world, as measured by the S&P 500 Index, the MSCI EAFE Index and the MSCI Emerging Markets Index. | |
| | |
| S&P Index | | MSCI EAFE Index |
| |

| |
|
49.77% | | 54.44% |
| | |
| MSCI EM Index | | |
| |
| | |
81.08% | | |
After a deep and difficult recession, the World Bank estimates that global gross domestic product (GDP) declined 2.2% in 2009. However, many economies began to regain their footing midway through the year. Growth turned positive in the second half of 2009 in the United States, Japan, the United Kingdom, Germany and France. In some smaller eurozone countries, such as Spain and Italy, recession continued throughout the year, and debt remains a problem for Greece, Spain, Portugal and Italy. For 2010, we believe global economic growth could potentially rise at a rate of 2.7%.
Stimulus spending aided recovery
Growth around the world was aided by government stimulus spending, but the emerging markets of China, India and Brazil were notable for their use of stimulus to help jumpstart the global recovery. All three countries have capitalized on prudent policies put in place over the past decade to stimulate domestic demand and succeeded through a combination of spending, tax cuts and other incentives.
Hopes for a sustained recovery around the world now depend on a rebound in consumer spending, an increase in revenues to keep business profits moving higher and a turnaround in the export markets, the latter of which appears to be underway. According to Moodys.com, surveys of manufacturers across the world show export orders up after the steepest decline in trade since the 1930s. The employment picture in developed countries is also improving, in the sense that job losses have slowed in many countries and the United States has experienced some growth in the labor market. However, we believe it could take until 2011 for job growth to accelerate in a meaningful way, raising concerns about the sustainability of recovery where unemployment remains stubbornly high.
Manufacturing activity has picked up around the world, and the technology sector has been a significant beneficiary. Demand for both hardware and software has increased after a sharp decline in 2008 and 2009. India reports that its outsourcing pipeline is filling again. In the United States, the manufacturing sector was one of the first signs that the economy was on the mend. In Asia and South America, stimulus spending, strong domestic demand and a rebound in trade have driven manufacturing activity sharply higher. However, increased manufacturing activity in eurozone countries lag the rest of the world.
Stocks bottomed, then rebounded
Against a strengthening economic backdrop, a stock market rally that began in mid-March 2009 continued throughout the period. The U.S. stock market returned 49.77% for the 12-month period, as measured by the S&P 500 Index.1 Outside the U.S., stock market returns were even stronger. The MSCI EAFE Index,2 a broad gauge of stock market performance in foreign developed markets, gained 54.44% (net of dividends, in U.S. dollars) for the period. Emerging stock markets were caught in a downdraft in 2008, but they bounced back stronger than domestic or developed world markets in
| 1 | The Standard & Poor’s (S&P) 500 Index tracks the performance of 500 widely held, large-capitalization U.S. stocks. |
| 2 | The Morgan Stanley Capital International Europe, Australasia, Far East (MSCI EAFE) Index is a capitalization-weighted index that tracks the total return of common stocks in 21 developed-market countries within Europe, Australasia and the Far East. |
2
Economic Update (continued) – Columbia World Equity Fund
2009 as their economic growth generally outpaced the developed world. The MSCI Emerging Markets Index3 returned 81.08% (net of dividends, in U.S. dollars), led by strong performances from India and the regions of Eastern Europe and South America. However, weak returns in the final months of the period detracted from emerging market returns, especially in China and Brazil.
Past performance is no guarantee of future results.
| 3 | The Morgan Stanley Capital International Emerging Markets Index (MSCI EMI) is a free float-adjusted market capitalization index that is designed to measure equity market performance in the global emerging markets. As of June 2009, the MSCI Emerging Markets Index consisted of the following 22 emerging market country indices: Brazil, Chile, China, Colombia, Czech Republic, Egypt, Hungary, India, Indonesia, Israel, Korea, Malaysia, Mexico, Morocco, Peru, Philippines, Poland, Russia, South Africa, Taiwan, Thailand and Turkey. |
Indices are not available for investment, are not professionally managed and do not reflect sales charges, fees, brokerage commissions, taxes or other expenses of investing. Securities in the fund may not match those in an index.
3
Performance Information – Columbia World Equity Fund
Performance data quoted represents past performance and current performance may be lower or higher. Past performance is no guarantee of future results. The investment return and principal value will fluctuate so that shares, when redeemed, may be worth more or less than the original cost. Please visit www.columbiafunds.com for daily and most recent month-end performance updates.
| | |
| Annual operating expense ratio (%)* |
| |
Class A | | 1.68 |
Class B | | 2.43 |
Class C | | 2.43 |
| * | The annual operating expense ratio is as stated in the fund’s prospectus that is current as of the date of this report and includes the expenses incurred by the investment companies in which the fund invests. Differences in expense ratios disclosed elsewhere in this report may result from expenses incurred by the investment companies, including fee waivers and expense reimbursements as well as different time periods used in calculating the ratios. |
The “with sales charge” returns include the maximum initial sales charge of 5.75% for Class A shares and the applicable contingent deferred sales charge of 5.00% in the first year, declining to 1.00% in the sixth year and eliminated thereafter for Class B shares and 1.00% for Class C shares for the first year only. The “without sales charge” returns do not include the effect of sales charges. If they had, returns would be lower.
Performance results reflect any fee waivers or reimbursements of fund expenses by the investment advisor and/or any of its affiliates. Absent these fee waivers or expense reimbursement arrangements, performance results would have been lower.
All results shown assume reinvestment of distributions. Performance for different share classes will vary based on differences in sales charges and fees associated with each class.
The tables do not reflect the deduction of taxes that a shareholder may pay on fund distributions or on the redemption of fund shares.
|
| Performance of a $10,000 investment 04/01/00 – 03/31/10 |
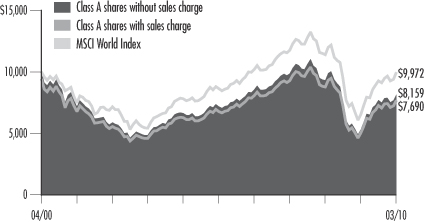
The chart above shows the change in value of a hypothetical $10,000 investment in Class A shares of Columbia World Equity Fund during the stated time period, and does not reflect the deduction of taxes that a shareholder may pay on fund distributions or on the redemption of fund shares.
| | | | |
| Performance of a $10,000 investment 04/01/00 – 03/31/10 ($) |
| Sales charge: | | without | | with |
Class A | | 8,159 | | 7,690 |
Class B | | 7,568 | | 7,568 |
Class C | | 7,551 | | 7,551 |
| | | | | | | | | | | | |
| Average annual total return as of 03/31/10 (%) |
| | | |
| Share class | | A | | B | | C |
| Inception | | 10/15/91 | | 03/27/95 | | 03/27/95 |
| Sales charge | | without | | with | | without | | with | | without | | with |
1-year | | 52.96 | | 44.16 | | 51.99 | | 46.99 | | 51.92 | | 50.92 |
5-year | | 2.55 | | 1.35 | | 1.80 | | 1.46 | | 1.79 | | 1.79 |
10-year | | –2.01 | | –2.59 | | –2.75 | | –2.75 | | –2.77 | | –2.77 |
4
Understanding Your Expenses – Columbia World Equity Fund
As a fund shareholder, you incur two types of costs. There are transaction costs, which generally include sales charges on purchases and may include redemption fees or exchange fees. There are also ongoing costs, which generally include investment advisory fees, distribution and service (Rule 12b-1) fees and other fund expenses. The information on this page is intended to help you understand the ongoing costs of investing in the fund and to compare these costs with the ongoing costs of investing in other mutual funds.
Analyzing your fund’s expenses by share class
To illustrate these ongoing costs, we have provided an example and calculated the expenses paid by investors in each share class during the period. The information in the following table is based on an initial investment of $1,000, which is invested at the beginning of the period and held for the entire period. Expense information is calculated two ways and each method provides you with different information. The amount listed in the “Actual” column is calculated using the fund’s actual operating expenses and total return for the period. The amount listed in the “Hypothetical” column for each share class assumes that the return each year is 5% before expenses and is calculated based on the fund’s actual operating expenses. You should not use the hypothetical account values and expenses to estimate either your actual account balance at the end of the period or the expenses you paid during this period.
Compare with other funds
Since all mutual funds are required to include the same hypothetical calculations about expenses in shareholder reports, you can use this information to compare the ongoing costs of investing in the fund with other funds. To do so, compare the 5% hypothetical example with the 5% hypothetical examples that appear in the shareholder reports of other funds. As you compare hypothetical examples of other funds, it is important to note that hypothetical examples are meant to highlight the ongoing costs of investing in a fund and do not reflect any transaction costs, such as sales charges, redemption fees or exchange fees.
Estimating your actual expenses
To estimate the expenses that you paid over the period, first you will need your account balance at the end of the period:
| | n | | For shareholders who receive their account statements from Columbia Management Services, Inc., your account balance is available online at www.columbiafunds.com or by calling Shareholder Services at 800.345.6611. | |
| | n | | For shareholders who receive their account statements from their financial intermediary, contact your financial intermediary to obtain your account balance. | |
| | 1. | Divide your ending account balance by $1,000. For example, if an account balance was $8,600 at the end of the period, the result would be 8.6. | |
| | 2. | In the section of the table below titled “Expenses paid during the period,” locate the amount for your share class. You will find this number in the column labeled “Actual.” Multiply this number by the result from step 1. Your answer is an estimate of the expenses you paid on your account during the period. | |
If the value of your account falls below the minimum initial investment requirement applicable to you, your account generally will be subject to a $20 annual fee. This fee is not included in the accompanying table. If you are subject to the fee, keep it in mind when you are estimating the ongoing expenses of investing in the fund and when comparing the expenses of this fund with other funds.
| | | | | | | | | | | | | | |
| 10/01/09 – 03/31/10 | | | | | | | | |
| | | | |
| | | Account value at the
beginning of the period ($) | | Account value at the
end of the period ($) | | Expenses paid
during the period ($) | | Fund’s annualized
expense ratio (%) |
| | | Actual | | Hypothetical | | Actual | | Hypothetical | | Actual | | Hypothetical | | Actual |
Class A | | 1,000.00 | | 1,000.00 | | 1,057.50 | | 1,017.95 | | 7.18 | | 7.04 | | 1.40 |
Class B | | 1,000.00 | | 1,000.00 | | 1,055.00 | | 1,014.21 | | 11.02 | | 10.80 | | 2.15 |
Class C | | 1,000.00 | | 1,000.00 | | 1,054.10 | | 1,014.21 | | 11.01 | | 10.80 | | 2.15 |
Expenses paid during the period are equal to the annualized expense ratio for the share class, multiplied by the average account value over the period, then multiplied by the number of days in the fund’s most recent fiscal half-year and divided by 365.
Had the investment advisor and/or any of its affiliates not waived fees or reimbursed a portion of expenses, account value at the end of the period would have been reduced.
It is important to note that the expense amounts shown in the table are meant to highlight only ongoing costs of investing in the fund and do not reflect any transaction costs, such as sales charges, redemption fees or exchange fees. Therefore, the hypothetical examples provided may not help you determine the relative total costs of owning shares of different funds. If these transaction costs were included, your costs would have been higher.
5
Portfolio Managers’ Report – Columbia World Equity Fund
Performance data quoted represents past performance and current performance may be lower or higher. Past performance is no guarantee of future results. The investment return and principal value will fluctuate so that shares, when redeemed, may be worth more or less than the original cost. Please visit www.columbiafunds.com for daily and most recent month-end performance updates.
| | |
| Net asset value per share |
|
as of 03/31/10 ($) |
Class A | | 11.19 |
Class B | | 10.62 |
Class C | | 10.60 |
| | |
| Distributions declared per share |
|
04/01/09 – 03/31/10 ($) |
Class A | | 0.22 |
Class B | | 0.13 |
Class C | | 0.13 |
For the 12-month period that ended March 31, 2010, the fund’s Class A shares returned 52.96% without sales charge. The fund outperformed its benchmark, the MSCI World Index, which returned 52.37%. It also did better than the 50.90% average return of funds in its peer group, the Lipper Global Large-Cap Core Funds Classification. The fund benefited from allocations to Columbia Greater China Fund and Columbia Emerging Markets Fund (1.5% and 3.4% of net assets, respectively), which cover markets that are not included in the index. We emphasized these funds because we believed that China and other emerging markets were likely to be leaders during the early phase of a global economic recovery. A relative underweight in Japan also aided results. An underweight in utilities, a defensive sector, was also helpful to relative performance.
Financial stocks led performance
Early in the period, we began moving out of defensive sectors and into areas that were more closely linked to a global economic recovery. Because sectors that are sensitive to low interest rates are usually among the first to rebound from recession, we built an overweight position relative to the benchmark in financials. Both the overweight and stock selection in the sector contributed strongly to return. A relatively large position in Spain’s Banco Santander (1.0% of net assets), a financial institution with significant exposure to Latin America, was particularly helpful. UK-based Barclays (0.9% of net assets) also enhanced performance. Barclays shares declined dramatically along with other financial institutions as banks worldwide came under pressure in 2008. However, unlike many other banks, Barclays maintained a solid balance sheet throughout the banking crisis and did not need government bailout money. We invested in Barclays when it was attractively valued. When financial stocks began to recover, investors recognized the strength of Barclays’ franchise and it made a robust recovery. Toronto-Dominion Bank (1.0% of net assets) in Canada also factored heavily in the fund’s strong return, as Canada, despite its proximity to the United States, was generally not exposed to the financial issues that gripped many other developed markets.
An aggressive approach to energy
In the energy sector, we concentrated on energy service companies, whose business prospects — and stock prices — are closely linked to the price of oil. (When oil prices rise, large integrated oil companies tend to increase spending on exploration, drilling and other large projects, to the benefit of energy service companies.) In this regard, Subsea 7 in the UK had a positive impact on the fund’s return, and we took profits in the stock. France-based Technip SA (0.7% of net assets) also helped boost performance.
Strong returns from U.S. stocks
U.S. stocks make up 50% of the MSCI World Index. The portfolio’s exposure was higher than 50%, which benefited performance. As in other markets, we favored companies that we believed would benefit from an improving economic environment. Two such examples are Brocade Communications Systems and Freeport-McMoRan Copper & Gold (0.3% and 1.1% of net assets, respectively). Brocade is a supplier of data storage devices to the technology industry. Freeport-McMoRan, a mining company,
6
Portfolio Managers’ Report (continued) – Columbia World Equity Fund
was buoyed by increased demand for natural resources. Both companies made significant contributions to performance for the period.
Defensive stocks disappointed
As world economies gained strength and investors sought out companies positioned to benefit, defensive stocks lagged. U.S.-based McDonald’s and Apollo Group, an education company, fell short of expectations. In Japan, Seven & I, a convenience store chain, made a relatively poor showing. All of these stocks were sold.
A positive outlook
We are positive in our outlook for global stock markets. Economic conditions are improving. We believe stocks are reasonably valued, even though valuations are not as compelling as they were a year ago. There is a substantial amount of money in cash accounts earning virtually no interest, and investors may become more confident about putting this money to work in stocks as economic conditions strengthen.
Portfolio holdings and characteristics are subject to change periodically and may not be representative of current holdings and characteristics. The outlook for the fund may differ from those presented for other Columbia Funds.
Equity securities are subject to stock market fluctuations that occur in response to economic and business developments.
International investing involves special risks, including foreign taxation, currency fluctuations, risks associated with possible differences in financial standards and other risks associated with future political and economic developments.
| | |
| Top 5 countries | | |
| |
as of 03/31/10 (%) | | |
United States* | | 58.6 |
Japan | | 4.6 |
United Kingdom | | 4.5 |
Switzerland | | 3.2 |
China | | 3.0 |
| * | Includes short-term obligation and investment companies. |
| | |
| Top 5 sectors | | |
| |
as of 03/31/10 (%) | | |
Information Technology | | 16.7 |
Financials | | 14.8 |
Health Care | | 12.1 |
Industrials | | 10.1 |
Energy | | 9.8 |
| | |
| Top 10 holdings | | |
| |
as of 03/31/10 (%) | | |
Columbia Emerging Markets Fund, Class Z | | 3.4 |
Columbia Greater China Fund, Class Z | | 1.5 |
WisdomTree India Earnings Fund | | 1.2 |
Tele2 AB, Class B | | 1.1 |
Redecard | | 1.1 |
Freeport-McMoRan Copper & Gold | | 1.1 |
McKesson | | 1.1 |
Avon Products | | 1.1 |
United Technologies | | 1.0 |
Novo-Nordisk A/S, Class B | | 1.0 |
The fund is actively managed and the composition of its portfolio will change over time. Information provided is calculated as a percentage of net assets.
7
Investment Portfolio – Columbia World Equity Fund
March 31, 2010
Common Stocks – 91.1%
| | | | |
| | | Shares | | Value ($) |
| Consumer Discretionary – 8.1% | | | | |
| Automobiles – 0.9% | | | | |
Ford Motor Co. (a) | | 35,827 | | 450,345 |
|
Automobiles Total | | | | 450,345 |
| | |
| Media – 0.4% | | | | |
Sirius XM Radio, Inc. (a) | | 220,370 | | 191,832 |
|
Media Total | | | | 191,832 |
| | |
| Multiline Retail – 1.5% | | | | |
Dollar Tree, Inc. (a) | | 4,770 | | 282,479 |
Target Corp. | | 9,828 | | 516,953 |
|
Multiline Retail Total | | | | 799,432 |
| | |
| Specialty Retail – 3.9% | | | | |
Best Buy Co., Inc. | | 9,600 | | 408,384 |
Game Group PLC | | 267,170 | | 398,335 |
Gap, Inc. | | 20,160 | | 465,898 |
Inditex SA | | 4,821 | | 317,793 |
Pier 1 Imports, Inc. (a) | | 38,781 | | 247,035 |
Staples, Inc. | | 10,330 | | 241,619 |
|
Specialty Retail Total | | | | 2,079,064 |
|
| Textiles, Apparel & Luxury Goods – 1.4% |
Hanesbrands, Inc. (a) | | 11,230 | | 312,419 |
LG Fashion Corp. | | 18,470 | | 453,812 |
|
Textiles, Apparel & Luxury Goods Total | | 766,231 |
| | | | |
Consumer Discretionary Total | | | | 4,286,904 |
| | | | |
| Consumer Staples – 5.5% | | | | |
| Food & Staples Retailing – 1.0% | | | | |
Koninklijke Ahold NV | | 39,703 | | 529,278 |
|
Food & Staples Retailing Total | | | | 529,278 |
| | |
| Food Products – 1.9% | | | | |
Del Monte Foods Co. | | 35,773 | | 522,286 |
Viterra, Inc. (a) | | 52,212 | | 492,997 |
|
Food Products Total | | | | 1,015,283 |
| | |
| Household Products – 1.5% | | | | |
Clorox Co. | | 4,370 | | 280,292 |
Kimberly-Clark Corp. | | 8,400 | | 528,192 |
|
Household Products Total | | | | 808,484 |
| | |
| Personal Products – 1.1% | | | | |
Avon Products, Inc. | | 16,491 | | 558,550 |
|
Personal Products Total | | | | 558,550 |
|
Consumer Staples Total | | | | 2,911,595 |
| | | | |
| | | Shares | | Value ($) |
| Energy – 9.8% | | | | |
| Energy Equipment & Services – 3.5% | | | | |
Noble Corp. (a) | | 12,310 | | 514,804 |
Shinko Plantech Co., Ltd. | | 45,700 | | 404,745 |
Technip SA | | 4,814 | | 391,422 |
Transocean Ltd. (a) | | 6,199 | | 535,470 |
|
Energy Equipment & Services Total | | | | 1,846,441 |
| | |
| Oil, Gas & Consumable Fuels – 6.3% | | | | |
Apache Corp. | | 5,069 | | 514,504 |
AWE Ltd. (a) | | 180,762 | | 451,183 |
BP PLC, ADR | | 4,491 | | 256,301 |
Chevron Corp. | | 6,822 | | 517,312 |
EOG Resources, Inc. | | 5,548 | | 515,631 |
Peabody Energy Corp. | | 10,270 | | 469,339 |
Spectra Energy Corp. | | 11,520 | | 259,546 |
Yanzhou Coal Mining Co., Ltd., Class H | | 152,000 | | 364,522 |
|
Oil, Gas & Consumable Fuels Total | | | | 3,348,338 |
|
Energy Total | | | | 5,194,779 |
| | | | |
| Financials – 14.8% | | | | |
| Capital Markets – 1.9% | | | | |
Credit Suisse Group AG, Registered Shares | | 5,123 | | 264,069 |
Goldman Sachs Group, Inc. | | 2,984 | | 509,160 |
Morgan Stanley | | 8,899 | | 260,652 |
|
Capital Markets Total | | | | 1,033,881 |
| | |
| Commercial Banks – 8.4% | | | | |
Banco Bilbao Vizcaya Argentaria SA | | 30,065 | | 411,352 |
Banco Bradesco SA, ADR | | 17,040 | | 314,047 |
Banco Santander SA | | 40,844 | | 542,833 |
Barclays PLC | | 84,851 | | 463,927 |
BB&T Corp. | | 8,970 | | 290,538 |
Credit Agricole SA | | 17,021 | | 297,943 |
National Bank of Canada | | 8,500 | | 517,541 |
PNC Financial Services Group, Inc. | | 8,823 | | 526,733 |
Toronto-Dominion Bank | | 7,135 | | 531,797 |
U.S. Bancorp | | 20,807 | | 538,485 |
|
Commercial Banks Total | | | | 4,435,196 |
| | |
| Diversified Financial Services – 1.0% | | | | |
JPMorgan Chase & Co. | | 11,822 | | 529,035 |
|
Diversified Financial Services Total | | | | 529,035 |
| | |
| Insurance – 3.5% | | | | |
Axis Capital Holdings Ltd. | | 15,944 | | 498,409 |
Baloise Holding AG, Registered Shares | | 5,992 | | 531,347 |
Prudential Financial, Inc. | | 5,570 | | 336,985 |
See Accompanying Notes to Financial Statements.
8
Columbia World Equity Fund
March 31, 2010
Common Stocks (continued)
| | | | |
| | | Shares | | Value ($) |
| Financials (continued) | | | | |
| Insurance (continued) | | | | |
XL Capital Ltd., Class A | | 26,188 | | 494,953 |
|
Insurance Total | | | | 1,861,694 |
|
Financials Total | | | | 7,859,806 |
| | | | |
| Health Care – 12.1% | | | | |
| Health Care Equipment & Supplies – 0.5% |
Insulet Corp. (a) | | 17,810 | | 268,753 |
|
Health Care Equipment & Supplies Total | | | | 268,753 |
|
| Health Care Providers & Services – 4.9% |
Laboratory Corp. of America Holdings (a) | | 6,902 | | 522,550 |
McKesson Corp. | | 8,557 | | 562,366 |
Medco Health Solutions, Inc. (a) | | 7,420 | | 479,035 |
Miraca Holdings, Inc. | | 17,300 | | 527,383 |
UnitedHealth Group, Inc. | | 15,080 | | 492,664 |
|
Health Care Providers & Services Total | | | | 2,583,998 |
|
| Life Sciences Tools & Services – 0.6% |
Life Technologies Corp. (a) | | 5,643 | | 294,960 |
|
Life Sciences Tools & Services Total | | | | 294,960 |
|
| Pharmaceuticals – 6.1% |
Abbott Laboratories | | 9,335 | | 491,768 |
Johnson & Johnson | | 6,220 | | 405,544 |
Mylan, Inc. (a) | | 21,233 | | 482,201 |
Novo-Nordisk A/S, Class B | | 7,071 | | 548,689 |
Sanofi-Aventis SA | | 7,337 | | 546,918 |
Santen Pharmaceutical Co., Ltd. | | 15,900 | | 477,221 |
Teva Pharmaceutical Industries Ltd., ADR | | 4,596 | | 289,916 |
|
Pharmaceuticals Total | | | | 3,242,257 |
|
Health Care Total | | | | 6,389,968 |
| | | | |
| Industrials – 10.1% | | | | |
| Aerospace & Defense – 1.6% | | | | |
Honeywell International, Inc. | | 7,130 | | 322,775 |
United Technologies Corp. | | 7,473 | | 550,088 |
|
Aerospace & Defense Total | | | | 872,863 |
| | |
| Construction & Engineering – 1.3% | | | | |
Foster Wheeler AG (a) | | 10,806 | | 293,275 |
Macmahon Holdings Ltd. | | 576,866 | | 386,434 |
|
Construction & Engineering Total | | | | 679,709 |
| | | | |
| | | Shares | | Value ($) |
| | |
| Electrical Equipment – 1.5% | | | | |
Emerson Electric Co. | | 5,942 | | 299,120 |
Sumitomo Electric Industries Ltd. | | 19,400 | | 237,805 |
Vestas Wind Systems A/S (a) | | 4,509 | | 245,010 |
|
Electrical Equipment Total | | | | 781,935 |
| | |
| Industrial Conglomerates – 0.7% | | | | |
General Electric Co. | | 19,023 | | 346,219 |
|
Industrial Conglomerates Total | | | | 346,219 |
| | |
| Machinery – 3.5% | | | | |
Danaher Corp. | | 3,870 | | 309,252 |
Dover Corp. | | 7,350 | | 343,612 |
Kubota Corp. | | 30,000 | | 273,398 |
Nabtesco Corp. | | 21,000 | | 279,880 |
Parker Hannifin Corp. | | 4,938 | | 319,686 |
Sulzer AG, Registered Shares | | 3,475 | | 337,811 |
|
Machinery Total | | | | 1,863,639 |
| | |
| Professional Services – 1.5% | | | | |
Atkins WS PLC | | 53,244 | | 500,946 |
Manpower, Inc. | | 5,078 | | 290,055 |
|
Professional Services Total | | | | 791,001 |
|
Industrials Total | | | | 5,335,366 |
| | | | |
| Information Technology – 16.7% | | | | |
| Communications Equipment – 2.1% | | | | |
Brocade Communications Systems, Inc. (a) | | 31,418 | | 179,397 |
Cisco Systems, Inc. (a) | | 15,600 | | 406,068 |
CommScope, Inc. (a) | | 8,940 | | 250,499 |
Harris Corp. | | 5,605 | | 266,181 |
|
Communications Equipment Total | | | | 1,102,145 |
| | |
| Computers & Peripherals – 4.7% | | | | |
Apple, Inc. (a) | | 2,335 | | 548,561 |
EMC Corp. (a) | | 28,049 | | 506,004 |
FUJITSU Ltd. | | 42,000 | | 274,938 |
Hewlett-Packard Co. | | 10,238 | | 544,150 |
International Business Machines Corp. | | 2,992 | | 383,724 |
Teradata Corp. (a) | | 8,330 | | 240,654 |
|
Computers & Peripherals Total | | | | 2,498,031 |
|
| Electronic Equipment, Instruments & Components – 0.8% |
Venture Corp., Ltd. | | 65,000 | | 405,161 |
|
Electronic Equipment, Instruments & Components Total | | | | 405,161 |
See Accompanying Notes to Financial Statements.
9
Columbia World Equity Fund
March 31, 2010
Common Stocks (continued)
| | | | |
| | | Shares | | Value ($) |
| Information Technology (continued) | | | | |
| Internet Software & Services – 2.3% |
Akamai Technologies, Inc. (a) | | 10,350 | | 325,094 |
Google, Inc., Class A (a) | | 910 | | 515,979 |
Tencent Holdings Ltd. | | 20,400 | | 409,090 |
|
Internet Software & Services Total | | | | 1,250,163 |
| | |
| IT Services – 2.6% | | | | |
Accenture PLC, Class A | | 12,150 | | 509,693 |
Fiserv, Inc. (a) | | 5,673 | | 287,961 |
Redecard SA | | 31,100 | | 575,359 |
|
IT Services Total | | | | 1,373,013 |
|
| Semiconductors & Semiconductor Equipment – 1.2% |
Samsung Electronics Co., Ltd. | | 379 | | 274,004 |
Xilinx, Inc. | | 13,870 | | 353,685 |
|
Semiconductors & Semiconductor Equipment Total | | | | 627,689 |
| | |
| Software – 3.0% | | | | |
Autonomy Corp. PLC (a) | | 10,759 | | 297,637 |
Citrix Systems, Inc. (a) | | 5,886 | | 279,409 |
Misys PLC (a) | | 126,707 | | 466,081 |
Oracle Corp. | | 20,649 | | 530,473 |
|
Software Total | | | | 1,573,600 |
|
Information Technology Total | | | | 8,829,802 |
| | | | |
| Materials – 7.2% | | | | |
| Chemicals – 2.4% | | | | |
BASF SE | | 5,681 | | 352,346 |
Makhteshim-Agan Industries Ltd. | | 91,965 | | 415,563 |
Praxair, Inc. | | 5,670 | | 470,610 |
|
Chemicals Total | | | | 1,238,519 |
| | |
| Containers & Packaging – 1.5% | | | | |
Packaging Corp. of America | | 16,760 | | 412,464 |
Silgan Holdings, Inc. | | 6,650 | | 400,529 |
|
Containers & Packaging Total | | | | 812,993 |
| | |
| Metals & Mining – 1.8% | | | | |
Freeport-McMoRan Copper & Gold, Inc. | | 6,874 | | 574,254 |
Vale SA | | 12,400 | | 398,493 |
|
Metals & Mining Total | | | | 972,747 |
| | |
| Paper & Forest Products – 1.5% | | | | |
Ahlstrom Oyj | | 33,735 | | 543,581 |
International Paper Co. | | 10,630 | | 261,604 |
|
Paper & Forest Products Total | | | | 805,185 |
|
Materials Total | | | | 3,829,444 |
| | | | |
| | | Shares | | Value ($) |
| Telecommunication Services – 3.7% |
| Diversified Telecommunication Services – 3.7% |
Qwest Communications International, Inc. | | 51,959 | | 271,226 |
Tele2 AB, Class B | | 35,020 | | 584,427 |
Telefonica O2 Czech Republic AS | | 18,368 | | 428,949 |
Telekomunikacja Polska SA | | 55,339 | | 314,025 |
Verizon Communications, Inc. | | 10,948 | | 339,607 |
|
Diversified Telecommunication Services Total | | | | 1,938,234 |
|
Telecommunication Services Total | | 1,938,234 |
| | | | |
| Utilities – 3.1% | | | | |
| Electric Utilities – 1.0% | | | | |
Enel SpA | | 93,588 | | 523,315 |
|
Electric Utilities Total | | | | 523,315 |
| | |
| Independent Power Producers & Energy Traders – 0.5% | | | | |
Energy Development Corp. | | 2,648,750 | | 293,068 |
|
Independent Power Producers & Energy Traders Total | | | | 293,068 |
| | |
| Multi-Utilities – 0.6% | | | | |
Public Service Enterprise Group, Inc. | | 10,120 | | 298,743 |
|
Multi-Utilities Total | | | | 298,743 |
| | |
| Water Utilities – 1.0% | | | | |
Hyflux Ltd. | | 209,000 | | 507,952 |
|
Water Utilities Total | | | | 507,952 |
| | | | |
Utilities Total | | | | 1,623,078 |
| | | | |
Total Common Stocks
(cost of $40,235,694) | | | | 48,198,976 |
| | |
Preferred Stock – 0.8% | | | | |
| | | | |
| Consumer Staples – 0.8% | | | | |
| Household Products – 0.8% | | | | |
Henkel AG & Co. KGaA | | 7,478 | | 402,593 |
|
Household Products Total | | | | 402,593 |
| | | | |
Consumer Staples Total | | | | 402,593 |
| | | | |
Total Preferred Stock
(cost of $366,395) | | | | 402,593 |
See Accompanying Notes to Financial Statements.
10
Columbia World Equity Fund
March 31, 2010
Investment Companies – 6.1%
| | | | | |
| | | Shares | | Value ($) | |
Columbia Emerging Markets Fund, Class Z (b) | | 158,441 | | 1,784,042 | |
Columbia Greater China Fund, Class Z (b) | | 14,939 | | 807,295 | |
WisdomTree India Earnings Fund | | 27,212 | | 634,855 | |
| |
Total Investment Companies (cost of $2,259,613) | | | | 3,226,192 | |
| | |
Short-Term Obligation – 2.6% | | | | | |
| | | Par ($) | | | |
Repurchase agreement with Fixed Income Clearing Corp., dated 03/31/10, due 04/01/10 at 0.000%, collateralized by a U.S. Treasury obligation maturing 03/31/17, market value $1,417,875 (repurchase proceeds $1,386,000) | | 1,386,000 | | 1,386,000 | |
| |
Total Short-Term Obligation
(cost of $1,386,000) | | | | 1,386,000 | |
| | | | | |
Total Investments – 100.6%
(cost of $44,247,702) (c) | | | | 53,213,761 | |
| | | | | |
Other Assets & Liabilities, Net – (0.6)% | | (300,875 | ) |
| | | | | |
Net Assets – 100.0% | | | | 52,912,886 | |
Notes to Investment Portfolio:
| (a) | Non-income producing security. |
| (b) | Investments in affiliates during the year ended March 31, 2010: |
| | | | | | | | | | | | | | | |
Affiliate | | Value,
beginning
of period | | Purchases | | Sales
Proceeds | | Dividend
Income | | Value, end
of period |
Columbia Emerging Markets Fund, Class Z | | $ | — | | $ | 1,605,000 | | $ | 669,080 | | $ | 33,488 | | $ | 1,784,042 |
Columbia Greater China Fund, Class Z | | | 1,137,432 | | | — | | | 960,080 | | | 4,634 | | | 807,295 |
| | | | | | | | | | | | | | | |
Total | | $ | 1,137,432 | | $ | 1,605,000 | | $ | 1,629,160 | | $ | 38,122 | | $ | 2,591,337 |
| | | | | | | | | | | | | | | |
| (c) | Cost for federal income tax purposes is $44,315,909. |
The following table summarizes the inputs used, as of March 31, 2010, in valuing the Fund’s assets:
| | | | | | | | | | | | | | |
Description | | Quoted Prices (Level 1) | | Other
Significant
Observable
Inputs (Level 2) | | | Significant
Unobservable
Inputs (Level 3) | | Total | |
Common Stocks | | | | | | | | | | | | | | |
Consumer Discretionary | | $ | 3,116,964 | | $ | 1,169,940 | | | | — | | $ | 4,286,904 | |
Consumer Staples | | | 2,382,317 | | | 529,278 | | | | — | | | 2,911,595 | |
Energy | | | 3,582,907 | | | 1,611,872 | | | | — | | | 5,194,779 | |
Financials | | | 5,348,335 | | | 2,511,471 | | | | — | | | 7,859,806 | |
Health Care | | | 4,289,757 | | | 2,100,211 | | | | — | | | 6,389,968 | |
Industrials | | | 3,074,082 | | | 2,261,284 | | | | — | | | 5,335,366 | |
Information Technology | | | 6,702,891 | | | 2,126,911 | | | | — | | | 8,829,802 | |
Materials | | | 2,517,954 | | | 1,311,490 | | | | — | | | 3,829,444 | |
Telecommunication Services | | | 610,833 | | | 1,327,401 | | | | — | | | 1,938,234 | |
Utilities | | | 298,743 | | | 1,324,335 | | | | — | | | 1,623,078 | |
| | | | | | | | | | | | | | |
Total Common Stocks | | | 31,924,783 | | | 16,274,193 | | | | — | | | 48,198,976 | |
| | | | | | | | | | | | | | |
Total Preferred Stock | | | — | | | 402,593 | | | | — | | | 402,593 | |
| | | | | | | | | | | | | | |
Total Investment Companies | | | 3,226,192 | | | — | | | | — | | | 3,226,192 | |
| | | | | | | | | | | | | | |
Total Short-Term Obligation | | | — | | | 1,386,000 | | | | — | | | 1,386,000 | |
| | | | | | | | | | | | | | |
Total Investments | | | 35,150,975 | | | 18,062,786 | | | | — | | | 53,213,761 | |
| | | | | | | | | | | | | | |
Unrealized Appreciation on Forward Foreign Currency Exchange Contracts | | | — | | | 87,085 | | | | — | | | 87,085 | |
Unrealized Depreciation on Forward Foreign Currency Exchange Contracts | | | — | | | (216,665 | ) | | | — | | | (216,665 | ) |
| | | | | | | | | | | | | | |
Total | | $ | 35,150,975 | | $ | 17,933,206 | | | $ | — | | $ | 53,084,181 | |
| | | | | | | | | | | | | | |
The Fund’s assets assigned to the Level 2 input category include certain foreign securities for which a third party statistical pricing service may be employed for purposes of fair market valuation.
For more information on valuation inputs, and their aggregation into the levels used in the table above, please refer to the Security Valuation section in the accompanying Notes to Financial Statements.
See Accompanying Notes to Financial Statements.
11
Columbia World Equity Fund
March 31, 2010
Forward foreign currency exchange contracts outstanding on March 31, 2010 are:
Foreign Exchange Rate Risk
| | | | | | | | | | | | |
Forward
Foreign
Currency
Exchange
Contracts
to Buy | | Value | | Aggregate
Face
Value | | Settlement
Date | | Unrealized
Appreciation
(Depreciation) | |
AUD | | $ | 1,292,251 | | $ | 1,263,028 | | 06/01/10 | | $ | 29,223 | |
CAD | | | 1,031,831 | | | 1,014,040 | | 06/01/10 | | | 17,791 | |
CHF | | | 616,755 | | | 604,190 | | 06/01/10 | | | 12,565 | |
EUR | | | 3,166,057 | | | 3,192,042 | | 06/01/10 | | | (25,985 | ) |
GBP | | | 2,553,096 | | | 2,530,895 | | 06/01/10 | | | 22,201 | |
JPY | | | 2,641,959 | | | 2,774,739 | | 06/01/10 | | | (132,780 | ) |
NOK | | | 201,217 | | | 201,733 | | 06/01/10 | | | (516 | ) |
| | | | | | | | | | | | |
| | | | | | | | | | $ | (77,501 | ) |
| | | | | | | | | | | | |
| | | | | | | | | | | | |
Forward
Foreign
Currency
Exchange
Contracts
to Sell | | Value | | Aggregate Face
Value | | Settlement Date | | Unrealized Appreciation (Depreciation) | |
AUD | | $ | 103,964 | | $ | 103,470 | | 06/01/10 | | $ | (494 | ) |
CZK | | | 609,883 | | | 602,541 | | 06/01/10 | | | (7,342 | ) |
DKK | | | 701,455 | | | 705,479 | | 06/01/10 | | | 4,024 | |
ILS | | | 1,036,301 | | | 1,010,868 | | 06/01/10 | | | (25,433 | ) |
KRW | | | 1,026,960 | | | 1,013,637 | | 06/01/10 | | | (13,323 | ) |
PHP | | | 311,056 | | | 304,259 | | 06/01/10 | | | (6,797 | ) |
PLN | | | 406,739 | | | 405,138 | | 06/01/10 | | | (1,601 | ) |
SEK | | | 150,699 | | | 151,980 | | 06/01/10 | | | 1,281 | |
SGD | | | 813,260 | | | 812,567 | | 06/01/10 | | | (693 | ) |
TWD | | | 356,799 | | | 355,098 | | 06/01/10 | | | (1,701 | ) |
| | | | | | | | | | | | |
| | | | | | | | | | $ | (52,079 | ) |
| | | | | | | | | | | | |
For the year ended March 31, 2010, transactions in written option contracts were as follows:
| | | | | | | |
| | | Number of contracts | | | Premium received | |
Options outstanding at March 31, 2009 | | 76 | | | $ | 7,562 | |
Options written | | — | | | | — | |
Options terminated in closing purchase transactions | | — | | | | — | |
Options exercised | | — | | | | — | |
Options expired | | (76 | ) | | | (7,562 | ) |
| | | | | | | |
Options outstanding at March 31, 2010 | | — | | | $ | — | |
| | | | | | | |
The Fund was invested in the following countries at March 31, 2010:
| | | | | |
Summary of Securities
by Country (Unaudited) | | Value | | % of Total Investments |
United States* | | $ | 31,182,902 | | 58.6 |
Japan | | | 2,475,371 | | 4.6 |
United Kingdom | | | 2,383,228 | | 4.5 |
Switzerland | | | 1,668,697 | | 3.2 |
China | | | 1,580,907 | | 3.0 |
Canada | | | 1,542,335 | | 2.9 |
Brazil | | | 1,287,899 | | 2.4 |
Spain | | | 1,271,978 | | 2.4 |
France | | | 1,236,283 | | 2.3 |
Singapore | | | 913,113 | | 1.7 |
Australia | | | 837,617 | | 1.6 |
Denmark | | | 793,699 | | 1.5 |
Germany | | | 754,939 | | 1.4 |
Republic of Korea | | | 727,816 | | 1.4 |
Israel | | | 705,478 | | 1.3 |
India | | | 634,856 | | 1.2 |
Sweden | | | 584,427 | | 1.1 |
Finland | | | 543,581 | | 1.0 |
Netherlands | | | 529,278 | | 1.0 |
Italy | | | 523,315 | | 1.0 |
Czech Republic | | | 428,949 | | 0.8 |
Poland | | | 314,025 | | 0.6 |
Philippines | | | 293,068 | | 0.5 |
| | | | | |
| | $ | 53,213,761 | | 100.0 |
| | | | | |
* Includes short-term obligation and investment companies.
Certain securities are listed by country of underlying exposure but may trade predominantly on another exchange.
| | |
Acronym | | Name |
| ADR | | American Depositary Receipt |
| AUD | | Australian Dollar |
| CAD | | Canadian Dollar |
| CHF | | Swiss Franc |
| CZK | | Czech Koruna |
| DKK | | Danish Krone |
| EUR | | Euro |
| GBP | | Pound Sterling |
| ILS | | Israeli Shekel |
| JPY | | Japanese Yen |
| KRW | | South Korean Won |
| NOK | | Norwegian Krone |
| PHP | | Philippine Pesos |
| PLN | | Polish Zloty |
| SEK | | Swedish Krona |
| SGD | | Singapore Dollar |
| TWD | | New Taiwan Dollar |
See Accompanying Notes to Financial Statements.
12
Statement of Assets and Liabilities – Columbia World Equity Fund
March 31, 2010
| | | | | |
| | | | | ($) | |
| Assets | | Unaffiliated investments, at cost | | 42,503,704 | |
| | Affiliated investments, at cost | | 1,743,998 | |
| | | | | |
| | Total investments, at cost | | 44,247,702 | |
| | |
| | Unaffiliated investments, at value | | 50,622,424 | |
| | Affiliated investments, at value | | 2,591,337 | |
| | | | | |
| | Total investments, at value | | 53,213,761 | |
| | Cash | | 924 | |
| | Foreign currency (cost of $6,912) | | 6,924 | |
| | Unrealized appreciation on forward foreign currency exchange contracts | | 87,085 | |
| | Receivable for: | | | |
| | Investments sold | | 903,774 | |
| | Fund shares sold | | 3,707 | |
| | Dividends | | 67,460 | |
| | Foreign tax reclaims | | 6,538 | |
| | Expense reimbursement due from investment advisor | | 3,801 | |
| | Trustees’ deferred compensation plan | | 26,325 | |
| | Prepaid expenses | | 1,091 | |
| | Other assets | | 81,783 | |
| | | |
| | Total Assets | | 54,403,173 | |
| | |
| Liabilities | | Unrealized depreciation on forward foreign currency exchange contracts | | 216,665 | |
| | Payable for: | | | |
| | Investments purchased | | 1,052,104 | |
| | Fund shares repurchased | | 75,489 | |
| | Investment advisory fee | | 16,850 | |
| | Administration fee | | 10,531 | |
| | Pricing and bookkeeping fees | | 5,845 | |
| | Transfer agent fee | | 17,573 | |
| | Trustees’ fees | | 850 | |
| | Audit fee | | 30,850 | |
| | Custody fee | | 4,300 | |
| | Distribution and service fees | | 12,314 | |
| | Chief compliance officer expenses | | 136 | |
| | Reports to shareholders | | 16,721 | |
| | Trustees’ deferred compensation plan | | 26,325 | |
| | Other liabilities | | 3,734 | |
| | | |
| | Total Liabilities | | 1,490,287 | |
| |
| | | |
| | Net Assets | | 52,912,886 | |
| | |
| Net Assets Consist of | | Paid-in capital | | 60,476,042 | |
| | Overdistributed net investment income | | (358,938 | ) |
| | Accumulated net realized loss | | (16,041,317 | ) |
| | Net unrealized appreciation (depreciation) on: | | | |
| | Investments | | 8,966,059 | |
| | Foreign currency translations | | (128,960 | ) |
| | | |
| | Net Assets | | 52,912,886 | |
See Accompanying Notes to Financial Statements.
13
Statement of Assets and Liabilities (continued) – Columbia World Equity Fund
March 31, 2010
| | | | | | |
| | | | | | |
| Class A | | Net assets | | $ | 51,073,273 | |
| | Shares outstanding | | | 4,562,994 | |
| | Net asset value per share | | $ | 11.19 | (a) |
| | Maximum sales charge | | | 5.75 | % |
| | Maximum offering price per share ($11.19/0.9425) | | $ | 11.87 | (b) |
| | |
| Class B | | Net assets | | $ | 955,274 | |
| | Shares outstanding | | | 89,987 | |
| | Net asset value and offering price per share | | $ | 10.62 | (a) |
| | |
| Class C | | Net assets | | $ | 884,339 | |
| | Shares outstanding | | | 83,413 | |
| | Net asset value and offering price per share | | $ | 10.60 | (a) |
| (a) | Redemption price per share is equal to net asset value less any applicable contingent deferred sales charge. |
| (b) | On sales of $50,000 or more the offering price is reduced. |
See Accompanying Notes to Financial Statements.
14
Statement of Operations – Columbia World Equity Fund
For the Year Ended March 31, 2010
| | | | | |
| | | | | ($) | |
| Investment Income | | Dividends | | 964,030 | |
| | Dividends from affiliates | | 38,122 | |
| | Interest | | 14,744 | |
| | Foreign tax withheld | | (83,549 | ) |
| | | |
| | Total Investment Income | | 933,347 | |
| | | | | |
| Expenses | | Investment advisory fee | | 197,839 | |
| | Administration fee | | 123,660 | |
| | Distribution fee: | | | |
| | Class B | | 8,339 | |
| | Class C | | 5,747 | |
| | Service fee: | | | |
| | Class A | | 119,050 | |
| | Class B | | 2,779 | |
| | Class C | | 1,916 | |
| | Transfer agent fee | | 159,777 | |
| | Pricing and bookkeeping fees | | 57,548 | |
| | Trustees’ fees | | 18,560 | |
| | Custody fee | | 27,472 | |
| | Reports to shareholders | | 48,512 | |
| | Audit fee | | 40,848 | |
| | Registration fees | | 38,342 | |
| | Chief compliance officer expenses | | 594 | |
| | Other expenses | | 31,653 | |
| | | |
| | Total Expenses | | 882,636 | |
| | |
| | Fees waived or expenses reimbursed by investment advisor and/or administrator | | (176,095 | ) |
| | Expense reductions | | (2 | ) |
| | | |
| | Net Expenses | | 706,539 | |
| |
| | | |
| | Net Investment Income | | 226,808 | |
| | |
| Net Realized and Unrealized Gain (Loss) on Investments, Foreign Currency and Written Options | | Net realized gain (loss) on: | | | |
| | Unaffiliated investments | | (1,107,751 | ) |
| | Affiliated investments | | 503,158 | |
| | Foreign currency transactions and forward foreign currency exchange contracts | | 136,740 | |
| | Written options | | 7,562 | |
| | | |
| | Net realized loss | | (460,291 | ) |
| | |
| | Net change in unrealized appreciation (depreciation) on: | | | |
| | Investments | | 19,822,718 | |
| | Foreign currency transactions and forward foreign currency exchange contracts | | (20,074 | ) |
| | Written options | | (6,422 | ) |
| | | |
| | Net change in unrealized appreciation (depreciation) | | 19,796,222 | |
| | | |
| | Net Gain | | 19,335,931 | |
| |
| | | |
| | Net Increase Resulting from Operations | | 19,562,739 | |
See Accompanying Notes to Financial Statements.
15
Statement of Changes in Net Assets – Columbia World Equity Fund
| | | | | | | | |
| | | | | Year Ended March 31, | |
| Increase (Decrease) in Net Assets | | | | 2010 ($) | | | 2009 ($) | |
| Operations | | Net investment income | | 226,808 | | | 512,275 | |
| | Net realized loss on investments, foreign currency transactions, forward foreign currency exchange contracts, written options and capital gains distributions received from affiliated investments | | (460,291 | ) | | (15,880,239 | ) |
| | Net change in unrealized appreciation (depreciation) on investments, foreign currency translations, forward foreign currency exchange contracts and written options | | 19,796,222 | | | (15,968,964 | ) |
| | | |
| | Net increase (decrease) resulting from operations | | 19,562,739 | | | (31,336,928 | ) |
| | | |
| Distributions to Shareholders | | From net investment income: | | | | | | |
| | Class A | | (1,016,070 | ) | | — | |
| | Class B | | (14,307 | ) | | — | |
| | Class C | | (10,909 | ) | | — | |
| | From net realized gains: | | | | | | |
| | Class A | | — | | | (582,318 | ) |
| | Class B | | — | | | (25,588 | ) |
| | Class C | | — | | | (8,137 | ) |
| | | |
| | Total distributions to shareholders | | (1,041,286 | ) | | (616,043 | ) |
| | | |
| | Net Capital Stock Transactions | | (3,984,478 | ) | | (8,550,215 | ) |
| | | |
| | Redemption fees | | 723 | | | 792 | |
| | | |
| | Increase from regulatory settlements | | 81,783 | | | 48,532 | |
| | | |
| | Total increase (decrease) in net assets | | 14,619,481 | | | (40,453,862 | ) |
| | | |
| Net Assets | | Beginning of period | | 38,293,405 | | | 78,747,267 | |
| | End of period | | 52,912,886 | | | 38,293,405 | |
| | Undistributed (overdistributed) net investment income at end of period | | (358,938 | ) | | 139,954 | |
See Accompanying Notes to Financial Statements.
16
Statement of Changes in Net Assets (continued) – Columbia World Equity Fund
| | | | | | | | | | | | | | |
| | | Capital Stock Activity | |
| | | Year Ended
March 31, 2010 | | | | | Year Ended
March 31, 2009 | |
| | | Shares | | | Dollars ($) | | | | | Shares | | | Dollars ($) | |
Class A | | | | | | | | | | | | | | |
Subscriptions | | 119,814 | | | 1,226,499 | | | | | 181,694 | | | 2,033,077 | |
Distributions reinvested | | 90,419 | | | 941,091 | | | | | 40,238 | | | 549,246 | |
Redemptions | | (556,858 | ) | | (5,636,645 | ) | | | | (943,205 | ) | | (9,634,107 | ) |
| | | | | | | | | | | | | | |
Net decrease | | (346,625 | ) | | (3,469,055 | ) | | | | (721,273 | ) | | (7,051,784 | ) |
| | | | | |
Class B | | | | | | | | | | | | | | |
Subscriptions | | 7,060 | | | 70,882 | | | | | 11,761 | | | 102,983 | |
Distributions reinvested | | 1,315 | | | 13,337 | | | | | 1,850 | | | 24,091 | |
Redemptions | | (69,600 | ) | | (655,436 | ) | | | | (152,893 | ) | | (1,604,608 | ) |
| | | | | | | | | | | | | | |
Net decrease | | (61,225 | ) | | (571,217 | ) | | | | (139,282 | ) | | (1,477,534 | ) |
| | | | | |
Class C | | | | | | | | | | | | | | |
Subscriptions | | 15,213 | | | 147,197 | | | | | 18,357 | | | 168,432 | |
Distributions reinvested | | 919 | | | 9,318 | | | | | 544 | | | 7,069 | |
Redemptions | | (10,481 | ) | | (100,721 | ) | | | | (19,765 | ) | | (196,398 | ) |
| | | | | | | | | | | | | | |
Net increase (decrease) | | 5,651 | | | 55,794 | | | | | (864 | ) | | (20,897 | ) |
See Accompanying Notes to Financial Statements.
17
Financial Highlights – Columbia World Equity Fund
Selected data for a share outstanding throughout each period is as follows:
| | | | | | | | | | | | | | | | | | | | |
| | | Year Ended March 31, | |
| Class A Shares | | 2010 | | | 2009 | | | 2008 | | | 2007 | | | 2006 | |
Net Asset Value, Beginning of Period | | $ | 7.47 | | | $ | 13.16 | | | $ | 15.48 | | | $ | 14.14 | | | $ | 11.92 | |
| | | | | |
Income from Investment Operations: | | | | | | | | | | | | | | | | | | | | |
Net investment income (a) | | | 0.05 | | | | 0.10 | | | | 0.14 | | | | 0.12 | | | | 0.10 | |
Net realized and unrealized gain (loss) on capital gain distributions received from affiliated investments, investments, foreign currency and written options | | | 3.87 | | | | (5.69 | ) | | | (0.81 | ) | | | 1.97 | | | | 2.18 | |
| | | | | | | | | | | | | | | | | | | | |
Total from investment operations | | | 3.92 | | | | (5.59 | ) | | | (0.67 | ) | | | 2.09 | | | | 2.28 | |
| | | | | |
Less Distributions to Shareholders: | | | | | | | | | | | | | | | | | | | | |
From net investment income | | | (0.22 | ) | | | — | | | | (0.22 | ) | | | (0.18 | ) | | | (0.06 | ) |
From net realized gains | | | — | | | | (0.11 | ) | | | (1.43 | ) | | | (0.57 | ) | | | — | |
| | | | | | | | | | | | | | | | | | | | |
Total distributions to shareholders | | | (0.22 | ) | | | (0.11 | ) | | | (1.65 | ) | | | (0.75 | ) | | | (0.06 | ) |
| | | | | |
Redemption Fees: | | | | | | | | | | | | | | | | | | | | |
Redemption fees added to paid-in-capital (b) | | | — | | | | — | | | | — | | | | — | | | | — | |
| | | | | |
Increase from regulatory settlements | | | 0.02 | | | | 0.01 | | | | — | | | | — | | | | — | |
| | | | | |
Net Asset Value, End of Period | | $ | 11.19 | | | $ | 7.47 | | | $ | 13.16 | | | $ | 15.48 | | | $ | 14.14 | |
Total return (c) | | | 52.96 | %(d) | | | (42.79 | )%(d) | | | (5.47 | )%(e) | | | 15.11 | % | | | 19.15 | %(d) |
| | | | | |
Ratios to Average Net Assets/Supplemental Data: | | | | | | | | | | | | | | | | | | | | |
Net expenses | | | 1.40 | %(f) | | | 1.58 | %(g) | | | 1.40 | %(f) | | | 1.47 | %(f) | | | 1.51 | %(f) |
Waiver/Reimbursement | | | 0.36 | % | | | 0.06 | % | | | — | | | | — | | | | 0.03 | % |
Net investment income | | | 0.49 | %(f) | | | 0.91 | %(g) | | | 0.94 | %(f) | | | 0.80 | %(f) | | | 0.76 | %(f) |
Portfolio turnover rate | | | 90 | % | | | 154 | % | | | 69 | % | | | 85 | % | | | 62 | % |
Net assets, end of period (000s) | | $ | 51,073 | | | $ | 36,672 | | | $ | 74,106 | | | $ | 86,237 | | | $ | 81,746 | |
| (a) | Per share data was calculated using the average shares outstanding during the period. |
| (b) | Rounds to less than $0.01 per share. |
| (c) | Total return at net asset value assuming all distributions reinvested and no initial sales charge or contingent deferred sales charge. |
| (d) | Had the investment advisor and/or any of its affiliates not waived fees or reimbursed a portion of expenses, total return would have been reduced. |
| (e) | Total return includes a voluntary reimbursement by the investment advisor for a realized investment loss due to a trading error. This reimbursement had an impact of less than 0.01% on the Fund’s total return. |
| (f) | The benefits derived from expense reductions had an impact of less than 0.01%. |
| (g) | The benefits derived from expense reductions had an impact of 0.02%. |
See Accompanying Notes to Financial Statements.
18
Financial Highlights – Columbia World Equity Fund
Selected data for a share outstanding throughout each period is as follows:
| | | | | | | | | | | | | | | | | | | | |
| | | Year Ended March 31, | |
| Class B Shares | | 2010 | | | 2009 | | | 2008 | | | 2007 | | | 2006 | |
Net Asset Value, Beginning of Period | | $ | 7.08 | | | $ | 12.58 | | | $ | 14.86 | | | $ | 13.58 | | | $ | 11.48 | |
| | | | | |
Income from Investment Operations: | | | | | | | | | | | | | | | | | | | | |
Net investment income (loss) (a) | | | (0.02 | ) | | | 0.03 | | | | 0.03 | | | | 0.02 | | | | — | (b) |
Net realized and unrealized gain (loss) on capital gain distributions received from affiliated investments, investments, foreign currency and written options | | | 3.67 | | | | (5.43 | ) | | | (0.77 | ) | | | 1.87 | | | | 2.10 | |
| | | | | | | | | | | | | | | | | | | | |
Total from investment operations | | | 3.65 | | | | (5.40 | ) | | | (0.74 | ) | | | 1.89 | | | | 2.10 | |
| | | | | |
Less Distributions to Shareholders: | | | | | | | | | | | | | | | | | | | | |
From net investment income | | | (0.13 | ) | | | — | | | | (0.11 | ) | | | (0.04 | ) | | | — | |
From net realized gains | | | — | | | | (0.11 | ) | | | (1.43 | ) | | | (0.57 | ) | | | — | |
| | | | | | | | | | | | | | | | | | | | |
Total distributions to shareholders | | | (0.13 | ) | | | (0.11 | ) | | | (1.54 | ) | | | (0.61 | ) | | | — | |
| | | | | |
Redemption Fees: | | | | | | | | | | | | | | | | | | | | |
Redemption fees added to paid-in-capital (b) | | | — | | | | — | | | | — | | | | — | | | | — | |
| | | | | |
Increase from regulatory settlements | | | 0.02 | | | | 0.01 | | | | — | | | | — | | | | — | |
| | | | | |
Net Asset Value, End of Period | | $ | 10.62 | | | $ | 7.08 | | | $ | 12.58 | | | $ | 14.86 | | | $ | 13.58 | |
Total return (c) | | | 51.99 | %(d) | | | (43.26 | )%(d) | | | (6.12 | )%(e) | | | 14.17 | % | | | 18.29 | %(d) |
| | | | | |
Ratios to Average Net Assets/Supplemental Data: | | | | | | | | | | | | | | | | | | | | |
Net expenses | | | 2.15 | %(f) | | | 2.33 | %(g) | | | 2.15 | %(f) | | | 2.22 | %(f) | | | 2.26 | %(f) |
Waiver/Reimbursement | | | 0.36 | % | | | 0.06 | % | | | — | | | | — | | | | 0.03 | % |
Net investment income (loss) | | | (0.21 | )%(f) | | | 0.25 | %(g) | | | 0.23 | %(f) | | | 0.11 | %(f) | | | 0.01 | %(f) |
Portfolio turnover rate | | | 90 | % | | | 154 | % | | | 69 | % | | | 85 | % | | | 62 | % |
Net assets, end of period (000s) | | $ | 955 | | | $ | 1,071 | | | $ | 3,654 | | | $ | 8,445 | | | $ | 13,513 | |
| (a) | Per share data was calculated using the average shares outstanding during the period. |
| (b) | Rounds to less than $0.01 per share. |
| (c) | Total return at net asset value assuming all distributions reinvested and no contingent deferred sales charge. |
| (d) | Had the investment advisor and/or any of its affiliates not waived fees or reimbursed a portion of expenses, total return would have been reduced. |
| (e) | Total return includes a voluntary reimbursement by the investment advisor for a realized investment loss due to a trading error. This reimbursement had an impact of less than 0.01% on the Fund’s total return. |
| (f) | The benefits derived from expense reductions had an impact of less than 0.01%. |
| (g) | The benefits derived from expense reductions had an impact of 0.02%. |
See Accompanying Notes to Financial Statements.
19
Financial Highlights – Columbia World Equity Fund
Selected data for a share outstanding throughout each period is as follows:
| | | | | | | | | | | | | | | | | | | | |
| | | Year Ended March 31, | |
| Class C Shares | | 2010 | | | 2009 | | | 2008 | | | 2007 | | | 2006 | |
Net Asset Value, Beginning of Period | | $ | 7.07 | | | $ | 12.56 | | | $ | 14.84 | | | $ | 13.56 | | | $ | 11.47 | |
| | | | | |
Income from Investment Operations: | | | | | | | | | | | | | | | | | | | | |
Net investment income (loss) (a) | | | (0.03 | ) | | | 0.02 | | | | 0.03 | | | | — | (b) | | | — | (b) |
Net realized and unrealized gain (loss) on capital gain distributions received from affiliated investments, investments, foreign currency and written options | | | 3.67 | | | | (5.41 | ) | | | (0.77 | ) | | | 1.89 | | | | 2.09 | |
| | | | | | | | | | | | | | | | | | | | |
Total from investment operations | | | 3.64 | | | | (5.39 | ) | | | (0.74 | ) | | | 1.89 | | | | 2.09 | |
| | | | | |
Less Distributions to Shareholders: | | | | | | | | | | | | | | | | | | | | |
From net investment income | | | (0.13 | ) | | | — | | | | (0.11 | ) | | | (0.04 | ) | | | — | |
From net realized gains | | | — | | | | (0.11 | ) | | | (1.43 | ) | | | (0.57 | ) | | | — | |
| | | | | | | | | | | | | | | | | | | | |
Total distributions to shareholders | | | (0.13 | ) | | | (0.11 | ) | | | (1.54 | ) | | | (0.61 | ) | | | — | |
| | | | | |
Redemption Fees: | | | | | | | | | | | | | | | | | | | | |
Redemption fees added to paid-in-capital (b) | | | — | | | | — | | | | — | | | | — | | | | — | |
| | | | | |
Increase from regulatory settlements | | | 0.02 | | | | 0.01 | | | | — | | | | — | | | | — | |
| | | | | |
Net Asset Value, End of Period | | $ | 10.60 | | | $ | 7.07 | | | $ | 12.56 | | | $ | 14.84 | | | $ | 13.56 | |
Total return (c) | | | 51.92 | %(d) | | | (43.25 | )%(d) | | | (6.12 | )%(e) | | | 14.19 | % | | | 18.22 | %(d) |
| | | | | |
Ratios to Average Net Assets/Supplemental Data: | | | | | | | | | | | | | | | | | | | | |
Net expenses | | | 2.15 | %(f) | | | 2.33 | %(g) | | | 2.15 | %(f) | | | 2.22 | %(f) | | | 2.26 | %(f) |
Waiver/Reimbursement | | | 0.36 | % | | | 0.06 | % | | | — | | | | — | | | | 0.03 | % |
Net investment income (loss) | | | (0.29 | )%(f) | | | 0.15 | %(g) | | | 0.21 | %(f) | | | 0.02 | %(f) | | | — | %(f)(h) |
Portfolio turnover rate | | | 90 | % | | | 154 | % | | | 69 | % | | | 85 | % | | | 62 | % |
Net assets, end of period (000s) | | $ | 884 | | | $ | 550 | | | $ | 987 | | | $ | 1,144 | | | $ | 1,287 | |
| (a) | Per share data was calculated using the average shares outstanding during the period. |
| (b) | Rounds to less than $0.01 per share. |
| (c) | Total return at net asset value assuming all distributions reinvested and no contingent deferred sales charge. |
| (d) | Had the investment advisor and/or any of its affiliates not waived fees or reimbursed a portion of expenses, total return would have been reduced. |
| (e) | Total return includes a voluntary reimbursement by the investment advisor for a realized investment loss due to a trading error. This reimbursement had an impact of less than 0.01% on the Fund’s total return. |
| (f) | The benefits derived from expense reductions had an impact of less than 0.01%. |
| (g) | The benefits derived from expense reductions had an impact of 0.02%. |
| (h) | Rounds to less than 0.01%. |
See Accompanying Notes to Financial Statements.
20
Notes to Financial Statements – Columbia World Equity Fund
March 31, 2010
Note 1. Organization
Columbia World Equity Fund (the “Fund”), a series of Columbia Funds Series Trust I (the “Trust”), is a diversified fund. The Trust is registered under the Investment Company Act of 1940, as amended (the “1940 Act”), as an open-end management investment company organized as a Massachusetts business trust.
Investment Objective
The Fund seeks long-term capital appreciation.
Fund Shares
The Trust may issue an unlimited number of shares, and the Fund offers three classes of shares: Class A, Class B and Class C. Each share class has its own expense structure and sales charges, as applicable. Effective June 22, 2009, the Fund no longer accepts investments in Class B shares from new or existing investors in the Fund’s Class B shares, except in connection with the reinvestment of any dividend and/or capital gain distributions in Class B shares of the Fund and exchanges by existing Class B shareholders of the other Columbia Funds.
Class A shares are subject to a maximum front-end sales charge of 5.75% based on the amount of initial investment. Class A shares purchased without an initial sales charge in accounts aggregating $1 million to $50 million at the time of purchase are subject to a 1.00% contingent deferred sales charge (“CDSC”) if the shares are sold within one year after purchase. Class B shares are subject to a maximum CDSC of 5.00% based upon the holding period after purchase. Class B shares will convert to Class A shares eight years after purchase. Class C shares are subject to a 1.00% CDSC on shares sold within one year after purchase.
Note 2. Significant Accounting Policies
The preparation of financial statements in accordance with accounting principles generally accepted in the United States of America (“GAAP”) requires management to make certain estimates and assumptions that affect the reported amounts of assets and liabilities, the disclosure of contingent assets and liabilities at the date of the financial statements and the reported amounts of revenue and expenses during the reporting period. Actual results could differ from those estimates.
The following is a summary of significant accounting policies consistently followed by the Fund in the preparation of its financial statements.
Security Valuation
Equity securities and securities of certain investment companies are valued at the last sale price on the principal exchange on which they trade, except for securities traded on the NASDAQ, which are valued at the NASDAQ official close price. Unlisted securities or listed securities for which there were no sales during the day are valued at the closing bid price on such exchanges or over-the-counter markets.
Short-term investments maturing in 60 days or less are valued at amortized cost, which approximates market value.
Investments in other open-end investment companies are valued at net asset value.
Written options are valued at the last reported sale price, or in the absence of a sale, at the last quoted ask price.
Forward foreign currency exchange contracts are valued at the prevailing forward exchange rate of the underlying currencies.
Foreign securities are generally valued at the last sale price on the foreign exchange or market on which they trade. If any foreign share prices are not readily available as a result of limited share activity, the securities are valued at the last sale price of the local shares in the principal market in which such securities are normally traded.
Generally, trading in foreign securities is substantially completed each day at various times prior to the close of the New York Stock Exchange (“NYSE”). The values of such securities used in computing the net asset value of the Fund’s shares are determined as of such times. Foreign currency exchange rates are generally determined at 4:00 p.m. Eastern (U.S.) time. Occasionally, events affecting the values of such foreign securities may occur between the times at which they are determined and the close of the customary trading session of the NYSE, which would not be reflected in the computation of the Fund’s net asset value. If events materially affecting the values of such foreign securities occur and it is determined that market quotations are not reliable, then these foreign securities will be valued at their fair value using procedures approved by the Board of Trustees.
21
Columbia World Equity Fund
March 31, 2010
The Fund may use a systematic fair valuation model provided by an independent third party to value securities principally traded in foreign markets in order to adjust for possible stale pricing that may occur between the close of the foreign exchanges and the time for valuation.
Investments for which market quotations are not readily available, or that have quotations which management believes are not reliable, are valued at fair value as determined in good faith under consistently applied procedures established by and under the general supervision of the Board of Trustees. If a security is valued at fair value, such value is likely to be different from the last quoted market price for the security. The determination of fair value often requires significant judgment. To determine fair value, management may use assumptions including but not limited to future cash flows and estimated risk premiums. Multiple inputs from various sources may be used to determine value.
GAAP establishes a hierarchy that prioritizes the inputs to valuation techniques used to measure fair value giving the highest priority to unadjusted quoted prices in active markets for identical securities (level 1 measurements) and the lowest priority to unobservable inputs (level 3 measurements) when market prices are not readily available or reliable. The three levels of the fair value hierarchy are described below:
| n | | Level 1 — quoted prices in active markets for identical securities |
| n | | Level 2 — prices determined using other significant observable inputs (including quoted prices for similar securities, interest rates, prepayment speeds, credit risk and others) |
| n | | Level 3 — prices determined using significant unobservable inputs. In situations where quoted prices or observable inputs are unavailable or less reliable, unobservable inputs may be used. Unobservable inputs may include management’s own assumptions about the factors market participants would use in pricing an investment. |
The inputs or methodology used for valuing securities are not necessarily an indication of the risk associated with investing in those securities.
On Jan. 21, 2010, the FASB issued an Accounting Standards Update (the amendment), Fair Value Measurements and Disclosures (Topic 820): Improving Disclosures about Fair Value Measurements, which provides guidance on how investment assets and liabilities are to be valued and disclosed. Specifically, the amendment requires reporting entities to disclose the input and valuation techniques used to measure fair value for both recurring and nonrecurring fair value measurements for Level 2 or Level 3 positions. The amendment also requires that transfers between all levels (including Level 1 and Level 2) be disclosed on a gross basis (i.e., transfers out must be disclosed separately from transfers in), and the reason(s) for the transfer. Additionally purchases, sales, issuances and settlements must be disclosed on a gross basis in the Level 3 rollforward. The effective date of the amendment is for interim and annual periods beginning after Dec. 15, 2009, however, the requirement to provide the Level 3 activity for purchases, sales, issuances and settlements on a gross basis will be effective for interim and annual periods beginning after Dec. 15, 2010. At this time, management is evaluating the implications of the amendment and the impact to the financial statements.
Security Transactions
Security transactions are accounted for on the trade date. Cost is determined and gains (losses) are based upon the specific identification method for both financial statement and federal income tax purposes.
Derivative Instruments
The Fund may invest in derivative investments. For additional information on derivative instruments, please see Note 6.
Repurchase Agreements
The Fund may engage in repurchase agreement transactions with institutions that Columbia Management Advisors, LLC (“Columbia”), the Fund’s investment advisor, has determined are creditworthy. The Fund, through its custodian, receives delivery of the underlying securities collateralizing a repurchase agreement. Columbia is responsible for determining that the collateral is at least equal, at all times, to the value of the repurchase obligation including interest. A repurchase agreement transaction involves certain risks in the event of default or insolvency of the counterparty. These risks include possible delays in or restrictions on the Fund’s ability to dispose of the underlying securities and a possible decline in the value of the underlying securities during the period while the Fund seeks to assert its rights.
22
Columbia World Equity Fund
March 31, 2010
Foreign Currency Transactions and Translations
The values of all assets and liabilities quoted in foreign currencies are translated into U.S. dollars at that day’s exchange rates. Net realized and unrealized gains (losses) on foreign currency transactions and translations include gains (losses) arising from the fluctuation in exchange rates between trade and settlement dates on securities transactions, gains (losses) arising from the disposition of foreign currency and currency gains (losses) between the accrual and payment dates on dividends, interest income and foreign withholding taxes.
For financial statement purposes, the Fund does not distinguish that portion of gains (losses) on investments which is due to changes in foreign exchange rates from that which is due to changes in market prices of the investments. Such fluctuations are included with the net realized and unrealized gains (losses) on investments on the Statement of Operations.
Income Recognition
Interest income is recorded on the accrual basis.
Corporate actions and dividend income are recorded on the ex-date except for certain foreign securities which are recorded as soon after the ex-date as the Fund becomes aware of such, net of any non-reclaimable tax withholdings.
Expenses
General expenses of the Trust are allocated to the Fund and other series of the Trust based upon relative net assets or other expense allocation methodologies determined by the nature of the expense. Expenses directly attributable to the Fund are charged to the Fund.
Determination of Class Net Asset Value
All income, expenses (other than class-specific expenses, as shown on the Statement of Operations) and realized and unrealized gains (losses) are allocated to each class of the Fund on a daily basis, based on the relative net assets of each class, for purposes of determining the net asset value of each class.
Federal Income Tax Status
The Fund intends to qualify each year as a “regulated investment company” under Subchapter M of the Internal Revenue Code, as amended, and will distribute substantially all of its taxable income, if any, for its tax year, and as such will not be subject to federal income taxes. In addition, the Fund intends to distribute in each calendar year substantially all of its net investment income, capital gains and certain other amounts, if any, such that the Fund should not be subject to federal excise tax. Therefore, no provision is made for federal income or excise taxes.
Distributions to Shareholders
Distributions from net investment income, if any, are declared and paid semi-annually. Net realized capital gains, if any, are distributed at least annually. Income distributions and capital gain distributions are determined in accordance with federal income tax regulations which may differ from GAAP.
Indemnification
In the normal course of business, the Fund enters into contracts that contain a variety of representations and warranties and which provide general indemnities. The Fund’s maximum exposure under these arrangements is unknown because this would involve future claims against the Fund. Also, under the Trust’s organizational documents and by contract, the Trustees and officers of the Trust are indemnified against certain liabilities that may arise out of actions relating to their duties to the Trust. However, based on experience, the Fund expects the risk of loss due to these representations, warranties and indemnities to be minimal.
Note 3. Federal Tax Information
The timing and character of income and capital gain distributions are determined in accordance with income tax regulations, which may differ from GAAP. Reclassifications are made to the Fund’s capital accounts for permanent tax differences to reflect income and gains available for distribution (or available capital loss carryforwards) under income tax regulations.
23
Columbia World Equity Fund
March 31, 2010
For the year ended March 31, 2010, permanent book and tax basis differences resulting primarily from differing treatments of distribution reclasses, foreign currency transactions and proceeds received from litigation settlements were identified and reclassified among the components of the Fund’s net assets as follows:
| | | | |
| | | | | |
Overdistributed Net Investment
Income | | Accumulated Net Realized
Loss | | Paid-In Capital |
| $315,586 | | $(136,737) | | $(178,849) |
Net investment income and net realized gains (losses), as disclosed on the Statement of Operations, and net assets were not affected by this reclassification.
The tax character of distributions paid during the years ended March 31, 2010 and March 31, 2009 was as follows:
| | | | | | |
| | | March 31, 2010 | | March 31, 2009 |
| Distributions paid from: | | |
Ordinary Income* | | $ | 1,041,286 | | $ | 9,003 |
Long-Term Capital Gains | | | — | | | 607,040 |
| * | For tax purposes short-term capital gains distributions, if any, are considered ordinary income distributions. |
As of March 31, 2010, the components of distributable earnings on a tax basis were as follows:
| | | | |
| | | | | |
Undistributed
Ordinary Income | | Undistributed Long-Term Capital Gains | | Net
Unrealized Appreciation* |
| $— | | $— | | $8,897,852 |
| * | The differences between book-basis and tax-basis net unrealized appreciation are primarily due to deferral of losses from wash sales. |
Unrealized appreciation and depreciation at March 31, 2010, based on cost of investments for federal income tax purposes were:
| | | | |
| | | | |
Unrealized appreciation | | $ | 9,834,924 | |
Unrealized depreciation | | | (937,072 | ) |
Net unrealized appreciation | | $ | 8,897,852 | |
The following capital loss carryforwards may be available to reduce taxable income arising from future net realized gains on investments, if any, to the extent permitted by the Internal Revenue Code:
| | | |
| | | |
| Year of Expiration | | Capital Loss Carryforward |
| 2017 | | $ | 7,698,220 |
| 2018 | | | 8,274,890 |
| Total | | $ | 15,973,110 |
Under current tax rules, certain currency (and capital) losses realized after October 31 may be deferred and treated as occurring on the first day of the following year. As of March 31, 2010, post-October capital losses of $452,888 attributed to security transactions were deferred to April 1, 2010.
Management is required to determine whether a tax position of the Fund is more likely than not to be sustained upon examination by the applicable taxing authority, including resolution of any related appeals or litigation processes, based on the technical merits of the position. The tax benefit to be recognized by the Fund is measured as the largest amount of benefit that is greater than fifty percent likely of being realized upon ultimate settlement. Management is not aware of any tax positions for which it is reasonably possible that the total amounts of unrecognized tax benefits will significantly change in the next twelve months. However, management’s conclusions may be subject to review and adjustment at a later date based on factors including, but not limited to, new tax laws, regulations, and administrative interpretations (including relevant court decisions). The Fund’s federal tax returns for the prior three fiscal years remain subject to examination by the Internal Revenue Service.
Note 4. Fees and Compensation Paid to Affiliates
Investment Advisory Fee
Columbia, an indirect, wholly owned subsidiary of Bank of America Corporation (“BOA”), provides investment advisory services to the Fund. In rendering investment advisory services to the Fund, Columbia may use the portfolio management and research resources of Columbia Management Pte. Ltd., an affiliate of Columbia. Columbia
24
Columbia World Equity Fund
March 31, 2010
receives a monthly investment advisory fee based on the Fund’s average daily net assets at the following annual rates:
| | | |
| | | | |
| Average Daily Net Assets | | Annual Fee Rate | |
First $1 billion | | 0.40 | % |
Over $1 billion | | 0.35 | % |
Columbia has voluntarily agreed to waive its investment advisory fee charged to the Fund on its assets that are invested in Columbia Greater China Fund and Columbia Emerging Markets Fund. For the year ended March 31, 2010, Columbia waived $11,060 of investment advisory fees for the Fund. Columbia, in its discretion, may revise or discontinue this arrangement at any time.
For the year ended March 31, 2010, the Fund’s effective investment advisory fee rate, net of fee waivers, was 0.38% of the Fund’s average daily net assets.
Bank of America, N.A., an indirect parent company of Columbia, entered into an agreement dated September 29, 2009, to sell a portion of the asset management business of Columbia Management Group, LLC to Ameriprise Financial, Inc. (“Ameriprise Financial”). The transaction (“Transaction”) includes the sale of the part of the asset management business that advises long-term mutual funds, including the Fund. The Transaction is subject to certain approvals and other conditions to closing, and is currently expected to close on or about April 30, 2010 (the “Closing”).
In connection with the Closing, certain changes will occur, including a change in the entities serving as the investment advisor, administrator, distributor and transfer agent of the Fund. RiverSource Investments, LLC (the “New Advisor”), a subsidiary of Ameriprise Financial, will become the investment advisor of the Fund upon the Closing. On March 3, 2010, the Fund’s shareholders approved, among other matters, the proposed investment management services agreement with the New Advisor. The New Advisor will serve as investment advisor under a new investment management services agreement effective upon the Closing. The New Advisor will change its name to Columbia Management Investment Advisers, LLC upon or shortly after the Closing. Effective upon the Closing, as the context requires, references to Columbia shall be deemed to refer to the New Advisor.
Administration Fee
Columbia provides administrative and other services to the Fund for a monthly administration fee at the annual rate of 0.25% of the Fund’s average daily net assets. Columbia has voluntarily agreed to waive its administration fee charged to the Fund on its assets that are invested in Columbia Greater China Fund and Columbia Emerging Markets Fund. For the year ended March 31, 2010, Columbia waived $6,904 of administration fees for the Fund. Columbia, in its discretion, may revise or discontinue this arrangement at any time.
For the year ended March 31, 2010, the Fund’s effective administration fee, net of fee waivers, was 0.24% of the Fund’s average daily net assets.
The New Advisor will become the administrator of the Fund under a new administrative services agreement effective upon the Closing.
Pricing and Bookkeeping Fees
The Fund has entered into a Financial Reporting Services Agreement (the “Financial Reporting Services Agreement”) with State Street Bank and Trust Company (“State Street”) and Columbia pursuant to which State Street provides financial reporting services to the Fund. The Fund has also entered into an Accounting Services Agreement (collectively with the Financial Reporting Services Agreement, the “State Street Agreements”) with State Street and Columbia pursuant to which State Street provides accounting services to the Fund. Under the State Street Agreements, the Fund pays State Street an annual fee of $38,000 paid monthly plus an additional monthly fee based on an annualized percentage rate of average daily net assets of the Fund for the month. The aggregate fee will not exceed $140,000 per year (exclusive of out-of-pocket expenses and charges). The Fund also reimburses State Street for certain out-of-pocket expenses and charges.
Among other updates to the State Street Agreements, Columbia will assign and delegate its rights and obligations thereunder to the New Advisor upon the Closing.
The Fund has entered into a Pricing and Bookkeeping Oversight and Services Agreement (the “Services Agreement”) with Columbia. Under the Services Agreement, Columbia provides services related to Fund expenses and the requirements of the Sarbanes-Oxley Act of 2002, and provides
25
Columbia World Equity Fund
March 31, 2010
oversight of the accounting and financial reporting services provided by State Street. Under the Services Agreement, the Fund reimburses Columbia for out-of-pocket expenses.
The Services Agreement will be terminated upon the Closing, and the services provided thereunder will be covered under the administrative services agreement with the New Advisor.
Transfer Agent Fee
Columbia Management Services, Inc. (the “Transfer Agent”), an affiliate of Columbia and an indirect, wholly owned subsidiary of BOA, provides shareholder services to the Fund and has contracted with Boston Financial Data Services (“BFDS”) to serve as sub-transfer agent. Effective November 1, 2009, the Transfer Agent is entitled to receive a fee for its services, paid monthly, at the annual rate of $22.36 per account plus reimbursement of certain sub-transfer agent fees paid by the Transfer Agent (exclusive of BFDS fees), calculated based on assets held in omnibus accounts and intended to recover the cost of payments to other parties (including affiliates of BOA) for services to those accounts. Prior to November 1, 2009, the annual rate was $17.34 per account. The Transfer Agent pays the fees of BFDS for services as sub-transfer agent and is not entitled to reimbursement for such fees from the Fund.
The Transfer Agent may also retain, as additional compensation for its services, fees for wire, telephone and redemption orders, Individual Retirement Account (“IRA”) trustee agent fees and account transcript fees due to the Transfer Agent from shareholders of the Fund and credits (net of bank charges) earned with respect to balances in accounts the Transfer Agent maintains in connection with its services to the Fund. The Transfer Agent also receives reimbursement for certain out-of-pocket expenses.
RiverSource Service Corporation (the “New Transfer Agent”), a subsidiary of Ameriprise Financial, will become the transfer agent of the Fund upon the Closing. The New Transfer Agent will change its name to Columbia Management Investment Services Corp. upon or shortly after the Closing.
An annual minimum account balance fee of $20 may apply to certain accounts with a value below the Fund’s initial minimum investment requirements to reduce the impact of small accounts on transfer agent fees. These minimum account balance fees are recorded as part of expense reductions on the Statement of Operations. For the year ended March 31, 2010, no minimum account balance fees were charged by the Fund.
Underwriting Discounts, Service and Distribution Fees
Columbia Management Distributors, Inc. (the “Distributor”), an affiliate of Columbia and an indirect, wholly owned subsidiary of BOA, is the principal underwriter of the Fund’s shares. For the year ended March 31, 2010, the Distributor has retained net underwriting discounts of $1,858 on sales of the Fund’s Class A shares and net CDSC fees of $59, $1,321 and $38 on Class A, Class B and Class C share redemptions, respectively.
RiverSource Fund Distributors, Inc. (the “New Distributor”), a subsidiary of Ameriprise Financial, will become the distributor of the Fund upon the Closing. The New Distributor will change its name to Columbia Management Investment Distributors, Inc. upon or shortly after the Closing.
The Fund has adopted plans pursuant to Rule 12b-1 under the 1940 Act (the “Plans”) which require the payment of a monthly service fee to the Distributor at the maximum annual rate of 0.25% of the average daily net assets attributable to Class A, Class B and Class C shares of the Fund. The Plans also require the payment of a monthly distribution fee to the Distributor at the maximum annual rate of 0.75% of the average daily net assets attributable to Class B and Class C shares only.
The CDSC and the distribution fees received from the Plans are used principally as repayment to the Distributor for amounts paid by the Distributor to dealers who sold such shares.
Fee Waivers and Expense Reimbursements
Columbia has voluntarily agreed to reimburse a portion of the Fund’s expenses so that the Fund’s ordinary operating expenses (excluding any distribution and service fees, brokerage commissions, interest, taxes and extraordinary expenses, but including custodian charges relating to overdrafts, if any), after giving effect to any balance credits from the Fund’s custodian, do not exceed 1.15% of the Fund’s average daily net assets on an annualized basis. Columbia, in its discretion, may revise or discontinue this arrangement at any time.
26
Columbia World Equity Fund
March 31, 2010
Fees Paid to Officers and Trustees
All officers of the Fund are employees of Columbia or its affiliates and, with the exception of the Fund’s Chief Compliance Officer, receive no compensation from the Fund. The Board of Trustees has appointed a Chief Compliance Officer to the Fund in accordance with federal securities regulations. The Fund, along with other affiliated funds, pays its pro-rata share of the expenses associated with the Chief Compliance Officer. The Fund’s expenses for the Chief Compliance Officer will not exceed $15,000 per year.
Trustees are compensated for their services to the Fund, as set forth on the Statement of Operations. The Trust’s eligible Trustees may participate in a deferred compensation plan which may be terminated at any time. Obligations of the plan will be paid solely out of the Fund’s assets.
Note 5. Custody Credits
The Fund has an agreement with its custodian bank under which custody fees may be reduced by balance credits. These credits are recorded as part of expense reductions on the Statement of Operations. The Fund could have invested a portion of the assets utilized in connection with the expense offset arrangement in an income-producing asset if it had not entered into such an agreement. For the year ended March 31, 2010, these custody credits reduced total expenses by $2 for the Fund.
Note 6. Objectives and Strategies for Investing in Derivative Instruments
The Fund uses derivatives instruments including options and forward foreign currency exchange contracts in order to meet its investment objectives. The Fund employs strategies in differing combinations to permit it to increase, decrease or change the level of exposure to market risk factors. The achievement of any strategy relating to derivatives depends on an analysis of various risk factors, and if the strategies for the use of derivatives do not work as intended, the Fund may not achieve its investment objectives.
In pursuit of its investment objectives, the Fund is exposed to the following market risks:
Equity Risk: Equity risk relates to change in value of equity securities such as common stocks due to general market conditions such as real or perceived adverse economic conditions, changes in the general outlook for corporate earnings, or adverse investor sentiment. Equity securities generally have greater price volatility than fixed income securities.
Foreign Exchange Rate Risk: Foreign exchange rate risk relates to the change in the U.S. dollar value of a security held that is denominated in a foreign currency. The U.S. dollar value of a foreign-currency-denominated security will decrease as the dollar appreciates against the currency, while the U.S. dollar value will increase as the dollar depreciates against the currency.
The following notes provide more detailed information about each derivative type held by the Fund.
Forward Foreign Currency Exchange Contracts — The Fund entered into forward foreign currency exchange contracts for the purpose of shifting foreign currency exposure back to U.S. dollars.
The Fund used forward contracts to shift its U.S. dollar exposure in order to achieve a representative weighted mix of major currencies in its benchmark and/or to recover an underweight country exposure in its portfolio.
The Fund entered into forward foreign currency exchange contracts to shift its investment exposure from one currency to another.
Forward foreign currency exchange contracts are agreements to exchange one currency for another at a future date at a specified price. These contracts are used to minimize the exposure to foreign exchange rate fluctuations during the period between the trade and settlement dates of the contract. The Fund may utilize forward foreign currency exchange contracts in connection with the settlement of purchases and sales of securities. The Fund may also enter into these contracts to reduce the exposure to adverse price movements in certain other foreign-currency-denominated assets. Contracts to buy generally are used to acquire exposure to foreign currencies, while contracts to sell are generally used to reduce the exposure to foreign exchange rate fluctuations. Forward foreign currency exchange contracts are valued daily at the current exchange rate of the underlying currency, resulting in unrealized gains (losses) which become realized at the time the forward foreign currency exchange contracts are closed or mature. Realized and unrealized gains (losses) arising from such transactions are included in net realized and unrealized gains (losses) on foreign currency
27
Columbia World Equity Fund
March 31, 2010
transactions. The use of forward foreign currency exchange contracts does not eliminate fluctuations in the prices of the Fund’s portfolio securities. While the maximum potential loss from such contracts is the aggregate face value in U.S. dollars at the time the contract was opened, exposure is typically limited to the change in value of the contract (in U.S. dollars) over the period it remains open. The Fund could also be exposed to risk that counterparties of the contracts may be unable to fulfill the terms of the contracts.
During the year ended March 31, 2010, the Fund entered into 278 forward foreign currency exchange contracts.
Options — The Fund had written covered call options to decrease the Fund’s exposure to equity risk and to increase return on instruments. Written covered call options becomes more valuable as the price of the underlying instruments depreciates relative to the strike price.
Writing put options tends to increase the Fund’s exposure to the underlying instrument. When the Fund writes a call or put option, an amount equal to the premium received is recorded as a liability and subsequently marked-to-market to reflect the current value of the option written. Premiums received from writing options which expire are treated as realized gains. Premiums received from writing options which are exercised or closed are added to the proceeds or offset against the amounts paid on the underlying security transaction to determine the realized gain or loss. The Fund, as a writer of an option, has no control over whether the underlying security may be sold (call) or purchased (put) and as a result bears the market risk of an unfavorable change in the price of the security underlying the written option. There is the risk that the Fund may not be able to enter into a closing transaction because of an illiquid market. The Fund identifies within its portfolio of investments cash or liquid portfolio securities equal to the amount of the written options contract commitment.
The Fund may also purchase put and call options. Purchasing call options tends to increase the Fund’s exposure to the underlying instrument. Purchasing put options tends to decrease the Fund’s exposure to the underlying instrument. The Fund may pay a premium, which is included in the Fund’s Statement of Assets and Liabilities as an investment and subsequently marked-to-market to reflect the current value of the option. The risk associated with purchasing put and call options is limited to the premium paid. Premiums paid for purchasing options which expire are treated as realized losses. Premiums paid for purchasing options which are exercised are added to the amounts paid (call) or offset against the proceeds (put) on the underlying security to determine the realized gain or loss. If the Fund enters into a closing transaction, the Fund will realize a gain or loss, depending on whether the proceeds from the closing transaction are greater or less than the cost of the option.
During the year ended March 31, 2010, the Fund did not enter into any written option contracts.
The following table is a summary of the value of the Fund’s derivative instruments as of March 31, 2010.
| | | | | | | | | | |
| | | Fair Value of Derivative Instruments |
| | | Statement of Assets and
Liabilities |
| | | Asset | | Fair Value | | Liability | | Fair Value |
Forward Foreign Currency | | | | | | | | | | |
Exchange Contracts | | Unrealized
appreciation | | $ | 87,085 | | Unrealized
depreciation | | $ | 216,665 |
The effect of derivative instruments on the Fund’s Statement of Operations for the year ended March 31, 2010:
| | | | | | | | | |
| | | Amount of Realized Gain or
(Loss) and Change in
Unrealized Appreciation or
(Depreciation) on
Derivatives Recognized in
Income | |
| | | Risk
Exposure | | Net
Realized
Gain | | Change in
Unrealized
Appreciation
(Depreciation) | |
Written Call Options | | Equity | | $ | 7,562 | | $ | (6,422 | ) |
Forward Foreign Currency Exchange Contracts | | Foreign
Exchange
Rate | | | 181,372 | | | (19,081 | ) |
Total | | | | $ | 188,934 | | $ | (25,503 | ) |
Note 7. Portfolio Information
For the year ended March 31, 2010, the cost of purchases and proceeds from sales of securities, excluding short-term obligations, for the Fund were $43,035,991 and $47,849,785, respectively.
Note 8. Redemption Fees
Effective March 1, 2010, the Fund no longer assesses a 2.00% redemption fee on the proceeds from Fund shares that are
28
Columbia World Equity Fund
March 31, 2010
redeemed within 60 days of purchase. The redemption fee was designed to offset brokerage commissions and other costs associated with short term trading of fund shares. The redemption fees, which were retained by the Fund, were accounted for as an addition to paid-in capital and were allocated to each class based on the relative net assets at the time of the redemption. For the year ended March 31, 2010, the redemption fees for Class A, Class B and Class C shares of the Fund amounted to $696, $16 and $11, respectively.
Note 9. Regulatory Settlements
As of March 31, 2010, the Fund was entitled to receive payments of $81,783 relating to certain regulatory settlements the Fund had participated in during the year. The payments have been included in “Increase from regulatory settlements” on the Statement of Changes in Net Assets.
Note 10. Line of Credit
The Fund and other affiliated funds participate in a $280,000,000 committed, unsecured revolving line of credit provided by State Street. The maximum amount that may be borrowed by any fund is limited to the lesser of $200,000,000 and the Fund’s borrowing limit set forth in the Fund’s registration statement. Borrowings are available for short-term liquidity or temporary or emergency purposes.
Effective October 15, 2009, interest is charged to each participating fund based on the fund’s borrowings at a rate per annum equal to the greater of the Federal Funds Rate plus 1.25% or the overnight LIBOR Rate plus 1.25%. In addition, a commitment fee of 0.15% per annum is accrued and apportioned among the participating funds pro rata based on their relative net assets.
Prior to October 15, 2009, interest was charged to each participating fund based on the fund’s borrowings at a rate per annum equal to the greater of the Federal Funds Rate plus 0.50% or the overnight LIBOR Rate plus 0.50%. In addition, an annual operations agency fee of $20,000, an amendment fee of 0.02% and a commitment fee of 0.12% per annum were accrued and apportioned among the participating funds pro rata based on their relative net assets.
For the year ended March 31, 2010, the Fund did not borrow under these arrangements.
Note 11. Shares of Beneficial Interest
As of March 31, 2010, the Fund had one shareholder that held 5.3% of the shares outstanding, over which BOA and/or any of its affiliates did not have investment discretion. On that date, no other shareholders owned more than 5% of the outstanding shares of the Fund.
Subscription and redemption activity of these accounts may have a significant effect on the operations of the Fund.
Note 12. Significant Risks and Contingencies
Foreign Securities Risk
There are certain additional risks involved when investing in foreign securities. These risks may involve foreign currency exchange rate fluctuations, adverse political and economic developments and the possible prevention of currency exchange or other foreign governmental laws or restrictions. In addition, the liquidity of foreign securities may be more limited than that of domestic securities.
Investments in emerging market countries are subject to additional risk. The risk of foreign investments is typically increased in less developed countries. These countries are also more likely to experience high levels of inflation, deflation or currency devaluation which could hurt their economies and securities markets.
Information Regarding Pending and Settled Legal Proceedings
In June 2004, an action captioned John E. Gallus et al. v. American Express Financial Corp. and American Express Financial Advisors Inc. was filed in the United States District Court for the District of Arizona. The plaintiffs allege that they are investors in several American Express Company (now known as RiverSource) mutual funds and they purport to bring the action derivatively on behalf of those funds under the Investment Company Act of 1940. The plaintiffs allege that fees allegedly paid to the defendants by the funds for investment advisory and administrative services are excessive. The plaintiffs seek remedies including restitution and rescission of investment advisory and distribution agreements. The plaintiffs voluntarily agreed to transfer this case to the United States District Court for the District of Minnesota (the District Court). In response to defendants’ motion to dismiss the complaint, the District Court dismissed one of plaintiffs’ four claims and granted plaintiffs limited
29
Columbia World Equity Fund
March 31, 2010
discovery. Defendants moved for summary judgment in April 2007. Summary judgment was granted in the defendants’ favor on July 9, 2007. The plaintiffs filed a notice of appeal with the Eighth Circuit Court of Appeals (the Eighth Circuit) on August 8, 2007. On April 8, 2009, the Eighth Circuit reversed summary judgment and remanded to the District Court for further proceedings. On August 6, 2009, defendants filed a writ of certiorari with the U.S. Supreme Court (the Supreme Court), asking the Supreme Court to stay the District Court proceedings while the Supreme Court considers and rules in a case captioned Jones v. Harris Associates, which involves issues of law similar to those presented in the Gallus case. On March 30, 2010, the Supreme Court issued its ruling in Jones v. Harris Associates, and on April 5, 2010, the Supreme Court vacated the Eighth Circuit’s decision in the Gallus case and remanded the case to the Eighth Circuit for further consideration in light of the Supreme Court’s decision in Jones v. Harris Associates.
In December 2005, without admitting or denying the allegations, American Express Financial Corporation (AEFC, which is now known as Ameriprise Financial, Inc. (Ameriprise Financial)), entered into settlement agreements with the Securities and Exchange Commission (SEC) and Minnesota Department of Commerce (MDOC) related to market timing activities. As a result, AEFC was censured and ordered to cease and desist from committing or causing any violations of certain provisions of the Investment Advisers Act of 1940, the Investment Company Act of 1940, and various Minnesota laws. AEFC agreed to pay disgorgement of $10 million and civil money penalties of $7 million. AEFC also agreed to retain an independent distribution consultant to assist in developing a plan for distribution of all disgorgement and civil penalties ordered by the SEC in accordance with various undertakings detailed at http://www.sec.gov/litigation/admin/ia-2451.pdf. Ameriprise Financial and its affiliates have cooperated with the SEC and the MDOC in these legal proceedings, and have made regular reports to the RiverSource Funds’ Boards of Directors/Trustees.
On November 7, 2008, RiverSource Investments, LLC, a subsidiary of Ameriprise Financial, Inc., acquired J. & W. Seligman & Co. Incorporated (Seligman). In late 2003, Seligman conducted an extensive internal review concerning mutual fund trading practices. Seligman’s review, which covered the period 2001-2003, noted one arrangement that permitted frequent trading in certain open-end registered investment companies managed by Seligman (the Seligman Funds); this arrangement was in the process of being closed down by Seligman before September 2003. Seligman identified three other arrangements that permitted frequent trading, all of which had been terminated by September 2002. In January 2004, Seligman, on a voluntary basis, publicly disclosed these four arrangements to its clients and to shareholders of the Seligman Funds. Seligman also provided information concerning mutual fund trading practices to the SEC and the Office of the Attorney General of the State of New York (NYAG).
In September 2006, the NYAG commenced a civil action in New York State Supreme Court against Seligman, Seligman Advisors, Inc. (now known as RiverSource Fund Distributors, Inc.), Seligman Data Corp. and Brian T. Zino (collectively, the Seligman Parties), alleging, in substance, that the Seligman Parties permitted various persons to engage in frequent trading and, as a result, the prospectus disclosure used by the registered investment companies then managed by Seligman was and had been misleading. The NYAG included other related claims and also claimed that the fees charged by Seligman to the Seligman Funds were excessive. On March 13, 2009, without admitting or denying any violations of law or wrongdoing, the Seligman Parties entered into a stipulation of settlement with the NYAG and settled the claims made by the NYAG. Under the terms of the settlement, Seligman paid $11.3 million to four Seligman Funds. This settlement resolved all outstanding matters between the Seligman Parties and the NYAG. In addition to the foregoing matter, the New York staff of the SEC indicated in September 2005 that it was considering recommending to the Commissioners of the SEC the instituting of a formal action against Seligman and Seligman Advisors, Inc. relating to frequent trading in the Seligman Funds. Seligman responded to the staff in October 2005 that it believed that any action would be both inappropriate and unnecessary, especially in light of the fact that Seligman had previously resolved the underlying issue with the Independent Directors of the Seligman Funds and made recompense to the affected Seligman Funds. There have been no further developments with the SEC on this matter.
Ameriprise Financial and certain of its affiliates have historically been involved in a number of legal, arbitration and regulatory proceedings, including routine litigation, class
30
Columbia World Equity Fund
March 31, 2010
actions, and governmental actions, concerning matters arising in connection with the conduct of their business activities. Ameriprise Financial believes that the Funds are not currently the subject of, and that neither Ameriprise Financial nor any of its affiliates are the subject of, any pending legal, arbitration or regulatory proceedings that are likely to have a material adverse effect on the Funds or the ability of Ameriprise Financial or its affiliates to perform under their contracts with the Funds. Ameriprise Financial is required to make 10-Q, 10-K and, as necessary, 8-K filings with the Securities and Exchange Commission on legal and regulatory matters that relate to Ameriprise Financial and its affiliates. Copies of these filings may be obtained by accessing the SEC website at www.sec.gov.
There can be no assurance that these matters, or the adverse publicity associated with them, will not result in increased fund redemptions, reduced sale of fund shares or other adverse consequences to the Funds. Further, although we believe proceedings are not likely to have a material adverse effect on the Funds or the ability of Ameriprise Financial or its affiliates to perform under their contracts with the Funds, these proceedings are subject to uncertainties and, as such, we are unable to estimate the possible loss or range of loss that may result. An adverse outcome in one or more of these proceedings could result in adverse judgments, settlements, fines, penalties or other relief that could have a material adverse effect on the consolidated financial condition or results of operations of Ameriprise Financial.
Note 13. Subsequent Events
In connection with the preparation of the financial statements of the Fund as of and for the fiscal year ended March 31, 2010, events and transactions through the date the financial statements were issued have been evaluated by the Fund’s management for possible adjustment and/or disclosure. No subsequent events or transactions have occurred that would require adjustment of the financial statements as presented. On April 30, 2010, the Transaction disclosed in Note 4 closed. Effective May 1, 2010, the New Advisor became the investment advisor and administrator of the Fund and subsequently changed its name to Columbia Management Investment Advisers, LLC. On that date, the New Transfer Agent became the transfer agent of the Fund and changed its name to Columbia Management Investment Services Corp. Also on that date, the New Distributor became the distributor of the Fund and changed its name to Columbia Management Investment Distributors, Inc.
31
Report of Independent Registered Public Accounting Firm
To the Trustees of Columbia Funds Series Trust I and the Shareholders of Columbia World Equity Fund
In our opinion, the accompanying statement of assets and liabilities, including the investment portfolio, and the related statements of operations and of changes in net assets and the financial highlights present fairly, in all material respects, the financial position of Columbia World Equity Fund (the “Fund”) (a series of Columbia Funds Series Trust I) at March 31, 2010, and the results of its operations, the changes in its net assets and the financial highlights for the periods indicated, in conformity with accounting principles generally accepted in the United States of America. These financial statements and financial highlights (hereafter referred to as “financial statements”) are the responsibility of the Fund’s management. Our responsibility is to express an opinion on these financial statements based on our audits. We conducted our audits of these financial statements in accordance with the standards of the Public Company Accounting Oversight Board (United States). Those standards require that we plan and perform the audit to obtain reasonable assurance about whether the financial statements are free of material misstatement. An audit includes examining, on a test basis, evidence supporting the amounts and disclosures in the financial statements, assessing the accounting principles used and significant estimates made by management, and evaluating the overall financial statement presentation. We believe that our audits, which included confirmation of securities at March 31, 2010 by correspondence with the custodian and brokers, provide a reasonable basis for our opinion.
PricewaterhouseCoopers LLP
Boston, Massachusetts
May 21, 2010
32
Federal Income Tax Information (Unaudited) – Columbia World Equity Fund
Foreign taxes paid during the fiscal year ended March 31, 2010, of $83,454 ($0.02 per share) are being passed through to shareholders. Eligible shareholders may claim this amount as a foreign tax credit.
Gross income derived from sources within foreign countries amounted to $624,653 ($0.13 per share) for the fiscal year ended March 31, 2010.
32.24% of the ordinary income distributed by the Fund for the fiscal year ended March 31, 2010, qualifies for the corporate dividends received deduction.
For non-corporate shareholders 34.99%, or the maximum amount allowable under the Jobs and Growth Tax Relief Reconciliation Act of 2003, of ordinary income distributed by the Fund for the fiscal year ended March 31, 2010 may represent qualified dividend income.
The Fund will notify shareholders in January 2011 of amounts for use in preparing 2010 income tax returns.
33
Fund Governance
The Trustees serve terms of indefinite duration. The names, addresses and ages of the Trustees and Officers of the Funds in Columbia Funds Series Trust I, the year each was first elected or appointed to office, their principal business occupations during at least the last five years, the number of Funds overseen by each Trustee and other directorships they hold are shown below. Each officer listed below serves as an officer of each Fund in the Columbia Funds Complex.
Independent Trustees
| | |
Name, Address and Year of
Birth, Position with Funds, Year
First Elected or Appointed to Office | | Principal Occupation(s) During Past Five Years, Number of Funds in the
Columbia Funds Complex Overseen by Trustee, Other Directorships Held |
| |
| John D. Collins (Born 1938) | | |
c/o Columbia Management Advisors, LLC One Financial Center Boston, MA 02111 Trustee (since 2005) | | Retired. Consultant, KPMG, LLP (accounting and tax firm) from July 1999 to June 2000; Partner, KPMG, LLP from March 1962 to June 1999. Oversees 65; Mrs. Fields Famous Brands LLC (consumer products); Suburban Propane Partners, L.P.; and Montpelier Re (insurance underwriting firm) |
| |
| Rodman L. Drake (Born 1943) | | |
c/o Columbia Management Advisors, LLC One Financial Center Boston, MA 02111 Trustee (since 1994) and Chairman of the Board (since 2009) | | Co-Founder of Baringo Capital LLC (private equity) since 2002; CEO of Crystal River Capital Inc. (real estate investment trust) since 2003; President, Continuation Investments Group, Inc. from 1997 to 2001. Oversees 65; Jackson Hewitt Tax Service Inc. (tax preparation services); Crystal Capital River Inc. (real estate investment trust); Student Loan Corporation (student loan provider); Celgene Corporation (global biotechnology company); and The Helios Funds (exchange-traded funds) |
| |
| Douglas A. Hacker (Born 1955) | | |
c/o Columbia Management Advisors, LLC One Financial Center Boston, MA 02111 Trustee (since 1996) | | Independent business executive since May 2006; Executive Vice President–Strategy of United Airlines (airline) from December 2002 to May 2006; President of UAL Loyalty Services (airline marketing company) from September 2001 to December 2002; Executive Vice President and Chief Financial Officer of United Airlines from July 1999 to September 2001. Oversees 65; Nash Finch Company (food distributor); Aircastle Limited (aircraft leasing) |
|
| Janet Langford Kelly (Born 1957) |
c/o Columbia Management Advisors, LLC One Financial Center Boston, MA 02111 Trustee (since 1996) | | Senior Vice President, General Counsel and Corporate Secretary, ConocoPhillips (integrated energy company) since September 2007; Deputy General Counsel–Corporate Legal Services, ConocoPhillips from August 2006 to August 2007; Partner, Zelle, Hofmann, Voelbel, Mason & Gette LLP (law firm) from March 2005 to July 2006; Adjunct Professor of Law, Northwestern University, from September 2004 to June 2006; Director, UAL Corporation (airline) from February 2006 to July 2006; Oversees 65; None |
| |
| Charles R. Nelson (Born 1942) | | |
c/o Columbia Management Advisors, LLC One Financial Center Boston, MA 02111 Trustee (since 1981) | | Professor of Economics, University of Washington, since January 1976; Ford and Louisa Van Voorhis Professor of Political Economy, University of Washington, since September 1993; Adjunct Professor of Statistics, University of Washington, since September 1980; Associate Editor, Journal of Money Credit and Banking, 1993-2008 Consultant on econometric and statistical matters. Oversees 65; None |
34
Fund Governance (continued)
Independent Trustees (continued)
| | |
Name, Address and Year of
Birth, Position with Funds, Year
First Elected or Appointed to Office | | Principal Occupation(s) During Past Five Years, Number of Funds in the
Columbia Funds Complex Overseen by Trustee, Other Directorships Held |
| |
| John J. Neuhauser (Born 1943) | | |
c/o Columbia Management Advisors, LLC One Financial Center Boston, MA 02111 Trustee (since 1984) | | President, Saint Michael’s College, since August 2007; University Professor, Boston College from November 2005 to August 2007; Academic Vice President and Dean of Faculties, Boston College from August 1999 to October 2005. Oversees 65; Liberty All-Star Equity Fund and Liberty All-Star Growth Fund, Inc. (closed-end funds) |
| |
| Jonathan Piel (Born 1938) | | |
c/o Columbia Management Advisors, LLC One Financial Center Boston, MA 02111 Trustee (since 1994) | | Cable television producer and website designer; The Editor, Scientific American from 1984 to 1994; Vice President, Scientific American, Inc., from 1984 to 1994; Member, Advisory Board, Stone Age Institute, Bloomington, Indiana (research institute that explores the effect of technology on human evolution); Member, Board of Directors of the National Institute of Social Sciences, New York City; Member, Board of Trustees of the William Alanson White Institute, New York City (institution for training psychoanalysts); and Member, Advisory Board, Mount Sinai Children’s Environmental Health Center, New York. Oversees 65; None |
| |
| Patrick J. Simpson (Born 1944) | | |
c/o Columbia Management Advisors, LLC One Financial Center Boston, MA 02111 Trustee (since 2000) | | Partner, Perkins Coie LLP (law firm). Oversees 65; None |
| |
| Anne-Lee Verville (Born 1945) | | |
c/o Columbia Management Advisors, LLC One Financial Center Boston, MA 02111 Trustee (since 1998) | | Retired since 1997 (formerly General Manager–Global Education Industry (from 1994 to 1997), President–Application Systems Division (from 1991 to 1994), Chief Financial Officer–US Marketing & Services (from 1988 to 1991), and Chief Information Officer (from 1987 to 1988), IBM Corporation (computer and technology)). Oversees 65; None |
35
Fund Governance (continued)
Interested Trustee
| | |
Name, Address and Year of Birth,
Position with Funds, Year First
Elected or Appointed to Office | | Principal Occupation(s) During Past Five Years, Number of Funds in the Columbia
Funds Complex Overseen by Trustee, Other Directorships Held |
| |
| William E. Mayer1 (Born 1940) | | |
c/o Columbia Management Advisors, LLC One Financial Center Boston, MA 02111 Trustee (since 1994) | | Partner, Park Avenue Equity Partners (private equity) since February 1999; Dean and Professor, College of Business, University of Maryland from 1992 to 1997. Oversees 65; Lee Enterprises (print media), WR Hambrecht + Co. (financial service provider); BlackRock Kelso Capital Corporation (investment company) |
| 1 | The Funds currently treat Mr. Mayer as an “interested person” (as defined in the Investment Company Act of 1940) by reason of his affiliation with WR Hambrecht + Co., a registered broker/dealer that may execute portfolio transactions for or engage in principal transactions with the Funds or other funds or accounts advised/managed by the Advisor or other Bank of America affiliates. |
The Statement of Additional Information includes additional information about the Trustees of the Funds and is available, without charge, upon request by calling 1-800-345-6611.
36
Fund Governance (continued)
Officers
| | |
| Name, Year of Birth and Address | | Principal Occupation(s) During the Past Five Years |
| |
| J. Kevin Connaughton (Born 1964) | | |
One Financial Center Boston, MA 02111 President (since 2009) | | Senior Vice President and General Manager–Mutual Fund Products, Columbia Management Investment Advisers, LLC since May 2010; President, Columbia Funds, since 2009, and RiverSource Funds, since May 2010 (previously Senior Vice President and Chief Financial Officer, Columbia Funds, from June 2008 to January 2009, Treasurer, Columbia Funds, from October 2003 to May 2008, and senior officer of various other affiliated funds since 2000); Managing Director, Columbia Management Advisors, LLC from December 2004 to April 2010. |
| |
| Michael G. Clarke (Born 1969) | | |
One Financial Center Boston, MA 02111 Senior Vice President and Chief Financial Officer (since 2009) | | Vice President, Columbia Management Investment Advisers, LLC since May 2010; Managing Director of Fund Administration, Columbia Management Advisors, LLC, from September 2004 to April 2010; senior officer of Columbia Funds and affiliated funds since 2002. |
| |
| Scott R. Plummer (Born 1959) | | |
5228 Ameriprise Financial Center Minneapolis, MN 55474 Senior Vice President, Secretary and Chief Legal Officer (since 2010) | | Chief Legal Officer and Assistant Secretary, Columbia Management Investment Advisers, LLC since June 2005; Vice President and Lead Chief Counsel–Asset Management, Ameriprise Financial, Inc. since May 2010 (previously Vice President and Chief Counsel–Asset Management, from 2005 to April 2010, and Vice President–Asset Management Compliance from 2004 to 2005); Vice President, Chief Counsel and Assistant Secretary, Columbia Management Investment Distributors, Inc. since 2008; Vice President, General Counsel and Secretary, Ameriprise Certificate Company since 2005; Chief Counsel, RiverSource Distributors, Inc. since 2006; Vice President, General Counsel and Secretary, RiverSource Funds, since December 2006; Senior Vice President, Secretary and Chief Legal Officer, Columbia Funds, since May 2010. |
| |
| Linda J. Wondrack (Born 1964) | | |
One Financial Center Boston, MA 02111 Senior Vice President and Chief Compliance Officer (since 2007) | | Vice President and Chief Compliance Officer, Columbia Management Investment Advisers, LLC since May 2010; Chief Compliance Officer, Columbia Funds, since 2007, and RiverSource Funds, since May 2010; Director (Columbia Management Group, LLC and Investment Product Group Compliance), Bank of America, from June 2005 to April 2010; Director of Corporate Compliance and Conflicts Officer of MFS Investment Management (investment management) from August 2004 to May 2005. |
| |
| William F. Truscott (Born 1960) | | |
53600 Ameriprise financial Center Minneapolis, MN 55474 Senior Vice President (since 2010) | | Chairman of the Board, Columbia Management Investment Advisers, LLC since May 2010 (previously President, Chairman of the Board and Chief Investment Officer, from 2001 to April 2010); Chief Executive Officer, U.S. Asset Management & President, Annuities, Ameriprise Financial, Inc. since May 2010 (previously President–U.S. Asset Management and Chief Investment Officer from 2005 to April 2010, and Senior Vice President–Chief Investment Officer, from 2001 to 2005); Director, President and Chief Executive Officer, Ameriprise Certificate Company since 2006; Director, Columbia Management Investment Distributors, Inc. since May 2010 (previously Chairman of the Board and Chief Executive Officer from 2008 to April 2010); Chairman of the Board and Chief Executive Officer, RiverSource Distributors, Inc. since 2006. |
37
Fund Governance (continued)
Officers (continued)
| | |
| Name, Year of Birth and Address | | Principal Occupation(s) During the Past Five Years |
| |
| Colin Moore (Born 1958) | | |
One Financial Center Boston, MA 02111 Senior Vice President (since 2010) | | Director and Chief Investment Officer, Columbia Management Investment Advisers, LLC since May 2010; Manager, Managing Director and Chief Investment Officer of Columbia Management Advisors, LLC from 2007 to April 2010; Head of Equities, Columbia Management Advisors, LLC from 2002 to 2007. |
| |
| Michael A. Jones (Born 1959) | | |
100 Federal Street Boston, MA 02110 Senior Vice President (since 2010) | | Director and President, Columbia Management Investment Advisers, LLC since May 2010; President and Director, Columbia Management Investment Distributors, Inc. since May 2010; Manager, Chairman, Chief Executive Officer and President, Columbia Management Advisors, LLC from 2007 to April 2010; Chief Executive Officer, President and Director, Columbia Management Distributors, Inc. from November 2006 to April 2010; previously, co-president and senior managing director at Robeco Investment Management. |
| |
| Amy Johnson (Born 1965) | | |
5228 Ameriprise Financial Center Minneapolis, MN 55474 Senior Vice President (since 2010) | | Senior Vice President and Chief Operating Officer, Columbia Management Investment Advisers, LLC since May 2010 (previously Chief Administrative Officer, from 2009 until April 2010, Vice President–Asset Management and Trust Company Services, from 2006 to 2009, and Vice President–Operations and Compliance from 2004 to 2006). |
| |
| Joseph F. DiMaria (Born 1968) | | |
One Financial Center Boston, MA 02111 Treasurer (since 2009) and Chief Accounting Officer (since 2008) | | Vice President, Mutual Fund Administration, Columbia Management Investment Advisers, LLC, since May 2010; Director of Fund Administration, Columbia Management Advisors, LLC from January 2006 to April 2010; Head of Tax/Compliance and Assistant Treasurer, Columbia Management Advisors, LLC, from November 2004 to December 2005. |
| |
| Marybeth Pilat (Born 1968) | | |
One Financial Center Boston, MA 02111 Deputy Treasurer (since 2010) | | Vice President, Mutual Fund Administration, Columbia Management Investment Advisers, LLC, since May 2010; Vice President, Investment Operations, Bank of America, from October 2008 to April 2010; Finance Manager, Boston Children’s Hospital from August 2008 to October 2008; Director, Mutual Fund Administration, Columbia Management Advisors, LLC, from May 2007 to July 2008; Vice President, Mutual Fund Valuation, Columbia Management Advisors, LLC, from January 2006 to May 2007; Vice President, Mutual Fund Accounting Oversight, Columbia Management Advisors, LLC from January 2005 to January 2006. |
| |
| Julian Quero (Born 1967) | | |
One Financial Center Boston, MA 02111 Deputy Treasurer (since 2008) | | Vice President, Mutual Fund Administration, Columbia Management Investment Advisers, LLC since May 2010; Director of Fund Administration, Columbia Management Advisors, LLC, from August 2008 to April 2010; Senior Tax Manager, Columbia Management Advisors, LLC from August 2006 to July 2008; Senior Compliance Manager, Columbia Management Advisors, LLC from April 2002 to August 2006. |
| |
| Stephen T. Welsh (Born 1957) | | |
One Financial Center Boston, MA 02111 Vice President (since 2006) | | President and Director, Columbia Management Investment Services Corp. since May 2010; President and Director, Columbia Management Services, Inc. from July 2004 to April 2010; Managing Director, Columbia Management Distributors, Inc. from August 2007 to April 2010. |
38
Board Consideration and Approval of Advisory Agreements
The Advisory Fees and Expenses Committee of the Board of Trustees meets several times annually to review the current advisory agreements (collectively, the “Agreements”) of the funds for which the Trustees serve as trustees (each a “fund”) and to determine whether to recommend that the full Board approve the continuation of the Agreements for an additional one-year period. After the Committee has made its recommendation, the full Board, including the Independent Trustees, determines whether to approve the continuation of the Agreements. In addition, the full Board, including the Independent Trustees, considers matters bearing on the Agreements at most of its other meetings throughout the year and meets regularly with senior management of the funds and Columbia, the funds’ investment adviser, including the senior manager of each investment area within Columbia. Through the Board’s Investment Oversight Committees, Trustees also meet with selected fund portfolio managers, research analysts and traders at various times throughout the year.
The Trustees receive and review all materials that they, their legal counsel or Columbia believe to be reasonably necessary for the Trustees to evaluate the Agreements and to determine whether to approve the continuation of the Agreements. Those materials generally include, among other items, (i) information on the investment performance of each fund relative to the performance of peer groups of mutual funds and the fund’s performance benchmarks, and additional information assessing performance on a risk-adjusted basis, (ii) information on each fund’s advisory fees and other expenses, including information comparing the fund’s expenses to those of peer groups of mutual funds and information about any applicable expense caps and fee “breakpoints,” (iii) information about the profitability of the Agreements to Columbia, including potential “fall-out” or ancillary benefits that Columbia and its affiliates may receive as a result of their relationships with the funds and (iv) information obtained through Columbia’s response to a questionnaire prepared at the request of the Trustees by counsel to the funds and independent legal counsel to the Independent Trustees. The Trustees also consider other information such as (v) Columbia’s financial results and financial condition, (vi) each fund’s investment objective and strategies and the size, education and experience of Columbia’s investment staffs and their use of technology, external research and trading cost measurement tools, (vii) the allocation of the funds’ brokerage and the use of “soft” commission dollars to pay for research products and services, (viii) Columbia’s resources devoted to, and its record of compliance with, the funds’ investment policies and restrictions, policies on personal securities transactions and other compliance policies and legal and regulatory requirements, (ix) Columbia’s response to various legal and regulatory proceedings since 2003 and to the recent period of volatility in the securities markets and (x) the economic outlook generally and for the mutual fund industry in particular. In addition, the Advisory Fees and Expenses Committee confers with the independent fee consultant (the “Fee Consultant”) appointed by the Independent Trustees pursuant to an assurance of discontinuance entered into by Columbia with the New York Attorney General (“NYAG”) to settle a civil complaint filed by the NYAG relating to trading in mutual fund shares (the “NYAG Settlement”) and reviews materials relating to the funds’ relationships with Columbia provided by the Fee Consultant. Under the NYAG Settlement, the Fee Consultant’s role is to manage the process by which management fees are negotiated so that they are negotiated in a manner that is at arms’ length and reasonable. Throughout the process, the Trustees have the opportunity to ask questions of and to request additional materials from Columbia and to consult with the Fee Consultant and independent legal counsel to the Independent Trustees.
The Board of Trustees most recently approved the continuation of the Agreements at its October, 2009 meeting, following meetings of the Advisory Fees and Expenses Committee held in December, 2008 and February, May, June, August, September and October, 2009.
The Board of Trustees also unanimously approved new advisory agreements (the “New Agreements”) for the funds with RiverSource Investments, LLC (to be renamed Columbia Management Investment Advisers, LLC) (“RiverSource”) at a meeting held on December 17, 2009. The New Agreements have since been approved by shareholders of the funds and are expected to take effect upon the closing of the acquisition of the long-term asset management business of Columbia by Ameriprise Financial, Inc. (“Ameriprise”), the parent company of RiverSource Investments, LLC (the “Transaction”).
The Advisory Fees and Expenses Committee met on multiple occasions to review the New Agreements for the funds. On
39
December 14, 2009, the Advisory Fees and Expenses Committee recommended that the full Board approve the New Agreements. On December 17, 2009, the full Board, including a majority of the Independent Trustees, approved the New Agreements. Prior to their approval of the New Agreements, the Advisory Fees and Expenses Committee and the Independent Trustees requested and evaluated materials from, and were provided materials and information about the Transaction and matters related to the proposals by, Bank of America Corp., Columbia, RiverSource and Ameriprise. In connection with their most recent approval of the Agreements (as discussed above) on October 28, 2009, the Advisory Fees and Expenses Committee and the Trustees requested and evaluated materials from Columbia, and discussed such materials with representatives of Columbia. The Advisory Fees and Expenses Committee, at meetings held on August 11, 2009, September 23, 2009, October 27, 2009, November 30, 2009, December 7, 2009 and December 14, 2009, and the Independent Trustees, at meetings held on August 12, 2009, August 20, 2009, October 28, 2009, December 8, 2009, December 14, 2009 and December 17, 2009, discussed the materials provided in connection with the October 28, 2009 approvals and the materials provided in connection with their consideration of the New Agreements and other matters relating to the Transaction with representatives of Bank of America Corp., Columbia, RiverSource and Ameriprise. The Trustees consulted with experienced legal counsel, who advised on the legal standards for consideration by the Trustees. The Independent Trustees also discussed the proposed approvals with independent legal counsel in private sessions.
The Trustees reviewed each New Agreement, as well as certain information obtained through RiverSource’s responses to initial and supplemental questionnaires prepared at the request of the Trustees by counsel to the funds and independent legal counsel to the Independent Trustees. The Advisory Fees and Expenses Committee and the Trustees also met with, and reviewed and considered a report prepared and provided by, the Fee Consultant (as discussed above).
In considering whether to approve the New Agreements and to approve the continuation of the Agreements, the Trustees, including the Independent Trustees, did not identify any single factor as determinative, and each weighed various factors as he or she deemed appropriate. In particular, the Trustees considered the following matters:
Matters Relating to the Agreements and the New Agreements
The nature, extent and quality of the services provided or to be provided to the funds under the Agreements and the New Agreements. The Trustees considered the nature, extent and quality of the services provided and the resources dedicated by Columbia and its affiliates (or to be provided and dedicated by RiverSource and its affiliates) to the funds.
Among other things, the Trustees considered, with respect to Columbia and its affiliates, (i) Columbia’s ability (including its personnel and other resources, compensation programs for personnel involved in fund management, reputation and other attributes) to attract, motivate and retain highly qualified research, advisory and supervisory investment professionals; (ii) the portfolio management services provided by those investment professionals; and (iii) the trade execution services provided on behalf of the funds. For each fund, the Trustees also considered the benefits to shareholders of investing in a mutual fund that is part of a family of funds offering exposure to a variety of asset classes and investment disciplines and providing a variety of fund and shareholder services.
Among other things, the Trustees considered, with respect to RiverSource and its affiliates, (i) the expected effect of the Transaction on the operations of the funds, (ii) the information provided by RiverSource with respect to the nature, extent and quality of services to be provided by it, (iii) RiverSource’s compliance program and compliance record, (iv) the ability of RiverSource (including personnel and other resources, compensation programs for personnel involved in fund management, reputation and other attributes) to attract, motivate and retain highly qualified research, advisory and supervisory investment professionals, (v) the trade execution services to be provided on behalf of the funds and (vi) the quality of RiverSource’s investment research capabilities and the other resources that it indicated it would devote to each fund. As noted above, the Trustees also considered RiverSource’s representations that the Chief Investment Officer of Columbia would serve as the Chief Investment Officer of RiverSource following the Transaction, and that the process for determining the portfolio
40
management team for each Fund would be substantially the same process as has customarily been followed by Columbia, and reported to the Trustees, in evaluating the performance of Columbia’s portfolio management teams. The Trustees also noted the professional experience and qualifications of the senior personnel of RiverSource. The Trustees also considered the compliance programs of and the compliance-related resources proposed to be provided to the funds by RiverSource and its affiliates, including discussions with the funds’ Chief Compliance Officer regarding RiverSource’s compliance program. The Trustees also discussed RiverSource’s compliance program with the Chief Compliance Officer for the RiverSource funds. The Trustees also considered RiverSource’s representation that the funds’ Chief Compliance Officer would serve as the Chief Compliance Officer of RiverSource following the Transaction. The Trustees considered RiverSource’s ability to provide administrative services to the funds, noting that while some Agreements contemplated the provision of certain administrative services, following the Transaction, all administrative services were anticipated to be provided pursuant to a new administrative services agreement. The Trustees also considered RiverSource’s ability to coordinate the activities of each fund’s other service providers. The Trustees considered performance information provided by RiverSource with respect to other mutual funds advised by RiverSource, and discussed with senior executives of RiverSource its process for identifying which portfolio management teams of the legacy Columbia and RiverSource organizations would be responsible for the management of the funds following the Transaction.
After reviewing those and related factors, the Trustees concluded, within the context of their overall conclusions, that the nature, extent and quality of services provided by Columbia supported the continuation of the Agreements, and that the nature, extent and quality of services expected to be provided by RiverSource supported approval of the New Agreements.
The costs of the services provided and profits realized by Columbia and its affiliates, and the expected costs of the services to be provided and the profits expected to be realized by RiverSource and its affiliates, from their relationships with the funds. With respect to Columbia and its affiliates, the Trustees considered the fees charged to the funds for advisory services as well as the total expense levels of the funds. That information included comparisons (provided by management and by an independent third-party data provider) of each fund’s advisory fees and total expense levels to those of the fund’s peer groups and information about the advisory fees charged by Columbia to comparable institutional accounts. In considering the fees charged to those accounts, the Trustees took into account, among other things, management’s representations about the differences between managing mutual funds as compared to other types of accounts, including differences in the services provided, differences in the risk profile of such business for Columbia, and the additional resources required to manage mutual funds effectively. In evaluating each fund’s advisory fees, the Trustees also took into account the demands, complexity and quality of the investment management of the fund. The Trustees considered existing advisory fee breakpoints, and Columbia’s use of advisory fee waivers and expense caps, which benefited a number of the funds. The Trustees also noted management’s stated justification for the fees charged to the funds, which included information about the investment performance of the funds and the services provided to the funds.
The Trustees considered that Columbia World Equity Fund’s total expenses were in the second quintile and actual management fees were in the first quintile (where the lowest fees and expenses would be in the first quintile) of the peer group selected by an independent third-party data provider for purposes of expense comparisons.
The Trustees also considered the compensation directly or indirectly received by Columbia and its affiliates from their relationships with the funds. The Trustees reviewed information provided by management as to the profitability to Columbia and its affiliates of their relationships with each fund, and information about the allocation of expenses used to calculate profitability. When reviewing profitability, the Trustees also considered court cases in which adviser profitability was an issue in whole or in part, the performance of the relevant funds, the expense level of each fund, and whether Columbia had implemented breakpoints and/or expense caps with respect to the fund.
In connection with the integration of the legacy Columbia and RiverSource organizations, the Trustees considered, among other things, RiverSource’s projected annual net expense synergies (reductions in the cost of providing services to the
41
funds), the timetable over which such synergies are expected to be realized and the extent to which any such synergies are expected to be shared with the funds. The Trustees also considered information provided by RiverSource regarding their respective financial conditions. The Trustees considered that RiverSource proposed to continue voluntary expense caps currently in effect for the funds and that RiverSource had undertaken not to change these caps without further discussion with the Independent Trustees.
After reviewing those and related factors, the Trustees concluded, within the context of their overall conclusions, that the advisory fees charged to each fund, and the related profitability to Columbia and its affiliates of their relationships with the fund, supported the continuation of the Agreement pertaining to that fund, and that the expected profitability to RiverSource and its affiliates from its relationship with each fund supported the approval of the New Agreements.
Economies of Scale. With respect to Columbia and its affiliates, the Trustees considered the existence of any economies of scale in the provision by Columbia of services to each fund, to groups of related funds, and to Columbia’s investment advisory clients as a whole and whether those economies were shared with the funds through breakpoints in the investment advisory fees or other means, such as fee waivers/expense reductions and additional investments by Columbia in investment, trading and compliance resources. The Trustees noted that many of the funds benefited from breakpoints, fee waivers/expense caps, or both. In considering those issues, the Trustees also took note of the costs of the services provided (both on an absolute and a relative basis) and the profitability to Columbia and its affiliates of their relationships with the funds, as discussed above.
With respect to RiverSource and its affiliates, the Trustees considered the existence of any anticipated economies of scale in the provision by RiverSource of services to each fund, to groups of related funds and to RiverSource’s investment advisory clients as a whole, and whether those economies of scale were expected to be shared with the funds. The Trustees considered Ameriprise’s anticipated net expense synergies resulting from the Transaction, and considered the possibility that the funds might benefit from economies of scale over time as part of the larger, combined fund complex. The Trustees considered how expected synergies and potential economies of scale might benefit the funds and their shareholders. The Trustees considered the potential effect of the Transaction on the distribution of the funds, and noted that the proposed management fee schedules for the funds generally contained breakpoints that would reduce the fee rate on assets above specified threshold levels.
After reviewing those and related factors, the Trustees concluded, within the context of their overall conclusions, that the extent to which economies of scale were shared or expected to be shared with the funds supported the continuation of the Agreements and the approval of the New Agreements.
Matters Relating to the Agreements
Investment performance of the funds and Columbia. The Trustees reviewed information about the performance of each fund over various time periods, including information prepared by an independent third-party data provider that compared the performance of each fund to the performance of peer groups of mutual funds and performance benchmarks. The Trustees also reviewed a description of the third party’s methodology for identifying each fund’s peer group for purposes of performance and expense comparisons. The Trustees also considered additional information that the Advisory Fees and Expenses Committee requested from Columbia relating to funds that presented relatively weaker performance and/or relatively higher fees or expenses. In the case of each fund whose performance lagged that of a relevant peer group for certain (although not necessarily all) periods, the Trustees concluded that other factors relevant to performance were sufficient, in light of other considerations, to warrant continuation of the fund’s Agreements. Those factors varied from fund to fund, but included one or more of the following: (i) that the fund’s performance, although lagging in certain recent periods, was stronger over the longer term; (ii) that the underperformance was attributable, to a significant extent, to investment decisions that were reasonable and consistent with the fund’s investment strategy and policies and that the fund was performing within a reasonable range of expectations, given those investment decisions, market conditions and the fund’s investment strategy; (iii) that the fund’s performance was competitive when compared to other relevant performance benchmarks or peer groups; (iv) that Columbia had taken or was taking steps
42
designed to help improve the fund’s investment performance, including, but not limited to, replacing portfolio managers or modifying investment strategies; and (v) that Columbia proposed to waive advisory fees or cap the expenses of the fund.
The Trustees noted that, through April 30, 2009, Columbia World Equity Fund’s performance was in the fourth quintile (where the best performance would be in the first quintile) for the one-, three-, five- and ten-year periods, of the peer group selected by an independent third-party data provider for purposes of performance comparisons.
The Trustees also considered Columbia’s performance and reputation generally, the funds’ performance as a fund family generally, and Columbia’s historical responsiveness to Trustee concerns about performance and Columbia’s willingness to take steps intended to improve performance. After reviewing those and related factors, the Trustees concluded, within the context of their overall conclusions regarding each of the Agreements, that the performance of each fund and Columbia was sufficient, in light of other considerations, to warrant the continuation of the Agreement pertaining to that fund.
Other Factors. The Trustees also considered other factors with respect to Columbia and its affiliates, which included but were not limited to the following:
| n | | the extent to which each fund had operated in accordance with its investment objective and investment restrictions, the nature and scope of the compliance programs of the funds and Columbia and the compliance-related resources that Columbia and its affiliates were providing to the funds; |
| n | | the nature, quality, cost and extent of administrative and shareholder services overseen and performed by Columbia and its affiliates, both under the Agreements and under separate agreements for the provision of transfer agency and administrative services; |
| n | | so-called “fall-out benefits” to Columbia and its affiliates, such as the engagement of its affiliates to provide distribution, brokerage and transfer agency services to the funds, and the benefits of research made available to Columbia by reason of brokerage commissions generated by the funds’ securities transactions, as well as possible conflicts of interest associated with those fall-out and other benefits, and the reporting, disclosure and other processes in place to disclose and monitor those possible conflicts of interest; and |
| n | | the report provided by the Fee Consultant, which included information about and analysis of the funds’ fees, expenses and performance. |
Matters Relating to the New Agreements
The Trustees considered all materials that they, their legal counsel or RiverSource believed reasonably necessary to evaluate and to determine whether to approve the New Agreements. In their deliberations, the Trustees did not identify any particular information that was all-important or controlling, and individual Trustees may have attributed different weights to the various factors. The material factors that formed the basis for the Trustees’ approvals included the factors set forth below:
| | (i) | the reputation, financial strength, regulatory histories and resources of RiverSource and its parent, Ameriprise; |
| | (ii) | the capabilities of RiverSource with respect to compliance, including an assessment of RiverSource’s compliance system by the funds’ Chief Compliance Officer; |
| | (iii) | the qualifications of the personnel of RiverSource that would be expected to provide advisory services to each fund, including RiverSource’s representations that the Chief Investment Officer of Columbia would serve as the Chief Investment Officer of RiverSource, and that the process for determining the portfolio management team for each fund would be substantially the same process as has customarily been followed by Columbia, and reported to the Trustees, in evaluating the performance of Columbia’s portfolio management teams; |
| | (iv) | the terms and conditions of the New Agreements, including the differences between the New Agreements and the Agreements; |
| | (v) | the terms and conditions of other agreements and arrangements relating to the future operations of the funds, including an administrative services agreement and a Master Services and Distribution Agreement; |
| | (vi) | the commitment of RiverSource and Ameriprise that there would not be any diminution in the nature, quality |
43
| | and extent of services provided to each fund or its shareholders following closing of the Transaction; |
| | (vii) | that the Trustees recently had completed a full annual review of the Agreements, as required by the 1940 Act, for each fund and had determined that they were satisfied with the nature, extent and quality of services provided thereunder and that the management fee rate for each fund were sufficient to warrant their approval; |
| | (viii) | that the advisory fee rates payable by each fund would not change; |
| | (ix) | that RiverSource and Bank of America, and not any fund, would bear the costs of obtaining approvals of the New Agreement; |
| | (x) | that Ameriprise and RiverSource had agreed to exercise reasonable best efforts to assure that, for a period of two years after the closing of the Transaction, there would not be imposed on any fund any “unfair burden” (within the meaning of Section 15(f) of 1940 Act) with respect to the Transaction; and |
| | (xi) | that certain members of RiverSource’s management have a significant amount of experience integrating other fund families; that certain current Columbia personnel that would be integrated into RiverSource and its affiliates as a result of the Transaction also have experience in integrating fund families; and that the senior management of RiverSource following the Transaction would include certain senior executives of Columbia who are currently responsible for oversight of services provided to the funds. |
Investment Advisory Fee Rates and Other Expenses. The Trustees considered the fact that the advisory fee rates payable by each fund to RiverSource under the New Agreements are the same as those currently paid by each fund to Columbia under the Agreements. The Trustees noted that in connection with their October 28, 2009 approval of the continuance of the Agreements, they had concluded, within the context of their overall conclusions regarding each such agreement, that the advisory fees charged to each fund supported the continuation of the agreement pertaining to that fund.
The Trustees noted that in certain cases the effective advisory fee rate for a RiverSource fund was lower than the proposed investment advisory fee rate for a fund with generally similar investment objectives and strategies. The Trustees also noted that RiverSource’s investment advisory fee rates for equity and balanced funds generally are subject to adjustments based on investment performance, whereas the proposed investment advisory fee rates for the funds, consistent with those in the Agreements, do not reflect performance adjustments. The Trustees considered existing advisory fee breakpoints and RiverSource’s undertaking not to change expense caps previously implemented by Columbia with respect to the funds without further discussion with the Independent Trustees.
The Trustees received and considered information about the advisory fees charged by RiverSource to institutional accounts. In considering the fees charged to those accounts, the Trustees took into account, among other things, RiverSource’s representations about the differences between managing mutual funds as compared to other types of accounts, including differences in the services provided, differences in the risk profile of such business for RiverSource and the additional resources required to manage mutual funds effectively. In evaluating each fund’s expected advisory fees, the Trustees also took into account the demands, complexity and quality of the investment management of the fund.
The Trustees also considered that for certain funds, certain administrative services that are provided under the Agreements would not be provided under the New Agreements, but under a separate administrative services agreement. The Trustees noted that, unlike fees under an advisory agreement, fees under the administrative services agreement could be changed without shareholder approval, although RiverSource had not proposed any increase in such administrative fees and any such increase would require Board approval. The Trustees also noted Ameriprise’s and RiverSource’s covenants regarding compliance with Section 15(f) of the 1940 Act.
After reviewing these and related factors, the Trustees concluded, within the context of their overall conclusions, that the expected advisory fee rates and expenses of each fund supported the approval of the New Agreements.
Other Benefits to RiverSource. The Trustees received and considered information regarding any expected “fall-out” or ancillary benefits to be received by RiverSource and its affiliates as a result of their relationships with the funds, such
44
as the engagement of RiverSource to provide administrative services to the funds and the engagement of RiverSource’s affiliates to provide distribution and transfer agency services to the funds. The Trustees considered that the funds’ distributor, which would be an affiliate of RiverSource, retains a portion of the distribution fees from the funds and receives a portion of the sales charges on sales or redemptions of certain classes of shares of the funds. The Trustees also considered the benefits of research made available to RiverSource by reason of brokerage commissions generated by the funds’ securities transactions, and reviewed information about RiverSource’s practices with respect to allocating portfolio brokerage for brokerage and research services. The Trustees considered the possible conflicts of interest associated with certain fall-out or other ancillary benefits and the reporting, disclosure and other processes that would be in place to disclose and to monitor such possible conflicts of interest. The Trustees recognized that RiverSource’s profitability would be somewhat lower without these benefits.
Conclusions
Based on their evaluation of all factors that they deemed to be material, including those factors described above, and assisted by the advice of independent counsel and the Fee Consultant, the Trustees, including the Independent Trustees, (i) approved the continuance of each of the Agreements through October 31, 2010 and (ii) approved each New Agreement.
45
Summary of Management Fee Evaluation by Independent Fee Consultant (Columbia Management Advisors, LLC)
EXCERPTS FROM REPORT OF INDEPENDENT FEE CONSULTANT TO THE FUNDS SUPERVISED BY THE COLUMBIA ATLANTIC BOARD
Prepared Pursuant to the February 9, 2005 Assurance of Discontinuance among the Office of Attorney General of New York State, Columbia Management Advisors, LLC, and Columbia Management Distributors, Inc. November 6, 2009
I. Overview
On February 9, 2005, Columbia Management Advisors, LLC (“CMA”) and Columbia Management Distributors, Inc.1 (“CMDI”) agreed to the New York Attorney General’s Assurance of Discontinuance (“AOD”). Among other things, the AOD stipulates that CMA may manage or advise a Columbia Fund (“Columbia Fund” and, together with some or all of such funds, the “Columbia Funds”) only if the Independent Members of the Columbia Fund’s Board of Trustees appoint a Senior Officer or retain an Independent Fee Consultant (“IFC”) who is to manage the process by which proposed management fees are negotiated. The AOD further stipulates that the Senior Officer or IFC is to prepare a written annual evaluation of the fee negotiation process.
With effect from January 1, 2007, the Independent Members of the Board of Trustees for certain Columbia Funds known collectively as the “Atlantic Funds” (together with the other members of that Board, the “Trustees”) retained me as IFC for the Atlantic Funds.2 In this capacity, I have prepared the fifth annual written evaluation of the fee negotiation process. As was the case with the 2007 and 2008 reports, my immediate predecessor as IFC, John Rea, provided invaluable assistance in the preparation of this year’s report.
A. Role of the Independent Fee Consultant
The AOD charges the IFC with “managing the process by which proposed management fees … to be charged the Columbia Fund are negotiated so that they are negotiated in a manner which is at arms’ length and reasonable and consistent with this Assurance of Discontinuance.” The AOD also provides that CMA “may manage or advise a Columbia Fund only if the reasonableness of the proposed management fees is determined by the Board of Trustees … using … an annual independent written evaluation prepared by or under the direction of … the Independent Fee Consultant.” Therefore, the AOD makes clear that the IFC does not supplant the Trustees in negotiating management fees with CMA, nor does the IFC substitute his or her judgment for that of the Trustees with respect to the reasonableness of proposed fees or any other matter that is committed to the business judgment of the Trustees.
B. Elements Involved in Managing the Fee Negotiation Process
In preparing the report required by the AOD, the IFC must consider at least the following six factors set forth in the AOD:
| 1. | The nature and quality of CMA’s services, including the Fund’s performance; |
| 2. | Management fees (including any components thereof) charged by other mutual fund companies for like services; |
| 3. | Possible economies of scale as the Fund grows larger; |
| 4. | Management fees (including any components thereof) charged to institutional and other clients of CMA for like services; |
| 5. | Costs to CMA and its affiliates of supplying services pursuant to the management fee agreements, excluding any intra-corporate profit; and |
| 6. | Profit margins of CMA and its affiliates from supplying such services. |
C. Organization of the Annual Evaluation
This report, like last year’s, focuses on the six factors and contains a section for each factor except that CMA’s costs and profits from managing the Funds are treated in a single section. In addition to a discussion of these factors, the report offers recommendations to improve the fee review process in future years. A review of the status of recommendations made in the 2008 Report is being provided separately with the materials for the October meeting.
| 1 | CMA and CMDI are subsidiaries of Columbia Management Group, LLC (“CMG”), and are the successors to the entities named in the AOD. |
| 2 | I have no material relationship with Bank of America, CMG or any of its affiliates, aside from serving as IFC, and I am aware of no material relationship with any of their affiliates. I retained John Rea, an independent economic consultant, to assist me with this report. |
| | Unless otherwise stated or required by the context, this report covers only the Atlantic Funds, which are also referred as the “Funds.” |
46
II. Summary of Findings
A. General
| 1. | Based upon my examination of the information supplied by CMG in the light of the six factors set forth in the AOD, I conclude that the Trustees have the relevant information necessary to evaluate the reasonableness of the proposed management fees for each Atlantic Fund. |
| 2. | In my view, the process by which the proposed management fees of the Funds have been negotiated in 2009 thus far has been, to the extent practicable, at arms’ length and reasonable and consistent with the AOD. |
B. Nature and Quality of Services, Including Performance
| 3. | The performance of the Funds has been relatively strong in recent years, although the one-year record was weaker than longer-term records. Based upon 1-, 3-, 5-, and 10-year returns through April 30, 2009, at least half of all the Funds were in the first and second performance quintiles in each of the three longest performance periods; for the one-year period, 40% of the Funds were in the top two quintiles. No more than 13% of the Funds were in the fifth quintile in any one performance period. Domestic equity, quantitative equity, and taxable fixed-income Funds were the strongest performers in 2009, while most foreign equity Funds lagged behind their competitors. |
| 4. | Performance rankings were similar in 2008 and 2009: the 1- and 3-year rankings declined slightly over the previous year, while the 5-year rankings improved modestly. Year over year, for the 1- and 3-year periods, the performance of equity Funds, both domestic and international, declined, while that of fixed-income Funds improved. Between three-fifths to two-thirds of the Funds changed quintile rankings in 2009 in the 1-, 3-, and 5-year performance periods. |
| 5. | The performance of the domestic equity Funds against their benchmarks was good for the 3- and 5-year performance periods. In contrast, gross returns of international equity and fixed-income Funds typically fell short of their benchmarks. The performance of equity Funds against their benchmarks was highly correlated to performance versus their peers; no such correlation was observed for fixed-income Funds. |
| 6. | The Atlantic equity Funds’ overall performance adjusted for risk was solid. Based upon 3-year returns, nearly 57% of the equity Funds had a combination of risk-adjusted and unadjusted returns that placed them in the top half of their performance universes. About one quarter of the fixed-income Funds posted high returns and low risk relative to comparable funds. Just over half of the fixed-income Funds, primarily tax-exempt Funds, took on more risk than the typical fund in their performance universes. |
| 7. | The industry-standard procedure used by Lipper that includes all share classes in the performance universe tends to bias a Fund’s ranking upward within that universe. The bias occurs because either no-12b-1 fee or low-12b-1 fee share classes of the Atlantic Funds are compared with funds in performance universes that include all share classes of multi-class funds with 12b-1 fees of up to 100 basis points. Correcting this bias by limiting the performance universe to classes of comparable funds with low or no 12b-1 fees (a “filtered universe”) lowers the relative performance for the Funds, but not to a material extent. The filtering process, however, did identify one Fund for further review that had not been identified as a review fund using unfiltered universes. Conversely, two Funds that had been identified as review funds in the unfiltered universe lost that status in filtered universes. |
| 8. | A small number of Funds have consistently underperformed over the past five years. The exact number depends on the criteria used to evaluate longer-term performance. For example, only three Funds had below-median performance in each 1- and 3-year period from 2005 to 2009. |
| 9. | The services performed by CMG professionals beyond portfolio management, such as compliance, legal, information technology, risk management, finance, and fund administration, are critical to the success of the Funds and appear to be of high quality. |
C. Management Fees Charged by Other Mutual Fund Companies
| 10. | The Funds’ management fees and total expenses are generally low relative to those of their peers, with over half of the Funds in the most favorable two quintiles. Only 26% of the Funds ranked in the two most expensive quintiles for actual management fees, and 18% in those quintiles for total expenses. Two Funds are in the fifth quintile for total |
47
| | expenses; four Funds are in the fifth quintile for actual management fees. |
| 11. | The highest concentration of low-expense Funds is found among the foreign equity Funds. The 12 former Excelsior Funds have relatively high fees and expenses, with two-thirds ranking in either the fourth or fifth quintiles for actual management fees. The higher actual management fee rankings of certain former Excelsior Funds are due in part to fee schedules that are higher than standard Columbia Fund fee schedules at current asset levels. |
| 12. | The distribution of total expense and management fee rankings has improved over the prior two years. The implementation of the voluntary standardized cap system has contributed significantly to the improved rankings in 2009. |
| 13. | The management fees of the Atlantic Funds are generally in line with those of Columbia Funds supervised by the Nations Board of Trustees (the “Nations Funds”). To the extent that Atlantic Funds have higher average fees in certain investment categories than Nations Funds, the difference reflects either differences in asset size, different fee structures of the former Excelsior Funds, or special circumstances of the Funds included in the investment categories. |
D. Trustees’ Advisory Contract Review Process
| 14. | The Trustees’ evaluation process identified 16 Funds in 2009 for further review based upon long-standing criteria relating to their relative performance or expenses or both. When compared in filtered universes, one additional Fund met the criteria for further review. CMG provided further information about each of those Funds to assist the Trustees in their evaluation. |
E. Potential Economies of Scale
| 15. | CMG presented to the Trustees its analysis of the sources and sharing of potential economies of scale. CMG views economies of scale as arising at the complex level and would regard estimates of scale economies for individual funds as unreliable. In its analysis, CMG did not identify specific sources of economies of scale or provide any estimates of any economies of scale that might arise from future asset growth. CMG’s analysis included measures taken by the Trustees and CMG that seek to share any potential economies of scale through breakpoints in management fee schedules, the establishment of expense limits for each Fund, enhanced shareholder services, fund mergers, and operational consolidation. |
| 16. | An examination of the contractual fee schedules for five Atlantic Funds shows that those with standard fee structures are generally in line with those of their competitors. The fee schedules of the former Excelsior Funds, however, have high initial fees relative to competitors but otherwise have comparable breakpoint structures. |
F. Management Fees Charged to Institutional Clients
| 17. | CMG has provided Trustees with comparisons of mutual fund management fees and institutional fees based upon standardized fee schedules and upon actual fees. The results show that, consistent with industry practice, actual and scheduled institutional fees are generally lower than the Funds’ management fees. CMG provided additional data this year demonstrating that at small asset levels, the effective fee of certain Funds may be equal to or less than institutional fee levels at those asset levels, due to the effect of expense limits on small funds with high gross expenses. CMG also analyzed the differences between the services provided and risks borne on the one hand by a manager of mutual funds and on the other by institutional advisers, and suggested that these differences should be kept in mind when Trustees review the reasonableness of the Funds’ management fees. |
G. Revenues, Expenses, and Profits
| 18. | The activity-based cost allocation methodology employed by CMG to allocate costs, both direct and indirect, for purposes of calculating Fund profitability is thoughtful and detailed. This year, CMG further refined the technique by allocating additional indirect expenses on an activity basis. |
| 19. | The materials provided on CMG’s revenues and expenses with respect to the Funds and the methodology underlying their construction form a sufficient basis for Trustees to evaluate the expenses of and profitability to CMG arising out of its relationships with the Funds. |
48
| 20. | CMG provided a firm-wide pro forma 2009 income statement demonstrating the effect of market events beginning in the fourth quarter of 2008 on its revenues and profitability to provide an additional perspective on calendar 2008 profitability data. In particular, 2008 revenues reflected the higher market prices prevailing during the first three quarters of that year, while expenses dropped due to cost cutting in the wake of the market downturn late in 2008. The continuing effects of this downturn are expected to produce a significant decline in profitability this year. |
| 21. | In 2008, CMG’s pre-tax post-distribution margin on the Atlantic Fund complex was above industry medians, based on the limited data available for publicly held mutual fund managers. However, as is to be expected in a large fund complex, some Atlantic Funds had relatively high pre-tax profit margins in 2008, when calculated solely with respect to management revenues and expenses, while other Atlantic Funds operated at a loss. There is a positive relationship between Fund size and profitability to CMG, with smaller Funds generally operating at a loss to CMG. |
| 22. | CMG pays a fixed percentage of its management fee revenues to an affiliate, U.S. Trust, Bank of America Private Wealth Management, with respect to assets of its clients invested in Atlantic Funds to compensate it for services it performs with respect to those client assets and for the effect of state law limitations on affiliates charging multiple fees. Based on our analysis of the services provided by this affiliate, we have concluded that all payments other than those for sub-transfer agent or sub-accounting services should be treated as a distribution expense. |
III. Recommendations
| 1) | Criteria for review. The Trustees may wish to consider modifying the criteria for identifying a Fund for further review (a “Review Fund”) to include criteria that focus exclusively on performance. The Trustees’ supplementary data request included one such criterion. They may also wish to consider whether it would be useful to apply CMG’s own internal monitoring standards for Fund performance to the contract review process, or whether such criteria are more relevant to their ongoing investment oversight. |
| 2) | Presentation of Review Fund discussion. CMG should consider whether it could more systematically present in one discussion all relevant information regarding each Review Fund, which is now split into several different portions of the 15(c) materials. For any Fund that has been a Review Fund in consecutive years, CMG should address under what circumstances it could reasonably be anticipated that the Fund would lose that status. |
| 3) | Refinement of tax-exempt performance data. Certain single-state tax-exempt Funds compete in extremely small universes and are compared to a multi-state benchmark of uncertain relevance. Notwithstanding the difficulties, CMG should work to improve the reliability of the calculation of relative performance of these Funds. If that is not possible, CMG should provide guidance on how the Trustees should judge the quality of CMG’s management of these Funds. |
| 4) | Development of risk metrics for asset-allocation, tax-exempt, and money market funds. CMG has developed and shared with the Trustees quantitative risk metrics comparing equity and taxable fixed-income Funds against their peers. However, reliable risk metrics have not been developed for asset-allocation, tax-exempt fixed income, and money market funds. We urge CMG to continue its efforts to provide reliable risk measures for these categories of Funds, especially in the cases of asset-allocation and money market funds, because their investors are likely to be motivated at least in part by a desire to manage risk. |
| 5) | Profitability data. For any period during which CMG is an affiliate of U.S. Trust, Bank of America Private Wealth Management, CMG should continue to present to the Trustees the profitability of each Fund, each investment style and each complex (of which Atlantic is one) calculated as follows: |
| | a. | Management-only profitability should be calculated without reference to any Private Bank expense. |
| | b. | Profitability excluding distribution (which essentially covers the management and transfer agency functions) should be adjusted by removing from the expense calculation any portion of the Private Bank payment not attributable to the performance by the Private Bank of sub-transfer agency or sub-accounting functions. |
| | c. | Total profitability, including distribution: No adjustment for Private Bank expenses should be made, because all such expenses represent legitimate fund |
49
| | expenses to be taken into account in calculating CMG’s profit margin including distribution. |
| | d. | Distribution only: This should include all Private Bank expenses other than those attributable to sub-transfer agency services. |
| 6) | Contractual fee analysis. This year CMG presented a new Lipper report comparing the contractual management fees of Funds with those of competitors in similar investment styles. However, the reliability of the conclusion – that Fund management fee breakpoints compared favorably with competitive fee rates – was limited by the use of competitive funds at all asset levels. The sponsors of a $100 million mutual fund may not have given much thought to breakpoints at $5 billion; therefore, that fund’s contractual fee at that level is unlikely to compare favorably with that of a $5 billion Fund. Limiting the competitors to the Lipper expense group, whose constituents are similar in size to the relevant Fund, would make the results more meaningful. In addition, the breakpoints of a select group of Atlantic Funds (which would differ each year) should continue to be compared to those of industry rivals to ensure that the Funds’ breakpoint schedules remain within industry norms. As breakpoint schedules change relatively little each year, performing such a comparison for each Atlantic Fund each year would not be an efficient use of Trustee and CMG resources. |
| 7) | Pro forma profitability data. In any year in which CMG or the Trustees believe that the prior year’s profitability is unlikely to be representative of current business results due to changes in markets or for any other reason, CMG should, consistent with this year’s practice, prepare a pro forma income statement based on year-to-date actual data and reasonable projections used for its own business planning purposes. |
| 8) | Additional institutional data and analysis. While CMG provided a substantial amount of information on its institutional business, including a virtually complete database of all institutional accounts, we suggest some additional items for future years: (a) profitability data for the institutional business in the format, and based upon the same allocation methodologies, used to present Fund profitability, (b) an explanation of how CMA sets institutional fee breakpoints, which normally begin at asset levels far lower than those found in Fund management fee breakpoints, and (c) an analysis of differences in actual fees within specific investment categories, with special attention given to accounts established before and after the implementation of the standardized institutional fee schedules in 2005. |
| 9) | Management fee disparities. In any future study of management fees, CMG and the Atlantic Trustees should analyze the differences in management fee schedules, including those arising out of the reorganization of the former Excelsior Funds as Atlantic Funds. As part of that analysis, CMG should provide an explanation for any significant fee differences among comparable funds across fund families sponsored by CMG, such as differences in the management styles of different Funds included the same Lipper category. Finally, if CMG proposes a management fee change or an expense cap for any mutual fund managed by CMA that is comparable to any Atlantic Fund, CMG should provide the Trustees with sufficient information about the proposal to allow the Trustees to assess the applicability of the proposed change to the relevant Atlantic Fund or Funds. |
| 10) | Explanation of data supplied to Lipper. Each year, as part of the 15(c) process, CMG retains Lipper to compare the fees and expenses of each Fund to a group of competitors. In many cases, CMG, with the approval of the Trustees, adjusts the actual expense data, which is based on the most recent full fiscal year of the Fund (and each competitive fund) to reflect changes in fees or expense limits that occurred during or after the relevant fiscal year. This improves the reliability and usefulness of the comparison. However, to ensure that the Trustees know when and how CMG adjusted the data, we recommend that CMG prepare a table listing for each Fund what adjustments were made, e.g., to reflect a new expense limitation of x basis points that commenced on y date. |
Reduction of volume of paper documents submitted. The effort to streamline and better organize the data presented to the Trustees and the process by which that data was prepared and organized continued to be well-received by all parties. Notwithstanding past success, it is always appropriate to look for opportunities to reduce and simplify the presentation of 15(c) data. One possibility would be to remove the 124 pages of biographical data, most if not all of which the Trustees have
50
previously seen as part of their ongoing investment oversight duties, from the paper volume and post it on the Internet-based document storage and retrieval system used by the Funds to provide reference data to Trustees.
Respectfully Submitted,
Steven E. Asher
51
Summary of Management Fee Evaluation by Independent Fee Consultant (RiverSource Investments, LLC)
REPORT OF INDEPENDENT FEE CONSULTANT TO THE FUNDS SUPERVISED BY THE COLUMBIA ATLANTIC BOARD
Prepared Pursuant to the February 9, 2005 Assurance of Discontinuance among the Office of Attorney General of New York State, Columbia Management Advisors, LLC, and Columbia Management Distributors, Inc. December 21, 2009
I. Overview
On February 9, 2005, Columbia Management Advisors, LLC (“CMA”) and Columbia Management Distributors, Inc.1 (“CMD”) agreed to the New York Attorney General’s Assurance of Discontinuance (“AOD”). Among other things, the AOD stipulates that CMA may manage or advise a Columbia Fund (“Columbia Fund” and, together with some or all of such funds, the “Columbia Funds”) only if the Independent Members of the Columbia Fund’s Board of Trustees appoint a Senior Officer or retain an Independent Fee Consultant (“IFC”) who is to manage the process by which proposed management fees are negotiated. The AOD further stipulates that the Senior Officer or IFC is to prepare a written annual evaluation of the fee negotiation process.
With effect from January 1, 2007, the Independent Members of the Board of Trustees for certain Columbia Funds known collectively as the “Atlantic Funds” (together with the other members of that Board, the “Trustees”) retained me as IFC for the Atlantic Funds.2 In this capacity, I have prepared this written evaluation of the fee negotiation process. As was the case with the last three annual reports, my immediate predecessor as IFC, John Rea, provided invaluable assistance in the preparation of this report.
On September 29, 2009, Ameriprise entered into an asset purchase agreement with Bank of America, N.A. and its parent, Bank of America Corporation (together, the “Bank”) pursuant to which the Bank agreed to sell certain CMG assets relating to Columbia’s long-term asset management business, including management of the Atlantic Funds (the “Transaction”).3 The Transaction if completed would result in the termination of the existing Investment Management Agreements with CMA. Therefore, the Trustees have been requested to approve and recommend to the shareholders of each Atlantic Fund new Investment Management and Sub-Advisory Agreements (together, the “Management Agreements”) with RiverSource Investments, LLC (“RI”),4 investment manager of the RiverSource Funds and a subsidiary of Ameriprise. This report is intended to fulfill the requirements of the AOD with respect to the Trustees’ consideration of the new Management Agreements.
A. Role of the Independent Fee Consultant
The AOD charges the IFC with “managing the process by which proposed management fees … to be charged the Columbia Fund are negotiated so that they are negotiated in a manner which is at arms’ length and reasonable and consistent with this Assurance of Discontinuance.” The AOD also provides that CMA “may manage or advise a Columbia Fund only if the reasonableness of the proposed management fees is determined by the Board of Trustees … using … an annual independent written evaluation prepared by or under the direction of … the Independent Fee Consultant.” Therefore, the AOD makes clear that the IFC does not supplant the Trustees in negotiating management fees with CMA (or RI), nor does the IFC substitute his or her judgment for that of the Trustees with respect to the reasonableness of proposed fees or any other matter that is committed to the business judgment of the Trustees.
B. Elements Involved in Managing the Fee Negotiation Process
In preparing the report required by the AOD, the IFC must consider at least the following six factors set forth in the AOD:
| 1. | The nature and quality of the adviser’s services, including the Fund’s performance; |
| 1 | CMA and CMD are subsidiaries of Columbia Management Group, LLC (“CMG”), and are the successors to the entities named in the AOD. |
| 2 | I have no material relationship with Bank of America, CMG or Ameriprise Financial, Inc. (“Ameriprise”), aside from serving as IFC, and I am aware of no material relationship with any of their affiliates. I retained John Rea, an independent economic consultant, to assist me with this report. |
| | Unless otherwise stated or required by the context, this report covers only the Atlantic Funds. |
| 3 | Preliminary Response of Ameriprise to Information Request of Columbia Atlantic Board dated October 21, 2009 (hereafter, the “Preliminary Response”), p. 1. The one money market Atlantic Fund, Money Market Fund VS, was included in the Transaction because it was an integral part of CMG's array of Funds used as investment vehicles by variable annuity and similar insurance products. |
| 4 | Ameriprise intends to re-brand RI with the “Columbia” name (which is one of the assets being sold in the Transaction). Preliminary Response, pp. 4-5. In the case of new Sub-Advisory Agreements, the current sub-adviser would also be a party. |
52
| 2. | Management fees (including any components thereof) charged by other mutual fund companies for like services; |
| 3. | Possible economies of scale as the Fund grows larger; |
| 4. | Management fees (including any components thereof) charged to institutional and other clients of the adviser for like services; |
| 5. | Costs to the adviser and its affiliates of supplying services pursuant to the management fee agreements, excluding any intra-corporate profit; and |
| 6. | Profit margins of the adviser and its affiliates from supplying such services. |
C. Data Presented to the Trustees
In considering the proposed new Management Agreements with RI, the Trustees relied in part on the data that had been prepared as part of their annual contract review process, which concluded in late October. This data remained relevant because the fees in the proposed Management Agreements were identical to the fees approved at that time. The annual review materials included a Lipper report on the performance of each Atlantic Fund compared to its peers and its benchmark, comparisons of the fees and expenses of each Atlantic Fund to similar CMG-sponsored Funds, comparable competitive funds chosen by Lipper, and institutional accounts advised by CMA, revenues, expenses, and profits of CMG from managing the Atlantic Funds, calculated both by Fund and collectively, and CMG’s views on the existence and sharing of economies of scale.
In addition, the Trustees reviewed materials specific to the proposed new Management Agreements with RI in response to requests for information made on behalf of the Trustees, including the following:
| n | | Performance data for the RiverSource Funds showing percentile and quartile rankings of each fund within its Lipper performance universe for periods up to five years and net returns of each fund relative to its benchmark returns. This data was arguably relevant due to the possibility that some RiverSource investment teams would be providing investment management services to certain Columbia Funds. 5 |
| n | | tables comparing the fee schedules and effective fee rates of funds managed by CMA and RI and institutional accounts advised by the two firms. |
| n | | extensive discussion of the process by which the various components of the two asset management businesses would be integrated including investment management, compliance, transfer agency, custody, fund accounting, and distribution. |
| n | | information about the financial condition of Ameriprise, including its most recent annual report on Form 10-K, RI’s profit margins from managing the RiverSource Funds in 2007 and 2008, and pro forma income statements for the combined Columbia and RiverSource fund complex. |
| n | | disclosure that certain senior CMG executives, including President Michael Jones, Chief Investment Officer Colin Moore, Head of Mutual Funds J. Kevin Connaughton, and Chief Compliance Officer Linda Wondrack would continue in analogous capacities following the consummation of the Transaction, and |
| n | | a breakdown of the synergies RI expects to realize in the two years following the Transaction and the extent to which those potential synergies are expected to be shared with shareholders of funds advised by RI. |
II. Findings
| 1. | Based upon my examination of the information supplied by CMG and Ameriprise in the light of the six factors set forth in the AOD, I conclude that the Trustees have the relevant information necessary to evaluate the reasonableness of the proposed management fees for each Atlantic Fund. |
| 2. | In my view, the process by which the proposed management fees of the Atlantic Funds have been negotiated with RI thus far has been, to the extent practicable, at arms’ length and reasonable and consistent with the AOD. |
Respectfully submitted,
Steven E. Asher
| 5 | On page 20 of its Supplemental Response to the Atlantic Trustees (undated but delivered November 24, 2009), Ameriprise said that “most personnel decisions, including with respect to the portfolio management teams for the Atlantic Funds . . . will be made primarily by [current CMA CIO] Colin Moore using the Columbia 5P process.” |
53
Proxy Voting Results
Columbia World Equity Fund
On March 3, 2010, a special meeting of shareholders of Columbia Funds Series Trust I was held to consider the approval of several proposals listed in the proxy statement for the meeting. Proposal 1 and Proposal 2 were voted on at the March 3, 2010 meeting of shareholders and Proposal 3 was voted on at an adjourned meeting of shareholders held on March 31, 2010. The shareholder meeting results are as follows:
Proposal 1: A proposed Investment Management Services Agreement with Columbia Management Investment Advisers, LLC (formerly, RiverSource Investments, LLC) (CMIA) was approved as follows:
| | | | | | |
| | | | | | | |
| Votes For | | Votes Against | | Abstentions | | Broker Non-Votes |
| 26,507,866 | | 933,476 | | 917,511 | | 3,165,903 |
Proposal 2: A proposal authorizing CMIA to enter into and materially amend subadvisory agreements for the Fund in the future, with the approval of the Trust’s Board of Trustees, but without obtaining additional shareholder approval, was approved as follows:
| | | | | | |
| | | | | | | |
| Votes For | | Votes Against | | Abstentions | | Broker Non-Votes |
| 25,752,481 | | 1,599,810 | | 1,006,551 | | 3,165,914 |
Proposal 3: Each of the nominees for trustees was elected to the Trust’s Board of Trustees, as follows:
| | | | | | |
| | | | | | | |
| Trustee | | Votes For | | Votes Withheld | | Abstentions |
| John D. Collins | | 30,977,072,412 | | 859,827,038 | | 0 |
Rodman L. Drake | | 30,951,179,004 | | 885,720,446 | | 0 |
| Douglas A. Hacker | | 30,989,793,279 | | 847,106,171 | | 0 |
Janet Langford Kelly | | 30,999,020,814 | | 837,878,636 | | 0 |
| William E. Mayer | | 16,291,139,483 | | 15,545,759,967 | | 0 |
Charles R. Nelson | | 30,997,700,700 | | 839,198,750 | | 0 |
| John J. Neuhauser | | 30,988,095,661 | | 848,803,789 | | 0 |
Jonathon Piel | | 30,968,801,048 | | 868,098,402 | | 0 |
| Patrick J. Simpson | | 30,999,065,030 | | 837,834,420 | | 0 |
Anne-Lee Verville | | 30,996,227,913 | | 840,671,537 | | 0 |
54
[THIS PAGE INTENTIONALLY LEFT BLANK]
55
[THIS PAGE INTENTIONALLY LEFT BLANK]
56
Important Information About This Report
The fund mails one shareholder report to each shareholder address. If you would like more than one report, please call shareholder services at 1-800-345-6611 and additional reports will be sent to you. This report has been prepared for shareholders of Columbia World Equity Fund.
A description of the policies and procedures that the fund uses to determine how to vote proxies and a copy of the fund’s voting records are available (i) at www.columbiamanagement.com, (ii) on the Securities and Exchange Commission’s website at www.sec.gov, and (iii) without charge, upon request, by calling 1-800-368-0346. Information regarding how the fund voted proxies relating to portfolio securities during the 12-month period ended June 30 is available from the SEC’s website. Information regarding how the fund voted proxies relating to fund securities is also available from the fund’s website, columbiamanagement.com.
The fund files a complete schedule of portfolio holdings with the SEC for the first and third quarters of each fiscal year on Form N-Q. The fund’s Form N-Q is available on the SEC’s website at www.sec.gov and may be reviewed and copied at the SEC’s Public Reference Room in Washington, D.C. Information on the operation of the Public Reference Room may be obtained by calling
1-800-SEC-0330.
Investors should consider the investment objectives, risks, charges and expenses of a mutual fund carefully before investing. For a free prospectus, which contains this and other important information about the funds, visit columbiamanagement.com. Read the prospectus carefully before investing.
On April 30, 2010, Ameriprise Financial, Inc., the parent company of RiverSource Investments, LLC, acquired the long-term asset management business of Columbia Management Group, LLC, including certain of its affiliates, which were, prior to this acquisition, part of Bank of America. In connection with the acquisition of the long-term assets, the Columbia Funds have a new investment adviser, RiverSource Investments, LLC, which is now known as Columbia Management Investment Advisers, LLC. For those clients that use the services of a subadviser, those arrangements are continuing unless notified otherwise. RiverSource Fund Distributors, Inc., now known as Columbia Management Investment Distributors, Inc., member FINRA, will act as the principal distributor of the Columbia Funds.
Transfer Agent*
Columbia Management Investment Services Corp.
P.O. Box 8081
Boston, MA 02266-8081
1-800-345-6611
Distributor*
Columbia Management Investment
Distributors, Inc.
One Financial Center
Boston, MA 02111
Investment Advisor*
Columbia Management Investment Advisers, LLC
100 Federal Street
Boston, MA 02110
* As of May 1, 2010
57

One Financial Center
Boston, MA 02111-2621
Columbia World Equity Fund
Annual Report, March 31, 2010
©2010 Columbia Management Investment Advisers, LLC. All rights reserved.
One Financial Center, Boston, MA 02111-2621
800.345.6611 www.columbiafunds.com
SHC-42/44509-0310 (05/10) 10/H406F5

Annual Report
March 31, 2010
Columbia Income Fund
Not FDIC Insured Ÿ May Lose Value Ÿ No Bank Guarantee
Table of Contents
The views expressed in this report reflect the current views of the respective parties. These views are not guarantees of future performance and involve certain risks, uncertainties and assumptions that are difficult to predict, so actual outcomes and results may differ significantly from the views expressed. These views are subject to change at any time based upon economic, market or other conditions and the respective parties disclaim any responsibility to update such views. These views may not be relied on as investment advice and, because investment decisions for a Columbia Fund are based on numerous factors, may not be relied on as an indication of trading intent on behalf of any particular Columbia Fund. References to specific securities should not be construed as a recommendation or investment advice.
President’s Message

Dear Shareholder:
On May 3, 2010, Ameriprise Financial, Inc. announced that it had completed the acquisition of the long-term asset management business of Columbia Management from Bank of America. This includes the business of managing its equity and fixed-income mutual funds. Ameriprise Financial has combined its current U.S. asset management business, RiverSource Investments, LLC, with Columbia Management. This transaction puts together two leading asset management firms to create one entity that ranks as the eighth largest manager of long-term mutual fund assets in the United States.1 This combined business will operate under the well-regarded Columbia Management brand, where we will build on the strengths of our combined investment capabilities and
talent, our broad and diversified product lineup and exceptional service.
Our combined business has a new breadth and depth of investment choices. William “Ted” Truscott, CEO, U.S. asset management and president of annuities for Ameriprise Financial, leads the combined U.S. asset management business. Michael Jones serves as president, U.S. asset management. Colin Moore continues to serve as chief investment officer. I am also continuing in my role as head of mutual funds, responsible for the delivery of mutual fund products and services to investors. The Columbia funds’ advisers, distributor and transfer agent are now subsidiaries of our parent company, Ameriprise Financial but operate under the Columbia Management name. You will begin to see these names used in communications and statements going forward.
| | |
| | | Service provider name |
| Advisers | | Columbia Management Investment Advisers, LLC Columbia Wanger Asset Management, LLC |
| Distributor | | Columbia Management Investment Distributors, Inc. |
| Transfer Agent | | Columbia Management Investment Services Corp. |
As a valued investor in Columbia funds, please know that our goal is to ensure a smooth transition and provide the highest quality products and services. Transition teams across the organization continue their efforts to build on best practices from both legacy organizations with integration efforts including rebranding, vendor and system consolidations and client communications. Additionally, we want to assure you that the funds’ portfolio managers also continue to focus on providing uninterrupted service to all fund shareholders.
Although we have a lot of work ahead of us in 2010, Columbia Management and Ameriprise Financial are excited about the opportunities for our combined organization. I share this optimism and believe it positions us as a best-in-class asset management business with the ability to deliver more for our clients than ever before.
Sincerely,

J. Kevin Connaughton
President, Columbia Funds
| 1 | Source: Ameriprise Financial, Inc., based on March 31, 2010 data from the Investment Company Institute |
Investors should consider the investment objectives, risks, charges and expenses of a mutual fund carefully before investing. For a free prospectus, which contains this and other important information about the funds, visit columbiamanagement.com. Read the prospectus carefully before investing.
Securities products offered through Columbia Management Investment Distributors, Inc. (formerly known as RiverSource Fund Distributors, Inc.), member FINRA. Advisory services provided by Columbia Management Investment Advisers, LLC (formerly known as RiverSource Investments, LLC).
© 2010 Columbia Management Investment Advisers, LLC. All rights reserved.
Fund Profile – Columbia Income Fund
Summary
| n | | For the 12-month period that ended March 31, 2010, the fund’s Class A shares returned 33.42% without sales charge. |
| n | | The fund’s return exceeded those of its benchmarks, the Barclays Capital Credit Bond Index1 and the blended benchmark2, and also the average return of its peer group, the Lipper Corporate Debt Funds BBB-Rated Classification.3 Prior to June 19, 2009, the Barclays Capital Intermediate Government/Credit Bond Index and the Barclays Capital Intermediate Credit Bond Index4 were the fund’s primary and secondary benchmarks, respectively. We believe that the new benchmarks more accurately reflect the strategy of the fund. |
| n | | The fund’s emphasis on high-yield and investment-grade bonds drove the fund’s outperformance. |
Portfolio Management
Carl W. Pappo, lead manager of the fund, has co-managed the fund since 2005 and has been associated with the advisor or its predecessors since 1993.
Kevin L. Cronk has co-managed the fund since 2003 and has been associated with the advisor or its predecessors since 1999.
Effective May 26, 2010, Brian Lanvin became a co-manager of the fund. Mr. Lanvin has been associated with the advisor or its predecessors since 1994. Kevin L. Cronk no longer co-manages the fund.
Effective May 1, 2010, RiverSource Investments, LLC, a subsidiary of Ameriprise Financial, Inc., became the investment advisor to the fund and changed its name to Columbia Management Investment Advisers, LLC. Please see the fund’s prospectus, as supplemented, for more information regarding the change in investment advisor and certain other changes.
| 1 | The Barclays Capital Credit Bond Index is an index of publicly issued investment grade, corporate securities and dollar-denominated SEC registered global debentures. |
| 2 | A weighted custom composite of the Barclays Capital Credit Bond Index (85%) and JPMorgan Global High Yield Index (15%) established by the advisor. The JPMorgan Global High Yield Index is designed to mirror the investable universe of the U.S. dollar global high yield corporate debt market, including domestic and international issues. |
| 3 | Lipper Inc., a widely respected data provider in the industry, calculates an average total return (assuming reinvestment of distributions) for mutual funds with investment objectives similar to those of the fund. Lipper makes no adjustment for the effect of sales loads. |
| 4 | The Barclays Capital Intermediate Government/Credit Bond Index is an index that tracks the performance of intermediate term U.S. government and corporate bonds. The Barclays Capital Intermediate Credit Bond Index is the intermediate component of the U.S. Credit Index. The U.S. Credit Index includes publicly issued U.S. corporate and foreign debentures and secured notes that meet specified maturity, liquidity and quality requirements. |
Performance data quoted represents past performance and current performance may be lower or higher. Past performance is no guarantee of future results. The investment return and principal value will fluctuate so that shares, when redeemed, may be worth more or less than the original cost. Please visit www.columbiafunds.com for daily and most recent month-end performance updates.
Summary
1-year return as of 03/31/10
| | |
| |
 | | +33.42% Class A shares (without sales charge) |
| |
| | +20.83% Barclays Capital Credit Bond Index |
| |
| | +25.75% Blended Benchmark |
| |
| | +6.92% Barclays Capital Intermediate Government/Credit Bond Index |
| |
| | +18.72% Barclays Capital Intermediate Credit Bond Index |
1
Economic Update – Columbia Income Fund
Summary
For the 12-month period that ended March 31, 2010
| | n | | As investors grew more comfortable with risk, non-Treasury sectors of the bond market rebounded. The Barclays Capital Aggregate Bond Index delivered solid results. High-yield bonds outperformed stocks, as measured by the BofA Merrill Lynch U.S. High Yield Cash Pay Index. | |
| | |
Barclays
Aggregate Index | | BofA ML
Index |
| |

| |
|
7.69% | | 55.67% |
| | n | | Stock markets rebounded around the world, as measured by the S&P 500 Index and the MSCI EAFE Index. | |
| | |
| S&P Index | | MSCI Index |
| |
| |
|
49.77% | | 54.44% |
After a deep and difficult recession, the U.S. economy regained its footing midway through calendar year 2009. Gross domestic product (GDP) turned positive in the third quarter of 2009, rising 2.2%, and then gained 5.6% in the fourth quarter according to the estimate released by the Bureau of Economic Analysis. Growth was primarily the result of a slowdown in inventory reduction and of federal government stimulus spending. Hopes for a sustained recovery now depend on a variety of factors, including continued improvement in consumer spending, an increase in revenues to keep business profits moving higher and a turnaround in the labor market.
The housing market showed some signs of stabilizing, but stopped short of meaningful improvement during the period. Home sales moved higher in 2009 as new homebuyers took advantage of a federal tax credit. However, as the tax credit was set to expire in November 2009, sales slipped — and did not revive even though the tax credit was expanded and extended through April 2010. Housing prices remained relatively flat over the past year, but that was progress compared to 2008. The average home price fell sharply in 2008; and since then distressed properties, which account for approximately 40% of all housing sales, have held prices down because they are heavily discounted.
In the beleaguered labor market, there was some good news. While businesses continued to shed jobs through most of 2009, raising the unemployment rate to 9.7% at the end of the period*, job data turned positive in March 2010, buoyed by a swell of temporary workers hired to conduct the national once-in-a-decade census. Consumer spending also trended higher in the second half of the period. In fact, March year-over-year sales made a significant jump upward. Despite these improvements, consumer confidence, as measured monthly by The Conference Board, an independent research organization, failed to gain much ground during the year. Consumers surveyed continue to cite uncertain business conditions and still-weak labor prospects for their concerns.
On the business side of the economy, manufacturing activity gained momentum. A key measure of the nation’s manufacturing situation — the Institute for Supply Management’s Index — rose above 50 in July 2009, then rose for eight consecutive months to remain well above 50 for the remainder of the period. (An index value of 50+ indicates a growing economy.) Industrial production moved higher for eleven out of the past 12 months, and durable goods orders took off, with a big jump upward in January. Manufacturing capacity utilization inched upward to 72.7%.
Bond returns ranged from solid to strong
As hopes for a recovery materialized, bonds from non-Treasury sectors delivered solid returns. The Barclays Capital Aggregate Bond Index1 returned 7.69%. Municipal bonds gained more than taxable investment-grade bonds even without factoring in
| * | Source: U.S. Bureau of Labor Statistics |
| 1 | The Barclays Capital Aggregate Bond Index is a market value-weighted index that tracks the daily price, coupon, pay-downs and total return performance of fixed-rate, publicly placed, dollar-denominated and non-convertible investment grade debt issues with at least $250 million par amount outstanding and with at least one year to final maturity. |
2
Economic Update (continued) – Columbia Income Fund
potential tax advantages to investors in higher income-tax brackets. The Barclays Capital Municipal Bond Index2 returned 9.69%. The high-yield bond market was even stronger than the broad stock market during the period. For the 12 months covered by this report, the BofA Merrill Lynch U.S. High Yield Cash Pay Index3 returned 55.67%.
The yield on the 10-year U.S. Treasury, a common bellwether for the bond market, rose from 2.7% to 3.8% during the 12-month period. Yet despite the pickup in economic activity, the Federal Reserve Board (the Fed) kept a key short-term interest rate — the federal funds rate — close to zero throughout the period.
Stocks staged a solid comeback
Against a strengthening economic backdrop, a stock market rally that began in mid-March 2009 continued with little interruption through the end of the period. The U.S. stock market returned 49.77% for the 12-month period, as measured by the S&P 500 Index.4 Mid-cap stocks outperformed large- and small-cap stocks, and value stocks outperformed growth stocks by a solid margin, as measured by their respective Russell indices.5 Outside the United States, stock market returns were slightly stronger. The MSCI EAFE Index,6 a broad gauge of stock market performance in foreign developed markets, gained 54.44% (net of dividends, in U.S. dollars) for the period. Emerging stock markets were caught in a downdraft in 2008, but they bounced back stronger than domestic or developed world markets as their economic growth generally outpaced the developed world. The MSCI Emerging Markets Index7 returned 81.08% (net of dividends, in U.S. dollars) for the 12-month period, after giving back some gains in the first quarter of 2010.
Past performance is no guarantee of future results.
| 2 | The Barclays Capital Municipal Bond Index is considered representative of the broad market for investment-grade, tax-exempt bonds with a maturity of at least one year. |
| 3 | The BofA Merrill Lynch U.S. High Yield Cash Pay Index tracks the performance of non-investment-grade corporate bonds. |
| 4 | The Standard and Poor’s (S&P) 500 Index tracks the performance of 500 widely held, large-capitalization U.S. stocks. |
| 5 | The Russell 1000 Index tracks the performance of 1,000 of the largest U.S. companies, based on market capitalization. The Russell MidCap Index measures the performance of the 800 smallest companies in the Russell 1000 Index, which represents approximately 25% of the total market capitalization of the Russell 1000 Index. The Russell 2000 Index measures the performance of the 2,000 smallest companies in the Russell 3000 Index, which represents approximately 8% of the total market capitalization of the Russell 3000 Index. The Russell 3000 Growth Index measures the performance of those Russell 3000 Index companies with higher price-to-book ratios and higher forecasted growth values. The stocks in this index are also members of either the Russell 1000 Growth or the Russell 2000 Growth indexes. The Russell 3000 Value Index measures the performance of those Russell 3000 Index companies with lower price-to-book ratios and lower forecasted growth values. The stocks in this index are also members of either the Russell 1000 Value or the Russell 2000 Value indices. |
| 6 | The Morgan Stanley Capital International Europe, Australasia, Far East (MSCI EAFE) Index is a capitalization-weighted index that tracks the total return of common stocks in 21 developed-market countries within Europe, Australasia and the Far East. |
| 7 | The Morgan Stanley Capital International Emerging Markets Index (MSCI EMI) is a free float-adjusted market capitalization index that is designed to measure equity market performance in the global emerging markets. As of June 2009, the MSCI Emerging Markets Index consisted of the following 22 emerging market country indices: Brazil, Chile, China, Colombia, Czech Republic, Egypt, Hungary, India, Indonesia, Israel, Korea, Malaysia, Mexico, Morocco, Peru, Philippines, Poland, Russia, South Africa, Taiwan, Thailand and Turkey. |
Indices are not available for investment, are not professionally managed and do not reflect sales charges, fees, brokerage commissions, taxes or other expenses of investing. Securities in the fund may not match those in an index.
3
Performance Information – Columbia Income Fund
Performance data quoted represents past performance and current performance may be lower or higher. Past performance is no guarantee of future results. The investment return and principal value will fluctuate so that shares, when redeemed, may be worth more or less than the original cost. Please visit www.columbiafunds.com for daily and most recent month-end performance updates.
| | |
| Annual operating expense ratio (%)* |
| |
Class A | | 0.98 |
Class B | | 1.73 |
Class C | | 1.73 |
Class Z | | 0.73 |
| * | The annual operating expense ratio is as stated in the fund's prospectus that is current as of the date of this report. Differences in expense ratios disclosed elsewhere in this report may result from including fee waivers and expense reimbursements as well as different time periods used in calculating the ratios. |
|
| Performance of a $10,000 investment 04/01/00 – 03/31/10 |
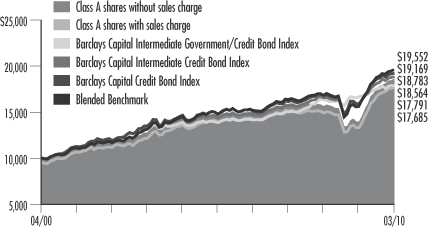
The chart above shows the change in value of a hypothetical $10,000 investment in Class A shares of Columbia Income Fund during the stated time period, and does not reflect the deduction of taxes that a shareholder may pay on fund distributions or on the redemption of fund shares.
| | | | |
| Performance of a $10,000 investment 04/01/00 – 03/31/10 ($) |
| | |
| Sales charge | | without | | with |
Class A | | 18,564 | | 17,685 |
Class B | | 17,523 | | 17,523 |
Class C | | 17,723 | | 17,723 |
Class Z | | 19,085 | | n/a |
| | | | | | | | | | | | | | |
| Average annual total return as of 03/31/10 (%) | | |
| | | | |
| Share class | | A | | B | | C | | Z |
| Inception | | 07/31/00 | | 07/15/02 | | 07/15/02 | | 03/05/86 |
| Sales charge | | without | | with | | without | | with | | without | | with | | without |
1-year | | 33.42 | | 27.07 | | 32.44 | | 27.44 | | 32.63 | | 31.63 | | 33.74 |
5-year | | 5.02 | | 4.01 | | 4.24 | | 3.92 | | 4.40 | | 4.40 | | 5.28 |
10-year | | 6.38 | | 5.87 | | 5.77 | | 5.77 | | 5.89 | | 5.89 | | 6.68 |
The “with sales charge” returns include the maximum initial sales charge of 4.75% for Class A shares and the applicable contingent deferred sales charge of 5.00% in the first year, declining to 1.00% in the sixth year and eliminated thereafter for Class B shares and 1.00% for Class C shares for the first year only. The “without sales charge” returns do not include the effect of sales charges. If they had, returns would be lower.
Performance results reflect any fee waivers or reimbursements of fund expenses by the investment advisor and/or any of its affiliates. Absent these fee waivers or expense reimbursement arrangements, performance results would have been lower.
All results shown assume reinvestment of distributions. Class Z shares are sold at net asset value with no distribution and service (Rule 12b-1) fees. Class Z shares have limited eligibility and the investment minimum requirements may vary. Please see the fund’s prospectus for details. Performance for different share classes will vary based on differences in sales charges and fees associated with each class.
The tables do not reflect the deduction of taxes that a shareholder may pay on fund distributions or on the redemption of fund shares.
4
Performance Information (continued) – Columbia Income Fund
Class A, Class B and Class C are newer classes of shares. Class A share performance information includes the returns of Class Z shares (the oldest existing share class) for periods prior to its inception. Class B and Class C share performance information includes returns of Class A shares for the period from July 31, 2000 through July 14, 2002, and the returns of Class Z shares for periods prior thereto. These returns reflect differences in sales charges, but have not been restated to reflect any differences in expenses (such as distribution and service (Rule 12b-1) fees) between Class Z shares and the newer classes of shares or between Class A shares, Class B shares and Class C shares. If differences in expenses had been reflected, the returns shown for periods prior to the inception of the newer classes of shares would have been lower, Class A shares were initially offered on July 31, 2000, Class B shares and Class C shares were initially offered on July 15, 2002, and Class Z shares were initially offered on March 5, 1986.
5
Understanding Your Expenses – Columbia Income Fund
Estimating your actual expenses
To estimate the expenses that you paid over the period, first you will need your account balance at the end of the period:
| | n | | For shareholders who receive their account statements from Columbia Management Services, Inc., your account balance is available online at www.columbiafunds.com or by calling Shareholder Services at 800.345.6611. | |
| | n | | For shareholders who receive their account statements from their financial intermediary, contact your financial intermediary to obtain your account balance. | |
| | 1. | Divide your ending account balance by $1,000. For example, if an account balance was $8,600 at the end of the period, the result would be 8.6. | |
| | 2. | In the section of the table below titled “Expenses paid during the period,” locate the amount for your share class. You will find this number in the column labeled “Actual.” Multiply this number by the result from step 1. Your answer is an estimate of the expenses you paid on your account during the period. | |
If the value of your account falls below the minimum initial investment requirement applicable to you, your account generally will be subject to a $20 annual fee. This fee is not included in the accompanying table. If you are subject to the fee, keep it in mind when you are estimating the ongoing expenses of investing in the fund and when comparing the expenses of this fund with other funds.
As a fund shareholder, you incur two types of costs. There are transaction costs, which generally include sales charges on purchases and may include redemption fees or exchange fees. There are also ongoing costs, which generally include investment advisory fees, distribution and service (Rule 12b-1) fees and other fund expenses. The information on this page is intended to help you understand the ongoing costs of investing in the fund and to compare these costs with the ongoing costs of investing in other mutual funds.
Analyzing your fund’s expenses by share class
To illustrate these ongoing costs, we have provided an example and calculated the expenses paid by investors in each share class during the period. The information in the following table is based on an initial investment of $1,000, which is invested at the beginning of the period and held for the entire period. Expense information is calculated two ways and each method provides you with different information. The amount listed in the “Actual” column is calculated using the fund’s actual operating expenses and total return for the period. The amount listed in the “Hypothetical” column for each share class assumes that the return each year is 5% before expenses and is calculated based on the fund’s actual operating expenses. You should not use the hypothetical account values and expenses to estimate either your actual account balance at the end of the period or the expenses you paid during this period.
Compare with other funds
Since all mutual funds are required to include the same hypothetical calculations about expenses in shareholder reports, you can use this information to compare the ongoing cost of investing in the fund with other funds. To do so, compare the 5% hypothetical example with the 5% hypothetical examples that appear in the shareholder reports of other funds. As you compare hypothetical examples of other funds, it is important to note that hypothetical examples are meant to highlight the ongoing cost of investing in a fund and do not reflect any transaction costs, such as sales charges, redemption fees or exchange fees.
| | | | | | | | | | | | | | |
| 10/01/09 – 03/31/10 |
| | | | |
| | | Account value at the
beginning of the period ($) | | Account value at the
end of the period ($) | | Expenses paid
during the period ($) | | Fund's annualized
expense ratio (%) |
| | | Actual | | Hypothetical | | Actual | | Hypothetical | | Actual | | Hypothetical | | Actual |
Class A | | 1,000.00 | | 1,000.00 | | 1,059.90 | | 1,020.19 | | 4.88 | | 4.78 | | 0.95 |
Class B | | 1,000.00 | | 1,000.00 | | 1,056.00 | | 1,016.45 | | 8.71 | | 8.55 | | 1.70 |
Class C | | 1,000.00 | | 1,000.00 | | 1,056.70 | | 1,017.20 | | 7.95 | | 7.80 | | 1.55 |
Class Z | | 1,000.00 | | 1,000.00 | | 1,061.20 | | 1,021.44 | | 3.60 | | 3.53 | | 0.70 |
Expenses paid during the period are equal to the annualized expense ratio for the share class, multiplied by the average account value over the period, then multiplied by the number of days in the fund’s most recent fiscal half-year and divided by 365.
Had the investment advisor and/or any of its affiliates not waived fees or reimbursed a portion of Class C expenses, Class C account value at the end of the period would have been reduced.
It is important to note that the expense amounts shown in the table are meant to highlight only ongoing costs of investing in the fund and do not reflect any transaction costs, such as sales charges, redemption fees or exchange fees. Therefore, the hypothetical examples provided may not help you determine the relative total costs of owning shares of different funds. If these transaction costs were included, your costs would have been higher.
6
Portfolio Managers’ Report – Columbia Income Fund
Performance data quoted represents past performance and current performance may be lower or higher. Past performance is no guarantee of future results. The investment return and principal value will fluctuate so that shares, when redeemed, may be worth more or less than the original cost. Please visit www.columbiafunds.com for daily and most recent month-end performance updates.
| | |
| Net asset value per share |
|
as of 03/31/10 ($) |
Class A | | 9.53 |
Class B | | 9.53 |
Class C | | 9.53 |
Class Z | | 9.53 |
| | |
| Distributions declared per share |
|
04/01/09 – 03/31/10 ($) |
Class A | | 0.57 |
Class B | | 0.51 |
Class C | | 0.52 |
Class Z | | 0.60 |
For the 12-month period that ended March 31, 2010, the fund’s Class A shares returned 33.42% without sales charge. The fund’s return exceeded the returns of its benchmarks, the Barclays Capital Credit Bond Index and a blended benchmark (a weighted custom composite of the Barclays Capital Credit Bond Index (85%) and JPMorgan Global High Yield Index (15%)), which were 20.83% and 25.75%, respectively, for the same period. The fund also outperformed the average fund in its peer group, the Lipper Corporate Debt Funds BBB-Rated Classification, which had an average return of 29.03% for the 12-month period. A heavy weight in investment-grade bonds and high-yield holdings, the latter of which are not part of the index, generally accounted for the fund’s strong performance.
Corporate bonds responded to an improving outlook
In a complete reversal from last year, corporate bonds staged a striking reversal, rebounding from the precipitous declines triggered by the credit crisis to record substantial gains. Aggressive government programs and a very accommodative Federal Reserve Board (the Fed) helped recapitalize corporate America and restore liquidity to the markets, heading off fears of a financial collapse. Investors began shedding low-risk holdings to pursue greater returns, as confident buyers scooped up beaten-down issues across the ratings spectrum and in a variety of industries. U.S. Treasury and agency bonds underperformed as investors sought better prospects elsewhere.
Sector allocation decisions drove strong results
Most of the fund’s outperformance relative to its benchmarks stems from a decision early last year to emphasize investment-grade and high-yield holdings. These sectors had fallen sharply during the credit crisis, leaving valuations depressed and yields relative to Treasuries at historically wide levels. We took advantage of these conditions to build overweight positions in investment-grade bonds. We also expanded high-yield holdings because we believed that lower-rated issues had the potential for significant gains in a recovering economy. Security selection within corporate sectors also added to returns. The fund’s emphasis on bank debt was productive, as was our choice of bonds that rank behind other bonds in a company’s capital structure and therefore offer higher yields.
Amid questions of capital adequacy in the banking industry, JPMorgan Chase’s (2.2% of net assets) debt rose because of the company’s comparatively small capital needs. MetLife (2.5% of net assets), whose capital was not in question, eliminated some real estate holdings and bought attractively priced assets at discounted prices from AIG. International Lease Finance (0.8% of net assets), an aircraft leasing company, also contributed. We added bonds of Citigroup (1.7% of net assets) when depressed prices resulted in a very high yield. Citi moved to strengthen its balance sheet and its securities responded favorably.
7
Portfolio Managers’ Report (continued) – Columbia Income Fund
| | |
| 30-day SEC yields | | |
as of 03/31/10 (%) | | |
Class A | | 4.71 |
Class B | | 4.24 |
Class C | | 4.40 |
Class Z | | 5.25 |
The 30-day SEC yields reflect the fund’s earning power, net of expenses, expressed as an annualized percentage of the public offering price per share at the end of the period.
| | | |
| Portfolio structure | | | |
as of 03/31/10 (%) | | | |
Corporate Fixed-Income Bonds & Notes | | 90.4 | |
Asset-Backed Securities | | 4.2 | |
Government & Agency Obligations | | 2.0 | |
Commercial Mortgage-Backed Securities | | 1.2 | |
Municipal Bonds | | 0.5 | |
Collateralized Mortgage Obligations | | 0.1 | |
Mortgage-Backed Securities | | 0.0 | * |
Warrants | | 0.0 | * |
Preferred Stock | | 0.0 | * |
Short-Term Obligation | | 0.1 | |
Other Assets & Liabilities, Net | | 1.5 | |
* Represents less than 0.1% of net assets.
| | |
| Quality breakdown | | |
as of 03/31/10 (%) | | |
Treasury | | 1.5 |
Agency | | 0.2 |
AAA | | 4.4 |
AA | | 9.5 |
A | | 25.2 |
BBB | | 42.8 |
BB | | 8.2 |
B | | 5.7 |
CCC | | 2.0 |
CC | | 0.1 |
Not Rated | | 0.2 |
Cash & Equivalents | | 0.2 |
| | |
| Maturity breakdown | | |
as of 03/31/10 (%) | | |
0 - 1 year | | 2.9 |
1 - 2 year | | 3.5 |
2 - 3 years | | 2.5 |
3 - 4 years | | 7.9 |
4 - 5 years | | 10.7 |
5 - 6 years | | 4.3 |
6 - 7 years | | 7.7 |
7 - 8 years | | 7.7 |
8 - 9 years | | 7.5 |
9 - 10 years | | 10.2 |
10 - 20 years | | 3.5 |
20 - 30 years | | 27.1 |
30 years and over | | 4.3 |
Cash & Equivalents | | 0.2 |
Portfolio structure is calculated as a percentage of net assets.
Quality and maturity breakdowns are calculated as a percentage of total investments. Ratings shown in the quality breakdown represent the rating assigned by one of the following nationally-recognized rating agencies: Standard and Poor’s, Moody’s Investors Service, Inc. or Fitch Ratings Ltd. Ratings are relative and subjective and are not absolute standards of quality. The fund’s credit quality does not remove market risk.
The fund is actively managed and the composition of its portfolio will change over time.
Looking ahead
With the economy on firmer footing, we believe the Fed will temper its accommodative stance and raise short-term interest rates late in 2010. Short-term rates are currently near zero, so a modest rate increase seems unlikely to disrupt the markets.
We believe that corporate and high-yield bonds should continue to perform well overall. Nevertheless, given how far the recent rally has come, we think it prudent to reduce some of the fund’s risk exposure by reducing its position in corporate bonds from a large overweight to a modest overweight.
Portfolio holdings and characteristics are subject to change periodically and may not be representative of current holdings and characteristics. The outlook for the fund may differ from those presented for other Columbia Funds.
Investing in fixed-income securities may involve certain risks, including the credit quality of individual issuers, possible prepayments, market or economic developments and yield and share price fluctuations due to changes in interest rates. When interest rates go up, bond prices typically drop, and vice versa.
Investments in high-yield bonds (sometimes referred to as “junk bonds”) offer the potential for high current income and attractive total return, but involve certain risks. Changes in economic conditions or other circumstances may adversely affect a high-yield bond issuer’s ability to make principal and interest payments.
8
Investment Portfolio – Columbia Income Fund
March 31, 2010
Corporate Fixed-Income Bonds and Notes – 90.4%
| | | | |
| | | Par ($) (a) | | Value ($) |
| Basic Materials – 5.2% | | | | |
| Chemicals – 3.0% | | |
| Dow Chemical Co. | | |
5.900% 02/15/15 | | 4,390,000 | | 4,752,719 |
8.550% 05/15/19 | | 1,440,000 | | 1,742,027 |
9.400% 05/15/39 | | 4,845,000 | | 6,494,427 |
| | |
| Georgia Gulf Corp. | | | | |
9.000% 01/15/17 (b) | | 80,000 | | 83,700 |
| | |
| Huntsman International LLC | | | | |
7.875% 11/15/14 | | 275,000 | | 277,750 |
| | |
| INEOS Group Holdings PLC | | | | |
8.500% 02/15/16 (b) | | 685,000 | | 565,125 |
| | |
| INVISTA | | | | |
9.250% 05/01/12 (b) | | 485,000 | | 491,063 |
| | |
| Lubrizol Corp. | | | | |
6.500% 10/01/34 | | 170,000 | | 175,943 |
8.875% 02/01/19 | | 715,000 | | 901,800 |
| | |
| NOVA Chemicals Corp. | | | | |
8.375% 11/01/16 (b) | | 160,000 | | 164,400 |
8.625% 11/01/19 (b) | | 160,000 | | 164,800 |
| | |
| Solutia, Inc. | | | | |
8.750% 11/01/17 | | 325,000 | | 342,875 |
| | |
| Terra Capital, Inc. | | | | |
7.750% 11/01/19 | | 230,000 | | 277,725 |
| | | | |
Chemicals Total | | | | 16,434,354 |
| | |
| Forest Products & Paper – 0.4% | | | | |
| Clearwater Paper Corp. | | | | |
10.625% 06/15/16 (b) | | 145,000 | | 160,950 |
| | |
| Domtar Corp. | | | | |
10.750% 06/01/17 | | 125,000 | | 151,875 |
| | |
| Georgia-Pacific Corp. | | | | |
8.000% 01/15/24 | | 480,000 | | 508,800 |
| | |
| NewPage Corp. | | | | |
10.000% 05/01/12 | | 535,000 | | 371,156 |
11.375% 12/31/14 | | 210,000 | | 208,950 |
| | |
| PE Paper Escrow GmbH | | | | |
12.000% 08/01/14 (b) | | 475,000 | | 536,750 |
| | | | |
Forest Products & Paper Total | | | | 1,938,481 |
| | |
| Iron/Steel – 0.9% | | | | |
| Arcelor Mittal | | | | |
7.000% 10/15/39 | | 2,430,000 | | 2,495,566 |
9.850% 06/01/19 | | 165,000 | | 209,715 |
| | | | |
| | | Par ($) (a) | | Value ($) |
| Nucor Corp. | | | | |
5.000% 06/01/13 | | 1,280,000 | | 1,383,048 |
| | |
| Russel Metals, Inc. | | | | |
6.375% 03/01/14 | | 300,000 | | 280,875 |
| | |
| Steel Dynamics, Inc. | | | | |
7.750% 04/15/16 (04/07/10) (c)(d) | | 350,000 | | 365,750 |
| |
| United States Steel Corp. | | |
7.000% 02/01/18 | | 210,000 | | 206,850 |
| | | | |
Iron/Steel Total | | | | 4,941,804 |
| | |
| Metals & Mining – 0.9% | | | | |
| FMG Finance Ltd. | | | | |
10.625% 09/01/16 (b) | | 615,000 | | 708,788 |
| |
| Freeport-McMoRan Copper & Gold, Inc. | | |
8.375% 04/01/17 | | 180,000 | | 200,250 |
| |
| Noranda Aluminium Holding Corp. | | |
PIK, | | | | |
7.024% 11/15/14 (05/15/10) (c)(d) | | 369,523 | | 252,555 |
| | |
| Teck Resources Ltd. | | | | |
10.750% 05/15/19 | | 520,000 | | 637,000 |
| | |
| Vale Overseas Ltd. | | | | |
6.875% 11/21/36 | | 2,650,000 | | 2,741,557 |
| | |
| Vedanta Resources PLC | | | | |
9.500% 07/18/18 (b) | | 600,000 | | 663,000 |
| | | | |
Metals & Mining Total | | | | 5,203,150 |
| | | | |
Basic Materials Total | | | | 28,517,789 |
| | | | |
| Communications – 10.7% |
| Advertising – 0.0% | | |
| Interpublic Group of Companies, Inc. | | |
6.250% 11/15/14 | | 100,000 | | 100,625 |
| | | | |
Advertising Total | | | | 100,625 |
| | |
| Media – 4.8% | | | | |
| CCH II LLC/CCH II Capital Corp. | | |
13.500% 11/30/16 | | 480,362 | | 577,635 |
| |
| Cengage Learning Acquisitions, Inc. | | |
10.500% 01/15/15 (b) | | 215,000 | | 206,400 |
| |
| Cequel Communications Holdings I LLC & Cequel Capital Corp. | | |
8.625% 11/15/17 (b) | | 165,000 | | 169,538 |
See Accompanying Notes to Financial Statements.
9
Columbia Income Fund
March 31, 2010
Corporate Fixed-Income Bonds and Notes (continued)
| | | | |
| | | Par ($) (a) | | Value ($) |
| Communications (continued) |
Clear Channel Worldwide
Holdings, Inc. | | |
9.250% 12/15/17 (b) | | 195,000 | | 203,775 |
| |
| CMP Susquehanna Corp. | | |
3.250% 05/15/14 (05/14/10) (c)(d)(e) | | 30,000 | | 17,700 |
| | |
| Comcast Corp. | | | | |
6.950% 08/15/37 | | 5,080,000 | | 5,495,635 |
| |
| CSC Holdings, Inc. | | |
8.500% 04/15/14 (b) | | 665,000 | | 708,225 |
| |
| DirecTV Holdings LLC | | |
6.375% 06/15/15 | | 1,120,000 | | 1,163,400 |
| |
| DISH DBS Corp. | | |
6.625% 10/01/14 | | 255,000 | | 256,912 |
7.875% 09/01/19 | | 260,000 | | 270,400 |
| |
| Liberty Media LLC | | |
8.250% 02/01/30 | | 445,000 | | 414,406 |
| |
| Local TV Finance LLC | | |
PIK, | | | | |
9.250% 06/15/15 (b) | | 253,575 | | 159,186 |
| | |
| News America, Inc. | | | | |
6.400% 12/15/35 | | 1,780,000 | | 1,817,651 |
6.550% 03/15/33 | | 500,000 | | 507,332 |
| |
| Sinclair Television Group, Inc. | | |
9.250% 11/01/17 (b) | | 280,000 | | 294,700 |
| | |
| Sirius XM Radio, Inc. | | | | |
9.750% 09/01/15 (b) | | 565,000 | | 610,200 |
| | |
| Time Warner Cable, Inc. | | | | |
3.500% 02/01/15 | | 9,660,000 | | 9,668,172 |
5.000% 02/01/20 | | 2,759,000 | | 2,720,322 |
5.850% 05/01/17 | | 1,120,000 | | 1,199,241 |
| | | | |
Media Total | | | | 26,460,830 |
| |
| Telecommunication Services – 5.9% | | |
| AT&T, Inc. | | | | |
5.625% 06/15/16 | | 1,645,000 | | 1,803,446 |
6.550% 02/15/39 | | 1,830,000 | | 1,923,773 |
| |
| British Telecommunications PLC | | |
5.950% 01/15/18 | | 3,390,000 | | 3,480,164 |
9.625% 12/15/30 | | 3,500,000 | | 4,407,476 |
| |
Cellco Partnership/Verizon Wireless
Capital LLC | | |
5.550% 02/01/14 | | 2,640,000 | | 2,885,103 |
| | | | |
| | | Par ($) (a) | | Value ($) |
| Clearwire Communications LLC/Clearwire Finance, Inc. | | |
12.000% 12/01/15 (b) | | 470,000 | | 479,013 |
| |
| Cricket Communications, Inc. | | |
9.375% 11/01/14 | | 375,000 | | 381,563 |
| |
| Crown Castle International Corp. | | |
9.000% 01/15/15 | | 310,000 | | 335,575 |
| | |
| Digicel Group Ltd. | | | | |
8.875% 01/15/15 (b) | | 695,000 | | 682,837 |
| |
| Frontier Communications Corp. | | |
7.875% 01/15/27 | | 860,000 | | 774,000 |
| | |
| GeoEye, Inc. | | | | |
9.625% 10/01/15 (b) | | 460,000 | | 470,350 |
| | |
| Global Crossing Ltd. | | | | |
12.000% 09/15/15 (b) | | 540,000 | | 599,400 |
| |
| Intelsat Jackson Holdings Ltd. | | |
11.250% 06/15/16 | | 285,000 | | 308,513 |
| |
| Intelsat Luxembourg SA | | |
11.250% 02/04/17 | | 780,000 | | 824,850 |
| |
| Level 3 Financing, Inc. | | |
8.750% 02/15/17 | | 265,000 | | 242,475 |
| |
| Lucent Technologies, Inc. | | |
6.450% 03/15/29 | | 885,000 | | 623,925 |
| |
| MetroPCS Wireless, Inc. | | |
9.250% 11/01/14 | | 415,000 | | 424,337 |
| |
| Nextel Communications, Inc. | | |
7.375% 08/01/15 | | 755,000 | | 717,250 |
|
| Nielsen Finance LLC/Nielsen Finance Co. |
11.500% 05/01/16 | | 225,000 | | 254,250 |
| | |
| NII Capital Corp. | | | | |
10.000% 08/15/16 (b) | | 210,000 | | 229,950 |
| |
| Nordic Telephone Co. Holdings ApS | | |
8.875% 05/01/16 (b) | | 430,000 | | 461,175 |
| | |
| Quebecor Media, Inc. | | | | |
7.750% 03/15/16 | | 615,000 | | 622,688 |
| |
| Qwest Communications International, Inc. | | |
7.500% 02/15/14 | | 540,000 | | 549,450 |
| | |
| Qwest Corp. | | | | |
7.500% 06/15/23 | | 400,000 | | 400,000 |
See Accompanying Notes to Financial Statements.
10
Columbia Income Fund
March 31, 2010
Corporate Fixed-Income Bonds and Notes (continued)
| | | | |
| | | Par ($) (a) | | Value ($) |
| Communications (continued) |
| SBA Telecommunications, Inc. | | |
8.250% 08/15/19 (b) | | 205,000 | | 218,325 |
| | |
| Sprint Capital Corp. | | | | |
6.875% 11/15/28 | | 215,000 | | 173,075 |
| |
| Syniverse Technologies, Inc. | | |
7.750% 08/15/13 | | 280,000 | | 282,100 |
| |
| Telefonica Emisiones SAU | | |
6.221% 07/03/17 | | 760,000 | | 833,466 |
6.421% 06/20/16 | | 2,900,000 | | 3,221,671 |
| |
| Verizon Communications, Inc. | | |
8.950% 03/01/39 | | 1,500,000 | | 2,034,099 |
| |
| Virgin Media Finance PLC | | |
9.500% 08/15/16 | | 540,000 | | 589,950 |
| | |
| West Corp. | | | | |
11.000% 10/15/16 | | 270,000 | | 286,200 |
| |
| Wind Acquisition Finance SA | | |
11.750% 07/15/17 (b) | | 592,000 | | 654,160 |
11.750% 07/15/17 (b) | | EUR 225,000 | | 337,325 |
12.000% 12/01/15 (b) | | 65,000 | | 70,200 |
| | |
| Windstream Corp. | | | | |
8.625% 08/01/16 | | 340,000 | | 347,650 |
| | | | |
Telecommunication Services Total | | 32,929,784 |
| | | | |
Communications Total | | 59,491,239 |
| | | | |
| Consumer Cyclical – 5.0% |
| Airlines – 0.6% | | | | |
| American Airlines, Inc. | | |
10.500% 10/15/12 (b) | | 245,000 | | 260,925 |
| |
| Continental Airlines, Inc. | | |
7.461% 04/01/15 | | 3,281,066 | | 3,240,053 |
| | | | |
Airlines Total | | | | 3,500,978 |
| |
| Apparel – 0.0% | | |
| Levi Strauss & Co. | | | | |
9.750% 01/15/15 | | 30,000 | | 31,425 |
| | | | |
Apparel Total | | | | 31,425 |
| |
| Auto Manufacturers – 0.1% | | |
| General Motors Corp. | | | | |
7.200% 01/15/11 (f) | | 390,000 | | 143,325 |
8.375% 07/15/33 (f) | | 810,000 | | 303,750 |
| |
| Navistar International Corp. | | |
8.250% 11/01/21 | | 195,000 | | 198,900 |
| | | | |
Auto Manufacturers Total | | 645,975 |
| | | | |
| | | Par ($) (a) | | Value ($) |
| Auto Parts & Equipment – 0.2% | | |
| Goodyear Tire & Rubber Co. | | |
10.500% 05/15/16 | | 520,000 | | 561,600 |
| | |
| Lear Corp. | | | | |
7.875% 03/15/18 | | 40,000 | | 40,450 |
8.125% 03/15/20 | | 40,000 | | 40,650 |
| | |
| TRW Automotive, Inc. | | | | |
7.000% 03/15/14 (b) | | 305,000 | | 300,425 |
| | | | |
Auto Parts & Equipment Total | | 943,125 |
| |
| Distribution/Wholesale – 0.0% | | |
| McJunkin Red Man Corp. | | | | |
9.500% 12/15/16 (b) | | 220,000 | | 224,675 |
| | | | |
Distribution/Wholesale Total | | 224,675 |
| | |
| Entertainment – 0.4% | | | | |
American Casino & Entertainment
Properties LLC | | |
11.000% 06/15/14 | | 120,000 | | 112,500 |
| | |
| Boyd Gaming Corp. | | | | |
6.750% 04/15/14 | | 425,000 | | 370,812 |
7.125% 02/01/16 | | 20,000 | | 16,700 |
| |
| Jacobs Entertainment, Inc. | | |
9.750% 06/15/14 | | 360,000 | | 338,400 |
| |
| Mohegan Tribal Gaming Authority | | |
11.500% 11/01/17 (b) | | 315,000 | | 335,475 |
| |
| Pinnacle Entertainment, Inc. | | |
8.625% 08/01/17 (b) | | 210,000 | | 205,275 |
| | |
| Six Flags, Inc. | | | | |
9.625% 06/01/14 (f) | | 259,000 | | 81,585 |
| | |
| WMG Acquisition Corp. | | | | |
7.375% 04/15/14 | | 380,000 | | 364,800 |
| | |
| WMG Holdings Corp. | | | | |
9.500% 12/15/14 | | 345,000 | | 347,588 |
| | | | |
Entertainment Total | | | | 2,173,135 |
| | |
| Home Builders – 0.3% | | | | |
| D.R. Horton, Inc. | | | | |
5.625% 09/15/14 | | 440,000 | | 435,600 |
5.625% 01/15/16 | | 185,000 | | 177,831 |
| | |
| KB Home | | | | |
5.875% 01/15/15 | | 345,000 | | 326,888 |
| | |
| Ryland Group, Inc. | | | | |
8.400% 05/15/17 | | 180,000 | | 195,750 |
See Accompanying Notes to Financial Statements.
11
Columbia Income Fund
March 31, 2010
Corporate Fixed-Income Bonds and Notes (continued)
| | | | |
| | | Par ($) (a) | | Value ($) |
| Consumer Cyclical (continued) |
| Standard Pacific Corp. | | | | |
7.000% 08/15/15 | | 390,000 | | 360,750 |
| | | | |
Home Builders Total | | | | 1,496,819 |
| | |
| Leisure Time – 0.1% | | | | |
| Royal Caribbean Cruises Ltd. | | |
7.500% 10/15/27 | | 400,000 | | 353,000 |
| | | | |
Leisure Time Total | | | | 353,000 |
| | |
| Lodging – 0.4% | | | | |
| Harrah’s Operating Co., Inc. | | |
10.000% 12/15/18 | | 282,000 | | 233,355 |
11.250% 06/01/17 | | 385,000 | | 414,837 |
| |
| Host Hotels & Resorts LP | | |
6.750% 06/01/16 | | 375,000 | | 375,938 |
| |
| Mashantucket Western Pequot Tribe | | |
8.500% 11/15/15 (b)(g) | | 485,000 | | 121,250 |
| | |
| MGM Mirage | | | | |
6.750% 09/01/12 | | 365,000 | | 344,925 |
| |
| Seminole Indian Tribe of Florida | | |
7.804% 10/01/20 (b) | | 535,000 | | 498,652 |
| |
| Snoqualmie Entertainment Authority | | |
9.125% 02/01/15 (b) | | 240,000 | | 184,800 |
| |
Starwood Hotels & Resorts
Worldwide, Inc. | | |
6.750% 05/15/18 | | 100,000 | | 100,250 |
| | | | |
Lodging Total | | | | 2,274,007 |
| | |
| Retail – 2.9% | | | | |
| AmeriGas Partners LP | | | | |
7.125% 05/20/16 | | 165,000 | | 166,650 |
7.250% 05/20/15 | | 75,000 | | 76,125 |
| Best Buy Co., Inc. | | | | |
6.750% 07/15/13 | | 2,755,000 | | 3,083,603 |
| | |
| CVS Pass-Through Trust | | | | |
5.298% 01/11/27 (b) | | 1,858,566 | | 1,768,701 |
6.036% 12/10/28 | | 1,971,829 | | 1,950,198 |
8.353% 07/10/31 (b) | | 3,901,629 | | 4,531,117 |
| | |
| Dollar General Corp. | | | | |
10.625% 07/15/15 | | 335,000 | | 367,662 |
| |
| General Nutrition Centers, Inc. | | |
PIK, | | | | |
4.893% 03/15/14 (09/15/10) (c)(d) | | 140,000 | | 132,475 |
| | | | |
| | | Par ($) (a) | | Value ($) |
| Inergy LP/Inergy Finance Corp. | | |
8.250% 03/01/16 | | 235,000 | | 242,050 |
8.750% 03/01/15 | | 320,000 | | 334,800 |
| |
| Landry’s Restaurants, Inc. | | |
11.625% 12/01/15 (b) | | 245,000 | | 263,375 |
| | |
| Limited Brands, Inc. | | | | |
8.500% 06/15/19 | | 255,000 | | 284,325 |
| |
| Macy’s Retail Holdings, Inc. | | |
5.350% 03/15/12 | | 645,000 | | 677,250 |
| | |
| McDonald’s Corp. | | | | |
5.700% 02/01/39 | | 1,460,000 | | 1,453,721 |
| | |
| Rite Aid Corp. | | | | |
9.500% 06/15/17 | | 270,000 | | 226,800 |
| | |
| Starbucks Corp. | | | | |
6.250% 08/15/17 | | 120,000 | | 130,117 |
| | |
| Toys R US, Inc. | | | | |
7.375% 10/15/18 | | 420,000 | | 403,200 |
| | | | |
Retail Total | | | | 16,092,169 |
|
| Storage/Warehousing – 0.0% |
| Niska Gas Storage U.S. LLC/Niska Gas Storage Canada ULC | | |
8.875% 03/15/18 (b) | | 190,000 | | 194,275 |
| | | | |
Storage/Warehousing Total | | 194,275 |
| | | | |
Consumer Cyclical Total | | 27,929,583 |
| | | | |
| Consumer Non-Cyclical – 7.7% |
| Beverages – 1.5% | | | | |
| Anheuser-Busch InBev Worldwide, Inc. | | |
7.200% 01/15/14 (b) | | 4,275,000 | | 4,897,560 |
7.750% 01/15/19 (b) | | 535,000 | | 636,319 |
8.000% 11/15/39 (b) | | 2,270,000 | | 2,872,392 |
| | | | |
Beverages Total | | | | 8,406,271 |
| |
| Commercial Services – 0.4% | | |
| ACE Cash Express, Inc. | | | | |
10.250% 10/01/14 (b) | | 220,000 | | 180,950 |
| | |
| ARAMARK Corp. | | | | |
8.500% 02/01/15 | | 565,000 | | 577,713 |
| | |
| Ashtead Holdings PLC | | | | |
8.625% 08/01/15 (b) | | 255,000 | | 255,000 |
| |
| Corrections Corp. of America | | |
6.250% 03/15/13 | | 315,000 | | 319,331 |
| | |
| Iron Mountain, Inc. | | | | |
8.000% 06/15/20 | | 100,000 | | 102,500 |
See Accompanying Notes to Financial Statements.
12
Columbia Income Fund
March 31, 2010
Corporate Fixed-Income Bonds and Notes (continued)
| | | | |
| | | Par ($) (a) | | Value ($) |
| Consumer Non-Cyclical (continued) |
| Rental Service Corp. | | | | |
9.500% 12/01/14 | | 425,000 | | 420,750 |
| |
| Service Corp. International | | |
6.750% 04/01/16 | | 220,000 | | 215,600 |
7.000% 06/15/17 | | 75,000 | | 73,500 |
| | | | |
Commercial Services Total | | 2,145,344 |
| |
| Cosmetics/Personal Care – 0.0% | | |
| Revlon Consumer Products Corp. | | |
9.750% 11/15/15 (b) | | 80,000 | | 82,600 |
| | | | |
Cosmetics/Personal Care Total | | 82,600 |
| | |
| Food – 2.8% | | | | |
| Campbell Soup Co. | | | | |
4.500% 02/15/19 | | 1,460,000 | | 1,485,562 |
| | |
| ConAgra Foods, Inc. | | | | |
7.000% 10/01/28 | | 2,385,000 | | 2,601,470 |
| |
| JBS USA LLC/JBS USA Finance, Inc. | | |
11.625% 05/01/14 (b) | | 360,000 | | 410,400 |
| | |
| Kraft Foods, Inc. | | | | |
6.500% 02/09/40 | | 7,310,000 | | 7,575,214 |
| | |
| Kroger Co. | | | | |
8.000% 09/15/29 | | 1,581,000 | | 1,926,409 |
| | |
| New Albertsons, Inc. | | | | |
8.000% 05/01/31 | | 375,000 | | 322,500 |
| |
| Pinnacle Foods Finance LLC | | |
9.250% 04/01/15 | | 305,000 | | 312,625 |
9.250% 04/01/15 (b) | | 160,000 | | 164,000 |
| | |
| Smithfield Foods, Inc. | | | | |
10.000% 07/15/14 (b) | | 470,000 | | 524,050 |
| | | | |
Food Total | | | | 15,322,230 |
| |
| Healthcare Products – 0.2% | | |
| Biomet, Inc. | | | | |
PIK, | | | | |
10.375% 10/15/17 | | 870,000 | | 957,000 |
| | | | |
Healthcare Products Total | | 957,000 |
| |
| Healthcare Services – 1.4% | | |
| Community Health Systems, Inc. | | |
8.875% 07/15/15 | | 560,000 | | 579,600 |
| | |
| DaVita, Inc. | | | | |
7.250% 03/15/15 | | 295,000 | | 300,900 |
| | | | |
| | | Par ($) (a) | | Value ($) |
| HCA, Inc. | | | | |
9.250% 11/15/16 | | 295,000 | | 313,622 |
PIK, | | | | |
9.625% 11/15/16 | | 1,392,000 | | 1,491,180 |
| | |
| Health Net, Inc. | | | | |
6.375% 06/01/17 | | 465,000 | | 432,450 |
| | |
| Healthsouth Corp. | | | | |
8.125% 02/15/20 | | 165,000 | | 164,175 |
10.750% 06/15/16 | | 270,000 | | 291,938 |
| | |
| Roche Holdings, Inc. | | | | |
6.000% 03/01/19 (b) | | 1,470,000 | | 1,624,534 |
| |
| U.S. Oncology Holdings, Inc. | | |
PIK, | | | | |
6.643% 03/15/12 (09/15/10) (c)(d) | | 408,621 | | 385,326 |
| | |
| U.S. Oncology, Inc. | | | | |
9.125% 08/15/17 | | 310,000 | | 323,950 |
| | |
| WellPoint, Inc. | | | | |
7.000% 02/15/19 | | 1,485,000 | | 1,683,969 |
| | | | |
Healthcare Services Total | | 7,591,644 |
| |
| Household Products/Wares – 0.0% | | |
| American Greetings Corp. | | |
7.375% 06/01/16 | | 255,000 | | 254,362 |
| | | | |
Household Products/Wares Total | | 254,362 |
| |
| Pharmaceuticals – 1.4% | | |
| Abbott Laboratories | | |
5.600% 05/15/11 | | 1,000,000 | | 1,050,921 |
| | |
| Elan Finance PLC | | | | |
4.250% 11/15/11 (05/15/10) (c)(d) | | 265,000 | | 260,363 |
8.875% 12/01/13 | | 195,000 | | 200,850 |
| |
| Novartis Securities Investment Ltd. | | |
5.125% 02/10/19 | | 3,290,000 | | 3,487,008 |
| | |
| Omnicare, Inc. | | | | |
6.750% 12/15/13 | | 215,000 | | 216,075 |
6.875% 12/15/15 | | 25,000 | | 24,531 |
| |
| Valeant Pharmaceuticals International | | |
8.375% 06/15/16 (b) | | 390,000 | | 407,550 |
| | |
| Wyeth | | | | |
6.500% 02/01/34 | | 2,000,000 | | 2,229,318 |
| | | | |
Pharmaceuticals Total | | | | 7,876,616 |
| | | | |
Consumer Non-Cyclical Total | | 42,636,067 |
| | | | |
See Accompanying Notes to Financial Statements.
13
Columbia Income Fund
March 31, 2010
Corporate Fixed-Income Bonds and Notes (continued)
| | | | |
| | | Par ($) (a) | | Value ($) |
| Diversified – 0.0% | | | | |
| Diversified Holding Companies – 0.0% | | |
Reynolds Group Issuer, Inc./Reynolds
Group Issuer LLC | | |
7.750% 10/15/16 (b) | | 225,000 | | 231,187 |
| | | | |
Diversified Holding Companies Total | | 231,187 |
| | | | |
Diversified Total | | | | 231,187 |
| | | | |
| Energy – 10.9% | | | | |
| Coal – 0.2% | | | | |
| Arch Western Finance LLC | | |
6.750% 07/01/13 | | 350,000 | | 351,313 |
| |
| Cloud Peak Energy Resources LLC/Cloud Peak Energy Finance Corp. | | |
8.500% 12/15/19 (b) | | 170,000 | | 174,250 |
| | |
| Massey Energy Co. | | | | |
6.875% 12/15/13 | | 430,000 | | 435,912 |
| | | | |
Coal Total | | | | 961,475 |
| |
| Energy-Alternate Sources – 0.1% | | |
| Headwaters, Inc. | | | | |
11.375% 11/01/14 (b) | | 315,000 | | 328,781 |
| | | | |
Energy-Alternate Sources Total | | 328,781 |
| | |
| Oil & Gas – 5.9% | | | | |
| Antero Resources Finance Corp. | | |
9.375% 12/01/17 (b) | | 390,000 | | 401,700 |
| |
| Canadian Natural Resources Ltd. | | |
6.250% 03/15/38 | | 1,825,000 | | 1,887,136 |
| | |
| Chaparral Energy, Inc. | | | | |
8.875% 02/01/17 | | 235,000 | | 215,025 |
| | |
| Chesapeake Energy Corp. | | | | |
6.375% 06/15/15 | | 105,000 | | 103,163 |
| | |
| Cimarex Energy Co. | | | | |
7.125% 05/01/17 | | 475,000 | | 484,500 |
| | |
| Coffeyville Resources LLC | | | | |
10.875% 04/01/17 (b)(h) | | 275,000 | | 272,937 |
| | |
| Connacher Oil & Gas Ltd. | | | | |
11.750% 07/15/14 (b) | | 475,000 | | 524,875 |
| | |
| Devon Energy Corp. | | | | |
6.300% 01/15/19 | | 1,150,000 | | 1,283,591 |
| | |
| Forest Oil Corp. | | | | |
8.500% 02/15/14 | | 235,000 | | 247,925 |
| | |
| Frontier Oil Corp. | | | | |
8.500% 09/15/16 | | 230,000 | | 235,750 |
| | | | |
| | | Par ($) (a) | | Value ($) |
| Gazprom International SA | | |
7.201% 02/01/20 (b) | | 1,787,572 | | 1,899,295 |
| | |
| Hess Corp. | | | | |
7.300% 08/15/31 | | 2,870,000 | | 3,270,339 |
| |
Linn Energy LLC/Linn Energy
Finance Corp. | | |
8.625% 04/15/20 (b) | | 45,000 | | 45,056 |
| | |
| Marathon Oil Corp. | | | | |
6.000% 07/01/12 | | 320,000 | | 347,385 |
7.500% 02/15/19 | | 505,000 | | 593,175 |
| |
| Newfield Exploration Co. | | |
6.625% 04/15/16 | | 265,000 | | 269,637 |
| | |
| Nexen, Inc. | | | | |
5.875% 03/10/35 | | 2,070,000 | | 1,968,212 |
7.500% 07/30/39 | | 1,190,000 | | 1,357,412 |
| | |
| OPTI Canada, Inc. | | | | |
8.250% 12/15/14 | | 575,000 | | 540,500 |
| | |
| Penn Virginia Corp. | | | | |
10.375% 06/15/16 | | 255,000 | | 276,675 |
| |
| PetroHawk Energy Corp. | | |
7.875% 06/01/15 | | 320,000 | | 326,000 |
| | |
| Qatar Petroleum | | | | |
5.579% 05/30/11 (b) | | 350,070 | | 359,608 |
| |
| Quicksilver Resources, Inc. | | |
7.125% 04/01/16 | | 315,000 | | 299,250 |
| | |
| Range Resources Corp. | | | | |
7.500% 05/15/16 | | 205,000 | | 211,150 |
| |
| Ras Laffan Liquefied Natural Gas Co., Ltd. III | | |
5.832% 09/30/16 (b) | | 640,000 | | 682,803 |
5.838% 09/30/27 (b) | | 1,200,000 | | 1,164,600 |
| |
| Shell International Finance BV | | |
5.500% 03/25/40 | | 4,025,000 | | 3,945,579 |
| |
| Southwestern Energy Co. | | |
7.500% 02/01/18 | | 205,000 | | 222,425 |
| | |
| Talisman Energy, Inc. | | | | |
5.850% 02/01/37 | | 3,615,000 | | 3,465,256 |
7.750% 06/01/19 | | 4,311,000 | | 5,136,772 |
| | |
| Tesoro Corp. | | | | |
6.625% 11/01/15 | | 450,000 | | 430,875 |
See Accompanying Notes to Financial Statements.
14
Columbia Income Fund
March 31, 2010
Corporate Fixed-Income Bonds and Notes (continued)
| | | | |
| | | Par ($) (a) | | Value ($) |
| Energy (continued) | | | | |
| United Refining Co. | | | | |
10.500% 08/15/12 | | 270,000 | | 257,850 |
| | | | |
Oil & Gas Total | | | | 32,726,456 |
| |
| Oil & Gas Services – 0.7% | | |
| Smith International, Inc. | | |
9.750% 03/15/19 | | 1,480,000 | | 1,990,758 |
| |
| Weatherford International Ltd. | | |
7.000% 03/15/38 | | 1,780,000 | | 1,881,991 |
| | | | |
Oil & Gas Services Total | | 3,872,749 |
| |
| Pipelines – 4.0% | | |
| Atlas Pipeline Partners LP | | |
8.125% 12/15/15 | | 355,000 | | 342,575 |
| | |
| El Paso Corp. | | | | |
6.875% 06/15/14 | | 350,000 | | 357,141 |
7.250% 06/01/18 | | 220,000 | | 227,020 |
| |
| Enbridge Energy Partners LP | | |
7.500% 04/15/38 | | 1,785,000 | | 2,089,742 |
| |
| Energy Transfer Partners LP | | |
6.000% 07/01/13 | | 1,865,000 | | 2,016,089 |
| |
| Kinder Morgan Energy Partners LP | | |
5.625% 02/15/15 | | 1,185,000 | | 1,284,977 |
6.500% 09/01/39 | | 1,985,000 | | 2,040,387 |
6.950% 01/15/38 | | 1,530,000 | | 1,657,343 |
| |
| MarkWest Energy Partners LP | | |
6.875% 11/01/14 | | 205,000 | | 200,900 |
8.500% 07/15/16 | | 455,000 | | 462,394 |
| | |
| ONEOK Partners LP | | | | |
6.850% 10/15/37 | | 1,090,000 | | 1,165,339 |
| |
| Plains All American Pipeline LP/PAA Finance Corp. | | |
5.750% 01/15/20 | | 265,000 | | 271,746 |
6.500% 05/01/18 | | 3,750,000 | | 4,085,820 |
6.650% 01/15/37 | | 2,635,000 | | 2,732,337 |
8.750% 05/01/19 | | 630,000 | | 768,580 |
| |
| TransCanada Pipelines Ltd. | | |
6.350% 05/15/67 (05/15/17) (c)(d) | | 2,610,000 | | 2,483,402 |
| |
| Williams Companies, Inc. | | |
7.875% 09/01/21 | | 107,000 | | 125,984 |
| | | | |
Pipelines Total | | | | 22,311,776 |
| | | | |
Energy Total | | | | 60,201,237 |
| | | | |
| | | | |
| | | Par ($) (a) | | Value ($) |
| Financials – 36.2% | | | | |
| Banks – 20.7% | | | | |
| Barclays Bank PLC | | | | |
5.000% 09/22/16 | | 2,470,000 | | 2,538,839 |
7.375% 06/29/49 (12/01/11) (b)(c)(d) | | 900,000 | | 868,500 |
| | |
| Capital One Capital IV | | | | |
6.745% 02/17/37 (c) | | 5,020,000 | | 4,329,750 |
| | |
| Capital One Capital V | | | | |
10.250% 08/15/39 | | 4,835,000 | | 5,727,952 |
| |
| Capital One Financial Corp. | | |
5.700% 09/15/11 | | 960,000 | | 1,003,342 |
7.375% 05/23/14 | | 255,000 | | 291,397 |
| |
| Chinatrust Commercial Bank | | |
5.625% 12/29/49 (03/17/15) (b)(c)(d) | | 825,000 | | 761,681 |
| | |
| CIT Group, Inc. | | | | |
7.000% 05/01/17 | | 1,030,000 | | 950,175 |
| | |
| Citigroup, Inc. | | | | |
8.125% 07/15/39 | | 8,218,000 | | 9,486,884 |
| | |
| Comerica Bank | | | | |
0.337% 06/30/10 (04/30/10) (c)(d) | | 900,000 | | 899,555 |
5.200% 08/22/17 | | 2,080,000 | | 2,017,725 |
5.750% 11/21/16 | | 2,985,000 | | 3,072,577 |
| |
| Discover Bank/Greenwood DE | | |
8.700% 11/18/19 | | 4,465,000 | | 4,890,389 |
| |
| Discover Financial Services | | |
10.250% 07/15/19 | | 1,090,000 | | 1,296,838 |
| | |
| Fifth Third Bank/Ohio | | | | |
0.360% 05/17/13 (05/17/10) (c)(d) | | 1,065,000 | | 994,633 |
| | |
| HSBC Capital Funding LP | | | | |
9.547% 12/31/49 (b)(c) | | 2,700,000 | | 2,733,750 |
| | |
| HSBC Holdings PLC | | | | |
6.800% 06/01/38 | | 2,000,000 | | 2,144,656 |
| |
| JPMorgan Chase Capital XVII | | |
5.850% 08/01/35 | | 1,950,000 | | 1,756,236 |
| |
| JPMorgan Chase Capital XX | | |
6.550% 09/29/36 | | 9,095,000 | | 8,534,930 |
| |
| JPMorgan Chase Capital XXIII | | |
1.250% 05/15/47 (05/17/10) (c)(d) | | 2,200,000 | | 1,651,041 |
See Accompanying Notes to Financial Statements.
15
Columbia Income Fund
March 31, 2010
Corporate Fixed-Income Bonds and Notes (continued)
| | | | |
| | | Par ($) (a) | | Value ($) |
| Financials (continued) | | | | |
| KeyBank NA | | | | |
5.800% 07/01/14 | | 1,695,000 | | 1,733,546 |
| | |
| Keycorp | | | | |
6.500% 05/14/13 | | 3,820,000 | | 4,079,412 |
| | |
| Lloyds TSB Bank PLC | | | | |
4.375% 01/12/15 (b) | | 6,205,000 | | 6,116,777 |
| | |
| Lloyds TSB Group PLC | | | | |
6.267% 12/31/49 (11/14/16) (b)(c)(d) | | 1,245,000 | | 737,663 |
| |
| M&I Marshall & Ilsley Bank | | |
5.300% 09/08/11 | | 763,000 | | 761,183 |
| |
| Merrill Lynch & Co., Inc. | | |
5.700% 05/02/17 (i) | | 6,370,000 | | 6,331,748 |
7.750% 05/14/38 (i) | | 2,585,000 | | 2,865,398 |
| |
| National City Bank of Cleveland | | |
6.200% 12/15/11 | | 575,000 | | 619,725 |
| |
| National City Bank of Kentucky | | |
6.300% 02/15/11 | | 1,020,000 | | 1,048,320 |
| | |
| National City Corp. | | | | |
6.875% 05/15/19 | | 1,840,000 | | 2,044,496 |
| | |
| Northern Trust Co. | | | | |
6.500% 08/15/18 | | 3,450,000 | | 3,860,364 |
| | |
| Northern Trust Corp. | | | | |
5.500% 08/15/13 | | 2,005,000 | | 2,218,811 |
| | |
| PNC Funding Corp. | | | | |
3.625% 02/08/15 | | 2,640,000 | | 2,655,816 |
5.125% 02/08/20 | | 4,000,000 | | 4,029,368 |
| |
| Regions Financial Corp. | | |
7.000% 03/01/11 | | 3,805,000 | | 3,833,652 |
| |
| SunTrust Preferred Capital I | | |
5.853% 12/31/49 (12/15/11) (c)(d) | | 545,000 | | 419,650 |
| | |
| USB Capital IX | | | | |
6.189% 04/15/42 (c) | | 9,190,000 | | 7,857,450 |
| |
| Westpac Banking Corp. | | |
4.200% 02/27/15 | | 7,300,000 | | 7,514,437 |
| |
| Zions Bancorporation | | |
7.750% 09/23/14 | | 245,000 | | 247,112 |
| | | | |
Banks Total | | | | 114,925,778 |
| | | | |
| | | Par ($) (a) | | Value ($) |
| Diversified Financial Services – 4.3% | | |
| American General Finance Corp. | | |
6.900% 12/15/17 | | 205,000 | | 179,561 |
| |
| Ameriprise Financial, Inc. | | |
7.300% 06/28/19 | | 2,095,000 | | 2,427,363 |
| | |
| Cemex Finance LLC | | | | |
9.500% 12/14/16 (b) | | 255,000 | | 263,925 |
| |
| E*Trade Financial Corp. | | |
PIK, | | | | |
12.500% 11/30/17 | | 255,000 | | 294,011 |
| | |
| Eaton Vance Corp. | | | | |
6.500% 10/02/17 | | 2,230,000 | | 2,401,534 |
| |
| Ford Motor Credit Co., LLC | | |
7.800% 06/01/12 | | 1,025,000 | | 1,063,095 |
8.000% 12/15/16 | | 525,000 | | 553,152 |
| |
| Fund American Companies, Inc. | | |
5.875% 05/15/13 | | 1,557,000 | | 1,602,491 |
| |
| General Electric Capital Corp. | | |
5.500% 01/08/20 | | 3,975,000 | | 4,055,554 |
| | |
| GMAC, Inc. | | | | |
6.875% 09/15/11 | | 505,000 | | 513,206 |
8.000% 11/01/31 | | 405,000 | | 386,775 |
| |
| Icahn Enterprises LP/Icahn Enterprises Finance Corp. | | |
8.000% 01/15/18 (b) | | 560,000 | | 539,700 |
| |
| International Lease Finance Corp. | | |
4.875% 09/01/10 | | 2,418,000 | | 2,417,978 |
5.625% 09/15/10 | | 1,750,000 | | 1,762,346 |
| |
| Lehman Brothers Holdings, Inc. | | |
5.625% 01/24/13 (e)(f) | | 13,665,000 | | 3,228,356 |
6.875% 05/02/18 (e)(f) | | 600,000 | | 141,750 |
| |
| Nuveen Investments, Inc. | | |
10.500% 11/15/15 | | 420,000 | | 407,400 |
| |
| PF Export Receivables Master Trust | | |
3.748% 06/01/13 (b) | | 423,245 | | 415,431 |
| |
| Reliance Intermediate Holdings LP | | |
9.500% 12/15/19 (b) | | 360,000 | | 380,700 |
| | |
| SLM Corp. | | | | |
8.000% 03/25/20 | | 470,000 | | 457,667 |
| | | | |
Diversified Financial Services Total | | 23,491,995 |
See Accompanying Notes to Financial Statements.
16
Columbia Income Fund
March 31, 2010
Corporate Fixed-Income Bonds and Notes (continued)
| | | | |
| | | Par ($) (a) | | Value ($) |
| Financials (continued) | | | | |
| Insurance – 9.0% | | |
| Asurion Corp. | | |
6.730% 07/02/15 (04/12/10) (c)(d)(j) | | 365,000 | | 361,043 |
| | |
| CNA Financial Corp. | | | | |
5.850% 12/15/14 | | 1,078,000 | | 1,096,926 |
7.350% 11/15/19 | | 2,127,000 | | 2,222,989 |
| |
| Crum & Forster Holdings Corp. | | |
7.750% 05/01/17 | | 415,000 | | 410,850 |
| |
| HUB International Holdings, Inc. | | |
10.250% 06/15/15 (b) | | 340,000 | | 325,550 |
| | |
| ING Groep NV | | | | |
5.775% 12/29/49 (12/08/15) (c)(d) | | 5,969,000 | | 5,082,604 |
| |
| Liberty Mutual Group, Inc. | | |
7.500% 08/15/36 (b) | | 3,555,000 | | 3,428,268 |
10.750% 06/15/58 (b)(c) | | 2,200,000 | | 2,464,000 |
| |
| Lincoln National Corp. | | |
8.750% 07/01/19 | | 4,215,000 | | 5,153,984 |
| |
| MetLife Capital Trust X | | |
9.250% 04/08/38 (b)(c) | | 5,085,000 | | 5,720,625 |
| | |
| MetLife, Inc. | | | | |
6.750% 06/01/16 | | 5,090,000 | | 5,704,124 |
10.750% 08/01/39 | | 2,260,000 | | 2,913,032 |
| |
| Principal Life Income Funding Trusts | | |
5.300% 04/24/13 | | 2,485,000 | | 2,667,546 |
| |
| Provident Companies, Inc. | | |
7.000% 07/15/18 | | 120,000 | | 122,371 |
| |
| Prudential Financial, Inc. | | |
4.500% 07/15/13 | | 1,580,000 | | 1,651,895 |
4.750% 06/13/15 | | 1,075,000 | | 1,104,612 |
8.875% 06/15/38 (c) | | 3,435,000 | | 3,855,788 |
| |
| Transatlantic Holdings, Inc. | | |
8.000% 11/30/39 | | 2,775,000 | | 2,836,072 |
| | |
| Unum Group | | | | |
7.125% 09/30/16 | | 2,230,000 | | 2,424,090 |
| | |
| USI Holdings Corp. | | | | |
9.750% 05/15/15 (b) | | 215,000 | | 203,175 |
| | | | |
Insurance Total | | | | 49,749,544 |
|
| Real Estate Investment Trusts (REITs) – 2.2% |
| Brandywine Operating Partnership LP | | |
7.500% 05/15/15 | | 1,440,000 | | 1,549,536 |
| | | | |
| | | Par ($) (a) | | Value ($) |
| Duke Realty LP | | | | |
7.375% 02/15/15 | | 2,145,000 | | 2,316,407 |
8.250% 08/15/19 | | 4,514,000 | | 5,034,415 |
| |
| DuPont Fabros Technology LP | | |
8.500% 12/15/17 (b) | | 335,000 | | 345,050 |
| |
| Highwoods Properties, Inc. | | |
5.850% 03/15/17 | | 830,000 | | 793,336 |
| | |
| Liberty Property LP | | | | |
5.500% 12/15/16 | | 2,155,000 | | 2,088,966 |
| | | | |
Real Estate Investment Trusts (REITs) Total | | 12,127,710 |
| |
| Savings & Loans – 0.0% | | |
| Washington Mutual Bank | | |
5.125% 01/15/15 (g) | | 6,350,000 | | 39,688 |
| |
| Washington Mutual Preferred Funding Delaware | | |
6.534% 03/29/49 (03/15/11) (b)(c)(d)(g) | | 1,075,000 | | 30,906 |
| | | | |
Savings & Loans Total | | 70,594 |
| | | | |
Financials Total | | | | 200,365,621 |
| | | | |
| Industrials – 4.9% | | | | |
| Aerospace & Defense – 1.0% | | |
| BE Aerospace, Inc. | | |
8.500% 07/01/18 | | 360,000 | | 384,300 |
| | |
| Embraer Overseas Ltd. | | | | |
6.375% 01/15/20 | | 2,555,000 | | 2,599,712 |
| |
| L-3 Communications Corp. | | |
6.375% 10/15/15 | | 490,000 | | 502,862 |
| | |
| Raytheon Co. | | | | |
5.500% 11/15/12 | | 1,000,000 | | 1,101,564 |
| | |
| Sequa Corp. | | | | |
11.750% 12/01/15 (b) | | 375,000 | | 375,000 |
| |
| Systems 2001 Asset Trust | | |
6.664% 09/15/13 (b) | | 400,305 | | 423,751 |
| | | | |
Aerospace & Defense Total | | 5,387,189 |
| |
| Air Transportation – 0.1% | | |
| Air 2 US | | | | |
8.027% 10/01/19 (b) | | 402,700 | | 341,792 |
| | | | |
Air Transportation Total | | 341,792 |
| |
| Building Materials – 0.1% | | |
| Building Materials Corp. of America | | |
7.500% 03/15/20 (b) | | 85,000 | | 84,788 |
See Accompanying Notes to Financial Statements.
17
Columbia Income Fund
March 31, 2010
Corporate Fixed-Income Bonds and Notes (continued)
| | | | |
| | | Par ($) (a) | | Value ($) |
| Industrials (continued) | | | | |
| Nortek, Inc. | | | | |
11.000% 12/01/13 | | 210,933 | | 226,226 |
| | |
| Texas Industries, Inc. | | | | |
7.250% 07/15/13 | | 305,000 | | 299,662 |
| | | | |
Building Materials Total | | 610,676 |
|
| Electrical Components & Equipment – 0.1% |
| Belden, Inc. | | | | |
7.000% 03/15/17 | | 470,000 | | 462,950 |
| | |
| General Cable Corp. | | | | |
7.125% 04/01/17 | | 345,000 | | 341,981 |
| | | | |
Electrical Components & Equipment Total | | 804,931 |
| |
| Engineering & Construction – 0.0% | | |
| Esco Corp. | | |
8.625% 12/15/13 (b) | | 270,000 | | 271,350 |
| | | | |
Engineering & Construction Total | | 271,350 |
| |
| Environmental Control – 0.1% | | |
| Clean Harbors, Inc. | | | | |
7.625% 08/15/16 | | 270,000 | | 274,050 |
| | | | |
Environmental Control Total | | 274,050 |
|
| Machinery-Construction & Mining – 0.1% |
| Terex Corp. | | | | |
8.000% 11/15/17 | | 560,000 | | 544,600 |
| | | | |
Machinery-Construction & Mining Total | | 544,600 |
| |
| Machinery-Diversified – 0.1% | | |
| CPM Holdings, Inc. | | | | |
10.625% 09/01/14 (b) | | 240,000 | | 255,600 |
| | |
| Manitowoc Co., Inc. | | | | |
7.125% 11/01/13 | | 300,000 | | 299,250 |
| | | | |
Machinery-Diversified Total | | 554,850 |
| |
| Miscellaneous Manufacturing – 1.6% | | |
| American Railcar Industries, Inc. | | |
7.500% 03/01/14 | | 165,000 | | 157,575 |
| | |
| Bombardier, Inc. | | | | |
6.300% 05/01/14 (b) | | 105,000 | | 108,938 |
| |
| Colt Defense LLC/Colt Finance Corp. | | |
8.750% 11/15/17 (b) | | 285,000 | | 285,712 |
| |
| Ingersoll-Rand Global Holding Co., Ltd. | | |
9.500% 04/15/14 | | 2,470,000 | | 2,994,964 |
| | |
| Reddy Ice Corp. | | | | |
13.250% 11/01/15 (b) | | 271,000 | | 278,452 |
| | | | |
| | | Par ($) (a) | | Value ($) |
| Trimas Corp. | | | | |
9.750% 12/15/17 (b) | | 365,000 | | 377,775 |
| |
| Tyco International Ltd./Tyco International Finance SA | | |
6.875% 01/15/21 | | 3,935,000 | | 4,496,521 |
| | | | |
Miscellaneous Manufacturing Total | | 8,699,937 |
| |
| Packaging & Containers – 0.4% | | |
| Berry Plastics Holding Corp. | | |
8.875% 09/15/14 | | 475,000 | | 463,719 |
| | |
| BWAY Corp. | | | | |
10.000% 04/15/14 (b) | | 265,000 | | 284,875 |
| |
| Crown Americas LLC & Crown Americas Capital Corp. | | |
7.750% 11/15/15 | | 295,000 | | 306,800 |
| |
| Crown Americas LLC & Crown Americas Capital Corp. II | | |
7.625% 05/15/17 (b) | | 220,000 | | 229,350 |
| |
| Graham Packaging Co., LP/GPC Capital Corp. I | | |
8.250% 01/01/17 (b) | | 100,000 | | 100,750 |
| |
| Graphic Packaging International, Inc. | | |
9.500% 06/15/17 | | 450,000 | | 480,375 |
| | |
| Solo Cup Co. | | | | |
8.500% 02/15/14 | | 480,000 | | 469,200 |
| | | | |
Packaging & Containers Total | | 2,335,069 |
| | |
| Transportation – 1.3% | | | | |
| BNSF Funding Trust I | | | | |
6.613% 12/15/55 (01/15/26) (c)(d) | | 1,730,000 | | 1,680,262 |
| | |
| Bristow Group, Inc. | | | | |
7.500% 09/15/17 | | 300,000 | | 303,000 |
| |
| Burlington Northern Santa Fe Corp. | | |
7.950% 08/15/30 | | 945,000 | | 1,150,934 |
| |
| Kansas City Southern de Mexico SA de CV | | |
7.625% 12/01/13 | | 425,000 | | 434,563 |
| |
| Navios Maritime Holdings, Inc. | | |
9.500% 12/15/14 | | 375,000 | | 377,813 |
| | |
| PHI, Inc. | | | | |
7.125% 04/15/13 | | 315,000 | | 305,944 |
| | |
| RailAmerica, Inc. | | | | |
9.250% 07/01/17 | | 153,000 | | 163,136 |
See Accompanying Notes to Financial Statements.
18
Columbia Income Fund
March 31, 2010
Corporate Fixed-Income Bonds and Notes (continued)
| | | | |
| | | Par ($) (a) | | Value ($) |
| Industrials (continued) | | | | |
| Ship Finance International Ltd. | | |
8.500% 12/15/13 | | 355,000 | | 351,450 |
| | |
| Stena AB | | | | |
7.500% 11/01/13 | | 315,000 | | 322,875 |
| | |
| Union Pacific Corp. | | | | |
5.700% 08/15/18 | | 2,245,000 | | 2,362,490 |
| | | | |
Transportation Total | | | | 7,452,467 |
| | | | |
Industrials Total | | | | 27,276,911 |
| | | | |
| Technology – 2.0% | | | | |
| Computers – 0.1% | | | | |
| Seagate Technology International | | |
10.000% 05/01/14 (b) | | 150,000 | | 169,875 |
| |
| Sungard Data Systems, Inc. | | |
9.125% 08/15/13 | | 310,000 | | 317,750 |
| | | | |
Computers Total | | | | 487,625 |
| |
| Networking Products – 0.9% | | |
| Cisco Systems, Inc. | | | | |
5.500% 01/15/40 | | 2,860,000 | | 2,742,657 |
5.900% 02/15/39 | | 2,620,000 | | 2,659,966 |
| | | | |
Networking Products Total | | 5,402,623 |
| | |
| Semiconductors – 0.1% | | | | |
| Amkor Technology, Inc. | | | | |
9.250% 06/01/16 | | 160,000 | | 168,800 |
| |
| Freescale Semiconductor, Inc. | | |
12.500% 12/15/14 (03/01/10) (c)(d) | | 155,469 | | 159,716 |
| | | | |
Semiconductors Total | | | | 328,516 |
| | |
| Software – 0.9% | | | | |
| Oracle Corp. | | | | |
6.500% 04/15/38 | | 4,515,000 | | 4,983,562 |
| | | | |
Software Total | | | | 4,983,562 |
| | | | |
Technology Total | | | | 11,202,326 |
| | | | |
| Utilities – 7.8% | | | | |
| Electric – 6.6% | | | | |
| AES Corp. | | | | |
8.000% 10/15/17 | | 725,000 | | 735,875 |
| |
| American Electric Power Co., Inc. | | |
5.250% 06/01/15 | | 1,825,000 | | 1,951,212 |
| | |
| CMS Energy Corp. | | | | |
6.875% 12/15/15 | | 205,000 | | 218,491 |
| | | | |
| | | Par ($) (a) | | Value ($) |
| Commonwealth Edison Co. | | |
5.900% 03/15/36 | | 690,000 | | 700,376 |
5.950% 08/15/16 | | 1,515,000 | | 1,660,625 |
6.150% 09/15/17 | | 1,890,000 | | 2,088,694 |
6.950% 07/15/18 | | 2,520,000 | | 2,780,628 |
| |
Consolidated Edison Co. of New
York, Inc. | | |
6.750% 04/01/38 | | 1,985,000 | | 2,239,376 |
| |
| Dominion Resources, Inc. | | |
8.875% 01/15/19 | | 1,500,000 | | 1,892,371 |
| | |
| DTE Energy Co. | | | | |
7.625% 05/15/14 | | 955,000 | | 1,086,451 |
| | |
| Dynegy Holdings, Inc. | | | | |
7.750% 06/01/19 | | 255,000 | | 192,525 |
| | |
| Edison Mission Energy | | | | |
7.000% 05/15/17 | | 285,000 | | 198,788 |
| |
| Energy Future Holdings Corp. | | |
10.000% 01/15/20 (b) | | 110,000 | | 114,675 |
| | |
| Exelon Generation Co. LLC | | | | |
6.200% 10/01/17 | | 1,000,000 | | 1,088,280 |
| |
| FPL Energy American Wind LLC | | |
6.639% 06/20/23 (b) | | 907,649 | | 930,630 |
| |
| FPL Energy National Wind LLC | | |
5.608% 03/10/24 (b) | | 165,782 | | 166,143 |
| | |
| Intergen NV | | | | |
9.000% 06/30/17 (b) | | 565,000 | | 581,950 |
| | |
| Ipalco Enterprises, Inc. | | | | |
7.250% 04/01/16 (b) | | 330,000 | | 342,375 |
| |
| Kansas City Power & Light Co. | | |
7.150% 04/01/19 | | 3,415,000 | | 3,919,122 |
| |
| Mirant Americas Generation LLC | | |
8.500% 10/01/21 | | 685,000 | | 643,900 |
| |
| Niagara Mohawk Power Corp. | | |
4.881% 08/15/19 (b) | | 3,430,000 | | 3,406,408 |
| | |
| NRG Energy, Inc. | | | | |
7.375% 02/01/16 | | 630,000 | | 625,275 |
7.375% 01/15/17 | | 60,000 | | 59,400 |
| |
| NSG Holdings LLC/NSG Holdings, Inc. | | |
7.750% 12/15/25 (b) | | 540,000 | | 486,000 |
| |
| Oncor Electric Delivery Co. | | |
5.950% 09/01/13 | | 3,225,000 | | 3,521,842 |
7.250% 01/15/33 | | 1,300,000 | | 1,462,258 |
See Accompanying Notes to Financial Statements.
19
Columbia Income Fund
March 31, 2010
Corporate Fixed-Income Bonds and Notes (continued)
| | | | |
| | | Par ($) (a) | | Value ($) |
| Utilities (continued) | | | | |
| Southern Co. | | | | |
4.150% 05/15/14 | | 1,010,000 | | 1,054,157 |
| |
| Tenaska Alabama II Partners LP | | |
6.125% 03/30/23 (b) | | 967,999 | | 960,013 |
| |
| Texas Competitive Electric Holdings Co. LLC | | |
10.250% 11/01/15 | | 260,000 | | 180,700 |
| | |
| Windsor Financing LLC | | | | |
5.881% 07/15/17 (b) | | 1,665,558 | | 1,318,156 |
| | | | |
Electric Total | | | | 36,606,696 |
| | |
| Gas – 1.2% | | | | |
| Atmos Energy Corp. | | | | |
6.350% 06/15/17 | | 1,585,000 | | 1,704,565 |
8.500% 03/15/19 | | 1,965,000 | | 2,410,790 |
| | |
| Nakilat, Inc. | | | | |
6.067% 12/31/33 (b) | | 1,160,000 | | 1,055,704 |
| | |
| Sempra Energy | | | | |
6.500% 06/01/16 | | 1,120,000 | | 1,251,248 |
| | | | |
Gas Total | | 6,422,307 |
| | | | |
Utilities Total | | | | 43,029,003 |
| | | | |
Total Corporate Fixed-Income Bonds & Notes
(cost of $488,227,496) | | 500,880,963 |
| |
Asset-Backed Securities – 4.2% | | |
| Bay View Auto Trust | | | | |
5.310% 06/25/14 | | 1,110,000 | | 1,124,403 |
| |
Citicorp Residential Mortgage
Securities, Inc. | | |
5.892% 03/25/37 (04/01/10)(c)(d) | | 3,300,000 | | 2,917,956 |
6.080% 06/25/37 (04/01/10)(c)(d) | | 4,000,000 | | 3,716,617 |
| |
| Citigroup Mortgage Loan Trust, Inc. | | |
5.517% 08/25/35 (04/01/10)(c)(d) | | 1,200,000 | | 87,469 |
5.598% 03/25/36 (04/01/10)(c)(d) | | 512,361 | | 432,073 |
5.666% 08/25/35 (04/01/10)(c)(d) | | 1,000,000 | | 57,282 |
|
| Countrywide Asset-Backed Certificates |
0.356% 06/25/21 (04/26/10)(c)(d)(e) | | 337,782 | | 253,767 |
| | | | |
| | | Par ($) (a) | | Value ($) |
| Ford Credit Auto Owner Trust | | |
5.470% 09/15/12 | | 4,000,000 | | 4,205,080 |
5.680% 06/15/12 | | 1,500,000 | | 1,558,491 |
5.690% 11/15/12 | | 3,000,000 | | 3,211,216 |
| |
| Green Tree Financial Corp. | | |
6.870% 01/15/29 | | 377,160 | | 396,240 |
| Harley-Davidson Motorcycle Trust | | |
5.540% 04/15/15 | | 1,400,000 | | 1,457,321 |
| |
| JPMorgan Auto Receivables Trust | | |
5.610% 12/15/14(b) | | 550,988 | | 552,371 |
| |
Residential Asset Mortgage
Products, Inc. | | |
4.120% 06/25/33 (04/01/10)(c)(d) | | 246,713 | | 144,552 |
| |
| Small Business Administration Participation Certificates | | |
5.570% 03/01/26 | | 795,693 | | 862,261 |
| |
| Wachovia Auto Loan Owner Trust | | |
5.650% 02/20/13 | | 2,500,000 | | 2,590,157 |
| | | | |
Total Asset-Backed Securities
(cost of $25,891,806) | | 23,567,256 |
| |
Government & Agency Obligations – 2.0% | | |
| | | | |
| Foreign Government Obligations – 0.5% |
| Federative Republic of Brazil | | |
6.000% 01/17/17 | | 1,000,000 | | 1,086,500 |
| | |
| Republic of Italy | | | | |
5.375% 06/12/17 | | 1,600,000 | | 1,719,544 |
| | | | |
Foreign Government Obligations Total | | 2,806,044 |
| | | | |
| U.S. Government Obligations – 1.5% |
| U.S. Treasury Bonds | | | | |
4.375% 11/15/39 | | 2,580,000 | | 2,439,713 |
| | |
| U.S. Treasury Notes | | | | |
1.375% 02/15/13 | | 4,000,000 | | 3,981,248 |
2.375% 02/28/15 | | 1,872,000 | | 1,859,139 |
| | | | |
U.S. Government Obligations Total | | 8,280,100 |
| | | | |
Total Government & Agency Obligations
(cost of $11,055,185) | | 11,086,144 |
See Accompanying Notes to Financial Statements.
20
Columbia Income Fund
March 31, 2010
Commercial Mortgage-Backed Securities – 1.2%
| | | | |
| | | Par ($) (a) | | Value ($) |
| Bear Stearns Commercial Mortgage Securities | | |
5.719% 09/11/38 (04/01/10) (c)(d) | | 3,750,000 | | 3,917,109 |
| Credit Suisse Mortgage Capital Certificates | | |
5.723% 06/15/39 (04/01/10) (c)(d) | | 695,000 | | 626,052 |
| |
GMAC Commercial Mortgage
Securities, Inc. | | |
5.487% 05/10/40 (04/01/10) (c)(d) | | 1,230,000 | | 1,311,245 |
| |
| GS Mortgage Securities Corp. II | | |
5.560% 11/10/39 | | 955,000 | | 945,435 |
| | | | |
Total Commercial Mortgage-Backed Securities (cost of $4,680,108) | | 6,799,841 |
| | |
Municipal Bonds – 0.5% | | | | |
| | | | |
| California – 0.5% | | | | |
| CA Los Angeles Unified School District | | |
Series 2009, | | | | |
5.750% 07/01/34 | | 2,055,000 | | 1,891,463 |
| CA State | | | | |
Series 2009, | | | | |
7.550% 04/01/39 | | 725,000 | | 753,899 |
| | | | |
California Total | | | | 2,645,362 |
| | | | |
Total Municipal Bonds
(cost of $2,835,146) | | 2,645,362 |
|
Collateralized Mortgage Obligations – 0.1% |
| | | | |
| Non-Agency – 0.1% | | | | |
| Citicorp Mortgage Securities, Inc. | | |
5.960% 05/25/37 (04/01/10) (c)(d) | | 1,449,241 | | 308,947 |
| |
| Countrywide Alternative Loan Trust | | |
5.500% 09/25/35 | | 2,086,975 | | 137,925 |
| |
| Nomura Asset Acceptance Corp. | | |
0.346% 08/25/36 (04/26/10) (c)(d) | | 89,938 | | 51,147 |
| | |
| Sequoia Mortgage Trust | | | | |
5.723% 07/20/37 (04/01/10) (c)(d) | | 1,022,736 | | 135,974 |
| | | | |
| | | Par ($) (a) | | Value ($) |
| Wachovia Mortgage Loan Trust LLC | | |
5.231% 05/20/36 (04/01/10) (c)(d) | | 493,791 | | 6,076 |
| | | | |
Non-Agency Total | | | | 640,069 |
| | | | |
Total Collateralized Mortgage Obligations
(cost of $5,013,779) | | 640,069 |
| |
Mortgage-Backed Securities – 0.0% | | |
| Government National Mortgage Association | | |
10.000% 10/15/17 | | 1,131 | | 1,257 |
10.000% 01/15/19 | | 261 | | 290 |
10.500% 01/15/16 | | 2,323 | | 2,578 |
10.500% 04/15/20 | | 1,528 | | 1,716 |
10.500% 05/15/20 | | 6,295 | | 7,069 |
11.500% 05/15/13 | | 2,715 | | 2,991 |
12.500% 10/15/13 | | 696 | | 740 |
12.500% 11/15/13 | | 1,849 | | 2,091 |
12.500% 12/15/13 | | 4,890 | | 5,521 |
14.000% 08/15/11 | | 515 | | 546 |
| | | | |
Total Mortgage-Backed Securities (cost of $22,427) | | 24,799 |
| | | | |
| | | Shares | | |
| | |
Warrants – 0.0% | | | | |
| | | | |
| Financials – 0.0% | | | | |
| CNB Capital Trust I | | | | |
Expires 03/23/19 (b)(e)(k) | | 8,101 | | 81 |
| | | | |
Financials Total | | | | 81 |
| | | | |
Total Warrants (cost of $81) | | 81 |
| | |
Preferred Stock – 0.0% | | | | |
| | | | |
| Communications – 0.0% | | |
| Media – 0.0% | | | | |
| CMP Susquehanna Radio Holdings Corp., | | |
Series A (b)(e)(k) | | 7,089 | | 71 |
| | | | |
Media Total | | | | 71 |
| | | | |
Communications Total | | 71 |
| | | | |
Total Preferred Stock (cost of $71) | | 71 |
See Accompanying Notes to Financial Statements.
21
Columbia Income Fund
March 31, 2010
| | | | |
| | | Par ($) (a) | | Value ($) |
| Short-Term Obligation – 0.1% | | |
Repurchase agreement with Fixed Income Clearing Corp., dated 03/31/10, due 04/01/10 at 0.00%, collateralized by a U.S. Government Agency obligation maturing 04/15/14, market value $462,358 (repurchase proceeds $453,000) | | 453,000 | | 453,000 |
| | | | |
Total Short-Term Obligation
(cost of $453,000) | | 453,000 |
| | | | |
Total Investments – 98.5%
(cost of $538,179,099)(l) | | 546,097,586 |
| | | | |
Other Assets & Liabilities, Net – 1.5% | | 8,306,071 |
| | | | |
Net Assets – 100.0% | | 554,403,657 |
Notes to Investment Portfolio:
| (a) | Principal amount is stated in United States dollars unless otherwise noted. |
| (b) | Security exempt from registration pursuant to Rule 144A under the Securities Act of 1933. These securities may be resold in transactions exempt from registration, normally to qualified institutional buyers. At March 31, 2010, these securities, which are not illiquid except for the following, amounted to $75,961,013, which represents 13.7% of net assets. |
| | | | | | | | | | | |
Security | | Acquisition
Dates | | Par/Units | | Cost | | Value |
ACE Cash Express, Inc. 10.250% 10/01/14 | | 09/26/06-
09/27/06 | | $ | 220,000 | | $ | 222,025 | | $ | 180,950 |
CMP Susquehanna Radio Holdings Corp. Series A | | 03/26/09 | | | 7,089 | | | 71 | | | 71 |
CNB Capital Trust I Expires 03/23/19 | | 03/26/09 | | | 8,101 | | | 81 | | | 81 |
Local TV Finance LLC, PIK 9.250% 06/15/15 | | 05/02/07-
12/15/09 | | $ | 253,575 | | | 241,739 | | | 159,186 |
Qatar Petroleum 5.579% 05/30/11 | | 05/26/06 | | $ | 350,070 | | | 350,070 | | | 359,608 |
Seminole Indian Tribe of Florida 7.804% 10/01/20 | | 09/26/07 | | $ | 535,000 | | | 543,813 | | | 498,652 |
Systems 2001 Asset Trust 6.664% 09/15/13 | | 06/04/01 | | $ | 400,305 | | | 400,305 | | | 423,751 |
| | | | | | | | | | | |
| | | | | | | | | | $ | 1,622,299 |
| | | | | | | | | | | |
| (c) | The interest rate shown on floating rate or variable rate securities reflects the rate at March 31, 2010. |
| (d) | Parenthetical date represents the next interest rate reset date for the security. |
| (e) | Represents fair value as determined in good faith under procedures approved by the Board of Trustees. At March 31, 2010, the value of these securities amounted to $3,641,725, which represents 0.7% of net assets. |
| (f) | The issuer has filed for bankruptcy protection under Chapter 11 and is in default of certain debt covenants. Income is not being accrued. At March 31, 2010, the value of these securities amounted to $3,898,766, which represents 0.7% of net assets. |
| (g) | The issuer is in default of certain debt covenants. Income is not being accrued. At March 31, 2010, the value of these securities amounted to $191,844, which represents less than 0.1% of net assets. |
| (h) | Security purchased on a delayed delivery basis. |
| (i) | Investments in affiliates during the year ended March 31, 2010: |
| | | | | | | | | | | | | | | |
Affiliate | | Value,
beginning
of period | | Purchases | | Sales
Proceeds | | Interest
Income | | Value,
end of
period |
Merrill Lynch & Co., Inc.,
5.700% 05/02/17 | | $ | 6,089,892 | | $ | — | | $ | 3,847,862 | | $ | 505,407 | | $ | 6,331,748 |
Merrill Lynch & Co., Inc.,
6.050% 08/15/12 | | | 574,898 | | | — | | | 722,106 | | | 28,712 | | | — |
Merrill Lynch & Co., Inc.,
7.750% 05/14/38 | | | 1,564,199 | | | — | | | 55,462 | | | 203,018 | | | 2,865,398 |
Countrywide Financial Corp.,
0.000% 04/15/37 | | | 389,438 | | | — | | | 400,000 | | | — | | | — |
| | | | | | | | | | | | | | | |
| | $ | 8,618,427 | | $ | — | | $ | 5,025,430 | | $ | 737,137 | | $ | 9,197,146 |
| | | | | | | | | | | | | | | |
| (j) | Loan participation agreement. |
| (k) | Non-income producing security. |
| (l) | Cost for federal income tax purposes is $539,441,201. |
The following table summarizes the inputs used, as of March 31, 2010, in valuing the Fund’s assets:
| | | | | | | | | | | | |
Description | | Quoted
Prices
(Level 1) | | Other
Significant
Observable
Inputs
(Level 2) | | Significant
Unobservable
Inputs
(Level 3) | | Total |
Corporate Fixed-Income Bonds & Notes | | | | | | |
Basic Materials | | $ | — | | $ | 28,517,789 | | $ | — | | $ | 28,517,789 |
Communications | | | — | | | 59,473,539 | | | 17,700 | | | 59,491,239 |
Consumer Cyclical | | | — | | | 24,689,530 | | | 3,240,053 | | | 27,929,583 |
Consumer Non-Cyclical | | | — | | | 42,636,067 | | | — | | | 42,636,067 |
Diversified | | | — | | | 231,187 | | | — | | | 231,187 |
Energy | | | — | | | 60,201,237 | | | — | | | 60,201,237 |
Financials | | | — | | | 200,365,621 | | | — | | | 200,365,621 |
Industrials | | | — | | | 26,935,119 | | | 341,792 | | | 27,276,911 |
Technology | | | — | | | 11,202,326 | | | — | | | 11,202,326 |
Utilities | | | — | | | 43,029,003 | | | — | | | 43,029,003 |
| | | | | | | | | | | | |
Total Corporate Fixed-Income Bonds & Notes | | | — | | | 497,281,418 | | | 3,599,545 | | | 500,880,963 |
| | | | | | | | | | | | |
Total Asset-Backed Securities | | | — | | | 23,567,256 | | | — | | | 23,567,256 |
| | | | | | | | | | | | |
Total Commercial Mortgage-Backed Securities | | | — | | | 6,799,841 | | | — | | | 6,799,841 |
| | | | | | | | | | | | |
See Accompanying Notes to Financial Statements.
22
Columbia Income Fund
March 31, 2010
| | | | | | | | | | | | |
Description | | Quoted
Prices
(Level 1) | | Other
Significant
Observable
Inputs
(Level 2) | | Significant
Unobservable
Inputs
(Level 3) | | Total |
Government & Agency Obligations | | | | | | | | | |
Foreign Government Obligations | | $ | — | | $ | 2,806,044 | | $ | — | | $ | 2,806,044 |
U.S. Government Obligations | | | 8,280,100 | | | — | | | — | | | 8,280,100 |
| | | | | | | | | | | | |
Total Government & Agency Obligations | | | 8,280,100 | | | 2,806,044 | | | — | | | 11,086,144 |
| | | | | | | | | | | | |
Total Municipal Bonds | | | — | | | 2,645,362 | | | — | | | 2,645,362 |
| | | | | | | | | | | | |
Total Collateralized Mortgage Obligations | | | — | | | 640,069 | | | — | | | 640,069 |
| | | | | | | | | | | | |
Total Mortgage-Backed Securities | | | — | | | 24,799 | | | — | | | 24,799 |
| | | | | | | | | | | | |
Total Warrants | | | — | | | — | | | 81 | | | 81 |
| | | | | | | | | | | | |
Total Preferred Stock | | | — | | | — | | | 71 | | | 71 |
| | | | | | | | | | | | |
Total Short-Term Obligation | | | — | | | 453,000 | | | — | | | 453,000 |
| | | | | | | | | | | | |
Total Investments | | | 8,280,100 | | | 534,217,789 | | | 3,599,697 | | | 546,097,586 |
| | | | | | | | | | | | |
| | | | | | | | | | | | | | | |
Description | | Quoted
Prices
(Level 1) | | | Other
Significant
Observable
Inputs
(Level 2) | | | Significant
Unobservable
Inputs
(Level 3) | | Total | |
Unrealized Appreciation on Forward Foreign Currency Exchange Contracts | | $ | — | | | $ | 6,888 | | | $ | — | | $ | 6,888 | |
| | | | | | | | | | | | | | | |
Unrealized Appreciation on Credit Default Swap Contracts | | | — | | | | 77,147 | | | | — | | | 77,147 | |
| | | | | | | | | | | | | | | |
Unrealized Depreciation on Credit Default Swap Contracts | | | — | | | | (589,369 | ) | | | — | | | (589,369 | ) |
| | | | | | | | | | | | | | | |
| | | | | | | | | | | | | | | |
Unrealized Appreciation on Futures Contracts | | | 22,120 | | | | — | | | | — | | | 22,120 | |
| | | | | | | | | | | | | | | |
Unrealized Depreciation on Futures Contracts | | | (408,339 | ) | | | | | | | | | | (408,339 | ) |
| | | | | | | | | | | | | | | |
Total | | $ | 7,893,881 | | | $ | 533,712,455 | | | $ | 3,599,697 | | $ | 545,206,033 | |
| | | | | | | | | | | | | | | |
The following table reconciles asset balances for the year ending March 31, 2010, in which significant unobservable inputs (Level 3) were used in determining value:
| | | | | | | | | | | | | | | | | | | | | | | | | | | | | | | |
Investments in
Securities | | Balance as of
March 31, 2009 | | Accrued
Discounts
(Premiums) | | Realized Gain (Loss) | | | Change in
Unrealized
Appreciation
(Depreciation) | | | Purchases | | Sales | | | Transfers
into Level 3 | | Transfers
out of Level 3 | | | Balance as of
March 31, 2010 |
Corporate Fixed-Income Bonds & Notes | | | | | | | | | | | | | | | | | | | | | | | | | | | | | | | |
Communications | | $ | 13,500 | | $ | 494 | | $ | — | | | $ | 3,706 | | | $ | — | | $ | — | | | $ | — | | $ | — | | | $ | 17,700 |
Consumer Cyclical | | | 2,443,226 | | | — | | | 20,530 | | | | 985,553 | | | | — | | | (209,256 | ) | | | — | | | — | | | | 3,240,053 |
Industrials | | | 272,017 | | | — | | | (49,631 | ) | | | 211,282 | | | | — | | | (91,876 | ) | | | — | | | — | | | | 341,792 |
Asset-Backed Securities | | | 571,517 | | | — | | | (1,728 | ) | | | (6,498 | ) | | | — | | | (309,524 | ) | | | — | | | (253,767 | ) | | | — |
Convertible Bond | | | | | | | | | | | | | | | | | | | | | | | | | | | | | | | |
Financials | | | — | | | 577 | | | 40,949 | | | | (30,964 | ) | | | — | | | (400,000 | ) | | | 389,438 | | | — | | | | — |
Warrants | | | | | | | | | | | | | | | | | | | | | | | | | | | | | | | |
Financials | | | 81 | | | — | | | — | | | | — | | | | — | | | — | | | | — | | | — | | | | 81 |
Preferred Stock | | | | | | | | | | | | | | | | | | | | | | | | | | | | | | | |
Communications | | | 71 | | | — | | | — | | | | — | | | | — | | | — | | | | — | | | — | | | | 71 |
| | | | | | | | | | | | | | | | | | | | | | | | | | | | | | | |
| | $ | 3,300,412 | | $ | 1,071 | | $ | 10,120 | | | $ | 1,163,079 | | | $ | — | | $ | (1,010,656 | ) | | $ | 389,438 | | $ | (253,767 | ) | | $ | 3,599,697 |
| | | | | | | | | | | | | | | | | | | | | | | | | | | | | | | |
The information in the above reconciliation represents fiscal year to date activity for any securities identified as using Level 3 inputs at either the beginning or the end of the current fiscal period.
The change in unrealized appreciation attributable to securities owned at March 31, 2010, which were valued using significant unobservable inputs (Level 3) amounted to $1,200,541. This amount is included in net change in unrealized appreciation on the Statement of Changes in Net Assets.
Financial assets levels were transferred out of Level 3 due to management’s determination that reliable and observable market data was now available to, and utilized by, pricing services for the valuation of this security.
Financial asset levels were transferred into Level 3 due to the pricing services methodology change from pricing the security based upon market data for comparable securities to the reliance upon a single broker quote.
For more information on valuation inputs, and their aggregation into the levels used in the tables above, please refer to the Security Valuation section in the accompanying Notes to Financial Statements.
See Accompanying Notes to Financial Statements.
23
Columbia Income Fund
March 31, 2010
Forward foreign currency exchange contracts outstanding on March 31, 2010 are:
Foreign Exchange Rate Risk
| | | | | | | | | | | |
Forward Foreign
Currency Exchange
Contracts to Sell | | Value | | Aggregate
Face Value | | Settlement
Date | | Unrealized
Appreciation |
EUR | | $ | 236,365 | | $ | 237,681 | | 04/09/10 | | $ | 1,316 |
EUR | | | 303,899 | | | 309,471 | | 04/15/10 | | | 5,572 |
| | | | | | | | | | | |
| | | | | | | | | | $ | 6,888 |
| | | | | | | | | | | |
At March 31, 2010, the Fund has entered into the following credit default swap contracts:
Credit Risk
| | | | | | | | | | | | | | | | | | | | |
Swap Counterparty | | Referenced Obligation | | Receive
Buy/Sell
Protection | | Fixed
Rate | | | Expiration
Date | | Notional
Amount | | Upfront
Premium
Paid
(Received) | | | Value of
Contract | |
Barclays Capital | | Toll Brothers, Inc. 5.150% 05/15/15 | | Buy | | 1.000 | % | | 09/20/14 | | $ | 3,715,000 | | $ | 29,184 | | | $ | 31,350 | |
Barclays Capital | | Toll Brothers, Inc. 5.150% 05/15/15 | | Buy | | 1.000 | % | | 09/20/14 | | | 3,715,000 | | | 12,914 | | | | 45,797 | |
Barclays Capital | | The Home Depot, Inc. | | Buy | | 1.000 | % | | 03/20/15 | | | 8,000,000 | | | (37,977 | ) | | | (96,543 | ) |
Barclays Capital | | Limited Brands, Inc. | | Buy | | 1.000 | % | | 03/20/15 | | | 4,500,000 | | | 251,315 | | | | (90,011 | ) |
Barclays Capital | | D.R. Horton, Inc. | | Buy | | 1.000 | % | | 03/20/15 | | | 5,000,000 | | | 218,221 | | | | (27,049 | ) |
Barclays Capital | | Macy’s, Inc. | | Buy | | 1.000 | % | | 03/20/15 | | | 3,520,000 | | | 181,034 | | | | (68,929 | ) |
Barclays Capital | | Textron, Inc. | | Buy | | 1.000 | % | | 03/20/15 | | | 2,000,000 | | | 63,593 | | | | (56 | ) |
BNP Paribas | | Marriott International, Inc. | | Buy | | 1.000 | % | | 03/20/15 | | | 5,560,000 | | | 51,644 | | | | (51,189 | ) |
CS First Boston | | Textron, Inc. | | Buy | | 1.000 | % | | 03/20/15 | | | 3,560,000 | | | 121,078 | | | | (7,884 | ) |
JPMorgan | | Macy’s, Inc. | | Buy | | 1.000 | % | | 03/20/15 | | | 6,000,000 | | | 321,834 | | | | (130,284 | ) |
JPMorgan | | D.R. Horton, Inc. | | Buy | | 1.000 | % | | 03/20/15 | | | 4,500,000 | | | 196,380 | | | | (24,430 | ) |
Morgan Stanley | | The Home Depot, Inc. | | Buy | | 1.000 | % | | 03/20/15 | | | 3,700,000 | | | (28,013 | ) | | | (34,377 | ) |
Morgan Stanley | | Limited Brands, Inc. | | Buy | | 1.000 | % | | 03/20/15 | | | 5,000,000 | | | 235,715 | | | | (58,617 | ) |
| | | | | | | | | | | | | | | | | | | | |
| | | | | | | | | | | | | | | | | | $ | (512,222 | ) |
| | | | | | | | | | | | | | | | | | | | |
At March 31, 2010, the Fund held the following open short futures contracts:
| | | | | | | | | | | | | | |
Interest
Rate Risk | | | | | | | | | | | |
Type | | Number
of
Contracts | | Value | | Aggregate
Face Value | | Expiration
Date | | Unrealized
Appreciation
(Depreciation) | |
2-Year U.S. Treasury Notes | | 134 | | $ | 29,071,719 | | $ | 29,052,439 | | June-
2010 | | $ | (19,280 | ) |
5-Year U.S. Treasury Notes | | 291 | | | 33,419,531 | | | 33,441,651 | | June-
2010 | | | 22,120 | |
30-Year U.S. Treasury Bonds | | 273 | | | 31,702,125 | | | 31,313,066 | | June-
2010 | | | (389,059 | ) |
| | | | | | | | | | | | | | |
| | | | | | | | | | | | $ | (386,219 | ) |
| | | | | | | | | | | | | | |
At March 31, 2010, cash of $1,678,000 was pledged as collateral for open futures contracts.
At March 31, 2010, asset allocation of the Fund is as follows:
| | | |
Asset Allocation (Unaudited) | | % of Net Assets | |
Corporate Fixed-Income Bonds & Notes | | 90.4 | |
Asset-Backed Securities | | 4.2 | |
Government & Agency Obligations | | 2.0 | |
Commercial Mortgage-Backed Securities | | 1.2 | |
Municipal Bonds | | 0.5 | |
Collateralized Mortgage Obligations | | 0.1 | |
Mortgage-Backed Securities | | 0.0 | * |
Warrants | | 0.0 | * |
Preferred Stock | | 0.0 | * |
| | | |
| | 98.4 | |
Short-Term Obligation | | 0.1 | |
Other Assets & Liabilities, Net | | 1.5 | |
| | | |
| | 100.0 | |
| | | |
* Represents less than 0.1% of net assets.
| | |
Acronym | | Name |
| EUR | | Euro |
| PIK | | Payment-In-Kind |
See Accompanying Notes to Financial Statements.
24
Statement of Assets and Liabilities – Columbia Income Fund
March 31, 2010
| | | | | |
| | | | | ($) | |
| Assets | | Unaffiliated investments, at identified cost | | 529,305,125 | |
| | Affiliated investments, at identified cost | | 8,873,974 | |
| | | | | |
| | Total investments, at identified cost | | 538,179,099 | |
| | | | | |
| | Unaffiliated investments, at value | | 536,900,440 | |
| | Affiliated investments, at value | | 9,197,146 | |
| | | | | |
| | Total investments, at value | | 546,097,586 | |
| | Cash | | 115,771 | |
| | Cash collateral for open futures contracts | | 1,678,000 | |
| | Open credit default swap contracts | | 77,147 | |
| | Credit default swap contracts premiums paid | | 1,645,055 | |
| | Unrealized appreciation on forward foreign currency exchange contracts | | 6,888 | |
| | Receivable for: | | | |
| | Fund shares sold | | 251,774 | |
| | Interest | | 8,453,654 | |
| | Trustees’ deferred compensation plan | | 50,841 | |
| | Prepaid expenses | | 11,259 | |
| | Other assets | | 266,631 | |
| | | | | |
| | Total Assets | | 558,654,606 | |
| | |
| Liabilities | | Open credit default swap contracts | | 589,369 | |
| | Credit default swap contracts premiums received | | 64,268 | |
| | Payable for: | | | |
| | Investments purchased | | 43,898 | |
| | Investments purchased on a delayed delivery basis | | 275,030 | |
| | Fund shares repurchased | | 1,286,438 | |
| | Futures variation margin | | 214,836 | |
| | Distributions | | 1,303,759 | |
| | Investment advisory fee | | 195,881 | |
| | Administration fee | | 61,047 | |
| | Pricing and bookkeeping fees | | 17,475 | |
| | Transfer agent fee | | 50,496 | |
| | Trustees’ fees | | 663 | |
| | Custody fee | | 3,997 | |
| | Distribution and service fees | | 32,172 | |
| | Chief compliance officer expenses | | 176 | |
| | Interest | | 687 | |
| | Trustees’ deferred compensation plan | | 50,841 | |
| | Other liabilities | | 59,916 | |
| | | | | |
| | Total Liabilities | | 4,250,949 | |
| | |
| | | | | |
| | Net Assets | | 554,403,657 | |
| | |
| Net Assets Consist of | | Paid-in capital | | 589,509,759 | |
| | Overdistributed net investment income | | (1,133,287 | ) |
| | Accumulated net realized loss | | (40,681,733 | ) |
| | Net unrealized appreciation (depreciation) on: | | | |
| | Investments | | 7,918,487 | |
| | Foreign currency translations and forward foreign currency exchange contracts | | 6,766 | |
| | Futures contracts | | (386,219 | ) |
| | Credit default swap contracts | | (830,116 | ) |
| | | | | |
| | Net Assets | | 554,403,657 | |
See Accompanying Notes to Financial Statements.
25
Statement of Assets and Liabilities (continued) – Columbia Income Fund
March 31, 2010
| | | | | | |
| | | | | | |
| Class A | | Net assets | | $ | 85,360,722 | |
| | Shares outstanding | | | 8,954,883 | |
| | Net asset value per share | | $ | 9.53 | (a) |
| | Maximum sales charge | | | 4.75 | % |
| | Maximum offering price per share ($9.53/0.9525) | | $ | 10.01 | (b) |
| | |
| Class B | | Net assets | | $ | 6,583,239 | |
| | Shares outstanding | | | 690,628 | |
| | Net asset value and offering price per share | | $ | 9.53 | (a) |
| | |
| Class C | | Net assets | | $ | 11,264,679 | |
| | Shares outstanding | | | 1,181,731 | |
| | Net asset value and offering price per share | | $ | 9.53 | (a) |
| | |
| Class Z | | Net assets | | $ | 451,195,017 | |
| | Shares outstanding | | | 47,333,597 | |
| | Net asset value, offering and redemption price per share | | $ | 9.53 | |
| (a) | Redemption price per share is equal to net asset value less any applicable contingent deferred sales charge. |
| (b) | On sales of $50,000 or more the offering price is reduced. |
See Accompanying Notes to Financial Statements.
26
Statement of Operations – Columbia Income Fund
For the Year Ended March 31, 2010
| | | | | |
| | | | | ($) | |
| Investment Income | | Interest | | 35,616,041 | |
| | Interest from affiliates | | 737,137 | |
| | Dollar roll fee income | | 25,312 | |
| | Securities lending | | 1,656 | |
| | | | | |
| | Total Investment Income | | 36,380,146 | |
| | |
| Expenses | | Investment advisory fee | | 2,172,793 | |
| | Administration fee | | 675,315 | |
| | Distribution fee: | | | |
| | Class B | | 56,609 | |
| | Class C | | 84,028 | |
| | Service fee: | | | |
| | Class A | | 204,427 | |
| | Class B | | 18,855 | |
| | Class C | | 28,014 | |
| | Pricing and bookkeeping fees | | 158,268 | |
| | Transfer agent fee | | 315,262 | |
| | Trustees’ fees | | 39,087 | |
| | Custody fee | | 30,228 | |
| | Chief compliance officer expenses | | 748 | |
| | Other expenses | | 242,098 | |
| | | | | |
| | Expenses before interest expense | | 4,025,732 | |
| | Interest expense | | 15,796 | |
| | | | | |
| | Total Expenses | | 4,041,528 | |
| | |
| | Fees waived by distributor – Class C | | (16,837 | ) |
| | Expense reductions | | (23 | ) |
| | | | | |
| | Net Expenses | | 4,024,668 | |
| | |
| | | | | |
| | Net Investment Income | | 32,355,478 | |
| | |
| Net Realized and Unrealized Gain (Loss) on Investments, Foreign Currency, Futures Contracts and Credit Default Swap Contracts | | Net realized gain (loss) on: | | | |
| | Unaffiliated investments | | 12,235,520 | |
| | Affiliated investments | | 96,773 | |
| | Foreign currency transactions and forward foreign currency exchange contracts | | 3,005 | |
| | Futures contracts | | 50,185 | |
| | Credit default swap contracts | | (4,337,416 | ) |
| | | | | |
| | Net realized gain | | 8,048,067 | |
| | |
| | Net change in unrealized appreciation (depreciation) on: | | | |
| | Investments | | 106,169,785 | |
| | Foreign currency translations and forward foreign currency exchange contracts | | 9,378 | |
| | Futures contracts | | (865,654 | ) |
| | Credit default swap contracts | | 227,204 | |
| | | | | |
| | Net change in unrealized appreciation (depreciation) | | 105,540,713 | |
| | | | | |
| | Net Gain | | 113,588,780 | |
| | |
| | | | | |
| | Net Increase Resulting from Operations | | 145,944,258 | |
See Accompanying Notes to Financial Statements.
27
Statement of Changes in Net Assets – Columbia Income Fund
| | | | | | | | |
| | | | | Year Ended March 31, | |
| Increase (Decrease) in Net Assets | | | | 2010 ($) | | | 2009 ($) | |
| Operations | | Net investment income | | 32,355,478 | | | 31,912,448 | |
| | Net realized gain (loss) on investments, futures contracts, credit default swap contracts, foreign currency transactions and forward foreign currency exchange contracts | | 8,048,067 | | | (24,413,566 | ) |
| | Net change in unrealized appreciation (depreciation) on investments, futures contracts, credit default swap contracts, foreign currency translations and forward foreign currency exchange contracts | | 105,540,713 | | | (65,607,648 | ) |
| | | | | | | | |
| | Net increase (decrease) resulting from operations | | 145,944,258 | | | (58,108,766 | ) |
| | | |
| Distributions to Shareholders | | From net investment income: | | | | | | |
| | Class A | | (5,249,455 | ) | | (5,169,722 | ) |
| | Class B | | (428,888 | ) | | (556,058 | ) |
| | Class C | | (652,222 | ) | | (622,081 | ) |
| | Class Z | | (27,984,986 | ) | | (25,490,177 | ) |
| | | | | | | | |
| | Total distributions to shareholders | | (34,315,551 | ) | | (31,838,038 | ) |
| | | |
| | Net Capital Stock Transactions | | (4,548,848 | ) | | (78,349,180 | ) |
| | Increase from regulatory settlements | | 6,535 | | | — | |
| | | | | | | | |
| | Total increase (decrease) in net assets | | 107,086,394 | | | (168,295,984 | ) |
| | | |
| | | | | | | | |
| Net Assets | | Beginning of period | | 447,317,263 | | | 615,613,247 | |
| | End of period | | 554,403,657 | | | 447,317,263 | |
| | Overdistributed net investment income at end of period | | (1,133,287 | ) | | (118,929 | ) |
See Accompanying Notes to Financial Statements.
28
Statement of Changes in Net Assets (continued) – Columbia Income Fund
| | | | | | | | | | | | |
| | | Capital Stock Activity | |
| | | Year Ended
March 31, 2010 | | | Year Ended
March 31, 2009 | |
| | | Shares | | | Dollars ($) | | | Shares | | | Dollars ($) | |
Class A | | | | | | | | | | | | |
Subscriptions | | 1,348,388 | | | 12,079,886 | | | 1,672,484 | | | 13,725,492 | |
Distributions reinvested | | 457,555 | | | 4,138,916 | | | 499,154 | | | 4,101,884 | |
Redemptions | | (2,216,339 | ) | | (19,741,567 | ) | | (4,756,912 | ) | | (39,543,987 | ) |
| | | | | | | | | | | | |
Net decrease | | (410,396 | ) | | (3,522,765 | ) | | (2,585,274 | ) | | (21,716,611 | ) |
| | | | |
Class B | | | | | | | | | | | | |
Subscriptions | | 89,784 | | | 791,251 | | | 133,478 | | | 1,086,874 | |
Distributions reinvested | | 34,497 | | | 311,148 | | | 46,038 | | | 379,391 | |
Redemptions | | (445,888 | ) | | (3,963,679 | ) | | (744,251 | ) | | (6,164,399 | ) |
| | | | | | | | | | | | |
Net decrease | | (321,607 | ) | | (2,861,280 | ) | | (564,735 | ) | | (4,698,134 | ) |
| | | | |
Class C | | | | | | | | | | | | |
Subscriptions | | 175,170 | | | 1,550,578 | | | 295,094 | | | 2,413,848 | |
Distributions reinvested | | 46,533 | | | 420,434 | | | 51,655 | | | 424,724 | |
Redemptions | | (350,263 | ) | | (3,118,901 | ) | | (637,660 | ) | | (5,300,043 | ) |
| | | | | | | | | | | | |
Net decrease | | (128,560 | ) | | (1,147,889 | ) | | (290,911 | ) | | (2,461,471 | ) |
| | | | |
Class Z | | | | | | | | | | | | |
Subscriptions | | 11,799,027 | | | 105,854,141 | | | 15,447,889 | | | 121,886,461 | |
Distributions reinvested | | 1,359,023 | | | 12,296,549 | | | 1,315,745 | | | 10,754,554 | |
Redemptions | | (12,900,249 | ) | | (115,167,604 | ) | | (22,493,647 | ) | | (182,113,979 | ) |
| | | | | | | | | | | | |
Net increase (decrease) | | 257,801 | | | 2,983,086 | | | (5,730,013 | ) | | (49,472,964 | ) |
See Accompanying Notes to Financial Statements.
29
Financial Highlights – Columbia Income Fund
Selected data for a share outstanding throughout each period is as follows:
| | | | | | | | | | | | | | | | | | | | |
| | | Year Ended March 31, | |
| Class A Shares | | 2010 | | | 2009 | | | 2008 | | | 2007 | | | 2006 | |
Net Asset Value, Beginning of Period | | $ | 7.61 | | | $ | 9.06 | | | $ | 9.68 | | | $ | 9.62 | | | $ | 9.89 | |
| | | | | |
Income from Investment Operations: | | | | | | | | | | | | | | | | | | | | |
Net investment income (a) | | | 0.54 | | | | 0.50 | | | | 0.51 | | | | 0.49 | | | | 0.45 | |
Net realized and unrealized gain (loss) on investments, foreign currency, futures contracts and credit default swap contracts | | | 1.95 | | | | (1.45 | ) | | | (0.62 | ) | | | 0.08 | | | | (0.21 | ) |
| | | | | | | | | | | | | | | | | | | | |
Total from investment operations | | | 2.49 | | | | (0.95 | ) | | | (0.11 | ) | | | 0.57 | | | | 0.24 | |
| | | | | |
Less Distributions to Shareholders: | | | | | | | | | | | | | | | | | | | | |
From net investment income | | | (0.57 | ) | | | (0.50 | ) | | | (0.51 | ) | | | (0.51 | ) | | | (0.51 | ) |
| | | | | |
Increase from regulatory settlements | | | — | (b) | | | — | | | | — | | | | — | | | | — | |
| | | | | |
Net Asset Value, End of Period | | $ | 9.53 | | | $ | 7.61 | | | $ | 9.06 | | | $ | 9.68 | | | $ | 9.62 | |
Total return (c) | | | 33.42 | % | | | (10.77 | )% | | | (1.15 | )% | | | 6.04 | %(d) | | | 2.39 | % |
| | | | | |
Ratios to Average Net Assets/Supplemental Data: | | | | | | | | | | | | | | | | | | | | |
Net expenses before interest expense (e) | | | 0.95 | % | | | 1.03 | % | | | 1.00 | % | | | 0.97 | % | | | 1.01 | % |
Interest expense | | | — | %(f) | | | — | %(f) | | | — | %(f) | | | — | | | | — | |
Net expenses (e) | | | 0.95 | % | | | 1.03 | % | | | 1.00 | % | | | 0.97 | % | | | 1.01 | % |
Net investment income (e) | | | 6.04 | % | | | 5.95 | % | | | 5.41 | % | | | 5.13 | % | | | 4.57 | % |
Portfolio turnover rate | | | 131 | % | | | 147 | % | | | 193 | % | | | 142 | % | | | 147 | % |
Net assets, end of period (000s) | | $ | 85,361 | | | $ | 71,290 | | | $ | 108,294 | | | $ | 123,330 | | | $ | 100,295 | |
| (a) | Per share data was calculated using the average shares outstanding during the period. |
| (b) | Rounds to less than $0.01 per share. |
| (c) | Total return at net asset value assuming all distributions reinvested and no initial sales charge or contingent deferred sales charge. |
| (d) | Total return includes a voluntary reimbursement by the investment advisor for a realized investment loss due to a trading error. This reimbursement increased total return and net asset value per share by less than 0.01% and less than $0.01, respectively. |
| (e) | The benefits derived from expense reductions had an impact of less than 0.01%. |
| (f) | Rounds to less than 0.01%. |
See Accompanying Notes to Financial Statements.
30
Financial Highlights – Columbia Income Fund
Selected data for a share outstanding throughout each period is as follows:
| | | | | | | | | | | | | | | | | | | | |
| | | Year Ended March 31, | |
| Class B Shares | | 2010 | | | 2009 | | | 2008 | | | 2007 | | | 2006 | |
Net Asset Value, Beginning of Period | | $ | 7.61 | | | $ | 9.06 | | | $ | 9.68 | | | $ | 9.62 | | | $ | 9.89 | |
| | | | | |
Income from Investment Operations: | | | | | | | | | | | | | | | | | | | | |
Net investment income (a) | | | 0.48 | | | | 0.43 | | | | 0.44 | | | | 0.42 | | | | 0.38 | |
Net realized and unrealized gain (loss) on investments, foreign currency, futures contracts and credit default swap contracts | | | 1.95 | | | | (1.45 | ) | | | (0.62 | ) | | | 0.07 | | | | (0.22 | ) |
| | | | | | | | | | | | | | | | | | | | |
Total from investment operations | | | 2.43 | | | | (1.02 | ) | | | (0.18 | ) | | | 0.49 | | | | 0.16 | |
| | | | | |
Less Distributions to Shareholders: | | | | | | | | | | | | | | | | | | | | |
From net investment income | | | (0.51 | ) | | | (0.43 | ) | | | (0.44 | ) | | | (0.43 | ) | | | (0.43 | ) |
| | | | | |
Increase from regulatory settlements | | | — | (b) | | | — | | | | — | | | | — | | | | — | |
| | | | | |
Net Asset Value, End of Period | | $ | 9.53 | | | $ | 7.61 | | | $ | 9.06 | | | $ | 9.68 | | | $ | 9.62 | |
Total return (c) | | | 32.44 | % | | | (11.44 | )% | | | (1.88 | )% | | | 5.26 | %(d) | | | 1.63 | % |
| | | | | |
Ratios to Average Net Assets/Supplemental Data: | | | | | | | | | | | | | | | | | | | | |
Net expenses before interest expense (e) | | | 1.70 | % | | | 1.78 | % | | | 1.75 | % | | | 1.72 | % | | | 1.76 | % |
Interest expense | | | — | %(f) | | | — | %(f) | | | — | %(f) | | | — | | | | — | |
Net expenses (e) | | | 1.70 | % | | | 1.78 | % | | | 1.75 | % | | | 1.72 | % | | | 1.76 | % |
Net investment income (e) | | | 5.33 | % | | | 5.17 | % | | | 4.67 | % | | | 4.38 | % | | | 3.83 | % |
Portfolio turnover rate | | | 131 | % | | | 147 | % | | | 193 | % | | | 142 | % | | | 147 | % |
Net assets, end of period (000s) | | $ | 6,583 | | | $ | 7,705 | | | $ | 14,290 | | | $ | 20,105 | | | $ | 23,649 | |
| (a) | Per share data was calculated using the average shares outstanding during the period. |
| (b) | Rounds to less than $0.01 per share. |
| (c) | Total return at net asset value assuming all distributions reinvested and no contingent deferred sales charge. |
| (d) | Total return includes a voluntary reimbursement by the investment advisor for a realized investment loss due to a trading error. This reimbursement increased total return and net asset value per share by less than 0.01% and less than $0.01, respectively. |
| (e) | The benefits derived from expense reductions had an impact of less than 0.01%. |
| (f) | Rounds to less than 0.01%. |
See Accompanying Notes to Financial Statements.
31
Financial Highlights – Columbia Income Fund
Selected data for a share outstanding throughout each period is as follows:
| | | | | | | | | | | | | | | | | | | | |
| | | Year Ended March 31, | |
| Class C Shares | | 2010 | | | 2009 | | | 2008 | | | 2007 | | | 2006 | |
Net Asset Value, Beginning of Period | | $ | 7.61 | | | $ | 9.06 | | | $ | 9.68 | | | $ | 9.62 | | | $ | 9.89 | |
| | | | | |
Income from Investment Operations: | | | | | | | | | | | | | | | | | | | | |
Net investment income (a) | | | 0.49 | | | | 0.45 | | | | 0.45 | | | | 0.44 | | | | 0.39 | |
Net realized and unrealized gain (loss) on investments, foreign currency, futures contracts and credit default swap contracts | | | 1.95 | | | | (1.45 | ) | | | (0.61 | ) | | | 0.07 | | | | (0.21 | ) |
| | | | | | | | | | | | | | | | | | | | |
Total from investment operations | | | 2.44 | | | | (1.00 | ) | | | (0.16 | ) | | | 0.51 | | | | 0.18 | |
| | | | | |
Less Distributions to Shareholders: | | | | | | | | | | | | | | | | | | | | |
From net investment income | | | (0.52 | ) | | | (0.45 | ) | | | (0.46 | ) | | | (0.45 | ) | | | (0.45 | ) |
| | | | | |
Increase from regulatory settlements | | | — | (b) | | | — | | | | — | | | | — | | | | — | |
| | | | | |
Net Asset Value, End of Period | | $ | 9.53 | | | $ | 7.61 | | | $ | 9.06 | | | $ | 9.68 | | | $ | 9.62 | |
Total return (c)(d) | | | 32.63 | % | | | (11.31 | )% | | | (1.74 | )% | | | 5.41 | %(e) | | | 1.78 | % |
| | | | | |
Ratios to Average Net Assets/Supplemental Data: | | | | | | | | | | | | | | | | | | | | |
Net expenses before interest expense (f) | | | 1.55 | % | | | 1.63 | % | | | 1.60 | % | | | 1.57 | % | | | 1.61 | % |
Interest expense | | | — | %(g) | | | — | %(g) | | | — | %(g) | | | — | | | | — | |
Net expenses (f) | | | 1.55 | % | | | 1.63 | % | | | 1.60 | % | | | 1.57 | % | | | 1.61 | % |
Waiver/Reimbursement | | | 0.15 | % | | | 0.15 | % | | | 0.15 | % | | | 0.15 | % | | | 0.15 | % |
Net investment income (f) | | | 5.45 | % | | | 5.35 | % | | | 4.81 | % | | | 4.52 | % | | | 3.96 | % |
Portfolio turnover rate | | | 131 | % | | | 147 | % | | | 193 | % | | | 142 | % | | | 147 | % |
Net assets, end of period (000s) | | $ | 11,265 | | | $ | 9,974 | | | $ | 14,510 | | | $ | 16,660 | | | $ | 13,042 | |
| (a) | Per share data was calculated using the average shares outstanding during the period. |
| (b) | Rounds to less than $0.01 per share. |
| (c) | Total return at net asset value assuming all distributions reinvested and no contingent deferred sales charge. |
| (d) | Had the investment advisor and/or any of its affiliates not waived fees or reimbursed a portion of expenses, total return would have been reduced. |
| (e) | Total return includes a voluntary reimbursement by the investment advisor for a realized investment loss due to a trading error. This reimbursement increased total return and net asset value per share by less than 0.01% and less than $0.01, respectively. |
| (f) | The benefits derived from expense reductions had an impact of less than 0.01%. |
| (g) | Rounds to less than 0.01%. |
See Accompanying Notes to Financial Statements.
32
Financial Highlights – Columbia Income Fund
Selected data for a share outstanding throughout each period is as follows:
| | | | | | | | | | | | | | | | | | | | |
| | | Year Ended March 31, | |
| Class Z Shares | | 2010 | | | 2009 | | | 2008 | | | 2007 | | | 2006 | |
Net Asset Value, Beginning of Period | | $ | 7.61 | | | $ | 9.06 | | | $ | 9.68 | | | $ | 9.62 | | | $ | 9.89 | |
| | | | | |
Income from Investment Operations: | | | | | | | | | | | | | | | | | | | | |
Net investment income (a) | | | 0.56 | | | | 0.52 | | | | 0.53 | | | | 0.52 | | | | 0.48 | |
Net realized and unrealized gain (loss) on investments, foreign currency, futures contracts and credit default swap contracts | | | 1.96 | | | | (1.45 | ) | | | (0.61 | ) | | | 0.07 | | | | (0.22 | ) |
| | | | | | | | | | | | | | | | | | | | |
Total from investment operations | | | 2.52 | | | | (0.93 | ) | | | (0.08 | ) | | | 0.59 | | | | 0.26 | |
| | | | | |
Less Distributions to Shareholders: | | | | | | | | | | | | | | | | | | | | |
From net investment income | | | (0.60 | ) | | | (0.52 | ) | | | (0.54 | ) | | | (0.53 | ) | | | (0.53 | ) |
| | | | | |
Increase from regulatory settlements | | | — | (b) | | | — | | | | — | | | | — | | | | — | |
| | | | | |
Net Asset Value, End of Period | | $ | 9.53 | | | $ | 7.61 | | | $ | 9.06 | | | $ | 9.68 | | | $ | 9.62 | |
Total return (c) | | | 33.74 | % | | | (10.55 | )% | | | (0.90 | )% | | | 6.31 | %(d) | | | 2.64 | % |
| | | | | |
Ratios to Average Net Assets/Supplemental Data: | | | | | | | | | | | | | | | | | | | | |
Net expenses before interest expense (e) | | | 0.70 | % | | | 0.78 | % | | | 0.75 | % | | | 0.72 | % | | | 0.76 | % |
Interest expense | | | — | %(f) | | | — | %(f) | | | — | %(f) | | | — | | | | — | |
Net expenses (e) | | | 0.70 | % | | | 0.78 | % | | | 0.75 | % | | | 0.72 | % | | | 0.76 | % |
Net investment income (e) | | | 6.29 | % | | | 6.22 | % | | | 5.66 | % | | | 5.39 | % | | | 4.82 | % |
Portfolio turnover rate | | | 131 | % | | | 147 | % | | | 193 | % | | | 142 | % | | | 147 | % |
Net assets, end of period (000s) | | $ | 451,195 | | | $ | 358,348 | | | $ | 478,519 | | | $ | 509,037 | | | $ | 351,529 | |
| (a) | Per share data was calculated using the average shares outstanding during the period. |
| (b) | Rounds to less than $0.01 per share. |
| (c) | Total return at net asset value assuming all distributions reinvested. |
| (d) | Total return includes a voluntary reimbursement by the investment advisor for a realized investment loss due to a trading error. This reimbursement increased total return and net asset value per share by less than 0.01% and less than $0.01, respectively. |
| (e) | The benefits derived from expense reductions had an impact of less than 0.01%. |
| (f) | Rounds to less than 0.01%. |
See Accompanying Notes to Financial Statements.
33
Notes to Financial Statements – Columbia Income Fund
March 31, 2010
Note 1. Organization
Columbia Income Fund (the “Fund”), a series of Columbia Funds Series Trust I (the “Trust”), is a diversified fund. The Trust is registered under the Investment Company Act of 1940, as amended (the “1940 Act”), as an open-end management investment company organized as a Massachusetts business trust.
Investment Objective
The Fund seeks total return, consisting primarily of current income and secondarily of capital appreciation.
Fund Shares
The Trust may issue an unlimited number of shares, and the Fund offers four classes of shares: Class A, Class B, Class C and Class Z. Each share class has its own expense structure and sales charges, as applicable. Effective June 22, 2009, the Fund no longer accepts investments from new or existing investors in the Fund’s Class B shares, except in connection with the reinvestment of any dividend and/or capital gain distributions in Class B shares of the Fund and exchanges by existing Class B shareholders of the other Columbia Funds.
Class A shares are subject to a maximum front-end sales charge of 4.75% based on the amount of initial investment. Class A shares purchased without an initial sales charge in accounts aggregating $1 million and $50 million at the time of purchase are subject to a 1.00% contingent deferred sales charge (“CDSC”) if the shares are sold within one year after purchase. Class B shares are subject to a maximum CDSC of 5.00% based upon the holding period after purchase. Class B shares will convert to Class A shares eight years after purchase. Class C shares are subject to a 1.00% CDSC on shares sold within one year after purchase. Class Z shares are offered continuously at net asset value. There are certain restrictions on the purchase of Class Z shares, as described in the Fund’s prospectus.
Note 2. Significant Accounting Policies
The preparation of financial statements in accordance with accounting principles generally accepted in the United States of America (“GAAP”) requires management to make certain estimates and assumptions that affect the reported amounts of assets and liabilities, the disclosure of contingent assets and liabilities at the date of the financial statements and the reported amounts of revenue and expenses during the reporting period. Actual results could differ from those estimates.
The following is a summary of significant accounting policies consistently followed by the Fund in the preparation of its financial statements.
Security Valuation
Debt securities generally are valued by pricing services approved by the Trust’s Board of Trustees, based upon market transactions for normal, institutional-size trading units of similar securities. The services may use various pricing techniques which take into account appropriate factors such as yield, quality, coupon rate, maturity, type of issue, trading characteristics and other data, as well as broker quotes. Debt securities for which quotations are readily available may also be valued based upon an over-the-counter or exchange bid quotation.
Certain debt securities, which tend to be more thinly traded and of lesser quality, are priced based on fundamental analysis of the financial condition of the issuer and the estimated value of any collateral. Valuations developed through pricing techniques may vary from the actual amounts realized upon sale of the securities, and the potential variation may be greater for those securities valued using fundamental analysis.
Equity securities are valued at the last sale price on the principal exchange on which they trade, except for securities traded on the NASDAQ, which are valued at the NASDAQ official close price. Unlisted securities or listed securities for which there were no sales during the day are valued at the closing bid price on such exchanges or over-the-counter markets.
Short-term investments maturing in 60 days or less are valued at amortized cost, which approximates market value.
Futures contracts are valued at the settlement price established each day by the board of trade or exchange on which they are traded.
Forward foreign currency exchange contracts are valued at the prevailing forward exchange rate of the underlying currencies.
Credit default swap contracts are marked to market daily based upon spread quotations from market makers.
Foreign securities are generally valued at the last sale price on the foreign exchange or market on which they trade. If any
34
Columbia Income Fund
March 31, 2010
foreign share prices are not readily available as a result of limited share activity, the securities are valued at the last sale price of the local shares in the principal market in which such securities are normally traded.
Generally, trading in foreign securities is substantially completed each day at various times prior to the close of the New York Stock Exchange (“NYSE”). The values of such securities used in computing the net asset value of the Fund’s shares are determined as of such times. Foreign currency exchange rates are generally determined at 4:00 p.m. Eastern (U.S.) time. Occasionally, events affecting the values of such foreign securities may occur between the times at which they are determined and the close of the customary trading session of the NYSE, which would not be reflected in the computation of the Fund’s net asset value. If events materially affecting the values of such foreign securities occur and it is determined that market quotations are not reliable, then these foreign securities will be valued at their fair value using procedures approved by the Board of Trustees.
Investments for which market quotations are not readily available, or that have quotations which management believes are not reliable, are valued at fair value as determined in good faith under consistently applied procedures established by and under the general supervision of the Board of Trustees. If a security is valued at fair value, such value is likely to be different from the last quoted market price for the security. The determination of fair value often requires significant judgment. To determine fair value, management may use assumptions including but not limited to future cash flows and estimated risk premiums. Multiple inputs from various sources may be used to determine value.
GAAP establishes a hierarchy that prioritizes the inputs to valuation techniques used to measure fair value giving the highest priority to unadjusted quoted prices in active markets for identical securities (level 1 measurements) and the lowest priority to unobservable inputs (level 3 measurements) when market prices are not readily available or reliable. The three levels of the fair value hierarchy are described below:
| | n | | Level 1 – quoted prices in active markets for identical securities |
| | n | | Level 2 – prices determined using other significant observable inputs (including quoted prices for similar securities, interest rates, prepayment speeds, credit risk and others) |
| | n | | Level 3 – prices determined using significant unobservable inputs. In situations where quoted prices or observable inputs are unavailable or less reliable, unobservable inputs may be used. Unobservable inputs may include management’s own assumptions about the factors market participants would use in pricing an investment. |
The inputs or methodology used for valuing securities are not necessarily an indication of the risk associated with investing in those securities.
On January 21, 2010, the FASB issued an Accounting Standards Update (the amendment), Fair Value Measurements and Disclosures (Topic 820): Improving Disclosures about Fair Value Measurements, which provides guidance on how investment assets and liabilities are to be valued and disclosed. Specifically, the amendment requires reporting entities to disclose the input and valuation techniques used to measure fair value for both recurring and nonrecurring fair value measurements for Level 2 or Level 3 positions. The amendment also requires that transfers between all levels (including Level 1 and Level 2) be disclosed on a gross basis (i.e., transfers out must be disclosed separately from transfers in), and the reason(s) for the transfer. Additionally purchases, sales, issuances and settlements must be disclosed on a gross basis in the Level 3 rollforward. The effective date of the amendment is for interim and annual periods beginning after December 15, 2009, however, the requirement to provide the Level 3 activity for purchases, sales, issuances and settlements on a gross basis will be effective for interim and annual periods beginning after December 15, 2010. At this time, management is evaluating the implications of the amendment and the impact to the financial statements.
Security Transactions
Security transactions are accounted for on the trade date. Cost is determined and gains (losses) are based upon the specific identification method for both financial statement and federal income tax purposes.
Derivative Instruments
The Fund may invest in derivative instruments. For additional information on derivative instruments, please see Note 6.
Repurchase Agreements
The Fund may engage in repurchase agreement transactions with institutions that Columbia Management Advisors, LLC
35
Columbia Income Fund
March 31, 2010
(“Columbia”), the Fund’s investment advisor, has determined are creditworthy. The Fund, through its custodian, receives delivery of the underlying securities collateralizing a repurchase agreement. Columbia is responsible for determining that the collateral is at least equal, at all times, to the value of the repurchase obligation including interest. A repurchase agreement transaction involves certain risks in the event of default or insolvency of the counterparty. These risks include possible delays in or restrictions on the Fund’s ability to dispose of the underlying securities and a possible decline in the value of the underlying securities during the period while the Fund seeks to assert its rights.
Loan Participations and Commitments
The Fund may invest in loan participations. When the Fund purchases a loan participation, the Fund typically enters into a contractual relationship with the lender or third party selling such participation (“Selling Participant”), but not the borrower. However, the Fund assumes the credit risk of the borrower, Selling Participant and any other persons interpositioned between the Fund and the borrower. The Fund may not directly benefit from the collateral supporting the senior loan which it has purchased from the Selling Participant.
Mortgage Dollar Roll Transactions
The Fund may enter into mortgage “dollar rolls” in which the Fund sells securities for delivery in the current month and simultaneously contracts with the same counterparty to repurchase similar (same type, coupon and maturity) but not identical securities on a specified future date not exceeding 120 days. During the roll period, the Fund loses the right to receive principal and interest paid on the securities sold. However, the Fund would benefit to the extent of any difference between the price received for the securities sold and the lower forward price for the future purchase (often referred to as the “drop”) or fee income plus the interest earned on the cash proceeds of the securities sold until the settlement date of the forward purchase. Unless such benefits exceed the income, capital appreciation and gain or loss due to mortgage prepayments that would have been realized on the securities sold as part of the mortgage dollar roll, the use of this technique will diminish the investment performance of the Fund compared with what such performance would have been without the use of mortgage dollar rolls. All cash proceeds will be invested in instruments that are permissible investments for the Fund. The Fund identifies within its portfolio of investments cash or liquid securities in an amount equal to the forward purchase price.
The Fund’s policy is to record the components of mortgage dollar rolls using “to be announced” mortgage-backed securities. For financial reporting and tax purposes, the Fund treats mortgage dollar rolls as two separate transactions, one involving the purchase of a security and a separate transaction involving a sale. The Fund does not currently enter into mortgage dollar rolls that are accounted for as financing transactions.
Mortgage dollar rolls involve certain risks. If the broker-dealer to whom the Fund sells the securities becomes insolvent, the Fund’s right to purchase or repurchase the mortgage-related securities may be restricted and the instruments which the Fund is required to repurchase may be worth less than instruments which the Fund originally held. Successful use of mortgage dollar rolls may depend upon the investment advisor’s ability to predict correctly interest rates and mortgage prepayments. For these reasons, there is no assurance that mortgage dollar rolls can be successfully employed.
Delayed Delivery Securities
The Fund may trade securities on other than normal settlement terms, including securities purchased or sold on a “when-issued” basis. This may increase the risk if the other party to the transaction fails to deliver and causes the Fund to subsequently invest at less advantageous prices. The Fund identifies within its portfolio of investments cash or liquid securities in an amount equal to the delayed delivery commitment.
Foreign Currency Transactions and Translations
The values of all assets and liabilities quoted in foreign currencies are translated into U.S. dollars at that day’s exchange rates. Net realized and unrealized gains (losses) on foreign currency transactions and translations include gains (losses) arising from the fluctuation in exchange rates between trade and settlement dates on securities transactions, gains (losses) arising from the disposition of foreign currency and currency gains (losses) between the
36
Columbia Income Fund
March 31, 2010
accrual and payment dates on dividends, interest income and foreign withholding taxes.
For financial statement purposes, the Fund does not distinguish that portion of gains (losses) on investments which is due to changes in foreign exchange rates from that which is due to changes in market prices of the investments. Such fluctuations are included with the net realized and unrealized gains (losses) on investments on the Statement of Operations.
Income Recognition
Interest income is recorded on the accrual basis and includes accretion of discounts, amortization of premiums and paydown gains and losses. Fee income attributable to mortgage dollar roll transactions is recorded on the accrual basis over the term of the transaction. The value of additional securities received as an income payment is recorded as income and as the cost basis of such securities.
Expenses
General expenses of the Trust are allocated to the Fund and other series of the Trust based upon relative net assets or other expense allocation methodologies determined by the nature of the expense. Expenses directly attributable to the Fund are charged to the Fund.
Determination of Class Net Asset Value
All income, expenses (other than class-specific expenses, as shown on the Statement of Operations) and realized and unrealized gains (losses) are allocated to each class of the Fund on a daily basis for purposes of determining the net asset value of each class. Income and expenses are allocated to each class based on the settled shares method, while realized and unrealized gains (losses) are allocated based on the relative net assets of each class.
Federal Income Tax Status
The Fund intends to qualify each year as a “regulated investment company” under Subchapter M of the Internal Revenue Code, as amended, and will distribute substantially all of its tax exempt or taxable income, if any, for its tax year, and as such will not be subject to federal income taxes. In addition, the Fund intends to distribute in each calendar year substantially all of its net investment income, capital gains and certain other amounts, if any, such that the Fund should not be subject to federal excise tax. Therefore, no federal income or excise tax provision is recorded.
Distributions to Shareholders
Distributions from net investment income are declared daily and paid monthly. Net realized capital gains, if any, are distributed at least annually. Income distributions and capital gain distributions are determined in accordance with federal income tax regulations which may differ from GAAP.
Indemnification
In the normal course of business, the Fund enters into contracts that contain a variety of representations and warranties and which provide general indemnities. The Fund’s maximum exposure under these arrangements is unknown because this would involve future claims against the Fund. Also, under the Trust’s organizational documents and by contract, the Trustees and officers of the Trust are indemnified against certain liabilities that may arise out of actions relating to their duties to the Trust. However, based on experience, the Fund expects the risk of loss due to these representations, warranties and indemnities to be minimal.
Note 3. Federal Tax Information
The timing and character of income and capital gain distributions are determined in accordance with income tax regulations, which may differ from GAAP. Reclassifications are made to the Fund’s capital accounts for permanent tax differences to reflect income and gains available for distribution (or available capital loss carryforwards) under income tax regulations.
For the year ended March 31, 2010, permanent book and tax basis differences resulting primarily from differing treatments for discount accretion/premium amortization on debt securities, paydown gain/loss, expired capital loss carryforwards, market discount, Section 988 currency gain/loss, proceeds from litigation settlements and defaulted securities basis adjustments were identified and reclassified among the components of the Fund’s net assets as follows:
| | | | |
| | | | | |
Overdistributed Net Investment
Income | | Accumulated Net Realized
Loss | | Paid-In Capital |
| $945,715 | | $405,556 | | $(1,351,271) |
37
Columbia Income Fund
March 31, 2010
Net investment income and net realized gains (losses), as disclosed on the Statement of Operations, and net assets were not affected by this reclassification.
The tax character of distributions paid during the years ended March 31, 2010 and March 31, 2009 was as follows:
| | | | | | |
| | | March 31, 2010 | | March 31, 2009 |
| Distributions paid from: | | |
Ordinary Income* | | $ | 34,315,551 | | $ | 31,838,038 |
Long-Term Capital Gains | | | — | | | — |
| * | For tax purposes short-term capital gain distributions, if any, are considered ordinary income distributions. |
As of March 31, 2010, the components of distributable earnings on a tax basis were as follows:
| | | | |
| | | | | |
Undistributed
Ordinary
Income | | Undistributed
Long-Term
Capital Gains | | Net Unrealized Appreciation* |
| $1,716,938 | | $— | | $6,656,385 |
| * | The differences between book-basis and tax-basis net unrealized appreciation are primarily due to deferral of losses from wash sales. |
Unrealized appreciation and depreciation at March 31, 2010, based on cost of investments for federal income tax purposes were:
| | | | |
| | | | |
Unrealized appreciation | | $ | 34,617,582 | |
Unrealized depreciation | | | (27,961,197 | ) |
Net unrealized appreciation | | $ | 6,656,385 | |
The following capital loss carryforwards may be available to reduce taxable income arising from future net realized gains on investments, if any, to the extent permitted by the Internal Revenue Code:
| | | |
| | | |
| Year of Expiration | | Capital Loss Carryforward |
| 2011 | | $ | 2,985,140 |
| 2014 | | | 3,731,648 |
| 2015 | | | 6,709,359 |
| 2016 | | | 4,172,850 |
| 2017 | | | 15,893,321 |
| 2018 | | | 6,922,021 |
| | | |
| Total | | $ | 40,414,339 |
| | | |
Capital loss carryforwards of $1,393,345 expired during the year ended March 31, 2010. Any capital loss carryforwards acquired as part of a merger that are permanently lost due to provisions under the Internal Revenue Code are included as being expired. Expired capital loss carryforwards are recorded as a reduction of paid-in capital.
Management is required to determine whether a tax position of the Fund is more likely than not to be sustained upon examination by the applicable taxing authority, including resolution of any related appeals or litigation processes, based on the technical merits of the position. The tax benefit to be recognized by the Fund is measured as the largest amount of benefit that is greater than fifty percent likely of being realized upon ultimate settlement. Management is not aware of any tax positions for which it is reasonably possible that the total amounts of unrecognized tax benefits will significantly change in the next twelve months. However, management’s conclusions may be subject to review and adjustment at a later date based on factors including, but not limited to, new tax laws, regulations, and administrative interpretations (including relevant court decisions). The Fund’s federal tax returns for the prior three fiscal years remain subject to examination by the Internal Revenue Service.
Note 4. Fees and Compensation Paid to Affiliates
Investment Advisory Fee
Columbia, an indirect, wholly owned subsidiary of Bank of America Corporation (“BOA”) provides investment advisory services to the Fund. Columbia receives a monthly investment advisory fee based on the Fund’s average daily net assets at the following annual rates:
| | | |
| | | | |
| Average Daily Net Assets | | Annual Fee Rate | |
First $500 million | | 0.420 | % |
$500 million to $1 billion | | 0.375 | % |
$1 billion to $1.5 billion | | 0.370 | % |
$1.5 billion to $3 billion | | 0.340 | % |
$3 billion to $6 billion | | 0.330 | % |
Over $6 billion | | 0.320 | % |
38
Columbia Income Fund
March 31, 2010
For the year ended March 31, 2010, the Fund’s effective investment advisory fee rate was 0.42% of the Fund’s average daily net assets.
Bank of America, N.A., an indirect parent company of Columbia, entered into an agreement dated September 29, 2009, to sell a portion of the asset management business of Columbia Management Group, LLC to Ameriprise Financial, Inc. (“Ameriprise Financial”). The transaction (“Transaction”) includes the sale of the part of the asset management business that advises long-term mutual funds, including the Fund. The Transaction is subject to certain approvals and other conditions to closing, and is currently expected to close on or about April 30, 2010 (the “Closing”).
In connection with the Closing, certain changes will occur, including a change in the entities serving as the investment advisor, administrator, distributor and transfer agent of the Fund. RiverSource Investments, LLC (the “New Advisor”), a subsidiary of Ameriprise Financial, will become the investment advisor of the Fund upon the Closing. On March 3, 2010, the Fund’s shareholders approved, among other matters, the proposed investment management services agreement with the New Advisor. The New Advisor will serve as investment advisor under a new investment management services agreement effective upon the Closing. The New Advisor will change its name to Columbia Management Investment Advisers, LLC upon or shortly after the Closing. Effective upon the Closing, as the context requires, references to Columbia shall be deemed to refer to the New Advisor.
Administration Fee
Columbia provides administrative and other services to the Fund for a monthly administration fee based on the Fund’s average daily net assets at the following annual rates:
| | | |
| | | | |
| Average Daily Net Assets | | Annual Fee Rate | |
First $100 million | | 0.150 | % |
$100 million to $1 billion | | 0.125 | % |
Over $1 billion | | 0.100 | % |
For the year ended March 31, 2010, the Fund’s effective administration fee rate was 0.13% of the Fund’s average daily net assets.
The New Advisor will become the administrator of the Fund under a new administrative services agreement effective upon the Closing.
Pricing and Bookkeeping Fees
The Fund has entered into a Financial Reporting Services Agreement (the “Financial Reporting Services Agreement”) with State Street Bank and Trust Company (“State Street”) and Columbia pursuant to which State Street provides financial reporting services to the Fund. The Fund has also entered into an Accounting Services Agreement (collectively with the Financial Reporting Services Agreement, the “State Street Agreements”) with State Street and Columbia pursuant to which State Street provides accounting services to the Fund. Under the State Street Agreements, the Fund pays State Street an annual fee of $38,000 paid monthly plus an additional monthly fee based on an annualized percentage rate of average daily net assets of the Fund for the month. The aggregate fee will not exceed $140,000 per year (exclusive of out-of-pocket expenses and charges). The Fund also reimburses State Street for certain out-of-pocket expenses and charges.
Among other updates to the State Street Agreements, Columbia will assign and delegate its rights and obligations thereunder to the New Advisor upon the Closing.
The Fund has entered into a Pricing and Bookkeeping Oversight and Services Agreement (the “Services Agreement”) with Columbia. Under the Services Agreement, Columbia provides services related to Fund expenses and the requirements of the Sarbanes-Oxley Act of 2002, and provides oversight of the accounting and financial reporting services provided by State Street. Under the Services Agreement, the Fund reimburses Columbia for out-of-pocket expenses.
The Services Agreement will be terminated upon the Closing, and the services provided thereunder will be covered under the administrative services agreement with the New Advisor.
Transfer Agent Fee
Columbia Management Services, Inc. (the “Transfer Agent”), an affiliate of Columbia and an indirect, wholly owned subsidiary of BOA, provides shareholder services to the Fund and has contracted with Boston Financial Data Services (“BFDS”) to serve as sub-transfer agent. Effective November 1, 2009, the Transfer Agent is entitled to receive a
39
Columbia Income Fund
March 31, 2010
fee for its services, paid monthly, at the annual rate of $22.36 per account plus reimbursement of certain sub-transfer agent fees paid by the Transfer Agent (exclusive of BFDS fees), calculated based on assets held in omnibus accounts and intended to recover the cost of payments to other parties (including affiliates of BOA) for services to those accounts. Prior to November 1, 2009, the annual rate was $17.34 per account. The Transfer Agent pays the fees of BFDS for services as sub-transfer agent and is not entitled to reimbursement for such fees from the Fund.
The Transfer Agent may also retain, as additional compensation for its services, fees for wire, telephone and redemption orders, Individual Retirement Account (“IRA”) trustee agent fees and account transcript fees due to the Transfer Agent from shareholders of the Fund and credits (net of bank charges) earned with respect to balances in accounts the Transfer Agent maintains in connection with its services to the Fund. The Transfer Agent also receives reimbursement for certain out-of-pocket expenses.
RiverSource Service Corporation (the “New Transfer Agent”), a subsidiary of Ameriprise Financial, will become the transfer agent of the Fund upon the Closing. The New Transfer Agent will change its name to Columbia Management Investment Services Corp. upon or shortly after the Closing.
An annual minimum account balance fee of $20 may apply to certain accounts with a value below the Fund’s initial minimum investment requirements to reduce the impact of small accounts on transfer agent fees. These minimum account balance fees are recorded as part of expense reductions on the Statement of Operations. For the year ended March 31, 2010, no minimum account balance fees were charged by the Fund.
Underwriting Discounts, Service and Distribution Fees
Columbia Management Distributors, Inc. (the “Distributor”), an affiliate of Columbia and an indirect, wholly owned subsidiary of BOA, is the principal underwriter of the Fund’s shares. For the year ended March 31, 2010, the Distributor has retained net underwriting discounts of $8,270 on sales of the Fund’s Class A shares and received net CDSC fees of $409, $6,890 and $1,744 on Class A, Class B and Class C share redemptions, respectively.
RiverSource Fund Distributors, Inc. (the “New Distributor”), a subsidiary of Ameriprise Financial, will become the distributor of the Fund upon the Closing. The New Distributor will change its name to Columbia Management Investment Distributors, Inc. upon or shortly after the Closing.
The Fund has adopted plans pursuant to Rule 12b-1 under the 1940 Act (the “Plans”) which require the payment of a monthly service fee to the Distributor at the maximum annual rate of 0.25% of the average daily net assets attributable to Class A, Class B and Class C shares of the Fund. The Plans also require the payment of a monthly distribution fee to the Distributor at the maximum annual rate of 0.75% of the average daily net assets attributable to Class B and Class C shares only. The Distributor has voluntarily agreed to waive a portion of the Fund’s distribution and service fees for the Class C shares so that the combined fee will not exceed 0.85% annually of Class C average daily net assets. This arrangement may be modified or terminated by the Distributor at any time.
The CDSC and the distribution fees received from the Plans are used principally as repayment to the Distributor for amounts paid by the Distributor to dealers who sold such shares.
Fee Waivers and Expense Reimbursements
Columbia has voluntarily agreed to reimburse a portion of the Fund’s expenses so that the Fund’s ordinary operating expenses (excluding any distribution and service fees, brokerage commissions, interest, taxes and extraordinary expenses, but including custodian charges relating to overdrafts, if any), after giving effect to any balance credits from the Fund’s custodian, do not exceed 0.70% of the Fund’s average daily net assets on an annualized basis. Columbia, in its discretion, may revise or discontinue this arrangement at any time.
Fees Paid to Officers and Trustees
All officers of the Fund are employees of Columbia or its affiliates and, with the exception of the Fund’s Chief Compliance Officer, receive no compensation from the Fund. The Board of Trustees has appointed a Chief Compliance Officer to the Fund in accordance with federal securities regulations. The Fund, along with other affiliated funds, pays its pro-rata share of the expenses associated with the Chief
40
Columbia Income Fund
March 31, 2010
Compliance Officer. The Fund’s expenses for the Chief Compliance Officer will not exceed $15,000 per year.
Trustees are compensated for their services to the Fund, as set forth on the Statement of Operations. The Trust’s eligible Trustees may participate in a deferred compensation plan which may be terminated at any time. Obligations of the plan will be paid solely out of the Fund’s assets.
Note 5. Custody Credits
The Fund has an agreement with its custodian bank under which custody fees may be reduced by balance credits. These credits are recorded as part of expense reduction on the Statement of Operations. The Fund could have invested a portion of the assets utilized in connection with the expense offset arrangement in an income-producing asset if it had not entered into such an agreement.
For the year ended March 31, 2010, these custody credits reduced total expenses by $23 for the Fund.
Note 6. Objectives and Strategies for Investing in Derivative Instruments
The Fund uses derivatives instruments including futures contracts, credit default swaps and forward foreign currency exchange contracts in order to meet its investment objectives. The Fund employs strategies in differing combinations to permit it to increase, decrease or change the level of exposure to market risk factors. The achievement of any strategy relating to derivatives depends on an analysis of various risk factors, and if the strategies for the use of derivatives do not work as intended, the Fund may not achieve its investment objectives.
In pursuit of its investment objectives, the Fund is exposed to the following market risks:
Interest Rate Risk: Interest rate risk relates to the fluctuation in value of fixed income securities because of the inverse relationship of price and yield. Fixed income securities generally will decline in value upon an increase in general interest rates and their value generally will increase upon a decline in general interest rates. Fixed income securities with longer durations tend to be more sensitive to changes in interest rates, usually making them more volatile than securities with shorter durations.
Foreign Exchange Rate Risk: Foreign exchange rate risk relates to the change in the U.S. dollar value of a security held that is denominated in a foreign currency. The U.S. dollar value of a foreign-currency-denominated security will decrease as the dollar appreciates against the currency, while the U.S. dollar value will increase as the dollar depreciates against the currency.
Credit Risk: Credit risk relates to the ability of the issuer or guarantor of a fixed income security, or counterparty to a derivative contract to make timely principal and /or interest payments, or to otherwise honor its obligations. Securities are subject to varying degrees of credit risk, which are often reflected in credit ratings. Generally, lower-yield higher-quality bonds are subject to credit risk to a lesser extent than lower-grade higher-yield bonds.
The following notes provide more detailed information about each derivative type held by the Fund:
Futures Contracts — The Fund entered into interest rate futures contracts to manage the duration and yield curve exposure of the Fund versus the benchmark.
The use of futures contracts involves certain risks, which include, among others: (1) imperfect correlation between the price movement of the instruments and the underlying securities, (2) inability to close out positions due to differing trading hours, or the temporary absence of a liquid market, for either the instruments or the underlying securities, and (3) an inaccurate prediction of the future direction of interest rates by Columbia.
Upon entering into a futures contract, the Fund pledges cash or securities in an amount sufficient to meet the initial margin requirement. Subsequent payments are made or received by the Fund equal to the daily change in the contract value and are recorded as variation margin receivable or payable and offset in unrealized gains or losses. The Fund recognizes a realized gain or loss when the contract is closed or expires.
Futures contracts involve, to varying degrees, risk of loss in excess of the variation margin disclosed on the Statement of Assets and Liabilities.
During the year ended March 31, 2010, the Fund entered into 2,894 futures contracts.
41
Columbia Income Fund
March 31, 2010
Forward Foreign Currency Exchange Contracts — The Fund entered into forward foreign currency exchange contracts to shift its investment exposure from one currency to another.
The Fund entered into forward foreign currency exchange contracts for the purpose of shifting foreign currency exposure back to U.S. dollars.
Forward foreign currency exchange contracts are agreements to exchange one currency for another at a future date at a specified price. These contracts are used to minimize the exposure to foreign exchange rate fluctuations during the period between the trade and settlement dates of the contract. The Fund may utilize forward foreign currency exchange contracts in connection with the settlement of purchases and sales of securities. The Fund may also enter into these contracts to reduce the exposure to adverse price movements in certain other foreign currency denominated assets. Contracts to buy generally are used to acquire exposure to foreign currencies, while contracts to sell are generally used reduce the exposure to foreign exchange rate fluctuations. Forward foreign currency exchange contracts are valued daily at the current exchange rate of the underlying currency, resulting in unrealized gains (losses) which become realized at the time the forward foreign currency exchange contracts are closed or mature. Realized and unrealized gains (losses) arising from such transactions are included in net realized and unrealized gains (losses) on foreign currency transactions. The use of forward foreign currency exchange contracts does not eliminate fluctuations in the prices of the Fund’s portfolio securities. While the maximum potential loss from such contracts is the aggregate face value in U.S. dollars at the time the contract was opened, exposure is typically limited to the change in value of the contract (in U.S. dollars) over the period it remains open. The Fund could also be exposed to risk that counterparties of the contracts may be unable to fulfill the terms of the contracts.
During the year ended March 31, 2010, the Fund entered into 40 forward foreign currency exchange contracts.
Credit Default Swap Contracts — The Fund entered into credit default swap transactions as a protection buyer to reduce overall credit exposure.
Credit default swaps are agreements in which one party pays fixed periodic payments to a counterparty in consideration for a guarantee from the counterparty to make a specific payment should a negative credit event take place. The Fund may receive or make an upfront payment as the protection buyer or seller. Credit default swaps are marked to market daily based on quotations from market makers and any change is recorded as unrealized appreciation/depreciation on the Statement of Assets and Liabilities. Periodic payments received or made are recorded as a realized gain or loss and premiums received or made are amortized on the Statement of Operations.
If the Fund is a buyer of protection and a credit event occurs, as defined under the terms of that particular swap agreement, the Fund will either (i) receive from the seller of protection an amount equal to the notional amount of the swap and deliver the referenced obligation or underlying securities comprising the referenced index or (ii) receive a net settlement amount in the form of cash or securities equal to the notional amount of the swap less the recovery value of the referenced obligation or underlying securities comprising the referenced index.
If the Fund is a seller of protection and a credit event occurs, as defined under the terms of that particular swap agreement, the Fund will either (i) pay to the buyer of protection an amount equal to the notional amount of the swap and take delivery of the referenced obligation or underlying securities comprising the referenced index or (ii) pay a net settlement amount in the form of cash or securities equal to the notional amount of the swap less the recovery value of the referenced obligation or underlying securities comprising the referenced index.
Credit default swap agreements involve greater risks than if the Fund had invested in the reference obligation directly since, in addition to general market risks, credit default swaps are subject to illiquidity risk, counterparty risk and credit risk.
During the year ended March 31, 2010, the Fund purchased credit default swaps with a notional amount of $131,105,000.
42
Columbia Income Fund
March 31, 2010
The following table is a summary of the value of the Fund’s derivative instruments as of March 31, 2010.
| | | | | | | | |
| | | Fair Value of Derivative Instruments | | |
| | | Statement of Assets and Liabilities |
| | | Asset | | Fair Value | | Liability | | Fair Value |
| Futures variation margin | | — | | $— | | Futures
variation
margin | | $ 214,836* |
| Forward foreign currency exchange contracts | | Unrealized
appreciation | | 6,888 | | — | | — |
| | Open credit
default
swaps/
Premiums | | 1,722,202 | | Open credit
default
swaps/
Premiums | | 653,637 |
| * | Includes only the current day’s variation margin. |
The effect of derivative instruments on the Fund’s Statement of Operations for the year ended March 31, 2010:
| | | | | | | | | | |
| | | Amount of Realized Gain or (Loss) and
Change in Unrealized Appreciation
or (Depreciation) on Derivatives
Recognized in Income | |
| | | Risk
Exposure | | Net Realized Gain (Loss) | | | Change in Unrealized Appreciation (Depreciation) | |
| Futures Contracts | | Equity | | $ | 50,185 | | | $ | (865,654 | ) |
| Forward Foreign Currency Exchange Contracts | | Foreign
Exchange
Rate | | | 2,217 | | | | 9,617 | |
| Credit default Swap Contracts | | Credit | | | (4,337,416 | ) | | | 227,204 | |
Note 7. Portfolio Information
For the year ended March 31, 2010, the cost of purchases and proceeds from sales of securities, excluding short-term obligations, for the Fund were $668,110,299 and $685,587,669, respectively, of which $184,948,428 and $190,743,024, respectively, were U.S. Government securities.
Note 8. Regulatory Settlements
During the year ended March 31, 2010, the Fund received payments totaling $6,535 relating to certain regulatory settlements with third parties that the Fund had participated in during the year. The payments have been included in “Increase from regulatory settlements” on the Statement of Changes in Net Assets.
Note 9. Line of Credit
The Fund and other affiliated funds participate in a $280,000,000 committed, unsecured revolving line of credit provided by State Street. The maximum amount that may be borrowed by any fund is limited to the lesser of $200,000,000 and the Fund’s borrowing limit set forth in the Fund’s registration statement. Borrowings are available for short-term liquidity or temporary or emergency purposes.
Effective October 15, 2009, interest is charged to each participating fund based on the fund’s borrowings at a rate per annum equal to the greater of the Federal Funds Rate plus 1.25% or the overnight LIBOR Rate plus 1.25%. In addition, a commitment fee of 0.15% per annum is accrued and apportioned among the participating funds pro rata based on their relative net assets.
Prior to October 15, 2009, interest was charged to each participating fund based on the fund’s borrowings at a rate per annum equal to the greater of the Federal Funds Rate plus 0.50% or the overnight LIBOR Rate plus 0.50%. In addition, an annual operations agency fee of $20,000, an amendment fee of 0.02% and a commitment fee of 0.12% per annum were accrued and apportioned among the participating funds pro rata based on their relative net assets.
For the year ended March 31, 2010, the average daily loan balance outstanding on days where borrowing existed was $4,511,667 at a weighted average interest rate of 1.06%.
Note 10. Securities Lending
The Fund may lend its securities to certain approved brokers, dealers and other financial institutions. Each loan is collateralized by cash, in an amount at least equal to the market value of the securities loaned plus accrued income from the investment of collateral. The market value of the loaned securities is determined at the close of business of the Fund and any additional required collateral is delivered to the Fund on the next business day. The collateral received is invested and the income generated by the investment of the collateral, net of any fees remitted to State Street as the lending agent and borrower rebates, is paid to the Fund.
43
Columbia Income Fund
March 31, 2010
Generally, in the event of borrower default, the Fund has the right to use the collateral to offset any losses incurred. In the event the Fund is delayed or prevented from exercising its right to dispose of the collateral, there may be a potential loss to the Fund. The Fund bears the risk of loss with respect to the investment of collateral.
Note 11. Shares of Beneficial Interest
As of March 31, 2010, 41.8% of the Fund’s shares outstanding were beneficially owned by one participant account over which BOA and/or any of its affiliates had either sole or joint investment discretion.
As of March 31, 2010, the Fund had two shareholders that collectively held 20.3% of the shares outstanding, over which BOA and/or any of its affiliates did not have investment discretion.
As of March 31, 2010, no other shareholders owned more than 5% of the outstanding shares of the Fund.
Subscription and redemption activity of these accounts may have a significant effect on the operations of the Fund.
Note 12. Significant Risks and Contingencies
Sector Focus Risk
The Fund may focus its investments in certain sectors, subjecting it to greater risk than a fund that is less focused.
High-Yield Securities Risk
Investing in high-yield securities may involve greater credit risk and considerations not typically associated with investing in U.S. Government bonds and other higher quality fixed income securities. These securities are non-investment grade securities, often referred to as “junk” bonds. Economic downturns may disrupt the high yield market and impair the ability of issuers to repay principal and interest. Also, an increase in interest rates would likely have an adverse impact on the value of such obligations. Moreover, high-yield securities may be less liquid to the extent that there is no established secondary market.
Asset-Backed Securities Risk
The value of asset-backed securities may be affected by, among other factors, changes in interest rates, the market’s assessment of the quality of underlying assets, the creditworthiness of the servicer for the underlying assets, factors concerning the interests in and structure of the issuer or the originator of the underlying assets, or the creditworthiness or rating of the entities that provide any supporting letters of credit, surety bonds, derivative instruments, or other credit enhancement. The value of asset-backed securities also will be affected by the exhaustion, termination or expiration of any credit enhancement. Most asset-backed securities are subject to prepayment risk, which is the possibility that the underlying debt may be refinanced or prepaid prior to maturity during periods of declining or low interest rates, causing the Fund to have to reinvest the money received in securities that have lower yields. In addition, the impact of prepayments on the value of asset-backed securities may be difficult to predict and may result in greater volatility.
Information Regarding Pending and Settled Legal Proceedings
In June 2004, an action captioned John E. Gallus et al. v. American Express Financial Corp. and American Express Financial Advisors Inc. was filed in the United States District Court for the District of Arizona. The plaintiffs allege that they are investors in several American Express Company (now known as RiverSource) mutual funds and they purport to bring the action derivatively on behalf of those funds under the Investment Company Act of 1940. The plaintiffs allege that fees allegedly paid to the defendants by the funds for investment advisory and administrative services are excessive. The plaintiffs seek remedies including restitution and rescission of investment advisory and distribution agreements. The plaintiffs voluntarily agreed to transfer this case to the United States District Court for the District of Minnesota (the District Court). In response to defendants’ motion to dismiss the complaint, the District Court dismissed one of plaintiffs’ four claims and granted plaintiffs limited discovery. Defendants moved for summary judgment in April 2007. Summary judgment was granted in the defendants’ favor on July 9, 2007. The plaintiffs filed a notice of appeal with the Eighth Circuit Court of Appeals (the Eighth Circuit) on August 8, 2007. On April 8, 2009, the Eighth Circuit reversed summary judgment and remanded to the District Court for further proceedings. On August 6, 2009, defendants filed a writ of certiorari with the U.S. Supreme Court (the Supreme Court), asking the Supreme Court to stay the
44
Columbia Income Fund
March 31, 2010
District Court proceedings while the Supreme Court considers and rules in a case captioned Jones v. Harris Associates, which involves issues of law similar to those presented in the Gallus case. On March 30, 2010, the Supreme Court issued its ruling in Jones v. Harris Associates, and on April 5, 2010, the Supreme Court vacated the Eighth Circuit’s decision in the Gallus case and remanded the case to the Eighth Circuit for further consideration in light of the Supreme Court’s decision in Jones v. Harris Associates.
In December 2005, without admitting or denying the allegations, American Express Financial Corporation (AEFC, which is now known as Ameriprise Financial, Inc. (Ameriprise Financial)), entered into settlement agreements with the Securities and Exchange Commission (SEC) and Minnesota Department of Commerce (MDOC) related to market timing activities. As a result, AEFC was censured and ordered to cease and desist from committing or causing any violations of certain provisions of the Investment Advisers Act of 1940, the Investment Company Act of 1940, and various Minnesota laws. AEFC agreed to pay disgorgement of $10 million and civil money penalties of $7 million. AEFC also agreed to retain an independent distribution consultant to assist in developing a plan for distribution of all disgorgement and civil penalties ordered by the SEC in accordance with various undertakings detailed at http://www.sec.gov/litigation/admin/ia-2451.pdf. Ameriprise Financial and its affiliates have cooperated with the SEC and the MDOC in these legal proceedings, and have made regular reports to the RiverSource Funds’ Boards of Directors/Trustees.
On November 7, 2008, RiverSource Investments, LLC, a subsidiary of Ameriprise Financial, Inc., acquired J. & W. Seligman & Co. Incorporated (Seligman). In late 2003, Seligman conducted an extensive internal review concerning mutual fund trading practices. Seligman’s review, which covered the period 2001-2003, noted one arrangement that permitted frequent trading in certain open-end registered investment companies managed by Seligman (the Seligman Funds); this arrangement was in the process of being closed down by Seligman before September 2003. Seligman identified three other arrangements that permitted frequent trading, all of which had been terminated by September 2002. In January 2004, Seligman, on a voluntary basis, publicly disclosed these four arrangements to its clients and to shareholders of the Seligman Funds. Seligman also provided information concerning mutual fund trading practices to the SEC and the Office of the Attorney General of the State of New York (NYAG).
In September 2006, the NYAG commenced a civil action in New York State Supreme Court against Seligman, Seligman Advisors, Inc. (now known as RiverSource Fund Distributors, Inc.), Seligman Data Corp. and Brian T. Zino (collectively, the Seligman Parties), alleging, in substance, that the Seligman Parties permitted various persons to engage in frequent trading and, as a result, the prospectus disclosure used by the registered investment companies then managed by Seligman was and had been misleading. The NYAG included other related claims and also claimed that the fees charged by Seligman to the Seligman Funds were excessive. On March 13, 2009, without admitting or denying any violations of law or wrongdoing, the Seligman Parties entered into a stipulation of settlement with the NYAG and settled the claims made by the NYAG. Under the terms of the settlement, Seligman paid $11.3 million to four Seligman Funds. This settlement resolved all outstanding matters between the Seligman Parties and the NYAG. In addition to the foregoing matter, the New York staff of the SEC indicated in September 2005 that it was considering recommending to the Commissioners of the SEC the instituting of a formal action against Seligman and Seligman Advisors, Inc. relating to frequent trading in the Seligman Funds. Seligman responded to the staff in October 2005 that it believed that any action would be both inappropriate and unnecessary, especially in light of the fact that Seligman had previously resolved the underlying issue with the Independent Directors of the Seligman Funds and made recompense to the affected Seligman Funds. There have been no further developments with the SEC on this matter.
Ameriprise Financial and certain of its affiliates have historically been involved in a number of legal, arbitration and regulatory proceedings, including routine litigation, class actions, and governmental actions, concerning matters arising in connection with the conduct of their business activities. Ameriprise Financial believes that the Funds are not currently the subject of, and that neither Ameriprise Financial nor any of its affiliates are the subject of, any pending legal, arbitration or regulatory proceedings that are likely to have a material adverse effect on the Funds or the ability of Ameriprise Financial or its affiliates to perform under their contracts with the Funds. Ameriprise Financial is required to make 10-Q, 10-K and, as necessary, 8-K filings with the Securities and Exchange Commission on legal and
45
Columbia Income Fund
March 31, 2010
regulatory matters that relate to Ameriprise Financial and its affiliates. Copies of these filings may be obtained by accessing the SEC website at www.sec.gov.
There can be no assurance that these matters, or the adverse publicity associated with them, will not result in increased fund redemptions, reduced sale of fund shares or other adverse consequences to the Funds. Further, although we believe proceedings are not likely to have a material adverse effect on the Funds or the ability of Ameriprise Financial or its affiliates to perform under their contracts with the Funds, these proceedings are subject to uncertainties and, as such, we are unable to estimate the possible loss or range of loss that may result. An adverse outcome in one or more of these proceedings could result in adverse judgments, settlements, fines, penalties or other relief that could have a material adverse effect on the consolidated financial condition or results of operations of Ameriprise Financial.
Note 13. Subsequent Events
In connection with the preparation of the financial statements of the Fund as of and for the fiscal year ended March 31, 2010, events and transactions through the date the financial statements were issued have been evaluated by the Fund’s management for possible adjustment and/or disclosure. No subsequent events or transactions have occurred that would require adjustment of the financial statements as presented. On April 30, 2010, the Transaction disclosed in Note 4 closed. Effective May 1, 2010, the New Advisor became the investment advisor and administrator of the Fund and subsequently changed its name to Columbia Management Investment Advisers, LLC. On that date, the New Transfer Agent became the transfer agent of the Fund and changed its name to Columbia Management Investment Services Corp. Also on that date, the New Distributor became the distributor of the Fund and changed its name to Columbia Management Investment Distributors, Inc.
46
Report of Independent Registered Public Accounting Firm
To the Trustees of Columbia Funds Series Trust I and the Shareholders of Columbia Income Fund
In our opinion, the accompanying statement of assets and liabilities, including the investment portfolio, and the related statement of operations and of changes in net assets and the financial highlights present fairly, in all material respects, the financial position of Columbia Income Fund (the “Fund”) (a series of Columbia Funds Series Trust I) at March 31, 2010, and the results of its operations for the year then ended, the changes in its net assets for the two years in the period then ended and the financial highlights for the five years in the period then ended, in conformity with accounting principles generally accepted in the United States of America. These financial statements and financial highlights (hereafter referred to as “financial statements”) are the responsibility of the Fund’s management. Our responsibility is to express an opinion on these financial statements based on our audits. We conducted our audits of these financial statements in accordance with the standards of the Public Company Accounting Oversight Board (United States). Those standards require that we plan and perform the audit to obtain reasonable assurance about whether the financial statements are free of material misstatement. An audit includes examining, on a test basis, evidence supporting the amounts and disclosures in the financial statements, assessing the accounting principles used and significant estimates made by management, and evaluating the overall financial statement presentation. We believe that our audits, which included confirmation of securities at March 31, 2010 by correspondence with the custodian and brokers, provide a reasonable basis for our opinion.
PricewaterhouseCoopers LLP
Boston, Massachusetts
May 21, 2010
47
Fund Governance
The Trustees serve terms of indefinite duration. The names, addresses and ages of the Trustees and Officers of the Funds in Columbia Funds Series Trust I, the year each was first elected or appointed to office, their principal business occupations during at least the last five years, the number of Funds overseen by each Trustee and other directorships they hold are shown below. Each officer listed below serves as an officer of each Fund in the Columbia Funds Complex.
Independent Trustees
| | |
Name, Address and Year of
Birth, Position with Funds, Year
First Elected or Appointed to Office | | Principal Occupation(s) During Past Five Years, Number of Funds in the
Columbia Funds Complex Overseen by Trustee, Other Directorships Held |
| |
| John D. Collins (Born 1938) | | |
c/o Columbia Management Advisors, LLC One Financial Center Boston, MA 02111 Trustee (since 2005) | | Retired. Consultant, KPMG, LLP (accounting and tax firm) from July 1999 to June 2000; Partner, KPMG, LLP from March 1962 to June 1999. Oversees 65; Mrs. Fields Famous Brands LLC (consumer products); Suburban Propane Partners, L.P.; and Montpelier Re (insurance underwriting firm) |
| |
| Rodman L. Drake (Born 1943) | | |
c/o Columbia Management Advisors, LLC One Financial Center Boston, MA 02111 Trustee (since 1994) and Chairman of the Board (since 2009) | | Co-Founder of Baringo Capital LLC (private equity) since 2002; CEO of Crystal River Capital Inc. (real estate investment trust) since 2003; President, Continuation Investments Group, Inc. from 1997 to 2001. Oversees 65; Jackson Hewitt Tax Service Inc. (tax preparation services); Crystal Capital River Inc. (real estate investment trust); Student Loan Corporation (student loan provider); Celgene Corporation (global biotechnology company); and The Helios Funds (exchange-traded funds) |
| |
| Douglas A. Hacker (Born 1955) | | |
c/o Columbia Management Advisors, LLC One Financial Center Boston, MA 02111 Trustee (since 1996) | | Independent business executive since May 2006; Executive Vice President–Strategy of United Airlines (airline) from December 2002 to May 2006; President of UAL Loyalty Services (airline marketing company) from September 2001 to December 2002; Executive Vice President and Chief Financial Officer of United Airlines from July 1999 to September 2001. Oversees 65; Nash Finch Company (food distributor); Aircastle Limited (aircraft leasing) |
|
| Janet Langford Kelly (Born 1957) |
c/o Columbia Management Advisors, LLC One Financial Center Boston, MA 02111 Trustee (since 1996) | | Senior Vice President, General Counsel and Corporate Secretary, ConocoPhillips (integrated energy company) since September 2007; Deputy General Counsel–Corporate Legal Services, ConocoPhillips from August 2006 to August 2007; Partner, Zelle, Hofmann, Voelbel, Mason & Gette LLP (law firm) from March 2005 to July 2006; Adjunct Professor of Law, Northwestern University, from September 2004 to June 2006; Director, UAL Corporation (airline) from February 2006 to July 2006; Oversees 65; None |
| |
| Charles R. Nelson (Born 1942) | | |
c/o Columbia Management Advisors, LLC One Financial Center Boston, MA 02111 Trustee (since 1981) | | Professor of Economics, University of Washington, since January 1976; Ford and Louisa Van Voorhis Professor of Political Economy, University of Washington, since September 1993; Adjunct Professor of Statistics, University of Washington, since September 1980; Associate Editor, Journal of Money Credit and Banking, 1993-2008 Consultant on econometric and statistical matters. Oversees 65; None |
48
Fund Governance (continued)
Independent Trustees (continued)
| | |
Name, Address and Year of
Birth, Position with Funds, Year
First Elected or Appointed to Office | | Principal Occupation(s) During Past Five Years, Number of Funds in the
Columbia Funds Complex Overseen by Trustee, Other Directorships Held |
| |
| John J. Neuhauser (Born 1943) | | |
c/o Columbia Management Advisors, LLC One Financial Center Boston, MA 02111 Trustee (since 1984) | | President, Saint Michael’s College, since August 2007; University Professor, Boston College from November 2005 to August 2007; Academic Vice President and Dean of Faculties, Boston College from August 1999 to October 2005. Oversees 65; Liberty All-Star Equity Fund and Liberty All-Star Growth Fund, Inc. (closed-end funds) |
| |
| Jonathan Piel (Born 1938) | | |
c/o Columbia Management Advisors, LLC One Financial Center Boston, MA 02111 Trustee (since 1994) | | Cable television producer and website designer; The Editor, Scientific American from 1984 to 1994; Vice President, Scientific American, Inc., from 1984 to 1994; Member, Advisory Board, Stone Age Institute, Bloomington, Indiana (research institute that explores the effect of technology on human evolution); Member, Board of Directors of the National Institute of Social Sciences, New York City; Member, Board of Trustees of the William Alanson White Institute, New York City (institution for training psychoanalysts); and Member, Advisory Board, Mount Sinai Children’s Environmental Health Center, New York. Oversees 65; None |
| |
| Patrick J. Simpson (Born 1944) | | |
c/o Columbia Management Advisors, LLC One Financial Center Boston, MA 02111 Trustee (since 2000) | | Partner, Perkins Coie LLP (law firm). Oversees 65; None |
| |
| Anne-Lee Verville (Born 1945) | | |
c/o Columbia Management Advisors, LLC One Financial Center Boston, MA 02111 Trustee (since 1998) | | Retired since 1997 (formerly General Manager–Global Education Industry (from 1994 to 1997), President–Application Systems Division (from 1991 to 1994), Chief Financial Officer–US Marketing & Services (from 1988 to 1991), and Chief Information Officer (from 1987 to 1988), IBM Corporation (computer and technology)). Oversees 65; None |
49
Fund Governance (continued)
Interested Trustee
| | |
Name, Address and Year of Birth,
Position with Funds, Year First
Elected or Appointed to Office | | Principal Occupation(s) During Past Five Years, Number of Funds in the Columbia
Funds Complex Overseen by Trustee, Other Directorships Held |
| |
| William E. Mayer1 (Born 1940) | | |
c/o Columbia Management Advisors, LLC One Financial Center Boston, MA 02111 Trustee (since 1994) | | Partner, Park Avenue Equity Partners (private equity) since February 1999; Dean and Professor, College of Business, University of Maryland from 1992 to 1997. Oversees 65; Lee Enterprises (print media), WR Hambrecht + Co. (financial service provider); BlackRock Kelso Capital Corporation (investment company) |
| 1 | The Funds currently treat Mr. Mayer as an “interested person” (as defined in the Investment Company Act of 1940) by reason of his affiliation with WR Hambrecht + Co., a registered broker/dealer that may execute portfolio transactions for or engage in principal transactions with the Funds or other funds or accounts advised/managed by the Advisor or other Bank of America affiliates. |
The Statement of Additional Information includes additional information about the Trustees of the Funds and is available, without charge, upon request by calling 1-800-345-6611.
50
Fund Governance (continued)
Officers
| | |
| Name, Year of Birth and Address | | Principal Occupation(s) During the Past Five Years |
| |
| J. Kevin Connaughton (Born 1964) | | |
One Financial Center Boston, MA 02111 President (since 2009) | | Senior Vice President and General Manager–Mutual Fund Products, Columbia Management Investment Advisers, LLC since May 2010; President, Columbia Funds, since 2009, and RiverSource Funds, since May 2010 (previously Senior Vice President and Chief Financial Officer, Columbia Funds, from June 2008 to January 2009, Treasurer, Columbia Funds, from October 2003 to May 2008, and senior officer of various other affiliated funds since 2000); Managing Director, Columbia Management Advisors, LLC from December 2004 to April 2010. |
| |
| Michael G. Clarke (Born 1969) | | |
One Financial Center Boston, MA 02111 Senior Vice President and Chief Financial Officer (since 2009) | | Vice President, Columbia Management Investment Advisers, LLC since May 2010; Managing Director of Fund Administration, Columbia Management Advisors, LLC, from September 2004 to April 2010; senior officer of Columbia Funds and affiliated funds since 2002. |
| |
| Scott R. Plummer (Born 1959) | | |
5228 Ameriprise Financial Center Minneapolis, MN 55474 Senior Vice President, Secretary and Chief Legal Officer (since 2010) | | Chief Legal Officer and Assistant Secretary, Columbia Management Investment Advisers, LLC since June 2005; Vice President and Lead Chief Counsel–Asset Management, Ameriprise Financial, Inc. since May 2010 (previously Vice President and Chief Counsel–Asset Management, from 2005 to April 2010, and Vice President–Asset Management Compliance from 2004 to 2005); Vice President, Chief Counsel and Assistant Secretary , Columbia Management Investment Distributors, Inc. since 2008; Vice President, General Counsel and Secretary, Ameriprise Certificate Company since 2005; Chief Counsel, RiverSource Distributors, Inc. since 2006; Vice President, General Counsel and Secretary, RiverSource Funds, since December 2006; Senior Vice President, Secretary and Chief Legal Officer, Columbia Funds, since May 2010. |
| |
| Linda J. Wondrack (Born 1964) | | |
One Financial Center Boston, MA 02111 Senior Vice President and Chief Compliance Officer (since 2007) | | Vice President and Chief Compliance Officer, Columbia Management Investment Advisers, LLC since May 2010; Chief Compliance Officer, Columbia Funds, since 2007, and RiverSource Funds, since May 2010; Director (Columbia Management Group, LLC and Investment Product Group Compliance), Bank of America, from June 2005 to April 2010; Director of Corporate Compliance and Conflicts Officer of MFS Investment Management (investment management) from August 2004 to May 2005. |
| |
| William F. Truscott (Born 1960) | | |
53600 Ameriprise Financial Center Minneapolis, MN 55474 Senior Vice President (since 2010) | | Chairman of the Board, Columbia Management Investment Advisers, LLC since May 2010 (previously President, Chairman of the Board and Chief Investment Officer, from 2001 to April 2010); Chief Executive Officer, U.S. Asset Management & President, Annuities, Ameriprise Financial, Inc. since May 2010 (previously President–U.S. Asset Management and Chief Investment Officer from 2005 to April 2010, and Senior Vice President–Chief Investment Officer, from 2001 to 2005); Director, President and Chief Executive Officer, Ameriprise Certificate Company since 2006; Director, Columbia Management Investment Distributors, Inc. since May 2010 (previously Chairman of the Board and Chief Executive Officer from 2008 to April 2010); Chairman of the Board and Chief Executive Officer, RiverSource Distributors, Inc. since 2006. |
51
Fund Governance (continued)
Officers (continued)
| | |
| Name, Year of Birth and Address | | Principal Occupation(s) During the Past Five Years |
| |
| Colin Moore (Born 1958) | | |
One Financial Center Boston, MA 02111 Senior Vice President (since 2010) | | Director and Chief Investment Officer, Columbia Management Investment Advisers, LLC since May 2010; Manager, Managing Director and Chief Investment Officer of Columbia Management Advisors, LLC from 2007 to April 2010; Head of Equities, Columbia Management Advisors, LLC from 2002 to 2007. |
| |
| Michael A. Jones (Born 1959) | | |
100 Federal Street Boston, MA 02110 Senior Vice President (since 2010) | | Director and President, Columbia Management Investment Advisers, LLC since May 2010; President and Director, Columbia Management Investment Distributors, Inc. since May 2010; Manager, Chairman, Chief Executive Officer and President, Columbia Management Advisors, LLC from 2007 to April 2010; Chief Executive Officer, President and Director, Columbia Management Distributors, Inc. from November 2006 to April 2010; previously, co-president and senior managing director at Robeco Investment Management. |
| |
| Amy Johnson (Born 1965) | | |
5228 Ameriprise Financial Center Minneapolis, MN 55474 Senior Vice President (since 2010) | | Senior Vice President and Chief Operating Officer, Columbia Management Investment Advisers, LLC since May 2010 (previously Chief Administrative Officer, from 2009 until April 2010, Vice President–Asset Management and Trust Company Services, from 2006 to 2009, and Vice President–Operations and Compliance from 2004 to 2006). |
| |
| Joseph F. DiMaria (Born 1968) | | |
One Financial Center Boston, MA 02111 Treasurer (since 2009) and Chief Accounting Officer (since 2008) | | Vice President, Mutual Fund Administration, Columbia Management Investment Advisers, LLC, since May 2010; Director of Fund Administration, Columbia Management Advisors, LLC from January 2006 to April 2010; Head of Tax/Compliance and Assistant Treasurer, Columbia Management Advisors, LLC, from November 2004 to December 2005. |
| |
| Marybeth Pilat (Born 1968) | | |
One Financial Center Boston, MA 02111 Deputy Treasurer (since 2010) | | Vice President, Mutual Fund Administration, Columbia Management Investment Advisers, LLC, since May 2010; Vice President, Investment Operations, Bank of America, from October 2008 to April 2010; Finance Manager, Boston Children’s Hospital from August 2008 to October 2008; Director, Mutual Fund Administration, Columbia Management Advisors, LLC, from May 2007 to July 2008; Vice President, Mutual Fund Valuation, Columbia Management Advisors, LLC, from January 2006 to May 2007; Vice President, Mutual Fund Accounting Oversight, Columbia Management Advisors, LLC from January 2005 to January 2006. |
| |
| Julian Quero (Born 1967) | | |
One Financial Center Boston, MA 02111 Deputy Treasurer (since 2008) | | Vice President, Mutual Fund Administration, Columbia Management Investment Advisers, LLC since May 2010; Director of Fund Administration, Columbia Management Advisors, LLC, from August 2008 to April 2010; Senior Tax Manager, Columbia Management Advisors, LLC from August 2006 to July 2008; Senior Compliance Manager, Columbia Management Advisors, LLC from April 2002 to August 2006. |
| |
| Stephen T. Welsh (Born 1957) | | |
One Financial Center Boston, MA 02111 Vice President (since 2006) | | President and Director, Columbia Management Investment Services Corp. since May 2010; President and Director, Columbia Management Services, Inc. from July 2004 to April 2010; Managing Director, Columbia Management Distributors, Inc. from August 2007 to April 2010. |
52
-
Board Consideration and Approval of Advisory Agreements
The Advisory Fees and Expenses Committee of the Board of Trustees meets several times annually to review the current advisory agreements (collectively, the “Agreements”) of the funds for which the Trustees serve as trustees (each a “fund”) and to determine whether to recommend that the full Board approve the continuation of the Agreements for an additional one-year period. After the Committee has made its recommendation, the full Board, including the Independent Trustees, determines whether to approve the continuation of the Agreements. In addition, the full Board, including the Independent Trustees, considers matters bearing on the Agreements at most of its other meetings throughout the year and meets regularly with senior management of the funds and Columbia, the funds’ investment adviser, including the senior manager of each investment area within Columbia. Through the Board’s Investment Oversight Committees, Trustees also meet with selected fund portfolio managers, research analysts and traders at various times throughout the year.
The Trustees receive and review all materials that they, their legal counsel or Columbia believe to be reasonably necessary for the Trustees to evaluate the Agreements and to determine whether to approve the continuation of the Agreements. Those materials generally include, among other items, (i) information on the investment performance of each fund relative to the performance of peer groups of mutual funds and the fund’s performance benchmarks, and additional information assessing performance on a risk-adjusted basis, (ii) information on each fund’s advisory fees and other expenses, including information comparing the fund’s expenses to those of peer groups of mutual funds and information about any applicable expense caps and fee “breakpoints,” (iii) information about the profitability of the Agreements to Columbia, including potential “fall-out” or ancillary benefits that Columbia and its affiliates may receive as a result of their relationships with the funds and (iv) information obtained through Columbia’s response to a questionnaire prepared at the request of the Trustees by counsel to the funds and independent legal counsel to the Independent Trustees. The Trustees also consider other information such as (v) Columbia’s financial results and financial condition, (vi) each fund’s investment objective and strategies and the size, education and experience of Columbia’s investment staffs and their use of technology, external research and trading cost measurement tools, (vii) the allocation of the funds’ brokerage and the use of “soft” commission dollars to pay for research products and services, (viii) Columbia’s resources devoted to, and its record of compliance with, the funds’ investment policies and restrictions, policies on personal securities transactions and other compliance policies and legal and regulatory requirements, (ix) Columbia’s response to various legal and regulatory proceedings since 2003 and to the recent period of volatility in the securities markets and (x) the economic outlook generally and for the mutual fund industry in particular. In addition, the Advisory Fees and Expenses Committee confers with the independent fee consultant (the “Fee Consultant”) appointed by the Independent Trustees pursuant to an assurance of discontinuance entered into by Columbia with the New York Attorney General (“NYAG”) to settle a civil complaint filed by the NYAG relating to trading in mutual fund shares (the “NYAG Settlement”) and reviews materials relating to the funds’ relationships with Columbia provided by the Fee Consultant. Under the NYAG Settlement, the Fee Consultant’s role is to manage the process by which management fees are negotiated so that they are negotiated in a manner that is at arms’ length and reasonable. Throughout the process, the Trustees have the opportunity to ask questions of and to request additional materials from Columbia and to consult with the Fee Consultant and independent legal counsel to the Independent Trustees.
The Board of Trustees most recently approved the continuation of the Agreements at its October, 2009 meeting, following meetings of the Advisory Fees and Expenses Committee held in December, 2008 and February, May, June, August, September and October, 2009.
The Board of Trustees also unanimously approved new advisory agreements (the “New Agreements”) for the funds with RiverSource Investments, LLC (to be renamed Columbia Management Investment Advisers, LLC) (“RiverSource”) at a meeting held on December 17, 2009. The New Agreements have since been approved by shareholders of the funds and are expected to take effect upon the closing of the acquisition of the long-term asset management business of Columbia by Ameriprise Financial, Inc. (“Ameriprise”), the parent company of RiverSource Investments, LLC (the “Transaction”).
The Advisory Fees and Expenses Committee met on multiple occasions to review the New Agreements for the funds. On December 14, 2009, the Advisory Fees and Expenses
53
Committee recommended that the full Board approve the New Agreements. On December 17, 2009, the full Board, including a majority of the Independent Trustees, approved the New Agreements. Prior to their approval of the New Agreements, the Advisory Fees and Expenses Committee and the Independent Trustees requested and evaluated materials from, and were provided materials and information about the Transaction and matters related to the proposals by, Bank of America Corp., Columbia, RiverSource and Ameriprise. In connection with their most recent approval of the Agreements (as discussed above) on October 28, 2009, the Advisory Fees and Expenses Committee and the Trustees requested and evaluated materials from Columbia, and discussed such materials with representatives of Columbia. The Advisory Fees and Expenses Committee, at meetings held on August 11, 2009, September 23, 2009, October 27, 2009, November 30, 2009, December 7, 2009 and December 14, 2009, and the Independent Trustees, at meetings held on August 12, 2009, August 20, 2009, October 28, 2009, December 8, 2009, December 14, 2009 and December 17, 2009, discussed the materials provided in connection with the October 28, 2009 approvals and the materials provided in connection with their consideration of the New Agreements and other matters relating to the Transaction with representatives of Bank of America Corp., Columbia, RiverSource and Ameriprise. The Trustees consulted with experienced legal counsel, who advised on the legal standards for consideration by the Trustees. The Independent Trustees also discussed the proposed approvals with independent legal counsel in private sessions.
The Trustees reviewed each New Agreement, as well as certain information obtained through RiverSource’s responses to initial and supplemental questionnaires prepared at the request of the Trustees by counsel to the funds and independent legal counsel to the Independent Trustees. The Advisory Fees and Expenses Committee and the Trustees also met with, and reviewed and considered a report prepared and provided by, the Fee Consultant (as discussed above).
In considering whether to approve the New Agreements and to approve the continuation of the Agreements, the Trustees, including the Independent Trustees, did not identify any single factor as determinative, and each weighed various factors as he or she deemed appropriate. In particular, the Trustees considered the following matters:
Matters Relating to the Agreements and the New Agreements
The nature, extent and quality of the services provided or to be provided to the funds under the Agreements and the New Agreements. The Trustees considered the nature, extent and quality of the services provided and the resources dedicated by Columbia and its affiliates (or to be provided and dedicated by RiverSource and its affiliates) to the funds.
Among other things, the Trustees considered, with respect to Columbia and its affiliates, (i) Columbia’s ability (including its personnel and other resources, compensation programs for personnel involved in fund management, reputation and other attributes) to attract, motivate and retain highly qualified research, advisory and supervisory investment professionals; (ii) the portfolio management services provided by those investment professionals; and (iii) the trade execution services provided on behalf of the funds. For each fund, the Trustees also considered the benefits to shareholders of investing in a mutual fund that is part of a family of funds offering exposure to a variety of asset classes and investment disciplines and providing a variety of fund and shareholder services.
Among other things, the Trustees considered, with respect to RiverSource and its affiliates, (i) the expected effect of the Transaction on the operations of the funds, (ii) the information provided by RiverSource with respect to the nature, extent and quality of services to be provided by it, (iii) RiverSource’s compliance program and compliance record, (iv) the ability of RiverSource (including personnel and other resources, compensation programs for personnel involved in fund management, reputation and other attributes) to attract, motivate and retain highly qualified research, advisory and supervisory investment professionals, (v) the trade execution services to be provided on behalf of the funds and (vi) the quality of RiverSource’s investment research capabilities and the other resources that it indicated it would devote to each fund. As noted above, the Trustees also considered RiverSource’s representations that the Chief Investment Officer of Columbia would serve as the Chief Investment Officer of RiverSource following the Transaction, and that the process for determining the portfolio management team for each Fund would be substantially the same process as has customarily been followed by Columbia, and reported to the Trustees, in evaluating the performance of Columbia’s portfolio management teams. The Trustees
54
also noted the professional experience and qualifications of the senior personnel of RiverSource. The Trustees also considered the compliance programs of and the compliance-related resources proposed to be provided to the funds by RiverSource and its affiliates, including discussions with the funds’ Chief Compliance Officer regarding RiverSource’s compliance program. The Trustees also discussed RiverSource’s compliance program with the Chief Compliance Officer for the RiverSource funds. The Trustees also considered RiverSource’s representation that the funds’ Chief Compliance Officer would serve as the Chief Compliance Officer of RiverSource following the Transaction. The Trustees considered RiverSource’s ability to provide administrative services to the funds, noting that while some Agreements contemplated the provision of certain administrative services, following the Transaction, all administrative services were anticipated to be provided pursuant to a new administrative services agreement. The Trustees also considered RiverSource’s ability to coordinate the activities of each fund’s other service providers. The Trustees considered performance information provided by RiverSource with respect to other mutual funds advised by RiverSource, and discussed with senior executives of RiverSource its process for identifying which portfolio management teams of the legacy Columbia and RiverSource organizations would be responsible for the management of the funds following the Transaction.
After reviewing those and related factors, the Trustees concluded, within the context of their overall conclusions, that the nature, extent and quality of services provided by Columbia supported the continuation of the Agreements, and that the nature, extent and quality of services expected to be provided by RiverSource supported approval of the New Agreements.
The costs of the services provided and profits realized by Columbia and its affiliates, and the expected costs of the services to be provided and the profits expected to be realized by RiverSource and its affiliates, from their relationships with the funds. With respect to Columbia and its affiliates, the Trustees considered the fees charged to the funds for advisory services as well as the total expense levels of the funds. That information included comparisons (provided by management and by an independent third-party data provider) of each fund’s advisory fees and total expense levels to those of the fund’s peer groups and information about the advisory fees charged by Columbia to comparable institutional accounts. In considering the fees charged to those accounts, the Trustees took into account, among other things, management’s representations about the differences between managing mutual funds as compared to other types of accounts, including differences in the services provided, differences in the risk profile of such business for Columbia, and the additional resources required to manage mutual funds effectively. In evaluating each fund’s advisory fees, the Trustees also took into account the demands, complexity and quality of the investment management of the fund. The Trustees considered existing advisory fee breakpoints, and Columbia’s use of advisory fee waivers and expense caps, which benefited a number of the funds. The Trustees also noted management’s stated justification for the fees charged to the funds, which included information about the investment performance of the funds and the services provided to the funds.
The Trustees considered that Columbia Income Fund’s total expenses were in third quintile and actual management fees were in the fifth quintile (where the lowest fees and expenses would be in the first quintile) of the peer group selected by an independent third-party data provider for purposes of expense comparisons.
The Trustees also considered the compensation directly or indirectly received by Columbia and its affiliates from their relationships with the funds. The Trustees reviewed information provided by management as to the profitability to Columbia and its affiliates of their relationships with each fund, and information about the allocation of expenses used to calculate profitability. When reviewing profitability, the Trustees also considered court cases in which adviser profitability was an issue in whole or in part, the performance of the relevant funds, the expense level of each fund, and whether Columbia had implemented breakpoints and/or expense caps with respect to the fund.
In connection with the integration of the legacy Columbia and RiverSource organizations, the Trustees considered, among other things, RiverSource’s projected annual net expense synergies (reductions in the cost of providing services to the funds), the timetable over which such synergies are expected to be realized and the extent to which any such synergies are expected to be shared with the funds. The Trustees also considered information provided by RiverSource regarding
55
their respective financial conditions. The Trustees considered that RiverSource proposed to continue voluntary expense caps currently in effect for the funds and that RiverSource had undertaken not to change these caps without further discussion with the Independent Trustees.
After reviewing those and related factors, the Trustees concluded, within the context of their overall conclusions, that the advisory fees charged to each fund, and the related profitability to Columbia and its affiliates of their relationships with the fund, supported the continuation of the Agreement pertaining to that fund, and that the expected profitability to RiverSource and its affiliates from its relationship with each fund supported the approval of the New Agreements.
Economies of Scale. With respect to Columbia and its affiliates, the Trustees considered the existence of any economies of scale in the provision by Columbia of services to each fund, to groups of related funds, and to Columbia’s investment advisory clients as a whole and whether those economies were shared with the funds through breakpoints in the investment advisory fees or other means, such as fee waivers/expense reductions and additional investments by Columbia in investment, trading and compliance resources. The Trustees noted that many of the funds benefited from breakpoints, fee waivers/expense caps, or both. In considering those issues, the Trustees also took note of the costs of the services provided (both on an absolute and a relative basis) and the profitability to Columbia and its affiliates of their relationships with the funds, as discussed above.
With respect to RiverSource and its affiliates, the Trustees considered the existence of any anticipated economies of scale in the provision by RiverSource of services to each fund, to groups of related funds and to RiverSource’s investment advisory clients as a whole, and whether those economies of scale were expected to be shared with the funds. The Trustees considered Ameriprise’s anticipated net expense synergies resulting from the Transaction, and considered the possibility that the funds might benefit from economies of scale over time as part of the larger, combined fund complex. The Trustees considered how expected synergies and potential economies of scale might benefit the funds and their shareholders. The Trustees considered the potential effect of the Transaction on the distribution of the funds, and noted that the proposed management fee schedules for the funds generally contained breakpoints that would reduce the fee rate on assets above specified threshold levels.
After reviewing those and related factors, the Trustees concluded, within the context of their overall conclusions, that the extent to which economies of scale were shared or expected to be shared with the funds supported the continuation of the Agreements and the approval of the New Agreements.
Matters Relating to the Agreements
Investment performance of the funds and Columbia. The Trustees reviewed information about the performance of each fund over various time periods, including information prepared by an independent third-party data provider that compared the performance of each fund to the performance of peer groups of mutual funds and performance benchmarks. The Trustees also reviewed a description of the third party’s methodology for identifying each fund’s peer group for purposes of performance and expense comparisons. The Trustees also considered additional information that the Advisory Fees and Expenses Committee requested from Columbia relating to funds that presented relatively weaker performance and/or relatively higher fees or expenses. In the case of each fund whose performance lagged that of a relevant peer group for certain (although not necessarily all) periods, the Trustees concluded that other factors relevant to performance were sufficient, in light of other considerations, to warrant continuation of the fund’s Agreements. Those factors varied from fund to fund, but included one or more of the following: (i) that the fund’s performance, although lagging in certain recent periods, was stronger over the longer term; (ii) that the underperformance was attributable, to a significant extent, to investment decisions that were reasonable and consistent with the fund’s investment strategy and policies and that the fund was performing within a reasonable range of expectations, given those investment decisions, market conditions and the fund’s investment strategy; (iii) that the fund’s performance was competitive when compared to other relevant performance benchmarks or peer groups; (iv) that Columbia had taken or was taking steps designed to help improve the fund’s investment performance, including, but not limited to, replacing portfolio managers or modifying investment strategies; and (v) that Columbia proposed to waive advisory fees or cap the expenses of the fund.
56
The Trustees noted that, through April 30, 2009, Columbia Income Fund’s performance was in the third quintile (where the best performance would be in the first quintile) for the one-year period and in the fourth quintile for the three-, five- and ten-year periods, of the peer group selected by an independent third-party data provider for purposes of performance comparisons.
The Trustees also considered Columbia’s performance and reputation generally, the funds’ performance as a fund family generally, and Columbia’s historical responsiveness to Trustee concerns about performance and Columbia’s willingness to take steps intended to improve performance. After reviewing those and related factors, the Trustees concluded, within the context of their overall conclusions regarding each of the Agreements, that the performance of each fund and Columbia was sufficient, in light of other considerations, to warrant the continuation of the Agreement pertaining to that fund.
Other Factors. The Trustees also considered other factors with respect to Columbia and its affiliates, which included but were not limited to the following:
| n | | the extent to which each fund had operated in accordance with its investment objective and investment restrictions, the nature and scope of the compliance programs of the funds and Columbia and the compliance-related resources that Columbia and its affiliates were providing to the funds; |
| n | | the nature, quality, cost and extent of administrative and shareholder services overseen and performed by Columbia and its affiliates, both under the Agreements and under separate agreements for the provision of transfer agency and administrative services; |
| n | | so-called “fall-out benefits” to Columbia and its affiliates, such as the engagement of its affiliates to provide distribution, brokerage and transfer agency services to the funds, and the benefits of research made available to Columbia by reason of brokerage commissions generated by the funds’ securities transactions, as well as possible conflicts of interest associated with those fall-out and other benefits, and the reporting, disclosure and other processes in place to disclose and monitor those possible conflicts of interest; and |
| n | | the report provided by the Fee Consultant, which included information about and analysis of the funds’ fees, expenses and performance. |
Matters Relating to the New Agreements
The Trustees considered all materials that they, their legal counsel or RiverSource believed reasonably necessary to evaluate and to determine whether to approve the New Agreements. In their deliberations, the Trustees did not identify any particular information that was all-important or controlling, and individual Trustees may have attributed different weights to the various factors. The material factors that formed the basis for the Trustees’ approvals included the factors set forth below:
| (i) | the reputation, financial strength, regulatory histories and resources of RiverSource and its parent, Ameriprise; |
| (ii) | the capabilities of RiverSource with respect to compliance, including an assessment of RiverSource’s compliance system by the funds’ Chief Compliance Officer; |
| (iii) | the qualifications of the personnel of RiverSource that would be expected to provide advisory services to each fund, including RiverSource’s representations that the Chief Investment Officer of Columbia would serve as the Chief Investment Officer of RiverSource, and that the process for determining the portfolio management team for each fund would be substantially the same process as has customarily been followed by Columbia, and reported to the Trustees, in evaluating the performance of Columbia’s portfolio management teams; |
| (iv) | the terms and conditions of the New Agreements, including the differences between the New Agreements and the Agreements; |
| (v) | the terms and conditions of other agreements and arrangements relating to the future operations of the funds, including an administrative services agreement and a Master Services and Distribution Agreement; |
| (vi) | the commitment of RiverSource and Ameriprise that there would not be any diminution in the nature, quality and extent of services provided to each fund or its shareholders following closing of the Transaction; |
| (vii) | that the Trustees recently had completed a full annual review of the Agreements, as required by the 1940 Act, for each fund and had determined that they were |
57
| | satisfied with the nature, extent and quality of services provided thereunder and that the management fee rate for each fund were sufficient to warrant their approval; |
| (viii) | that the advisory fee rates payable by each fund would not change; |
| (ix) | that RiverSource and Bank of America, and not any fund, would bear the costs of obtaining approvals of the New Agreement; |
| (x) | that Ameriprise and RiverSource had agreed to exercise reasonable best efforts to assure that, for a period of two years after the closing of the Transaction, there would not be imposed on any fund any “unfair burden” (within the meaning of Section 15(f) of 1940 Act) with respect to the Transaction; and |
| (xi) | that certain members of RiverSource’s management have a significant amount of experience integrating other fund families; that certain current Columbia personnel that would be integrated into RiverSource and its affiliates as a result of the Transaction also have experience in integrating fund families; and that the senior management of RiverSource following the Transaction would include certain senior executives of Columbia who are currently responsible for oversight of services provided to the funds. |
Investment Advisory Fee Rates and Other Expenses. The Trustees considered the fact that the advisory fee rates payable by each fund to RiverSource under the New Agreements are the same as those currently paid by each fund to Columbia under the Agreements. The Trustees noted that in connection with their October 28, 2009 approval of the continuance of the Agreements, they had concluded, within the context of their overall conclusions regarding each such agreement, that the advisory fees charged to each fund supported the continuation of the agreement pertaining to that fund.
The Trustees noted that in certain cases the effective advisory fee rate for a RiverSource fund was lower than the proposed investment advisory fee rate for a fund with generally similar investment objectives and strategies. The Trustees also noted that RiverSource’s investment advisory fee rates for equity and balanced funds generally are subject to adjustments based on investment performance, whereas the proposed investment advisory fee rates for the funds, consistent with those in the Agreements, do not reflect performance adjustments. The Trustees considered existing advisory fee breakpoints and RiverSource’s undertaking not to change expense caps previously implemented by Columbia with respect to the funds without further discussion with the Independent Trustees.
The Trustees received and considered information about the advisory fees charged by RiverSource to institutional accounts. In considering the fees charged to those accounts, the Trustees took into account, among other things, RiverSource’s representations about the differences between managing mutual funds as compared to other types of accounts, including differences in the services provided, differences in the risk profile of such business for RiverSource and the additional resources required to manage mutual funds effectively. In evaluating each fund’s expected advisory fees, the Trustees also took into account the demands, complexity and quality of the investment management of the fund.
The Trustees also considered that for certain funds, certain administrative services that are provided under the Agreements would not be provided under the New Agreements, but under a separate administrative services agreement. The Trustees noted that, unlike fees under an advisory agreement, fees under the administrative services agreement could be changed without shareholder approval, although RiverSource had not proposed any increase in such administrative fees and any such increase would require Board approval. The Trustees also noted Ameriprise’s and RiverSource’s covenants regarding compliance with Section 15(f) of the 1940 Act.
After reviewing these and related factors, the Trustees concluded, within the context of their overall conclusions, that the expected advisory fee rates and expenses of each fund supported the approval of the New Agreements.
Other Benefits to RiverSource. The Trustees received and considered information regarding any expected “fall-out” or ancillary benefits to be received by RiverSource and its affiliates as a result of their relationships with the funds, such as the engagement of RiverSource to provide administrative services to the funds and the engagement of RiverSource’s affiliates to provide distribution and transfer agency services to the funds. The Trustees considered that the funds’ distributor, which would be an affiliate of RiverSource,
58
retains a portion of the distribution fees from the funds and receives a portion of the sales charges on sales or redemptions of certain classes of shares of the funds. The Trustees also considered the benefits of research made available to RiverSource by reason of brokerage commissions generated by the funds’ securities transactions, and reviewed information about RiverSource’s practices with respect to allocating portfolio brokerage for brokerage and research services. The Trustees considered the possible conflicts of interest associated with certain fall-out or other ancillary benefits and the reporting, disclosure and other processes that would be in place to disclose and to monitor such possible conflicts of interest. The Trustees recognized that RiverSource’s profitability would be somewhat lower without these benefits.
Conclusions
Based on their evaluation of all factors that they deemed to be material, including those factors described above, and assisted by the advice of independent counsel and the Fee Consultant, the Trustees, including the Independent Trustees, (i) approved the continuance of each of the Agreements through October 31, 2010 and (ii) approved each New Agreement.
59
Summary of Management Fee Evaluation by Independent Fee Consultant (Columbia Management Advisors, LLC)
EXCERPTS FROM REPORT OF INDEPENDENT FEE CONSULTANT TO THE FUNDS SUPERVISED BY THE COLUMBIA ATLANTIC BOARD
Prepared Pursuant to the February 9, 2005 Assurance of Discontinuance among the Office of Attorney General of New York State, Columbia Management Advisors, LLC, and Columbia Management Distributors, Inc. November 6, 2009
I. Overview
On February 9, 2005, Columbia Management Advisors, LLC (“CMA”) and Columbia Management Distributors, Inc.1 (“CMDI”) agreed to the New York Attorney General’s Assurance of Discontinuance (“AOD”). Among other things, the AOD stipulates that CMA may manage or advise a Columbia Fund (“Columbia Fund” and, together with some or all of such funds, the “Columbia Funds”) only if the Independent Members of the Columbia Fund’s Board of Trustees appoint a Senior Officer or retain an Independent Fee Consultant (“IFC”) who is to manage the process by which proposed management fees are negotiated. The AOD further stipulates that the Senior Officer or IFC is to prepare a written annual evaluation of the fee negotiation process.
With effect from January 1, 2007, the Independent Members of the Board of Trustees for certain Columbia Funds known collectively as the “Atlantic Funds” (together with the other members of that Board, the “Trustees”) retained me as IFC for the Atlantic Funds.2 In this capacity, I have prepared the fifth annual written evaluation of the fee negotiation process. As was the case with the 2007 and 2008 reports, my immediate predecessor as IFC, John Rea, provided invaluable assistance in the preparation of this year’s report.
A. Role of the Independent Fee Consultant
The AOD charges the IFC with “managing the process by which proposed management fees … to be charged the Columbia Fund are negotiated so that they are negotiated in a manner which is at arms’ length and reasonable and consistent with this Assurance of Discontinuance.” The AOD also provides that CMA “may manage or advise a Columbia Fund only if the reasonableness of the proposed management fees is determined by the Board of Trustees … using … an annual independent written evaluation prepared by or under the direction of … the Independent Fee Consultant.” Therefore, the AOD makes clear that the IFC does not supplant the Trustees in negotiating management fees with CMA, nor does the IFC substitute his or her judgment for that of the Trustees with respect to the reasonableness of proposed fees or any other matter that is committed to the business judgment of the Trustees.
B. Elements Involved in Managing the Fee Negotiation Process
In preparing the report required by the AOD, the IFC must consider at least the following six factors set forth in the AOD:
| 1. | The nature and quality of CMA’s services, including the Fund’s performance; |
| 2. | Management fees (including any components thereof) charged by other mutual fund companies for like services; |
| 3. | Possible economies of scale as the Fund grows larger; |
| 4. | Management fees (including any components thereof) charged to institutional and other clients of CMA for like services; |
| 5. | Costs to CMA and its affiliates of supplying services pursuant to the management fee agreements, excluding any intra-corporate profit; and |
| 6. | Profit margins of CMA and its affiliates from supplying such services. |
C. Organization of the Annual Evaluation
This report, like last year’s, focuses on the six factors and contains a section for each factor except that CMA’s costs and profits from managing the Funds are treated in a single section. In addition to a discussion of these factors, the report offers recommendations to improve the fee review process in future years. A review of the status of recommendations made in the 2008 Report is being provided separately with the materials for the October meeting.
| 1 | CMA and CMDI are subsidiaries of Columbia Management Group, LLC (“CMG”), and are the successors to the entities named in the AOD. |
| 2 | I have no material relationship with Bank of America, CMG or any of its affiliates, aside from serving as IFC, and I am aware of no material relationship with any of their affiliates. I retained John Rea, an independent economic consultant, to assist me with this report. |
| | Unless otherwise stated or required by the context, this report covers only the Atlantic Funds, which are also referred as the “Funds.” |
60
II. Summary of Findings
A. General
| 1. | Based upon my examination of the information supplied by CMG in the light of the six factors set forth in the AOD, I conclude that the Trustees have the relevant information necessary to evaluate the reasonableness of the proposed management fees for each Atlantic Fund. |
| 2. | In my view, the process by which the proposed management fees of the Funds have been negotiated in 2009 thus far has been, to the extent practicable, at arms’ length and reasonable and consistent with the AOD. |
B. Nature and Quality of Services, Including Performance
| 3. | The performance of the Funds has been relatively strong in recent years, although the one-year record was weaker than longer-term records. Based upon 1-, 3-, 5-, and 10-year returns through April 30, 2009, at least half of all the Funds were in the first and second performance quintiles in each of the three longest performance periods; for the one-year period, 40% of the Funds were in the top two quintiles. No more than 13% of the Funds were in the fifth quintile in any one performance period. Domestic equity, quantitative equity, and taxable fixed-income Funds were the strongest performers in 2009, while most foreign equity Funds lagged behind their competitors. |
| 4. | Performance rankings were similar in 2008 and 2009: the 1- and 3-year rankings declined slightly over the previous year, while the 5-year rankings improved modestly. Year over year, for the 1- and 3-year periods, the performance of equity Funds, both domestic and international, declined, while that of fixed-income Funds improved. Between three-fifths to two-thirds of the Funds changed quintile rankings in 2009 in the 1-, 3-, and 5-year performance periods. |
| 5. | The performance of the domestic equity Funds against their benchmarks was good for the 3- and 5-year performance periods. In contrast, gross returns of international equity and fixed-income Funds typically fell short of their benchmarks. The performance of equity Funds against their benchmarks was highly correlated to performance versus their peers; no such correlation was observed for fixed-income Funds. |
| 6. | The Atlantic equity Funds’ overall performance adjusted for risk was solid. Based upon 3-year returns, nearly 57% of the equity Funds had a combination of risk-adjusted and unadjusted returns that placed them in the top half of their performance universes. About one quarter of the fixed-income Funds posted high returns and low risk relative to comparable funds. Just over half of the fixed-income Funds, primarily tax-exempt Funds, took on more risk than the typical fund in their performance universes. |
| 7. | The industry-standard procedure used by Lipper that includes all share classes in the performance universe tends to bias a Fund’s ranking upward within that universe. The bias occurs because either no-12b-1 fee or low-12b-1 fee share classes of the Atlantic Funds are compared with funds in performance universes that include all share classes of multi-class funds with 12b-1 fees of up to 100 basis points. Correcting this bias by limiting the performance universe to classes of comparable funds with low or no 12b-1 fees (a “filtered universe”) lowers the relative performance for the Funds, but not to a material extent. The filtering process, however, did identify one Fund for further review that had not been identified as a review fund using unfiltered universes. Conversely, two Funds that had been identified as review funds in the unfiltered universe lost that status in filtered universes. |
| 8. | A small number of Funds have consistently underperformed over the past five years. The exact number depends on the criteria used to evaluate longer-term performance. For example, only three Funds had below-median performance in each 1- and 3-year period from 2005 to 2009. |
| 9. | The services performed by CMG professionals beyond portfolio management, such as compliance, legal, information technology, risk management, finance, and fund administration, are critical to the success of the Funds and appear to be of high quality. |
C. Management Fees Charged by Other Mutual Fund Companies
| 10. | The Funds’ management fees and total expenses are generally low relative to those of their peers, with over half of the Funds in the most favorable two quintiles. Only 26% of the Funds ranked in the two most expensive quintiles for actual management fees, and 18% in those quintiles for total expenses. Two Funds are in the fifth quintile for total |
61
| | expenses; four Funds are in the fifth quintile for actual management fees. |
| 11. | The highest concentration of low-expense Funds is found among the foreign equity Funds. The 12 former Excelsior Funds have relatively high fees and expenses, with two-thirds ranking in either the fourth or fifth quintiles for actual management fees. The higher actual management fee rankings of certain former Excelsior Funds are due in part to fee schedules that are higher than standard Columbia Fund fee schedules at current asset levels. |
| 12. | The distribution of total expense and management fee rankings has improved over the prior two years. The implementation of the voluntary standardized cap system has contributed significantly to the improved rankings in 2009. |
| 13. | The management fees of the Atlantic Funds are generally in line with those of Columbia Funds supervised by the Nations Board of Trustees (the “Nations Funds”). To the extent that Atlantic Funds have higher average fees in certain investment categories than Nations Funds, the difference reflects either differences in asset size, different fee structures of the former Excelsior Funds, or special circumstances of the Funds included in the investment categories. |
D. Trustees’ Advisory Contract Review Process
| 14. | The Trustees’ evaluation process identified 16 Funds in 2009 for further review based upon long-standing criteria relating to their relative performance or expenses or both. When compared in filtered universes, one additional Fund met the criteria for further review. CMG provided further information about each of those Funds to assist the Trustees in their evaluation. |
E. Potential Economies of Scale
| 15. | CMG presented to the Trustees its analysis of the sources and sharing of potential economies of scale. CMG views economies of scale as arising at the complex level and would regard estimates of scale economies for individual funds as unreliable. In its analysis, CMG did not identify specific sources of economies of scale or provide any estimates of any economies of scale that might arise from future asset growth. CMG’s analysis included measures taken by the Trustees and CMG that seek to share any potential economies of scale through breakpoints in management fee schedules, the establishment of expense limits for each Fund, enhanced shareholder services, fund mergers, and operational consolidation. |
| 16. | An examination of the contractual fee schedules for five Atlantic Funds shows that those with standard fee structures are generally in line with those of their competitors. The fee schedules of the former Excelsior Funds, however, have high initial fees relative to competitors but otherwise have comparable breakpoint structures. |
F. Management Fees Charged to Institutional Clients
| 17. | CMG has provided Trustees with comparisons of mutual fund management fees and institutional fees based upon standardized fee schedules and upon actual fees. The results show that, consistent with industry practice, actual and scheduled institutional fees are generally lower than the Funds’ management fees. CMG provided additional data this year demonstrating that at small asset levels, the effective fee of certain Funds may be equal to or less than institutional fee levels at those asset levels, due to the effect of expense limits on small funds with high gross expenses. CMG also analyzed the differences between the services provided and risks borne on the one hand by a manager of mutual funds and on the other by institutional advisers, and suggested that these differences should be kept in mind when Trustees review the reasonableness of the Funds’ management fees. |
G. Revenues, Expenses, and Profits
| 18. | The activity-based cost allocation methodology employed by CMG to allocate costs, both direct and indirect, for purposes of calculating Fund profitability is thoughtful and detailed. This year, CMG further refined the technique by allocating additional indirect expenses on an activity basis. |
| 19. | The materials provided on CMG’s revenues and expenses with respect to the Funds and the methodology underlying their construction form a sufficient basis for Trustees to evaluate the expenses of and profitability to CMG arising out of its relationships with the Funds. |
62
| 20. | CMG provided a firm-wide pro forma 2009 income statement demonstrating the effect of market events beginning in the fourth quarter of 2008 on its revenues and profitability to provide an additional perspective on calendar 2008 profitability data. In particular, 2008 revenues reflected the higher market prices prevailing during the first three quarters of that year, while expenses dropped due to cost cutting in the wake of the market downturn late in 2008. The continuing effects of this downturn are expected to produce a significant decline in profitability this year. |
| 21. | In 2008, CMG’s pre-tax post-distribution margin on the Atlantic Fund complex was above industry medians, based on the limited data available for publicly held mutual fund managers. However, as is to be expected in a large fund complex, some Atlantic Funds had relatively high pre-tax profit margins in 2008, when calculated solely with respect to management revenues and expenses, while other Atlantic Funds operated at a loss. There is a positive relationship between Fund size and profitability to CMG, with smaller Funds generally operating at a loss to CMG. |
| 22. | CMG pays a fixed percentage of its management fee revenues to an affiliate, U.S. Trust, Bank of America Private Wealth Management, with respect to assets of its clients invested in Atlantic Funds to compensate it for services it performs with respect to those client assets and for the effect of state law limitations on affiliates charging multiple fees. Based on our analysis of the services provided by this affiliate, we have concluded that all payments other than those for sub-transfer agent or sub-accounting services should be treated as a distribution expense. |
III. Recommendations
| 1) | Criteria for review. The Trustees may wish to consider modifying the criteria for identifying a Fund for further review (a “Review Fund”) to include criteria that focus exclusively on performance. The Trustees’ supplementary data request included one such criterion. They may also wish to consider whether it would be useful to apply CMG’s own internal monitoring standards for Fund performance to the contract review process, or whether such criteria are more relevant to their ongoing investment oversight. |
| 2) | Presentation of Review Fund discussion. CMG should consider whether it could more systematically present in one discussion all relevant information regarding each Review Fund, which is now split into several different portions of the 15(c) materials. For any Fund that has been a Review Fund in consecutive years, CMG should address under what circumstances it could reasonably be anticipated that the Fund would lose that status. |
| 3) | Refinement of tax-exempt performance data. Certain single-state tax-exempt Funds compete in extremely small universes and are compared to a multi-state benchmark of uncertain relevance. Notwithstanding the difficulties, CMG should work to improve the reliability of the calculation of relative performance of these Funds. If that is not possible, CMG should provide guidance on how the Trustees should judge the quality of CMG’s management of these Funds. |
| 4) | Development of risk metrics for asset-allocation, tax-exempt, and money market funds. CMG has developed and shared with the Trustees quantitative risk metrics comparing equity and taxable fixed-income Funds against their peers. However, reliable risk metrics have not been developed for asset-allocation, tax-exempt fixed income, and money market funds. We urge CMG to continue its efforts to provide reliable risk measures for these categories of Funds, especially in the cases of asset-allocation and money market funds, because their investors are likely to be motivated at least in part by a desire to manage risk. |
| 5) | Profitability data. For any period during which CMG is an affiliate of U.S. Trust, Bank of America Private Wealth Management, CMG should continue to present to the Trustees the profitability of each Fund, each investment style and each complex (of which Atlantic is one) calculated as follows: |
| | a. | Management-only profitability should be calculated without reference to any Private Bank expense. |
| | b. | Profitability excluding distribution (which essentially covers the management and transfer agency functions) should be adjusted by removing from the expense calculation any portion of the Private Bank payment not attributable to the performance by the Private Bank of sub-transfer agency or sub-accounting functions. |
| | c. | Total profitability, including distribution: No adjustment for Private Bank expenses should be made, because all such expenses represent legitimate fund |
63
| | expenses to be taken into account in calculating CMG’s profit margin including distribution. |
| | d. | Distribution only: This should include all Private Bank expenses other than those attributable to sub-transfer agency services. |
| 6) | Contractual fee analysis. This year CMG presented a new Lipper report comparing the contractual management fees of Funds with those of competitors in similar investment styles. However, the reliability of the conclusion – that Fund management fee breakpoints compared favorably with competitive fee rates – was limited by the use of competitive funds at all asset levels. The sponsors of a $100 million mutual fund may not have given much thought to breakpoints at $5 billion; therefore, that fund’s contractual fee at that level is unlikely to compare favorably with that of a $5 billion Fund. Limiting the competitors to the Lipper expense group, whose constituents are similar in size to the relevant Fund, would make the results more meaningful. In addition, the breakpoints of a select group of Atlantic Funds (which would differ each year) should continue to be compared to those of industry rivals to ensure that the Funds’ breakpoint schedules remain within industry norms. As breakpoint schedules change relatively little each year, performing such a comparison for each Atlantic Fund each year would not be an efficient use of Trustee and CMG resources. |
| 7) | Pro forma profitability data. In any year in which CMG or the Trustees believe that the prior year’s profitability is unlikely to be representative of current business results due to changes in markets or for any other reason, CMG should, consistent with this year’s practice, prepare a pro forma income statement based on year-to-date actual data and reasonable projections used for its own business planning purposes. |
| 8) | Additional institutional data and analysis. While CMG provided a substantial amount of information on its institutional business, including a virtually complete database of all institutional accounts, we suggest some additional items for future years: (a) profitability data for the institutional business in the format, and based upon the same allocation methodologies, used to present Fund profitability, (b) an explanation of how CMA sets institutional fee breakpoints, which normally begin at asset levels far lower than those found in Fund management fee breakpoints, and (c) an analysis of differences in actual fees within specific investment categories, with special attention given to accounts established before and after the implementation of the standardized institutional fee schedules in 2005. |
| 9) | Management fee disparities. In any future study of management fees, CMG and the Atlantic Trustees should analyze the differences in management fee schedules, including those arising out of the reorganization of the former Excelsior Funds as Atlantic Funds. As part of that analysis, CMG should provide an explanation for any significant fee differences among comparable funds across fund families sponsored by CMG, such as differences in the management styles of different Funds included the same Lipper category. Finally, if CMG proposes a management fee change or an expense cap for any mutual fund managed by CMA that is comparable to any Atlantic Fund, CMG should provide the Trustees with sufficient information about the proposal to allow the Trustees to assess the applicability of the proposed change to the relevant Atlantic Fund or Funds. |
| 10) | Explanation of data supplied to Lipper. Each year, as part of the 15(c) process, CMG retains Lipper to compare the fees and expenses of each Fund to a group of competitors. In many cases, CMG, with the approval of the Trustees, adjusts the actual expense data, which is based on the most recent full fiscal year of the Fund (and each competitive fund) to reflect changes in fees or expense limits that occurred during or after the relevant fiscal year. This improves the reliability and usefulness of the comparison. However, to ensure that the Trustees know when and how CMG adjusted the data, we recommend that CMG prepare a table listing for each Fund what adjustments were made, e.g., to reflect a new expense limitation of x basis points that commenced on y date. |
Reduction of volume of paper documents submitted. The effort to streamline and better organize the data presented to the Trustees and the process by which that data was prepared and organized continued to be well-received by all parties. Notwithstanding past success, it is always appropriate to look for opportunities to reduce and simplify the presentation of 15(c) data. One possibility would be to remove the 124 pages of biographical data, most if not all of which the Trustees have
64
previously seen as part of their ongoing investment oversight duties, from the paper volume and post it on the Internet-based document storage and retrieval system used by the Funds to provide reference data to Trustees.
Respectfully Submitted,
Steven E. Asher
65
Summary of Management Fee Evaluation by Independent Fee Consultant (RiverSource Investments, LLC)
REPORT OF INDEPENDENT FEE CONSULTANT TO THE FUNDS SUPERVISED BY THE COLUMBIA ATLANTIC BOARD
Prepared Pursuant to the February 9, 2005 Assurance of Discontinuance among the Office of Attorney General of New York State, Columbia Management Advisors, LLC, and Columbia Management Distributors, Inc. December 21, 2009
I. Overview
On February 9, 2005, Columbia Management Advisors, LLC (“CMA”) and Columbia Management Distributors, Inc.1 (“CMD”) agreed to the New York Attorney General’s Assurance of Discontinuance (“AOD”). Among other things, the AOD stipulates that CMA may manage or advise a Columbia Fund (“Columbia Fund” and, together with some or all of such funds, the “Columbia Funds”) only if the Independent Members of the Columbia Fund’s Board of Trustees appoint a Senior Officer or retain an Independent Fee Consultant (“IFC”) who is to manage the process by which proposed management fees are negotiated. The AOD further stipulates that the Senior Officer or IFC is to prepare a written annual evaluation of the fee negotiation process.
With effect from January 1, 2007, the Independent Members of the Board of Trustees for certain Columbia Funds known collectively as the “Atlantic Funds” (together with the other members of that Board, the “Trustees”) retained me as IFC for the Atlantic Funds.2 In this capacity, I have prepared this written evaluation of the fee negotiation process. As was the case with the last three annual reports, my immediate predecessor as IFC, John Rea, provided invaluable assistance in the preparation of this report.
On September 29, 2009, Ameriprise entered into an asset purchase agreement with Bank of America, N.A. and its parent, Bank of America Corporation (together, the “Bank”) pursuant to which the Bank agreed to sell certain CMG assets relating to Columbia’s long-term asset management business, including management of the Atlantic Funds (the “Transaction”).3 The Transaction if completed would result in the termination of the existing Investment Management Agreements with CMA. Therefore, the Trustees have been requested to approve and recommend to the shareholders of each Atlantic Fund new Investment Management and Sub-Advisory Agreements (together, the “Management Agreements”) with RiverSource Investments, LLC (“RI”),4 investment manager of the RiverSource Funds and a subsidiary of Ameriprise. This report is intended to fulfill the requirements of the AOD with respect to the Trustees’ consideration of the new Management Agreements.
A. Role of the Independent Fee Consultant
The AOD charges the IFC with “managing the process by which proposed management fees … to be charged the Columbia Fund are negotiated so that they are negotiated in a manner which is at arms’ length and reasonable and consistent with this Assurance of Discontinuance.” The AOD also provides that CMA “may manage or advise a Columbia Fund only if the reasonableness of the proposed management fees is determined by the Board of Trustees … using … an annual independent written evaluation prepared by or under the direction of … the Independent Fee Consultant.” Therefore, the AOD makes clear that the IFC does not supplant the Trustees in negotiating management fees with CMA (or RI), nor does the IFC substitute his or her judgment for that of the Trustees with respect to the reasonableness of proposed fees or any other matter that is committed to the business judgment of the Trustees.
| 1 | CMA and CMD are subsidiaries of Columbia Management Group, LLC (“CMG”), and are the successors to the entities named in the AOD. |
| 2 | I have no material relationship with Bank of America, CMG or Ameriprise Financial, Inc. (“Ameriprise”), aside from serving as IFC, and I am aware of no material relationship with any of their affiliates. I retained John Rea, an independent economic consultant, to assist me with this report. |
| | Unless otherwise stated or required by the context, this report covers only the Atlantic Funds. |
| 3 | Preliminary Response of Ameriprise to Information Request of Columbia Atlantic Board dated October 21, 2009 (hereafter, the “Preliminary Response”), p. 1. The one money market Atlantic Fund, Money Market Fund VS, was included in the Transaction because it was an integral part of CMG’s array of Funds used as investment vehicles by variable annuity and similar insurance products. |
| 4 | Ameriprise intends to re-brand RI with the “Columbia” name (which is one of the assets being sold in the Transaction). Preliminary Response, pp. 4-5. In the case of new Sub-Advisory Agreements, the current sub-adviser would also be a party. |
66
B. Elements Involved in Managing the Fee Negotiation Process
In preparing the report required by the AOD, the IFC must consider at least the following six factors set forth in the AOD:
| 1. | The nature and quality of the adviser’s services, including the Fund’s performance; |
| 2. | Management fees (including any components thereof) charged by other mutual fund companies for like services; |
| 3. | Possible economies of scale as the Fund grows larger; |
| 4. | Management fees (including any components thereof) charged to institutional and other clients of the adviser for like services; |
| 5. | Costs to the adviser and its affiliates of supplying services pursuant to the management fee agreements, excluding any intra-corporate profit; and |
| 6. | Profit margins of the adviser and its affiliates from supplying such services. |
C. Data Presented to the Trustees
In considering the proposed new Management Agreements with RI, the Trustees relied in part on the data that had been prepared as part of their annual contract review process, which concluded in late October. This data remained relevant because the fees in the proposed Management Agreements were identical to the fees approved at that time. The annual review materials included a Lipper report on the performance of each Atlantic Fund compared to its peers and its benchmark, comparisons of the fees and expenses of each Atlantic Fund to similar CMG-sponsored Funds, comparable competitive funds chosen by Lipper, and institutional accounts advised by CMA, revenues, expenses, and profits of CMG from managing the Atlantic Funds, calculated both by Fund and collectively, and CMG’s views on the existence and sharing of economies of scale.
In addition, the Trustees reviewed materials specific to the proposed new Management Agreements with RI in response to requests for information made on behalf of the Trustees, including the following:
| n | | Performance data for the RiverSource Funds showing percentile and quartile rankings of each fund within its Lipper performance universe for periods up to five years and net returns of each fund relative to its benchmark returns. This data was arguably relevant due to the possibility that some RiverSource investment teams would be providing investment management services to certain Columbia Funds. 5 |
| n | | tables comparing the fee schedules and effective fee rates of funds managed by CMA and RI and institutional accounts advised by the two firms. |
| n | | extensive discussion of the process by which the various components of the two asset management businesses would be integrated including investment management, compliance, transfer agency, custody, fund accounting, and distribution. |
| n | | information about the financial condition of Ameriprise, including its most recent annual report on Form 10-K, RI’s profit margins from managing the RiverSource Funds in 2007 and 2008, and pro forma income statements for the combined Columbia and RiverSource fund complex. |
| n | | disclosure that certain senior CMG executives, including President Michael Jones, Chief Investment Officer Colin Moore, Head of Mutual Funds J. Kevin Connaughton, and Chief Compliance Officer Linda Wondrack would continue in analogous capacities following the consummation of the Transaction, and |
| n | | a breakdown of the synergies RI expects to realize in the two years following the Transaction and the extent to which those potential synergies are expected to be shared with shareholders of funds advised by RI. |
II. Findings
| 1. | Based upon my examination of the information supplied by CMG and Ameriprise in the light of the six factors set forth in the AOD, I conclude that the Trustees have the relevant information necessary to evaluate the reasonableness of the proposed management fees for each Atlantic Fund. |
| 2. | In my view, the process by which the proposed management fees of the Atlantic Funds have been negotiated with RI thus far has been, to the extent practicable, at arms’ length and reasonable and consistent with the AOD. |
Respectfully submitted,
Steven E. Asher
| 5 | On page 20 of its Supplemental Response to the Atlantic Trustees (undated but delivered November 24, 2009), Ameriprise said that “most personnel decisions, including with respect to the portfolio management teams for the Atlantic Funds … will be made primarily by [current CMA CIO] Colin Moore using the Columbia 5P process.” |
67
Proxy Voting Results
Columbia Income Fund
On March 3, 2010, a special meeting of shareholders of Columbia Funds Series Trust I was held to consider the approval of several proposals listed in the proxy statement for the meeting. Proposal 1 and Proposal 2 were voted on at the March 3, 2010 meeting of shareholders and Proposal 3 was voted on at an adjourned meeting of shareholders held on March 31, 2010. The shareholder meeting results are as follows:
Proposal 1: A proposed Investment Management Services Agreement with Columbia Management Investment Advisers, LLC (formerly, RiverSource Investments, LLC) (CMIA) was approved as follows:
| | | | | | |
| | | | | | | |
| Votes For | | Votes Against | | Abstentions | | Broker Non-Votes |
| 422,882,730 | | 6,012,602 | | 5,552,661 | | 44,921,684 |
Proposal 2: A proposal authorizing CMIA to enter into and materially amend subadvisory agreements for the Fund in the future, with the approval of the Trust’s Board of Trustees, but without obtaining additional shareholder approval, was approved as follows:
| | | | | | |
| | | | | | | |
| Votes For | | Votes Against | | Abstentions | | Broker Non-Votes |
| 412,472,410 | | 15,910,476 | | 6,065,060 | | 44,921,731 |
Proposal 3: Each of the nominees for trustees was elected to the Trust’s Board of Trustees, as follows:
| | | | | | |
| | | | | | | |
| Trustee | | Votes For | | Votes Withheld | | Abstentions |
| John D. Collins | | 30,977,072,412 | | 859,827,038 | | 0 |
| Rodman L. Drake | | 30,951,179,004 | | 885,720,446 | | 0 |
| Douglas A. Hacker | | 30,989,793,279 | | 847,106,171 | | 0 |
| Janet Langford Kelly | | 30,999,020,814 | | 837,878,636 | | 0 |
| William E. Mayer | | 16,291,139,483 | | 15,545,759,967 | | 0 |
| Charles R. Nelson | | 30,997,700,700 | | 839,198,750 | | 0 |
| John J. Neuhauser | | 30,988,095,661 | | 848,803,789 | | 0 |
| Jonathon Piel | | 30,968,801,048 | | 868,098,402 | | 0 |
| Patrick J. Simpson | | 30,999,065,030 | | 837,834,420 | | 0 |
| Anne-Lee Verville | | 30,996,227,913 | | 840,671,537 | | 0 |
68
Important Information About This Report – Columbia Income Fund
Transfer Agent*
Columbia Management Investment Services Corp.
P.O. Box 8081
Boston, MA 02266-8081
1-800-345-6611
Distributor*
Columbia Management Investment
Distributors, Inc.
One Financial Center
Boston, MA 02111
Investment Advisor*
Columbia Management Investment Advisers, LLC
100 Federal Street
Boston, MA 02110
* As of May 1, 2010.
The fund mails one shareholder report to each shareholder address. If you would like more than one report, please call shareholder services at 1-800-345-6611 and additional reports will be sent to you. This report has been prepared for shareholders of Columbia Income Fund.
A description of the policies and procedures that the fund uses to determine how to vote proxies and a copy of the fund’s voting records are available (i) at www.columbiamanagement.com, (ii) on the Securities and Exchange Commission’s website at www.sec.gov, and (iii) without charge, upon request, by calling 1-800-368-0346. Information regarding how the fund voted proxies relating to portfolio securities during the 12-month period ended June 30 is available on the SEC’s website. Information regarding how the fund voted proxies relating to portfolio securities is also available from the fund’s website, www.columbiamanagement.com
The fund files a complete schedule of portfolio holdings with the SEC for the first and third quarters of each fiscal year on Form N-Q. The fund’s Form N-Q is available on the SEC’s website at www.sec.gov and may be reviewed and copied at the SEC’s Public Reference Room in Washington, D.C. Information on the operation of the Public Reference Room may be obtained by calling
1-800-SEC-0330.
Investors should consider the investment objectives, risks, charges and expenses of a mutual fund carefully before investing. For a free prospectus, which contains this and other important information about the funds, visit columbiamanagement.com. Read the prospectus carefully before investing.
On April 30, 2010, Ameriprise Financial, Inc., the parent company of RiverSource Investments, LLC, acquired the long-term asset management business of Columbia Management Group, LLC, including certain of its affiliates, which were, prior to this acquisition, part of Bank of America. In connection with the acquisition of the long-term assets, the Columbia Funds have a new investment adviser, RiverSource Investments, LLC, which is now known as Columbia Management Investment Advisers, LLC. For those clients that use the services of a subadviser, those arrangements are continuing unless notified otherwise. RiverSource Fund Distributors, Inc., now known as Columbia Management Investment Distributors, Inc., member FINRA, will act as the principal distributor of the Columbia Funds.
69

One Financial Center
Boston, MA 02111-2621
Columbia Income Fund
Annual Report, March 31, 2010
©2010 Columbia Management Investment Advisers, LLC. All rights reserved.
One Financial Center, Boston, MA 02111-2621
800.345.6611 www.columbiafunds.com
SHC-42/44409-0310 (05/10) 10/72K6O4

Annual Report
March 31, 2010
Columbia Intermediate Bond Fund
Not FDIC Insured Ÿ May Lose Value Ÿ No Bank Guarantee
Table of Contents
The views expressed in this report reflect the current views of the respective parties. These views are not guarantees of future performance and involve certain risks, uncertainties and assumptions that are difficult to predict, so actual outcomes and results may differ significantly from the views expressed. These views are subject to change at any time based upon economic, market or other conditions and the respective parties disclaim any responsibility to update such views. These views may not be relied on as investment advice and, because investment decisions for a Columbia Fund are based on numerous factors, may not be relied on as an indication of trading intent on behalf of any particular Columbia Fund. References to specific securities should not be construed as a recommendation or investment advice.
President’s Message

Dear Shareholder:
On May 3, 2010, Ameriprise Financial, Inc. announced that it had completed the acquisition of the long-term asset management business of Columbia Management from Bank of America. This includes the business of managing its equity and fixed-income mutual funds. Ameriprise Financial has combined its current U.S. asset management business, RiverSource Investments, LLC, with Columbia Management. This transaction puts together two leading asset management firms to create one entity that ranks as the eighth largest manager of long-term mutual fund assets in the United States.1 This combined business will operate under the well-regarded Columbia Management brand, where we will build on the strengths of our combined investment capabilities and
talent, our broad and diversified product lineup and exceptional service.
Our combined business has a new breadth and depth of investment choices. William “Ted” Truscott, CEO, U.S. asset management and president of annuities for Ameriprise Financial, leads the combined U.S. asset management business. Michael Jones serves as president, U.S. asset management. Colin Moore continues to serve as chief investment officer. I am also continuing in my role as head of mutual funds, responsible for the delivery of mutual fund products and services to investors. The Columbia funds’ advisers, distributor and transfer agent are now subsidiaries of our parent company, Ameriprise Financial but operate under the Columbia Management name. You will begin to see these names used in communications and statements going forward.
| | |
| | | Service provider name |
| Advisers | | Columbia Management Investment Advisers, LLC Columbia Wanger Asset Management, LLC |
| Distributor | | Columbia Management Investment Distributors, Inc. |
| Transfer Agent | | Columbia Management Investment Services Corp. |
As a valued investor in Columbia funds, please know that our goal is to ensure a smooth transition and provide the highest quality products and services. Transition teams across the organization continue their efforts to build on best practices from both legacy organizations with integration efforts including rebranding, vendor and system consolidations and client communications. Additionally, we want to assure you that the funds’ portfolio managers also continue to focus on providing uninterrupted service to all fund shareholders.
Although we have a lot of work ahead of us in 2010, Columbia Management and Ameriprise Financial are excited about the opportunities for our combined organization. I share this optimism and believe it positions us as a best-in-class asset management business with the ability to deliver more for our clients than ever before.
Sincerely,

J. Kevin Connaughton
President, Columbia Funds
| 1 | Source: Ameriprise Financial, Inc., based on March 31, 2010 data from the Investment Company Institute |
Investors should consider the investment objectives, risks, charges and expenses of a mutual fund carefully before investing. For a free prospectus, which contains this and other important information about the funds, visit columbiamanagement.com. Read the prospectus carefully before investing.
Securities products offered through Columbia Management Investment Distributors, Inc. (formerly known as RiverSource Fund Distributors, Inc.), member FINRA. Advisory services provided by Columbia Management Investment Advisers, LLC (formerly known as RiverSource Investments, LLC).
© 2010 Columbia Management Investment Advisers, LLC. All rights reserved.
Fund Profile – Columbia Intermediate Bond Fund
Summary
| n | | For the 12-month period that ended March 31, 2010, the fund’s Class A shares returned 22.31% without sales charge. |
| n | | The fund’s return was well ahead of the return of its benchmark, the Barclays Capital Aggregate Bond Index1, and the average return of its peer group, the Lipper Intermediate Investment Grade Debt Funds Classification.2 |
| n | | Above-benchmark weights in corporate bonds drove the fund’s outstanding results. High-yield bonds, which are not in the benchmark, also contributed. |
Portfolio Management
Carl W. Pappo, lead manager for the fund, has co-managed the fund since March 2005 and has been associated with the advisor or its predecessors since 1993.
Kevin Cronk has co-managed the fund since March 2003 and has been associated with the advisor or its predecessors since 1999.
Lee Reddin has co-managed the fund since June 2007 and has been associated with the advisor or its predecessors since 2000.
Effective May 1, 2010, Alexander D. Powers and Michael Zazzarino replaced Kevin Cronk and Lee Reddin as co-managers of the fund. Mr. Powers has been associated with the advisor or its predecessors since 1996. Mr. Zazzarino has been associated with the advisor or its predecessors since 2005. Effective May 26, 2010, Brian Lanvin became a co-manager of the fund. Mr. Lanvin has been associated with the advisor or its predecessors since 1994.
Effective May 1, 2010, RiverSource Investments, LLC, a subsidiary of Ameriprise Financial, Inc., became the investment advisor to the fund and changed its name to Columbia Management Investment Advisers, LLC. Please see the fund’s prospectus, as supplemented, for more information regarding the change in investment advisor and certain other changes.
| 1 | The Barclays Capital Aggregate Bond Index is a market value-weighted index that tracks the daily price, coupon, pay-downs, and total return performance of fixed-rate, publicly placed, dollar-denominated and non-convertible investment grade debt issues with at least $250 million par amount outstanding and with at least one year to final maturity. Indices are not available for investment, are not professionally managed and do not reflect sales charges, fees, brokerage commissions, taxes or other expenses of investing. Securities in the fund may not match those in an index. |
| 2 | Lipper Inc., a widely respected data provider in the industry, calculates an average total return (assuming reinvestment of distributions) for mutual funds with investment objectives similar to those of the fund. Lipper makes no adjustment for the effect of sales loads. |
Performance data quoted represents past performance and current performance may be lower or higher. Past performance is no guarantee of future results. The investment return and principal value will fluctuate so that shares, when redeemed, may be worth more or less than the original cost. Please visit www.columbiafunds.com for daily and most recent month-end performance updates.
Summary
1-year return as of 03/31/10
| | |
| |
 | | +22.31% Class A shares
(without sales charge) |
| |
| | +7.69% Barclays Capital
Aggregate Bond Index |
1
Economic Update – Columbia Intermediate Bond Fund
After a deep and difficult recession, the U.S. economy regained its footing midway through calendar year 2009. Gross domestic product (GDP) turned positive in the third quarter of 2009, rising 2.2%, and then gained 5.6% in the fourth quarter according to the estimate released by the Bureau of Economic Analysis. Growth was primarily the result of a slowdown in inventory reduction and of federal government stimulus spending. Hopes for a sustained recovery now depend on a variety of factors, including continued improvement in consumer spending, an increase in revenues to keep business profits moving higher and a turnaround in the labor market.
The housing market showed some signs of stabilizing, but stopped short of meaningful improvement during the period. Home sales moved higher in 2009 as new homebuyers took advantage of a federal tax credit. However, as the tax credit was set to expire in November 2009, sales slipped — and did not revive even though the tax credit was expanded and extended through April 2010. Housing prices remained relatively flat over the past year, but that was progress compared to 2008. The average home price fell sharply in 2008; and since then distressed properties, which account for approximately 40% of all housing sales, have held prices down because they are heavily discounted.
In the beleaguered labor market, there was some good news. While businesses continued to shed jobs through most of 2009, raising the unemployment rate to 9.7% at the end of the period*, job data turned positive in March 2010, buoyed by a swell of temporary workers hired to conduct the national once-in-a-decade census. Consumer spending also trended higher in the second half of the period. In fact, March year-over-year sales made a significant jump upward. Despite these improvements, consumer confidence, as measured monthly by The Conference Board, an independent research organization, failed to gain much ground during the year. Consumers surveyed continue to cite uncertain business conditions and still-weak labor prospects for their concerns.
On the business side of the economy, manufacturing activity gained momentum. A key measure of the nation’s manufacturing situation — the Institute for Supply Management’s Index — rose above 50 in July 2009, then rose for eight consecutive months to remain well above 50 for the remainder of the period. (An index value of 50+ indicates a growing economy.) Industrial production moved higher for eleven out of the past 12 months, and durable goods orders took off, with a big jump upward in January. Manufacturing capacity utilization inched upward to 72.7%.
Bond returns ranged from solid to strong
As hopes for a recovery materialized, bonds from non-Treasury sectors delivered solid returns. The Barclays Capital Aggregate Bond Index1 returned 7.69%. Municipal
| * | Source: U.S. Bureau of Labor Statistics |
| 1 | The Barclays Capital Aggregate Bond Index is a market value-weighted index that tracks the daily price, coupon, pay-downs and total return performance of fixed-rate, publicly placed, dollar-denominated, and non-convertible investment grade debt issues with at least $250 million par amount outstanding and with at least one year to final maturity. |
Summary
For the 12-month period that ended March 31, 2010
| | n | | As investors grew more comfortable with risk, non-Treasury sectors of the bond market rebounded. The Barclays Capital Aggregate Bond Index delivered solid results. High-yield bonds outperformed stocks, as measured by the BofA Merrill Lynch U.S. High Yield Cash Pay Index. | |
| | |
| Barclays Aggregate Index | | BofA ML Index |
| |

| |
|
7.69% | | 55.67% |
| | n | | Stock markets rebounded around the world, as measured by the S&P 500 Index and the MSCI EAFE Index. | |
| | |
| S&P Index | | MSCI Index |
| |
| |
|
| | 54.44% |
49.77% | | |
2
Economic Update (continued) – Columbia Intermediate Bond Fund
bonds gained more than taxable investment-grade bonds even without factoring in potential tax advantages to investors in higher income-tax brackets. The Barclays Capital Municipal Bond Index2 returned 9.69%. The high-yield bond market was even stronger than the broad stock market during the period. For the 12 months covered by this report, the BofA Merrill Lynch U.S. High Yield Cash Pay Index3 returned 55.67%.
The yield on the 10-year U.S. Treasury, a common bellwether for the bond market, rose from 2.7% to 3.8% during the 12-month period. Yet despite the pickup in economic activity, the Federal Reserve Board (the Fed) kept a key short-term interest rate—the federal funds rate—close to zero throughout the period.
Stocks staged a solid comeback
Against a strengthening economic backdrop, a stock market rally that began in mid-March 2009 continued with little interruption through the end of the period. The U.S. stock market returned 49.77% for the 12-month period, as measured by the S&P 500 Index.4 Mid-cap stocks outperformed large- and small-cap stocks, and value stocks outperformed growth stocks by a solid margin, as measured by their respective Russell indices.5 Outside the United States, stock market returns were slightly stronger. The MSCI EAFE Index,6 a broad gauge of stock market performance in foreign developed markets, gained 54.44% (net of dividends, in U.S. dollars) for the period. Emerging stock markets were caught in a downdraft in 2008, but they bounced back stronger than domestic or developed world markets as their economic growth generally outpaced the developed world. The MSCI Emerging Markets Index7 returned 81.08% (net of dividends, in U.S. dollars) for the 12-month period, after giving back some gains in the first quarter of 2010.
Past performance is no guarantee of future results.
| 2 | The Barclays Capital Municipal Bond Index is considered representative of the broad market for investment-grade, tax-exempt bonds with a maturity of at least one year. |
| 3 | The BofA Merrill Lynch U.S. High Yield Cash Pay Index tracks the performance of non-investment-grade corporate bonds. |
| 4 | The Standard & Poor’s (S&P) 500 Index tracks the performance of 500 widely held, large-capitalization U.S. stocks. |
| 5 | The Russell 1000 Index tracks the performance of 1,000 of the largest U.S. companies, based on market capitalization. The Russell MidCap Index measures the performance of the 800 smallest companies in the Russell 1000 Index, which represents approximately 25% of the total market capitalization of the Russell 1000 Index. The Russell 2000 Index measures the performance of the 2,000 smallest companies in the Russell 3000 Index, which represents approximately 8% of the total market capitalization of the Russell 3000 Index. The Russell 3000 Growth Index measures the performance of those Russell 3000 Index companies with higher price-to-book ratios and higher forecasted growth values. The stocks in this index are also members of either the Russell 1000 Growth or the Russell 2000 Growth indexes. The Russell 3000 Value Index measures the performance of those Russell 3000 Index companies with lower price-to-book ratios and lower forecasted growth values. The stocks in this index are also members of either the Russell 1000 Value or the Russell 2000 Value indices. |
| 6 | The Morgan Stanley Capital International Europe, Australasia, Far East (MSCI EAFE) Index is a capitalization-weighted index that tracks the total return of common stocks in 21 developed-market countries within Europe, Australasia and the Far East. |
| 7 | The Morgan Stanley Capital International Emerging Markets Index (MSCI EMI) is a free float-adjusted market capitalization index that is designed to measure equity market performance in the global emerging markets. As of June 2009, the MSCI Emerging Markets Index consisted of the following 22 emerging market country indices: Brazil, Chile, China, Colombia, Czech Republic, Egypt, Hungary, India, Indonesia, Israel, Korea, Malaysia, Mexico, Morocco, Peru, Philippines, Poland, Russia, South Africa, Taiwan, Thailand and Turkey. |
Indices are not available for investment, are not professionally managed and do not reflect sales charges, fees, brokerage commissions, taxes or other expenses of investing. Securities in the fund may not match those in an index.
3
Performance Information – Columbia Intermediate Bond Fund
Performance data quoted represents past performance and current performance may be lower or higher. Past performance is no guarantee of future results. The investment return and principal value will fluctuate so that shares, when redeemed, may be worth more or less than the original cost. Please visit www.columbiafunds.com for daily and most recent month-end performance updates.
| | |
| Annual operating expense ratio (%)* |
| |
Class A | | 0.99 |
Class B | | 1.64 |
Class C | | 1.64 |
Class R | | 1.14 |
Class Z | | 0.64 |
| * | The annual operating expense ratio is as stated in the fund's prospectus that is current as of the date of this report. Differences in expense ratios disclosed elsewhere in this report may result from including fee waivers and expense reimbursements as well as different time periods used in calculating the ratios. |
|
| Performance of a $10,000 investment 04/01/00 – 03/31/10 |
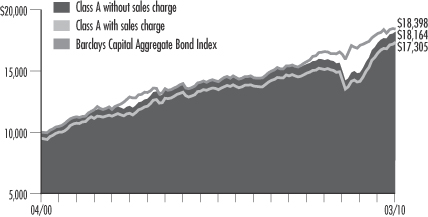
The chart above shows the change in value of a hypothetical $10,000 investment in Class A shares of Columbia Intermediate Bond Fund during the stated time period, and does not reflect the deduction of taxes that a shareholder may pay on fund distributions or on the redemption of fund shares.
| | | | |
| Performance of a $10,000 investment 04/01/00 - 03/31/10 ($) |
| | |
| Sales charge | | without | | with |
Class A | | 18,164 | | 17,305 |
Class B | | 17,092 | | 17,092 |
Class C | | 17,301 | | 17,301 |
Class R | | 17,975 | | n/a |
Class Z | | 18,619 | | n/a |
| | | | | | | | | | | | | | | | |
| Average annual total return as of 03/31/10 (%) |
| | | | | |
| Share class | | A | | B | | C | | R | | Z |
| Inception | | 07/31/00 | | 02/01/02 | | 02/01/02 | | 01/23/06 | | 12/05/78 |
| Sales charge | | without | | with | | without | | with | | without | | with | | without | | without |
1-year | | 22.31 | | 18.33 | | 21.41 | | 18.41 | | 21.59 | | 20.59 | | 22.01 | | 22.62 |
5-year | | 5.16 | | 4.13 | | 4.37 | | 4.37 | | 4.53 | | 4.53 | | 4.94 | | 5.42 |
10-year | | 6.15 | | 5.64 | | 5.51 | | 5.51 | | 5.63 | | 5.63 | | 6.04 | | 6.41 |
The “with sales charge” returns include the maximum initial sales charge of 3.25% for Class A shares and the applicable contingent deferred sales charge of 3.00% in the first year, declining to 1.00% in the fourth year and eliminated thereafter for Class B shares and 1.00% for Class C shares for the first year only. The “without sales charge” returns do not include the effect of sales charges. If they had, returns would be lower. Prior to August 22, 2005, new purchases of Class A shares had a maximum initial sales charge of 4.75%. The 5 & 10 year average annual returns with sales charge as of 03/31/10 include the previous sales charge of 4.75%.
Performance results reflect any fee waivers or reimbursements of fund expenses by the investment advisor and/or any of its affiliates. Absent these fee waivers or expense reimbursement arrangements, performance results would have been lower.
All results shown assume reinvestment of distributions. Class Z and R shares are sold at net asset value. Class Z shares have no distribution and service (Rule 12b-1) fees. Class R shares are sold at net asset value with a distribution (Rule 12b-1) fee. Class Z and R shares have limited eligibility and the investment minimum requirements may vary. Please see the fund’s prospectus for details. Performance for different share classes will vary based on differences in sales charges and fees associated with each class.
The tables do not reflect the deduction of taxes that a shareholder may pay on fund distributions or on the redemption of fund shares.
Class A share performance information includes returns of Class Z shares (the oldest existing share class) for periods prior to July 31, 2000. Class B and Class C share performance information includes returns of Class A shares for the period from July 31, 2000 through February 1, 2002, and the returns of Class Z shares for periods prior thereto. Class R share performance information includes returns of Class A shares for the period from July 31, 2000 through January 22, 2006, and the returns of Class Z shares for periods prior thereto. These returns shown for these share classes reflect any differences in sales charges, but have not been restated to reflect any differences in expenses, such as distribution and service (Rule 12b-1) fees, between Class Z or Class A shares, as applicable, and the corresponding newer share classes. If differences in expenses had been reflected, the returns shown for periods prior to the inception of the newer classes of shares would have been lower. Class A shares were initially offered on July 31, 2000; Class B and Class C shares were initially offered on February 1, 2002; Class R shares were initially offered on January 23, 2006; and Class Z shares were initially offered on December 5, 1978.
4
Understanding Your Expenses – Columbia Intermediate Bond Fund
Estimating your actual expenses
To estimate the expenses that you paid over the period, first you will need your account balance at the end of the period:
| | n | | For shareholders who receive their account statements from Columbia Management Services, Inc., your account balance is available online at www.columbiafunds.com or by calling Shareholder Services at 800.345.6611. | |
| | n | | For shareholders who receive their account statements from their financial intermediary, contact your financial intermediary to obtain your account balance. | |
| | 1. | Divide your ending account balance by $1,000. For example, if an account balance was $8,600 at the end of the period, the result would be 8.6. | |
| | 2. | In the section of the table below titled “Expenses paid during the period,” locate the amount for your share class. You will find this number in the column labeled “Actual.” Multiply this number by the result from step 1. Your answer is an estimate of the expenses you paid on your account during the period. | |
If the value of your account falls below the minimum initial investment requirement applicable to you, your account generally will be subject to a $20 annual fee. This fee is not included in the accompanying table. If you are subject to the fee, keep it in mind when you are estimating the ongoing expenses of investing in the fund and when comparing the expenses of this fund with other funds.
As a fund shareholder, you incur two types of costs. There are transaction costs, which generally include sales charges on purchases and may include redemption fees or exchange fees. There are also ongoing costs, which generally include investment advisory fees, distribution and service (Rule 12b-1) fees and other fund expenses. The information on this page is intended to help you understand the ongoing costs of investing in the fund and to compare these costs with the ongoing costs of investing in other mutual funds.
Analyzing your fund’s expenses by share class
To illustrate these ongoing costs, we have provided an example and calculated the expenses paid by investors in each share class during the period. The information in the following table is based on an initial investment of $1,000, which is invested at the beginning of the period and held for the entire period. Expense information is calculated two ways and each method provides you with different information. The amount listed in the “Actual” column is calculated using the fund’s actual operating expenses and total return for the period. The amount listed in the “Hypothetical” column for each share class assumes that the return each year is 5% before expenses and is calculated based on the fund’s actual operating expenses. You should not use the hypothetical account values and expenses to estimate either your actual account balance at the end of the period or the expenses you paid during this period.
Compare with other funds
Since all mutual funds are required to include the same hypothetical calculations about expenses in shareholder reports, you can use this information to compare the ongoing costs of investing in the fund with other funds. To do so, compare the 5% hypothetical example with the 5% hypothetical examples that appear in the shareholder reports of other funds. As you compare hypothetical examples of other funds, it is important to note that hypothetical examples are meant to highlight the ongoing costs of investing in a fund and do not reflect any transaction costs, such as sales charges, redemption fees or exchange fees.
| | | | | | | | | | | | | | |
| | | | |
| | | Account value at the
beginning of the period ($) | | Account value at the end of the period ($) | | Expenses paid during the period ($) | | Fund’s annualized
expense ratio (%) |
| | | Actual | | Hypothetical | | Actual | | Hypothetical | | Actual | | Hypothetical | | Actual |
Class A | | 1,000.00 | | 1,000.00 | | 1,050.70 | | 1,020.44 | | 4.60 | | 4.53 | | 0.90 |
Class B | | 1,000.00 | | 1,000.00 | | 1,046.80 | | 1,016.70 | | 8.42 | | 8.30 | | 1.65 |
Class C | | 1,000.00 | | 1,000.00 | | 1,047.60 | | 1,017.45 | | 7.66 | | 7.54 | | 1.50 |
Class R | | 1,000.00 | | 1,000.00 | | 1,049.40 | | 1,019.20 | | 5.88 | | 5.79 | | 1.15 |
Class Z | | 1,000.00 | | 1,000.00 | | 1,052.00 | | 1,021.69 | | 3.33 | | 3.28 | | 0.65 |
Expenses paid during the period are equal to the annualized expense ratio for the share class, multiplied by the average account value over the period, then multiplied by the number of days in the fund’s most recent fiscal half-year and divided by 365.
Had the investment advisor and/or any of its affiliates not waived fees or reimbursed a portion of expenses for Class A shares and Class C shares, the Class A and Class C account values at the end of the period would have been reduced.
It is important to note that the expense amounts shown in the table are meant to highlight only ongoing costs of investing in the fund and do not reflect any transaction costs, such as sales charges, redemption fees or exchange fees. Therefore, the hypothetical examples provided may not help you determine the relative total costs of owning shares of different funds. If these transaction costs were included, your costs would have been higher.
5
Portfolio Managers’ Report – Columbia Intermediate Bond Fund
Performance data quoted represents past performance and current performance may be lower or higher. Past performance is no guarantee of future results. The investment return and principal value will fluctuate so that shares, when redeemed, may be worth more or less than the original cost. Please visit www.columbiafunds.com for daily and most recent month-end performance updates.
| | | |
| Net asset value per share | |
| |
as of 03/31/10 ($) | | | |
Class A | | 8.95 | |
Class B | | 8.95 | |
Class C | | 8.95 | |
Class R | | 8.95 | |
Class Z | | 8.95 | |
| | | |
| Distributions declared per share | |
| |
04/01/09 – 03/31/10 ($) | | | |
Class A | | 0.46 | |
Class B | | 0.40 | |
Class C | | 0.41 | |
Class R | | 0.44 | |
Class Z | | 0.48 | |
| | | |
| Portfolio structure | |
| |
as of 03/31/10 (%) | | | |
Corporate Fixed-Income Bonds & Notes | | 43.3 | |
Commercial Mortgage-Backed Securities | | 20.2 | |
Mortgage-Backed Securities | | 16.9 | |
Government & Agency Obligations | | 9.8 | |
Asset-Backed Securities | | 5.6 | |
Collateralized Mortgage Obligations | | 2.0 | |
Municipal Bonds | | 0.6 | |
Common Stock | | 0.0 | * |
Preferred Stock | | 0.0 | * |
Warrants | | 0.0 | * |
Short-Term Obligation | | 0.9 | |
Other Assets & Liabilities, Net | | 0.7 | |
| * | Represents less than 0.1% of net assets. |
For the 12-month period that ended March 31, 2010, the fund’s Class A shares returned 22.31% without sales charge. The fund’s return was nearly triple the 7.69% return of its benchmark, the Barclays Capital Aggregate Bond Index, for the same period. The fund also exceeded the average return of its peer group, the Lipper Intermediate Investment Grade Debt Funds Classification, which was 15.67%. Sizeable allocations to corporate and high-yield issues accounted for much of the fund’s outstanding performance versus the benchmark and its peers during this period. There are no high-yield bonds in the index.
Investor confidence fed appetite for risk
As government programs and a very accommodative Federal Reserve Board (the Fed) helped recapitalize corporate America and restore liquidity to the markets, fears of financial collapse subsided. Investors began shedding low-risk holdings to pursue greater returns, as confident buyers scooped up deeply distressed issues across the ratings spectrum and in a variety of industries. Corporate bonds staged a striking reversal, rebounding from the precipitous declines triggered by the recent credit crisis and recording sizeable gains. U.S. Treasury and agency bonds underperformed as investors sought better prospects elsewhere.
Overweight in corporates drove strong results
Most of the fund’s substantial performance advantage over its benchmark was the result of our decision to overweight corporate and high-yield bonds. Early last year, valuations were severely depressed and yield spreads on investment-grade and high-yield bonds over Treasuries stood at historically wide levels. We took advantage of these higher yields and low prices to build overweight positions in investment-grade bonds and commercial mortgage-backed securities (CMBS). We also expanded high-yield holdings because lower-rated issues have potential for significant gains in a recovering economy. Security selection within corporate sectors also added to returns. The fund’s emphasis on bank debt brought solid gains, as did bonds that were subordinate to other bonds in a company’s capital structure, which offered higher yields.
Amid questions of capital adequacy in the banking industry, JPMorgan’s (3.5% of net assets) debt rose because of the company’s comparatively small capital needs. MetLife (1.2% of net assets), whose capital was not in question, eliminated some real estate holdings and bought attractively-priced assets at discount prices from AIG. International Lease Finance (0.7% of net assets), an aircraft leasing company, also contributed. Wells Fargo (0.2% of net assets) benefited when the government intervened to back some of the distressed assets it acquired in the merger with Wachovia Bank (4.5% of net assets). We added bonds of Citigroup (1.9% of net assets) when depressed prices resulted in a very high yield. That decision was rewarded when Citi strengthened its balance sheet and its securities rebounded.
6
Portfolio Managers’ Report (continued) – Columbia Intermediate Bond Fund
Higher rates unlikely to trouble markets
With the economy on firmer footing, we believe the Fed will temper its accommodative stance and move to raise short-term interest rates late in 2010. With rates currently near zero, a modest increase seems unlikely to disrupt the markets. In this environment, we believe that corporate and high-yield bonds have the potential to continue to perform well overall. Nevertheless, given how far the recent rally has come, we think it prudent to reduce some of the fund’s risk exposure by reducing somewhat the fund’s large overweight to corporates. In that regard, we have been transitioning some BBB corporate holdings into CMBS, where we can acquire AAA-rated1 securities maturing in five years or less at very attractive valuations.
Portfolio holdings and characteristics are subject to change periodically and may not be representative of current holdings and characteristics. The outlook for the fund may differ from those presented for other Columbia Funds.
Investing in fixed-income securities may involve certain risks, including the credit quality of individual issuers, possible prepayments, market or economic developments and yield and share price fluctuations due to changes in interest rates. When interest rates go up, bond prices typically drop, and vice versa.
Investments in high-yield bonds (sometimes referred to as “junk bonds”) offer the potential for high current income and attractive total return, but involve certain risks. Changes in economic conditions or other circumstances may adversely affect a high-yield bond issuer’s ability to make principal and interest payments.
| 1 | The credit quality ratings represent those of Moody’s Investors Service, Inc. (“Moody’s”), Standard & Poor’s Corporation (“S&P”) or Fitch Ratings (“Fitch”). The ratings represent their opinions as to the quality of the securities they rate. Ratings are relative and subjective and are not absolute standards of quality. The security’s credit quality does not eliminate risk. |
| | |
| Quality breakdown |
| |
as of 03/31/10 (%) | | |
Treasury | | 9.6 |
Agency | | 18.3 |
AAA | | 24.1 |
AA | | 4.5 |
A | | 12.9 |
BBB | | 21.7 |
BB | | 4.0 |
B | | 2.5 |
CCC and Below | | 1.4 |
Not Rated | | 0.1 |
Cash & Equivalents | | 0.9 |
| | |
| Maturity breakdown |
| |
as of 03/31/10 (%) | | |
0 - 1 year | | 5.6 |
1 - 2 year | | 6.8 |
2 - 3 years | | 7.0 |
3 - 4 years | | 16.4 |
4 - 5 years | | 11.2 |
5 - 6 years | | 3.8 |
6 - 7 years | | 9.7 |
7 - 8 years | | 6.9 |
8 - 9 years | | 5.0 |
9 - 10 years | | 7.7 |
10 - 20 years | | 1.5 |
20 - 30 years | | 13.7 |
30 years and over | | 3.8 |
Cash & Equivalents | | 0.9 |
Portfolio structure is calculated as a percentage of net assets.
Quality and maturity breakdowns are calculated as a percentage of total investments. Ratings shown in the quality breakdown represent the rating assigned by one of the following nationally-recognized rating agencies: Standard and Poor’s, Moody’s Investor Service, Inc or Fitch Ratings Ltd. Ratings are relative and subjective and are not absolute standard of quality. The fund’s credit quality does not remove market risk.
The fund is actively managed and the composition of its portfolio will change over time.
| | |
| 30-day SEC yields |
| |
as of 03/31/10 (%) | | |
Class A | | 4.24 |
Class B | | 3.71 |
Class C | | 3.86 |
Class R | | 4.20 |
Class Z | | 4.71 |
The 30-day SEC yields reflect the fund’s earning power, net of expenses, expressed as an annualized percentage of the public offering price per share at the end of the period. Had the investment advisor and/or its affiliates not waived fees or reimbursed a portion of expenses for Class A and Class C shares, the 30-day SEC yields would have been lower.
7
Investment Portfolio – Columbia Intermediate Bond Fund
March 31, 2010
Corporate Fixed-Income Bonds & Notes – 43.3%
| | | | |
| | | Par ($) (a) | | Value ($) |
| Basic Materials – 2.2% | | | | |
| Chemicals – 0.8% | | | | |
| Dow Chemical Co. | | | | |
5.900% 02/15/15 | | 6,775,000 | | 7,334,778 |
8.550% 05/15/19 | | 2,330,000 | | 2,818,697 |
| | |
| Georgia Gulf Corp. | | | | |
9.000% 01/15/17 (b) | | 130,000 | | 136,012 |
| | |
| Huntsman International LLC | | | | |
7.875% 11/15/14 | | 580,000 | | 585,800 |
| | |
| INEOS Group Holdings PLC | | | | |
8.500% 02/15/16 (b) | | 1,065,000 | | 878,625 |
| | |
| INVISTA | | | | |
9.250% 05/01/12 (b) | | 775,000 | | 784,687 |
| | |
| Lubrizol Corp. | | | | |
6.500% 10/01/34 | | 330,000 | | 341,536 |
8.875% 02/01/19 | | 3,235,000 | | 4,080,173 |
| | |
| NOVA Chemicals Corp. | | | | |
8.375% 11/01/16 (b) | | 260,000 | | 267,150 |
8.625% 11/01/19 (b) | | 260,000 | | 267,800 |
| | |
| Solutia, Inc. | | | | |
8.750% 11/01/17 | | 525,000 | | 553,875 |
| | |
| Terra Capital, Inc. | | | | |
7.750% 11/01/19 | | 380,000 | | 458,850 |
| | | | |
Chemicals Total | | | | 18,507,983 |
| | |
| Forest Products & Paper – 0.2% | | | | |
| Clearwater Paper Corp. | | | | |
10.625% 06/15/16 (b) | | 240,000 | | 266,400 |
| | |
| Domtar Corp. | | | | |
10.750% 06/01/17 | | 210,000 | | 255,150 |
| | |
| Georgia-Pacific Corp. | | | | |
8.000% 01/15/24 | | 775,000 | | 821,500 |
| | |
| NewPage Corp. | | | | |
10.000% 05/01/12 | | 825,000 | | 572,344 |
11.375% 12/31/14 | | 335,000 | | 333,325 |
| | |
| PE Paper Escrow GmbH | | | | |
12.000% 08/01/14 (b) | | 785,000 | | 887,050 |
| | | | |
Forest Products & Paper Total | | | | 3,135,769 |
| | |
| Iron/Steel – 0.7% | | | | |
| ArcelorMittal | | | | |
7.000% 10/15/39 | | 1,275,000 | | 1,309,402 |
9.850% 06/01/19 | | 3,120,000 | | 3,965,510 |
| | | | |
| | | Par ($) (a) | | Value ($) |
| Nucor Corp. | | | | |
5.000% 06/01/13 | | 2,545,000 | | 2,749,888 |
5.850% 06/01/18 | | 4,800,000 | | 5,210,549 |
| | |
| Russel Metals, Inc. | | | | |
6.375% 03/01/14 | | 500,000 | | 468,125 |
| | |
| Steel Dynamics, Inc. | | | | |
7.750% 04/15/16 | | 770,000 | | 804,650 |
| | |
| United States Steel Corp. | | | | |
7.000% 02/01/18 | | 340,000 | | 334,900 |
| | | | |
Iron/Steel Total | | | | 14,843,024 |
| | |
| Metals & Mining – 0.5% | | | | |
| FMG Finance Ltd. | | | | |
10.625% 09/01/16 (b) | | 1,050,000 | | 1,210,125 |
| |
| Freeport-McMoRan Copper & Gold, Inc. | | |
8.375% 04/01/17 | | 285,000 | | 317,063 |
| |
| Noranda Aluminium Holding Corp. | | |
PIK, | | | | |
7.024% 11/15/14 (05/15/10) (c)(d) | | 728,180 | | 497,684 |
| | |
| Teck Resources Ltd. | | | | |
10.750% 05/15/19 | | 805,000 | | 986,125 |
| | |
| Vale Overseas Ltd. | | | | |
6.875% 11/21/36 | | 7,620,000 | | 7,883,271 |
| | |
| Vedanta Resources PLC | | | | |
9.500% 07/18/18 (b) | | 940,000 | | 1,038,700 |
| | | | |
Metals & Mining Total | | | | 11,932,968 |
| | | | |
Basic Materials Total | | | | 48,419,744 |
| | | | |
| Communications – 3.6% | | | | |
| Advertising – 0.0% | | | | |
| Interpublic Group of Companies, Inc. | | |
6.250% 11/15/14 | | 165,000 | | 166,031 |
| | | | |
Advertising Total | | | | 166,031 |
| | |
| Media – 1.8% | | | | |
| CCH II LLC/CCH II Capital Corp. | | | | |
13.500% 11/30/16 | | 623,371 | | 749,604 |
| |
| Cengage Learning Acquisitions, Inc. | | |
10.500% 01/15/15 (b) | | 365,000 | | 350,400 |
| |
| Cequel Communications Holdings I LLC & Cequel Capital Corp. | | |
8.625% 11/15/17 (b) | | 295,000 | | 303,112 |
See Accompanying Notes to Financial Statements.
8
Columbia Intermediate Bond Fund
March 31, 2010
Corporate Fixed-Income Bonds & Notes (continued)
| | | | |
| | | Par ($) (a) | | Value ($) |
| Communications (continued) | | | | |
| Clear Channel Worldwide Holdings, Inc. | | |
9.250% 12/15/17 (b) | | 300,000 | | 313,500 |
| | |
| CMP Susquehanna Corp. | | | | |
3.250% 05/15/14 (05/14/10) (c)(d)(e) | | 38,000 | | 22,420 |
| | |
| Comcast Corp. | | | | |
6.950% 08/15/37 | | 7,450,000 | | 8,059,544 |
| | |
| CSC Holdings, Inc. | | | | |
8.500% 04/15/14 (b) | | 1,060,000 | | 1,128,900 |
| | |
| DirecTV Holdings LLC | | | | |
6.375% 06/15/15 | | 1,780,000 | | 1,848,975 |
| | |
| DISH DBS Corp. | | | | |
6.625% 10/01/14 | | 460,000 | | 463,450 |
7.875% 09/01/19 | | 440,000 | | 457,600 |
| | |
| Liberty Media LLC | | | | |
8.250% 02/01/30 | | 695,000 | | 647,219 |
| | |
| Local TV Finance LLC | | | | |
PIK, | | | | |
9.250% 06/15/15 (b) | | 661,500 | | 415,266 |
| | |
| News America, Inc. | | | | |
6.400% 12/15/35 | | 4,835,000 | | 4,937,270 |
| | |
| Sinclair Television Group, Inc. | | | | |
9.250% 11/01/17 (b) | | 465,000 | | 489,412 |
| | |
| Sirius XM Radio, Inc. | | | | |
9.750% 09/01/15 (b) | | 925,000 | | 999,000 |
| | |
| Time Warner Cable, Inc. | | | | |
3.500% 02/01/15 | | 11,120,000 | | 11,129,408 |
5.000% 02/01/20 | | 4,485,000 | | 4,422,125 |
5.850% 05/01/17 | | 2,260,000 | | 2,419,897 |
| | | | |
Media Total | | | | 39,157,102 |
| |
| Telecommunication Services – 1.8% | | |
| AT&T, Inc. | | | | |
6.550% 02/15/39 | | 4,005,000 | | 4,210,224 |
| | |
| British Telecommunications PLC | | | | |
5.950% 01/15/18 | | 6,855,000 | | 7,037,322 |
| |
| Clearwire Communications LLC/Clearwire Finance, Inc. | | |
12.000% 12/01/15 (b) | | 765,000 | | 779,663 |
| | |
| Cricket Communications, Inc. | | | | |
9.375% 11/01/14 | | 700,000 | | 712,250 |
| | | | |
| | | Par ($) (a) | | Value ($) |
| Crown Castle International Corp. | | | | |
9.000% 01/15/15 | | 505,000 | | 546,663 |
| | |
| Digicel Group Ltd. | | | | |
8.875% 01/15/15 (b) | | 1,165,000 | | 1,144,612 |
| | |
| Frontier Communications Corp. | | | �� | |
7.875% 01/15/27 | | 1,420,000 | | 1,278,000 |
| | |
| GeoEye, Inc. | | | | |
9.625% 10/01/15 (b) | | 745,000 | | 761,762 |
| | |
| Global Crossing Ltd. | | | | |
12.000% 09/15/15 (b) | | 540,000 | | 599,400 |
| | |
| Intelsat Jackson Holdings Ltd. | | | | |
11.250% 06/15/16 | | 465,000 | | 503,363 |
| | |
| Intelsat Luxembourg SA | | | | |
11.250% 02/04/17 | | 1,255,000 | | 1,327,162 |
| | |
| Level 3 Financing, Inc. | | | | |
8.750% 02/15/17 | | 440,000 | | 402,600 |
| | |
| Lucent Technologies, Inc. | | | | |
6.450% 03/15/29 | | 1,040,000 | | 733,200 |
| | |
| MetroPCS Wireless, Inc. | | | | |
9.250% 11/01/14 | | 700,000 | | 715,750 |
| | |
| Nextel Communications, Inc. | | | | |
7.375% 08/01/15 | | 840,000 | | 798,000 |
| |
| Nielsen Finance LLC/Nielsen Finance Co. | | |
11.500% 05/01/16 | | 350,000 | | 395,500 |
| | |
| NII Capital Corp. | | | | |
10.000% 08/15/16 (b) | | 345,000 | | 377,775 |
| | |
| Nordic Telephone Co. Holdings ApS | | | | |
8.875% 05/01/16 (b) | | 800,000 | | 858,000 |
| | |
| Quebecor Media, Inc. | | | | |
7.750% 03/15/16 | | 970,000 | | 982,125 |
| |
| Qwest Communications International, Inc. | | |
7.500% 02/15/14 | | 1,020,000 | | 1,037,850 |
| | |
| Qwest Corp. | | | | |
7.500% 06/15/23 | | 655,000 | | 655,000 |
| | |
| SBA Telecommunications, Inc. | | | | |
8.250% 08/15/19 (b) | | 325,000 | | 346,125 |
| | |
| Sprint Capital Corp. | | | | |
6.875% 11/15/28 | | 320,000 | | 257,600 |
| | |
| Syniverse Technologies, Inc. | | | | |
7.750% 08/15/13 | | 485,000 | | 488,638 |
See Accompanying Notes to Financial Statements.
9
Columbia Intermediate Bond Fund
March 31, 2010
Corporate Fixed-Income Bonds & Notes (continued)
| | | | |
| | | Par ($) (a) | | Value ($) |
| Communications (continued) | | | | |
| Telefonica Emisiones SAU | | | | |
6.221% 07/03/17 | | 2,880,000 | | 3,158,398 |
6.421% 06/20/16 | | 4,265,000 | | 4,738,078 |
| | |
| Verizon Communications, Inc. | | | | |
6.250% 04/01/37 | | 1,825,000 | | 1,849,588 |
| | |
| Virgin Media Finance PLC | | | | |
9.500% 08/15/16 | | 890,000 | | 972,325 |
| | |
| West Corp. | | | | |
11.000% 10/15/16 | | 450,000 | | 477,000 |
| | |
| Wind Acquisition Finance SA | | | | |
11.750% 07/15/17 (b) | | 951,000 | | 1,050,855 |
11.750% 07/15/17 (b) | | EUR 380,000 | | 569,704 |
| | |
| Windstream Corp. | | | | |
8.625% 08/01/16 | | 565,000 | | 577,713 |
| | | | |
Telecommunication Services Total | | 40,342,245 |
| | | | |
Communications Total | | | | 79,665,378 |
| | | | |
| Consumer Cyclical – 2.2% | | |
| Airlines – 0.3% | | | | |
| American Airlines, Inc. | | | | |
10.500% 10/15/12 (b) | | 400,000 | | 426,000 |
| | |
| Continental Airlines, Inc. | | | | |
6.940% 10/15/13 | | 473,072 | | 484,899 |
7.461% 04/01/15 | | 4,554,838 | | 4,497,902 |
| | | | |
Airlines Total | | | | 5,408,801 |
| | |
| Apparel – 0.0% | | | | |
| Levi Strauss & Co. | | | | |
9.750% 01/15/15 | | 40,000 | | 41,900 |
| | | | |
Apparel Total | | | | 41,900 |
| | |
| Auto Manufacturers – 0.1% | | | | |
| General Motors Corp. | | | | |
7.200% 01/15/11 (g) | | 735,000 | | 270,113 |
8.375% 07/15/33 (g) | | 1,320,000 | | 495,000 |
| | |
| Navistar International Corp. | | | | |
8.250% 11/01/21 | | 305,000 | | 311,100 |
| | | | |
Auto Manufacturers Total | | | | 1,076,213 |
| | |
| Auto Parts & Equipment – 0.1% | | | | |
| Goodyear Tire & Rubber Co. | | | | |
10.500% 05/15/16 | | 845,000 | | 912,600 |
| | |
| Lear Corp. | | | | |
7.875% 03/15/18 | | 65,000 | | 65,731 |
8.125% 03/15/20 | | 65,000 | | 66,056 |
| | | | |
| | | Par ($) (a) | | Value ($) |
| TRW Automotive, Inc. | | | | |
7.000% 03/15/14 (b) | | 495,000 | | 487,575 |
| | | | |
Auto Parts & Equipment Total | | 1,531,962 |
| | |
| Distribution/Wholesale – 0.0% | | | | |
| McJunkin Red Man Corp. | | | | |
9.500% 12/15/16 (b) | | 335,000 | | 342,119 |
| | | | |
Distribution/Wholesale Total | | 342,119 |
| | |
| Entertainment – 0.1% | | | | |
| American Casino & Entertainment Properties LLC | | |
11.000% 06/15/14 | | 190,000 | | 178,125 |
| | |
| Boyd Gaming Corp. | | | | |
6.750% 04/15/14 | | 425,000 | | 370,812 |
7.125% 02/01/16 | | 170,000 | | 141,950 |
| | |
| Jacobs Entertainment, Inc. | | | | |
9.750% 06/15/14 | | 555,000 | | 521,700 |
| | |
| Mohegan Tribal Gaming Authority | | | | |
11.500% 11/01/17 (b) | | 535,000 | | 569,775 |
| | |
| Six Flags, Inc. | | | | |
9.625% 06/01/14 (g) | | 287,000 | | 90,405 |
| | |
| WMG Acquisition Corp. | | | | |
7.375% 04/15/14 | | 580,000 | | 556,800 |
| | |
| WMG Holdings Corp. | | | | |
9.500%(f) 12/15/14 | | 540,000 | | 544,050 |
| | | | |
Entertainment Total | | | | 2,973,617 |
| | |
| Home Builders – 0.1% | | | | |
| D.R. Horton, Inc. | | | | |
5.625% 09/15/14 | | 960,000 | | 950,400 |
| | |
| KB Home | | | | |
5.875% 01/15/15 | | 540,000 | | 511,650 |
| | |
| Ryland Group, Inc. | | | | |
8.400% 05/15/17 | | 315,000 | | 342,562 |
| | |
| Standard Pacific Corp. | | | | |
7.000% 08/15/15 | | 635,000 | | 587,375 |
| | | | |
Home Builders Total | | | | 2,391,987 |
| |
| Leisure Time – 0.0% | | |
| Royal Caribbean Cruises Ltd. | | |
7.500% 10/15/27 | | 705,000 | | 622,163 |
| | | | |
Leisure Time Total | | | | 622,163 |
| |
| Lodging – 0.2% | | |
| Harrah’s Operating Co., Inc. | | |
10.000% 12/15/18 | | 577,000 | | 477,468 |
11.250% 06/01/17 | | 585,000 | | 630,337 |
See Accompanying Notes to Financial Statements.
10
Columbia Intermediate Bond Fund
March 31, 2010
Corporate Fixed-Income Bonds & Notes (continued)
| | | | |
| | | Par ($) (a) | | Value ($) |
| Consumer Cyclical (continued) | | |
| Host Hotels & Resorts LP | | | | |
6.750% 06/01/16 | | 605,000 | | 606,513 |
| |
| Mashantucket Western Pequot Tribe | | |
8.500% 11/15/15 (b)(h) | | 1,395,000 | | 348,750 |
| | |
| MGM Mirage | | | | |
6.750% 09/01/12 | | 590,000 | | 557,550 |
| | |
| Seminole Indian Tribe of Florida | | | | |
7.804% 10/01/20 (b) | | 540,000 | | 503,312 |
| |
| Snoqualmie Entertainment Authority | | |
9.125% 02/01/15 (b) | | 640,000 | | 492,800 |
| |
| Starwood Hotels & Resorts Worldwide, Inc. | | |
6.750% 05/15/18 | | 150,000 | | 150,375 |
| | | | |
Lodging Total | | | | 3,767,105 |
| | |
| Retail – 1.3% | | | | |
| AmeriGas Partners LP | | | | |
7.250% 05/20/15 | | 335,000 | | 340,025 |
| | |
| CVS Pass Through Trust | | | | |
8.353% 07/10/31 (b) | | 9,029,625 | | 10,486,464 |
| | |
| CVS Pass-Through Trust | | | | |
5.298% 01/11/27 (b) | | 5,041,970 | | 4,798,182 |
6.036% 12/10/28 | | 4,524,150 | | 4,474,520 |
| | |
| Dollar General Corp. | | | | |
10.625% 07/15/15 | | 540,000 | | 592,650 |
| | |
| General Nutrition Centers, Inc. | | | | |
PIK, | | | | |
4.893% 03/15/14 (09/15/10) (c)(d) | | 230,000 | | 217,637 |
| | |
| Inergy LP/Inergy Finance Corp. | | | | |
8.250% 03/01/16 | | 380,000 | | 391,400 |
8.750% 03/01/15 | | 525,000 | | 549,281 |
| | |
| Landry’s Restaurants, Inc. | | | | |
11.625% 12/01/15 (b) | | 390,000 | | 419,250 |
| | |
| Limited Brands, Inc. | | | | |
8.500% 06/15/19 | | 445,000 | | 496,175 |
| | |
| Macy’s Retail Holdings, Inc. | | | | |
5.350% 03/15/12 | | 1,250,000 | | 1,312,500 |
| | |
| McDonald’s Corp. | | | | |
5.000% 02/01/19 | | 1,250,000 | | 1,311,714 |
5.700% 02/01/39 | | 2,975,000 | | 2,962,205 |
| | |
| Rite Aid Corp. | | | | |
9.500% 06/15/17 | | 470,000 | | 394,800 |
| | | | |
| | | Par ($) (a) | | Value ($) |
| Toys R US, Inc. | | | | |
7.375% 10/15/18 | | 700,000 | | 672,000 |
| | | | |
Retail Total | | | | 29,418,803 |
| | |
| Storage/Warehousing – 0.0% | | | | |
| Niska Gas Storage U.S. LLC/Niska Gas Storage Canada ULC | | |
8.875% 03/15/18 (b) | | 315,000 | | 322,088 |
| | | | |
Storage/Warehousing Total | | | | 322,088 |
| | | | |
Consumer Cyclical Total | | | | 47,896,758 |
| | | | |
| Consumer Non-Cyclical – 4.3% | | |
| Beverages – 1.0% | | | | |
| Anheuser-Busch InBev Worldwide, Inc. | | |
7.200% 01/15/14 (b) | | 4,725,000 | | 5,413,092 |
7.750% 01/15/19 (b) | | 8,560,000 | | 10,181,110 |
8.000% 11/15/39 (b) | | 5,235,000 | | 6,624,217 |
| | | | |
Beverages Total | | | | 22,218,419 |
| | |
| Commercial Services – 0.2% | | | | |
| ACE Cash Express, Inc. | | | | |
10.250% 10/01/14 (b) | | 280,000 | | 230,300 |
| | |
| ARAMARK Corp. | | | | |
8.500% 02/01/15 | | 645,000 | | 659,513 |
| | |
| Ashtead Holdings PLC | | | | |
8.625% 08/01/15 (b) | | 470,000 | | 470,000 |
| | |
| Corrections Corp. of America | | | | |
6.250% 03/15/13 | | 440,000 | | 446,050 |
| | |
| Iron Mountain, Inc. | | | | |
8.000% 06/15/20 | | 250,000 | | 256,250 |
| | |
| Rental Service Corp. | | | | |
9.500% 12/01/14 | | 775,000 | | 767,250 |
| | |
| Service Corp. International | | | | |
7.000% 06/15/17 | | 750,000 | | 735,000 |
| | | | |
Commercial Services Total | | | | 3,564,363 |
| |
| Cosmetics/Personal Care – 0.0% | | |
| Revlon Consumer Products Corp. | | |
9.750% 11/15/15 (b) | | 130,000 | | 134,225 |
| | | | |
Cosmetics/Personal Care Total | | | | 134,225 |
| | |
| Food – 1.7% | | | | |
| Campbell Soup Co. | | | | |
4.500% 02/15/19 | | 4,885,000 | | 4,970,527 |
| | |
| ConAgra Foods, Inc. | | | | |
7.000% 10/01/28 | | 9,295,000 | | 10,138,642 |
See Accompanying Notes to Financial Statements.
11
Columbia Intermediate Bond Fund
March 31, 2010
Corporate Fixed-Income Bonds & Notes (continued)
| | | | |
| | | Par ($) (a) | | Value ($) |
| Consumer Non-Cyclical (continued) | | |
| JBS USA LLC/JBS USA Finance, Inc. | | |
11.625% 05/01/14 (b) | | 575,000 | | 655,500 |
| | |
| Kraft Foods, Inc. | | | | |
6.500% 02/09/40 | | 17,070,000 | | 17,689,317 |
| | |
| Kroger Co. | | | | |
8.000% 09/15/29 | | 1,270,000 | | 1,547,463 |
| | |
| New Albertsons, Inc. | | | | |
8.000% 05/01/31 | | 575,000 | | 494,500 |
| | |
| Pinnacle Foods Finance LLC | | | | |
9.250% 04/01/15 | | 515,000 | | 527,875 |
9.250% 04/01/15 (b) | | 260,000 | | 266,500 |
| | |
| Smithfield Foods, Inc. | | | | |
10.000% 07/15/14 (b) | | 815,000 | | 908,725 |
| | | | |
Food Total | | | | 37,199,049 |
| | |
| Healthcare Products – 0.1% | | | | |
| Biomet, Inc. | | | | |
PIK, | | | | |
10.375% 10/15/17 | | 1,375,000 | | 1,512,500 |
| | | | |
Healthcare Products Total | | | | 1,512,500 |
| | |
| Healthcare Services – 0.7% | | | | |
| Community Health Systems, Inc. | | | | |
8.875% 07/15/15 | | 845,000 | | 874,575 |
| | |
| DaVita, Inc. | | | | |
7.250% 03/15/15 | | 445,000 | | 453,900 |
| | |
| HCA, Inc. | | | | |
9.250% 11/15/16 | | 30,000 | | 31,894 |
PIK, | | | | |
9.625% 11/15/16 | | 2,696,000 | | 2,888,090 |
| | |
| Health Net, Inc. | | | | |
6.375% 06/01/17 | | 755,000 | | 702,150 |
| | |
| Healthsouth Corp. | | | | |
8.125% 02/15/20 | | 150,000 | | 149,250 |
10.750% 06/15/16 | | 440,000 | | 475,750 |
| | |
| Roche Holdings, Inc. | | | | |
6.000% 03/01/19 (b) | | 4,150,000 | | 4,586,269 |
| | |
| U.S. Oncology Holdings, Inc. | | | | |
PIK, | | | | |
6.643% 03/15/12 (09/15/10) (c)(d) | | 644,000 | | 608,211 |
| | |
| U.S. Oncology, Inc. | | | | |
9.125% 08/15/17 | | 490,000 | | 512,050 |
| | | | |
| | | Par ($) (a) | | Value ($) |
| WellPoint, Inc. | | | | |
7.000% 02/15/19 | | 4,150,000 | | 4,706,042 |
| | | | |
Healthcare Services Total | | 15,988,181 |
| |
| Household Products/Wares – 0.0% | | |
| American Greetings Corp. | | |
7.375% 06/01/16 | | 460,000 | | 458,850 |
| | | | |
Household Products/Wares Total | | 458,850 |
| | |
| Pharmaceuticals – 0.6% | | | | |
| Abbott Laboratories | | | | |
5.600% 05/15/11 | | 1,000,000 | | 1,050,921 |
| | |
| Elan Finance PLC | | | | |
4.250% 11/15/11 (05/15/10) (c)(d) | | 205,000 | | 201,413 |
8.875% 12/01/13 | | 310,000 | | 319,300 |
| |
| Novartis Securities Investment Ltd. | | |
5.125% 02/10/19 | | 6,545,000 | | 6,936,921 |
| | |
| Omnicare, Inc. | | | | |
6.750% 12/15/13 | | 410,000 | | 412,050 |
6.875% 12/15/15 | | 85,000 | | 83,406 |
| | |
| Valeant Pharmaceuticals International | | | | |
8.375% 06/15/16 (b) | | 620,000 | | 647,900 |
| | |
| Wyeth | | | | |
5.500% 02/01/14 | | 1,640,000 | | 1,809,169 |
5.500% 02/15/16 | | 2,485,000 | | 2,772,030 |
| | | | |
Pharmaceuticals Total | | | | 14,233,110 |
| | | | |
Consumer Non-Cyclical Total | | 95,308,697 |
| | |
| Diversified – 0.0% | | | | |
| Diversified Holding Companies – 0.0% | | |
Reynolds Group Issuer, Inc./Reynolds
Group Issuer LLC | | |
7.750% 10/15/16 (b) | | 300,000 | | 308,250 |
| | | | |
Diversified Holding Companies Total | | 308,250 |
| | | | |
Diversified Total | | | | 308,250 |
| | | | |
| Energy – 5.2% | | | | |
| Coal – 0.1% | | | | |
| Arch Western Finance LLC | | | | |
6.750% 07/01/13 | | 560,000 | | 562,100 |
| |
| Cloud Peak Energy Resources LLC/Cloud Peak Energy Finance Corp. | | |
8.500% 12/15/19 (b) | | 275,000 | | 281,875 |
See Accompanying Notes to Financial Statements.
12
Columbia Intermediate Bond Fund
March 31, 2010
Corporate Fixed-Income Bonds & Notes (continued)
| | | | |
| | | Par ($) (a) | | Value ($) |
| Energy (continued) | | | | |
| Massey Energy Co. | | | | |
6.875% 12/15/13 | | 715,000 | | 724,831 |
| | | | |
Coal Total | | | | 1,568,806 |
| | |
| Energy-Alternate Sources – 0.0% | | | | |
| Headwaters, Inc. | | | | |
11.375% 11/01/14 (b) | | 535,000 | | 558,406 |
| | | | |
Energy-Alternate Sources Total | | | | 558,406 |
| | |
| Oil & Gas – 2.3% | | | | |
| Antero Resources Finance Corp. | | | | |
9.375% 12/01/17 (b) | | 385,000 | | 396,550 |
| | |
| Chaparral Energy, Inc. | | | | |
8.875% 02/01/17 | | 395,000 | | 361,425 |
| | |
| Cimarex Energy Co. | | | | |
7.125% 05/01/17 | | 770,000 | | 785,400 |
| | |
| Coffeyville Resources LLC | | | | |
10.875% 04/01/17 (b)(i) | | 445,000 | | 441,663 |
| | |
| Connacher Oil & Gas Ltd. | | | | |
11.750% 07/15/14 (b) | | 760,000 | | 839,800 |
| | |
| Devon Energy Corp. | | | | |
6.300% 01/15/19 | | 2,675,000 | | 2,985,744 |
| | |
| Forest Oil Corp. | | | | |
8.500% 02/15/14 | | 435,000 | | 458,925 |
| | |
| Frontier Oil Corp. | | | | |
8.500% 09/15/16 | | 440,000 | | 451,000 |
| | |
| Gazprom International SA | | | | |
7.201% 02/01/20 (b) | | 3,830,511 | | 4,069,918 |
| | |
| Hess Corp. | | | | |
7.300% 08/15/31 | | 3,475,000 | | 3,959,731 |
| |
| Linn Energy LLC/Linn Energy Finance Corp. | | |
8.625% 04/15/20 (b) | | 75,000 | | 75,094 |
| | |
| Marathon Oil Corp. | | | | |
7.500% 02/15/19 | | 975,000 | | 1,145,239 |
| | |
| Newfield Exploration Co. | | | | |
6.625% 04/15/16 | | 545,000 | | 554,537 |
| | |
| OPTI Canada, Inc. | | | | |
8.250% 12/15/14 | | 925,000 | | 869,500 |
| | |
| Penn Virginia Corp. | | | | |
10.375% 06/15/16 | | 435,000 | | 471,975 |
| | |
| PetroHawk Energy Corp. | | | | |
7.875% 06/01/15 | | 555,000 | | 565,406 |
| | | | |
| | | Par ($) (a) | | Value ($) |
| Qatar Petroleum | | | | |
5.579% 05/30/11 (b) | | 818,497 | | 840,798 |
| | |
| Quicksilver Resources, Inc. | | | | |
7.125% 04/01/16 | | 535,000 | | 508,250 |
| | |
| Range Resources Corp. | | | | |
7.500% 05/15/16 | | 315,000 | | 324,450 |
| |
| Ras Laffan Liquefied Natural Gas Co., Ltd. II | | |
5.298% 09/30/20 (b) | | 3,400,000 | | 3,497,580 |
| |
| Ras Laffan Liquefied Natural Gas Co., Ltd. III | | |
5.832% 09/30/16 (b) | | 2,230,000 | | 2,379,142 |
| | |
| Shell International Finance BV | | | | |
5.500% 03/25/40 | | 8,265,000 | | 8,101,915 |
| | |
| Southwestern Energy Co. | | | | |
7.500% 02/01/18 | | 250,000 | | 271,250 |
| | |
| Talisman Energy, Inc. | | | | |
5.850% 02/01/37 | | 4,150,000 | | 3,978,095 |
7.750% 06/01/19 | | 9,309,000 | | 11,092,139 |
| | |
| Tesoro Corp. | | | | |
6.625% 11/01/15 | | 730,000 | | 698,975 |
| | |
| United Refining Co. | | | | |
10.500% 08/15/12 | | 435,000 | | 415,425 |
| | | | |
Oil & Gas Total | | | | 50,539,926 |
| | |
| Oil & Gas Services – 0.4% | | | | |
| Weatherford International Ltd. | | | | |
7.000% 03/15/38 | | 8,415,000 | | 8,897,163 |
| | | | |
Oil & Gas Services Total | | | | 8,897,163 |
| | |
| Pipelines – 2.4% | | | | |
| Atlas Pipeline Partners LP | | | | |
8.125% 12/15/15 | | 610,000 | | 588,650 |
| | |
| El Paso Corp. | | | | |
6.875% 06/15/14 | | 805,000 | | 821,424 |
| | |
| Enbridge Energy Partners LP | | | | |
7.500% 04/15/38 | | 4,605,000 | | 5,391,184 |
| |
| Kinder Morgan Energy Partners LP | | |
5.625% 02/15/15 | | 3,225,000 | | 3,497,090 |
6.500% 09/01/39 | | 6,010,000 | | 6,177,697 |
6.950% 01/15/38 | | 3,295,000 | | 3,569,246 |
| | |
| MarkWest Energy Partners LP | | | | |
6.875% 11/01/14 | | 190,000 | | 186,200 |
8.500% 07/15/16 | | 820,000 | | 833,325 |
See Accompanying Notes to Financial Statements.
13
Columbia Intermediate Bond Fund
March 31, 2010
Corporate Fixed-Income Bonds & Notes (continued)
| | | | |
| | | Par ($) (a) | | Value ($) |
| Energy (continued) | | | | |
| ONEOK Partners LP | | | | |
6.850% 10/15/37 | | 2,205,000 | | 2,357,405 |
| |
| Plains All American Pipeline LP/PAA Finance Corp. | | |
6.650% 01/15/37 | | 2,840,000 | | 2,944,910 |
| | |
| TransCanada Pipelines Ltd. | | | | |
6.350% 05/15/67 (05/15/17) (c)(d) | | 10,470,000 | | 9,962,153 |
| | |
| Williams Companies, Inc. | | | | |
7.875% 09/01/21 | | 170,000 | | 200,161 |
| | |
| Williams Partners LP | | | | |
6.300% 04/15/40 (b) | | 16,490,000 | | 16,386,212 |
| | | | |
Pipelines Total | | | | 52,915,657 |
| | | | |
Energy Total | | | | 114,479,958 |
| | | | |
| Financials – 18.3% | | | | |
| Banks – 10.2% | | | | |
| Bank of New York Mellon Corp. | | | | |
5.450% 05/15/19 | | 7,485,000 | | 7,938,164 |
| | |
| Barclays Bank PLC | | | | |
7.375% 06/29/49 (12/01/11) (b)(c)(d) | | 2,645,000 | | 2,552,425 |
| | |
| Capital One Capital IV | | | | |
6.745% 02/17/37 (c) | | 9,050,000 | | 7,805,625 |
| | |
| Capital One Capital V | | | | |
10.250% 08/15/39 | | 12,185,000 | | 14,435,387 |
| | |
| Chinatrust Commercial Bank | | | | |
5.625% 03/29/49 (03/17/15) (b)(c)(d) | | 2,350,000 | | 2,169,638 |
| | |
| CIT Group, Inc. | | | | |
7.000% 05/01/17 | | 1,675,000 | | 1,545,188 |
| | |
| Citigroup, Inc. | | | | |
8.125% 07/15/39 | | 13,775,000 | | 15,901,901 |
| | |
| Comerica Bank | | | | |
0.337% 06/30/10 (04/30/10) (c)(d) | | 2,000,000 | | 1,999,010 |
5.200% 08/22/17 | | 5,150,000 | | 4,995,809 |
5.750% 11/21/16 | | 1,660,000 | | 1,708,703 |
| | |
| Discover Bank/Greenwood DE | | | | |
8.700% 11/18/19 | | 2,380,000 | | 2,606,747 |
| | |
| Discover Financial Services | | | | |
10.250% 07/15/19 | | 2,940,000 | | 3,497,894 |
| | | | |
| | | Par ($) (a) | | Value ($) |
| Fifth Third Bank/Ohio | | | | |
0.360% 05/17/13 (05/17/10) (c)(d) | | 2,140,000 | | 1,998,606 |
| | |
| HSBC Capital Funding LP | | | | |
9.547% 12/29/49 (b)(c) | | 10,500,000 | | 10,631,250 |
| | |
| JPMorgan Chase & Co. | | | | |
7.900% 04/29/49 (04/30/18) (c)(d) | | 13,470,000 | | 14,360,367 |
| | |
| JPMorgan Chase Capital XVII | | | | |
5.850% 08/01/35 | | 6,550,000 | | 5,899,153 |
| | |
| JPMorgan Chase Capital XX | | | | |
6.550% 09/29/36 | | 6,550,000 | | 6,146,651 |
| | |
| JPMorgan Chase Capital XXIII | | | | |
1.250% 05/15/47 (05/17/10) (c)(d) | | 6,170,000 | | 4,630,418 |
| | |
| KeyBank NA | | | | |
5.800% 07/01/14 | | 4,054,000 | | 4,146,192 |
| | |
| Keycorp | | | | |
6.500% 05/14/13 | | 18,495,000 | | 19,750,977 |
| | |
| Lloyds TSB Bank PLC | | | | |
4.375% 01/12/15 (b) | | 16,750,000 | | 16,511,848 |
| | |
| Lloyds TSB Group PLC | | | | |
6.267% 12/31/49 (b) | | 2,930,000 | | 1,736,025 |
| | |
| M&I Marshall & Ilsley Bank | | | | |
5.300% 09/08/11 | | 1,759,000 | | 1,754,812 |
| | |
| Merrill Lynch & Co., Inc. | | | | |
5.700% 05/02/17 (j) | | 6,940,000 | | 6,898,325 |
6.050% 08/15/12 (j) | | 1,500,000 | | 1,602,008 |
7.750% 05/14/38 (j) | | 5,160,000 | | 5,719,710 |
| | |
| National City Bank of Cleveland | | | | |
6.200% 12/15/11 | | 1,590,000 | | 1,713,673 |
| | |
| National City Bank of Kentucky | | | | |
6.300% 02/15/11 | | 2,830,000 | | 2,908,575 |
| | |
| National City Corp. | | | | |
6.875% 05/15/19 | | 2,535,000 | | 2,816,737 |
| | |
| Northern Trust Co. | | | | |
6.500% 08/15/18 | | 6,370,000 | | 7,127,686 |
| | |
| PNC Funding Corp. | | | | |
3.625% 02/08/15 | | 3,220,000 | | 3,239,291 |
5.125% 02/08/20 | | 4,920,000 | | 4,956,123 |
| | |
| Regions Financial Corp. | | | | |
7.000% 03/01/11 | | 7,806,000 | | 7,864,779 |
| | |
| USB Capital IX | | | | |
6.189% 04/15/42 (c) | | 25,865,000 | | 22,114,575 |
See Accompanying Notes to Financial Statements.
14
Columbia Intermediate Bond Fund
March 31, 2010
Corporate Fixed-Income Bonds & Notes (continued)
| | | | |
| | | Par ($) (a) | | Value ($) |
| Financials (continued) | | | | |
| Wachovia Corp. | | | | |
5.750% 02/01/18 | | 1,175,000 | | 1,249,111 |
| | |
| Zions Bancorporation | | | | |
7.750% 09/23/14 | | 395,000 | | 398,405 |
| | | | |
Banks Total | | | | 223,331,788 |
| | | | |
| |
| Diversified Financial Services – 2.4% | | |
| American General Finance Corp. | | | | |
6.900% 12/15/17 | | 255,000 | | 223,357 |
| | |
| Cemex Finance LLC | | | | |
9.500% 12/14/16 (b) | | 460,000 | | 476,100 |
| | |
| E*Trade Financial Corp. | | | | |
PIK, 12.500% 11/30/17 | | 371,000 | | 427,758 |
| | |
| Eaton Vance Corp. | | | | |
6.500% 10/02/17 | | 7,890,000 | | 8,496,907 |
| | |
| Ford Motor Credit Co. | | | | |
7.800% 06/01/12 | | 1,815,000 | | 1,882,456 |
| | |
| Ford Motor Credit Co., LLC | | | | |
8.000% 12/15/16 | | 725,000 | | 763,877 |
| | |
| Fund American Companies, Inc. | | | | |
5.875% 05/15/13 | | 4,535,000 | | 4,667,499 |
| | |
| General Electric Capital Corp. | | | | |
5.500% 01/08/20 | | 5,690,000 | | 5,805,308 |
| | |
| GMAC, Inc. | | | | |
6.875% 09/15/11 | | 835,000 | | 848,569 |
8.000% 11/01/31 | | 663,000 | | 633,165 |
| |
| International Lease Finance Corp. | | |
4.875% 09/01/10 | | 15,907,000 | | 15,906,857 |
| | |
| Lehman Brothers Holdings, Inc. | | | | |
5.625% 01/24/13 (e)(g) | | 36,760,000 | | 8,684,550 |
6.875% 05/02/18 (e)(g) | | 1,685,000 | | 398,081 |
| | |
| Nuveen Investments, Inc. | | | | |
10.500% 11/15/15 | | 810,000 | | 785,700 |
| |
| PF Export Receivables Master Trust | | |
3.748% 06/01/13 (b) | | 1,325,188 | | 1,300,723 |
| |
| Reliance Intermediate Holdings LP | | |
9.500% 12/15/19 (b) | | 445,000 | | 470,587 |
| | |
| SLM Corp. | | | | |
8.000% 03/25/20 | | 765,000 | | 744,925 |
| | | | |
Diversified Financial Services Total | | 52,516,419 |
| | | | |
| | | Par ($) (a) | | Value ($) |
| Insurance – 4.6% | | | | |
| Asurion Corp. | | | | |
6.730% 07/02/15 (04/12/10) (c)(d)(k) | | 342,155 | | 337,664 |
6.730% 07/02/15 (04/12/10) (c)(d)(k) | | 467,845 | | 463,556 |
| |
| Berkshire Hathaway Finance Corp. | | |
4.850% 01/15/15 | | 5,000,000 | | 5,374,550 |
| | |
| CNA Financial Corp. | | | | |
5.850% 12/15/14 | | 2,444,000 | | 2,486,909 |
7.350% 11/15/19 | | 4,796,000 | | 5,012,439 |
| | |
| Crum & Forster Holdings Corp. | | | | |
7.750% 05/01/17 | | 630,000 | | 623,700 |
| | |
| HUB International Holdings, Inc. | | | | |
10.250% 06/15/15 (b) | | 440,000 | | 421,300 |
| | |
| ING Groep NV | | | | |
5.775% 12/29/49 (12/08/15) (c)(d) | | 10,180,000 | | 8,668,270 |
| | |
| Liberty Mutual Group, Inc. | | | | |
7.500% 08/15/36 (b) | | 6,805,000 | | 6,562,409 |
10.750% 06/15/58 (b)(c) | | 7,985,000 | | 8,943,200 |
| | |
| MetLife Capital Trust X | | | | |
9.250% 04/08/38 (b)(c) | | 12,255,000 | | 13,786,875 |
| | |
| MetLife, Inc. | | | | |
10.750% 08/01/39 | | 9,500,000 | | 12,245,044 |
| | |
| Provident Companies, Inc. | | | | |
7.000% 07/15/18 | | 190,000 | | 193,754 |
| | |
| Prudential Financial, Inc. | | | | |
4.750% 06/13/15 | | 3,210,000 | | 3,298,423 |
8.875% 06/15/38 (06/15/18) (c)(d) | | 16,110,000 | | 18,083,475 |
| | |
| Transatlantic Holdings, Inc. | | | | |
8.000% 11/30/39 | | 7,905,000 | | 8,078,973 |
| | |
| Unum Group | | | | |
7.125% 09/30/16 | | 6,335,000 | | 6,886,373 |
| | |
| USI Holdings Corp. | | | | |
9.750% 05/15/15 (b) | | 325,000 | | 307,125 |
| | | | |
Insurance Total | | | | 101,774,039 |
|
| Real Estate Investment Trusts (REITs) – 1.1% |
| Brandywine Operating Partnership LP | | |
7.500% 05/15/15 | | 5,705,000 | | 6,138,963 |
See Accompanying Notes to Financial Statements.
15
Columbia Intermediate Bond Fund
March 31, 2010
Corporate Fixed-Income Bonds & Notes (continued)
| | | | |
| | | Par ($) (a) | | Value ($) |
| Financials (continued) | | | | |
| Duke Realty LP | | | | |
7.375% 02/15/15 | | 3,020,000 | | 3,261,328 |
8.250% 08/15/19 | | 7,855,000 | | 8,760,595 |
| |
| Health Care Property Investors, Inc. | | |
5.625% 05/01/17 | | 3,765,000 | | 3,671,658 |
| | |
| Highwoods Properties, Inc. | | | | |
5.850% 03/15/17 | | 2,005,000 | | 1,916,431 |
| | | | |
Real Estate Investment Trusts (REITs) Total | | 23,748,975 |
| | |
| Savings & Loans – 0.0% | | | | |
| Washington Mutual Bank | | | | |
5.125% 01/15/15 (h) | | 20,444,000 | | 127,775 |
| |
| Washington Mutual Preferred Funding Delaware | | |
6.534% 03/29/49 (03/15/11) (b)(c)(d)(h) | | 2,725,000 | | 78,344 |
| | | | |
Savings & Loans Total | | | | 206,119 |
| | | | |
Financials Total | | | | 401,577,340 |
| | | | |
| Industrials – 2.4% | | | | |
| Aerospace & Defense – 0.6% | | | | |
| BE Aerospace, Inc. | | | | |
8.500% 07/01/18 | | 630,000 | | 672,525 |
| | |
| Embraer Overseas Ltd. | | | | |
6.375% 01/15/20 | | 7,400,000 | | 7,529,500 |
| | |
| L-3 Communications Corp. | | | | |
6.375% 10/15/15 | | 660,000 | | 677,325 |
| | |
| Raytheon Co. | | | | |
5.500% 11/15/12 | | 800,000 | | 881,251 |
7.200% 08/15/27 | | 1,730,000 | | 2,035,143 |
| | |
| Sequa Corp. | | | | |
11.750% 12/01/15 (b) | | 600,000 | | 600,000 |
| | |
| Systems 2001 Asset Trust | | | | |
6.664% 09/15/13 (b) | | 1,253,362 | | 1,326,772 |
| | | | |
Aerospace & Defense Total | | | | 13,722,516 |
| | |
| Air Transportation – 0.1% | | | | |
| Air 2 US | | | | |
8.027% 10/01/19 (b) | | 1,890,688 | | 1,604,722 |
| | | | |
Air Transportation Total | | | | 1,604,722 |
| | |
| Building Materials – 0.1% | | | | |
| Building Materials Corp. of America | | |
7.500% 03/15/20 (b) | | 135,000 | | 134,663 |
| | | | |
| | | Par ($) (a) | | Value ($) |
| Nortek, Inc. | | | | |
11.000% 12/01/13 | | 366,622 | | 393,202 |
| | |
| Texas Industries, Inc. | | | | |
7.250% 07/15/13 | | 455,000 | | 447,037 |
| | | | |
Building Materials Total | | | | 974,902 |
| |
| Electrical Components & Equipment – 0.1% | | |
| Belden, Inc. | | | | |
7.000% 03/15/17 | | 785,000 | | 773,225 |
| | |
| General Cable Corp. | | | | |
7.125% 04/01/17 | | 715,000 | | 708,744 |
| | | | |
Electrical Components & Equipment Total | | 1,481,969 |
| |
| Engineering & Construction – 0.0% | | |
| Esco Corp. | | | | |
8.625% 12/15/13 (b) | | 380,000 | | 381,900 |
| | | | |
Engineering & Construction Total | | 381,900 |
| |
| Environmental Control – 0.0% | | |
| Clean Harbors, Inc. | | | | |
7.625% 08/15/16 | | 455,000 | | 461,825 |
| | | | |
Environmental Control Total | | | | 461,825 |
| |
| Machinery-Construction & Mining – 0.0% | | |
| Terex Corp. | | | | |
8.000% 11/15/17 | | 780,000 | | 758,550 |
| | | | |
Machinery-Construction & Mining Total | | 758,550 |
| | |
| Machinery-Diversified – 0.0% | | | | |
| CPM Holdings, Inc. | | | | |
10.625% 09/01/14 (b) | | 385,000 | | 410,025 |
| | |
| Manitowoc Co., Inc. | | | | |
7.125% 11/01/13 | | 520,000 | | 518,700 |
| | | | |
Machinery-Diversified Total | | | | 928,725 |
| |
| Miscellaneous Manufacturing – 0.2% | | |
| American Railcar Industries, Inc. | | | | |
7.500% 03/01/14 | | 330,000 | | 315,150 |
| | |
| Bombardier, Inc. | | | | |
6.300% 05/01/14 (b) | | 125,000 | | 129,688 |
| |
| Colt Defense LLC/Colt Finance Corp. | | |
8.750% 11/15/17 (b) | | 465,000 | | 466,162 |
| | |
| Reddy Ice Corp. | | | | |
13.250% 11/01/15 (b) | | 341,000 | | 350,377 |
| | |
| Trimas Corp. | | | | |
9.750% 12/15/17 (b) | | 590,000 | | 610,650 |
See Accompanying Notes to Financial Statements.
16
Columbia Intermediate Bond Fund
March 31, 2010
Corporate Fixed-Income Bonds & Notes (continued)
| | | | |
| | | Par ($) (a) | | Value ($) |
| Industrials (continued) | | | | |
| Tyco International Ltd./Tyco International Finance SA | | |
6.875% 01/15/21 | | 2,635,000 | | 3,011,012 |
| | | | |
Miscellaneous Manufacturing Total | | 4,883,039 |
| | |
| Packaging & Containers – 0.2% | | | | |
| Berry Plastics Holding Corp. | | | | |
8.875% 09/15/14 | | 745,000 | | 727,306 |
| | |
| BWAY Corp. | | | | |
10.000% 04/15/14 (b) | | 475,000 | | 510,625 |
| |
| Crown Americas LLC & Crown Americas Capital Corp. | | |
7.750% 11/15/15 | | 240,000 | | 249,600 |
| |
| Crown Americas LLC & Crown Americas Capital Corp. II | | |
7.625% 05/15/17 (b) | | 315,000 | | 328,387 |
| |
| Graham Packaging Co., LP/GPC Capital Corp. I | | |
8.250% 01/01/17 (b) | | 235,000 | | 236,763 |
| |
| Graphic Packaging International, Inc. | | |
9.500% 06/15/17 | | 730,000 | | 779,275 |
| | |
| Solo Cup Co. | | | | |
8.500% 02/15/14 | | 780,000 | | 762,450 |
| | | | |
Packaging & Containers Total | | | | 3,594,406 |
| | |
| Transportation – 1.1% | | | | |
| BNSF Funding Trust I | | | | |
6.613% 12/15/55 (01/15/26) (c)(d) | | 4,401,000 | | 4,274,471 |
| | |
| Bristow Group, Inc. | | | | |
7.500% 09/15/17 | | 560,000 | | 565,600 |
| |
| Burlington Northern Santa Fe Corp. | | |
7.125% 12/15/10 | | 3,900,000 | | 4,075,317 |
7.950% 08/15/30 | | 2,375,000 | | 2,892,560 |
| |
| Kansas City Southern de Mexico SA de CV | | |
7.625% 12/01/13 | | 685,000 | | 700,412 |
| | |
| Navios Maritime Holdings, Inc. | | | | |
9.500% 12/15/14 | | 605,000 | | 609,538 |
| | |
| PHI, Inc. | | | | |
7.125% 04/15/13 | | 515,000 | | 500,194 |
| | |
| RailAmerica, Inc. | | | | |
9.250% 07/01/17 | | 261,000 | | 278,291 |
| |
| Ship Finance International Ltd. | | |
8.500% 12/15/13 | | 540,000 | | 534,600 |
| | | | |
| | | Par ($) (a) | | Value ($) |
| Stena AB | | | | |
7.500% 11/01/13 | | 535,000 | | 548,375 |
| | |
| Union Pacific Corp. | | | | |
5.700% 08/15/18 | | 4,770,000 | | 5,019,633 |
6.650% 01/15/11 | | 4,595,000 | | 4,792,548 |
| | | | |
Transportation Total | | | | 24,791,539 |
| | | | |
Industrials Total | | | | 53,584,093 |
| | | | |
| Technology – 0.8% | | | | |
| Computers – 0.1% | | | | |
| Seagate Technology International | | |
10.000% 05/01/14 (b) | | 265,000 | | 300,113 |
| |
| Sungard Data Systems, Inc. | | |
9.125% 08/15/13 | | 485,000 | | 497,125 |
| | | | |
Computers Total | | | | 797,238 |
| |
| Networking Products – 0.2% | | |
| Cisco Systems, Inc. | | | | |
5.900% 02/15/39 | | 4,710,000 | | 4,781,846 |
| | | | |
Networking Products Total | | 4,781,846 |
| | |
| Semiconductors – 0.0% | | | | |
| Amkor Technology, Inc. | | | | |
9.250% 06/01/16 | | 285,000 | | 300,675 |
| |
| Freescale Semiconductor, Inc. | | |
12.500% 12/15/14 (k) | | 442,642 | | 454,732 |
| | | | |
Semiconductors Total | | | | 755,407 |
| | |
| Software – 0.5% | | | | |
| Oracle Corp. | | | | |
4.950% 04/15/13 | | 2,500,000 | | 2,715,930 |
6.500% 04/15/38 | | 7,065,000 | | 7,798,199 |
| | | | |
Software Total | | | | 10,514,129 |
| | | | |
Technology Total | | | | 16,848,620 |
| | | | |
| Utilities – 4.3% | | | | |
| Electric – 3.5% | | | | |
| AES Corp. | | | | |
8.000% 10/15/17 | | 890,000 | | 903,350 |
| |
| American Electric Power Co., Inc. | | |
5.250% 06/01/15 | | 4,473,000 | | 4,782,339 |
| | |
| CMS Energy Corp. | | | | |
6.875% 12/15/15 | | 320,000 | | 341,059 |
| | |
| Commonwealth Edison Co. | | | | |
5.900% 03/15/36 | | 4,160,000 | | 4,222,558 |
5.950% 08/15/16 | | 6,495,000 | | 7,119,312 |
See Accompanying Notes to Financial Statements.
17
Columbia Intermediate Bond Fund
March 31, 2010
Corporate Fixed-Income Bonds & Notes (continued)
| | | | |
| | | Par ($) (a) | | Value ($) |
| Utilities (continued) | | | | |
6.150% 09/15/17 | | 500,000 | | 552,564 |
6.950% 07/15/18 | | 5,810,000 | | 6,410,893 |
| |
| Consolidated Edison Co. of New York, Inc. | | |
6.750% 04/01/38 | | 12,415,000 | | 14,005,970 |
| | |
| DTE Energy Co. | | | | |
7.625% 05/15/14 | | 4,025,000 | | 4,579,021 |
| | |
| Dynegy Holdings, Inc. | | | | |
7.750% 06/01/19 | | 405,000 | | 305,775 |
| | |
| Edison Mission Energy | | | | |
7.000% 05/15/17 | | 440,000 | | 306,900 |
| | |
| Energy Future Holdings Corp. | | | | |
10.000% 01/15/20 (b) | | 175,000 | | 182,437 |
| | |
| Exelon Generation Co. LLC | | | | |
6.200% 10/01/17 | | 370,000 | | 402,664 |
| | |
| FPL Energy American Wind LLC | | | | |
6.639% 06/20/23 (b) | | 2,801,533 | | 2,872,468 |
| | |
| FPL Energy National Wind LLC | | | | |
5.608% 03/10/24 (b) | | 566,776 | | 568,012 |
| | |
| Intergen NV | | | | |
9.000% 06/30/17 (b) | | 910,000 | | 937,300 |
| | |
| Ipalco Enterprises, Inc. | | | | |
7.250% 04/01/16 (b) | | 540,000 | | 560,250 |
| |
| MidAmerican Energy Holdings Co. | | |
5.875% 10/01/12 | | 1,765,000 | | 1,926,738 |
| |
| Mirant Americas Generation LLC | | |
8.500% 10/01/21 | | 1,030,000 | | 968,200 |
| | |
| Niagara Mohawk Power Corp. | | | | |
4.881% 08/15/19 (b) | | 5,745,000 | | 5,705,486 |
| | |
| NRG Energy, Inc. | | | | |
7.375% 02/01/16 | | 1,105,000 | | 1,096,712 |
| |
| NSG Holdings LLC/NSG Holdings, Inc. | | |
7.750% 12/15/25 (b) | | 875,000 | | 787,500 |
| | |
| Oglethorpe Power Corp. | | | | |
6.974% 06/30/11 | | 481,000 | | 483,145 |
| | |
| Oncor Electric Delivery Co. | | | | |
5.950% 09/01/13 | | 6,270,000 | | 6,847,116 |
| | |
| Southern California Edison Co. | | | | |
5.000% 01/15/16 | | 4,500,000 | | 4,871,961 |
| | |
| Southern Co. | | | | |
4.150% 05/15/14 | | 2,325,000 | | 2,426,649 |
| | | | |
| | | Par ($) (a) | | Value ($) |
| Tenaska Alabama II Partners LP | | |
6.125% 03/30/23 (b) | | 2,856,658 | | 2,833,091 |
| |
| Texas Competitive Electric Holdings Co. LLC | | |
10.250% 11/01/15 | | 415,000 | | 288,425 |
| | | | |
Electric Total | | | | 77,287,895 |
| | |
| Gas – 0.8% | | | | |
| Atmos Energy Corp. | | | | |
6.350% 06/15/17 | | 4,065,000 | | 4,371,644 |
8.500% 03/15/19 | | 5,910,000 | | 7,250,772 |
| | |
| Nakilat, Inc. | | | | |
6.067% 12/31/33 (b) | | 2,880,000 | | 2,621,059 |
| | |
| Sempra Energy | | | | |
6.500% 06/01/16 | | 2,490,000 | | 2,781,793 |
| | | | |
Gas Total | | | | 17,025,268 |
| | | | |
Utilities Total | | | | 94,313,163 |
Total Corporate Fixed-Income Bonds & Notes (cost of $933,689,988) | | 952,402,001 |
|
Commercial Mortgage-Backed Securities – 20.2% |
| Bear Stearns Commercial Mortgage Securities | | |
4.720% 11/11/35 (c) | | 5,300,000 | | 5,529,486 |
5.201% 12/11/38 | | 3,710,000 | | 3,708,571 |
5.422% 09/11/42 | | 7,768,205 | | 8,061,458 |
5.540% 09/11/41 | | 5,375,000 | | 5,534,166 |
5.719% 09/11/38 (04/01/10) (c)(d) | | 1,290,000 | | 1,347,486 |
5.742% 09/11/42 (04/01/10) (c)(d) | | 8,580,000 | | 8,837,089 |
| |
| Bear Stearns Commercial Mortgage Securities, Inc. | | |
6.480% 02/15/35 | | 7,044,672 | | 7,254,423 |
| |
| Chase Commercial Mortgage Securities Corp. | | |
5.857% 02/12/16 (04/01/10) (b)(c)(d) | | 9,000,000 | | 9,327,257 |
| |
| Citigroup Commercial Mortgage Trust | | |
5.413% 10/15/49 | | 5,750,000 | | 5,998,127 |
6.034% 12/10/49 | | 17,155,000 | | 18,053,064 |
| |
| Credit Suisse First Boston Mortgage Securities Corp. | | |
I.O., 1.068% 03/15/36 (04/01/10) (b)(c)(d) | | 41,428,311 | | 1,297 |
4.801% 03/15/36 | | 15,000,000 | | 15,631,595 |
See Accompanying Notes to Financial Statements.
18
Columbia Intermediate Bond Fund
March 31, 2010
Commercial Mortgage-Backed Securities (continued)
| | | | |
| | | Par ($) (a) | | Value ($) |
| Credit Suisse Mortgage Capital Certificates | | |
5.723% 06/15/39 (04/01/10) (c)(d) | | 20,238,309 | | 18,230,541 |
| | |
| CW Capital Cobalt Ltd. | | | | |
5.820% 05/15/46 (04/01/10) (c)(d) | | 22,877,750 | | 21,660,747 |
| |
| First Union National Bank Commercial Mortgage | | |
6.141% 02/12/34 | | 19,138,234 | | 20,139,494 |
| |
| GE Capital Commercial Mortgage Corp. | | |
4.819% 01/10/38 | | 5,110,000 | | 5,343,610 |
5.189% 07/10/39 (04/01/10) (c)(d) | | 14,000,000 | | 14,565,846 |
| |
| GMAC Commercial Mortgage Securities, Inc. | | |
I.O., 0.655% 04/10/40 (04/01/10) (b)(c)(d) | | 39,075,354 | | 164,347 |
5.487% 05/10/40 (04/01/10) (c)(d) | | 12,745,000 | | 13,586,842 |
5.713% 10/15/38 | | 20,000,000 | | 21,151,428 |
| |
| Greenwich Capital Commercial Funding Corp. | | |
5.317% 06/10/36 (04/01/10) (c)(d) | | 5,000,000 | | 5,257,186 |
5.886% 07/10/38 (04/01/10) (c)(d) | | 16,085,000 | | 16,397,311 |
| |
| GS Mortgage Securities Corp. II | | |
5.560% 11/10/39 | | 11,000,000 | | 10,889,826 |
5.805% 08/10/45 (04/01/10) (c)(d) | | 11,275,000 | | 10,446,469 |
| |
| JPMorgan Chase Commercial Mortgage Securities Corp. | | |
I.O., 0.169% 10/15/42 (04/01/10) (c)(d) | | 132,929,069 | | 650,568 |
4.985% 01/12/37 | | 15,000,000 | | 15,725,124 |
5.440% 06/12/47 | | 11,800,000 | | 11,533,257 |
6.068% 02/12/51 | | 3,687,000 | | 3,303,844 |
6.162% 05/12/34 | | 7,992,000 | | 8,500,952 |
| |
| LB-UBS Commercial Mortgage Trust | | |
4.853% 09/15/31 | | 6,270,000 | | 6,580,305 |
5.430% 02/15/40 | | 7,500,000 | | 7,217,503 |
5.866% 09/15/45 (04/11/10) (c)(d) | | 10,000,000 | | 9,843,743 |
6.510% 12/15/26 | | 4,627,896 | | 4,711,996 |
| | |
| Morgan Stanley Capital I | | | | |
5.150% 06/13/41 | | 10,015,000 | | 10,562,584 |
| |
| Morgan Stanley Dean Witter Capital I | | |
4.180% 03/12/35 | | 5,089,111 | | 5,252,585 |
4.740% 11/13/36 | | 8,673,000 | | 9,004,916 |
4.920% 03/12/35 | | 4,065,000 | | 4,228,929 |
5.980% 01/15/39 | | 1,500,000 | | 1,593,846 |
6.390% 07/15/33 | | 8,649,431 | | 9,014,887 |
| |
| Structured Asset Securities Corp. | | |
I.O., 2.189% 02/25/28 (04/01/10) (c)(d) | | 2,136,547 | | 1 |
| | | | |
| | | Par ($) (a) | | Value ($) |
| Wachovia Bank Commercial Mortgage Trust | | |
I.O., 0.251% 03/15/42 (04/01/10) (b)(c)(d) | | 410,870,047 | | 2,250,048 |
3.989% 06/15/35 | | 11,930,000 | | 12,189,480 |
5.037% 03/15/42 | | 7,499,974 | | 7,816,938 |
5.077% 10/15/35 (04/01/10) (b)(c)(d) | | 10,000,000 | | 10,524,769 |
5.083% 03/15/42 (04/01/10) (c)(d) | | 9,575,000 | | 10,008,004 |
5.110% 07/15/42 (04/01/10) (c)(d) | | 15,000,000 | | 15,517,533 |
5.209% 10/15/44 (04/01/10) (c)(d) | | 8,550,000 | | 8,803,091 |
5.239% 07/15/41 (04/01/10) (c)(d) | | 1,910,000 | | 1,963,255 |
5.609% 03/15/45 (04/01/10) (c)(d) | | 2,305,000 | | 1,999,052 |
5.765% 07/15/45 (04/01/10) (c)(d) | | 18,640,000 | | 18,999,012 |
| | | | |
Total Commercial Mortgage-Backed Securities
(cost of $419,105,566) | | 444,913,888 |
| |
Mortgage-Backed Securities – 16.9% | | |
| Federal Home Loan Mortgage Corp. | | |
4.000% 11/01/39 | | 14,851,451 | | 14,410,774 |
4.500% 12/01/39 | | 47,636,740 | | 47,799,051 |
12.000% 07/01/20 | | 48,496 | | 50,131 |
| |
| Federal National Mortgage Association | | |
4.500% 09/01/24 | | 31,476,276 | | 32,696,271 |
4.500% 10/01/24 | | 29,674,890 | | 30,825,065 |
4.500% 11/01/24 | | 41,056,636 | | 42,647,958 |
4.500% 05/01/39 | | 29,023,497 | | 29,122,388 |
5.500% 02/01/37 | | 2,489,767 | | 2,626,991 |
5.500% 05/01/38 | | 30,990,055 | | 32,698,074 |
5.500% 06/01/38 | | 19,700,986 | | 20,786,806 |
6.000% 01/01/14 | | 138,407 | | 149,519 |
6.000% 02/01/37 | | 28,848,298 | | 30,872,622 |
6.000% 05/01/37 | | 5,900,566 | | 6,277,738 |
6.000% 11/01/37 | | 18,481,966 | | 19,663,359 |
6.000% 12/01/38 | | 5,957,639 | | 6,335,667 |
6.000% 02/01/39 | | 37,574,257 | | 39,958,442 |
6.500% 10/01/28 | | 510,121 | | 563,612 |
6.500% 12/01/31 | | 523,592 | | 578,496 |
6.500% 08/01/36 | | 11,768,404 | | 12,789,124 |
| |
| Government National Mortgage Association | | |
3.625% 07/20/25 (04/01/10) (c)(d) | | 52,435 | | 53,991 |
See Accompanying Notes to Financial Statements.
19
Columbia Intermediate Bond Fund
March 31, 2010
Mortgage-Backed Securities (continued)
| | | | |
| | | Par ($) (a) | | Value ($) |
9.000% 06/15/16 | | 1,681 | | 1,877 |
9.000% 08/15/16 | | 1,419 | | 1,584 |
9.000% 10/15/16 | | 2,988 | | 3,337 |
| | | | |
Total Mortgage-Backed Securities
(cost of $366,068,568) | | 370,912,877 |
| |
Government & Agency Obligations – 9.8% | | |
| | | | |
| Foreign Government Obligations – 0.2% |
| Republic of Italy | | | | |
5.375% 06/12/17 | | 4,690,000 | | 5,040,414 |
| | | | |
Foreign Government Obligations Total | | 5,040,414 |
| | | | |
| U.S. Government Obligations – 9.6% | | |
| U.S. Treasury Bonds | | | | |
4.250% 05/15/39 | | 17,260,000 | | 15,992,460 |
4.375% 11/15/39 | | 9,065,000 | | 8,572,091 |
| | |
| U.S. Treasury Notes | | | | |
1.375% 01/15/13 | | 535,000 | | 533,286 |
1.375% 03/15/13 (l) | | 12,125,000 | | 12,053,948 |
2.250% 01/31/15 (l) | | 79,940,000 | | 79,071,932 |
2.375% 02/28/15 (l) | | 18,587,000 | | 18,459,307 |
3.125% 05/15/19 | | 530,000 | | 504,784 |
3.375% 11/15/19 (m) | | 35,867,000 | | 34,608,857 |
3.625% 08/15/19 | | 22,370,000 | | 22,097,354 |
3.625% 02/15/20 | | 18,085,000 | | 17,776,994 |
| | | | |
U.S. Government Obligations Total | | 209,671,013 |
| | | | |
Total Government & Agency Obligations (cost of $216,993,210) | | 214,711,427 |
| |
Asset-Backed Securities – 5.6% | | |
| American Express Credit Account Master Trust | | |
0.510% 01/15/13 (04/15/10) (b)(c)(d) | | 3,850,000 | | 3,842,610 |
| |
| Bay View Auto Trust | | |
5.310% 06/25/14 | | 3,500,000 | | 3,545,415 |
| |
| Capital Auto Receivables Asset Trust | | |
5.310% 06/15/12 | | 9,000,000 | | 9,187,821 |
| |
| Chase Issuance Trust | | |
0.980% 06/15/12 (04/15/10) (c)(d) | | 5,500,000 | | 5,507,327 |
| |
| Citibank Credit Card Issuance Trust | | |
6.300% 06/20/14 | | 470,000 | | 497,270 |
6.950% 02/18/14 | | 1,630,000 | | 1,738,434 |
| | | | |
| | | Par ($) (a) | | Value ($) |
| Citicorp Residential Mortgage Securities, Inc. | | |
5.892% 03/25/37
(04/01/10) (c)(d) | | 11,000,000 | | 9,726,519 |
5.977% 06/25/37
(04/01/10) (c)(d) | | 1,300,000 | | 1,281,702 |
6.080% 06/25/37
(04/01/10) (c)(d) | | 11,000,000 | | 10,220,697 |
| |
| Citigroup Mortgage Loan Trust, Inc. | | |
5.517% 08/25/35
(04/01/10) (c)(d) | | 3,775,000 | | 275,161 |
5.598% 03/25/36
(04/01/10) (c)(d) | | 1,460,229 | | 1,231,408 |
5.666% 08/25/35
(04/01/10) (c)(d) | | 2,330,000 | | 133,468 |
| |
| Countrywide Asset-Backed Certificates | | |
0.356% 06/25/21 (04/26/10) (c)(d)(e) | | 723,818 | | 543,787 |
5.813% 05/25/37
(04/01/10) (c)(d) | | 6,672,191 | | 2,939,517 |
| |
| Discover Card Master Trust | | |
0.550% 01/15/13
(04/15/10) (c)(d) | | 4,000,000 | | 3,985,506 |
1.530% 02/17/15
(04/15/10) (c)(d) | | 3,810,000 | | 3,877,726 |
| |
| Ford Credit Auto Owner Trust | | |
5.160% 04/15/13 | | 5,000,000 | | 5,324,603 |
5.680% 06/15/12 | | 5,422,000 | | 5,633,426 |
5.690% 11/15/12 | | 6,000,000 | | 6,422,432 |
| |
| Franklin Auto Trust | | |
5.360% 05/20/16 | | 4,720,000 | | 4,888,175 |
7.160% 05/20/16 (b) | | 3,555,000 | | 3,849,354 |
| |
| GE Capital Credit Card Master Note Trust | | |
4.130% 06/15/13 | | 9,725,000 | | 9,793,371 |
| |
| Green Tree Financial Corp. | | |
6.870% 01/15/29 | | 1,059,438 | | 1,113,035 |
| |
| Harley-Davidson Motorcycle Trust | | |
5.540% 04/15/15 | | 4,600,000 | | 4,788,340 |
| |
| JPMorgan Auto Receivables Trust | | |
5.610% 12/15/14 (b) | | 1,313,188 | | 1,316,484 |
| |
| Renaissance Home Equity Loan Trust | | |
5.355% 11/25/35
(04/01/10) (c)(d) | | 4,750,000 | | 1,181,270 |
| |
| Small Business Administration Participation Certificates | | |
4.570% 06/01/25 | | 3,000,506 | | 3,126,814 |
See Accompanying Notes to Financial Statements.
20
Columbia Intermediate Bond Fund
March 31, 2010
Asset-Backed Securities (continued)
| | | | |
| | | Par ($) (a) | | Value ($) |
5.390% 12/01/25 | | 782,107 | | 836,619 |
5.570% 03/01/26 | | 2,745,988 | | 2,975,717 |
5.780% 08/01/27 | | 4,660,139 | | 4,975,143 |
| |
| Wachovia Auto Loan Owner Trust | | |
5.650% 02/20/13 | | 8,000,000 | | 8,288,502 |
| | | | |
Total Asset-Backed Securities (cost of $135,757,026) | | 123,047,653 |
| |
Collateralized Mortgage Obligations – 2.0% | | |
| | | | |
| Agency – 0.9% | | | | |
| Federal Home Loan Mortgage Corp. REMICS | | |
4.000% 03/15/19 | | 7,075,000 | | 7,270,573 |
5.000% 03/15/28 | | 11,449,868 | | 11,882,679 |
| Federal National Mortgage Association REMICS | | |
9.250% 03/25/18 | | 55,647 | | 62,503 |
| | | | |
Agency Total | | | | 19,215,755 |
| | | | |
| Non-Agency – 1.1% | | | | |
| American Mortgage Trust | | | | |
8.445% 09/27/22 (e) | | 7,542 | | 4,573 |
| |
| Countrywide Alternative Loan Trust | | |
5.500% 09/25/35 | | 6,341,897 | | 419,128 |
| | |
| GSMPS Mortgage Loan Trust | | | | |
7.750% 09/19/27 (b)(c) | | 599,431 | | 575,363 |
| | |
| JPMorgan Mortgage Trust | | | | |
5.734% 05/25/36 (04/01/10) (c)(d) | | 7,551,792 | | 5,937,793 |
| |
| Nomura Asset Acceptance Corp. | | |
0.346% 08/25/36 (04/26/10) (c)(d) | | 1,708,823 | | 971,798 |
5.515% 01/25/36 (04/01/10) (c)(d) | | 7,331,480 | | 4,367,425 |
6.138% 03/25/47 (04/01/10) (c)(d) | | 9,500,000 | | 7,745,822 |
| |
| Wells Fargo Mortgage Backed Securities Trust | | |
6.254% 10/25/37 (04/01/10) (c)(d) | | 6,864,304 | | 5,492,472 |
| | | | |
Non-Agency Total | | | | 25,514,374 |
| | | | |
Total Collateralized Mortgage Obligations (cost of $57,923,984) | | 44,730,129 |
Municipal Bonds – 0.6%
| | | | |
| | | Par ($) (a) | | Value ($) |
| California – 0.4% | | | | |
| CA State | | | | |
Series 2009, | | | | |
7.550% 04/01/39 | | 4,470,000 | | 4,648,174 |
| |
| CA Los Angeles Unified School District | | |
Series 2009, | | | | |
5.750% 07/01/34 | | 5,665,000 | | 5,214,179 |
| | | | |
California Total | | | | 9,862,353 |
| | | | |
| New York – 0.2% | | | | |
| NY Triborough Bridge & Tunnel Authority | | |
Series 2008 C, | | | | |
5.000% 11/15/38 | | 3,500,000 | | 3,654,280 |
| | | | |
New York Total | | | | 3,654,280 |
| | | | |
Total Municipal Bonds (cost of $13,329,535) | | 13,516,633 |
| | | | |
| | | Shares | | |
Common Stock – 0.0% | | | | |
| | | | |
| Industrials – 0.0% | | | | |
| Airlines – 0.0% | | | | |
UAL Corp. (n) | | 1,493 | | 29,188 |
| | | | |
Airlines Total | | | | 29,188 |
| | | | |
Industrials Total | | 29,188 |
| | | | |
Total Common Stock (cost of $53,240) | | 29,188 |
| | | Units | | |
Warrants – 0.0% | | | | |
| | | | |
| Financials – 0.0% | | | | |
CNB Capital Trust I Expires 03/23/19 (b)(e)(n) | | 10,127 | | 101 |
| | | | |
Financials Total | | 101 |
| | | | |
Total Warrants (cost of $101) | | 101 |
See Accompanying Notes to Financial Statements.
21
Columbia Intermediate Bond Fund
March 31, 2010
Preferred Stock – 0.0%
| | | | | |
| | | Shares | | Value ($) | |
| Communications – 0.0% | | | |
| Media – 0.0% | | | | | |
CMP Susquehanna Radio Holdings Corp., Series A (b)(e)(n) | | 8,862 | | 89 | |
| | | | | |
Media Total | | | | 89 | |
| | | | | |
Communications Total | | | | 89 | |
| | | | | |
Total Preferred Stock (cost of $89) | | | | 89 | |
| |
| Securities Lending Collateral – 4.6% | | | |
State Street Navigator Securities Lending Prime Portfolio (7 day yield of 0.219%) (o) | | 100,544,056 | | 100,544,056 | |
| | | | | |
Total Securities Lending Collateral (cost of $100,544,056) | | 100,544,056 | |
| | | Par ($) (a) | | | |
| Short-Term Obligation – 0.9% | | | | | |
Repurchase agreement with Fixed Income Clearing Corp., dated 03/31/10, due 04/01/10 at 0.000%, collateralized by a U.S. Treasury obligation maturing 01/31/14, market value $20,870,769 (repurchase proceeds $20,458,000) | | 20,458,000 | | 20,458,000 | |
| | | | | |
Total Short-Term Obligation (cost of $20,458,000) | | 20,458,000 | |
| | | | | |
Total Investments – 103.9% (cost of $2,263,923,363)(p) | | 2,285,266,042 | |
| | | | | |
Obligation to Return Collateral for Securities Loaned – (4.6)% | | (100,544,056 | ) |
| | | | | |
Other Assets & Liabilities, Net – 0.7% | | 15,532,793 | |
| | | | | |
Net Assets – 100.0% | | | | 2,200,254,779 | |
Notes to Investment Portfolio:
| (a) | Principal amount is stated in U.S. dollars unless otherwise noted. |
| (b) | Security exempt from registration pursuant to Rule 144A under the Securities Act of 1933. These securities may be resold in transactions exempt from registration, normally to qualified institutional buyers. At March 31, 2010, these securities, which are not illiquid except for the following, amounted to $217,871,494, which represents 9.9% of net assets. |
| | | | | | | | | | | | |
Security | | Acquisition
Date | | | Par/
Shares | | Cost | | Value |
ACE Cash Express, Inc.
10.250% 10/01/14 | | 02/11/06 | | | $ | 280,000 | | $ | 284,200 | | $ | 230,300 |
CMP Susquehanna Radio Holdings Corp., Series A | | 03/26/09 | | | | 8,862 | | | 89 | | | 89 |
CNB Capital Trust I
Expires 03/23/19 | | 03/26/09 | | | | 10,127 | | | 101 | | | 101 |
Local TV Finance LLC, PIK
9.250% 06/15/15 | | 05/07/07
06/15/09 | -
| | | 661,500 | | | 561,001 | | | 415,266 |
Qatar Petroleum
5.579% 05/30/11 | | 05/19/06 | | | | 818,497 | | | 818,497 | | | 840,798 |
Ras Laffan Liquefied Natural Gas Co., Ltd. II 5.298% 09/30/20 | | 01/07/08 | | | | 3,400,000 | | | 3,247,748 | | | 3,497,580 |
Seminole Indian Tribe of Florida
7.804% 10/01/20 | | 09/26/07-
10/04/07 |
| | | 540,000 | | | 548,225 | | | 503,312 |
Systems 2001 Asset Trust
6.664% 09/15/13 | | 06/04/01 | | | | 1,253,362 | | | 1,253,362 | | | 1,326,772 |
| | | | | | | | | | | | |
| | | | | | | | | | | $ | 6,814,218 |
| | | | | | | | | | | | |
| (c) | The interest rate shown on floating rate or variable rate securities reflects the rate at March 31, 2010. |
| (d) | Parenthetical date represents the next interest rate reset date for the security. |
| (e) | Represents fair value as determined in good faith under procedures approved by the Board of Trustees. At March 31, 2010, the value of these securities amounted to $9,653,601, which represents 0.4% of net assets. |
| (f) | Step bond. This security is currently not paying coupon. Shown parenthetically is the next coupon rate to be paid and the date the security will begin accruing at this rate. |
| (g) | The issuer has filed for bankruptcy protection under Chapter 11, and is in default of certain debt covenants. Income is not being accrued. At March 31, 2010, the value of these securities amounted to $9,938,149, which represents 0.5% of net assets. |
| (h) | The issuer is in default of certain debt covenants. Income is not being accrued. At March 31, 2010, the value of these securities amounted to $554,869, which represents less than 0.1% of net assets. |
| (i) | Security purchased on a delayed delivery basis. |
See Accompanying Notes to Financial Statements.
22
Columbia Intermediate Bond Fund
March 31, 2010
| (j) | Investments in affiliates during the year ended March 31, 2010: |
| | | | | | | | | | | | | | | |
Affiliate | | Value,
beginning of period | | Purchases | | Sales
Proceeds | | Interest
Income | | Value, end of
period |
Merrill Lynch & Co., Inc.
5.450% 02/05/13 | | $ | 12,296,400 | | $ | — | | $ | 15,780,750 | | $ | 690,333 | | $ | — |
Merrill Lynch & Co., Inc.
5.700% 05/02/17 | | | 5,885,613 | | | — | | | 2,982,510 | | | 517,655 | | | 6,898,325 |
Merrill Lynch & Co., Inc.
6.050% 08/15/12 | | | 1,287,086 | | | — | | | — | | | 90,750 | | | 1,602,008 |
Merrill Lynch & Co., Inc.
6.150% 04/25/13 | | | 4,278,639 | | | — | | | 5,445,042 | | | 191,672 | | | — |
Merrill Lynch & Co., Inc.
7.750% 05/14/38 | | | 3,063,100 | | | — | | | — | | | 399,900 | | | 5,719,710 |
| | | | | | | | | | | | | | | |
Total | | $ | 26,810,838 | | $ | — | | $ | 24,208,302 | | $ | 1,890,310 | | $ | 14,220,043 |
| | | | | | | | | | | | | | | |
| (k) | Loan participation agreement. |
| (l) | All or a portion of this security was on loan at March 31, 2010. The total market value of securities on loan at March 31, 2010 is $98,711,173. |
| (m) | A portion of this security with a market value of $2,894,766 is pledged as collateral for open futures contracts. |
| (n) | Non-income producing security. |
| (o) | Investment made with cash collateral received from securities lending activity. |
| (p) | Cost for federal income tax purposes is $2,269,828,701. |
The following table summarizes the inputs used, as of March 31, 2010, in valuing the Fund’s assets:
| | | | | | | | | | | | |
Description | | Quoted Prices (Level 1) | | Other
Significant Observable
Inputs (Level 2) | | Significant Unobservable Inputs
(Level 3) | | Total |
Corporate Fixed-Income Bonds & Notes | | | | | | |
Basic Materials | | $ | — | | $ | 48,419,744 | | $ | — | | $ | 48,419,744 |
Communications | | | — | | | 79,642,958 | | | 22,420 | | | 79,665,378 |
Consumer Cyclical | | | — | | | 42,913,957 | | | 4,982,801 | | | 47,896,758 |
Consumer Non-Cyclical | | | — | | | 95,308,697 | | | — | | | 95,308,697 |
Diversified | | | — | | | 308,250 | | | — | | | 308,250 |
Energy | | | — | | | 114,479,958 | | | — | | | 114,479,958 |
Financials | | | — | | | 401,577,340 | | | — | | | 401,577,340 |
Industrials | | | — | | | 51,979,371 | | | 1,604,722 | | | 53,584,093 |
Technology | | | — | | | 16,848,620 | | | — | | | 16,848,620 |
Utilities | | | — | | | 94,313,163 | | | — | | | 94,313,163 |
| | | | | | | | | | | | |
Total Corporate Fixed-Income Bonds & Notes | | | — | | | 945,792,058 | | | 6,609,943 | | | 952,402,001 |
| | | | | | | | | | | | |
Total Commercial Mortgage-Backed Securities | | | — | | | 444,913,888 | | | — | | | 444,913,888 |
| | | | | | | | | | | | |
Total Mortgage-Backed Securities | | | — | | | 370,912,877 | | | — | | | 370,912,877 |
| | | | | | | | | | | | |
| | | | | | | | | | | | | | | |
Description | | Quoted Prices (Level 1) | | | Other
Significant Observable
Inputs (Level 2) | | | Significant Unobservable Inputs
(Level 3) | | Total | |
Government & Agency Obligations | | | | | | | | | | | | | | | |
Foreign Government Obligations | | $ | — | | | $ | 5,040,414 | | | $ | — | | $ | 5,040,414 | |
U.S. Government Obligations | | | 209,671,013 | | | | — | | | | — | | | 209,671,013 | |
| | | | | | | | | | | | | | | |
Total Government & Agency Obligations | | | 209,671,013 | | | | 5,040,414 | | | | — | | | 214,711,427 | |
| | | | | | | | | | | | | | | |
Total Asset-Backed Securities | | | — | | | | 123,047,653 | | | | — | | | 123,047,653 | |
| | | | | | | | | | | | | | | |
Collateralized Mortgage Obligations | | | | | | | | |
Agency | | | — | | | | 19,215,755 | | | | — | | | 19,215,755 | |
Non-Agency | | | — | | | | 25,509,801 | | | | 4,573 | | | 25,514,374 | |
| | | | | | | | | | | | | | | |
Total Collateralized Mortgage Obligations | | | — | | | | 44,725,556 | | | | 4,573 | | | 44,730,129 | |
| | | | | | | | | | | | | | | |
Total Municipal Bonds | | | — | | | | 13,516,633 | | | | — | | | 13,516,633 | |
| | | | | | | | | | | | | | | |
Total Common Stock | | | 29,188 | | | | — | | | | — | | | 29,188 | |
| | | | | | | | | | | | | | | |
Total Warrants | | | — | | | | — | | | | 101 | | | 101 | |
| | | | | | | | | | | | | | | |
Total Preferred Stock | | | — | | | | — | | | | 89 | | | 89 | |
| | | | | | | | | | | | | | | |
Total Securities Lending Collateral | | | 100,544,056 | | | | — | | | | — | | | 100,544,056 | |
| | | | | | | | | | | | | | | |
Total Short-Term Obligation | | | — | | | | 20,458,000 | | | | — | | | 20,458,000 | |
| | | | | | | | | | | | | | | |
Total Investments | | | 310,244,257 | | | | 1,968,407,079 | | | | 6,614,706 | | | 2,285,266,042 | |
| | | | | | | | | | | | | | | |
Unrealized Appreciation on Forward Foreign Currency Exchange Contracts | | | — | | | | 11,102 | | | | — | | | 11,102 | |
| | | | | | | | | | | | | | | |
Value of Credit Default Swap Contracts – Appreciation | | | — | | | | 215,473 | | | | — | | | 215,473 | |
| | | | | | | | | | | | | | | |
Value of Credit Default Swap Contracts – Depreciation | | | — | | | | (1,387,881 | ) | | | — | | | (1,387,881 | ) |
| | | | | | | | | | | | | | | |
Unrealized Appreciation on Futures Contracts | | | 731,662 | | | | — | | | | — | | | 731,662 | |
| | | | | | | | | | | | | | | |
Unrealized Depreciation on Futures Contracts | | | (865,212 | ) | | | — | | | | — | | | (865,212 | ) |
| | | | | | | | | | | | | | | |
Total | | $ | 310,110,707 | | | $ | 1,967,245,773 | | | $ | 6,614,706 | | $ | 2,283,971,186 | |
| | | | | | | | | | | | | | | |
See Accompanying Notes to Financial Statements.
23
Columbia Intermediate Bond Fund
March 31, 2010
The following table reconciles asset balances for the year ending March 31, 2010, in which significant unobservable inputs (Level 3) were used in determining value:
| | | | | | | | | | | | | | | | | | | | | | | | | | | | | | | |
Investments in Securities | | Balance as of
March 31,
2009 | | Accrued
Discounts (Premiums) | | Realized Gain
(Loss) | | | Change in
Unrealized
Appreciation
(Depreciation) | | | Purchases | | Sales | | | Transfers
into
Level 3 | | Transfers
out of
Level 3 | | | Balance as of
March 31,
2010 |
Corporate Fixed-Income Bonds & Notes | | | | | | | | | | | | | | | | | | | | | | | | | | | | | | | |
Communications | | $ | 17,100 | | $ | 640 | | $ | — | | | $ | 4,680 | | | $ | — | | $ | — | | | $ | — | | $ | — | | | $ | 22,420 |
Consumer Cyclical | | | 3,391,731 | | | — | | | 46,102 | | | | 1,450,862 | | | | — | | | (397,604 | ) | | | 491,710 | | | — | | | | 4,982,801 |
Industrials | | | 1,277,128 | | | — | | | — | | | | 758,957 | | | | — | | | (431,363 | ) | | | — | | | — | | | | 1,604,722 |
Asset-Backed Securities | | | 1,224,679 | | | — | | | (3,702 | ) | | | (13,923 | ) | | | — | | | (663,267 | ) | | | — | | | (543,787 | ) | | | — |
Collateralized Mortgage Obligations | | | | | | | | | | | | | | | | | | | | | | | | | | | | | | | |
Non-Agency | | | — | | | — | | | 169 | | | | 659 | | | | — | | | (2,108 | ) | | | 5,853 | | | — | | | | 4,573 |
Warrants | | | | | | | | | | | | | | | | | | | | | | | | | | | | | | | |
Financials | | | 101 | | | — | | | — | | | | — | | | | — | | | — | | | | — | | | — | | | | 101 |
Preferred Stock | | | | | | | | | | | | | | | | | | | | | | | | | | | | | | | |
Communications | | | 89 | | | — | | | — | | | | — | | | | — | | | — | | | | — | | | — | | | | 89 |
| | | | | | | | | | | | | | | | | | | | | | | | | | | | | | | |
Total | | $ | 5,910,828 | | $ | 640 | | $ | 42,569 | | | $ | 2,201,235 | | | $ | — | | $ | (1,494,342 | ) | | $ | 497,563 | | $ | (543,787 | ) | | $ | 6,614,706 |
| | | | | | | | | | | | | | | | | | | | | | | | | | | | | | | |
The information in the above reconciliation represents fiscal year to date activity for any securities identified as using Level 3 inputs at either the beginning or the end of the current fiscal period.
The change in unrealized appreciation attributable to securities owned at March 31, 2010, which were valued using significant unobservable inputs (Level 3) amounted to $2,215,158. This amount is included in net change in unrealized appreciation (depreciation) on the Statement of Changes in Net Assets.
Financial assets levels were transferred out of Level 3 due to management’s determination that reliable and observable market data was now available to, and utilized by, pricing services for the valuation of this security.
Financial asset levels were transferred into Level 3 due to the pricing services methodology change from pricing the security based upon market data for comparable securities to the reliance upon a single broker quote.
For more information on valuation inputs, and their aggregation into the levels used in the tables above, please refer to the Security Valuation section in the accompanying Notes to Financial Statements.
Forward foreign currency exchange contracts outstanding on March 31, 2010 are:
Foreign Exchange Rate Risk
| | | | | | | | | | | |
Forward Foreign Currency
Exchange Contracts to Sell | | Value | | Aggregate
Face Value | | Settlement
Date | | Unrealized
Appreciation |
EUR | | $ | 303,897 | | $ | 305,589 | | 04/09/10 | | $ | 1,692 |
EUR | | | 513,252 | | | 522,662 | | 04/15/10 | | | 9,410 |
| | | | | | | | | | | |
| | | | | | | | | | $ | 11,102 |
| | | | | | | | | | | |
At March 31, 2010, the Fund has entered into the following credit default swap contracts:
Credit Risk
| | | | | | | | | | | | | | | | | | | | |
Swap Counterparty | | Referenced Obligation | | Receive
Buy/Sell
Protection | | Fixed Rate | | | Expiration Date | | Notional
Amount | | Upfront
Premium
Paid (Received) | | | Value of
Contract | |
Barclays Capital | | Toll Brothers, Inc.
5.150% 05/15/15 | | Buy | | 1.000 | % | | 09/20/14 | | $ | 9,600,000 | | $ | 33,371 | | | $ | 118,344 | |
Barclays Capital | | Toll Brothers, Inc.
5.150% 05/15/15 | | Buy | | 1.000 | % | | 09/20/14 | | | 11,510,000 | | | 90,419 | | | | 97,129 | |
Barclays Capital | | Limited Brands, Inc. | | Buy | | 1.000 | % | | 03/20/15 | | | 11,000,000 | | | 614,326 | | | | (220,026 | ) |
Barclays Capital | | Macy’s, Inc. | | Buy | | 1.000 | % | | 03/20/15 | | | 7,905,000 | | | 406,555 | | | | (154,797 | ) |
Barclays Capital | | Textron, Inc. | | Buy | | 1.000 | % | | 03/20/15 | | | 5,000,000 | | | 158,984 | | | | (140 | ) |
Barclays Capital | | D.R. Horton, Inc. | | Buy | | 1.000 | % | | 03/20/15 | | | 13,000,000 | | | 567,375 | | | | (70,326 | ) |
Barclays Capital | | The Home Depot, Inc. | | Buy | | 1.000 | % | | 03/20/15 | | | 17,000,000 | | | (80,702 | ) | | | (205,155 | ) |
BNP Paribas | | Marriott International, Inc. | | Buy | | 1.000 | % | | 03/20/15 | | | 11,160,000 | | | 103,660 | | | | (102,746 | ) |
Credit Suisse First Boston | | Textron, Inc. | | Buy | | 1.000 | % | | 03/20/15 | | | 6,160,000 | | | 209,506 | | | | (13,643 | ) |
JPMorgan | | Macy’s, Inc. | | Buy | | 1.000 | % | | 03/20/15 | | | 14,700,000 | | | 788,492 | | | | (319,194 | ) |
JPMorgan | | D.R. Horton, Inc. | | Buy | | 1.000 | % | | 03/20/15 | | | 11,600,000 | | | 506,225 | | | | (62,975 | ) |
Morgan Stanley | | Limited Brands, Inc. | | Buy | | 1.000 | % | | 03/20/15 | | | 11,500,000 | | | 542,145 | | | | (134,820 | ) |
Morgan Stanley | | The Home Depot, Inc. | | Buy | | 1.000 | % | | 03/20/15 | | | 11,200,000 | | | (84,796 | ) | | | (104,059 | ) |
| | | | | | | | | | | | | | | | | | | | |
| | | | | | | | | | | | | | | | | | $ | (1,172,408 | ) |
| | | | | | | | | | | | | | | | | | | | |
See Accompanying Notes to Financial Statements.
24
Columbia Intermediate Bond Fund
March 31, 2010
At March 31, 2010, the Fund held the following open long futures contracts:
| | | | | | | | | | | | | |
Interest
Rate Risk | | | | | | | | | | |
Type | | Number of
Contracts | | Value | | Aggregate
Face Value | | Expiration
Date | | Unrealized
Appreciation |
10-Year U.S. Treasury Notes | | 295 | | $ | 34,293,750 | | $ | 34,089,592 | | June-2010 | | $ | 204,158 |
At March 31, 2010, the Fund held the following open short futures contracts:
| | | | | | | | | | | | | | |
Interest
Rate Risk | | | | | | | | | | | |
Type | | Number of
Contracts | | Value | | Aggregate
Face Value | | Expiration
Date | | Unrealized
Appreciation
(Depreciation) | |
2-Year U.S. Treasury Notes | | 536 | | $ | 116,286,876 | | $ | 116,209,758 | | June-2010 | | $ | (77,118 | ) |
30-Year U.S. Treasury Bonds | | 553 | | | 64,217,125 | | | 63,429,031 | | June-2010 | | | (788,094 | ) |
5-Year U.S. Treasury Notes | | 1,866 | | | 214,298,437 | | | 214,825,941 | | June-2010 | | | 527,504 | |
| | | | | | | | | | | | | | |
| | | | | | | | | | | | $ | (337,708 | ) |
| | | | | | | | | | | | | | |
At March 31, 2010, cash of $2,150,000 was pledged as collateral for open futures contracts.
At March 31, 2010, asset allocation of the Fund is as follows:
| | | |
Asset Allocation (Unaudited) | | % of
Net Assets | |
Corporate Fixed-Income Bonds & Notes | | 43.3 | |
Commercial Mortgage-Backed Securities | | 20.2 | |
Mortgage-Backed Securities | | 16.9 | |
Government & Agency Obligations | | 9.8 | |
Asset-Backed Securities | | 5.6 | |
Collateralized Mortgage Obligations | | 2.0 | |
Municipal Bonds | | 0.6 | |
Common Stock | | 0.0 | * |
Preferred Stock | | 0.0 | * |
Warrants | | 0.0 | * |
| | | |
| | 98.4 | |
Securities Lending Collateral | | 4.6 | |
Short-Term Obligation | | 0.9 | |
Obligation to Return Collateral for Securities Loaned | | (4.6 | ) |
Other Assets & Liabilities, Net | | 0.7 | |
| | | |
| | 100.0 | |
| | | |
* Represents less than 0.1% of net assets.
| | |
Acronym | | Name |
| EUR | | Euro |
| I.O. | | Interest Only |
| PIK | | Payment-In-Kind |
| REMICS | | Real Estate Mortgage Investment Conduits |
See Accompanying Notes to Financial Statements.
25
Statement of Assets and Liabilities – Columbia Intermediate Bond Fund
March 31, 2010
| | | | | |
| | | | | ($) | |
| Assets | | Unaffiliated investments, at identified cost | | 2,250,427,334 | |
| | Affiliated investments, at identified cost | | 13,496,029 | |
| | | | | |
| | Total investments, at identified cost | | 2,263,923,363 | |
| | Unaffiliated investments, at value | | 2,271,045,999 | |
| | Affiliated investments, at value | | 14,220,043 | |
| | | | | |
| | Total investments, at value (including securities on loan of $98,711,173) | | 2,285,266,042 | |
| | Cash | | 227,465 | |
| | Cash collateral for open futures contracts | | 2,150,000 | |
| | Open credit default swap contracts | | 215,473 | |
| | Credit default swap contracts premiums paid | | 3,928,609 | |
| | Unrealized appreciation on forward foreign
currency exchange contracts | | 11,102 | |
| | Receivable for: | | | |
| | Fund shares sold | | 1,847,078 | |
| | Interest | | 22,055,155 | |
| | Securities lending | | 57 | |
| | Foreign tax reclaims | | 32,162 | |
| | Trustees’ deferred compensation plan | | 109,016 | |
| | Prepaid expenses | | 44,453 | |
| | Other assets | | 1,017,490 | |
| | | | | |
| | Total Assets | | 2,316,904,102 | |
| | |
| Liabilities | | Collateral on securities loaned | | 100,544,056 | |
| | Open credit default swap contracts | | 1,387,881 | |
| | Credit default swap contracts premiums received | | 161,241 | |
| | Payable for: | | | |
| | Investments purchased | | 3,933,168 | |
| | Investments purchased on a delayed delivery basis | | 444,967 | |
| | Fund shares repurchased | | 3,713,473 | |
| | Futures variation margin | | 673,546 | |
| | Distributions | | 4,248,219 | |
| | Investment advisory fee | | 595,493 | |
| | Administration fee | | 279,455 | |
| | Pricing and bookkeeping fees | | 19,704 | |
| | Transfer agent fee | | 339,618 | |
| | Trustees’ fees | | 442 | |
| | Custody fee | | 11,107 | |
| | Distribution and service fees | | 85,473 | |
| | Chief compliance officer expenses | | 313 | |
| | Trustees’ deferred compensation plan | | 109,016 | |
| | Other liabilities | | 102,151 | |
| | | | | |
| | Total Liabilities | | 116,649,323 | |
| | |
| | | | | |
| | Net Assets | | 2,200,254,779 | |
| | |
| Net Assets Consist of | | Paid-in capital | | 2,232,255,420 | |
| | Undistributed net investment income | | 3,578,700 | |
| | Accumulated net realized loss | | (54,439,743 | ) |
| | Net unrealized appreciation (depreciation) on:
Investments | | 21,342,679 | |
| | Foreign currency translations and forward
foreign currency exchange contracts | | 10,897 | |
| | Credit default swap contracts | | (2,359,624 | ) |
| | Futures contracts | | (133,550 | ) |
| | | | | |
| | Net Assets | | 2,200,254,779 | |
See Accompanying Notes to Financial Statements.
26
Statement of Assets and Liabilities (continued) – Columbia Intermediate Bond Fund
March 31, 2010
| | | | | | |
| | | | | | |
| Class A | | Net assets | | $ | 163,333,161 | |
| | Shares outstanding | | | 18,253,036 | |
| | Net asset value per share | | $ | 8.95 | (a) |
| | Maximum sales charge | | | 3.25 | % |
| | Maximum offering price per share ($8.95/0.9675) | | $ | 9.25 | (b) |
| | |
| Class B | | Net assets | | $ | 31,475,895 | |
| | Shares outstanding | | | 3,517,538 | |
| | Net asset value and offering price per share | | $ | 8.95 | (a) |
| | |
| Class C | | Net assets | | $ | 30,731,033 | |
| | Shares outstanding | | | 3,434,295 | |
| | Net asset value and offering price per share | | $ | 8.95 | (a) |
| | |
| Class R | | Net assets | | $ | 1,694,292 | |
| | Shares outstanding | | | 189,343 | |
| | Net asset value, offering and redemption price per share | | $ | 8.95 | |
| | |
| Class Z | | Net assets | | $ | 1,973,020,398 | |
| | Shares outstanding | | | 220,491,380 | |
| | Net asset value, offering and redemption price per share | | $ | 8.95 | |
| (a) | Redemption price per share is equal to net asset value less any applicable contingent deferred sales charge. |
| (b) | On sales of $50,000 or more the offering price is reduced. |
See Accompanying Notes to Financial Statements.
27
Statement of Operations – Columbia Intermediate Bond Fund
For the Year Ended March 31, 2010
| | | | | |
| | | | | ($) | |
| Investment Income | | Interest | | 122,329,273 | |
| | Interest from affiliates | | 1,890,310 | |
| | Securities lending | | 33,529 | |
| | Dollar roll fee income | | 342,641 | |
| | | | | |
| | Total Investment Income | | 124,595,753 | |
| | |
| Expenses | | Investment advisory fee | | 6,768,041 | |
| | Administration fee | | 3,164,565 | |
| | Distribution fee: | | | |
| | Class A | | 159,958 | |
| | Class B | | 266,146 | |
| | Class C | | 239,468 | |
| | Class R | | 8,902 | |
| | Service fee: | | | |
| | Class A | | 399,760 | |
| | Class B | | 88,709 | |
| | Class C | | 79,839 | |
| | Pricing and bookkeeping fees | | 189,677 | |
| | Transfer agent fee | | 2,839,286 | |
| | Trustees’ fees | | 117,111 | |
| | Custody fee | | 72,734 | |
| | Chief compliance officer expenses | | 1,407 | |
| | Other expenses | | 511,447 | |
| | | | | |
| | Expenses before interest expense | | 14,907,050 | |
| | Interest expense | | 35 | |
| | | | | |
| | Total Expenses | | 14,907,085 | |
| | |
| | Fees waived by distributor – Class A | | (159,958 | ) |
| | Fees waived by distributor – Class C | | (47,893 | ) |
| | Expense reductions | | (174 | ) |
| | | | | |
| | Net Expenses | | 14,699,060 | |
| | |
| | | | | |
| | Net Investment Income | | 109,896,693 | |
| | |
| Net Realized and Unrealized Gain (Loss) on Investments, Futures Contracts, Credit Default Swap Contracts and Foreign Currency | | Net realized gain (loss) on: | | | |
| | Unaffiliated investments | | 55,083,263 | |
| | Affiliated investments | | 1,424,650 | |
| | Foreign currency transactions and forward foreign currency
exchange contracts | | 8,850 | |
| | Credit default swap contracts | | (15,392,042 | ) |
| | Futures contracts | | 4,018,960 | |
| | | | | |
| | Net realized gain | | 45,143,681 | |
| | Net change in unrealized appreciation (depreciation) on: | | | |
| | Investments | | 265,479,075 | |
| | Foreign currency translations and forward foreign currency
exchange contracts | | 14,185 | |
| | Credit default swap contracts | | 1,231,309 | |
| | Futures contracts | | 1,405,085 | |
| | | | | |
| | Net change in unrealized appreciation (depreciation) | | 268,129,654 | |
| | | | | |
| | Net Gain | | 313,273,335 | |
| | |
| | | | | |
| | Net Increase Resulting from Operations | | 423,170,028 | |
See Accompanying Notes to Financial Statements.
28
Statement of Changes in Net Assets – Columbia Intermediate Bond Fund
| | | | | | | | |
| | | | | Year Ended March 31, | |
| Increase (Decrease) in Net Assets | | | | 2010 ($) | | | 2009 ($) | |
| Operations | | Net investment income | | 109,896,693 | | | 124,197,647 | |
| | Net realized gain (loss) on investments, futures contracts, credit default swap contracts, foreign currency transactions and forward foreign currency exchange contracts | | 45,143,681 | | | (83,818,928 | ) |
| | Net change in unrealized appreciation (depreciation) on investments, futures contracts, credit default swap contracts, foreign currency translations and forward foreign currency exchange contracts | | 268,129,654 | | | (195,085,329 | ) |
| | | | | | | | |
| | Net increase (decrease) resulting from operations | | 423,170,028 | | | (154,706,610 | ) |
| | | |
| Distributions to Shareholders | | From net investment income: | | | | | | |
| | Class A | | (8,661,981 | ) | | (9,455,771 | ) |
| | Class B | | (1,657,924 | ) | | (2,075,339 | ) |
| | Class C | | (1,539,099 | ) | | (1,548,169 | ) |
| | Class R | | (91,882 | ) | | (86,795 | ) |
| | Class Z | | (106,473,961 | ) | | (109,356,195 | ) |
| | From net realized gains: | | | | | | |
| | Class A | | — | | | (428,610 | ) |
| | Class B | | — | | | (112,718 | ) |
| | Class C | | — | | | (77,526 | ) |
| | Class R | | — | | | (3,556 | ) |
| | Class Z | | — | | | (4,770,651 | ) |
| | | | | | | | |
| | Total distributions to shareholders | | (118,424,847 | ) | | (127,915,330 | ) |
| | | |
| | Net Capital Stock Transactions | | (39,345,318 | ) | | (344,521,048 | ) |
| | Increase from regulatory settlements | | 62,349 | | | — | |
| | | | | | | | |
| | Total increase (decrease) in net assets | | 265,462,212 | | | (627,142,988 | ) |
| | | |
| Net Assets | | Beginning of period | | 1,934,792,567 | | | 2,561,935,555 | |
| | End of period | | 2,200,254,779 | | | 1,934,792,567 | |
| | Undistributed net investment income at end of period | | 3,578,700 | | | 8,446,917 | |
See Accompanying Notes to Financial Statements.
29
Statement of Changes in Net Assets (continued) – Columbia Intermediate Bond Fund
| | | | | | | | | | | | | | |
| | | Capital Stock Activity | |
| | | Year Ended March 31, 2010 | | | | | Year Ended March 31, 2009 | |
| | | | | | | | |
| | | Shares | | | Dollars ($) | | | | | Shares | | | Dollars ($) | |
Class A | | | | | | | | | | | | | | |
Subscriptions | | 4,024,261 | | | 34,577,227 | | | | | 5,724,124 | | | 46,402,459 | |
Distributions reinvested | | 925,715 | | | 7,967,506 | | | | | 1,139,701 | | | 9,237,323 | |
Redemptions | | (6,581,064 | ) | | (55,926,745 | ) | | | | (10,781,223 | ) | | (86,748,875 | ) |
| | | | | | | | | | | | | | |
Net decrease | | (1,631,088 | ) | | (13,382,012 | ) | | | | (3,917,398 | ) | | (31,109,093 | ) |
| | | | | |
Class B | | | | | | | | | | | | | | |
Subscriptions | | 261,450 | | | 2,231,931 | | | | | 609,747 | | | 4,920,689 | |
Distributions reinvested | | 145,598 | | | 1,250,813 | | | | | 204,400 | | | 1,659,409 | |
Redemptions | | (1,716,488 | ) | | (14,622,868 | ) | | | | (2,429,542 | ) | | (19,594,906 | ) |
| | | | | | | | | | | | | | |
Net decrease | | (1,309,440 | ) | | (11,140,124 | ) | | | | (1,615,395 | ) | | (13,014,808 | ) |
| | | | | |
Class C | | | | | | | | | | | | | | |
Subscriptions | | 568,812 | | | 4,851,110 | | | | | 1,157,218 | | | 9,303,741 | |
Distributions reinvested | | 118,250 | | | 1,017,027 | | | | | 137,760 | | | 1,115,502 | |
Redemptions | | (1,318,313 | ) | | (11,247,492 | ) | | | | (1,498,243 | ) | | (12,062,419 | ) |
| | | | | | | | | | | | | | |
Net decrease | | (631,251 | ) | | (5,379,355 | ) | | | | (203,265 | ) | | (1,643,176 | ) |
| | | | | |
Class R | | | | | | | | | | | | | | |
Subscriptions | | 133,154 | | | 1,145,681 | | | | | 108,792 | | | 860,902 | |
Distributions reinvested | | 6,664 | | | 57,659 | | | | | 5,099 | | | 41,108 | |
Redemptions | | (186,232 | ) | | (1,602,433 | ) | | | | (62,638 | ) | | (496,769 | ) |
| | | | | | | | | | | | | | |
Net increase (decrease) | | (46,414 | ) | | (399,093 | ) | | | | 51,253 | | | 405,241 | |
| | | | | |
Class Z | | | | | | | | | | | | | | |
Subscriptions | | 47,943,504 | | | 410,119,481 | | | | | 48,434,868 | | | 396,931,752 | |
Distributions reinvested | | 5,832,159 | | | 50,260,132 | | | | | 6,663,306 | | | 54,039,194 | |
Redemptions | | (55,004,873 | ) | | (469,424,347 | ) | | | | (92,954,379 | ) | | (750,130,158 | ) |
| | | | | | | | | | | | | | |
Net decrease | | (1,229,210 | ) | | (9,044,734 | ) | | | | (37,856,205 | ) | | (299,159,212 | ) |
See Accompanying Notes to Financial Statements.
30
Financial Highlights – Columbia Intermediate Bond Fund
Selected data for a share outstanding throughout each period is as follows:
| | | | | | | | | | | | | | | | | | | | |
| | | Year Ended March 31, | |
| Class A Shares | | 2010 | | | 2009 | | | 2008 | | | 2007 | | | 2006 | |
Net Asset Value, Beginning of Period | | $ | 7.72 | | | $ | 8.71 | | | $ | 8.84 | | | $ | 8.74 | | | $ | 8.96 | |
| | | | | |
Income from Investment Operations: | | | | | | | | | | | | | | | | | | | | |
Net investment income (a) | | | 0.43 | | | | 0.43 | | | | 0.43 | | | | 0.42 | | | | 0.39 | |
Net realized and unrealized gain (loss) on investments, foreign currency, futures contracts and credit default swap contracts | | | 1.26 | | | | (0.97 | ) | | | (0.13 | ) | | | 0.11 | | | | (0.20 | ) |
| | | | | | | | | | | | | | | | | | | | |
Total from investment operations | | | 1.69 | | | | (0.54 | ) | | | 0.30 | | | | 0.53 | | | | 0.19 | |
| | | | | |
Less Distributions to Shareholders: | | | | | | | | | | | | | | | | | | | | |
From net investment income | | | (0.46 | ) | | | (0.43 | ) | | | (0.43 | ) | | | (0.43 | ) | | | (0.41 | ) |
From net realized gains | | | — | | | | (0.02 | ) | | | — | | | | — | | | | — | |
| | | | | | | | | | | | | | | | | | | | |
Total distributions to shareholders | | | (0.46 | ) | | | (0.45 | ) | | | (0.43 | ) | | | (0.43 | ) | | | (0.41 | ) |
| | | | | |
Increase from regulatory settlements | | | — | (b) | | | — | | | | — | | | | — | | | | — | |
| | | | | |
Net Asset Value, End of Period | | $ | 8.95 | | | $ | 7.72 | | | $ | 8.71 | | | $ | 8.84 | | | $ | 8.74 | |
Total return (c)(d) | | | 22.31 | % | | | (6.34 | )% | | | 3.48 | % | | | 6.21 | %(e) | | | 2.12 | % |
| | | | | |
Ratios to Average Net Assets/Supplemental Data: | | | | | | | | | | | | | | | | | | | | |
Net expenses before interest expense (f) | | | 0.90 | % | | | 0.89 | % | | | 0.88 | % | | | 0.87 | % | | | 0.89 | % |
Interest expense | | | — | %(g) | | | — | %(g) | | | — | | | | — | | | | — | |
Net expenses (f) | | | 0.90 | % | | | 0.89 | % | | | 0.88 | % | | | 0.87 | % | | | 0.89 | % |
Waiver/Reimbursement | | | 0.10 | % | | | 0.10 | % | | | 0.10 | % | | | 0.10 | % | | | 0.10 | % |
Net investment income (f) | | | 5.01 | % | | | 5.33 | % | | | 4.88 | % | | | 4.83 | % | | | 4.36 | % |
Portfolio turnover rate | | | 160 | % | | | 137 | % | | | 266 | % | | | 150 | % | | | 126 | % |
Net assets, end of period (000s) | | $ | 163,333 | | | $ | 153,435 | | | $ | 207,215 | | | $ | 206,147 | | | $ | 199,376 | |
| (a) | Per share data was calculated using the average shares outstanding during the period. |
| (b) | Rounds to less than $0.01 per share. |
| (c) | Total return at net asset value assuming all distributions reinvested and no initial sales charge or contingent deferred sales charge. |
| (d) | Had the investment advisor and/or any of its affiliates not waived fees or reimbursed a portion of expenses, total return would have been reduced. |
| (e) | Total return includes a voluntary reimbursement by the investment advisor for a realized investment loss due to a trading error. This reimbursement increased total return and net asset value per share by less than 0.01% and less than $0.01, respectively. |
| (f) | The benefits derived from expense reductions had an impact of less than 0.01%. |
| (g) | Rounds to less than 0.01%. |
See Accompanying Notes to Financial Statements.
31
Financial Highlights – Columbia Intermediate Bond Fund
Selected data for a share outstanding throughout each period is as follows:
| | | | | | | | | | | | | | | | | | | | |
| | | Year Ended March 31, | |
| Class B Shares | | 2010 | | | 2009 | | | 2008 | | | 2007 | | | 2006 | |
Net Asset Value, Beginning of Period | | $ | 7.72 | | | $ | 8.71 | | | $ | 8.84 | | | $ | 8.74 | | | $ | 8.96 | |
| | | | | |
Income from Investment Operations: | | | | | | | | | | | | | | | | | | | | |
Net investment income (a) | | | 0.37 | | | | 0.37 | | | | 0.36 | | | | 0.36 | | | | 0.32 | |
Net realized and unrealized gain (loss) on investments, foreign currency, futures contracts and credit default swap contracts | | | 1.26 | | | | (0.97 | ) | | | (0.12 | ) | | | 0.10 | | | | (0.20 | ) |
| | | | | | | | | | | | | | | | | | | | |
Total from investment operations | | | 1.63 | | | | (0.60 | ) | | | 0.24 | | | | 0.46 | | | | 0.12 | |
| | | | | |
Less Distributions to Shareholders: | | | | | | | | | | | | | | | | | | | | |
From net investment income | | | (0.40 | ) | | | (0.37 | ) | | | (0.37 | ) | | | (0.36 | ) | | | (0.34 | ) |
From net realized gains | | | — | | | | (0.02 | ) | | | — | | | | — | | | | — | |
| | | | | | | | | | | | | | | | | | | | |
Total distributions to shareholders | | | (0.40 | ) | | | (0.39 | ) | | | (0.37 | ) | | | (0.36 | ) | | | (0.34 | ) |
| | | | | |
Increase from regulatory settlements | | | — | (b) | | | — | | | | — | | | | — | | | | — | |
| | | | | |
Net Asset Value, End of Period | | $ | 8.95 | | | $ | 7.72 | | | $ | 8.71 | | | $ | 8.84 | | | $ | 8.74 | |
Total return (c) | | | 21.41 | % | | | (7.04 | )% | | | 2.72 | % | | | 5.42 | %(d) | | | 1.36 | % |
| | | | | |
Ratios to Average Net Assets/Supplemental Data: | | | | | | | | | | | | | | | | | | | | |
Net expenses before interest expense (e) | | | 1.65 | % | | | 1.64 | % | | | 1.63 | % | | | 1.62 | % | | | 1.64 | % |
Interest expense | | | — | %(f) | | | — | %(f) | | | — | | | | — | | | | — | |
Net expenses (e) | | | 1.65 | % | | | 1.64 | % | | | 1.63 | % | | | 1.62 | % | | | 1.64 | % |
Net investment income (e) | | | 4.29 | % | | | 4.59 | % | | | 4.14 | % | | | 4.08 | % | | | 3.61 | % |
Portfolio turnover rate | | | 160 | % | | | 137 | % | | | 266 | % | | | 150 | % | | | 126 | % |
Net assets, end of period (000s) | | $ | 31,476 | | | $ | 37,247 | | | $ | 56,087 | | | $ | 63,617 | | | $ | 74,332 | |
| (a) | Per share data was calculated using the average shares outstanding during the period. |
| (b) | Rounds to less than $0.01 per share. |
| (c) | Total return at net asset value assuming all distributions reinvested and no contingent deferred sales charge. |
| (d) | Total return includes a voluntary reimbursement by the investment advisor for a realized investment loss due to a trading error. This reimbursement increased total return and net asset value per share by less than 0.01% and less than $0.01, respectively. |
| (e) | The benefits derived from expense reductions had an impact of less than 0.01%. |
| (f) | Rounds to less than 0.01%. |
See Accompanying Notes to Financial Statements.
32
Financial Highlights – Columbia Intermediate Bond Fund
Selected data for a share outstanding throughout each period is as follows:
| | | | | | | | | | | | | | | | | | | | |
| | | Year Ended March 31, | |
| Class C Shares | | 2010 | | | 2009 | | | 2008 | | | 2007 | | | 2006 | |
Net Asset Value, Beginning of Period | | $ | 7.72 | | | $ | 8.71 | | | $ | 8.84 | | | $ | 8.74 | | | $ | 8.96 | |
| | | | | |
Income from Investment Operations: | | | | | | | | | | | | | | | | | | | | |
Net investment income (a) | | | 0.38 | | | | 0.39 | | | | 0.37 | | | | 0.37 | | | | 0.34 | |
Net realized and unrealized gain (loss) on investments, foreign currency, futures contracts and credit default swap contracts | | | 1.26 | | | | (0.98 | ) | | | (0.12 | ) | | | 0.11 | | | | (0.20 | ) |
| | | | | | | | | | | | | | | | | | | | |
Total from investment operations | | | 1.64 | | | | (0.59 | ) | | | 0.25 | | | | 0.48 | | | | 0.14 | |
| | | | | |
Less Distributions to Shareholders: | | | | | | | | | | | | | | | | | | | | |
From net investment income | | | (0.41 | ) | | | (0.38 | ) | | | (0.38 | ) | | | (0.38 | ) | | | (0.36 | ) |
From net realized gains | | | — | | | | (0.02 | ) | | | — | | | | — | | | | — | |
| | | | | | | | | | | | | | | | | | | | |
Total distributions to shareholders | | | (0.41 | ) | | | (0.40 | ) | | | (0.38 | ) | | | (0.38 | ) | | | (0.36 | ) |
| | | | | |
Increase from regulatory settlements | | | — | (b) | | | — | | | | — | | | | — | | | | — | |
| | | | | |
Net Asset Value, End of Period | | $ | 8.95 | | | $ | 7.72 | | | $ | 8.71 | | | $ | 8.84 | | | $ | 8.74 | |
Total return (c)(d) | | | 21.59 | % | | | (6.91 | )% | | | 2.87 | % | | | 5.58 | %(e) | | | 1.51 | % |
| | | | | |
Ratios to Average Net Assets/Supplemental Data: | | | | | | | | | | | | | | | | | | | | |
Net expenses before interest expense (f) | | | 1.50 | % | | | 1.49 | % | | | 1.48 | % | | | 1.47 | % | | | 1.49 | % |
Interest expense | | | — | %(g) | | | — | %(g) | | | — | | | | — | | | | — | |
Net expenses (f) | | | 1.50 | % | | | 1.49 | % | | | 1.48 | % | | | 1.47 | % | | | 1.49 | % |
Waiver/Reimbursement | | | 0.15 | % | | | 0.15 | % | | | 0.15 | % | | | 0.15 | % | | | 0.15 | % |
Net investment income (f) | | | 4.43 | % | | | 4.74 | % | | | 4.28 | % | | | 4.23 | % | | | 3.76 | % |
Portfolio turnover rate | | | 160 | % | | | 137 | % | | | 266 | % | | | 150 | % | | | 126 | % |
Net assets, end of period (000s) | | $ | 30,731 | | | $ | 31,372 | | | $ | 37,164 | | | $ | 35,458 | | | $ | 39,641 | |
| (a) | Per share data was calculated using the average shares outstanding during the period. |
| (b) | Rounds to less than $0.01 per share. |
| (c) | Total return at net asset value assuming all distributions reinvested and no contingent deferred sales charge. |
| (d) | Had the investment advisor and/or any of its affiliates not waived fees or reimbursed a portion of expenses, total return would have been reduced. |
| (e) | Total return includes a voluntary reimbursement by the investment advisor for a realized investment loss due to a trading error. This reimbursement increased total return and net asset value per share by less than 0.01% and less than $0.01, respectively. |
| (f) | The benefits derived from expense reductions had an impact of less than 0.01%. |
| (g) | Rounds to less than 0.01%. |
See Accompanying Notes to Financial Statements.
33
Financial Highlights – Columbia Intermediate Bond Fund
Selected data for a share outstanding throughout each period is as follows:
| | | | | | | | | | | | | | | | | | | | |
| | | Year Ended March 31, | | | Period
Ended
March 31, | |
| Class R Shares | | 2010 | | | 2009 | | | 2008 | | | 2007 | | | 2006 (a) | |
Net Asset Value, Beginning of Period | | $ | 7.72 | | | $ | 8.71 | | | $ | 8.84 | | | $ | 8.74 | | | $ | 8.91 | |
| | | | | |
Income from Investment Operations: | | | | | | | | | | | | | | | | | | | | |
Net investment income (b) | | | 0.41 | | | | 0.41 | | | | 0.40 | | | | 0.39 | | | | 0.06 | |
Net realized and unrealized gain (loss) on investments, foreign currency, futures contracts and credit default swap contracts | | | 1.26 | | | | (0.97 | ) | | | (0.12 | ) | | | 0.12 | | | | (0.15 | ) |
| | | | | | | | | | | | | | | | | | | | |
Total from investment operations | | | 1.67 | | | | (0.56 | ) | | | 0.28 | | | | 0.51 | | | | (0.09 | ) |
| | | | | |
Less Distributions to Shareholders: | | | | | | | | | | | | | | | | | | | | |
From net investment income | | | (0.44 | ) | | | (0.41 | ) | | | (0.41 | ) | | | (0.41 | ) | | | (0.08 | ) |
From net realized gains | | | — | | | | (0.02 | ) | | | — | | | | — | | | | — | |
| | | | | | | | | | | | | | | | | | | | |
Total distributions to shareholders | | | (0.44 | ) | | | (0.43 | ) | | | (0.41 | ) | | | (0.41 | ) | | | (0.08 | ) |
| | | | | |
Increase from regulatory settlements | | | — | (c) | | | — | | | | — | | | | — | | | | — | |
| | | | | |
Net Asset Value, End of Period | | $ | 8.95 | | | $ | 7.72 | | | $ | 8.71 | | | $ | 8.84 | | | $ | 8.74 | |
Total return (d) | | | 22.01 | % | | | (6.58 | )% | | | 3.24 | % | | | 5.94 | %(e) | | | (1.06 | )%(f) |
| | | | | |
Ratios to Average Net Assets/Supplemental Data: | | | | | | | | | | | | | | | | | | | | |
Net expenses before interest expense (g) | | | 1.15 | % | | | 1.14 | % | | | 1.13 | % | | | 1.12 | % | | | 1.30 | %(h) |
Interest expense | | | — | %(i) | | | — | %(i) | | | — | | | | — | | | | — | |
Net expenses (g) | | | 1.15 | % | | | 1.14 | % | | | 1.13 | % | | | 1.12 | % | | | 1.30 | %(h) |
Net investment income (g) | | | 4.78 | % | | | 5.11 | % | | | 4.60 | % | | | 4.45 | % | | | 3.25 | %(h) |
Portfolio turnover rate | | | 160 | % | | | 137 | % | | | 266 | % | | | 150 | % | | | 126 | %(f) |
Net assets, end of period (000s) | | $ | 1,694 | | | $ | 1,819 | | | $ | 1,606 | | | $ | 42 | | | $ | 10 | |
| (a) | Class R shares were initially offered on January 23, 2006. |
| (b) | Per share data was calculated using the average shares outstanding during the period. |
| (c) | Rounds to less than $0.01 per share. |
| (d) | Total return at net asset value assuming all distributions reinvested. |
| (e) | Total return includes a voluntary reimbursement by the investment advisor for a realized investment loss due to a trading error. This reimbursement increased total return and net asset value per share by less than 0.01% and less than $0.01, respectively. |
| (g) | The benefits derived from expense reductions had an impact of less than 0.01%. |
| (i) | Rounds to less than 0.01%. |
See Accompanying Notes to Financial Statements.
34
Financial Highlights – Columbia Intermediate Bond Fund
Selected data for a share outstanding throughout each period is as follows:
| | | | | | | | | | | | | | | | | | | | |
| | | Year Ended March 31, | |
| Class Z Shares | | 2010 | | | 2009 | | | 2008 | | | 2007 | | | 2006 | |
Net Asset Value, Beginning of Period | | $ | 7.72 | | | $ | 8.71 | | | $ | 8.84 | | | $ | 8.74 | | | $ | 8.96 | |
| | | | | |
Income from Investment Operations: | | | | | | | | | | | | | | | | | | | | |
Net investment income (a) | | | 0.45 | | | | 0.45 | | | | 0.45 | | | | 0.45 | | | | 0.41 | |
Net realized and unrealized gain (loss) on investments, foreign currency, futures contracts and credit default swap contracts | | | 1.26 | | | | (0.97 | ) | | | (0.13 | ) | | | 0.10 | | | | (0.20 | ) |
| | | | | | | | | | | | | | | | | | | | |
Total from investment operations | | | 1.71 | | | | (0.52 | ) | | | 0.32 | | | | 0.55 | | | | 0.21 | |
| | | | | |
Less Distributions to Shareholders: | | | | | | | | | | | | | | | | | | | | |
From net investment income | | | (0.48 | ) | | | (0.45 | ) | | | (0.45 | ) | | | (0.45 | ) | | | (0.43 | ) |
From net realized gains | | | — | | | | (0.02 | ) | | | — | | | | — | | | | — | |
| | | | | | | | | | | | | | | | | | | | |
Total distributions to shareholders | | | (0.48 | ) | | | (0.47 | ) | | | (0.45 | ) | | | (0.45 | ) | | | (0.43 | ) |
| | | | | |
Increase from regulatory settlements | | | — | (b) | | | — | | | | — | | | | — | | | | — | |
| | | | | |
Net Asset Value, End of Period | | $ | 8.95 | | | $ | 7.72 | | | $ | 8.71 | | | $ | 8.84 | | | $ | 8.74 | |
Total return (c) | | | 22.62 | % | | | (6.11 | )% | | | 3.74 | % | | | 6.48 | %(d) | | | 2.37 | % |
| | | | | |
Ratios to Average Net Assets/Supplemental Data: | | | | | | | | | | | | | | | | | | | | |
Net expenses before interest expense (e) | | | 0.65 | % | | | 0.64 | % | | | 0.63 | % | | | 0.62 | % | | | 0.64 | % |
Interest expense | | | — | %(f) | | | — | %(f) | | | — | | | | — | | | | — | |
Net expenses (e) | | | 0.65 | % | | | 0.64 | % | | | 0.63 | % | | | 0.62 | % | | | 0.64 | % |
Net investment income (e) | | | 5.26 | % | | | 5.58 | % | | | 5.13 | % | | | 5.08 | % | | | 4.63 | % |
Portfolio turnover rate | | | 160 | % | | | 137 | % | | | 266 | % | | | 150 | % | | | 126 | % |
Net assets, end of period (000s) | | $ | 1,973,020 | | | $ | 1,710,920 | | | $ | 2,259,863 | | | $ | 1,894,798 | | | $ | 1,379,320 | |
| (a) | Per share data was calculated using the average shares outstanding during the period. |
| (b) | Rounds to less than $0.01 per share. |
| (c) | Total return at net asset value assuming all distributions reinvested. |
| (d) | Total return includes a voluntary reimbursement by the investment advisor for a realized investment loss due to a trading error. This reimbursement increased total return and net asset value per share by less than 0.01% and less than $0.01, respectively. |
| (e) | The benefits derived from expense reductions had an impact of less than 0.01%. |
| (f) | Rounds to less than 0.01%. |
See Accompanying Notes to Financial Statements.
35
Notes to Financial Statements – Columbia Intermediate Bond Fund
March 31, 2010
Note 1. Organization
Columbia Intermediate Bond Fund (the “Fund”), a series of Columbia Funds Series Trust I (the “Trust”), is a diversified fund. The Trust is registered under the Investment Company Act of 1940, as amended (the “1940 Act”), as an open-end management investment company organized as a Massachusetts business trust.
Investment Objective
The Fund seeks total return, consisting of current income and capital appreciation.
Fund Shares
The Trust may issue an unlimited number of shares, and the Fund offers five classes of shares: Class A, Class B, Class C, Class R and Class Z. Each share class has its own expense structure and sales charges, as applicable. Effective June 22, 2009, the Fund no longer accepts investments in Class B shares from new or existing investors in the Fund’s Class B shares, except in connection with the reinvestment of any dividend and/or capital gain distributions in Class B shares of the Fund and exchanges by existing Class B shareholders of the other Columbia Funds.
Class A shares are subject to a maximum front-end sales charge of 3.25% based on the amount of initial investment. Class A shares purchased without an initial sales charge in accounts aggregating $1 million to $50 million at the time of purchase are subject to a 1.00% contingent deferred sales charge (“CDSC”) if the shares are sold within one year after purchase. Class B shares are subject to a maximum CDSC of 3.00% based upon the holding period after purchase. Class B shares will convert to Class A shares eight years after purchase. Class C shares are subject to a 1.00% CDSC on shares sold within one year after purchase. Class R and Class Z shares are offered continuously at net asset value. There are certain restrictions on the purchase of Class R and Class Z shares, as described in the Fund’s prospectus.
Note 2. Significant Accounting Policies
The preparation of financial statements in accordance with accounting principles generally accepted in the United States of America (“GAAP”) requires management to make certain estimates and assumptions that affect the reported amounts of assets and liabilities, the disclosure of contingent assets and liabilities at the date of the financial statements and the reported amounts of revenue and expenses during the reporting period. Actual results could differ from those estimates.
The following is a summary of significant accounting policies consistently followed by the Fund in the preparation of its financial statements.
Security Valuation
Debt securities generally are valued by pricing services approved by the Trust’s Board of Trustees, based upon market transactions for normal, institutional-size trading units of similar securities. The services may use various pricing techniques which take into account appropriate factors such as yield, quality, coupon rate, maturity, type of issue, trading characteristics and other data, as well as broker quotes. Debt securities for which quotations are readily available may also be valued based upon an over-the-counter or exchange bid quotation.
Certain debt securities, which tend to be more thinly traded and of lesser quality, are priced based on fundamental analysis of the financial condition of the issuer and the estimated value of any collateral. Valuations developed through pricing techniques may vary from the actual amounts realized upon sale of the securities, and the potential variation may be greater for those securities valued using fundamental analysis.
Equity securities are valued at the last sale price on the principal exchange on which they trade, except for securities traded on the NASDAQ, which are valued at the NASDAQ official close price. Unlisted securities or listed securities for which there were no sales during the day are valued at the closing bid price on such exchanges or over-the-counter markets.
Short-term investments maturing in 60 days or less are valued at amortized cost, which approximates market value.
Futures contracts are valued at the settlement price established each day by the board of trade or exchange on which they are traded.
Forward foreign currency exchange contracts are valued at the prevailing forward exchange rate of the underlying currencies.
Credit default swap contracts are marked to market daily based upon spread quotations from market makers.
Foreign securities are generally valued at the last sale price on the foreign exchange or market on which they trade. If any
36
Columbia Intermediate Bond Fund
March 31, 2010
foreign share prices are not readily available as a result of limited share activity, the securities are valued at the last sale price of the local shares in the principal market in which such securities are normally traded.
Generally, trading in foreign securities is substantially completed each day at various times prior to the close of the New York Stock Exchange (“NYSE”). The values of such securities used in computing the net asset value of the Fund’s shares are determined as of such times. Foreign currency exchange rates are generally determined at 4:00 p.m. Eastern (U.S.) time. Occasionally, events affecting the values of such foreign securities may occur between the times at which they are determined and the close of the customary trading session of the NYSE, which would not be reflected in the computation of the Fund’s net asset value. If events materially affecting the values of such foreign securities occur and it is determined that market quotations are not reliable, then these foreign securities will be valued at their fair value using procedures approved by the Board of Trustees.
Investments for which market quotations are not readily available, or that have quotations which management believes are not reliable, are valued at fair value as determined in good faith under consistently applied procedures established by and under the general supervision of the Board of Trustees. If a security is valued at fair value, such value is likely to be different from the last quoted market price for the security. The determination of fair value often requires significant judgment. To determine fair value, management may use assumptions including but not limited to future cash flows and estimated risk premiums. Multiple inputs from various sources may be used to determine value.
GAAP establishes a hierarchy that prioritizes the inputs to valuation techniques used to measure fair value giving the highest priority to unadjusted quoted prices in active markets for identical securities (level 1 measurements) and the lowest priority to unobservable inputs (level 3 measurements) when market prices are not readily available or reliable. The three levels of the fair value hierarchy are described below:
| | • | | Level 1 – quoted prices in active markets for identical securities | |
| | • | | Level 2 – prices determined using other significant observable inputs (including quoted prices for similar securities, interest rates, prepayment speeds, credit risk and others) | |
| | • | | Level 3 – prices determined using significant unobservable inputs. In situations where quoted prices or observable inputs are unavailable or less reliable, unobservable inputs may be used. Unobservable inputs may include management’s own assumptions about the factors market participants would use in pricing an investment. | |
The inputs or methodology used for valuing securities are not necessarily an indication of the risk associated with investing in those securities.
On January 21, 2010, the FASB issued an Accounting Standards Update (the amendment), Fair Value Measurements and Disclosures (Topic 820): Improving Disclosures about Fair Value Measurements, which provides guidance on how investment assets and liabilities are to be valued and disclosed. Specifically, the amendment requires reporting entities to disclose the input and valuation techniques used to measure fair value for both recurring and nonrecurring fair value measurements for Level 2 or Level 3 positions. The amendment also requires that transfers between all levels (including Level 1 and Level 2) be disclosed on a gross basis (i.e., transfers out must be disclosed separately from transfers in), and the reason(s) for the transfer. Additionally purchases, sales, issuances and settlements must be disclosed on a gross basis in the Level 3 rollforward. The effective date of the amendment is for interim and annual periods beginning after December 15, 2009, however, the requirement to provide the Level 3 activity for purchases, sales, issuances and settlements on a gross basis will be effective for interim and annual periods beginning after December 15, 2010. At this time, management is evaluating the implications of the amendment and the impact to the financial statements.
Security Transactions
Security transactions are accounted for on the trade date. Cost is determined and gains (losses) are based upon the specific identification method for both financial statement and federal income tax purposes.
Derivative Instruments
The Fund may invest in derivative instruments. For additional information on derivative instruments, please see Note 6.
37
Columbia Intermediate Bond Fund
March 31, 2010
Repurchase Agreements
The Fund may engage in repurchase agreement transactions with institutions that Columbia Management Advisors, LLC (“Columbia”), the Fund’s investment advisor, has determined are creditworthy. The Fund, through its custodian, receives delivery of the underlying securities collateralizing a repurchase agreement. Columbia is responsible for determining that the collateral is at least equal, at all times, to the value of the repurchase obligation including interest. A repurchase agreement transaction involves certain risks in the event of default or insolvency of the counterparty. These risks include possible delays in or restrictions on the Fund’s ability to dispose of the underlying securities and a possible decline in the value of the underlying securities during the period while the Fund seeks to assert its rights.
Loan Participations and Commitments
The Fund may invest in loan participations. When a Fund purchases a loan participation, the Fund typically enters into a contractual relationship with the lender or third party selling such participation (“Selling Participant”), but not the borrower. However, the Fund assumes the credit risk of the borrower, Selling Participant and any other persons interpositioned between the Fund and the borrower. The Fund may not directly benefit from the collateral supporting the senior loan which it has purchased from the Selling Participant.
Mortgage Dollar Roll Transactions
The Fund may enter into mortgage “dollar rolls” in which the Fund sells securities for delivery in the current month and simultaneously contracts with the same counterparty to repurchase similar (same type, coupon and maturity) but not identical securities on a specified future date not exceeding 120 days. During the roll period, the Fund loses the right to receive principal and interest paid on the securities sold. However, the Fund would benefit to the extent of any difference between the price received for the securities sold and the lower forward price for the future purchase (often referred to as the “drop”) or fee income plus the interest earned on the cash proceeds of the securities sold until the settlement date of the forward purchase. Unless such benefits exceed the income, capital appreciation and gain or loss due to mortgage prepayments that would have been realized on the securities sold as part of the mortgage dollar roll, the use of this technique will diminish the investment performance of the Fund compared with what such performance would have been without the use of mortgage dollar rolls. All cash proceeds will be invested in instruments that are permissible investments for the Fund. The Fund identifies within its portfolio of investments cash or liquid securities in an amount equal to the forward purchase price.
The Fund’s policy is to record the components of mortgage dollar rolls using “to be announced” mortgage-backed securities. For financial reporting and tax purposes, the Fund treats mortgage dollar rolls as two separate transactions, one involving the purchase of a security and a separate transaction involving a sale. The Fund does not currently enter into mortgage dollar rolls that are accounted for as financing transactions.
Mortgage dollar rolls involve certain risks. If the broker-dealer to whom the Fund sells the securities becomes insolvent, the Fund’s right to purchase or repurchase the mortgage-related securities may be restricted and the instruments which the Fund is required to repurchase may be worth less than instruments which the Fund originally held. Successful use of mortgage dollar rolls may depend upon the investment advisor’s ability to predict correctly interest rates and mortgage prepayments. For these reasons, there is no assurance that mortgage dollar rolls can be successfully employed.
Delayed Delivery Securities
The Fund may trade securities on other than normal settlement terms, including securities purchased or sold on a “when-issued” basis. This may increase the risk if the other party to the transaction fails to deliver and causes the Fund to subsequently invest at less advantageous prices. The Fund identifies within its portfolio of investments cash or liquid securities in an amount equal to the delayed delivery commitment.
Stripped Securities
Stripped mortgage-backed securities are derivative multi-class mortgage securities structured so that one class receives most, if not all, of the principal from the underlying mortgage assets, while the other class receives most, if not all, of the interest and the remainder of the principal. If the underlying mortgage assets experience greater than anticipated prepayments of principal, the Fund may fail to
38
Columbia Intermediate Bond Fund
March 31, 2010
fully recoup its initial investment in an interest-only security. The market value of these securities can be extremely volatile in response to changes in interest rates. Credit risk reflects the risk that the Fund may not receive all or part of its principal because the issuer or credit enhancer has defaulted on its obligation.
Foreign Currency Transactions and Translations
The values of all assets and liabilities quoted in foreign currencies are translated into U.S. dollars at that day’s exchange rates. Net realized and unrealized gains (losses) on foreign currency transactions and translations include gains (losses) arising from the fluctuation in exchange rates between trade and settlement dates on securities transactions, gains (losses) arising from the disposition of foreign currency and currency gains (losses) between the accrual and payment dates on dividends, interest income and foreign withholding taxes.
For financial statement purposes, the Fund does not distinguish that portion of gains (losses) on investments which is due to changes in foreign exchange rates from that which is due to changes in market prices of the investments. Such fluctuations are included with the net realized and unrealized gains (losses) on investments on the Statement of Operations.
Income Recognition
Interest income is recorded on the accrual basis and includes accretion of discounts, amortization of premiums and paydown gains and losses. Fee income attributable to mortgage dollar roll transactions is recorded on the accrual basis over the term of the transaction. The value of additional securities received as an income payment is recorded as income and as the cost basis of such securities.
Expenses
General expenses of the Trust are allocated to the Fund and other series of the Trust based upon relative net assets or other expense allocation methodologies determined by the nature of the expense. Expenses directly attributable to the Fund are charged to the Fund.
Determination of Class Net Asset Value
All income, expenses (other than class-specific expenses, as shown on the Statement of Operations) and realized and unrealized gains (losses) are allocated to each class of the Fund on a daily basis for purposes of determining the net asset value of each class. Income and expenses are allocated to each class based on the settled shares method, while realized and unrealized gains (losses) are allocated based on the relative net assets of each class.
Federal Income Tax Status
The Fund intends to qualify each year as a “regulated investment company” under Subchapter M of the Internal Revenue Code, as amended, and will distribute substantially all of its tax exempt or taxable income, if any, for its tax year, and as such will not be subject to federal income taxes. In addition, the Fund intends to distribute in each calendar year substantially all of its net investment income, capital gains and certain other amounts, if any, such that the Fund should not be subject to federal excise tax. Therefore, no federal income or excise tax provision is recorded.
Distributions to Shareholders
Distributions from net investment income are declared daily and paid monthly. Net realized capital gains, if any, are distributed at least annually. Income distributions and capital gain distributions are determined in accordance with federal income tax regulations which may differ from GAAP.
Indemnification
In the normal course of business, the Fund enters into contracts that contain a variety of representations and warranties and which provide general indemnities. The Fund’s maximum exposure under these arrangements is unknown because this would involve future claims against the Fund. Also, under the Trust’s organizational documents and by contract, the Trustees and officers of the Trust are indemnified against certain liabilities that may arise out of actions relating to their duties to the Trust. However, based on experience, the Fund expects the risk of loss due to these representations, warranties and indemnities to be minimal.
Note 3. Federal Tax Information
The timing and character of income and capital gain distributions are determined in accordance with income tax regulations, which may differ from GAAP. Reclassifications are made to the Fund’s capital accounts for permanent tax differences to reflect income and gains available for distribution (or available capital loss carryforwards) under income tax regulations.
39
Columbia Intermediate Bond Fund
March 31, 2010
For the year ended March 31, 2010, permanent book and tax basis differences resulting primarily from differing treatments for foreign currency transactions, market discount accretion/premium amortization on debt securities and paydown adjustments were identified and reclassified among the components of the Fund’s net assets as follows:
| | | | | |
| | | | | |
Overdistributed Net Investment
Income | | Accumulated Net Realized
Loss | | Paid-In Capital |
| $3,659,937 | | $(3,659,937) | | $ | — |
Net investment income and net realized gains (losses), as disclosed on the Statement of Operations, and net assets were not affected by this reclassification.
The tax character of distributions paid during the years ended March 31, 2010 and March 31, 2009 was as follows:
| | | | | | |
| | | March 31, 2010 | | March 31, 2009 |
| Distributions paid from: | | |
Ordinary Income* | | $ | 118,424,847 | | $ | 127,915,330 |
| * | For tax purposes short-term capital gain distributions, if any, are considered ordinary income distributions. |
As of March 31, 2010, the components of distributable earnings on a tax basis were as follows:
| | | | | | |
| | | | | |
Undistributed
Ordinary Income | | Undistributed Long-Term Capital Gains | | Net
Unrealized Appreciation* |
| $11,783,799 | | $ | — | | $ | 15,437,341 |
| * | The differences between book-basis and tax-basis net unrealized appreciation are primarily due to deferral of losses from wash sales. |
Unrealized appreciation and depreciation at March 31, 2010, based on cost of investments for federal income tax purposes were:
| | | | |
| | | | |
Unrealized appreciation | | $ | 97,429,250 | |
Unrealized depreciation | | | (81,991,909 | ) |
Net unrealized appreciation | | $ | 15,437,341 | |
The following capital loss carryforwards may be available to reduce taxable income arising from future net realized gains on investments, if any, to the extent permitted by the Internal Revenue Code:
| | | |
| | | |
| Year of Expiration | | Capital Loss Carryforwards |
| 2017 | | $ | 45,710,830 |
| 2018 | | | 3,475,333 |
| | | |
| Total | | $ | 49,186,163 |
| | | |
Management is required to determine whether a tax position of the Fund is more likely than not to be sustained upon examination by the applicable taxing authority, including resolution of any related appeals or litigation processes, based on the technical merits of the position. The tax benefit to be recognized by the Fund is measured as the largest amount of benefit that is greater than fifty percent likely of being realized upon ultimate settlement. Management is not aware of any tax positions for which it is reasonably possible that the total amounts of unrecognized tax benefits will significantly change in the next twelve months. However, management’s conclusions may be subject to review and adjustment at a later date based on factors including, but not limited to, new tax laws, regulations, and administrative interpretations (including relevant court decisions). The Fund’s federal tax returns for the prior three fiscal years remain subject to examination by the Internal Revenue Service.
Note 4. Fees and Compensation Paid to Affiliates
Investment Advisory Fee
Columbia, an indirect, wholly owned subsidiary of Bank of America Corporation (“BOA”) provides investment advisory services to the Fund. Columbia receives a monthly investment advisory fee based on the Fund’s average daily net assets at the following annual rates:
| | | |
| | | | |
| Average Daily Net Assets | | Annual Fee Rate | |
First $1 billion | | 0.35 | % |
$1 billion to $1.5 billion | | 0.30 | % |
$1.5 billion to $3 billion | | 0.29 | % |
$3 billion to $6 billion | | 0.28 | % |
Over $6 billion | | 0.27 | % |
For the year ended March 31, 2010, the Fund’s effective investment advisory fee rate was 0.32% of the Fund’s average daily net assets.
40
Columbia Intermediate Bond Fund
March 31, 2010
Bank of America, N.A., an indirect parent company of Columbia, entered into an agreement dated September 29, 2009, to sell a portion of the asset management business of Columbia Management Group, LLC to Ameriprise Financial, Inc. (“Ameriprise Financial”). The transaction (“Transaction”) includes the sale of the part of the asset management business that advises long-term mutual funds, including the Fund. The Transaction is subject to certain approvals and other conditions to closing, and is currently expected to close on or about April 30, 2010 (the “Closing”).
In connection with the Closing, certain changes will occur, including a change in the entities serving as the investment advisor, administrator, distributor and transfer agent of the Fund. RiverSource Investments, LLC (the “New Advisor”), a subsidiary of Ameriprise Financial, will become the investment advisor of the Fund upon the Closing. On March 3, 2010, the Fund’s shareholders approved, among other matters, the proposed investment management services agreement with the New Advisor. The New Advisor will serve as investment advisor under a new investment management services agreement effective upon the Closing. The New Advisor will change its name to Columbia Management Investment Advisers, LLC upon or shortly after the Closing. Effective upon the Closing, as the context requires, references to Columbia shall be deemed to refer to the New Advisor.
Administration Fee
Columbia provides administrative and other services to the Fund for a monthly administration fee at the annual rate of 0.15% of the Fund’s average daily net assets.
The New Advisor will become the administrator of the Fund under a new administrative services agreement effective upon the Closing.
Pricing and Bookkeeping Fees
The Fund has entered into a Financial Reporting Services Agreement (the “Financial Reporting Services Agreement”) with State Street Bank and Trust Company (“State Street”) and Columbia pursuant to which State Street provides financial reporting services to the Fund. The Fund has also entered into an Accounting Services Agreement (collectively with the Financial Reporting Services Agreement, the “State Street Agreements”) with State Street and Columbia pursuant to which State Street provides accounting services to the Fund. Under the State Street Agreements, the Fund pays State Street an annual fee of $38,000 paid monthly plus an additional monthly fee based on an annualized percentage rate of average daily net assets of the Fund for the month. The aggregate fee will not exceed $140,000 per year (exclusive of out-of-pocket expenses and charges). The Fund also reimburses State Street for certain out-of-pocket expenses and charges.
Among other updates to the State Street Agreements, Columbia will assign and delegate its rights and obligations thereunder to the New Advisor upon the Closing.
The Fund has entered into a Pricing and Bookkeeping Oversight and Services Agreement (the “Services Agreement”) with Columbia. Under the Services Agreement, Columbia provides services related to Fund expenses and the requirements of the Sarbanes-Oxley Act of 2002, and provides oversight of the accounting and financial reporting services provided by State Street. Under the Services Agreement, the Fund reimburses Columbia for out-of-pocket expenses.
The Services Agreement will be terminated upon the Closing, and the services provided thereunder will be covered under the administrative services agreement with the New Advisor.
Transfer Agent Fee
Columbia Management Services, Inc. (the “Transfer Agent”), an affiliate of Columbia and an indirect, wholly owned subsidiary of BOA, provides shareholder services to the Fund and has contracted with Boston Financial Data Services (“BFDS”) to serve as sub-transfer agent. Effective November 1, 2009, the Transfer Agent is entitled to receive a fee for its services, paid monthly, at the annual rate of $22.36 per account plus reimbursement of certain sub-transfer agent fees paid by the Transfer Agent (exclusive of BFDS fees), calculated based on assets held in omnibus accounts and intended to recover the cost of payments to other parties (including affiliates of BOA) for services to those accounts. Prior to November 1, 2009, the annual rate was $17.34 per account. The Transfer Agent pays the fees of BFDS for services as sub-transfer agent and is not entitled to reimbursement for such fees from the Fund.
The Transfer Agent may also retain, as additional compensation for its services, fees for wire, telephone and redemption orders, Individual Retirement Account (“IRA”) trustee agent fees and account transcript fees due to the Transfer Agent from shareholders of the Fund and credits
41
Columbia Intermediate Bond Fund
March 31, 2010
(net of bank charges) earned with respect to balances in accounts the Transfer Agent maintains in connection with its services to the Fund. The Transfer Agent also receives reimbursement for certain out-of-pocket expenses.
RiverSource Service Corporation (the “New Transfer Agent”), a subsidiary of Ameriprise Financial, will become the transfer agent of the Fund upon the Closing. The New Transfer Agent will change its name to Columbia Management Investment Services Corp. upon or shortly after the Closing.
An annual minimum account balance fee of $20 may apply to certain accounts with a value below the Fund’s initial minimum investment requirements to reduce the impact of small accounts on transfer agent fees. These minimum account balance fees are recorded as part of expense reductions on the Statement of Operations. For the year ended March 31, 2010, no minimum account balance fees were charged by the Fund.
Underwriting Discounts, Service and Distribution Fees
Columbia Management Distributors, Inc. (the “Distributor”), an affiliate of Columbia and an indirect, wholly owned subsidiary of BOA, is the principal underwriter of the Fund’s shares. For the year ended March 31, 2010, the Distributor has retained net underwriting discounts of $9,732 on sales of the Fund’s Class A shares and received net CDSC fees of $100, $20,653 and $3,191 on Class A, Class B and Class C share redemptions, respectively.
RiverSource Fund Distributors, Inc. (the “New Distributor”), a subsidiary of Ameriprise Financial, will become the distributor of the Fund upon the Closing. The New Distributor will change its name to Columbia Management Investment Distributors, Inc. upon or shortly after the Closing.
The Fund has adopted plans pursuant to Rule 12b-1 under the 1940 Act (the “Plans”) which require the payment of a monthly service fee to the Distributor at the maximum annual rate of 0.25% of the average daily net assets attributable to Class A, Class B and Class C shares of the Fund. The Plans also require the payment of a monthly distribution fee to the Distributor at the maximum annual rates of 0.10%, 0.75%, 0.75% and 0.50% of the average daily net assets attributable to Class A, Class B, Class C and Class R shares, respectively. The Distributor has voluntarily agreed to waive a portion of the distribution and service fees for Class A shares of the Fund so that the combined fee will not exceed 0.25% annually of Class A average daily net assets. The Distributor has also voluntarily agreed to waive a portion of the distribution and service fees for Class C shares so that the combined fee will not exceed 0.85% annually of Class C average daily net assets. These arrangements may be modified or terminated by the Distributor at any time.
The CDSC and the distribution fees received from the Plans are used principally as repayment to the Distributor for amounts paid by the Distributor to dealers who sold such shares.
Fee Waivers and Expense Reimbursements
Columbia has voluntarily agreed to reimburse a portion of the Fund’s expenses so that the Fund’s ordinary operating expenses (excluding any distribution and service fees, brokerage commissions, interest, taxes and extraordinary expenses, but including custodian charges relating to overdrafts, if any), after giving effect to any balance credits from the Fund’s custodian, do not exceed 0.70% of the Fund’s average daily net assets on an annualized basis. Columbia, in its discretion, may revise or discontinue this arrangement at any time.
Fees Paid to Officers and Trustees
All officers of the Fund are employees of Columbia or its affiliates and, with the exception of the Fund’s Chief Compliance Officer, receive no compensation from the Fund. The Board of Trustees has appointed a Chief Compliance Officer to the Fund in accordance with federal securities regulations. The Fund, along with other affiliated funds, pays its pro-rata share of the expenses associated with the Chief Compliance Officer. The Fund’s expenses for the Chief Compliance Officer will not exceed $15,000 per year.
Trustees are compensated for their services to the Fund, as set forth on the Statement of Operations. The Trust’s eligible Trustees may participate in a deferred compensation plan which may be terminated at any time. Obligations of the plan will be paid solely out of the Fund’s assets.
Note 5. Custody Credits
The Fund has an agreement with its custodian bank under which custody fees may be reduced by balance credits. These
42
Columbia Intermediate Bond Fund
March 31, 2010
credits are recorded as part of expense reductions on the Statement of Operations. The Fund could have invested a portion of the assets utilized in connection with the expense offset arrangement in an income-producing asset if it had not entered into such an agreement. For the year ended March 31, 2010, these custody credits reduced total expenses by $174 for the Fund.
Note 6. Objectives and Strategies for Investing in Derivative Instruments
The Fund uses derivatives instruments including futures contracts, credit default swaps and forward foreign currency contracts in order to meet its investment objectives. The Fund employs strategies in differing combinations to permit it to increase, decrease or change the level of exposure to market risk factors. The achievement of any strategy relating to derivatives depends on an analysis of various risk factors, and if the strategies for the use of derivatives do not work as intended, the Fund may not achieve its investment objectives.
In pursuit of its investment objectives, the Fund is exposed to the following market risks:
Interest Rate Risk: Interest rate risk relates to the fluctuation in value of fixed income securities because of the inverse relationship of price and yield. Fixed income securities generally will decline in value upon an increase in general interest rates and their value generally will increase upon a decline in general interest rates. Fixed income securities with longer durations tend to be more sensitive to changes in interest rates, usually making them more volatile than securities with shorter durations.
Foreign Exchange Rate Risk: Foreign exchange rate risk relates to the change in the U.S. dollar value of a security held that is denominated in a foreign currency. The U.S. dollar value of a foreign-currency-denominated security will decrease as the dollar appreciates against the currency, while the U.S. dollar value will increase as the dollar depreciates against the currency.
Credit Risk: Credit risk relates to the ability of the issuer or guarantor of a fixed income security, or counterparty to a derivative contract to make timely principal and/or interest payments, or to otherwise honor its obligations. Securities are subject to varying degrees of credit risk, which are often reflected in credit ratings. Generally, lower-yield higher-quality bonds are subject to credit risk to a lesser extent than lower-grade higher-yield bonds.
The following notes provide more detailed information about each derivative type held by the Fund:
Futures Contracts — The Fund entered into interest rate futures contracts to manage the duration and yield curve exposure of the Fund versus the benchmark.
The use of futures contracts involves certain risks, which include, among others: (1) imperfect correlation between the price movement of the instruments and the underlying securities, (2) inability to close out positions due to differing trading hours, or the temporary absence of a liquid market, for either the instruments or the underlying securities, and (3) an inaccurate prediction of the future direction of interest rates by Columbia.
Upon entering into a futures contract, the Fund pledges cash or securities in an amount sufficient to meet the initial margin requirement. Subsequent payments are made or received by the Fund equal to the daily change in the contract value and are recorded as variation margin receivable or payable and offset in unrealized gains or losses. The Fund recognizes a realized gain or loss when the contract is closed or expires.
Futures contracts involve, to varying degrees, risk of loss in excess of the variation margin disclosed on the Statement of Assets and Liabilities.
During the year ended March 31, 2010, the Fund entered into 13,410 futures contracts.
Forward Foreign Currency Exchange Contracts — The Fund entered into forward foreign currency exchange contracts to shift its investment exposure from one currency to another.
Forward foreign currency exchange contracts are agreements to exchange one currency for another at a future date at a specified price. These contracts are used to minimize the exposure to foreign exchange rate fluctuations during the period between the trade and settlement dates of the contract. The Fund may utilize forward foreign currency exchange contracts in connection with the settlement of purchases and sales of securities. The Fund may also enter into these contracts to reduce the exposure to adverse price movements
43
Columbia Intermediate Bond Fund
March 31, 2010
in certain other foreign-currency-denominated assets. Contracts to buy generally are used to acquire exposure to foreign currencies, while contracts to sell are generally used to reduce the exposure to foreign exchange rate fluctuations. Forward foreign currency exchange contracts are valued daily at the current exchange rate of the underlying currency, resulting in unrealized gains (losses) which become realized at the time the forward foreign currency exchange contracts are closed or mature. Realized and unrealized gains (losses) arising from such transactions are included in net realized and unrealized gains (losses) on foreign currency transactions. The use of forward foreign currency exchange contracts does not eliminate fluctuations in the prices of the Fund’s portfolio securities. While the maximum potential loss from such contracts is the aggregate face value in U.S. dollars at the time the contract was opened, exposure is typically limited to the change in value of the contract (in U.S. dollars) over the period it remains open. The Fund could also be exposed to risk that counterparties of the contracts may be unable to fulfill the terms of the contracts.
During the year ended March 31, 2010, the Fund entered into 40 forward foreign currency exchange contracts.
Credit Default Swap Contracts — The Fund entered into credit default swap transactions as a protection buyer to reduce overall credit exposure.
Credit default swaps are agreements in which one party pays fixed periodic payments to a counterparty in consideration for a guarantee from the counterparty to make a specific payment should a negative credit event take place. The Fund may receive or make an upfront payment as the protection buyer or seller. Credit default swaps are marked to market daily based on quotations from market makers and any change is recorded as unrealized appreciation/depreciation on the Statement of Assets and Liabilities. Periodic payments received or made are recorded as a realized gain or loss and premiums received or made are amortized on the Statement of Operations.
If the Fund is a buyer of protection and a credit event occurs, as defined under the terms of that particular swap agreement, the Fund will either (i) receive from the seller of protection an amount equal to the notional amount of the swap and deliver the referenced obligation or underlying securities comprising the referenced index or (ii) receive a net settlement amount in the form of cash or securities equal to the notional amount of the swap less the recovery value of the referenced obligation or underlying securities comprising the referenced index.
If the Fund is a seller of protection and a credit event occurs, as defined under the terms of that particular swap agreement, the Fund will either (i) pay to the buyer of protection an amount equal to the notional amount of the swap and take delivery of the referenced obligation or underlying securities comprising the referenced index or (ii) pay a net settlement amount in the form of cash or securities equal to the notional amount of the swap less the recovery value of the referenced obligation or underlying securities comprising the referenced index.
Credit default swap agreements involve greater risks than if the Fund had invested in the reference obligation directly since, in addition to general market risks, credit default swaps are subject to illiquidity risk, counterparty risk and credit risk.
During the year ended March 31, 2010, the Fund purchased credit default swaps with a notional amount of $608,195,000.
The following table is a summary of the value of the Fund’s derivative instruments as of March 31, 2010.
| | | | | | | | | | | |
| | | Fair Value of Derivative Instruments | |
Statement of Assets and Liabilities | |
| | | Assets | | Fair Value | | Liabilities | | Fair Value | |
Futures
variation
margin | | — | | $ | — | | Futures
variation
margin | | $ | 673,546 | * |
Forward
foreign
currency
exchange
contracts | | Unrealized
appreciation | | | 11,102 | | Unrealized
depreciation | | | — | |
| | Open credit
default
swaps/
Premiums | | | 4,144,082 | | Open credit
default
swaps/
Premiums | | | 1,549,122 | |
| * | Includes only the current day’s variation margin. |
44
Columbia Intermediate Bond Fund
March 31, 2010
The effect of derivative instruments on the Fund’s Statement of Operations for the year ended March 31, 2010:
| | | | | | | | | |
| | | | | | | | |
| | | Amount of Realized Gain or (Loss) and
Change in Unrealized Appreciation or
(Depreciation) on Derivatives
Recognized in Income |
| | | Risk
Exposure | | Net
Realized Gain (Loss) | | | Change in Unrealized Appreciation (Depreciation) |
| Futures Contracts | | Interest
Rate | | $ | 4,018,960 | | | $ | 1,405,085 |
| Forward Foreign Currency Exchange Contracts | | Foreign
Exchange
Rate | | | 8,742 | | | | 14,543 |
| Credit Default Swap Contracts | | Credit | | | (15,392,042 | ) | | | 1,231,309 |
Note 7. Portfolio Information
For the year ended March 31, 2010, the cost of purchases and proceeds from sales of securities, excluding short-term obligations, for the Fund were $3,307,114,126 and $3,401,134,753, respectively, of which $1,628,929,794 and $1,649,956,453, respectively, were U.S. Government securities.
Note 8. Regulatory Settlements
During the year ended March 31, 2010, the Fund received payments totaling $62,349 relating to certain regulatory settlements with third parties that the Fund had participated in during the year. The payments have been included in “Increase from regulatory settlements” on the Statement of Changes in Net Assets.
Note 9. Line of Credit
The Fund and other affiliated funds participate in a $280,000,000 committed, unsecured revolving line of credit provided by State Street. The maximum amount that may be borrowed by any fund is limited to the lesser of $200,000,000 and the Fund’s borrowing limit set forth in the Fund’s registration statement. Borrowings are available for short-term liquidity or temporary or emergency purposes.
Effective October 15, 2009, interest is charged to each participating fund based on the fund’s borrowings at a rate per annum equal to the greater of the Federal Funds Rate plus 1.25% or the overnight LIBOR Rate plus 1.25%. In addition, a commitment fee of 0.15% per annum is accrued and apportioned among the participating funds pro rata based on their relative net assets.
Prior to October 15, 2009, interest was charged to each participating fund based on the fund’s borrowings at a rate per annum equal to the greater of the Federal Funds Rate plus 0.50% or the overnight LIBOR Rate plus 0.50%. In addition, an annual operations agency fee of $20,000, an amendment fee of 0.02% and a commitment fee of 0.12% per annum were accrued and apportioned among the participating funds pro rata based on their relative net assets.
For the year ended March 31, 2010, the average daily loan balance outstanding on days where borrowing existed was $1,700,000 at a weighted average interest rate of 0.74%.
Note 10. Securities Lending
The Fund may lend its securities to certain approved brokers, dealers and other financial institutions. Each loan is collateralized by cash, in an amount at least equal to the market value of the securities loaned plus accrued income from the investment of collateral. The market value of the loaned securities is determined at the close of business of the Fund and any additional required collateral is delivered to the Fund on the next business day. The collateral received is invested and the income generated by the investment of the collateral, net of any fees remitted to State Street as the lending agent and borrower rebates, is paid to the Fund. Generally, in the event of borrower default, the Fund has the right to use the collateral to offset any losses incurred. In the event the Fund is delayed or prevented from exercising its right to dispose of the collateral, there may be a potential loss to the Fund. The Fund bears the risk of loss with respect to the investment of collateral.
Note 11. Shares of Beneficial Interest
As of March 31, 2010, 45.3% of the Fund’s shares outstanding were beneficially owned by one participant account over which BOA and/or any of its affiliates had either sole or joint investment discretion.
As of March 31, 2010, the Fund had two shareholders that collectively held 13.9% of the shares outstanding, over which
45
Columbia Intermediate Bond Fund
March 31, 2010
BOA and/or any of its affiliates did not have investment discretion.
As of March 31, 2010, no other shareholder owned more than 5% of the outstanding shares of the Fund. Subscription and redemption activity of these accounts may have a significant effect on the operations of the Fund.
Note 12. Significant Risks and Contingencies
Sector Focus Risk
The Fund may focus its investments in certain sectors, subjecting it to greater risk than a fund that is less focused.
High-Yield Securities Risk
Investing in high-yield securities may involve greater credit risk and considerations not typically associated with investing in U.S. Government bonds and other higher quality fixed income securities. These securities are non-investment grade securities, often referred to as “junk” bonds. Economic downturns may disrupt the high yield market and impair the ability of issuers to repay principal and interest. Also, an increase in interest rates would likely have an adverse impact on the value of such obligations. Moreover, high-yield securities may be less liquid to the extent that there is no established secondary market.
Asset-Backed Securities Risk
The value of asset-backed securities may be affected by, among other factors, changes in interest rates, the market’s assessment of the quality of underlying assets, the creditworthiness of the servicer for the underlying assets, factors concerning the interests in and structure of the issuer or the originator of the underlying assets, or the creditworthiness or rating of the entities that provide any supporting letters of credit, surety bonds, derivative instruments, or other credit enhancement. The value of asset-backed securities also will be affected by the exhaustion, termination or expiration of any credit enhancement. Most asset-backed securities are subject to prepayment risk, which is the possibility that the underlying debt may be refinanced or prepaid prior to maturity during periods of declining or low interest rates, causing the Fund to have to reinvest the money received in securities that have lower yields. In addition, the impact of prepayments on the value of asset-backed securities may be difficult to predict and may result in greater volatility.
Mortgage-Backed Securities Risk
The value of mortgage-backed securities may be affected by, among other things, changes in interest rates, factors concerning the interests in and structure of the issuer or the originator of the mortgages, the creditworthiness of the entities that provide any supporting letters of credit, surety bonds or other credit enhancements or the quality of underlying assets or the market’s assessment thereof. Mortgage-backed securities are subject to prepayment risk, which is the possibility that the underlying mortgage may be refinanced or prepaid prior to maturity during periods of declining or low interest rates, causing the Fund to have to reinvest the money received in securities that have lower yields. In addition, the impact of prepayments on the value of mortgage-backed securities may be difficult to predict and may result in greater volatility.
Information Regarding Pending and Settled Legal Proceedings
In June 2004, an action captioned John E. Gallus et al. v. American Express Financial Corp. and American Express Financial Advisors Inc. was filed in the United States District Court for the District of Arizona. The plaintiffs allege that they are investors in several American Express Company (now known as RiverSource) mutual funds and they purport to bring the action derivatively on behalf of those funds under the Investment Company Act of 1940. The plaintiffs allege that fees allegedly paid to the defendants by the funds for investment advisory and administrative services are excessive. The plaintiffs seek remedies including restitution and rescission of investment advisory and distribution agreements. The plaintiffs voluntarily agreed to transfer this case to the United States District Court for the District of Minnesota (the District Court). In response to defendants’ motion to dismiss the complaint, the District Court dismissed one of plaintiffs’ four claims and granted plaintiffs limited discovery. Defendants moved for summary judgment in April 2007. Summary judgment was granted in the defendants’ favor on July 9, 2007. The plaintiffs filed a notice of appeal with the Eighth Circuit Court of Appeals (the Eighth Circuit) on August 8, 2007. On April 8, 2009, the Eighth Circuit reversed summary judgment and remanded to the District
46
Columbia Intermediate Bond Fund
March 31, 2010
Court for further proceedings. On August 6, 2009, defendants filed a writ of certiorari with the U.S. Supreme Court (the Supreme Court), asking the Supreme Court to stay the District Court proceedings while the Supreme Court considers and rules in a case captioned Jones v. Harris Associates, which involves issues of law similar to those presented in the Gallus case. On March 30, 2010, the Supreme Court issued its ruling in Jones v. Harris Associates, and on April 5, 2010, the Supreme Court vacated the Eighth Circuit’s decision in the Gallus case and remanded the case to the Eighth Circuit for further consideration in light of the Supreme Court’s decision in Jones v. Harris Associates.
In December 2005, without admitting or denying the allegations, American Express Financial Corporation (AEFC, which is now known as Ameriprise Financial, Inc. (Ameriprise Financial)), entered into settlement agreements with the Securities and Exchange Commission (SEC) and Minnesota Department of Commerce (MDOC) related to market timing activities. As a result, AEFC was censured and ordered to cease and desist from committing or causing any violations of certain provisions of the Investment Advisers Act of 1940, the Investment Company Act of 1940, and various Minnesota laws. AEFC agreed to pay disgorgement of $10 million and civil money penalties of $7 million. AEFC also agreed to retain an independent distribution consultant to assist in developing a plan for distribution of all disgorgement and civil penalties ordered by the SEC in accordance with various undertakings detailed at http://www.sec.gov/litigation/admin/ia-2451.pdf. Ameriprise Financial and its affiliates have cooperated with the SEC and the MDOC in these legal proceedings, and have made regular reports to the RiverSource Funds’ Boards of Directors/Trustees.
On November 7, 2008, RiverSource Investments, LLC, a subsidiary of Ameriprise Financial, Inc., acquired J. & W. Seligman & Co. Incorporated (Seligman). In late 2003, Seligman conducted an extensive internal review concerning mutual fund trading practices. Seligman’s review, which covered the period 2001-2003, noted one arrangement that permitted frequent trading in certain open-end registered investment companies managed by Seligman (the Seligman Funds); this arrangement was in the process of being closed down by Seligman before September 2003. Seligman identified three other arrangements that permitted frequent trading, all of which had been terminated by September 2002. In January 2004, Seligman, on a voluntary basis, publicly disclosed these four arrangements to its clients and to shareholders of the Seligman Funds. Seligman also provided information concerning mutual fund trading practices to the SEC and the Office of the Attorney General of the State of New York (NYAG).
In September 2006, the NYAG commenced a civil action in New York State Supreme Court against Seligman, Seligman Advisors, Inc. (now known as RiverSource Fund Distributors, Inc.), Seligman Data Corp. and Brian T. Zino (collectively, the Seligman Parties), alleging, in substance, that the Seligman Parties permitted various persons to engage in frequent trading and, as a result, the prospectus disclosure used by the registered investment companies then managed by Seligman was and had been misleading. The NYAG included other related claims and also claimed that the fees charged by Seligman to the Seligman Funds were excessive. On March 13, 2009, without admitting or denying any violations of law or wrongdoing, the Seligman Parties entered into a stipulation of settlement with the NYAG and settled the claims made by the NYAG. Under the terms of the settlement, Seligman paid $11.3 million to four Seligman Funds. This settlement resolved all outstanding matters between the Seligman Parties and the NYAG. In addition to the foregoing matter, the New York staff of the SEC indicated in September 2005 that it was considering recommending to the Commissioners of the SEC the instituting of a formal action against Seligman and Seligman Advisors, Inc. relating to frequent trading in the Seligman Funds. Seligman responded to the staff in October 2005 that it believed that any action would be both inappropriate and unnecessary, especially in light of the fact that Seligman had previously resolved the underlying issue with the Independent Directors of the Seligman Funds and made recompense to the affected Seligman Funds. There have been no further developments with the SEC on this matter.
Ameriprise Financial and certain of its affiliates have historically been involved in a number of legal, arbitration and regulatory proceedings, including routine litigation, class actions, and governmental actions, concerning matters arising in connection with the conduct of their business activities. Ameriprise Financial believes that the Funds are not currently the subject of, and that neither Ameriprise Financial nor any of its affiliates are the subject of, any pending legal, arbitration or regulatory proceedings that are likely to have a material adverse effect on the Funds or the ability of Ameriprise Financial or its affiliates to perform
47
Columbia Intermediate Bond Fund
March 31, 2010
under their contracts with the Funds. Ameriprise Financial is required to make 10-Q, 10-K and, as necessary, 8-K filings with the Securities and Exchange Commission on legal and regulatory matters that relate to Ameriprise Financial and its affiliates. Copies of these filings may be obtained by accessing the SEC website at www.sec.gov.
There can be no assurance that these matters, or the adverse publicity associated with them, will not result in increased fund redemptions, reduced sale of fund shares or other adverse consequences to the Funds. Further, although we believe proceedings are not likely to have a material adverse effect on the Funds or the ability of Ameriprise Financial or its affiliates to perform under their contracts with the Funds, these proceedings are subject to uncertainties and, as such, we are unable to estimate the possible loss or range of loss that may result. An adverse outcome in one or more of these proceedings could result in adverse judgments, settlements, fines, penalties or other relief that could have a material adverse effect on the consolidated financial condition or results of operations of Ameriprise Financial.
Note 13. Subsequent Events
In connection with the preparation of the financial statements of the Fund as of and for the fiscal year ended March 31, 2010, events and transactions through the date the financial statements were issued have been evaluated by the Fund’s management for possible adjustment and/or disclosure. No subsequent events or transactions have occurred that would require adjustment of the financial statements as presented. On April 30, 2010, the Transaction disclosed in Note 4 closed. Effective May 1, 2010, the New Advisor became the investment advisor and administrator of the Fund and subsequently changed its name to Columbia Management Investment Advisers, LLC. On that date, the New Transfer Agent became the transfer agent of the Fund and changed its name to Columbia Management Investment Services Corp. Also on that date, the New Distributor became the distributor of the Fund and changed its name to Columbia Management Investment Distributors, Inc.
48
Report of Independent Registered Public Accounting Firm
To the Trustees of Columbia Funds Series Trust I and the Shareholders of Columbia Intermediate Bond Fund
In our opinion, the accompanying statement of assets and liabilities, including the investment portfolio, and the related statements of operations and of changes in net assets and the financial highlights present fairly, in all material respects, the financial position of Columbia Intermediate Bond Fund (the “Fund”) (a series of Columbia Funds Series Trust I) at March 31, 2010, and the results of its operations, the changes in its net assets and the financial highlights for the periods indicated, in conformity with accounting principles generally accepted in the United States of America. These financial statements and financial highlights (hereafter referred to as “financial statements”) are the responsibility of the Fund’s management. Our responsibility is to express an opinion on these financial statements based on our audits. We conducted our audits of these financial statements in accordance with the standards of the Public Company Accounting Oversight Board (United States). Those standards require that we plan and perform the audit to obtain reasonable assurance about whether the financial statements are free of material misstatement. An audit includes examining, on a test basis, evidence supporting the amounts and disclosures in the financial statements, assessing the accounting principles used and significant estimates made by management, and evaluating the overall financial statement presentation. We believe that our audits, which included confirmation of securities at March 31, 2010 by correspondence with the custodian and brokers, provide a reasonable basis for our opinion.
PricewaterhouseCoopers LLP
Boston, Massachusetts
May 21, 2010
49
Fund Governance
The Trustees serve terms of indefinite duration. The names, addresses and ages of the Trustees and Officers of the Funds in Columbia Funds Series Trust I, the year each was first elected or appointed to office, their principal business occupations during at least the last five years, the number of Funds overseen by each Trustee and other directorships they hold are shown below. Each officer listed below serves as an officer of each Fund in the Columbia Funds Complex.
Independent Trustees
| | |
Name, Address and Year of
Birth, Position with Funds, Year
First Elected or Appointed to Office | | Principal Occupation(s) During Past Five Years, Number of Funds in the
Columbia Funds Complex Overseen by Trustee, Other Directorships Held |
| |
| John D. Collins (Born 1938) | | |
c/o Columbia Management Advisors, LLC One Financial Center Boston, MA 02111 Trustee (since 2005) | | Retired. Consultant, KPMG, LLP (accounting and tax firm) from July 1999 to June 2000; Partner, KPMG, LLP from March 1962 to June 1999. Oversees 65; Mrs. Fields Famous Brands LLC (consumer products); Suburban Propane Partners, L.P.; and Montpelier Re (insurance underwriting firm) |
| |
| Rodman L. Drake (Born 1943) | | |
c/o Columbia Management Advisors, LLC One Financial Center Boston, MA 02111 Trustee (since 1994) and Chairman of the Board (since 2009) | | Co-Founder of Baringo Capital LLC (private equity) since 2002; CEO of Crystal River Capital Inc. (real estate investment trust) since 2003; President, Continuation Investments Group, Inc. from 1997 to 2001. Oversees 65; Jackson Hewitt Tax Service Inc. (tax preparation services); Crystal Capital River Inc. (real estate investment trust); Student Loan Corporation (student loan provider); Celgene Corporation (global biotechnology company); and The Helios Funds (exchange-traded funds) |
| |
| Douglas A. Hacker (Born 1955) | | |
c/o Columbia Management Advisors, LLC One Financial Center Boston, MA 02111 Trustee (since 1996) | | Independent business executive since May 2006; Executive Vice President–Strategy of United Airlines (airline) from December 2002 to May 2006; President of UAL Loyalty Services (airline marketing company) from September 2001 to December 2002; Executive Vice President and Chief Financial Officer of United Airlines from July 1999 to September 2001. Oversees 65; Nash Finch Company (food distributor); Aircastle Limited (aircraft leasing) |
|
| Janet Langford Kelly (Born 1957) |
c/o Columbia Management Advisors, LLC One Financial Center Boston, MA 02111 Trustee (since 1996) | | Senior Vice President, General Counsel and Corporate Secretary, ConocoPhillips (integrated energy company) since September 2007; Deputy General Counsel–Corporate Legal Services, ConocoPhillips from August 2006 to August 2007; Partner, Zelle, Hofmann, Voelbel, Mason & Gette LLP (law firm) from March 2005 to July 2006; Adjunct Professor of Law, Northwestern University, from September 2004 to June 2006; Director, UAL Corporation (airline) from February 2006 to July 2006; Oversees 65; None |
| |
| Charles R. Nelson (Born 1942) | | |
c/o Columbia Management Advisors, LLC One Financial Center Boston, MA 02111 Trustee (since 1981) | | Professor of Economics, University of Washington, since January 1976; Ford and Louisa Van Voorhis Professor of Political Economy, University of Washington, since September 1993; Adjunct Professor of Statistics, University of Washington, since September 1980; Associate Editor, Journal of Money Credit and Banking, 1993-2008 Consultant on econometric and statistical matters. Oversees 65; None |
50
Fund Governance (continued)
Independent Trustees (continued)
| | |
Name, Address and Year of
Birth, Position with Funds, Year
First Elected or Appointed to Office | | Principal Occupation(s) During Past Five Years, Number of Funds in the
Columbia Funds Complex Overseen by Trustee, Other Directorships Held |
| |
| John J. Neuhauser (Born 1943) | | |
c/o Columbia Management Advisors, LLC One Financial Center Boston, MA 02111 Trustee (since 1984) | | President, Saint Michael’s College, since August 2007; University Professor, Boston College from November 2005 to August 2007; Academic Vice President and Dean of Faculties, Boston College from August 1999 to October 2005. Oversees 65; Liberty All-Star Equity Fund and Liberty All-Star Growth Fund, Inc. (closed-end funds) |
| |
| Jonathan Piel (Born 1938) | | |
c/o Columbia Management Advisors, LLC One Financial Center Boston, MA 02111 Trustee (since 1994) | | Cable television producer and website designer; The Editor, Scientific American from 1984 to 1994; Vice President, Scientific American, Inc., from 1984 to 1994; Member, Advisory Board, Stone Age Institute, Bloomington, Indiana (research institute that explores the effect of technology on human evolution); Member, Board of Directors of the National Institute of Social Sciences, New York City; Member, Board of Trustees of the William Alanson White Institute, New York City (institution for training psychoanalysts); and Member, Advisory Board, Mount Sinai Children’s Environmental Health Center, New York. Oversees 65; None |
| |
| Patrick J. Simpson (Born 1944) | | |
c/o Columbia Management Advisors, LLC One Financial Center Boston, MA 02111 Trustee (since 2000) | | Partner, Perkins Coie LLP (law firm). Oversees 65; None |
| |
| Anne-Lee Verville (Born 1945) | | |
c/o Columbia Management Advisors, LLC One Financial Center Boston, MA 02111 Trustee (since 1998) | | Retired since 1997 (formerly General Manager–Global Education Industry (from 1994 to 1997), President–Application Systems Division (from 1991 to 1994), Chief Financial Officer–US Marketing & Services (from 1988 to 1991), and Chief Information Officer (from 1987 to 1988), IBM Corporation (computer and technology)). Oversees 65; None |
Interested Trustee
| | |
| |
| William E. Mayer1 (Born 1940) | | |
c/o Columbia Management Advisors, LLC One Financial Center Boston, MA 02111 Trustee (since 1994) | | Partner, Park Avenue Equity Partners (private equity) since February 1999; Dean and Professor, College of Business, University of Maryland from 1992 to 1997. Oversees 65; Lee Enterprises (print media), WR Hambrecht + Co. (financial service provider); BlackRock Kelso Capital Corporation (investment company) |
| 1 | The Funds currently treat Mr. Mayer as an “interested person” (as defined in the Investment Company Act of 1940) by reason of his affiliation with WR Hambrecht + Co., a registered broker/dealer that may execute portfolio transactions for or engage in principal transactions with the Funds or other funds or accounts advised/managed by the Advisor or other Bank of America affiliates. |
The Statement of Additional Information includes additional information about the Trustees of the Funds and is available, without charge, upon request by calling 1-800-345-6611.
51
Fund Governance (continued)
Officers
| | |
| Name, Year of Birth and Address | | Principal Occupation(s) During the Past Five Years |
| |
| J. Kevin Connaughton (Born 1964) | | |
One Financial Center Boston, MA 02111 President (since 2009) | | Senior Vice President and General Manager–Mutual Fund Products, Columbia Management Investment Advisers, LLC since May 2010; President, Columbia Funds, since 2009, and RiverSource Funds, since May 2010 (previously Senior Vice President and Chief Financial Officer, Columbia Funds, from June 2008 to January 2009, Treasurer, Columbia Funds, from October 2003 to May 2008, and senior officer of various other affiliated funds since 2000); Managing Director, Columbia Management Advisors, LLC from December 2004 to April 2010. |
| |
| Michael G. Clarke (Born 1969) | | |
One Financial Center Boston, MA 02111 Senior Vice President and Chief Financial Officer (since 2009) | | Vice President, Columbia Management Investment Advisers, LLC since May 2010; Managing Director of Fund Administration, Columbia Management Advisors, LLC, from September 2004 to April 2010; senior officer of Columbia Funds and affiliated funds since 2002. |
| |
| Scott R. Plummer (Born 1959) | | |
5228 Ameriprise Financial Center Minneapolis, MN 55474 Senior Vice President, Secretary and Chief Legal Officer (since 2010) | | Chief Legal Officer and Assistant Secretary, Columbia Management Investment Advisers, LLC since June 2005; Vice President and Lead Chief Counsel–Asset Management, Ameriprise Financial, Inc. since May 2010 (previously Vice President and Chief Counsel–Asset Management, from 2005 to April 2010, and Vice President–Asset Management Compliance from 2004 to 2005); Vice President, Chief Counsel and Assistant Secretary, Columbia Management Investment Distributors, Inc. since 2008; Vice President, General Counsel and Secretary, Ameriprise Certificate Company since 2005; Chief Counsel, RiverSource Distributors, Inc. since 2006; Vice President, General Counsel and Secretary, RiverSource Funds, since December 2006; Senior Vice President, Secretary and Chief Legal Officer, Columbia Funds, since May 2010. |
| |
| Linda J. Wondrack (Born 1964) | | |
One Financial Center Boston, MA 02111 Senior Vice President and Chief Compliance Officer (since 2007) | | Vice President and Chief Compliance Officer, Columbia Management Investment Advisers, LLC since May 2010; Chief Compliance Officer, Columbia Funds, since 2007, and RiverSource Funds, since May 2010; Director (Columbia Management Group, LLC and Investment Product Group Compliance), Bank of America, from June 2005 to April 2010; Director of Corporate Compliance and Conflicts Officer of MFS Investment Management (investment management) from August 2004 to May 2005. |
| |
| William F. Truscott (Born 1960) | | |
53600 Ameriprise Financial Center Minneapolis, MN 55474 Senior Vice President (since 2010) | | Chairman of the Board, Columbia Management Investment Advisers, LLC since May 2010 (previously President, Chairman of the Board and Chief Investment Officer, from 2001 to April 2010); Chief Executive Officer, U.S. Asset Management & President, Annuities, Ameriprise Financial, Inc. since May 2010 (previously President–U.S. Asset Management and Chief Investment Officer from 2005 to April 2010, and Senior Vice President–Chief Investment Officer, from 2001 to 2005); Director, President and Chief Executive Officer, Ameriprise Certificate Company since 2006; Director, Columbia Management Investment Distributors, Inc. since May 2010 (previously Chairman of the Board and Chief Executive Officer from 2008 to April 2010); Chairman of the Board and Chief Executive Officer, RiverSource Distributors, Inc. since 2006. |
52
Fund Governance (continued)
Officers (continued)
| | |
| Name, Year of Birth and Address | | Principal Occupation(s) During the Past Five Years |
| |
| Colin Moore (Born 1958) | | |
One Financial Center Boston, MA 02111 Senior Vice President (since 2010) | | Director and Chief Investment Officer, Columbia Management Investment Advisers, LLC since May 2010; Manager, Managing Director and Chief Investment Officer of Columbia Management Advisors, LLC from 2007 to April 2010; Head of Equities, Columbia Management Advisors, LLC from 2002 to 2007. |
| |
| Michael A. Jones (Born 1959) | | |
100 Federal Street Boston, MA 02110 Senior Vice President (since 2010) | | Director and President, Columbia Management Investment Advisers, LLC since May 2010; President and Director, Columbia Management Investment Distributors, Inc. since May 2010; Manager, Chairman, Chief Executive Officer and President, Columbia Management Advisors, LLC from 2007 to April 2010; Chief Executive Officer, President and Director, Columbia Management Distributors, Inc. from November 2006 to April 2010; previously, co-president and senior managing director at Robeco Investment Management. |
| |
| Amy Johnson (Born 1965) | | |
5228 Ameriprise Financial Center Minneapolis, MN 55474 Senior Vice President (since 2010) | | Senior Vice President and Chief Operating Officer, Columbia Management Investment Advisers, LLC since May 2010 (previously Chief Administrative Officer, from 2009 until April 2010, Vice President–Asset Management and Trust Company Services, from 2006 to 2009, and Vice President–Operations and Compliance from 2004 to 2006). |
| |
| Joseph F. DiMaria (Born 1968) | | |
One Financial Center Boston, MA 02111 Treasurer (since 2009) and Chief Accounting Officer (since 2008) | | Vice President, Mutual Fund Administration, Columbia Management Investment Advisers, LLC, since May 2010; Director of Fund Administration, Columbia Management Advisors, LLC from January 2006 to April 2010; Head of Tax/Compliance and Assistant Treasurer, Columbia Management Advisors, LLC, from November 2004 to December 2005. |
| |
| Marybeth Pilat (Born 1968) | | |
One Financial Center Boston, MA 02111 Deputy Treasurer (since 2010) | | Vice President, Mutual Fund Administration, Columbia Management Investment Advisers, LLC, since May 2010; Vice President, Investment Operations, Bank of America, from October 2008 to April 2010; Finance Manager, Boston Children’s Hospital from August 2008 to October 2008; Director, Mutual Fund Administration, Columbia Management Advisors, LLC, from May 2007 to July 2008; Vice President, Mutual Fund Valuation, Columbia Management Advisors, LLC, from January 2006 to May 2007; Vice President, Mutual Fund Accounting Oversight, Columbia Management Advisors, LLC from January 2005 to January 2006. |
| |
| Julian Quero (Born 1967) | | |
One Financial Center Boston, MA 02111 Deputy Treasurer (since 2008) | | Vice President, Mutual Fund Administration, Columbia Management Investment Advisers, LLC since May 2010; Director of Fund Administration, Columbia Management Advisors, LLC, from August 2008 to April 2010; Senior Tax Manager, Columbia Management Advisors, LLC from August 2006 to July 2008; Senior Compliance Manager, Columbia Management Advisors, LLC from April 2002 to August 2006. |
| |
| Stephen T. Welsh (Born 1957) | | |
One Financial Center Boston, MA 02111 Vice President (since 2006) | | President and Director, Columbia Management Investment Services Corp. since May 2010; President and Director, Columbia Management Services, Inc. from July 2004 to April 2010; Managing Director, Columbia Management Distributors, Inc. from August 2007 to April 2010. |
The Statement of Additional Information includes additional information about the Trustees of the Funds and is available, without charge, upon request by calling 1-800-345-6611.
53
Board Consideration and Approval of Advisory Agreements
The Advisory Fees and Expenses Committee of the Board of Trustees meets several times annually to review the current advisory agreements (collectively, the “Agreements”) of the funds for which the Trustees serve as trustees (each a “fund”) and to determine whether to recommend that the full Board approve the continuation of the Agreements for an additional one-year period. After the Committee has made its recommendation, the full Board, including the Independent Trustees, determines whether to approve the continuation of the Agreements. In addition, the full Board, including the Independent Trustees, considers matters bearing on the Agreements at most of its other meetings throughout the year and meets regularly with senior management of the funds and Columbia, the funds’ investment adviser, including the senior manager of each investment area within Columbia. Through the Board’s Investment Oversight Committees, Trustees also meet with selected fund portfolio managers, research analysts and traders at various times throughout the year.
The Trustees receive and review all materials that they, their legal counsel or Columbia believe to be reasonably necessary for the Trustees to evaluate the Agreements and to determine whether to approve the continuation of the Agreements. Those materials generally include, among other items, (i) information on the investment performance of each fund relative to the performance of peer groups of mutual funds and the fund’s performance benchmarks, and additional information assessing performance on a risk-adjusted basis, (ii) information on each fund’s advisory fees and other expenses, including information comparing the fund’s expenses to those of peer groups of mutual funds and information about any applicable expense caps and fee “breakpoints,” (iii) information about the profitability of the Agreements to Columbia, including potential “fall-out” or ancillary benefits that Columbia and its affiliates may receive as a result of their relationships with the funds and (iv) information obtained through Columbia’s response to a questionnaire prepared at the request of the Trustees by counsel to the funds and independent legal counsel to the Independent Trustees. The Trustees also consider other information such as (v) Columbia’s financial results and financial condition, (vi) each fund’s investment objective and strategies and the size, education and experience of Columbia’s investment staffs and their use of technology, external research and trading cost measurement tools, (vii) the allocation of the funds’ brokerage and the use of “soft” commission dollars to pay for research products and services, (viii) Columbia’s resources devoted to, and its record of compliance with, the funds’ investment policies and restrictions, policies on personal securities transactions and other compliance policies and legal and regulatory requirements, (ix) Columbia’s response to various legal and regulatory proceedings since 2003 and to the recent period of volatility in the securities markets and (x) the economic outlook generally and for the mutual fund industry in particular. In addition, the Advisory Fees and Expenses Committee confers with the independent fee consultant (the “Fee Consultant”) appointed by the Independent Trustees pursuant to an assurance of discontinuance entered into by Columbia with the New York Attorney General (“NYAG”) to settle a civil complaint filed by the NYAG relating to trading in mutual fund shares (the “NYAG Settlement”) and reviews materials relating to the funds’ relationships with Columbia provided by the Fee Consultant. Under the NYAG Settlement, the Fee Consultant’s role is to manage the process by which management fees are negotiated so that they are negotiated in a manner that is at arms’ length and reasonable. Throughout the process, the Trustees have the opportunity to ask questions of and to request additional materials from Columbia and to consult with the Fee Consultant and independent legal counsel to the Independent Trustees.
The Board of Trustees most recently approved the continuation of the Agreements at its October, 2009 meeting, following meetings of the Advisory Fees and Expenses Committee held in December, 2008 and February, May, June, August, September and October, 2009.
The Board of Trustees also unanimously approved new advisory agreements (the “New Agreements”) for the funds with RiverSource Investments, LLC (to be renamed Columbia Management Investment Advisers, LLC) (“RiverSource”) at a meeting held on December 17, 2009. The New Agreements have since been approved by shareholders of the funds and are expected to take effect upon the closing of the acquisition of the long-term asset management business of Columbia by Ameriprise Financial, Inc. (“Ameriprise”), the parent company of RiverSource Investments, LLC (the “Transaction”).
The Advisory Fees and Expenses Committee met on multiple occasions to review the New Agreements for the funds. On December 14, 2009, the Advisory Fees and Expenses
54
Committee recommended that the full Board approve the New Agreements. On December 17, 2009, the full Board, including a majority of the Independent Trustees, approved the New Agreements. Prior to their approval of the New Agreements, the Advisory Fees and Expenses Committee and the Independent Trustees requested and evaluated materials from, and were provided materials and information about the Transaction and matters related to the proposals by, Bank of America Corp., Columbia, RiverSource and Ameriprise. In connection with their most recent approval of the Agreements (as discussed above) on October 28, 2009, the Advisory Fees and Expenses Committee and the Trustees requested and evaluated materials from Columbia, and discussed such materials with representatives of Columbia. The Advisory Fees and Expenses Committee, at meetings held on August 11, 2009, September 23, 2009, October 27, 2009, November 30, 2009, December 7, 2009 and December 14, 2009, and the Independent Trustees, at meetings held on August 12, 2009, August 20, 2009, October 28, 2009, December 8, 2009, December 14, 2009 and December 17, 2009, discussed the materials provided in connection with the October 28, 2009 approvals and the materials provided in connection with their consideration of the New Agreements and other matters relating to the Transaction with representatives of Bank of America Corp., Columbia, RiverSource and Ameriprise. The Trustees consulted with experienced legal counsel, who advised on the legal standards for consideration by the Trustees. The Independent Trustees also discussed the proposed approvals with independent legal counsel in private sessions.
The Trustees reviewed each New Agreement, as well as certain information obtained through RiverSource’s responses to initial and supplemental questionnaires prepared at the request of the Trustees by counsel to the funds and independent legal counsel to the Independent Trustees. The Advisory Fees and Expenses Committee and the Trustees also met with, and reviewed and considered a report prepared and provided by, the Fee Consultant (as discussed above).
In considering whether to approve the New Agreements and to approve the continuation of the Agreements, the Trustees, including the Independent Trustees, did not identify any single factor as determinative, and each weighed various factors as he or she deemed appropriate. In particular, the Trustees considered the following matters:
Matters Relating to the Agreements and the New Agreements
The nature, extent and quality of the services provided or to be provided to the funds under the Agreements and the New Agreements. The Trustees considered the nature, extent and quality of the services provided and the resources dedicated by Columbia and its affiliates (or to be provided and dedicated by RiverSource and its affiliates) to the funds.
Among other things, the Trustees considered, with respect to Columbia and its affiliates, (i) Columbia’s ability (including its personnel and other resources, compensation programs for personnel involved in fund management, reputation and other attributes) to attract, motivate and retain highly qualified research, advisory and supervisory investment professionals; (ii) the portfolio management services provided by those investment professionals; and (iii) the trade execution services provided on behalf of the funds. For each fund, the Trustees also considered the benefits to shareholders of investing in a mutual fund that is part of a family of funds offering exposure to a variety of asset classes and investment disciplines and providing a variety of fund and shareholder services.
Among other things, the Trustees considered, with respect to RiverSource and its affiliates, (i) the expected effect of the Transaction on the operations of the funds, (ii) the information provided by RiverSource with respect to the nature, extent and quality of services to be provided by it, (iii) RiverSource’s compliance program and compliance record, (iv) the ability of RiverSource (including personnel and other resources, compensation programs for personnel involved in fund management, reputation and other attributes) to attract, motivate and retain highly qualified research, advisory and supervisory investment professionals, (v) the trade execution services to be provided on behalf of the funds and (vi) the quality of RiverSource’s investment research capabilities and the other resources that it indicated it would devote to each fund. As noted above, the Trustees also considered RiverSource’s representations that the Chief Investment Officer of Columbia would serve as the Chief Investment Officer of RiverSource following the Transaction, and that the process for determining the portfolio management team for each Fund would be substantially the same process as has customarily been followed by Columbia, and reported to the Trustees, in evaluating the performance of Columbia’s portfolio management teams. The Trustees
55
also noted the professional experience and qualifications of the senior personnel of RiverSource. The Trustees also considered the compliance programs of and the compliance-related resources proposed to be provided to the funds by RiverSource and its affiliates, including discussions with the funds’ Chief Compliance Officer regarding RiverSource’s compliance program. The Trustees also discussed RiverSource’s compliance program with the Chief Compliance Officer for the RiverSource funds. The Trustees also considered RiverSource’s representation that the funds’ Chief Compliance Officer would serve as the Chief Compliance Officer of RiverSource following the Transaction. The Trustees considered RiverSource’s ability to provide administrative services to the funds, noting that while some Agreements contemplated the provision of certain administrative services, following the Transaction, all administrative services were anticipated to be provided pursuant to a new administrative services agreement. The Trustees also considered RiverSource’s ability to coordinate the activities of each fund’s other service providers. The Trustees considered performance information provided by RiverSource with respect to other mutual funds advised by RiverSource, and discussed with senior executives of RiverSource its process for identifying which portfolio management teams of the legacy Columbia and RiverSource organizations would be responsible for the management of the funds following the Transaction.
After reviewing those and related factors, the Trustees concluded, within the context of their overall conclusions, that the nature, extent and quality of services provided by Columbia supported the continuation of the Agreements, and that the nature, extent and quality of services expected to be provided by RiverSource supported approval of the New Agreements.
The costs of the services provided and profits realized by Columbia and its affiliates, and the expected costs of the services to be provided and the profits expected to be realized by RiverSource and its affiliates, from their relationships with the funds. With respect to Columbia and its affiliates, the Trustees considered the fees charged to the funds for advisory services as well as the total expense levels of the funds. That information included comparisons (provided by management and by an independent third-party data provider) of each fund’s advisory fees and total expense levels to those of the fund’s peer groups and information about the advisory fees charged by Columbia to comparable institutional accounts. In considering the fees charged to those accounts, the Trustees took into account, among other things, management’s representations about the differences between managing mutual funds as compared to other types of accounts, including differences in the services provided, differences in the risk profile of such business for Columbia, and the additional resources required to manage mutual funds effectively. In evaluating each fund’s advisory fees, the Trustees also took into account the demands, complexity and quality of the investment management of the fund. The Trustees considered existing advisory fee breakpoints, and Columbia’s use of advisory fee waivers and expense caps, which benefited a number of the funds. The Trustees also noted management’s stated justification for the fees charged to the funds, which included information about the investment performance of the funds and the services provided to the funds.
The Trustees considered that Columbia Intermediate Bond Fund’s total expenses and actual management fees were in the third quintile (where the lowest fees and expenses would be in the first quintile) of the peer group selected by an independent third-party data provider for purposes of expense comparisons.
The Trustees also considered the compensation directly or indirectly received by Columbia and its affiliates from their relationships with the funds. The Trustees reviewed information provided by management as to the profitability to Columbia and its affiliates of their relationships with each fund, and information about the allocation of expenses used to calculate profitability. When reviewing profitability, the Trustees also considered court cases in which adviser profitability was an issue in whole or in part, the performance of the relevant funds, the expense level of each fund, and whether Columbia had implemented breakpoints and/or expense caps with respect to the fund.
In connection with the integration of the legacy Columbia and RiverSource organizations, the Trustees considered, among other things, RiverSource’s projected annual net expense synergies (reductions in the cost of providing services to the funds), the timetable over which such synergies are expected to be realized and the extent to which any such synergies are expected to be shared with the funds. The Trustees also considered information provided by RiverSource regarding
56
their respective financial conditions. The Trustees considered that RiverSource proposed to continue voluntary expense caps currently in effect for the funds and that RiverSource had undertaken not to change these caps without further discussion with the Independent Trustees.
After reviewing those and related factors, the Trustees concluded, within the context of their overall conclusions, that the advisory fees charged to each fund, and the related profitability to Columbia and its affiliates of their relationships with the fund, supported the continuation of the Agreement pertaining to that fund, and that the expected profitability to RiverSource and its affiliates from its relationship with each fund supported the approval of the New Agreements.
Economies of Scale. With respect to Columbia and its affiliates, the Trustees considered the existence of any economies of scale in the provision by Columbia of services to each fund, to groups of related funds, and to Columbia’s investment advisory clients as a whole and whether those economies were shared with the funds through breakpoints in the investment advisory fees or other means, such as fee waivers/expense reductions and additional investments by Columbia in investment, trading and compliance resources. The Trustees noted that many of the funds benefited from breakpoints, fee waivers/expense caps, or both. In considering those issues, the Trustees also took note of the costs of the services provided (both on an absolute and a relative basis) and the profitability to Columbia and its affiliates of their relationships with the funds, as discussed above.
With respect to RiverSource and its affiliates, the Trustees considered the existence of any anticipated economies of scale in the provision by RiverSource of services to each fund, to groups of related funds and to RiverSource’s investment advisory clients as a whole, and whether those economies of scale were expected to be shared with the funds. The Trustees considered Ameriprise’s anticipated net expense synergies resulting from the Transaction, and considered the possibility that the funds might benefit from economies of scale over time as part of the larger, combined fund complex. The Trustees considered how expected synergies and potential economies of scale might benefit the funds and their shareholders. The Trustees considered the potential effect of the Transaction on the distribution of the funds, and noted that the proposed management fee schedules for the funds generally contained breakpoints that would reduce the fee rate on assets above specified threshold levels.
After reviewing those and related factors, the Trustees concluded, within the context of their overall conclusions, that the extent to which economies of scale were shared or expected to be shared with the funds supported the continuation of the Agreements and the approval of the New Agreements.
Matters Relating to the Agreements
Investment performance of the funds and Columbia. The Trustees reviewed information about the performance of each fund over various time periods, including information prepared by an independent third-party data provider that compared the performance of each fund to the performance of peer groups of mutual funds and performance benchmarks. The Trustees also reviewed a description of the third party’s methodology for identifying each fund’s peer group for purposes of performance and expense comparisons. The Trustees also considered additional information that the Advisory Fees and Expenses Committee requested from Columbia relating to funds that presented relatively weaker performance and/or relatively higher fees or expenses. In the case of each fund whose performance lagged that of a relevant peer group for certain (although not necessarily all) periods, the Trustees concluded that other factors relevant to performance were sufficient, in light of other considerations, to warrant continuation of the fund’s Agreements. Those factors varied from fund to fund, but included one or more of the following: (i) that the fund’s performance, although lagging in certain recent periods, was stronger over the longer term; (ii) that the underperformance was attributable, to a significant extent, to investment decisions that were reasonable and consistent with the fund’s investment strategy and policies and that the fund was performing within a reasonable range of expectations, given those investment decisions, market conditions and the fund’s investment strategy; (iii) that the fund’s performance was competitive when compared to other relevant performance benchmarks or peer groups; (iv) that Columbia had taken or was taking steps designed to help improve the fund’s investment performance, including, but not limited to, replacing portfolio managers or modifying investment strategies; and (v) that Columbia proposed to waive advisory fees or cap the expenses of the fund.
57
The Trustees noted that, through April 30, 2009, Columbia Intermediate Bond Fund’s performance was in the fourth quintile (where the best performance would be in the first quintile) for the one-, three- and five-year periods, and in the third quintile for the ten-year period, of the peer group selected by an independent third-party data provider for purposes of performance comparisons.
The Trustees also considered Columbia’s performance and reputation generally, the funds’ performance as a fund family generally, and Columbia’s historical responsiveness to Trustee concerns about performance and Columbia’s willingness to take steps intended to improve performance. After reviewing those and related factors, the Trustees concluded, within the context of their overall conclusions regarding each of the Agreements, that the performance of each fund and Columbia was sufficient, in light of other considerations, to warrant the continuation of the Agreement pertaining to that fund.
Other Factors. The Trustees also considered other factors with respect to Columbia and its affiliates, which included but were not limited to the following:
| n | | the extent to which each fund had operated in accordance with its investment objective and investment restrictions, the nature and scope of the compliance programs of the funds and Columbia and the compliance-related resources that Columbia and its affiliates were providing to the funds; |
| n | | the nature, quality, cost and extent of administrative and shareholder services overseen and performed by Columbia and its affiliates, both under the Agreements and under separate agreements for the provision of transfer agency and administrative services; |
| n | | so-called “fall-out benefits” to Columbia and its affiliates, such as the engagement of its affiliates to provide distribution, brokerage and transfer agency services to the funds, and the benefits of research made available to Columbia by reason of brokerage commissions generated by the funds’ securities transactions, as well as possible conflicts of interest associated with those fall-out and other benefits, and the reporting, disclosure and other processes in place to disclose and monitor those possible conflicts of interest; and |
| n | | the report provided by the Fee Consultant, which included information about and analysis of the funds’ fees, expenses and performance. |
Matters Relating to the New Agreements
The Trustees considered all materials that they, their legal counsel or RiverSource believed reasonably necessary to evaluate and to determine whether to approve the New Agreements. In their deliberations, the Trustees did not identify any particular information that was all-important or controlling, and individual Trustees may have attributed different weights to the various factors. The material factors that formed the basis for the Trustees’ approvals included the factors set forth below:
| (i) | the reputation, financial strength, regulatory histories and resources of RiverSource and its parent, Ameriprise; |
| (ii) | the capabilities of RiverSource with respect to compliance, including an assessment of RiverSource’s compliance system by the funds’ Chief Compliance Officer; |
| (iii) | the qualifications of the personnel of RiverSource that would be expected to provide advisory services to each fund, including RiverSource’s representations that the Chief Investment Officer of Columbia would serve as the Chief Investment Officer of RiverSource, and that the process for determining the portfolio management team for each fund would be substantially the same process as has customarily been followed by Columbia, and reported to the Trustees, in evaluating the performance of Columbia’s portfolio management teams; |
| (iv) | the terms and conditions of the New Agreements, including the differences between the New Agreements and the Agreements; |
| (v) | the terms and conditions of other agreements and arrangements relating to the future operations of the funds, including an administrative services agreement and a Master Services and Distribution Agreement; |
| (vi) | the commitment of RiverSource and Ameriprise that there would not be any diminution in the nature, quality and extent of services provided to each fund or its shareholders following closing of the Transaction; |
| (vii) | that the Trustees recently had completed a full annual review of the Agreements, as required by the 1940 Act, for each fund and had determined that they were |
58
| | satisfied with the nature, extent and quality of services provided thereunder and that the management fee rate for each fund were sufficient to warrant their approval; |
| (viii) | that the advisory fee rates payable by each fund would not change; |
| (ix) | that RiverSource and Bank of America, and not any fund, would bear the costs of obtaining approvals of the New Agreement; |
| (x) | that Ameriprise and RiverSource had agreed to exercise reasonable best efforts to assure that, for a period of two years after the closing of the Transaction, there would not be imposed on any fund any “unfair burden” (within the meaning of Section 15(f) of 1940 Act) with respect to the Transaction; and |
| (xi) | that certain members of RiverSource’s management have a significant amount of experience integrating other fund families; that certain current Columbia personnel that would be integrated into RiverSource and its affiliates as a result of the Transaction also have experience in integrating fund families; and that the senior management of RiverSource following the Transaction would include certain senior executives of Columbia who are currently responsible for oversight of services provided to the funds. |
Investment Advisory Fee Rates and Other Expenses. The Trustees considered the fact that the advisory fee rates payable by each fund to RiverSource under the New Agreements are the same as those currently paid by each fund to Columbia under the Agreements. The Trustees noted that in connection with their October 28, 2009 approval of the continuance of the Agreements, they had concluded, within the context of their overall conclusions regarding each such agreement, that the advisory fees charged to each fund supported the continuation of the agreement pertaining to that fund.
The Trustees noted that in certain cases the effective advisory fee rate for a RiverSource fund was lower than the proposed investment advisory fee rate for a fund with generally similar investment objectives and strategies. The Trustees also noted that RiverSource’s investment advisory fee rates for equity and balanced funds generally are subject to adjustments based on investment performance, whereas the proposed investment advisory fee rates for the funds, consistent with those in the Agreements, do not reflect performance adjustments. The Trustees considered existing advisory fee breakpoints and RiverSource’s undertaking not to change expense caps previously implemented by Columbia with respect to the funds without further discussion with the Independent Trustees.
The Trustees received and considered information about the advisory fees charged by RiverSource to institutional accounts. In considering the fees charged to those accounts, the Trustees took into account, among other things, RiverSource’s representations about the differences between managing mutual funds as compared to other types of accounts, including differences in the services provided, differences in the risk profile of such business for RiverSource and the additional resources required to manage mutual funds effectively. In evaluating each fund’s expected advisory fees, the Trustees also took into account the demands, complexity and quality of the investment management of the fund.
The Trustees also considered that for certain funds, certain administrative services that are provided under the Agreements would not be provided under the New Agreements, but under a separate administrative services agreement. The Trustees noted that, unlike fees under an advisory agreement, fees under the administrative services agreement could be changed without shareholder approval, although RiverSource had not proposed any increase in such administrative fees and any such increase would require Board approval. The Trustees also noted Ameriprise’s and RiverSource’s covenants regarding compliance with Section 15(f) of the 1940 Act.
After reviewing these and related factors, the Trustees concluded, within the context of their overall conclusions, that the expected advisory fee rates and expenses of each fund supported the approval of the New Agreements.
Other Benefits to RiverSource. The Trustees received and considered information regarding any expected “fall-out” or ancillary benefits to be received by RiverSource and its affiliates as a result of their relationships with the funds, such as the engagement of RiverSource to provide administrative services to the funds and the engagement of RiverSource’s affiliates to provide distribution and transfer agency services to the funds. The Trustees considered that the funds’ distributor, which would be an affiliate of RiverSource,
59
retains a portion of the distribution fees from the funds and receives a portion of the sales charges on sales or redemptions of certain classes of shares of the funds. The Trustees also considered the benefits of research made available to RiverSource by reason of brokerage commissions generated by the funds’ securities transactions, and reviewed information about RiverSource’s practices with respect to allocating portfolio brokerage for brokerage and research services. The Trustees considered the possible conflicts of interest associated with certain fall-out or other ancillary benefits and the reporting, disclosure and other processes that would be in place to disclose and to monitor such possible conflicts of interest. The Trustees recognized that RiverSource’s profitability would be somewhat lower without these benefits.
Conclusions
Based on their evaluation of all factors that they deemed to be material, including those factors described above, and assisted by the advice of independent counsel and the Fee Consultant, the Trustees, including the Independent Trustees, (i) approved the continuance of each of the Agreements through October 31, 2010 and (ii) approved each New Agreement.
60
Summary of Management Fee Evaluation by Independent Fee Consultant (Columbia Management Advisors, LLC)
EXCERPTS FROM REPORT OF INDEPENDENT FEE CONSULTANT TO THE FUNDS SUPERVISED BY THE COLUMBIA ATLANTIC BOARD
Prepared Pursuant to the February 9, 2005 Assurance of Discontinuance among the Office of Attorney General of New York State, Columbia Management Advisors, LLC, and Columbia Management Distributors, Inc. November 6, 2009
I. Overview
On February 9, 2005, Columbia Management Advisors, LLC (“CMA”) and Columbia Management Distributors, Inc.1 (“CMDI”) agreed to the New York Attorney General’s Assurance of Discontinuance (“AOD”). Among other things, the AOD stipulates that CMA may manage or advise a Columbia Fund (“Columbia Fund” and, together with some or all of such funds, the “Columbia Funds”) only if the Independent Members of the Columbia Fund’s Board of Trustees appoint a Senior Officer or retain an Independent Fee Consultant (“IFC”) who is to manage the process by which proposed management fees are negotiated. The AOD further stipulates that the Senior Officer or IFC is to prepare a written annual evaluation of the fee negotiation process.
With effect from January 1, 2007, the Independent Members of the Board of Trustees for certain Columbia Funds known collectively as the “Atlantic Funds” (together with the other members of that Board, the “Trustees”) retained me as IFC for the Atlantic Funds.2 In this capacity, I have prepared the fifth annual written evaluation of the fee negotiation process. As was the case with the 2007 and 2008 reports, my immediate predecessor as IFC, John Rea, provided invaluable assistance in the preparation of this year’s report.
A. Role of the Independent Fee Consultant
The AOD charges the IFC with “managing the process by which proposed management fees … to be charged the Columbia Fund are negotiated so that they are negotiated in a manner which is at arms’ length and reasonable and consistent with this Assurance of Discontinuance.” The AOD also provides that CMA “may manage or advise a Columbia Fund only if the reasonableness of the proposed management fees is determined by the Board of Trustees … using … an annual independent written evaluation prepared by or under the direction of … the Independent Fee Consultant.” Therefore, the AOD makes clear that the IFC does not supplant the Trustees in negotiating management fees with CMA, nor does the IFC substitute his or her judgment for that of the Trustees with respect to the reasonableness of proposed fees or any other matter that is committed to the business judgment of the Trustees.
B. Elements Involved in Managing the Fee Negotiation Process
In preparing the report required by the AOD, the IFC must consider at least the following six factors set forth in the AOD:
| 1. | The nature and quality of CMA’s services, including the Fund’s performance; |
| 2. | Management fees (including any components thereof) charged by other mutual fund companies for like services; |
| 3. | Possible economies of scale as the Fund grows larger; |
| 4. | Management fees (including any components thereof) charged to institutional and other clients of CMA for like services; |
| 5. | Costs to CMA and its affiliates of supplying services pursuant to the management fee agreements, excluding any intra-corporate profit; and |
| 6. | Profit margins of CMA and its affiliates from supplying such services. |
C. Organization of the Annual Evaluation
This report, like last year’s, focuses on the six factors and contains a section for each factor except that CMA’s costs and profits from managing the Funds are treated in a single section. In addition to a discussion of these factors, the report offers recommendations to improve the fee review process in future years. A review of the status of recommendations made in the 2008 Report is being provided separately with the materials for the October meeting.
| 1 | CMA and CMDI are subsidiaries of Columbia Management Group, LLC (“CMG”), and are the successors to the entities named in the AOD. |
| 2 | I have no material relationship with Bank of America, CMG or any of its affiliates, aside from serving as IFC, and I am aware of no material relationship with any of their affiliates. I retained John Rea, an independent economic consultant, to assist me with this report. |
| | Unless otherwise stated or required by the context, this report covers only the Atlantic Funds, which are also referred as the “Funds.” |
61
II. Summary of Findings
A. General
| 1. | Based upon my examination of the information supplied by CMG in the light of the six factors set forth in the AOD, I conclude that the Trustees have the relevant information necessary to evaluate the reasonableness of the proposed management fees for each Atlantic Fund. |
| 2. | In my view, the process by which the proposed management fees of the Funds have been negotiated in 2009 thus far has been, to the extent practicable, at arms’ length and reasonable and consistent with the AOD. |
B. Nature and Quality of Services, Including Performance
| 3. | The performance of the Funds has been relatively strong in recent years, although the one-year record was weaker than longer-term records. Based upon 1-, 3-, 5-, and 10-year returns through April 30, 2009, at least half of all the Funds were in the first and second performance quintiles in each of the three longest performance periods; for the one-year period, 40% of the Funds were in the top two quintiles. No more than 13% of the Funds were in the fifth quintile in any one performance period. Domestic equity, quantitative equity, and taxable fixed-income Funds were the strongest performers in 2009, while most foreign equity Funds lagged behind their competitors. |
| 4. | Performance rankings were similar in 2008 and 2009: the 1- and 3-year rankings declined slightly over the previous year, while the 5-year rankings improved modestly. Year over year, for the 1- and 3-year periods, the performance of equity Funds, both domestic and international, declined, while that of fixed-income Funds improved. Between three-fifths to two-thirds of the Funds changed quintile rankings in 2009 in the 1-, 3-, and 5-year performance periods. |
| 5. | The performance of the domestic equity Funds against their benchmarks was good for the 3- and 5-year performance periods. In contrast, gross returns of international equity and fixed-income Funds typically fell short of their benchmarks. The performance of equity Funds against their benchmarks was highly correlated to performance versus their peers; no such correlation was observed for fixed-income Funds. |
| 6. | The Atlantic equity Funds’ overall performance adjusted for risk was solid. Based upon 3-year returns, nearly 57% of the equity Funds had a combination of risk-adjusted and unadjusted returns that placed them in the top half of their performance universes. About one quarter of the fixed-income Funds posted high returns and low risk relative to comparable funds. Just over half of the fixed-income Funds, primarily tax-exempt Funds, took on more risk than the typical fund in their performance universes. |
| 7. | The industry-standard procedure used by Lipper that includes all share classes in the performance universe tends to bias a Fund’s ranking upward within that universe. The bias occurs because either no-12b-1 fee or low-12b-1 fee share classes of the Atlantic Funds are compared with funds in performance universes that include all share classes of multi-class funds with 12b-1 fees of up to 100 basis points. Correcting this bias by limiting the performance universe to classes of comparable funds with low or no 12b-1 fees (a “filtered universe”) lowers the relative performance for the Funds, but not to a material extent. The filtering process, however, did identify one Fund for further review that had not been identified as a review fund using unfiltered universes. Conversely, two Funds that had been identified as review funds in the unfiltered universe lost that status in filtered universes. |
| 8. | A small number of Funds have consistently underperformed over the past five years. The exact number depends on the criteria used to evaluate longer-term performance. For example, only three Funds had below-median performance in each 1- and 3-year period from 2005 to 2009. |
| 9. | The services performed by CMG professionals beyond portfolio management, such as compliance, legal, information technology, risk management, finance, and fund administration, are critical to the success of the Funds and appear to be of high quality. |
C. Management Fees Charged by Other Mutual Fund Companies
| 10. | The Funds’ management fees and total expenses are generally low relative to those of their peers, with over half of the Funds in the most favorable two quintiles. Only 26% of the Funds ranked in the two most expensive quintiles for actual management fees, and 18% in those quintiles for total expenses. Two Funds are in the fifth quintile for total |
62
| | expenses; four Funds are in the fifth quintile for actual management fees. |
| 11. | The highest concentration of low-expense Funds is found among the foreign equity Funds. The 12 former Excelsior Funds have relatively high fees and expenses, with two-thirds ranking in either the fourth or fifth quintiles for actual management fees. The higher actual management fee rankings of certain former Excelsior Funds are due in part to fee schedules that are higher than standard Columbia Fund fee schedules at current asset levels. |
| 12. | The distribution of total expense and management fee rankings has improved over the prior two years. The implementation of the voluntary standardized cap system has contributed significantly to the improved rankings in 2009. |
| 13. | The management fees of the Atlantic Funds are generally in line with those of Columbia Funds supervised by the Nations Board of Trustees (the “Nations Funds”). To the extent that Atlantic Funds have higher average fees in certain investment categories than Nations Funds, the difference reflects either differences in asset size, different fee structures of the former Excelsior Funds, or special circumstances of the Funds included in the investment categories. |
D. Trustees’ Advisory Contract Review Process
| 14. | The Trustees’ evaluation process identified 16 Funds in 2009 for further review based upon long-standing criteria relating to their relative performance or expenses or both. When compared in filtered universes, one additional Fund met the criteria for further review. CMG provided further information about each of those Funds to assist the Trustees in their evaluation. |
E. Potential Economies of Scale
| 15. | CMG presented to the Trustees its analysis of the sources and sharing of potential economies of scale. CMG views economies of scale as arising at the complex level and would regard estimates of scale economies for individual funds as unreliable. In its analysis, CMG did not identify specific sources of economies of scale or provide any estimates of any economies of scale that might arise from future asset growth. CMG’s analysis included measures taken by the Trustees and CMG that seek to share any potential economies of scale through breakpoints in management fee schedules, the establishment of expense limits for each Fund, enhanced shareholder services, fund mergers, and operational consolidation. |
| 16. | An examination of the contractual fee schedules for five Atlantic Funds shows that those with standard fee structures are generally in line with those of their competitors. The fee schedules of the former Excelsior Funds, however, have high initial fees relative to competitors but otherwise have comparable breakpoint structures. |
F. Management Fees Charged to Institutional Clients
| 17. | CMG has provided Trustees with comparisons of mutual fund management fees and institutional fees based upon standardized fee schedules and upon actual fees. The results show that, consistent with industry practice, actual and scheduled institutional fees are generally lower than the Funds’ management fees. CMG provided additional data this year demonstrating that at small asset levels, the effective fee of certain Funds may be equal to or less than institutional fee levels at those asset levels, due to the effect of expense limits on small funds with high gross expenses. CMG also analyzed the differences between the services provided and risks borne on the one hand by a manager of mutual funds and on the other by institutional advisers, and suggested that these differences should be kept in mind when Trustees review the reasonableness of the Funds’ management fees. |
G. Revenues, Expenses, and Profits
| 18. | The activity-based cost allocation methodology employed by CMG to allocate costs, both direct and indirect, for purposes of calculating Fund profitability is thoughtful and detailed. This year, CMG further refined the technique by allocating additional indirect expenses on an activity basis. |
| 19. | The materials provided on CMG’s revenues and expenses with respect to the Funds and the methodology underlying their construction form a sufficient basis for Trustees to evaluate the expenses of and profitability to CMG arising out of its relationships with the Funds. |
63
| 20. | CMG provided a firm-wide pro forma 2009 income statement demonstrating the effect of market events beginning in the fourth quarter of 2008 on its revenues and profitability to provide an additional perspective on calendar 2008 profitability data. In particular, 2008 revenues reflected the higher market prices prevailing during the first three quarters of that year, while expenses dropped due to cost cutting in the wake of the market downturn late in 2008. The continuing effects of this downturn are expected to produce a significant decline in profitability this year. |
| 21. | In 2008, CMG’s pre-tax post-distribution margin on the Atlantic Fund complex was above industry medians, based on the limited data available for publicly held mutual fund managers. However, as is to be expected in a large fund complex, some Atlantic Funds had relatively high pre-tax profit margins in 2008, when calculated solely with respect to management revenues and expenses, while other Atlantic Funds operated at a loss. There is a positive relationship between Fund size and profitability to CMG, with smaller Funds generally operating at a loss to CMG. |
| 22. | CMG pays a fixed percentage of its management fee revenues to an affiliate, U.S. Trust, Bank of America Private Wealth Management, with respect to assets of its clients invested in Atlantic Funds to compensate it for services it performs with respect to those client assets and for the effect of state law limitations on affiliates charging multiple fees. Based on our analysis of the services provided by this affiliate, we have concluded that all payments other than those for sub-transfer agent or sub-accounting services should be treated as a distribution expense. |
III. Recommendations
| 1) | Criteria for review. The Trustees may wish to consider modifying the criteria for identifying a Fund for further review (a “Review Fund”) to include criteria that focus exclusively on performance. The Trustees’ supplementary data request included one such criterion. They may also wish to consider whether it would be useful to apply CMG’s own internal monitoring standards for Fund performance to the contract review process, or whether such criteria are more relevant to their ongoing investment oversight. |
| 2) | Presentation of Review Fund discussion. CMG should consider whether it could more systematically present in one discussion all relevant information regarding each Review Fund, which is now split into several different portions of the 15(c) materials. For any Fund that has been a Review Fund in consecutive years, CMG should address under what circumstances it could reasonably be anticipated that the Fund would lose that status. |
| 3) | Refinement of tax-exempt performance data. Certain single-state tax-exempt Funds compete in extremely small universes and are compared to a multi-state benchmark of uncertain relevance. Notwithstanding the difficulties, CMG should work to improve the reliability of the calculation of relative performance of these Funds. If that is not possible, CMG should provide guidance on how the Trustees should judge the quality of CMG’s management of these Funds. |
| 4) | Development of risk metrics for asset-allocation, tax-exempt, and money market funds. CMG has developed and shared with the Trustees quantitative risk metrics comparing equity and taxable fixed-income Funds against their peers. However, reliable risk metrics have not been developed for asset-allocation, tax-exempt fixed income, and money market funds. We urge CMG to continue its efforts to provide reliable risk measures for these categories of Funds, especially in the cases of asset-allocation and money market funds, because their investors are likely to be motivated at least in part by a desire to manage risk. |
| 5) | Profitability data. For any period during which CMG is an affiliate of U.S. Trust, Bank of America Private Wealth Management, CMG should continue to present to the Trustees the profitability of each Fund, each investment style and each complex (of which Atlantic is one) calculated as follows: |
| | a. | Management-only profitability should be calculated without reference to any Private Bank expense. |
| | b. | Profitability excluding distribution (which essentially covers the management and transfer agency functions) should be adjusted by removing from the expense calculation any portion of the Private Bank payment not attributable to the performance by the Private Bank of sub-transfer agency or sub-accounting functions. |
| | c. | Total profitability, including distribution: No adjustment for Private Bank expenses should be made, because all such expenses represent legitimate fund expenses to be taken into account in calculating CMG’s profit margin including distribution. |
| | d. | Distribution only: This should include all Private Bank expenses other than those attributable to sub-transfer agency services. |
64
| 6) | Contractual fee analysis. This year CMG presented a new Lipper report comparing the contractual management fees of Funds with those of competitors in similar investment styles. However, the reliability of the conclusion – that Fund management fee breakpoints compared favorably with competitive fee rates – was limited by the use of competitive funds at all asset levels. The sponsors of a $100 million mutual fund may not have given much thought to breakpoints at $5 billion; therefore, that fund’s contractual fee at that level is unlikely to compare favorably with that of a $5 billion Fund. Limiting the competitors to the Lipper expense group, whose constituents are similar in size to the relevant Fund, would make the results more meaningful. In addition, the breakpoints of a select group of Atlantic Funds (which would differ each year) should continue to be compared to those of industry rivals to ensure that the Funds’ breakpoint schedules remain within industry norms. As breakpoint schedules change relatively little each year, performing such a comparison for each Atlantic Fund each year would not be an efficient use of Trustee and CMG resources. |
| 7) | Pro forma profitability data. In any year in which CMG or the Trustees believe that the prior year’s profitability is unlikely to be representative of current business results due to changes in markets or for any other reason, CMG should, consistent with this year’s practice, prepare a pro forma income statement based on year-to-date actual data and reasonable projections used for its own business planning purposes. |
| 8) | Additional institutional data and analysis. While CMG provided a substantial amount of information on its institutional business, including a virtually complete database of all institutional accounts, we suggest some additional items for future years: (a) profitability data for the institutional business in the format, and based upon the same allocation methodologies, used to present Fund profitability, (b) an explanation of how CMA sets institutional fee breakpoints, which normally begin at asset levels far lower than those found in Fund management fee breakpoints, and (c) an analysis of differences in actual fees within specific investment categories, with special attention given to accounts established before and after the implementation of the standardized institutional fee schedules in 2005. |
| 9) | Management fee disparities. In any future study of management fees, CMG and the Atlantic Trustees should analyze the differences in management fee schedules, including those arising out of the reorganization of the former Excelsior Funds as Atlantic Funds. As part of that analysis, CMG should provide an explanation for any significant fee differences among comparable funds across fund families sponsored by CMG, such as differences in the management styles of different Funds included the same Lipper category. Finally, if CMG proposes a management fee change or an expense cap for any mutual fund managed by CMA that is comparable to any Atlantic Fund, CMG should provide the Trustees with sufficient information about the proposal to allow the Trustees to assess the applicability of the proposed change to the relevant Atlantic Fund or Funds. |
| 10) | Explanation of data supplied to Lipper. Each year, as part of the 15(c) process, CMG retains Lipper to compare the fees and expenses of each Fund to a group of competitors. In many cases, CMG, with the approval of the Trustees, adjusts the actual expense data, which is based on the most recent full fiscal year of the Fund (and each competitive fund) to reflect changes in fees or expense limits that occurred during or after the relevant fiscal year. This improves the reliability and usefulness of the comparison. However, to ensure that the Trustees know when and how CMG adjusted the data, we recommend that CMG prepare a table listing for each Fund what adjustments were made, e.g., to reflect a new expense limitation of x basis points that commenced on y date. |
Reduction of volume of paper documents submitted. The effort to streamline and better organize the data presented to the Trustees and the process by which that data was prepared and organized continued to be well-received by all parties. Notwithstanding past success, it is always appropriate to look for opportunities to reduce and simplify the presentation of 15(c) data. One possibility would be to remove the 124 pages of biographical data, most if not all of which the Trustees have previously seen as part of their ongoing investment oversight duties, from the paper volume and post it on the Internet-based document storage and retrieval system used by the Funds to provide reference data to Trustees.
Respectfully Submitted,
Steven E. Asher
65
Summary of Management Fee Evaluation by Independent Fee Consultant (RiverSource Investments, LLC)
REPORT OF INDEPENDENT FEE CONSULTANT TO THE FUNDS SUPERVISED BY THE COLUMBIA ATLANTIC BOARD
Prepared Pursuant to the February 9, 2005 Assurance of Discontinuance among the Office of Attorney General of New York State, Columbia Management Advisors, LLC, and Columbia Management Distributors, Inc. December 21, 2009
I. Overview
On February 9, 2005, Columbia Management Advisors, LLC (“CMA”) and Columbia Management Distributors, Inc.1 (“CMD”) agreed to the New York Attorney General’s Assurance of Discontinuance (“AOD”). Among other things, the AOD stipulates that CMA may manage or advise a Columbia Fund (“Columbia Fund” and, together with some or all of such funds, the “Columbia Funds”) only if the Independent Members of the Columbia Fund’s Board of Trustees appoint a Senior Officer or retain an Independent Fee Consultant (“IFC”) who is to manage the process by which proposed management fees are negotiated. The AOD further stipulates that the Senior Officer or IFC is to prepare a written annual evaluation of the fee negotiation process.
With effect from January 1, 2007, the Independent Members of the Board of Trustees for certain Columbia Funds known collectively as the “Atlantic Funds” (together with the other members of that Board, the “Trustees”) retained me as IFC for the Atlantic Funds.2 In this capacity, I have prepared this written evaluation of the fee negotiation process. As was the case with the last three annual reports, my immediate predecessor as IFC, John Rea, provided invaluable assistance in the preparation of this report.
On September 29, 2009, Ameriprise entered into an asset purchase agreement with Bank of America, N.A. and its parent, Bank of America Corporation (together, the “Bank”) pursuant to which the Bank agreed to sell certain CMG assets relating to Columbia’s long-term asset management business, including management of the Atlantic Funds (the “Transaction”).3 The Transaction if completed would result in the termination of the existing Investment Management Agreements with CMA. Therefore, the Trustees have been requested to approve and recommend to the shareholders of each Atlantic Fund new Investment Management and Sub-Advisory Agreements (together, the “Management Agreements”) with RiverSource Investments, LLC (“RI”),4 investment manager of the RiverSource Funds and a subsidiary of Ameriprise. This report is intended to fulfill the requirements of the AOD with respect to the Trustees’ consideration of the new Management Agreements.
A. Role of the Independent Fee Consultant
The AOD charges the IFC with “managing the process by which proposed management fees … to be charged the Columbia Fund are negotiated so that they are negotiated in a manner which is at arms’ length and reasonable and consistent with this Assurance of Discontinuance.” The AOD also provides that CMA “may manage or advise a Columbia Fund only if the reasonableness of the proposed management fees is determined by the Board of Trustees … using … an annual independent written evaluation prepared by or under the direction of … the Independent Fee Consultant.” Therefore, the AOD makes clear that the IFC does not supplant the Trustees in negotiating management fees with CMA (or RI), nor does the IFC substitute his or her judgment for that of the Trustees with respect to the reasonableness of proposed fees or any other matter that is committed to the business judgment of the Trustees.
| 1 | CMA and CMD are subsidiaries of Columbia Management Group, LLC (“CMG”), and are the successors to the entities named in the AOD. |
| 2 | I have no material relationship with Bank of America, CMG or Ameriprise Financial, Inc. (“Ameriprise”), aside from serving as IFC, and I am aware of no material relationship with any of their affiliates. I retained John Rea, an independent economic consultant, to assist me with this report. |
| | Unless otherwise stated or required by the context, this report covers only the Atlantic Funds. |
| 3 | Preliminary Response of Ameriprise to Information Request of Columbia Atlantic Board dated October 21, 2009 (hereafter, the “Preliminary Response”), p. 1. The one money market Atlantic Fund, Money Market Fund VS, was included in the Transaction because it was an integral part of CMG’s array of Funds used as investment vehicles by variable annuity and similar insurance products. |
| 4 | Ameriprise intends to re-brand RI with the “Columbia” name (which is one of the assets being sold in the Transaction). Preliminary Response, pp. 4-5. In the case of new Sub-Advisory Agreements, the current sub-adviser would also be a party. |
66
B. Elements Involved in Managing the Fee Negotiation Process
In preparing the report required by the AOD, the IFC must consider at least the following six factors set forth in the AOD:
| 1. | The nature and quality of the adviser’s services, including the Fund’s performance; |
| 2. | Management fees (including any components thereof) charged by other mutual fund companies for like services; |
| 3. | Possible economies of scale as the Fund grows larger; |
| 4. | Management fees (including any components thereof) charged to institutional and other clients of the adviser for like services; |
| 5. | Costs to the adviser and its affiliates of supplying services pursuant to the management fee agreements, excluding any intra-corporate profit; and |
| 6. | Profit margins of the adviser and its affiliates from supplying such services. |
C. Data Presented to the Trustees
In considering the proposed new Management Agreements with RI, the Trustees relied in part on the data that had been prepared as part of their annual contract review process, which concluded in late October. This data remained relevant because the fees in the proposed Management Agreements were identical to the fees approved at that time. The annual review materials included a Lipper report on the performance of each Atlantic Fund compared to its peers and its benchmark, comparisons of the fees and expenses of each Atlantic Fund to similar CMG-sponsored Funds, comparable competitive funds chosen by Lipper, and institutional accounts advised by CMA, revenues, expenses, and profits of CMG from managing the Atlantic Funds, calculated both by Fund and collectively, and CMG’s views on the existence and sharing of economies of scale.
In addition, the Trustees reviewed materials specific to the proposed new Management Agreements with RI in response to requests for information made on behalf of the Trustees, including the following:
| n | | Performance data for the RiverSource Funds showing percentile and quartile rankings of each fund within its Lipper performance universe for periods up to five years and net returns of each fund relative to its benchmark returns. This data was arguably relevant due to the possibility that some RiverSource investment teams would be providing investment management services to certain Columbia Funds. 5 |
| n | | tables comparing the fee schedules and effective fee rates of funds managed by CMA and RI and institutional accounts advised by the two firms. |
| n | | extensive discussion of the process by which the various components of the two asset management businesses would be integrated including investment management, compliance, transfer agency, custody, fund accounting, and distribution. |
| n | | information about the financial condition of Ameriprise, including its most recent annual report on Form 10-K, RI’s profit margins from managing the RiverSource Funds in 2007 and 2008, and pro forma income statements for the combined Columbia and RiverSource fund complex. |
| n | | disclosure that certain senior CMG executives, including President Michael Jones, Chief Investment Officer Colin Moore, Head of Mutual Funds J. Kevin Connaughton, and Chief Compliance Officer Linda Wondrack would continue in analogous capacities following the consummation of the Transaction, and |
| n | | a breakdown of the synergies RI expects to realize in the two years following the Transaction and the extent to which those potential synergies are expected to be shared with shareholders of funds advised by RI. |
II. Findings
| 1. | Based upon my examination of the information supplied by CMG and Ameriprise in the light of the six factors set forth in the AOD, I conclude that the Trustees have the relevant information necessary to evaluate the reasonableness of the proposed management fees for each Atlantic Fund. |
| 5 | On page 20 of its Supplemental Response to the Atlantic Trustees (undated but delivered November 24, 2009), Ameriprise said that “most personnel decisions, including with respect to the portfolio management teams for the Atlantic Funds . . . will be made primarily by [current CMA CIO] Colin Moore using the Columbia 5P process.” |
67
| 2. | In my view, the process by which the proposed management fees of the Atlantic Funds have been negotiated with RI thus far has been, to the extent practicable, at arms’ length and reasonable and consistent with the AOD. |
Respectfully submitted,
Steven E. Asher
68
Proxy Voting Results
Columbia Intermediate Bond Fund
On March 3, 2010, a special meeting of shareholders of Columbia Funds Series Trust I was held to consider the approval of several proposals listed in the proxy statement for the meeting. Proposal 1 and Proposal 2 were voted on at the March 3, 2010 meeting of shareholders and Proposal 3 was voted on at an adjourned meeting of shareholders held on March 31, 2010. The shareholder meeting results are as follows:
Proposal 1: A proposed Investment Management Services Agreement with Columbia Management Investment Advisers, LLC (formerly, RiverSource Investments, LLC) (CMIA) was approved as follows:
| | | | | | |
| | | | | | | |
| Votes For | | Votes Against | | Abstentions | | Broker Non-Votes |
| 1,619,884,060 | | 12,374,638 | | 12,806,952 | | 202,668,271 |
Proposal 2: A proposal authorizing CMIA to enter into and materially amend subadvisory agreements for the Fund in the future, with the approval of the Trust’s Board of Trustees, but without obtaining additional shareholder approval, was approved as follows:
| | | | | | |
| | | | | | | |
| Votes For | | Votes Against | | Abstentions | | Broker Non-Votes |
| 1,293,667,810 | | 337,509,386 | | 13,888,304 | | 202,668,421 |
Proposal 3: Each of the nominees for trustees was elected to the Trust’s Board of Trustees, as follows:
| | | | | | |
| | | | | | | |
| Trustee | | Votes For | | Votes Withheld | | Abstentions |
| John D. Collins | | 30,977,072,412 | | 859,827,038 | | 0 |
| Rodman L. Drake | | 30,951,179,004 | | 885,720,446 | | 0 |
| Douglas A. Hacker | | 30,989,793,279 | | 847,106,171 | | 0 |
| Janet Langford Kelly | | 30,999,020,814 | | 837,878,636 | | 0 |
| William E. Mayer | | 16,291,139,483 | | 15,545,759,967 | | 0 |
| Charles R. Nelson | | 30,997,700,700 | | 839,198,750 | | 0 |
| John J. Neuhauser | | 30,988,095,661 | | 848,803,789 | | 0 |
| Jonathon Piel | | 30,968,801,048 | | 868,098,402 | | 0 |
| Patrick J. Simpson | | 30,999,065,030 | | 837,834,420 | | 0 |
| Anne-Lee Verville | | 30,996,227,913 | | 840,671,537 | | 0 |
69
[THIS PAGE INTENTIONALLY LEFT BLANK]
70
[THIS PAGE INTENTIONALLY LEFT BLANK]
71
[THIS PAGE INTENTIONALLY LEFT BLANK]
72
Important Information About This Report
Transfer Agent*
Columbia Management Investment Services Corp.
P.O. Box 8081
Boston, MA 02266-8081
1-800-345-6611
Distributor*
Columbia Management Investment
Distributors, Inc.
One Financial Center
Boston, MA 02111
Investment Advisor*
Columbia Management Investment Advisers, LLC
100 Federal Street
Boston, MA 02110
* As of May 1, 2010
The fund mails one shareholder report to each shareholder address. If you would like more than one report, please call shareholder services at 1-800-345-6611 and additional reports will be sent to you. This report has been prepared for shareholders of Columbia Intermediate Bond Fund.
A description of the policies and procedures that the fund uses to determine how to vote proxies and a copy of the fund’s voting records are available (i) at www.columbiamanagement.com, (ii) on the Securities and Exchange Commission’s website at www.sec.gov, and (iii) without charge, upon request, by calling 1-800-368-0346. Information regarding how the fund voted proxies relating to portfolio securities during the 12-month period ended June 30 is available on the SEC’s website. Information regarding how the fund voted proxies relating to portfolio securities is also available from the fund’s website, www.columbiamanagement.com
The fund files a complete schedule of portfolio holdings with the SEC for the first and third quarters of each fiscal year on Form N-Q. The fund’s Form N-Q is available on the SEC’s website at www.sec.gov and may be reviewed and copied at the SEC’s Public Reference Room in Washington, D.C. Information on the operation of the Public Reference Room may be obtained by calling
1-800-SEC-0330.
Investors should consider the investment objectives, risks, charges and expenses of a mutual fund carefully before investing. For a free prospectus, which contains this and other important information about the funds, visit columbiamanagement.com. Read the prospectus carefully before investing.
On April 30, 2010, Ameriprise Financial, Inc., the parent company of RiverSource Investments, LLC, acquired the long-term asset management business of Columbia Management Group, LLC, including certain of its affiliates, which were, prior to this acquisition, part of Bank of America. In connection with the acquisition of the long-term assets, the Columbia Funds have a new investment adviser, RiverSource Investments, LLC, which is now known as Columbia Management Investment Advisers, LLC. For those clients that use the services of a subadviser, those arrangements are continuing unless notified otherwise. RiverSource Fund Distributors, Inc., now known as Columbia Management Investment Distributors, Inc., member FINRA, will act as the principal distributor of the Columbia Funds.
73

One Financial Center
Boston, MA 02111-2621
Columbia Intermediate Bond Fund
Annual Report, March 31, 2010
©2010 Columbia Management Investment Advisers, LLC. All rights reserved.
One Financial Center, Boston, MA 02111-2621
800.345.6611 www.columbiafunds.com
SHC-42/44510-0310 (05/10) 10/O2J351

Annual Report
March 31, 2010
Equity Funds
| n | | Columbia Blended Equity Fund |
| n | | Columbia Energy and Natural Resources Fund |
| n | | Columbia Mid Cap Core Fund |
| n | | Columbia Select Large Cap Growth Fund |
| n | | Columbia Select Opportunities Fund |
| n | | Columbia Select Small Cap Fund |
| n | | Columbia Value and Restructuring Fund |
| n | | Columbia Emerging Markets Fund |
| n | | Columbia International Growth Fund |
| n | | Columbia Pacific/Asia Fund |
Not FDIC Insured Ÿ May Lose Value Ÿ No Bank Guarantee
Table of Contents
The views expressed in this report reflect the current views of the respective parties. These views are not guarantees of future performance and involve certain risks, uncertainties and assumptions that are difficult to predict, so actual outcomes and results may differ significantly from the views expressed. These views are subject to change at any time based upon economic, market or other conditions and the respective parties disclaim any responsibility to update such views. These views may not be relied on as investment advice and, because investment decisions for a Columbia Fund are based on numerous factors, may not be relied on as an indication of trading intent on behalf of any particular Columbia Fund. References to specific securities should not be construed as a recommendation or investment advice.
President’s Message

Dear Shareholder:
On May 3, 2010, Ameriprise Financial, Inc. announced that it had completed the acquisition of the long-term asset management business of Columbia Management from Bank of America. This includes the business of managing its equity and fixed-income mutual funds. Ameriprise Financial has combined its current U.S. asset management business, RiverSource Investments, LLC, with Columbia Management. This transaction puts together two leading asset management firms to create one entity that ranks as the eighth largest manager of long-term mutual fund assets in the United States.1 This combined business will operate under the well-regarded Columbia Management brand, where we will build on the strengths of our combined investment capabilities and talent, our broad and diversified product lineup and exceptional service.
Our combined business has a new breadth and depth of investment choices. William “Ted” Truscott, CEO, U.S. asset management and president of annuities for Ameriprise Financial, leads the combined U.S. asset management business. Michael Jones serves as president, U.S. asset management. Colin Moore continues to serve as chief investment officer. I am also continuing in my role as head of mutual funds, responsible for the delivery of mutual fund products and services to investors. The Columbia funds’ advisers, distributor and transfer agent are now subsidiaries of our parent company, Ameriprise Financial but operate under the Columbia Management name. You will begin to see these names used in communications and statements going forward.
| | |
| | | Service provider name |
| Advisers | | Columbia Management Investment Advisers, LLC Columbia Wanger Asset Management, LLC |
| Distributor | | Columbia Management Investment Distributors, Inc. |
| Transfer Agent | | Columbia Management Investment Services Corp. |
As a valued investor in Columbia funds, please know that our goal is to ensure a smooth transition and provide the highest quality products and services. Transition teams across the organization continue their efforts to build on best practices from both legacy organizations with integration efforts including rebranding, vendor and system consolidations and client communications. Additionally, we want to assure you that the funds’ portfolio managers also continue to focus on providing uninterrupted service to all fund shareholders.
Although we have a lot of work ahead of us in 2010, Columbia Management and Ameriprise Financial are excited about the opportunities for our combined organization. I share this optimism and believe it positions us as a best-in-class asset management business with the ability to deliver more for our clients than ever before.
Sincerely,

J. Kevin Connaughton
President, Columbia Funds
| 1 | Source: Ameriprise Financial, Inc., based on March 31, 2010 data from the Investment Company Institute |
Investors should consider the investment objectives, risks, charges and expenses of a mutual fund carefully before investing. For a free prospectus, which contains this and other important information about the funds, visit columbiamanagement.com. Read the prospectus carefully before investing.
Securities products offered through Columbia Management Investment Distributors, Inc. (formerly known as RiverSource Fund Distributors, Inc.), member FINRA. Advisory services provided by Columbia Management Investment Advisers, LLC (formerly known as RiverSource Investments, LLC).
© 2010 Columbia Management Investment Advisers, LLC. All rights reserved.
Economic Update – Equity Funds
After a deep and difficult recession, the U.S. economy regained its footing midway through calendar year 2009. Gross domestic product (GDP) turned positive in the third quarter of 2009, rising 2.2%, and then gained 5.6% in the fourth quarter according to the estimate released by the Bureau of Economic Analysis. Growth was primarily the result of a slowdown in inventory reduction and federal government stimulus spending. Hopes for a sustained recovery now depend on a variety of factors, including continued improvement in consumer spending, an increase in revenues to keep business profits moving higher and a turnaround in the labor market.
The housing market showed some signs of stabilizing, but stopped short of meaningful improvement during the period. Home sales moved higher in 2009 as new homebuyers took advantage of a federal tax credit. However, as the tax credit was set to expire in November 2009, sales slipped — and did not revive even though the tax credit was expanded and extended through April 2010. Housing prices remained relatively flat over the past year, but that was progress compared to 2008. The average home price fell sharply in 2008; and since then distressed properties, which account for approximately 40% of all housing sales, have held prices down because they are heavily discounted.
In the beleaguered labor market, there was some good news. While businesses continued to shed jobs through most of 2009, raising the unemployment rate to 9.7% at the end of the period*, job data turned positive in March 2010, buoyed by a swell of temporary workers hired to conduct the national once-in-a-decade census. Consumer spending also trended higher in the second half of the period. In fact, March year-over-year sales made a significant jump upward. Despite these improvements, consumer confidence, as measured monthly by The Conference Board, an independent research organization, failed to gain much ground during the year. Consumers surveyed continue to cite uncertain business conditions and still-weak labor prospects for their concerns.
On the business side of the economy, manufacturing activity gained momentum. A key measure of the nation’s manufacturing situation — the Institute for Supply Management’s Index — rose above 50 in July 2009 — then rose for eight consecutive months to remain well above 50 for the remainder of the period. (An index value of 50+ indicates a growing economy.) Industrial production moved higher for eleven out of the past 12 months, and durable goods orders took off, with a big jump upward in January. Manufacturing capacity utilization inched upward to 72.7%.
| * | Source: U.S. Bureau of Labor Statistics |
Summary
For the 12-month period that ended March 31, 2010
| | n | | After a sharp decline, stock markets rebounded around the world, as measured by the S&P 500 Index and the MSCI EAFE Index. | |
| | |
| S&P Index | | MSCI Index |
| |

| |
|
49.77% | | 54.44% |
| | n | | As investors grew more comfortable with risk, non-Treasury sectors of the bond market rebounded. The Barclays Capital Aggregate Bond Index delivered solid results. High-yield bonds outperformed stocks, as measured by the BofA Merrill Lynch U.S. High Yield Cash Pay Index. | |
| | |
| Barclays Aggregate Index | | BofA ML Index |
| |
| |
|
7.69% | | 55.67% |
1
Economic Update (continued) – Equity Funds
Stocks staged a solid comeback
Against a strengthening economic backdrop, a stock market rally that began in mid-March 2009 continued with little interruption through the end of the period. The U.S. stock market returned 49.77% for the 12-month period, as measured by the S&P 500 Index.1 Mid-cap stocks outperformed large- and small-cap stocks and value stocks outperformed growth stocks by a solid margin, as measured by their respective Russell indices.2 Outside the United States, stock market returns were slightly stronger. The MSCI EAFE Index,3 a broad gauge of stock market performance in foreign developed markets, gained 54.44% (net of dividends, in U.S. dollars) for the period. Emerging stock markets were caught in a downdraft in 2009, but they bounced back stronger than domestic or developed world markets as their economic growth generally outpaced the developed world. The MSCI Emerging Markets Index4 returned 81.08% (net of dividends, in U.S. dollars) for the 12-month period, after giving back some gains in the first quarter of 2010.
Bond returns ranged from solid to strong
As hopes for a recovery materialized, bonds from non-Treasury sectors delivered solid returns. The Barclays Capital Aggregate Bond Index5 returned 7.69%. Municipal bonds gained more than taxable investment-grade bonds even without factoring in potential tax advantages to investors in higher income-tax brackets. The Barclays Capital Municipal Bond Index6 returned 9.69%. The high-yield bond market was even stronger than the broad stock market during the period. For the 12 months covered by this report, the BofA Merrill Lynch U.S. High Yield Cash Pay Index7 returned 55.67%.
The yield on the 10-year U.S. Treasury, a common bellwether for the bond market, rose from 2.7% to 3.8% during the 12-month period. Yet despite the pickup in economic activity, the Federal Reserve Board (the Fed) kept a key short-term interest rate — the federal funds rate — close to zero throughout the period.
Past performance is no guarantee of future results.
| 1 | The Standard & Poor’s (S&P) 500 Index tracks the performance of 500 widely held, large-capitalization U.S. stocks. |
| 2 | The Russell 1000 Index tracks the performance of 1,000 of the largest U.S. companies, based on market capitalization. The Russell MidCap Index measures the performance of the 800 smallest companies in the Russell 1000 Index, which represents approximately 25% of the total market capitalization of the Russell 1000 Index. The Russell 2000 Index measures the performance of the 2,000 smallest companies in the Russell 3000 Index, which represents approximately 8% of the total market capitalization of the Russell 3000 Index. The Russell 3000 Growth Index measures the performance of those Russell 3000 Index companies with higher price-to-book ratios and higher forecasted growth values. The stocks in this index are also members of either the Russell 1000 Growth or the Russell 2000 Growth indexes. The Russell 3000 Value Index measures the performance of those Russell 3000 Index companies with lower price-to-book ratios and lower forecasted growth values. The stocks in this index are also members of either the Russell 1000 Value or the Russell 2000 Value indexes. |
| 3 | The Morgan Stanley Capital International Europe, Australasia, Far East (MSCI EAFE) Index is a capitalization-weighted index that tracks the total return of common stocks in 21 developed-market countries within Europe, Australasia and the Far East. |
| 4 | The Morgan Stanley Capital International Emerging Markets Index (MSCI EMI) is a free float-adjusted market capitalization index that is designed to measure equity market performance in the global emerging markets. As of June 2009, the MSCI Emerging Markets Index consisted of the following 22 emerging market country indices: Brazil, Chile, China, Colombia, Czech Republic, Egypt, Hungary, India, Indonesia, Israel, Korea, Malaysia, Mexico, Morocco, Peru, Philippines, Poland, Russia, South Africa, Taiwan, Thailand, and Turkey. |
| 5 | The Barclays Capital Aggregate Bond Index is a market value-weighted index that tracks the daily price, coupon, pay-downs and total return performance of fixed-rate, publicly placed, dollar-denominated and non-convertible investment grade debt issues with at least $250 million par amount outstanding and with at least one year to final maturity. |
| 6 | The Barclays Capital Municipal Bond Index is considered representative of the broad market for investment-grade, tax-exempt bonds with a maturity of at least one year. |
| 7 | The BofA Merrill Lynch U.S. High Yield Cash Pay Index tracks the performance of non-investment-grade corporate bonds. |
Indices are not available for investment, are not professionally managed and do not reflect sales charges, fees, brokerage commissions, taxes or other expenses of investing. Securities in the fund may not match those in an index.
2
Fund Profile – Columbia Blended Equity Fund
Summary
| n | | For the 12-month period that ended March 31, 2010, the fund’s Class A shares returned 43.41% without sales charge. |
| n | | The fund, its benchmark — the S&P 500 Index1 — and the average return of its peer group, the Lipper Multi-Cap Core Classification2 — all enjoyed returns of more than 40% for the period. |
| n | | An emphasis on companies with solid balance sheets and positive free cash flow prospects hurt the fund’s relative performance in an environment that favored more speculative stocks, which rallied as the economic picture brightened. |
Portfolio Management
Peter Santoro has co-managed the fund since February 2009 and has been associated with the advisor or its predecessors since 2007.
Dhruv V. Toolsidas has co-managed the fund since March 2008 and has been associated with the advisor or its predecessors since 2003.
Effective May 1, 2010, RiverSource Investments, LLC, a subsidiary of Ameriprise Financial, Inc., became the investment advisor to the fund and changed its name to Columbia Management Investment Advisers, LLC. Please see the fund’s prospectus, as supplemented, for more information regarding the change in investment advisor and certain other changes.
| 1 | The Standard & Poor’s (S&P) 500 Index tracks the performance of 500 widely held, large-capitalization U.S. stocks. Indices are not available for investment, are not professionally managed and do not reflect sales charges, fees, brokerage commissions, taxes or other expenses of investing. Securities in the fund may not match those in an index. |
| 2 | Lipper Inc., a widely respected data provider in the industry, calculates an average total return (assuming reinvestment of distributions) for mutual funds with investment objectives similar to those of the fund. Lipper makes no adjustment for the effect of sales loads. |
Performance data quoted represents past performance and current performance may be lower or higher. Past performance is no guarantee of future results. The investment return and principal value will fluctuate so that shares, when redeemed, may be worth more or less than the original cost. Please visit www.columbiafunds.com for daily and most recent month-end performance updates.
Summary
1-year return as of 03/31/10
| | |
| |
 | | +43.41% Class A shares
(without sales charge) |
| |
| | +49.77% S&P 500 Index |
|
Morningstar Style BoxTM |
|
Equity Style |
|
The Morningstar Style BoxTM reveals a fund’s investment strategy. For equity funds, the vertical axis shows the market capitalization of the stocks owned, and the horizontal axis shows investment style (value, blend or growth). Information shown is based on the most recent data provided by Morningstar.
3
Performance Information – Columbia Blended Equity Fund
Performance data quoted represents past performance and current performance may be lower or higher. Past performance is no guarantee of future results. The investment return and principal value will fluctuate so that shares, when redeemed, may be worth more or less than the original cost. Please visit www.columbiafunds.com for daily and most recent month-end performance updates.
| | |
| Annual operating expense ratio (%)* |
| |
Class A | | 1.27 |
Class C | | 2.02 |
Class Z | | 1.02 |
| * | The annual operating expense ratio is as stated in the fund’s prospectus that is current as of the date of this report. Differences in expense ratios disclosed elsewhere in this report may result from the inclusion of fee waivers and expense reimbursements as well as the use of different time periods used in calculating the ratios. |
| | |
| Performance of a $10,000 investment 04/01/00 – 03/31/10 |
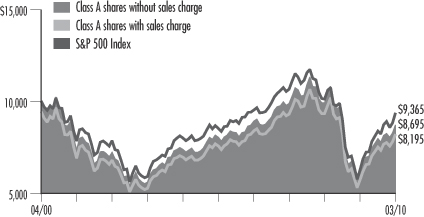
The chart above shows the change in value of a hypothetical $10,000 investment in Class A shares of Columbia Blended Equity Fund during the stated time period, and does not reflect the deduction of taxes that a shareholder may pay on fund distributions or on the redemption of fund shares.
| | | | |
| Performance of a $10,000 investment 04/01/00 – 03/31/10 ($) |
| | |
| Sales charge | | without | | with |
Class A | | 8,695 | | 8,195 |
Class C | | 8,562 | | 8,562 |
Class Z | | 8,738 | | n/a |
| | | | | | | | | | |
| Average annual total return as of 03/31/10 (%) |
| | | |
| Share class | | A | | C | | Z |
| Inception | | 03/31/08 | | 03/31/08 | | 04/25/85 |
| Sales charge | | without | | with | | without | | with | | without |
1-year | | 43.41 | | 35.15 | | 42.31 | | 41.31 | | 43.84 |
5-year | | 1.63 | | 0.43 | | 1.32 | | 1.32 | | 1.73 |
10-year | | –1.39 | | –1.97 | | –1.54 | | –1.54 | | –1.34 |
The “with sales charge” returns include the maximum initial sales charge of 5.75% for Class A shares and the applicable contingent deferred sales charge of 1.00% for Class C shares for the first year only. The “without sales charge” returns do not include the effect of sales charges. If they had, returns would be lower.
The Fund commenced operations on March 31, 2008. The returns of the Class A and Class C shares shown for periods prior to March 31, 2008 are those of the Shares class shares of the Blended Equity Fund, the predecessor to the Fund and a series of Excelsior Funds, Inc. (the “Predecessor Fund”). The returns shown reflect applicable sales charges, but have not been adjusted to reflect differences in expenses. If differences in expenses were reflected, the returns shown for the periods prior to March 31, 2008 would be lower. The returns of the Class Z shares shown for periods prior to March 31, 2008 are those of the Shares class shares of the Predecessor Fund. The returns of Class Z shown have not been adjusted to reflect differences in expenses.
Inception date refers to the date on which the Fund class commenced operations for Classes A and C and the date on which the Predecessor Fund class commenced operations for Class Z.
Performance results reflect any fee waivers or reimbursements of fund expenses by the investment advisor and/or any of its affiliates. Absent these fee waivers or expense reimbursement arrangements, performance results would have been lower.
All results shown assume reinvestment of distributions. Class Z shares are sold at net asset value with no distribution and service (Rule 12b-1) fees. Class Z shares have limited eligibility and the investment minimum requirements may vary. Please see the fund’s prospectus for details. Performance for different share classes will vary based on differences in sales charges and fees associated with each class.
The tables do not reflect the deduction of taxes that a shareholder may pay on fund distributions or on the redemption of fund shares.
4
Understanding Your Expenses – Columbia Blended Equity Fund
As a fund shareholder, you incur two types of costs. There are transaction costs, which generally include sales charges on purchases and may include redemption fees or exchange fees. There are also ongoing costs, which generally include investment advisory fees, distribution and service (Rule 12b-1) fees and other fund expenses. The information on this page is intended to help you understand the ongoing costs of investing in the fund and to compare these costs with the ongoing costs of investing in other mutual funds.
Analyzing your fund’s expenses by share class
To illustrate these ongoing costs, we have provided an example and calculated the expenses paid by investors in each share class during the period. The information in the following table is based on an initial investment of $1,000, which is invested at the beginning of the period and held for the entire period. Expense information is calculated two ways and each method provides you with different information. The amount listed in the “Actual” column is calculated using the fund’s actual operating expenses and total return for the period. The amount listed in the “Hypothetical” column for each share class assumes that the return each year is 5% before expenses and is calculated based on the fund’s actual operating expenses. You should not use the hypothetical account values and expenses to estimate either your actual account balance at the end of the period or the expenses you paid during this period.
Compare with other funds
Since all mutual funds are required to include the same hypothetical calculations about expenses in shareholder reports, you can use this information to compare the ongoing cost of investing in the fund with other funds. To do so, compare the 5% hypothetical example with the 5% hypothetical examples that appear in the shareholder reports of other funds. As you compare hypothetical examples of other funds, it is important to note that hypothetical examples are meant to highlight the ongoing costs of investing in a fund and do not reflect any transaction costs, such as sales charges, redemption fees or exchange fees.
Estimating your actual expenses
To estimate the expenses that you paid over the period, first you will need your account balance at the end of the period:
| | n | | For shareholders who receive their account statements from Columbia Management Services, Inc., your account balance is available online at www.columbiafunds.com or by calling Shareholder Services at 800.345.6611. | |
| | n | | For shareholders who receive their account statements from their financial intermediary, contact your financial intermediary to obtain your account balance. | |
| | 1. | Divide your ending account balance by $1,000. For example, if an account balance was $8,600 at the end of the period, the result would be 8.6. | |
| | 2. | In the section of the table below titled “Expenses paid during the period,” locate the amount for your share class. You will find this number in the column labeled “Actual.” Multiply this number by the result from step 1. Your answer is an estimate of the expenses you paid on your account during the period. | |
If the value of your account falls below the minimum initial investment requirement applicable to you, your account generally will be subject to a $20 annual fee. This fee is not included in the accompanying table. If you are subject to the fee, keep it in mind when you are estimating the ongoing expenses of investing in the fund and when comparing the expenses of this fund with other funds.
| | | | | | | | | | | | | | |
| 10/01/09 – 03/31/10 | | | | | | | | | | |
| | | | |
| | | Account value at the
beginning of the period ($) | | Account value at the
end of the period ($) | | Expenses paid
during the period ($) | | Fund’s annualized
expense ratio (%) |
| | | Actual | | Hypothetical | | Actual | | Hypothetical | | Actual | | Hypothetical | | Actual |
Class A | | 1,000.00 | | 1,000.00 | | 1,092.70 | | 1,018.70 | | 6.52 | | 6.29 | | 1.25 |
Class C | | 1,000.00 | | 1,000.00 | | 1,088.20 | | 1,014.96 | | 10.41 | | 10.05 | | 2.00 |
Class Z | | 1,000.00 | | 1,000.00 | | 1,094.50 | | 1,019.95 | | 5.22 | | 5.04 | | 1.00 |
Expenses paid during the period are equal to the annualized expense ratio for the share class, multiplied by the average account value over the period, then multiplied by the number of days in the fund’s most recent fiscal half-year and divided by 365.
Had the investment advisor and/or any of its affiliates not waived fees or reimbursed a portion of expenses, account value at the end of the period would have been reduced.
It is important to note that the expense amounts shown in the table are meant to highlight only ongoing costs of investing in the fund and do not reflect any transaction costs, such as sales charges, redemption fees or exchange fees. Therefore, the hypothetical examples provided may not help you determine the relative total costs of owning shares of different funds. If these transaction costs were included, your costs would have been higher.
5
Portfolio Managers’ Report – Columbia Blended Equity Fund
Performance data quoted represents past performance and current performance may be lower or higher. Past performance is no guarantee of future results. The investment return and principal value will fluctuate so that shares, when redeemed, may be worth more or less than the original cost. Please visit www.columbiafunds.com for daily and most recent month-end performance updates.
| | |
| Net asset value per share |
| |
as of 03/31/10 ($) | | |
Class A | | 23.10 |
Class C | | 22.99 |
Class Z | | 23.10 |
| | |
| Distributions declared per share |
| |
04/01/09 – 03/31/10 ($) | | |
Class A | | 0.13 |
Class C | | 0.02 |
Class Z | | 0.18 |
For the 12-month period that ended March 31, 2010, the fund’s Class A shares returned 43.41% without sales charge. The fund’s benchmark, the S&P 500 Index, returned 49.77% for the same period. The average return of funds in its peer group, the Lipper Multi-Cap Core Funds Classification, was 52.56% for the 12-month period. The period’s powerful stock market rally helped drive the fund’s positive double-digit returns. Nevertheless, its conservative positioning and emphasis on quality held the fund back relative to the index and peers in an environment where speculative names responded more favorably. The portion of the fund’s portfolio that is managed using a quantitative strategy also detracted from performance. A focus on companies in sectors that tend to respond favorably to conditions early in the economic cycle and on companies that could benefit from recovering emerging economies helped, as did stock selection in the technology and energy sectors.
Economic recovery, emerging markets and energy themes helped drive results
Positive economic news helped boost several of the fund’s technology holdings, including Hewlett-Packard, Microsoft and Apple (1.7%, 3.9%, and 1.3% of net assets, respectively). In light of a potentially muted domestic economic recovery, we also sought companies with exposure to emerging markets and their potential for better economic growth. An uptick in demand from emerging economies benefited iron ore distributor Rio Tinto, cosmetics purveyor Avon Products (0.5% and 0.9% of net assets, respectively) and AES, an international generator and distributor of electricity. All three posted strong results from fast-growing overseas demand. We subsequently sold the AES position. An emphasis on oil and natural gas exploration and production companies also aided returns. Rising energy prices boosted shares of Apache and Occidental Petroleum (each 1.1% of net assets) as both companies developed their pipelines with new oil and gas reserve discoveries.
Disappointments in financials, industrials and consumer discretionary sectors
During the period, the market rallied on an assumption that the economy would rapidly improve. As the market’s interest turned towards stocks that could benefit from a quick economic turnaround, many companies that had performed well in 2008 did not retain that momentum in 2009. Thus, our emphasis on companies with financial strength and defensive characteristics detracted from performance during the 2009 cyclical rally. In particular, holdings in the financials, industrials and consumer discretionary sectors did not keep pace with the benchmark, which included more speculative names in these sectors. We focused on bank stocks, such as Fifth Third, U.S. Bancorp, JPMorgan Chase and PNC Financial Services (0.7%, 0.8%, 1.8% and 1.6% of net assets, respectively), as the segment within financials that was most likely to succeed as the risk of insolvency declined. While these stocks did well during the period, more speculative names did even better.
Holdings with absolute negative results were few. Department store JC Penney reported disappointing same-store sales and shares of Burger King declined when a planned turnaround failed to materialize. We sold both positions. We also sold milk producer Dean Foods, which was hit by declining milk prices and poor operational results.
6
Portfolio Managers’ Report (continued) – Columbia Blended Equity Fund
Positioned for an improving economy
We remain focused on high-quality companies with strong balance sheets, which we believe are well positioned relative to their respective industries. By drawing on three independent research sources — fundamental research, quantitative models and the input of our portfolio management team — and by employing a disciplined valuation process, we seek companies that are positioned to capitalize as the economic recovery continues.
Portfolio characteristics and holdings are subject to change periodically and may not be representative of current characteristics and holdings. The outlook for the fund may differ from that presented for other Columbia Funds.
Equity securities are subject to stock market fluctuations that occur in response to economic and business developments.
International investing involves special risks, including foreign taxation, currency risks, risks associated with possible differences in financial standards and other risks associated with future political and economic developments.
| | |
| Top sectors |
|
as of 03/31/10 (%) |
Information Technology | | 19.7 |
Financials | | 18.6 |
Health Care | | 13.3 |
Consumer Staples | | 12.5 |
Industrials | | 10.4 |
| | |
| Top 10 holdings |
|
as of 03/31/10 (%) |
Target | | 4.7 |
Cisco Systems | | 4.7 |
Abbott Laboratories | | 4.3 |
Microsoft | | 3.9 |
Wal-Mart Stores | | 3.7 |
Philip Morris International | | 3.1 |
Exxon Mobil | | 3.0 |
Johnson & Johnson | | 2.6 |
State Street | | 2.2 |
Wells Fargo | | 2.0 |
The fund is actively managed and the composition of its portfolio will change over time. Information provided is calculated as a percentage of net assets.
7
Fund Profile – Columbia Energy and Natural Resources Fund
Performance data quoted represents past performance and current performance may be lower or higher. Past performance is no guarantee of future results. The investment return and principal value will fluctuate so that shares, when redeemed, may be worth more or less than the original cost. Please visit www.columbiafunds.com for daily and most recent month-end performance updates.
Summary
1-year return as of 03/31/10
| | |
| |
| | +47.76% Class A shares
(without sales charge) |
| |
| | +48.62% S&P North American Natural Resources Sector Index |
|
Morningstar Style BoxTM |
|
Equity Style |
|
The Morningstar Style BoxTM reveals a fund’s investment strategy. For equity funds, the vertical axis shows the market capitalization of the stocks owned, and the horizontal axis shows investment style (value, blend or growth). Information shown is based on the most recent data provided by Morningstar.
Summary
| n | | For the 12-month period that ended March 31, 2010, the fund’s Class A shares returned 47.76% without sales charge. |
| n | | The fund trailed its benchmark, the S&P North American Natural Resources Sector Index1; and lagged the average return of its peer group, the Lipper Natural Resources Funds Classification2, during a period in which surging oil prices led to robust returns for the fund, its benchmark and its peer group. Nearly all of the underperformance occurred during the first fiscal quarter ending June 30, 2009 as more speculative small and mid-capitalization companies out-performed the higher quality large capitalization names. |
| n | | The fund’s selections in both the energy and natural resources sectors produced generally strong returns. An underweight in gold, integrated oil and gas, and paper and packaging held back results. |
Portfolio Management
Michael E. Hoover has managed the fund since March 2008 and has been associated with the advisor or its predecessors since 1989.
Effective May 1, 2010, RiverSource Investments, LLC, a subsidiary of Ameriprise Financial, Inc., became the investment advisor to the fund and changed its name to Columbia Management Investment Advisers, LLC. Please see the fund’s prospectus, as supplemented, for more information regarding the change in investment advisor and certain other changes.
| 1 | The Standard & Poor’s (S&P) North American Natural Resources Sector Index is a modified market capitalization-weighted equity index designed as a benchmark for U.S. traded stocks in the natural resources sector. The index includes companies involved in the following categories: extractive industries, energy companies, owners and operators of timber tracts, forestry services, producers of pulp and paper and owners of plantations. Indices are not available for investment, are not professionally managed and do not reflect sales charges, fees, brokerage commissions, taxes or other expenses of investing. Securities in the fund may not match those in an index. |
| 2 | Lipper Inc., a widely respected data provider in the industry, calculates an average total return (assuming reinvestment of distributions) for mutual funds with investment objectives similar to those of the fund. Lipper makes no adjustment for the effect of sales loads. |
8
Performance Information – Columbia Energy and Natural Resources Fund
| | | | |
| Performance of a $10,000 investment 04/01/00 – 03/31/10 |
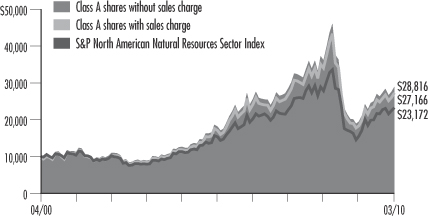
The chart above shows the change in value of a hypothetical $10,000 investment in Class A shares of Columbia Energy and Natural Resources Fund during the stated time period, and does not reflect the deduction of taxes that a shareholder may pay on fund distributions or on the redemption of fund shares.
| | | | |
| Performance of a $10,000 investment 04/01/00 – 03/31/10 ($) |
| | |
| Sales charge | | without | | with |
Class A | | 28,816 | | 27,166 |
Class C | | 28,328 | | 28,328 |
Class Z | | 28,971 | | n/a |
| | | | | | | | | | |
| Average annual total return as of 03/31/10 (%) |
| | | |
| Share class | | A | | C | | Z |
| Inception | | 09/28/07 | | 09/28/07 | | 12/31/92 |
| Sales charge | | without | | with | | without | | with | | without |
1-year | | 47.76 | | 39.27 | | 46.84 | | 45.84 | | 48.12 |
5-year | | 9.72 | | 8.43 | | 9.34 | | 9.34 | | 9.84 |
10-year | | 11.16 | | 10.51 | | 10.97 | | 10.97 | | 11.22 |
Performance data quoted represents past performance and current performance may be lower or higher. Past performance is no guarantee of future results. The investment return and principal value will fluctuate so that shares, when redeemed, may be worth more or less than the original cost. Please visit www.columbiafunds.com for daily and most recent month-end performance updates.
| | |
| Annual operating expense ratio (%)* |
| |
Class A | | 1.28 |
Class C | | 2.03 |
Class Z | | 1.03 |
| * | The annual operating expense ratio is as stated in the fund’s prospectus that is current as of the date of this report. Differences in expense ratios disclosed elsewhere in this report may result from the inclusion of fee waivers and expense reimbursements as well as the use of different time periods used in calculating the ratios. |
The “with sales charge” returns include the maximum initial sales charge of 5.75% for Class A shares and the applicable contingent deferred sales charge of 1.00% for Class C shares for the first year only. The “without sales charge” returns do not include the effect of sales charges. If they had, returns would be lower.
The Fund commenced operations on March 31, 2008. The returns of the Class A and Class C shares shown for periods prior to March 31, 2008 include the returns of Class A shares or Class C shares, as applicable, of Energy and Natural Resources Fund, the predecessor to the Fund and a series of Excelsior Funds, Inc. (the “Predecessor Fund”), for periods after September 27, 2007, and include the returns of Shares class shares of the Predecessor Fund for periods prior to September 28, 2007. The returns shown reflect applicable sales charges, but have not been adjusted to reflect differences in expenses. If differences in expenses were reflected, the returns shown for the periods prior to September 28, 2007 would be lower. The returns of the Class Z shares shown for periods prior to March 31, 2008 are those of Shares class shares of the Predecessor Fund. The returns of Class Z shares shown have not been adjusted to reflect differences in expenses.
Inception date refers to the date on which the Predecessor Fund class commenced operations.
Performance results reflect any fee waivers or reimbursements of fund expenses by the investment advisor and/or any of its affiliates. Absent these fee waivers or expense reimbursement arrangements, performance results would have been lower.
All results shown assume reinvestment of distributions. Class Z shares are sold at net asset value with no distribution and service (Rule 12b-1) fees. Class Z shares have limited eligibility and the investment minimum requirements may vary. Please see the fund’s prospectus for details. Performance for different share classes will vary based on differences in sales charges and fees associated with each class.
The tables do not reflect the deduction of taxes that a shareholder may pay on fund distributions or on the redemption of fund shares.
9
Understanding Your Expenses – Columbia Energy and Natural Resources Fund
Estimating your actual expenses
To estimate the expenses that you paid over the period, first you will need your account balance at the end of the period:
| | n | | For shareholders who receive their account statements from Columbia Management Services, Inc., your account balance is available online at www.columbiafunds.com or by calling Shareholder Services at 800.345.6611. | |
| | n | | For shareholders who receive their account statements from their financial intermediary, contact your financial intermediary to obtain your account balance. | |
| | 1. | Divide your ending account balance by $1,000. For example, if an account balance was $8,600 at the end of the period, the result would be 8.6. | |
| | 2. | In the section of the table below titled “Expenses paid during the period,” locate the amount for your share class. You will find this number in the column labeled “Actual.” Multiply this number by the result from step 1. Your answer is an estimate of the expenses you paid on your account during the period. | |
If the value of your account falls below the minimum initial investment requirement applicable to you, your account generally will be subject to a $20 annual fee. This fee is not included in the accompanying table. If you are subject to the fee, keep it in mind when you are estimating the ongoing expenses of investing in the fund and when comparing the expenses of this fund with other funds.
As a fund shareholder, you incur two types of costs. There are transaction costs, which generally include sales charges on purchases and may include redemption fees or exchange fees. There are also ongoing costs, which generally include investment advisory fees, distribution and service (Rule 12b-1) fees and other fund expenses. The information on this page is intended to help you understand the ongoing costs of investing in the fund and to compare these costs with the ongoing costs of investing in other mutual funds.
Analyzing your fund’s expenses by share class
To illustrate these ongoing costs, we have provided an example and calculated the expenses paid by investors in each share class during the period. The information in the following table is based on an initial investment of $1,000 which is invested at the beginning of the period and held for the entire period. Expense information is calculated two ways and each method provides you with different information. The amount listed in the “Actual” column is calculated using the fund’s actual operating expenses and total return for the period. The amount listed in the “Hypothetical” column for each share class assumes that the return each year is 5% before expenses and is calculated based on the fund’s actual operating expenses. You should not use the hypothetical account values and expenses to estimate either your actual account balance at the end of the period or the expenses you paid during this period.
Compare with other funds
Since all mutual funds are required to include the same hypothetical calculations about expenses in shareholder reports, you can use this information to compare the ongoing costs of investing in the fund with other funds. To do so, compare the 5% hypothetical example with the 5% hypothetical examples that appear in the shareholder reports of other funds. As you compare hypothetical examples of other funds, it is important to note that hypothetical examples are meant to highlight the ongoing costs of investing in a fund and do not reflect any transaction costs, such as sales charges, redemption fees or exchange fees.
| | | | | | | | | | | | | | |
| 10/01/09 – 03/31/10 | | | | | | | | | | |
| | | | |
| | | Account value at the
beginning of the period ($) | | Account value at the
end of the period ($) | | Expenses paid
during the period ($) | | Fund’s annualized
expense ratio (%) |
| | | Actual | | Hypothetical | | Actual | | Hypothetical | | Actual | | Hypothetical | | Actual |
Class A | | 1,000.00 | | 1,000.00 | | 1,072.00 | | 1,019.00 | | 6.15 | | 5.99 | | 1.19 |
Class C | | 1,000.00 | | 1,000.00 | | 1,069.20 | | 1,015.26 | | 10.01 | | 9.75 | | 1.94 |
Class Z | | 1,000.00 | | 1,000.00 | | 1,074.00 | | 1,020.24 | | 4.86 | | 4.73 | | 0.94 |
Expenses paid during the period are equal to the annualized expense ratio for the share class, multiplied by the average account value over the period, then multiplied by the number of days in the fund’s most recent fiscal half-year and divided by 365.
It is important to note that the expense amounts shown in the table are meant to highlight only ongoing costs of investing in the fund and do not reflect any transaction costs, such as sales charges, redemption fees or exchange fees. Therefore, the hypothetical examples provided may not help you determine the relative total costs of owning shares of different funds. If these transaction costs were included, your costs would have been higher.
10
Portfolio Manager’s Report – Columbia Energy and Natural Resources Fund
For the 12-month period that ended March 31, 2010, the fund’s Class A shares returned 47.76% without sales charge. The S&P North American Natural Resources Sector Index returned 48.62% for the same period. The average return of funds in its peer group, the Lipper Natural Resources Funds Classification, was 56.66% for the 12-month period. The fund’s selections in both the energy and natural resources (materials) sectors produced generally strong returns. An underweight in gold, integrated oil and gas, and paper and packaging held back results.
Rising prices created significant opportunities
While the 12-month period generally saw strong price gains in energy and natural resource commodities, it also witnessed a decoupling of the prices of crude oil and natural gas in North America. The price of crude oil rose substantially over the period, as the commodity came to be treated both as a hedge against a weak U.S. dollar and as a bet on growth trends in the global economy. In contrast, natural gas prices in North America ended the 12-month period at lower levels than at the start. While the supply of natural gas expanded, demand failed to keep pace as major U.S. industrial users operated well below capacity. In our portfolio of energy investments, we substantially lowered the weights in the major defensive groups, including major oil companies and regulated utilities and sold positions in three small-cap natural gas producers. At the same time, we moved into more aggressive, small- and mid-cap companies that were benefiting from surging oil prices. In the natural resources area, strong demand from China helped drive up prices for base metals such as copper, iron ore and coking coal. We sought to take advantage of this demand by raising the fund’s overall weight in natural resources stocks from 37% of net assets to almost 42%.
Strong gains in both energy and natural resources
The fund’s overweights in oil and gas exploration companies, chemical corporations and diversified mining corporations provided significant support to performance. We sold one top energy contributor, oil service corporation Weatherford International, but retained exposure to several others, including Northern Oil & Gas, a small-cap oil producer; Transocean, a specialist in offshore drilling; and exploration-and-production companies Brigham Exploration and Apache (2.3%, 1.3%, 0.9% and 2.2% of net assets, respectively). In natural resources, strong results came from investments in coal producer Walter Energy, chemical company Solutia, U.S. Steel, resource producer Freeport-McMoRan Copper & Gold and Vale SA, a Brazilian iron ore company (2.3%, 1.6%, 2.76%, 3.3% and 2.3% of net assets, respectively).
Certain industry underweights detracted from returns
Even though returns from integrated oil and gas, paper and packaging and gold companies were robust, the fund had less exposure to these areas than the index and, as such, our underweights hampered relative returns. In addition, Monsanto (1.6% of net assets), a leading producer of agricultural seeds and chemicals, was a notable underperformer when it failed to gain premium pricing for its latest seed products. Gold miners Goldcorp (1.9% of net assets) and Agnico Eagle disappointed. Mine production volumes were lower than expected and costs rose. We sold the position in
Performance data quoted represents past performance and current performance may be lower or higher. Past performance is no guarantee of future results. The investment return and principal value will fluctuate so that shares, when redeemed, may be worth more or less than the original cost. Please visit www.columbiafunds.com for daily and most recent month-end performance updates.
| | |
| Net asset value per share |
|
as of 03/31/10 ($) |
Class A | | 20.11 |
Class C | | 19.78 |
Class Z | | 20.17 |
| | |
| Distributions declared per share |
| |
04/01/09 – 03/31/10 ($) | | |
Class A | | 0.01 |
Class Z | | 0.05 |
11
Portfolio Manager’s Report (continued) – Columbia Energy and Natural Resources Fund
| | |
| Top 10 holdings |
| |
as of 03/31/10 (%) | | |
Freeport-McMoRan Copper & Gold | | 3.3 |
United States Steel | | 2.8 |
Exxon Mobil | | 2.7 |
Teck Resources | | 2.5 |
Pioneer Natural Resources | | 2.5 |
Walter Energy | | 2.3 |
Vale SA | | 2.3 |
Schlumberger | | 2.3 |
Northern Oil & Gas | | 2.3 |
Apache | | 2.2 |
| | |
| Top sectors |
| |
as of 03/31/10 (%) | | |
Energy | | 58.6 |
Materials | | 33.5 |
Industrials | | 5.7 |
This fund is actively managed and the composition of its portfolio will change over time. Information provided is calculated as a percentage of net assets.
Agnico Eagle while retaining exposure to Goldcorp. Despite disappointing performance, we also kept an investment in Willbros Group (0.4% of net assets), an energy-oriented engineering and construction company.
Positioned for global recovery
We believe the fund is well positioned for a sustained recovery in emerging markets and an eventual rebound in the United States, especially with increased exposure to natural resources. Over the next two decades, we think the emerging economies of Brazil, India and China will evolve and raise the living standards of over one billion people. This persistent long-term secular trend should provide significant opportunities in both energy and natural resources industries. In the near term, prospects for North American natural gas producers should continue to be restricted by burgeoning supply and constrained demand. As a consequence, we believe that oil is a more investable commodity, and we have focused on companies that have the potential to benefit from the rising price of crude oil.
Portfolio characteristics and holdings are subject to change periodically and may not be representative of current characteristics and holdings. The outlook for the fund may differ from that presented for other Columbia Funds.
Equity securities are subject to stock market fluctuations that occur in response to economic and business developments.
International investing involves special risks, including foreign taxation, currency risks, risks associated with possible differences in financial standards and other risks associated with future political and economic developments.
Energy and natural resources stocks have been volatile. They may be affected by rising interest rates and inflation and can also be affected by factors such as natural events (for example, earthquakes or fires) and international politics.
The fund is non-diversified, which generally means that it may invest a greater percentage of its total assets in the securities of fewer issuers than a “diversified” fund. This increases the risk that a change in the value of any one investment held by the Fund could affect the overall value of the Fund more than it would affect that of a diversified fund holding a greater number of investments. Accordingly, the Fund’s value will likely be more volatile than the value of more diversified funds.
12
Fund Profile – Columbia Mid Cap Core Fund
Summary
| n | | For the 12-month period that ended March 31, 2010, the fund’s Class A shares returned 56.43% without sales charge. |
| n | | The fund, its benchmarks — the Russell Midcap Index and the Russell Midcap Value Index1 — and the average return of its peer group — the Lipper Mid-Cap Core Funds Classification2 — all achieved returns of 50% or more. |
| n | | The fund underperformed its benchmarks and peer group average because it emphasized larger, higher-quality stocks in an environment that favored smaller, more speculative names. |
Portfolio Management
Peter Santoro has co-managed the fund since November 2008 and has been associated with the advisor or its predecessors since 2003.
Craig Leopold has co-managed the fund since November 2008 and has been associated with the advisor or its predecessors since 2003.
Effective May 1, 2010, RiverSource Investments, LLC, a subsidiary of Ameriprise Financial, Inc., became the investment advisor to the fund and changed its name to Columbia Management Investment Advisers, LLC. Please see the fund’s prospectus, as supplemented, for more information regarding the change in investment advisor and certain other changes.
| 1 | The Russell Midcap Index measures the performance of the 800 smallest companies in the Russell 1000 Index, which represent approximately 25% of the total market capitalization of the Russell 1000 Index. The Russell Midcap Value Index measures the performance of those Russell Midcap companies with lower price-to-book ratios and lower forecasted growth values. The stocks are also members of the Russell 1000 Value Index. Indices are not available for investment, are not professionally managed and do not reflect sales charges, fees, brokerage commissions, taxes or other expenses of investing. Securities in the fund may not match those in an index. |
| 2 | Lipper Inc., a widely respected data provider in the industry, calculates an average total return (assuming reinvestment of distributions) for mutual funds with investment objectives similar to those of the fund. Lipper makes no adjustment for the effect of sales loads. |
Performance data quoted represents past performance and current performance may be lower or higher. Past performance is no guarantee of future results. The investment return and principal value will fluctuate so that shares, when redeemed, may be worth more or less than the original cost. Please visit www.columbiafunds.com for daily and most recent month-end performance updates.
Summary
1-year return as of 03/31/10
| | |
| |
| | +56.43% Class A shares
(without sales charge) |
| |
| | +67.71% Russell Midcap Index |
| |
| | +72.41% Russell Midcap Value Index |
|
Morningstar Style BoxTM |
|
Equity Style |
|
|
The Morningstar Style BoxTM reveals a fund’s investment strategy. For equity funds, the vertical axis shows the market capitalization of the stocks owned, and the horizontal axis shows investment style (value, blend or growth). Information shown is based on the most recent data provided by Morningstar. |
13
Performance Information – Columbia Mid Cap Core Fund
Performance data quoted represents past performance and current performance may be lower or higher. Past performance is no guarantee of future results. The investment return and principal value will fluctuate so that shares, when redeemed, may be worth more or less than the original cost. Please visit www.columbiafunds.com for daily and most recent month-end performance updates.
| | |
| Annual operating expense ratio (%)* |
| |
Class A | | 1.30 |
Class C | | 2.05 |
Class R | | 1.55 |
Class Z | | 1.05 |
| * | The annual operating expense ratio is as stated in the fund’s prospectus that is current as of the date of this report. Differences in expense ratios disclosed elsewhere in this report may result from the inclusion of fee waivers and expense reimbursements as well as the use of different time periods used in calculating the ratios. |
|
| Performance of a $10,000 investment 04/01/00 – 03/31/10 |
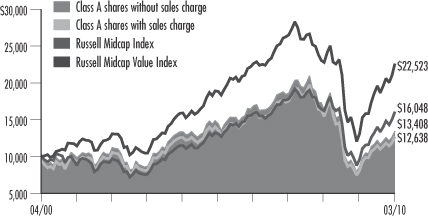
The chart above shows the change in value of a hypothetical $10,000 investment in Class A shares of Columbia Mid Cap Core Fund during the stated time period, and does not reflect the deduction of taxes that a shareholder may pay on fund distributions or on the redemption of fund shares.
| | | | |
| Performance of a $10,000 investment 04/01/00 – 03/31/10 ($) |
| | |
| Sales charge | | without | | with |
Class A | | 13,408 | | 12,638 |
Class C | | 13,250 | | 13,250 |
Class R | | 13,131 | | n/a |
Class Z | | 13,486 | | n/a |
| | | | | | | | | | | | |
| Average annual total return as of 03/31/10 (%) |
| | | | |
| Share class | | A | | C | | R | | Z |
| Inception | | 03/31/08 | | 03/31/08 | | 12/31/04 | | 05/31/96 |
| Sales charge | | without | | with | | without | | with | | without | | without |
1-year | | 56.43 | | 47.47 | | 55.74 | | 54.74 | | 56.19 | | 56.97 |
5-year | | –1.37 | | –2.53 | | –1.60 | | –1.60 | | –1.74 | | –1.25 |
10-year | | 2.98 | | 2.37 | | 2.85 | | 2.85 | | 2.76 | | 3.04 |
The “with sales charge” returns include the maximum initial sales charge of 5.75% for Class A shares and the applicable contingent deferred sales charge of 1.00% for Class C shares for the first year only. The “without sales charge” returns do not include the effect of sales charges. If they had, returns would be lower.
The Fund commenced operations on March 31, 2008. The returns of the Class A and Class C shares shown for periods prior to March 31, 2008 are those of the Shares class shares of Mid Cap Value and Restructuring, the predecessor to the Fund and a series of Excelsior Funds Trust (the “Predecessor Fund”). The returns shown reflect applicable sales charges, but have not been adjusted to reflect differences in expenses. If differences in expenses were reflected, the returns shown for periods prior to March 31, 2008 would be lower. The returns of Class R shares shown include the returns of Retirement Shares class shares of the Predecessor Fund for periods after December 30, 2004, and include the returns of Shares class shares of the Predecessor Fund for periods prior to December 31, 2004. The returns shown reflect that Class R shares are sold without sales charges, but have not been adjusted to reflect differences in expenses. If differences in expenses were reflected, the returns shown for periods prior to March 31, 2008 would be lower. The returns of the Class Z shares shown for periods prior to March 31, 2008 are those of the Shares class shares of the Predecessor Fund. The returns shown reflect that Class Z shares are sold without sales charges, but have not been adjusted to reflect differences in expenses. The inception of the Predecessor Fund is May 31, 1996.
Performance results reflect any fee waivers or reimbursements of fund expenses by the investment advisor and/or any of its affiliates. Absent these fee waivers or expense reimbursement arrangements, performance results would have been lower.
All results shown assume reinvestment of distributions. Class R shares are sold at net asset value with distribution and service (Rule 12b-1) fees. Class Z shares are sold at net asset value with no distribution and service (Rule 12b-1) fees. Class R and Class Z shares have limited eligibility and the investment minimum requirements may vary. Please see the fund’s prospectus for details. Performance for different share classes will vary based on differences in sales charges and fees associated with each class.
The tables do not reflect the deduction of taxes that a shareholder may pay on fund distributions or on the redemption of fund shares.
14
Understanding Your Expenses – Columbia Mid Cap Core Fund
As a fund shareholder, you incur two types of costs. There are transaction costs, which generally include sales charges on purchases and may include redemption fees or exchange fees. There are also ongoing costs, which generally include investment advisory fees, distribution and service (Rule 12b-1) fees and other fund expenses. The information on this page is intended to help you understand the ongoing costs of investing in the fund and to compare these costs with the ongoing costs of investing in other mutual funds.
Analyzing your fund’s expenses by share class
To illustrate these ongoing costs, we have provided an example and calculated the expenses paid by investors in each share class during the period. The information in the following table is based on an initial investment of $1,000, which is invested at the beginning of the period and held for the entire period. Expense information is calculated two ways and each method provides you with different information. The amount listed in the “Actual” column is calculated using the fund’s actual operating expenses and total return for the period. The amount listed in the “Hypothetical” column for each share class assumes that the return each year is 5% before expenses and is calculated based on the fund’s actual operating expenses. You should not use the hypothetical account values and expenses to estimate either your actual account balance at the end of the period or the expenses you paid during this period.
Compare with other funds
Since all mutual funds are required to include the same hypothetical calculations about expenses in shareholder reports, you can use this information to compare the ongoing costs of investing in the fund with other funds. To do so, compare the 5% hypothetical example with the 5% hypothetical examples that appear in the shareholder reports of other funds. As you compare hypothetical examples of other funds, it is important to note that hypothetical examples are meant to highlight the ongoing costs of investing in a fund and do not reflect any transaction costs, such as sales charges, redemption fees or exchange fees.
Estimating your actual expenses
To estimate the expenses that you paid over the period, first you will need your account balance at the end of the period:
| | n | | For shareholders who receive their account statements from Columbia Management Services, Inc., your account balance is available online at www.columbiafunds.com or by calling Shareholder Services at 800.345.6611. | |
| | n | | For shareholders who receive their account statements from their financial intermediary, contact your financial intermediary to obtain your account balance. | |
| | 1. | Divide your ending account balance by $1,000. For example, if an account balance was $8,600 at the end of the period, the result would be 8.6. | |
| | 2. | In the section of the table below titled “Expenses paid during the period,” locate the amount for your share class. You will find this number in the column labeled “Actual.” Multiply this number by the result from step 1. Your answer is an estimate of the expenses you paid on your account during the period. | |
If the value of your account falls below the minimum initial investment requirement applicable to you, your account generally will be subject to a $20 annual fee. This fee is not included in the accompanying table. If you are subject to the fee, keep it in mind when you are estimating the ongoing expenses of investing in the fund and when comparing the expenses of this fund with other funds.
| | | | | | | | | | | | | | |
| 10/01/09 – 03/31/10 | | | | | | | | |
| | | | |
| | | Account value at the
beginning of the period ($) | | Account value at the end
of the period ($) | | Expenses paid
during the period ($) | | Fund’s annualized
expense ratio (%) |
| | | Actual | | Hypothetical | | Actual | | Hypothetical | | Actual | | Hypothetical | | Actual |
Class A | | 1,000.00 | | 1,000.00 | | 1,103.00 | | 1,018.45 | | 6.82 | | 6.54 | | 1.30 |
Class C | | 1,000.00 | | 1,000.00 | | 1,101.40 | | 1,014.70 | | 10.75 | | 10.30 | | 2.05 |
Class R | | 1,000.00 | | 1,000.00 | | 1,102.10 | | 1,017.20 | | 8.12 | | 7.80 | | 1.55 |
Class Z | | 1,000.00 | | 1,000.00 | | 1,105.80 | | 1,019.70 | | 5.51 | | 5.29 | | 1.05 |
Expenses paid during the period are equal to the annualized expense ratio for the share class, multiplied by the average account value over the period, then multiplied by the number of days in the fund’s most recent fiscal half-year and divided by 365.
Had the investment advisor and/or any of its affiliates not waived fees or reimbursed a portion of expenses, account value at the end of the period would have been reduced.
It is important to note that the expense amounts shown in the table are meant to highlight only ongoing costs of investing in the fund and do not reflect any transaction costs, such as sales charges, redemption fees or exchange fees. Therefore, the hypothetical examples provided may not help you determine the relative total costs of owning shares of different funds. If these transaction costs were included, your costs would have been higher.
15
Portfolio Managers’ Report – Columbia Mid Cap Core Fund
Performance data quoted represents past performance and current performance may be lower or higher. Past performance is no guarantee of future results. The investment return and principal value will fluctuate so that shares, when redeemed, may be worth more or less than the original cost. Please visit www.columbiafunds.com for daily and most recent month-end performance updates.
| | |
| Net asset value per share |
| |
as of 03/31/10 ($) | | |
Class A | | 14.84 |
Class C | | 14.77 |
Class R | | 14.65 |
Class Z | | 14.88 |
| | |
| Distributions declared per share |
| |
04/01/09 – 03/31/10 ($) | | |
Class A | | 0.07 |
Class C | | 0.02 |
Class R | | 0.05 |
Class Z | | 0.09 |
For the 12-month period that ended March 31, 2010, the fund’s Class A shares returned 56.43% without sales charge. The fund’s benchmarks, the Russell Midcap Index and the Russell Midcap Value Index, returned 67.71% and 72.41%, respectively, for the same period. The average return of the Lipper Mid-Cap Core Funds Classification was 62.22% for the 12-month period. While a market rally helped drive double-digit returns for the fund, an emphasis on larger companies with strong balance sheets and positive free cash flow prospects held the fund back during a period in which investors favored lower-quality, smaller names. As a result, the fund underperformed its benchmarks in most sectors, with the exception of health care and telecommunications. Stock selection in those sectors contributed positively to the fund’s relative and absolute performance.
Health care and telecommunications holdings boosted returns
As the debate on national health care put pressure on insurance companies, we built a position in managed care company CIGNA (0.4% of net assets). The company’s share price did not, in our opinion, reflect its substantial future cash flow prospects, and we were rewarded when the price edged upwards. We also emphasized generic drug makers, including Mylan and AmerisourceBergen (each 1.0% of net assets), which we believe can benefit as the use of generic drugs increases and more Americans receive health care coverage. This strategy was rewarded during the period, and we sold a position in Express Scripts into strength.
We also sought companies with exposure to emerging markets, which we believed would offer better growth prospects than the U.S. economy in the short run. Millicom International Cellular and NII Holdings (0.7% and 0.9% of net assets, respectively) benefited from increased cell phone use in the African and South American markets. Holdings in the financials, industrials and consumer discretionary sectors were also among top contributors to absolute returns. Standouts included Fifth Third, which gained on a successful capital raise; mining equipment maker Joy Global, which benefited as commodity prices rose and cosmetics company Estee Lauder, which saw its share price increase as new management improved sales margins and growth (1.3%, 0.8%, and 0.7% of net assets, respectively).
Disappointments in industrials and consumer discretionary sectors
In a market that seemed to assume the economy had already turned the corner, many companies that performed well in 2008 did not retain their momentum through 2009. Because we continued to emphasize companies with financial strength and defensive characteristics, this positioning detracted from performance during the period’s cyclical rally. As a result, the fund’s holdings in the financials, industrials and consumer discretionary sectors failed to keep pace with those of the benchmarks, which included more speculative names. While holdings with absolute negative results were few, department store JC Penney reported disappointing same-store sales and shares of Burger King declined when a planned turnaround never materialized. We sold both positions. Shares of education firm Apollo Group (0.5% of net assets) also declined amidst concerns regarding an SEC inquiry into the company’s revenue recognition practices.
16
Portfolio Managers’ Report (continued) – Columbia Mid Cap Core Fund
Positioned for an economic recovery
The U.S. economy is showing signs of improvement that support a continued market rally. By drawing on three independent research sources — fundamental research, quantitative models and the input of our portfolio management team — and by employing a disciplined valuation process, we continue to seek mid-cap companies that are positioned to capitalize as the economic recovery continues. Owning mid-cap names may prove particularly beneficial in a period of economic recovery, as has historically been the case. We remain focused on high-quality companies with strong balance sheets that we believe are well positioned relative to their respective industries.
Portfolio characteristics and holdings are subject to change periodically and may not be representative of current characteristics and holdings. The outlook for the fund may differ from that presented for other Columbia Funds.
Equity securities are subject to stock market fluctuations that occur in response to economic and business developments.
Stocks of mid-cap companies pose special risks, including possible illiquidity and greater price volatility than stocks of larger, more established companies.
Value stocks are securities of companies that may have experienced adverse business or industry developments or may be subject to special risks that have caused the stocks to be out of favor. If the manager’s assessment of a company’s prospects is wrong, the price of its stock may not approach the value the manager has placed on it.
| | |
| Top sectors |
| |
as of 03/31/10 (%) | | |
Financials | | 20.3 |
Consumer Discretionary | | 15.8 |
Information Technology | | 15.1 |
Industrials | | 13.5 |
Health Care | | 8.4 |
| | |
| Top 10 holdings |
| |
as of 03/31/10 (%) | | |
Ameriprise Financial | | 1.5 |
Avon | | 1.4 |
Parker Hannifin | | 1.4 |
Dover | | 1.4 |
Raymond James Financial | | 1.4 |
Fifth Third Bancorp | | 1.3 |
T. Rowe Price Group | | 1.3 |
Discover Financial Services | | 1.3 |
Ross Stores | | 1.2 |
Teradata | | 1.2 |
The fund is actively managed and the composition of its portfolio will change over time. Information provided is calculated as a percentage of net assets.
17
Fund Profile – Columbia Select Large Cap Growth Fund
Performance data quoted represents past performance and current performance may be lower or higher. Past performance is no guarantee of future results. The investment return and principal value will fluctuate so that shares, when redeemed, may be worth more or less than the original cost. Please visit www.columbiafunds.com for daily and most recent month-end performance updates.
Summary
1-year return as of 03/31/10
| | |
| |
| | +50.14% Class A shares
(without sales charge) |
| |
| | +49.75% Russell 1000 Growth Index |
|
Morningstar Style BoxTM |
|
Equity Style |
|
The Morningstar Style BoxTM reveals a fund’s investment strategy. For equity funds, the vertical axis shows the market capitalization of the stocks owned, and the horizontal axis shows investment style (value, blend or growth). Information shown is based on the most recent data provided by Morningstar.
Summary
| n | | For the 12-month period that ended March 31, 2010, the fund’s Class A shares returned 50.14% without sales charge. |
| n | | The fund outperformed both its benchmark, the Russell 1000 Growth Index1, and the average return of its peer group, the Lipper Large-Cap Growth Funds Classification2. The Russell 1000 Growth Index returned 49.75% while the average return of the Lipper Large-Cap Growth Funds Classification was 46.16%. |
| n | | We attribute the fund’s outperformance to positive stock selection in the energy, health care and information technology sectors. Sector allocation in consumer staples and financials also benefited relative results. |
Portfolio Management
Thomas M. Galvin, lead manager, has managed or co-managed the fund since March 2008 and the predecessor Fund since February 2003. He has been associated with the advisor or its predecessors since 2003.
Richard A. Carter has co-managed the fund since March 2009 and has been associated with the advisor or its predecessors since 2003.
Todd D. Herget has co-managed the fund since March 2009 and has been associated with the advisor or its predecessors since 1998.
Effective May 1, 2010, RiverSource Investments, LLC, a subsidiary of Ameriprise Financial, Inc., became the investment advisor to the fund and changed its name to Columbia Management Investment Advisers, LLC. Please see the fund’s prospectus, as supplemented, for more information regarding the change in investment advisor and certain other changes.
| 1 | The Russell 1000 Growth Index measures the performance of those Russell 1000 Index companies with higher price-to-book ratios and higher forecasted growth values. Indices are not available for investment, are not professionally managed and do not reflect sales charges, fees, brokerage commissions, taxes or other expenses of investing. Securities in the fund may not match those in an index. |
| 2 | Lipper Inc., a widely respected data provider in the industry, calculates an average total return (assuming reinvestment of distributions) for mutual funds with investment objectives similar to those of the fund. Lipper makes no adjustment for the effect of sales loads. |
18
Performance Information – Columbia Select Large Cap Growth Fund
| | |
| Performance of a $10,000 investment 04/01/00 – 03/31/10 |
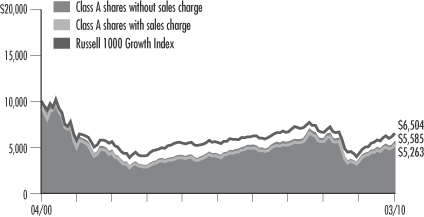
The chart above shows the change in value of a hypothetical $10,000 investment in Class A shares of Columbia Select Large Cap Growth Fund during the stated time period, and does not reflect the deduction of taxes that a shareholder may pay on fund distributions or on the redemption of fund shares.
| | | | |
| Performance of a $10,000 investment 04/01/00 – 03/31/10 ($) |
| | |
| Sales charge | | without | | with |
Class A | | 5,585 | | 5,263 |
Class C | | 5,479 | | 5,479 |
Class R | | 5,453 | | n/a |
Class Z | | 5,611 | | n/a |
| | | | | | | | | | | | |
| Average annual total return as of 03/31/10 (%) |
| | | | |
| Share class | | A | | C | | R | | Z |
| Inception | | 09/28/07 | | 09/28/07 | | 12/31/04 | | 10/01/97 |
| Sales charge | | without | | with | | without | | with | | without | | without |
1-year | | 50.14 | | 41.52 | | 49.00 | | 48.00 | | 49.78 | | 50.42 |
5-year | | 5.68 | | 4.44 | | 5.28 | | 5.28 | | 5.23 | | 5.78 |
10-year | | –5.66 | | –6.22 | | –5.84 | | –5.84 | | –5.88 | | –5.61 |
Performance data quoted represents past performance and current performance may be lower or higher. Past performance is no guarantee of future results. The investment return and principal value will fluctuate so that shares, when redeemed, may be worth more or less than the original cost. Please visit www.columbiafunds.com for daily and most recent month-end performance updates.
| | |
| Annual operating expense ratio (%)* |
| |
Class A | | 1.25 |
Class C | | 2.00 |
Class R | | 1.50 |
Class Z | | 1.00 |
| * | The annual operating expense ratio is as stated in the fund’s prospectus that is current as of the date of this report. Differences in expense ratios disclosed elsewhere in this report may result from the inclusion of fee waivers and expense reimbursements as well as the use of different time periods used in calculating the ratios. |
The “with sales charge” returns include the maximum initial sales charge of 5.75% for Class A shares and the applicable contingent deferred sales charge of 1.00% for Class C shares for the first year only. The “without sales charge” returns do not include the effect of sales charges. If they had, returns would be lower.
The Fund commenced operations on March 31, 2008. The returns of Class A and Class C shares shown for periods prior to March 31, 2008 include the returns of Class A shares or Class C shares, as applicable, of Large Cap Growth Fund, the predecessor to the Fund and a series of Excelsior Funds, Inc. (the “Predecessor Fund”), for periods after September 27, 2007, and also include the returns of Shares class shares of the Predecessor Fund for periods prior to September 28, 2007. The returns shown reflect applicable sales charges, but have not been adjusted to reflect differences in expenses. If differences in expenses had been reflected, the returns shown for the periods prior to September 28, 2007 would have been lower. The returns of the Class R shares shown for periods prior to March 31, 2008 include the returns of Retirement Shares class shares of the Predecessor Fund for periods after December 30, 2004, and include the returns of Shares class shares of the Predecessor Fund for periods prior to December 31, 2004. The returns shown reflect that Class R shares are sold without sales charges, but have not been adjusted to reflect differences in expenses. If differences in expenses had been reflected, the returns shown for periods prior to March 31, 2008 would have been lower. The returns of the Class Z shares shown for periods prior to March 31, 2008 are those of the Shares class shares of the Predecessor Fund. The returns of Class Z shares shown have not been adjusted to reflect differences in expenses.
Inception date refers to the date on which the Predecessor Fund class commenced operations.
Performance results reflect any fee waivers or reimbursements of fund expenses by the investment advisor and/or any of its affiliates. Absent these fee waivers or expense reimbursement arrangements, performance results would have been lower.
All results shown assume reinvestment of distributions. Class R shares are sold at net asset value with distribution and service (Rule 12b-1) fees. Class Z shares are sold at net asset value with no distribution and service (Rule 12b-1) fees. Class R and Class Z shares have limited eligibility and the investment minimum requirements may vary. Please see the fund’s prospectus for details. Performance for different share classes will vary based on differences in sales charges and fees associated with each class.
The tables do not reflect the deduction of taxes that a shareholder may pay on fund distributions or on the redemption of fund shares.
19
Understanding Your Expenses – Columbia Select Large Cap Growth Fund
Estimating your actual expenses
To estimate the expenses that you paid over the period, first you will need your account balance at the end of the period:
| | n | | For shareholders who receive their account statements from Columbia Management Services, Inc., your account balance is available online at www.columbiafunds.com or by calling Shareholder Services at 800.345.6611. | |
| | n | | For shareholders who receive their account statements from their financial intermediary, contact your financial intermediary to obtain your account balance. | |
| | 1. | Divide your ending account balance by $1,000. For example, if an account balance was $8,600 at the end of the period, the result would be 8.6. | |
| | 2. | In the section of the table below titled “Expenses paid during the period,” locate the amount for your share class. You will find this number in the column labeled “Actual.” Multiply this number by the result from step 1. Your answer is an estimate of the expenses you paid on your account during the period. | |
If the value of your account falls below the minimum initial investment requirement applicable to you, your account generally will be subject to a $20 annual fee. This fee is not included in the accompanying table. If you are subject to the fee, keep it in mind when you are estimating the ongoing expenses of investing in the fund and when comparing the expenses of this fund with other funds.
As a fund shareholder, you incur two types of costs. There are transaction costs, which generally include sales charges on purchases and may include redemption fees or exchange fees. There are also ongoing costs, which generally include investment advisory fees, distribution and service (Rule 12b-1) fees and other fund expenses. The information on this page is intended to help you understand the ongoing costs of investing in the fund and to compare these costs with the ongoing costs of investing in other mutual funds.
Analyzing your fund’s expenses by share class
To illustrate these ongoing costs, we have provided an example and calculated the expenses paid by investors in each share class during the period. The information in the following table is based on an initial investment of $1,000, which is invested at the beginning of the period and held for the entire period. Expense information is calculated two ways and each method provides you with different information. The amount listed in the “Actual” column is calculated using the fund’s actual operating expenses and total return for the period. The amount listed in the “Hypothetical” column for each share class assumes that the return each year is 5% before expenses and is calculated based on the fund’s actual operating expenses. You should not use the hypothetical account values and expenses to estimate either your actual account balance at the end of the period or the expenses you paid during this period.
Compare with other funds
Since all mutual funds are required to include the same hypothetical calculations about expenses in shareholder reports, you can use this information to compare the ongoing cost of investing in the fund with other funds. To do so, compare the 5% hypothetical example with the 5% hypothetical examples that appear in the shareholder reports of other funds. As you compare hypothetical examples of other funds, it is important to note that hypothetical examples are meant to highlight the ongoing costs of investing in a fund and do not reflect any transaction costs, such as sales charges, redemption fees or exchange fees.
| | | | | | | | | | | | | | |
| 10/01/09 – 03/31/10 | | | | | | |
| | | | |
| | | Account value at the
beginning of the period ($) | | Account value at the
end of the period ($) | | Expenses paid
during the period ($) | | Fund’s annualized
expense ratio (%) |
| | | Actual | | Hypothetical | | Actual | | Hypothetical | | Actual | | Hypothetical | | Actual |
Class A | | 1,000.00 | | 1,000.00 | | 1,119.30 | | 1,018.70 | | 6.60 | | 6.29 | | 1.25 |
Class C | | 1,000.00 | | 1,000.00 | | 1,114.70 | | 1,014.96 | | 10.54 | | 10.05 | | 2.00 |
Class R | | 1,000.00 | | 1,000.00 | | 1,117.70 | | 1,017.45 | | 7.92 | | 7.54 | | 1.50 |
Class Z | | 1,000.00 | | 1,000.00 | | 1,119.90 | | 1,019.95 | | 5.29 | | 5.04 | | 1.00 |
Expenses paid during the period are equal to the annualized expense ratio for the share class, multiplied by the average account value over the period, then multiplied by the number of days in the fund’s most recent fiscal half-year and divided by 365.
It is important to note that the expense amounts shown in the table are meant to highlight only ongoing costs of investing in the fund and do not reflect any transaction costs, such as sales charges, redemption fees or exchange fees. Therefore, the hypothetical examples provided may not help you determine the relative total costs of owning shares of different funds. If these transaction costs were included, your costs would have been higher.
20
Portfolio Managers’ Report – Columbia Select Large Cap Growth Fund
For the 12-month period that ended March 31, 2010, the fund’s Class A shares returned 50.14% without sales charge. The returns were higher than both the benchmark, the Russell 1000 Growth Index, and the average return of the funds in its peer group, the Lipper Large-Cap Growth Funds Classification, which returned 49.75% and 46.16%, respectively. Positive stock selection in the energy, health care and information technology sectors and sector allocation in consumer staples and financials generally accounted for the fund’s strong results relative to these comparative measures. The fund continued to emphasize high-quality companies, whose sound business prospects can help deliver attractive returns longer-term.
Stock selection, sector allocation aided results
Positive stock selection in the energy, health care and information technology sectors benefited the fund’s returns during the 12-month period. In the energy sector, FMC Technologies (2.7% of net assets) rose on greater demand for its subsea production and processing systems, as oil companies increased their deep-water drilling and exploration activity. In the health care sector, robotic surgical devices company Intuitive Surgical benefited from strong sales, while shares of eye care company Alcon rose after announcing it would be acquired by a large European pharmaceutical manufacturer. We sold both positions by the end of the period. “Smart phone” manufacturers Apple and Research in Motion (4.5% and 3.5% of net assets, respectively) drove returns in the information technology sector, as did Akamai Technologies (2.9% of net assets), a company that helps accelerate and improve the delivery of online content and applications.
Sector weights also played a key role in the fund’s returns. The fund had less exposure than the index to the weaker-performing consumer staples sector and more exposure than the index to the stronger-performing financials sector, both of which aided relative performance.
Disappointments in consumer discretionary and industrials sectors
Stock selection in the consumer discretionary and industrials sectors limited returns. In the consumer discretionary sector, Apollo Group (3.4% of net assets) and Gamestop were disappointments. Investors became concerned that large retail companies would enter Gamestop’s highly profitable business of selling used video games. We sold the stock before period end. Apollo, a leading provider of educational programs for working adults, also underperformed. Although the company’s enrollment grew in the face of a weak economy, investors lacked confidence that it would continue as the economy rebounded. In the industrials sector, First Solar was a drag on performance. First Solar, which manufactures solar modules, encountered heightened competition as a key building cost declined, and average selling prices dropped industry-wide. We sold the stock.
Looking Ahead
Leading indicators suggest that a synchronized recovery in global economic growth is in the cards for 2010. A modestly improving job picture is good news
Performance data quoted represents past performance and current performance may be lower or higher. Past performance is no guarantee of future results. The investment return and principal value will fluctuate so that shares, when redeemed, may be worth more or less than the original cost. Please visit www.columbiafunds.com for daily and most recent month-end performance updates.
| | |
| Net asset value per share |
| |
as of 03/31/10 ($) | | |
Class A | | 10.60 |
Class C | | 10.40 |
Class R | | 10.35 |
Class Z | | 10.65 |
21
Portfolio Managers’ Report (continued) – Columbia Select Large Cap Growth Fund
| | |
| Top Sectors |
| |
as of 03/31/10 (%) | | |
Information Technology | | 29.8 |
Health Care | | 28.3 |
Consumer Discretionary | | 16.6 |
Financials | | 7.5 |
Consumer Staples | | 3.7 |
| |
| | |
| Top 10 Holdings |
| |
as of 03/31/10 (%) | | |
Apple | | 4.5 |
Amazon | | 4.4 |
MasterCard | | 4.2 |
QUALCOMM | | 4.2 |
Google | | 4.1 |
EMC | | 4.1 |
T. Rowe Price Group | | 4.0 |
St. Jude Medical | | 3.8 |
Allergan | | 3.8 |
Gilead Sciences | | 3.7 |
The fund is actively managed and the composition of its portfolio will change over time. Information provided is calculated as a percentage of net assets.
for consumer spending. The leverage from aggressive cost-cutting and from any improvement in revenues should lead to a pick-up in capital spending. Plus, a weak dollar, coupled with robust economic growth in developing economies, suggest that the export environment could be positive. We believe that much of this recovery has already been priced into the equity markets — and there are risks to this outlook: the potential for higher interest rates and the end of stimulus spending in 12 to 24 months. Going forward, we believe that earnings will drive stock market returns, stock selection will be the key to investment gains and high-quality companies that can deliver on earnings beyond the current cyclical recovery will be attractive to investors. We are focused on identifying just such companies to position the fund for the current environment and the period ahead.
Portfolio characteristics and holdings are subject to change periodically and may not be representative of current holdings and characteristics. The outlook for the fund may differ from that presented for other Columbia Funds.
Equity securities are subject to stock market fluctuations that occur in response to economic and business developments.
Investing in growth stocks incurs the possibility of losses because their prices are sensitive to changes in current or expected earnings.
22
Fund Profile – Columbia Select Opportunities Fund
Summary
| n | | For the 12-month period that ended March 31, 2010, the fund’s Class A shares returned 56.09% without sales charge. |
| n | | The fund outperformed its benchmarks, the S&P 500 Index and the Russell 1000 Index.1 It also outperformed its peer group average, the Lipper Multi-Cap Core Funds Classification.2 |
| n | | Both stock selection and sector weights contributed to the fund’s strong relative performance for the period. |
Portfolio Management
Emil A. Gjester, lead manager, has co-managed the fund since February 2009 and has been associated with the advisor or its predecessors since 1996.
Jonas Patrikson has co-managed the fund since February 2009 and has been associated with the advisor or its predecessors since 2004.
Michael T. Welter has co-managed the fund since February 2009 and has been associated with the advisor or its predecessors since 2006.
Mary-Ann Ward has co-managed the fund since February 2009 and has been associated with the advisor or its predecessors since 1997.
Effective May 1, 2010, RiverSource Investments, LLC, a subsidiary of Ameriprise Financial, Inc., became the investment advisor to the fund and changed its name to Columbia Management Investment Advisers, LLC. Please see the fund’s prospectus, as supplemented, for more information regarding the change in investment advisor and certain other changes.
| 1 | The Standard & Poor’s (S&P) 500 Index tracks the performance of 500 widely held, large-capitalization U.S. stocks. The Russell 1000 Index measures the performance of 1,000 of the largest U.S. companies, based on market capitalization. Indices are not available for investment, are not professionally managed and do not reflect sales charges, fees, brokerage commissions, taxes or other expenses of investing. Securities in the fund may not match those in an index. |
| 2 | Lipper Inc., a widely respected data provider in the industry, calculates an average total return (assuming reinvestment of distributions) for mutual funds with investment objectives similar to those of the fund. Lipper makes no adjustment for the effect of sales loads. |
Performance data quoted represents past performance and current performance may be lower or higher. Past performance is no guarantee of future results. The investment return and principal value will fluctuate so that shares, when redeemed, may be worth more or less than the original cost. Please visit www.columbiafunds.com for daily and most recent month-end performance updates.
Summary
1-year return as of 03/31/10
| | |
| |
| | +56.09% Class A shares (without sales charge) |
| |
| | +49.77% S&P 500 Index |
| |
| | +51.60% Russell 1000 Index |
|
Morningstar Style BoxTM |
|
Equity Style |
|
The Morningstar Style BoxTM reveals a fund’s investment strategy. For equity funds, the vertical axis shows the market capitalization of the stocks owned, and the horizontal axis shows investment style (value, blend or growth). Information shown is based on the most recent data provided by Morningstar. |
23
Performance Information – Columbia Select Opportunities Fund
Performance data quoted represents past performance and current performance may be lower or higher. Past performance is no guarantee of future results. The investment return and principal value will fluctuate so that shares, when redeemed, may be worth more or less than the original cost. Please visit www.columbiafunds.com for daily and most recent month-end performance updates.
| | |
| Annual operating expense ratio (%)* |
| |
Class A | | 1.29 |
Class C | | 2.04 |
Class Z | | 1.04 |
| * | The annual operating expense ratio is as stated in the fund’s prospectus that is current as of the date of this report. Differences in expense ratios disclosed elsewhere in this report may result from the inclusion of fee waivers and expense reimbursements as well as the use of different time periods used in calculating the ratios. |
| | |
| Performance of a $10,000 investment 03/31/04 – 03/31/10 |
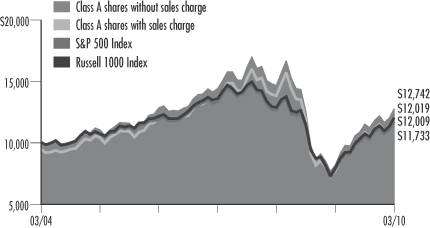
The chart above shows the change in value of a hypothetical $10,000 investment in Class A shares of Columbia Select Opportunities Fund during the stated time period, and does not reflect the deduction of taxes that a shareholder may pay on fund distributions or on the redemption of fund shares.
| | | | |
| Performance of a $10,000 investment 03/31/04 – 03/31/10 ($) |
| | |
| Sales charge | | without | | with |
Class A | | 12,742 | | 12,009 |
Class C | | 12,478 | | 12,478 |
Class Z | | 12,798 | | n/a |
| | | | | | | | | | |
| Average annual total return as of 03/31/10 (%) |
| | | |
| Share class | | A | | C | | Z |
| Inception | | 09/28/07 | | 09/28/07 | | 03/31/04 |
| Sales charge | | without | | with | | without | | with | | without |
1-year | | 56.09 | | 47.20 | | 54.78 | | 53.78 | | 56.37 |
5-year | | 2.93 | | 1.72 | | 2.50 | | 2.50 | | 3.02 |
Life | | 4.12 | | 3.10 | | 3.76 | | 3.76 | | 4.20 |
The “with sales charge” returns include the maximum initial sales charge of 5.75% for Class A shares and the applicable contingent deferred sales charge of 1.00% for Class C shares for the first year only. The “without sales charge” returns do not include the effect of sales charges. If they had, returns would be lower.
The Fund commenced operations on March 31, 2008. The returns of the Class A and Class C shares shown for periods prior to March 31, 2008 include the returns of Class A shares or Class C shares, as applicable, of Equity Opportunities Fund, the predecessor to the Fund and a series of Excelsior Funds, Inc. (the “Predecessor Fund”), for periods after September 27, 2007, and include the returns of Shares class shares of the Predecessor Fund for periods prior to September 28, 2007. The returns shown reflect applicable sales charges, but have not been adjusted to reflect differences in expenses. If differences in expenses were reflected, the returns shown for the periods prior to September 28, 2007 would be lower. The returns of the Class Z shares shown for periods prior to March 31, 2008 are those of the Shares class shares of the Predecessor Fund. The returns of Class Z shares shown have not been adjusted to reflect differences in expenses.
Inception date refers to the date on which the Predecessor Fund class commenced operations.
Performance results reflect any fee waivers or reimbursements of fund expenses by the investment advisor and/or any of its affiliates. Absent these fee waivers or expense reimbursement arrangements, performance results would have been lower.
All results shown assume reinvestment of distributions. Class Z shares are sold at net asset value with no distribution and service (Rule 12b-1) fees. Class Z shares have limited eligibility and the investment minimum requirements may vary. Please see the fund’s prospectus for details. Performance for different share classes will vary based on differences in sales charges and fees associated with each class.
The tables do not reflect the deduction of taxes that a shareholder may pay on fund distributions or on the redemption of fund shares.
24
Understanding Your Expenses – Columbia Select Opportunities Fund
As a fund shareholder, you incur two types of costs. There are transaction costs, which generally include sales charges on purchases and may include redemption fees or exchange fees. There are also ongoing costs, which generally include investment advisory fees, distribution and service (Rule 12b-1) fees and other fund expenses. The information on this page is intended to help you understand the ongoing costs of investing in the fund and to compare these costs with the ongoing costs of investing in other mutual funds.
Analyzing your fund’s expenses by share class
To illustrate these ongoing costs, we have provided an example and calculated the expenses paid by investors in each share class during the period. The information in the following table is based on an initial investment of $1,000, which is invested at the beginning of the period and held for the entire period. Expense information is calculated two ways and each method provides you with different information. The amount listed in the “Actual” column is calculated using the fund’s actual operating expenses and total return for the period. The amount listed in the “Hypothetical” column for each share class assumes that the return each year is 5% before expenses and is calculated based on the fund’s actual operating expenses. You should not use the hypothetical account values and expenses to estimate either your actual account balance at the end of the period or the expenses you paid during this period.
Compare with other funds
Since all mutual funds are required to include the same hypothetical calculations about expenses in shareholder reports, you can use this information to compare the ongoing cost of investing in the fund with other funds. To do so, compare the 5% hypothetical example with the 5% hypothetical examples that appear in the shareholder reports of other funds. As you compare hypothetical examples of other funds, it is important to note that hypothetical examples are meant to highlight the ongoing costs of investing in a fund and do not reflect any transaction costs, such as sales charges, redemption fees or exchange fees.
Estimating your actual expenses
To estimate the expenses that you paid over the period, first you will need your account balance at the end of the period:
| | n | | For shareholders who receive their account statements from Columbia Management Services, Inc., your account balance is available online at www.columbiafunds.com or by calling Shareholder Services at 800.345.6611. | |
| | n | | For shareholders who receive their account statements from their financial intermediary, contact your financial intermediary to obtain your account balance. | |
| | 1. | Divide your ending account balance by $1,000. For example, if an account balance was $8,600 at the end of the period, the result would be 8.6. | |
| | 2. | In the section of the table below titled “Expenses paid during the period,” locate the amount for your share class, You will find this number in the column labeled “Actual”. Multiply this number by the result from step 1. Your answer is an estimate of the expenses you paid on your account during the period. | |
If the value of your account falls below the minimum initial investment requirement applicable to you, your account generally will be subject to a $20 annual fee. This fee is not included in the accompanying table. If you are subject to the fee, keep it in mind when you are estimating the ongoing expenses of investing in the fund and when comparing the expenses of this fund with other funds.
| | | | | | | | | | | | | | |
| 10/01/09 – 03/31/10 | | |
| | | | |
| | | Account value at the
beginning of the period ($) | | Account value at the
end of the period ($) | | Expenses paid
during the period ($) | | Fund’s annualized
expense ratio (%) |
| | | Actual | | Hypothetical | | Actual | | Hypothetical | | Actual | | Hypothetical | | Actual |
Class A | | 1,000.00 | | 1,000.00 | | 1,110.60 | | 1,018.75 | | 6.52 | | 6.24 | | 1.24 |
Class C | | 1,000.00 | | 1,000.00 | | 1,105.60 | | 1,015.01 | | 10.45 | | 10.00 | | 1.99 |
Class Z | | 1,000.00 | | 1,000.00 | | 1,112.40 | | 1,020.00 | | 5.21 | | 4.99 | | 0.99 |
Expenses paid during the period are equal to the annualized expense ratio for the share class, multiplied by the average account value over the period, then multiplied by the number of days in the fund’s most recent fiscal half-year and divided by 365.
Had the investment advisor and/or any of its affiliates not waived fees or reimbursed a portion of expenses, account value at the end of the period would have been reduced.
It is important to note that the expense amounts shown in the table are meant to highlight only ongoing costs of investing in the fund and do not reflect any transaction costs, such as sales charges, redemption fees or exchange fees. Therefore, the hypothetical examples provided may not help you determine the relative total costs of owning shares of different funds. If these transaction costs were included, your costs would have been higher.
25
Portfolio Managers’ Report – Columbia Select Opportunities Fund
Performance data quoted represents past performance and current performance may be lower or higher. Past performance is no guarantee of future results. The investment return and principal value will fluctuate so that shares, when redeemed, may be worth more or less than the original cost. Please visit www.columbiafunds.com for daily and most recent month-end performance updates.
| | |
| Net asset value per share |
| |
as of 03/31/10 ($) | | |
Class A | | 11.86 |
Class C | | 11.73 |
Class Z | | 11.86 |
| | | |
| Distributions declared per share | |
| |
04/01/09 – 03/31/10 ($) | | | |
Class A | | 0.03 | |
Class C | | 0.00 | * |
Class Z | | 0.05 | |
| * | Rounds to less than 0.01. |
For the 12-month period that ended March 31, 2010, the fund’s Class A shares returned 56.09% without sales charge. The fund’s return was higher than the return of its benchmarks, the S&P 500 Index and the Russell 1000 Index, which returned 49.77% and 51.60%, respectively, for the same period. The fund outperformed the 52.56% average return of its peer group, the Lipper Multi-Cap Core Funds Classification, for the 12-month period. Both stock selection and sector weights contributed to the fund’s strong relative performance.
Strong performance from energy, consumer staples and utilities
During the period, the fund’s relative performance was led by the energy sector. Among the energy names that benefited the fund were Cimarex Energy, Petroleo Brasileiro and Apache (0.9%, 0.4% and 0.7% of net assets respectively). An underweight in consumer staples and utilities and stock selection in both sectors also aided relative performance. In consumer staples, Hypermarcas, Avon Products (0.7% and 0.8% of net assets, respectively) and Herbalife contributed solid gains. Herbalife was sold before the end of the period. Among the names that benefited the fund in utilities were AES and PT Perusahaan Gas Negara (0.5% and 0.8% of net assets, respectively). Other strong contributors for the period were Jo-Ann Stores, in the consumer discretionary sector; Wells Fargo, in the financials sector; Thompson Creek Metals, in the materials sector (1.2%, 2.3% and 0.5% of net assets, respectively) and Brocade Communications Systems, in the technology sector. We sold Brocade during the period. An overweight in materials and an underweight in telecommunication services further aided the fund’s results for the period. The fund also benefited from an overweight in financials throughout most of the period.
Disappointments in industrials, financials and health care
During the period, the fund experienced poor relative performance from several sectors, including industrials, financials and health care. In the industrials sector, Genco Shipping & Trading, Huron Consulting Group (0.4% and 0.3% of net assets, respectively) and Emerson Electric (sold) weighed on performance. Although the fund was helped by an overweight in financials, stock selection in the sector detracted from the fund’s relative returns. Among financials, Redwood Trust and Glacier Bancorp were disappointments. Both were sold. Health care stocks also hampered fund results, including Becton Dickinson and Illumina. We sold both stocks during the period.
Looking ahead
We believe that the U.S. economy has stabilized and that a recovery will continue to unfold through the course of 2010. We are mindful, however, that headwinds in the United States, such as a deleveraging consumer, joblessness and a still-fragile property market may cause growth to be muted when compared to past recoveries. Nonetheless, we feel that opportunities remain. We are maintaining our long-held belief in the growth potential of emerging markets.
26
Portfolio Managers’ Report (continued) – Columbia Select Opportunities Fund
Portfolio characteristics and holdings are subject to change periodically and may not be representative of current characteristics and holdings. The outlook for the fund may differ from that presented for other Columbia Funds.
Equity securities are subject to stock market fluctuations that occur in response to economic and business developments.
International investing involves special risks, including foreign taxation, currency risks, risks associated with possible differences in financial standards and other risks associated with future political and economic developments.
Investing in emerging markets may involve greater risks than investing in more developed countries. In addition, concentration of investments in a single region may result in greater volatility.
| | |
| Top Sectors |
| |
as of 03/31/10 (%) | | |
Information Technology | | 19.0 |
Financials | | 15.2 |
Energy | | 13.5 |
Health Care | | 11.3 |
Industrials | | 10.8 |
| | |
| Top 10 Holdings |
as of 03/31/10 (%) | | |
Microsoft | | 2.3 |
Wells Fargo | | 2.3 |
JPMorgan Chase | | 2.0 |
Hewlett-Packard | | 1.8 |
International Business Machines | | 1.8 |
Apple | | 1.7 |
Exxon Mobil | | 1.5 |
Wal-Mart Stores | | 1.5 |
PepsiCo | | 1.4 |
Google | | 1.3 |
The fund is actively managed and the composition of its portfolio will change over time. Information provided is calculated as a percentage of net assets.
27
Fund Profile – Columbia Select Small Cap Fund
Performance data quoted represents past performance and current performance may be lower or higher. Past performance is no guarantee of future results. The investment return and principal value will fluctuate so that shares, when redeemed, may be worth more or less than the original cost. Please visit www.columbiafunds.com for daily and most recent month-end performance updates.
Summary
1-year return as of 03/31/10
| | |
| |
| | +62.33% Class A shares
(without sales charge) |
| |
| | +62.76% Russell 2000 Index |
|
Morningstar Style BoxTM |
|
Equity Style |
|
The Morningstar Style BoxTM reveals a fund’s investment strategy. For equity funds, the vertical axis shows the market capitalization of the stocks owned, and the horizontal axis shows investment style (value, blend or growth). Information shown is based on the most recent data provided by Morningstar. |
Summary
| n | | For the 12-month period that ended March 31, 2010, the fund’s Class A shares returned 62.33% without sales charge. |
| n | | The fund performed roughly in line with its benchmark, the Russell 2000 Index1, as well as with the average return of its peer group, the Lipper Small-Cap Core Funds Classification.2 |
| n | | Stock selection in consumer discretionary, industrials and information technology added to performance relative to the benchmark; however, underweights relative to the index in financials and health care tempered those results. |
Portfolio Management
Douglas H. Pyle has managed the fund since 2008 and has been associated with the advisor or its predecessors since 1999.
Effective May 1, 2010, RiverSource Investments, LLC, a subsidiary of Ameriprise Financial, Inc., became the investment advisor to the fund and changed its name to Columbia Management Investment Advisers, LLC. Please see the fund’s prospectus, as supplemented, for more information regarding the change in investment advisor and certain other changes.
| 1 | The Russell 2000 Index measures the performance of the 2,000 smallest companies in the Russell 3000 Index, which represents approximately 8% of the total market capitalization of the Russell 3000 Index. Indices are not available for investment, are not professionally managed and do not reflect sales charges, fees, brokerage commissions, taxes or other expenses of investing. Securities in the fund may not match those in an index. |
| 2 | Lipper Inc., a widely respected data provider in the industry, calculates an average total return (assuming reinvestment of distributions) for mutual funds with investment objectives similar to those of the fund. Lipper makes no adjustment for the effect of sales loads. |
28
Performance Information – Columbia Select Small Cap Fund
| | |
| Performance of a $10,000 investment 04/01/00 – 03/31/10 |
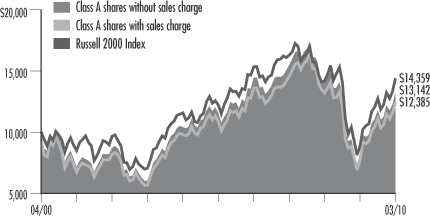
The chart above shows the change in value of a hypothetical $10,000 investment in Class A shares of Columbia Select Small Cap Fund during the stated time period, and does not reflect the deduction of taxes that a shareholder may pay on fund distributions or on the redemption of fund shares.
| | | | |
| Performance of a $10,000 investment 04/01/00 - 03/31/10 ($) |
| Sales charge | | without | | with |
Class A | | 13,142 | | 12,385 |
Class C | | 12,895 | | 12,895 |
Class R | | 12,848 | | n/a |
Class Z | | 13,203 | | n/a |
| | | | | | | | | | | | |
| Average annual total return as of 3/31/10 (%) |
| | | | |
| Share class | | A | | C | | R | | Z |
| Inception | | 09/28/07 | | 09/28/07 | | 12/31/04 | | 12/31/92 |
| Sales charge | | without | | with | | without | | with | | without | | without |
1-year | | 62.33 | | 53.06 | | 61.20 | | 60.20 | | 61.94 | | 62.75 |
5-year | | 2.74 | | 1.53 | | 2.35 | | 2.35 | | 2.31 | | 2.83 |
10-year | | 2.77 | | 2.16 | | 2.58 | | 2.58 | | 2.54 | | 2.82 |
Performance data quoted represents past performance and current performance may be lower or higher. Past performance is no guarantee of future results. The investment return and principal value will fluctuate so that shares, when redeemed, may be worth more or less than the original cost. Please visit www.columbiafunds.com for daily and most recent month-end performance updates.
| | |
| Annual operating expense ratio (%)* |
| |
Class A | | 1.35 |
Class C | | 2.10 |
Class R | | 1.60 |
Class Z | | 1.10 |
| * | The annual operating expense ratio is as stated in the fund’s prospectus that is current as of the date of this report. Differences in expense ratios disclosed elsewhere in this report may result from the inclusion of fee waivers and expense reimbursements as well as the use of different time periods used in calculating the ratios. |
The “with sales charge” returns include the maximum initial sales charge of 5.75% for Class A shares, the applicable contingent deferred sales charge of 1.00% for Class C shares for the first year only. The “without sales charge” returns do not include the effect of sales charges. If they had, returns would be lower.
The Fund commenced operations on March 31, 2008. The returns of the Class A and Class C shares shown for periods prior to March 31, 2008 include the returns of Class A shares or Class C shares, as applicable, of Small Cap Fund, the predecessor to the Fund and a series of Excelsior Funds, Inc. (the “Predecessor Fund”), for periods after September 27, 2007, and include the returns of Shares class shares of the Predecessor Fund for periods prior to September 28, 2007. The returns shown reflect applicable sales charges, but have not been adjusted to reflect differences in expenses. If differences in expenses were reflected, the returns shown for the periods prior to September 28, 2007 would be lower. The returns of the Class R shares shown for periods prior to March 31, 2008 include the returns of Retirement Shares class shares of the Predecessor Fund for periods after December 30, 2004, and include the returns of Shares class shares of the Predecessor Fund for periods prior to December 31, 2004. The returns shown reflect that Class R shares are sold without sales charges, but have not been adjusted to reflect differences in expenses. If differences in expenses were reflected, the returns shown for periods prior to March 31, 2008 would be lower. The returns of the Class Z shares shown for periods prior to March 31, 2008 are those of the Shares class shares of the Predecessor Fund. The returns of Class Z shares shown have not been adjusted to reflect differences in expenses.
Inception date refers to the date on which the Predecessor Fund class commenced operations.
Performance results reflect any fee waivers or reimbursements of fund expenses by the investment advisor and/or any of its affiliates. Absent these fee waivers or expense reimbursement arrangements, performance results would have been lower.
All results shown assume reinvestment of distributions. Class Z shares are sold at net asset value with no distribution and service (Rule 12b-1) fees. Class R shares are sold at net asset value with distribution (Rule 12b-1) fees. Class R and Class Z shares have limited eligibility and the investment minimum requirements may vary. Please see the fund’s prospectus for details. Performance for different share classes will vary based on differences in sales charges and fees associated with each class.
The tables do not reflect the deduction of taxes that a shareholder may pay on fund distributions or on the redemption of fund shares.
29
Understanding Your Expenses – Columbia Select Small Cap Fund
Estimating your actual expenses
To estimate the expenses that you paid over the period, first you will need your account balance at the end of the period:
| | n | | For shareholders who receive their account statements from Columbia Management Services, Inc., your account balance is available online at www.columbiafunds.com or by calling Shareholder Services at 800.345.6611. | |
| | n | | For shareholders who receive their account statements from their financial intermediary, contact your financial intermediary to obtain your account balance. | |
| | 1. | Divide your ending account balance by $1,000. For example, if an account balance was $8,600 at the end of the period, the result would be 8.6. | |
| | 2. | In the section of the table below titled “Expenses paid during the period,” locate the amount for your share class, You will find this number in the column labeled “Actual”. Multiply this number by the result from step 1. Your answer is an estimate of the expenses you paid on your account during the period. | |
If the value of your account falls below the minimum initial investment requirement applicable to you, your account generally will be subject to a $20 annual fee. This fee is not included in the accompanying table. If you are subject to the fee, keep it in mind when you are estimating the ongoing expenses of investing in the fund and when comparing the expenses of this fund with other funds.
As a fund shareholder, you incur two types of costs. There are transaction costs, which generally include sales charges on purchases and may include redemption fees or exchange fees. There are also ongoing costs, which generally include investment advisory fees, distribution and service (Rule 12b-1) fees and other fund expenses. The information on this page is intended to help you understand the ongoing costs of investing in the fund and to compare these costs with the ongoing costs of investing in other mutual funds.
Analyzing your fund’s expenses by share class
To illustrate these ongoing costs, we have provided an example and calculated the expenses paid by investors in each share class during the period. The information in the following table is based on an initial investment of $1,000, which is invested at the beginning of the period and held for the entire period. Expense information is calculated two ways and each method provides you with different information. The amount listed in the “Actual” column is calculated using the fund’s actual operating expenses and total return for the period. The amount listed in the “Hypothetical” column for each share class assumes that the return each year is 5% before expenses and is calculated based on the fund’s actual operating expenses. You should not use the hypothetical account values and expenses to estimate either your actual account balance at the end of the period or the expenses you paid during this period.
Compare with other funds
Since all mutual funds are required to include the same hypothetical calculations about expenses in shareholder reports, you can use this information to compare the ongoing cost of investing in the fund with other funds. To do so, compare the 5% hypothetical example with the 5% hypothetical examples that appear in the shareholder reports of other funds. As you compare hypothetical examples of other funds, it is important to note that hypothetical examples are meant to highlight the ongoing costs of investing in a fund and do not reflect any transaction costs, such as sales charges, redemption fees or exchange fees.
| | | | | | | | | | | | | | |
| 10/01/09 – 03/31/10 | | | | | | | | | | |
| | | | |
| | | Account value at the
beginning of the period ($) | | Account value at the
end of the period ($) | | Expenses paid
during the period ($) | | Fund’s annualized
expense ratio (%) |
| | | Actual | | Hypothetical | | Actual | | Hypothetical | | Actual | | Hypothetical | | Actual |
Class A | | 1,000.00 | | 1,000.00 | | 1,119.20 | | 1,018.35 | | 6.97 | | 6.64 | | 1.32 |
Class C | | 1,000.00 | | 1,000.00 | | 1,115.70 | | 1,014.61 | | 10.92 | | 10.40 | | 2.07 |
Class R | | 1,000.00 | | 1,000.00 | | 1,118.20 | | 1,017.10 | | 8.29 | | 7.90 | | 1.57 |
Class Z | | 1,000.00 | | 1,000.00 | | 1,121.10 | | 1,019.60 | | 5.66 | | 5.39 | | 1.07 |
Expenses paid during the period are equal to the annualized expense ratio for the share class, multiplied by the average account value over the period, then multiplied by the number of days in the fund’s most recent fiscal half-year and divided by 365.
It is important to note that the expense amounts shown in the table are meant to highlight only ongoing costs of investing in the fund and do not reflect any transaction costs, such as sales charges, redemption fees or exchange fees. Therefore, the hypothetical examples provided may not help you determine the relative total costs of owning shares of different funds. If these transaction costs were included, your costs would have been higher.
30
Portfolio Manager’s Report – Columbia Select Small Cap Fund
For the 12-month period that ended March 31, 2010, the fund’s Class A shares returned 62.33% without sales charge. The fund’s benchmark, the Russell 2000 Index, returned 62.76% for the same period. The fund’s return was slightly below the average return of its peer group, the Lipper Small-Cap Core Funds Classification, which was 63.07% for the 12-month period. Maintaining overweights in information technology, industrials and consumer discretionary added to performance relative to the benchmark. However, underweights in financials and health care tempered the fund’s strong results.
Technology, industrials and consumer discretionary stocks led performance
The advisor selects securities that it believes are attractively valued and have the potential for long term growth. We believe that if a security’s price is already depressed, the risk of it declining further is lessened. Following the precipitous declines of 2008 and early 2009, we emphasized several stocks within information technology, industrials and consumer discretionary, which benefited performance. One of the most significant individual contributors was F5 Networks (2.8% of net assets), a technology company that provides software and hardware for interconnectivity systems. F5 Networks’ business prospects improved as the economy emerged from recession, despite concerns about reduced demand from the company’s financial services clients and about the integration of a recent acquisition. Also in technology, Power Integrations (3.2% of net assets) benefited from increased demand for its energy-saving integrated circuits.
Home goods retailer Williams-Sonoma (3.1% of net assets) was another top contributor. The company tightly controlled its expenses and inventories during the economic downturn, which eventually contributed to the firm’s success when the economy rebounded and consumers loosened their purse strings. Another top performer was Sotheby’s (3.5% of net assets), an international art auctioneer. As the world’s economies improved, especially emerging markets such as China, India and Russia, so did demand for Sotheby’s services.
Underweights in financials and health care held back returns
The fund had less exposure than the index to financials and health care — two sectors that performed well during the period — and that positioning detracted from relative performance. In addition, the fund held certain stocks that did not keep pace with the strong results of the index. For example, Greenhill (2.6% of net assets), an independent investment bank, posted anemic returns due to a decline in merger and acquisition activity during the period. However, we believe the company has the potential to benefit from a slowly growing economy and an environment of low interest rates, so we held onto the stock.
Drew Industries, a developer of components for manufactured houses and recreational vehicles, also detracted from the fund’s relative return. We sold Drew to establish a larger position in one of its competitors, Thor Industries (2.5% of net assets), which was a better performer during this 12-month period. Innovative Solutions & Support also held back the fund’s results. This company, which
Performance data quoted represents past performance and current performance may be lower or higher. Past performance is no guarantee of future results. The investment return and principal value will fluctuate so that shares, when redeemed, may be worth more or less than the original cost. Please visit www.columbiafunds.com for daily and most recent month-end performance updates.
| | |
| Net asset value per share |
| |
as of 03/31/10 ($) | | |
Class A | | 14.74 |
Class C | | 14.46 |
Class R | | 14.38 |
Class Z | | 14.81 |
31
Portfolio Manager’s Report (continued) – Columbia Select Small Cap Fund
| | |
| Top sectors | | |
| |
as of 03/31/10 (%) | | |
Information Technology | | 26.3 |
Consumer Discretionary | | 19.7 |
Industrials | | 19.0 |
Financials | | 17.3 |
Energy | | 8.8 |
| | |
| Top 10 holdings | | |
| |
as of 03/31/10 (%) | | |
Sotheby’s | | 3.5 |
Power Integrations | | 3.2 |
Williams-Sonoma | | 3.1 |
Zions Bancorporation | | 3.1 |
Manhattan Associates | | 2.9 |
P.F. Chang’s China Bistro | | 2.8 |
InterDigital | | 2.8 |
F5 Networks | | 2.8 |
Shaw Group | | 2.8 |
Wintrust Financial | | 2.7 |
The fund is actively managed and the composition of its portfolio will change over time. Information provided is calculated as a percentage of net assets.
manufactures flat-panel displays for aircraft cockpits, turned its sole focus to a single client. When that client declared bankruptcy, Innovative Solutions & Support tumbled. We sold the stock.
Looking ahead
Looking ahead, we believe that interest rates and tax rates will increase and that we will see the return of inflation as the U.S. deficit continues to balloon. We are monitoring how each of these challenges will affect the economic environment. Yet, we foresee opportunities, particularly among regional banks, whose stock prices were severely punished in the recent economic downturn, and we have either added to existing positions or initiated new ones, including Wintrust Financial, Zions Bancorporation and City National (2.7%, 3.1% and 2.4% of net assets, respectively). To fund these purchases, we decreased allocations across technology, industrials and consumer discretionary stocks, areas in which the fund reaped much success in the past year.
Portfolio characteristics and holdings are subject to change periodically and may not be representative of current characteristics and holdings. The outlook for the fund may differ from that presented for other Columbia Funds.
Equity securities are subject to stock market fluctuations that occur in response to economic and business developments.
Stocks of small-cap companies pose special risks, including possible illiquidity and greater price volatility than stocks of larger, more established companies.
32
Fund Profile – Columbia Value and Restructuring Fund
Summary
| n | | For the 12-month period that ended March 31, 2010, the Value and Restructuring Fund’s Class A shares returned 70.25% without sales charge. |
| n | | The fund outdistanced its benchmarks, the Russell 1000 Value Index and the S&P 500 Index1, as well as the average return of its peer group, the Lipper Multi-Cap Value Funds Classification2, by a substantial margin. |
| n | | An emphasis on restructuring companies and commodities drove the fund’s outperformance. |
Portfolio Management
David J. Williams has co-managed the fund since 2008 and has been associated with the advisor or its predecessors since 1987.
Guy W. Pope has co-managed the fund since 2009 and has been associated with the advisor or its predecessors since 1993.
J. Nicholas Smith has co-managed the fund since 2009 and has been associated with the advisor or its predecessors since 2005.
Effective May 1, 2010, RiverSource Investments, LLC, a subsidiary of Ameriprise Financial, Inc., became the investment advisor to the fund and changed its name to Columbia Management Investment Advisers, LLC. Please see the fund’s prospectus, as supplemented, for more information regarding the change in investment advisor and certain other changes.
| 1 | The Russell 1000 Value Index measures the performance of those Russell 1000 Index companies with lower price-to-book ratios and lower forecasted growth values. The Standard & Poor’s (S&P) 500 Index tracks the performance of 500 widely held, large-capitalization U.S. stocks. Indices are not available for investment, are not professionally managed and do not reflect sales charges, fees, brokerage commissions, taxes or other expenses of investing. Securities in the fund may not match those in an index. |
| 2 | Lipper Inc., a widely respected data provider in the industry, calculates an average total return (assuming reinvestment of distributions) for mutual funds with investment objectives similar to those of the fund. Lipper makes no adjustment for the effect of sales loads. |
Performance data quoted represents past performance and current performance may be lower or higher. Past performance is no guarantee of future results. The investment return and principal value will fluctuate so that shares, when redeemed, may be worth more or less than the original cost. Please visit www.columbiafunds.com for daily and most recent month-end performance updates.
Summary
1-year return as of 03/31/10
| | |
| |
| | +70.25% Class A shares
(without sales charge) |
| |
| | +53.56% Russell 1000 Value Index |
| |
| | +49.77% S&P 500 Index |
|
Morningstar Style BoxTM |
|
Equity Style |
|
The Morningstar Style BoxTM reveals a fund’s investment strategy. For equity funds, the vertical axis shows the market capitalization of the stocks owned, and the horizontal axis shows investment style (value, blend or growth). Information shown is based on the most recent data provided by Morningstar.
33
Performance Information – Columbia Value and Restructuring Fund
Performance data quoted represents past performance and current performance may be lower or higher. Past performance is no guarantee of future results. The investment return and principal value will fluctuate so that shares, when redeemed, may be worth more or less than the original cost. Please visit www.columbiafunds.com for daily and most recent month-end performance updates.
| | |
| Annual operating expense ratio (%)* |
| |
Class A | | 1.19 |
Class C | | 1.94 |
| |
Class R | | 1.44 |
Class Z | | 0.94 |
| * | The annual operating expense ratio is as stated in the fund’s prospectus that is current as of the date of this report. Differences in expense ratios disclosed elsewhere in this report may result from the inclusion of fee waivers and expense reimbursements as well as the use of different time periods used in calculating the ratios. |
| | |
| Performance Growth of a $10,000 investment 04/01/00 – 03/31/10 |
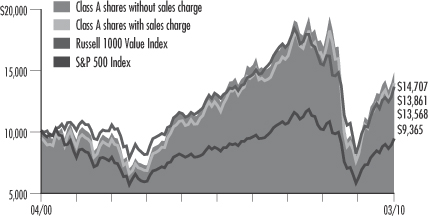
The chart above shows the change in value of a hypothetical $10,000 investment in Class A shares of Columbia Value and Restructuring Fund during the stated time period, and does not reflect the deduction of taxes that a shareholder may pay on fund distributions or on the redemption of fund shares.
| | | | |
| Performance of a $10,000 investment 04/01/00 – 03/31/10 ($) |
| | |
| Sales charge | | without | | with |
Class A | | 14,707 | | 13,861 |
Class C | | 14,442 | | 14,442 |
Class R | | 14,419 | | n/a |
Class Z | | 14,779 | | n/a |
| | | | | | | | | | | | |
| Average annual total return as of 03/31/10 (%) |
| | | | |
| Share class | | A | | C | | R | | Z |
| Inception | | 09/28/07 | | 09/28/07 | | 12/31/04 | | 12/31/92 |
| Sales charge | | without | | with | | without | | with | | without | | without |
1-year | | 70.25 | | 60.44 | | 69.00 | | 68.00 | | 69.84 | | 70.71 |
5-year | | 2.89 | | 1.68 | | 2.52 | | 2.52 | | 2.52 | | 2.99 |
10-year | | 3.93 | | 3.32 | | 3.74 | | 3.74 | | 3.73 | | 3.98 |
The “with sales charge” returns include the maximum initial sales charge of 5.75% for Class A shares and the applicable contingent deferred sales charge of 1.00% for Class C shares for the first year only. The “without sales charge” returns do not include the effect of sales charges. If they had, returns would be lower.
The Fund commenced operations on March 31, 2008. The returns of the Class A and Class C shares shown for period prior to March 31, 2008 include the returns of Class A shares or Class C shares, as applicable, of Value and Restructuring Fund, the predecessor to the Fund and a series of Excelsior Funds, Inc. (the “Predecessor Fund”), for periods after September 27, 2007, and include the returns of Shares class shares of the Predecessor Fund for periods prior to September 28, 2007. The returns shown reflect applicable sales charges, but have not been adjusted to reflect differences in expenses. If differences in expenses were reflected, the returns shown for the period prior to September 28, 2007 would be lower. The returns of the Class R shares shown for period prior to March 31, 2008 include the returns of Retirement Shares class shares of the Predecessor Fund for periods after December 30, 2004, and include the returns of Shares class shares of the Predecessor Fund for periods prior to December 31, 2004. The returns shown reflect that Class R shares are sold without sales charges, but have not been adjusted to reflect differences in expenses. If differences in expenses were reflected, the returns shown for periods prior to March 31, 2008 would be lower. The returns of the Class Z shares shown for periods prior to March 31, 2008 are those of the Shares class shares of the Predecessor Fund. The returns of Class Z shares shown have not been adjusted to reflect differences in expenses.
Inception date refers to the date on which the Predecessor Fund class commenced operations.
Performance results reflect any fee waivers or reimbursements of fund expenses by the investment advisor and/or any of its affiliates. Absent these fee waivers or expense reimbursement arrangements, performance results would have been lower.
All results shown assume reinvestment of distributions. Class R shares are sold at net asset value with distribution and service (Rule 12b-1) fees. Class Z shares are sold at net asset value with no distribution and service (Rule 12b-1) fees. Class R and Class Z shares have limited eligibility and the investment minimum requirements may vary. Please see the fund’s prospectus for details. Performance for different share classes will vary based on differences in sales charges and fees associated with each class.
The tables do not reflect the deduction of taxes that a shareholder may pay on fund distributions or on the redemption of fund shares.
34
Understanding Your Expenses – Columbia Value and Restructuring Fund
As a fund shareholder, you incur two types of costs. There are transaction costs, which generally include sales charges on purchases and may include redemption fees or exchange fees. There are also ongoing costs, which generally include investment advisory fees, distribution and service (Rule 12b-1) fees and other fund expenses. The information on this page is intended to help you understand the ongoing costs of investing in the fund and to compare these costs with the ongoing costs of investing in other mutual funds.
Analyzing your fund’s expenses by share class
To illustrate these ongoing costs, we have provided an example and calculated the expenses paid by investors in each share class during the period. The information in the following table is based on an initial investment of $1,000, which is invested at the beginning of the period and held for the entire period. Expense information is calculated two ways and each method provides you with different information. The amount listed in the “Actual” column is calculated using the fund’s actual operating expenses and total return for the period. The amount listed in the “Hypothetical” column for each share class assumes that the return each year is 5% before expenses and is calculated based on the fund’s actual operating expenses. You should not use the hypothetical account values and expenses to estimate either your actual account balance at the end of the period or the expenses you paid during this period.
Compare with other funds
Since all mutual funds are required to include the same hypothetical calculations about expenses in shareholder reports, you can use this information to compare the ongoing cost of investing in the fund with other funds. To do so, compare the 5% hypothetical example with the 5% hypothetical examples that appear in the shareholder reports of other funds. As you compare hypothetical examples of other funds, it is important to note that hypothetical examples are meant to highlight the ongoing costs of investing in a fund and do not reflect any transaction costs, such as sales charges, redemption fees or exchange fees.
Estimating your actual expenses
To estimate the expenses that you paid over the period, first you will need your account balance at the end of the period:
| | n | | For shareholders who receive their account statements from Columbia Management Services, Inc., your account balance is available online at www.columbiafunds.com or by calling Shareholder Services at 800.345.6611. | |
| | n | | For shareholders who receive their account statements from their financial intermediary, contact your financial intermediary to obtain your account balance. | |
| | 1. | Divide your ending account balance by $1,000. For example, if an account balance was $8,600 at the end of the period, the result would be 8.6. | |
| | 2. | In the section of the table below titled “Expenses paid during the period,” locate the amount for your share class. You will find this number in the column labeled “Actual.” Multiply this number by the result from step 1. Your answer is an estimate of the expenses you paid on your account during the period. | |
If the value of your account falls below the minimum initial investment requirement applicable to you, your account generally will be subject to a $20 annual fee. This fee is not included in the accompanying table. If you are subject to the fee, keep it in mind when you are estimating the ongoing expenses of investing in the fund and when comparing the expenses of this fund with other funds.
| | | | | | | | | | | | | | |
| 10/01/09 – 03/31/10 | | | | | | |
| | | | |
| | | Account value at the
beginning of the period ($) | | Account value at the end of the period ($) | | Expenses paid during the period ($) | | Fund’s annualized
expense ratio (%) |
| | | Actual | | Hypothetical | | Actual | | Hypothetical | | Actual | | Hypothetical | | Actual |
Class A | | 1,000.00 | | 1,000.00 | | 1,126.10 | | 1,019.35 | | 5.94 | | 5.64 | | 1.12 |
Class C | | 1,000.00 | | 1,000.00 | | 1,121.80 | | 1,015.61 | | 9.89 | | 9.40 | | 1.87 |
Class R | | 1,000.00 | | 1,000.00 | | 1,124.80 | | 1,018.10 | | 7.26 | | 6.89 | | 1.37 |
Class Z | | 1,000.00 | | 1,000.00 | | 1,127.50 | | 1,020.59 | | 4.61 | | 4.38 | | 0.87 |
Expenses paid during the period are equal to the annualized expense ratio for the share class, multiplied by the average account value over the period, then multiplied by the number of days in the fund’s most recent fiscal half-year and divided by 365.
It is important to note that the expense amounts shown in the table are meant to highlight only ongoing costs of investing in the fund and do not reflect any transaction costs, such as sales charges, redemption fees or exchange fees. Therefore, the hypothetical examples provided may not help you determine the relative total costs of owning shares of different funds. If these transaction costs were included, your costs would have been higher.
35
Portfolio Managers’ Report – Columbia Value and Restructuring Fund
Performance data quoted represents past performance and current performance may be lower or higher. Past performance is no guarantee of future results. The investment return and principal value will fluctuate so that shares, when redeemed, may be worth more or less than the original cost. Please visit www.columbiafunds.com for daily and most recent month-end performance updates.
| | |
| Net asset value per share |
|
as of 03/31/10 ($) |
Class A | | 44.68 |
| |
Class C | | 44.60 |
Class R | | 44.64 |
| |
Class Z | | 44.66 |
| | |
| Distributions declared per share |
|
04/01/09 – 03/31/10 ($) |
Class A | | 0.38 |
| |
Class C | | 0.17 |
Class R | | 0.30 |
| |
Class Z | | 0.47 |
For the 12-month period that ended March 31, 2010, the fund’s Class A shares returned 70.25% without sales charge. The fund outpaced its benchmarks, the Russell 1000 Value Index and the S&P 500 Index, which returned 53.56% and 49.77%, respectively, and the average return of its peer group, the Lipper Multi-Cap Value Funds Classification, which was 56.02% for the 12-month period. The fund was exceptionally well-positioned to benefit from a resurgence of companies that either were reorganizing themselves to increase efficiency or were in industries undergoing consolidation. During a period in which some foreign market economies expanded faster than the U.S. economy, performance received further support from the emphasis on companies with significant earnings derived from outside the United States.
Earnings from overseas operations drove results
The fund was well-positioned to capitalize on a stock rally that was triggered by increasing expectations of a global economic recovery. Concerned about longer-term fiscal and monetary challenges in the United States, we maintained emphasis on companies that earned a major share of their profits in foreign markets. At the end of the 12-month period covered by this report, approximately 50% of the revenues of fund holdings came from operations overseas.
We believe that current U.S. government policy trends are almost certain to result in dangerously higher inflation in the future. As a consequence, our investments in domestically-oriented companies emphasized corporations likely to benefit from inflation, such as in the energy and materials sectors. We avoided sectors we believe to be vulnerable to inflation, higher taxes or greater government involvement, such as consumer discretionary, health care and utilities.
In general, we maintained our discipline and focused on companies that either are restructuring themselves or are in industries that are undergoing consolidation. We believe these types of companies are more likely to show earnings improvements in a slow-growth environment. One of the period’s beneficiaries of this theme was Stanley Black & Decker (2.1% of net assets), formed by the merger of Stanley Works and Black & Decker. Black & Decker made a strong contribution to the fund’s return.
Energy and materials investments drove results
By sector, the greatest boost to performance came from selections in the energy and materials sectors, two areas that benefited directly from rising commodity prices. The leading energy contributors to fund performance included coal miner Alpha Natural Resources, Brazilian oil company Petroleo Brasileiro SA, coal and natural gas company Consol Energy and Anadarko Petroleum, an oil and gas exploration and production company (4.1%, 4.6%, 2.7% and 2.4% of net assets, respectively). Similarly, rising commodity prices propelled robust returns from many of our materials selections, including chemical corporation Celanese and natural resources companies Grupo Mexico SAB de CV, Southern Copper, Freeport-McMoRan Copper & Gold and Vale SA (2.2%, 2.0%, 2.3%, 2.1% and 1.6% of net assets, respectively.) Elsewhere, the fund received solid contributions from companies such as Eaton (2.3% of net assets), an electronics component producer that has increased its international exposure;
36
Portfolio Managers’ Report (continued) – Columbia Value and Restructuring Fund
railroad corporation Union Pacific (3.8% of net assets), which has achieved significant internal cost savings; and retailer TJX Companies (2.0% of net assets), whose Marshalls and TJ Maxx chains appeal to cost-conscious consumers.
Individual stock disappointments
Even in a year of strong performance, several holdings produced disappointing results. We sold Nokia, the Finland-based telecommunications equipment company that had been a long-term holding, after it failed to show improvement. However, we retained several other weak performers in which we continue to have confidence. These include investment bank Morgan Stanley, property-and-casualty re-insurance corporation ACE and two industrials corporations: AerCap Holdings and RSC Holdings (1.5%, 2.7%, 0.9% and 0.4% of net assets, respectively).
Domestic economic concerns influence strategy
We remain concerned about the risks of inflationary pressures, higher taxes and slowing growth in the domestic economy, and we have positioned the fund in an attempt to hedge these risks while taking advantage of healthier growth trends overseas. In this regard, we have maintained an emphasis on commodities, including mining and energy companies, that can prosper with inflation. At the same time, we have tried to deemphasize companies that we believe are highly exposed to risks in the U.S. economy by underweighting the consumer groups, both discretionary and staples, as well as health care corporations and utilities. We continue to favor corporations that earn significant profits outside the United States.
Portfolio characteristics and holdings are subject to change periodically and may not be representative of current characteristics and holdings. The outlook for the fund may differ from that presented for other Columbia Funds.
Equity securities are subject to stock market fluctuations that occur in response to economic and business developments.
Value stocks are securities of companies that may have experienced adverse business or industry developments or may be subject to special risks that have caused the stocks to be out of favor. If the manager’s assessment of a company’s prospects is wrong, the price of its stock may not approach the value the manager has placed on it.
International investing involves special risks, including foreign taxation, currency risks, risks associated with possible differences in financial standards and other risks associated with future political and economic developments.
Investing in emerging markets may involve greater risks than investing in more developed countries. In addition, concentration of investments in a single region may result in greater volatility.
| | |
| Top Sectors |
|
as of 03/31/10 (%) |
Energy | | 23.3 |
Financials | | 16.8 |
Industrials | | 15.8 |
Materials | | 13.3 |
Information Technology | | 8.0 |
| | |
Top 10 Holdings |
|
as of 03/31/10 (%) |
Petroleo Brasileiro SA | | 4.6 |
Alpha Natural Resources | | 4.1 |
Lorillard | | 4.0 |
Union Pacific | | 3.8 |
America Movil SAB de CV | | 3.8 |
Harris | | 3.5 |
International Business Machines | | 2.9 |
ACE | | 2.7 |
Consol Energy | | 2.7 |
Anadarko Petroleum | | 2.4 |
The fund is actively managed and the composition of its portfolio will change over time. Information provided is calculated as a percentage of net assets.
37
Fund Profile – Columbia Emerging Markets Fund
Performance data quoted represents past performance and current performance may be lower or higher. Past performance is no guarantee of future results. The investment return and principal value will fluctuate so that shares, when redeemed, may be worth more or less than the original cost. Please visit www.columbiafunds.com for daily and most recent month-end performance updates.
Summary
1-year return as of 03/31/10
| | |
| |
| | +78.17% Class A shares
(without sales charge) |
| |
| | +81.08% MSCI Emerging Markets Index (Net) |
| |
| | +81.55% MSCI Emerging Markets Index (Gross) |
| |
| | +54.44% MSCI EAFE Index |
|
Morningstar Style BoxTM |
|
Equity Style |
|
The Morningstar Style BoxTM reveals a fund’s investment strategy. For equity funds, the vertical axis shows the market capitalization of the stocks owned, and the horizontal axis shows investment style (value, blend or growth). Information shown is based on the most recent data provided by Morningstar.
Summary
| n | | For the 12-month period that ended March 31, 2010, the fund’s Class A shares returned 78.17% without sales charge. |
| n | | The fund’s returns were lower than the return of one of its benchmarks, the MSCI Emerging Markets Index1, while substantially higher than the return of its other benchmark, the MSCI EAFE Index.2 The fund also lagged the average return of its peer group, the Lipper Emerging Markets Funds Classification.3 |
| n | | The fund’s results lagged its primary benchmark by less than three percentage points primarily because the managers focused on higher-quality, financially strong companies early in the period, when poorer-quality stocks posted the strongest performance. |
Portfolio Management
Dara J. White, lead manager, has co-managed the fund since 2008 and has been associated with the advisor or its predecessors since 2006.
Jasmine (Weili) Huang has co-managed the fund since 2008 and has been associated with the advisor or its predecessors since 2003.
Fred Copper has co-managed the fund since 2008 and has been associated with the advisor or its predecessors since 2005.
Robert B. Cameron has co-managed the fund since December 2008 and has been associated with the advisor or its predecessors since 2008.
Effective May 1, 2010, Fred Copper no longer co-managed the fund.
Effective May 1, 2010, RiverSource Investments, LLC, a subsidiary of Ameriprise Financial, Inc., became the investment advisor to the fund and changed its name to Columbia Management Investment Advisers, LLC. Please see the fund’s prospectus, as supplemented, for more information regarding the change in investment advisor and certain other changes.
| 1 | The Morgan Stanley Capital International Emerging Markets Index (MSCI EMI) is a free float-adjusted market capitalization index that is designed to measure equity market performance in the global emerging markets. As of June 2009, the MSCI Emerging Markets Index consisted of the following 22 emerging market country indices: Brazil, Chile, China, Colombia, Czech Republic, Egypt, Hungary, India, Indonesia, Israel, Korea, Malaysia, Mexico, Morocco, Peru, Philippines, Poland, Russia, South Africa, Taiwan, Thailand and Turkey. |
| 2 | The Morgan Stanley Capital International Europe, Australasia, Far East (MSCI EAFE) Index is a capitalization-weighted index that tracks the total return of common stocks in 21 developed-market countries within Europe, Australasia and the Far East. |
| | Indices are not available for investment, are not professionally managed and do not reflect sales charges, fees, brokerage commissions, taxes or other expenses of investing. Securities in the fund may not match those in an index. |
| 3 | Lipper Inc., a widely respected data provider in the industry, calculates an average total return (assuming reinvestment of distributions) for mutual funds with investment objectives similar to those of the fund. Lipper makes no adjustment for the effect of sales loads. |
38
Performance Information – Columbia Emerging Markets Fund
|
| Performance of a $10,000 investment 04/01/00 – 03/31/10 |
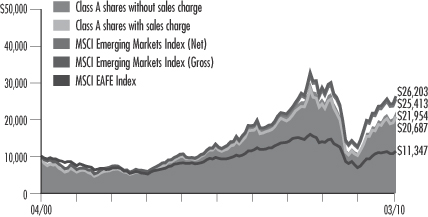
The chart above shows the change in value of a hypothetical $10,000 investment in Class A shares of Columbia Emerging Markets Fund during the stated time period, and does not reflect the deduction of taxes that a shareholder may pay on fund distributions or on the redemption of fund shares.
| | | | |
| Performance of a $10,000 investment 04/01/00 – 03/31/10 ($) |
| | |
| Sales charge | | without | | with |
Class A | | 21,954 | | 20,687 |
Class C | | 21,539 | | 21,539 |
Class Z | | 22,045 | | n/a |
| | | | | | | | | | |
| Average annual total return as of 03/31/10 (%) |
| | | |
| Share class | | A | | C | | Z |
| Inception | | 09/28/07 | | 09/28/07 | | 01/02/98 |
| Sales charge | | without | | with | | without | | with | | without |
1-year | | 78.17 | | 67.97 | | 76.73 | | 75.73 | | 78.84 |
5-year | | 12.14 | | 10.83 | | 11.72 | | 11.72 | | 12.24 |
10-year | | 8.18 | | 7.54 | | 7.98 | | 7.98 | | 8.23 |
Performance data quoted represents past performance and current performance may be lower or higher. Past performance is no guarantee of future results. The investment return and principal value will fluctuate so that shares, when redeemed, may be worth more or less than the original cost. Please visit www.columbiafunds.com for daily and most recent month-end performance updates.
| | |
| Annual operating expense ratio (%)* |
| |
Class A | | 2.06 |
Class C | | 2.81 |
Class Z | | 1.81 |
| * | The annual operating expense ratio is as stated in the fund’s prospectus that is current as of the date of this report. Differences in expense ratios disclosed elsewhere in this report may result from the inclusion of fee waivers and expense reimbursements as well as the use of different time periods used in calculating the ratios. |
The “with sales charge” returns include the maximum initial sales charge of 5.75% for Class A shares and the applicable contingent deferred sales charge of 1.00% for Class C shares for the first year only. The “without sales charge” returns do not include the effect of sales charges. If they had, returns would be lower.
The Fund commenced operations on March 31, 2008. The returns of the Class A and Class C shares shown for periods prior to March 31, 2008 include the returns of Class A shares or Class C shares, as applicable, of Emerging Markets Fund, the predecessor to the Fund and a series of Excelsior Funds, Inc. (the “Predecessor Fund”), for periods after September 27, 2007, and include the returns of Shares class shares of the Predecessor Fund for periods prior to September 28, 2007. The returns shown reflect applicable sales charges, but have not been adjusted to reflect differences in expenses. If differences in expenses were reflected, the returns shown for the periods prior to September 28, 2007 would be lower. The returns of the Class Z shares shown for periods prior to March 31, 2008 are those of the Shares class shares of the Predecessor Fund. The returns shown reflect that Class Z shares are sold without sales charges, but have not been adjusted to reflect differences in expenses. The inception of the Predecessor Fund is January 2, 1998.
Inception date refers to the date on which the Predecessor Fund class commenced operations.
Performance results reflect any fee waivers or reimbursements of fund expenses by the investment advisor and/or any of its affiliates. Absent these fee waivers or expense reimbursement arrangements, performance results would have been lower.
All results shown assume reinvestment of distributions. Class Z shares are sold at net asset value with no distribution and service (Rule 12b-1) fees. Class Z shares have limited eligibility and the investment minimum requirements may vary. Please see the fund’s prospectus for details. Performance for different share classes will vary based on differences in sales charges and fees associated with each class.
The tables do not reflect the deduction of taxes that a shareholder may pay on fund distributions or on the redemption of fund shares.
39
Understanding Your Expenses – Columbia Emerging Markets Fund
Estimating your actual expenses
To estimate the expenses that you paid over the period, first you will need your account balance at the end of the period:
| | n | | For shareholders who receive their account statements from Columbia Management Services, Inc., your account balance is available online at www.columbiafunds.com or by calling Shareholder Services at 800.345.6611. | |
| | n | | For shareholders who receive their account statements from their financial intermediary, contact your financial intermediary to obtain your account balance. | |
| | 1. | Divide your ending account balance by $1,000. For example, if an account balance was $8,600 at the end of the period, the result would be 8.6. | |
| | 2. | In the section of the table below titled “Expenses paid during the period,” locate the amount for your share class. You will find this number in the column labeled “Actual.” Multiply this number by the result from step 1. Your answer is an estimate of the expenses you paid on your account during the period. | |
If the value of your account falls below the minimum initial investment requirement applicable to you, your account generally will be subject to a $20 annual fee. This fee is not included in the accompanying table. If you are subject to the fee, keep it in mind when you are estimating the ongoing expenses of investing in the fund and when comparing the expenses of this fund with other funds.
As a fund shareholder, you incur two types of costs. There are transaction costs, which generally include sales charges on purchases and may include redemption fees or exchange fees. There are also ongoing costs, which generally include investment advisory fees, distribution and service (Rule 12b-1) fees and other fund expenses. The information on this page is intended to help you understand the ongoing costs of investing in the fund and to compare these costs with the ongoing costs of investing in other mutual funds.
Analyzing your fund’s expenses by share class
To illustrate these ongoing costs, we have provided an example and calculated the expenses paid by investors in each share class during the period. The information in the following table is based on an initial investment of $1,000, which is invested at the beginning of the period and held for the entire period. Expense information is calculated two ways and each method provides you with different information. The amount listed in the “Actual” column is calculated using the fund’s actual operating expenses and total return for the period. The amount listed in the “Hypothetical” column for each share class assumes that the return each year is 5% before expenses and is calculated based on the fund’s actual operating expenses. You should not use the hypothetical account values and expenses to estimate either your actual account balance at the end of the period or the expenses you paid during this period.
Compare with other funds
Since all mutual funds are required to include the same hypothetical calculations about expenses in shareholder reports, you can use this information to compare the ongoing costs of investing in the fund with other funds. To do so, compare the 5% hypothetical example with the 5% hypothetical examples that appear in the shareholder reports of other funds. As you compare hypothetical examples of other funds, it is important to note that hypothetical examples are meant to highlight the ongoing costs of investing in a fund and do not reflect any transaction costs, such as sales charges, redemption fees or exchange fees.
| | | | | | | | | | | | | | |
| 10/01/09 – 03/31/10 | | | | | | | | | | |
| | | | |
| | | Account value at the
beginning of the period ($) | | Account value at the
end of the period ($) | | Expenses paid
during the period ($) | | Fund’s annualized
expense ratio (%) |
| | | Actual | | Hypothetical | | Actual | | Hypothetical | | Actual | | Hypothetical | | Actual |
Class A | | 1,000.00 | | 1,000.00 | | 1,111.10 | | 1,016.75 | | 8.63 | | 8.25 | | 1.64 |
Class C | | 1,000.00 | | 1,000.00 | | 1,107.40 | | 1,013.01 | | 12.56 | | 11.99 | | 2.39 |
Class Z | | 1,000.00 | | 1,000.00 | | 1,113.00 | | 1,018.00 | | 7.32 | | 6.99 | | 1.39 |
Expenses paid during the period are equal to the annualized expense ratio for the share class, multiplied by the average account value over the period, then multiplied by the number of days in the fund’s most recent fiscal half-year and divided by 365.
Had the investment advisor and/or any of its affiliates not waived fees or reimbursed a portion of expenses, account value at the end of the period would have been reduced.
It is important to note that the expense amounts shown in the table are meant to highlight only ongoing costs of investing in the fund and do not reflect any transaction costs, such as sales charges, redemption fees or exchange fees. Therefore, the hypothetical examples provided may not help you determine the relative total costs of owning shares of different funds. If these transaction costs were included, your costs would have been higher.
40
Portfolio Managers’ Report – Columbia Emerging Markets Fund
For the 12-month period that ended March 31, 2010, the fund’s Class A shares returned 78.17% without sales charge. The fund’s benchmarks, the MSCI Emerging Markets Index (net) and the MSCI EAFE Index, returned 81.08% and 54.44%, respectively. The average return of its peer group, the Lipper Emerging Markets Funds Classification, was 85.31% for the 12-month period. The fund lagged its primary benchmark primarily because the managers focused on higher-quality, financially strong companies early in the period, when poorer-quality stocks posted the strongest performance.
Low prices, signs of growth and stimulus spending propelled markets
Stocks of emerging market companies staged a dramatic recovery after extreme investor pessimism had pushed valuations to depressed levels as the period began. Buoyed by fresh evidence of an economic recovery and prodded by highly aggressive government monetary and fiscal policies throughout the world, emerging market equities took off near the start of the period and continued their ascent for most of the 12-month period covered by this report. At the outset of the rebound, performance was led by stocks of highly-stressed companies that had fallen hard when markets had slumped. However, higher-quality growth companies began to assume market leadership in later months. Stocks in economically-sensitive sectors, such as consumer discretionary, materials and financials, turned in the best relative results, while defensive areas, such as utilities and telecommunication services, lagged.
Cyclical sectors led fund performance
Selections in cyclical sectors, such as consumer discretionary, energy, financials and materials, helped drive fund performance. In the consumer discretionary group, leading contributors included PT Astra International (0.9% of net assets), a distributor of mopeds and automobiles in Indonesia, and Hero Honda Motors (0.6% of net assets), a marketer of motor scooters and motorbikes in India. Both companies benefited from growing consumer demand, which, in turn, was fueled by lower-cost loans. Similarly, Hypermarcas (0.9% of net assets), a diversified Brazilian consumer products company in the consumer staples group, posted strong results as demand from an emerging middle class increased. Among energy holdings, standout performers included Yanzhou Coal Mining and OGX Petroleo e Gas Participacoes (1.6% and 0.8% of net assets, respectively). Rising demand from industrial coal users in China helped drive Yanzhou’s performance, while OGX, an exploration and production company, benefited from oil field discoveries off the coast of Brazil. In the financials group, both Turkiye Garanti Bank and Bank Rakyat Indonesia (1.0% and 0.6% of net assets, respectively) succeeded in increasing their penetrations of consumer markets with the help of lower interest rates. Among materials holdings, rising demand for new housing helped fuel the performance of cement producer Indocement Tunggal Prakarsa (0.6% of net assets), while steel corporation Mechel (0.5% of net assets) gained amid rising global demand.
Performance data quoted represents past performance and current performance may be lower or higher. Past performance is no guarantee of future results. The investment return and principal value will fluctuate so that shares, when redeemed, may be worth more or less than the original cost. Please visit www.columbiafunds.com for daily and most recent month-end performance updates.
| | |
| Net asset value per share |
| |
as of 03/31/10 ($) | | |
Class A | | 11.27 |
Class C | | 11.21 |
Class Z | | 11.26 |
| | |
| Distributions declared per share |
| |
04/01/09 – 03/31/10 ($) | | |
Class A | | 0.14 |
Class C | | 0.03 |
Class Z | | 0.18 |
41
Portfolio Managers’ Report (continued) – Columbia Emerging Markets Fund
| | |
| Top countries |
| |
as of 03/31/10 (%) | | |
Brazil | | 18.8 |
China | | 15.7 |
Republic of Korea | | 10.0 |
Russia | | 9.6 |
Taiwan | | 8.6 |
| | |
| Top 10 holdings |
| |
as of 03/31/10 (%) | | |
Petroleo Brasileiro SA | | 4.3 |
Samsung Electronics | | 3.9 |
Vale SA | | 3.9 |
Itau Unibanco Holding SA | | 2.6 |
HON HAI Precision Industry | | 1.8 |
Rosneft Oil | | 1.8 |
China Life Insurance | | 1.7 |
LUKOIL | | 1.7 |
Yanzhou Coal Mining | | 1.6 |
Taiwan Semiconductor Manufacturing Co. | | 1.6 |
The fund is actively managed and the composition of it’s portfolio will change over time. Information provided is calculated as a percentage of net assets.
Telecom selections held back results
In the less cyclical telecommunication services sector, SK Telecom (0.6% of net assets) produced double-digit positive returns, but significantly lagged the market as it faced a tough competitive market. Our stock selections in the information technology group also held back results. We deemphasized the group early in the period because we were skeptical that demand for technology products would increase in western markets as the global economy began recovering. At the same time, our decisions to underweight the markets of Mexico, Hungary and Poland hurt performance. While we were concerned about weak government balance sheets and aging populations in each of these countries, their markets nevertheless surged ahead in the global stock rebound.
Looking ahead
We believe that emerging markets have the potential to continue to offer solid investment opportunities, although the markets are likely to produce less spectacular results than they did over the recent 12-month period. Stock valuations in emerging markets appear to be reasonable; and we see potential in financially sound, well-managed companies that can take advantage of the development of a new consumer class and the spread of industrialization long-term — two long secular themes in emerging market countries. We intend to focus on investments in countries with solid growth characteristics: young populations with little personal debt, economies positioned for productivity gains and governments that have solid financial balance sheets and sound fiscal policy.
Portfolio characteristics and holdings are subject to change periodically and may not be representative of current characteristics and holdings. The outlook for the fund may differ from that presented for other Columbia Funds.
Equity securities are subject to stock market fluctuations that occur in response to economic and business developments.
International investing involves special risks, including foreign taxation, currency risks, risks associated with possible differences in financial standards and other risks associated with future political and economic developments.
Investing in emerging markets may involve greater risks than investing in more developed countries. In addition, concentration of investments in a single region may result in greater volatility.
42
Fund Profile – Columbia International Growth Fund
Summary
| n | | For the 12-month period that ended March 31, 2010, the fund’s Class A shares returned 46.30% without sales charge. |
| n | | The fund’s benchmark, the MSCI EAFE Growth Index1 returned 50.61%. The average return of the fund’s peer group, the Lipper International Large-Cap Growth Funds Classification2 was 53.47%. |
| n | | The fund’s defensive positioning accounted for its performance shortfall relative to its benchmark, as stocks that were levered to an economic recovery produced the strongest returns. |
Portfolio Management
Fred Copper, lead manager, has co-managed the fund since 2007 and has been associated with the advisor or its predecessors since 2005.
Jasmine (Weili) Huang has co-managed the fund since 2008 and has been associated with the advisor or its predecessors since 2003.
Daisuke Nomoto has co-managed the fund since 2008 and has been associated with the advisor or its predecessors since 2005.
Paul J. DiGiacomo has co-managed the fund since 2008 and has been associated with the advisor or its predecessors since 2006.
Effective May 1, 2010, Jasmine (Weili) Huang, Daisuke Nomoto and Paul J. DiGiacomo no longer co-managed the fund.
Effective May 1, 2010, RiverSource Investments, LLC, a subsidiary of Ameriprise Financial, Inc., became the investment advisor to the fund and changed its name to Columbia Management Investment Advisers, LLC. Please see the fund’s prospectus, as supplemented, for more information regarding the change in investment advisor and certain other changes.
| 1 | The Morgan Stanley Capital International Europe, Australasia, Far East (MSCI EAFE) Growth Index is a subset of the MSCI EAFE Index, and constituents of the index include securities from Europe, Australasia and the Far East. The index generally represents approximately 50% of the free float-adjusted market capitalization of the MSCI EAFE Index, and consists of those securities classified by Morgan Stanley Capital International, Inc. (MSCI) as most representing the growth style, such as higher forecasted growth rates, lower book value-to-price ratios, lower forward earnings-to-price ratios and lower dividend yields than securities representing the value style. Indices are not available for investment, are not professionally managed and do not reflect sales charges, fees, brokerage commissions, taxes or other expenses of investing. Securities in the fund may not match those in an index. |
| 2 | Lipper Inc., a widely respected data provider in the industry, calculates an average total return (assuming reinvestment of distributions) for mutual funds with investment objectives similar to those of the fund. Lipper makes no adjustment for the effect of sales loads. |
Performance data quoted represents past performance and current performance may be lower or higher. Past performance is no guarantee of future results. The investment return and principal value will fluctuate so that shares, when redeemed, may be worth more or less than the original cost. Please visit www.columbiafunds.com for daily and most recent month-end performance updates.
Summary
1-year return as of 03/31/10
| | |
| |
| | +46.30% Class A shares
(without sales charge) |
| |
| | +50.61% MSCI EAFE Growth Index |
|
Morningstar Style BoxTM |
|
Equity Style |
|
The Morningstar Style BoxTM reveals a fund’s investment strategy. For equity funds, the vertical axis shows the market capitalization of the stocks owned, and the horizontal axis shows investment style (value, blend or growth). Information shown is based on the most recent data provided by Morningstar.
43
Performance Information – Columbia International Growth Fund
Performance data quoted represents past performance and current performance may be lower or higher. Past performance is no guarantee of future results. The investment return and principal value will fluctuate so that shares, when redeemed, may be worth more or less than the original cost. Please visit www.columbiafunds.com for daily and most recent month-end performance updates.
| | |
| Annual operating expense ratio (%)* |
| |
Class A | | 1.56 |
Class C | | 2.31 |
Class Z | | 1.31 |
| * | The annual operating expense ratio is as stated in the fund’s prospectus that is current as of the date of this report and includes the expenses incurred by the investment companies in which the fund invests. Differences in expense ratios disclosed elsewhere in this report may result from including expenses incurred by the investment companies, fee waivers and expense reimbursements as well as the use of different time periods used in calculating the ratios. |
| | |
| Performance of a $10,000 investment 04/01/00 – 03/31/10 |

The chart above shows the change in value of a hypothetical $10,000 investment in Class A shares of Columbia International Growth Fund during the stated time period, and does not reflect the deduction of taxes that a shareholder may pay on fund distributions or on the redemption of fund shares.
| | | | |
| Performance of a $10,000 investment 04/01/00 – 03/31/10 ($) |
| | |
| Sales charge | | without | | with |
Class A | | 8,176 | | 7,707 |
Class C | | 8,055 | | 8,055 |
Class Z | | 8,233 | | n/a |
| | | | | | | | | | |
| Average annual total return as of 03/31/10 (%) |
| | | |
| Share class | | A | | C | | Z |
| Inception | | 03/31/08 | | 03/31/08 | | 07/21/87 |
| Sales charge | | without | | with | | without | | with | | without |
1-year | | 46.30 | | 37.89 | | 45.23 | | 44.23 | | 47.00 |
5-year | | 2.26 | | 1.05 | | 1.96 | | 1.96 | | 2.40 |
10-year | | –1.99 | | –2.57 | | –2.14 | | –2.14 | | –1.93 |
The “with sales charge” returns include the maximum initial sales charge of 5.75% for Class A shares and the applicable contingent deferred sales charge of 1.00% for Class C shares for the first year only. The “without sales charge” returns do not include the effect of sales charges. If they had, returns would be lower.
The Fund commenced operations on March 31, 2008. The returns of the Class A and Class C shares shown for periods prior to March 31, 2008 are those of the Shares class shares of International Fund, the predecessor to the Fund and a series of Excelsior Funds, Inc. (the “Predecessor Fund”). The returns shown reflect applicable sales charges, but have not been adjusted to reflect differences in expenses. If differences in expenses were reflected, the returns shown for the periods prior to March 31, 2008 would be lower. The returns of the Class Z shares shown for periods prior to March 31, 2008 are those of the Shares class shares of the Predecessor Fund. The returns of Class Z shown have not been adjusted to reflect differences in expenses.
Inception date refers to the date on which the Fund class commenced operations for Classes A and C and the date on which the Predecessor Fund class commenced operations for Class Z.
Performance results reflect any fee waivers or reimbursements of fund expenses by the investment advisor and/or any of its affiliates. Absent these fee waivers or expense reimbursement arrangements, performance results would have been lower.
All results shown assume reinvestment of distributions. Class Z shares are sold at net asset value with no distribution and service (Rule 12b-1) fees. Class Z shares have limited eligibility and the investment minimum requirements may vary. Please see the fund’s prospectus for details. Performance for different share classes will vary based on differences in sales charges and fees associated with each class.
The tables do not reflect the deduction of taxes that a shareholder may pay on fund distributions or on the redemption of fund shares.
44
Understanding Your Expenses – Columbia International Growth Fund
As a fund shareholder, you incur two types of costs. There are transaction costs, which generally include sales charges on purchases and may include redemption fees or exchange fees. There are also ongoing costs, which generally include investment advisory fees, distribution and service (Rule 12b-1) fees and other fund expenses. The information on this page is intended to help you understand the ongoing costs of investing in the fund and to compare these costs with the ongoing costs of investing in other mutual funds.
Analyzing your fund’s expenses by share class
To illustrate these ongoing costs, we have provided an example and calculated the expenses paid by investors in each share class during the period. The information in the following table is based on an initial investment of $1,000, which is invested at the beginning of the period and held for the entire period. Expense information is calculated two ways and each method provides you with different information. The amount listed in the “Actual” column is calculated using the fund’s actual operating expenses and total return for the period. The amount listed in the “Hypothetical” column for each share class assumes that the return each year is 5% before expenses and is calculated based on the fund’s actual operating expenses. You should not use the hypothetical account values and expenses to estimate either your actual account balance at the end of the period or the expenses you paid during this period.
Compare with other funds
Since all mutual funds are required to include the same hypothetical calculations about expenses in shareholder reports, you can use this information to compare the ongoing cost of investing in the fund with other funds. To do so, compare the 5% hypothetical example with the 5% hypothetical examples that appear in the shareholder reports of other funds. As you compare hypothetical examples of other funds, it is important to note that hypothetical examples are meant to highlight the ongoing costs of investing in a fund and do not reflect any transaction costs, such as sales charges, redemption fees or exchange fees.
Estimating your actual expenses
To estimate the expenses that you paid over the period, first you will need your account balance at the end of the period:
| | n | | For shareholders who receive their account statements from Columbia Management Services, Inc., your account balance is available online at www.columbiafunds.com or by calling Shareholder Services at 800.345.6611. | |
| | n | | For shareholders who receive their account statements from their financial intermediary, contact your financial intermediary to obtain your account balance. | |
| | 1. | Divide your ending account balance by $1,000. For example, if an account balance was $8,600 at the end of the period, the result would be 8.6. | |
| | 2. | In the section of the table below titled “Expenses paid during the period,” locate the amount for your share class. You will find this number in the column labeled “Actual.” Multiply this number by the result from step 1. Your answer is an estimate of the expenses you paid on your account during the period. | |
If the value of your account falls below the minimum initial investment requirement applicable to you, your account generally will be subject to a $20 annual fee. This fee is not included in the accompanying table. If you are subject to the fee, keep it in mind when you are estimating the ongoing expenses of investing in the fund and when comparing the expenses of this fund with other funds.
| | | | | | | | | | | | | | |
| 10/01/09 – 03/31/10 | | | | | | | | | | |
| | | | |
| | | Account value at the
beginning of the period ($) | | Account value at the
end of the period ($) | | Expenses paid
during the period ($) | | Fund’s annualized
expense ratio (%) |
| | | Actual | | Hypothetical | | Actual | | Hypothetical | | Actual | | Hypothetical | | Actual |
Class A | | 1,000.00 | | 1,000.00 | | 1,063.90 | | 1,017.95 | | 7.20 | | 7.04 | | 1.40 |
Class C | | 1,000.00 | | 1,000.00 | | 1,060.10 | | 1,014.21 | | 11.04 | | 10.80 | | 2.15 |
Class Z | | 1,000.00 | | 1,000.00 | | 1,067.90 | | 1,019.20 | | 5.93 | | 5.79 | | 1.15 |
Expenses paid during the period are equal to the annualized expense ratio for the share class, multiplied by the average account value over the period, then multiplied by the number of days in the fund’s most recent fiscal half-year and divided by 365.
Had the investment advisor and/or any of its affiliates not waived fees or reimbursed a portion of expenses, account value at the end of the period would have been reduced.
It is important to note that the expense amounts shown in the table are meant to highlight only ongoing costs of investing in the fund and do not reflect any transaction costs, such as sales charges, redemption fees or exchange fees. Therefore, the hypothetical examples provided may not help you determine the relative total costs of owning shares of different funds. If these transaction costs were included, your costs would have been higher.
45
Portfolio Managers’ Report – Columbia International Growth Fund
Performance data quoted represents past performance and current performance may be lower or higher. Past performance is no guarantee of future results. The investment return and principal value will fluctuate so that shares, when redeemed, may be worth more or less than the original cost. Please visit www.columbiafunds.com for daily and most recent month-end performance updates.
| | |
| Net asset value per share |
| |
as of 03/31/10 ($) | | |
Class A | | 13.32 |
Class C | | 13.23 |
Class Z | | 13.37 |
| | |
| Distributions declared per share |
| |
04/01/09 – 03/31/10 ($) | | |
Class A | | 0.09 |
Class Z | | 0.12 |
For the 12-month period that ended March 31, 2010, the fund’s Class A shares returned 46.30% without sales charge. The fund’s return was less than the return of its benchmark, the MSCI EAFE Growth Index, which was 50.61% for the same period. The fund underperformed the average return of its peer group, the Lipper International Large-Cap Growth Funds Classification, which was 53.47%. While the fund produced a strong absolute return, its performance relative to its benchmark was disappointing. The fund was positioned defensively, which hampered performance. Defensive stocks were helpful during the market sell-off of 2008, but they held back return when global equity markets rose in anticipation of a return to economic growth in 2009 and 2010.
On March 12, 2010, the fund’s management team changed. Fred Copper became lead manager, with co-managers Jasmine (Weili) Huang, Daisuke Nomoto and Paul J. DiGiacomo.
An out-of-index weight in China aided performance
The fund’s investments in China, which is not included in the fund’s benchmark, benefited performance for the period. We began building a position in China because we believed it would likely be a leader during the early stages of the global economic recovery. For decades, China’s growth has been driven by exports, infrastructure investment and consumption. Of the three, the growth of consumption’s contribution to gross domestic product (GDP) has lagged. Now, the government is seeking to achieve more sustained and balanced economic growth among these three drivers by promoting consumption. To do so, the government is promoting service industries, such as information technology, which is still in its infancy in China. Traditionally, companies viewed investments in capital spending and labor as a means to generate profits. Going forward, we believe that more companies will begin to see the potential for technology to improve productivity as a means to raise profits. To take advantage of this change in policy, we favored technology stocks such as Tencent Holdings, China’s biggest online service provider (1.1% of net assets). The stock made a significant positive contribution to the fund’s relative return.
Financial stocks were leaders
Because financial stocks tend to outperform in the early stage of an economic recovery, when interest rates are relatively low, we increased the fund’s exposure to financials that we believed would do well in an economic recovery. Hongkong Land Holdings (0.8% of net assets), a property manager in Hong Kong, which benefited from a rising real estate market, was a notable performer. Among banks, Banco Santander (1.0% of net assets) made a strong showing. Banco Bilbao Vizcaya Argentaria also had a positive impact on return. We took profits and sold the stock before the end of the period.
Increasing exposure to Japan
Japan’s stock market did not keep pace with the relatively large run-ups in other markets, partly because Japan derives much of its business revenues from exports, and a strong yen hurt exports during the period. However, we believe that Japan is positioned to do well as the global economy recovers. Stock valuations remain
46
Portfolio Managers’ Report (continued) – Columbia International Growth Fund
attractive, and the country has a new finance minister who may implement a weaker yen policy. During the period, we added Nissan Motor Co. and Honda Motor Co. (0.8% and 1.3% of net assets, respectively) to the portfolio. We believe that both have the potential to do well in an improving global economic environment.
Defensive stocks disappointed
As investors shifted their focus to companies and sectors linked to economic recovery, defensive stocks detracted from results. Japan-based FamilyMart, a convenience store operator, and Toyo Seikan Kaisha, a manufacturer of plastic bottles and cans, were two such disappointments. We sold both stocks.
A positive outlook
We are positive in our outlook for global stock markets. Economic conditions are improving, and we believe stocks are reasonably valued even though valuations are not as compelling as they were a year ago. There is a substantial amount of money in cash accounts earning virtually no interest, and investors may become more confident about putting this money to work in stocks as economic conditions strengthen.
Portfolio characteristics and holdings are subject to change periodically and may not be representative of current characteristics and holdings. The outlook for the fund may differ from that presented for other Columbia Funds.
Equity securities are subject to stock market fluctuations that occur in response to economic and business developments.
International investing involves special risks, including foreign taxation, currency risks, risks associated with possible differences in financial standards and other risks associated with future political and economic developments.
Investing in emerging markets may involve greater risks than investing in more developed countries. In addition, concentration of investments in a single region may result in greater volatility.
| | |
| Top countries | | |
| |
as of 03/31/10 (%) | | |
Japan | | 22.2 |
United Kingdom | | 20.6 |
Switzerland | | 11.0 |
Netherlands | | 6.0 |
Australia | | 5.5 |
| | |
| Top 10 holdings | | |
| |
as of 03/31/10 (%) | | |
BHP Billiton | | 4.2 |
Nestle SA | | 2.5 |
Rio Tinto | | 2.4 |
Roche Holding AG | | 2.1 |
Standard Chartered | | 1.8 |
Unilever NV | | 1.6 |
Anglo American | | 1.6 |
Novartis AG | | 1.5 |
Koninklijke Ahold NV | | 1.4 |
Eurasian Natural Resources | | 1.3 |
The fund is actively managed and the composition of its portfolio will change over time. Information provided is calculated as a percentage of net assets.
47
Fund Profile – Columbia Pacific/Asia Fund
Performance data quoted represents past performance and current performance may be lower or higher. Past performance is no guarantee of future results. The investment return and principal value will fluctuate so that shares, when redeemed, may be worth more or less than the original cost. Please visit www.columbiafunds.com for daily and most recent month-end performance updates.
Summary
1-year return as of 03/31/10
| | |
| | +59.07% Class A shares (without sales charge) |
| | +57.95% MSCI All Country Asia Pacific Index (Net) |
| | +58.24% MSCI All Country Asia Pacific Index (Gross) |
| | +54.44% MSCI EAFE Index |
|
Morningstar Style Box™ |
|
Equity Style |
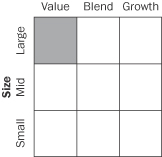
|
The Morningstar Style BoxTM reveals a fund’s investment strategy. For equity funds, the vertical axis shows the market capitalization of the stocks owned, and the horizontal axis shows investment style (value, blend or growth). Information shown is based on the most recent data provided by Morningstar.
Summary
| n | | For the 12-month period that ended March 31, 2010, the fund’s Class A shares returned 59.07% without sales charge. |
| n | | The MSCI All Country Asia Pacific Index1 (Net) returned 57.95%, and the MSCI EAFE Index2 returned 54.44%. The average return of the fund’s peer group, the Lipper Pacific Region Funds Classification3, was 61.54%. |
| n | | Stock selection in the financials and industrials sectors accounted for outperformance relative to the fund’s benchmarks. Country allocation, particularly overweights in Singapore and Thailand, also aided relative performance. |
Portfolio Management
Fred Copper has co-managed the fund since 2008 and has been associated with the advisor or its predecessors since 2005.
Daisuke Nomoto has co-managed the fund since 2008 and has been associated with the advisor or its predecessors since 2005.
Jasmine (Weili) Huang has co-managed the fund since 2008 and has been associated with the advisor or its predecessors since 2003.
Effective May 1, 2010, Fred Copper no longer co-managed the fund.
Effective May 1, 2010, RiverSource Investments, LLC, a subsidiary of Ameriprise Financial, Inc., became the investment advisor to the fund and changed its name to Columbia Management Investment Advisers, LLC. Please see the fund’s prospectus, as supplemented, for more information regarding the change in investment advisor and certain other changes.
| 1 | The Morgan Stanley Capital International (MSCI) All Country (AC) Asia Pacific Free Index tracks the performance of stock traded on stock exchanges in Pacific Basin countries, including Australia, China, Hong Kong, Indonesia, Japan, Korea, Malaysia, New Zealand, Philippines, Singapore, Taiwan, and Thailand. |
| 2 | The Morgan Stanley Capital International Europe, Australasia, Far East (MSCI EAFE) Index is a capitalization-weighted index that tracks the total return of common stocks in 21 developed-market countries within Europe, Australasia and the Far East. |
| | Indices are not available for investment, are not professionally managed and do not reflect sales charges, fees, brokerage commissions, taxes or other expenses of investing. Securities in the fund may not match those in an index. |
| 3 | Lipper Inc., a widely respected data provider in the industry, calculates an average total return (assuming reinvestment of distributions) for mutual funds with investment objectives similar to those of the fund. Lipper makes no adjustment for the effect of sales loads. |
48
Performance Information – Columbia Pacific/Asia Fund
| | | | |
| Performance of a $10,000 investment 04/01/00 – 03/31/10 |
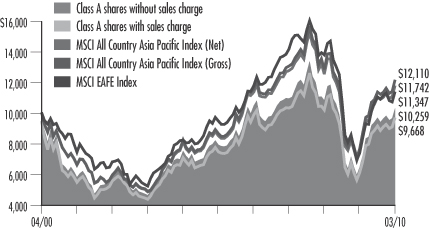
The chart above shows the change in value of a hypothetical $10,000 investment in Class A shares of Columbia Pacific/Asia Fund during the stated time period, and does not reflect the deduction of taxes that a shareholder may pay on fund distributions or on the redemption of fund shares.
| | | | |
| Performance of a $10,000 investment 04/01/00 – 03/31/10 ($) |
| | |
| Sales charge | | without | | with |
Class A | | 10,259 | | 9,668 |
Class C | | 10,120 | | 10,120 |
Class Z | | 10,354 | | n/a |
| | | | | | | | | | |
| Average annual total return as of 03/31/10 (%) |
| | | |
| Share class | | A | | C | | Z |
| Inception | | 03/31/08 | | 03/31/08 | | 12/31/92 |
| Sales charge | | without | | with | | without | | with | | without |
1-year | | 59.07 | | 50.04 | | 58.16 | | 57.16 | | 60.22 |
5-year | | 5.38 | | 4.14 | | 5.09 | | 5.09 | | 5.57 |
10-year | | 0.26 | | –0.34 | | 0.12 | | 0.12 | | 0.35 |
Performance data quoted represents past performance and current performance may be lower or higher. Past performance is no guarantee of future results. The investment return and principal value will fluctuate so that shares, when redeemed, may be worth more or less than the original cost. Please visit www.columbiafunds.com for daily and most recent month-end performance updates.
| | |
| Annual operating expense ratio (%)* |
| |
Class A | | 1.81 |
Class C | | 2.56 |
Class Z | | 1.56 |
| * | The annual operating expense ratio is as stated in the fund’s prospectus that is current as of the date of this report and includes the expenses incurred by the investment companies in which the fund invests. Differences in expense ratios disclosed elsewhere in this report may result from including expenses incurred by the investment companies, fee waivers and expense reimbursements as well as the use of different time periods used in calculating the ratios. |
The “with sales charge” returns include the maximum initial sales charge of 5.75% for Class A shares and the applicable contingent deferred sales charge of 1.00% for Class C shares for the first year only. The “without sales charge” returns do not include the effect of sales charges. If they had, returns would be lower.
The Fund commenced operations on March 31, 2008. The returns of the Class A and Class C shares shown for periods prior to March 31, 2008 are those of the Shares class shares of Pacific/Asia Fund, the predecessor to the Fund and a series of Excelsior Funds, Inc. (the “Predecessor Fund”). The returns shown reflect applicable sales charges, but have not been adjusted to reflect differences in expenses. If differences in expenses were reflected, the returns shown for the periods prior to March 31, 2008 would be lower. The returns of the Class Z shares shown for periods prior to March 31, 2008 are those of the Shares class shares of the Predecessor Fund. The returns shown reflect that Class Z shares are sold without sales charges, but have not been adjusted to reflect differences in expenses. The inception of the predecessor fund is December 31, 1992.
Inception date refers to the date on which the Fund class commenced operations for Classes A and C and the date on which the Predecessor Fund class commenced operations for Class Z.
Performance results reflect any fee waivers or reimbursements of fund expenses by the investment advisor and/or any of its affiliates. Absent these fee waivers or expense reimbursement arrangements, performance results would have been lower.
All results shown assume reinvestment of distributions. Class Z shares are sold at net asset value with no distribution and service (Rule 12b-1) fees. Class Z shares have limited eligibility and the investment minimum requirements may vary. Please see the fund’s prospectus for details. Performance for different share classes will vary based on differences in sales charges and fees associated with each class.
The tables do not reflect the deduction of taxes that a shareholder may pay on fund distributions or on the redemption of fund shares.
49
Understanding Your Expenses – Columbia Pacific/Asia Fund
Estimating your actual expenses
To estimate the expenses that you paid over the period, first you will need your account balance at the end of the period:
| | n | | For shareholders who receive their account statements from Columbia Management Services, Inc., your account balance is available online at www.columbiafunds.com or by calling Shareholder Services at 800.345.6611. | |
| | n | | For shareholders who receive their account statements from their financial intermediary, contact your financial intermediary to obtain your account balance. | |
| | 1. | Divide your ending account balance by $1,000. For example, if an account balance was $8,600 at the end of the period, the result would be 8.6. | |
| | 2. | In the section of the table below titled “Expenses paid during the period,” locate the amount for your share class. You will find this number in the column labeled “Actual.” Multiply this number by the result from step 1. Your answer is an estimate of the expenses you paid on your account during the period. | |
If the value of your account falls below the minimum initial investment requirement applicable to you, your account generally will be subject to a $20 annual fee. This fee is not included in the accompanying table. If you are subject to the fee, keep it in mind when you are estimating the ongoing expenses of investing in the fund and when comparing the expenses of this fund with other funds.
As a fund shareholder, you incur two types of costs. There are transaction costs, which generally include sales charges on purchases and may include redemption fees or exchange fees. There are also ongoing costs, which generally include investment advisory fees, distribution and service (Rule 12b-1) fees and other fund expenses. The information on this page is intended to help you understand the ongoing costs of investing in the fund and to compare these costs with the ongoing costs of investing in other mutual funds.
Analyzing your fund’s expenses by share class
To illustrate these ongoing costs, we have provided an example and calculated the expenses paid by investors in each share class during the period. The information in the following table is based on an initial investment of $1,000 which is invested at the beginning of the period and held for the entire period. Expense information is calculated two ways and each method provides you with different information. The amount listed in the “Actual” column is calculated using the fund’s actual operating expenses and total return for the period. The amount listed in the “Hypothetical” column for each share class assumes that the return each year is 5% before expenses and is calculated based on the fund’s actual operating expenses. You should not use the hypothetical account values and expenses to estimate either your actual account balance at the end of the period or the expenses you paid during this period.
Compare with other funds
Since all mutual funds are required to include the same hypothetical calculations about expenses in shareholder reports, you can use this information to compare the ongoing costs of investing in the fund with other funds. To do so, compare the 5% hypothetical example with the 5% hypothetical examples that appear in the shareholder reports of other funds. As you compare hypothetical examples of other funds, it is important to note that hypothetical examples are meant to highlight the ongoing costs of investing in a fund and do not reflect any transaction costs, such as sales charges, redemption fees or exchange fees.
| | | | | | | | | | | | | | |
| 10/01/09 – 03/31/10 | | | | | | | | | | |
| | | | |
| | | Account value at the
beginning of the period ($) | | Account value at the
end of the period ($) | | Expenses paid
during the period ($) | | Fund’s annualized
expense ratio (%) |
| | | Actual | | Hypothetical | | Actual | | Hypothetical | | Actual | | Hypothetical | | Actual |
Class A | | 1,000.00 | | 1,000.00 | | 1,061.10 | | 1,016.70 | | 8.48 | | 8.30 | | 1.65 |
Class C | | 1,000.00 | | 1,000.00 | | 1,058.80 | | 1,012.96 | | 12.32 | | 12.04 | | 2.40 |
Class Z | | 1,000.00 | | 1,000.00 | | 1,066.60 | | 1,017.95 | | 7.21 | | 7.04 | | 1.40 |
Expenses paid during the period are equal to the annualized expense ratio for the share class, multiplied by the average account value over the period, then multiplied by the number of days in the fund’s most recent fiscal half-year and divided by 365.
Had the investment advisor and/or any of its affiliates not waived fees or reimbursed a portion of expenses, account value at the end of the period would have been reduced.
It is important to note that the expense amounts shown in the table are meant to highlight only ongoing costs of investing in the fund and do not reflect any transaction costs, such as sales charges, redemption fees or exchange fees. Therefore, the hypothetical examples provided may not help you determine the relative total costs of owning shares of different funds. If these transaction costs were included, your costs would have been higher.
50
Portfolio Managers’ Report – Columbia Pacific/Asia Fund
For the 12-month period that ended March 31, 2010, the fund’s Class A shares returned 59.07% without sales charge. The fund outperformed the MSCI All Country Asia Pacific Index (Net), which returned 57.95%. The fund also outperformed the MSCI EAFE Index, which returned 54.44% for the same period. Fund performance was just short of the average return of its peer group, the Lipper Pacific Region Funds Classification, which was 61.54%. Stock selection in the financials and industrials sectors was the main driver of positive return relative to the fund’s benchmarks. Country allocation, particularly overweights in Singapore and Thailand, also aided relative returns.
Positioned for recovery
When it appeared that the global economy was poised for recovery, we began rotating out of defensive companies and into those that we believe have the potential to benefit from improved economic conditions. We favored financial companies, which typically do well early in an economic rebound when interest rates are relatively low. LIC Housing Finance (0.7% of net assets), a mortgage lender in India, was a particularly noteworthy performer. The mortgage market in India is underdeveloped, and we believe that demand for LIC’s products and services will increase as the middle class and home ownership grow. Industrials stocks also tend to improve early in a recovery, and Australia-based Macmahon Holdings (0.9% of net assets), a contract engineering company with substantial business in the mining industry, was one of the strongest performers relative to the benchmarks. The company benefited from increased global demand for raw materials.
Rising exports buoyed stocks in Singapore and Thailand
Proximity to China drove Singapore’s stock market higher during the period. Singapore is a major provider of goods to China, which had one of the largest economic stimulus programs in the world. The robust run-up of Singapore’s stock market mirrored China’s recovery from recession. Keppel, a designer of ships and rigs for offshore oil exploration, is an example of a holding that substantially aided results. We took profits in the stock.
While Thailand had no direct exposure to the financial problems that affected other Asian countries, it suffered from a general sell-off in global stocks in 2009 and from a decline in exports during the recent recession, especially to Asia. As Asia recovered, Thailand’s stock market produced solid gains. The portfolio’s holding in Bangkok Bank (0.9% of net assets) had a positive impact on relative return.
Defensive consumer stocks disappointed
Some conservative consumer stocks failed to keep pace with companies that were levered to an economic turnaround, including Autobacs Seven, a Japanese auto parts retailer; China Milk Products Group (0.8% and 0.2% of net assets, respectively) and Benesse, a Japanese publisher. We sold Benesse. China Milk Products Group did poorly because of concerns about its ability to pay its debts and a high-level management change.
Performance data quoted represents past performance and current performance may be lower or higher. Past performance is no guarantee of future results. The investment return and principal value will fluctuate so that shares, when redeemed, may be worth more or less than the original cost. Please visit www.columbiafunds.com for daily and most recent month-end performance updates.
| | |
| Net asset value per share |
| |
as of 03/31/10 ($) | | |
Class A | | 7.64 |
Class C | | 7.56 |
Class Z | | 7.69 |
| | |
| Distributions declared per share |
| |
04/01/09 – 03/31/10 ($) | | |
Class A | | 0.02 |
Class Z | | 0.04 |
51
Portfolio Managers’ Report (continued) – Columbia Pacific/Asia Fund
| | |
| Top countries |
| |
as of 03/31/10 (%) | | |
Japan | | 41.4 |
China | | 12.6 |
Australia | | 11.6 |
Taiwan | | 9.5 |
Republic of Korea | | 7.6 |
| | |
| Top 10 holdings |
| |
as of 03/31/10 (%) | | |
BHP Billilton | | 2.6 |
Samsung Electronics | | 2.4 |
Westpac Banking | | 2.0 |
Commonwealth Bank of Australia | | 1.9 |
Canon | | 1.7 |
Toyota Motor | | 1.5 |
Bank of China | | 1.5 |
ITOCHU | | 1.4 |
Nintendo | | 1.4 |
DBS Group Holdings | | 1.3 |
The fund is actively managed and the composition of its portfolio will change over time. Information provided is calculated as a percentage of net assets.
Building a position in Japan
Japan’s stock market did not keep pace with the relatively large run-ups in other markets, partly because Japan derives much of its business revenues from exports, and a strong yen hurt exports during the period. However, we believe that Japan is positioned to do well as the global economy recovers. Stock valuations remain attractive, and the country has a new finance minister, who may implement a weaker yen policy. With these factors in mind, we added Nissan Motor Co. and Honda Motor Co. to the portfolio (1.2% and 1.3% of net assets, respectively). We believe that both companies have the potential to benefit from an improved global economy.
A positive outlook
We are positive in our outlook for global stock markets. Economic conditions are improving; and we believe stocks are reasonably valued, even though valuations are not as compelling as they were a year ago. There is a substantial amount of money in cash accounts earning virtually no interest, and investors may become more confident about putting this money to work in stocks as economic conditions strengthen.
Portfolio characteristics and holdings are subject to change periodically and may not be representative of current characteristics and holdings. The outlook for the fund may differ from that presented for other Columbia Funds.
Equity securities are subject to stock market fluctuations that occur in response to economic and business developments.
International investing involves special risks, including foreign taxation, currency risks, risks associated with possible differences in financial standards and other risks associated with future political and economic developments.
Investing in emerging markets may involve greater risks than investing in more developed countries. In addition, concentration of investments in a single region may result in greater volatility.
52
Investment Portfolio – Columbia Blended Equity Fund
March 31, 2010
Common Stocks – 100.0%
| | | | |
| | | Shares | | Value ($) |
| Consumer Discretionary – 9.9% | | | | |
| Automobiles – 0.2% | | |
Ford Motor Co. (a) | | 28,300 | | 355,731 |
| | | | |
Automobiles Total | | 355,731 |
| |
| Hotels, Restaurants & Leisure – 0.5% | | |
International Game Technology | | 400 | | 7,380 |
Starwood Hotels & Resorts Worldwide, Inc. | | 15,073 | | 703,005 |
| | | | |
Hotels, Restaurants & Leisure Total | | 710,385 |
| |
| Internet & Catalog Retail – 0.9% | | |
Amazon.com, Inc. (a) | | 9,605 | | 1,303,686 |
| | | | |
Internet & Catalog Retail Total | | 1,303,686 |
| |
| Media – 2.3% | | |
DIRECTV, Class A (a) | | 25,120 | | 849,307 |
DISH Network Corp., Class A | | 19,570 | | 407,447 |
Gannett Co., Inc. | | 7,000 | | 115,640 |
Interpublic Group of Companies, Inc. (a) | | 1,155 | | 9,610 |
News Corp., Class A | | 55,393 | | 798,213 |
Viacom, Inc., Class B (a) | | 35,078 | | 1,205,982 |
| | | | |
Media Total | | 3,386,199 |
| |
| Multiline Retail – 4.7% | | |
Target Corp. | | 135,240 | | 7,113,624 |
| | | | |
Multiline Retail Total | | 7,113,624 |
| |
| Specialty Retail – 0.8% | | |
Lowe’s Companies, Inc. | | 52,470 | | 1,271,873 |
| | | | |
Specialty Retail Total | | 1,271,873 |
| |
| Textiles, Apparel & Luxury Goods – 0.5% | | |
Hanesbrands, Inc. (a) | | 25,877 | | 719,898 |
| | | | |
Textiles, Apparel & Luxury Goods Total | | 719,898 |
| | | | |
Consumer Discretionary Total | | | | 14,861,396 |
| | | | |
| Consumer Staples – 12.5% | | |
| Beverages – 1.7% | | |
Diageo PLC, ADR | | 16,900 | | 1,139,905 |
PepsiCo, Inc. | | 20,783 | | 1,375,003 |
| | | | |
Beverages Total | | 2,514,908 |
| |
| Food & Staples Retailing – 3.7% | | |
Wal-Mart Stores, Inc. | | 99,560 | | 5,535,536 |
| | | | |
Food & Staples Retailing Total | | 5,535,536 |
| |
| Food Products – 1.2% | | |
Kraft Foods, Inc., Class A | | 61,036 | | 1,845,729 |
| | | | |
Food Products Total | | 1,845,729 |
| | | | |
| | | Shares | | Value ($) |
| Household Products – 1.9% | | |
Clorox Co. | | 12,310 | | 789,563 |
Procter & Gamble Co. | | 33,436 | | 2,115,496 |
| | | | |
Household Products Total | | 2,905,059 |
| |
| Personal Products – 0.9% | | |
Avon Products, Inc. | | 38,210 | | 1,294,173 |
| | | | |
Personal Products Total | | 1,294,173 |
| |
| Tobacco – 3.1% | | |
Philip Morris International, Inc. | | 88,120 | | 4,596,339 |
| | | | |
Tobacco Total | | 4,596,339 |
| | | | |
Consumer Staples Total | | | | 18,691,744 |
| | | | |
| Energy – 10.0% | | |
| Energy Equipment & Services – 0.8% | | |
Baker Hughes, Inc. | | 600 | | 28,104 |
Halliburton Co. | | 25,950 | | 781,873 |
Nabors Industries Ltd. (a) | | 1,000 | | 19,630 |
Rowan Companies, Inc. (a) | | 8,500 | | 247,435 |
Smith International, Inc. | | 4,000 | | 171,280 |
| | | | |
Energy Equipment & Services Total | | 1,248,322 |
| |
| Oil, Gas & Consumable Fuels – 9.2% | | |
Alpha Natural Resources, Inc. (a) | | 11,738 | | 585,609 |
Apache Corp. | | 16,370 | | 1,661,555 |
Cabot Oil & Gas Corp. | | 12,593 | | 463,422 |
Chevron Corp. | | 37,031 | | 2,808,061 |
ConocoPhillips | | 7,900 | | 404,243 |
Denbury Resources, Inc. (a) | | 10,100 | | 170,387 |
Exxon Mobil Corp. | | 67,413 | | 4,515,323 |
Occidental Petroleum Corp. | | 18,521 | | 1,565,765 |
Royal Dutch Shell PLC, ADR | | 12,100 | | 700,106 |
Southwestern Energy Co. (a) | | 10,979 | | 447,065 |
XTO Energy, Inc. | | 8,700 | | 410,466 |
| | | | |
Oil, Gas & Consumable Fuels Total | | 13,732,002 |
| | | | |
Energy Total | | | | 14,980,324 |
| | | | |
| Financials – 18.6% | | |
| Capital Markets – 5.2% | | |
Ameriprise Financial, Inc. | | 8,920 | | 404,611 |
Bank of New York Mellon Corp. | | 23,088 | | 712,958 |
Franklin Resources, Inc. | | 7,424 | | 823,322 |
Goldman Sachs Group, Inc. | | 15,370 | | 2,622,583 |
State Street Corp. | | 72,900 | | 3,290,706 |
| | | | |
Capital Markets Total | | 7,854,180 |
| |
| Commercial Banks – 7.2% | | |
Comerica, Inc. | | 33,300 | | 1,266,732 |
Fifth Third Bancorp. | | 75,473 | | 1,025,678 |
See Accompanying Notes to Financial Statements.
53
Columbia Blended Equity Fund
March 31, 2010
Common Stocks (continued)
| | | | |
| | | Shares | | Value ($) |
| Financials (continued) | | |
| Commercial Banks (continued) | | |
PNC Financial Services Group, Inc. | | 39,112 | | 2,334,986 |
SunTrust Banks, Inc. | | 71,000 | | 1,902,090 |
U.S. Bancorp | | 46,188 | | 1,195,346 |
Wells Fargo & Co. | | 98,031 | | 3,050,725 |
| | | | |
Commercial Banks Total | | 10,775,557 |
| |
| Consumer Finance – 0.4% | | |
American Express Co. | | 1,100 | | 45,386 |
Discover Financial Services | | 37,177 | | 553,937 |
| | | | |
Consumer Finance Total | | 599,323 |
| |
| Diversified Financial Services – 2.6% | | |
Citigroup, Inc. (a) | | 292,700 | | 1,185,435 |
JPMorgan Chase & Co. | | 59,920 | | 2,681,420 |
| | | | |
Diversified Financial Services Total | | 3,866,855 |
| |
| Insurance – 2.5% | | |
Hartford Financial Services Group, Inc. | | 6,300 | | 179,046 |
Lincoln National Corp. | | 36,600 | | 1,123,620 |
Prudential Financial, Inc. | | 22,310 | | 1,349,755 |
Unum Group | | 28,512 | | 706,242 |
XL Capital Ltd., Class A | | 22,730 | | 429,597 |
| | | | |
Insurance Total | | 3,788,260 |
|
| Real Estate Investment Trusts (REITs) – 0.7% |
Host Hotels & Resorts, Inc. | | 22,000 | | 322,300 |
Kimco Realty Corp. | | 46,000 | | 719,440 |
| | | | |
Real Estate Investment Trusts (REITs) Total | | 1,041,740 |
| | | | |
Financials Total | | | | 27,925,915 |
| | | | |
| Health Care – 13.3% | | |
| Biotechnology – 1.6% | | |
Genzyme Corp. (a) | | 22,100 | | 1,145,443 |
Gilead Sciences, Inc. (a) | | 17,780 | | 808,635 |
Vertex Pharmaceuticals, Inc. (a) | | 9,561 | | 390,758 |
| | | | |
Biotechnology Total | | 2,344,836 |
| |
| Health Care Equipment & Supplies – 0.7% | | |
Hospira, Inc. (a) | | 18,100 | | 1,025,365 |
| | | | |
Health Care Equipment & Supplies Total | | 1,025,365 |
| |
| Health Care Providers & Services – 2.6% | | |
AmerisourceBergen Corp. | | 37,052 | | 1,071,544 |
Coventry Health Care, Inc. (a) | | 7,800 | | 192,816 |
Humana, Inc. (a) | | 18,938 | | 885,730 |
Medco Health Solutions, Inc. (a) | | 18,620 | | 1,202,107 |
| | | | |
| | | Shares | | Value ($) |
UnitedHealth Group, Inc. (a) | | 17,101 | | 558,690 |
| | | | |
Health Care Providers & Services Total | | 3,910,887 |
| |
| Life Sciences Tools & Services – 0.5% | | |
Thermo Fisher Scientific, Inc. (a) | | 15,569 | | 800,869 |
| | | | |
Life Sciences Tools & Services Total | | 800,869 |
| |
| Pharmaceuticals – 7.9% | | |
Abbott Laboratories | | 122,361 | | 6,445,977 |
Johnson & Johnson | | 59,978 | | 3,910,566 |
Merck & Co., Inc. | | 11,014 | | 411,373 |
Pfizer, Inc. | | 63,634 | | 1,091,323 |
| | | | |
Pharmaceuticals Total | | 11,859,239 |
| | | | |
Health Care Total | | 19,941,196 |
| | | | |
| Industrials – 10.4% | | |
| Aerospace & Defense – 2.1% | | |
Boeing Co. | | 11,000 | | 798,710 |
Lockheed Martin Corp. | | 10,757 | | 895,198 |
United Technologies Corp. | | 19,879 | | 1,463,293 |
| | | | |
Aerospace & Defense Total | | 3,157,201 |
| |
| Air Freight & Logistics – 1.1% | | |
United Parcel Service, Inc., Class B | | 24,618 | | 1,585,645 |
| | | | |
Air Freight & Logistics Total | | 1,585,645 |
| |
| Airlines – 0.2% | | |
Southwest Airlines Co. | | 25,200 | | 333,144 |
| | | | |
Airlines Total | | 333,144 |
| |
| Commercial Services & Supplies – 1.3% | | |
Waste Management, Inc. | | 56,400 | | 1,941,852 |
| | | | |
Commercial Services & Supplies Total | | 1,941,852 |
| |
| Industrial Conglomerates – 2.3% | | |
General Electric Co. | | 133,349 | | 2,426,952 |
Textron, Inc. | | 13,000 | | 275,990 |
Tyco International Ltd. | | 19,510 | | 746,257 |
| | | | |
Industrial Conglomerates Total | | 3,449,199 |
| |
| Machinery – 3.3% | | |
Dover Corp. | | 54,190 | | 2,533,383 |
Illinois Tool Works, Inc. | | 16,407 | | 777,036 |
Joy Global, Inc. | | 7,279 | | 411,991 |
Parker Hannifin Corp. | | 18,280 | | 1,183,447 |
| | | | |
Machinery Total | | 4,905,857 |
| |
| Road & Rail – 0.1% | | |
Norfolk Southern Corp. | | 4,000 | | 223,560 |
| | | | |
Road & Rail Total | | 223,560 |
| | | | |
Industrials Total | | 15,596,458 |
See Accompanying Notes to Financial Statements.
54
Columbia Blended Equity Fund
March 31, 2010
Common Stocks (continued)
| | | | |
| | | Shares | | Value ($) |
| Information Technology – 19.7% | | |
| Communications Equipment – 4.7% | | |
Cisco Systems, Inc. (a) | | 271,165 | | 7,058,425 |
| | | | |
Communications Equipment Total | | 7,058,425 |
| |
| Computers & Peripherals – 7.8% | | |
Apple, Inc. (a) | | 8,564 | | 2,011,940 |
EMC Corp. (a) | | 137,399 | | 2,478,678 |
Hewlett-Packard Co. | | 46,400 | | 2,466,160 |
International Business Machines Corp. | | 21,015 | | 2,695,174 |
Teradata Corp. (a) | | 69,600 | | 2,010,744 |
| | | | |
Computers & Peripherals Total | | 11,662,696 |
| |
| Electronic Equipment, Instruments & Components – 0.2% | | |
Molex, Inc. | | 14,700 | | 306,642 |
| | | | |
Electronic Equipment, Instruments & Components Total | | 306,642 |
| |
| Internet Software & Services – 1.4% | | |
Akamai Technologies, Inc. (a) | | 21,170 | | 664,950 |
eBay, Inc. (a) | | 45,160 | | 1,217,062 |
Google, Inc., Class A (a) | | 300 | | 170,103 |
| | | | |
Internet Software & Services Total | | 2,052,115 |
| |
| IT Services – 0.7% | | |
MasterCard, Inc., Class A | | 3,828 | | 972,312 |
| | | | |
IT Services Total | | 972,312 |
|
| Semiconductors & Semiconductor Equipment – 1.0% |
Advanced Micro Devices, Inc. (a) | | 8,500 | | 78,795 |
Intel Corp. | | 900 | | 20,034 |
Micron Technology, Inc. (a) | | 12,800 | | 132,992 |
Novellus Systems, Inc. (a) | | 19,256 | | 481,400 |
Texas Instruments, Inc. | | 32,470 | | 794,541 |
| | | | |
Semiconductors & Semiconductor Equipment Total | | 1,507,762 |
| |
| Software – 3.9% | | |
Microsoft Corp. | | 201,739 | | 5,904,900 |
| | | | |
Software Total | | 5,904,900 |
| | | | |
Information Technology Total | | 29,464,852 |
| | | | |
| Materials – 2.7% | | |
| Chemicals – 1.2% | | |
Celanese Corp., Series A | | 20,887 | | 665,251 |
Dow Chemical Co. | | 17,100 | | 505,647 |
PPG Industries, Inc. | | 10,027 | | 655,766 |
| | | | |
Chemicals Total | | 1,826,664 |
| | | | |
| | | Shares | | Value ($) |
| Containers & Packaging – 0.1% | | |
Owens-Illinois, Inc. (a) | | 2,500 | | 88,850 |
| | | | |
Containers & Packaging Total | | 88,850 |
| |
| Metals & Mining – 1.1% | | |
Alcoa, Inc. | | 14,600 | | 207,904 |
Cliffs Natural Resources, Inc. | | 1,900 | | 134,805 |
Freeport-McMoRan Copper & Gold, Inc. | | 3,900 | | 325,806 |
Newmont Mining Corp. | | 6,200 | | 315,766 |
Rio Tinto PLC, ADR | | 3,030 | | 717,292 |
| | | | |
Metals & Mining Total | | 1,701,573 |
| |
| Paper & Forest Products – 0.3% | | |
International Paper Co. | | 20,061 | | 493,701 |
| | | | |
Paper & Forest Products Total | | 493,701 |
| | | | |
Materials Total | | 4,110,788 |
| | | | |
| Telecommunication Services – 1.4% | | |
| Diversified Telecommunication Services – 0.8% |
AT&T, Inc. | | 45,533 | | 1,176,573 |
| | | | |
Diversified Telecommunication Services Total | | 1,176,573 |
|
| Wireless Telecommunication Services – 0.6% |
MetroPCS Communications, Inc. (a) | | 50,600 | | 358,248 |
NII Holdings, Inc. (a) | | 9,291 | | 387,063 |
Sprint Nextel Corp. (a) | | 44,600 | | 169,480 |
| | | | |
Wireless Telecommunication Services Total | | 914,791 |
| | | | |
Telecommunication Services Total | | 2,091,364 |
| | | | |
| Utilities – 1.5% | | |
| Electric Utilities – 0.2% | | |
Pepco Holdings, Inc. | | 15,300 | | 262,395 |
| | | | |
Electric Utilities Total | | 262,395 |
| |
| Multi-Utilities – 1.3% | | |
NiSource, Inc. | | 11,700 | | 184,860 |
PG&E Corp. | | 22,978 | | 974,727 |
Public Service Enterprise Group, Inc. | | 26,228 | | 774,250 |
| | | | |
Multi-Utilities Total | | 1,933,837 |
| | | | |
Utilities Total | | 2,196,232 |
| | | | |
Total Common Stocks
(cost of $78,079,497) | | | | 149,860,269 |
See Accompanying Notes to Financial Statements.
55
Columbia Blended Equity Fund
March 31, 2010
Short-Term Obligation – 0.1%
| | | | | |
| | | Par ($) | | Value ($) | |
Repurchase agreement with Fixed Income Clearing Corp., dated 03/31/10, due 04/01/10 at 0.000%, collateralized by a U.S. Treasury obligation maturing 01/31/14, market value $173,469 (repurchase proceeds $168,000) | | 168,000 | | 168,000 | |
| | | | | |
Total Short-Term Obligation
(cost of $168,000) | | 168,000 | |
| | | | | |
Total Investments – 100.1%
(cost of $78,247,497)(b) | | 150,028,269 | |
| | | | | |
Other Assets & Liabilities, Net – (0.1)% | | (208,268 | ) |
| | | | | |
Net Assets – 100.0% | | 149,820,001 | |
Notes to Investment Portfolio:
| (a) | Non-income producing security. |
| (b) | Cost for federal income tax purposes is $78,415,843. |
The following table summarizes the inputs used, as of March 31, 2010, in valuing the Fund’s assets:
| | | | | | | | | | | | |
Description | | Quoted Prices
(Level 1) | | Other
Significant
Observable
Inputs
(Level 2) | | Significant
Unobservable
Inputs
(Level 3) | | Total |
Total Common Stocks | | $ | 149,860,269 | | $ | — | | $ | — | | $ | 149,860,269 |
| | | | | | | | | | | | |
Total Short-Term Obligation | | | — | | | 168,000 | | | — | | | 168,000 |
| | | | | | | | | | | | |
Total Investments | | $ | 149,860,269 | | $ | 168,000 | | $ | — | | $ | 150,028,269 |
| | | | | | | | | | | | |
For more information on valuation inputs, and their aggregation into the levels used in the table above, please refer to the Security Valuation section in the accompanying Notes to Financial Statements.
At March 31, 2010, the Fund held investments in the following sectors:
| | | |
Sector (Unaudited) | | % of
Net Assets | |
Information Technology | | 19.7 | |
Financials | | 18.6 | |
Health Care | | 13.3 | |
Consumer Staples | | 12.5 | |
Industrials | | 10.4 | |
Energy | | 10.0 | |
Consumer Discretionary | | 9.9 | |
Materials | | 2.7 | |
Utilities | | 1.5 | |
Telecommunication Services | | 1.4 | |
| | | |
| | 100.0 | |
Short-Term Obligation | | 0.1 | |
Other Assets & Liabilities, Net | | (0.1 | ) |
| | | |
| | 100.0 | |
| | | |
| | |
Acronym | | Name |
| ADR | | American Depositary Receipt |
See Accompanying Notes to Financial Statements.
56
Investment Portfolio – Columbia Energy and Natural Resources Fund
March 31, 2010
Common Stocks – 97.8%
| | | | |
| | | Shares | | Value ($) |
| Energy – 58.6% | | | | |
| Energy Equipment & Services – 11.5% | | |
Cameron International Corp. (a) | | 350,000 | | 15,001,000 |
Halliburton Co. | | 500,000 | | 15,065,000 |
Key Energy Services, Inc. (a) | | 1,000,000 | | 9,550,000 |
Oceaneering International, Inc. (a) | | 170,000 | | 10,793,300 |
Pioneer Drilling Co. (a) | | 300,000 | | 2,112,000 |
Schlumberger Ltd. | | 250,000 | | 15,865,000 |
Transocean Ltd. (a) | | 100,000 | | 8,638,000 |
Willbros Group, Inc. (a) | | 200,000 | | 2,402,000 |
| | | | |
Energy Equipment & Services Total | | 79,426,300 |
|
Oil, Gas & Consumable Fuels – 47.1% |
Alpha Natural Resources, Inc. (a) | | 150,000 | | 7,483,500 |
Anadarko Petroleum Corp. | | 150,000 | | 10,924,500 |
Apache Corp. | | 150,000 | | 15,225,000 |
Arena Resources, Inc. (a) | | 200,000 | | 6,680,000 |
Brigham Exploration Co. (a) | | 393,300 | | 6,273,135 |
Callon Petroleum Co. (a) | | 500,000 | | 2,680,000 |
Canadian Natural Resources Ltd. | | 200,000 | | 14,808,000 |
Chevron Corp. | | 200,000 | | 15,166,000 |
Concho Resources, Inc. (a) | | 200,321 | | 10,088,166 |
ConocoPhillips | | 200,000 | | 10,234,000 |
Continental Resources, Inc. (a) | | 250,000 | | 10,637,500 |
Denbury Resources, Inc. (a) | | 300,000 | | 5,061,000 |
EOG Resources, Inc. | | 115,000 | | 10,688,100 |
EXCO Resources, Inc. | | 500,000 | | 9,190,000 |
Exxon Mobil Corp. | | 275,000 | | 18,419,500 |
Forest Oil Corp. (a) | | 250,000 | | 6,455,000 |
Green Plains Renewable Energy, Inc. (a) | | 500,000 | | 7,135,000 |
Hess Corp. | | 200,000 | | 12,510,000 |
Newfield Exploration Co. (a) | | 225,000 | | 11,711,250 |
Noble Energy, Inc. | | 100,000 | | 7,300,000 |
Northern Oil & Gas, Inc. (a) | | 1,000,000 | | 15,850,000 |
Occidental Petroleum Corp. | | 150,000 | | 12,681,000 |
Oilsands Quest, Inc. (a) | | 2,500,000 | | 1,848,000 |
Overseas Shipholding Group, Inc. | | 200,000 | | 7,846,000 |
Peabody Energy Corp. | | 299,583 | | 13,690,943 |
PetroHawk Energy Corp. (a) | | 500,000 | | 10,140,000 |
Petroleo Brasileiro SA, ADR | | 275,000 | | 12,234,750 |
Pioneer Natural Resources Co. | | 300,000 | | 16,896,000 |
Plains Exploration & Production Co. (a) | | 100,000 | | 2,999,000 |
Range Resources Corp. | | 100,000 | | 4,687,000 |
Southwestern Energy Co. (a) | | 225,000 | | 9,162,000 |
Spectra Energy Corp. | | 300,000 | | 6,759,000 |
| | | | |
| | | Shares | | Value ($) |
Suncor Energy, Inc. | | 350,000 | | 11,389,000 |
| | | | |
Oil, Gas & Consumable Fuels Total | | 324,852,344 |
| | | | |
Energy Total | | | | 404,278,644 |
| | | | |
| Industrials – 5.7% | | | | |
| Construction & Engineering – 1.0% | | |
Fluor Corp. | | 150,000 | | 6,976,500 |
| | | | |
Construction & Engineering Total | | 6,976,500 |
| |
Electrical Equipment – 0.8% | | |
Fushi Copperweld, Inc. (a) | | 500,000 | | 5,610,000 |
| | | | |
Electrical Equipment Total | | | | 5,610,000 |
| |
Industrial Conglomerates – 3.0% | | |
General Electric Co. | | 400,000 | | 7,280,000 |
McDermott International, Inc. (a) | | 500,000 | | 13,460,000 |
| | | | |
Industrial Conglomerates Total | | 20,740,000 |
| |
Transportation Infrastructure – 0.9% | | |
Aegean Marine Petroleum Network, Inc. | | 200,000 | | 5,676,000 |
| | | | |
Transportation Infrastructure Total | | 5,676,000 |
| | | | |
Industrials Total | | | | 39,002,500 |
| | | | |
| Materials – 33.5% | | |
| Chemicals – 5.5% | | |
Celanese Corp., Series A | | 250,152 | | 7,967,341 |
Monsanto Co. | | 150,000 | | 10,713,000 |
Sociedad Quimica y Minera de Chile SA, ADR | | 225,000 | | 8,412,750 |
Solutia, Inc. (a) | | 700,000 | | 11,277,000 |
| | | | |
Chemicals Total | | | | 38,370,091 |
| | |
Metals & Mining – 26.9% | | | | |
AK Steel Holding Corp. | | 500,000 | | 11,430,000 |
Allegheny Technologies, Inc. | | 200,000 | | 10,798,000 |
BHP Billiton Ltd., ADR | | 175,000 | | 14,056,000 |
Freeport-McMoRan Copper & Gold, Inc. | | 275,000 | | 22,973,500 |
Gold Fields Ltd., ADR | | 400,000 | | 5,048,000 |
Goldcorp, Inc. | | 350,000 | | 13,027,000 |
Ivanhoe Mines Ltd. (a) | | 500,000 | | 8,705,000 |
Jaguar Mining, Inc. (a) | | 500,000 | | 4,600,050 |
Novagold Resources, Inc. (a) | | 900,000 | | 6,426,000 |
Rio Tinto PLC, ADR | | 50,000 | | 11,836,500 |
Silver Wheaton Corp. (a) | | 500,000 | | 7,840,000 |
Teck Resources Ltd. (a) | | 400,000 | | 17,424,000 |
United States Steel Corp. | | 300,000 | | 19,056,000 |
See Accompanying Notes to Financial Statements.
57
Columbia Energy and Natural Resources Fund
March 31, 2010
Common Stocks (continued)
| | | | | |
| | | Shares | | Value ($) | |
| Materials (continued) | | | |
| Metals & Mining (continued) | | | | | |
Vale SA, ADR | | 500,000 | | 16,095,000 | |
Walter Energy, Inc. | | 175,000 | | 16,147,250 | |
| | | | | |
Metals & Mining Total | | | | 185,462,300 | |
| |
Paper & Forest Products – 1.1% | | | |
International Paper Co. | | 300,000 | | 7,383,000 | |
| | | | | |
Paper & Forest Products Total | | 7,383,000 | |
| | | | | |
Materials Total | | | | 231,215,391 | |
| | | | | |
Total Common Stocks
(cost of $575,312,729) | | | | 674,496,535 | |
| | | | | |
Short-Term Obligation – 7.1% | |
| | | Par ($) | | | |
Repurchase agreement with Fixed Income Clearing Corp., dated 03/31/10, due 04/01/10 at 0.000%, collateralized by U.S. Treasury obligation maturing 01/31/14, market value $50,177,075 (repurchase proceeds $49,189,000) | | 49,189,000 | | 49,189,000 | |
| | | | | |
Total Short-Term Obligation
(cost of $49,189,000) | | 49,189,000 | |
| | | | | |
Total Investments – 104.9%
(cost of $624,501,729) (b) | | 723,685,535 | |
| | | | | |
Other Assets & Liabilities, Net – (4.9)% | | (33,983,366 | ) |
| | | | | |
Net Assets – 100.0% | | 689,702,169 | |
Notes to Investment Portfolio:
| (a) | Non-income producing security. |
| (b) | Cost for federal income tax purposes is $638,266,275. |
The following table summarizes the inputs used, as of March 31, 2010, in valuing the Fund’s assets:
| | | | | | | | | | | | |
Description | | Quoted Prices
(Level 1) | | Other
Significant
Observable
Inputs
(Level 2) | | Significant
Unobservable
Inputs
(Level 3) | | Total |
Total Common Stocks | | $ | 674,496,535 | | $ | — | | $ | — | | $ | 674,496,535 |
| | | | | | | | | | | | |
Total Short-Term Obligation | | | — | | | 49,189,000 | | | — | | | 49,189,000 |
| | | | | | | | | | | | |
Total Investments | | $ | 674,496,535 | | $ | 49,189,000 | | $ | — | | $ | 723,685,535 |
| | | | | | | | | | | | |
The Fund’s assets assigned to the Level 2 input category represent short-term obligations which are valued using amortized cost, an income approach which converts future cash flows to a present value based upon the yield at purchase.
For more information on valuation inputs, and their aggregation into the levels used in the table above, please refer to the Security Valuation section in the accompanying Notes to Financial Statements.
At March 31, 2010, the Fund held investments in the following sectors:
| | | |
Sector (Unaudited) | | % of
Net Assets | |
Energy | | 58.6 | |
Materials | | 33.5 | |
Industrials | | 5.7 | |
| | | |
| | 97.8 | |
Short-Term Obligation | | 7.1 | |
Other Assets & Liabilities, Net | | (4.9 | ) |
| | | |
| | 100.0 | |
| | | |
| | |
Acronym | | Name |
| ADR | | American Depositary Receipt |
See Accompanying Notes to Financial Statements.
58
Investment Portfolio – Columbia Mid Cap Core Fund
March 31, 2010
Common Stocks – 100.8%
| | | | |
| | | Shares | | Value ($) |
| Consumer Discretionary – 15.8% |
| Auto Components – 1.7% | | | | |
BorgWarner, Inc. (a) | | 20,184 | | 770,625 |
Lear Corp. (a) | | 6,578 | | 521,965 |
|
Auto Components Total | | 1,292,590 |
|
| Diversified Consumer Services – 0.5% |
Apollo Group, Inc., Class A (a) | | 5,901 | | 361,672 |
|
Diversified Consumer Services Total | | 361,672 |
|
| Hotels, Restaurants & Leisure – 2.6% |
Bally Technologies, Inc. (a) | | 12,439 | | 504,277 |
Carnival Corp. | | 12,467 | | 484,717 |
Chipotle Mexican Grill, Inc., Class A (a) | | 4,148 | | 467,355 |
Starbucks Corp. (a) | | 19,806 | | 480,692 |
|
Hotels, Restaurants & Leisure Total | | 1,937,041 |
| | |
| Internet & Catalog Retail – 1.1% | | | | |
Liberty Media Holding Corp., Interactive Series A (a) | | 52,282 | | 800,438 |
|
Internet & Catalog Retail Total | | | | 800,438 |
| | |
| Media – 3.2% | | | | |
CBS Corp., Class B | | 13,427 | | 187,172 |
DISH Network Corp., Class A | | 22,251 | | 463,266 |
Gannett Co., Inc. | | 41,823 | | 690,916 |
Lamar Advertising Co., Class A (a) | | 12,075 | | 414,776 |
Viacom, Inc., Class B (a) | | 17,423 | | 599,003 |
|
Media Total | | 2,355,133 |
| | |
| Multiline Retail – 0.8% | | | | |
Nordstrom, Inc. | | 15,264 | | 623,534 |
|
Multiline Retail Total | | 623,534 |
| | |
| Specialty Retail – 4.8% | | | | |
Advance Auto Parts, Inc. | | 9,345 | | 391,742 |
American Eagle Outfitters, Inc. | | 21,633 | | 400,643 |
Pier 1 Imports, Inc. (a) | | 117,746 | | 750,042 |
Ross Stores, Inc. | | 17,262 | | 922,999 |
TJX Companies, Inc. | | 8,897 | | 378,301 |
Urban Outfitters, Inc. (a) | | 18,475 | | 702,604 |
|
Specialty Retail Total | | | | 3,546,331 |
|
| Textiles, Apparel & Luxury Goods – 1.1% |
Hanesbrands, Inc. (a) | | 30,227 | | 840,915 |
|
Textiles, Apparel & Luxury Goods Total | | 840,915 |
| | | | |
Consumer Discretionary Total | | 11,757,654 |
| | | | |
| Consumer Staples – 6.5% | | | | |
| Beverages – 0.6% | | | | |
Molson Coors Brewing Co., Class B | | 10,443 | | 439,232 |
|
Beverages Total | | | | 439,232 |
| | | | |
| | | Shares | | Value ($) |
| Food Products – 1.8% | | | | |
H.J. Heinz Co. | | 13,766 | | 627,867 |
Mead Johnson Nutrition Co., Class A | | 13,987 | | 727,744 |
|
Food Products Total | | 1,355,611 |
| | |
Household Products – 1.1% | | | | |
Clorox Co. | | 13,043 | | 836,578 |
|
Household Products Total | | | | 836,578 |
| | |
Personal Products – 2.1% | | | | |
Avon Products, Inc. | | 31,477 | | 1,066,126 |
Estee Lauder Companies, Inc., Class A | | 7,476 | | 484,968 |
|
Personal Products Total | | | | 1,551,094 |
| | |
Tobacco – 0.9% | | | | |
Lorillard, Inc. | | 8,424 | | 633,822 |
|
Tobacco Total | | | | 633,822 |
|
Consumer Staples Total | | 4,816,337 |
| | | | |
| Energy – 7.3% | | | | |
| Energy Equipment & Services – 2.4% |
Baker Hughes, Inc. | | 10,573 | | 495,239 |
Nabors Industries Ltd. (a) | | 15,536 | | 304,972 |
Noble Corp. (a) | | 14,708 | | 615,088 |
Pride International, Inc. (a) | | 13,443 | | 404,769 |
|
Energy Equipment & Services Total | | 1,820,068 |
|
Oil, Gas & Consumable Fuels – 4.9% |
Alpha Natural Resources, Inc. (a) | | 13,938 | | 695,367 |
Cabot Oil & Gas Corp. | | 18,943 | | 697,102 |
Continental Resources, Inc. (a) | | 13,492 | | 574,085 |
Massey Energy Co. | | 8,552 | | 447,184 |
Southwestern Energy Co. (a) | | 17,288 | | 703,967 |
Whiting Petroleum Corp. (a) | | 6,102 | | 493,286 |
|
Oil, Gas & Consumable Fuels Total | | 3,610,991 |
|
Energy Total | | | | 5,431,059 |
| | | | |
| Financials – 20.3% | | | | |
| Capital Markets – 5.9% | | | | |
Ameriprise Financial, Inc. | | 24,575 | | 1,114,722 |
Greenhill & Co., Inc. | | 6,561 | | 538,592 |
Raymond James Financial, Inc. | | 37,907 | | 1,013,633 |
T. Rowe Price Group, Inc. | | 18,043 | | 991,102 |
TD Ameritrade Holding Corp. (a) | | 37,164 | | 708,346 |
|
Capital Markets Total | | | | 4,366,395 |
| | |
Commercial Banks – 4.4% | | | | |
BB&T Corp. | | 14,613 | | 473,315 |
Fifth Third Bancorp. | | 73,048 | | 992,722 |
See Accompanying Notes to Financial Statements.
59
Columbia Mid Cap Core Fund
March 31, 2010
Common Stocks (continued)
| | | | |
| | | Shares | | Value ($) |
| Financials (continued) | | | | |
| Commercial Banks (continued) | | | | |
M&T Bank Corp. | | 11,200 | | 889,056 |
TCF Financial Corp. | | 34,854 | | 555,573 |
Zions Bancorporation | | 17,529 | | 382,483 |
|
Commercial Banks Total | | 3,293,149 |
| | |
Consumer Finance – 1.4% | | | | |
Discover Financial Services | | 66,442 | | 989,986 |
|
Consumer Finance Total | | | | 989,986 |
| | |
Insurance – 5.4% | | | | |
Axis Capital Holdings Ltd. | | 25,751 | | 804,976 |
Lincoln National Corp. | | 18,704 | | 574,213 |
Principal Financial Group, Inc. | | 18,263 | | 533,462 |
Reinsurance Group of America, Inc. | | 12,586 | | 661,017 |
Unum Group | | 32,454 | | 803,886 |
XL Capital Ltd., Class A | | 34,235 | | 647,041 |
|
Insurance Total | | | | 4,024,595 |
|
Real Estate Investment Trusts (REITs) – 3.2% |
Alexandria Real Estate Equities, Inc. | | 6,927 | | 468,265 |
Digital Realty Trust, Inc. | | 8,740 | | 473,708 |
Equity Lifestyle Properties, Inc. | | 9,036 | | 486,860 |
Mid-America Apartment Communities, Inc. | | 9,374 | | 485,480 |
Ventas, Inc. | | 10,003 | | 474,942 |
|
Real Estate Investment Trusts (REITs) Total | | 2,389,255 |
|
Financials Total | | | | 15,063,380 |
| | | | |
| Health Care – 8.4% | | | | |
| Biotechnology – 0.6% | | | | |
Vertex Pharmaceuticals, Inc. (a) | | 11,255 | | 459,992 |
|
Biotechnology Total | | | | 459,992 |
|
Health Care Equipment & Supplies – 2.9% |
C.R. Bard, Inc. | | 5,950 | | 515,389 |
CareFusion Corp. (a) | | 14,076 | | 372,028 |
Edwards Lifesciences Corp. (a) | | 4,224 | | 417,669 |
Hospira, Inc. (a) | | 8,338 | | 472,348 |
St. Jude Medical, Inc. (a) | | 9,974 | | 409,433 |
|
Health Care Equipment & Supplies Total | | 2,186,867 |
|
Health Care Providers & Services – 2.5% |
AmerisourceBergen Corp. | | 25,099 | | 725,863 |
CIGNA Corp. | | 7,011 | | 256,462 |
Community Health Systems, Inc. (a) | | 12,617 | | 465,946 |
Humana, Inc. (a) | | 8,909 | | 416,674 |
|
Health Care Providers & Services Total | | 1,864,945 |
| | | | |
| | | Shares | | Value ($) |
| Life Sciences Tools & Services – 0.9% | | |
Life Technologies Corp. (a) | | 12,142 | | 634,662 |
|
Life Sciences Tools & Services Total | | 634,662 |
| | |
Pharmaceuticals – 1.5% | | | | |
Medicis Pharmaceutical Corp., Class A | | 15,050 | | 378,658 |
Mylan, Inc. (a) | | 31,112 | | 706,554 |
|
Pharmaceuticals Total | | | | 1,085,212 |
| | | | |
Health Care Total | | 6,231,678 |
| | |
| Industrials – 13.5% | | | | |
| Aerospace & Defense – 1.1% | | | | |
Rockwell Collins, Inc. | | 12,366 | | 773,988 |
|
Aerospace & Defense Total | | | | 773,988 |
| | |
Building Products – 1.3% | | | | |
Masco Corp. | | 39,393 | | 611,379 |
Owens Corning (a) | | 14,220 | | 361,757 |
|
Building Products Total | | | | 973,136 |
| | |
Construction & Engineering – 0.5% | | | | |
Chicago Bridge & Iron Co., NV, N.Y. Registered Shares (a) | | 16,102 | | 374,533 |
|
Construction & Engineering Total | | 374,533 |
| | |
Electrical Equipment – 0.9% | | | | |
Cooper Industries PLC, Class A | | 13,803 | | 661,716 |
|
Electrical Equipment Total | | | | 661,716 |
| | |
Industrial Conglomerates – 0.5% | | | | |
Tyco International Ltd. | | 10,327 | | 395,008 |
|
Industrial Conglomerates Total | | | | 395,008 |
| | |
Machinery – 7.0% | | | | |
Barnes Group, Inc. | | 33,605 | | 653,617 |
Cummins, Inc. | | 11,973 | | 741,727 |
Dover Corp. | | 21,835 | | 1,020,786 |
Flowserve Corp. | | 6,465 | | 712,896 |
Harsco Corp. | | 15,262 | | 487,468 |
Joy Global, Inc. | | 9,848 | | 557,397 |
Parker Hannifin Corp. | | 15,829 | | 1,024,770 |
|
Machinery Total | | | | 5,198,661 |
| | |
Professional Services – 0.5% | | | | |
Dun & Bradstreet Corp. | | 4,532 | | 337,271 |
|
Professional Services Total | | | | 337,271 |
| | |
Road & Rail – 0.8% | | | | |
Ryder System, Inc. | | 15,462 | | 599,307 |
|
Road & Rail Total | | | | 599,307 |
See Accompanying Notes to Financial Statements.
60
Columbia Mid Cap Core Fund
March 31, 2010
Common Stocks (continued)
| | | | |
| | | Shares | | Value ($) |
| Industrials (continued) | | | | |
| Trading Companies & Distributors – 0.9% |
W.W. Grainger, Inc. | | 6,182 | | 668,398 |
|
Trading Companies & Distributors Total | | 668,398 |
|
Industrials Total | | | | 9,982,018 |
| | | | |
| Information Technology – 15.1% | | | | |
| Communications Equipment – 1.8% | | | | |
Brocade Communications Systems, Inc. (a) | | 129,624 | | 740,153 |
CommScope, Inc. (a) | | 20,427 | | 572,365 |
|
Communications Equipment Total | | | | 1,312,518 |
| | |
Computers & Peripherals – 1.6% | | | | |
NetApp, Inc. (a) | | 9,161 | | 298,282 |
Teradata Corp. (a) | | 31,738 | | 916,911 |
|
Computers & Peripherals Total | | | | 1,215,193 |
|
Electronic Equipment, Instruments & Components – 0.8% |
Avnet, Inc. (a) | | 18,680 | | 560,400 |
|
Electronic Equipment, Instruments & Components Total | | 560,400 |
|
Internet Software & Services – 0.7% |
Akamai Technologies, Inc. (a) | | 17,375 | | 545,749 |
|
Internet Software & Services Total | | | | 545,749 |
| | |
IT Services – 3.0% | | | | |
Accenture PLC, Class A | | 10,656 | | 447,019 |
Cognizant Technology Solutions Corp., Class A (a) | | 15,245 | | 777,190 |
Global Payments, Inc. | | 10,280 | | 468,254 |
Hewitt Associates, Inc., Class A (a) | | 13,730 | | 546,180 |
|
IT Services Total | | | | 2,238,643 |
|
Semiconductors & Semiconductor Equipment – 4.7% |
Altera Corp. | | 25,447 | | 618,617 |
Analog Devices, Inc. | | 15,360 | | 442,675 |
Lam Research Corp. (a) | | 17,213 | | 642,389 |
Marvell Technology Group Ltd. (a) | | 36,700 | | 747,946 |
Novellus Systems, Inc. (a) | | 26,182 | | 654,550 |
Varian Semiconductor Equipment Associates, Inc. (a) | | 11,845 | | 392,306 |
|
Semiconductors & Semiconductor Equipment Total | | 3,498,483 |
| | |
Software – 2.5% | | | | |
Electronic Arts, Inc. (a) | | 17,382 | | 324,348 |
Jack Henry & Associates, Inc. | | 15,654 | | 376,635 |
Nuance Communications, Inc. (a) | | 31,798 | | 529,119 |
Sybase, Inc. (a) | | 13,529 | | 630,722 |
|
Software Total | | | | 1,860,824 |
|
Information Technology Total | | | | 11,231,810 |
| | | | |
| | | Shares | | Value ($) |
| Materials – 6.2% | | | | |
| Chemicals – 2.3% | | | | |
Albemarle Corp. | | 9,201 | | 392,239 |
Celanese Corp., Series A | | 23,856 | | 759,813 |
PPG Industries, Inc. | | 8,327 | | 544,586 |
|
Chemicals Total | | | | 1,696,638 |
| | |
Containers & Packaging – 1.4% | | | | |
Owens-Illinois, Inc. (a) | | 15,661 | | 556,592 |
Packaging Corp. of America | | 18,517 | | 455,703 |
|
Containers & Packaging Total | | | | 1,012,295 |
| | |
Metals & Mining – 1.6% | | | | |
AK Steel Holding Corp. | | 13,720 | | 313,639 |
Compass Minerals International, Inc. | | 3,694 | | 296,370 |
Nucor Corp. | | 13,216 | | 599,742 |
|
Metals & Mining Total | | | | 1,209,751 |
| | |
Paper & Forest Products – 0.9% | | | | |
International Paper Co. | | 27,870 | | 685,881 |
|
Paper & Forest Products Total | | | | 685,881 |
|
Materials Total | | | | 4,604,565 |
| | | | |
| Telecommunication Services – 2.3% |
| Diversified Telecommunication Services – 0.7% |
Qwest Communications International, Inc. | | 96,225 | | 502,294 |
|
Diversified Telecommunication Services Total | | 502,294 |
|
Wireless Telecommunication Services – 1.6% |
Millicom International Cellular SA | | 5,925 | | 528,214 |
NII Holdings, Inc. (a) | | 16,771 | | 698,680 |
|
Wireless Telecommunication Services Total | | 1,226,894 |
|
Telecommunication Services Total | | | | 1,729,188 |
| | | | |
| Utilities – 5.4% | | | | |
| Electric Utilities – 0.6% | | | | |
PPL Corp. | | 16,557 | | 458,794 |
|
Electric Utilities Total | | | | 458,794 |
| | |
Gas Utilities – 1.0% | | | | |
Questar Corp. | | 18,081 | | 781,099 |
|
Gas Utilities Total | | | | 781,099 |
|
Independent Power Producers & Energy Traders – 0.5% |
AES Corp. (a) | | 33,722 | | 370,942 |
|
Independent Power Producers & Energy Traders Total | | 370,942 |
See Accompanying Notes to Financial Statements.
61
Columbia Mid Cap Core Fund
March 31, 2010
Common Stocks (continued)
| | | | | |
| | | Shares | | Value ($) | |
| Utilities (continued) | | | | | |
| Multi-Utilities – 3.3% | | | | | |
PG&E Corp. | | 15,832 | | 671,594 | |
Public Service Enterprise Group, Inc. | | 19,580 | | 578,002 | |
Sempra Energy | | 10,419 | | 519,908 | |
Xcel Energy, Inc. | | 30,612 | | 648,974 | |
| |
Multi-Utilities Total | | | | 2,418,478 | |
| |
Utilities Total | | | | 4,029,313 | |
| |
Total Common Stocks
(cost of $60,021,245) | | | | 74,877,002 | |
| |
Total Investments – 100.8%
(cost of $60,021,245)(b) | | | | 74,877,002 | |
| |
Other Assets & Liabilities, Net – (0.8)% | | (557,526 | ) |
| |
Net Assets – 100.0% | | | | 74,319,476 | |
Notes to Investment Portfolio:
| (a) | Non-income producing security. |
| (b) | Cost for federal income tax purposes is $60,170,960. |
Quoted prices in active markets for identical securities (level 1 measurements), were used in determining value for all securities in the Fund’s portfolio as of March 31, 2010.
For more information on valuation inputs please refer to the Security Valuation section in the accompanying Notes to Financial Statements.
At March 31, 2010, the Fund held investments in the following sectors:
| | | |
Sector (Unaudited) | | % of
Net Assets | |
Financials | | 20.3 | |
Consumer Discretionary | | 15.8 | |
Information Technology | | 15.1 | |
Industrials | | 13.5 | |
Health Care | | 8.4 | |
Energy | | 7.3 | |
Consumer Staples | | 6.5 | |
Materials | | 6.2 | |
Utilities | | 5.4 | |
Telecommunication Services | | 2.3 | |
| | | |
| | 100.8 | |
Other Assets & Liabilities, Net | | (0.8 | ) |
| | | |
| | 100.0 | |
| | | |
See Accompanying Notes to Financial Statements.
62
Investment Portfolio – Columbia Select Large Cap Growth Fund
March 31, 2010
Common Stocks – 96.7%
| | | | |
| | | Shares | | Value ($) |
| Consumer Discretionary – 16.6% | | | | |
| Diversified Consumer Services – 3.4% | | |
Apollo Group, Inc., Class A (a) | | 1,257,830 | | 77,092,401 |
| | | | |
Diversified Consumer Services Total | | 77,092,401 |
| |
| Internet & Catalog Retail – 6.4% | | |
Amazon.com, Inc. (a) | | 730,315 | | 99,125,655 |
Priceline.com, Inc. (a) | | 186,805 | | 47,635,275 |
| | | | |
Internet & Catalog Retail Total | | | | 146,760,930 |
| | |
| Specialty Retail – 5.6% | | | | |
O’Reilly Automotive, Inc. (a) | | 1,541,480 | | 64,295,131 |
Staples, Inc. | | 2,678,540 | | 62,651,050 |
| | | | |
Specialty Retail Total | | | | 126,946,181 |
| |
| Textiles, Apparel & Luxury Goods – 1.2% | | |
Lululemon Athletica, Inc. (a) | | 684,719 | | 28,415,839 |
| | | | |
Textiles, Apparel & Luxury Goods Total | | 28,415,839 |
| | | | |
Consumer Discretionary Total | | 379,215,351 |
| | | | |
| Consumer Staples – 3.7% | | | | |
| Food & Staples Retailing – 3.7% | | | | |
Costco Wholesale Corp. | | 1,397,465 | | 83,442,635 |
| | | | |
Food & Staples Retailing Total | | | | 83,442,635 |
| | | | |
Consumer Staples Total | | | | 83,442,635 |
| | | | |
| Energy – 2.7% | | | | |
| Energy Equipment & Services – 2.7% | | |
FMC Technologies, Inc. (a) | | 946,449 | | 61,168,999 |
| | | | |
Energy Equipment & Services Total | | 61,168,999 |
| | | | |
Energy Total | | | | 61,168,999 |
| | | | |
| Financials – 7.5% | | | | |
| Capital Markets – 4.0% | | | | |
T. Rowe Price Group, Inc. | | 1,657,773 | | 91,061,471 |
| | | | |
Capital Markets Total | | | | 91,061,471 |
| |
| Diversified Financial Services – 3.5% | | |
CME Group, Inc. | | 251,050 | | 79,359,415 |
| | | | |
Diversified Financial Services Total | | 79,359,415 |
| | | | |
Financials Total | | | | 170,420,886 |
| | | | |
| Health Care – 28.3% | | | | |
| Biotechnology – 7.2% | | | | |
Celgene Corp. (a) | | 1,274,039 | | 78,939,456 |
Gilead Sciences, Inc. (a) | | 1,870,542 | | 85,072,250 |
| | | | |
Biotechnology Total | | | | 164,011,706 |
| | | | |
| | | Shares | | Value ($) |
| Health Care Equipment & Supplies – 3.8% |
St. Jude Medical, Inc. (a) | | 2,125,350 | | 87,245,617 |
| | | | |
Health Care Equipment & Supplies Total | | 87,245,617 |
| |
| Health Care Providers & Services – 3.4% | | |
Medco Health Solutions, Inc. (a) | | 1,195,971 | | 77,211,888 |
| | | | |
Health Care Providers & Services Total | | 77,211,888 |
| |
| Life Sciences Tools & Services – 7.1% | | |
Covance, Inc. (a) | | 700,320 | | 42,992,645 |
Illumina, Inc. (a) | | 1,378,570 | | 53,626,373 |
QIAGEN N.V. (a) | | 2,867,101 | | 65,914,652 |
| | | | |
Life Sciences Tools & Services Total | | 162,533,670 |
| | |
| Pharmaceuticals – 6.8% | | | | |
Allergan, Inc. | | 1,306,772 | | 85,358,347 |
Novo Nordisk A/S, ADR | | 882,747 | | 68,077,449 |
| | | | |
Pharmaceuticals Total | | | | 153,435,796 |
| | | | |
Health Care Total | | | | 644,438,677 |
| | | | |
| Industrials – 2.6% | | | | |
| Air Freight & Logistics – 2.6% | | | | |
Expeditors International of Washington, Inc. | | 1,642,882 | | 60,655,204 |
| | | | |
Air Freight & Logistics Total | | | | 60,655,204 |
| | | | |
Industrials Total | | | | 60,655,204 |
| | | | |
| Information Technology – 29.8% | | |
| Communications Equipment – 7.7% | | |
QUALCOMM, Inc. | | 2,253,280 | | 94,615,227 |
Research In Motion Ltd. (a) | | 1,086,695 | | 80,361,095 |
| | | | |
Communications Equipment Total | | 174,976,322 |
| | |
| Computers & Peripherals – 8.5% | | | | |
Apple, Inc. (a) | | 432,310 | | 101,562,588 |
EMC Corp. (a) | | 5,117,700 | | 92,323,308 |
| | | | |
Computers & Peripherals Total | | | | 193,885,896 |
| |
| Internet Software & Services – 7.0% | | |
Akamai Technologies, Inc. (a) | | 2,065,400 | | 64,874,214 |
Google, Inc., Class A (a) | | 164,959 | | 93,533,403 |
| | | | |
Internet Software & Services Total | | 158,407,617 |
| | |
| IT Services – 4.2% | | | | |
MasterCard, Inc., Class A | | 379,234 | | 96,325,436 |
| | | | |
IT Services Total | | | | 96,325,436 |
See Accompanying Notes to Financial Statements.
63
Columbia Select Large Cap Growth Fund
March 31, 2010
Common Stocks (continued)
| | | | |
| | | Shares | | Value ($) |
| Information Technology (continued) | | |
| Software – 2.4% | | | | |
Salesforce.com, Inc. (a) | | 737,900 | | 54,936,655 |
| | | | |
Software Total | | | | 54,936,655 |
| | | | |
Information Technology Total | | 678,531,926 |
| | | | |
| Materials – 2.5% | | | | |
| Chemicals – 2.5% | | | | |
Mosaic Co. | | 924,020 | | 56,152,695 |
| | | | |
Chemicals Total | | | | 56,152,695 |
| | | | |
Materials Total | | | | 56,152,695 |
| | | | |
| Telecommunication Services – 3.0% | | |
| Wireless Telecommunication Services – 3.0% |
America Movil SAB de CV, Series L, ADR | | 1,363,267 | | 68,626,861 |
| | | | |
Wireless Telecommunication
Services Total | | 68,626,861 |
| | | | |
Telecommunication Services Total | | 68,626,861 |
| | | | |
Total Common Stocks
(cost of $1,817,675,033) | | 2,202,653,234 |
| | |
Short-Term Obligation – 2.9% | | | | |
| | | Par ($) | | |
Repurchase agreement with Fixed Income Clearing Corp., dated 03/31/10, due 04/01/10 at 0.000%, collateralized by a U.S. Treasury obligation maturing 01/31/14, market value $66,725,994 (repurchase proceeds $65,414,000) | | 65,414,000 | | 65,414,000 |
| | | | |
Total Short-Term Obligation
(cost of $65,414,000) | | 65,414,000 |
| | | | |
Total Investments – 99.6%
(cost of $1,883,089,033)(b) | | 2,268,067,234 |
| | | | |
Other Assets & Liabilities, Net – 0.4% | | 10,161,048 |
| | | | |
Net Assets – 100.0% | | | | 2,278,228,282 |
Notes to Investment Portfolio:
| (a) | Non-income producing security. |
| (b) | Cost for federal income tax purposes is $1,894,106,487. |
The following table summarizes the inputs used, as of March 31, 2010 in valuing the Fund’s assets:
| | | | | | | | | | | | |
Description | | Quoted Prices
(Level 1) | | Other
Significant
Observable
Inputs
(Level 2) | | Significant
Unobservable
Inputs
(Level 3) | | Total |
Total Common Stocks | | $ | 2,202,653,234 | | $ | — | | $ | — | | $ | 2,202,653,234 |
| | | | | | | | | | | | |
Total Short-Term Obligation | | | — | | | 65,414,000 | | | — | | | 65,414,000 |
| | | | | | | | | | | | |
Total Investments | | $ | 2,202,653,234 | | $ | 65,414,000 | | $ | — | | $ | 2,268,067,234 |
| | | | | | | | | | | | |
For more information on valuation inputs, and their aggregation into the levels used in the table above, please refer to the Security Valuation section in the accompanying Notes to Financial Statements.
At March 31, 2010, the Fund held investments in the following sectors:
| | |
Sector (Unaudited) | | % of
Net Assets |
Information Technology | | 29.8 |
Health Care | | 28.3 |
Consumer Discretionary | | 16.6 |
Financials | | 7.5 |
Consumer Staples | | 3.7 |
Telecommunication Services | | 3.0 |
Energy | | 2.7 |
Industrials | | 2.6 |
Materials | | 2.5 |
| | |
| | 96.7 |
Short-Term Obligation | | 2.9 |
Other Assets & Liabilities, Net | | 0.4 |
| | |
| | 100.0 |
| | |
| | |
Acronym | | Name |
| ADR | | American Depositary Receipt |
See Accompanying Notes to Financial Statements.
64
Investment Portfolio – Columbia Select Opportunities Fund
March 31, 2010
Common Stocks – 98.6%
| | | | |
| | | Shares | | Value ($) |
| Consumer Discretionary – 10.3% | | | | |
| Auto Components – 0.5% | | | | |
Nokian Renkaat Oyj | | 22,375 | | 581,146 |
|
Auto Components Total | | | | 581,146 |
| | |
| Automobiles – 0.2% | | | | |
Nissan Motor Co., Ltd. (a) | | 35,800 | | 306,726 |
|
Automobiles Total | | | | 306,726 |
|
| Hotels, Restaurants & Leisure – 2.3% |
Bally Technologies, Inc. (a) | | 17,399 | | 705,356 |
Brinker International, Inc. | | 32,426 | | 625,174 |
Ctrip.com International Ltd., ADR (a) | | 13,266 | | 520,027 |
Las Vegas Sands Corp. (a) | | 35,101 | | 742,386 |
WMS Industries, Inc. (a) | | 6,046 | | 253,569 |
|
Hotels, Restaurants & Leisure Total | | 2,846,512 |
| | |
| Media – 0.6% | | | | |
DIRECTV, Class A (a) | | 22,251 | | 752,306 |
|
Media Total | | | | 752,306 |
| | |
| Multiline Retail – 2.0% | | | | |
Big Lots, Inc. (a) | | 34,757 | | 1,265,850 |
Target Corp. | | 22,673 | | 1,192,600 |
|
Multiline Retail Total | | | | 2,458,450 |
| | |
| Specialty Retail – 3.2% | | | | |
Belle International Holdings Ltd. | | 423,000 | | 564,418 |
Collective Brands, Inc. (a) | | 43,067 | | 979,343 |
GameStop Corp., Class A (a) | | 41,422 | | 907,556 |
Jo-Ann Stores, Inc. (a) | | 34,656 | | 1,454,859 |
|
Specialty Retail Total | | | | 3,906,176 |
|
| Textiles, Apparel & Luxury Goods – 1.5% |
Hanesbrands, Inc. (a) | | 25,316 | | 704,291 |
NIKE, Inc., Class B | | 12,714 | | 934,479 |
Ports Design Ltd. | | 85,000 | | 214,573 |
|
Textiles, Apparel & Luxury Goods Total | | 1,853,343 |
| | | | |
Consumer Discretionary Total | | 12,704,659 |
| | | | |
| Consumer Staples – 9.6% | | | | |
| Beverages – 3.1% | | | | |
Carlsberg A/S, Class B | | 10,634 | | 892,501 |
Constellation Brands, Inc., Class A (a) | | 33,001 | | 542,537 |
Molson Coors Brewing Co., Class B | | 16,269 | | 684,274 |
PepsiCo, Inc. | | 25,246 | | 1,670,275 |
|
Beverages Total | | | | 3,789,587 |
| | | | |
| | | Shares | | Value ($) |
| Food & Staples Retailing – 2.9% |
BJ’s Wholesale Club, Inc. (a) | | 24,216 | | 895,750 |
Wal-Mart Stores, Inc. | | 32,503 | | 1,807,167 |
Walgreen Co. | | 23,483 | | 870,984 |
|
Food & Staples Retailing Total | | | | 3,573,901 |
| | |
| Food Products – 0.5% | | | | |
Archer-Daniels-Midland Co. | | 22,624 | | 653,834 |
|
Food Products Total | | | | 653,834 |
| | |
| Personal Products – 1.4% | | | | |
Avon Products, Inc. | | 29,194 | | 988,800 |
Hypermarcas SA (a) | | 65,700 | | 803,540 |
|
Personal Products Total | | | | 1,792,340 |
| | |
| Tobacco – 1.7% | | | | |
Japan Tobacco, Inc. | | 134 | | 498,792 |
Philip Morris International, Inc. | | 30,408 | | 1,586,081 |
|
Tobacco Total | | | | 2,084,873 |
| | | | |
Consumer Staples Total | | | | 11,894,535 |
| | | | |
| Energy – 13.5% | | | | |
| Energy Equipment & Services – 5.1% |
Cameron International Corp. (a) | | 16,506 | | 707,447 |
CARBO Ceramics, Inc. | | 4,192 | | 261,329 |
Ensco International PLC, ADR | | 8,430 | | 377,495 |
National-Oilwell Varco, Inc. | | 16,005 | | 649,483 |
Noble Corp. (a) | | 12,431 | | 519,865 |
Schlumberger Ltd. | | 10,191 | | 646,721 |
Smith International, Inc. | | 18,193 | | 779,024 |
Tenaris SA, ADR | | 14,338 | | 615,674 |
Transocean Ltd. (a) | | 5,233 | | 452,027 |
Weatherford International Ltd. (a) | | 49,274 | | 781,486 |
Wellstream Holdings PLC | | 55,226 | | 548,925 |
|
Energy Equipment & Services Total | | 6,339,476 |
|
| Oil, Gas & Consumable Fuels – 8.4% |
Apache Corp. | | 8,470 | | 859,705 |
Cimarex Energy Co. | | 18,909 | | 1,122,816 |
Continental Resources, Inc. (a) | | 9,079 | | 386,312 |
Denbury Resources, Inc. (a) | | 57,593 | | 971,594 |
Devon Energy Corp. | | 10,698 | | 689,272 |
EOG Resources, Inc. | | 9,572 | | 889,622 |
Exxon Mobil Corp. | | 28,153 | | 1,885,688 |
Hess Corp. | | 11,555 | | 722,765 |
Occidental Petroleum Corp. | | 14,669 | | 1,240,117 |
Peabody Energy Corp. | | 10,151 | | 463,901 |
Petroleo Brasileiro SA, ADR | | 11,331 | | 504,116 |
StatoilHydro ASA, ADR | | 27,095 | | 632,126 |
|
Oil, Gas & Consumable Fuels Total | | | | 10,368,034 |
| | | | |
Energy Total | | | | 16,707,510 |
See Accompanying Notes to Financial Statements.
65
Columbia Select Opportunities Fund
March 31, 2010
Common Stocks (continued)
| | | | |
| | | Shares | | Value ($) |
| Financials – 15.2% | | | | |
| Capital Markets – 4.7% | | | | |
Charles Schwab Corp. | | 46,392 | | 867,066 |
Goldman Sachs Group, Inc. | | 5,185 | | 884,716 |
Invesco Ltd. | | 34,749 | | 761,351 |
Morgan Stanley | | 40,885 | | 1,197,522 |
Northern Trust Corp. | | 12,730 | | 703,460 |
Raymond James Financial, Inc. | | 23,722 | | 634,326 |
TD Ameritrade Holding Corp. (a) | | 40,079 | | 763,906 |
|
Capital Markets Total | | | | 5,812,347 |
| | |
| Commercial Banks – 5.1% | | | | |
Fifth Third Bancorp. | | 44,632 | | 606,549 |
HDFC Bank Ltd., ADR | | 5,295 | | 738,070 |
Itau Unibanco Holding SA, ADR | | 31,933 | | 702,207 |
PT Bank Central Asia Tbk | | 588,000 | | 355,404 |
TCF Financial Corp. | | 31,985 | | 509,841 |
Wells Fargo & Co. | | 90,937 | | 2,829,959 |
Wilmington Trust Corp. | | 31,135 | | 515,907 |
|
Commercial Banks Total | | | | 6,257,937 |
| | |
| Consumer Finance – 1.4% | | | | |
American Express Co. | | 18,356 | | 757,368 |
Discover Financial Services | | 63,584 | | 947,402 |
|
Consumer Finance Total | | | | 1,704,770 |
|
| Diversified Financial Services – 2.6% |
Hong Kong Exchanges & Clearing Ltd. | | 28,000 | | 467,373 |
JPMorgan Chase & Co. | | 56,081 | | 2,509,625 |
Portfolio Recovery Associates, Inc. (a) | | 5,421 | | 297,450 |
|
Diversified Financial Services Total | | | | 3,274,448 |
| | |
| Insurance – 1.4% | | | | |
ACE Ltd. | | 7,288 | | 381,162 |
Axis Capital Holdings Ltd. | | 8,286 | | 259,020 |
Primerica, Inc. (a) | | 7,263 | | 108,945 |
Principal Financial Group, Inc. | | 35,645 | | 1,041,191 |
|
Insurance Total | | | | 1,790,318 |
| | | | |
Financials Total | | | | 18,839,820 |
| | | | |
| Health Care – 11.3% | | | | |
| Biotechnology – 1.0% | | | | |
Alexion Pharmaceuticals, Inc. (a) | | 6,835 | | 371,619 |
Dendreon Corp. (a) | | 5,663 | | 206,530 |
Gilead Sciences, Inc. (a) | | 15,013 | | 682,791 |
|
Biotechnology Total | | | | 1,260,940 |
| | | | |
| | | Shares | | Value ($) |
| Health Care Equipment & Supplies – 2.3% |
Baxter International, Inc. | | 12,363 | | 719,527 |
Covidien PLC | | 10,867 | | 546,393 |
Hospira, Inc. (a) | | 9,523 | | 539,478 |
Insulet Corp. (a) | | 12,336 | | 186,150 |
NuVasive, Inc. (a) | | 9,626 | | 435,095 |
Smith & Nephew PLC, ADR | | 8,154 | | 408,189 |
|
Health Care Equipment & Supplies Total | | 2,834,832 |
|
| Health Care Providers & Services – 2.2% |
CIGNA Corp. | | 12,783 | | 467,602 |
Express Scripts, Inc. (a) | | 8,611 | | 876,255 |
Mednax, Inc. (a) | | 4,193 | | 243,991 |
UnitedHealth Group, Inc. | | 33,492 | | 1,094,184 |
|
Health Care Providers & Services Total | | 2,682,032 |
| | |
| Health Care Technology – 0.2% | | | | |
MedAssets, Inc. (a) | | 14,565 | | 305,865 |
|
Health Care Technology Total | | | | 305,865 |
|
| Life Sciences Tools & Services – 0.8% |
Life Technologies Corp. (a) | | 8,991 | | 469,960 |
QIAGEN N.V. (a) | | 21,050 | | 483,939 |
|
Life Sciences Tools & Services Total | | 953,899 |
|
| Pharmaceuticals – 4.8% |
Abbott Laboratories | | 21,227 | | 1,118,238 |
Allergan, Inc. | | 7,888 | | 515,244 |
Bayer AG | | 8,755 | | 592,193 |
Merck & Co., Inc. | | 40,614 | | 1,516,933 |
Roche Holding AG, Genusschein Shares | | 2,647 | | 429,284 |
Sanofi-Aventis SA, ADR | | 29,679 | | 1,108,808 |
Teva Pharmaceutical Industries Ltd., ADR | | 9,788 | | 617,427 |
|
Pharmaceuticals Total | | | | 5,898,127 |
| | | | |
Health Care Total | | | | 13,935,695 |
| | | | |
| Industrials – 10.8% | | | | |
| Aerospace & Defense – 0.9% | | | | |
United Technologies Corp. | | 15,964 | | 1,175,110 |
|
Aerospace & Defense Total | | | | 1,175,110 |
| | |
| Air Freight & Logistics – 0.7% | | | | |
Atlas Air Worldwide Holdings, Inc. (a) | | 6,543 | | 347,106 |
UTI Worldwide, Inc. | | 31,857 | | 488,049 |
|
Air Freight & Logistics Total | | | | 835,155 |
|
| Commercial Services & Supplies – 0.3% |
Tetra Tech, Inc. (a) | | 13,599 | | 313,321 |
|
Commercial Services & Supplies Total | | 313,321 |
See Accompanying Notes to Financial Statements.
66
Columbia Select Opportunities Fund
March 31, 2010
Common Stocks (continued)
| | | | |
| | | Shares | | Value ($) |
| Industrials (continued) | | | | |
| Construction & Engineering – 1.1% |
EMCOR Group, Inc. (a) | | 10,676 | | 262,950 |
Insituform Technologies, Inc., Class A (a) | | 19,554 | | 520,332 |
Quanta Services, Inc. (a) | | 30,949 | | 592,983 |
| | | | |
Construction & Engineering Total | | | | 1,376,265 |
| | |
| Industrial Conglomerates – 1.5% | | | | |
General Electric Co. | | 53,093 | | 966,292 |
Siemens AG, ADR | | 8,779 | | 877,637 |
| | | | |
Industrial Conglomerates Total | | | | 1,843,929 |
| | |
| Machinery – 3.4% | | | | |
Caterpillar, Inc. | | 14,606 | | 917,987 |
Cummins, Inc. | | 4,132 | | 255,977 |
Dover Corp. | | 12,407 | | 580,027 |
Joy Global, Inc. | | 14,770 | | 835,982 |
Kubota Corp. | | 75,000 | | 683,496 |
Parker Hannifin Corp. | | 14,821 | | 959,512 |
| | | | |
Machinery Total | | | | 4,232,981 |
| | |
| Marine – 1.5% | | | | |
A.P. Moller – Maersk A/S, Class B | | 125 | | 952,502 |
Diana Shipping, Inc. (a) | | 31,710 | | 479,455 |
Genco Shipping & Trading Ltd. (a) | | 23,012 | | 485,784 |
| | | | |
Marine Total | | | | 1,917,741 |
| | |
| Professional Services – 0.6% | | | | |
Huron Consulting Group, Inc. (a) | | 15,434 | | 313,310 |
TrueBlue, Inc. (a) | | 24,820 | | 384,710 |
| | | | |
Professional Services Total | | | | 698,020 |
| | |
| Road & Rail – 0.8% | | | | |
Landstar System, Inc. | | 11,409 | | 478,950 |
Union Pacific Corp. | | 7,425 | | 544,252 |
| | | | |
Road & Rail Total | | | | 1,023,202 |
| | | | |
Industrials Total | | | | 13,415,724 |
| | | | |
| Information Technology – 19.0% | | | | |
| Communications Equipment – 1.5% |
Adtran, Inc. | | 21,713 | | 572,137 |
QUALCOMM, Inc. | | 29,618 | | 1,243,660 |
| | | | |
Communications Equipment Total | | | | 1,815,797 |
| | |
| Computers & Peripherals – 5.4% | | | | |
Apple, Inc. (a) | | 9,048 | | 2,125,647 |
Hewlett-Packard Co. | | 42,972 | | 2,283,962 |
International Business Machines Corp. | | 17,536 | | 2,248,992 |
| | | | |
Computers & Peripherals Total | | | | 6,658,601 |
| | | | |
| | | Shares | | Value ($) |
| Electronic Equipment, Instruments & Components – 0.8% |
Hollysys Automation Technologies Ltd. (a) | | 23,094 | | 265,812 |
Tyco Electronics Ltd. | | 26,644 | | 732,177 |
| | | | |
Electronic Equipment, Instruments & Components Total | | 997,989 |
| |
| Internet Software & Services – 2.4% | | |
eBay, Inc. (a) | | 38,061 | | 1,025,744 |
Google, Inc., Class A (a) | | 2,916 | | 1,653,401 |
GSI Commerce, Inc. (a) | | 11,835 | | 327,475 |
| | | | |
Internet Software & Services Total | | | | 3,006,620 |
| | |
| IT Services – 2.1% | | | | |
Alliance Data Systems Corp. (a) | | 11,970 | | 765,960 |
Hewitt Associates, Inc., Class A (a) | | 10,788 | | 429,147 |
MasterCard, Inc., Class A | | 3,016 | | 766,064 |
Redecard SA | | 36,500 | | 675,261 |
| | | | |
IT Services Total | | | | 2,636,432 |
|
| Semiconductors & Semiconductor Equipment – 2.4% |
Advanced Energy Industries, Inc. (a) | | 28,790 | | 476,762 |
Atmel Corp. (a) | | 106,152 | | 533,945 |
Disco Corp. | | 7,300 | | 448,979 |
Intel Corp. | | 50,036 | | 1,113,801 |
Micron Technology, Inc. (a) | | 38,762 | | 402,737 |
| | | | |
Semiconductors & Semiconductor Equipment Total | | 2,976,224 |
| | |
| Software – 4.4% | | | | |
Electronic Arts, Inc. (a) | | 31,358 | | 585,140 |
Microsoft Corp. | | 97,124 | | 2,842,820 |
Nuance Communications, Inc. (a) | | 21,671 | | 360,605 |
Oracle Corp. | | 37,976 | | 975,603 |
TIBCO Software, Inc. (a) | | 33,699 | | 363,612 |
VanceInfo Technologies, Inc., ADR (a) | | 10,781 | | 240,309 |
| | | | |
Software Total | | | | 5,368,089 |
| | | | |
Information Technology Total | | 23,459,752 |
| | | | |
| Materials – 5.0% | | | | |
| Chemicals – 1.3% | | | | |
Ferro Corp. (a) | | 64,293 | | 565,135 |
Monsanto Co. | | 6,025 | | 430,306 |
Potash Corp. of Saskatchewan, Inc. | | 4,801 | | 572,999 |
| | | | |
Chemicals Total | | | | 1,568,440 |
| | |
| Construction Materials – 0.5% | | | | |
Cemex SAB de CV, ADR (a) | | 59,647 | | 608,996 |
| | | | |
Construction Materials Total | | | | 608,996 |
See Accompanying Notes to Financial Statements.
67
Columbia Select Opportunities Fund
March 31, 2010
Common Stocks (continued)
| | | | |
| | | Shares | | Value ($) |
| Materials (continued) | | | | |
| Metals & Mining – 3.2% | | | | |
AK Steel Holding Corp. | | 29,859 | | 682,577 |
ArcelorMittal, NY Registered Shares | | 18,588 | | 816,199 |
Eurasian Natural Resources Corp. PLC | | 33,724 | | 610,020 |
Freeport-McMoRan Copper & Gold, Inc. | | 14,741 | | 1,231,463 |
Thompson Creek Metals Co., Inc. (a) | | 48,316 | | 653,715 |
| | | | |
Metals & Mining Total | | | | 3,993,974 |
| | | | |
Materials Total | | | | 6,171,410 |
| | | | |
| Telecommunication Services – 1.5% |
| Wireless Telecommunication Services – 1.5% |
American Tower Corp., Class A (a) | | 13,791 | | 587,635 |
Millicom International Cellular SA | | 3,584 | | 319,514 |
Mobile TeleSystems OJSC, ADR | | 12,295 | | 682,372 |
Turkcell Iletisim Hizmet AS, ADR | | 16,422 | | 247,315 |
| | | | |
Wireless Telecommunication Services Total | | 1,836,836 |
| | | | |
Telecommunication Services Total | | 1,836,836 |
| | | | |
| Utilities – 2.4% | | | | |
| Gas Utilities – 0.8% | | | | |
PT Perusahaan Gas Negara Tbk | | 2,084,500 | | 973,584 |
| | | | |
Gas Utilities Total | | | | 973,584 |
|
| Independent Power Producers & Energy Traders – 0.5% |
AES Corp. (a) | | 54,658 | | 601,238 |
| | | | |
Independent Power Producers & Energy Traders Total | | 601,238 |
|
| Multi-Utilities – 1.1% |
Alliant Energy Corp. | | 22,829 | | 759,292 |
Public Service Enterprise Group, Inc. | | 21,673 | | 639,787 |
| | | | |
Multi-Utilities Total | | | | 1,399,079 |
| | | | |
Utilities Total | | | | 2,973,901 |
| | | | |
Total Common Stocks
(cost of $90,023,940) | | 121,939,842 |
| | | | |
| | | Par ($) | | Value ($) |
Short-Term Obligation – 1.1% | | | | |
Repurchase agreement with Fixed Income Clearing Corp., dated 03/31/10, due 04/01/10 at 0.000%, collateralized by U.S. Treasury obligation maturing 01/31/14, market value $1,387,750 (repurchase proceeds $1,360,000) | | 1,360,000 | | 1,360,000 |
| | | | |
Total Short-Term Obligation
(cost of $1,360,000) | | 1,360,000 |
| | | | |
Total Investments – 99.7%
(cost of $91,383,940)(b) | | 123,299,842 |
| | | | |
Other Assets & Liabilities, Net – 0.3% | | 374,836 |
| | | | |
Net Assets – 100.0% | | | | 123,674,678 |
Notes to Investment Portfolio:
| (a) | Non-income producing security. |
| (b) | Cost for federal income tax purposes is $91,477,883. |
The following table summarizes the inputs used, as of March 31, 2010, in valuing the Fund’s assets:
| | | | | | | | | | | | |
Description | | Quoted Prices
(Level 1) | | Other
Significant
Observable
Inputs
(Level 2) | | Significant
Unobservable
Inputs
(Level 3) | | Total |
Common Stocks | | | | | | | | | | | | |
Consumer Discretionary | | $ | 11,037,796 | | $ | 1,666,863 | | $ | — | | $ | 12,704,659 |
Consumer Staples | | | 10,503,242 | | | 1,391,293 | | | — | | | 11,894,535 |
Energy | | | 16,158,585 | | | 548,925 | | | — | | | 16,707,510 |
Financials | | | 18,017,043 | | | 822,777 | | | — | | | 18,839,820 |
Health Care | | | 12,914,218 | | | 1,021,477 | | | — | | | 13,935,695 |
Industrials | | | 11,779,726 | | | 1,635,998 | | | — | | | 13,415,724 |
Information Technology | | | 23,010,773 | | | 448,979 | | | — | | | 23,459,752 |
Materials | | | 5,561,390 | | | 610,020 | | | — | | | 6,171,410 |
Telecommunication Services | | | 1,836,836 | | | — | | | — | | | 1,836,836 |
Utilities | | | 2,000,317 | | | 973,584 | | | — | | | 2,973,901 |
| | | | | | | | | | | | |
Total Common Stocks | | | 112,819,926 | | | 9,119,916 | | | — | | | 121,939,842 |
| | | | | | | | | | | | |
Total Short-Term Obligation | | | — | | | 1,360,000 | | | — | | | 1,360,000 |
| | | | | | | | | | | | |
Total Investments | | $ | 112,819,926 | | $ | 10,479,916 | | $ | — | | $ | 123,299,842 |
| | | | | | | | | | | | |
The Fund’s assets assigned to Level 2 input category include certain foreign securities for which a third party statistical pricing service may be employed for purposes of fair market valuation.
See Accompanying Notes to Financial Statements.
68
Columbia Select Opportunities Fund
March 31, 2010
Common Stocks (continued)
For more information on valuation inputs, and their aggregation into the levels used in the table above, please refer to the Security Valuation section in the accompanying Notes to Financial Statements.
At March 31, 2010, the Fund held investments in the following sectors:
| | |
Sector (Unaudited) | | % of
Net
Assets |
Information Technology | | 19.0 |
Financials | | 15.2 |
Energy | | 13.5 |
Health Care | | 11.3 |
Industrials | | 10.8 |
Consumer Discretionary | | 10.3 |
Consumer Staples | | 9.6 |
Materials | | 5.0 |
Utilities | | 2.4 |
Telecommunication Services | | 1.5 |
| | |
| | 98.6 |
Short Term Obligation | | 1.1 |
Other Assets & Liabilities, Net | | 0.3 |
| | |
| | 100.0 |
| | |
| | |
Acronym | | Name |
| ADR | | American Depositary Receipt |
See Accompanying Notes to Financial Statements.
69
Investment Portfolio – Columbia Select Small Cap Fund
March 31, 2010
Common Stocks – 99.8%
| | | | |
| | | Shares | | Value ($) |
| Consumer Discretionary – 19.7% | | | | |
| Automobiles – 2.5% | | | | |
Thor Industries, Inc. | | 510,000 | | 15,407,100 |
| | | | |
Automobiles Total | | 15,407,100 |
|
| Diversified Consumer Services – 3.5% |
Sotheby’s | | 700,000 | | 21,763,000 |
| | | | |
Diversified Consumer Services Total | | 21,763,000 |
|
| Hotels, Restaurants & Leisure – 2.8% |
P.F. Chang’s China Bistro, Inc. (a) | | 400,000 | | 17,652,000 |
| | | | |
Hotels, Restaurants & Leisure Total | | 17,652,000 |
|
| Household Durables – 3.7% |
Meritage Home Corp. (a) | | 420,000 | | 8,820,000 |
Ryland Group, Inc. | | 640,000 | | 14,361,600 |
| | | | |
Household Durables Total | | 23,181,600 |
|
| Specialty Retail – 4.8% |
RadioShack Corp. | | 460,000 | | 10,409,800 |
Williams-Sonoma, Inc. | | 740,000 | | 19,454,600 |
| | | | |
Specialty Retail Total | | 29,864,400 |
|
| Textiles, Apparel & Luxury Goods – 2.4% |
Liz Claiborne, Inc. (a) | | 2,000,000 | | 14,860,000 |
| | | | |
Textiles, Apparel & Luxury Goods Total | | 14,860,000 |
| | | | |
Consumer Discretionary Total | | 122,728,100 |
| | | | |
| Energy – 8.8% |
| Energy Equipment & Services – 4.0% |
Helix Energy Solutions Group, Inc. (a) | | 820,000 | | 10,684,600 |
Helmerich & Payne, Inc. | | 380,000 | | 14,470,400 |
| | | | |
Energy Equipment & Services Total | | 25,155,000 |
|
| Oil, Gas & Consumable Fuels – 4.8% |
Overseas Shipholding Group, Inc. | | 340,000 | | 13,338,200 |
St. Mary Land & Exploration Co. | | 480,000 | | 16,708,800 |
| | | | |
Oil, Gas & Consumable Fuels Total | | 30,047,000 |
| | | | |
Energy Total | | | | 55,202,000 |
| | | | |
| Financials – 17.3% | | | | |
| Capital Markets – 7.5% | | | | |
Greenhill & Co., Inc. | | 200,000 | | 16,418,000 |
KBW, Inc. (a) | | 560,000 | | 15,064,000 |
Legg Mason, Inc. | | 540,000 | | 15,481,800 |
| | | | |
Capital Markets Total | | 46,963,800 |
| | | | |
| | | Shares | | Value ($) |
| Commercial Banks – 8.2% | | | | |
City National Corp. | | 280,000 | | 15,111,600 |
Wintrust Financial Corp. | | 460,000 | | 17,116,600 |
Zions Bancorporation | | 880,000 | | 19,201,600 |
| | | | |
Commercial Banks Total | | 51,429,800 |
|
| Real Estate Management & Development – 1.6% |
St. Joe Co. (a) | | 300,000 | | 9,705,000 |
| | | | |
Real Estate Management & Development Total | | 9,705,000 |
| | | | |
Financials Total | | 108,098,600 |
| | | | |
| Health Care – 3.1% |
| Health Care Equipment & Supplies – 2.5% |
Cooper Companies, Inc. | | 400,000 | | 15,552,000 |
| | | | |
Health Care Equipment & Supplies Total | | 15,552,000 |
|
| Pharmaceuticals – 0.6% |
Endo Pharmaceuticals Holdings, Inc. (a) | | 160,000 | | 3,790,400 |
| | | | |
Pharmaceuticals Total | | 3,790,400 |
| | | | |
Health Care Total | | 19,342,400 |
| | | | |
| Industrials – 19.0% |
| Building Products – 3.9% |
Quanex Building Products Corp. | | 640,000 | | 10,579,200 |
Simpson Manufacturing Co., Inc. | | 500,000 | | 13,880,000 |
| | | | |
Building Products Total | | 24,459,200 |
|
| Construction & Engineering – 4.8% |
Chicago Bridge & Iron Co., NV, N.Y. Registered Shares (a) | | 540,000 | | 12,560,400 |
Shaw Group, Inc. (a) | | 500,000 | | 17,210,000 |
| | | | |
Construction & Engineering Total | | 29,770,400 |
|
| Machinery – 6.2% |
Barnes Group, Inc. | | 600,000 | | 11,670,000 |
Bucyrus International, Inc. | | 200,000 | | 13,198,000 |
Kaydon Corp. | | 360,000 | | 13,536,000 |
| | | | |
Machinery Total | | 38,404,000 |
|
| Marine – 1.4% |
Diana Shipping, Inc. (a) | | 600,000 | | 9,072,000 |
| | | | |
Marine Total | | 9,072,000 |
|
| Road & Rail – 2.7% |
Kansas City Southern (a) | | 460,000 | | 16,638,200 |
| | | | |
Road & Rail Total | | 16,638,200 |
| | | | |
Industrials Total | | 118,343,800 |
See Accompanying Notes to Financial Statements.
70
Columbia Select Small Cap Fund
March 31, 2010
Common Stocks (continued)
| | | | |
| | | Shares | | Value ($) |
| Information Technology – 26.3% | | | | |
| Communications Equipment – 10.0% |
CommScope, Inc. (a) | | 460,000 | | 12,889,200 |
F5 Networks, Inc. (a) | | 280,000 | | 17,222,800 |
InterDigital, Inc. (a) | | 620,000 | | 17,273,200 |
Plantronics, Inc. | | 480,000 | | 15,014,400 |
| | | | |
Communications Equipment Total | | 62,399,600 |
|
| Internet Software & Services – 2.1% |
Monster Worldwide, Inc. (a) | | 800,000 | | 13,288,000 |
| | | | |
Internet Software & Services Total | | 13,288,000 |
|
| IT Services – 3.9% |
Forrester Research, Inc. (a) | | 400,000 | | 12,028,000 |
Hewitt Associates, Inc., Class A (a) | | 300,000 | | 11,934,000 |
| | | | |
IT Services Total | | 23,962,000 |
|
| Semiconductors & Semiconductor Equipment – 5.0% |
Cabot Microelectronics Corp. (a) | | 300,000 | | 11,349,000 |
Power Integrations, Inc. | | 480,000 | | 19,776,000 |
| | | | |
Semiconductors & Semiconductor Equipment Total | | 31,125,000 |
|
| Software – 5.3% |
Fair Isaac Corp. | | 600,000 | | 15,204,000 |
Manhattan Associates, Inc. (a) | | 710,000 | | 18,090,800 |
| | | | |
Software Total | | 33,294,800 |
| | | | |
Information Technology Total | | 164,069,400 |
| | | | |
| Materials – 4.6% | | | | |
| Chemicals – 2.4% |
OM Group, Inc. (a) | | 440,000 | | 14,907,200 |
| | | | |
Chemicals Total | | 14,907,200 |
|
| Metals & Mining – 2.2% |
Brush Engineered Materials, Inc. (a) | | 620,000 | | 13,993,400 |
| | | | |
Metals & Mining Total | | 13,993,400 |
| | | | |
Materials Total | | 28,900,600 |
| | | | |
| Telecommunication Services – 1.0% |
| Diversified Telecommunication Services – 1.0% |
Iridium Communications, Inc. (a) | | 740,000 | | 6,001,400 |
| | | | |
Diversified Telecommunication Services Total | | 6,001,400 |
| | | | |
Telecommunication Services Total | | 6,001,400 |
| | | | |
Total Common Stocks
(cost of $470,182,008) | | | | 622,686,300 |
Short-Term Obligation – 0.3%
| | | | | |
| | | Par ($) | | Value ($) | |
Repurchase agreement with Fixed Income Clearing Corp., dated 03/31/10, due 04/01/10 at 0.000%, collateralized by a U.S. Treasury obligation maturing 01/31/14, market value $2,081,625 (repurchase proceeds $2,040,000) | | 2,040,000 | | 2,040,000 | |
| | | | | |
Total Short-Term Obligation
(cost of $2,040,000) | | 2,040,000 | |
| | | | | |
Total Investments – 100.1%
(cost of $472,222,008)(b) | | 624,726,300 | |
| | | | | |
Other Assets & Liabilities, Net – (0.1)% | | (756,525 | ) |
| | | | | |
Net Assets – 100.0% | | 623,969,775 | |
Notes to Investment Portfolio:
| (a) | Non-income producing security. |
| (b) | Cost for federal income tax purposes is $476,346,374. |
An affiliate may include any company in which the Fund owns five percent or more of its outstanding voting shares. Transactions with companies which are or were affiliates during the year ended March 31, 2010, are as follows:
| | | | | | | | | | | | | | | |
Affiliate | | Value,
beginning
of period | | Purchases | | Sales
Proceeds | | Dividend
Income | | Value,
end of
period |
Innovative Solutions & Support, Inc. | | $ | 4,230,000 | | $ | — | | $ | 4,607,310 | | $ | — | | $ | — |
| | | | | | | | | | | | | | | |
The following table summarizes the inputs used, as of March 31, 2010, in valuing the Fund’s assets:
| | | | | | | | | | | | |
Description | | Quoted Prices
(Level 1) | | Other
Significant
Observable
Inputs
(Level 2) | | Significant
Unobservable
Inputs
(Level 3) | | Total |
Total Common Stocks | | $ | 622,686,300 | | $ | — | | $ | — | | $ | 622,686,300 |
| | | | | | | | | | | | |
Total Short-Term Obligation | | | — | | | 2,040,000 | | | — | | | 2,040,000 |
| | | | | | | | | | | | |
Total Investments | | $ | 622,686,300 | | $ | 2,040,000 | | $ | — | | $ | 624,726,300 |
| | | | | | | | | | | | |
For more information on valuation inputs, and their aggregation into the levels used in the table above, please refer to the Security Valuation section in the accompanying Notes to Financial Statements.
See Accompanying Notes to Financial Statements.
71
Columbia Select Small Cap Fund
March 31, 2010
At March 31, 2010, the Fund held investments in the following sectors:
| | | |
Sector (Unaudited) | | % of
Net Assets | |
Information Technology | | 26.3 | |
Consumer Discretionary | | 19.7 | |
Industrials | | 19.0 | |
Financials | | 17.3 | |
Energy | | 8.8 | |
Materials | | 4.6 | |
Health Care | | 3.1 | |
Telecommunication Services | | 1.0 | |
| | | |
| | 99.8 | |
Short-Term Obligation | | 0.3 | |
Other Assets & Liabilities, Net | | (0.1 | ) |
| | | |
| | 100.0 | |
| | | |
See Accompanying Notes to Financial Statements.
72
Investment Portfolio – Columbia Value and Restructuring Fund
March 31, 2010
Common Stocks – 98.7%
| | | | |
| | | Shares | | Value ($) |
| Consumer Discretionary – 5.0% |
| Household Durables – 2.9% | | | | |
Newell Rubbermaid, Inc. | | 3,800,000 | | 57,760,000 |
Stanley Black & Decker, Inc. (a) | | 2,600,000 | | 149,266,000 |
|
Household Durables Total | | | | 207,026,000 |
| | |
Multiline Retail – 0.1% | | | | |
Dollar General Corp. (b) | | 350,000 | | 8,837,500 |
|
Multiline Retail Total | | | | 8,837,500 |
| | |
Specialty Retail – 2.0% | | | | |
TJX Companies, Inc. | | 3,350,000 | | 142,442,000 |
|
Specialty Retail Total | | | | 142,442,000 |
|
Consumer Discretionary Total | | 358,305,500 |
| | | | |
| Consumer Staples – 6.5% | | | | |
| Food Products – 0.8% | | | | |
Dean Foods Co. (a)(b) | | 2,000,000 | | 31,380,000 |
Dole Food Co., Inc. (b) | | 2,250,000 | | 26,662,500 |
|
Food Products Total | | | | 58,042,500 |
| | |
Personal Products – 1.7% | | | | |
Avon Products, Inc. | | 3,600,000 | | 121,932,000 |
|
Personal Products Total | | | | 121,932,000 |
| | |
Tobacco – 4.0% | | | | |
Lorillard, Inc. | | 3,800,000 | | 285,912,000 |
|
Tobacco Total | | | | 285,912,000 |
|
Consumer Staples Total | | | | 465,886,500 |
| | | | |
| Energy – 23.3% | | | | |
| Oil, Gas & Consumable Fuels – 23.3% |
Alpha Natural Resources, Inc. (a)(b)(c) | | 5,900,000 | | 294,351,000 |
Anadarko Petroleum Corp. (a) | | 2,350,000 | | 171,150,500 |
Cloud Peak Energy, Inc. (b) | | 1,100,000 | | 18,304,000 |
ConocoPhillips | | 2,950,000 | | 150,951,500 |
Consol Energy, Inc. | | 4,500,000 | | 191,970,000 |
Devon Energy Corp. (a) | | 2,450,000 | | 157,853,500 |
El Paso Corp. | | 3,200,000 | | 34,688,000 |
Murphy Oil Corp. | | 1,100,000 | | 61,809,000 |
Noble Energy, Inc. | | 1,900,000 | | 138,700,000 |
PetroHawk Energy Corp. (a)(b) | | 4,000,000 | | 81,120,000 |
Petroleo Brasileiro SA, ADR | | 7,350,000 | | 327,001,500 |
Rosetta Resources, Inc. (b)(d)(e) | | 1,300,000 | | 30,615,000 |
W&T Offshore, Inc. | | 1,650,000 | | 13,860,000 |
|
Oil, Gas & Consumable Fuels Total | | 1,672,374,000 |
|
Energy Total | | | | 1,672,374,000 |
| | | | |
| | | Shares | | Value ($) |
| Financials – 16.5% | | | | |
| Capital Markets – 6.0% | | | | |
Apollo Investment Corp. (f) | | 4,200,000 | | 53,466,000 |
Goldman Sachs Group, Inc. | | 830,000 | | 141,622,900 |
Invesco Ltd. | | 5,900,000 | | 129,269,000 |
Morgan Stanley | | 3,650,000 | | 106,908,500 |
|
Capital Markets Total | | | | 431,266,400 |
| | |
Commercial Banks – 2.0% | | | | |
Banco Santander SA, ADR (a) | | 2,500,000 | | 33,175,000 |
PNC Financial Services Group, Inc. | | 1,900,000 | | 113,430,000 |
|
Commercial Banks Total | | | | 146,605,000 |
|
Diversified Financial Services – 1.8% |
JPMorgan Chase & Co. | | 2,850,000 | | 127,537,500 |
|
Diversified Financial Services Total | | 127,537,500 |
| | |
Insurance – 5.5% | | | | |
ACE Ltd. | | 3,700,000 | | 193,510,000 |
Loews Corp. | | 2,300,000 | | 85,744,000 |
MetLife, Inc. | | 2,750,000 | | 119,185,000 |
|
Insurance Total | | | | 398,439,000 |
|
Real Estate Investment Trusts (REITs) – 1.2% |
DiamondRock Hospitality Co. (b) | | 4,850,000 | | 49,033,500 |
Host Hotels & Resorts, Inc. (a) | | 2,300,000 | | 33,695,000 |
|
Real Estate Investment Trusts (REITs) Total | | 82,728,500 |
| | | | |
Financials Total | | | | 1,186,576,400 |
| | | | |
| Health Care – 5.6% | | | | |
| Biotechnology – 0.4% | | | | |
Talecris Biotherapeutics Holdings Corp. (b) | | 1,300,000 | | 25,896,000 |
|
Biotechnology Total | | | | 25,896,000 |
|
Health Care Equipment & Supplies – 1.5% |
Baxter International, Inc. | | 1,900,000 | | 110,580,000 |
|
Health Care Equipment & Supplies Total | | 110,580,000 |
|
Health Care Providers & Services – 2.0% |
AmerisourceBergen Corp. | | 4,900,000 | | 141,708,000 |
|
Health Care Providers & Services Total | | 141,708,000 |
| | |
Pharmaceuticals – 1.7% | | | | |
Bristol-Myers Squibb Co. | | 4,700,000 | | 125,490,000 |
|
Pharmaceuticals Total | | | | 125,490,000 |
| | | | |
Health Care Total | | | | 403,674,000 |
See Accompanying Notes to Financial Statements.
73
Columbia Value and Restructuring Fund
March 31, 2010
Common Stocks (continued)
| | | | |
| | | Shares | | Value ($) |
| Industrials – 15.8% | | | | |
| Aerospace & Defense – 2.8% |
AerCap Holdings NV (b)(c) | | 5,400,000 | | 62,208,000 |
United Technologies Corp. | | 1,950,000 | | 143,539,500 |
|
Aerospace & Defense Total | | | | 205,747,500 |
| | |
Airlines – 1.6% | | | | |
Copa Holdings SA, Class A | | 1,900,000 | | 115,520,000 |
|
Airlines Total | | | | 115,520,000 |
|
Construction & Engineering – 0.8% |
AECOM Technology Corp. (b) | | 2,050,000 | | 58,158,500 |
|
Construction & Engineering Total | | 58,158,500 |
|
Industrial Conglomerates – 1.6% |
Tyco International Ltd. | | 3,100,000 | | 118,575,000 |
|
Industrial Conglomerates Total | | 118,575,000 |
| | |
Machinery – 4.1% | | | | |
AGCO Corp. (a)(b) | | 3,500,000 | | 125,545,000 |
Eaton Corp. | | 2,200,000 | | 166,694,000 |
|
Machinery Total | | 292,239,000 |
| | |
Road & Rail – 4.5% | | | | |
Ryder System, Inc. | | 1,300,000 | | 50,388,000 |
Union Pacific Corp. | | 3,700,000 | | 271,210,000 |
|
Road & Rail Total | | | | 321,598,000 |
|
Trading Companies & Distributors – 0.4% |
RSC Holdings, Inc. (a)(b) | | 3,550,000 | | 28,258,000 |
|
Trading Companies & Distributors Total | | 28,258,000 |
|
Industrials Total | | | | 1,140,096,000 |
| | | | |
| Information Technology – 8.0% |
| Communications Equipment – 4.7% |
CommScope, Inc. (b) | | 3,000,000 | | 84,060,000 |
Harris Corp. | | 5,300,000 | | 251,697,000 |
|
Communications Equipment Total | | 335,757,000 |
|
Computers & Peripherals – 2.8% |
International Business Machines Corp. | | 1,600,000 | | 205,200,000 |
|
Computers & Peripherals Total | | 205,200,000 |
|
Electronic Equipment, Instruments & Components – 0.5% |
Corning, Inc. | | 1,700,000 | | 34,357,000 |
|
Electronic Equipment, Instruments & Components Total | | 34,357,000 |
|
Information Technology Total | | 575,314,000 |
| | | | |
| | | Shares | | Value ($) |
| Materials – 13.3% | | | | |
| Chemicals – 4.4% | | | | |
Celanese Corp., Series A | | 4,900,000 | | 156,065,000 |
Lanxess AG | | 2,000,000 | | 92,154,882 |
PPG Industries, Inc. (a) | | 1,000,000 | | 65,400,000 |
|
Chemicals Total | | | | 313,619,882 |
| | |
Metals & Mining – 8.9% | | | | |
Freeport-McMoRan Copper & Gold, Inc. (b) | | 1,800,000 | | 150,372,000 |
Grupo Mexico SAB de CV, Series B | | 54,000,000 | | 144,611,465 |
Schnitzer Steel Industries, Inc., Class A | | 1,300,000 | | 68,289,000 |
Southern Copper Corp. (a) | | 5,250,000 | | 166,267,500 |
Vale SA, ADR | | 3,500,000 | | 112,665,000 |
|
Metals & Mining Total | | | | 642,204,965 |
|
Materials Total | | | | 955,824,847 |
| | | | |
| Telecommunication Services – 4.3% |
| Diversified Telecommunication Services – 0.6% |
Windstream Corp. | | 3,700,000 | | 40,293,000 |
|
Diversified Telecommunication Services Total | | 40,293,000 |
|
Wireless Telecommunication Services – 3.7% |
America Movil SAB de CV, Series L, ADR | | 5,350,000 | | 269,319,000 |
|
Wireless Telecommunication Services Total | | 269,319,000 |
|
Telecommunication Services Total | | 309,612,000 |
| | |
| Utilities – 0.4% | | | | |
| Electric Utilities – 0.4% | | | | |
Enel SpA | | 5,500,000 | | 30,754,311 |
|
Electric Utilities Total | | | | 30,754,311 |
|
Utilities Total | | | | 30,754,311 |
|
Total Common Stocks
(cost of $5,252,120,430) | | 7,098,417,558 |
See Accompanying Notes to Financial Statements.
74
Columbia Value and Restructuring Fund
March 31, 2010
Convertible Preferred Stock – 0.3%
| | | | | |
| | | Shares | | Value ($) | |
| Financials – 0.3% | |
| Diversified Financial Services – 0.3% | |
Citigroup, Inc., 7.500% | | 185,000 | | 22,547,800 | |
| |
Diversified Financial Services Total | | 22,547,800 | |
| |
Financials Total | | | | 22,547,800 | |
| |
Total Convertible Preferred Stock
(cost of $19,149,314) | | 22,547,800 | |
| | |
Convertible Bond – 1.1% | | | | | |
| | | Par ($) | | | |
| Consumer Cyclical – 1.1% | | | | | |
| Auto Manufacturers – 1.1% | | | | | |
Ford Motor Co.
4.250% 11/15/16 | | 50,000,000 | | 74,812,500 | |
| |
Auto Manufacturers Total | | 74,812,500 | |
| |
Consumer Cyclical Total | | 74,812,500 | |
| |
Total Convertible Bond
(cost of $51,018,137) | | | | 74,812,500 | |
| |
Total Investments – 100.1%
(cost of $5,322,287,881) (g) | | 7,195,777,858 | |
| |
Other Assets & Liabilities, Net – (0.1)% | | (5,778,146 | ) |
| |
Net Assets – 100.0% | | 7,189,999,712 | |
Notes to Investment Portfolio:
| (a) | All or a portion of this security is pledged as collateral for open written options contracts. |
| (b) | Non-income producing security. |
| (c) | An affiliate may include any company in which the Fund owns five percent or more of its outstanding voting shares. Transactions with companies which are or were affiliates during the year ended March 31, 2010, are as follows: |
| | | | | | | | | | | | | | | |
Affiliate | | Value,
beginning
of period | | Purchases | | Sales
Proceeds | | Dividend
Income | | Value,
end
of period |
AerCap Holdings NV | | $ | 16,250,000 | | $ | 5,167,214 | | $ | 1,275,060 | | $ | — | | $ | 62,208,000 |
Alpha Natural Resources, Inc. | | | 68,781,250 | | | 4,252,678 | | | 8,836,255 | | | — | | | 294,351,000 |
| | | | | | | | | | | | | | | |
Total | | $ | 85,031,250 | | $ | 9,419,892 | | $ | 10,111,315 | | $ | — | | $ | 356,559,000 |
| | | | | | | | | | | | | | | |
| (d) | Security exempt from registration pursuant to Rule 144A under the Securities Act of 1933. These securities may be resold in transactions exempt from registration, normally to qualified institutional buyers. At March 31, 2010, this security, which is not illiquid, amounted to $30,615,000, which represents 0.4% of net assets. |
| (e) | Represents fair value as determined in good faith under procedures approved by the Board of Trustees. At March 31, 2010, the value of this security amounted to $30,615,000, which represents 0.4% of net assets. |
| (f) | Closed-end Management Investment Company. |
| (g) | Cost for federal income tax purposes is $5,332,399,139. |
The following table summarizes the inputs used, as of March 31, 2010, in valuing the Fund’s assets:
| | | | | | | | | | | | | | |
Description | | Quoted Prices in
(Level 1) | | | Other
Significant
Observable
Inputs
(Level 2) | | Significant
Unobservable
Inputs
(Level 3) | | Total | |
Common Stocks | | | | | | | | | | | | | | |
Consumer Discretionary | | $ | 358,305,500 | | | $ | — | | $ | — | | $ | 358,305,500 | |
Consumer Staples | | | 465,886,500 | | | | — | | | — | | | 465,886,500 | |
Energy | | | 1,641,759,000 | | | | 30,615,000 | | | — | | | 1,672,374,000 | |
Financials | | | 1,186,576,400 | | | | — | | | — | | | 1,186,576,400 | |
Health Care | | | 403,674,000 | | | | — | | | — | | | 403,674,000 | |
Industrials | | | 1,140,096,000 | | | | — | | | — | | | 1,140,096,000 | |
Information Technology | | | 575,314,000 | | | | — | | | — | | | 575,314,000 | |
Materials | | | 863,669,965 | | | | 92,154,882 | | | — | | | 955,824,847 | |
Telecommuni- cation Services | | | 309,612,000 | | | | — | | | — | | | 309,612,000 | |
Utilities | | | — | | | | 30,754,311 | | | — | | | 30,754,311 | |
| | | | | | | | | | | | | | |
Total Common Stocks | | | 6,944,893,365 | | | | 153,524,193 | | | — | | | 7,098,417,558 | |
| | | | | | | | | | | | | | |
Total Convertible Preferred Stock | | | 22,547,800 | | | | — | | | — | | | 22,547,800 | |
| | | | | | | | | | | | | | |
Total Convertible Bond | | | — | | | | 74,812,500 | | | — | | | 74,812,500 | |
| | | | | | | | | | | | | | |
Total Investments | | | 6,967,441,165 | | | | 228,336,693 | | | — | | | 7,195,777,858 | |
| | | | | | | | | | | | | | |
Value of Written Call Option Contracts | | | (593,000 | ) | | | — | | | — | | | (593,000 | ) |
| | | | | | | | | | | | | | |
Total | | $ | 6,966,848,165 | | | $ | 228,336,693 | | $ | — | | $ | 7,195,184,858 | |
| | | | | | | | | | | | | | |
The Fund’s assets assigned to the Level 2 input category include certain foreign securities for which a third party statistical pricing service may be employed for purposes of fair market valuation.
See Accompanying Notes to Financial Statements.
75
Columbia Value and Restructuring Fund
March 31, 2010
The following table reconciles asset balances for the year ended March 31, 2010, in which significant unobservable inputs (Level 3) were used in determining value:
| | | | | | | | | | | | | | | | | | | | | | | | | | |
Investment in Securities | | Balance as
of March 31,
2009 | | Realized
Gain (Loss) | | | Change in
Unrealized
Appreciation
(Depreciation) | | Purchases | | Sales | | | Transfers
into Level 3 | | Transfers
out of Level 3 | | Balance as
of March 31,
2010 |
Common Stocks | | | | | | | | | | | | | | | | | | | | | | | | | | |
Financials | | $ | 791,985 | | $ | (4,094,967 | ) | | $ | 4,685,745 | | $ | — | | $ | (1,382,763 | ) | | $ | — | | $ | — | | $ | — |
The information in the above reconciliation represents fiscal year to date activity for any securities identified as using Level 3 inputs at either the beginning or the end of the current fiscal period.
For more information on valuation inputs, and their aggregation into the levels used in the tables above, please refer to the Security Valuation section in the accompanying Notes to Financial Statements.
For the year ended March 31, 2010, transactions in written option contracts were as follows:
| | | | | |
| | | Number of
contracts | | Premium
received |
Options outstanding at March 31, 2009 | | — | | $ | — |
Options written | | 9,000 | | | 557,720 |
Options terminated in closing purchase transactions | | — | | | — |
Options exercised | | — | | | — |
Options expired | | — | | | — |
| | | | | |
Options outstanding at March 31, 2010 | | 9,000 | | $ | 557,720 |
| | | | | |
At March 31, 2010, the Fund held the following written call option contracts:
Equity Risk
| | | | | | | | | | | | | | |
Name of Issuer | | Strike
Price | | Number of
Contracts | | Expiration
Date | | Premium | | Value | |
AGCO Corp. | | $ | 40.0 | | 1,000 | | 05/22/10 | | $ | 68,999 | | $ | (45,000 | ) |
Alpha Natural Resources, Inc. | | | 60.0 | | 1,000 | | 06/19/10 | | | 111,998 | | | (135,000 | ) |
Anadarko Petroleum Corp. | | | 80.0 | | 500 | | 05/22/10 | | | 39,534 | | | (48,000 | ) |
Banco Santander SA, ADR | | | 15.0 | | 500 | | 06/19/10 | | | 14,500 | | | (12,500 | ) |
Dean Foods Co. | | | 17.5 | | 500 | | 05/22/10 | | | 15,000 | | | (15,000 | ) |
Devon Energy Corp. | | | 80.0 | | 500 | | 07/17/10 | | | 20,000 | | | (25,000 | ) |
Host Hotels & Resorts, Inc. | | | 15.0 | | 1,500 | | 05/22/10 | | | 73,499 | | | (90,000 | ) |
PetroHawk Energy Corp. | | | 25.0 | | 1,000 | | 06/19/10 | | | 34,000 | | | (45,000 | ) |
PPG Industries, Inc. | | | 70.0 | | 750 | | 05/22/10 | | | 44,872 | | | (48,750 | ) |
RSC Holdings, Inc. | | | 10.0 | | 250 | | 09/18/10 | | | 6,000 | | | (13,750 | ) |
Southern Copper Corp. | | | 35.0 | | 1,000 | | 06/19/10 | | | 88,999 | | | (80,000 | ) |
Stanley Black & Decker, Inc. | | | 65.0 | | 500 | | 07/17/10 | | | 40,319 | | | (35,000 | ) |
| | | | | | | | | | | | | | |
Total written call options: (proceeds $557,720) | | | | | | | | | | | | $ | (593,000 | ) |
| | | | | | | | | | | | | | |
At March 31, 2010, the Fund held investments in the following sectors:
| | | |
Sector (Unaudited) | | % of
Net Assets | |
Energy | | 23.3 | |
Financials | | 16.8 | |
Industrials | | 15.8 | |
Materials | | 13.3 | |
Information Technology | | 8.0 | |
Consumer Staples | | 6.5 | |
Health Care | | 5.6 | |
Consumer Discretionary | | 5.0 | |
Telecommunication Services | | 4.3 | |
Consumer Cyclical | | 1.1 | |
Utilities | | 0.4 | |
| | | |
| | 100.1 | |
Other Assets & Liabilities, Net | | (0.1 | ) |
| | | |
| | 100.0 | |
| | | |
| | |
Acronym | | Name |
| ADR | | American Depositary Receipt |
See Accompanying Notes to Financial Statements.
76
Investment Portfolio – Columbia Emerging Markets Fund
March 31, 2010
Common Stocks – 94.0%
| | | | |
| | | Shares | | Value ($) |
| Consumer Discretionary – 9.4% | | | | |
| Auto Components – 1.5% | | | | |
Hankook Tire Co. Ltd. | | 86,400 | | 1,637,969 |
Hyundai Mobis | | 19,826 | | 2,628,397 |
Nokian Renkaat Oyj | | 74,385 | | 1,932,002 |
| | | | |
Auto Components Total | | | | 6,198,368 |
| | |
| Automobiles – 1.5% | | | | |
Hero Honda Motors Ltd. | | 51,792 | | 2,248,300 |
PT Astra International Tbk | | 823,000 | | 3,789,626 |
| | | | |
Automobiles Total | | | | 6,037,926 |
| | |
| Distributors – 0.5% | | | | |
Li & Fung Ltd. | | 432,000 | | 2,122,652 |
| | | | |
Distributors Total | | | | 2,122,652 |
| |
| Diversified Consumer Services – 0.6% | | |
MegaStudy Co. Ltd. | | 15,310 | | 2,523,589 |
| | | | |
Diversified Consumer Services Total | | 2,523,589 |
| |
| Hotels, Restaurants & Leisure – 0.9% | | |
Ctrip.com International Ltd., ADR (a) | | 56,400 | | 2,210,880 |
Shangri-La Asia Ltd. | | 722,000 | | 1,411,593 |
| | | | |
Hotels, Restaurants & Leisure Total | | 3,622,473 |
| | |
| Household Durables – 0.8% | | | | |
LG Electronics, Inc. | | 10,555 | | 1,072,805 |
Woongjin Coway Co., Ltd. | | 63,960 | | 1,981,349 |
| | | | |
Household Durables Total | | | | 3,054,154 |
| |
| Leisure Equipment & Products – 0.4% | | |
Giant Manufacturing Co., Ltd. | | 632,800 | | 1,835,156 |
| | | | |
Leisure Equipment & Products Total | | 1,835,156 |
| | |
| Media – 0.7% | | | | |
Naspers Ltd. | | 64,061 | | 2,783,636 |
| | | | |
Media Total | | | | 2,783,636 |
| | |
| Multiline Retail – 0.7% | | | | |
Golden Eagle Retail Group Ltd. | | 1,192,000 | | 2,379,624 |
PT Ramayana Lestari Sentosa Tbk | | 6,562,000 | | 634,602 |
| | | | |
Multiline Retail Total | | | | 3,014,226 |
| | |
| Specialty Retail – 1.4% | | | | |
PT Ace Hardware Indonesia Tbk | | 3,907,000 | | 704,158 |
Belle International Holdings Ltd. | | 2,361,000 | | 3,150,331 |
Home Product Center PCL | | 9,188,400 | | 1,633,935 |
| | | | |
Specialty Retail Total | | | | 5,488,424 |
| | | | |
| | | Shares | | Value ($) |
| Textiles, Apparel & Luxury Goods – 0.4% | | |
Ports Design Ltd. | | 631,000 | | 1,592,891 |
| | | | |
Textiles, Apparel & Luxury Goods Total | | 1,592,891 |
| | | | |
Consumer Discretionary Total | | | | 38,273,495 |
| | | | |
| Consumer Staples – 4.6% | | | | |
| Beverages – 0.5% | | | | |
Fomento Economico Mexicano SAB de CV, ADR | | 41,105 | | 1,953,721 |
| | | | |
Beverages Total | | | | 1,953,721 |
| | |
| Food & Staples Retailing – 2.4% | | | | |
BIM Birlesik Magazalar AS | | 77,772 | | 4,048,090 |
Drogasil SA | | 125,100 | | 2,011,195 |
Eurocash SA | | 224,900 | | 1,495,869 |
Magnit OAO, GDR (b)(c) | | 122,619 | | 2,270,904 |
| | | | |
Food & Staples Retailing Total | | | | 9,826,058 |
| | |
| Food Products – 0.2% | | | | |
Balrampur Chini Mills Ltd. | | 388,200 | | 793,348 |
| | | | |
Food Products Total | | | | 793,348 |
| | |
| Personal Products – 0.9% | | | | |
Hypermarcas SA (a) | | 283,200 | | 3,463,660 |
| | | | |
Personal Products Total | | | | 3,463,660 |
| | |
| Tobacco – 0.6% | | | | |
Gudang Garam Tbk PT | | 273,000 | | 742,541 |
ITC Ltd. | | 290,359 | | 1,704,836 |
| | | | |
Tobacco Total | | | | 2,447,377 |
| | | | |
Consumer Staples Total | | | | 18,484,164 |
| | | | |
| Energy – 9.0% | | | | |
| Oil, Gas & Consumable Fuels – 9.0% | | |
Cairn India Ltd. (a) | | 362,672 | | 2,462,648 |
CNOOC Ltd. | | 1,668,000 | | 2,736,944 |
Gazprom OAO, ADR | | 142,760 | | 3,350,577 |
LUKOIL OAO, ADR | | 119,933 | | 6,800,201 |
OGX Petroleo e Gas Participacoes SA | | 346,700 | | 3,246,018 |
PT Tambang Batubara Bukit Asam Tbk | | 1,332,500 | | 2,547,997 |
Rosneft Oil Co., GDR | | 917,444 | | 7,275,331 |
Straits Asia Resources Ltd. | | 1,058,000 | | 1,633,568 |
Yanzhou Coal Mining Co., Ltd., Class H | | 2,638,000 | | 6,326,375 |
| | | | |
Oil, Gas & Consumable Fuels Total | | 36,379,659 |
| | | | |
Energy Total | | | | 36,379,659 |
See Accompanying Notes to Financial Statements.
77
Columbia Emerging Markets Fund
March 31, 2010
Common Stocks (continued)
| | | | |
| | | Shares | | Value ($) |
| Financials – 24.4% | | | | |
| Commercial Banks – 16.4% | | | | |
Banco Bradesco SA, ADR | | 115,115 | | 2,121,569 |
Banco Santander Chile, ADR | | 21,221 | | 1,447,697 |
Bangkok Bank PCL, Foreign Registered Shares | | 794,900 | | 3,232,700 |
Bank of China Ltd., Class H | | 9,145,000 | | 4,864,456 |
Bank Rakyat Indonesia | | 2,598,500 | | 2,355,912 |
China Construction Bank Corp., Class H | | 4,807,000 | | 3,931,410 |
CIMB Group Holdings Bhd | | 891,400 | | 3,842,147 |
HDFC Bank Ltd., ADR | | 30,510 | | 4,252,789 |
Industrial & Commercial Bank of China, Class H | | 6,695,000 | | 5,113,353 |
Itau Unibanco Holding SA, ADR | | 483,400 | | 10,629,966 |
Kasikornbank PCL, Foreign Registered Shares | | 884,300 | | 2,639,089 |
PT Bank Central Asia Tbk | | 6,746,000 | | 4,077,477 |
Punjab National Bank Ltd. | | 80,570 | | 1,811,142 |
Sberbank | | 892,000 | | 2,613,560 |
Shinhan Financial Group Co., Ltd. | | 69,140 | | 2,716,225 |
Standard Bank Group Ltd. | | 181,250 | | 2,851,725 |
Turkiye Garanti Bankasi AS | | 828,535 | | 3,875,868 |
Turkiye Halk Bankasi AS | | 155,700 | | 1,128,447 |
Union Bank of India | | 414,210 | | 2,703,275 |
| | | | |
Commercial Banks Total | | | | 66,208,807 |
| |
| Diversified Financial Services – 2.8% | | |
AMMB Holdings Bhd | | 1,601,900 | | 2,455,395 |
BM&F BOVESPA SA | | 523,000 | | 3,540,878 |
Bolsa Mexicana de Valores SA de CV (a) | | 1,184,900 | | 1,878,398 |
Hong Kong Exchanges & Clearing Ltd. | | 62,700 | | 1,046,581 |
Metro Pacific Investments Corp. (a) | | 37,485,000 | | 2,571,443 |
| | | | |
Diversified Financial Services Total | | 11,492,695 |
| |
| Insurance – 2.6% | | |
Amil Participacoes SA | | 207,300 | | 1,614,477 |
China Life Insurance Co., Ltd., Class H | | 1,467,000 | | 7,028,677 |
China Pacific Insurance Group Co., Ltd., Class H (a) | | 397,736 | | 1,767,317 |
| | | | |
Insurance Total | | | | 10,410,471 |
|
| Real Estate Management & Development – 2.6% |
Ayala Land, Inc. | | 7,997,500 | | 2,300,675 |
China Overseas Land & Investment Ltd. | | 1,209,440 | | 2,729,097 |
China Vanke Co., Ltd., Class B | | 1,375,080 | | 1,577,997 |
| | | | |
| | | Shares | | Value ($) |
Quality Houses PCL | | 10,126,000 | | 757,845 |
SM Prime Holdings, Inc. | | 6,811,000 | | 1,477,048 |
Unitech Ltd. | | 1,047,490 | | 1,721,901 |
| | | | |
Real Estate Management & Development Total | | 10,564,563 |
| | | | |
Financials Total | | | | 98,676,536 |
| | | | |
| Health Care – 2.3% | | | | |
| Biotechnology – 0.3% | | | | |
China Nuokang Bio-Pharmaceutical, Inc., ADR (a) | | 159,302 | | 987,672 |
| | | | |
Biotechnology Total | | | | 987,672 |
| |
| Health Care Equipment & Supplies – 0.4% | | |
Top Glove Corp. Bhd | | 420,900 | | 1,793,535 |
| | | | |
Health Care Equipment & Supplies Total | | 1,793,535 |
| |
| Health Care Providers & Services – 0.7% | | |
Fleury SA (a) | | 214,000 | | 2,286,389 |
Sinopharm Group Co., Class H (a) | | 116,370 | | 523,079 |
| | | | |
Health Care Providers & Services Total | | 2,809,468 |
| |
| Pharmaceuticals – 0.9% | | |
PT Kalbe Farma Tbk | | 4,492,000 | | 923,132 |
Pharmstandard, Series S, GDR (a)(b)(c) | | 24,828 | | 618,217 |
Richter Gedeon Nyrt. | | 4,252 | | 919,826 |
Teva Pharmaceutical Industries Ltd., ADR | | 20,232 | | 1,276,235 |
| | | | |
Pharmaceuticals Total | | | | 3,737,410 |
| | | | |
Health Care Total | | | | 9,328,085 |
| | | | |
| Industrials – 6.5% | | | | |
| Airlines – 1.2% | | | | |
Lan Airlines SA, ADR | | 95,851 | | 1,691,770 |
Turk Hava Yollari A.O. | | 968,616 | | 3,318,599 |
| | | | |
Airlines Total | | | | 5,010,369 |
| |
| Construction & Engineering – 1.1% | | |
Aveng Ltd. | | 203,807 | | 1,052,088 |
CTCI Corp. | | 3,305,000 | | 3,449,863 |
| | | | |
Construction & Engineering Total | | 4,501,951 |
| |
| Electrical Equipment – 2.1% | | |
Bharat Heavy Electricals Ltd. | | 33,634 | | 1,782,276 |
Harbin Electric, Inc. (a) | | 93,534 | | 2,019,399 |
LS Cable Ltd. | | 19,257 | | 1,681,552 |
Zhuzhou CSR Times Electric Co., Ltd., Class H | | 1,518,000 | | 2,870,108 |
| | | | |
Electrical Equipment Total | | | | 8,353,335 |
See Accompanying Notes to Financial Statements.
78
Columbia Emerging Markets Fund
March 31, 2010
Common Stocks (continued)
| | | | |
| | | Shares | | Value ($) |
| Industrials (continued) | | | | |
| Road & Rail – 1.1% | | | | |
All America Latina Logistica SA | | 295,100 | | 2,704,827 |
Globaltrans Investment PLC, GDR (a)(b)(c) | | 126,800 | | 1,654,740 |
| | | | |
Road & Rail Total | | | | 4,359,567 |
| |
| Transportation Infrastructure – 1.0% | | |
China Merchants Holdings International Co., Ltd. | | 194,000 | | 709,611 |
Cia de Concessoes Rodoviarias | | 95,000 | | 2,109,568 |
Cosco Pacific Ltd. | | 926,000 | | 1,404,937 |
| | | | |
Transportation Infrastructure Total | | 4,224,116 |
| | | | |
Industrials Total | | | | 26,449,338 |
| | | | |
| Information Technology – 13.7% | | | | |
| Computers & Peripherals – 0.6% | | | | |
Wistron Corp. | | 1,261,000 | | 2,291,067 |
| | | | |
Computers & Peripherals Total | | | | 2,291,067 |
|
| Electronic Equipment, Instruments & Components – 2.9% |
HON HAI Precision Industry Co., Ltd. | | 1,709,099 | | 7,399,745 |
Suprema, Inc. | | 71,232 | | 931,755 |
WPG Holdings Co., Ltd. | | 2,125,000 | | 3,472,747 |
| | | | |
Electronic Equipment, Instruments & Components Total | | 11,804,247 |
| |
| Internet Software & Services – 1.2% | | |
NHN Corp. (a) | | 15,745 | | 2,504,839 |
Tencent Holdings Ltd. | | 111,000 | | 2,225,933 |
| | | | |
Internet Software & Services Total | | | | 4,730,772 |
| | |
| IT Services – 1.5% | | | | |
Infosys Technologies Ltd. | | 18,700 | | 1,089,219 |
Infosys Technologies Ltd., ADR | | 19,576 | | 1,152,048 |
Redecard SA | | 209,700 | | 3,879,512 |
| | | | |
IT Services Total | | | | 6,120,779 |
|
| Semiconductors & Semiconductor Equipment – 7.3% |
MediaTek, Inc. | | 277,000 | | 4,805,939 |
Samsung Electronics Co., Ltd. | | 22,062 | | 15,950,078 |
Seoul Semiconductor Co. Ltd. | | 15,750 | | 606,920 |
Taiwan Semiconductor Manufacturing Co., Ltd. | | 1,941,190 | | 3,759,153 |
Taiwan Semiconductor Manufacturing Co., Ltd., ADR | | 243,695 | | 2,556,361 |
United Microelectronics Corp. (a) | | 1,877,000 | | 995,889 |
United Microelectronics Corp., ADR (a) | | 233,875 | | 879,370 |
| | | | |
Semiconductors & Semiconductor Equipment Total | | 29,553,710 |
| | | | |
| | | Shares | | Value ($) |
| Software – 0.2% | | | | |
VanceInfo Technologies, Inc., ADR (a) | | 39,340 | | 876,888 |
| | | | |
Software Total | | | | 876,888 |
| | | | |
Information Technology Total | | 55,377,463 |
| | |
| Materials – 14.5% | | | | |
| Chemicals – 0.5% | | | | |
Israel Chemicals Ltd. | | 149,809 | | 2,026,774 |
| | | | |
Chemicals Total | | | | 2,026,774 |
| | |
| Construction Materials – 0.6% | | | | |
PT Indocement Tunggal Prakarsa Tbk | | 1,630,200 | | 2,552,926 |
| | | | |
Construction Materials Total | | | | 2,552,926 |
| | |
| Metals & Mining – 13.4% | | | | |
Anglo Platinum Ltd. (a) | | 27,551 | | 2,799,072 |
AngloGold Ashanti Ltd., ADR | | 34,687 | | 1,316,372 |
BHP Billiton Ltd., ADR | | 27,685 | | 2,223,659 |
Cia de Minas Buenaventura SA, ADR | | 46,765 | | 1,448,312 |
Eastern Platinum Ltd. (a) | | 1,728,900 | | 2,519,344 |
Eurasian Natural Resources Corp. PLC | | 214,030 | | 3,871,500 |
Freeport-McMoRan Copper & Gold, Inc. (a) | | 15,215 | | 1,271,061 |
Gold Fields Ltd., ADR | | 125,022 | | 1,577,777 |
Gujarat NRE Coke Ltd. | | 993,500 | | 1,933,004 |
Hidili Industry International Development Ltd. (a) | | 2,107,000 | | 2,279,525 |
Kumba Iron Ore Ltd. | | 46,300 | | 2,243,250 |
Mechel, ADR | | 66,014 | | 1,876,118 |
Novolipetsk Steel OJSC, GDR (a)(b)(c) | | 48,366 | | 1,675,882 |
POSCO | | 7,757 | | 3,619,865 |
Steel Authority Of India Ltd. | | 419,015 | | 2,361,772 |
Sterlite Industries India Ltd. | | 177,256 | | 3,361,922 |
Tata Steel Ltd. | | 149,000 | | 2,098,346 |
Vale SA | | 494,200 | | 15,881,874 |
| | | | |
Metals & Mining Total | | | | 54,358,655 |
| | | | |
Materials Total | | | | 58,938,355 |
| | | | |
| Telecommunication Services – 6.7% | | |
| Diversified Telecommunication Services – 2.2% |
Chunghwa Telecom Co. Ltd., ADR | | 183,321 | | 3,561,927 |
Vimpel-Communications, ADR | | 275,200 | | 5,066,432 |
| | | | |
Diversified Telecommunication Services Total | | 8,628,359 |
See Accompanying Notes to Financial Statements.
79
Columbia Emerging Markets Fund
March 31, 2010
Common Stocks (continued)
| | | | |
| | | Shares | | Value ($) |
| Telecommunication Services (continued) | | |
| Wireless Telecommunication Services – 4.5% |
America Movil SAB de CV, Series L, ADR | | 94,764 | | 4,770,420 |
Millicom International Cellular SA | | 18,240 | | 1,626,096 |
Mobile TeleSystems OJSC, ADR | | 100,100 | | 5,555,550 |
MTN Group Ltd. | | 136,520 | | 2,099,226 |
Philippine Long Distance Telephone Co., ADR | | 31,963 | | 1,702,988 |
SK Telecom Co., Ltd. | | 16,874 | | 2,587,511 |
| | | | |
Wireless Telecommunication Services Total | | 18,341,791 |
| | | | |
Telecommunication Services Total | | 26,970,150 |
| | |
| Utilities – 2.9% | | | | |
| Gas Utilities – 2.7% | | | | |
PT Perusahaan Gas Negara Tbk | | 12,261,500 | | 5,726,839 |
Xinao Gas Holdings Ltd. | | 2,002,000 | | 5,115,714 |
| | | | |
Gas Utilities Total | | | | 10,842,553 |
| | |
| Water Utilities – 0.2% | | | | |
Manila Water Co. | | 2,435,000 | | 848,667 |
| | | | |
Water Utilities Total | | | | 848,667 |
| | | | |
Utilities Total | | | | 11,691,220 |
| | | | |
Total Common Stocks
(cost of $233,808,227) | | | | 380,568,465 |
| | |
Preferred Stocks – 5.6% | | | | |
| | | | |
| Consumer Staples – 0.6% | | | | |
| Food & Staples Retailing – 0.6% | | | | |
Cia Brasileira de Distribuicao Grupo Pao de Acucar | | 70,900 | | 2,363,001 |
| | | | |
Food & Staples Retailing Total | | | | 2,363,001 |
| | | | |
Consumer Staples Total | | | | 2,363,001 |
| | | | |
| Energy – 4.3% | | | | |
| Oil, Gas & Consumable Fuels – 4.3% | | |
Petroleo Brasileiro SA | | 879,700 | | 17,506,443 |
| | | | |
Oil, Gas & Consumable Fuels Total | | 17,506,443 |
| | | | |
Energy Total | | | | 17,506,443 |
| | | | |
| | | Shares | | Value ($) |
| Materials – 0.7% | | | | |
| Metals & Mining – 0.7% | | | | |
Usinas Siderurgicas de Minas Gerais SA | | 79,900 | | 2,737,092 |
| | | | |
Metals & Mining Total | | | | 2,737,092 |
| | | | |
Materials Total | | | | 2,737,092 |
| | | | |
Total Preferred Stocks
(cost of $5,988,230) | | | | 22,606,536 |
| | |
Short-Term Obligation – 0.1% | | | | |
| | | Par ($) | | |
Repurchase agreement with Fixed Income Clearing Corp., dated 03/31/10, due 04/01/10 at 0.000%, collateralized by a U.S. Treasury obligation maturing 01/31/14, market value $545,188 (repurchase proceeds $533,000) | | 533,000 | | 533,000 |
| | | | |
Total Short-Term Obligation
(cost of $533,000) | | | | 533,000 |
| | | | |
Total Investments – 99.7%
(cost of $240,329,457)(d) | | | | 403,708,001 |
| | | | |
Other Assets & Liabilities, Net – 0.3% | | 1,042,301 |
| | | | |
Net Assets – 100.0% | | | | 404,750,302 |
Notes to Investment Portfolio:
| (a) | Non-income producing security. |
| (b) | Represents fair value as determined in good faith under procedures approved by the Board of Trustees. At March 31, 2010, the value of these securities amounted to $6,219,743, which represents 1.5% of net assets. |
| (c) | Security exempt from registration pursuant to Rule 144A under the Securities Act of 1933. These securities may be resold in transactions exempt from registration, normally to qualified institutional buyers. At March 31, 2010, these securities, which are not illiquid, amounted to $6,219,743, which represents 1.5% of net assets. |
| (d) | Cost for federal income tax purposes is $242,200,532. |
See Accompanying Notes to Financial Statements.
80
Columbia Emerging Markets Fund
March 31, 2010
The following table summarizes the inputs used, as of March 31, 2010, in valuing the Fund’s assets:
| | | | | | | | | | | | |
Description | | Quoted Prices
(Level 1) | | Other
Significant
Observable
Inputs
(Level 2) | | Significant
Unobservable
Inputs
(Level 3) | | Total |
Common Stocks | | | | | | | | | | | | |
Consumer Discretionary | | $ | 2,210,880 | | $ | 36,062,615 | | $ | — | | $ | 38,273,495 |
Consumer Staples | | | 7,428,576 | | | 11,055,588 | | | — | | | 18,484,164 |
Energy | | | 20,672,127 | | | 15,707,532 | | | — | | | 36,379,659 |
Financials | | | 28,857,179 | | | 69,819,357 | | | — | | | 98,676,536 |
Health Care | | | 4,550,296 | | | 4,777,789 | | | — | | | 9,328,085 |
Industrials | | | 8,525,564 | | | 17,923,774 | | | — | | | 26,449,338 |
Information Technology | | | 9,344,179 | | | 46,033,284 | | | — | | | 55,377,463 |
Materials | | | 28,114,517 | | | 30,823,838 | | | — | | | 58,938,355 |
Telecommunication Services | | | 22,283,413 | | | 4,686,737 | | | — | | | 26,970,150 |
Utilities | | | — | | | 11,691,220 | | | — | | | 11,691,220 |
| | | | | | | | | | | | |
Total Common Stocks | | | 131,986,731 | | | 248,581,734 | | | — | | | 380,568,465 |
| | | | | | | | | | | | |
Total Preferred Stocks | | | 22,606,536 | | | — | | | — | | | 22,606,536 |
| | | | | | | | | | | | |
Total Short-Term Obligation | | | — | | | 533,000 | | | — | | | 533,000 |
| | | | | | | | | | | | |
Total Investments | | $ | 154,593,267 | | $ | 249,114,734 | | | — | | $ | 403,708,001 |
| | | | | | | | | | | | |
The Fund’s assets assigned to the Level 2 input category include certain foreign securities for which a third party statistical pricing service may be employed for purposes of fair market valuation.
For more information on valuation inputs, and their aggregation into the levels used in the table above, please refer to the Security Valuation section in the accompanying Notes to Financial Statements.
The Fund was invested in the following countries at March 31, 2010:
| | | | | |
Summary of Securities
by Country (Unaudited) | | Value | | % of Total Investments |
Brazil | | $ | 76,096,469 | | 18.8 |
China | | | 63,434,546 | | 15.7 |
Republic of Korea | | | 40,442,854 | | 10.0 |
Russia | | | 38,757,512 | | 9.6 |
Taiwan | | | 35,007,217 | | 8.7 |
India | | | 32,180,984 | | 8.0 |
Indonesia | | | 23,351,052 | | 5.8 |
South Africa | | | 16,723,145 | | 4.1 |
Turkey | | | 12,371,003 | | 3.1 |
Philippines | | | 8,900,821 | | 2.2 |
Mexico | | | 8,602,538 | | 2.1 |
Thailand | | | 8,263,570 | | 2.0 |
Malaysia | | | 8,091,077 | | 2.0 |
Hong Kong | | | 4,580,826 | | 1.2 |
United Kingdom | | | 3,871,501 | | 1.0 |
Israel | | | 3,303,009 | | 0.8 |
Chile | | | 3,139,467 | | 0.8 |
United States* | | | 2,791,734 | | 0.7 |
Canada | | | 2,519,344 | | 0.6 |
Australia | | | 2,223,659 | | 0.5 |
Finland | | | 1,932,002 | | 0.5 |
Singapore | | | 1,633,568 | | 0.4 |
Sweden | | | 1,626,096 | | 0.4 |
Poland | | | 1,495,869 | | 0.4 |
Peru | | | 1,448,312 | | 0.4 |
Hungary | | | 919,826 | | 0.2 |
| | | | | |
| | $ | 403,708,001 | | 100.0 |
| | | | | |
* Includes short-term obligation.
Certain securities are listed by country of underlying exposure but may trade predominantly on another exchange.
| | |
Acronym | | Name |
| ADR | | American Depositary Receipt |
| GDR | | Global Depositary Receipt |
See Accompanying Notes to Financial Statements.
81
Investment Portfolio – Columbia International Growth Fund
March 31, 2010
Common Stocks – 96.6%
| | | | |
| | | Shares | | Value ($) |
| Consumer Discretionary – 11.7% | | | | |
| Auto Components – 2.0% | | | | |
Autoliv, Inc. | | 21,602 | | 1,113,151 |
Keihin Corp. | | 55,400 | | 1,070,194 |
Stanley Electric Co., Ltd. | | 65,300 | | 1,266,327 |
| | | | |
Auto Components Total | | | | 3,449,672 |
| | |
| Automobiles – 2.1% | | | | |
Honda Motor Co., Ltd. | | 63,600 | | 2,244,946 |
Nissan Motor Co., Ltd. (a) | | 150,800 | | 1,292,018 |
| | | | |
Automobiles Total | | | | 3,536,964 |
|
| Diversified Consumer Services – 0.5% |
Benesse Holdings, Inc. | | 20,400 | | 883,731 |
| | | | |
Diversified Consumer Services Total | | 883,731 |
|
| Hotels, Restaurants & Leisure – 1.9% |
Compass Group PLC | | 237,632 | | 1,896,789 |
William Hill PLC | | 448,757 | | 1,438,248 |
| | | | |
Hotels, Restaurants & Leisure Total | | 3,335,037 |
| | |
| Media – 0.9% | | | | |
WPP PLC | | 147,776 | | 1,531,627 |
| | | | |
Media Total | | | | 1,531,627 |
| | |
| Specialty Retail – 2.5% | | | | |
Fast Retailing Co., Ltd. | | 8,900 | | 1,546,957 |
Game Group PLC | | 404,585 | | 603,213 |
Yamada Denki Co., Ltd. | | 27,800 | | 2,051,770 |
| | | | |
Specialty Retail Total | | | | 4,201,940 |
|
| Textiles, Apparel & Luxury Goods – 1.8% |
Compagnie Financiere Richemont SA, Class A | | 40,499 | | 1,568,261 |
Polo Ralph Lauren Corp. (b) | | 18,455 | | 1,569,413 |
| | | | |
Textiles, Apparel & Luxury Goods Total | | 3,137,674 |
| | | | |
Consumer Discretionary Total | | | | 20,076,645 |
| | | | |
| Consumer Staples – 15.8% | | | | |
| Beverages – 2.0% | | | | |
Carlsberg A/S, Class B | | 23,583 | | 1,979,298 |
Cott Corp. (a) | | 186,928 | | 1,448,692 |
| | | | |
Beverages Total | | | | 3,427,990 |
| | |
| Food & Staples Retailing – 6.2% | | | | |
George Weston Ltd. | | 12,400 | | 856,456 |
Koninklijke Ahold NV | | 174,527 | | 2,326,606 |
Seven & I Holdings Co., Ltd. | | 86,000 | | 2,078,019 |
Tesco PLC | | 260,857 | | 1,723,730 |
Wal-Mart Stores, Inc. | | 27,639 | | 1,536,728 |
Woolworths Ltd. | | 80,386 | | 2,065,454 |
| | | | |
Food & Staples Retailing Total | | | | 10,586,993 |
| | | | |
| | | Shares | | Value ($) |
| Food Products – 5.9% | | | | |
Balrampur Chini Mills Ltd. | | 403,510 | | 824,636 |
Danone SA | | 15,334 | | 923,705 |
Nestle SA, Registered Shares | | 84,452 | | 4,325,122 |
Toyo Suisan Kaisha Ltd. | | 49,000 | | 1,267,323 |
Unilever NV | | 92,569 | | 2,800,010 |
| | | | |
Food Products Total | | | | 10,140,796 |
| | |
| Tobacco – 1.7% | | | | |
British American Tobacco PLC | | 23,981 | | 826,625 |
Japan Tobacco, Inc. | | 569 | | 2,118,002 |
| | | | |
Tobacco Total | | | | 2,944,627 |
| | | | |
Consumer Staples Total | | | | 27,100,406 |
| | | | |
| Energy – 3.6% | | | | |
| Energy Equipment & Services – 2.7% | | | | |
Core Laboratories N.V. | | 15,765 | | 2,062,062 |
Shinko Plantech Co., Ltd. | | 62,000 | | 549,107 |
Tecnicas Reunidas SA | | 30,753 | | 1,933,526 |
| | | | |
Energy Equipment & Services Total | | 4,544,695 |
| | |
| Oil, Gas & Consumable Fuels – 0.9% | | | | |
AWE Ltd. (a) | | 367,958 | | 918,426 |
BG Group PLC | | 38,741 | | 670,494 |
| | | | |
Oil, Gas & Consumable Fuels Total | | 1,588,920 |
| | | | |
Energy Total | | | | 6,133,615 |
| | | | |
| Financials – 15.1% | | | | |
| Capital Markets – 2.3% | | | | |
Credit Suisse Group AG, Registered Shares | | 33,449 | | 1,724,159 |
Investec PLC | | 168,331 | | 1,376,833 |
UBS AG, Registered Shares (a) | | 51,306 | | 834,015 |
| | | | |
Capital Markets Total | | | | 3,935,007 |
| | |
| Commercial Banks – 7.3% | | | | |
Banco Santander SA | | 129,528 | | 1,721,479 |
BNP Paribas | | 28,251 | | 2,169,620 |
DBS Group Holdings Ltd. | | 46,000 | | 470,210 |
Governor & Co. of the Bank of Ireland (a)(b) | | 153,221 | | 331,117 |
National Bank of Greece SA (a) | | 39,121 | | 787,298 |
Standard Chartered PLC | | 114,939 | | 3,135,196 |
Svenska Handelsbanken AB, Class A | | 30,943 | | 906,786 |
Toronto-Dominion Bank | | 22,400 | | 1,669,552 |
Westpac Banking Corp. | | 55,827 | | 1,426,233 |
| | | | |
Commercial Banks Total | | | | 12,617,491 |
See Accompanying Notes to Financial Statements.
82
Columbia International Growth Fund
March 31, 2010
Common Stocks (continued)
| | | | |
| | | Shares | | Value ($) |
| Financials (continued) | | | | |
| Diversified Financial Services – 1.2% |
Hong Kong Exchanges & Clearing Ltd. | | 33,400 | | 557,509 |
ING Groep NV (a) | | 146,405 | | 1,461,709 |
| | | | |
Diversified Financial Services Total | | 2,019,218 |
| | |
| Insurance – 2.2% | | | | |
Brit Insurance Holdings NV | | 93,594 | | 1,068,767 |
Mapfre SA | | 426,568 | | 1,564,808 |
Zurich Financial Services AG, Registered Shares | | 4,622 | | 1,184,869 |
| | | | |
Insurance Total | | | | 3,818,444 |
|
| Real Estate Investment Trusts (REITs) – 0.8% |
Japan Real Estate Investment Corp. | | 154 | | 1,312,846 |
| | | | |
Real Estate Investment Trusts (REITs) Total | | 1,312,846 |
|
| Real Estate Management & Development – 1.3% |
Hongkong Land Holdings Ltd. | | 279,000 | | 1,414,530 |
Huaku Development Co., Ltd. | | 312,000 | | 809,522 |
| | | | |
Real Estate Management & Development Total | | 2,224,052 |
| | | | |
Financials Total | | | | 25,927,058 |
| | | | |
| Health Care – 10.8% | | | | |
| Biotechnology – 1.8% | | | | |
Amgen, Inc. (a)(b) | | 37,435 | | 2,237,116 |
CSL Ltd. | | 25,505 | | 852,632 |
| | | | |
Biotechnology Total | | | | 3,089,748 |
|
| Health Care Providers & Services – 0.8% |
Miraca Holdings, Inc. | | 47,200 | | 1,438,870 |
| | | | |
Health Care Providers & Services Total | | 1,438,870 |
| | |
| Pharmaceuticals – 8.2% | | | | |
Bayer AG | | 17,194 | | 1,163,012 |
GlaxoSmithKline PLC | | 103,820 | | 1,993,754 |
Novartis AG, Registered Shares | | 46,556 | | 2,514,571 |
Novo-Nordisk A/S, Class B | | 26,861 | | 2,084,337 |
Roche Holding AG, Genusschein Shares | | 22,157 | | 3,593,368 |
Sanofi-Aventis SA, ADR | | 36,097 | | 1,348,584 |
Santen Pharmaceutical Co., Ltd. | | 46,300 | | 1,389,644 |
| | | | |
Pharmaceuticals Total | | | | 14,087,270 |
| | | | |
Health Care Total | | | | 18,615,888 |
| | | | |
| | | Shares | | Value ($) |
| Industrials – 12.1% | | | | |
| Air Freight & Logistics – 0.7% | | | | |
Yamato Holdings Co., Ltd. | | 80,300 | | 1,128,615 |
| | | | |
Air Freight & Logistics Total | | | | 1,128,615 |
| | |
| Building Products – 1.0% | | | | |
Asahi Glass Co., Ltd. | | 156,000 | | 1,757,065 |
| | | | |
Building Products Total | | | | 1,757,065 |
|
| Commercial Services & Supplies – 0.9% |
Toppan Printing Co., Ltd. | | 180,000 | | 1,624,987 |
| | | | |
Commercial Services & Supplies Total | | 1,624,987 |
|
| Construction & Engineering – 1.4% |
Impregilo SpA | | 234,843 | | 811,215 |
JGC Corp. | | 85,000 | | 1,516,526 |
| | | | |
Construction & Engineering Total | | 2,327,741 |
| | |
| Electrical Equipment – 3.6% | | | | |
ABB Ltd., Registered Shares (a) | | 74,929 | | 1,636,585 |
Alstom SA | | 22,073 | | 1,376,462 |
Mitsubishi Electric Corp. | | 97,000 | | 891,250 |
Schneider Electric SA | | 9,944 | | 1,166,337 |
Sumitomo Electric Industries Ltd. | | 96,600 | | 1,184,122 |
| | | | |
Electrical Equipment Total | | | | 6,254,756 |
|
| Industrial Conglomerates – 1.5% |
Koninklijke Philips Electronics NV | | 50,317 | | 1,613,386 |
Siemens AG, Registered Shares | | 9,538 | | 955,238 |
| | | | |
Industrial Conglomerates Total | | | | 2,568,624 |
| | |
| Machinery – 1.0% | | | | |
MAN SE | | 21,417 | | 1,792,888 |
| | | | |
Machinery Total | | | | 1,792,888 |
| | |
| Marine – 1.0% | | | | |
A.P. Moller – Maersk A/S, Class B | | 227 | | 1,729,744 |
| | | | |
Marine Total | | | | 1,729,744 |
| | |
| Professional Services – 0.6% | | | | |
Atkins WS PLC | | 101,044 | | 950,672 |
| | | | |
Professional Services Total | | | | 950,672 |
|
| Transportation Infrastructure – 0.4% |
Zhejiang Expressway Co., Ltd., Class H | | 762,000 | | 687,976 |
| | | | |
Transportation Infrastructure Total | | 687,976 |
| | | | |
Industrials Total | | | | 20,823,068 |
| | | | |
| Information Technology – 6.4% | | | | |
| Computers & Peripherals – 0.6% |
Wistron Corp. | | 595,000 | | 1,081,035 |
| | | | |
Computers & Peripherals Total | | | | 1,081,035 |
See Accompanying Notes to Financial Statements.
83
Columbia International Growth Fund
March 31, 2010
Common Stocks (continued)
| | | | |
| | | Shares | | Value ($) |
| Information Technology (continued) | | | | |
| Electronic Equipment, Instruments & Components – 1.7% |
FUJIFILM Holdings Corp. | | 59,200 | | 2,038,977 |
Murata Manufacturing Co., Ltd. | | 16,500 | | 937,159 |
| | | | |
Electronic Equipment, Instruments & Components Total | | 2,976,136 |
|
| Internet Software & Services – 1.2% |
Tencent Holdings Ltd. | | 97,800 | | 1,961,227 |
| | | | |
Internet Software & Services Total | | 1,961,227 |
| | |
| IT Services – 0.9% | | | | |
Redecard SA | | 86,600 | | 1,602,126 |
| | | | |
IT Services Total | | | | 1,602,126 |
|
| Semiconductors & Semiconductor Equipment – 0.9% |
Shinko Electric Industries Co., Ltd. | | 95,300 | | 1,473,995 |
| | | | |
Semiconductors & Semiconductor Equipment Total | | 1,473,995 |
| | |
| Software – 1.1% | | | | |
Autonomy Corp. PLC (a) | | 69,244 | | 1,915,567 |
| | | | |
Software Total | | | | 1,915,567 |
| | | | |
Information Technology Total | | | | 11,010,086 |
| | | | |
| Materials – 15.2% | | | | |
| Chemicals – 3.0% | | | | |
Hitachi Chemical Co., Ltd. | | 78,700 | | 1,700,438 |
Nitto Denko Corp. | | 50,100 | | 1,945,267 |
Syngenta AG, Registered Shares | | 5,559 | | 1,543,698 |
| | | | |
Chemicals Total | | | | 5,189,403 |
| | |
| Construction Materials – 0.5% | | | | |
PT Indocement Tunggal Prakarsa Tbk | | 506,000 | | 792,406 |
| | | | |
Construction Materials Total | | | | 792,406 |
| | |
| Containers & Packaging – 0.9% | | | | |
Smurfit Kappa Group PLC (a) | | 188,487 | | 1,570,440 |
| | | | |
Containers & Packaging Total | | | | 1,570,440 |
| | |
| Metals & Mining – 10.8% | | | | |
Anglo American PLC (a) | | 61,871 | | 2,698,375 |
Antofagasta PLC | | 143,446 | | 2,263,863 |
BHP Billiton PLC | | 208,616 | | 7,154,586 |
Eurasian Natural Resources Corp. PLC | | 126,401 | | 2,286,416 |
Rio Tinto Ltd. | | 57,858 | | 4,162,522 |
| | | | |
Metals & Mining Total | | | | 18,565,762 |
| | | | |
Materials Total | | | | 26,118,011 |
| | | | |
| | | Shares | | Value ($) |
| Telecommunication Services – 3.5% |
| Diversified Telecommunication Services – 2.1% |
Tele2 AB, Class B | | 80,873 | | 1,349,638 |
Telefonica SA | | 94,678 | | 2,242,961 |
| | | | |
Diversified Telecommunication Services Total | | 3,592,599 |
|
| Wireless Telecommunication Services – 1.4% |
Mobile TeleSystems OJSC, ADR | | 19,924 | | 1,105,782 |
Softbank Corp. | | 57,800 | | 1,423,825 |
| | | | |
Wireless Telecommunication Services Total | | 2,529,607 |
| | | | |
Telecommunication Services Total | | 6,122,206 |
| | | | |
| Utilities – 2.4% | | | | |
| Gas Utilities – 0.7% | | | | |
PT Perusahaan Gas Negara Tbk | | 2,443,000 | | 1,141,024 |
| | | | |
Gas Utilities Total | | | | 1,141,024 |
|
| Independent Power Producers & Energy Traders – 1.0% |
International Power PLC | | 369,327 | | 1,787,286 |
| | | | |
Independent Power Producers & Energy Traders Total | | 1,787,286 |
| | |
| Multi-Utilities – 0.7% | | | | |
RWE AG | | 12,947 | | 1,147,139 |
| | | | |
Multi-Utilities Total | | | | 1,147,139 |
| | | | |
Utilities Total | | | | 4,075,449 |
| | | | |
Total Common Stocks
(cost of $137,124,487) | | | | 166,002,432 |
| | |
Preferred Stock – 0.9% | | | | |
| | | | |
| Consumer Staples – 0.9% | | | | |
| Household Products – 0.9% | | | | |
Henkel AG & Co. KgaA | | 29,998 | | 1,615,000 |
| | | | |
Household Products Total | | | | 1,615,000 |
| | | | |
Consumer Staples Total | | | | 1,615,000 |
| | | | |
Total Preferred Stock
(cost of $1,542,228) | | | | 1,615,000 |
See Accompanying Notes to Financial Statements.
84
Columbia International Growth Fund
March 31, 2010
Investment Companies – 1.6%
| | | | |
| | | Shares | | Value ($) |
iShares FTSE/Xinhua China 25 Index Fund | | 22,622 | | 952,386 |
iShares MSCI EAFE Index Fund | | 32,778 | | 1,835,568 |
| | | | |
Total Investment Companies
(cost of $2,406,401) | | 2,787,954 |
| | | | |
Total Investments – 99.1%
(cost of $141,073,116) (c) | | 170,405,386 |
| | | | |
Other Assets & Liabilities, Net – 0.9% | | 1,465,401 |
| | | | |
Net Assets – 100.0% | | 171,870,787 |
Notes to Investment Portfolio:
| (a) | Non-income producing security. |
| (b) | All or a portion of this security is pledged as collateral for open written options contracts. |
| (c) | Cost for federal income tax purposes is $143,169,595. |
The following table summarizes the inputs used, as of March 31, 2010, in valuing the Fund’s assets:
| | | | | | | | | | | | | | | |
Description | | Quoted Prices
(Level 1) | | | Other
Significant
Observable
Inputs
(Level 2) | | | Significant
Unobservable
Inputs
(Level 3) | | Total | |
Common Stocks | | | | | | | | | | | | | | | |
Consumer Discretionary | | $ | 2,682,564 | | | $ | 17,394,081 | | | $ | — | | $ | 20,076,645 | |
Consumer Staples | | | 3,841,876 | | | | 23,258,530 | | | | — | | | 27,100,406 | |
Energy | | | 2,062,062 | | | | 4,071,553 | | | | — | | | 6,133,615 | |
Financials | | | 3,084,082 | | | | 22,842,976 | | | | — | | | 25,927,058 | |
Health Care | | | 3,585,700 | | | | 15,030,188 | | | | — | | | 18,615,888 | |
Industrials | | | — | | | | 20,823,068 | | | | — | | | 20,823,068 | |
Information Technology | | | 1,602,126 | | | | 9,407,960 | | | | — | | | 11,010,086 | |
Materials | | | — | | | | 26,118,011 | | | | — | | | 26,118,011 | |
Telecommunication Services | | | 1,105,782 | | | | 5,016,424 | | | | — | | | 6,122,206 | |
Utilities | | | — | | | | 4,075,449 | | | | — | | | 4,075,449 | |
| | | | | | | | | | | | | | | |
Total Common Stocks | | | 17,964,192 | | | | 148,038,240 | | | | — | | | 166,002,432 | |
| | | | | | | | | | | | | | | |
Total Preferred Stock | | | — | | | | 1,615,000 | | | | — | | | 1,615,000 | |
| | | | | | | | | | | | | | | |
Total Investment Companies | | | 2,787,954 | | | | — | | | | — | | | 2,787,954 | |
| | | | | | | | | | | | | | | |
Total Investments | | | 20,752,146 | | | | 149,653,240 | | | | — | | | 170,405,386 | |
| | | | | | | | | | | | | | | |
Unrealized Appreciation on Forward Foreign Currency Exchange Contracts | | | — | | | | 355,745 | | | | — | | | 355,745 | |
| | | | | | | | | | | | | | | |
Unrealized Depreciation on Forward Foreign Currency Exchange Contracts | | | — | | | | (152,829 | ) | | | — | | | (152,829 | ) |
| | | | | | | | | | | | | | | |
Value of written call options contracts | | | (8,432 | ) | | | — | | | | — | | | (8,432 | ) |
| | | | | | | | | | | | | | | |
Total | | $ | 20,743,714 | | | $ | 149,856,156 | | | $ | — | | $ | 170,599,870 | |
| | | | | | | | | | | | | | | |
The Fund’s assets assigned to Level 2 input category include certain foreign securities for which a third party statistical pricing service may be employed for purposes of fair market valuation.
For more information on valuation inputs, and their aggregation into the levels used in the table above, please refer to the Security Valuation section in the accompanying Notes to Financial Statements.
At March 31, 2010, the Fund had the following written call option contracts:
Equity Risk
| | | | | | | | | | | | | | |
Name of Issuer | | Strike
Price | | Number of
Contracts | | Expiration
Date | | Premium | | Value | |
Amgen, Inc. | | $ | 62.5 | | 187 | | 04/17/10 | | $ | 7,564 | | $ | (3,927 | ) |
Bank of Ireland ADR | | | 10.0 | | 105 | | 04/17/10 | | | 1,580 | | | (1,580 | ) |
Polo Ralph Lauren Corp. | | | 90.0 | | 117 | | 04/17/10 | | | 3,297 | | | (2,925 | ) |
| | | | | | | | | | | | | | |
Total written call options (proceeds $12,441) | | | | | | | | | | | | $ | (8,432 | ) |
| | | | | | | | | | | | | | |
For the year ended March 31, 2010, transactions in written option contracts were as follows:
| | | | | | | |
| | | Number of
Contracts | | | Premium
Received | |
Options outstanding at March 31, 2009 | | — | | | $ | — | |
Options written | | 1,877 | | | | 79,192 | |
Options terminated in closing purchase transactions | | (491 | ) | | | (23,629 | ) |
Options exercised | | — | | | | — | |
Options expired | | (977 | ) | | | (43,122 | ) |
| | | | | | | |
Options outstanding at March 31, 2010 | | 409 | | | $ | 12,441 | |
| | | | | | | |
Forward foreign currency exchange contracts outstanding at March 31, 2010 are:
Foreign Exchange Rate Risk
| | | | | | | | | | | | |
Forward
Foreign
Currency
Exchange
Contracts
to Buy | | Value | | Aggregate
Face Value | | Settlement
Date | | Unrealized
Appreciation
(Depreciation) | |
AUD | | $ | 5,369,636 | | $ | 5,248,210 | | 06/01/10 | | $ | 121,426 | |
BRL | | | 517,388 | | | 520,460 | | 06/01/10 | | | (3,072 | ) |
CHF | | | 4,498,519 | | | 4,406,871 | | 06/01/10 | | | 91,648 | |
EUR | | | 5,860,716 | | | 5,873,605 | | 06/01/10 | | | (12,889 | ) |
GBP | | | 2,366,507 | | | 2,345,928 | | 06/01/10 | | | 20,579 | |
NOK | | | 929,896 | | | 940,393 | | 06/01/10 | | | (10,497 | ) |
SEK | | | 2,807,604 | | | 2,831,480 | | 06/01/10 | | | (23,876 | ) |
SGD | | | 1,757,298 | | | 1,755,802 | | 06/01/10 | | | 1,496 | |
| | | | | | | | | | | | |
| | | | | | | | | | $ | 184,815 | |
| | | | | | | | | | | | |
See Accompanying Notes to Financial Statements.
85
Columbia International Growth Fund
March 31, 2010
| | | | | | | | | | | | |
Forward
Foreign
Currency
Exchange
Contracts
to Sell | | Value | | Aggregate
Face Value | | Settlement
Date | | Unrealized
Appreciation
(Depreciation) | |
BRL | | $ | 2,630,843 | | $ | 2,590,849 | | 06/01/10 | | $ | (39,994 | ) |
CAD | | | 3,411,541 | | | 3,363,521 | | 06/01/10 | | | (48,020 | ) |
DKK | | | 3,409,889 | | | 3,435,837 | | 06/01/10 | | | 25,948 | |
GBP | | | 1,017,901 | | | 1,011,615 | | 06/01/10 | | | (6,286 | ) |
JPY | | | 1,883,248 | | | 1,977,896 | | 06/01/10 | | | 94,648 | |
TWD | | | 2,137,787 | | | 2,129,592 | | 06/01/10 | | | (8,195 | ) |
| | | | | | | | | | | | |
| | | | | | | | | | $ | 18,101 | |
| | | | | | | | | | | | |
The Fund was invested in the following countries at March 31, 2010:
| | | | | |
Summary of Securities
by Country (Unaudited) | | Value | | % of Total
Investments |
Japan | | $ | 38,131,981 | | 22.4 |
United Kingdom | | | 35,322,039 | | 20.7 |
Switzerland | | | 18,924,647 | | 11.1 |
Netherlands | | | 10,263,773 | | 6.1 |
Australia | | | 9,425,268 | | 5.5 |
Spain | | | 7,462,774 | | 4.4 |
United States* | | | 7,178,825 | | 4.2 |
France | | | 6,984,707 | | 4.1 |
Germany | | | 6,673,277 | | 3.9 |
Denmark | | | 5,793,379 | | 3.4 |
Canada | | | 3,974,700 | | 2.3 |
China | | | 3,601,590 | | 2.1 |
Sweden | | | 3,369,575 | | 2.0 |
Hong Kong | | | 1,972,039 | | 1.2 |
Indonesia | | | 1,933,430 | | 1.1 |
Ireland | | | 1,901,557 | | 1.1 |
Taiwan | | | 1,890,557 | | 1.1 |
Brazil | | | 1,602,126 | | 0.9 |
Russia | | | 1,105,782 | | 0.6 |
India | | | 824,636 | | 0.5 |
Italy | | | 811,216 | | 0.5 |
Greece | | | 787,298 | | 0.5 |
Singapore | | | 470,210 | | 0.3 |
| | | | | |
| | $ | 170,405,386 | | 100.0 |
| | | | | |
* Includes investment companies.
Certain securities are listed by country of underlying exposure but may trade predominantly on another exchange.
| | |
Acronym | | Name |
| ADR | | American Depositary Receipt |
| AUD | | Australian Dollar |
| BRL | | Brazilian Real |
| CAD | | Canadian Dollar |
| CHF | | Swiss Franc |
| DKK | | Danish Krone |
| EUR | | Euro |
| GBP | | Pound Sterling |
| JPY | | Japanese Yen |
| NOK | | Norwegian Krone |
| SEK | | Swedish Krona |
| SGD | | Singapore Dollar |
| TWD | | New Taiwan Dollar |
See Accompanying Notes to Financial Statements.
86
Investment Portfolio – Columbia Pacific/Asia Fund
March 31, 2010
Common Stocks – 97.1%
| | | | |
| | | Shares | | Value ($) |
| Consumer Discretionary – 11.2% | | | | |
| Auto Components – 1.1% | | | | |
Nippon Seiki Co., Ltd. | | 16,000 | | 189,111 |
Stanley Electric Co., Ltd. | | 8,200 | | 159,018 |
|
Auto Components Total | | | | 348,129 |
| | |
Automobiles – 4.9% | | | | |
Dongfeng Motor Group Co., Ltd., Class H | | 184,000 | | 298,599 |
Honda Motor Co., Ltd. | | 11,600 | | 409,456 |
Nissan Motor Co., Ltd. (a) | | 43,500 | | 372,698 |
Toyota Motor Corp. | | 12,000 | | 480,693 |
|
Automobiles Total | | | | 1,561,446 |
|
Leisure Equipment & Products – 0.8% |
Altek Corp. | | 139,423 | | 245,411 |
|
Leisure Equipment & Products Total | | 245,411 |
| | |
Media – 0.9% | | | | |
Daiichikosho Co., Ltd. | | 20,800 | | 268,315 |
|
Media Total | | | | 268,315 |
| | |
Specialty Retail – 1.3% | | | | |
Autobacs Seven Co., Ltd. | | 7,400 | | 236,271 |
USS Co., Ltd. | | 2,580 | | 175,238 |
|
Specialty Retail Total | | | | 411,509 |
|
Textiles, Apparel & Luxury Goods – 2.2% |
LG Fashion Corp. | | 11,340 | | 278,627 |
Weiqiao Textile Co., Ltd., Class H | | 189,572 | | 149,914 |
Youngone Corp. | | 35,138 | | 278,880 |
|
Textiles, Apparel & Luxury Goods Total | | 707,421 |
| | | | |
Consumer Discretionary Total | | | | 3,542,231 |
| | | | |
| Consumer Staples – 5.5% | | | | |
| Food & Staples Retailing – 2.9% | | | | |
Lianhua Supermarket Holdings Co., Ltd., Class H | | 89,017 | | 322,166 |
Matsumotokiyoshi Holdings Co., Ltd. | | 10,900 | | 246,588 |
Seven & I Holdings Co., Ltd. | | 14,700 | | 355,196 |
|
Food & Staples Retailing Total | | | | 923,950 |
| | |
Food Products – 1.1% | | | | |
Balrampur Chini Mills Ltd. | | 57,003 | | 116,495 |
China Milk Products Group Ltd. (a)(b) | | 595,000 | | 76,557 |
Toyo Suisan Kaisha Ltd. | | 5,900 | | 152,596 |
|
Food Products Total | | | | 345,648 |
| | | | |
| | | Shares | | Value ($) |
| Personal Products – 0.8% | | | | |
Mandom Corp. | | 8,900 | | 242,754 |
|
Personal Products Total | | | | 242,754 |
| | |
Tobacco – 0.7% | | | | |
Japan Tobacco, Inc. | | 59 | | 219,617 |
|
Tobacco Total | | | | 219,617 |
|
Consumer Staples Total | | | | 1,731,969 |
| | | | |
| Energy – 4.9% | | | | |
| Energy Equipment & Services – 0.8% | | | | |
Shinko Plantech Co., Ltd. | | 28,600 | | 253,298 |
|
Energy Equipment & Services Total | | 253,298 |
| | |
Oil, Gas & Consumable Fuels – 4.1% | | | | |
AWE Ltd. (a) | | 87,720 | | 218,950 |
China Shenhua Energy Co., Ltd., Class H | | 25,000 | | 107,544 |
CNOOC Ltd. | | 188,000 | | 308,480 |
Oil & Natural Gas Corp., Ltd. | | 12,731 | | 309,817 |
Yanzhou Coal Mining Co., Ltd., Class H | | 150,000 | | 359,726 |
|
Oil, Gas & Consumable Fuels Total | | | | 1,304,517 |
|
Energy Total | | | | 1,557,815 |
| | | | |
| Financials – 27.0% | | | | |
| Capital Markets – 1.5% | | | | |
Macquarie Group Ltd. | | 4,467 | | 193,684 |
Tokai Tokyo Financial Holdings | | 69,000 | | 287,838 |
|
Capital Markets Total | | | | 481,522 |
| | |
Commercial Banks – 16.1% | | | | |
Australia & New Zealand Banking Group Ltd. | | 6,822 | | 158,759 |
Bangkok Bank PCL, Foreign Registered Shares | | 72,000 | | 292,810 |
Bank of Baroda | | 26,324 | | 376,287 |
Bank of China Ltd., Class H | | 871,000 | | 463,307 |
Commonwealth Bank of Australia | | 11,764 | | 607,664 |
Daegu Bank | | 16,210 | | 217,050 |
DBS Group Holdings Ltd. | | 41,000 | | 419,100 |
Fukuoka Financial Group, Inc. | | 65,000 | | 276,019 |
Industrial & Commercial Bank of China, Class H | | 531,100 | | 405,631 |
Mitsubishi UFJ Financial Group, Inc. | | 21,700 | �� | 113,734 |
National Australia Bank Ltd. | | 5,686 | | 143,593 |
Siam Commercial Bank PCL, Foreign Registered Shares | | 91,600 | | 260,622 |
See Accompanying Notes to Financial Statements.
87
Columbia Pacific/Asia Fund
March 31, 2010
Common Stocks (continued)
| | | | |
| | | Shares | | Value ($) |
| Financials (continued) | | | | |
| Commercial Banks (continued) | | | | |
Sumitomo Mitsui Financial Group, Inc. | | 8,600 | | 284,244 |
Sumitomo Trust & Banking Co., Ltd. | | 47,400 | | 277,839 |
Union Bank of India | | 28,711 | | 187,378 |
Westpac Banking Corp. | | 24,782 | | 633,115 |
|
Commercial Banks Total | | | | 5,117,152 |
| | |
Consumer Finance – 1.0% | | | | |
Hitachi Capital Corp. | | 15,800 | | 224,942 |
ORIX Corp. | | 1,090 | | 96,653 |
|
Consumer Finance Total | | | | 321,595 |
| | |
Insurance – 2.7% | | | | |
Dai-ichi Mutual Life Insurance Co. (a)(b) | | 50 | | 79,153 |
Dongbu Insurance Co., Ltd. | | 10,870 | | 310,311 |
Hyundai Marine & Fire Insurance Co., Ltd. | | 12,720 | | 205,732 |
QBE Insurance Group Ltd. | | 14,379 | | 274,849 |
|
Insurance Total | | | | 870,045 |
|
Real Estate Investment Trusts (REITs) – 0.8% |
Japan Retail Fund Investment Corp. | | 214 | | 251,792 |
|
Real Estate Investment Trusts (REITs) Total | | 251,792 |
|
Real Estate Management & Development – 4.2% |
Ho Bee Investment Ltd. | | 224,000 | | 288,216 |
Hongkong Land Holdings Ltd. | | 60,000 | | 304,200 |
Huaku Development Co., Ltd. | | 115,000 | | 298,381 |
Sinolink Worldwide Holdings Ltd. | | 1,459,854 | | 248,190 |
Swire Pacific Ltd., Class A | | 14,700 | | 176,739 |
|
Real Estate Management & Development Total | | 1,315,726 |
| | |
Thrifts & Mortgage Finance – 0.7% | | | | |
LIC Housing Finance Ltd. | | 10,586 | | 206,191 |
|
Thrifts & Mortgage Finance Total | | | | 206,191 |
|
Financials Total | | | | 8,564,023 |
| | | | |
| Health Care – 2.8% | | | | |
| Health Care Providers & Services – 1.4% |
As One Corp. | | 9,100 | | 159,924 |
Miraca Holdings, Inc. | | 9,800 | | 298,748 |
|
Health Care Providers & Services Total | | 458,672 |
|
Pharmaceuticals – 1.4% |
Astellas Pharma, Inc. | | 5,700 | | 206,380 |
Santen Pharmaceutical Co., Ltd. | | 7,800 | | 234,109 |
|
Pharmaceuticals Total | | | | 440,489 |
|
Health Care Total | | | | 899,161 |
| | | | |
| | | Shares | | Value ($) |
| Industrials – 12.8% | | | | |
| Building Products – 0.7% | | | | |
Asahi Glass Co., Ltd. | | 21,000 | | 236,528 |
|
Building Products Total | | | | 236,528 |
|
Commercial Services & Supplies – 0.8% |
Aeon Delight Co., Ltd. | | 17,400 | | 244,557 |
|
Commercial Services & Supplies Total | | 244,557 |
| | |
Construction & Engineering – 3.8% | | | | |
COMSYS Holdings Corp. | | 12,400 | | 120,034 |
CTCI Corp. | | 193,000 | | 201,460 |
Macmahon Holdings Ltd. | | 421,303 | | 282,224 |
Monadelphous Group Ltd. | | 12,539 | | 176,048 |
NEC Networks & System Integration Corp. | | 21,900 | | 290,235 |
Toyo Engineering Corp. | | 36,000 | | 138,240 |
|
Construction & Engineering Total | | | | 1,208,241 |
| | |
Electrical Equipment – 3.0% | | | | |
Bharat Heavy Electricals Ltd. | | 2,757 | | 146,094 |
Harbin Power Equipment Co., Ltd., Class H | | 186,000 | | 153,558 |
I-Sheng Electric Wire & Cable Co., Ltd. | | 151,000 | | 287,660 |
Sumitomo Electric Industries Ltd. | | 28,500 | | 349,353 |
|
Electrical Equipment Total | | | | 936,665 |
| | |
Machinery – 0.9% | | | | |
Sintokogio Ltd. | | 35,800 | | 297,535 |
|
Machinery Total | | | | 297,535 |
| | |
Road & Rail – 0.6% | | | | |
Transport International Holdings Ltd. | | 54,121 | | 188,901 |
|
Road & Rail Total | | | | 188,901 |
|
Trading Companies & Distributors – 2.6% |
ITOCHU Corp. | | 50,000 | | 438,015 |
Mitsubishi Corp. | | 14,500 | | 379,987 |
|
Trading Companies & Distributors Total | | 818,002 |
|
Transportation Infrastructure – 0.4% |
Zhejiang Expressway Co., Ltd., Class H | | 132,000 | | 119,177 |
|
Transportation Infrastructure Total | | 119,177 |
|
Industrials Total | | | | 4,049,606 |
| | | | |
| Information Technology – 13.8% | | | | |
| Computers & Peripherals – 0.9% | | | | |
Wistron Corp. | | 164,631 | | 299,112 |
|
Computers & Peripherals Total | | | | 299,112 |
See Accompanying Notes to Financial Statements.
88
Columbia Pacific/Asia Fund
March 31, 2010
Common Stocks (continued)
| | | | |
| | | Shares | | Value ($) |
| Information Technology (continued) | | | | |
| Electronic Equipment, Instruments & Components – 2.8% |
FUJIFILM Holdings Corp. | | 9,300 | | 320,312 |
HON HAI Precision Industry Co., Ltd. | | 71,745 | | 310,628 |
Venture Corp., Ltd. | | 43,000 | | 268,030 |
|
Electronic Equipment, Instruments & Components Total | | 898,970 |
| | |
Internet Software & Services – 1.1% | | | | |
Tencent Holdings Ltd. | | 16,700 | | 334,893 |
|
Internet Software & Services Total | | | | 334,893 |
| | |
Office Electronics – 1.7% | | | | |
Canon, Inc. | | 11,600 | | 537,255 |
|
Office Electronics Total | | | | 537,255 |
|
Semiconductors & Semiconductor Equipment – 5.0% |
Macronix International | | 578,000 | | 382,203 |
Samsung Electronics Co., Ltd. | | 1,031 | | 745,378 |
Taiwan Semiconductor Manufacturing Co., Ltd., ADR | | 17,934 | | 188,128 |
United Microelectronics Corp., ADR (a) | | 72,129 | | 271,205 |
|
Semiconductors & Semiconductor Equipment Total | | 1,586,914 |
| | |
Software – 2.3% | | | | |
Nintendo Co., Ltd. | | 1,300 | | 435,234 |
NSD Co., Ltd. | | 24,700 | | 296,696 |
|
Software Total | | | | 731,930 |
|
Information Technology Total | | 4,389,074 |
| | |
| Materials – 10.9% | | | | |
| Chemicals – 3.5% | | | | |
Capro Corp. (a) | | 26,550 | | 253,427 |
Hitachi Chemical Co., Ltd. | | 14,000 | | 302,492 |
Kansai Paint Co., Ltd. | | 37,000 | | 301,573 |
Nitto Denko Corp. | | 6,100 | | 236,849 |
|
Chemicals Total | | | | 1,094,341 |
| | |
Containers & Packaging – 0.8% | | | | |
Cheng Loong Corp. (a) | | 609,000 | | 242,580 |
|
Containers & Packaging Total | | 242,580 |
| | |
Metals & Mining – 6.6% | | | | |
BHP Billiton Ltd. | | 20,669 | | 826,768 |
China Zhongwang Holdings Ltd. (a) | | 214,800 | | 188,124 |
Eurasian Natural Resources Corp. PLC | | 18,075 | | 326,951 |
Freeport-McMoRan Copper & Gold, Inc. (c) | | 2,777 | | 231,991 |
| | | | |
| | | Shares | | Value ($) |
Rio Tinto Ltd. | | 2,107 | | 151,585 |
Tokyo Steel Manufacturing Co., Ltd. | | 8,500 | | 106,466 |
Yamato Kogyo Co., Ltd. | | 8,300 | | 275,660 |
|
Metals & Mining Total | | | | 2,107,545 |
|
Materials Total | | | | 3,444,466 |
| | | | |
| Telecommunication Services – 4.3% |
| Diversified Telecommunication Services – 2.3% |
Chunghwa Telecom Co. Ltd., ADR | | 15,081 | | 293,024 |
Nippon Telegraph & Telephone Corp. | | 8,200 | | 345,577 |
Telecom Corp. of New Zealand Ltd. | | 69,610 | | 107,301 |
|
Diversified Telecommunication Services Total | | 745,902 |
|
Wireless Telecommunication Services – 2.0% |
China Mobile Ltd., ADR | | 3,001 | | 144,408 |
SK Telecom Co., Ltd. | | 717 | | 109,947 |
Softbank Corp. | | 15,100 | | 371,968 |
|
Wireless Telecommunication Services Total | | 626,323 |
|
Telecommunication Services Total | | 1,372,225 |
| | |
| Utilities – 3.9% | | | | |
| Gas Utilities – 2.4% | | | | |
PT Perusahaan Gas Negara Tbk | | 415,000 | | 193,829 |
Tokyo Gas Co., Ltd. | | 67,000 | | 295,262 |
Xinao Gas Holdings Ltd. | | 102,000 | | 260,641 |
|
Gas Utilities Total | | | | 749,732 |
|
Independent Power Producers & Energy Traders – 0.6% |
Energy Development Corp. | | 1,769,000 | | 195,729 |
|
Independent Power Producers & Energy Traders Total | | 195,729 |
| | |
Water Utilities – 0.9% | | | | |
Guangdong Investment Ltd. | | 544,000 | | 294,272 |
|
Water Utilities Total | | | | 294,272 |
| | | | |
Utilities Total | | | | 1,239,733 |
| | | | |
Total Common Stocks
(cost of $25,733,660) | | | | 30,790,303 |
See Accompanying Notes to Financial Statements.
89
Columbia Pacific/Asia Fund
March 31, 2010
Investment Companies – 1.9%
| | | | |
| | | Shares | | Value ($) |
iShares MSCI Emerging Markets Index Fund | | 5,820 | | 245,138 |
iShares MSCI Japan Index Fund | | 23,171 | | 241,905 |
iShares MSCI Pacific ex-Japan Index Fund | | 2,833 | | 121,791 |
| | | | |
Total Investment Companies
(cost of $600,578) | | | | 608,834 |
|
Total Investments – 99.0%
(cost of $26,334,238) (d) | | | | 31,399,137 |
|
Other Assets & Liabilities, Net – 1.0% | | 302,817 |
|
Net Assets – 100.0% | | | | 31,701,954 |
|
Notes to Investment Portfolio:
| (a) | Non-income producing security. |
| (b) | Represents fair value as determined in good faith under procedures approved by the Board of Trustees. At March 31, 2010, the value of these securities amounted to $155,710, which represents 0.05% of net assets. |
| (c) | All or a portion of this security is pledged as collateral for written options contracts. |
| (d) | Cost for federal income tax purposes is $27,045,129. |
The following table summarizes the inputs used, as of March 31, 2010, in valuing the Fund’s assets:
| | | | | | | | | | | | | | | |
Description | | Quoted
Prices
(Level 1) | | | Other
Significant
Observable
Inputs
(Level 2) | | | Significant
Unobservable
Inputs
(Level 3) | | Total | |
Common Stocks | | | | | | | | | | | | | | | |
Consumer Discretionary | | $ | — | | | $ | 3,542,231 | | | $ | — | | $ | 3,542,231 | |
Consumer Staples | | | — | | | | 1,655,412 | | | | 76,557 | | | 1,731,969 | |
Energy | | | — | | | | 1,557,815 | | | | — | | | 1,557,815 | |
Financials | | | 304,200 | | | | 8,180,670 | | | | 79,153 | | | 8,564,023 | |
Health Care | | | — | | | | 899,161 | | | | — | | | 899,161 | |
Industrials | | | — | | | | 4,049,606 | | | | — | | | 4,049,606 | |
Information Technology | | | 459,333 | | | | 3,929,741 | | | | — | | | 4,389,074 | |
Materials | | | 231,991 | | | | 3,212,475 | | | | — | | | 3,444,466 | |
Telecommunication Services | | | 437,432 | | | | 934,793 | | | | — | | | 1,372,225 | |
Utilities | | | — | | | | 1,239,733 | | | | — | | | 1,239,733 | |
| | | | | | | | | | | | | | | |
Total Common Stocks | | | 1,432,956 | | | | 29,201,637 | | | | 155,710 | | | 30,790,303 | |
| | | | | | | | | | | | | | | |
Total Investment Companies | | | 608,834 | | | | — | | | | — | | | 608,834 | |
| | | | | | | | | | | | | | | |
Total Investments | | | 2,041,790 | | | | 29,201,637 | | | | 155,710 | | | 31,399,137 | |
| | | | | | | | | | | | | | | |
Unrealized Appreciation on Forward Foreign Currency Exchange Contracts | | | — | | | | 56,956 | | | | — | | | 56,956 | |
| | | | | | | | | | | | | | | |
Unrealized Depreciation on Forward Foreign Currency Exchange Contracts | | | — | | | | (28,860 | ) | | | — | | | (28,860 | ) |
| | | | | | | | | | | | | | | |
Value of Written Call Option Contracts | | | (195 | ) | | | — | | | | — | | | (195 | ) |
| | | | | | | | | | | | | | | |
Total | | $ | 2,041,595 | | | $ | 29,229,733 | | | $ | 155,710 | | $ | 31,427,038 | |
| | | | | | | | | | | | | | | |
The Fund’s assets assigned to Level 2 input category include certain foreign securities for which a third party statistical pricing service may be employed for purposes of fair market valuation.
The following table reconciles asset balances for the year ending March 31, 2010, in which significant unobservable inputs (Level 3) were used in determining value:
| | | | | | | | | | | | | | | | | | | | | | | | | | | |
Investments in Securities | | Balance as of
March 31,
2009 | | Realized Gain (Loss) | | | Change in
Unrealized
Appreciation
(Depreciation) | | | Purchases | | Sales | | | Transfers
into
Level 3 | | Transfers
out of Level 3 | | Balance as of
March 31,
2010 |
Common Stocks | | | | | | | | | | | | | | | | | | | | | | | | | | | |
Consumer Staples | | $ | — | | $ | (3,017 | ) | | $ | (68,351 | ) | | $ | 205,230 | | $ | (57,305 | ) | | $ | — | | $ | — | | $ | 76,557 |
Financials | | | — | | | — | | | | 1,719 | | | | 77,434 | | | — | | | | — | | | — | | | 79,153 |
| | | | | | | | | | | | | | | | | | | | | | | | | | | |
| | $ | — | | $ | (3,017 | ) | | $ | (66,632 | ) | | $ | 282,664 | | $ | (57,305 | ) | | $ | — | | $ | — | | $ | 155,710 |
| | | | | | | | | | | | | | | | | | | | | | | | | | | |
See Accompanying Notes to Financial Statements.
90
Columbia Pacific/Asia Fund
March 31, 2010
The information in the above reconciliation represents fiscal year to date activity for any securities identified as using Level 3 inputs at either the beginning or the end of the current fiscal period.
The change in unrealized depreciation attributed to securities owned at March 31, 2010, which were valued using significant unobservable inputs (Level 3) amounted to $66,632. This amount is included in net changes in unrealized appreciation (depreciation) on the Statements of Changes in Net Assets.
For more information on valuation inputs, and their aggregation into the levels used in the tables above, please refer to the Security Valuation section in the accompanying Notes to Financial Statements.
At March 31, 2010, the Fund held the following written call option contracts:
Equity Risk
| | | | | | | | | | | | | | |
Name of Issuer | | Strike
Price | | Number of
Contracts | | Expiration
Date | | Premium | | Value | |
Freeport-McMoRan Copper & Gold, Inc. Total written call options (proceeds $195) | | $ | 95.0 | | 13 | | 04/17/10 | | $ | 195 | | $ | (195 | ) |
For the year ended March 31, 2010, transactions in written option contracts were as follows:
| | | | | | | |
| | | Number of
Contracts | | | Premium
Received | |
Options outstanding at March 31, 2009 | | — | | | $ | — | |
Options written | | 222 | | | | 14,486 | |
Options terminated in closing purchase transactions | | (62 | ) | | | (2,740 | ) |
Options exercised | | (53 | ) | | | (6,285 | ) |
Options expired | | (94 | ) | | | (5,266 | ) |
| | | | | | | |
Options outstanding at March 31, 2010 | | 13 | | | $ | 195 | |
| | | | | | | |
Forward foreign currency exchange contracts outstanding on March 31, 2010, are:
Foreign Exchange Rate Risk
| | | | | | | | | | | | |
Forward
Foreign
Currency
Exchange
Contracts
to Buy | | Value | | Aggregate
Face Value | | Settlement
Date | | Unrealized
Appreciation
(Depreciation) | |
AUD | | $ | 1,229,326 | | $ | 1,201,526 | | 06/01/10 | | $ | 27,800 | |
IDR | | | 382,202 | | | 375,930 | | 06/01/10 | | | 6,272 | |
INR | | | 258,965 | | | 254,298 | | 06/01/10 | | | 4,667 | |
JPY | | | 113,928 | | | 119,654 | | 06/01/10 | | | (5,726 | ) |
MYR | | | 595,091 | | | 578,088 | | 06/01/10 | | | 17,003 | |
NZD | | | 161,361 | | | 160,147 | | 06/01/10 | | | 1,214 | |
| | | | | | | | | | | | |
| | | | | | | | | | $ | 51,230 | |
| | | | | | | | | | | | |
| | | | | | | | | | | | |
Forward
Foreign
Currency
Exchange
Contracts
to Sell | | Value | | Aggregate
Face Value | | Settlement
Date | | Unrealized
Depreciation | |
GBP | | $ | 344,357 | | $ | 341,955 | | 06/01/10 | | $ | (2,402 | ) |
KRW | | | 104,770 | | | 103,410 | | 06/01/10 | | | (1,360 | ) |
NZD | | | 239,918 | | | 231,032 | | 06/01/10 | | | (8,886 | ) |
PHP | | | 129,722 | | | 126,887 | | 06/01/10 | | | (2,835 | ) |
SGD | | | 165,796 | | | 165,655 | | 06/01/10 | | | (141 | ) |
THB | | | 341,151 | | | 338,063 | | 06/01/10 | | | (3,088 | ) |
TWD | | | 927,273 | | | 922,851 | | 06/01/10 | | | (4,422 | ) |
| | | | | | | | | | | | |
| | | | | | | | | | $ | (23,134 | ) |
| | | | | | | | | | | | |
The Fund was invested in the following countries at March 31, 2010:
| | | | | |
Summary of Securities
by Country (Unaudited) | | Value ($) | | % of Total
Investments |
Japan | | $ | 13,113,956 | | 41.8 |
China | | | 3,986,998 | | 12.7 |
Australia | | | 3,667,240 | | 11.7 |
Taiwan | | | 3,019,791 | | 9.6 |
Republic of Korea | | | 2,399,353 | | 7.6 |
India | | | 1,342,262 | | 4.3 |
Singapore | | | 975,346 | | 3.1 |
Hong Kong | | | 918,030 | | 2.9 |
United States* | | | 598,920 | | 1.9 |
Thailand | | | 553,431 | | 1.8 |
United Kingdom | | | 326,951 | | 1.0 |
Philippines | | | 195,729 | | 0.6 |
Indonesia | | | 193,829 | | 0.6 |
New Zealand | | | 107,301 | | 0.4 |
| | | | | |
| | $ | 31,399,137 | | 100.0 |
| | | | | |
* Includes investment companies.
Certain securities are listed by country of underlying exposure but may trade predominantly on another exchange.
| | |
Acronym | | Name |
| ADR | | American Depositary Receipt |
| AUD | | Australian Dollar |
| GBP | | British Pound |
| IDR | | Indonesian Rupiah |
| INR | | Indian Rupee |
| JPY | | Japanese Yen |
| KRW | | South Korean Won |
| MYR | | Malaysian Ringgit |
| NZD | | New Zealand Dollar |
| PHP | | Philippine Peso |
| SGD | | Singapore Dollar |
| THB | | Thailand Baht |
| TWD | | New Taiwan Dollar |
See Accompanying Notes to Financial Statements.
91
Statements of Assets and Liabilities – Equity Funds
March 31, 2010
| | | | | | | | | | |
| | | ($) | | ($) | | ($) | | ($) | | |
| | | Columbia
Blended
Equity Fund | | Columbia
Energy and
Natural
Resources
Fund | | Columbia
Mid Cap
Core Fund | | Columbia
Select Large
Cap Growth
Fund | | |
Assets | | | | | | | | | | |
Unaffiliated investments, at identified cost | | 78,247,497 | | 624,501,729 | | 60,021,245 | | 1,883,089,033 | | |
Affiliated investments, at identified cost | | — | | — | | — | | — | | |
| | | | | | | | | | |
| | | | | |
Total investments, at identified cost | | 78,247,497 | | 624,501,729 | | 60,021,245 | | 1,883,089,033 | | |
Unaffiliated investments, at value | | 150,028,269 | | 723,685,535 | | 74,877,002 | | 2,268,067,234 | | |
Affiliated investments, at value | | — | | — | | — | | — | | |
| | | | | | | | | | |
| | | | | |
Total investments, at value | | 150,028,269 | | 723,685,535 | | 74,877,002 | | 2,268,067,234 | | |
| | | | | |
Cash | | 945 | | 680 | | — | | 265 | | |
Foreign currency (cost of $—, $—, $—, $—, $4,820, $—, $—, $1,178,617, $467,837 and $143,096, respectively) | | — | | — | | — | | — | | |
Unrealized appreciation on forward foreign currency exchange contracts | | — | | — | | — | | — | | |
Receivable for: | | | | | | | | | | |
Investments sold | | — | | 8,876,853 | | — | | — | | |
Fund shares sold | | 2,032 | | 1,081,021 | | 208,199 | | 16,778,987 | | |
Dividends | | 189,768 | | 295,080 | | 76,842 | | 1,104,938 | | |
Interest | | — | | — | | — | | — | | |
Foreign tax reclaims | | — | | — | | — | | 508,794 | | |
Premium for written options | | — | | — | | — | | — | | |
Expense reimbursement due from investment advisor | | — | | — | | — | | — | | |
Trustees’ deferred compensation plan | | 7,965 | | 13,692 | | 6,890 | | 20,579 | | |
Prepaid expenses | | 15,903 | | 37,064 | | 12,826 | | 64,232 | | |
Other assets | | — | | — | | — | | — | | |
| | | | | | | | | | |
| | | | | |
Total Assets | | 150,244,882 | | 733,989,925 | | 75,181,759 | | 2,286,545,029 | | |
| | | | | |
| | | | | | | | | | | |
Liabilities | | | | | | | | | | |
Payable to custodian bank | | — | | — | | 415,569 | | — | | |
Written options, at value (premium of $—, $—, $—, $—, $—, $—, $557,720, $-, $12,441 and $195, respectively) | | — | | — | | — | | — | | |
Unrealized depreciation on forward foreign currency exchange contracts | | — | | — | | — | | — | | |
Expense reimbursement due to investment advisor | | 6,532 | | — | | 6,545 | | 2,755 | | |
Payable for: | | | | | | | | | | |
Investments purchased | | — | | 42,877,294 | | — | | 4,459,913 | | |
Fund shares repurchased | | 221,436 | | 743,815 | | 299,136 | | 1,805,801 | | |
Foreign capital gains taxes withheld | | — | | — | | — | | — | | |
Investment advisory fee | | 96,709 | | 343,698 | | 41,701 | | 1,124,772 | | |
Administration fee | | 14,415 | | 74,385 | | 5,739 | | 266,544 | | |
Pricing and bookkeeping fees | | 5,859 | | 11,806 | | 4,906 | | 11,746 | | |
Transfer agent fee | | 18,034 | | 135,320 | | 15,580 | | 416,459 | | |
Trustees’ fees | | 2,455 | | 1,757 | | 1,663 | | 1,637 | | |
Audit fee | | 29,075 | | 29,075 | | 32,175 | | 31,175 | | |
Custody fee | | 1,977 | | 3,230 | | 1,034 | | 6,452 | | |
Distribution and service fees | | 239 | | 23,880 | | 1,045 | | 115,915 | | |
Chief compliance officer expenses | | 175 | | 227 | | 167 | | 337 | | |
Reports to shareholders | | 10,712 | | 21,913 | | 22,888 | | 46,335 | | |
Loan | | — | | — | | — | | — | | |
Interest | | — | | 118 | | 1 | | — | | |
Trustees’ deferred compensation plan | | 7,965 | | 13,692 | | 6,890 | | 20,579 | | |
Other liabilities | | 9,298 | | 7,546 | | 7,244 | | 6,327 | | |
| | | | | | | | | | |
| | | | | |
Total Liabilities | | 424,881 | | 44,287,756 | | 862,283 | | 8,316,747 | | |
| | | | | |
| | | | | | | | | | | |
Net Assets | | 149,820,001 | | 689,702,169 | | 74,319,476 | | 2,278,228,282 | | |
See Accompanying Notes to Financial Statements.
92
| | | | | | | | | | | | |
| | | ($) | | ($) | | ($) | | ($) | | ($) | | ($) |
| | | Columbia
Select
Opportunities
Fund | | Columbia
Select Small
Cap Fund | | Columbia
Value and
Restructuring
Fund | | Columbia
Emerging
Markets
Fund | | Columbia
International
Growth Fund | | Columbia
Pacific/
Asia Fund |
| | | | | | | | | | | | |
| | 91,383,940 | | 472,222,008 | | 5,078,451,019 | | 240,329,457 | | 141,073,116 | | 26,334,238 |
| | — | | — | | 243,836,862 | | — | | — | | — |
| | | | | | | | | | | | |
| | | | | | |
| | 91,383,940 | | 472,222,008 | | 5,322,287,881 | | 240,329,457 | | 141,073,116 | | 26,334,238 |
| | 123,299,842 | | 624,726,300 | | 6,839,218,858 | | 403,708,001 | | 170,405,386 | | 31,399,137 |
| | — | | — | | 356,559,000 | | — | | — | | — |
| | | | | | | | | | | | |
| | | | | | |
| | 123,299,842 | | 624,726,300 | | 7,195,777,858 | | 403,708,001 | | 170,405,386 | | 31,399,137 |
| | | | | | |
| | 698 | | 354 | | 96,752 | | 1,991 | | — | | — |
| | 4,854 | | — | | — | | 1,178,673 | | 467,899 | | 143,208 |
| | — | | — | | — | | — | | 355,745 | | 56,956 |
| | | | | | | | | | | | |
| | 1,265,950 | | — | | 6,304,919 | | 4,662,162 | | 527,784 | | 1,172,994 |
| | 20,741 | | 843,180 | | 7,819,916 | | 142,266 | | 108,912 | | 54 |
| | 101,688 | | 116,700 | | 6,361,000 | | 561,584 | | 612,455 | | 172,054 |
| | — | | — | | 838,194 | | — | | — | | — |
| | 10,752 | | — | | 178,960 | | — | | 311,167 | | — |
| | — | | — | | — | | — | | 1,580 | | 195 |
| | 9,425 | | — | | — | | — | | — | | 18,958 |
| | 8,728 | | 13,121 | | 122,295 | | 13,953 | | 10,391 | | 5,520 |
| | 14,529 | | 37,447 | | 464,009 | | 49,332 | | 29,171 | | 6,715 |
| | — | | — | | 11,177 | | — | | 1,925 | | — |
| | | | | | | | | | | | |
| | | | | | |
| | 124,737,207 | | 625,737,102 | | 7,217,975,080 | | 410,317,962 | | 172,832,415 | | 32,975,791 |
| | | | | | |
| | | | | | | | | | | | |
| | | | | | | | | | | | |
| | — | | — | | — | | — | | 129,749 | | 275,151 |
| | — | | — | | 593,000 | | — | | 8,432 | | 195 |
| | — | | — | | — | | — | | 152,829 | | 28,860 |
| | — | | — | | — | | 59,361 | | 21,553 | | — |
| | | | | | | | | | | | |
| | 581,111 | | — | | — | | 3,137,735 | | 174,526 | | 822,098 |
| | 295,094 | | 1,049,266 | | 12,786,389 | | 506,210 | | 123,230 | | 12,412 |
| | — | | — | | — | | 1,069,092 | | — | | 46,140 |
| | 84,533 | | 396,438 | | 3,596,243 | | 389,759 | | 141,810 | | 20,567 |
| | 14,021 | | 68,187 | | 888,259 | | 61,532 | | 27,171 | | 2,309 |
| | 6,850 | | 11,254 | | 12,356 | | 10,291 | | 7,310 | | 5,582 |
| | 8,122 | | 132,517 | | 1,530,571 | | 69,393 | | 44,508 | | 3,885 |
| | 1,827 | | 2,355 | | 8,063 | | 2,022 | | 2,485 | | 1,350 |
| | 30,075 | | 31,175 | | 36,375 | | 25,738 | | 33,650 | | 23,838 |
| | 8,299 | | 4,048 | | 53,565 | | 128,023 | | 20,144 | | 11,284 |
| | 530 | | 8,222 | | 149,566 | | 2,602 | | 296 | | 505 |
| | 177 | | 217 | | 899 | | 203 | | 183 | | 157 |
| | 17,424 | | 42,649 | | 295,366 | | 71,932 | | 41,532 | | 7,184 |
| | — | | — | | 7,800,000 | | — | | — | | — |
| | — | | — | | 3,402 | | 453 | | — | | — |
| | 8,728 | | 13,121 | | 122,295 | | 13,953 | | 10,391 | | 5,520 |
| | 5,738 | | 7,878 | | 99,019 | | 19,361 | | 21,829 | | 6,800 |
| | | | | | | | | | | | |
| | | | | | |
| | 1,062,529 | | 1,767,327 | | 27,975,368 | | 5,567,660 | | 961,628 | | 1,273,837 |
| | | | | | |
| | | | | | | | | | | | |
| | 123,674,678 | | 623,969,775 | | 7,189,999,712 | | 404,750,302 | | 171,870,787 | | 31,701,954 |
See Accompanying Notes to Financial Statements.
93
Statements of Assets and Liabilities (continued) – Equity Funds
March 31, 2010
| | | | | | | | | | | | | | | | | | |
| | | ($) | | | ($) | | | ($) | | | ($) | | | |
| | | Columbia
Blended
Equity Fund | | | Columbia
Energy and
Natural
Resources
Fund | | | Columbia
Mid Cap
Core Fund | | | Columbia Select Large Cap
Growth Fund | | | |
Net Assets Consist of | | | | | | | | | | | | | | | | | | |
Paid-in capital | | | 71,670,749 | | | | 708,036,879 | | | | 60,221,761 | | | | 2,171,049,281 | | | |
Undistributed (overdistributed) net investment income | | | 145,948 | | | | 337,918 | | | | (6,233 | ) | | | (17,961 | ) | | |
Accumulated net realized gain (loss) | | | 6,222,532 | | | | (117,856,590 | ) | | | (751,809 | ) | | | (277,781,239 | ) | | |
Net unrealized appreciation (depreciation) on: | | | | | | | | | | | | | | | | | | |
Investments | | | 71,780,772 | | | | 99,183,806 | | | | 14,855,757 | | | | 384,978,201 | | | |
Foreign currency translations | | | — | | | | 156 | | | | — | | | | — | | | |
Written options | | | — | | | | — | | | | — | | | | — | | | |
Foreign capital gains tax | | | — | | | | — | | | | — | | | | — | | | |
| | | | | |
| | | | | | | | | | | | | | | | | | | |
Net Assets | | | 149,820,001 | | | | 689,702,169 | | | | 74,319,476 | | | | 2,278,228,282 | | | |
| | | | | |
| | | | | | | | | | | | | | | | | | | |
Class A | | | | | | | | | | | | | | | | | | |
Net assets | | $ | 330,342 | | | $ | 50,811,688 | | | $ | 949,426 | | | $ | 576,956,218 | | | |
Shares outstanding | | | 14,302 | | | | 2,526,150 | | | | 63,980 | | | | 54,444,621 | | | |
Net asset value per share(a) | | $ | 23.10 | | | $ | 20.11 | | | $ | 14.84 | | | $ | 10.60 | | | |
Maximum sales charge | | | 5.75 | % | | | 5.75 | % | | | 5.75 | % | | | 5.75 | % | | |
Maximum offering price per share(b) | | $ | 24.51 | | | $ | 21.34 | | | $ | 15.75 | | | $ | 11.25 | | | |
| | | | | |
| | | | | | | | | | | | | | | | | | | |
Class C | | | | | | | | | | | | | | | | | | |
Net assets | | $ | 197,598 | | | $ | 16,419,637 | | | $ | 257,385 | | | $ | 3,234,125 | | | |
Shares outstanding | | | 8,593 | | | | 830,280 | | | | 17,430 | | | | 311,040 | | | |
Net asset value and offering price per share(a) | | $ | 22.99 | (c) | | $ | 19.78 | | | $ | 14.77 | | | $ | 10.40 | | | |
| | | | | |
| | | | | | | | | | | | | | | | | | | |
Class R | | | | | | | | | | | | | | | | | | |
Net assets | | | — | | | | — | | | $ | 1,218,984 | | | $ | 407,833 | | | |
Shares outstanding | | | — | | | | — | | | | 83,223 | | | | 39,396 | | | |
Net asset value, offering and redemption price per share | | | — | | | | — | | | $ | 14.65 | | | $ | 10.35 | | | |
| | | | | |
| | | | | | | | | | | | | | | | | | | |
Class Z | | | | | | | | | | | | | | | | | | |
Net assets | | $ | 149,292,061 | | | $ | 622,470,844 | | | $ | 71,893,681 | | | $ | 1,697,630,106 | | | |
Shares outstanding | | | 6,463,880 | | | | 30,864,224 | | | | 4,832,428 | | | | 159,392,788 | | | |
Net asset value, offering and redemption price per share | | $ | 23.10 | | | $ | 20.17 | | | $ | 14.88 | | | $ | 10.65 | | | |
| (a) | Redemption price per share is equal to net asset value less any applicable contingent deferred sales charge. |
| (b) | On sales of $50,000 or more the offering price is reduced. |
| (c) | Net asset value rounds to $23.00 per share due to fractional shares outstanding. |
See Accompanying Notes to Financial Statements.
94
| | | | | | | | | | | | | | | | | | | | | | | | |
| | | ($) | | | ($) | | | ($) | | | ($) | | | ($) | | | ($) | |
| | | Columbia
Select
Opportunities
Fund | | | Columbia
Select Small Cap
Fund | | | Columbia Value and
Restructuring
Fund | | | Columbia
Emerging
Markets Fund | | | Columbia
International
Growth Fund | | | Columbia
Pacific/ Asia Fund | |
| | | | | | | | | | | | | | | | | | | | | | | | |
| | | 203,491,662 | | | | 605,126,015 | | | | 6,962,905,357 | | | | 228,980,771 | | | | 282,086,824 | | | | 50,259,114 | |
| | | | | | |
| | | 36,580 | | | | (11,483 | ) | | | 3,439,148 | | | | (1,604,394 | ) | | | 2,960,574 | | | | 661,843 | |
| | | (111,770,262 | ) | | | (133,649,049 | ) | | | (1,649,783,627 | ) | | | 15,051,397 | | | | (142,721,168 | ) | | | (24,264,230 | ) |
| | | | | | | | | | | | | | | | | | | | | | | | |
| | | 31,915,902 | | | | 152,504,292 | | | | 1,873,489,977 | | | | 163,378,544 | | | | 29,332,270 | | | | 5,064,899 | |
| | | 796 | | | | — | | | | (15,863 | ) | | | 13,076 | | | | 208,278 | | | | 26,468 | |
| | | — | | | | — | | | | (35,280 | ) | | | — | | | | 4,009 | | | | — | |
| | | — | | | | — | | | | — | | | | (1,069,092 | ) | | | — | | | | (46,140 | ) |
| | | | | | |
| | | | | | | | | | | | | | | | | | | | | | | | |
| | | 123,674,678 | | | | 623,969,775 | | | | 7,189,999,712 | | | | 404,750,302 | | | | 171,870,787 | | | | 31,701,954 | |
| | | | | | |
| | | | | | | | | | | | | | | | | | | | | | | | |
| | | | | | | | | | | | | | | | | | | | | | | | |
| | $ | 1,371,845 | | | $ | 15,281,335 | | | $ | 291,654,967 | | | $ | 6,362,012 | | | $ | 395,908 | | | $ | 813,684 | |
| | | 115,717 | | | | 1,037,038 | | | | 6,527,123 | | | | 564,603 | | | | 29,726 | | | | 106,435 | |
| | $ | 11.86 | | | $ | 14.74 | | | $ | 44.68 | | | $ | 11.27 | | | $ | 13.32 | | | $ | 7.64 | |
| | | 5.75 | % | | | 5.75 | % | | | 5.75 | % | | | 5.75 | % | | | 5.75 | % | | | 5.75 | % |
| | $ | 12.58 | | | $ | 15.64 | | | $ | 47.41 | | | $ | 11.96 | | | $ | 14.13 | | | $ | 8.11 | |
| | | | | | |
| | | | | | | | | | | | | | | | | | | | | | | | |
| | | | | | | | | | | | | | | | | | | | | | | | |
| | $ | 264,280 | | | $ | 1,090,340 | | | $ | 74,879,848 | | | $ | 1,539,550 | | | $ | 249,659 | | | $ | 359,138 | |
| | | 22,525 | | | | 75,421 | | | | 1,678,934 | | | | 137,398 | | | | 18,876 | | | | 47,530 | |
| | $ | 11.73 | | | $ | 14.46 | | | $ | 44.60 | | | $ | 11.21 | | | $ | 13.23 | | | $ | 7.56 | |
| | | | | | |
| | | | | | | | | | | | | | | | | | | | | | | | |
| | | | | | | | | | | | | | | | | | | | | | | | |
| | | — | | | $ | 9,794,559 | | | $ | 58,119,797 | | | | — | | | | — | | | | — | |
| | | — | | | | 681,050 | | | | 1,302,072 | | | | — | | | | — | | | | — | |
| | | — | | | $ | 14.38 | | | $ | 44.64 | | | | — | | | | — | | | | — | |
| | | | | | |
| | | | | | | | | | | | | | | | | | | | | | | | |
| | | | | | | | | | | | | | | | | | | | | | | | |
| | $ | 122,038,553 | | | $ | 597,803,541 | | | $ | 6,765,345,100 | | | $ | 396,848,740 | | | $ | 171,225,220 | | | $ | 30,529,132 | |
| | | 10,293,884 | | | | 40,376,993 | | | | 151,501,299 | | | | 35,236,665 | | | | 12,810,334 | | | | 3,971,762 | |
| | $ | 11.86 | | | $ | 14.81 | | | $ | 44.66 | | | $ | 11.26 | | | $ | 13.37 | | | $ | 7.69 | |
See Accompanying Notes to Financial Statements.
95
Statements of Operations – Equity Funds
For the Year Ended March 31, 2010
| | | | | | | | | | | | | | |
| | | $ | | | $ | | | $ | | | $ | | | |
| | | Columbia
Blended
Equity
Fund | | | Columbia
Energy and
Natural
Resources
Fund | | | Columbia
Mid Cap
Core Fund | | | Columbia
Select
Large Cap
Growth
Fund | | | |
Investment Income | | | | | | | | | | | | | | |
Dividends | | 2,951,482 | | | 6,692,337 | | | 1,203,393 | | | 11,082,241 | | | |
Interest | | 27,599 | | | 28,519 | | | 172 | | | 141,029 | | | |
Foreign taxes withheld | | (19,739 | ) | | (174,439 | ) | | (2,118 | ) | | (342,515 | ) | | |
| | | | | |
| | | | | | | | | | | | | | | |
Total Investment Income | | 2,959,342 | | | 6,546,417 | | | 1,201,447 | | | 10,880,755 | | | |
| | | | | |
Expenses | | | | | | | | | | | | | | |
Investment advisory fee | | 1,165,707 | | | 3,382,995 | | | 488,998 | | | 10,061,635 | | | |
Administration fee | | 171,827 | | | 723,263 | | | 63,556 | | | 2,127,779 | | | |
Distribution fee: | | | | | | | | | | | | | | |
Class C | | 1,144 | | | 89,532 | | | 1,466 | | | 14,917 | | | |
Class R | | — | | | — | | | 6,903 | | | 618 | | | |
Service fee: | | | | | | | | | | | | | | |
Class A | | 542 | | | 95,419 | | | 1,429 | | | 769,303 | | | |
Class C | | 381 | | | 29,844 | | | 489 | | | 4,972 | | | |
Pricing and bookkeeping fees | | 65,325 | | | 123,403 | | | 51,983 | | | 140,511 | | | |
Transfer agent fee | | 71,464 | | | 807,854 | | | 73,744 | | | 2,280,152 | | | |
Trustees’ fees | | 14,150 | | | 30,708 | | | 20,566 | | | 62,208 | | | |
Custody fee | | 3,930 | | | 18,749 | | | 12,524 | | | 33,491 | | | |
Registration fees | | 30,165 | | | 67,684 | | | 39,927 | | | 143,031 | | | |
Audit fee | | 34,958 | | | 35,036 | | | 37,998 | | | 36,939 | | | |
Reports to shareholders | | 36,605 | | | 141,459 | | | 45,072 | | | 211,943 | | | |
Chief compliance officer expenses | | 651 | | | 717 | | | 634 | | | 1,171 | | | |
Other expenses | | 30,545 | | | 67,815 | | | 22,927 | | | 145,510 | | | |
| | | | | |
| | | | | | | | | | | | | | | |
Expenses before interest expense | | 1,627,394 | | | 5,614,478 | | | 868,216 | | | 16,034,180 | | | |
| | | | | |
Interest expense | | 537 | | | 1,349 | | | 40 | | | — | | | |
| | | | | |
| | | | | | | | | | | | | | | |
Total Expenses | | 1,627,931 | | | 5,615,827 | | | 868,256 | | | 16,034,180 | | | |
Fees waived or expenses reimbursed by investment advisor and/or administrator | | (20,588 | ) | | — | | | (74,979 | ) | | — | | | |
Expense reductions | | — | * | | (28 | ) | | — | | | (39 | ) | | |
| | | | | |
| | | | | | | | | | | | | | | |
Net Expenses | | 1,607,343 | | | 5,615,799 | | | 793,277 | | | 16,034,141 | | | |
| | | | | |
| | | | | | | | | | | | | | | |
Net Investment Income (Loss) | | 1,351,999 | | | 930,618 | | | 408,170 | | | (5,153,386 | ) | | |
| * | Rounds to less than $1.00. |
See Accompanying Notes to Financial Statements.
96
| | | | | | | | | | | | | | | | | | |
| | | $ | | | $ | | | $ | | | $ | | | $ | | | $ | |
| | | Columbia
Select
Opportunities
Fund | | | Columbia
Select
Small Cap
Fund | | | Columbia
Value and
Restructuring
Fund | | | Columbia
Emerging
Markets Fund | | | Columbia
International
Growth Fund | | | Columbia
Pacific/ Asia Fund | |
| | | | | | | | | | | | | | | | | | |
| | 1,896,963 | | | 3,838,908 | | | 140,780,841 | | | 7,761,454 | | | 5,600,434 | | | 787,930 | |
| | 1,229 | | | 4,333 | | | 833,494 | | | 2,599 | | | 496 | | | 64 | |
| | (43,927 | ) | | — | | | (3,246,235 | ) | | (849,935 | ) | | (447,948 | ) | | (58,793 | ) |
| | | | | | |
| | | | | | | | | | | | | | | | | | |
| | 1,854,265 | | | 3,843,241 | | | 138,368,100 | | | 6,914,118 | | | 5,152,982 | | | 729,201 | |
| | | | | | |
| | | | | | | | | | | | | | | | | | |
| | 1,009,880 | | | 3,835,693 | | | 38,153,435 | | | 4,059,904 | | | 1,731,218 | | | 219,007 | |
| | 143,792 | | | 652,276 | | | 9,398,359 | | | 615,027 | | | 299,037 | | | 16,020 | |
| | | | | | | | | | | | | | | | | | |
| | 2,040 | | | 6,684 | | | 473,717 | | | 7,090 | | | 1,762 | | | 2,781 | |
| | — | | | 40,499 | | | 258,974 | | | — | | | — | | | — | |
| | | | | | | | | | | | | | | | | | |
| | 3,503 | | | 30,108 | | | 610,589 | | | 10,730 | | | 853 | | | 1,579 | |
| | 680 | | | 2,228 | | | 157,906 | | | 2,363 | | | 587 | | | 927 | |
| | 68,505 | | | 115,064 | | | 143,767 | | | 103,288 | | | 75,170 | | | 53,504 | |
| | 28,190 | | | 777,770 | | | 6,673,492 | | | 126,652 | | | 61,489 | | | 20,639 | |
| | 23,397 | | | 34,816 | | | 289,296 | | | 15,676 | | | 25,580 | | | 17,769 | |
| | 43,321 | | | 19,761 | | | 283,704 | | | 254,161 | | | 126,859 | | | 95,553 | |
| | 46,395 | | | 64,147 | | | 129,420 | | | 44,568 | | | 23,980 | | | 36,687 | |
| | 35,957 | | | 36,893 | | | 42,368 | | | 28,124 | | | 40,899 | | | 50,793 | |
| | 30,716 | | | 85,283 | | | 1,095,286 | | | 78,035 | | | 42,664 | | | 24,378 | |
| | 630 | | | 744 | | | 2,396 | | | 635 | | | 577 | | | 581 | |
| | 37,754 | | | 66,091 | | | 770,985 | | | 60,743 | | | 33,608 | | | 29,182 | |
| | | | | | |
| | | | | | | | | | | | | | | | | | |
| | 1,474,760 | | | 5,768,057 | | | 58,483,694 | | | 5,406,996 | | | 2,464,283 | | | 569,400 | |
| | | | | | |
| | 126 | | | 134 | | | 21,251 | | | 1,502 | | | 798 | | | — | |
| | | | | | |
| | | | | | | | | | | | | | | | | | |
| | 1,474,886 | | | 5,768,191 | | | 58,504,945 | | | 5,408,498 | | | 2,465,081 | | | 569,400 | |
| | | | | | |
| | (206,732 | ) | | — | | | — | | | (133,614 | ) | | (156,078 | ) | | (131,463 | ) |
| | (1 | ) | | (3 | ) | | (2 | ) | | (2 | ) | | — | | | — | |
| | | | | | |
| | | | | | | | | | | | | | | | | | |
| | 1,268,153 | | | 5,768,188 | | | 58,504,943 | | | 5,274,882 | | | 2,309,003 | | | 437,937 | |
| | | | | | |
| | | | | | | | | | | | | | | | | | |
| | 586,112 | | | (1,924,947 | ) | | 79,863,157 | | | 1,639,236 | | | 2,843,979 | | | 291,264 | |
See Accompanying Notes to Financial Statements.
97
Statements of Operations (continued) – Equity Funds
For the Year Ended March 31, 2010
| | | | | | | | | | | | | | |
| | | $ | | | $ | | | $ | | | $ | | | |
| | | Columbia
Blended
Equity Fund | | | Columbia
Energy and
Natural
Resources
Fund | | | Columbia
Mid Cap
Core Fund | | | Columbia
Select
Large Cap
Growth Fund | | | |
Net Realized and Unrealized Gain (Loss) on Investments, Written Options, Foreign Currency and Foreign Capital Gains Tax | | | | | | | | | | | | | | |
Net realized gain (loss) on: | | | | | | | | | | | | | | |
Unaffiliated investments | | 27,972,273 | | | 84,763,444 | | | 14,798,726 | | | (19,265,914 | ) | | |
Affiliated investments | | — | | | — | | | — | | | — | | | |
Foreign currency transactions and forward foreign currency exchange contracts | | (52 | ) | | (39,340 | ) | | 43 | | | — | | | |
Written options | | — | | | — | | | — | | | — | | | |
| | | | | |
| | | | | | | | | | | | | | | |
Net realized gain (loss) | | 27,972,221 | | | 84,724,104 | | | 14,798,769 | | | (19,265,914 | ) | | |
Net change in unrealized appreciation (depreciation) on: | | | | | | | | | | | | | | |
Investments | | 26,249,000 | | | 108,993,784 | | | 17,787,065 | | | 567,509,777 | | | |
Foreign currency translations and forward foreign currency exchange contracts | | 87 | | | 38,916 | | | (40 | ) | | — | | | |
Written options | | — | | | — | | | — | | | — | | | |
Foreign capital gains tax | | — | | | — | | | — | | | — | | | |
| | | | | |
| | | | | | | | | | | | | | | |
Net change in unrealized appreciation | | 26,249,087 | | | 109,032,700 | | | 17,787,025 | | | 567,509,777 | | | |
| | | | | |
| | | | | | | | | | | | | | | |
Net Gain | | 54,221,308 | | | 193,756,804 | | | 32,585,794 | | | 548,243,863 | | | |
| | | | | |
| | | | | | | | | | | | | | | |
Net Increase Resulting from Operations | | 55,573,307 | | | 194,687,422 | | | 32,993,964 | | | 543,090,477 | | | |
| | | | | | | | | | | | | | |
| * | Rounds to less than $1.00. |
See Accompanying Notes to Financial Statements.
98
| | | | | | | | | | | | | | | | | | |
| | | $ | | | $ | | | $ | | | $ | | | $ | | | $ | |
| | |
Columbia
Select
Opportunities
Fund | | | Columbia
Select
Small Cap
Fund | | | Columbia
Value and
Restructuring
Fund | | | Columbia
Emerging
Markets
Fund | | | Columbia
International
Growth
Fund | | | Columbia
Pacific/
Asia Fund | |
| | | | | | |
| | | | | | | | | | | | | | | | | | |
| | | | | | | | | | | | | | | | | | |
| | 20,133,601 | | | (9,941,861 | ) | | (321,064,474 | ) | | 50,632,786 | | | (4,438,402 | ) | | (311,038 | ) |
| | — | | | — | | | (2,891,068 | ) | | — | | | — | | | — | |
| | | | | | |
| | (22,548 | ) | | — | | | (137,020 | ) | | (299,400 | ) | | 429,113 | | | 281,854 | |
| | — | | | — | | | — | | | — | | | 64,927 | | | 5,266 | |
| | | | | | |
| | | | | | | | | | | | | | | | | | |
| | 20,111,053 | | | (9,941,861 | ) | | (324,092,562 | ) | | 50,333,386 | | | (3,944,362 | ) | | (23,918 | ) |
| | | | | | |
| | | | | | | | | | | | | | | | | | |
| | 40,437,223 | | | 239,917,915 | | | 3,334,313,839 | | | 134,702,413 | | | 70,677,574 | | | 13,417,418 | |
| | | | | | |
| | 9,363 | | | — | | | 3,553 | | | 27,745 | | | (61,524 | ) | | (17,430 | ) |
| | — | | | — | | | (35,280 | ) | | — | | | 4,009 | | | — | |
| | — | | | — | | | — | | | (1,019,546 | ) | | — | | | (46,140 | ) |
| | | | | | |
| | | | | | | | | | | | | | | | | | |
| | 40,446,586 | | | 239,917,915 | | | 3,334,282,112 | | | 133,710,612 | | | 70,620,059 | | | 13,353,848 | |
| | | | | | |
| | | | | | | | | | | | | | | | | | |
| | 60,557,639 | | | 229,976,054 | | | 3,010,189,550 | | | 184,043,998 | | | 66,675,697 | | | 13,329,930 | |
| | | | | | |
| | | | | | | | | | | | | | | | | | |
| | 61,143,751 | | | 228,051,107 | | | 3,090,052,707 | | | 185,683,234 | | | 69,519,676 | | | 13,621,194 | |
| | | | | | | | | | | | | | | | | | |
See Accompanying Notes to Financial Statements.
99
Statements of Changes in Net Assets – Equity Funds
| | | | | | | | | | | | | | |
| Increase (Decrease) in Net Assets | | Columbia Blended
Equity Fund | | | Columbia Energy and
Natural Resources Fund | | | |
| | | Year Ended March 31, | | | Year Ended March 31, | | | |
| | | 2010 ($) | | | 2009 ($) | | | 2010 ($) | | | 2009 ($) | | | |
Operations | | | | | | | | | | | | | | |
Net investment income (loss) | | 1,351,999 | | | 1,885,312 | | | 930,618 | | | 579,329 | | | |
Net realized gain (loss) on investments, written options, foreign currency transactions and forward foreign currency exchange contracts | | 27,972,221 | | | (21,792,871 | ) | | 84,724,104 | | | (200,239,054 | ) | | |
Net change in unrealized appreciation (depreciation) on investments, written options, foreign currency translations and forward foreign currency exchange contracts | | 26,249,087 | | | (82,621,897 | ) | | 109,032,700 | | | (127,871,834 | ) | | |
| | | | | | | | | | | | | | |
Net increase (decrease) resulting from operations | | 55,573,307 | | | (102,529,456 | ) | | 194,687,422 | | | (327,531,559 | ) | | |
| | | | | |
Distributions to Shareholders | | | | | | | | | | | | | | |
From net investment income: | | | | | | | | | | | | | | |
Class A | | (1,301 | ) | | (474 | ) | | (29,443 | ) | | — | | | |
Class C | | (166 | ) | | (19 | ) | | — | | | — | | | |
Class R | | — | | | — | | | — | | | — | | | |
Class Z | | (1,357,618 | ) | | (1,756,076 | ) | | (1,492,249 | ) | | — | | | |
From net realized gains: | | | | | | | | | | | | | | |
Class A | | — | | | (1,523 | ) | | — | | | (213,683 | ) | | |
Class C | | — | | | (2,089 | ) | | — | | | (49,859 | ) | | |
Class R | | — | | | — | | | — | | | — | | | |
Class Z | | — | | | (21,465,963 | ) | | — | | | (11,867,954 | ) | | |
| | | | | | | | | | | | | | |
Total distributions to shareholders | | (1,359,085 | ) | | (23,226,144 | ) | | (1,521,692 | ) | | (12,131,496 | ) | | |
| | | | | |
Net Capital Stock Transactions | | (44,530,682 | ) | | (26,011,260 | ) | | 135,524,840 | | | (18,201,727 | ) | | |
Increase from regulatory settlements | | 25,685 | | | — | | | 35,194 | | | — | | | |
| | | | | | | | | | | | | | |
Total increase (decrease) in net assets | | 9,709,225 | | | (151,766,860 | ) | | 328,725,764 | | | (357,864,782 | ) | | |
| | | | | |
Net Assets | | | | | | | | | | | | | | |
Beginning of period | | 140,110,776 | | | 291,877,636 | | | 360,976,405 | | | 718,841,187 | | | |
End of period | | 149,820,001 | | | 140,110,776 | | | 689,702,169 | | | 360,976,405 | | | |
Undistributed (overdistributed) net investment income at end of period | | 145,948 | | | 127,402 | | | 337,918 | | | 516,042 | | | |
See Accompanying Notes to Financial Statements.
100
| | | | | | | | | | | | | | | | | | |
| | | Columbia
Mid Cap Core Fund | | | Columbia Select
Large Cap Growth Fund | | | Columbia Select
Opportunities Fund | |
| | | Year Ended March 31, | | | Year Ended March 31, | | | Year Ended March 31, | |
| | | 2010 ($) | | | 2009 ($) | | | 2010 ($) | | | 2009 ($) | | | 2010 ($) | | | 2009 ($) | |
| | | | | | | | | | | | | | | | | | |
| | 408,170 | | | 931,792 | | | (5,153,386 | ) | | (3,690,244 | ) | | 586,112 | | | 2,255,306 | |
| | | | | | |
| | 14,798,769 | | | (15,557,397 | ) | | (19,265,914 | ) | | (177,939,043 | ) | | 20,111,053 | | | (131,808,483 | ) |
| | | | | | |
| | 17,787,025 | | | (80,732,239 | ) | | 567,509,777 | | | (309,588,130 | ) | | 40,446,586 | | | (46,488,945 | ) |
| | | | | | | | | | | | | | | | | | |
| | 32,993,964 | | | (95,357,844 | ) | | 543,090,477 | | | (491,217,417 | ) | | 61,143,751 | | | (176,042,122 | ) |
| | | | | | |
| | | | | | | | | | | | | | | | | | |
| | | | | | | | | | | | | | | | | | |
| | (3,177 | ) | | (876 | ) | | — | | | — | | | (4,009 | ) | | (10,165 | ) |
| | (364 | ) | | (144 | ) | | — | | | — | | | (52 | ) | | (914 | ) |
| | (5,914 | ) | | (5,496 | ) | | — | | | — | | | — | | | — | |
| | (531,441 | ) | | (793,378 | ) | | — | | | — | | | (620,288 | ) | | (2,305,877 | ) |
| | | | | | | | | | | | | | | | | | |
| | — | | | (59 | ) | | — | | | — | | | — | | | (20,990 | ) |
| | — | | | (43 | ) | | — | | | — | | | — | | | (2,859 | ) |
| | — | | | (4,852 | ) | | — | | | — | | | — | | | — | |
| | — | | | (546,197 | ) | | — | | | — | | | — | | | (5,524,841 | ) |
| | | | | | | | | | | | | | | | | | |
| | (540,896 | ) | | (1,351,045 | ) | | — | | | — | | | (624,349 | ) | | (7,865,646 | ) |
| | | | | | |
| | (23,083,544 | ) | | (85,989,212 | ) | | 917,467,650 | | | 367,737,435 | | | (72,650,116 | ) | | (69,072,002 | ) |
| | — | | | — | | | — | | | 13,882 | | | — | | | — | |
| | | | | | | | | | | | | | | | | | |
| | 9,369,524 | | | (182,698,101 | ) | | 1,460,558,127 | | | (123,466,100 | ) | | (12,130,714 | ) | | (252,979,770 | ) |
| | | | | | |
| | | | | | | | | | | | | | | | | | |
| | 64,949,952 | | | 247,648,053 | | | 817,670,155 | | | 941,136,255 | | | 135,805,392 | | | 388,785,162 | |
| | 74,319,476 | | | 64,949,952 | | | 2,278,228,282 | | | 817,670,155 | | | 123,674,678 | | | 135,805,392 | |
| | | | | | |
| | (6,233 | ) | | 99,722 | | | (17,961 | ) | | (6,634 | ) | | 36,580 | | | 97,364 | |
See Accompanying Notes to Financial Statements.
101
Statements of Changes in Net Assets (continued) – Equity Funds
| | | | | | | | | | | | | | |
| Increase (Decrease) in Net Assets | | Columbia Select
Small Cap Fund | | | Columbia Value and
Restructuring Fund | | | |
| | | Year Ended March 31, | | | Year Ended March 31, | | | |
| | | 2010 ($) | | | 2009 ($) | | | 2010 ($) | | | 2009 ($) | | | |
Operations | | | | | | | | | | | | | | |
Net investment income (loss) | | (1,924,947 | ) | | (1,726,692 | ) | | 79,863,157 | | | 112,153,414 | | | |
Net realized gain (loss) on investments, written options, foreign currency transactions and forward foreign currency exchange contracts | | (9,941,861 | ) | | (122,425,320 | ) | | (324,092,562 | ) | | (1,176,931,945 | ) | | |
Net change in unrealized appreciation (depreciation) on investments, written options, foreign currency translations forward foreign currency exchange contracts and foreign capital gains tax | | 239,917,915 | | | (155,761,126 | ) | | 3,334,282,112 | | | (3,893,787,563 | ) | | |
| | | | | | | | | | | | | | |
Net increase (decrease) resulting from operations | | 228,051,107 | | | (279,913,138 | ) | | 3,090,052,707 | | | (4,958,566,094 | ) | | |
| | | | | |
Distributions to Shareholders | | | | | | | | | | | | | | |
From net investment income: | | | | | | | | | | | | | | |
Class A | | — | | | — | | | (2,386,455 | ) | | (2,899,712 | ) | | |
Class C | | — | | | — | | | (271,834 | ) | | (292,782 | ) | | |
Class R | | — | | | — | | | (411,525 | ) | | (480,565 | ) | | |
Class Z | | — | | | — | | | (73,975,594 | ) | | (108,747,976 | ) | | |
From net realized gains: | | | | | | | | | | | | | | |
Class A | | — | | | (303,623 | ) | | — | | | (83,311 | ) | | |
Class C | | — | | | (70,804 | ) | | — | | | (18,779 | ) | | |
Class R | | — | | | (241,850 | ) | | — | | | (18,992 | ) | | |
Class Z | | — | | | (20,518,422 | ) | | — | | | (3,904,858 | ) | | |
| | | | | | | | | | | | | | |
Total distributions to shareholders | | — | | | (21,134,699 | ) | | (77,045,408 | ) | | (116,446,975 | ) | | |
| | | | | |
Net Capital Stock Transactions | | 60,662,968 | | | (52,896,968 | ) | | (416,549,708 | ) | | 563,439,037 | | | |
| | | | | |
Redemption fees | | — | | | — | | | — | | | — | | | |
Increase from regulatory settlements | | 18,764 | | | 146,495 | | | 11,049 | | | 47,297 | | | |
| | | | | | | | | | | | | | |
Total increase (decrease) in net assets | | 288,732,839 | | | (353,798,310 | ) | | 2,596,468,640 | | | (4,511,526,735 | ) | | |
| | | | | |
Net Assets | | | | | | | | | | | | | | |
Beginning of period | | 335,236,936 | | | 689,035,246 | | | 4,593,531,072 | | | 9,105,057,807 | | | |
End of period | | 623,969,775 | | | 335,236,936 | | | 7,189,999,712 | | | 4,593,531,072 | | | |
Undistributed (overdistributed) net investment income at end of period | | (11,483 | ) | | (5,567 | ) | | 3,439,148 | | | 841,775 | | | |
See Accompanying Notes to Financial Statements.
102
| | | | | | | | | | | | | | | | | | |
| | | Columbia Emerging
Markets Fund | | | Columbia International
Growth Fund | | | Columbia
Pacific/Asia Fund | |
| | | Year Ended March 31, | | | Year Ended March 31, | | | Year Ended March 31, | |
| | | 2010 ($) | | | 2009 ($) | | | 2010 ($) | | | 2009 ($) | | | 2010 ($) | | | 2009 ($) | |
| | | | | | | | | | | | | | | | | | |
| | 1,639,236 | | | 5,544,814 | | | 2,843,979 | | | 7,046,287 | | | 291,264 | | | 882,424 | |
| | | | | | |
| | 50,333,386 | | | (36,231,703 | ) | | (3,944,362 | ) | | (139,221,928 | ) | | (23,918 | ) | | (23,610,363 | ) |
| | | | | | |
| | 133,710,612 | | | (315,836,860 | ) | | 70,620,059 | | | (105,883,949 | ) | | 13,353,848 | | | (8,320,223 | ) |
| | | | | | | | | | | | | | | | | | |
| | 185,683,234 | | | (346,523,749 | ) | | 69,519,676 | | | (238,059,590 | ) | | 13,621,194 | | | (31,048,162 | ) |
| | | | | | |
| | | | | | | | | | | | | | | | | | |
| | | | | | | | | | | | | | | | | | |
| | (66,797 | ) | | — | | | (2,219 | ) | | (289 | ) | | (1,477 | ) | | (594 | ) |
| | (3,149 | ) | | — | | | — | | | (19 | ) | | — | | | (45 | ) |
| | — | | | — | | | — | | | — | | | — | | | — | |
| | (6,656,120 | ) | | — | | | (2,044,589 | ) | | (1,132,296 | ) | | (176,814 | ) | | (480,114 | ) |
| | | | | | | | | | | | | | | | | | |
| | — | | | (513,878 | ) | | — | | | (3,433 | ) | | — | | | (5,615 | ) |
| | — | | | (84,665 | ) | | — | | | (602 | ) | | — | | | (1,401 | ) |
| | — | | | — | | | — | | | — | | | — | | | — | |
| | — | | | (137,101,297 | ) | | — | | | (35,191,377 | ) | | — | | | (14,738,370 | ) |
| | | | | | | | | | | | | | | | | | |
| | (6,726,066 | ) | | (137,699,840 | ) | | (2,046,808 | ) | | (36,328,016 | ) | | (178,291 | ) | | (15,226,139 | ) |
| | | | | | |
| | (12,813,894 | ) | | (293,665,421 | ) | | (61,841,910 | ) | | (195,593,367 | ) | | (6,755,455 | ) | | (46,647,878 | ) |
| | | | | | |
| | 36,026 | | | 55,618 | | | 4,246 | | | 9,839 | | | 1,523 | | | 576 | |
| | — | | | — | | | 6,592 | | | 150,489 | | | 79,506 | | | — | |
| | | | | | | | | | | | | | | | | | |
| | 166,179,300 | | | (777,833,392 | ) | | 5,641,796 | | | (469,820,645 | ) | | 6,768,477 | | | (92,921,603 | ) |
| | | | | | |
| | | | | | | | | | | | | | | | | | |
| | 238,571,002 | | | 1,016,404,394 | | | 166,228,991 | | | 636,049,636 | | | 24,933,477 | | | 117,855,080 | |
| | 404,750,302 | | | 238,571,002 | | | 171,870,787 | | | 166,228,991 | | | 31,701,954 | | | 24,933,477 | |
| | | | | | |
| | (1,604,394 | ) | | 2,957,245 | | | 2,960,574 | | | 1,542,970 | | | 661,843 | | | 105,370 | |
See Accompanying Notes to Financial Statements.
103
Statements of Changes in Net Assets – Capital Stock Activity
| | | | | | | | | | | | |
| | | Columbia Blended Equity Fund | |
| | | Year Ended
March 31, 2010 | | | Year Ended
March 31, 2009 | |
| | | Shares | | | Dollars ($) | | | Shares | | | Dollars ($) | |
Class A | | | | | | | | | | | | |
Subscriptions | | 10,354 | | | 209,806 | | | 13,948 | | | 264,716 | |
Distributions reinvested | | 63 | | | 1,301 | | | 84 | | | 1,996 | |
Redemptions | | (6,070 | ) | | (112,326 | ) | | (4,425 | ) | | (90,083 | ) |
| | | | | | | | | | | | |
Net increase | | 4,347 | | | 98,781 | | | 9,607 | | | 176,629 | |
Class C | | | | | | | | | | | | |
Subscriptions | | 5,947 | | | 115,992 | | | 3,298 | | | 69,597 | |
Distributions reinvested | | 8 | | | 166 | | | 79 | | | 2,108 | |
Redemptions | | (914 | ) | | (18,453 | ) | | (173 | ) | | (2,626 | ) |
| | | | | | | | | | | | |
Net increase | | 5,041 | | | 97,705 | | | 3,204 | | | 69,079 | |
Class Z | | | | | | | | | | | | |
Subscriptions | | 143,841 | | | 2,878,240 | | | 1,069,699 | | | 25,352,681 | |
Distributions reinvested | | 35,666 | | | 732,311 | | | 461,476 | | | 12,021,012 | |
Redemptions | | (2,348,440 | ) | | (48,337,719 | ) | | (3,046,571 | ) | | (63,630,661 | ) |
| | | | | | | | | | | | |
Net decrease | | (2,168,933 | ) | | (44,727,168 | ) | | (1,515,396 | ) | | (26,256,968 | ) |
See Accompanying Notes to Financial Statements.
104
| | | | | | | | | | | | |
| | | Columbia Energy and Natural Resources Fund | |
| | | Year Ended
March 31, 2010 | | | Year Ended
March 31, 2009 | |
| | | Shares | | | Dollars ($) | | | Shares | | | Dollars ($) | |
Class A | | | | | | | | | | | | |
Subscriptions | | 2,143,325 | | | 38,526,042 | | | 1,521,512 | | | 31,235,608 | |
Distributions reinvested | | 1,416 | | | 27,178 | | | 6,524 | | | 202,507 | |
Redemptions | | (854,735 | ) | | (15,782,330 | ) | | (500,903 | ) | | (9,514,854 | ) |
| | | | | | | | | | | | |
Net increase | | 1,290,006 | | | 22,770,890 | | | 1,027,133 | | | 21,923,261 | |
Class C | | | | | | | | | | | | |
Subscriptions | | 567,011 | | | 9,991,562 | | | 499,658 | | | 9,008,275 | |
Distributions reinvested | | — | | | — | | | 1,512 | | | 46,686 | |
Redemptions | | (170,392 | ) | | (3,063,346 | ) | | (123,945 | ) | | (2,327,141 | ) |
| | | | | | | | | | | | |
Net increase | | 396,619 | | | 6,928,216 | | | 377,225 | | | 6,727,820 | |
Class Z | | | | | | | | | | | | |
Subscriptions | | 13,600,915 | | | 243,040,391 | | | 10,770,648 | | | 238,912,602 | |
Distributions reinvested | | 66,461 | | | 1,134,656 | | | 318,342 | | | 9,884,506 | |
Redemptions | | (7,573,801 | ) | | (138,349,313 | ) | | (14,257,674 | ) | | (295,649,916 | ) |
| | | | | | | | | | | | |
Net increase (decrease) | | 6,093,575 | | | 105,825,734 | | | (3,168,684 | ) | | (46,852,808 | ) |
See Accompanying Notes to Financial Statements.
105
Statements of Changes in Net Assets (continued) – Capital Stock Activity
| | | | | | | | | | | | |
| | | Columbia Mid Cap Core Fund | |
| | | Year Ended
March 31, 2010 | | | Year Ended
March 31, 2009 | |
| | | Shares | | | Dollars ($) | | | Shares | | | Dollars ($) | |
Class A | | | | | | | | | | | | |
Subscriptions | | 45,803 | | | 596,045 | | | 29,193 | | | 324,419 | |
Distributions reinvested | | 239 | | | 3,065 | | | 92 | | | 917 | |
Redemptions | | (4,078 | ) | | (51,980 | ) | | (7,816 | ) | | (81,226 | ) |
| | | | | | | | | | | | |
Net increase | | 41,964 | | | 547,130 | | | 21,469 | | | 244,110 | |
Class C | | | | | | | | | | | | |
Subscriptions | | 12,753 | | | 157,220 | | | 7,728 | | | 79,136 | |
Distributions reinvested | | 26 | | | 336 | | | 17 | | | 187 | |
Redemptions | | (2,407 | ) | | (33,583 | ) | | (1,234 | ) | | (13,294 | ) |
| | | | | | | | | | | | |
Net increase | | 10,372 | | | 123,973 | | | 6,511 | | | 66,029 | |
Class R | | | | | | | | | | | | |
Subscriptions | | 31,397 | | | 392,451 | | | 42,244 | | | 582,981 | |
Distributions reinvested | | 478 | | | 5,914 | | | 763 | | | 10,348 | |
Redemptions | | (70,112 | ) | | (913,315 | ) | | (33,133 | ) | | (405,611 | ) |
| | | | | | | | | | | | |
Net increase (decrease) | | (38,237 | ) | | (514,950 | ) | | 9,874 | | | 187,718 | |
Class Z | | | | | | | | | | | | |
Subscriptions | | 711,424 | | | 9,171,822 | | | 911,865 | | | 14,180,439 | |
Distributions reinvested | | 19,605 | | | 244,890 | | | 38,775 | | | 586,253 | |
Redemptions | | (2,553,498 | ) | | (32,656,409 | ) | | (7,724,000 | ) | | (101,253,761 | ) |
| | | | | | | | | | | | |
Net decrease | | (1,822,469 | ) | | (23,239,697 | ) | | (6,773,360 | ) | | (86,487,069 | ) |
See Accompanying Notes to Financial Statements.
106
| | | | | | | | | | | | |
| | | Columbia Select Large Cap Growth Fund | |
| | | Year Ended
March 31, 2010 | | | Year Ended
March 31, 2009 | |
| | | Shares | | | Dollars ($) | | | Shares | | | Dollars ($) | |
Class A | | | | | | | | | | | | |
Subscriptions | | 47,897,150 | | | 443,726,537 | | | 13,464,242 | | | 95,140,472 | |
Distributions reinvested | | — | | | — | | | — | | | — | |
Redemptions | | (5,418,094 | ) | | (51,525,015 | ) | | (1,688,190 | ) | | (12,586,524 | ) |
| | | | | | | | | | | | |
Net increase | | 42,479,056 | | | 392,201,522 | | | 11,776,052 | | | 82,553,948 | |
Class C | | | | | | | | | | | | |
Subscriptions | | 261,762 | | | 2,379,863 | | | 144,439 | | | 1,322,856 | |
Distributions reinvested | | — | | | — | | | — | | | — | |
Redemptions | | (60,010 | ) | | (552,119 | ) | | (56,309 | ) | | (424,734 | ) |
| | | | | | | | | | | | |
Net increase | | 201,752 | | | 1,827,744 | | | 88,130 | | | 898,122 | |
Class R | | | | | | | | | | | | |
Subscriptions | | 46,478 | | | 447,608 | | | 21,445 | | | 229,371 | |
Distributions reinvested | | — | | | — | | | — | | | — | |
Redemptions | | (10,458 | ) | | (104,160 | ) | | (20,076 | ) | | (138,787 | ) |
| | | | | | | | | | | | |
Net increase | | 36,020 | | | 343,448 | | | 1,369 | | | 90,584 | |
Class Z | | | | | | | | | | | | |
Subscriptions | | 83,327,961 | | | 776,672,199 | | | 70,056,832 | | | 674,697,263 | |
Distributions reinvested | | — | | | — | | | — | | | — | |
Redemptions | | (27,391,554 | ) | | (253,577,263 | ) | | (49,639,020 | ) | | (390,502,482 | ) |
| | | | | | | | | | | | |
Net increase | | 55,936,407 | | | 523,094,936 | | | 20,417,812 | | | 284,194,781 | |
See Accompanying Notes to Financial Statements.
107
Statements of Changes in Net Assets (continued) – Capital Stock Activity
| | | | | | | | | | | | |
| | | Columbia Select Opportunities Fund | |
| | | Year Ended
March 31, 2010 | | | Year Ended
March 31, 2009 | |
| | | Shares | | | Dollars ($) | | | Shares | | | Dollars ($) | |
Class A | | | | | | | | | | | | |
Subscriptions | | 32,593 | | | 309,616 | | | 245,159 | | | 3,043,457 | |
Distributions reinvested | | 391 | | | 3,630 | | | 2,140 | | | 25,070 | |
Redemptions | | (61,202 | ) | | (640,846 | ) | | (126,113 | ) | | (1,000,311 | ) |
| | | | | | | | | | | | |
Net increase (decrease) | | (28,218 | ) | | (327,600 | ) | | 121,186 | | | 2,068,216 | |
| | | | |
Class C | | | | | | | | | | | | |
Subscriptions | | 1,369 | | | 12,703 | | | 51,047 | | | 626,053 | |
Distributions reinvested | | 2 | | | 17 | | | 216 | | | 2,718 | |
Redemptions | | (10,480 | ) | | (102,888 | ) | | (21,565 | ) | | (175,467 | ) |
| | | | | | | | | | | | |
Net increase (decrease) | | (9,109 | ) | | (90,168 | ) | | 29,698 | | | 453,304 | |
| | | | |
Class Z | | | | | | | | | | | | |
Subscriptions | | 464,195 | | | 4,701,443 | | | 6,840,043 | | | 81,210,244 | |
Distributions reinvested | | 14,787 | | | 141,090 | | | 192,085 | | | 2,503,567 | |
Redemptions | | (7,837,644 | ) | | (77,074,881 | ) | | (17,201,779 | ) | | (155,307,333 | ) |
| | | | | | | | | | | | |
Net decrease | | (7,358,662 | ) | | (72,232,348 | ) | | (10,169,651 | ) | | (71,593,522 | ) |
See Accompanying Notes to Financial Statements.
108
| | | | | | | | | | | | |
| | | Columbia Select Small Cap Fund | |
| | | Year Ended
March 31, 2010 | | | Year Ended
March 31, 2009 | |
| | | Shares | | | Dollars ($) | | | Shares | | | Dollars ($) | |
Class A | | | | | | | | | | | | |
Subscriptions | | 542,155 | | | 6,373,440 | | | 1,329,317 | | | 18,172,202 | |
Distributions reinvested | | — | | | — | | | 19,688 | | | 303,392 | |
Redemptions | | (240,143 | ) | | (2,988,481 | ) | | (826,731 | ) | | (8,579,057 | ) |
| | | | | | | | | | | | |
Net increase | | 302,012 | | | 3,384,959 | | | 522,274 | | | 9,896,537 | |
| | | | |
Class C | | | | | | | | | | | | |
Subscriptions | | 32,444 | | | 420,347 | | | 38,874 | | | 527,059 | |
Distributions reinvested | | — | | | — | | | 4,609 | | | 70,656 | |
Redemptions | | (75,455 | ) | | (827,092 | ) | | (55,600 | ) | | (595,536 | ) |
| | | | | | | | | | | | |
Net increase(decrease) | | (43,011 | ) | | (406,745 | ) | | (12,117 | ) | | 2,179 | |
| | | | |
Class R | | | | | | | | | | | | |
Subscriptions | | 202,194 | | | 2,483,997 | | | 343,592 | | | 4,176,248 | |
Distributions reinvested | | — | | | — | | | 15,995 | | | 241,850 | |
Redemptions | | (176,360 | ) | | (2,158,391 | ) | | (138,198 | ) | | (1,724,888 | ) |
| | | | | | | | | | | | |
Net increase | | 25,834 | | | 325,606 | | | 221,389 | | | 2,693,210 | |
| | | | |
Class Z | | | | | | | | | | | | |
Subscriptions | | 15,743,435 | | | 191,856,210 | | | 11,301,343 | | | 145,607,901 | |
Distributions reinvested | | — | | | — | | | 695,997 | | | 10,732,107 | |
Redemptions | | (10,726,335 | ) | | (134,497,062 | ) | | (18,522,626 | ) | | (221,828,902 | ) |
| | | | | | | | | | | | |
Net increase (decrease) | | 5,017,100 | | | 57,359,148 | | | (6,525,286 | ) | | (65,488,894 | ) |
See Accompanying Notes to Financial Statements.
109
Statements of Changes in Net Assets (continued) – Capital Stock Activity
| | | | | | | | | | | | |
| | | Columbia Value and Restructuring Fund | |
| | | Year Ended
March 31, 2010 | | | Year Ended
March 31, 2009 | |
| | | Shares | | | Dollars ($) | | | Shares | | | Dollars ($) | |
Class A | | | | | | | | | | | | |
Subscriptions | | 2,661,138 | | | 101,139,997 | | | 7,544,325 | | | 350,530,429 | |
Distributions reinvested | | 60,817 | | | 2,269,822 | | | 82,462 | | | 2,837,030 | |
Redemptions | | (2,356,033 | ) | | (88,374,983 | ) | | (2,943,227 | ) | | (92,566,890 | ) |
| | | | | | | | | | | | |
Net increase | | 365,922 | | | 15,034,836 | | | 4,683,560 | | | 260,800,569 | |
| | | | |
Class C | | | | | | | | | | | | |
Subscriptions | | 517,607 | | | 19,769,519 | | | 1,655,495 | | | 78,563,854 | |
Distributions reinvested | | 6,100 | | | 222,574 | | | 8,192 | | | 252,762 | |
Redemptions | | (367,782 | ) | | (14,441,139 | ) | | (402,283 | ) | | (12,919,203 | ) |
| | | | | | | | | | | | |
Net increase | | 155,925 | | | 5,550,954 | | | 1,261,404 | | | 65,897,413 | |
| | | | |
Class R | | | | | | | | | | | | |
Subscriptions | | 309,097 | | | 11,611,135 | | | 1,094,672 | | | 47,511,730 | |
Distributions reinvested | | 11,147 | | | 411,512 | | | 14,870 | | | 499,301 | |
Redemptions | | (438,362 | ) | | (16,452,188 | ) | | (337,014 | ) | | (13,176,051 | ) |
| | | | | | | | | | | | |
Net increase (decrease) | | (118,118 | ) | | (4,429,541 | ) | | 772,528 | | | 34,834,980 | |
| | | | |
Class Z | | | | | | | | | | | | |
Subscriptions | | 36,044,433 | | | 1,406,943,530 | | | 60,774,982 | | | 2,515,699,893 | |
Distributions reinvested | | 1,469,656 | | | 55,115,638 | | | 2,397,249 | | | 88,424,717 | |
Redemptions | | (50,294,212 | ) | | (1,894,765,125 | ) | | (70,849,326 | ) | | (2,402,218,535 | ) |
| | | | | | | | | | | | |
Net increase (decrease) | | (12,780,123 | ) | | (432,705,957 | ) | | (7,677,095 | ) | | 201,906,075 | |
See Accompanying Notes to Financial Statements.
110
| | | | | | | | | | | | |
| | | Columbia Emerging Markets Fund | |
| | | Year Ended
March 31, 2010 | | | Year Ended
March 31, 2009 | |
| | | Shares | | | Dollars ($) | | | Shares | | | Dollars ($) | |
Class A | | | | | | | | | | | | |
Subscriptions | | 683,278 | | | 6,604,736 | | | 230,578 | | | 3,009,480 | |
Distributions reinvested | | 6,065 | | | 59,173 | | | 38,222 | | | 484,281 | |
Redemptions | | (267,582 | ) | | (2,808,253 | ) | | (208,280 | ) | | (1,853,707 | ) |
| | | | | | | | | | | | |
Net increase | | 421,761 | | | 3,855,656 | | | 60,520 | | | 1,640,054 | |
| | | | |
Class C | | | | | | | | | | | | |
Subscriptions | | 141,536 | | | 1,377,969 | | | 36,604 | | | 332,966 | |
Distributions reinvested | | 246 | | | 2,597 | | | 6,377 | | | 80,541 | |
Redemptions | | (42,524 | ) | | (433,673 | ) | | (35,521 | ) | | (339,357 | ) |
| | | | | | | | | | | | |
Net increase | | 99,258 | | | 946,893 | | | 7,460 | | | 74,150 | |
| | | | |
Class Z | | | | | | | | | | | | |
Subscriptions | | 9,329,329 | | | 86,421,767 | | | 10,504,267 | | | 91,945,466 | |
Distributions reinvested | | 554,261 | | | 5,072,709 | | | 7,919,385 | | | 100,338,612 | |
Redemptions | | (11,606,492 | ) | | (109,110,919 | ) | | (49,364,298 | ) | | (487,663,703 | ) |
| | | | | | | | | | | | |
Net decrease | | (1,722,902 | ) | | (17,616,443 | ) | | (30,940,646 | ) | | (295,379,625 | ) |
See Accompanying Notes to Financial Statements.
111
Statements of Changes in Net Assets (continued) – Capital Stock Activity
| | | | | | | | | | | | |
| | | Columbia International Growth Fund | |
| | | Year Ended
March 31, 2010 | | | Year Ended
March 31, 2009 | |
| | | Shares | | | Dollars ($) | | | Shares | | | Dollars ($) | |
Class A | | | | | | | | | | | | |
Subscriptions | | 10,263 | | | 126,227 | | | 27,985 | | | 339,801 | |
Distributions reinvested | | 207 | | | 2,196 | | | 212 | | | 3,722 | |
Redemptions | | (5,308 | ) | | (66,084 | ) | | (4,165 | ) | | (42,238 | ) |
| | | | | | | | | | | | |
Net increase | | 5,162 | | | 62,339 | | | 24,032 | | | 301,285 | |
| | | | |
Class C | | | | | | | | | | | | |
Subscriptions | | 5,127 | | | 57,880 | | | 16,682 | | | 172,894 | |
Distributions reinvested | | — | | | — | | | 36 | | | 621 | |
Redemptions | | (3,501 | ) | | (41,240 | ) | | — | | | — | |
| | | | | | | | | | | | |
Net increase | | 1,626 | | | 16,640 | | | 16,718 | | | 173,515 | |
| | | | |
Class Z | | | | | | | | | | | | |
Subscriptions | | 1,580,348 | | | 19,065,399 | | | 1,961,918 | | | 26,327,271 | |
Distributions reinvested | | 51,661 | | | 548,127 | | | 710,211 | | | 12,442,903 | |
Redemptions | | (6,840,170 | ) | | (81,534,415 | ) | | (18,489,612 | ) | | (234,838,341 | ) |
| | | | | | | | | | | | |
Net decrease | | (5,208,161 | ) | | (61,920,889 | ) | | (15,817,483 | ) | | (196,068,167 | ) |
See Accompanying Notes to Financial Statements.
112
| | | | | | | | | | | | |
| | | Columbia Pacific/Asia Fund | |
| | | Year Ended
March 31, 2010 | | | Year Ended
March 31, 2009 | |
| | | Shares | | | Dollars ($) | | | Shares | | | Dollars ($) | |
Class A | | | | | | | | | | | | |
Subscriptions | | 113,811 | | | 757,471 | | | 34,723 | | | 185,444 | |
Distributions reinvested | | 237 | | | 1,440 | | | 767 | | | 6,209 | |
Redemptions | | (43,812 | ) | | (312,482 | ) | | (353 | ) | | (1,671 | ) |
| | | | | | | | | | | | |
Net increase | | 70,236 | | | 446,429 | | | 35,137 | | | 189,982 | |
| | | | |
Class C | | | | | | | | | | | | |
Subscriptions | | 13,194 | | | 88,659 | | | 58,001 | | | 299,319 | |
Distributions reinvested | | — | | | — | | | 179 | | | 1,446 | |
Redemptions | | (15,406 | ) | | (111,862 | ) | | (9,500 | ) | | (39,521 | ) |
| | | | | | | | | | | | |
Net increase (decrease) | | (2,212 | ) | | (23,203 | ) | | 48,680 | | | 261,244 | |
| | | | |
Class Z | | | | | | | | | | | | |
Subscriptions | | 908,889 | | | 6,376,656 | | | 150,707 | | | 1,071,918 | |
Distributions reinvested | | 13,143 | | | 79,780 | | | 773,939 | | | 6,268,905 | |
Redemptions | | (2,025,223 | ) | | (13,635,117 | ) | | (8,354,699 | ) | | (54,439,927 | ) |
| | | | | | | | | | | | |
Net decrease | | (1,103,191 | ) | | (7,178,681 | ) | | (7,430,053 | ) | | (47,099,104 | ) |
See Accompanying Notes to Financial Statements.
113
Financial Highlights – Columbia Blended Equity Fund
Selected data for a share outstanding throughout each period is as follows:
| | | | | | | | | | | | |
| | | Year Ended
March 31, | | | Period Ended
March 31, | |
| Class A Shares | | 2010 | | | 2009 | | | 2008 (a) | |
Net Asset Value, Beginning of Period | | $ | 16.21 | | | $ | 28.76 | | | $ | 28.76 | |
| | | |
Income from Investment Operations: | | | | | | | | | | | | |
Net investment income (loss) (b) | | | 0.13 | | | | 0.12 | | | | — | (c) |
Net realized and unrealized gain (loss) on investments and foreign currency | | | 6.89 | | | | (10.40 | ) | | | — | (c) |
| | | | | | | | | | | | |
Total from investment operations | | | 7.02 | | | | (10.28 | ) | | | — | (c) |
| | | |
Less Distributions to Shareholders: | | | | | | | | | | | | |
From net investment income | | | (0.13 | ) | | | (0.13 | ) | | | — | |
From net realized gains | | | — | | | | (2.14 | ) | | | — | |
| | | | | | | | | | | | |
Total distributions to shareholders | | | (0.13 | ) | | | (2.27 | ) | | | — | |
| | | |
Increase from Regulatory Settlements | | | — | (c) | | | — | | | | — | |
| | | |
Net Asset Value, End of Period | | $ | 23.10 | | | $ | 16.21 | | | $ | 28.76 | |
Total return (d)(e) | | | 43.41 | % | | | (38.73 | )% | | | 0.00 | %(f) |
| | | |
Ratios to Average Net Assets/Supplemental Data: | | | | | | | | | | | | |
Net expenses before interest expense (g) | | | 1.28 | % | | | 1.30 | % | | | 1.35 | %(h) |
Interest expense (i) | | | — | % | | | — | % | | | — | %(h) |
Net expenses (g) | | | 1.28 | % | | | 1.30 | % | | | 1.35 | %(h) |
Waiver/Reimbursement | | | 0.02 | % | | | 0.05 | % | | | 0.09 | %(h) |
Net investment income (loss) (g) | | | 0.61 | % | | | 0.66 | % | | | (1.32 | )%(h) |
Portfolio turnover rate | | | 73 | % | | | 41 | % | | | 10 | %(f) |
Net assets, end of period (000s) | | $ | 330 | | | $ | 161 | | | $ | 10 | |
| (a) | The Fund’s Class A shares commenced operations on March 31, 2008. Per share data and total return reflect activity from that date. |
| (b) | Per share data was calculated using the average shares outstanding during the period. |
| (c) | Rounds to less than $0.01 per share. |
| (d) | Had the investment advisor and/or any of its affiliates not waived fees or reimbursed a portion of expenses, total return would have been reduced. |
| (e) | Total return at net asset value assuming all distributions reinvested and no initial sales charge or contingent deferred sales charge. |
| (g) | The benefits derived from expense reductions had an impact of less than 0.01%. |
| (i) | Rounds to less than 0.01%. |
See Accompanying Notes to Financial Statements.
114
Financial Highlights – Columbia Blended Equity Fund
Selected data for a share outstanding throughout each period is as follows:
| | | | | | | | | | | | |
| | | Year Ended
March 31, | | | Period Ended
March 31, | |
| Class C Shares | | 2010 | | | 2009 | | | 2008 (a) | |
Net Asset Value, Beginning of Period | | $ | 16.17 | | | $ | 28.76 | | | $ | 28.76 | |
| | | |
Income from Investment Operations: | | | | | | | | | | | | |
Net investment loss (b) | | | (0.03 | ) | | | — | (c) | | | — | (c) |
Net realized and unrealized gain (loss) on investments and foreign currency | | | 6.87 | | | | (10.43 | ) | | | — | (c) |
| | | | | | | | | | | | |
Total from investment operations | | | 6.84 | | | | (10.43 | ) | | | — | (c) |
| | | |
Less Distributions to Shareholders: | | | | | | | | | | | | |
From net investment income | | | (0.02 | ) | | | (0.02 | ) | | | — | |
From net realized gains | | | — | | | | (2.14 | ) | | | — | |
| | | | | | | | | | | | |
Total distributions to shareholders | | | (0.02 | ) | | | (2.16 | ) | | | — | |
| | | |
Increase from Regulatory Settlements | | | — | (c) | | | — | | | | — | |
| | | |
Net Asset Value, End of Period | | $ | 22.99 | | | $ | 16.17 | | | $ | 28.76 | |
Total return (d)(e) | | | 42.31 | % | | | (39.20 | )% | | | 0.00 | %(f) |
| | | |
Ratios to Average Net Assets/Supplemental Data: | | | | | | | | | | | | |
Net expenses before interest expense (g) | | | 2.03 | % | | | 2.05 | % | | | 2.10 | %(h) |
Interest expense (i) | | | — | % | | | — | % | | | — | %(h) |
Net expenses (g) | | | 2.03 | % | | | 2.05 | % | | | 2.10 | %(h) |
Waiver/Reimbursement | | | 0.02 | % | | | 0.05 | % | | | 0.09 | %(h) |
Net investment loss (g) | | | (0.13 | )% | | | (0.02 | )% | | | (2.07 | )%(h) |
Portfolio turnover rate | | | 73 | % | | | 41 | % | | | 10 | %(f) |
Net assets, end of period (000s) | | $ | 198 | | | $ | 57 | | | $ | 10 | |
| (a) | The Fund’s Class C shares commenced operations on March 31, 2008. Per share data and total return reflect activity from that date. |
| (b) | Per share data was calculated using the average shares outstanding during the period. |
| (c) | Rounds to less than $0.01 per share. |
| (d) | Had the investment advisor and/or any of its affiliates not waived fees or reimbursed a portion of expenses, total return would have been reduced. |
| (e) | Total return at net asset value assuming all distributions reinvested and no contingent deferred sales charge. |
| (g) | The benefits derived from expense reductions had an impact of less than 0.01%. |
| (i) | Rounds to less than 0.01%. |
See Accompanying Notes to Financial Statements.
115
Financial Highlights – Columbia Blended Equity Fund
Selected data for a share outstanding throughout each period is as follows:
| | | | | | | | | | | | | | | | | | | | |
| | | Year Ended March 31, | |
| Class Z Shares | | 2010 | | | 2009 | | | 2008 (a) | | | 2007 | | | 2006 (b) | |
Net Asset Value, Beginning of Period | | $ | 16.20 | | | $ | 28.76 | | | $ | 35.36 | | | $ | 37.27 | | | $ | 36.12 | |
| | | | | |
Income from Investment Operations: | | | | | | | | | | | | | | | | | | | | |
Net investment income (c) | | | 0.18 | | | | 0.19 | | | | 0.23 | | | | 0.25 | | | | 0.19 | |
Net realized and unrealized gain (loss) on investments and foreign currency | | | 6.90 | | | | (10.43 | ) | | | 0.47 | | | | 3.61 | | | | 3.67 | |
| | | | | | | | | | | | | | | | | | | | |
Total from investment operations | | | 7.08 | | | | (10.24 | ) | | | 0.70 | | | | 3.86 | | | | 3.86 | |
| | | | | |
Less Distributions to Shareholders: | | | | | | | | | | | | | | | | | | | | |
From net investment income | | | (0.18 | ) | | | (0.18 | ) | | | (0.29 | ) | | | (0.23 | ) | | | (0.21 | ) |
From net realized gains | | | — | | | | (2.14 | ) | | | (7.01 | ) | | | (5.54 | ) | | | (2.50 | ) |
| | | | | | | | | | | | | | | | | | | | |
Total distributions to shareholders | | | (0.18 | ) | | | (2.32 | ) | | | (7.30 | ) | | | (5.77 | ) | | | (2.71 | ) |
| | | | | |
Increase from Regulatory Settlements | | | — | (d) | | | — | | | | — | | | | — | | | | — | |
| | | | | |
Net Asset Value, End of Period | | $ | 23.10 | | | $ | 16.20 | | | $ | 28.76 | | | $ | 35.36 | | | $ | 37.27 | |
Total return (e)(f) | | | 43.84 | % | | | (38.61 | )% | | | 0.35 | %(g) | | | 10.66 | % | | | 11.10 | % |
| | | | | |
Ratios to Average Net Assets/Supplemental Data: | | | | | | | | | | | | | | | | | | | | |
Net expenses before interest expense (h) | | | 1.03 | % | | | 1.05 | % | | | 1.11 | % | | | 1.10 | % | | | 1.08 | % |
Interest expense | | | — | %(i) | | | — | %(i) | | | 0.01 | % | | | — | | | | — | |
Net expenses (h) | | | 1.03 | % | | | 1.05 | % | | | 1.10 | % | | | 1.10 | % | | | 1.08 | % |
Waiver/Reimbursement | | | 0.02 | % | | | 0.05 | % | | | 0.13 | % | | | 0.11 | % | | | 0.13 | % |
Net investment income (h) | | | 0.87 | % | | | 0.85 | % | | | 0.66 | % | | | 0.68 | % | | | 0.53 | % |
Portfolio turnover rate | | | 73 | % | | | 41 | % | | | 10 | % | | | 10 | % | | | 22 | % |
Net assets, end of period (000s) | | $ | 149,292 | | | $ | 139,892 | | | $ | 291,858 | | | $ | 401,023 | | | $ | 460,309 | |
| (a) | On March 31, 2008, Shares class of Blended Equity Fund, a series of Excelsior Funds, Inc., was reorganized into Class Z. The financial information of the Fund’s Class Z includes the financial information of Blended Equity Fund’s Shares class. |
| (b) | Per share data for the year ended March 31, 2006 was audited by other auditors. |
| (c) | Per share data was calculated using the average shares outstanding during the period. |
| (d) | Rounds to less than $0.01 per share. |
| (e) | Had the investment advisor and/or any of its affiliates not waived fees or reimbursed a portion of expenses, total return would have been reduced. |
| (f) | Total return at net asset value assuming all distributions reinvested. |
| (g) | Total return includes a voluntary reimbursement by the investment advisor for a realized investment loss due to a trading error. This reimbursement increased total return and net asset value per share by less than 0.01% and less than $0.01, respectively. |
| (h) | The benefits derived from expense reductions had an impact of less than 0.01%. |
| (i) | Rounds to less than 0.01%. |
See Accompanying Notes to Financial Statements.
116
Financial Highlights – Columbia Energy and Natural Resources Fund
Selected data for a share outstanding throughout each period is as follows:
| | | | | | | | | | | | |
| | | Year Ended
March 31, | | | Period Ended
March 31, | |
| Class A Shares | | 2010 | | | 2009 | | | 2008 (a) | |
Net Asset Value, Beginning of Period | | $ | 13.62 | | | $ | 25.49 | | | $ | 27.64 | |
| | | |
Income from Investment Operations: | | | | | | | | | | | | |
Net investment loss (b) | | | (0.02 | ) | | | (0.01 | ) | | | — | (c) |
Net realized and unrealized gain (loss) on investments and foreign currency | | | 6.52 | | | | (11.46 | ) | | | 1.72 | |
| | | | | | | | | | | | |
Total from investment operations | | | 6.50 | | | | (11.47 | ) | | | 1.72 | |
| | | |
Less Distributions to Shareholders: | | | | | | | | | | | | |
From net investment income | | | (0.01 | ) | | | — | | | | — | |
From net realized gains | | | — | | | | (0.40 | ) | | | (3.87 | ) |
| | | | | | | | | | | | |
Total distributions to shareholders | | | (0.01 | ) | | | (0.40 | ) | | | (3.87 | ) |
| | | |
Increase from Regulatory Settlements | | | — | (c) | | | — | | | | — | |
| | | |
Net Asset Value, End of Period | | $ | 20.11 | | | $ | 13.62 | | | $ | 25.49 | |
Total return (d) | | | 47.76 | % | | | (45.88 | )%(e) | | | 6.82 | %(e)(f) |
| | | |
Ratios to Average Net Assets/Supplemental Data: | | | | | | | | | | | | |
Net expenses before interest expense (g) | | | 1.21 | % | | | 1.24 | % | | | 1.07 | %(h) |
Interest expense | | | — | %(i) | | | — | | | | — | %(h)(i) |
Net expenses (g) | | | 1.21 | % | | | 1.24 | % | | | 1.07 | %(h) |
Waiver/Reimbursement | | | — | | | | 0.04 | % | | | 0.05 | %(h) |
Net investment loss (g) | | | (0.10 | )% | | | (0.03 | )% | | | (0.02 | )%(h) |
Portfolio turnover rate | | | 523 | % | | | 484 | % | | | 198 | %(f) |
Net assets, end of period (000s) | | $ | 50,812 | | | $ | 16,842 | | | $ | 5,328 | |
| (a) | The Predecessor Fund’s Class A shares commenced operations on September 28, 2007. Per share data and total return reflect activity from that date. |
| (b) | Per share data was calculated using the average shares outstanding during the period. |
| (c) | Rounds to less than $0.01 per share. |
| (d) | Total return at net asset value assuming all distributions reinvested and no initial sales charge or contingent deferred sales charge. |
| (e) | Had the investment advisor and/or any of its affiliates not waived fees or reimbursed a portion of expenses, total return would have been reduced. |
| (g) | The benefits derived from expense reductions had an impact of less than 0.01%. |
| (i) | Rounds to less than 0.01%. |
See Accompanying Notes to Financial Statements.
117
Financial Highlights – Columbia Energy and Natural Resources Fund
Selected data for a share outstanding throughout each period is as follows:
| | | | | | | | | | | | |
| | | Year Ended
March 31, | | | Period Ended
March 31, | |
| Class C Shares | | 2010 | | | 2009 | | | 2008 (a) | |
Net Asset Value, Beginning of Period | | $ | 13.47 | | | $ | 25.40 | | | $ | 27.64 | |
| | | |
Income from Investment Operations: | | | | | | | | | | | | |
Net investment loss (b) | | | (0.15 | ) | | | (0.13 | ) | | | (0.10 | ) |
Net realized and unrealized gain (loss) on investments and foreign currency | | | 6.46 | | | | (11.40 | ) | | | 1.73 | |
| | | | | | | | | | | | |
Total from investment operations | | | 6.31 | | | | (11.53 | ) | | | 1.63 | |
| | | |
Less Distributions to Shareholders: | | | | | | | | | | | | |
From net realized gains | | | — | | | | (0.40 | ) | | | (3.87 | ) |
| | | |
Increase from Regulatory Settlements | | | — | (c) | | | — | | | | — | |
| | | |
Net Asset Value, End of Period | | $ | 19.78 | | | $ | 13.47 | | | $ | 25.40 | |
Total return (d) | | | 46.84 | % | | | (46.29 | )%(e) | | | 6.45 | %(e)(f) |
| | | |
Ratios to Average Net Assets/Supplemental Data: | | | | | | | | | | | | |
Net expenses before interest expense (g) | | | 1.96 | % | | | 1.99 | % | | | 1.82 | %(h) |
Interest expense | | | — | %(i) | | | — | | | | — | %(h)(i) |
Net expenses (g) | | | 1.96 | % | | | 1.99 | % | | | 1.82 | %(h) |
Waiver/Reimbursement | | | — | | | | 0.04 | % | | | 0.05 | %(h) |
Net investment loss (g) | | | (0.84 | )% | | | (0.73 | )% | | | (0.78 | )%(h) |
Portfolio turnover rate | | | 523 | % | | | 484 | % | | | 198 | %(f) |
Net assets, end of period (000s) | | $ | 16,420 | | | $ | 5,843 | | | $ | 1,433 | |
| (a) | The Predecessor Fund’s Class C shares commenced operations on September 28, 2007. Per share data and total return reflect activity from that date. |
| (b) | Per share data was calculated using the average shares outstanding during the period. |
| (c) | Rounds to less than $0.01 per share. |
| (d) | Total return at net asset value assuming all distributions reinvested and no contingent deferred sales charge. |
| (e) | Had the investment advisor and/or any of its affiliates not waived fees or reimbursed a portion of expenses, total return would have been reduced. |
| (g) | The benefits derived from expense reductions had an impact of less than 0.01%. |
| (i) | Rounds to less than 0.01%. |
See Accompanying Notes to Financial Statements.
118
Financial Highlights – Columbia Energy and Natural Resources Fund
Selected data for a share outstanding throughout each period is as follows:
| | | | | | | | | | | | | | | | | | | | |
| | | Year Ended March 31, | |
| Class Z Shares | | 2010 | | | 2009 | | | 2008 (a) | | | 2007 | | | 2006 (b) | |
Net Asset Value, Beginning of Period | | $ | 13.66 | | | $ | 25.49 | | | $ | 23.30 | | | $ | 25.99 | | | $ | 22.34 | |
| | | | | |
Income from Investment Operations: | | | | | | | | | | | | | | | | | | | | |
Net investment income (loss) (c) | | | 0.04 | | | | 0.02 | | | | 0.01 | | | | 0.06 | | | | — | (d) |
Net realized and unrealized gain (loss) on investments and foreign currency | | | 6.52 | | | | (11.45 | ) | | | 6.08 | | | | 2.50 | | | | 9.04 | |
| | | | | | | | | | | | | | | | | | | | |
Total from investment operations | | | 6.56 | | | | (11.43 | ) | | | 6.09 | | | | 2.56 | | | | 9.04 | |
| | | | | |
Less Distributions to Shareholders: | | | | | | | | | | | | | | | | | | | | |
From net investment income | | | (0.05 | ) | | | — | | | | (0.03 | ) | | | (0.06 | ) | | | — | |
From net realized gains | | | — | | | | (0.40 | ) | | | (3.87 | ) | | | (5.19 | ) | | | (5.39 | ) |
| | | | | | | | | | | | | | | | | | | | |
Total distributions to shareholders | | | (0.05 | ) | | | (0.40 | ) | | | (3.90 | ) | | | (5.25 | ) | | | (5.39 | ) |
| | | | | |
Increase from Regulatory Settlements | | | — | (d) | | | — | | | | — | | | | — | | | | — | |
| | | | | |
Net Asset Value, End of Period | | $ | 20.17 | | | $ | 13.66 | | | $ | 25.49 | | | $ | 23.30 | | | $ | 25.99 | |
Total return (e) | | | 48.12 | % | | | (45.72 | )%(f) | | | 26.84 | %(f) | | | 10.84 | %(f) | | | 41.42 | % |
| | | | | |
Ratios to Average Net Assets/Supplemental Data: | | | | | | | | | | | | | | | | | | | | |
Net expenses before interest expense (g) | | | 0.96 | % | | | 0.99 | % | | | 1.07 | % | | | 1.12 | % | | | 1.13 | % |
Interest expense | | | — | %(h) | | | — | | | | — | %(h) | | | — | | | | — | |
Net expenses (g) | | | 0.96 | % | | | 0.99 | % | | | 1.07 | % | | | 1.12 | % | | | 1.13 | % |
Waiver/Reimbursement | | | — | | | | 0.04 | % | | | 0.04 | % | | | 0.01 | % | | | — | |
Net investment income (loss) (g) | | | 0.21 | % | | | 0.11 | % | | | 0.05 | % | | | 0.25 | % | | | (0.01 | )% |
Portfolio turnover rate | | | 523 | % | | | 484 | % | | | 198 | % | | | 279 | % | | | 234 | % |
Net assets, end of period (000s) | | $ | 622,471 | | | $ | 338,292 | | | $ | 712,080 | | | $ | 497,676 | | | $ | 522,506 | |
| (a) | On March 31, 2008, Shares class of Energy and Natural Resources Fund, a series of Excelsior Funds, Inc., was reorganized into Class Z. The financial information of Class Z includes the financial information of Energy and Natural Resources Fund’s Shares class. |
| (b) | Per share data for the year ended March 31, 2006 was audited by other auditors. |
| (c) | Per share data was calculated using the average shares outstanding during the period. |
| (d) | Rounds to less than $0.01 per share. |
| (e) | Total return at net asset value assuming all distributions reinvested. |
| (f) | Had the investment advisor and/or any of its affiliates not waived fees or reimbursed a portion of expenses, total return would have been reduced. |
| (g) | The benefits derived from expense reductions had an impact of less than 0.01%, except for the year ended March 31, 2007, which had an impact of 0.01%. |
| (h) | Rounds to less than 0.01%. |
See Accompanying Notes to Financial Statements.
119
Financial Highlights – Columbia Mid Cap Core Fund
Selected data for a share outstanding throughout each period is as follows:
| | | | | | | | | | | | |
| | | Year Ended
March 31, | | | Period Ended
March 31, | |
| Class A Shares | | 2010 | | | 2009 | | | 2008 (a) | |
Net Asset Value, Beginning of Period | | $ | 9.54 | | | $ | 18.29 | | | $ | 18.29 | |
| | | |
Income from Investment Operations: | | | | | | | | | | | | |
Net investment income (loss) (b) | | | 0.04 | | | | 0.08 | | | | — | (c) |
Net realized and unrealized gain (loss) on investments and foreign currency | | | 5.33 | | | | (8.72 | ) | | | — | (c) |
| | | | | | | | | | | | |
Total from investment operations | | | 5.37 | | | | (8.64 | ) | | | — | (c) |
| | | |
Less Distributions to Shareholders: | | | | | | | | | | | | |
From net investment income | | | (0.07 | ) | | | (0.07 | ) | | | — | |
From net realized gains | | | — | | | | (0.04 | ) | | | — | |
| | | | | | | | | | | | |
Total distributions to shareholders | | | (0.07 | ) | | | (0.11 | ) | | | — | |
| | | |
Net Asset Value, End of Period | | $ | 14.84 | | | $ | 9.54 | | | $ | 18.29 | |
Total return (d)(e) | | | 56.43 | % | | | (47.44 | )% | | | 0.00 | %(f) |
| | | |
Ratios to Average Net Assets/Supplemental Data: | | | | | | | | | | | | |
Net expenses before interest expense | | | 1.29 | % | | | 1.26 | %(g) | | | 1.10 | %(g)(h) |
Interest expense (i) | | | — | % | | | — | % | | | — | %(h) |
Net expenses | | | 1.29 | % | | | 1.26 | %(g) | | | 1.10 | %(g)(h) |
Waiver/Reimbursement | | | 0.10 | % | | | 0.05 | % | | | 0.05 | %(h) |
Net investment income (loss) | | | 0.34 | % | | | 0.81 | %(g) | | | (1.10 | )%(g)(h) |
Portfolio turnover rate | | | 164 | % | | | 111 | % | | | 16 | %(f) |
Net assets, end of period (000s) | | $ | 949 | | | $ | 210 | | | $ | 10 | |
| (a) | The Fund’s Class A shares commenced operations on March 31, 2008. Per share data and total return reflect activity from that date. |
| (b) | Per share data was calculated using the average shares outstanding during the period. |
| (c) | Rounds to less than $0.01 per share. |
| (d) | Total return at net asset value assuming all distributions reinvested and no initial sales charge or contingent deferred sales charge. |
| (e) | Had the investment advisor and/or any of its affiliates not waived fees or reimbursed a portion of expenses, total return would have been reduced. |
| (g) | The benefits derived from expense reductions had an impact of less than 0.01%. |
| (i) | Rounds to less than 0.01%. |
See Accompanying Notes to Financial Statements.
120
Financial Highlights – Columbia Mid Cap Core Fund
Selected data for a share outstanding throughout each period is as follows:
| | | | | | | | | | | | |
| | | Year Ended
March 31, | | | Period Ended
March 31, | |
| Class C Shares | | 2010 | | | 2009 | | | 2008 (a) | |
Net Asset Value, Beginning of Period | | $ | 9.50 | | | $ | 18.29 | | | $ | 18.29 | |
| | | |
Income from Investment Operations: | | | | | | | | | | | | |
Net investment loss (b) | | | (0.06 | ) | | | (0.01 | ) | | | — | (c) |
Net realized and unrealized gain (loss) on investments and foreign currency | | | 5.35 | | | | (8.72 | ) | | | — | (c) |
| | | | | | | | | | | | |
Total from investment operations | | | 5.29 | | | | (8.73 | ) | | | — | (c) |
| | | |
Less Distributions to Shareholders: | | | | | | | | | | | | |
From net investment income | | | (0.02 | ) | | | (0.02 | ) | | | — | |
From net realized gains | | | — | | | | (0.04 | ) | | | — | |
| | | | | | | | | | | | |
Total distributions to shareholders | | | (0.02 | ) | | | (0.06 | ) | | | — | |
| | | |
Net Asset Value, End of Period | | $ | 14.77 | | | $ | 9.50 | | | $ | 18.29 | |
Total return (d)(e) | | | 55.74 | % | | | (47.83 | )% | | | 0.00 | %(f) |
| | | |
Ratios to Average Net Assets/Supplemental Data: | | | | | | | | | | | | |
Net expenses before interest expense | | | 2.04 | % | | | 2.01 | %(g) | | | 1.85 | %(g)(h) |
Interest expense (i) | | | — | % | | | — | % | | | — | %(h) |
Net expenses | | | 2.04 | % | | | 2.01 | %(g) | | | 1.85 | %(g)(h) |
Waiver/Reimbursement | | | 0.10 | % | | | 0.05 | % | | | 0.05 | %(h) |
Net investment loss | | | (0.43 | )% | | | (0.06 | )%(g) | | | (1.85 | )%(g)(h) |
Portfolio turnover rate | | | 164 | % | | | 111 | % | | | 16 | %(f) |
Net assets, end of period (000s) | | $ | 257 | | | $ | 67 | | | $ | 10 | |
| (a) | The Fund’s Class C shares commenced operations on March 31, 2008. Per share data and total return reflect activity from that date. |
| (b) | Per share data was calculated using the average shares outstanding during the period. |
| (c) | Rounds to less than $0.01 per share. |
| (d) | Had the investment advisor and/or any of its affiliates not waived fees or reimbursed a portion of expenses, total return would have been reduced. |
| (e) | Total return at net asset value assuming all distributions reinvested and no contingent deferred sales charge. |
| (g) | The benefits derived from expense reductions had an impact of less than 0.01%. |
| (i) | Rounds to less than 0.01%. |
See Accompanying Notes to Financial Statements.
121
Financial Highlights – Columbia Mid Cap Core Fund
Selected data for a share outstanding throughout each period is as follows:
| | | | | | | | | | | | | | | | | | | | |
| | | Year Ended March 31, | |
| Class R Shares | | 2010 | | | 2009 | | | 2008 (a) | | | 2007 | | | 2006 (b) | |
Net Asset Value, Beginning of Period | | $ | 9.42 | | | $ | 18.10 | | | $ | 21.48 | | | $ | 19.62 | | | $ | 16.78 | |
| | | | | |
Income from Investment Operations: | | | | | | | | | | | | | | | | | | | | |
Net investment income (loss) (c) | | | 0.01 | | | | 0.02 | | | | (0.03 | ) | | | 0.70 | | | | (0.06 | ) |
Net realized and unrealized gain (loss) on investments and foreign currency | | | 5.27 | | | | (8.61 | ) | | | (2.55 | ) | | | 1.16 | | | | 2.90 | |
| | | | | | | | | | | | | | | | | | | | |
Total from investment operations | | | 5.28 | | | | (8.59 | ) | | | (2.58 | ) | | | 1.86 | | | | 2.84 | |
| | | | | |
Less Distributions to Shareholders: | | | | | | | | | | | | | | | | | | | | |
From net investment income | | | (0.05 | ) | | | (0.05 | ) | | | (0.29 | ) | | | — | | | | — | |
From net realized gains | | | — | | | | (0.04 | ) | | | (0.51 | ) | | | — | (d) | | | — | |
| | | | | | | | | | | | | | | | | | | | |
Total distributions to shareholders | | | (0.05 | ) | | | (0.09 | ) | | | (0.80 | ) | | | — | (d) | | | — | |
| | | | | |
Net Asset Value, End of Period | | $ | 14.65 | | | $ | 9.42 | | | $ | 18.10 | | | $ | 21.48 | | | $ | 19.62 | |
Total return (e) | | | 56.19 | %(f) | | | (47.62 | )%(f) | | | (12.56 | )%(f) | | | 9.48 | %(f) | | | 16.92 | % |
| | | | | |
Ratios to Average Net Assets/Supplemental Data: | | | | | | | | | | | | | | | | | | | | |
Net expenses before interest expense | | | 1.54 | % | | | 1.51 | %(g) | | | 1.60 | %(g) | | | 1.61 | %(g) | | | 1.46 | %(g) |
Interest expense | | | — | %(h) | | | — | %(h) | | | — | %(h) | | | — | | | | — | |
Net expenses | | | 1.54 | % | | | 1.51 | %(g) | | | 1.60 | %(g) | | | 1.61 | %(g) | | | 1.46 | %(g) |
Waiver/Reimbursement | | | 0.10 | % | | | 0.05 | % | | | 0.04 | % | | | 0.03 | % | | | — | |
Net investment income (loss) | | | 0.06 | % | | | 0.14 | %(g) | | | (0.13 | )%(g) | | | 3.38 | %(g) | | | (0.34 | )%(g) |
Portfolio turnover rate | | | 164 | % | | | 111 | % | | | 16 | % | | | 25 | % | | | 23 | % |
Net assets, end of period (000s) | | $ | 1,219 | | | $ | 1,145 | | | $ | 2,020 | | | $ | 1,097 | | | $ | 1 | |
| (a) | On March 31, 2008, Retirement Shares class of Mid Cap Value and Restructuring Fund, a series of Excelsior Funds Trust, was reorganized into the Fund’s Class R shares. The financial information of the Fund’s Class R shares includes the financial information of Mid Cap Value and Restructuring Fund’s Retirement Shares class. |
| (b) | Per share data for the year ended March 31, 2006 was audited by other auditors. |
| (c) | Per share data was calculated using the average shares outstanding during the period. |
| (d) | Rounds to less than $0.01 per share. |
| (e) | Total return at net asset value assuming all distributions reinvested. |
| (f) | Had the investment advisor and/or any of its affiliates not waived fees or reimbursed a portion of expenses, total return would have been reduced. |
| (g) | The benefits derived from expense reductions had an impact of less than 0.01%. |
| (h) | Rounds to less than 0.01%. |
See Accompanying Notes to Financial Statements.
122
Financial Highlights – Columbia Mid Cap Core Fund
Selected data for a share outstanding throughout each period is as follows:
| | | | | | | | | | | | | | | | | | | | |
| | | Year Ended March 31, | |
| Class Z Shares | | 2010 | | | 2009 | | | 2008 (a)(b) | | | 2007 | | | 2006 (c) | |
Net Asset Value, Beginning of Period | | $ | 9.55 | | | $ | 18.29 | | | $ | 21.61 | | | $ | 19.64 | | | $ | 16.77 | |
| | | | | |
Income from Investment Operations: | | | | | | | | | | | | | | | | | | | | |
Net investment income (d) | | | 0.07 | | | | 0.09 | | | | 0.10 | | | | 0.23 | | | | — | (e) |
Net realized and unrealized gain (loss) on investments and foreign currency | | | 5.35 | | | | (8.71 | ) | | | (2.59 | ) | | | 1.75 | | | | 2.90 | |
| | | | | | | | | | | | | | | | | | | | |
Total from investment operations | | | 5.42 | | | | (8.62 | ) | | | (2.49 | ) | | | 1.98 | | | | 2.90 | |
| | | | | |
Less Distributions to Shareholders: | | | | | | | | | | | | | | | | | | | | |
From net investment income | | | (0.09 | ) | | | (0.08 | ) | | | (0.32 | ) | | | (0.01 | ) | | | (0.03 | ) |
From net realized gains | | | — | | | | (0.04 | ) | | | (0.51 | ) | | | — | (e) | | | — | |
| | | | | | | | | | | | | | | | | | | | |
Total distributions to shareholders | | | (0.09 | ) | | | (0.12 | ) | | | (0.83 | ) | | | (0.01 | ) | | | (0.03 | ) |
| | | | | |
Net Asset Value, End of Period | | $ | 14.88 | | | $ | 9.55 | | | $ | 18.29 | | | $ | 21.61 | | | $ | 19.64 | |
Total return (f) | | | 56.97 | %(g) | | | (47.32 | )%(g) | | | (12.08 | )%(g) | | | 10.07 | % | | | 17.32 | % |
| | | | | |
Ratios to Average Net Assets/Supplemental Data: | | | | | | | | | | | | | | | | | | | | |
Net expenses before interest expense | | | 1.04 | % | | | 1.01 | %(h) | | | 1.10 | %(h) | | | 1.13 | %(h) | | | 1.13 | %(h) |
Interest expense | | | — | %(i) | | | — | %(i) | | | — | %(i) | | | — | | | | — | |
Net expenses | | | 1.04 | % | | | 1.01 | %(h) | | | 1.10 | %(h) | | | 1.13 | %(h) | | | 1.13 | %(h) |
Waiver/Reimbursement | | | 0.10 | % | | | 0.05 | % | | | 0.04 | % | | | — | | | | — | |
Net investment income | | | 0.56 | % | | | 0.59 | %(h) | | | 0.47 | %(h) | | | 1.12 | %(h) | | | 0.02 | %(h) |
Portfolio turnover rate | | | 164 | % | | | 111 | % | | | 16 | % | | | 25 | % | | | 23 | % |
Net assets, end of period (000s) | | $ | 71,894 | | | $ | 63,528 | | | $ | 245,608 | | | $ | 294,452 | | | $ | 237,531 | |
| (a) | On March 31, 2008, Shares class of Mid Cap Value and Restructuring Fund, a series of Excelsior Funds Trust, was reorganized into the Fund’s Class Z. The financial information of the Fund’s Class Z includes the financial information of Mid Cap Value and Restructuring Fund’s Shares class. |
| (b) | On March 31, 2008, Mid Cap Value and Restructuring Fund’s Institutional Shares class was reorganized into the Fund’s Class Z. |
| (c) | Per share data for the year ended March 31, 2006 was audited by other auditors. |
| (d) | Per share data was calculated using the average shares outstanding during the period. |
| (e) | Rounds to less than $0.01 per share. |
| (f) | Total return at net asset value assuming all distributions reinvested. |
| (g) | Had the investment advisor and/or any of its affiliates not waived fees or reimbursed a portion of expenses, total return would have been reduced. |
| (h) | The benefits derived from expense reductions had an impact of less than 0.01%. |
| (i) | Rounds to less than 0.01%. |
See Accompanying Notes to Financial Statements.
123
Financial Highlights – Columbia Select Large Cap Growth Fund
Selected data for a share outstanding throughout each period is as follows:
| | | | | | | | | | | | |
| | | Year Ended
March 31, | | | Period Ended
March 31, | |
| Class A Shares | | 2010 | | | 2009 | | | 2008 (a) | |
Net Asset Value, Beginning of Period | | $ | 7.06 | | | $ | 11.30 | | | $ | 12.18 | |
| | | |
Income from Investment Operations: | | | | | | | | | | | | |
Net investment loss (b) | | | (0.05 | ) | | | (0.06 | ) | | | (0.05 | ) |
Net realized and unrealized gain (loss) on investments | | | 3.59 | | | | (4.18 | ) | | | (0.83 | ) |
| | | | | | | | | | | | |
Total from investment operations | | | 3.54 | | | | (4.24 | ) | | | (0.88 | ) |
| | | |
Increase from Regulatory Settlements | | | — | | | | — | (c) | | | — | |
| | | |
Net Asset Value, End of Period | | $ | 10.60 | | | $ | 7.06 | | | $ | 11.30 | |
Total return (d) | | | 50.14 | % | | | (37.52 | )%(e) | | | (7.22 | )%(e)(f) |
| | | |
Ratios to Average Net Assets/Supplemental Data: | | | | | | | | | | | | |
Net expenses before interest expense (g) | | | 1.26 | % | | | 1.28 | % | | | 1.16 | %(h) |
Interest expense | | | — | | | | — | %(i) | | | — | |
Net expenses (g) | | | 1.26 | % | | | 1.28 | % | | | 1.16 | %(h) |
Waiver/Reimbursement | | | — | | | | 0.05 | % | | | 0.05 | %(h) |
Net investment loss (g) | | | (0.53 | )% | | | (0.77 | )% | | | (0.92 | )%(h) |
Portfolio turnover rate | | | 27 | % | | | 58 | % | | | 39 | %(f) |
Net assets, end of period (000s) | | $ | 576,956 | | | $ | 84,493 | | | $ | 2,141 | |
| (a) | The Predecessor Fund’s Class A shares commenced operations on September 28, 2007. Per share data and total return reflect activity from that date. |
| (b) | Per share data was calculated using the average shares outstanding during the period. |
| (c) | Rounds to less than $0.01 per share. |
| (d) | Total return at net asset value assuming all distributions reinvested and no initial sales charge or contingent deferred sales charge. |
| (e) | Had the investment advisor and/or any of its affiliates not waived fees or reimbursed a portion of expenses, total return would have been reduced. |
| (g) | The benefits derived from expense reductions had an impact of less than 0.01%. |
| (i) | Rounds to less than 0.01%. |
See Accompanying Notes to Financial Statements.
124
Financial Highlights – Columbia Select Large Cap Growth Fund
Selected data for a share outstanding throughout each period is as follows:
| | | | | | | | | | | | |
| | | Year Ended
March 31, | | | Period Ended
March 31, | |
| Class C Shares | | 2010 | | | 2009 | | | 2008 (a) | |
Net Asset Value, Beginning of Period | | $ | 6.98 | | | $ | 11.26 | | | $ | 12.18 | |
| | | |
Income from Investment Operations: | | | | | | | | | | | | |
Net investment loss (b) | | | (0.12 | ) | | | (0.12 | ) | | | (0.09 | ) |
Net realized and unrealized gain (loss) on investments | | | 3.54 | | | | (4.16 | ) | | | (0.83 | ) |
| | | | | | | | | | | | |
Total from investment operations | | | 3.42 | | | | (4.28 | ) | | | (0.92 | ) |
| | | |
Increase from Regulatory Settlements | | | — | | | | — | (c) | | | — | |
| | | |
Net Asset Value, End of Period | | $ | 10.40 | | | $ | 6.98 | | | $ | 11.26 | |
Total return (d) | | | 49.00 | % | | | (38.01 | )%(e) | | | (7.55 | )%(e)(f) |
| | | |
Ratios to Average Net Assets/Supplemental Data: | | | | | | | | | | | | |
Net expenses before interest expense (g) | | | 2.01 | % | | | 2.03 | % | | | 1.91 | %(h) |
Interest expense | | | — | | | | — | %(i) | | | — | |
Net expenses (g) | | | 2.01 | % | | | 2.03 | % | | | 1.91 | %(h) |
Waiver/Reimbursement | | | — | | | | 0.05 | % | | | 0.05 | %(h) |
Net investment loss (g) | | | (1.27 | )% | | | (1.37 | )% | | | (1.59 | )%(h) |
Portfolio turnover rate | | | 27 | % | | | 58 | % | | | 39 | %(f) |
Net assets, end of period (000s) | | $ | 3,234 | | | $ | 763 | | | $ | 238 | |
| (a) | The Predecessor Fund’s Class C shares commenced operations on September 28, 2007. Per share data and total return reflect activity from that date. |
| (b) | Per share data was calculated using the average shares outstanding during the period. |
| (c) | Rounds to less than $0.01 per share. |
| (d) | Total return at net asset value assuming all distributions reinvested and no contingent deferred sales charge. |
| (e) | Had the investment advisor and/or any of its affiliates not waived fees or reimbursed a portion of expenses, total return would have been reduced. |
| (g) | The benefits derived from expense reductions had an impact of less than 0.01%. |
| (i) | Rounds to less than 0.01%. |
See Accompanying Notes to Financial Statements.
125
Financial Highlights – Columbia Select Large Cap Growth Fund
Selected data for a share outstanding throughout each period is as follows:
| | | | | | | | | | | | | | | | | | | | |
| | | Year Ended March 31, | |
| Class R Shares | | 2010 | | | 2009 | | | 2008 (a) | | | 2007 | | | 2006 (b) | |
Net Asset Value, Beginning of Period | | $ | 6.91 | | | $ | 11.09 | | | $ | 10.45 | | | $ | 9.82 | | | $ | 8.02 | |
| | | | | |
Income from Investment Operations: | | | | | | | | | | | | | | | | | | | | |
Net investment loss (c) | | | (0.07 | ) | | | (0.07 | ) | | | (0.14 | ) | | | (0.12 | ) | | | (0.11 | ) |
Net realized and unrealized gain (loss) on investments | | | 3.51 | | | | (4.11 | ) | | | 0.78 | | | | 0.75 | | | | 1.91 | |
| | | | | | | | | | | | | | | | | | | | |
Total from investment operations | | | 3.44 | | | | (4.18 | ) | | | 0.64 | | | | 0.63 | | | | 1.80 | |
| | | | | |
Increase from Regulatory Settlements | | | — | | | | — | (d) | | | — | | | | — | | | | — | |
| | | | | |
Net Asset Value, End of Period | | $ | 10.35 | | | $ | 6.91 | | | $ | 11.09 | | | $ | 10.45 | | | $ | 9.82 | |
Total return (e) | | | 49.78 | % | | | (37.69 | )%(f) | | | 6.12 | %(f) | | | 6.42 | %(f) | | | 22.44 | %(f) |
| | | | | |
Ratios to Average Net Assets/Supplemental Data: | | | | | | | | | | | | | | | | | | | | |
Net expenses before interest expense (g) | | | 1.51 | % | | | 1.53 | % | | | 1.66 | % | | | 1.69 | % | | | 1.70 | % |
Interest expense | | | — | | | | — | %(h) | | | — | | | | — | | | | — | |
Net expenses (g) | | | 1.51 | % | | | 1.53 | % | | | 1.66 | % | | | 1.69 | % | | | 1.70 | % |
Waiver/Reimbursement | | | — | | | | 0.05 | % | | | 0.04 | % | | | 0.01 | % | | | 0.29 | % |
Net investment loss (g) | | | (0.71 | )% | | | (0.80 | )% | | | (1.22 | )% | | | (1.18 | )% | | | (1.20 | )% |
Portfolio turnover rate | | | 27 | % | | | 58 | % | | | 39 | % | | | 33 | % | | | 24 | % |
Net assets, end of period (000s) | | $ | 408 | | | $ | 23 | | | $ | 22 | | | $ | 3 | | | $ | 3 | |
| (a) | On March 31, 2008, Retirement Shares class of Large Cap Growth Fund, a series of Excelsior Funds, Inc., was reorganized into the Fund’s Class R. The financial information of the Fund’s Class R includes the financial information of Large Cap Growth Fund’s Retirement Shares class. |
| (b) | Per share data for the year ended March 31, 2006 was audited by other auditors. |
| (c) | Per share data was calculated using the average shares outstanding during the period. |
| (d) | Rounds to less than $0.01 per share. |
| (e) | Total return at net asset value assuming all distributions reinvested. |
(f) Had the investment advisor and/or any of its affiliates not waived fees or reimbursed a portion of expenses, total return would have been reduced.
| (g) | The benefits derived from expense reductions had an impact of less than 0.01%. |
| (h) | Rounds to less than 0.01%. |
See Accompanying Notes to Financial Statements.
126
Financial Highlights – Columbia Select Large Cap Growth Fund
Selected data for a share outstanding throughout each period is as follows:
| | | | | | | | | | | | | | | | | | | | |
| | | Year Ended March 31, | |
| Class Z Shares | | 2010 | | | 2009 | | | 2008 (a)(b) | | | 2007 | | | 2006 (c) | |
Net Asset Value, Beginning of Period | | $ | 7.08 | | | $ | 11.30 | | | $ | 10.60 | | | $ | 9.91 | | | $ | 8.04 | |
| | | | | |
Income from Investment Operations: | | | | | | | | | | | | | | | | | | | | |
Net investment loss (d) | | | (0.03 | ) | | | (0.03 | ) | | | (0.08 | ) | | | (0.07 | ) | | | (0.04 | ) |
Net realized and unrealized gain (loss) on investments | | | 3.60 | | | | (4.19 | ) | | | 0.78 | | | | 0.76 | | | | 1.91 | |
| | | | | | | | | | | | | | | | | | | | |
Total from investment operations | | | 3.57 | | | | (4.22 | ) | | | 0.70 | | | | 0.69 | | | | 1.87 | |
| | | | | |
Increase from Regulatory Settlements | | | — | | | | — | (e) | | | — | | | | — | | | | — | |
| | | | | |
Net Asset Value, End of Period | | $ | 10.65 | | | $ | 7.08 | | | $ | 11.30 | | | $ | 10.60 | | | $ | 9.91 | |
Total return (f) | | | 50.42 | % | | | (37.35 | )%(g) | | | 6.60 | %(g) | | | 6.96 | % | | | 23.26 | %(g) |
| | | | | |
Ratios to Average Net Assets/Supplemental Data: | | | | | | | | | | | | | | | | | | | | |
Net expenses before interest expense (h) | | | 1.01 | % | | | 1.03 | % | | | 1.16 | % | | | 1.20 | % | | | 1.10 | % |
Interest expense | | | — | | | | — | %(i) | | | — | | | | — | | | | — | |
Net expenses (h) | | | 1.01 | % | | | 1.03 | % | | | 1.16 | % | | | 1.20 | % | | | 1.10 | % |
Waiver/Reimbursement | | | — | | | | 0.05 | % | | | 0.04 | % | | | — | | | | 0.13 | % |
Net investment loss (h) | | | (0.29 | )% | | | (0.38 | )% | | | (0.69 | )% | | | (0.68 | )% | | | (0.48 | )% |
Portfolio turnover rate | | | 27 | % | | | 58 | % | | | 39 | % | | | 33 | % | | | 24 | % |
Net assets, end of period (000s) | | $ | 1,697,630 | | | $ | 732,391 | | | $ | 938,734 | | | $ | 718,424 | | | $ | 552,194 | |
| (a) | On March 31, 2008, Shares class of Large Cap Growth Fund, a series of Excelsior Funds, Inc., was reorganized into the Fund’s Class Z. The financial information of the Fund’s Class Z includes the financial information of Large Cap Growth Fund’s Shares class. |
| (b) | On March 31, 2008, Large Cap Growth Fund’s Institutional Shares class was reorganized into the Fund’s Class Z. |
| (c) | Per share data for the year ended March 31, 2006 was audited by other auditors. |
| (d) | Per share data was calculated using the average shares outstanding during the period. |
| (e) | Rounds to less than $0.01 per share. |
| (f) | Total return at net asset value assuming all distributions reinvested. |
| (g) | Had the investment advisor and/or any of its affiliates not waived fees or reimbursed a portion of expenses, total return would have been reduced. |
| (h) | The benefits derived from expense reductions had an impact of less than 0.01%. |
| (i) | Rounds to less than 0.01%. |
See Accompanying Notes to Financial Statements.
127
Financial Highlights – Columbia Select Opportunities Fund
Selected data for a share outstanding throughout each period is as follows:
| | | | | | | | | | | | |
| | | Year Ended
March 31, | | | Period Ended
March 31, | |
| Class A Shares | | 2010 | | | 2009 | | | 2008 (a) | |
Net Asset Value, Beginning of Period | | $ | 7.62 | | | $ | 13.96 | | | $ | 15.80 | |
| | | |
Income from Investment Operations: | | | | | | | | | | | | |
Net investment income (b) | | | 0.02 | | | | 0.06 | | | | 0.04 | |
Net realized and unrealized gain (loss) on investments and foreign currency | | | 4.25 | | | | (6.13 | ) | | | (1.43 | ) |
| | | | | | | | | | | | |
Total from investment operations | | | 4.27 | | | | (6.07 | ) | | | (1.39 | ) |
| | | |
Less Distributions to Shareholders: | | | | | | | | | | | | |
From net investment income | | | (0.03 | ) | | | (0.08 | ) | | | (0.04 | ) |
From net realized gains | | | — | | | | (0.19 | ) | | | (0.41 | ) |
| | | | | | | | | | | | |
Total distributions to shareholders | | | (0.03 | ) | | | (0.27 | ) | | | (0.45 | ) |
| | | |
Net Asset Value, End of Period | | $ | 11.86 | | | $ | 7.62 | | | $ | 13.96 | |
Total return (c)(d) | | | 56.09 | % | | | (44.24 | )% | | | (9.07 | )%(e) |
| | | |
Ratios to Average Net Assets/Supplemental Data: | | | | | | | | | | | | |
Net expenses before interest expense (f) | | | 1.19 | % | | | 1.07 | % | | | 1.05 | %(g) |
Interest expense | | | — | %(h) | | | — | %(h) | | | — | |
Net expenses (f) | | | 1.19 | % | | | 1.07 | % | | | 1.05 | %(g) |
Waiver/Reimbursement | | | 0.15 | % | | | 0.23 | % | | | 0.17 | %(g) |
Net investment income (f) | | | 0.17 | % | | | 0.63 | % | | | 0.55 | %(g) |
Portfolio turnover rate | | | 111 | % | | | 63 | % | | | 27 | %(e) |
Net assets, end of period (000s) | | $ | 1,372 | | | $ | 1,097 | | | $ | 318 | |
| (a) | The Predecessor Fund’s Class A shares commenced operations on September 28, 2007. Per share data and total return reflect activity from that date. |
| (b) | Per share data was calculated using the average shares outstanding during the period. |
(c) Had the investment advisor and/or any of its affiliates not waived fees or reimbursed a portion of expenses, total return would have been reduced.
(d) Total return at net asset value assuming all distributions reinvested and no initial sales charge or contingent deferred sales charge.
| (f) | The benefits derived from expense reductions had an impact of less than 0.01%. |
| (h) | Rounds to less than 0.01%. |
See Accompanying Notes to Financial Statements.
128
Financial Highlights – Columbia Select Opportunities Fund
Selected data for a share outstanding throughout each period is as follows:
| | | | | | | | | | | | |
| | | Year Ended
March 31, | | | Period Ended
March 31, | |
| Class C Shares | | 2010 | | | 2009 | | | 2008 (a) | |
Net Asset Value, Beginning of Period | | $ | 7.58 | | | $ | 13.93 | | | $ | 15.80 | |
| | | |
Income from Investment Operations: | | | | | | | | | | | | |
Net investment income (loss) (b) | | | (0.06 | ) | | | — | (c) | | | — | (c) |
Net realized and unrealized gain (loss) on investments and foreign currency | | | 4.21 | | | | (6.13 | ) | | | (1.46 | ) |
| | | | | | | | | | | | |
Total from investment operations | | | 4.15 | | | | (6.13 | ) | | | (1.46 | ) |
| | | |
Less Distributions to Shareholders: | | | | | | | | | | | | |
From net investment income | | | — | (c) | | | (0.03 | ) | | | — | |
From net realized gains | | | — | | | | (0.19 | ) | | | (0.41 | ) |
| | | | | | | | | | | | |
Total distributions to shareholders | | | — | (c) | | | (0.22 | ) | | | (0.41 | ) |
| | | |
Net Asset Value, End of Period | | $ | 11.73 | | | $ | 7.58 | | | $ | 13.93 | |
Total return (d)(e) | | | 54.78 | % | | | (44.69 | )% | | | (9.47 | )%(f) |
| | | |
Ratios to Average Net Assets/Supplemental Data: | | | | | | | | | | | | |
Net expenses before interest expense (g) | | | 1.94 | % | | | 1.82 | % | | | 1.80 | %(h) |
Interest expense | | | — | %(i) | | | — | %(i) | | | — | |
Net expenses (g) | | | 1.94 | % | | | 1.82 | % | | | 1.80 | %(h) |
Waiver/Reimbursement | | | 0.15 | % | | | 0.23 | % | | | 0.17 | %(h) |
Net investment income (loss) (g) | | | (0.58 | )% | | | (0.03 | )% | | | 0.01 | %(h) |
Portfolio turnover rate | | | 111 | % | | | 63 | % | | | 27 | %(f) |
Net assets, end of period (000s) | | $ | 264 | | | $ | 240 | | | $ | 27 | |
| (a) | The Predecessor Fund’s Class C shares commenced operations on September 28, 2007. Per share data and total return reflect activity from that date. |
| (b) | Per share data was calculated using the average shares outstanding during the period. |
| (c) | Rounds to less than $0.01 per share. |
| (d) | Total return at net asset value assuming all distributions reinvested and no contingent deferred sales charge. |
| (e) | Had the investment advisor and/or any of its affiliates not waived fees or reimbursed a portion of expenses, total return would have been reduced. |
| (g) | The benefits derived from expense reductions had an impact of less than 0.01%. |
| (i) | Rounds to less than 0.01%. |
See Accompanying Notes to Financial Statements.
129
Financial Highlights – Columbia Select Opportunities Fund
Selected data for a share outstanding throughout each period is as follows:
| | | | | | | | | | | | | | | | | | | | |
| | | Year Ended March 31, | |
| Class Z Shares | | 2010 | | | 2009 | | | 2008 (a)(b) | | | 2007 | | | 2006 (c) | |
Net Asset Value, Beginning of Period | | $ | 7.62 | | | $ | 13.96 | | | $ | 14.17 | | | $ | 12.70 | | | $ | 10.98 | |
| | | | | |
Income from Investment Operations: | | | | | | | | | | | | | | | | | | | | |
Net investment income (d) | | | 0.04 | | | | 0.09 | | | | 0.10 | | | | 0.07 | | | | 0.07 | |
Net realized and unrealized gain (loss) on investments and foreign currency | | | 4.25 | | | | (6.14 | ) | | | 0.21 | | | | 1.47 | | | | 1.70 | |
| | | | | | | | | | | | | | | | | | | | |
Total from investment operations | | | 4.29 | | | | (6.05 | ) | | | 0.31 | | | | 1.54 | | | | 1.77 | |
| | | | | |
Less Distributions to Shareholders: | | | | | | | | | | | | | | | | | | | | |
From net investment income | | | (0.05 | ) | | | (0.10 | ) | | | (0.11 | ) | | | (0.07 | ) | | | (0.05 | ) |
From net realized gains | | | — | | | | (0.19 | ) | | | (0.41 | ) | | | — | | | | — | |
| | | | | | | | | | | | | | | | | | | | |
Total distributions to shareholders | | | (0.05 | ) | | | (0.29 | ) | | | (0.52 | ) | | | (0.07 | ) | | | (0.05 | ) |
| | | | | |
Net Asset Value, End of Period | | $ | 11.86 | | | $ | 7.62 | | | $ | 13.96 | | | $ | 14.17 | | | $ | 12.70 | |
Total return (e)(f) | | | 56.37 | % | | | (44.11 | )% | | | 1.89 | % | | | 12.18 | % | | | 16.16 | % |
| | | | | |
Ratios to Average Net Assets/Supplemental Data: | | | | | | | | | | | | | | | | | | | | |
Net expenses before interest expense (g) | | | 0.94 | % | | | 0.82 | % | | | 1.05 | % | | | 1.04 | % | | | 1.05 | % |
Interest expense | | | — | %(h) | | | — | %(h) | | | — | | | | — | | | | — | |
Net expenses (g) | | | 0.94 | % | | | 0.82 | % | | | 1.05 | % | | | 1.04 | % | | | 1.05 | % |
Waiver/Reimbursement | | | 0.15 | % | | | 0.23 | % | | | 0.17 | % | | | 0.20 | % | | | 0.26 | % |
Net investment income (g) | | | 0.44 | % | | | 0.75 | % | | | 0.64 | % | | | 0.56 | % | | | 0.57 | % |
Portfolio turnover rate | | | 111 | % | | | 63 | % | | | 27 | % | | | 11 | % | | | 17 | % |
Net assets, end of period (000s) | | $ | 122,039 | | | $ | 134,468 | | | $ | 388,441 | | | $ | 277,877 | | | $ | 132,406 | |
| (a) | On March 31, 2008, Shares class of Equity Opportunities Fund, a series of Excelsior Funds Trust, was reorganized into the Fund’s Class Z. The financial information of the Fund’s Class Z includes the financial information of Equity Opportunities Fund’s Shares class. |
| (b) | On March 31, 2008, Equity Opportunities Fund’s Institutional Shares class was reorganized into the Fund’s Class Z. |
| (c) | Per share data for the year ended March 31, 2006 were audited by other auditors. |
| (d) | Per share data was calculated using the average shares outstanding during the period. |
(e) Had the investment advisor and/or any of its affiliates not waived fees or reimbursed a portion of expenses, total return would have been reduced.
| (f) | Total return at net asset value assuming all distributions reinvested. |
(g) The benefits derived from expense reductions had an impact of less than 0.01%, except for the year ended March 31, 2007, which had an impact of 0.01%.
| (h) | Rounds to less than 0.01%. |
See Accompanying Notes to Financial Statements.
130
Financial Highlights – Columbia Select Small Cap Fund
Selected data for a share outstanding throughout each period is as follows:
| | | | | | | | | | | | |
| | | Year Ended
March 31, | | | Period Ended
March 31, | |
| Class A Shares | | 2010 | | | 2009 | | | 2008 (a) | |
Net Asset Value, Beginning of Period | | $ | 9.08 | | | $ | 16.15 | | | $ | 21.11 | |
| | | |
Income from Investment Operations: | | | | | | | | | | | | |
Net investment loss (b) | | | (0.08 | ) | | | (0.06 | ) | | | (0.05 | ) |
Net realized and unrealized gain (loss) on investments | | | 5.74 | | | | (6.53 | ) | | | (3.43 | ) |
| | | | | | | | | | | | |
Total from investment operations | | | 5.66 | | | | (6.59 | ) | | | (3.48 | ) |
| | | |
Less Distributions to Shareholders: | | | | | | | | | | | | |
From net realized gains | | | — | | | | (0.48 | ) | | | (1.48 | ) |
| | | |
Increase from Regulatory Settlements | | | — | (c) | | | — | (c) | | | — | |
| | | |
Net Asset Value, End of Period | | $ | 14.74 | | | $ | 9.08 | | | $ | 16.15 | |
Total return (d) | | | 62.33 | % | | | (42.02 | )%(e) | | | (17.38 | )%(e)(f)(g) |
| | | |
Ratios to Average Net Assets/Supplemental Data: | | | | | | | | | | | | |
Net expenses before interest expense (h) | | | 1.36 | % | | | 1.36 | % | | | 1.20 | %(i) |
Interest expense (j) | | | — | % | | | — | % | | | — | %(i) |
Net expenses (h) | | | 1.36 | % | | | 1.36 | % | | | 1.20 | %(i) |
Waiver/Reimbursement | | | — | | | | 0.04 | % | | | 0.05 | %(i) |
Net investment loss (h) | | | (0.63 | )% | | | (0.47 | )% | | | (0.67 | )%(i) |
Portfolio turnover rate | | | 73 | % | | | 67 | % | | | 73 | %(f) |
Net assets, end of period (000s) | | $ | 15,281 | | | $ | 6,671 | | | $ | 3,436 | |
| (a) | The Predecessor Fund’s Class A shares commenced operations on September 28, 2007. Per share data and total return reflect activity from that date. |
| (b) | Per share data was calculated using the average shares outstanding during the period. |
| (c) | Rounds to less than $0.01 per share. |
| (d) | Total return at net asset value assuming all distributions reinvested and no initial sales charge or contingent deferred sales charge. |
| (e) | Had the investment advisor and/or any of its affiliates not waived fees or reimbursed a portion of expenses, total return would have been reduced. |
| (g) | Total return includes a voluntary reimbursement by the investment advisor for a realized investment loss due to a trading error. This reimbursement increased total return and net asset value per share by less than 0.01% and less than $0.01, respectively. |
| (h) | The benefits derived from expense reductions had an impact of less than 0.01%. |
| (j) | Rounds to less than 0.01%. |
See Accompanying Notes to Financial Statements.
131
Financial Highlights – Columbia Select Small Cap Fund
Selected data for a share outstanding throughout each period is as follows:
| | | | | | | | | | | | |
| | | Year Ended
March 31, | | | Period Ended
March 31, | |
| Class C Shares | | 2010 | | | 2009 | | | 2008 (a) | |
Net Asset Value, Beginning of Period | | $ | 8.97 | | | $ | 16.10 | | | $ | 21.11 | |
| | | |
Income from Investment Operations: | | | | | | | | | | | | |
Net investment loss (b) | | | (0.16 | ) | | | (0.17 | ) | | | (0.12 | ) |
Net realized and unrealized gain (loss) on investments | | | 5.65 | | | | (6.48 | ) | | | (3.41 | ) |
| | | | | | | | | | | | |
Total from investment operations | | | 5.49 | | | | (6.65 | ) | | | (3.53 | ) |
| | | |
Less Distributions to Shareholders: | | | | | | | | | | | | |
From net realized gains | | | — | | | | (0.48 | ) | | | (1.48 | ) |
| | | |
Increase from Regulatory Settlements | | | — | (c) | | | — | (c) | | | — | |
| | | |
Net Asset Value, End of Period | | $ | 14.46 | | | $ | 8.97 | | | $ | 16.10 | |
Total return (d) | | | 61.20 | % | | | (42.53 | )%(e) | | | (17.63 | )%(e)(f)(g) |
| | | |
Ratios to Average Net Assets/Supplemental Data: | | | | | | | | | | | | |
Net expenses before interest expense (h) | | | 2.11 | % | | | 2.11 | % | | | 1.95 | %(i) |
Interest expense (j) | | | — | % | | | — | % | | | — | %(i) |
Net expenses (h) | | | 2.11 | % | | | 2.11 | % | | | 1.95 | %(i) |
Waiver/Reimbursement | | | — | | | | 0.04 | % | | | 0.05 | %(i) |
Net investment loss (h) | | | (1.34 | )% | | | (1.31 | )% | | | (1.42 | )%(i) |
Portfolio turnover rate | | | 73 | % | | | 67 | % | | | 73 | %(f) |
Net assets, end of period (000s) | | $ | 1,090 | �� | | $ | 1,063 | | | $ | 2,101 | |
| (a) | The Predecessor Fund’s Class C shares commenced operations on September 28, 2007. Per share data and total return reflect activity from that date. |
| (b) | Per share data was calculated using the average shares outstanding during the period. |
| (c) | Rounds to less than $0.01 per share. |
| (d) | Total return at net asset value assuming all distributions reinvested and no contingent deferred sales charge. |
| (e) | Had the investment advisor and/or any of its affiliates not waived fees or reimbursed a portion of expenses, total return would have been reduced. |
| (g) | Total return includes a voluntary reimbursement by the investment advisor for a realized investment loss due to a trading error. This reimbursement increased total return and net asset value per share by less than 0.01% and less than $0.01, respectively. |
| (h) | The benefits derived from expense reductions had an impact of less than 0.01%. |
| (j) | Rounds to less than 0.01%. |
See Accompanying Notes to Financial Statements.
132
Financial Highlights – Columbia Select Small Cap Fund
Selected data for a share outstanding throughout each period is as follows:
| | | | | | | | | | | | | | | | | | | | |
| | | Year Ended March 31, | |
| Class R Shares | | 2010 | | | 2009 | | | 2008 (a) | | | 2007 | | | 2006 (b) | |
Net Asset Value, Beginning of Period | | $ | 8.88 | | | $ | 15.86 | | | $ | 18.98 | | | $ | 19.12 | | | $ | 16.12 | |
| | | | | |
Income from Investment Operations: | | | | | | | | | | | | | | | | | | | | |
Net investment loss (c) | | | (0.10 | ) | | | (0.10 | ) | | | (0.21 | ) | | | (0.22 | ) | | | (0.19 | ) |
Net realized and unrealized gain (loss) on investments | | | 5.60 | | | | (6.40 | ) | | | (1.43 | ) | | | 1.34 | | | | 4.08 | |
| | | | | | | | | | | | | | | | | | | | |
Total from investment operations | | | 5.50 | | | | (6.50 | ) | | | (1.64 | ) | | | 1.12 | | | | 3.89 | |
| | | | | |
Less Distributions to Shareholders: | | | | | | | | | | | | | | | | | | | | |
From net realized gains | | | — | | | | (0.48 | ) | | | (1.48 | ) | | | (1.26 | ) | | | (0.89 | ) |
| | | | | |
Increase from Regulatory Settlements | | | — | (d) | | | — | (d) | | | — | | | | — | | | | — | |
| | | | | |
Net Asset Value, End of Period | | $ | 14.38 | | | $ | 8.88 | | | $ | 15.86 | | | $ | 18.98 | | | $ | 19.12 | |
Total return (e) | | | 61.94 | % | | | (42.22 | )%(f) | | | (9.66 | )%(f)(g) | | | 6.23 | % | | | 24.83 | % |
| | | | | |
Ratios to Average Net Assets/Supplemental Data: | | | | | | | | | | | | | | | | | | | | |
Net expenses before interest expense (h) | | | 1.61 | % | | | 1.61 | % | | | 1.70 | % | | | 1.74 | % | | | 1.56 | % |
Interest expense | | | — | %(i) | | | — | %(i) | | | — | %(i) | | | — | | | | — | |
Net expenses (h) | | | 1.61 | % | | | 1.61 | % | | | 1.70 | % | | | 1.74 | % | | | 1.56 | % |
Waiver/Reimbursement | | | — | | | | 0.04 | % | | | 0.04 | % | | | — | | | | — | |
Net investment loss (h) | | | (0.85 | )% | | | (0.80 | )% | | | (1.13 | )% | | | (1.21 | )% | | | (1.13 | )% |
Portfolio turnover rate | | | 73 | % | | | 67 | % | | | 73 | % | | | 52 | % | | | 65 | % |
Net assets, end of period (000s) | | $ | 9,795 | | | $ | 5,819 | | | $ | 6,881 | | | $ | 1,827 | | | $ | 1 | |
| (a) | On March 31, 2008, Retirement Shares class of Small Cap Fund, a series of Excelsior Funds, Inc., was reorganized into the Fund’s Class R. The financial information of the Fund’s Class R includes the financial information of Small Cap Fund’s Retirement Shares class. |
| (b) | Per share data for the year ended March 31, 2006 were audited by other auditors. |
| (c) | Per share data was calculated using the average shares outstanding during the period. |
| (d) | Rounds to less than $0.01 per share. |
| (e) | Total return at net asset value assuming all distributions reinvested. |
| (f) | Had the investment advisor and/or any of its affiliates not waived fees or reimbursed a portion of expenses, total return would have been reduced. |
| (g) | Total return includes a voluntary reimbursement by the investment advisor for a realized investment loss due to a trading error. This reimbursement increased total return and net asset value per share by less than 0.01% and less than $0.01, respectively. |
| (h) | The benefits derived from expense reductions had an impact of less than 0.01%. |
| (i) | Rounds to less than 0.01%. |
See Accompanying Notes to Financial Statements.
133
Financial Highlights – Columbia Select Small Cap Fund
Selected data for a share outstanding throughout each period is as follows:
| | | | | | | | | | | | | | | | | | | | |
| | | Year Ended March 31, | |
| Class Z Shares | | 2010 | | | 2009 | | | 2008 (a) | | | 2007 | | | 2006 (b) | |
Net Asset Value, Beginning of Period | | $ | 9.10 | | | $ | 16.15 | | | $ | 19.21 | | | $ | 19.23 | | | $ | 16.14 | |
| | | | | |
Income from Investment Operations: | | | | | | | | | | | | | | | | | | | | |
Net investment loss (c) | | | (0.05 | ) | | | (0.04 | ) | | | (0.12 | ) | | | (0.12 | ) | | | (0.11 | ) |
Net realized and unrealized gain (loss) on investments | | | 5.76 | | | | (6.53 | ) | | | (1.46 | ) | | | 1.36 | | | | 4.09 | |
| | | | | | | | | | | | | | | | | | | | |
Total from investment operations | | | 5.71 | | | | (6.57 | ) | | | (1.58 | ) | | | 1.24 | | | | 3.98 | |
| | | | | |
Less Distributions to Shareholders: | | | | | | | | | | | | | | | | | | | | |
From net realized gains | | | — | | | | (0.48 | ) | | | (1.48 | ) | | | (1.26 | ) | | | (0.89 | ) |
| | | | | |
Increase from Regulatory Settlements | | | — | (d) | | | — | (d) | | | — | | | | — | | | | — | |
| | | | | |
Net Asset Value, End of Period | | $ | 14.81 | | | $ | 9.10 | | | $ | 16.15 | | | $ | 19.21 | | | $ | 19.23 | |
Total return (e) | | | 62.75 | % | | | (41.89 | )%(f) | | | (9.22 | )%(f)(g) | | | 6.83 | % | | | 25.37 | %(f) |
| | | | | |
Ratios to Average Net Assets/Supplemental Data: | | | | | | | | | | | | | | | | | | | | |
Net expenses before interest expense (h) | | | 1.11 | % | | | 1.11 | % | | | 1.20 | % | | | 1.22 | % | | | 1.09 | % |
Interest expense | | | — | %(i) | | | — | %(i) | | | — | %(i) | | | — | | | | — | |
Net expenses (h) | | | 1.11 | % | | | 1.11 | % | | | 1.20 | % | | | 1.22 | % | | | 1.09 | % |
Waiver/Reimbursement | | | — | | | | 0.04 | % | | | 0.04 | % | | | — | | | | 0.02 | % |
Net investment loss (h) | | | (0.36 | )% | | | (0.31 | )% | | | (0.63 | )% | | | (0.66 | )% | | | (0.64 | )% |
Portfolio turnover rate | | | 73 | % | | | 67 | % | | | 73 | % | | | 52 | % | | | 65 | % |
Net assets, end of period (000s) | | $ | 597,804 | | | $ | 321,684 | | | $ | 676,616 | | | $ | 694,765 | | | $ | 599,389 | |
| (a) | On March 31, 2008, Shares class Cap of Small Cap Fund, a series of Excelsior Funds Inc., was reorganized into the Fund’s Class Z. The financial information of the Fund’s Class Z includes the financial information of Small Cap Fund’s Share class. |
| (b) | Per share data for the year ended March 31, 2006 were audited by other auditors. |
| (c) | Per share data was calculated using the average shares outstanding during the period. |
| (d) | Rounds to less than $0.01 per share. |
| (e) | Total return at net asset value assuming all distributions reinvested. |
| (f) | Had the investment advisor and/or any of its affiliates not waived fees or reimbursed a portion of expenses, total return would have been reduced. |
| (g) | Total return includes a voluntary reimbursement by the investment advisor for a realized investment loss due to a trading error. This reimbursement increased total return and net asset value per share by less than 0.01% and less than $0.01, respectively. |
| (h) | The benefits derived from expense reductions had an impact of less than 0.01%. |
| (i) | Rounds to less than 0.01%. |
See Accompanying Notes to Financial Statements.
134
Financial Highlights – Columbia Value and Restructuring Fund
Selected data for a share outstanding throughout each period is as follows:
| | | | | | | | | | | | |
| | | Year Ended
March 31, | | | Period Ended
March 31, | |
| Class A Shares | | 2010 | | | 2009 | | | 2008 (a) | |
Net Asset Value, Beginning of Period | | $ | 26.51 | | | $ | 52.25 | | | $ | 58.58 | |
| | | |
Income from Investment Operations: | | | | | | | | | | | | |
Net investment income (b) | | | 0.39 | (j) | | | 0.51 | | | | 0.24 | |
Net realized and unrealized gain (loss) on investments, foreign currency and written options | | | 18.16 | | | | (25.72 | ) | | | (5.70 | ) |
| | | | | | | | | | | | |
Total from investment operations | | | 18.55 | | | | (25.21 | ) | | | (5.46 | ) |
| | | |
Less Distributions to Shareholders: | | | | | | | | | | | | |
From net investment income | | | (0.38 | ) | | | (0.51 | ) | | | (0.36 | ) |
From net realized gains | | | — | | | | (0.02 | ) | | | (0.51 | ) |
| | | | | | | | | | | | |
Total distributions to shareholders | | | (0.38 | ) | | | (0.53 | ) | | | (0.87 | ) |
| | | |
Increase from Regulatory Settlements | | | — | (c) | | | — | (c) | | | — | |
| | | |
Net Asset Value, End of Period | | $ | 44.68 | | | $ | 26.51 | | | $ | 52.25 | |
Total return (d) | | | 70.25 | % | | | (48.51 | )%(e) | | | (9.41 | )%(e)(f) |
| | | |
Ratios to Average Net Assets/Supplemental Data: | | | | | | | | | | | | |
Net expenses before interest expense (g) | | | 1.14 | % | | | 1.14 | % | | | 1.02 | %(h) |
Interest expense | | | — | %(i) | | | — | %(i) | | | — | |
Net expenses (g) | | | 1.14 | % | | | 1.14 | % | | | 1.02 | %(h) |
Waiver/Reimbursement | | | — | | | | 0.04 | % | | | 0.05 | %(h) |
Net investment income (g) | | | 1.01 | % | | | 1.35 | % | | | 0.83 | %(h) |
Portfolio turnover rate | | | 6 | % | | | 12 | % | | | 11 | %(f) |
Net assets, end of period (000s) | | $ | 291,655 | | | $ | 163,338 | | | $ | 77,209 | |
| (a) | The Predecessor Fund’s Class A shares commenced operations on September 28, 2007. Per share data and total return reflect activity from that date. |
| (b) | Per share data was calculated using the average shares outstanding during the period. |
| (c) | Rounds to less than $0.01 per share. |
| (d) | Total return at net asset value assuming all distributions reinvested and no initial sales charge or contingent deferred sales charge. |
| (e) | Had the investment advisor and/or any of its affiliates not waived fees or reimbursed a portion of expenses, total return would have been reduced. |
| (g) | The benefits derived from expense reductions had an impact of less than 0.01%. |
| (i) | Rounds to less than 0.01%. |
| (j) | Net investment income per share reflects a special dividend. The effect of this dividend amounted to $0.04 per share. |
See Accompanying Notes to Financial Statements.
135
Financial Highlights – Columbia Value and Restructuring Fund
Selected data for a share outstanding throughout each period is as follows:
| | | | | | | | | | | | |
| | | Year Ended
March 31, | | | Period Ended
March 31, | |
| Class C Shares | | 2010 | | | 2009 | | | 2008 (a) | |
Net Asset Value, Beginning of Period | | $ | 26.51 | | | $ | 52.23 | | | $ | 58.58 | |
| | | |
Income from Investment Operations: | | | | | | | | | | | | |
Net investment income (b) | | | 0.10 | (j) | | | 0.23 | | | | 0.04 | |
Net realized and unrealized gain (loss) on investments, foreign currency and written options | | | 18.16 | | | | (25.73 | ) | | | (5.68 | ) |
| | | | | | | | | | | | |
Total from investment operations | | | 18.26 | | | | (25.50 | ) | | | (5.64 | ) |
| | | |
Less Distributions to Shareholders: | | | | | | | | | | | | |
From net investment income | | | (0.17 | ) | | | (0.20 | ) | | | (0.20 | ) |
From net realized gains | | | — | | | | (0.02 | ) | | | (0.51 | ) |
| | | | | | | | | | | | |
Total distributions to shareholders | | | (0.17 | ) | | | (0.22 | ) | | | (0.71 | ) |
| | | |
Increase from Regulatory Settlements | | | — | (c) | | | — | (c) | | | — | |
| | | |
Net Asset Value, End of Period | | $ | 44.60 | | | $ | 26.51 | | | $ | 52.23 | |
Total return (d) | | | 69.00 | % | | | (48.89 | )%(e) | | | (9.72 | )%(e)(f) |
| | | |
Ratios to Average Net Assets/Supplemental Data: | | | | | | | | | | | | |
Net expenses before interest expense (g) | | | 1.89 | % | | | 1.89 | % | | | 1.77 | %(h) |
Interest expense | | | — | %(i) | | | — | %(i) | | | — | |
Net expenses (g) | | | 1.89 | % | | | 1.89 | % | | | 1.77 | %(h) |
Waiver/Reimbursement | | | — | | | | 0.04 | % | | | 0.05 | %(h) |
Net investment income (g) | | | 0.26 | % | | | 0.63 | % | | | 0.07 | %(h) |
Portfolio turnover rate | | | 6 | % | | | 12 | % | | | 11 | %(f) |
Net assets, end of period (000s) | | $ | 74,880 | | | $ | 40,380 | | | $ | 13,665 | |
| (a) | The Predecessor Fund’s Class C shares commenced operations on September 28, 2007. Per share data and total return reflect activity from that date. |
| (b) | Per share data was calculated using the average shares outstanding during the period. |
| (c) | Rounds to less than $0.01 per share. |
| (d) | Total return at net asset value assuming all distributions reinvested and no contingent deferred sales charge. |
| (e) | Had the investment advisor and/or any of its affiliates not waived fees or reimbursed a portion of expenses, total return would have been reduced. |
| (g) | The benefits derived from expense reductions had an impact of less than 0.01%. |
| (i) | Rounds to less than 0.01%. |
| (j) | Net investment income per share reflects a special dividend. The effect of this dividend amounted to $0.04 per share. |
See Accompanying Notes to Financial Statements.
136
Financial Highlights – Columbia Value and Restructuring Fund
Selected data for a share outstanding throughout each period is as follows:
| | | | | | | | | | | | | | | | | | | | |
| | | Year Ended March 31, | |
| Class R Shares | | 2010 | | | 2009 | | | 2008 (a) | | | 2007 | | | 2006 (b) | |
Net Asset Value, Beginning of Period | | $ | 26.50 | | | $ | 52.23 | | | $ | 54.30 | | | $ | 49.35 | | | $ | 41.49 | |
| | | | | |
Income from Investment Operations: | | | | | | | | | | | | | | | | | | | | |
Net investment income (c) | | | 0.30 | (i) | | | 0.41 | | | | 0.33 | | | | 0.22 | | | | 0.42 | |
Net realized and unrealized gain (loss) on investments, foreign currency and written options | | | 18.14 | | | | (25.72 | ) | | | (1.41 | ) | | | 4.98 | | | | 7.81 | |
| | | | | | | | | | | | | | | | | | | | |
Total from investment operations | | | 18.44 | | | | (25.31 | ) | | | (1.08 | ) | | | 5.20 | | | | 8.23 | |
| | | | | |
Less Distributions to Shareholders: | | | | | | | | | | | | | | | | | | | | |
From net investment income | | | (0.30 | ) | | | (0.40 | ) | | | (0.48 | ) | | | (0.25 | ) | | | (0.37 | ) |
From net realized gains | | | — | | | | (0.02 | ) | | | (0.51 | ) | | | — | | | | — | |
| | | | | | | | | | | | | | | | | | | | |
Total distributions to shareholders | | | (0.30 | ) | | | (0.42 | ) | | | (0.99 | ) | | | (0.25 | ) | | | (0.37 | ) |
| | | | | |
Increase from Regulatory Settlements | | | — | (d) | | | — | (d) | | | — | | | | — | | | | — | |
| | | | | |
Net Asset Value, End of Period | | $ | 44.64 | | | $ | 26.50 | | | $ | 52.23 | | | $ | 54.30 | | | $ | 49.35 | |
Total return (e) | | | 69.84 | % | | | (48.65 | )%(f) | | | (2.11 | )%(f) | | | 10.58 | % | | | 19.95 | % |
| | | | | |
Ratios to Average Net Assets/Supplemental Data: | | | | | | | | | | | | | | | | | | | | |
Net expenses before interest expense (g) | | | 1.39 | % | | | 1.39 | % | | | 1.35 | % | | | 1.55 | % | | | 1.56 | % |
Interest expense | | | — | %(h) | | | — | %(h) | | | — | | | | — | | | | — | |
Net expenses (g) | | | 1.39 | % | | | 1.39 | % | | | 1.35 | % | | | 1.55 | % | | | 1.56 | % |
Waiver/Reimbursement | | | — | | | | 0.04 | % | | | 0.04 | % | | | — | | | | — | |
Net investment income (g) | | | 0.78 | % | | | 1.05 | % | | | 0.60 | % | | | 0.43 | % | | | 0.90 | % |
Portfolio turnover rate | | | 6 | % | | | 12 | % | | | 11 | % | | | 13 | % | | | 12 | % |
Net assets, end of period (000s) | | $ | 58,120 | | | $ | 37,637 | | | $ | 33,826 | | | $ | 2,926 | | | $ | 896 | |
| (a) | On March 31, 2008, Retirement Shares class of Value and Restructuring Fund, a series of Excelsior Funds, Inc., was reorganized into the Fund’s Class R. The financial information of the Fund’s Class R includes the financial information of Value and Restructuring Fund’s Retirement Shares class. |
| (b) | Per share data for the years ended March 31, 2006 was audited by other auditors. |
| (c) | Per share data was calculated using the average shares outstanding during the period. |
| (d) | Rounds to less than $0.01 per share. |
| (e) | Total return at net asset value assuming all distributions reinvested. |
| (f) | Had the investment advisor and/or any of its affiliates not waived fees or reimbursed a portion of expenses, total return would have been reduced. |
| (g) | The benefits derived from expense reductions had an impact of less than 0.01%. |
| (h) | Rounds to less than 0.01%. |
| (i) | Net investment income per share reflects a special dividend. The effect of this dividend amounted to $0.04 per share. |
See Accompanying Notes to Financial Statements.
137
Financial Highlights – Columbia Value and Restructuring Fund
Selected data for a share outstanding throughout each period is as follows:
| | | | | | | | | | | | | | | | | | | | |
| | | Year Ended March 31, | |
| Class Z Shares | | 2010 | | | 2009 | | | 2008 (a)(b) | | | 2007 | | | 2006 (c) | |
Net Asset Value, Beginning of Period | | $ | 26.49 | | | $ | 52.22 | | | $ | 54.33 | | | $ | 49.36 | | | $ | 41.40 | |
| | | | | |
Income from Investment Operations: | | | | | | | | | | | | | | | | | | | | |
Net investment income (d) | | | 0.49 | (j) | | | 0.61 | | | | 0.60 | | | | 0.45 | | | | 0.53 | |
Net realized and unrealized gain (loss) on investments, foreign currency and written options | | | 18.15 | | | | (25.71 | ) | | | (1.47 | ) | | | 5.00 | | | | 7.88 | |
| | | | | | | | | | | | | | | | | | | | |
Total from investment operations | | | 18.64 | | | | (25.10 | ) | | | (0.87 | ) | | | 5.45 | | | | 8.41 | |
| | | | | |
Less Distributions to Shareholders: | | | | | | | | | | | | | | | | | | | | |
From net investment income | | | (0.47 | ) | | | (0.61 | ) | | | (0.73 | ) | | | (0.48 | ) | | | (0.45 | ) |
From net realized gains | | | — | | | | (0.02 | ) | | | (0.51 | ) | | | — | | | | — | |
| | | | | | | | | | | | | | | | | | | | |
Total distributions to shareholders | | | (0.47 | ) | | | (0.63 | ) | | | (1.24 | ) | | | (0.48 | ) | | | (0.45 | ) |
| | | | | |
Increase from Regulatory Settlements | | | — | (e) | | | — | (e) | | | — | | | | — | | | | — | |
| | | | | |
Net Asset Value, End of Period | | $ | 44.66 | | | $ | 26.49 | | | $ | 52.22 | | | $ | 54.33 | | | $ | 49.36 | |
Total return (f) | | | 70.71 | % | | | (48.39 | )%(g) | | | (1.74 | )%(g) | | | 11.14 | % | | | 20.45 | % |
| | | | | |
Ratios to Average Net Assets/Supplemental Data: | | | | | | | | | | | | | | | | | | | | |
Net expenses before interest expense (h) | | | 0.89 | % | | | 0.89 | % | | | 1.02 | % | | | 1.05 | % | | | 1.05 | % |
Interest expense | | | — | %(i) | | | — | %(i) | | | — | | | | — | | | | — | |
Net expenses (h) | | | 0.89 | % | | | 0.89 | % | | | 1.02 | % | | | 1.05 | % | | | 1.05 | % |
Waiver/Reimbursement | | | — | | | | 0.04 | % | | | 0.04 | % | | | — | | | | — | |
Net investment income (h) | | | 1.28 | % | | | 1.47 | % | | | 1.07 | % | | | 0.90 | % | | | 1.18 | % |
Portfolio turnover rate | | | 6 | % | | | 12 | % | | | 11 | % | | | 13 | % | | | 12 | % |
Net assets, end of period (000s) | | $ | 6,765,345 | | | $ | 4,352,176 | | | $ | 8,980,358 | | | $ | 7,767,713 | | | $ | 6,230,754 | |
| (a) | On March 31, 2008, Shares class of Value and Restructuring Fund, a series of Excelsior Funds, Inc., was reorganized into the Fund’s Class Z. The financial information of the Fund’s Class Z includes the financial information of Value and Restructuring Fund’s Shares class. |
| (b) | On March 31, 2008, Value and Restructuring Fund’s Institutional Shares class was reorganized into the Fund’s Class Z. |
| (c) | Per share data for the year ended March 31, 2006 was audited by other auditors. |
| (d) | Per share data was calculated using the average shares outstanding during the period. |
| (e) | Rounds to less than $0.01 per share. |
| (f) | Total return at net asset value assuming all distributions reinvested. |
| (g) | Had the investment advisor and/or any of its affiliates not waived fees or reimbursed a portion of expenses, total return would have been reduced. |
| (h) | The benefits derived from expense reductions had an impact of less than 0.01%. |
| (i) | Rounds to less than 0.01%. |
| (j) | Net investment income per share reflects a special dividend. The effect of this dividend amounted to $0.04 per share. |
See Accompanying Notes to Financial Statements.
138
Financial Highlights – Columbia Emerging Markets Fund
Selected data for a share outstanding throughout each period is as follows:
| | | | | | | | | | | | |
| | | Year Ended
March 31, | | | Period Ended
March 31, | |
| Class A Shares | | 2010 | | | 2009 | | | 2008 (a) | |
Net Asset Value, Beginning of Period | | $ | 6.42 | | | $ | 14.96 | | | $ | 17.77 | |
| | | |
Income from Investment Operations: | | | | | | | | | | | | |
Net investment income (loss) (b) | | | (0.01 | ) | | | 0.07 | | | | 0.04 | (c) |
Net realized and unrealized gain (loss) on investments, foreign currency and foreign capital gains tax | | | 5.00 | | | | (6.36 | ) | | | (1.63 | ) |
| | | | | | | | | | | | |
Total from investment operations | | | 4.99 | | | | (6.29 | ) | | | (1.59 | ) |
| | | |
Less Distributions to Shareholders: | | | | | | | | | | | | |
From net investment income | | | (0.14 | ) | | | — | | | | (0.06 | ) |
From net realized gains | | | — | | | | (2.26 | ) | | | (1.16 | ) |
| | | | | | | | | | | | |
Total distributions to shareholders | | | (0.14 | ) | | | (2.26 | ) | | | (1.22 | ) |
| | | |
Redemption Fees: | | | | | | | | | | | | |
Redemption fees added to paid-in-capital (b) | | | — | (d) | | | 0.01 | | | | — | (d) |
| | | |
Net Asset Value, End of Period | | $ | 11.27 | | | $ | 6.42 | | | $ | 14.96 | |
Total return (e)(f) | | | 78.17 | % | | | (49.44 | )% | | | (9.80 | )%(g) |
| | | |
Ratios to Average Net Assets/Supplemental Data: | | | | | | | | | | | | |
Net expenses before interest expense (h) | | | 1.74 | % | | | 1.95 | % | | | 1.85 | %(i) |
Interest expense | | | — | %(j) | | | 0.01 | % | | | — | %(i)(j) |
Net expenses (h) | | | 1.74 | % | | | 1.96 | % | | | 1.85 | %(i) |
Waiver/Reimbursement | | | 0.03 | % | | | 0.18 | % | | | 0.05 | %(i) |
Net investment income (loss) (h) | | | (0.12 | )% | | | 0.71 | % | | | 0.46 | %(i) |
Portfolio turnover rate | | | 74 | % | | | 82 | % | | | 29 | %(g) |
Net assets, end of period (000s) | | $ | 6,362 | | | $ | 917 | | | $ | 1,231 | |
| (a) | The Predecessor Fund’s Class A shares commenced operations on September 28, 2007. Per share data and total return reflect activity from that date. |
| (b) | Per share data was calculated using the average shares outstanding during the period. |
| (c) | Net investment income per share reflects special dividends. The effect of these dividends amounted to $0.03 per share. |
| (d) | Rounds to less than $0.01 per share. |
| (e) | Had the investment advisor and/or any of its affiliates not waived fees or reimbursed a portion of expenses, total return would have been reduced. |
| (f) | Total return at net asset value assuming all distributions reinvested and no initial sales charge or contingent deferred sales charge. |
| (h) | The benefits derived from expense reductions had an impact of less than 0.01%. |
| (j) | Rounds to less than 0.01%. |
See Accompanying Notes to Financial Statements.
139
Financial Highlights – Columbia Emerging Markets Fund
Selected data for a share outstanding throughout each period is as follows:
| | | | | | | | | | | | |
| | | Year Ended
March 31, | | | Period Ended
March 31, | |
| Class C Shares | | 2010 | | | 2009 | | | 2008 (a) | |
Net Asset Value, Beginning of Period | | $ | 6.36 | | | $ | 14.94 | | | $ | 17.77 | |
| | | |
Income from Investment Operations: | | | | | | | | | | | | |
Net investment income (loss) (b) | | | (0.09 | ) | | | — | (c) | | | (0.04 | )(d) |
Net realized and unrealized gain (loss) on investments, foreign currency and foreign capital gains tax | | | 4.97 | | | | (6.33 | ) | | | (1.61 | ) |
| | | | | | | | | | | | |
Total from investment operations | | | 4.88 | | | | (6.33 | ) | | | (1.65 | ) |
| | | |
Less Distributions to Shareholders: | | | | | | | | | | | | |
From net investment income | | | (0.03 | ) | | | — | | | | (0.02 | ) |
From net realized gains | | | — | | | | (2.26 | ) | | | (1.16 | ) |
| | | | | | | | | | | | |
Total distributions to shareholders | | | (0.03 | ) | | | (2.26 | ) | | | (1.18 | ) |
| | | |
Redemption Fees: | | | | | | | | | | | | |
Redemption fees added to paid-in-capital (b) | | | — | (c) | | | 0.01 | | | | — | (c) |
| | | |
Net Asset Value, End of Period | | $ | 11.21 | | | $ | 6.36 | | | $ | 14.94 | |
Total return (e)(f) | | | 76.73 | % | | | (49.82 | )% | | | (10.11 | )%(g) |
| | | |
Ratios to Average Net Assets/Supplemental Data: | | | | | | | | | | | | |
Net expenses before interest expense (h) | | | 2.49 | % | | | 2.70 | % | | | 2.60 | %(i) |
Interest expense | | | — | %(j) | | | 0.01 | % | | | — | %(i)(j) |
Net expenses (h) | | | 2.49 | % | | | 2.71 | % | | | 2.60 | %(i) |
Waiver/Reimbursement | | | 0.03 | % | | | 0.18 | % | | | 0.05 | %(i) |
Net investment loss (h) | | | (0.86 | )% | | | (0.01 | )% | | | (0.44 | )%(i) |
Portfolio turnover rate | | | 74 | % | | | 82 | % | | | 29 | %(g) |
Net assets, end of period (000s) | | $ | 1,540 | | | $ | 242 | | | $ | 458 | |
| (a) | The Predecessor Fund’s Class C shares commenced operations on September 28, 2007. Per share data and total return reflect activity from that date. |
| (b) | Per share data was calculated using the average shares outstanding during the period. |
| (c) | Rounds to less than $0.01 per share. |
| (d) | Net investment income per share reflects special dividends. The effect of these dividends amounted to $0.03 per share. |
| (e) | Had the investment advisor and/or any of its affiliates not waived fees or reimbursed a portion of expenses, total return would have been reduced. |
| (f) | Total return at net asset value assuming all distributions reinvested and no contingent deferred sales charge. |
| (h) | The benefits derived from expense reductions had an impact of less than 0.01%. |
| (j) | Rounds to less than 0.01%. |
See Accompanying Notes to Financial Statements.
140
Financial Highlights – Columbia Emerging Markets Fund
Selected data for a share outstanding throughout each period is as follows:
| | | | | | | | | | | | | | | | | | | | |
| | | Year Ended March 31, | |
| Class Z Shares | | 2010 | | | 2009 | | | 2008 (a)(b) | | | 2007 | | | 2006 (c) | |
Net Asset Value, Beginning of Period | | $ | 6.42 | | | $ | 14.94 | | | $ | 14.06 | | | $ | 12.60 | | | $ | 8.73 | |
| | | | | |
Income from Investment Operations: | | | | | | | | | | | | | | | | | | | | |
Net investment income (d) | | | 0.05 | | | | 0.11 | | | | 0.12 | (e) | | | 0.07 | | | | 0.10 | |
Net realized and unrealized gain (loss) on investments, foreign currency and foreign capital gains tax | | | 4.97 | | | | (6.38 | ) | | | 2.04 | | | | 2.16 | | | | 3.87 | |
| | | | | | | | | | | | | | | | | | | | |
Total from investment operations | | | 5.02 | | | | (6.27 | ) | | | 2.16 | | | | 2.23 | | | | 3.97 | |
| | | | | |
Less Distributions to Shareholders: | | | | | | | | | | | | | | | | | | | | |
From net investment income | | | (0.18 | ) | | | — | | | | (0.12 | ) | | | (0.08 | ) | | | (0.10 | ) |
From net realized gains | | | — | | | | (2.26 | ) | | | (1.16 | ) | | | (0.69 | ) | | | — | |
| | | | | | | | | | | | | | | | | | | | |
Total distributions to shareholders | | | (0.18 | ) | | | (2.26 | ) | | | (1.28 | ) | | | (0.77 | ) | | | (0.10 | ) |
| | | | | |
Redemption Fees: | | | | | | | | | | | | | | | | | | | | |
Redemption fees added to paid-in-capital (d) | | | — | (f) | | | 0.01 | | | | — | (f) | | | — | (f) | | | — | (f) |
| | | | | |
Net Asset Value, End of Period | | $ | 11.26 | | | $ | 6.42 | | | $ | 14.94 | | | $ | 14.06 | | | $ | 12.60 | |
Total return (g)(h) | | | 78.84 | % | | | (49.37 | )% | | | 14.31 | % | | | 17.98 | % | | | 45.85 | % |
| | | | | |
Ratios to Average Net Assets/Supplemental Data: | | | | | | | | | | | | | | | | | | | | |
Net expenses before interest expense (i) | | | 1.49 | % | | | 1.70 | % | | | 1.85 | % | | | 1.85 | % | | | 1.81 | % |
Interest expense | | | — | %(j) | | | 0.01 | % | | | — | %(j) | | | — | | | | — | |
Net expenses (i) | | | 1.49 | % | | | 1.71 | % | | | 1.85 | % | | | 1.85 | % | | | 1.81 | % |
Waiver/Reimbursement | | | 0.03 | % | | | 0.18 | % | | | 0.04 | % | | | 0.05 | % | | | 0.11 | % |
Net investment income (i) | | | 0.47 | % | | | 1.01 | % | | | 0.73 | % | | | 0.50 | % | | | 1.00 | % |
Portfolio turnover rate | | | 74 | % | | | 82 | % | | | 29 | % | | | 16 | % | | | 7 | % |
Net assets, end of period (000s) | | $ | 396,849 | | | $ | 237,412 | | | $ | 1,014,715 | | | $ | 1,092,481 | | | $ | 996,666 | |
| (a) | On March 31, 2008, Shares class of Emerging Markets Fund, a series of Excelsior Funds, Inc., was reorganized into the Fund’s Class Z. The financial information of the Fund’s Class Z includes the financial information of Emerging Markets Fund’s Shares class. |
| (b) | On March 31, 2008, Emerging Markets Fund’s Institutional Shares class was reorganized into the Fund’s Class Z. |
| (c) | Per share data for the year ended March 31, 2006 was audited by other auditors. |
| (d) | Per share data was calculated using the average shares outstanding during the period. |
| (e) | Net investment income per share reflects special dividends. The effect of these dividends amounted to $0.03 per share. |
| (f) | Rounds to less than $0.01 per share. |
| (g) | Had the investment advisor and/or any of its affiliates not waived fees or reimbursed a portion of expenses, total return would have been reduced. |
| (h) | Total return at net asset value assuming all distributions reinvested. |
| (i) | The benefits derived from expense reductions had an impact of less than 0.01%. |
| (j) | Rounds to less than 0.01%. |
See Accompanying Notes to Financial Statements.
141
Financial Highlights – Columbia International Growth Fund
Selected data for a share outstanding throughout each period is as follows:
| | | | | | | | | | | | |
| | | Year Ended
March 31, | | | Period Ended
March 31, | |
| Class A Shares | | 2010 | | | 2009 | | | 2008 (a) | |
Net Asset Value, Beginning of Period | | $ | 9.18 | | | $ | 18.80 | | | $ | 18.80 | |
| | | |
Income from Investment Operations: | | | | | | | | | | | | |
Net investment income (b) | | | 0.13 | | | | 0.13 | | | | — | (c) |
Net realized and unrealized gain (loss) on investments, foreign currency, written options and foreign capital gains tax | | | 4.10 | | | | (8.58 | ) | | | — | (c) |
| | | | | | | | | | | | |
Total from investment operations | | | 4.23 | | | | (8.45 | ) | | | — | (c) |
| | | |
Less Distributions to Shareholders: | | | | | | | | | | | | |
From net investment income | | | (0.09 | ) | | | (0.04 | ) | | | — | |
From net realized gains | | | — | | | | (1.13 | ) | | | — | |
| | | | | | | | | | | | |
Total distributions to shareholders | | | (0.09 | ) | | | (1.17 | ) | | | — | |
| | | |
Redemption Fees: | | | | | | | | | | | | |
Redemption fees added to paid-in-capital (b)(c) | | | — | | | | — | | | | — | |
| | | |
Increase from Regulatory Settlements | | | — | (c) | | | — | (c) | | | — | |
| | | |
Net Asset Value, End of Period | | $ | 13.32 | | | $ | 9.18 | | | $ | 18.80 | |
Total return (d)(e) | | | 46.30 | % | | | (47.91 | )% | | | 0.00 | %(f) |
| | | |
Ratios to Average Net Assets/Supplemental Data: | | | | | | | | | | | | |
Net expenses before interest expense | | | 1.51 | % | | | 1.68 | %(g) | | | 1.75 | %(g)(i) |
Interest expense | | | — | %(h) | | | 0.01 | % | | | — | %(h)(i) |
Net expenses | | | 1.51 | % | | | 1.69 | %(g) | | | 1.75 | %(g)(i) |
Waiver/Reimbursement | | | 0.09 | % | | | 0.04 | % | | | 0.06 | %(i) |
Net investment income (loss) | | | 1.08 | % | | | 1.21 | %(g) | | | (1.75 | )%(g)(i) |
Portfolio turnover rate | | | 111 | % | | | 133 | % | | | 68 | %(f) |
Net assets, end of period (000s) | | $ | 396 | | | $ | 226 | | | $ | 10 | |
| (a) | Class A shares commenced operations on March 31, 2008. Per share data and total return reflect activity from that date. |
| (b) | Per share data was calculated using the average shares outstanding during the period. |
| (c) | Rounds to less than $0.01 per share. |
| (d) | Had the investment advisor and/or any of its affiliates not waived fees or reimbursed a portion of expenses, total return would have been reduced. |
| (e) | Total return at net asset value assuming all distributions reinvested and no initial sales charge or contingent deferred sales charge. |
| (g) | The benefits derived from custody credits had an impact of less than 0.01%. |
| (h) | Rounds to less than 0.01%. |
See Accompanying Notes to Financial Statements.
142
Financial Highlights – Columbia International Growth Fund
Selected data for a share outstanding throughout each period is as follows:
| | | | | | | | | | | | |
| | | Year Ended
March 31, | | | Period Ended
March 31, | |
| Class C Shares | | 2010 | | | 2009 | | | 2008 (a) | |
Net Asset Value, Beginning of Period | | $ | 9.11 | | | $ | 18.80 | | | $ | 18.80 | |
| | | |
Income from Investment Operations: | | | | | | | | | | | | |
Net investment income (b) | | | 0.05 | | | | 0.12 | | | | — | (c) |
Net realized and unrealized gain (loss) on investments, foreign currency, written options and foreign capital gains tax | | | 4.07 | | | | (8.64 | ) | | | — | (c) |
| | | | | | | | | | | | |
Total from investment operations | | | 4.12 | | | | (8.52 | ) | | | — | (c) |
| | | |
Less Distributions to Shareholders: | | | | | | | | | | | | |
From net investment income | | | — | | | | (0.04 | ) | | | — | |
From net realized gains | | | — | | | | (1.13 | ) | | | — | |
| | | | | | | | | | | | |
Total distributions to shareholders | | | — | | | | (1.17 | ) | | | — | |
| | | |
Redemption Fees: | | | | | | | | | | | | |
Redemption fees added to paid-in-capital (b)(c) | | | — | | | | — | | | | — | |
| | | |
Increase from Regulatory Settlements | | | — | (c) | | | — | (c) | | | — | |
| | | |
Net Asset Value, End of Period | | $ | 13.23 | | | $ | 9.11 | | | $ | 18.80 | |
Total return (d)(e) | | | 45.23 | % | | | (48.31 | )% | | | 0.00 | %(f) |
| | | |
Ratios to Average Net Assets/Supplemental Data: | | | | | | | | | | | | |
Net expenses before interest expense | | | 2.26 | % | | | 2.43 | %(g) | | | 2.50 | %(g)(i) |
Interest expense | | | — | %(h) | | | 0.01 | % | | | — | %(h)(i) |
Net expenses | | | 2.26 | % | | | 2.44 | %(g) | | | 2.50 | %(g)(i) |
Waiver/Reimbursement | | | 0.09 | % | | | 0.04 | % | | | 0.06 | %(i) |
Net investment income (loss) | | | 0.38 | % | | | 1.16 | %(g) | | | (2.50 | )%(g)(i) |
Portfolio turnover rate | | | 111 | % | | | 133 | % | | | 68 | %(f) |
Net assets, end of period (000s) | | $ | 250 | | | $ | 157 | | | $ | 10 | |
| (a) | Class C shares commenced operations on March 31, 2008. Per share data and total return reflect activity from that date. |
| (b) | Per share data was calculated using the average shares outstanding during the period. |
| (c) | Rounds to less than $0.01 per share. |
| (d) | Had the investment advisor and/or any of its affiliates not waived fees or reimbursed a portion of expenses, total return would have been reduced. |
| (e) | Total return at net asset value assuming all distributions reinvested and no contingent deferred sales charge. |
| (g) | The benefits derived from custody credits had an impact of less than 0.01%. |
| (h) | Rounds to less than 0.01%. |
See Accompanying Notes to Financial Statements.
143
Financial Highlights – Columbia International Growth Fund
Selected data for a share outstanding throughout each period is as follows:
| | | | | | | | | | | | | | | | | | | | |
| | | Year Ended March 31, | |
| Class Z Shares | | 2010 | | | 2009 | | | 2008 (a) | | | 2007 | | | 2006 (b) | |
Net Asset Value, Beginning of Period | | $ | 9.20 | | | $ | 18.80 | | | $ | 19.06 | | | $ | 16.51 | | | $ | 13.05 | |
| | | | | |
Income from Investment Operations: | | | | | | | | | | | | | | | | | | | | |
Net investment income (c) | | | 0.19 | | | | 0.26 | | | | 0.12 | (d) | | | 0.09 | | | | 0.07 | |
Net realized and unrealized gain (loss) on investments, foreign currency, written options and foreign capital gains tax | | | 4.10 | | | | (8.69 | ) | | | (0.30 | ) | | | 2.54 | | | | 3.51 | |
| | | | | | | | | | | | | | | | | | | | |
Total from investment operations | | | 4.29 | | | | (8.43 | ) | | | (0.18 | ) | | | 2.63 | | | | 3.58 | |
| | | | | |
Less Distributions to Shareholders: | | | | | | | | | | | | | | | | | | | | |
From net investment income | | | (0.12 | ) | | | (0.04 | ) | | | (0.08 | ) | | | (0.08 | ) | | | (0.12 | ) |
From net realized gains | | | — | | | | (1.13 | ) | | | — | | | | — | | | | — | |
| | | | | | | | | | | | | | | | | | | | |
Total distributions to shareholders | | | (0.12 | ) | | | (1.17 | ) | | | (0.08 | ) | | | (0.08 | ) | | | (0.12 | ) |
| | | | | |
Redemption Fees: | | | | | | | | | | | | | | | | | | | | |
Redemption fees added to paid-in-capital (c)(e) | | | — | | | | — | | | | — | | | | — | | | | — | |
| | | | | |
Increase from Regulatory Settlements | | | — | (e) | | | — | (e) | | | — | | | | — | | | | — | |
| | | | | |
Net Asset Value, End of Period | | $ | 13.37 | | | $ | 9.20 | | | $ | 18.80 | | | $ | 19.06 | | | $ | 16.51 | |
Total return (f)(g) | | | 47.00 | % | | | (47.80 | )% | | | (0.95 | )% | | | 16.03 | % | | | 27.70 | % |
| | | | | |
Ratios to Average Net Assets/Supplemental Data: | | | | | | | | | | | | | | | | | | | | |
Net expenses before interest expense | | | 1.26 | % | | | 1.43 | %(h) | | | 1.50 | %(h) | | | 1.50 | %(h) | | | 1.50 | %(h) |
Interest expense | | | — | %(i) | | | 0.01 | % | | | — | %(i) | | | — | | | | — | |
Net expenses | | | 1.26 | % | | | 1.44 | %(h) | | | 1.50 | %(h) | | | 1.50 | %(h) | | | 1.50 | %(h) |
Waiver/Reimbursement | | | 0.09 | % | | | 0.04 | % | | | 0.04 | % | | | 0.06 | % | | | 0.08 | % |
Net investment income | | | 1.56 | % | | | 1.81 | %(h) | | | 0.59 | %(h) | | | 0.49 | %(h) | | | 0.52 | %(h) |
Portfolio turnover rate | | | 111 | % | | | 133 | % | | | 68 | % | | | 28 | % | | | 26 | % |
Net assets, end of period (000s) | | $ | 171,225 | | | $ | 165,846 | | | $ | 636,030 | | | $ | 636,941 | | | $ | 522,284 | |
| (a) | On March 31, 2008, Shares class of International Fund, a series of Excelsior Funds, Inc., was reorganized into the Fund’s Class Z. The financial information of the Fund’s Class Z includes the financial information of International Fund’s Shares class. |
| (b) | Per share data for the year ended 2006 was audited by other auditors. |
| (c) | Per share data was calculated using the average shares outstanding during the period. |
| (d) | Net investment income per share reflects a special dividend. The effect of this dividend amounted to $0.04 per share. |
| (e) | Rounds to less than $0.01 per share. |
| (f) | Had the investment advisor and/or any of its affiliates not waived fees or reimbursed a portion of expenses, total return would have been reduced. |
| (g) | Total return at net asset value assuming all distributions reinvested. |
| (h) | The benefits derived from expense reductions had an impact of less than 0.01%. |
| (i) | Rounds to less than 0.01%. |
See Accompanying Notes to Financial Statements.
144
Financial Highlights – Columbia Pacific/Asia Fund
Selected data for a share outstanding throughout each period is as follows:
| | | | | | | | | | | | |
| | | Year Ended
March 31, | | | Period Ended
March 31, | |
| Class A Shares | | 2010 | | | 2009 | | | 2008 (a) | |
Net Asset Value, Beginning of Period | | $ | 4.82 | | | $ | 9.42 | | | $ | 9.42 | |
| | | |
Income from Investment Operations: | | | | | | | | | | | | |
Net investment income (b) | | | 0.04 | | | | 0.11 | | | | — | (c) |
Net realized and unrealized gain (loss) on investments, foreign currency, foreign
capital gains tax and written options | | | 2.78 | | | | (3.35 | ) | | | — | (c) |
| | | | | | | | | | | | |
Total from investment operations | | | 2.82 | | | | (3.24 | ) | | | — | (c) |
| | | |
Less Distributions to Shareholders: | | | | | | | | | | | | |
From net investment income | | | (0.02 | ) | | | (0.04 | ) | | | — | |
From net realized gains | | | — | | | | (1.32 | ) | | | — | |
| | | | | | | | | | | | |
Total distributions to shareholders | | | (0.02 | ) | | | (1.36 | ) | | | — | |
| | | |
Redemption Fees: | | | | | | | | | | | | |
Redemption fees added to paid-in-capital (b)(c) | | | — | | | | — | | | | — | |
| | | |
Increase from Regulatory Settlements | | | 0.02 | | | | — | | | | — | |
| | | |
Net Asset Value, End of Period | | $ | 7.64 | | | $ | 4.82 | | | $ | 9.42 | |
Total return (d)(e) | | | 59.07 | % | | | (40.21 | )% | | | 0.00 | %(f) |
| | | |
Ratios to Average Net Assets/Supplemental Data: | | | | | | | | | | | | |
Net expenses before interest expense | | | 1.73 | % | | | 1.90 | %(g) | | | 1.82 | %(g)(h) |
Interest expense | | | — | | | | 0.01 | % | | | — | %(h)(i) |
Net expenses | | | 1.73 | % | | | 1.91 | %(g) | | | 1.82 | %(g)(h) |
Waiver/Reimbursement | | | 0.45 | % | | | 0.11 | % | | | 0.05 | %(h) |
Net investment income (loss) | | | 0.64 | % | | | 1.94 | %(g) | | | (0.80 | )%(g)(h) |
Portfolio turnover rate | | | 98 | % | | | 111 | % | | | 68 | %(f) |
Net assets, end of period (000s) | | $ | 814 | | | $ | 175 | | | $ | 10 | |
| (a) | The Fund’s Class A shares commenced operations on March 31, 2008. Per share data and total return reflect activity from that date. |
| (b) | Per share data was calculated using the average shares outstanding during the period. |
| (c) | Rounds to less than $0.01 per share. |
| (d) | Had the investment advisor and/or any of its affiliates not waived fees or reimbursed a portion of expenses, total return would have been reduced. |
| (e) | Total return at net asset value assuming all distributions reinvested and no initial sales charge or contingent deferred sales charge. |
| (g) | The benefits derived from expense reductions had an impact of less than 0.01%. |
| (i) | Rounds to less than 0.01%. |
See Accompanying Notes to Financial Statements.
145
Financial Highlights – Columbia Pacific/Asia Fund
Selected data for a share outstanding throughout each period is as follows:
| | | | | | | | | | | | |
| | | Year Ended
March 31, | | | Period Ended
March 31, | |
| Class C Shares | | 2010 | | | 2009 | | | 2008 (a) | |
Net Asset Value, Beginning of Period | | $ | 4.78 | | | $ | 9.42 | | | $ | 9.42 | |
| | | |
Income from Investment Operations: | | | | | | | | | | | | |
Net investment income (loss) (b) | | | (0.01 | ) | | | 0.04 | | | | — | (c) |
Net realized and unrealized gain (loss) on investments, foreign currency, foreign
capital gains tax and written options | | | 2.77 | | | | (3.32 | ) | | | — | (c) |
| | | | | | | | | | | | |
Total from investment operations | | | 2.76 | | | | (3.28 | ) | | | — | (c) |
| | | |
Less Distributions to Shareholders: | | | | | | | | | | | | |
From net investment income | | | — | | | | (0.04 | ) | | | — | |
From return of capital | | | — | | | | (1.32 | ) | | | — | |
| | | | | | | | | | | | |
Total distributions to shareholders | | | — | | | | (1.36 | ) | | | — | |
| | | |
Redemption Fees: | | | | | | | | | | | | |
Redemption fees added to paid-in-capital (b)(c) | | | — | | | | — | | | | — | |
| | | |
Increase from Regulatory Settlements | | | 0.02 | | | | — | | | | — | |
| | | |
Net Asset Value, End of Period | | $ | 7.56 | | | $ | 4.78 | | | $ | 9.42 | |
Total return (d)(e) | | | 58.16 | % | | | (40.69 | )% | | | 0.00 | %(f) |
| | | |
Ratios to Average Net Assets/Supplemental Data: | | | | | | | | | | | | |
Net expenses before interest expense | | | 2.48 | % | | | 2.65 | %(g) | | | 2.57 | %(g)(h) |
Interest expense | | | — | | | | 0.01 | % | | | — | %(h)(i) |
Net expenses | | | 2.48 | % | | | 2.66 | %(g) | | | 2.57 | %(g)(h) |
Waiver/Reimbursement | | | 0.45 | % | | | 0.11 | % | | | 0.05 | %(h) |
Net investment income (loss) | | | (0.09 | )% | | | 0.87 | %(g) | | | (1.55 | )%(g)(h) |
Portfolio turnover rate | | | 98 | % | | | 111 | % | | | 68 | %(f) |
Net assets, end of period (000s) | | $ | 359 | | | $ | 238 | | | $ | 10 | |
| (a) | The Fund’s Class C shares commenced operations on March 31, 2008. Per share data and total return reflect activity from that date. |
| (b) | Per share data was calculated using the average shares outstanding during the period. |
| (c) | Rounds to less than $0.01 per share. |
| (d) | Had the investment advisor and/or any of its affiliates not waived fees or reimbursed a portion of expenses, total return would have been reduced. |
| (e) | Total return at net asset value assuming all distributions reinvested and no contingent deferred sales charge. |
| (g) | The benefits derived from expense reductions had an impact of less than 0.01%. |
| (i) | Rounds to less than 0.01%. |
See Accompanying Notes to Financial Statements.
146
Financial Highlights – Columbia Pacific/Asia Fund
Selected data for a share outstanding throughout each period is as follows:
| | | | | | | | | | | | | | | | | | | | |
| | | Year Ended March 31, | |
| Class Z Shares | | 2010 | | | 2009 | | | 2008 (a) | | | 2007 | | | 2006 (b) | |
Net Asset Value, Beginning of Period | | $ | 4.83 | | | $ | 9.42 | | | $ | 11.72 | | | $ | 11.61 | | | $ | 8.88 | |
| | | | | |
Income from Investment Operations: | | | | | | | | | | | | | | | | | | | | |
Net investment income (c) | | | 0.07 | | | | 0.10 | | | | 0.05 | | | | — | (d) | | | 0.02 | |
Net realized and unrealized gain (loss) on investments, foreign currency, foreign capital gains tax and written options | | | 2.81 | | | | (3.33 | ) | | | 0.11 | | | | 0.50 | | | | 2.82 | |
| | | | | | | | | | | | | | | | | | | | |
Total from investment operations | | | 2.88 | | | | (3.23 | ) | | | 0.16 | | | | 0.50 | | | | 2.84 | |
| | | | | |
Less Distributions to Shareholders: | | | | | | | | | | | | | | | | | | | | |
From net investment income | | | (0.04 | ) | | | (0.04 | ) | | | (0.08 | ) | | | — | | | | (0.11 | ) |
From net realized gains | | | — | | | | (1.32 | ) | | | (2.38 | ) | | | (0.39 | ) | | | — | |
| | | | | | | | | | | | | | | | | | | | |
Total distributions to shareholders | | | (0.04 | ) | | | (1.36 | ) | | | (2.46 | ) | | | (0.39 | ) | | | (0.11 | ) |
| | | | | |
Redemption Fees: | | | | | | | | | | | | | | | | | | | | |
Redemption fees added to paid-in-capital (c)(d) | | | — | | | | — | | | | — | | | | — | | | | — | |
| | | | | |
Increase from Regulatory Settlements | | | 0.02 | | | | — | | | | — | | | | — | | | | — | |
| | | | | |
Net Asset Value, End of Period | | $ | 7.69 | | | $ | 4.83 | | | $ | 9.42 | | | $ | 11.72 | | | $ | 11.61 | |
Total return (e) | | | 60.22 | %(f) | | | (40.10 | )%(f) | | | (1.11 | )%(f)(g) | | | 4.40 | % | | | 32.35 | %(f) |
| | | | | |
Ratios to Average Net Assets/Supplemental Data: | | | | | | | | | | | | | | | | | | | | |
Net expenses before interest expense | | | 1.48 | % | | | 1.65 | %(h) | | | 1.57 | %(h) | | | 1.61 | %(h) | | | 1.59 | %(h) |
Interest expense | | | — | | | | 0.01 | % | | | — | %(i) | | | — | | | | — | |
Net expenses | | | 1.48 | % | | | 1.66 | %(h) | | | 1.57 | %(h) | | | 1.61 | %(h) | | | 1.59 | %(h) |
Waiver/Reimbursement | | | 0.45 | % | | | 0.11 | % | | | 0.04 | % | | | — | | | | 0.03 | % |
Net investment income (loss) | | | 1.02 | % | | | 1.33 | %(h) | | | 0.39 | %(h) | | | (0.04 | )%(h) | | | 0.22 | %(h) |
Portfolio turnover rate | | | 98 | % | | | 111 | % | | | 68 | % | | | 92 | % | | | 68 | % |
Net assets, end of period (000s) | | $ | 30,529 | | | $ | 24,521 | | | $ | 117,835 | | | $ | 213,132 | | | $ | 243,964 | |
| (a) | On March 31, 2008, Shares class of Pacific/Asia Fund, a series of Excelsior Funds, Inc. was reorganized into the Fund’s Class Z. The financial information of the Fund’s Class Z includes the financial information of Pacific/Asia Fund’s Shares class. |
| (b) | Per share data for the year ended March 31, 2006 was audited by other auditors. |
| (c) | Per share data was calculated using the average shares outstanding during the period. |
| (d) | Rounds to less than $0.01 per share. |
| (e) | Total return at net asset value assuming all distributions reinvested. |
| (f) | Had the investment advisor and/or any of its affiliates not waived fees or reimbursed a portion of expenses, total return would have been reduced. |
| (g) | Total return includes a voluntary reimbursement by the investment advisor for a realized investment loss due to a trading error. This reimbursement increased total return and net asset value per share by less than 0.01% and $0.01, respectively. |
| (h) | The benefits derived from expense reductions had an impact of less than 0.01%. |
| (i) | Rounds to less than 0.01%. |
See Accompanying Notes to Financial Statements.
147
Notes to Financial Statements – Equity Funds
March 31, 2010
Note 1. Organization
Columbia Funds Series Trust I (the “Trust”) is registered under the Investment Company Act of 1940, as amended (the “1940 Act”), as an open-end management investment company organized as a Massachusetts business trust. Information presented in these financial statements pertains to the following funds (each, a “Fund” and collectively, the “Funds”), each a series of the Trust:
Columbia Blended Equity Fund
Columbia Energy and Natural Resources Fund
Columbia Mid Cap Core Fund
Columbia Select Large Cap Growth Fund
Columbia Select Opportunities Fund
Columbia Select Small Cap Fund
Columbia Value and Restructuring Fund
Columbia Emerging Markets Fund
Columbia International Growth Fund
Columbia Pacific/Asia Fund
Each Fund is diversified, with the exception of Columbia Energy and Natural Resources Fund, which is non-diversified.
Investment Objectives
Each Fund seeks long-term capital appreciation.
Fund Shares
The Trust may issue an unlimited number of shares. Columbia Blended Equity Fund, Columbia Energy and Natural Resources Fund, Columbia Select Opportunities Fund, Columbia Emerging Markets Fund, Columbia International Growth Fund and Columbia Pacific/Asia Fund each offer three classes of shares: Class A, Class C and Class Z. Columbia Mid Cap Core Fund, Columbia Select Large Cap Growth Fund, Columbia Select Small Cap Fund and Columbia Value and Restructuring Fund each offer four classes of shares: Class A, Class C, Class R and Class Z. Each share class has its own expense structure and sales charges, as applicable.
Class A shares are subject to a maximum front-end sales charge of 5.75% based on the amount of initial investment. Class A shares purchased without an initial sales charge in accounts aggregating $1 million to $50 million at the time of purchase are subject to a 1.00% contingent deferred sales charge (“CDSC”) if the shares are sold within one year after purchase. Class C shares are subject to a 1.00% CDSC on shares sold within one year after purchase. Class R and Class Z shares are offered continuously at net asset value. There are certain restrictions on the purchase of Class R and Class Z shares, as described in each Fund’s prospectus.
Note 2. Significant Accounting Policies
The preparation of financial statements in accordance with accounting principles generally accepted in the United States of America (“GAAP”) requires management to make certain estimates and assumptions that affect the reported amounts of assets and liabilities, the disclosure of contingent assets and liabilities at the date of the financial statements and the reported amounts of revenue and expenses during the reporting period. Actual results could differ from those estimates.
The following is a summary of significant accounting policies consistently followed by the Funds in the preparation of their financial statements.
Security Valuation
Equity securities, exchange-traded funds and securities of certain investments companies are valued at the last sale price on the principal exchange on which they trade, except for securities traded on the NASDAQ, which are valued at the NASDAQ official close price. Unlisted securities or listed securities for which there were no sales during the day are valued at the closing bid price on such exchanges or over-the-counter markets.
Short-term investments maturing in 60 days or less are valued at amortized cost, which approximates market value.
Investments in other open-end investment companies are valued at net asset value.
Purchased options are valued at the last reported sale price, or in the absence of a sale, at the last quoted bid price.
Written options are valued at the last reported sale price, or in the absence of a sale, at the last quoted ask price.
Forward foreign currency exchange contracts are valued at the prevailing forward exchange rate of the underlying currencies.
Foreign securities are generally valued at the last sale price on the foreign exchange or market on which they trade. If any
148
Equity Funds
March 31, 2010
foreign share prices are not readily available as a result of limited share activity, the securities are valued at the last sale price of the local shares in the principal market in which such securities are normally traded.
Generally, trading in foreign securities is substantially completed each day at various times prior to the close of the New York Stock Exchange (“NYSE”). The values of such securities used in computing the net asset value of the Funds’ shares are determined as of such times. Foreign currency exchange rates are generally determined at 4:00 p.m. Eastern (U.S.) time. Occasionally, events affecting the values of such foreign securities may occur between the times at which they are determined and the close of the customary trading session of the NYSE, which would not be reflected in the computation of the Funds’ net asset values. If events materially affecting the values of such foreign securities occur and it is determined that market quotations are not reliable, then these foreign securities will be valued at their fair value using procedures approved by the Board of Trustees.
Certain Funds may use a systematic fair valuation model provided by an independent third party to value securities principally traded in foreign markets in order to adjust for possible stale pricing that may occur between the close of the foreign exchanges and the time for valuation.
Investments for which market quotations are not readily available, or that have quotations which management believes are not reliable, are valued at fair value as determined in good faith under consistently applied procedures established by and under the general supervision of the Board of Trustees. If a security is valued at fair value, such value is likely to be different from the last quoted market price for the security. The determination of fair value often requires significant judgment. To determine fair value, management may use assumptions including but not limited to future cash flows and estimated risk premiums. Multiple inputs from various sources may be used to determine value.
GAAP establishes a hierarchy that prioritizes the inputs to valuation techniques used to measure fair value giving the highest priority to unadjusted quoted prices in active markets for identical securities (level 1 measurements) and the lowest priority to unobservable inputs (level 3 measurements) when market prices are not readily available or reliable. The three levels of the fair value hierarchy are described below:
| • | | Level 1 — quoted prices in active markets for identical securities |
| • | | Level 2 — prices determined using other significant observable inputs (including quoted prices for similar securities, interest rates, prepayment speeds, credit risk and others) |
| • | | Level 3 — prices determined using significant unobservable inputs. In situations where quoted prices or observable inputs are unavailable or less reliable, unobservable inputs may be used. Unobservable inputs may include management’s own assumptions about the factors market participants would use in pricing an investment. |
The inputs or methodology used for valuing securities are not necessarily an indication of the risk associated with investing in those securities.
On January 21, 2010, the FASB issued an Accounting Standards Update (the amendment), Fair Value Measurements and Disclosures (Topic 820): Improving Disclosures about Fair Value Measurements, which provides guidance on how investment assets and liabilities are to be valued and disclosed. Specifically, the amendment requires reporting entities to disclose the input and valuation techniques used to measure fair value for both recurring and nonrecurring fair value measurements for Level 2 or Level 3 positions. The amendment also requires that transfers between all levels (including Level 1 and Level 2) be disclosed on a gross basis (i.e., transfers out must be disclosed separately from transfers in), and the reason(s) for the transfer. Additionally purchases, sales, issuances and settlements must be disclosed on a gross basis in the Level 3 rollforward. The effective date of the amendment is for interim and annual periods beginning after December 15, 2009, however, the requirement to provide the Level 3 activity for purchases, sales, issuances and settlements on a gross basis will be effective for interim and annual periods beginning after December 15, 2010. At this time, management is evaluating the implications of the amendment and the impact to the financial statements.
Security Transactions
Security transactions are accounted for on the trade date. Cost is determined and gains (losses) are based upon the specific identification method for both financial statement and federal income tax purposes.
149
Equity Funds
March 31, 2010
Derivative Instruments
The Funds may invest in derivative instruments. For additional information on derivative instruments, please see Note 6.
Repurchase Agreements
Each Fund may engage in repurchase agreement transactions with institutions that Columbia Management Advisors, LLC (“Columbia”), the Funds’ investment advisor, has determined are creditworthy. Each Fund, through its custodian, receives delivery of the underlying securities collateralizing a repurchase agreement. Columbia is responsible for determining that the collateral is at least equal, at all times, to the value of the repurchase obligation including interest. A repurchase agreement transaction involves certain risks in the event of default or insolvency of the counterparty. These risks include possible delays in or restrictions on each Fund’s ability to dispose of the underlying securities and a possible decline in the value of the underlying securities during the period while the Funds seek to assert their rights.
Foreign Currency Transactions and Translations
The values of all assets and liabilities quoted in foreign currencies are translated into U.S. dollars at that day’s exchange rates. Net realized and unrealized gains (losses) on foreign currency transactions and translations include gains (losses) arising from the fluctuation in exchange rates between trade and settlement dates on securities transactions, gains (losses) arising from the disposition of foreign currency and currency gains (losses) between the accrual and payment dates on dividends, interest income and foreign withholding taxes.
For financial statement purposes, the Funds do not distinguish that portion of gains (losses) on investments which is due to changes in foreign exchange rates from that which is due to changes in market prices of the investments. Such fluctuations are included with the net realized and unrealized gains (losses) on investments on the Statements of Operations.
Income Recognition
Interest income is recorded on the accrual basis. Premium and discount are amortized and accreted, respectively, on all debt securities, unless otherwise noted.
Corporate actions and dividend income are recorded on the ex-date except for certain foreign securities which are recorded as soon after the ex-date as the Funds become aware of such, net of any non-reclaimable tax withholdings.
Distributions received from real estate investment trusts (REITs) in excess of their income are recorded as a reduction of the cost of the related investments. If the Funds no longer own the applicable securities, any distributions received in excess of income are recorded as realized gains.
Expenses
General expenses of the Trust are allocated to the Funds and other series of the Trust based upon relative net assets or other expense allocation methodologies determined by the nature of the expense. Expenses directly attributable to a Fund are charged to such Fund.
Determination of Class Net Asset Value
All income, expenses (other than class-specific expenses, as shown on the Statements of Operations) and realized and unrealized gains (losses) are allocated to each class of the Funds on a daily basis, based on the relative net assets of each class, for purposes of determining the net asset value of each class.
Federal Income Tax Status
Each Fund intends to qualify each year as a “regulated investment company” under Subchapter M of the Internal Revenue Code, as amended, and will distribute substantially all of its tax-exempt or taxable income, if any, for its tax year, and as such will not be subject to federal income taxes. In addition, each Fund intends to distribute in each calendar year substantially all of its net investment income, capital gains and certain other amounts, if any, such that each Fund should not be subject to federal excise tax. Therefore, no federal income or excise tax provision is recorded.
Foreign Capital Gains Taxes
Realized gains in certain countries may be subject to foreign taxes at the fund level, at rates ranging from approximately 10% to 15%. The Funds accrue for such foreign taxes on net realized and unrealized gains at the appropriate rate for each jurisdiction.
150
Equity Funds
March 31, 2010
Distributions to Shareholders
Distributions from net investment income, if any, are declared and paid quarterly for each Fund except Columbia Emerging Markets Fund, Columbia International Growth Fund and Columbia Pacific/Asia Fund, each of which declares and pays distributions from net investment income semi-annually. Net realized capital gains, if any, are distributed at least annually. Income distributions and capital gain distributions are determined in accordance with federal income tax regulations which may differ from GAAP.
Indemnification
In the normal course of business, each Fund enters into contracts that contain a variety of representations and warranties and which provide general indemnities. A Fund’s maximum exposure under these arrangements is unknown because this would involve future claims against a Fund. Also, under the Trust’s organizational documents and by contract, the Trustees and officers of the Trust are indemnified against certain liabilities that may arise out of actions relating to their duties to the Trust. However, based on experience, the Funds expect the risk of loss due to these representations, warranties and indemnities to be minimal.
Note 3. Federal Tax Information
The timing and character of income and capital gain distributions are determined in accordance with income tax regulations, which may differ from GAAP. Reclassifications are made to each Fund’s capital accounts for permanent tax differences to reflect income and gains available for distribution (or available capital loss carryforwards) under income tax regulations.
For the year ended March 31, 2010, permanent book and tax basis differences resulting primarily from differing treatments for net operating losses, foreign currency transactions, passive foreign investment company (“PFIC”) adjustments, distribution reclassifications, reversal of net currency and capital gains on redemption-in-kind, foreign capital gains tax and proceeds from litigation settlements were identified and reclassified among the components of the Funds’ net assets as follows:
| | | | | | | | | | | | |
| | | | | | | | | | |
| | | Undistributed/
(Overdistributed) Net Investment
Income (Loss) | | | Accumulated Net Realized Gain (Loss) | | | Paid-In
Capital | |
Columbia Blended Equity Fund | | $ | 25,632 | | | $ | 53 | | | $ | (25,685 | ) |
Columbia Energy and Natural Resources Fund | | | 412,950 | | | | (377,756 | ) | | | (35,194 | ) |
Columbia Mid Cap Core Fund | | | 26,771 | | | | (43 | ) | | | (26,728 | ) |
Columbia Select Large Cap Growth Fund | | | 5,142,059 | | | | (1 | ) | | | (5,142,058 | ) |
Columbia Select Opportunities Fund | | | (22,547 | ) | | | 22,547 | | | | — | |
Columbia Select Small Cap Fund | | | 1,919,031 | | | | 1 | | | | (1,919,032 | ) |
Columbia Value and Restructuring Fund | | | (220,376 | ) | | | (12,473,333 | ) | | | 12,693,709 | |
Columbia Emerging Markets Fund | | | 525,191 | | | | (129,390 | ) | | | (395,801 | ) |
Columbia International Growth Fund | | | 620,433 | | | | (463,350 | ) | | | (157,083 | ) |
Columbia Pacific/Asia Fund | | | 443,500 | | | | (363,994 | ) | | | (79,506 | ) |
Net investment income and net realized gains (losses), as disclosed on the Statements of Operations, and net assets were not affected by these reclassifications.
151
Equity Funds
March 31, 2010
The tax character of distributions paid during the years ended March 31, 2010 and March 31, 2009 was as follows:
| | | | | | |
| | | March 31, 2010 |
| | | Ordinary
Income* | | Long-Term Capital Gains |
Columbia Blended Equity Fund | | $ | 1,359,085 | | $ | — |
Columbia Energy and Natural Resources Fund | | | 1,521,692 | | | — |
Columbia Mid Cap Core Fund | | | 540,896 | | | — |
Columbia Select Large Cap Growth Fund | | | — | | | — |
Columbia Select Opportunities Fund | | | 624,349 | | | — |
Columbia Select Small Cap Fund | | | — | | | — |
Columbia Value and Restructuring Fund | | | 77,045,408 | | | — |
Columbia Emerging Markets Fund | | | 5,987,918 | | | 738,148 |
Columbia International Growth Fund | | | 2,046,808 | | | — |
Columbia Pacific/Asia Fund | | | 178,291 | | | — |
| | | | | | |
| | | March 31, 2009 |
| | | Ordinary
Income* | | Long-Term Capital Gains |
Columbia Blended Equity Fund | | $ | 1,781,713 | | $ | 21,444,431 |
Columbia Energy and Natural Resources Fund | | | 6,431,347 | | | 5,700,149 |
Columbia Mid Cap Core Fund | | | 825,208 | | | 525,837 |
Columbia Select Large Cap Growth Fund | | | — | | | — |
Columbia Select Opportunities Fund | | | 2,348,282 | | | 5,517,364 |
Columbia Select Small Cap Fund | | | — | | | 21,134,698 |
Columbia Value and Restructuring Fund | | | 112,804,416 | | | 3,642,559 |
Columbia Emerging Markets Fund | | | 78,116 | | | 137,621,724 |
Columbia International Growth Fund | | | 1,206,331 | | | 35,121,685 |
Columbia Pacific/Asia Fund | | | 1,153,529 | | | 14,072,610 |
| * | For tax purposes short-term capital gain distributions, if any, are considered ordinary income distributions. |
152
Equity Funds
March 31, 2010
As of March 31, 2010, the components of distributable earnings on a tax basis were as follows:
| | | | | | | | | |
| | | | | | | |
| | | Undistributed
Ordinary Income | | Undistributed Long-Term Capital Gains | | Net Unrealized Appreciation (Depreciation)* |
Columbia Blended Equity Fund | | $ | 153,005 | | $ | 6,390,878 | | $ | 71,612,426 |
Columbia Energy and Natural Resources Fund | | | 2,331,673 | | | — | | | 85,419,260 |
Columbia Mid Cap Core Fund | | | — | | | — | | | 14,706,042 |
Columbia Select Large Cap Growth Fund | | | — | | | — | | | 373,960,747 |
Columbia Select Opportunities Fund | | | 44,311 | | | — | | | 31,821,959 |
Columbia Select Small Cap Fund | | | — | | | — | | | 148,379,926 |
Columbia Value and Restructuring Fund | | | 3,524,778 | | | — | | | 1,863,378,719 |
Columbia Emerging Markets Fund | | | — | | | 15,865,665 | | | 161,507,469 |
Columbia International Growth Fund | | | 3,411,570 | | | — | | | 27,235,791 |
Columbia Pacific/Asia Fund | | | 790,320 | | | — | | | 4,354,008 |
| * | The differences between book-basis and tax-basis net unrealized appreciation/depreciation are primarily due to deferral of losses from wash sales, changes in the value of assets and liabilities resulting from changes in exchange rates, and the realization for tax-purposes of unrealized gains on certain forward foreign currency contracts and PFIC adjustments. |
Unrealized appreciation and depreciation at March 31, 2010, based on cost of investments for federal income tax purposes, were:
| | | | | | | | | | |
| | | | | | | | |
| | | Unrealized Appreciation | | Unrealized Depreciation | | | Net Unrealized Appreciation |
Columbia Blended Equity Fund | | $ | 71,681,765 | | $ | (69,339 | ) | | $ | 71,612,426 |
Columbia Energy and Natural Resources Fund | | | 101,215,965 | | | (15,796,705 | ) | | | 85,419,260 |
Columbia Mid Cap Core Fund | | | 15,164,159 | | | (458,117 | ) | | | 14,706,042 |
Columbia Select Large Cap Growth Fund | | | 411,853,126 | | | (37,892,379 | ) | | | 373,960,747 |
Columbia Select Opportunities Fund | | | 32,641,162 | | | (819,203 | ) | | | 31,821,959 |
Columbia Select Small Cap Fund | | | 154,339,839 | | | (5,959,913 | ) | | | 148,379,926 |
Columbia Value and Restructuring Fund | | | 2,363,707,319 | | | (500,328,600 | ) | | | 1,863,378,719 |
Columbia Emerging Markets Fund | | | 162,612,420 | | | (1,104,951 | ) | | | 161,507,469 |
Columbia International Growth Fund | | | 30,395,027 | | | (3,159,236 | ) | | | 27,235,791 |
Columbia Pacific/Asia Fund | | | 5,386,848 | | | (1,032,840 | ) | | | 4,354,008 |
153
Equity Funds
March 31, 2010
The following capital loss carryforwards may be available to reduce taxable income arising from future net realized gains on investments, if any, to the extent permitted by the Internal Revenue Code:
| | | | | | | | | | | | | | | | | | | | | |
| | | Year of Expiration |
| | | 2011 | | 2012 | | 2013 | | 2014 | | 2017 | | 2018 | | Total |
Columbia Blended Equity Fund | | $ | — | | $ | — | | $ | — | | $ | — | | $ | — | | $ | — | | $ | — |
Columbia Energy and Natural Resources Fund | | | — | | | — | | | — | | | — | | | 62,348,309 | | | 42,556,165 | | | 104,904,474 |
Columbia Mid Cap Core Fund | | | — | | | — | | | — | | | — | | | 602,093 | | | — | | | 602,093 |
Columbia Select Large Cap Growth Fund | | | 58,065,667 | | | 22,030,449 | | | 480,165 | | | — | | | 98,833,717 | | | 87,353,787 | | | 266,763,785 |
Columbia Select Opportunities Fund | | | — | | | — | | | — | | | — | | | 21,622,838 | | | 90,053,482 | | | 111,676,320 |
Columbia Select Small Cap Fund | | | — | | | — | | | — | | | — | | | 13,761,705 | | | 115,762,978 | | | 129,524,683 |
Columbia Value and Restructuring Fund | | | — | | | — | | | — | | | — | | | 579,007,867 | | | 1,055,676,289 | | | 1,634,684,156 |
Columbia Emerging Markets Fund | | | — | | | 498,904 | | | — | | | 36,739 | | | — | | | — | | | 535,643 |
Columbia International Growth Fund | | | 2,840,733 | | | — | | | — | | | — | | | 24,554,073 | | | 113,489,589 | | | 140,884,395 |
Columbia Pacific/Asia Fund | | | — | | | — | | | — | | | — | | | 9,165,902 | | | 14,323,890 | | | 23,489,792 |
Capital loss carryforwards of $1,117,134, $7,683,765 and $6,596,882 were utilized during the year ended March 31, 2010 by Columbia Blended Equity Fund, Columbia Mid Cap Core Fund and Columbia Emerging Markets Fund, respectively. Expired capital loss carryforwards are recorded as a reduction of paid-in capital.
Under current tax rules, certain currency and capital losses realized after October 31 may be deferred and treated as occurring on the first day of the following fiscal year. As of March 31, 2010, post-October capital losses attributed to security transactions were deferred to April 1, 2010 as follows:
| | | |
| | | |
| | | Capital Losses Deferred |
Columbia Energy and Natural Resources Fund | | $ | 1,169,333 |
Columbia Value and Restructuring Fund | | | 4,988,213 |
Columbia Pacific/Asia Fund | | | 174,194 |
Management is required to determine whether a tax position of the Funds is more likely than not to be sustained upon examination by the applicable taxing authority, including resolution of any related appeals or litigation processes, based on the technical merits of the position. The tax benefit to be recognized by each Fund is measured as the largest amount of benefit that is greater than fifty percent likely of being realized upon ultimate settlement. Management is not aware of any tax positions for which it is reasonably possible that the total amounts of unrecognized tax benefits will significantly change in the next twelve months. However, management’s conclusions may be subject to review and adjustment at a later date based on factors including, but not limited to, new tax laws, regulations, and administrative interpretations (including relevant court decisions). The Funds’ federal tax returns for the prior three fiscal years remain subject to examination by the Internal Revenue Service.
154
Equity Funds
March 31, 2010
Note 4. Fees and Compensation Paid to Affiliates
Investment Advisory Fee
Columbia, an indirect, wholly owned subsidiary of Bank of America Corporation (“BOA”) provides investment advisory services to the Funds. Columbia receives a monthly investment advisory fee based on each Fund’s average daily net assets at the following annual rates:
| | | | | | | | | | | | | | | | | | | | | | | | |
| | | | | | | | | | | | | | | | | | | | | | | | | |
| | | First
$500
Million | | | $500
Million to $750
Million | | | $750
Million to
$1 Billion | | | $1 Billion to $1.5
Billion | | | $1.5
Billion to
$3 Billion | | | $3 Billion
to $6
Billion | | | $6 billion to $10
Billion | | | Over $10
Billion | |
Columbia Blended Equity Fund | | 0.75 | % | | 0.57 | % | | 0.57 | % | | 0.52 | % | | 0.47 | % | | 0.45 | % | | 0.43 | % | | 0.43 | % |
Columbia Energy and Natural Resources Fund | | 0.60 | % | | 0.60 | % | | 0.60 | % | | 0.52 | % | | 0.47 | % | | 0.45 | % | | 0.43 | % | | 0.43 | % |
Columbia Mid Cap Core Fund | | 0.65 | % | | 0.65 | % | | 0.65 | % | | 0.57 | % | | 0.52 | % | | 0.52 | % | | 0.52 | % | | 0.52 | % |
Columbia Select Large Cap Growth Fund | | 0.75 | % | | 0.75 | % | | 0.75 | % | | 0.52 | % | | 0.47 | % | | 0.45 | % | | 0.43 | % | | 0.43 | % |
Columbia Select Opportunities Fund | | 0.75 | % | | 0.57 | % | | 0.57 | % | | 0.52 | % | | 0.47 | % | | 0.45 | % | | 0.43 | % | | 0.43 | % |
Columbia Select Small Cap Fund | | 0.75 | % | | 0.75 | % | | 0.75 | % | | 0.62 | % | | 0.62 | % | | 0.62 | % | | 0.62 | % | | 0.62 | % |
Columbia Value and Restructuring Fund | | 0.60 | % | | 0.60 | % | | 0.60 | % | | 0.60 | % | | 0.60 | % | | 0.60 | % | | 0.60 | % | | 0.43 | % |
Columbia Emerging Markets Fund | | 1.15 | % | | 1.15 | % | | 1.00 | % | | 0.67 | % | | 0.62 | % | | 0.57 | % | | 0.52 | % | | 0.52 | % |
Columbia International Growth Fund | | 0.95 | % | | 0.62 | % | | 0.62 | % | | 0.57 | % | | 0.52 | % | | 0.50 | % | | 0.48 | % | | 0.48 | % |
Columbia Pacific/Asia Fund | | 0.75 | % | | 0.75 | % | | 0.75 | % | | 0.67 | % | | 0.62 | % | | 0.57 | % | | 0.52 | % | | 0.52 | % |
For the year period ended March 31, 2010, the effective investment advisory fee rates for the Funds, as a percentage of each Funds’ average daily net assets, were as follows:
| | | |
| | | | |
| | | Effective Fee Rate | |
Columbia Blended Equity Fund | | 0.75 | % |
Columbia Energy and Natural Resources Fund | | 0.60 | % |
Columbia Mid Cap Core Fund | | 0.65 | % |
Columbia Select Large Cap Growth Fund | | 0.67 | % |
Columbia Select Opportunities Fund | | 0.75 | % |
Columbia Select Small Cap Fund | | 0.75 | % |
Columbia Value and Restructuring Fund | | 0.60 | % |
Columbia Emerging Markets Fund | | 1.15 | % |
Columbia International Growth Fund | | 0.95 | % |
Columbia Pacific/Asia Fund | | 0.75 | % |
Bank of America, N.A., an indirect parent company of Columbia, entered into an agreement dated September 29, 2009, to sell a portion of the asset management business of Columbia Management Group, LLC to Ameriprise Financial, Inc. (“Ameriprise Financial”). The transaction (“Transaction”) includes the sale of the part of the asset management business that advises long-term mutual funds, including the Funds. The Transaction is subject to certain approvals and other conditions to closing, and is currently expected to close on or about April 30, 2010 (the “Closing”).
In connection with the Closing, certain changes will occur, including a change in the entities serving as the investment advisor, administrator, distributor and transfer agent of the Funds. RiverSource Investments, LLC (the “New Advisor”), a subsidiary of Ameriprise Financial, will become the investment advisor of the Funds upon the Closing. On March 3, 2010, the Funds’ shareholders approved, among other matters, the proposed investment management
155
Equity Funds
March 31, 2010
services agreement with the New Advisor. The New Advisor will serve as investment advisor under a new investment management services agreement effective upon the Closing. The New Advisor will change its name to Columbia Management Investment Advisers, LLC upon or shortly after the Closing. Effective upon the Closing, as the context requires, references to Columbia shall be deemed to refer to the New Advisor.
Administration Fee
Columbia provides administrative and other services to the Funds. Under the administration agreement, Columbia is entitled to receive an administration fee, computed daily and paid monthly, based on each Fund’s average daily net assets at the annual rates listed below less the fees payable by the Funds as described under the Pricing and Bookkeeping Fees note below:
| | | |
| | | | |
| | | Annual Fee Rate | |
Columbia Blended Equity Fund | | 0.15 | % |
Columbia Energy and Natural Resources Fund | | 0.15 | % |
Columbia Mid Cap Core Fund | | 0.15 | % |
Columbia Select Large Cap Growth Fund | | 0.15 | % |
Columbia Select Opportunities Fund | | 0.15 | % |
Columbia Select Small Cap Fund | | 0.15 | % |
Columbia Value and Restructuring Fund | | 0.15 | % |
Columbia Emerging Markets Fund | | 0.20 | % |
Columbia International Growth Fund | | 0.20 | % |
Columbia Pacific/Asia Fund | | 0.20 | % |
The New Advisor will become the administrator of the Funds under a new administrative services agreement effective upon the Closing.
Pricing and Bookkeeping Fees
The Funds have entered into a Financial Reporting Services Agreement (the “Financial Reporting Services Agreement”) with State Street Bank and Trust Company (“State Street”) and Columbia pursuant to which State Street provides financial reporting services to the Funds. The Funds have also entered into an Accounting Services Agreement (collectively with the Financial Reporting Services Agreement, the “State Street Agreements”) with State Street and Columbia pursuant to which State Street provides accounting services to the Funds. Under the State Street Agreements, each Fund pays State Street an annual fee of $38,000 paid monthly plus an additional monthly fee based on an annualized percentage rate of average daily net assets of each Fund for the month. The aggregate fee per Fund will not exceed $140,000 per year (exclusive of out-of-pocket expenses and charges). The Funds also reimburse State Street for certain out-of-pocket expenses and charges.
Among other updates to the State Street Agreements, Columbia will assign and delegate its rights and obligations thereunder to the New Advisor upon the Closing.
The Funds have entered into a Pricing and Bookkeeping Oversight and Services Agreement (the “Services Agreement”) with Columbia. Under the Services Agreement, Columbia provides services related to Fund expenses and the requirements of the Sarbanes-Oxley Act of 2002, and provides oversight of the accounting and financial reporting services provided by State Street. Under the Services Agreement, the Funds reimburse Columbia for out-of-pocket expenses.
The Services Agreement will be terminated upon the Closing, and the services provided thereunder will be covered under the administrative services agreement with the New Advisor.
Transfer Agent Fee
Columbia Management Services, Inc. (the “Transfer Agent”), an affiliate of Columbia and an indirect, wholly owned subsidiary of BOA, provides shareholder services to the Funds and has contracted with Boston Financial Data Services (“BFDS”) to serve as sub-transfer agent. Effective November 1, 2009, the Transfer Agent is entitled to receive a fee for its services, paid monthly, at the annual rate of $22.36 per account plus reimbursement of certain sub-transfer agent fees paid by the Transfer Agent (exclusive of BFDS fees), calculated based on assets held in omnibus accounts and intended to recover the cost of payments to other parties (including affiliates of BOA) for services to those accounts. Prior to November 1, 2009, the annual rate was $17.34 per account. The Transfer Agent pays the fees of BFDS for services as sub-transfer agent and is not entitled to reimbursement for such fees from the Funds.
156
Equity Funds
March 31, 2010
The Transfer Agent may also retain, as additional compensation for its services, fees for wire, telephone and redemption orders, Individual Retirement Account (“IRA”) trustee agent fees and account transcript fees due to the Transfer Agent from shareholders of the Funds and credits (net of bank charges) earned with respect to balances in accounts the Transfer Agent maintains in connection with its services to the Funds. The Transfer Agent also receives reimbursement for certain out-of-pocket expenses.
RiverSource Service Corporation (the “New Transfer Agent”), a subsidiary of Ameriprise Financial, will become the transfer agent of the Funds upon the Closing. The New Transfer Agent will change its name to Columbia Management Investment Services Corp. upon or shortly after the Closing.
An annual minimum account balance fee of $20 may apply to certain accounts with a value below each Fund’s initial minimum investment requirements to reduce the impact of small accounts on transfer agent fees. These minimum account balance fees are recorded as part of expense reductions on the Statements of Operations. For the year ended March 31, 2010, no minimum account balance fees were charged by the Funds.
Underwriting Discounts, Service and Distribution Fees
Columbia Management Distributors, Inc. (the “Distributor”) an affiliate of Columbia and an indirect, wholly-owned subsidiary of BOA, is the principal underwriter of the Funds’ shares. For the year ended March 31, 2010, the Distributor has retained net underwriting discounts on the sale of Class A shares and received net CDSC fees on Class A and Class C share redemptions as follows:
| | | | | | | | | |
| | | Front-End
Sales Charge | | CDSC |
| | | Class A | | Class A | | Class C |
Columbia Blended Equity Fund | | $ | — | | $ | — | | $ | 54 |
Columbia Energy and Natural Resources Fund | | | 55,073 | | | 116 | | | 4,646 |
Columbia Mid Cap Core Fund | | | 588 | | | — | | | 24 |
Columbia Select Large Cap Growth Fund | | | 11,067 | | | — | | | 1,504 |
| | | | | | | | | |
| | | Front-End
Sales Charge | | CDSC |
| | | Class A | | Class A | | Class C |
Columbia Select Opportunities Fund | | $ | 680 | | $ | — | | $ | 42 |
Columbia Select Small Cap Fund | | | 1,693 | | | — | | | 205 |
Columbia Value and Restructuring Fund | | | 50,337 | | | 4,589 | | | 22,254 |
Columbia Emerging Markets Fund | | | 11,612 | | | 6 | | | 134 |
Columbia International Growth Fund | | | 281 | | | — | | | 51 |
Columbia Pacific/Asia Fund | | | 576 | | | — | | | 28 |
RiverSource Fund Distributors, Inc. (the “New Distributor”), a subsidiary of Ameriprise Financial, will become the distributor of the Funds upon the Closing. The New Distributor will change its name to Columbia Management Investment Distributors, Inc. upon or shortly after the Closing.
The Trust has adopted distribution and shareholder servicing plans (the “Plans”) pursuant to Rule 12b-1 under the 1940 Act, which require the payment of distribution and service fees. The fees are intended to compensate the Distributor and/or eligible selling and/or servicing agents for selling shares of the Funds and providing services to investors. The Plans require the payment of a monthly service fee to the Distributor at the annual rate of 0.25% of the average daily net assets attributable to Class A and Class C shares of each Fund. The Plans also require the payment of a monthly distribution fee to the Distributor at the annual rate of 0.75% and 0.50% of the average daily net assets attributable to Class C and Class R shares, respectively, of each Fund.
Fee Waivers and Expense Reimbursements
Effective August 1, 2009, Columbia has voluntarily agreed to reimburse a portion of the Funds’ expenses so that ordinary operating expenses (excluding any distribution and service fees, brokerage commissions, interest, taxes and extraordinary expenses, but including custodian charges relating to overdrafts, if any), after giving effect to any balance credits from the Funds’ custodian, do not exceed the
157
Equity Funds
March 31, 2010
following annual rates, based on each Fund’s average daily net assets:
| | | |
| | | | |
| | | Annual Rates | |
Columbia Blended Equity Fund | | 1.00 | % |
Columbia Energy and Natural Resources Fund | | 1.20 | % |
Columbia Mid Cap Core Fund | | 1.05 | % |
Columbia Select Large Cap Growth Fund | | 1.00 | % |
Columbia Select Opportunities Fund | | 1.00 | % |
Columbia Select Small Cap Fund | | 1.10 | % |
Columbia Value and Restructuring Fund | | 1.00 | % |
Columbia Emerging Markets Fund | | 1.40 | % |
Columbia International Growth Fund | | 1.15 | % |
Columbia Pacific/Asia Fund | | 1.40 | % |
Prior to August 1, 2009, Columbia contractually agreed to bear a portion of the Funds’ expenses so that ordinary operating expenses (excluding any distribution and service fees, brokerage commissions, interest, taxes and extraordinary expenses, but including custodian charges relating to overdrafts, if any), after giving effect to any balance credits from the Funds’ custodian, did not exceed the following annual rates, based on each Fund’s average daily net assets:
| | |
| | | |
| | | Annual Rates |
Columbia Blended Equity Fund | | 1.10% |
Columbia Energy and Natural Resources Fund | | 1.25% |
Columbia Mid Cap Core Fund | | 1.02% |
Columbia Select Large Cap Growth Fund | | 1.08% |
Columbia Select Opportunities Fund | | 0.82% |
Columbia Select Small Cap Fund | | 1.25% |
Columbia Value and Restructuring Fund | | 0.98% |
Columbia Emerging Markets Fund | | 1.70% |
Columbia International Growth Fund | | 1.50% |
Columbia Pacific/Asia Fund | | 1.65% |
Fees Paid to Officers and Trustees
All officers of the Funds are employees of Columbia or its affiliates and, with the exception of the Funds’ Chief Compliance Officer, receive no compensation from the Funds. The Board of Trustees has appointed a Chief Compliance Officer to the Funds in accordance with federal securities regulations. The Funds, along with other affiliated funds, pay their pro-rata share of the expenses associated with the Chief Compliance Officer. Each Fund’s expenses for the Chief Compliance Officer will not exceed $15,000 per year.
Trustees are compensated for their services to the Funds, as set forth on the Statements of Operations. The Trust’s eligible Trustees may participate in a deferred compensation plan which may be terminated at any time. Obligations of the plan will be paid solely out of the Funds’ assets.
As a result of fund mergers, certain Funds assumed the liabilities of the deferred compensation plan of the acquired fund, which are included in “Trustees’ fee” on the Statements of Assets and Liabilities. The deferred compensation plan may be terminated at any time. Any payments to plan participants are paid solely out of the Funds’ assets.
Other Related Party Transactions
In connection with the purchase and sale of their securities during the period, the Funds used one or more brokers that are affiliates of BOA. Total brokerage commissions paid to affiliated brokers for the year ended March 31, 2010 were as follows:
| | | |
| | | |
| | | Amount |
Columbia Blended Equity Fund | | $ | 2,102 |
Columbia Energy and Natural Resources Fund | | | 21,000 |
Columbia Mid Cap Core Fund | | | 1,972 |
Columbia Select Large Cap Growth Fund | | | 30,297 |
Columbia Select Opportunities Fund | | | 2,370 |
Columbia Select Small Cap Fund | | | 19,185 |
Columbia Value and Restructuring Fund | | | 14,727 |
Note 5. Custody Credits
Each Fund has an agreement with its custodian bank under which custody fees may be reduced by balance credits. These credits are recorded as part of expense reductions on the Statements of Operations. The Funds could have invested a portion of the assets utilized in connection with the expense offset arrangement in an income-producing asset if they had not entered into such an agreement. For the year ended
158
Equity Funds
March 31, 2010
March 31, 2010, these custody credits reduced total expenses for the Funds as follows:
| | |
| | | |
| | | Custody Credits |
Columbia Blended Equity Fund | | $—* |
Columbia Energy and Natural Resources Fund | | 28 |
Columbia Mid Cap Core Fund | | — |
Columbia Select Large Cap Growth Fund | | 39 |
Columbia Select Opportunities Fund | | 1 |
Columbia Select Small Cap Fund | | 3 |
Columbia Value and Restructuring Fund | | 2 |
Columbia Emerging Markets Fund | | 2 |
Columbia International Growth Fund | | — |
Columbia Pacific/Asia Fund | | — |
Note 6. Objectives and Strategies for Investing in Derivative Instruments
Columbia Value and Restructuring Fund, Columbia International Growth Fund and Columbia Pacific/Asia Fund use derivative instruments including options and forward contracts in order to meet each Fund’s investment objectives. Each Fund employs strategies in differing combinations to permit it to increase, decrease or change the level of exposure to market risk factors. The achievement of any strategy relating to derivatives depends on an analysis of various risk factors, and if the strategies for the use of derivatives do not work as intended, each Fund may not achieve its investment objectives.
In pursuit of the Funds’ investment objectives, the Funds are exposed to the following market risks:
Equity Risk: Equity risk relates to change in value of equity securities such as common stocks due to general market conditions such as real or perceived adverse economic conditions, changes in the general outlook for corporate earnings, or adverse investor sentiment. Equity securities generally have greater price volatility than fixed income securities.
Foreign Exchange Rate Risk: Foreign exchange rate risk relates to the change in the U.S. dollar value of a security held that is denominated in a foreign currency. The U.S. dollar value of a foreign-currency-denominated security will decrease as the dollar appreciates against the currency, while the U.S. dollar value will increase as the dollar depreciates against the currency.
The following notes provide more detailed information about each derivative type held by the Funds:
Forward Foreign Currency Exchange Contracts—Columbia International Growth Fund and Columbia Pacific/Asia Fund entered into forward foreign currency exchange contracts to shift their investment exposure from one currency to another. These Funds entered into forward foreign currency exchange contracts for the purpose of shifting foreign currency exposure back to U.S. dollars. Columbia International Growth Fund and Columbia Pacific/Asia Fund also used forward contracts in order to achieve a representative weighted mix of major currencies in their benchmarks and/or to recover an underweight country exposure in their portfolios.
Forward foreign currency exchange contracts are agreements to exchange one currency for another at a future date at a specified price. These contracts are used to minimize the exposure to foreign exchange rate fluctuations during the period between the trade and settlement dates of the contract. Certain Funds may utilize forward foreign currency exchange contracts in connection with the settlement of purchases and sales of securities. Certain Funds may also enter into these contracts to reduce the exposure to adverse price movements in certain other foreign-currency-denominated assets. Contracts to buy generally are used to acquire exposure to foreign currencies, while contracts to sell are generally used to reduce the exposure to foreign exchange rate fluctuations. Forward foreign currency exchange contracts are valued daily at the current exchange rate of the underlying currency, resulting in unrealized gains (losses) which become realized at the time the forward foreign currency exchange contracts are closed or mature. Realized and unrealized gains (losses) arising from such transactions are included in net realized and unrealized gains (losses) on foreign currency transactions. The use of forward foreign currency exchange contracts does not eliminate fluctuations in the prices of the Funds’ portfolio securities. While the maximum potential loss from such contracts is the aggregate face value in U.S. dollars at the time the contract was opened, exposure is typically limited to the change in value of the contract (in U.S. dollars) over the period it remains open. The Funds could also
159
Equity Funds
March 31, 2010
be exposed to risk that counterparties of the contracts may be unable to fulfill the terms of the contracts.
Options—Columbia Value and Restructuring Fund, Columbia International Growth Fund and Columbia Pacific/Asia Fund had written covered call options to decrease each Fund’s exposure to equity risk and to increase return on instruments. Written covered call options become more valuable as the price of the underlying instruments depreciates relative to the strike price.
Writing put options tends to increase a Fund’s exposure to the underlying instrument. When a Fund writes a call or put option, an amount equal to the premium received is recorded as a liability and subsequently marked-to-market to reflect the current value of the option written. Premiums received from writing options which expire are treated as realized gains. Premiums received from writing options which are exercised or closed are added to the proceeds or offset against the amounts paid on the underlying security transaction to determine the realized gain or loss. A Fund, as a writer of an option, has no control over whether the underlying security may be sold (call) or purchased (put) and as a result bears the market risk of an unfavorable change in the price of the security underlying the written option. There is the risk that a Fund may not be able to enter into a closing transaction because of an illiquid market. A Fund identifies within its portfolio of investments cash or liquid portfolio securities equal to the amount of the written options contract commitment.
A Fund may also purchase put and call options. Purchasing call options tends to increase a Fund’s exposure to the underlying instrument. Purchasing put options tends to decrease a Fund’s exposure to the underlying instrument. The Funds may pay a premium, which is included in the Funds’ Statements of Assets and Liabilities as an investment and subsequently marked-to-market to reflect the current value of the option. The risk associated with purchasing put and call options is limited to the premium paid. Premiums paid for purchasing options which expire are treated as realized losses. Premiums paid for purchasing options which are exercised are added to the amounts paid (call) or offset against the proceeds (put) on the underlying security to determine the realized gain or loss. If a Fund enters into a closing transaction, the Fund will realize a gain or loss, depending on whether the proceeds from the closing transaction are greater or less than the cost of the option.
During the year ended March 31, 2010, Columbia Value and Restructuring Fund, Columbia International Growth Fund and Columbia Pacific/Asia Fund had entered into 9,000; 1,877 and 222 written option contracts, respectively.
The following table is a summary of the value of the Funds’ derivative instruments as of March 31, 2010.
| | | | | | | | | |
| | | | | | | |
| | | Fair Value of Derivative Instruments |
| | | Assets | | Liabilities |
| | | Statements
of Assets
and
Liabilities | | Statements
of Assets
and
Liabilities |
| | | Fair Value | | Fair Value |
Funds | | Unrealized
Appreciation
on Forward
Foreign
Currency
Exchange
Contracts | | Written
Options,
at Value | | Unrealized
Depreciation
on Forward
Foreign
Currency
Exchange
Contracts |
Columbia Value and Restructuring Fund | | $ | — | | $ | 593,000 | | $ | — |
Columbia International Growth Fund | | | 355,745 | | | 8,432 | | | 152,829 |
Columbia Pacific/Asia Fund | | | 56,956 | | | 195 | | | 28,860 |
160
Equity Funds
March 31, 2010
The effect of derivative instruments on the Statements of Operations for the year ended March 31, 2010:
| | | | | | | | | | | | | | | | |
| | | | | | | | |
| | | | | Amount of
Realized Gain
or (Loss) on
Derivatives
Recognized in
Income | | Change in
Unrealized
Appreciation
(Depreciation) on
Derivatives
Recognized
in Income | |
| Funds | | Risk
Exposure | | Written
Options | | Forward
Foreign
Currency
Exchange
Contracts | | Written
Options | | | Unrealized
Appreciation
on Forward
Foreign
Currency
Exchange
Contracts | |
Columbia Value and
Restructuring Fund | | Equity | | $ | — | | $ | — | | $ | (35,280 | ) | | $ | — | |
Columbia International Growth Fund | | Equity/
Foreign
Exchange
Rate | | | 64,927 | | | 513,912 | | | 4,009 | | | | (100,279 | ) |
Columbia Pacific/Asia Fund | | Equity/
Foreign
Exchange
Rate | | | 5,266 | | | 298,231 | | | — | | | | (17,801 | ) |
Note 7. Portfolio Information
For the year ended March 31, 2010, the cost of purchases and proceeds from sales of securities, excluding short-term obligations, for the Funds were as follows:
| | | | | | |
| | | | | |
| | | Purchases | | Sales |
Columbia Blended Equity Fund | | $ | 111,369,239 | | $ | 152,754,209 |
Columbia Energy and Natural Resources Fund | | | 2,844,000,862 | | | 2,695,066,555 |
Columbia Mid Cap Core Fund | | | 121,215,667 | | | 143,611,875 |
Columbia Select Large Cap Growth Fund | | | 1,255,611,409 | | | 397,623,120 |
Columbia Select Opportunities Fund | | | 145,729,062 | | | 216,906,759 |
Columbia Select Small Cap Fund | | | 429,238,064 | | | 365,887,600 |
Columbia Value and Restructuring Fund | | | 403,070,109 | | | 806,151,932 |
Columbia Emerging Markets Fund | | | 255,476,400 | | | 269,190,383 |
Columbia International Growth Fund | | | 199,112,860 | | | 261,316,307 |
Columbia Pacific/Asia Fund | | | 28,174,983 | | | 34,711,895 |
Note 8. Redemption-in-Kind
Sales of securities for Columbia Value and Restructuring Fund include the value of securities delivered through an in-kind redemption of certain fund shares on July 10, 2009. Any realized gain on securities deliver through an in-kind redemption of fund shares is not taxable to the Fund. The value of securities and realized gain on securities delivered through an in-kind redemption of fund shares aggregated $104,650,659 and $12,737,100, respectively.
Note 9. Regulatory Settlements
During the year ended March 31, 2010, the following Funds received payments relating to certain regulatory settlements with third parties that the Funds had participated in during the year. The payments have been included in “Increase from regulatory settlements” on the Statements of Changes in Net Assets. The payments were as follows:
| | | |
| | | |
| | | Amount |
Columbia Blended Equity Fund | | $ | 25,685 |
Columbia Energy and Natural Resources Fund | | | 35,194 |
Columbia Select Small Cap Fund | | | 18,764 |
Columbia Value and Restructuring Fund | | | 11,049 |
Columbia International Growth Fund | | | 6,592 |
Columbia Pacific/Asia Fund | | | 79,506 |
Note 10. Redemption Fees
Effective March 1, 2010, Columbia Emerging Markets Fund, Columbia International Growth Fund and Columbia Pacific/Asia Fund no longer assess a 2.00% redemption fee on the proceeds from Fund shares that are redeemed within 60 days of purchase. The redemption fees were designed to offset brokerage commissions and other costs associated with short term trading of fund shares. The redemption fees, which were retained by the Funds, were accounted for as an addition to paid-in capital and were allocated to each class based on the relative net assets at the time of the redemption. For the year ended March 31, 2010, the Funds assessed redemption fees as follows:
| | | |
| | | |
| | | Amount |
Columbia Emerging Markets Fund | | $ | 36,026 |
Columbia International Growth Fund | | | 4,246 |
Columbia Pacific/Asia Fund | | | 1,523 |
161
Equity Funds
March 31, 2010
Note 11. Line of Credit
The Funds and other affiliated funds participate in a $280,000,000 committed, unsecured revolving line of credit provided by State Street. The maximum amount that may be borrowed by any fund is limited to the lesser of $200,000,000 and the Fund’s borrowing limit set forth in the Fund’s registration statement. Borrowings are available for short-term liquidity or temporary or emergency purposes.
Effective October 15, 2009, interest is charged to each participating fund based on the fund’s borrowings at a rate per annum equal to the greater of the Federal Funds Rate plus 1.25% or the overnight LIBOR Rate plus 1.25%. In addition, a commitment fee of 0.15% per annum is accrued and apportioned among the participating funds pro rata based on their relative net assets.
Prior to October 15, 2009, interest was charged to each participating fund based on the fund’s borrowings at a rate per annum equal to the greater of the Federal Funds Rate plus 0.50% or the overnight LIBOR Rate plus 0.50%. In addition, an annual operations agency fee of $20,000, an amendment fee of 0.02% and a commitment fee of 0.12% per annum were accrued and apportioned among the participating funds pro rata based on their relative net assets.
For the year ended March 31, 2010, the average daily loan balance outstanding on days where borrowing existed, and the weighted average interest rate of each Fund that borrowed were as follows:
| | | | | | |
| | | | | | |
| Fund | | Average Daily
Loan Balance
Outstanding
on Days Where
Borrowing
Existed | | Weighted
Average
Interest
Rate | |
Columbia Blended Equity Fund | | $ | 1,200,000 | | 0.873 | % |
Columbia Energy and Natural Resources Fund | | | 5,950,000 | | 1.187 | |
Columbia Mid Cap Core Fund | | | 1,000,000 | | 1.428 | |
Columbia Select Opportunities Fund | | | 1,575,000 | | 0.720 | |
Columbia Select Small Cap Fund | | | 850,000 | | 1.423 | |
Columbia Value and Restructuring Fund | | | 5,391,837 | | 0.979 | |
Columbia Emerging Markets Fund | | | 3,005,263 | | 1.028 | |
Columbia International Growth Fund | | | 1,423,810 | | 1.026 | |
Note 12. Shares of Beneficial Interest
As of March 31, 2010, the Funds had shareholders that held greater than 5% of the shares outstanding of a Fund, whose shares were beneficially owned by participant accounts over which BOA and/or any of its affiliates had either sole or joint investment discretion. The percentages of shares of beneficial interest outstanding held therein are as follows:
| | |
| | | |
| | | % of Shares Outstanding Held |
Columbia Blended Equity Fund | | 40.0 |
Columbia Energy and Natural Resources Fund | | 18.5 |
Columbia Mid Cap Core Fund | | 53.9 |
Columbia Select Large Cap Growth Fund | | 65.7 |
Columbia Select Opportunities Fund | | 79.8 |
Columbia Select Small Cap Fund | | 52.6 |
Columbia Value and Restructuring Fund | | 24.8 |
Columbia Emerging Markets Fund | | 27.9 |
Columbia International Growth Fund | | 77.9 |
Columbia Pacific/Asia Fund | | 43.2 |
As of March 31, 2010, the Funds had shareholders that held greater than 5% of the shares outstanding of a Fund, over which BOA and/or any of its affiliates did not have investment discretion. The number of accounts and the percentages of shares of beneficial interest outstanding held therein are as follows:
| | | | |
| | | | | |
| | | Number of
Shareholders | | % of Shares Outstanding Held |
Columbia Blended Equity Fund | | 1 | | 18.9 |
Columbia Energy and Natural Resources Fund | | 1 | | 24.4 |
Columbia Mid Cap Core Fund | | 1 | | 17.6 |
Columbia Select Opportunities Fund | | 1 | | 11.6 |
Columbia Select Small Cap Fund | | 2 | | 13.6 |
162
Equity Funds
March 31, 2010
| | | | |
| | | | | |
| | | Number of
Shareholders | | % of Shares Outstanding Held |
Columbia Value and Restructuring Fund | | 2 | | 36.1 |
Columbia Emerging Markets Fund | | 4 | | 49.3 |
Columbia International Growth Fund | | 1 | | 9.8 |
Columbia Pacific/Asia Fund | | 3 | | 28.2 |
As of March 31, 2010, no other shareholders owned more than 5% of the outstanding shares of each Fund. Subscription and redemption activity of these accounts may have a significant effect on the operations of the Funds.
Note 13. Significant Risks and Contingencies
Non-Diversification Risk
As a non-diversified mutual fund, Columbia Energy and Natural Resources Fund is permitted to invest a greater percentage of its total assets in the securities of fewer issuers than a diversified fund. The Fund may, therefore, have a greater risk of loss from a few issuers than a similar fund that invests more broadly.
Foreign Securities Risk
There are certain additional risks involved when investing in foreign securities. These risks may involve foreign currency exchange rate fluctuations, adverse political and economic developments and the possible prevention of currency exchange or other foreign governmental laws or restrictions. In addition, the liquidity of foreign securities may be more limited than that of domestic securities.
Investments in emerging market countries are subject to additional risk. The risk of foreign investments is typically increased in less developed countries. These countries are also more likely to experience high levels of inflation, deflation or currency devaluation which could hurt their economies and securities markets.
Geographic Concentration Risk
Because Columbia Pacific/Asia Fund’s investments are concentrated in the Asia/Pacific region, events within the region will have a greater effect on the Fund than if the Fund were more geographically diversified. In addition, events in any one country within the region may impact the other countries or the region as a whole. Markets in the region can experience significant volatility due to social, regulatory and political uncertainties.
Information Regarding Pending and Settled Legal Proceedings
In June 2004, an action captioned John E. Gallus et al. v. American Express Financial Corp. and American Express Financial Advisors Inc. was filed in the United States District Court for the District of Arizona. The plaintiffs allege that they are investors in several American Express Company (now known as RiverSource) mutual funds and they purport to bring the action derivatively on behalf of those funds under the Investment Company Act of 1940. The plaintiffs allege that fees allegedly paid to the defendants by the funds for investment advisory and administrative services are excessive. The plaintiffs seek remedies including restitution and rescission of investment advisory and distribution agreements. The plaintiffs voluntarily agreed to transfer this case to the United States District Court for the District of Minnesota (the District Court). In response to defendants’ motion to dismiss the complaint, the District Court dismissed one of plaintiffs’ four claims and granted plaintiffs limited discovery. Defendants moved for summary judgment in April 2007. Summary judgment was granted in the defendants’ favor on July 9, 2007. The plaintiffs filed a notice of appeal with the Eighth Circuit Court of Appeals (the Eighth Circuit) on August 8, 2007. On April 8, 2009, the Eighth Circuit reversed summary judgment and remanded to the District Court for further proceedings. On August 6, 2009, defendants filed a writ of certiorari with the U.S. Supreme Court (the Supreme Court), asking the Supreme Court to stay the District Court proceedings while the Supreme Court considers and rules in a case captioned Jones v. Harris Associates, which involves issues of law similar to those presented in the Gallus case. On March 30, 2010, the Supreme Court issued its ruling in Jones v. Harris Associates, and on April 5, 2010, the Supreme Court vacated the Eighth Circuit’s decision in the Gallus case and remanded the case to the Eighth Circuit for further consideration in light of the Supreme Court’s decision in Jones v. Harris Associates.
In December 2005, without admitting or denying the allegations, American Express Financial Corporation (AEFC,
163
Equity Funds
March 31, 2010
which is now known as Ameriprise Financial, Inc. (Ameriprise Financial)), entered into settlement agreements with the Securities and Exchange Commission (SEC) and Minnesota Department of Commerce (MDOC) related to market timing activities. As a result, AEFC was censured and ordered to cease and desist from committing or causing any violations of certain provisions of the Investment Advisers Act of 1940, the Investment Company Act of 1940, and various Minnesota laws. AEFC agreed to pay disgorgement of $10 million and civil money penalties of $7 million. AEFC also agreed to retain an independent distribution consultant to assist in developing a plan for distribution of all disgorgement and civil penalties ordered by the SEC in accordance with various undertakings detailed at http://www.sec.gov/litigation/admin/ia-2451.pdf. Ameriprise Financial and its affiliates have cooperated with the SEC and the MDOC in these legal proceedings, and have made regular reports to the RiverSource Funds’ Boards of Directors/Trustees.
On November 7, 2008, RiverSource Investments, LLC, a subsidiary of Ameriprise Financial, Inc., acquired J. & W. Seligman & Co. Incorporated (Seligman). In late 2003, Seligman conducted an extensive internal review concerning mutual fund trading practices. Seligman’s review, which covered the period 2001-2003, noted one arrangement that permitted frequent trading in certain open-end registered investment companies managed by Seligman (the Seligman Funds); this arrangement was in the process of being closed down by Seligman before September 2003. Seligman identified three other arrangements that permitted frequent trading, all of which had been terminated by September 2002. In January 2004, Seligman, on a voluntary basis, publicly disclosed these four arrangements to its clients and to shareholders of the Seligman Funds. Seligman also provided information concerning mutual fund trading practices to the SEC and the Office of the Attorney General of the State of New York (NYAG).
In September 2006, the NYAG commenced a civil action in New York State Supreme Court against Seligman, Seligman Advisors, Inc. (now known as RiverSource Fund Distributors, Inc.), Seligman Data Corp. and Brian T. Zino (collectively, the Seligman Parties), alleging, in substance, that the Seligman
Parties permitted various persons to engage in frequent trading and, as a result, the prospectus disclosure used by the registered investment companies then managed by Seligman was and had been misleading. The NYAG included other related claims and also claimed that the fees charged by Seligman to the Seligman Funds were excessive. On March 13, 2009, without admitting or denying any violations of law or wrongdoing, the Seligman Parties entered into a stipulation of settlement with the NYAG and settled the claims made by the NYAG. Under the terms of the settlement, Seligman paid $11.3 million to four Seligman Funds. This settlement resolved all outstanding matters between the Seligman Parties and the NYAG. In addition to the foregoing matter, the New York staff of the SEC indicated in September 2005 that it was considering recommending to the Commissioners of the SEC the instituting of a formal action against Seligman and Seligman Advisors, Inc. relating to frequent trading in the Seligman Funds. Seligman responded to the staff in October 2005 that it believed that any action would be both inappropriate and unnecessary, especially in light of the fact that Seligman had previously resolved the underlying issue with the Independent Directors of the Seligman Funds and made recompense to the affected Seligman Funds. There have been no further developments with the SEC on this matter.
Ameriprise Financial and certain of its affiliates have historically been involved in a number of legal, arbitration and regulatory proceedings, including routine litigation, class actions, and governmental actions, concerning matters arising in connection with the conduct of their business activities. Ameriprise Financial believes that the Funds are not currently the subject of, and that neither Ameriprise Financial nor any of its affiliates are the subject of, any pending legal, arbitration or regulatory proceedings that are likely to have a material adverse effect on the Funds or the ability of Ameriprise Financial or its affiliates to perform under their contracts with the Funds. Ameriprise Financial is required to make 10-Q, 10-K and, as necessary, 8-K filings with the Securities and Exchange Commission on legal and regulatory matters that relate to Ameriprise Financial and its affiliates. Copies of these filings may be obtained by accessing the SEC website at www.sec.gov.
There can be no assurance that these matters, or the adverse publicity associated with them, will not result in increased fund redemptions, reduced sale of fund shares or other adverse consequences to the Funds. Further, although we believe proceedings are not likely to have a material adverse effect on the Funds or the ability of Ameriprise Financial or its affiliates to perform under their contracts with the Funds, these proceedings are subject to uncertainties and, as such,
164
Equity Funds
March 31, 2010
we are unable to estimate the possible loss or range of loss that may result. An adverse outcome in one or more of these proceedings could result in adverse judgments, settlements, fines, penalties or other relief that could have a material adverse effect on the consolidated financial condition or results of operations of Ameriprise Financial.
Note 14. Subsequent Events
In connection with the preparation of the financial statements of the Funds as of and for the fiscal year ended March 31, 2010, events and transactions through the date the financial statements were issued have been evaluated by the Funds’ management for possible adjustment and/or disclosure. No subsequent events or transactions have occurred that would require adjustment of the financial statements as presented. On April 30, 2010, the Transaction disclosed in Note 4 closed. Effective May 1, 2010, the New Advisor became the investment advisor and administrator of the Funds and subsequently changed its name to Columbia Management Investment Advisers, LLC. On that date, the New Transfer Agent became the transfer agent of the Funds and changed its name to Columbia Management Investment Services Corp. Also on that date, the New Distributor became the distributor of the Funds/Portfolios and changed its name to Columbia Management Investment Distributors, Inc.
165
Report of Independent Registered Public Accounting Firm
To the Board of Trustees and Shareholders of Columbia Funds Series Trust I
In our opinion, the accompanying statements of assets and liabilities, including the portfolios of investments, and the related statements of operations and of changes in net assets and the financial highlights present fairly, in all material respects, the financial position of the Columbia Blended Equity Fund, Columbia Energy and Natural Resources Fund, Columbia Mid Cap Core Fund, Columbia Select Large Cap Growth Fund, Columbia Select Opportunities Fund, Columbia Select Small Cap Fund, Columbia Value and Restructuring Fund, Columbia Emerging Markets Fund, Columbia International Growth Fund and Columbia Pacific/Asia Fund (each a series of Columbia Funds Series Trust I and hereafter collectively referred to as the “Funds”) at March 31, 2010, and the results of each of their operations for the year then ended, the changes in each of their net assets for each of the two years in the period then ended, and the financial highlights for each of the periods indicated in conformity with accounting principles generally accepted in the United States of America. These financial statements and financial highlights (hereafter referred to as “financial statements”) are the responsibility of the Funds’ management. Our responsibility is to express an opinion on these financial statements based on our audits. We conducted our audits of these financial statements in accordance with the standards of the Public Company Accounting Oversight Board (United States). Those standards require that we plan and perform the audits to obtain reasonable assurance about whether the financial statements are free of material misstatement. An audit includes examining, on a test basis, evidence supporting the amounts and disclosures in the financial statements, assessing the accounting principles used and significant estimates made by management, and evaluating the overall financial statement presentation. We believe that our audits, which included confirmation of securities at March 31, 2010 by correspondence with the custodian and brokers, provide a reasonable basis for our opinion. The financial highlights of the Funds for the period ended March 31, 2006 were audited by other auditors whose report dated May 22, 2006 expressed an unqualified opinion on those highlights.
PricewaterhouseCoopers LLP
Boston, Massachusetts
May 21, 2010
166
Federal Income Tax Information (Unaudited) – Equity Funds
Columbia Blended Equity Fund
The Fund hereby designates as a capital gain dividend with respect to the fiscal year ended March 31, 2010, $6,710,422, or, if subsequently determined to be different, the net capital gain of such year.
100.00% of the ordinary income distributed by the Fund for the fiscal year ended March 31, 2010, qualifies for the corporate dividends received deduction.
For non-corporate shareholders 100.00%, or the maximum amount allowable under the Jobs and Growth Tax Relief Reconciliation Act of 2003, of ordinary income distributed by the Fund for the fiscal year ended March 31, 2010 may represent qualified dividend income.
The Fund will notify shareholders in January 2011 of amounts for use in preparing 2010 income tax returns.
Columbia Energy and Natural Resources Fund
89.20% of the ordinary income distributed by the Fund for the fiscal year ended March 31, 2010, qualifies for the corporate dividends received deduction.
For non-corporate shareholders 98.66%, or the maximum amount allowable under the Jobs and Growth Tax Relief Reconciliation Act of 2003, of ordinary income distributed by the Fund for the fiscal year ended March 31, 2010 may represent qualified dividend income.
The Fund will notify shareholders in January 2011 of amounts for use in preparing 2010 income tax returns.
Columbia Mid Cap Core Fund
97.10% of the ordinary income distributed by the Fund for the fiscal year ended March 31, 2010, qualifies for the corporate dividends received deduction.
For non-corporate shareholders 97.10%, or the maximum amount allowable under the Jobs and Growth Tax Relief Reconciliation Act of 2003, of ordinary income distributed by the Fund for the fiscal year ended March 31, 2010 may represent qualified dividend income.
The Fund will notify shareholders in January 2011 of amounts for use in preparing 2010 income tax returns.
Columbia Select Opportunities Fund
100.00% of the ordinary income distributed by the Fund for the fiscal year ended March 31, 2010, qualifies for the corporate dividends received deduction.
For non-corporate shareholders 100.00%, or the maximum amount allowable under the Jobs and Growth Tax Relief Reconciliation Act of 2003, of ordinary income distributed by the Fund for the fiscal year ended March 31, 2010 may represent qualified dividend income.
The Fund will notify shareholders in January 2011 of amounts for use in preparing 2010 income tax returns.
Columbia Value and Restructuring Fund
100.00% of the ordinary income distributed by the Fund for the fiscal year ended March 31, 2010, qualifies for the corporate dividends received deduction.
For non-corporate shareholders 100.00%, or the maximum amount allowable under the Jobs and Growth Tax Relief Reconciliation Act of 2003, of ordinary income distributed by the Fund for the fiscal year ended March 31, 2010 may represent qualified dividend income.
The Fund will notify shareholders in January 2011 of amounts for use in preparing 2010 income tax returns.
Columbia Emerging Markets Fund
The Fund hereby designates as a capital gain dividend with respect to the fiscal year ended March 31, 2010, $17,434,004, or, if subsequently determined to be different, the net capital gain of such year.
Foreign taxes paid during the fiscal year ended March 31, 2010, of $1,065,692 are being passed through to shareholders. This represents $0.03 per share. Eligible shareholders may claim this amount as a foreign tax credit.
Gross income derived from sources within foreign countries was $7,753,254 ($0.22 per share) for the fiscal year ended March 31, 2010.
For non-corporate shareholders 48.10%, or the maximum amount allowable under the Jobs and Growth Tax Relief Reconciliation Act of 2003, of ordinary income distributed by the Fund for the fiscal year ended March 31, 2010 may represent qualified dividend income.
167
The Fund will notify shareholders in January 2011 of amounts for use in preparing 2010 income tax returns.
Columbia International Growth Fund
Foreign taxes paid during the fiscal year ended March 31, 2010, of $424,371 are being passed through to shareholders. This represents $0.03 per share. Eligible shareholders may claim this amount as a foreign tax credit.
Gross income derived from sources within foreign countries was $5,485,382 ($0.43 per share) for the fiscal year ended March 31, 2010.
6.08% of the ordinary income distributed by the Fund for the fiscal year ended March 31, 2010, qualifies for the corporate dividends received deduction.
For non-corporate shareholders 100.00%, or the maximum amount allowable under the Jobs and Growth Tax Relief Reconciliation Act of 2003, of ordinary income distributed by the Fund for the fiscal year ended March 31, 2010 may represent qualified dividend income.
The Fund will notify shareholders in January 2011 of amounts for use in preparing 2010 income tax returns.
Columbia Pacific/Asia Fund
Foreign taxes paid during the fiscal year ended March 31, 2010, of $67,887 are being passed through to shareholders. This represents $0.02 per share. Eligible shareholders may claim this amount as a foreign tax credit.
Gross income derived from sources within foreign countries was $698,768 ($0.17 per share) for the fiscal year ended March 31, 2010.
For non-corporate shareholders 97.18%, or the maximum amount allowable under the Jobs and Growth Tax Relief Reconciliation Act of 2003, of ordinary income distributed by the Fund for the fiscal year ended March 31, 2010 may represent qualified dividend income.
The Fund will notify shareholders in January 2011 of amounts for use in preparing 2010 income tax returns.
168
Fund Governance
The Trustees serve terms of indefinite duration. The names, addresses and birth years of the Trustees and Officers of the Funds of Columbia Funds Series Trust I, the year each was first elected or appointed to office, their principal business occupations during at least the last five years, the number of Funds overseen by each Trustee and other directorships they hold are shown below. Each officer listed below serves as an officer of each Fund in the Columbia Funds Complex.
Independent Trustees
| | |
Name, Address and Year of
Birth, Position with Funds, Year
First Elected or Appointed to Office | | Principal Occupation(s) During Past Five Years, Number of Funds in the Columbia
Funds Complex Overseen by Trustee, Other Directorships Held |
| |
| John D. Collins (Born 1938) | | |
c/o Columbia Management Investment Advisers, LLC One Financial Center Boston, MA 02111 Trustee (since 2005) | | Retired. Consultant, KPMG, LLP (accounting and tax firm) from July 1999 to June 2000; Partner, KPMG, LLP from March 1962 to June 1999. Oversees 65; Mrs. Fields Famous Brands LLC (consumer products); Suburban Propane Partners, L.P.; and Montpelier Re (insurance underwriting firm) |
| |
| Rodman L. Drake (Born 1943) | | |
c/o Columbia Management Investment Advisers, LLC One Financial Center Boston, MA 02111 Trustee (since 1994) and Chairman of the Board (since 2009) | | Co-Founder of Baringo Capital LLC (private equity) since 2002; CEO of Crystal River Capital, Inc. (real estate investment trust) since 2003; President, Continuation Investments Group, Inc. from 1997 to 2001. Oversees 65; Jackson Hewitt Tax Service Inc. (tax preparation services); Crystal Capital River Inc. (real estate investment trust); Student Loan Corporation (student loan provider); Celgene Corporation (global biotechnology company); and The Helios Funds (exchange-traded funds) |
| |
| Douglas A. Hacker (Born 1955) | | |
c/o Columbia Management Investment Advisers, LLC One Financial Center Boston, MA 02111 Trustee (since 1996) | | Independent business executive since May 2006; Executive Vice President–Strategy of United Airlines (airline) from December 2002 to May 2006; President of UAL Loyalty Services (airline marketing company) from September 2001 to December 2002; Executive Vice President and Chief Financial Officer of United Airlines from July 1999 to September 2001. Oversees 65; Nash Finch Company (food distributor); Aircastle Limited (aircraft leasing) |
|
| Janet Langford Kelly (Born 1957) |
c/o Columbia Management Investment Advisers, LLC One Financial Center Boston, MA 02111 Trustee (since 1996) | | Senior Vice President, General Counsel and Corporate Secretary, ConocoPhillips (integrated energy company) since September 2007; Deputy General Counsel–Corporate Legal Services, ConocoPhillips from August 2006 to August 2007; Partner, Zelle, Hofmann, Voelbel, Mason & Gette LLP (law firm) from March 2005 to July 2006; Adjunct Professor of Law, Northwestern University, from September 2004 to June 2006; Director, UAL Corporation (airline) from February 2006 to July 2006; Oversees 65; None |
| |
| Charles R. Nelson (Born 1942) | | |
c/o Columbia Management Investment Advisers, LLC One Financial Center Boston, MA 02111 Trustee (since 1981) | | Professor of Economics, University of Washington, since January 1976; Ford and Louisa Van Voorhis Professor of Political Economy, University of Washington, since September 1993; Adjunct Professor of Statistics, University of Washington, since September 1980; Associate Editor, Journal of Money Credit and Banking, 1993-2008 Consultant on econometric and statistical matters. Oversees 65; None |
169
Fund Governance (continued)
Independent Trustees (continued)
| | |
Name, Address and Year of
Birth, Position with Funds, Year
First Elected or Appointed to Office | | Principal Occupation(s) During Past Five Years, Number of Funds in the
Columbia Funds Complex Overseen by Trustee, Other Directorships Held |
| |
| John J. Neuhauser (Born 1943) | | |
c/o Columbia Management Investment Advisers, LLC One Financial Center Boston, MA 02111 Trustee (since 1984) | | President, Saint Michael’s College, since August 2007; University Professor, Boston College from November 2005 to August 2007; Academic Vice President and Dean of Faculties, Boston College from August 1999 to October 2005. Oversees 65; Liberty All-Star Equity Fund and Liberty All-Star Growth Fund, Inc. (closed-end funds) |
| |
| Jonathan Piel (Born 1938) | | |
c/o Columbia Management Investment Advisers, LLC One Financial Center Boston, MA 02111 Trustee (since 1994) | | Cable television producer and website designer; The Editor, Scientific American from 1984 to 1994; Vice President, Scientific American, Inc., from 1984 to 1994; Member, Advisory Board, Stone Age Institute, Bloomington, Indiana (research institute that explores the effect of technology on human evolution); Member, Board of Directors of the National Institute of Social Sciences, New York City; Member, Board of Trustees of the William Alanson White Institute, New York City (institution for training psychoanalysts); and Member, Advisory Board, Mount Sinai Children’s Environmental Health Center, New York. Oversees 65; None |
| |
| Patrick J. Simpson (Born 1944) | | |
c/o Columbia Management Investment Advisers, LLC One Financial Center Boston, MA 02111 Trustee (since 2000) | | Partner, Perkins Coie LLP (law firm). Oversees 65; None |
| |
| Anne-Lee Verville (Born 1945) | | |
c/o Columbia Management Investment Advisers, LLC One Financial Center Boston, MA 02111 Trustee (since 1998) | | Retired since 1997 (formerly General Manager–Global Education Industry (from 1994 to 1997), President–Application Systems Division (from 1991 to 1994), Chief Financial Officer–US Marketing & Services (from 1988 to 1991), and Chief Information Officer (from 1987 to 1988), IBM Corporation (computer and technology)). Oversees 65; None |
170
Fund Governance (continued)
Interested Trustee
| | |
Name, Address and Year of Birth,
Position with Funds, Year First
Elected or Appointed to Office | | Principal Occupation(s) During Past Five Years, Number of Funds in the Columbia
Funds Complex Overseen by Trustee, Other Directorships Held |
| |
| William E. Mayer1 (Born 1940) | | |
c/o Columbia Management Investment Advisers, LLC One Financial Center Boston, MA 02111 Trustee (since 1994) | | Partner, Park Avenue Equity Partners (private equity) since February 1999; Dean and Professor, College of Business, University of Maryland from 1992 to 1997. Oversees 65; Lee Enterprises (print media), WR Hambrecht + Co. (financial service provider); BlackRock Kelso Capital Corporation (investment company) |
| 1 | The Funds currently treat Mr. Mayer as an “interested person” (as defined in the Investment Company Act of 1940) by reason of his affiliation with WR Hambrecht + Co., a registered broker/dealer that may execute portfolio transactions for or engage in principal transactions with the Funds or other funds or accounts advised/managed by the Advisor or other Bank of America affiliates. |
The Statement of Additional Information includes additional information about the Trustees of the Funds and is available, without charge, upon request by calling 1-800-345-6611.
171
Fund Governance (continued)
Officers
| | |
| Name, Year of Birth and Address | | Principal Occupation(s) During the Past Five Years |
| |
| J. Kevin Connaughton (Born 1964) | | |
One Financial Center Boston, MA 02111 President (since 2009) | | Senior Vice President and General Manager–Mutual Fund Products, Columbia Management Investment Advisers, LLC since May 2010; President, Columbia Funds, since 2009, and RiverSource Funds, since May 2010 (previously Senior Vice President and Chief Financial Officer, Columbia Funds, from June 2008 to January 2009, Treasurer, Columbia Funds, from October 2003 to May 2008, and senior officer of various other affiliated funds since 2000); Managing Director, Columbia Management Advisors, LLC from December 2004 to April 2010. |
| |
| Michael G. Clarke (Born 1969) | | |
One Financial Center Boston, MA 02111 Senior Vice President and Chief Financial Officer (since 2009) | | Vice President, Columbia Management Investment Advisers, LLC since May 2010; Managing Director of Fund Administration, Columbia Management Advisors, LLC, from September 2004 to April 2010; senior officer of Columbia Funds and affiliated funds since 2002. |
| |
| Scott R. Plummer (Born 1959) | | |
5228 Ameriprise Financial Center Minneapolis, MN 55474 Senior Vice President Secretary and Chief Legal Officer (since 2010) | | Chief Legal Officer and Assistant Secretary, Columbia Management Investment Advisers, LLC since June 2005; Vice President and Lead Chief Counsel–Asset Management, Ameriprise Financial, Inc. since May 2010 (previously Vice President and Chief Counsel–Asset Management, from 2005 to April 2010, and Vice President–Asset Management Compliance from 2004 to 2005); Vice President, Chief Counsel and Assistant Secretary , Columbia Management Investment Distributors, Inc. since 2008; Vice President, General Counsel and Secretary, Ameriprise Certificate Company since 2005; Chief Counsel, RiverSource Distributors, Inc. since 2006; Vice President, General Counsel and Secretary, RiverSource Funds, since December 2006; Senior Vice President, Secretary and Chief Legal Officer, Columbia Funds, since May 2010. |
| |
| Linda J. Wondrack (Born 1964) | | |
One Financial Center Boston, MA 02111 Senior Vice President and Chief Compliance Officer (since 2007) | | Vice President and Chief Compliance Officer, Columbia Management Investment Advisers, LLC since May 2010; Chief Compliance Officer, Columbia Funds, since 2007, and RiverSource Funds, since May 2010; Director (Columbia Management Group, LLC and Investment Product Group Compliance), Bank of America, from June 2005 to April 2010; Director of Corporate Compliance and Conflicts Officer of MFS Investment Management (investment management) from August 2004 to May 2005. |
| |
| William F. Truscott (Born 1960) | | |
53600 Ameriprise Financial Center Minneapolis, MN 55474 Senior Vice President (since 2010) | | Chairman of the Board, Columbia Management Investment Advisers, LLC since May 2010 (previously President, Chairman of the Board and Chief Investment Officer, from 2001 to April 2010); Chief Executive Officer, U.S. Asset Management & President, Annuities, Ameriprise Financial, Inc. since May 2010 (previously President–U.S. Asset Management and Chief Investment Officer from 2005 to April 2010, and Senior Vice President–Chief Investment Officer, from 2001 to 2005); Director, President and Chief Executive Officer, Ameriprise Certificate Company since 2006; Director, Columbia Management Investment Distributors, Inc. since May 2010 (previously Chairman of the Board and Chief Executive Officer from 2008 to April 2010); Chairman of the Board and Chief Executive Officer, RiverSource Distributors, Inc. since 2006. |
172
Fund Governance (continued)
Officers (continued)
| | |
| Name, Year of Birth and Address | | Principal Occupation(s) During the Past Five Years |
| |
| Colin Moore (Born 1958) | | |
One Financial Center Boston, MA 02111 Senior Vice President (since 2010) | | Director and Chief Investment Officer, Columbia Management Investment Advisers, LLC since May 2010; Manager, Managing Director and Chief Investment Officer of Columbia Management Advisors, LLC from 2007 to April 2010; Head of Equities, Columbia Management Advisors, LLC from 2002 to 2007. |
| |
| Michael A. Jones (Born 1959) | | |
100 Federal Street Boston, MA 02110 Senior Vice President (since 2010) | | Director and President, Columbia Management Investment Advisers, LLC since May 2010; President and Director, Columbia Management Investment Distributors, Inc. since May 2010; Manager, Chairman, Chief Executive Officer and President, Columbia Management Advisors, LLC from 2007 to April 2010; Chief Executive Officer, President and Director, Columbia Management Distributors, Inc. from November 2006 to April 2010; previously, co-president and senior managing director at Robeco Investment Management. |
| |
| Amy Johnson (Born 1965) | | |
5228 Ameriprise Financial Center Minneapolis, MN 55474 Senior Vice President (since 2010) | | Senior Vice President and Chief Operating Officer, Columbia Management Investment Advisers, LLC since May 2010 (previously Chief Administrative Officer, from 2009 until April 2010, Vice President–Asset Management and Trust Company Services, from 2006 to 2009, and Vice President–Operations and Compliance from 2004 to 2006). |
| |
| Joseph F. DiMaria (Born 1968) | | |
One Financial Center Boston, MA 02111 Treasurer (since 2009) and Chief Accounting Officer (since 2008) | | Vice President, Mutual Fund Administration, Columbia Management Investment Advisers, LLC, since May 2010; Director of Fund Administration, Columbia Management Advisors, LLC from January 2006 to April 2010; Head of Tax/Compliance and Assistant Treasurer, Columbia Management Advisors, LLC, from November 2004 to December 2005. |
| |
| Marybeth Pilat (Born 1968) | | |
One Financial Center Boston, MA 02111 Deputy Treasurer (since 2010) | | Vice President, Mutual Fund Administration, Columbia Management Investment Advisers, LLC, since May 2010; Vice President, Investment Operations, Bank of America, from October 2008 to April 2010; Finance Manager, Boston Children’s Hospital from August 2008 to October 2008; Director, Mutual Fund Administration, Columbia Management Advisors, LLC, from May 2007 to July 2008; Vice President, Mutual Fund Valuation, Columbia Management Advisors, LLC, from January 2006 to May 2007; Vice President, Mutual Fund Accounting Oversight, Columbia Management Advisors, LLC from January 2005 to January 2006. |
| |
| Julian Quero (Born 1967) | | |
One Financial Center Boston, MA 02111 Deputy Treasurer (since 2008) | | Vice President, Mutual Fund Administration, Columbia Management Investment Advisers, LLC since May 2010; Director of Fund Administration, Columbia Management Advisors, LLC, from August 2008 to April 2010; Senior Tax Manager, Columbia Management Advisors, LLC from August 2006 to July 2008; Senior Compliance Manager, Columbia Management Advisors, LLC from April 2002 to August 2006. |
| |
| Stephen T. Welsh (Born 1957) | | |
One Financial Center Boston, MA 02111 Vice President (since 2006) | | President and Director, Columbia Management Investment Services Corp. since May 2010; President and Director, Columbia Management Services, Inc. from July 2004 to April 2010; Managing Director, Columbia Management Distributors, Inc. from August 2007 to April 2010. |
173
Board Consideration and Approval of Advisory Agreements
The Advisory Fees and Expenses Committee of the Board of Trustees meets several times annually to review the current advisory agreements (collectively, the “Agreements”) of the funds for which the Trustees serve as trustees (each a “fund”) and to determine whether to recommend that the full Board approve the continuation of the Agreements for an additional one-year period. After the Committee has made its recommendation, the full Board, including the Independent Trustees, determines whether to approve the continuation of the Agreements. In addition, the full Board, including the Independent Trustees, considers matters bearing on the Agreements at most of its other meetings throughout the year and meets regularly with senior management of the funds and Columbia, the funds’ investment adviser, including the senior manager of each investment area within Columbia. Through the Board’s Investment Oversight Committees, Trustees also meet with selected fund portfolio managers, research analysts and traders at various times throughout the year.
The Trustees receive and review all materials that they, their legal counsel or Columbia believe to be reasonably necessary for the Trustees to evaluate the Agreements and to determine whether to approve the continuation of the Agreements. Those materials generally include, among other items, (i) information on the investment performance of each fund relative to the performance of peer groups of mutual funds and the fund’s performance benchmarks, and additional information assessing performance on a risk-adjusted basis, (ii) information on each fund’s advisory fees and other expenses, including information comparing the fund’s expenses to those of peer groups of mutual funds and information about any applicable expense caps and fee “breakpoints,” (iii) information about the profitability of the Agreements to Columbia, including potential “fall-out” or ancillary benefits that Columbia and its affiliates may receive as a result of their relationships with the funds and (iv) information obtained through Columbia’s response to a questionnaire prepared at the request of the Trustees by counsel to the funds and independent legal counsel to the Independent Trustees. The Trustees also consider other information such as (i) Columbia’s financial results and financial condition, (ii) each fund’s investment objective and strategies and the size, education and experience of Columbia’s investment staffs and their use of technology, external research and trading cost measurement tools, (iii) the allocation of the funds’ brokerage and the use of “soft” commission dollars to pay for research products and services, (iv) Columbia’s resources devoted to, and its record of compliance with, the funds’ investment policies and restrictions, policies on personal securities transactions and other compliance policies and legal and regulatory requirements, (v) Columbia’s response to various legal and regulatory proceedings since 2003 and to the recent period of volatility in the securities markets and (vi) the economic outlook generally and for the mutual fund industry in particular. In addition, the Advisory Fees and Expenses Committee confers with the independent fee consultant (the “Fee Consultant”) appointed by the Independent Trustees pursuant to an assurance of discontinuance entered into by Columbia with the New York Attorney General (“NYAG”) to settle a civil complaint filed by the NYAG relating to trading in mutual fund shares (the “NYAG Settlement”) and reviews materials relating to the funds’ relationships with Columbia provided by the Fee Consultant. Under the NYAG Settlement, the Fee Consultant’s role is to manage the process by which management fees are negotiated so that they are negotiated in a manner that is at arms’ length and reasonable. Throughout the process, the Trustees have the opportunity to ask questions of and to request additional materials from Columbia and to consult with the Fee Consultant and independent legal counsel to the Independent Trustees.
The Board of Trustees most recently approved the continuation of the Agreements at its October, 2009 meeting, following meetings of the Advisory Fees and Expenses Committee held in December, 2008 and February, May, June, August, September and October, 2009.
The Board of Trustees also unanimously approved new advisory agreements (the “New Agreements”) for the funds with RiverSource Investments, LLC (to be renamed Columbia Management Investment Advisers, LLC) (“RiverSource”) at a meeting held on December 17, 2009. The New Agreements have since been approved by shareholders of the funds and are expected to take effect upon the closing of the acquisition of the long-term asset management business of Columbia by Ameriprise Financial, Inc. (“Ameriprise”), the parent company of RiverSource Investments, LLC (the “Transaction”).
The Advisory Fees and Expenses Committee met on multiple occasions to review the New Agreements for the funds. On
174
-
December 14, 2009, the Advisory Fees and Expenses Committee recommended that the full Board approve the New Agreements. On December 17, 2009, the full Board, including a majority of the Independent Trustees, approved the New Agreements. Prior to their approval of the New Agreements, the Advisory Fees and Expenses Committee and the Independent Trustees requested and evaluated materials from, and were provided materials and information about the Transaction and matters related to the proposals by, Bank of America Corp., Columbia, RiverSource and Ameriprise. In connection with their most recent approval of the Agreements (as discussed above) on October 28, 2009, the Advisory Fees and Expenses Committee and the Trustees requested and evaluated materials from Columbia, and discussed such materials with representatives of Columbia. The Advisory Fees and Expenses Committee, at meetings held on August 11, 2009, September 23, 2009, October 27, 2009, November 30, 2009, December 7, 2009 and December 14, 2009, and the Independent Trustees, at meetings held on August 12, 2009, August 20, 2009, October 28, 2009, December 8, 2009, December 14, 2009 and December 17, 2009, discussed the materials provided in connection with the October 28, 2009 approvals and the materials provided in connection with their consideration of the New Agreements and other matters relating to the Transaction with representatives of Bank of America Corp., Columbia, RiverSource and Ameriprise. The Trustees consulted with experienced legal counsel, who advised on the legal standards for consideration by the Trustees. The Independent Trustees also discussed the proposed approvals with independent legal counsel in private sessions.
The Trustees reviewed each New Agreement, as well as certain information obtained through RiverSource’s responses to initial and supplemental questionnaires prepared at the request of the Trustees by counsel to the funds and independent legal counsel to the Independent Trustees. The Advisory Fees and Expenses Committee and the Trustees also met with, and reviewed and considered a report prepared and provided by, the Fee Consultant (as discussed above).
In considering whether to approve the New Agreements and to approve the continuation of the Agreements, the Trustees, including the Independent Trustees, did not identify any single factor as determinative, and each weighed various factors as he or she deemed appropriate. In particular, the Trustees considered the following matters:
Matters Relating to the Agreements and the New Agreements
The nature, extent and quality of the services provided or to be provided to the funds under the Agreements and the New Agreements. The Trustees considered the nature, extent and quality of the services provided and the resources dedicated by Columbia and its affiliates (or to be provided and dedicated by RiverSource and its affiliates) to the funds.
Among other things, the Trustees considered, with respect to Columbia and its affiliates, (i) Columbia’s ability (including its personnel and other resources, compensation programs for personnel involved in fund management, reputation and other attributes) to attract, motivate and retain highly qualified research, advisory and supervisory investment professionals; (ii) the portfolio management services provided by those investment professionals; and (iii) the trade execution services provided on behalf of the funds. For each fund, the Trustees also considered the benefits to shareholders of investing in a mutual fund that is part of a family of funds offering exposure to a variety of asset classes and investment disciplines and providing a variety of fund and shareholder services.
Among other things, the Trustees considered, with respect to RiverSource and its affiliates, (i) the expected effect of the Transaction on the operations of the funds, (ii) the information provided by RiverSource with respect to the nature, extent and quality of services to be provided by it, (iii) RiverSource’s compliance program and compliance record, (iv) the ability of RiverSource (including personnel and other resources, compensation programs for personnel involved in fund management, reputation and other attributes) to attract, motivate and retain highly qualified research, advisory and supervisory investment professionals, (v) the trade execution services to be provided on behalf of the funds and (vi) the quality of RiverSource’s investment research capabilities and the other resources that it indicated it would devote to each fund. As noted above, the Trustees also considered RiverSource’s representations that the Chief Investment Officer of Columbia would serve as the Chief Investment Officer of RiverSource following the Transaction, and that the process for determining the portfolio
175
-
management team for each Fund would be substantially the same process as has customarily been followed by Columbia, and reported to the Trustees, in evaluating the performance of Columbia’s portfolio management teams. The Trustees also noted the professional experience and qualifications of the senior personnel of RiverSource. The Trustees also considered the compliance programs of and the compliance-related resources proposed to be provided to the funds by RiverSource and its affiliates, including discussions with the funds’ Chief Compliance Officer regarding RiverSource’s compliance program. The Trustees also discussed RiverSource’s compliance program with the Chief Compliance Officer for the RiverSource funds. The Trustees also considered RiverSource’s representation that the funds’ Chief Compliance Officer would serve as the Chief Compliance Officer of RiverSource following the Transaction. The Trustees considered RiverSource’s ability to provide administrative services to the funds, noting that while some Agreements contemplated the provision of certain administrative services, following the Transaction, all administrative services were anticipated to be provided pursuant to a new administrative services agreement. The Trustees also considered RiverSource’s ability to coordinate the activities of each fund’s other service providers. The Trustees considered performance information provided by RiverSource with respect to other mutual funds advised by RiverSource, and discussed with senior executives of RiverSource its process for identifying which portfolio management teams of the legacy Columbia and RiverSource organizations would be responsible for the management of the funds following the Transaction.
After reviewing those and related factors, the Trustees concluded, within the context of their overall conclusions, that the nature, extent and quality of services provided by Columbia supported the continuation of the Agreements, and that the nature, extent and quality of services expected to be provided by RiverSource supported approval of the New Agreements.
The costs of the services provided and profits realized by Columbia and its affiliates, and the expected costs of the services to be provided and the profits expected to be realized by RiverSource and its affiliates, from their relationships with the funds. With respect to Columbia and its affiliates, the Trustees considered the fees charged to the funds for advisory services as well as the total expense levels of the funds. That information included comparisons (provided by management and by an independent third-party data provider) of each fund’s advisory fees and total expense levels to those of the fund’s peer groups and information about the advisory fees charged by Columbia to comparable institutional accounts. In considering the fees charged to those accounts, the Trustees took into account, among other things, management’s representations about the differences between managing mutual funds as compared to other types of accounts, including differences in the services provided, differences in the risk profile of such business for Columbia, and the additional resources required to manage mutual funds effectively. In evaluating each fund’s advisory fees, the Trustees also took into account the demands, complexity and quality of the investment management of the fund. The Trustees considered existing advisory fee breakpoints, and Columbia’s use of advisory fee waivers and expense caps, which benefited a number of the funds. The Trustees also noted management’s stated justification for the fees charged to the funds, which included information about the investment performance of the funds and the services provided to the funds.
The Trustees considered each fund’s total expenses and actual management fees relative to those of a peer group selected by an independent third-party data provider for the purposes of expense comparisons. Specifically, Columbia Blended Equity Fund’s total expenses were in the third quintile and actual management fees were in the fifth quintile (where the lowest fees and expenses would be in the first quintile); Columbia Energy and Natural Resources Fund’s total expenses and actual management fees were in the third quintile; Columbia Mid Cap Core Fund’s total expenses were in the first quintile and actual management fees were in the third quintile; Columbia Select Large Cap Growth Fund’s total expenses and actual management fees were in the fourth quintile; Columbia Select Opportunities Fund’s total expenses were in the third quintile and actual management fees were in the fifth quintile; Columbia Select Small Cap Fund’s total expenses were in the third quintile and actual management fees were in the fourth quintile; Columbia Value and Restructuring Fund’s total expenses were in the third quintile and actual management fees were in the fourth quintile; Columbia Emerging Markets Fund’s total expenses and actual management fees were in the first quintile; Columbia International Growth Fund’s total expenses were
176
in the first quintile and actual management fees were in the fourth quintile; and Columbia Pacific/Asia Fund’s total expenses were in the first quintile and actual management fees were in the second quintile.
The Trustees also considered the compensation directly or indirectly received by Columbia and its affiliates from their relationships with the funds. The Trustees reviewed information provided by management as to the profitability to Columbia and its affiliates of their relationships with each fund, and information about the allocation of expenses used to calculate profitability. When reviewing profitability, the Trustees also considered court cases in which adviser profitability was an issue in whole or in part, the performance of the relevant funds, the expense level of each fund, and whether Columbia had implemented breakpoints and/or expense caps with respect to the fund.
In connection with the integration of the legacy Columbia and RiverSource organizations, the Trustees considered, among other things, RiverSource’s projected annual net expense synergies (reductions in the cost of providing services to the funds), the timetable over which such synergies are expected to be realized and the extent to which any such synergies are expected to be shared with the funds. The Trustees also considered information provided by RiverSource regarding their respective financial conditions. The Trustees considered that RiverSource proposed to continue voluntary expense caps currently in effect for the funds and that RiverSource had undertaken not to change these caps without further discussion with the Independent Trustees.
After reviewing those and related factors, the Trustees concluded, within the context of their overall conclusions, that the advisory fees charged to each fund, and the related profitability to Columbia and its affiliates of their relationships with the fund, supported the continuation of the Agreement pertaining to that fund, and that the expected profitability to RiverSource and its affiliates from its relationship with each fund supported the approval of the New Agreements.
Economies of Scale. With respect to Columbia and its affiliates, the Trustees considered the existence of any economies of scale in the provision by Columbia of services to each fund, to groups of related funds, and to Columbia’s investment advisory clients as a whole and whether those economies were shared with the funds through breakpoints in the investment advisory fees or other means, such as fee waivers/expense reductions and additional investments by Columbia in investment, trading and compliance resources. The Trustees noted that many of the funds benefited from breakpoints, fee waivers/expense caps, or both. In considering those issues, the Trustees also took note of the costs of the services provided (both on an absolute and a relative basis) and the profitability to Columbia and its affiliates of their relationships with the funds, as discussed above.
With respect to RiverSource and its affiliates, the Trustees considered the existence of any anticipated economies of scale in the provision by RiverSource of services to each fund, to groups of related funds and to RiverSource’s investment advisory clients as a whole, and whether those economies of scale were expected to be shared with the funds. The Trustees considered Ameriprise’s anticipated net expense synergies resulting from the Transaction, and considered the possibility that the funds might benefit from economies of scale over time as part of the larger, combined fund complex. The Trustees considered how expected synergies and potential economies of scale might benefit the funds and their shareholders. The Trustees considered the potential effect of the Transaction on the distribution of the funds, and noted that the proposed management fee schedules for the funds generally contained breakpoints that would reduce the fee rate on assets above specified threshold levels.
After reviewing those and related factors, the Trustees concluded, within the context of their overall conclusions, that the extent to which economies of scale were shared or expected to be shared with the funds supported the continuation of the Agreements and the approval of the New Agreements.
Matters Relating to the Agreements
Investment performance of the funds and Columbia. The Trustees reviewed information about the performance of each fund over various time periods, including information prepared by an independent third-party data provider that compared the performance of each fund to the performance of peer groups of mutual funds and performance benchmarks. The Trustees also reviewed a description of the third party’s methodology for identifying each fund’s peer group for purposes of performance and expense comparisons. The
177
Trustees also considered additional information that the Advisory Fees and Expenses Committee requested from Columbia relating to funds that presented relatively weaker performance and/or relatively higher fees or expenses. In the case of each fund whose performance lagged that of a relevant peer group for certain (although not necessarily all) periods, the Trustees concluded that other factors relevant to performance were sufficient, in light of other considerations, to warrant continuation of the fund’s Agreements. Those factors varied from fund to fund, but included one or more of the following: (i) that the fund’s performance, although lagging in certain recent periods, was stronger over the longer term; (ii) that the underperformance was attributable, to a significant extent, to investment decisions that were reasonable and consistent with the fund’s investment strategy and policies and that the fund was performing within a reasonable range of expectations, given those investment decisions, market conditions and the fund’s investment strategy; (iii) that the fund’s performance was competitive when compared to other relevant performance benchmarks or peer groups; (iv) that Columbia had taken or was taking steps designed to help improve the fund’s investment performance, including, but not limited to, replacing portfolio managers or modifying investment strategies; and (v) that Columbia proposed to waive advisory fees or cap the expenses of the fund.
The Trustees noted the performance of each fund through April 30, 2009 relative to that of a peer group selected by an independent third-party data provider for purposes of performance comparisons. Specifically, Columbia Blended Equity Fund’s performance was in the fourth quintile (where the best performance would be in the first quintile) for the one-year period, in the second quintile for the three-year period, in the third quintile for the five-year period and in the fifth quintile for the ten-year period; Columbia Energy and Natural Resources Fund’s performance was in the third quintile for the one- and three-year periods, and in the first quintile for the five- and ten-year periods; Columbia Mid Cap Core Fund’s performance was in the fifth quintile for the one-, three- and five-year periods, and in the fourth quintile for the ten-year period; Columbia Select Large Cap Growth Fund’s performance was in the fourth quintile for the one-year period, in the first quintile for the three- and five-year periods, and in the fifth quintile for the ten-year period; Columbia Select Opportunities Fund’s performance was in the fifth quintile for the one-year period, in the third quintile for the three-year period and in the second quintile for the five- and ten-year periods; Columbia Select Small Cap Fund’s performance was in the fourth quintile for the one-year period and in the third quintile for the three-, five- and ten-year periods; Columbia Value and Restructuring Fund’s performance was in the fifth quintile for the one-year period, in the fourth quintile for the three-year period, in the second quintile for the five-year period and in the first quintile for the ten-year period; Columbia Emerging Markets Fund’s performance was in the fourth quintile for the one-, three- and five-year periods, and in the second quintile for the ten-year period; Columbia International Growth Fund’s performance was in the fifth quintile for the one- and three-year periods, and in the fourth quintile for the five- and ten-year periods; and Columbia Pacific/Asia Fund’s performance was in the third quintile for the one- and three-year periods, and in the fifth quintile for the five- and ten-year periods.
The Trustees also considered Columbia’s performance and reputation generally, the funds’ performance as a fund family generally, and Columbia’s historical responsiveness to Trustee concerns about performance and Columbia’s willingness to take steps intended to improve performance. After reviewing those and related factors, the Trustees concluded, within the context of their overall conclusions regarding each of the Agreements, that the performance of each fund and Columbia was sufficient, in light of other considerations, to warrant the continuation of the Agreement pertaining to that fund.
Other Factors. The Trustees also considered other factors with respect to Columbia and its affiliates, which included but were not limited to the following:
| n | | the extent to which each fund had operated in accordance with its investment objective and investment restrictions, the nature and scope of the compliance programs of the funds and Columbia and the compliance-related resources that Columbia and its affiliates were providing to the funds; |
| n | | the nature, quality, cost and extent of administrative and shareholder services overseen and performed by Columbia and its affiliates, both under the Agreements and under separate agreements for the provision of transfer agency and administrative services; |
178
| n | | so-called “fall-out benefits” to Columbia and its affiliates, such as the engagement of its affiliates to provide distribution, brokerage and transfer agency services to the funds, and the benefits of research made available to Columbia by reason of brokerage commissions generated by the funds’ securities transactions, as well as possible conflicts of interest associated with those fall-out and other benefits, and the reporting, disclosure and other processes in place to disclose and monitor those possible conflicts of interest; and |
| n | | the report provided by the Fee Consultant, which included information about and analysis of the funds’ fees, expenses and performance. |
Matters Relating to the New Agreements
The Trustees considered all materials that they, their legal counsel or RiverSource believed reasonably necessary to evaluate and to determine whether to approve the New Agreements. In their deliberations, the Trustees did not identify any particular information that was all-important or controlling, and individual Trustees may have attributed different weights to the various factors. The material factors that formed the basis for the Trustees’ approvals included the factors set forth below:
| (i) | the reputation, financial strength, regulatory histories and resources of RiverSource and its parent, Ameriprise; |
| (ii) | the capabilities of RiverSource with respect to compliance, including an assessment of RiverSource’s compliance system by the funds’ Chief Compliance Officer; |
| (iii) | the qualifications of the personnel of RiverSource that would be expected to provide advisory services to each fund, including RiverSource’s representations that the Chief Investment Officer of Columbia would serve as the Chief Investment Officer of RiverSource, and that the process for determining the portfolio management team for each fund would be substantially the same process as has customarily been followed by Columbia, and reported to the Trustees, in evaluating the performance of Columbia’s portfolio management teams; |
| (iv) | the terms and conditions of the New Agreements, including the differences between the New Agreements and the Agreements; |
| (v) | the terms and conditions of other agreements and arrangements relating to the future operations of the funds, including an administrative services agreement and a Master Services and Distribution Agreement; |
| (vi) | the commitment of RiverSource and Ameriprise that there would not be any diminution in the nature, quality and extent of services provided to each fund or its shareholders following closing of the Transaction; |
| (vii) | that the Trustees recently had completed a full annual review of the Agreements, as required by the 1940 Act, for each fund and had determined that they were satisfied with the nature, extent and quality of services provided thereunder and that the management fee rate for each fund were sufficient to warrant their approval; |
| (viii) | that the advisory fee rates payable by each fund would not change; |
| (ix) | that RiverSource and Bank of America, and not any fund, would bear the costs of obtaining approvals of the New Agreement; |
| (x) | that Ameriprise and RiverSource had agreed to exercise reasonable best efforts to assure that, for a period of two years after the closing of the Transaction, there would not be imposed on any fund any “unfair burden” (within the meaning of Section 15(f) of 1940 Act) with respect to the Transaction; and |
| (xi) | that certain members of RiverSource’s management have a significant amount of experience integrating other fund families; that certain current Columbia personnel that would be integrated into RiverSource and its affiliates as a result of the Transaction also have experience in integrating fund families; and that the senior management of RiverSource following the Transaction would include certain senior executives of Columbia who are currently responsible for oversight of services provided to the funds. |
Investment Advisory Fee Rates and Other Expenses. The Trustees considered the fact that the advisory fee rates payable by each fund to RiverSource under the New Agreements are the same as those currently paid by each fund to Columbia under the Agreements. The Trustees noted that in connection with their October 28, 2009 approval of the continuance of the Agreements, they had concluded, within the context of their overall conclusions regarding each such agreement, that the advisory fees charged to each fund
179
supported the continuation of the agreement pertaining to that fund.
The Trustees noted that in certain cases the effective advisory fee rate for a RiverSource fund was lower than the proposed investment advisory fee rate for a fund with generally similar investment objectives and strategies. The Trustees also noted that RiverSource’s investment advisory fee rates for equity and balanced funds generally are subject to adjustments based on investment performance, whereas the proposed investment advisory fee rates for the funds, consistent with those in the Agreements, do not reflect performance adjustments. The Trustees considered existing advisory fee breakpoints and RiverSource’s undertaking not to change expense caps previously implemented by Columbia with respect to the funds without further discussion with the Independent Trustees.
The Trustees received and considered information about the advisory fees charged by RiverSource to institutional accounts. In considering the fees charged to those accounts, the Trustees took into account, among other things, RiverSource’s representations about the differences between managing mutual funds as compared to other types of accounts, including differences in the services provided, differences in the risk profile of such business for RiverSource and the additional resources required to manage mutual funds effectively. In evaluating each fund’s expected advisory fees, the Trustees also took into account the demands, complexity and quality of the investment management of the fund.
The Trustees also considered that for certain funds, certain administrative services that are provided under the Agreements would not be provided under the New Agreements, but under a separate administrative services agreement. The Trustees noted that, unlike fees under an advisory agreement, fees under the administrative services agreement could be changed without shareholder approval, although RiverSource had not proposed any increase in such administrative fees and any such increase would require Board approval. The Trustees also noted Ameriprise’s and RiverSource’s covenants regarding compliance with Section 15(f) of the 1940 Act.
After reviewing these and related factors, the Trustees concluded, within the context of their overall conclusions, that the expected advisory fee rates and expenses of each fund supported the approval of the New Agreements.
Other Benefits to RiverSource. The Trustees received and considered information regarding any expected “fall-out” or ancillary benefits to be received by RiverSource and its affiliates as a result of their relationships with the funds, such as the engagement of RiverSource to provide administrative services to the funds and the engagement of RiverSource’s affiliates to provide distribution and transfer agency services to the funds. The Trustees considered that the funds’ distributor, which would be an affiliate of RiverSource, retains a portion of the distribution fees from the funds and receives a portion of the sales charges on sales or redemptions of certain classes of shares of the funds. The Trustees also considered the benefits of research made available to RiverSource by reason of brokerage commissions generated by the funds’ securities transactions, and reviewed information about RiverSource’s practices with respect to allocating portfolio brokerage for brokerage and research services. The Trustees considered the possible conflicts of interest associated with certain fall-out or other ancillary benefits and the reporting, disclosure and other processes that would be in place to disclose and to monitor such possible conflicts of interest. The Trustees recognized that RiverSource’s profitability would be somewhat lower without these benefits.
Conclusions
Based on their evaluation of all factors that they deemed to be material, including those factors described above, and assisted by the advice of independent counsel and the Fee Consultant, the Trustees, including the Independent Trustees, (i) approved the continuance of each of the Agreements through October 31, 2010 and (ii) approved each New Agreement.
180
Summary of Management Fee Evaluation by Independent Fee Consultant (Columbia Management Advisors, LLC)
REPORT OF INDEPENDENT FEE CONSULTANT TO THE FUNDS SUPERVISED BY THE COLUMBIA ATLANTIC BOARD
Prepared Pursuant to the February 9, 2005 Assurance of Discontinuance among the Office of Attorney General of New York State, Columbia Management Advisors, LLC, and Columbia Management Distributors, Inc. November 6, 2009
I. Overview
On February 9, 2005, Columbia Management Advisors, LLC (“CMA”) and Columbia Management Distributors, Inc.1 (“CMDI”) agreed to the New York Attorney General’s Assurance of Discontinuance (“AOD”). Among other things, the AOD stipulates that CMA may manage or advise a Columbia Fund (“Columbia Fund” and, together with some or all of such funds, the “Columbia Funds”) only if the Independent Members of the Columbia Fund’s Board of Trustees appoint a Senior Officer or retain an Independent Fee Consultant (“IFC”) who is to manage the process by which proposed management fees are negotiated. The AOD further stipulates that the Senior Officer or IFC is to prepare a written annual evaluation of the fee negotiation process.
With effect from January 1, 2007, the Independent Members of the Board of Trustees for certain Columbia Funds known collectively as the “Atlantic Funds” (together with the other members of that Board, the “Trustees”) retained me as IFC for the Atlantic Funds.2 In this capacity, I have prepared the fifth annual written evaluation of the fee negotiation process. As was the case with the 2007 and 2008 reports, my immediate predecessor as IFC, John Rea, provided invaluable assistance in the preparation of this year’s report.
A. Role of the Independent Fee Consultant
The AOD charges the IFC with “managing the process by which proposed management fees … to be charged the Columbia Fund are negotiated so that they are negotiated in a manner which is at arms’ length and reasonable and consistent with this Assurance of Discontinuance.” The AOD also provides that CMA “may manage or advise a Columbia Fund only if the reasonableness of the proposed management fees is determined by the Board of Trustees … using … an annual independent written evaluation prepared by or under the direction of … the Independent Fee Consultant.” Therefore, the AOD makes clear that the IFC does not supplant the Trustees in negotiating management fees with CMA, nor does the IFC substitute his or her judgment for that of the Trustees with respect to the reasonableness of proposed fees or any other matter that is committed to the business judgment of the Trustees.
B. Elements Involved in Managing the Fee Negotiation Process
In preparing the report required by the AOD, the IFC must consider at least the following six factors set forth in the AOD:
| 1. | The nature and quality of CMA’s services, including the Fund’s performance; |
| 2. | Management fees (including any components thereof) charged by other mutual fund companies for like services; |
| 3. | Possible economies of scale as the Fund grows larger; |
| 4. | Management fees (including any components thereof) charged to institutional and other clients of CMA for like services; |
| 5. | Costs to CMA and its affiliates of supplying services pursuant to the management fee agreements, excluding any intra-corporate profit; and |
| 6. | Profit margins of CMA and its affiliates from supplying such services. |
C. Organization of the Annual Evaluation
This report, like last year’s, focuses on the six factors and contains a section for each factor except that CMA’s costs and profits from managing the Funds are treated in a single section. In addition to a discussion of these factors, the report offers recommendations to improve the fee review process in future years. A review of the status of recommendations made in the 2008 Report is being provided separately with the materials for the October meeting.
| 1 | CMA and CMDI are subsidiaries of Columbia Management Group, LLC (“CMG”), and are the successors to the entities named in the AOD. |
| 2 | I have no material relationship with Bank of America, CMG or any of its affiliates, aside from serving as IFC, and I am aware of no material relationship with any of their affiliates. I retained John Rea, an independent economic consultant, to assist me with this report. |
| | Unless otherwise stated or required by the context, this report covers only the Atlantic Funds, which are also referred as the “Funds.” |
181
II. Summary of Findings
A. General
| 1. | Based upon my examination of the information supplied by CMG in the light of the six factors set forth in the AOD, I conclude that the Trustees have the relevant information necessary to evaluate the reasonableness of the proposed management fees for each Atlantic Fund. |
| 2. | In my view, the process by which the proposed management fees of the Funds have been negotiated in 2009 thus far has been, to the extent practicable, at arms’ length and reasonable and consistent with the AOD. |
B. Nature and Quality of Services, Including Performance
| 3. | The performance of the Funds has been relatively strong in recent years, although the one-year record was weaker than longer-term records. Based upon 1-, 3-, 5-, and 10-year returns through April 30, 2009, at least half of all the Funds were in the first and second performance quintiles in each of the three longest performance periods; for the one-year period, 40% of the Funds were in the top two quintiles. No more than 13% of the Funds were in the fifth quintile in any one performance period. Domestic equity, quantitative equity, and taxable fixed-income Funds were the strongest performers in 2009, while most foreign equity Funds lagged behind their competitors. |
| 4. | Performance rankings were similar in 2008 and 2009: the 1- and 3-year rankings declined slightly over the previous year, while the 5-year rankings improved modestly. Year over year, for the 1- and 3-year periods, the performance of equity Funds, both domestic and international, declined, while that of fixed-income Funds improved. Between three-fifths to two-thirds of the Funds changed quintile rankings in 2009 in the 1-, 3-, and 5-year performance periods. |
| 5. | The performance of the domestic equity Funds against their benchmarks was good for the 3- and 5-year performance periods. In contrast, gross returns of international equity and fixed-income Funds typically fell short of their benchmarks. The performance of equity Funds against their benchmarks was highly correlated to performance versus their peers; no such correlation was observed for fixed-income Funds. |
| 6. | The Atlantic equity Funds’ overall performance adjusted for risk was solid. Based upon 3-year returns, nearly 57% of the equity Funds had a combination of risk-adjusted and unadjusted returns that placed them in the top half of their performance universes. About one quarter of the fixed-income Funds posted high returns and low risk relative to comparable funds. Just over half of the fixed-income Funds, primarily tax-exempt Funds, took on more risk than the typical fund in their performance universes. |
| 7. | The industry-standard procedure used by Lipper that includes all share classes in the performance universe tends to bias a Fund’s ranking upward within that universe. The bias occurs because either no-12b-1 fee or low-12b-1 fee share classes of the Atlantic Funds are compared with funds in performance universes that include all share classes of multi-class funds with 12b-1 fees of up to 100 basis points. Correcting this bias by limiting the performance universe to classes of comparable funds with low or no 12b-1 fees (a “filtered universe”) lowers the relative performance for the Funds, but not to a material extent. The filtering process, however, did identify one Fund for further review that had not been identified as a review fund using unfiltered universes. Conversely, two Funds that had been identified as review funds in the unfiltered universe lost that status in filtered universes. |
| 8. | A small number of Funds have consistently underperformed over the past five years. The exact number depends on the criteria used to evaluate longer-term performance. For example, only three Funds had below-median performance in each 1- and 3-year period from 2005 to 2009. |
| 9. | The services performed by CMG professionals beyond portfolio management, such as compliance, legal, information technology, risk management, finance, and fund administration, are critical to the success of the Funds and appear to be of high quality. |
C. Management Fees Charged by Other Mutual Fund Companies
| 10. | The Funds’ management fees and total expenses are generally low relative to those of their peers, with over half of the Funds in the most favorable two quintiles. Only 26% of the Funds ranked in the two most expensive quintiles for actual management fees, and 18% in those quintiles for total expenses. Two Funds are in the fifth quintile for total |
182
| | expenses; four Funds are in the fifth quintile for actual management fees. |
| 11. | The highest concentration of low-expense Funds is found among the foreign equity Funds. The 12 former Excelsior Funds have relatively high fees and expenses, with two-thirds ranking in either the fourth or fifth quintiles for actual management fees. The higher actual management fee rankings of certain former Excelsior Funds are due in part to fee schedules that are higher than standard Columbia Fund fee schedules at current asset levels. |
| 12. | The distribution of total expense and management fee rankings has improved over the prior two years. The implementation of the voluntary standardized cap system has contributed significantly to the improved rankings in 2009. |
| 13. | The management fees of the Atlantic Funds are generally in line with those of Columbia Funds supervised by the Nations Board of Trustees (the “Nations Funds”). To the extent that Atlantic Funds have higher average fees in certain investment categories than Nations Funds, the difference reflects either differences in asset size, different fee structures of the former Excelsior Funds, or special circumstances of the Funds included in the investment categories. |
D. Trustees’ Advisory Contract Review Process
| 14. | The Trustees’ evaluation process identified 16 Funds in 2009 for further review based upon long-standing criteria relating to their relative performance or expenses or both. When compared in filtered universes, one additional Fund met the criteria for further review. CMG provided further information about each of those Funds to assist the Trustees in their evaluation. |
E. Potential Economies of Scale
| 15. | CMG presented to the Trustees its analysis of the sources and sharing of potential economies of scale. CMG views economies of scale as arising at the complex level and would regard estimates of scale economies for individual funds as unreliable. In its analysis, CMG did not identify specific sources of economies of scale or provide any estimates of any economies of scale that might arise from future asset growth. CMG’s analysis included measures taken by the Trustees and CMG that seek to share any potential economies of scale through breakpoints in management fee schedules, the establishment of expense limits for each Fund, enhanced shareholder services, fund mergers, and operational consolidation. |
| 16. | An examination of the contractual fee schedules for five Atlantic Funds shows that those with standard fee structures are generally in line with those of their competitors. The fee schedules of the former Excelsior Funds, however, have high initial fees relative to competitors but otherwise have comparable breakpoint structures. |
F. Management Fees Charged to Institutional Clients
| 17. | CMG has provided Trustees with comparisons of mutual fund management fees and institutional fees based upon standardized fee schedules and upon actual fees. The results show that, consistent with industry practice, actual and scheduled institutional fees are generally lower than the Funds’ management fees. CMG provided additional data this year demonstrating that at small asset levels, the effective fee of certain Funds may be equal to or less than institutional fee levels at those asset levels, due to the effect of expense limits on small funds with high gross expenses. CMG also analyzed the differences between the services provided and risks borne on the one hand by a manager of mutual funds and on the other by institutional advisers, and suggested that these differences should be kept in mind when Trustees review the reasonableness of the Funds’ management fees. |
G. Revenues, Expenses, and Profits
| 18. | The activity-based cost allocation methodology employed by CMG to allocate costs, both direct and indirect, for purposes of calculating Fund profitability is thoughtful and detailed. This year, CMG further refined the technique by allocating additional indirect expenses on an activity basis. |
| 19. | The materials provided on CMG’s revenues and expenses with respect to the Funds and the methodology underlying their construction form a sufficient basis for Trustees to evaluate the expenses of and profitability to CMG arising out of its relationships with the Funds. |
183
| 20. | CMG provided a firm-wide pro forma 2009 income statement demonstrating the effect of market events beginning in the fourth quarter of 2008 on its revenues and profitability to provide an additional perspective on calendar 2008 profitability data. In particular, 2008 revenues reflected the higher market prices prevailing during the first three quarters of that year, while expenses dropped due to cost cutting in the wake of the market downturn late in 2008. The continuing effects of this downturn are expected to produce a significant decline in profitability this year. |
| 21. | In 2008, CMG’s pre-tax post-distribution margin on the Atlantic Fund complex was above industry medians, based on the limited data available for publicly held mutual fund managers. However, as is to be expected in a large fund complex, some Atlantic Funds had relatively high pre-tax profit margins in 2008, when calculated solely with respect to management revenues and expenses, while other Atlantic Funds operated at a loss. There is a positive relationship between Fund size and profitability to CMG, with smaller Funds generally operating at a loss to CMG. |
| 22. | CMG pays a fixed percentage of its management fee revenues to an affiliate, U.S. Trust, Bank of America Private Wealth Management, with respect to assets of its clients invested in Atlantic Funds to compensate it for services it performs with respect to those client assets and for the effect of state law limitations on affiliates charging multiple fees. Based on our analysis of the services provided by this affiliate, we have concluded that all payments other than those for sub-transfer agent or sub-accounting services should be treated as a distribution expense. |
III. Recommendations
| 1) | Criteria for review. The Trustees may wish to consider modifying the criteria for identifying a Fund for further review (a “Review Fund”) to include criteria that focus exclusively on performance. The Trustees’ supplementary data request included one such criterion. They may also wish to consider whether it would be useful to apply CMG’s own internal monitoring standards for Fund performance to the contract review process, or whether such criteria are more relevant to their ongoing investment oversight. |
| 2) | Presentation of Review Fund discussion. CMG should consider whether it could more systematically present in one discussion all relevant information regarding each Review Fund, which is now split into several different portions of the 15(c) materials. For any Fund that has been a Review Fund in consecutive years, CMG should address under what circumstances it could reasonably be anticipated that the Fund would lose that status. |
| 3) | Refinement of tax-exempt performance data. Certain single-state tax-exempt Funds compete in extremely small universes and are compared to a multi-state benchmark of uncertain relevance. Notwithstanding the difficulties, CMG should work to improve the reliability of the calculation of relative performance of these Funds. If that is not possible, CMG should provide guidance on how the Trustees should judge the quality of CMG’s management of these Funds. |
| 4) | Development of risk metrics for asset-allocation, tax-exempt, and money market funds. CMG has developed and shared with the Trustees quantitative risk metrics comparing equity and taxable fixed-income Funds against their peers. However, reliable risk metrics have not been developed for asset-allocation, tax-exempt fixed income, and money market funds. We urge CMG to continue its efforts to provide reliable risk measures for these categories of Funds, especially in the cases of asset-allocation and money market funds, because their investors are likely to be motivated at least in part by a desire to manage risk. |
| 5) | Profitability data. For any period during which CMG is an affiliate of U.S. Trust, Bank of America Private Wealth Management, CMG should continue to present to the Trustees the profitability of each Fund, each investment style and each complex (of which Atlantic is one) calculated as follows: |
| | a. | Management-only profitability should be calculated without reference to any Private Bank expense. |
| | b. | Profitability excluding distribution (which essentially covers the management and transfer agency functions) should be adjusted by removing from the expense calculation any portion of the Private Bank payment not attributable to the performance by the Private Bank of sub-transfer agency or sub-accounting functions. |
| | c. | Total profitability, including distribution: No adjustment for Private Bank expenses should be made, because all such expenses represent legitimate fund |
184
| | expenses to be taken into account in calculating CMG’s profit margin including distribution. |
| | d. | Distribution only: This should include all Private Bank expenses other than those attributable to sub-transfer agency services. |
| 6) | Contractual fee analysis. This year CMG presented a new Lipper report comparing the contractual management fees of Funds with those of competitors in similar investment styles. However, the reliability of the conclusion – that Fund management fee breakpoints compared favorably with competitive fee rates – was limited by the use of competitive funds at all asset levels. The sponsors of a $100 million mutual fund may not have given much thought to breakpoints at $5 billion; therefore, that fund’s contractual fee at that level is unlikely to compare favorably with that of a $5 billion Fund. Limiting the competitors to the Lipper expense group, whose constituents are similar in size to the relevant Fund, would make the results more meaningful. In addition, the breakpoints of a select group of Atlantic Funds (which would differ each year) should continue to be compared to those of industry rivals to ensure that the Funds’ breakpoint schedules remain within industry norms. As breakpoint schedules change relatively little each year, performing such a comparison for each Atlantic Fund each year would not be an efficient use of Trustee and CMG resources. |
| 7) | Pro forma profitability data. In any year in which CMG or the Trustees believe that the prior year’s profitability is unlikely to be representative of current business results due to changes in markets or for any other reason, CMG should, consistent with this year’s practice, prepare a pro forma income statement based on year-to-date actual data and reasonable projections used for its own business planning purposes. |
| 8) | Additional institutional data and analysis. While CMG provided a substantial amount of information on its institutional business, including a virtually complete database of all institutional accounts, we suggest some additional items for future years: (a) profitability data for the institutional business in the format, and based upon the same allocation methodologies, used to present Fund profitability, (b) an explanation of how CMA sets institutional fee breakpoints, which normally begin at asset levels far lower than those found in Fund management fee breakpoints, and (c) an analysis of differences in actual fees within specific investment categories, with special attention given to accounts established before and after the implementation of the standardized institutional fee schedules in 2005. |
| 9) | Management fee disparities. In any future study of management fees, CMG and the Atlantic Trustees should analyze the differences in management fee schedules, including those arising out of the reorganization of the former Excelsior Funds as Atlantic Funds. As part of that analysis, CMG should provide an explanation for any significant fee differences among comparable funds across fund families sponsored by CMG, such as differences in the management styles of different Funds included the same Lipper category. Finally, if CMG proposes a management fee change or an expense cap for any mutual fund managed by CMA that is comparable to any Atlantic Fund, CMG should provide the Trustees with sufficient information about the proposal to allow the Trustees to assess the applicability of the proposed change to the relevant Atlantic Fund or Funds. |
| 10) | Explanation of data supplied to Lipper. Each year, as part of the 15(c) process, CMG retains Lipper to compare the fees and expenses of each Fund to a group of competitors. In many cases, CMG, with the approval of the Trustees, adjusts the actual expense data, which is based on the most recent full fiscal year of the Fund (and each competitive fund) to reflect changes in fees or expense limits that occurred during or after the relevant fiscal year. This improves the reliability and usefulness of the comparison. However, to ensure that the Trustees know when and how CMG adjusted the data, we recommend that CMG prepare a table listing for each Fund what adjustments were made, e.g., to reflect a new expense limitation of x basis points that commenced on y date. |
Reduction of volume of paper documents submitted. The effort to streamline and better organize the data presented to the Trustees and the process by which that data was prepared and organized continued to be well-received by all parties. Notwithstanding past success, it is always appropriate to look for opportunities to reduce and simplify the presentation of 15(c) data. One possibility would be to remove the 124 pages of biographical data, most if not all of which the Trustees have
185
previously seen as part of their ongoing investment oversight duties, from the paper volume and post it on the Internet-based document storage and retrieval system used by the Funds to provide reference data to Trustees.
Respectfully Submitted,
Steven E. Asher
186
Summary of Management Fee Evaluation by Independent Fee Consultant (RiverSource Investments, LLC)
REPORT OF INDEPENDENT FEE CONSULTANT TO THE FUNDS SUPERVISED BY THE COLUMBIA ATLANTIC BOARD
Prepared Pursuant to the February 9, 2005 Assurance of Discontinuance among the Office of Attorney General of New York State, Columbia Management Advisors, LLC, and Columbia Management Distributors, Inc. December 21, 2009
I. Overview
On February 9, 2005, Columbia Management Advisors, LLC (“CMA”) and Columbia Management Distributors, Inc.1 (“CMD”) agreed to the New York Attorney General’s Assurance of Discontinuance (“AOD”). Among other things, the AOD stipulates that CMA may manage or advise a Columbia Fund (“Columbia Fund” and, together with some or all of such funds, the “Columbia Funds”) only if the Independent Members of the Columbia Fund’s Board of Trustees appoint a Senior Officer or retain an Independent Fee Consultant (“IFC”) who is to manage the process by which proposed management fees are negotiated. The AOD further stipulates that the Senior Officer or IFC is to prepare a written annual evaluation of the fee negotiation process.
With effect from January 1, 2007, the Independent Members of the Board of Trustees for certain Columbia Funds known collectively as the “Atlantic Funds” (together with the other members of that Board, the “Trustees”) retained me as IFC for the Atlantic Funds.2 In this capacity, I have prepared this written evaluation of the fee negotiation process. As was the case with the last three annual reports, my immediate predecessor as IFC, John Rea, provided invaluable assistance in the preparation of this report.
On September 29, 2009, Ameriprise entered into an asset purchase agreement with Bank of America, N.A. and its parent, Bank of America Corporation (together, the “Bank”) pursuant to which the Bank agreed to sell certain CMG assets relating to Columbia’s long-term asset management business, including management of the Atlantic Funds (the “Transaction”).3 The Transaction if completed would result in the termination of the existing Investment Management Agreements with CMA. Therefore, the Trustees have been requested to approve and recommend to the shareholders of each Atlantic Fund new Investment Management and Sub-Advisory Agreements (together, the “Management Agreements”) with RiverSource Investments, LLC (“RI”),4 investment manager of the RiverSource Funds and a subsidiary of Ameriprise. This report is intended to fulfill the requirements of the AOD with respect to the Trustees’ consideration of the new Management Agreements.
A. Role of the Independent Fee Consultant
The AOD charges the IFC with “managing the process by which proposed management fees … to be charged the Columbia Fund are negotiated so that they are negotiated in a manner which is at arms’ length and reasonable and consistent with this Assurance of Discontinuance.” The AOD also provides that CMA “may manage or advise a Columbia Fund only if the reasonableness of the proposed management fees is determined by the Board of Trustees … using … an annual independent written evaluation prepared by or under the direction of … the Independent Fee Consultant.” Therefore, the AOD makes clear that the IFC does not supplant the Trustees in negotiating management fees with CMA (or RI), nor does the IFC substitute his or her judgment for that of the Trustees with respect to the reasonableness of proposed fees or any other matter that is committed to the business judgment of the Trustees.
| 1 | CMA and CMD are subsidiaries of Columbia Management Group, LLC (“CMG”), and are the successors to the entities named in the AOD. |
| 2 | I have no material relationship with Bank of America, CMG or Ameriprise Financial, Inc. (“Ameriprise”), aside from serving as IFC, and I am aware of no material relationship with any of their affiliates. I retained John Rea, an independent economic consultant, to assist me with this report. |
| | Unless otherwise stated or required by the context, this report covers only the Atlantic Funds. |
| 3 | Preliminary Response of Ameriprise to Information Request of Columbia Atlantic Board dated October 21, 2009 (hereafter, the “Preliminary Response”), p. 1. The one money market Atlantic Fund, Money Market Fund VS, was included in the Transaction because it was an integral part of CMG’s array of Funds used as investment vehicles by variable annuity and similar insurance products. |
| 4 | Ameriprise intends to re-brand RI with the “Columbia” name (which is one of the assets being sold in the Transaction). Preliminary Response, pp. 4-5. In the case of new Sub-Advisory Agreements, the current sub-adviser would also be a party. |
187
B. Elements Involved in Managing the Fee Negotiation Process
In preparing the report required by the AOD, the IFC must consider at least the following six factors set forth in the AOD:
| 1. | The nature and quality of the adviser’s services, including the Fund’s performance; |
| 2. | Management fees (including any components thereof) charged by other mutual fund companies for like services; |
| 3. | Possible economies of scale as the Fund grows larger; |
| 4. | Management fees (including any components thereof) charged to institutional and other clients of the adviser for like services; |
| 5. | Costs to the adviser and its affiliates of supplying services pursuant to the management fee agreements, excluding any intra-corporate profit; and |
| 6. | Profit margins of the adviser and its affiliates from supplying such services. |
C. Data Presented to the Trustees
In considering the proposed new Management Agreements with RI, the Trustees relied in part on the data that had been prepared as part of their annual contract review process, which concluded in late October. This data remained relevant because the fees in the proposed Management Agreements were identical to the fees approved at that time. The annual review materials included a Lipper report on the performance of each Atlantic Fund compared to its peers and its benchmark, comparisons of the fees and expenses of each Atlantic Fund to similar CMG-sponsored Funds, comparable competitive funds chosen by Lipper, and institutional accounts advised by CMA, revenues, expenses, and profits of CMG from managing the Atlantic Funds, calculated both by Fund and collectively, and CMG’s views on the existence and sharing of economies of scale.
In addition, the Trustees reviewed materials specific to the proposed new Management Agreements with RI in response to requests for information made on behalf of the Trustees, including the following:
| n | | Performance data for the RiverSource Funds showing percentile and quartile rankings of each fund within its Lipper performance universe for periods up to five years and net returns of each fund relative to its benchmark returns. This data was arguably relevant due to the possibility that some RiverSource investment teams would be providing investment management services to certain Columbia Funds. 5 |
| n | | tables comparing the fee schedules and effective fee rates of funds managed by CMA and RI and institutional accounts advised by the two firms. |
| n | | extensive discussion of the process by which the various components of the two asset management businesses would be integrated including investment management, compliance, transfer agency, custody, fund accounting, and distribution. |
| n | | information about the financial condition of Ameriprise, including its most recent annual report on Form 10-K, RI’s profit margins from managing the RiverSource Funds in 2007 and 2008, and pro forma income statements for the combined Columbia and RiverSource fund complex. |
| n | | disclosure that certain senior CMG executives, including President Michael Jones, Chief Investment Officer Colin Moore, Head of Mutual Funds J. Kevin Connaughton, and Chief Compliance Officer Linda Wondrack would continue in analogous capacities following the consummation of the Transaction, and |
| n | | a breakdown of the synergies RI expects to realize in the two years following the Transaction and the extent to which those potential synergies are expected to be shared with shareholders of funds advised by RI. |
II. Findings
| 1. | Based upon my examination of the information supplied by CMG and Ameriprise in the light of the six factors set forth in the AOD, I conclude that the Trustees have the relevant information necessary to evaluate the reasonableness of the proposed management fees for each Atlantic Fund. |
| 2. | In my view, the process by which the proposed management fees of the Atlantic Funds have been negotiated with RI thus far has been, to the extent practicable, at arms’ length and reasonable and consistent with the AOD. |
Respectfully submitted,
Steven E. Asher
| 5 | On page 20 of its Supplemental Response to the Atlantic Trustees (undated but delivered November 24, 2009), Ameriprise said that “most personnel decisions, including with respect to the portfolio management teams for the Atlantic Funds … will be made primarily by [current CMA CIO] Colin Moore using the Columbia 5P process.” |
188
Proxy Voting Results
On March 3, 2010, a special meeting of shareholders of Columbia Funds Series Trust I was held to consider the approval of several proposals listed in the proxy statement for the meeting. Proposal 1 and Proposal 2 were voted on at the March 3, 2010 meeting of shareholders and Proposal 3 was voted on at an adjourned meeting of shareholders held on March 31, 2010. The shareholder meeting results are as follows:
Proposal 1: A proposed Investment Management Services Agreement with Columbia Management Investment Advisers, LLC (formerly, RiverSource Investments, LLC) (CMIA) was approved for each Fund as follows:
| | | | | | | | |
| | | | | | | | | |
| Fund | | Votes For | | Votes Against | | Abstentions | | Broker Non-Votes |
| Columbia Blended Equity Fund | | 81,331,939 | | 4,018,722 | | 2,353,007 | | 8,776,504 |
| Columbia Energy and Natural Resources Fund | | 342,698,549 | | 10,446,235 | | 8,863,289 | | 100,720,512 |
| Columbia Mid Cap Core Fund | | 45,842,410 | | 622,145 | | 547,230 | | 6,077,742 |
| Columbia Select Large Cap Growth Fund | | 1,426,331,700 | | 6,693,300 | | 6,667,816 | | 246,599,537 |
| Columbia Select Opportunities Fund | | 95,992,863 | | 993,793 | | 397,460 | | 3,504,932 |
| Columbia Select Small Cap Fund | | 375,495,940 | | 4,285,642 | | 5,841,808 | | 69,248,841 |
| Columbia Value and Restructuring Fund | | 3,555,636,375 | | 327,971,692 | | 91,765,112 | | 729,112,209 |
| Columbia Emerging Markets Fund | | 237,152,166 | | 5,603,391 | | 3,487,783 | | 32,869,386 |
| Columbia International Growth Fund | | 120,313,435 | | 1,857,218 | | 818,311 | | 6,013,223 |
| Columbia Pacific/Asia Fund | | 16,153,051 | | 828,095 | | 258,692 | | 1,735,340 |
Proposal 2: A proposal authorizing CMIA to enter into and materially amend subadvisory agreements for the Fund in the future, with the approval of the Trust’s Board of Trustees, but without obtaining additional shareholder approval, was approved for each Fund as follows:
| | | | | | | | |
| | | | | | | | | |
| Fund | | Votes For | | Votes Against | | Abstentions | | Broker Non-Votes |
| Columbia Blended Equity Fund | | 77,240,736 | | 8,693,656 | | 1,769,253 | | 8,776,526 |
| Columbia Energy and Natural Resources Fund | | 322,865,761 | | 29,663,999 | | 9,478,392 | | 100,720,432 |
| Columbia Mid Cap Core Fund | | 43,545,812 | | 2,937,283 | | 528,622 | | 6,077,811 |
| Columbia Select Large Cap Growth Fund | | 1,406,478,704 | | 25,906,773 | | 7,307,330 | | 246,599,547 |
| Columbia Select Opportunities Fund | | 94,068,203 | | 2,677,965 | | 637,937 | | 3,504,943 |
| Columbia Select Small Cap Fund | | 342,418,111 | | 36,599,535 | | 6,605,729 | | 69,248,854 |
| Columbia Value and Restructuring Fund | | 3,275,084,910 | | 608,299,815 | | 91,987,818 | | 729,112,845 |
| Columbia Emerging Markets Fund | | 231,553,319 | | 10,972,630 | | 3,717,391 | | 32,869,386 |
| Columbia International Growth Fund | | 117,758,901 | | 4,451,332 | | 778,668 | | 6,013,287 |
| Columbia Pacific/Asia Fund | | 15,662,030 | | 1,316,514 | | 261,294 | | 1,735,340 |
189
Proposal 3: Each of the nominees for trustees was elected to the Trust’s Board of Trustees, as follows:
| | | | | | |
| | | | | | | |
| Trustee | | Votes For | | Votes Withheld | | Abstentions |
| John D. Collins | | 30,977,072,412 | | 859,827,038 | | 0 |
| Rodman L. Drake | | 30,951,179,004 | | 885,720,446 | | 0 |
| Douglas A. Hacker | | 30,989,793,279 | | 847,106,171 | | 0 |
| Janet Langford Kelly | | 30,999,020,814 | | 837,878,636 | | 0 |
| William E. Mayer | | 16,291,139,483 | | 15,545,759,967 | | 0 |
| Charles R. Nelson | | 30,997,700,700 | | 839,198,750 | | 0 |
| John J. Neuhauser | | 30,988,095,661 | | 848,803,789 | | 0 |
| Jonathon Piel | | 30,968,801,048 | | 868,098,402 | | 0 |
| Patrick J. Simpson | | 30,999,065,030 | | 837,834,420 | | 0 |
| Anne-Lee Verville | | 30,996,227,913 | | 840,671,537 | | 0 |
190
[THIS PAGE INTENTIONALLY LEFT BLANK]
191
[THIS PAGE INTENTIONALLY LEFT BLANK]
192
Important Information About This Report
Transfer Agent*
Columbia Management Investment Services Corp.
P.O. Box 8081
Boston, MA 02266-8081
1-800-345-6611
Distributor*
Columbia Management Investment
Distributors, Inc.
One Financial Center
Boston, MA 02111
Investment Advisor*
Columbia Management Investment Advisers, LLC
100 Federal Street
Boston, MA 02110
* As of May 1, 2010.
The funds mail one shareholder report to each shareholder address. If you would like more than one report, please call shareholder services at 1-800-345-6611 and additional reports will be sent to you. This report has been prepared for shareholders of Equity Funds.
A description of the policies and procedures that each fund uses to determine how to vote proxies and a copy of each fund’s voting records are available (i) at www.columbiamanagement.com, (ii) on the Securities and Exchange Commission’s website at www.sec.gov, and (iii) without charge, upon request, by calling 1-800-368-0346. Information regarding how each fund voted proxies relating to portfolio securities during the 12-month period ended June 30 is available from the SEC’s website. Information regarding how each fund voted proxies relating to portfolio securities is also available from the funds’ website, www.columbiamanagement.com.
Each fund files a complete schedule of portfolio holdings with the SEC for the first and third quarters of each fiscal year on Form N-Q. Each fund’s Form N-Q is available on the SEC’s website at www.sec.gov and may be reviewed and copied at the SEC’s Public Reference Room in Washington, D.C. Information on the operation of the Public Reference Room may be obtained by calling 1-800-SEC-0330.
Investors should consider the investment objectives, risks, charges and expenses of a mutual fund carefully before investing. For a free prospectus, which contains this and other important information about the funds, visit columbiamanagement.com. Read the prospectus carefully before investing.
On April 30, 2010, Ameriprise Financial, Inc., the parent company of RiverSource Investments, LLC, acquired the long-term asset management business of Columbia Management Group, LLC, including certain of its affiliates, which were, prior to this acquisition, part of Bank of America. In connection with the acquisition of the long-term assets, the Columbia Funds have a new investment adviser, RiverSource Investments, LLC, which is now known as Columbia Management Investment Advisers, LLC. For those clients that use the services of a subadviser, those arrangements are continuing unless notified otherwise. RiverSource Fund Distributors, Inc., now known as Columbia Management Investment Distributors, Inc., member FINRA, will act as the principal distributor of the Columbia Funds.
193

One Financial Center
Boston, MA 02111-2621
Equity Funds
Annual Report, March 31, 2010
©2010 Columbia Management Investment Advisers, LLC. All rights reserved.
One Financial Center, Boston, MA 02111-2621
800.345.6611 www.columbiafunds.com
SHC-42/44410-0310 (05/10) 10/95L0Z1

Annual Report
March 31, 2010
Columbia Bond Fund
Not FDIC Insured Ÿ May Lose Value Ÿ No Bank Guarantee
Table of Contents
The views expressed in this report reflect the current views of the respective parties. These views are not guarantees of future performance and involve certain risks, uncertainties and assumptions that are difficult to predict, so actual outcomes and results may differ significantly from the views expressed. These views are subject to change at any time based upon economic, market or other conditions and the respective parties disclaim any responsibility to update such views. These views may not be relied on as investment advice and, because investment decisions for a Columbia Fund are based on numerous factors, may not be relied on as an indication of trading intent on behalf of any particular Columbia Fund. References to specific securities should not be construed as a recommendation or investment advice.
President’s Message

Dear Shareholder:
On May 3, 2010, Ameriprise Financial, Inc. announced that it had completed the acquisition of the long-term asset management business of Columbia Management from Bank of America. This includes the business of managing its equity and fixed-income mutual funds. Ameriprise Financial has combined its current U.S. asset management business, RiverSource Investments, LLC, with Columbia Management. This transaction puts together two leading asset management firms to create one entity that ranks as the eighth largest manager of long-term mutual fund assets in the United States.1 This combined business will operate under the well-regarded Columbia Management brand, where we will build on the strengths of our combined investment capabilities and talent, our broad and diversified product lineup and exceptional service.
Our combined business has a new breadth and depth of investment choices. William “Ted” Truscott, CEO, U.S. asset management and president of annuities for Ameriprise Financial, leads the combined U.S. asset management business. Michael Jones serves as president, U.S. asset management. Colin Moore continues to serve as chief investment officer. I am also continuing in my role as head of mutual funds, responsible for the delivery of mutual fund products and services to investors. The Columbia funds’ advisers, distributor and transfer agent are now subsidiaries of our parent company, Ameriprise Financial but operate under the Columbia Management name. You will begin to see these names used in communications and statements going forward.
| | |
| | | Service provider name |
| Advisers | | Columbia Management Investment Advisers, LLC Columbia Wanger Asset Management, LLC |
| Distributor | | Columbia Management Investment Distributors, Inc. |
| Transfer Agent | | Columbia Management Investment Services Corp. |
As a valued investor in Columbia funds, please know that our goal is to ensure a smooth transition and provide the highest quality products and services. Transition teams across the organization continue their efforts to build on best practices from both legacy organizations with integration efforts including rebranding, vendor and system consolidations and client communications. Additionally, we want to assure you that the funds’ portfolio managers also continue to focus on providing uninterrupted service to all fund shareholders.
Although we have a lot of work ahead of us in 2010, Columbia Management and Ameriprise Financial are excited about the opportunities for our combined organization. I share this optimism and believe it positions us as a best-in-class asset management business with the ability to deliver more for our clients than ever before.
Sincerely,

J. Kevin Connaughton
President, Columbia Funds
| 1 | Source: Ameriprise Financial, Inc., based on March 31, 2010 data from the Investment Company Institute |
Investors should consider the investment objectives, risks, charges and expenses of a mutual fund carefully before investing. For a free prospectus, which contains this and other important information about the funds, visit columbiamanagement.com. Read the prospectus carefully before investing.
Securities products offered through Columbia Management Investment Distributors, Inc. (formerly known as RiverSource Fund Distributors, Inc.), member FINRA. Advisory services provided by Columbia Management Investment Advisers, LLC (formerly known as RiverSource Investments, LLC).
© 2010 Columbia Management Investment Advisers, LLC. All rights reserved.
Fund Profile – Columbia Bond Fund
Performance data quoted represents past performance and current performance may be lower or higher. Past performance is no guarantee of future results. The investment return and principal value will fluctuate so that shares, when redeemed, may be worth more or less than the original cost. Please visit www.columbiafunds.com for daily and most recent month-end performance updates.
Summary
1-year return as of 03/31/10
| | |
| |
 | | +10.39% Class A shares |
| | (without sales charge) |
| |
| | +7.69% Barclays Capital Aggregate Bond Index |
Summary
| n | | For the 12-month period that ended March 31, 2010, the fund’s Class A shares returned 10.39% without sales charge. |
| n | | The fund outperformed its benchmark, the Barclays Capital Aggregate Bond Index1, but underperformed the average return of its peer group, the Lipper Corporate Debt Funds A Rated Classification.2 |
| n | | The fund’s short-maturity profile aided performance relative to the benchmark, while its conservative orientation was a slight handicap relative to competing funds. |
Portfolio Management
Alexander D. Powers has co-managed the fund since 2008 and the predecessor fund since 1997. He has been associated with the advisor or its predecessors since 1996.
Michael Zazzarino has co-managed the fund since 2008 and the predecessor fund since 2005. He has been associated with the advisor or its predecessors since 2005.
Effective May 1, 2010, Alexander D. Powers will become the lead manager and Carl W. Pappo will also co-manage the fund.
Effective May 1, 2010, RiverSource Investments, LLC, a subsidiary of Ameriprise Financial, Inc., became the investment advisor to the fund and changed its name to Columbia Management Investment Advisers, LLC. Please see the fund’s prospectus, as supplemented, for more information regarding the change in investment advisor and certain other changes.
| 1 | The Barclays Capital Aggregate Bond Index is a market value-weighted index that tracks the daily price, coupon, pay-downs and total return performance of fixed-rate, publicly placed, dollar-denominated and non-convertible investment grade debt issues with at least $250 million par amount outstanding and with at least one year to final maturity. Indices are not available for investment, are not professionally managed and do not reflect sales charges, fees, brokerage commissions, taxes or other expenses of investing. Securities in the fund may not match those in an index. |
| 2 | Lipper Inc., a widely respected data provider in the industry, calculates an average total return (assuming reinvestment of distributions) for mutual funds with investment objectives similar to those of the fund. Lipper makes no adjustment for the effect of sales loads. |
1
Economic Update – Columbia Bond Fund
Summary
For the 12-month period that ended March 31, 2010
| | n | | As investors grew more comfortable with risk, non-Treasury sectors of the bond market rebounded. The Barclays Capital Aggregate Bond Index delivered solid results. High-yield bonds outperformed stocks, as measured by the BofA Merrill Lynch U.S. High Yield Cash Pay Index. | |
| | |
| Barclays Aggregate Index | | BofA ML Index |
| |

| |
|
7.69% | | 55.67% |
| | n | | Stock markets rebounded around the world, as measured by the S&P 500 Index and the MSCI EAFE Index. | |
| | |
| S&P Index | | MSCI Index |
| |
| |
|
49.77% | | 54.44% |
After a deep and difficult recession, the U.S. economy regained its footing midway through calendar year 2009. Gross domestic product (GDP) turned positive in the third quarter of 2009, rising 2.2%, and then gained 5.6% in the fourth quarter according to the estimate released by the Bureau of Economic Analysis. Growth was primarily the result of a slowdown in inventory reduction and of federal government stimulus spending. Hopes for a sustained recovery now depend on a variety of factors, including continued improvement in consumer spending, an increase in revenues to keep business profits moving higher and a turnaround in the labor market.
The housing market showed some signs of stabilizing, but stopped short of meaningful improvement during the period. Home sales moved higher in 2009 as new homebuyers took advantage of a federal tax credit. However, as the tax credit was set to expire in November 2009, sales slipped — and did not revive even though the tax credit was expanded and extended through April 2010. Housing prices remained relatively flat over the past year, but that was progress compared to 2008. The average home price fell sharply in 2008; and since then distressed properties, which account for approximately 40% of all housing sales, have held prices down because they are heavily discounted.
In the beleaguered labor market, there was some good news. While businesses continued to shed jobs through most of 2009, raising the unemployment rate to 9.7% at the end of the period*, job data turned positive in March 2010, buoyed by a swell of temporary workers hired to conduct the national once-in-a-decade census. Consumer spending also trended higher in the second half of the period. In fact, March year-over-year sales made a significant jump upward. Despite these improvements, consumer confidence, as measured monthly by The Conference Board, an independent research organization, failed to gain much ground during the year. Consumers surveyed continue to cite uncertain business conditions and still-weak labor prospects for their concerns.
On the business side of the economy, manufacturing activity gained momentum. A key measure of the nation’s manufacturing situation — the Institute for Supply Management’s Index — rose above 50 in July 2009 — then rose for eight consecutive months to remain well above 50 for the remainder of the period. (An index value of 50+ indicates a growing economy.) Industrial production moved higher for eleven out of the past 12 months, and durable goods orders took off, with a big jump upward in January. Manufacturing capacity utilization inched upward to 72.7%.
Bond returns ranged from solid to strong
As hopes for a recovery materialized, bonds from non-Treasury sectors delivered solid returns. The Barclays Capital Aggregate Bond Index1 returned 7.69%. Municipal bonds gained more than taxable investment-grade bonds even without factoring in potential tax advantages to investors in higher income-tax brackets. The Barclays Capital Municipal Bond Index2 returned 9.69%. The high-yield bond market was even stronger than the broad stock market during the period. For the 12 months covered by this report, the BofA Merrill Lynch U.S. High Yield Cash Pay Index3 returned 55.67%.
| * | Source: U.S. Bureau of Labor Statistics |
2
Economic Update (continued) – Columbia Bond Fund
The yield on the 10-year U.S. Treasury, a common bellwether for the bond market, rose from 2.7% to 3.8% during the 12-month period. Yet despite the pickup in economic activity, the Federal Reserve Board (the Fed) kept a key short-term interest rate — the federal funds rate — close to zero throughout the period.
Stocks staged a solid comeback
Against a strengthening economic backdrop, a stock market rally that began in mid-March 2009 continued with little interruption through the end of the period. The U.S. stock market returned 49.77% for the 12-month period, as measured by the S&P 500 Index.4 Mid-cap stocks outperformed large- and small-cap stocks, and value stocks outperformed growth stocks by a solid margin, as measured by their respective Russell indices.5 Outside the United States, stock market returns were slightly stronger. The MSCI EAFE Index,6 a broad gauge of stock market performance in foreign developed markets, gained 54.44% (net of dividends, in U.S. dollars) for the period. Emerging stock markets were caught in a downdraft in 2008, but they bounced back stronger than domestic or developed world markets as their economic growth generally outpaced the developed world. The MSCI Emerging Markets Index7 returned 81.08% (net of dividends, in U.S. dollars) for the 12-month period, after giving back some gains in the first quarter of 2010.
Past performance is no guarantee of future results.
| 1 | The Barclays Capital Aggregate Bond Index is a market value-weighted index that tracks the daily price, coupon, pay-downs and total return performance of fixed-rate, publicly placed, dollar-denominated and non-convertible investment grade debt issues with at least $250 million par amount outstanding and with at least one year to final maturity. |
| 2 | The Barclays Capital Municipal Bond Index is considered representative of the broad market for investment-grade, tax-exempt bonds with a maturity of at least one year. |
| 3 | The BofA Merrill Lynch U.S. High Yield Cash Pay Index tracks the performance of non-investment-grade corporate bonds. |
| 4 | The Standard & Poor’s (S&P) 500 Index tracks the performance of 500 widely held, large-capitalization U.S. stocks. |
| 5 | The Russell 1000 Index tracks the performance of 1,000 of the largest U.S. companies, based on market capitalization. The Russell MidCap Index measures the performance of the 800 smallest companies in the Russell 1000 Index, which represents approximately 25% of the total market capitalization of the Russell 1000 Index. The Russell 2000 Index measures the performance of the 2,000 smallest companies in the Russell 3000 Index, which represents approximately 8% of the total market capitalization of the Russell 3000 Index. The Russell 3000 Growth Index measures the performance of those Russell 3000 Index companies with higher price-to-book ratios and higher forecasted growth values. The stocks in this index are also members of either the Russell 1000 Growth or the Russell 2000 Growth indexes. The Russell 3000 Value Index measures the performance of those Russell 3000 Index companies with lower price-to-book ratios and lower forecasted growth values. The stocks in this index are also members of either the Russell 1000 Value or the Russell 2000 Value indexes. |
| 6 | The Morgan Stanley Capital International Europe, Australasia, Far East (MSCI EAFE) Index is a capitalization-weighted index that tracks the total return of common stocks in 21 developed-market countries within Europe, Australasia and the Far East. |
| 7 | The Morgan Stanley Capital International Emerging Markets Index (MSCI EMI) is a free float-adjusted market capitalization index that is designed to measure equity market performance in the global emerging markets. As of June 2009, the MSCI Emerging Markets Index consisted of the following 22 emerging market country indices: Brazil, Chile, China, Colombia, Czech Republic, Egypt, Hungary, India, Indonesia, Israel, Korea, Malaysia, Mexico, Morocco, Peru, Philippines, Poland, Russia, South Africa, Taiwan, Thailand, and Turkey. |
Indices are not available for investment, are not professionally managed and do not reflect sales charges, fees, brokerage commissions, taxes or other expenses of investing. Securities in the fund may not match those in an index.
3
Performance Information – Columbia Bond Fund
Performance data quoted represents past performance and current performance may be lower or higher. Past performance is no guarantee of future results. The investment return and principal value will fluctuate so that shares, when redeemed, may be worth more or less than the original cost. Please visit www.columbiafunds.com for daily and most recent month-end performance updates.
| | |
| Annual operating expense ratio (%)* |
| |
Class A | | 1.13 |
Class C | | 1.88 |
Class Y | | 0.83 |
Class Z | | 0.88 |
| * | The annual operating expense ratio is as stated in the fund’s prospectus that is current as of the date of this report. Differences in expense ratios disclosed elsewhere in this report may result from the inclusion of fee waivers and expense reimbursements as well as the use of different time periods used in calculating the ratios. |
|
| Performance of a $10,000 investment 04/01/00 – 03/31/10 |
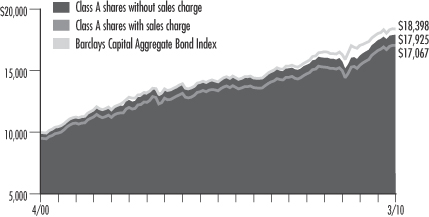
The chart above shows the change in value of a hypothetical $10,000 investment in Class A shares of Columbia Bond Fund during the stated time period, and does not reflect the deduction of taxes that a shareholder may pay on fund distributions or on the redemption of fund shares.
| | | | |
| Performance of a $10,000 investment 04/01/00 – 03/31/10 ($) |
| | |
| Sales charge | | without | | with |
Class A | | 17,925 | | 17,067 |
Class C | | 17,685 | | 17,685 |
Class Y | | 18,069 | | n/a |
Class Z | | 18,049 | | n/a |
| | | | | | | | | | | | |
| Average annual total return as of 03/31/10 (%) |
| | | | |
| Share class | | A | | C | | Y | | Z |
| Inception | | 03/31/08 | | 03/31/08 | | 07/15/09 | | 01/09/86 |
| Sales charge | | without | | with | | without | | with | | without | | without |
1-year | | 10.39 | | 5.12 | | 9.56 | | 8.56 | | 10.78 | | 10.66 |
5-year | | 5.00 | | 3.97 | | 4.71 | | 4.71 | | 5.17 | | 5.14 |
10-year | | 6.01 | | 5.49 | | 5.87 | | 5.87 | | 6.09 | | 6.08 |
The “with sales charge” returns include the maximum initial sales charge of 4.75% for Class A shares and the applicable contingent deferred sales charge of 1.00% for Class C shares for the first year only. The “without sales charge” returns do not include the effect of sales charges. If they had, returns would be lower.
Performance results reflect any fee waivers or reimbursements of fund expenses by the investment advisor and/or any of its affiliates. Absent these fee waivers or expense reimbursement arrangements, performance results would have been lower.
All results shown assume reinvestment of distributions.
The Fund commenced operations on March 31, 2008. Class A, Class C, and Class Z share performance information includes the performance of Shares class shares of Core Bond Fund, the predecessor to the Fund and a series of Excelsior Funds, Inc. (the “Predecessor Fund”), for periods prior to March 31, 2008. These returns reflect any differences in sales charges, but have not been restated to reflect any differences in expenses between the Predecessor Fund share class and the newer share classes. If differences in expenses had been reflected, the returns shown for periods prior to March 31, 2008 would be lower for Class A and Class C shares, since these newer classes of shares are subject to higher distribution and service (Rule 12b-1) fees.
The returns for Class Y shares include the returns for Class Z shares prior to July 15, 2009, the date on which Class Y shares were initially offered by the fund. The returns shown have not been adjusted to reflect any differences in expenses between Class Y shares and Class Z shares. If differences in expenses had been reflected, the returns shown would be lower.
Class Y and Class Z shares are sold at net asset value with no distribution and service (Rule 12b-1) fees. Class Y and Class Z shares have limited eligibility and the investment minimum requirements may vary. Please see the fund’s prospectus for details. Performance for different share classes will vary based on differences in sales charges and fees associated with each class.
The tables do not reflect the deduction of taxes that a shareholder may pay on fund distributions or on the redemption of fund shares.
4
Understanding Your Expenses – Columbia Bond Fund
Estimating your actual expenses
To estimate the expenses that you paid over the period, first you will need your account balance at the end of the period:
| | n | | For shareholders who receive their account statements from Columbia Management Services, Inc., your account balance is available online at www.columbiafunds.com or by calling Shareholder Services at 800.345.6611. | |
| | n | | For shareholders who receive their account statements from their financial intermediary, contact your financial intermediary to obtain your account balance. | |
| | 1. | Divide your ending account balance by $1,000. For example, if an account balance was $8,600 at the end of the period, the result would be 8.6. | |
| | 2. | In the section of the table below titled “Expenses paid during the period,” locate the amount for your share class. You will find this number in the column labeled “Actual.” Multiply this number by the result from step 1. Your answer is an estimate of the expenses you paid on your account during the period. | |
If the value of your account falls below the minimum initial investment requirement applicable to you, your account generally will be subject to a $20 annual fee. This fee is not included in the accompanying table. If you are subject to the fee, keep it in mind when you are estimating the ongoing expenses of investing in the fund and when comparing the expenses of this fund with other funds.
As a fund shareholder, you incur two types of costs. There are transaction costs, which generally include sales charges on purchases and may include redemption fees or exchange fees. There are also ongoing costs, which generally include investment advisory fees, distribution and service (Rule 12b-1) fees and other fund expenses. The information on this page is intended to help you understand the ongoing costs of investing in the fund and to compare these costs with the ongoing costs of investing in other mutual funds.
Analyzing your fund’s expenses by share class
To illustrate these ongoing costs, we have provided an example and calculated the expenses paid by investors in each share class during the period. The information in the following table is based on an initial investment of $1,000, which is invested at the beginning of the period and held for the entire period. Expense information is calculated two ways and each method provides you with different information. The amount listed in the “Actual” column is calculated using the fund’s actual operating expenses and total return for the period. The amount listed in the “Hypothetical” column for each share class assumes that the return each year is 5% before expenses and is calculated based on the fund’s actual operating expenses. You should not use the hypothetical account values and expenses to estimate either your actual account balance at the end of the period or the expenses you paid during this period.
Compare with other funds
Since all mutual funds are required to include the same hypothetical calculations about expenses in shareholder reports, you can use this information to compare the ongoing cost of investing in the fund with other funds. To do so, compare the 5% hypothetical example with the 5% hypothetical examples that appear in the shareholder reports of other funds. As you compare hypothetical examples of other funds, it is important to note that hypothetical examples are meant to highlight the ongoing costs of investing in a fund and do not reflect any transaction costs, such as sales charges, redemption fees or exchange fees.
| | | | | | | | | | | | | | |
10/01/09 – 03/31/10 |
| | | | |
| | | Account value at the
beginning of the period ($) | | Account value at the end
of the period ($) | | Expenses paid
during the period ($) | | Fund's annualized
expense ratio (%) |
| | | Actual | | Hypothetical | | Actual | | Hypothetical | | Actual | | Hypothetical | | Actual |
Class A | | 1,000.00 | | 1,000.00 | | 1,025.00 | | 1,020.94 | | 4.04 | | 4.03 | | 0.80 |
Class C | | 1,000.00 | | 1,000.00 | | 1,022.30 | | 1,017.20 | | 7.81 | | 7.80 | | 1.55 |
Class Y | | 1,000.00 | | 1,000.00 | | 1,027.40 | | 1,022.19 | | 2.78 | | 2.77 | | 0.55 |
Class Z | | 1,000.00 | | 1,000.00 | | 1,027.40 | | 1,022.19 | | 2.78 | | 2.77 | | 0.55 |
Expenses paid during the period are equal to the annualized expense ratio for the share class, multiplied by the average account value over the period, then multiplied by the number of days in the fund’s most recent fiscal half-year and divided by 365.
Had the investment advisor and/or any of its affiliates not waived fees or reimbursed a portion of expenses, account value at the end of the period would have been reduced.
It is important to note that the expense amounts shown in the table are meant to highlight only ongoing costs of investing in the fund and do not reflect any transaction costs, such as sales charges, redemption fees or exchange fees. Therefore, the hypothetical examples provided may not help you determine the relative total costs of owning shares of different funds. If these transaction costs were included, your costs would have been higher.
5
Portfolio Managers’ Report – Columbia Bond Fund
Performance data quoted represents past performance and current performance may be lower or higher. Past performance is no guarantee of future results. The investment return and principal value will fluctuate so that shares, when redeemed, may be worth more or less than the original cost. Please visit www.columbiafunds.com for daily and most recent month-end performance updates.
| | |
| Net asset value per share |
| |
as of 03/31/10 ($) | | |
Class A | | 9.28 |
Class C | | 9.29 |
Class Y | | 9.30 |
Class Z | | 9.29 |
| | |
| Distributions declared per share |
| |
04/01/09 – 03/31/10 ($) | | |
Class A | | 0.41 |
Class C | | 0.34 |
Class Y | | 0.25 |
Class Z | | 0.43 |
| | |
| 30-day SEC yields |
| |
as of 03/31/10 (%) | | |
Class A | | 2.89 |
Class C | | 2.14 |
Class Y | | 3.14 |
Class Z | | 3.14 |
The 30-day SEC yields reflect the fund’s earning power, net of expenses, expressed as an annualized percentage of the public offering price per share at the end of the period. Had the investment advisor and/or its affiliates not waived fees or reimbursed a portion of expenses, the 30-day SEC yields would have been lower.
For the 12-month period that ended March 31, 2010, the fund’s Class A shares returned 10.39% without sales charge. The fund’s return was above the 7.69% return of its benchmark, the Barclays Capital Aggregate Bond Index, for the same period. The fund underperformed the average return of its peer group, the Lipper Corporate Debt Funds A Rated Classification, which was 17.12% for the 12-month period. The fund’s maturity profile enabled it to outpace its benchmark. Its relatively conservative orientation hampered performance versus the more aggressively positioned funds in its peer group. However, this conservative positioning is consistent with our long-term investment strategy.
Maturity profile aided results
The fund’s maturity profile aided overall results. Early in 2009 we shortened the portfolio on the expectation that an improvement in the national economy would lead to higher long-term interest rates, a thesis that was borne out as the year progressed. We purchased some long-term corporate bonds, which did quite well for the period. Within these and other corporate purchases, our emphasis on the financial sector benefited returns and helped the fund outperform its benchmark.
Quality focus hampered return
The past twelve months were characterized by a dramatic recovery in the lower-quality asset classes that had suffered the most during a credit crisis that began in late 2008. In April 2009, when the reporting period began, many classes of corporate bonds and mortgage-backed investments were trading at extraordinary yield premiums to comparable Treasury securities. As the economy improved, however, so did the financial strength of the issuers and the quality of any underlying collateral. Fixed-income investors who sat on the sidelines during the worst days of the crisis gained the confidence to move back in, thereby pushing the yield premiums back down to more normal levels. In this environment, high-yield bonds were the best performing sector of the fixed-income market. Because this fund, like the benchmark index, has no exposure to high-yield securities, it lagged behind competing funds that do have high-yield exposure.
An emphasis on less-risky, seasoned commercial mortgage-backed securities (CMBS) also detracted from relative return. Low-quality securities generated from the lax underwriting standards of the late housing boom produced the biggest rebounds during the period, but these securities did not measure up to our standards for the fund. However, an overweight in CMBS benefited performance.
Looking ahead
The fund continues to be overweight in CMBS, with a corresponding underweight in securities backed by residential mortgages. Although the government’s extensive support for the secondary mortgage market has offered some interesting trading opportunities in this sector, it has not translated into a meaningful improvement for the residential housing market, hence our concern about the prevailing valuations of mortgage-backed securities. More generally, we will continue to maintain a relatively conservative investment style for this fund. Our conservative approach served the fund
6
Portfolio Managers’ Report (continued) – Columbia Bond Fund
| | | |
| Portfolio structure | |
| |
as of 03/31/10 (%) | | | |
Corporate Fixed-Income Bonds & Notes | | 27.9 | |
Mortgage-Backed Securities | | 23.3 | |
Government & Agency Obligations | | 22.9 | |
Commercial Mortgage-Backed Securities | | 19.9 | |
Asset-Backed Securities | | 5.6 | |
Municipal Bonds | | 0.3 | |
Collateralized Mortgage Obligation | | 0.2 | |
Short-Term Obligation | | 2.3 | |
Other Assets & Liabilities, Net | | (2.4 | ) |
| | |
| Maturity Breakdown |
| |
as of 03/31/10 (%) | | |
0-1 year | | 6.8 |
1-5 years | | 45.0 |
5-10 years | | 36.3 |
10-20 years | | 3.4 |
20-30 years | | 7.5 |
30 years and over | | 1.0 |
| | |
| Quality Breakdown |
| |
as of 03/31/10 (%) | | |
Treasury | | 17.1 |
Agency | | 27.1 |
AAA | | 26.3 |
AA | | 4.9 |
A | | 9.6 |
BBB | | 15.0 |
Ratings shown in the quality breakdown represent the rating assigned to a particular bond by one of the following nationally-recognized rating agencies: Standard and Poor’s, a division of the McGraw-Hill Companies, Inc., Moody’s Investors Service, Inc. or Fitch Ratings Ltd. Ratings are relative and subjective and are not absolute standards of quality. The fund’s credit quality does not remove market risk.
The fund is actively managed and the composition of its portfolio will change over time. Portfolio structure is calculated as a percentage of net assets and quality breakdown and maturity breakdown are calculated as a percentage of total investments.
well in the crisis that preceded this period and is the basis, we believe, of an attractive long-term investment strategy.
Portfolio characteristics and holdings are subject to change periodically and may not be representative of current characteristics and holdings. The outlook for the fund may differ from that presented for other Columbia Funds.
Investing in fixed-income securities may involve certain risks, including the credit quality of individual issuers, possible prepayments, market or economic developments and yield and share price fluctuations due to changes in interest rates. When interest rates go up, bond prices typically drop, and vice versa.
7
Investment Portfolio – Columbia Bond Fund
March 31, 2010
Corporate Fixed-Income Bonds & Notes – 27.9%
| | | | |
| | | Par ($) | | Value ($) |
| Basic Materials – 1.8% | | | | |
| Chemicals – 0.8% | | | | |
| Dow Chemical Co. | | | | |
5.900% 02/15/15 | | 2,155,000 | | 2,333,055 |
8.550% 05/15/19 | | 625,000 | | 756,088 |
9.400% 05/15/39 | | 200,000 | | 268,088 |
| | |
| Lubrizol Corp. | | | | |
8.875% 02/01/19 | | 1,400,000 | | 1,765,762 |
| | | | |
Chemicals Total | | | | 5,122,993 |
| | | | |
| Iron/Steel – 0.8% | | | | |
| ArcelorMittal | | | | |
7.000% 10/15/39 | | 190,000 | | 195,127 |
9.850% 06/01/19 | | 785,000 | | 997,733 |
| Nucor Corp. | | | | |
5.000% 06/01/13 | | 900,000 | | 972,455 |
5.850% 06/01/18 | | 2,385,000 | | 2,588,991 |
| | | | |
Iron/Steel Total | | | | 4,754,306 |
| | | | |
| Metals & Mining – 0.2% | | | | |
| Vale Overseas Ltd. | | | | |
6.875% 11/21/36 | | 1,145,000 | | 1,184,560 |
| | | | |
Metals & Mining Total | | | | 1,184,560 |
| | | | |
Basic Materials Total | | | | 11,061,859 |
| | | | |
| Communications – 4.3% | | | | |
| Media – 2.3% | | | | |
| Comcast Cable Holdings LLC | | | | |
9.800% 02/01/12 | | 2,600,000 | | 2,949,559 |
| | |
| Comcast Corp. | | | | |
5.850% 11/15/15 | | 2,460,000 | | 2,695,550 |
6.950% 08/15/37 | | 125,000 | | 135,227 |
| | |
| News America, Inc. | | | | |
6.400% 12/15/35 | | 695,000 | | 709,701 |
| | |
| Time Warner Cable, Inc. | | | | |
3.500% 02/01/15 | | 5,540,000 | | 5,544,687 |
5.850% 05/01/17 | | 550,000 | | 588,913 |
| | |
| Time Warner Companies, Inc. | | | | |
7.250% 10/15/17 | | 593,000 | | 681,303 |
| | |
| Time Warner, Inc. | | | | |
6.500% 11/15/36 | | 1,015,000 | | 1,042,677 |
| | | | |
Media Total | | | | 14,347,617 |
| | | | |
| |
| Telecommunication Services – 2.0% | | |
| AT&T, Inc. | | | | |
5.500% 02/01/18 | | 1,850,000 | | 1,964,051 |
6.550% 02/15/39 | | 600,000 | | 630,745 |
| | | | |
| | | Par ($) | | Value ($) |
| BellSouth Corp. | | | | |
5.200% 09/15/14 | | 2,460,000 | | 2,650,534 |
| | |
| British Telecommunications PLC | | | | |
5.950% 01/15/18 | | 2,855,000 | | 2,930,935 |
| |
Cellco Partnership/Verizon Wireless
Capital LLC | | |
5.550% 02/01/14 | | 480,000 | | 524,564 |
8.500% 11/15/18 | | 600,000 | | 748,595 |
| |
| Deutsche Telekom International Finance, Multi-Coupon Bond | | |
8.750% 06/15/30 (a) | | 500,000 | | 640,355 |
| | |
| Telefonica Emisiones SAU | | | | |
6.421% 06/20/16 | | 2,000,000 | | 2,221,842 |
| | | | |
Telecommunication Services Total | | | | 12,311,621 |
| | | | |
Communications Total | | | | 26,659,238 |
| | | | |
| Consumer Cyclical – 0.4% | | | | |
| Retail – 0.4% | | | | |
| CVS Pass-Through Trust | | | | |
6.036% 12/10/28 | | 760,168 | | 751,829 |
8.353% 07/10/31 (b) | | 1,256,038 | | 1,458,687 |
| | |
| McDonald’s Corp. | | | | |
5.000% 02/01/19 | | 200,000 | | 209,874 |
| | | | |
Retail Total | | | | 2,420,390 |
| | | | |
Consumer Cyclical Total | | | | 2,420,390 |
| | | | |
| Consumer Non-Cyclical – 3.6% |
| Beverages – 0.4% | | | | |
| Anheuser-Busch InBev Worldwide, Inc. | | |
7.200% 01/15/14 (b) | | 550,000 | | 630,095 |
7.750% 01/15/19 (b) | | 700,000 | | 832,568 |
8.000% 11/15/39 (b) | | 635,000 | | 803,511 |
| | | | |
Beverages Total | | | | 2,266,174 |
| | |
| Food – 2.4% | | | | |
| Campbell Soup Co. | | | | |
4.500% 02/15/19 | | 715,000 | | 727,518 |
| | |
| ConAgra Foods, Inc. | | | | |
7.000% 10/01/28 | | 1,300,000 | | 1,417,992 |
| | |
| General Mills, Inc. | | | | |
5.200% 03/17/15 | | 1,660,000 | | 1,802,059 |
See Accompanying Notes to Financial Statements.
8
Columbia Bond Fund
March 31, 2010
Corporate Fixed-Income Bonds & Notes (continued)
| | | | |
| | | Par ($) | | Value ($) |
| Consumer Non-Cyclical (continued) |
| Kraft Foods, Inc. | | | | |
4.125% 02/09/16 | | 6,605,000 | | 6,692,893 |
| | |
| Kroger Co. | | | | |
3.900% 10/01/15 | | 3,785,000 | | 3,831,423 |
| | | | |
Food Total | | | | 14,471,885 |
| | |
| Healthcare Services – 0.5% | | | | |
| Roche Holdings, Inc. | | | | |
6.000% 03/01/19 (b) | | 2,200,000 | | 2,431,275 |
| | |
| WellPoint, Inc. | | | | |
7.000% 02/15/19 | | 635,000 | | 720,081 |
| | | | |
Healthcare Services Total | | | | 3,151,356 |
| |
| Household Products/Wares – 0.1% | | |
| Fortune Brands, Inc. | | | | |
5.125% 01/15/11 | | 750,000 | | 771,489 |
| | | | |
Household Products/Wares Total | | | | 771,489 |
| | |
| Pharmaceuticals – 0.2% | | | | |
| Novartis Securities Investment Ltd. | | |
5.125% 02/10/19 | | 1,300,000 | | 1,377,845 |
| | | | |
Pharmaceuticals Total | | | | 1,377,845 |
| | | | |
Consumer Non-Cyclical Total | | | | 22,038,749 |
| | | | |
| Energy – 3.0% | | | | |
| Oil & Gas – 1.4% | | | | |
| Canadian Natural Resources Ltd. | | | | |
6.250% 03/15/38 | | 520,000 | | 537,704 |
| | |
| Devon Energy Corp. | | | | |
6.300% 01/15/19 | | 485,000 | | 541,341 |
| | |
| Hess Corp. | | | | |
7.300% 08/15/31 | | 660,000 | | 752,064 |
| | |
| Marathon Oil Corp. | | | | |
7.500% 02/15/19 | | 1,060,000 | | 1,245,080 |
| | |
| Nexen, Inc. | | | | |
5.650% 05/15/17 | | 1,000,000 | | 1,053,518 |
7.500% 07/30/39 | | 445,000 | | 507,604 |
| | |
| Shell International Finance BV | | | | |
5.500% 03/25/40 | | 1,915,000 | | 1,877,213 |
| | |
| Talisman Energy, Inc. | | | | |
5.850% 02/01/37 | | 300,000 | | 287,573 |
7.750% 06/01/19 | | 1,579,000 | | 1,881,457 |
| | | | |
Oil & Gas Total | | | | 8,683,554 |
| | | | |
| | | | |
| | | Par ($) | | Value ($) |
| Oil & Gas Services – 0.7% | | | | |
| Halliburton Co. | | | | |
5.900% 09/15/18 | | 400,000 | | 439,548 |
| | |
| Smith International, Inc. | | | | |
9.750% 03/15/19 | | 925,000 | | 1,244,224 |
| | |
| Weatherford International Ltd. | | | | |
5.150% 03/15/13 | | 2,175,000 | | 2,311,105 |
| | | | |
Oil & Gas Services Total | | | | 3,994,877 |
| | | | |
| Pipelines – 0.9% | | | | |
| Enbridge Energy Partners LP | | | | |
7.500% 04/15/38 | | 750,000 | | 878,043 |
| | |
| Energy Transfer Partners LP | | | | |
6.000% 07/01/13 | | 230,000 | | 248,633 |
| |
| Kinder Morgan Energy Partners LP | | |
6.500% 09/01/39 | | 120,000 | | 123,349 |
6.950% 01/15/38 | | 750,000 | | 812,423 |
| |
| Plains All American Pipeline LP/PAA Finance Corp. | | |
5.750% 01/15/20 | | 150,000 | | 153,818 |
6.650% 01/15/37 | | 750,000 | | 777,705 |
8.750% 05/01/19 | | 865,000 | | 1,055,272 |
| | |
| TransCanada Pipelines Ltd. | | | | |
6.350% 05/15/67
(05/15/15) (a)(c) | | 210,000 | | 199,814 |
7.625% 01/15/39 | | 1,000,000 | | 1,218,567 |
| | | | |
Pipelines Total | | | | 5,467,624 |
| | | | |
Energy Total | | | | 18,146,055 |
| | | | |
| Financials – 10.0% | | | | |
| Banks – 5.9% | | | | |
| Bank of New York Mellon Corp. | | | | |
5.450% 05/15/19 | | 2,145,000 | | 2,274,865 |
| | |
| Barclays Bank PLC | | | | |
5.000% 09/22/16 | | 825,000 | | 847,993 |
| | |
| Capital One Capital IV | | | | |
6.745% 02/17/37 (02/17/32) (a)(c) | | 695,000 | | 599,438 |
| | |
| Capital One Capital V | | | | |
10.250% 08/15/39 | | 1,200,000 | | 1,421,622 |
| | |
| Capital One Financial Corp. | | | | |
5.700% 09/15/11 | | 1,585,000 | | 1,656,560 |
7.375% 05/23/14 | | 290,000 | | 331,392 |
See Accompanying Notes to Financial Statements.
9
Columbia Bond Fund
March 31, 2010
Corporate Fixed-Income Bonds & Notes (continued)
| | | | |
| | | Par ($) | | Value ($) |
| Financials (continued) | | | | |
| Citigroup, Inc. | | | | |
6.010% 01/15/15 | | 3,655,000 | | 3,839,826 |
| | |
| Comerica Bank | | | | |
0.337% 06/30/10
(04/30/10) (a)(c) | | 350,000 | | 349,827 |
5.200% 08/22/17 | | 660,000 | | 640,240 |
5.750% 11/21/16 | | 250,000 | | 257,335 |
| | |
| Deutsche Bank AG London | | | | |
4.875% 05/20/13 | | 765,000 | | 819,793 |
| | |
| Discover Financial Services | | | | |
10.250% 07/15/19 | | 445,000 | | 529,443 |
| | |
| JPMorgan Chase Capital XVIII | | | | |
6.950% 08/17/36 | | 105,000 | | 102,912 |
| | |
| JPMorgan Chase Capital XX | | | | |
6.550% 09/29/36 | | 1,970,000 | | 1,848,687 |
| | |
| JPMorgan Chase Capital XXII | | | | |
6.450% 02/02/37 | | 1,425,000 | | 1,322,981 |
| | |
| KeyBank NA | | | | |
5.800% 07/01/14 | | 750,000 | | 767,056 |
| | |
| Keycorp | | | | |
6.500% 05/14/13 | | 1,690,000 | | 1,804,766 |
| | |
| Lloyds TSB Bank PLC | | | | |
4.375% 01/12/15 (b) | | 5,310,000 | | 5,234,502 |
| | |
| National City Corp. | | | | |
4.900% 01/15/15 | | 575,000 | | 600,623 |
| | |
| Northern Trust Corp. | | | | |
5.500% 08/15/13 | | 2,005,000 | | 2,218,811 |
| | |
| PNC Funding Corp. | | | | |
3.625% 02/08/15 | | 1,060,000 | | 1,066,350 |
5.125% 02/08/20 | | 1,610,000 | | 1,621,821 |
| | |
| U.S. Bancorp | | | | |
3.150% 03/04/15 | | 920,000 | | 910,481 |
| | |
| USB Capital IX | | | | |
6.189% 04/15/49 (04/15/11) (a)(c) | | 3,510,000 | | 3,001,050 |
| | |
| Westpac Banking Corp. | | | | |
4.200% 02/27/15 | | 1,825,000 | | 1,878,609 |
| | | | |
Banks Total | | | | 35,946,983 |
| | | | |
| | | Par ($) | | Value ($) |
| Diversified Financial Services – 1.0% | | |
| Ameriprise Financial, Inc. | | | | |
7.300% 06/28/19 | | 855,000 | | 990,642 |
| | |
| General Electric Capital Corp. | | | | |
5.500% 01/08/20 | | 2,498,000 | | 2,548,622 |
| | |
| International Lease Finance Corp. | | | | |
4.875% 09/01/10 | | 1,887,000 | | 1,886,983 |
| | |
| Lehman Brothers Holdings, Inc. | | | | |
5.625% 01/24/13 (d)(e) | | 2,620,000 | | 618,975 |
| | | | |
Diversified Financial Services Total | | | | 6,045,222 |
| | | | |
| Insurance – 2.4% | | | | |
| CNA Financial Corp. | | | | |
5.850% 12/15/14 | | 424,000 | | 431,444 |
7.350% 11/15/19 | | 841,000 | | 878,954 |
| |
| Hartford Financial Services Group, Inc. | | |
6.625% 03/30/40 | | 835,000 | | 821,601 |
| | |
| ING Groep NV | | | | |
5.775% 12/29/49 (12/08/15) (a)(c) | | 1,515,000 | | 1,290,023 |
| | |
| Liberty Mutual Group, Inc. | | | | |
7.500% 08/15/36 (b) | | 855,000 | | 824,520 |
10.750% 06/15/58 (a)(b) | | 1,310,000 | | 1,467,200 |
| | |
| Lincoln National Corp. | | | | |
8.750% 07/01/19 | | 1,030,000 | | 1,259,455 |
| | |
| MetLife Capital Trust X | | | | |
9.250% 04/08/38 (a)(b) | | 710,000 | | 798,750 |
| | |
| MetLife, Inc. | | | | |
10.750% 08/01/39 | | 1,165,000 | | 1,501,629 |
| |
| Principal Life Income Funding Trusts | | |
5.300% 04/24/13 | | 2,040,000 | | 2,189,856 |
| | |
| Prudential Financial, Inc. | | | | |
7.375% 06/15/19 | | 1,045,000 | | 1,198,393 |
| | |
| Transatlantic Holdings, Inc. | | | | |
8.000% 11/30/39 | | 1,040,000 | | 1,062,888 |
| | |
| Unum Group | | | | |
7.125% 09/30/16 | | 1,210,000 | | 1,315,314 |
| | | | |
Insurance Total | | | | 15,040,027 |
| | | | |
See Accompanying Notes to Financial Statements.
10
Columbia Bond Fund
March 31, 2010
Corporate Fixed-Income Bonds & Notes (continued)
| | | | |
| | | Par ($) | | Value ($) |
| Financials (continued) | | | | |
| Real Estate Investment Trusts (REITs) – 0.7% |
| Brandywine Operating Partnership LP | | |
7.500% 05/15/15 | | 1,435,000 | | 1,544,156 |
| | |
| Duke Realty LP | | | | |
7.375% 02/15/15 | | 755,000 | | 815,332 |
8.250% 08/15/19 | | 1,922,600 | | 2,144,255 |
| | | | |
Real Estate Investment Trusts (REITs) Total | | | | 4,503,743 |
| | | | |
Financials Total | | | | 61,535,975 |
| | | | |
| Industrials – 1.9% |
| Aerospace & Defense – 0.2% | | | | |
| Embraer Overseas Ltd. | | | | |
6.375% 01/15/20 | | 1,125,000 | | 1,144,688 |
| | | | |
Aerospace & Defense Total | | | | 1,144,688 |
| | | | |
| Machinery – 0.0% | | | | |
| Caterpillar Financial Services Corp. | | |
4.850% 12/07/12 | | 265,000 | | 285,007 |
| | | | |
Machinery Total | | | | 285,007 |
| | | | |
| Machinery-Construction & Mining – 0.1% |
| Caterpillar, Inc. | | | | |
8.250% 12/15/38 | | 590,000 | | 788,759 |
| | | | |
Machinery-Construction & Mining Total | | | | 788,759 |
| | | | |
| Miscellaneous Manufacturing – 0.3% |
| Ingersoll-Rand Global Holding Co., Ltd. | | |
9.500% 04/15/14 | | 995,000 | | 1,206,473 |
| |
| Tyco International Ltd./Tyco International Finance SA | | |
6.875% 01/15/21 | | 335,000 | | 382,804 |
| | | | |
Miscellaneous Manufacturing Total | | | | 1,589,277 |
| | | | |
| Transportation – 1.3% | | | | |
| BNSF Funding Trust I | | | | |
6.613% 12/15/55 (01/15/26) (a)(c) | | 1,320,000 | | 1,282,050 |
| |
| Burlington Northern Santa Fe Corp. | | |
6.750% 07/15/11 | | 805,000 | | 856,505 |
| | |
| CSX Corp. | | | | |
6.250% 04/01/15 | | 2,460,000 | | 2,751,441 |
| | | | |
| | | Par ($) | | Value ($) |
| Union Pacific Corp. | | | | |
7.875% 01/15/19 | | 2,725,000 | | 3,273,796 |
| | | | |
Transportation Total | | | | 8,163,792 |
| | | | |
Industrials Total | | | | 11,971,523 |
| | | | |
| Technology – 0.5% | | | | |
| Networking Products – 0.1% | | | | |
| Cisco Systems, Inc. | | | | |
5.900% 02/15/39 | | 830,000 | | 842,661 |
| | | | |
Networking Products Total | | | | 842,661 |
| | |
| Office/Business Equipment – 0.2% | | | | |
| Xerox Corp. | | | | |
6.400% 03/15/16 | | 950,000 | | 1,042,642 |
| | | | |
Office/Business Equipment Total | | | | 1,042,642 |
| | | | |
| Software – 0.2% | | | | |
| Oracle Corp. | | | | |
6.500% 04/15/38 | | 815,000 | | 899,580 |
| | | �� | |
Software Total | | | | 899,580 |
| | | | |
Technology Total | | | | 2,784,883 |
| | | | |
| Utilities – 2.4% | | | | |
| Electric – 1.9% | | | | |
| Commonwealth Edison Co. | | | | |
5.950% 08/15/16 | | 1,000,000 | | 1,096,122 |
| | |
| Duke Energy Carolinas LLC | | | | |
5.100% 04/15/18 | | 1,000,000 | | 1,044,617 |
5.250% 01/15/18 | | 2,000,000 | | 2,106,336 |
| | |
| Georgia Power Co. | | | | |
5.700% 06/01/17 | | 1,185,000 | | 1,298,905 |
| | |
| Niagara Mohawk Power Corp. | | | | |
4.881% 08/15/19 (b) | | 815,000 | | 809,395 |
| | |
| Nisource Finance Corp. | | | | |
5.250% 09/15/17 | | 685,000 | | 688,445 |
| | |
| Oncor Electric Delivery Co. | | | | |
5.950% 09/01/13 | | 750,000 | | 819,033 |
| | |
| Pacific Gas & Electric Co. | | | | |
5.625% 11/30/17 | | 1,665,000 | | 1,792,472 |
| | |
| Peco Energy Co. | | | | |
5.350% 03/01/18 | | 2,175,000 | | 2,291,830 |
| | | | |
Electric Total | | | | 11,947,155 |
| | | | |
See Accompanying Notes to Financial Statements.
11
Columbia Bond Fund
March 31, 2010
Corporate Fixed-Income Bonds & Notes (continued)
| | | | |
| | | Par ($) | | Value ($) |
| Utilities (continued) | | | | |
| Gas – 0.5% | | | | |
| Atmos Energy Corp. | | | | |
6.350% 06/15/17 | | 500,000 | | 537,717 |
8.500% 03/15/19 | | 800,000 | | 981,492 |
| | |
| Nakilat, Inc. | | | | |
6.067% 12/31/33 (b) | | 1,030,000 | | 937,393 |
| | |
| Sempra Energy | | | | |
6.500% 06/01/16 | | 415,000 | | 463,632 |
| | | | |
Gas Total | | | | 2,920,234 |
| | | | |
Utilities Total | | | | 14,867,389 |
| | | | |
Total Corporate Fixed-Income Bonds & Notes (cost of $162,249,250) | | 171,486,061 |
|
Mortgage-Backed Securities – 23.3% |
| Federal Home Loan Mortgage Corporation | | |
4.500% 09/01/24 | | 3,885,440 | | 4,035,429 |
4.500% 11/01/24 | | 16,525,607 | | 17,163,543 |
5.000% 03/01/21 | | 64,003 | | 67,861 |
5.388% 05/01/39
(04/01/10) (a)(c) | | 5,452,535 | | 5,760,963 |
5.596% 08/01/37
(04/01/10) (a)(c) | | 2,283,405 | | 2,415,396 |
5.631% 06/01/37
(04/01/10) (a)(c) | | 1,719,979 | | 1,820,512 |
5.703% 06/01/36
(04/01/10) (a)(c) | | 2,767,796 | | 2,912,824 |
6.000% 02/01/39 | | 1,659,771 | | 1,782,889 |
7.000% 12/01/35 | | 1,144,536 | | 1,275,593 |
| |
| Federal National Mortgage Association | | |
4.000% 03/01/39 | | 3,382,812 | | 3,283,303 |
4.000% 10/01/39 | | 7,399,772 | | 7,181,358 |
4.000% 12/01/39 | | 1,590,190 | | 1,543,254 |
4.500% 07/01/24 | | 2,929,831 | | 3,043,389 |
4.500% 11/01/24 | | 4,249,892 | | 4,414,614 |
4.500% 02/01/39 | | 6,361,259 | | 6,382,933 |
4.500% 11/01/39 | | 2,987,153 | | 2,997,331 |
4.680% 06/01/19 | | 1,582,559 | | 1,646,361 |
4.680% 09/01/19 | | 2,975,000 | | 3,075,012 |
4.760% 09/01/19 | | 1,575,500 | | 1,644,531 |
4.770% 06/01/19 | | 1,632,165 | | 1,711,981 |
5.500% 06/01/35 | | 454,236 | | 480,219 |
5.534% 10/01/37
(04/01/10) (a)(c) | | 1,794,224 | | 1,877,853 |
6.000% 05/01/37 | | 6,258,990 | | 6,659,074 |
6.000% 08/01/38 | | 15,111,455 | | 16,070,316 |
6.000% 12/01/38 | | 5,256,740 | | 5,590,294 |
| | | | |
| | | Par ($) | | Value ($) |
6.500% 02/01/13 | | 64,363 | | 69,477 |
7.500% 10/01/29 | | 51,697 | | 58,498 |
| | |
| TBA, | | | | |
4.500% 12/01/40 (f) | | 21,100,000 | | 21,146,167 |
| |
| Government National Mortgage Association | | |
4.375% 04/20/28
(04/01/10) (a)(c) | | 9,966 | | 10,293 |
4.375% 06/20/28
(04/01/10) (a)(c) | | 79,778 | | 82,402 |
4.500% 07/20/33 | | 1,227,693 | | 1,251,061 |
4.500% 09/15/33 | | 591,181 | | 604,199 |
4.500% 07/15/39 | | 8,586,467 | | 8,705,787 |
4.500% 02/15/40 | | 3,994,821 | | 4,050,334 |
6.000% 03/20/28 | | 182,326 | | 198,172 |
6.500% 05/15/23 | | 1,381 | | 1,489 |
6.500% 05/15/28 | | 82,598 | | 91,126 |
6.500% 06/15/28 | | 42,331 | | 46,701 |
6.500% 12/15/31 | | 66,425 | | 73,035 |
6.500% 04/15/32 | | 21,825 | | 23,874 |
7.000% 05/15/29 | | 104,951 | | 117,843 |
7.500% 03/15/28 | | 43,670 | | 49,354 |
8.000% 10/15/17 | | 98,316 | | 108,774 |
8.000% 01/15/30 | | 166,726 | | 192,132 |
8.500% 06/15/17 | | 216,159 | | 242,015 |
8.500% 11/15/17 | | 82,463 | | 90,492 |
8.500% 12/15/17 | | 393,000 | | 431,267 |
9.000% 12/15/17 | | 355,029 | | 395,709 |
9.000% 06/15/30 | | 27,428 | | 31,950 |
9.500% 11/15/17 | | 318,328 | | 356,862 |
| | | | |
Total Mortgage-Backed Securities (cost of $142,834,664) | | 143,265,846 |
|
Government & Agency Obligations – 22.9% |
| | | | |
| Foreign Government Obligations – 2.3% |
| European Investment Bank | | | | |
3.000% 04/08/14 | | 5,250,000 | | 5,369,815 |
| |
| International Bank for Reconstruction & Development | | |
5.000% 04/01/16 | | 3,900,000 | | 4,295,768 |
| |
| Pemex Project Funding Master Trust | | |
5.750% 03/01/18 | | 1,000,000 | | 1,029,145 |
| | |
| Province of Quebec | | | | |
4.625% 05/14/18 | | 2,500,000 | | 2,608,928 |
See Accompanying Notes to Financial Statements.
12
Columbia Bond Fund
March 31, 2010
Government & Agency Obligations (continued)
| | | | |
| | | Par ($) | | Value ($) |
| Foreign Government Obligations (continued) |
| | |
| Republic of Italy | | | | |
5.375% 06/12/17 | | 660,000 | | 709,312 |
| | | | |
Foreign Government Obligations Total | | 14,012,968 |
| | | | |
| U.S. Government Agencies – 3.5% |
| Federal Home Loan Banks | | | | |
0.700% 06/23/11 | | 9,640,000 | | 9,638,303 |
| |
| Resolution Funding Corp., STRIPS | | |
(g) 10/15/19 | | 3,915,000 | | 2,551,069 |
(g) 10/15/20 | | 3,780,000 | | 2,308,979 |
(g) 01/15/21 | | 7,010,000 | | 4,223,308 |
(g) 01/15/30 | | 8,000,000 | | 2,822,632 |
| | | | |
U.S. Government Agencies Total | | 21,544,291 |
| | | | |
| U.S. Government Obligations – 17.1% |
| U.S. Treasury Bonds | | | | |
4.375% 11/15/39 | | 409,000 | | 386,761 |
4.500% 02/15/36 | | 12,000,000 | | 11,720,628 |
4.500% 05/15/38 | | 1,435,000 | | 1,392,174 |
6.125% 11/15/27 | | 2,700,000 | | 3,234,092 |
6.250% 05/15/30 | | 1,000,000 | | 1,224,062 |
| |
| U.S. Treasury Inflation Indexed Bonds | | |
2.375% 01/15/27 | | 4,184,671 | | 4,361,214 |
| |
| U.S. Treasury Inflation Indexed Notes | | |
1.625% 01/15/18 (h) | | 7,534,220 | | 7,707,861 |
| | |
| U.S. Treasury Notes | | | | |
0.875% 01/31/12 | | 30,055,000 | | 30,019,776 |
1.375% 01/15/13 | | 4,390,000 | | 4,375,939 |
1.375% 02/15/13 | | 17,000,000 | | 16,920,304 |
1.875% 02/28/14 | | 1,365,000 | | 1,353,482 |
2.375% 02/28/15 | | 7,593,000 | | 7,540,836 |
3.125% 01/31/17 | | 9,845,000 | | 9,775,012 |
3.375% 11/15/19 | | 1,245,000 | | 1,201,328 |
| | |
| U.S. Treasury STRIPS | | | | |
(g) 11/15/19 | | 5,230,000 | | 3,528,168 |
| | | | |
U.S. Government Obligations Total | | | | 104,741,637 |
| | | | |
Total Government & Agency Obligations (cost of $139,945,912) | | 140,298,896 |
Commercial Mortgage-Backed Securities – 19.9%
| | | | |
| | | Par ($) | | Value ($) |
| Bank of America Commercial Mortgage, Inc. | | |
4.760% 11/10/39 | | 2,497,000 | | 2,548,515 |
| |
| Bear Stearns Commercial Mortgage Securities | | |
4.740% 03/13/40 | | 895,000 | | 933,869 |
4.830% 08/15/38 | | 925,000 | | 967,665 |
4.933% 02/13/42 (04/01/10) (a)(c) | | 2,290,000 | | 2,372,630 |
5.201% 12/11/38 | | 885,000 | | 884,659 |
5.471% 01/12/45 (04/01/10) (a)(c) | | 725,000 | | 738,602 |
5.518% 09/11/41 | | 5,000,000 | | 5,284,620 |
5.540% 09/11/41 | | 765,000 | | 787,653 |
5.719% 06/11/40 (04/01/10) (a)(c) | | 3,000,000 | | 2,961,328 |
5.742% 09/11/42 (04/01/10) (a)(c) | | 1,880,000 | | 1,936,332 |
6.480% 02/15/35 | | 7,096,848 | | 7,308,152 |
| |
| Chase Commercial Mortgage Securities Corp. | | |
5.857% 02/12/16 (04/01/10) (a)(b)(c) | | 4,415,000 | | 4,575,538 |
| |
| Credit Suisse First Boston Mortgage Securities Corp. | | |
6.006% 11/15/36 (04/01/10) (a)(b)(c) | | 1,000,000 | | 792,508 |
| |
| Credit Suisse Mortgage Capital Certificates | | |
5.723% 06/15/39 (04/01/10) (a)(c) | | 2,685,000 | | 2,418,631 |
| | |
| CW Capital Cobalt Ltd. | | | | |
5.820% 05/15/46 (04/01/10) (a)(c) | | 4,215,000 | | 3,990,779 |
| |
| GE Capital Commercial Mortgage Corp. | | |
5.189% 07/10/39 (04/01/10) (a)(c) | | 1,835,000 | | 1,909,166 |
6.734% 01/15/33 (a) | | 6,775,000 | | 6,866,984 |
| |
| GMAC Commercial Mortgage Securities, Inc. | | |
5.487% 05/10/40 (04/01/10) (a)(c) | | 1,060,000 | | 1,130,016 |
6.979% 05/15/33 (04/01/10) (a)(c) | | 806,266 | | 809,010 |
| |
| Greenwich Capital Commercial Funding Corp. | | |
5.317% 06/10/36 (04/01/10) (a)(c) | | 6,954,000 | | 7,311,694 |
5.886% 07/10/38 (04/01/10) (a)(c) | | 1,065,000 | | 1,085,678 |
| |
| GS Mortgage Securities Corp. II | | |
5.560% 11/10/39 | | 3,215,000 | | 3,182,799 |
| |
| JPMorgan Chase Commercial Mortgage Securities Corp. | | |
6.068% 02/12/51 | | 998,000 | | 894,287 |
| |
| LB-UBS Commercial Mortgage Trust | | |
4.853% 09/15/31 | | 4,315,000 | | 4,528,552 |
5.430% 02/15/40 | | 2,035,000 | | 1,958,349 |
5.611% 04/15/41 | | 991,520 | | 1,033,544 |
5.866% 09/15/45 (04/11/10) (a)(c) | | 2,000,000 | | 1,968,749 |
See Accompanying Notes to Financial Statements.
13
Columbia Bond Fund
March 31, 2010
Commercial Mortgage-Backed Securities (continued)
| | | | |
| | | Par ($) | | Value ($) |
| Merrill Lynch Mortgage Trust | | | | |
4.747% 06/12/43 (04/01/10) (a)(c) | | 2,500,000 | | 2,536,001 |
| | |
| Morgan Stanley Capital I | | | | |
4.970% 12/15/41 | | 4,315,000 | | 4,525,213 |
5.150% 06/13/41 | | 4,795,000 | | 5,057,173 |
5.328% 11/12/41 | | 3,000,000 | | 3,025,214 |
| |
| Morgan Stanley Dean Witter Capital I | | |
4.740% 11/13/36 | | 1,245,000 | | 1,292,646 |
4.920% 03/12/35 | | 1,370,000 | | 1,425,248 |
5.080% 09/15/37 | | 1,705,000 | | 1,787,783 |
5.980% 01/15/39 | | 1,430,000 | | 1,519,466 |
6.390% 07/15/33 | | 2,352,356 | | 2,451,748 |
7.500% 10/15/33 (a) | | 3,150,000 | | 3,198,507 |
| |
| Wachovia Bank Commercial Mortgage Trust | | |
4.039% 10/15/41 | | 2,847,701 | | 2,870,050 |
5.001% 07/15/41 | | 4,642,619 | | 4,695,057 |
5.037% 03/15/42 | | 1,939,993 | | 2,021,981 |
5.209% 10/15/44 (04/01/10) (a)(c) | | 2,490,000 | | 2,563,707 |
5.230% 07/15/41 (04/01/10) (a)(c) | | 3,905,000 | | 3,989,912 |
5.609% 03/15/45 (04/01/10) (a)(c) | | 1,905,000 | | 1,652,145 |
5.726% 06/15/45 | | 734,538 | | 740,173 |
5.765% 07/15/45 (04/01/10) (a)(c) | | 4,430,000 | | 4,515,323 |
5.997% 06/15/45 | | 920,000 | | 974,374 |
| | | | |
Total Commercial Mortgage-Backed Securities
(cost of $117,136,286) | | 122,022,030 |
| | |
Asset-Backed Securities – 5.6% | | | | |
| Ally Auto Receivables Trust | | | | |
1.450% 05/15/14 | | 700,000 | | 699,930 |
| |
| American Express Credit Account Master Trust | | |
0.270% 02/15/13 (04/15/10) (a)(c) | | 2,640,000 | | 2,639,507 |
0.510% 01/15/13 (04/15/10) (a)(b)(c) | | 1,030,000 | | 1,028,023 |
| |
| AmeriCredit Automobile Receivables Trust | | |
0.970% 01/15/13 | | 2,925,000 | | 2,925,434 |
| | |
| BMW Vehicle Lease Trust | | | | |
2.040% 04/15/11 | | 1,353,460 | | 1,357,990 |
| | | | |
| | | Par ($) | | Value ($) |
| Capital Auto Receivables Asset Trust | | |
4.460% 07/15/14 | | 4,690,000 | | 4,934,691 |
5.210% 03/17/14 | | 2,015,000 | | 2,108,353 |
| |
| Capital One Multi-Asset Execution Trust | | |
1.330% 04/15/13 (04/15/10) (a)(c) | | 1,840,000 | | 1,843,786 |
| | |
| Carmax Auto Owner Trust | | | | |
5.270% 11/15/12 | | 1,500,000 | | 1,566,358 |
| | |
| Chrysler Financial Lease Trust | | | | |
1.780% 06/15/11 (b) | | 1,190,000 | | 1,189,510 |
| |
| Citibank Credit Card Issuance Trust | | |
0.241% 05/21/12 (05/21/10) (a)(c) | | 810,000 | | 809,758 |
2.250% 12/23/14 | | 2,860,000 | | 2,876,620 |
6.300% 06/20/14 | | 130,000 | | 137,543 |
6.950% 02/18/14 | | 455,000 | | 485,268 |
| | |
| Daimler Chrysler Auto Trust | | | | |
4.480% 08/08/14 | | 920 | | 962 |
| | |
| Discover Card Master Trust | | | | |
0.597% 06/15/15 (06/15/10) (a)(c) | | 690,000 | | 685,569 |
0.880% 09/15/15 (04/15/10) (a)(c) | | 3,225,000 | | 3,230,946 |
1.530% 12/15/14 (04/15/10) (a)(c) | | 1,335,000 | | 1,348,285 |
1.530% 02/17/15 (04/15/10) (a)(c) | | 1,020,000 | | 1,038,131 |
| | |
| Franklin Auto Trust | | | | |
5.360% 05/20/16 | | 1,030,000 | | 1,066,699 |
7.160% 05/20/16 (b) | | 1,000,000 | | 1,082,800 |
| |
| Harley-Davidson Motorcycle Trust | | |
5.230% 03/15/14 | | 1,500,000 | | 1,566,536 |
| | | | |
Total Asset-Backed Securities
(cost of $34,059,361) | | | | 34,622,699 |
| | |
Municipal Bonds – 0.3% | | | | |
| California – 0.3% | | | | |
| CA Los Angeles Unified School District | | |
Series 2009,
5.750% 07/01/34 | | 880,000 | | 809,970 |
| | |
| CA State | | | | |
Series 2009,
7.550% 04/01/39 | | 955,000 | | 993,066 |
| | | | |
California Total | | | | 1,803,036 |
| | | | |
Total Municipal Bonds
(cost of $1,899,503) | | | | 1,803,036 |
See Accompanying Notes to Financial Statements.
14
Columbia Bond Fund
March 31, 2010
Collateralized Mortgage Obligation – 0.2%
| | | | | |
| | | Par ($) | | Value ($) | |
| Agency – 0.2% | | | | | |
| Federal Home Loan Mortgage Corporation | | | |
6.500% 07/15/31 | | 1,209,312 | | 1,271,644 | |
| | | | | |
Agency Total | | | | 1,271,644 | |
| | | | | |
Total Collateralized Mortgage Obligation
(cost of $1,253,878) | | | | 1,271,644 | |
| | |
Short-Term Obligation – 2.3% | | | | | |
Repurchase agreement with Fixed Income Clearing Corp., dated 03/31/10, due 04/01/10 at 0.000%, collateralized by a U.S. Treasury obligation maturing 01/31/14, market value $14,472,250 (repurchase proceeds $14,184,000) | | 14,184,000 | | 14,184,000 | |
| | | | | |
Total Short-Term Obligation
(cost of $14,184,000) | | | | 14,184,000 | |
| | | | | |
Total Investments – 102.4% (cost of $613,562,854) (i) | | | | 628,954,212 | |
| | | | | |
Other Assets & Liabilities, Net – (2.4)% | | (14,856,897 | ) |
| | | | | |
Net Assets – 100.0% | | | | 614,097,315 | |
Notes to Investment Portfolio:
| (a) | The interest rate shown on floating rate or variable rate securities reflects the rate at March 31, 2010. |
| (b) | Security exempt from registration pursuant to Rule 144A under the Securities Act of 1933. These securities may be resold in transactions exempt from registration, normally to qualified institutional buyers. At March 31, 2010, these securities, which are not illiquid, amounted to $24,896,275, which represents 4.1% of net assets. |
| (c) | Parenthetical date represents the next interest rate reset date for the security. |
| (d) | The issuer has filed for bankruptcy protection under Chapter 11 and is in default of certain debt covenants. Income is not being accrued. At March 31, 2010, the value of this security amounted to $618,975 which represents 0.1% of net assets. |
| (e) | Represents fair value as determined in good faith under procedures approved by the Board of Trustees. |
| (f) | Security purchased on a delayed delivery basis. |
| (h) | A portion of this security is held as collateral for open futures contracts. At March 31, 2010, the total market value of the security pledged amounted to $1,125,352. |
| (i) | Cost for federal income tax purposes is $613,605,533. |
The following table summarizes the inputs used, as of March 31, 2010, in valuing the Fund’s assets:
| | | | | | | | | | | | | | | |
Description | | Quoted Prices
(Level 1) | | | Other
Significant
Observable
Inputs
(Level 2) | | | Significant
Unobservable
Inputs
(Level 3) | | Total | |
Total Corporate
Fixed-Income Bonds & Notes | | $ | — | | | $ | 171,486,061 | | | $ | — | | $ | 171,486,061 | |
| | | | | | | | | | | | | | | |
Total Mortgage-
Backed
Securities | | | 21,146,167 | | | | 122,119,679 | | | | — | | | 143,265,846 | |
| | | | | | | | | | | | | | | |
Government &
Agency
Obligations | | | | | | | | | | | | | | | |
Foreign
Government Obligations | | | — | | | | 14,012,968 | | | | — | | | 14,012,968 | |
U.S.
Government Agencies | | | — | | | | 21,544,291 | | | | — | | | 21,544,291 | |
U.S.
Government Obligations | | | 101,213,469 | | | | 3,528,168 | | | | — | | | 104,741,637 | |
| | | | | | | | | | | | | | | |
Total
Government & Agency
Obligations | | | 101,213,469 | | | | 39,085,427 | | | | — | | | 140,298,896 | |
| | | | | | | | | | | | | | | |
Total Commercial Mortgage-
Backed
Securities | | | — | | | | 122,022,030 | | | | — | | | 122,022,030 | |
| | | | | | | | | | | | | | | |
Total Asset-Backed Securities | | | — | | | | 34,622,699 | | | | — | | | 34,622,699 | |
| | | | | | | | | | | | | | | |
Total Municipal
Bonds | | | — | | | | 1,803,036 | | | | — | | | 1,803,036 | |
| | | | | | | | | | | | | | | |
Total Collateralized Mortgage
Obligation | | | — | | | | 1,271,644 | | | | — | | | 1,271,644 | |
| | | | | | | | | | | | | | | |
Total Short-Term Obligation | | | — | | | | 14,184,000 | | | | — | | | 14,184,000 | |
| | | | | | | | | | | | | | | |
Total Investments | | | 122,359,636 | | | | 506,594,576 | | | | — | | | 628,954,212 | |
| | | | | | | | | | | | | | | |
Unrealized Appreciation on Futures
Contracts | | | 12,254 | | | | — | | | | — | | | 12,254 | |
| | | | | | | | | | | | | | | |
Unrealized Depreciation on Futures
Contracts | | | (327,144 | ) | | | — | | | | — | | | (327,144 | ) |
| | | | | | | | | | | | | | | |
Value of Credit Default Swap Contracts – Depreciation | | | — | | | | (201,679 | ) | | | — | | | (201,679 | ) |
| | | | | | | | | | | | | | | |
Value of Credit Default Swap Contracts – Appreciation | | | — | | | | 37,845 | | | | — | | | 37,845 | |
| | | | | | | | | | | | | | | |
Total | | $ | 122,044,746 | | | $ | 506,430,742 | | | $ | — | | $ | 628,475,488 | |
| | | | | | | | | | | | | | | |
For more information on valuation inputs, and their aggregation into the levels used in the table above, please refer to the Security Valuation section in the accompanying Notes to Financial Statements.
See Accompanying Notes to Financial Statements.
15
Columbia Bond Fund
March 31, 2010
At March 31, 2010, the Fund has entered into the following credit default swap contracts:
Credit Risk
| | | | | | | | | | | | | | | | | | | | |
Swap Counterparty | | Referenced Obligation | | Receive Buy/
Sell Protection | | Fixed Rate | | | Expiration Date | | Notional Amount | | Upfront
Premium Paid (Received) | | | Value of Contract | |
Barclays Capital | | Toll Brothers, Inc.
5.150% 05/15/15 | | Buy | | 1.000 | % | | 09/20/14 | | $ | 3,070,000 | | $ | 10,672 | | | $ | 37,845 | |
Barclays Capital | | The Home Depot | | Buy | | 1.000 | % | | 03/20/15 | | | 3,100,000 | | | (14,716 | ) | | | (37,411 | ) |
Barclays Capital | | Limited Brands, Inc. | | Buy | | 1.000 | % | | 03/20/15 | | | 1,500,000 | | | 83,772 | | | | (30,004 | ) |
Morgan Stanley | | The Home Depot | | Buy | | 1.000 | % | | 03/20/15 | | | 550,000 | | | (4,164 | ) | | | (5,110 | ) |
Barclays Capital | | Macy’s, Inc. | | Buy | | 1.000 | % | | 03/20/15 | | | 4,385,000 | | | 225,521 | | | | (85,868 | ) |
Morgan Stanley | | Limited Brands, Inc. | | Buy | | 1.000 | % | | 03/20/15 | | | 2,200,000 | | | 103,715 | | | | (25,792 | ) |
Barclays Capital | | D.R. Horton, Inc. | | Buy | | 1.000 | % | | 03/20/15 | | | 4,500,000 | | | 188,990 | | | | (17,494 | ) |
| | | | | | | | | | | | | | | | | | | | |
| | | | | | | | | | | | | | | | | | $ | (163,834 | ) |
| | | | | | | | | | | | | | | | | | | | |
At March 31, 2010, the Fund held the following open long futures contracts:
| | | | | | | | | | | | | |
Risk
Exposure/
Type | | Number of
Contracts | | Value | | Aggregate
Face Value | | Expiration
Date | | Unrealized
Appreciation |
Interest Rate Risk | | | | | | | | | | | |
5 Year U.S. Treasury Notes | | 100 | | $ | 11,484,375 | | $ | 11,472,121 | | Jun-2010 | | $ | 12,254 |
| | | | | | | | | | | | | |
At March 31, 2010, the Fund held the following open short futures contracts:
| | | | | | | | | | | | | | |
Risk
Exposure/
Type | | Number of
Contracts | | Value | | Aggregate
Face Value | | Expiration
Date | | Unrealized
Depreciation | |
Interest Rate Risk | | | | | | | | | | | | |
10 Year U.S. Treasury Notes | | 477 | | $ | 55,451,250 | | $ | 55,124,106 | | Jun-2010 | | $ | (327,144 | ) |
| | | | | | | | | | | | | | |
At March 31, 2010, the asset allocation of the Fund is as follows:
| | | |
Asset Allocation (Unaudited) | | % of
Net Assets | |
Corporate Fixed-Income Bonds & Notes | | 27.9 | |
Mortgage-Backed Securities | | 23.3 | |
Government & Agency Obligations | | 22.9 | |
Commercial Mortgage-Backed Securities | | 19.9 | |
Asset-Backed Securities | | 5.6 | |
Municipal Bonds | | 0.3 | |
Collateralized Mortgage Obligation | | 0.2 | |
| | | |
| | 100.1 | |
Short-Term Obligation | | 2.3 | |
Other Assets & Liabilities, Net | | (2.4 | ) |
| | | |
| | 100.0 | |
| | | |
| | |
Acronym | | Name |
| STRIPS | | Separate Trading of Registered Interest and Principal of Securities |
| TBA | | To Be Announced |
See Accompanying Notes to Financial Statements.
16
Statement of Assets and Liabilities – Columbia Bond Fund
March 31, 2010
| | | | | |
| | | | | ($) | |
| Assets | | Investments, at cost | | 613,562,854 | |
| | | | | |
| | Investments, at value | | 628,954,212 | |
| | Cash | | 43,849 | |
| | Open credit default swap contracts | | 37,845 | |
| | Credit default swap contracts premiums paid | | 599,868 | |
| | Receivable for: | | | |
| | Investments sold | | 4,775,074 | |
| | Fund shares sold | | 587,627 | |
| | Interest | | 7,641,761 | |
| | Foreign tax reclaims | | 11,539 | |
| | Expense reimbursement due from investment advisor | | 178,317 | |
| | Trustees’ deferred compensation plan | | 13,217 | |
| | Prepaid expenses | | 31,782 | |
| | | | | |
| | Total Assets | | 642,875,091 | |
| | |
| Liabilities | | Open credit default swap contracts | | 201,679 | |
| | Credit default swap contracts premiums received | | 18,372 | |
| | Payable for: | | | |
| | Investments purchased | | 4,991,110 | |
| | Investments purchased on a delayed delivery basis | | 21,135,658 | |
| | Fund shares repurchased | | 640,229 | |
| | Futures variation margin | | 126,406 | |
| | Distributions | | 1,142,111 | |
| | Investment advisory fee | | 311,769 | |
| | Administration fee | | 67,910 | |
| | Pricing and bookkeeping fees | | 15,291 | |
| | Transfer agent fee | | 51,043 | |
| | Trustees’ fees | | 90 | |
| | Audit fee | | 36,550 | |
| | Custody fee | | 4,858 | |
| | Distribution and service fees | | 5,076 | |
| | Chief compliance officer expenses | | 225 | |
| | Trustees’ deferred compensation plan | | 13,217 | |
| | Other liabilities | | 16,182 | |
| | | | | |
| | Total Liabilities | | 28,777,776 | |
| | |
| | | | | |
| | Net Assets | | 614,097,315 | |
| | |
| Net Assets Consist of | | Paid-in capital | | 594,984,327 | |
| | Overdistributed net investment income | | (288,554 | ) |
| | Accumulated net realized gain | | 4,488,908 | |
| | Net unrealized appreciation (depreciation) on: | | | |
| | Investments | | 15,391,358 | |
| | Credit default swap contracts | | (163,834 | ) |
| | Futures contracts | | (314,890 | ) |
| | | | | |
| | Net Assets | | 614,097,315 | |
See Accompanying Notes to Financial Statements.
17
Statement of Assets and Liabilities (continued) – Columbia Bond Fund
March 31, 2010
| | | | | | |
| | | | | | |
| Class A | | Net assets | | $ | 15,362,267 | |
| | Shares outstanding | | | 1,654,544 | |
| | Net asset value per share | | $ | 9.28 | (a) |
| | Maximum sales charge | | | 4.75 | % |
| | Maximum offering price per share ($9.28/.9525) | | $ | 9.74 | (b) |
| | |
| Class C | | Net assets | | $ | 2,226,160 | |
| | Shares outstanding | | | 239,568 | |
| | Net asset value and offering price per share | | $ | 9.29 | (a) |
| | |
| Class Y (c) | | Net assets | | $ | 14,913,205 | |
| | Shares outstanding | | | 1,603,248 | |
| | Net asset value and offering price per share | | $ | 9.30 | |
| | |
| Class Z | | Net assets | | $ | 581,595,683 | |
| | Shares outstanding | | | 62,584,255 | |
| | Net asset value and offering price per share | | $ | 9.29 | |
| (a) | Redemption price per share is equal to net asset value less any applicable contingent deferred sales charge. |
| (b) | On sales of $50,000 or more the offering price is reduced. |
| (c) | Class Y shares commenced operations on July 15, 2009. |
See Accompanying Notes to Financial Statements.
18
Statement of Operations – Columbia Bond Fund
For the Year Ended March 31, 2010
| | | | | |
| | | | | ($) | |
| Investment Income | | Interest | | 25,165,913 | |
| | Securities lending | | 24,534 | |
| | | | | |
| | Total Investment Income | | 25,190,447 | |
| | |
| Expenses | | Investment advisory fee | | 3,555,388 | |
| | Administration fee | | 754,748 | |
| | Distribution fee: | | | |
| | Class C | | 13,110 | |
| | Service fee: | | | |
| | Class A | | 29,341 | |
| | Class C | | 4,370 | |
| | Transfer agent fees – Class A, Class C and Class Z | | 322,476 | |
| | Transfer agent fees – Class Y (a)(b) | | 33 | |
| | Pricing and bookkeeping fees | | 149,216 | |
| | Trustees’ fees | | 40,715 | |
| | Custody fee | | 25,440 | |
| | Chief compliance officer expenses | | 818 | |
| | Other expenses | | 267,087 | |
| | | | | |
| | Total Expenses | | 5,162,742 | |
| | |
| | Fees waived or expenses reimbursed by investment advisor | | (1,762,911 | ) |
| | Expense reductions | | (16 | ) |
| | | | | |
| | Net Expenses | | 3,399,815 | |
| | |
| | | | | |
| | Net Investment Income | | 21,790,632 | |
| | |
| Net Realized and Unrealized Gain (Loss) on Investments, Futures Contracts and Credit Default Swap Contracts | | Net realized gain on: | | | |
| | Net realized loss on violation of investment restriction (See Note 9) | | (3,168 | ) |
| | Investments | | 11,440,086 | |
| | Futures contracts | | (820,327 | ) |
| | Credit default swap contracts | | (710,476 | ) |
| | Reimbursement of realized loss on violation of investment restriction (See Note 9) | | 3,168 | |
| | | | | |
| | Net realized gain | | 9,909,283 | |
| | |
| | Net change in unrealized appreciation (depreciation) on: | | | |
| | Investments | | 27,360,492 | |
| | Futures contracts | | (314,890 | ) |
| | Credit default swap contracts | | (163,834 | ) |
| | | | | |
| | Net change in unrealized appreciation (depreciation) | | 26,881,768 | |
| | | | | |
| | Net Gain | | 36,791,051 | |
| | |
| | | | | |
| | Net Increase Resulting from Operations | | 58,581,683 | |
| (a) | Class Y shares commenced operations on July 15, 2009. |
| (b) | Class Y shares reflect activity for the period July 15, 2009 through March 31, 2010. |
See Accompanying Notes to Financial Statements.
19
Statement of Changes in Net Assets – Columbia Bond Fund
| | | | | | | | |
| | | | | Year Ended March 31, | |
| Increase (Decrease) in Net Assets | | | | 2010 ($)(a)(b) | | | 2009 ($) | |
| Operations | | Net investment income | | 21,790,632 | | | 24,521,644 | |
| | Net realized gain (loss) on investments, futures contracts and credit default swap contracts | | 9,909,283 | | | (648,020 | ) |
| | Net change in unrealized appreciation (depreciation) on investments, futures contracts and credit default swap contracts | | 26,881,768 | | | (17,649,337 | ) |
| | | | | | | | |
| | Net increase resulting from operations | | 58,581,683 | | | 6,224,287 | |
| | | |
| Distributions to Shareholders | | From net investment income: | | | | | | |
| | Class A | | (420,354 | ) | | (40,386 | ) |
| | Class C | | (49,892 | ) | | (8,574 | ) |
| | Class Y | | (340,472 | ) | | — | |
| | Class Z | | (21,832,594 | ) | | (24,282,274 | ) |
| | From net realized gains: | | | | | | |
| | Class A | | (71,583 | ) | | (217 | ) |
| | Class C | | (13,438 | ) | | (13 | ) |
| | Class Z | | (4,489,921 | ) | | (729,525 | ) |
| | | | | | | | |
| | Total distributions to shareholders | | (27,218,254 | ) | | (25,060,989 | ) |
| | | |
| | Net Capital Stock Transactions | | 83,239,343 | | | (28,473,745 | ) |
| | Increase from regulatory settlements | | 4,011 | | | — | |
| | | | | | | | |
| | Total increase (decrease) in net assets | | 114,606,783 | | | (47,310,447 | ) |
| | | |
| Net Assets | | Beginning of period | | 499,490,532 | | | 546,800,979 | |
| | End of period | | 614,097,315 | | | 499,490,532 | |
| | Undistributed (overdistributed) net investment income at end of period | | (288,554 | ) | | 560,843 | |
| | | | | | | | |
| (a) | Class Y shares commenced operations on July 15, 2009. |
| (b) | Class Y shares reflect activity for the period July 15, 2009 through March 31, 2010. |
See Accompanying Notes to Financial Statements.
20
Statement of Changes in Net Assets (continued) – Capital Stock Activity
| | | | | | | | | | | | |
| | | Columbia Bond Fund | |
| | | Year Ended
March 31, 2010 (a)(b) | | | Year Ended
March 31, 2009 | |
| | | Shares | | | Dollars ($) | | | Shares | | | Dollars ($) | |
Class A | | | | | | | | | | | | |
Subscriptions | | 1,312,247 | | | 11,886,554 | | | 715,769 | | | 6,264,548 | |
Distributions reinvested | | 50,645 | | | 461,703 | | | 4,349 | | | 37,949 | |
Redemptions | | (311,338 | ) | | (2,857,410 | ) | | (118,214 | ) | | (1,033,619 | ) |
| | | | | | | | | | | | |
Net increase | | 1,051,554 | | | 9,490,847 | | | 601,904 | | | 5,268,878 | |
| | | | |
Class C | | | | | | | | | | | | |
Subscriptions | | 158,653 | | | 1,448,076 | | | 150,374 | | | 1,310,459 | |
Distributions reinvested | | 4,529 | | | 40,979 | | | 832 | | | 7,241 | |
Redemptions | | (73,362 | ) | | (670,217 | ) | | (2,544 | ) | | (22,388 | ) |
| | | | | | | | | | | | |
Net increase | | 89,820 | | | 818,838 | | | 148,662 | | | 1,295,312 | |
| | | | |
Class Y | | | | | | | | | | | | |
Subscriptions | | 1,644,970 | | | 14,869,097 | | | — | | | — | |
Distributions reinvested | | 23,425 | | | 216,849 | | | — | | | — | |
Redemptions | | (65,147 | ) | | (600,000 | ) | | — | | | — | |
| | | | | | | | | | | | |
Net increase | | 1,603,248 | | | 14,485,946 | | | — | | | — | |
| | | | |
Class Z | | | | | | | | | | | | |
Subscriptions | | 29,383,305 | | | 267,207,145 | | | 14,064,009 | | | 123,836,901 | |
Distributions reinvested | | 1,229,550 | | | 11,169,190 | | | 1,004,751 | | | 8,815,368 | |
Redemptions | | (24,062,158 | ) | | (219,932,623 | ) | | (19,178,104 | ) | | (167,690,204 | ) |
| | | | | | | | | | | | |
Net increase (decrease) | | 6,550,697 | | | 58,443,712 | | | (4,109,344 | ) | | (35,037,935 | ) |
| (a) | Class Y shares commenced operations on July 15, 2009. |
| (b) | Class Y shares reflect activity for the period July 15, 2009 through March 31, 2010. |
See Accompanying Notes to Financial Statements.
21
Financial Highlights – Columbia Bond Fund
Selected data for a share outstanding throughout each period is as follows:
| | | | | | | | | | | | |
| | | Year Ended
March 31, | | | Period Ended
March 31, | |
| Class A Shares | | 2010 | | | 2009 | | | 2008 (a) | |
Net Asset Value, Beginning of Period | | $ | 8.79 | | | $ | 9.09 | | | $ | 9.09 | |
| | | |
Income from Investment Operations: | | | | | | | | | | | | |
Net investment income (b) | | | 0.31 | | | | 0.35 | | | | — | (c) |
Net realized and unrealized gain (loss) on investments, futures contracts and credit default swap contracts | | | 0.59 | | | | (0.26 | ) | | | — | (c) |
| | | | | | | | | | | | |
Total from investment operations | | | 0.90 | | | | 0.09 | | | | — | (c) |
| | | |
Less Distributions to Shareholders: | | | | | | | | | | | | |
From net investment income | | | (0.33 | ) | | | (0.38 | ) | | | — | (c) |
From net realized gains | | | (0.08 | ) | | | (0.01 | ) | | | — | |
| | | | | | | | | | | | |
Total distributions to shareholders | | | (0.41 | ) | | | (0.39 | ) | | | — | (c) |
| | | |
Increase from regulatory settlements | | | — | (c) | | | — | | | | — | |
| | | |
Net Asset Value, End of Period | | $ | 9.28 | | | $ | 8.79 | | | $ | 9.09 | |
Total return (d)(e) | | | 10.39 | %(f) | | | 1.04 | % | | | 0.01 | %(g) |
| | | |
Ratios to Average Net Assets/Supplemental Data: | | | | | | | | | | | | |
Net expenses before interest expense (h) | | | 0.82 | % | | | 0.91 | % | | | 0.91 | %(i) |
Interest expense | | | — | | | | — | %(j) | | | — | |
Net expenses (h) | | | 0.82 | % | | | 0.91 | % | | | 0.91 | %(i) |
Waiver/Reimbursement | | | 0.30 | % | | | 0.22 | % | | | 0.14 | %(i) |
Net investment income (h) | | | 3.43 | % | | | 3.99 | % | | | 4.16 | %(i) |
Portfolio turnover rate | | | 256 | % | | | 209 | % | | | 49 | %(g) |
Net assets, end of period (000s) | | $ | 15,362 | | | $ | 5,299 | | | $ | 10 | |
| (a) | Class A shares commenced operations on March 31, 2008. Per share data and total return reflect activity from that date. |
| (b) | Per share data was calculated using the average shares outstanding during the period. |
| (c) | Rounds to less than $0.01 per share. |
| (d) | Had the investment advisor and/or any of its affiliates not waived fees or reimbursed a portion of expenses, total return would have been reduced. |
| (e) | Total return at net asset value assuming all distributions reinvested and no initial sales charge or contingent deferred sales charge. |
| (f) | Total return includes a reimbursement of a loss experienced by the Fund due to a compliance violation. The reimbursement had an impact of less than 0.01% on total return. |
| (h) | The benefits derived from expense reductions had an impact of less than 0.01%. |
| (j) | Rounds to less than 0.01%. |
See Accompanying Notes to Financial Statements.
22
Financial Highlights – Columbia Bond Fund
Selected data for a share outstanding throughout each period is as follows:
| | | | | | | | | | | | |
| | | Year Ended
March 31, | | | Period Ended
March 31, | |
| Class C Shares | | 2010 | | | 2009 | | | 2008 (a) | |
Net Asset Value, Beginning of Period | | $ | 8.80 | | | $ | 9.09 | | | $ | 9.09 | |
| | | |
Income from Investment Operations: | | | | | | | | | | | | |
Net investment income (b) | | | 0.25 | | | | 0.29 | | | | — | (c) |
Net realized and unrealized gain (loss) on investments, futures contracts and credit default swap contracts | | | 0.58 | | | | (0.26 | ) | | | — | (c) |
| | | | | | | | | | | | |
Total from investment operations | | | 0.83 | | | | 0.03 | | | | — | (c) |
| | | |
Less Distributions to Shareholders: | | | | | | | | | | | | |
From net investment income | | | (0.26 | ) | | | (0.31 | ) | | | — | (c) |
From net realized gains | | | (0.08 | ) | | | (0.01 | ) | | | — | |
| | | | | | | | | | | | |
Total distributions to shareholders | | | (0.34 | ) | | | (0.32 | ) | | | — | (c) |
| | | |
Increase from regulatory settlements | | | — | (c) | | | — | | | | — | |
| | | |
Net Asset Value, End of Period | | $ | 9.29 | | | $ | 8.80 | | | $ | 9.09 | |
Total return (d)(e) | | | 9.56 | %(f) | | | 0.44 | % | | | 0.01 | %(g) |
| | | |
Ratios to Average Net Assets/Supplemental Data: | | | | | | | | | | | | |
Net expenses before interest expense (h) | | | 1.57 | % | | | 1.66 | % | | | 1.66 | %(i) |
Interest expense | | | — | | | | — | %(j) | | | — | |
Net expenses (h) | | | 1.57 | % | | | 1.66 | % | | | 1.66 | %(i) |
Waiver/Reimbursement | | | 0.30 | % | | | 0.22 | % | | | 0.14 | %(i) |
Net investment income (h) | | | 2.71 | % | | | 3.32 | % | | | 3.41 | %(i) |
Portfolio turnover rate | | | 256 | % | | | 209 | % | | | 49 | %(g) |
Net assets, end of period (000s) | | $ | 2,226 | | | $ | 1,317 | | | $ | 10 | |
| (a) | Class C shares commenced operations on March 31, 2008. Per share data and total return reflect activity from that date. |
| (b) | Per share data was calculated using the average shares outstanding during the period. |
| (c) | Rounds to less than $0.01 per share. |
| (d) | Had the investment advisor and/or any of its affiliates not waived fees or reimbursed a portion of expenses, total return would have been reduced. |
| (e) | Total return at net asset value assuming all distributions reinvested and no contingent deferred sales charge. |
| (f) | Total return includes a reimbursement of a loss experienced by the Fund due to a compliance violation. The reimbursement had an impact of less than 0.01% on total return. |
| (h) | The benefits derived from expense reductions had an impact of less than 0.01%. |
| (j) | Rounds to less than 0.01%. |
See Accompanying Notes to Financial Statements.
23
Financial Highlights – Columbia Bond Fund
Selected data for a share outstanding throughout the period is as follows:
| | | | |
| Class Y Shares | | Period Ended
March 31,
2010 (a) | |
Net Asset Value, Beginning of Period | | $ | 8.93 | |
| |
Income from Investment Operations: | | | | |
Net investment income (b) | | | 0.24 | |
Net realized and unrealized gain on investments, futures contracts and credit default swap contracts | | | 0.38 | |
| | | | |
Total from investment operations | | | 0.62 | |
| |
Less Distributions to Shareholders: | | | | |
From net investment income | | | (0.25 | ) |
From net realized gains | | | — | |
| | | | |
Total distributions to shareholders | | | (0.25 | ) |
| |
Increase from regulatory settlements | | | — | |
| |
Net Asset Value, End of Period | | $ | 9.30 | |
Total return (c)(d)(e) | | | 7.00 | % |
| |
Ratios to Average Net Assets / Supplemental Data: | | | | |
Net expenses before interest expense (f)(g) | | | 0.55 | % |
Interest expense | | | — | |
Net expenses (f)(g) | | | 0.55 | % |
Waiver/Reimbursement (g) | | | 0.26 | % |
Net investment income (f)(g) | | | 3.58 | % |
Portfolio turnover rate (e) | | | 256 | % |
Net assets, end of period (000s) | | $ | 14,913 | |
| (a) | Class Y shares commenced operations on July 15, 2009. Per share data and total return reflect activity from that date. |
| (b) | Per share data was calculated using the average shares outstanding during the period. |
| (c) | Had the investment advisor and/or any of its affiliates not waived fees or reimbursed a portion of expenses, total return would have been reduced. |
| (d) | Total return at net asset value assuming all distributions reinvested. |
| (f) | The benefits derived from expense reductions had an impact of less than 0.01%. |
See Accompanying Notes to Financial Statements.
24
Financial Highlights – Columbia Bond Fund
Selected data for a share outstanding throughout each period is as follows:
| | | | | | | | | | | | | | | | | | | | |
| | | Year Ended March 31, | |
| Class Z Shares | | 2010 | | | 2009 | | | 2008 (a)(b) | | | 2007 | | | 2006 (c) | |
Net Asset Value, Beginning of Period | | $ | 8.80 | | | $ | 9.09 | | | $ | 8.98 | | | $ | 8.84 | | | $ | 9.15 | |
| | | | | |
Income from Investment Operations: | | | | | | | | | | | | | | | | | | | | |
Net investment income (d) | | | 0.34 | | | | 0.41 | | | | 0.40 | | | | 0.39 | | | | 0.37 | |
Net realized and unrealized gain (loss) on investments, futures contracts and credit default swap contracts | | | 0.58 | | | | (0.28 | ) | | | 0.10 | | | | 0.14 | | | | (0.18 | ) |
| | | | | | | | | | | | | | | | | | | | |
Total from investment operations | | | 0.92 | | | | 0.13 | | | | 0.50 | | | | 0.53 | | | | 0.19 | |
| | | | | |
Less Distributions to Shareholders: | | | | | | | | | | | | | | | | | | | | |
From net investment income | | | (0.35 | ) | | | (0.41 | ) | | | (0.39 | ) | | | (0.39 | ) | | | (0.38 | ) |
From net realized gains | | | (0.08 | ) | | | (0.01 | ) | | | — | | | | — | | | | (0.12 | ) |
| | | | | | | | | | | | | | | | | | | | |
Total distributions to shareholders | | | (0.43 | ) | | | (0.42 | ) | | | (0.39 | ) | | | (0.39 | ) | | | (0.50 | ) |
| | | | | |
Increase from regulatory settlements | | | — | (e) | | | — | | | | — | | | | — | | | | — | |
| | | | | |
Net Asset Value, End of Period | | $ | 9.29 | | | $ | 8.80 | | | $ | 9.09 | | | $ | 8.98 | | | $ | 8.84 | |
Total return (f)(g) | | | 10.66 | %(h) | | | 1.49 | % | | | 5.75 | % | | | 6.08 | % | | | 2.00 | % |
| | | | | |
Ratios to Average Net Assets/Supplemental Data: | | | | | | | | | | | | | | | | | | | | |
Net expenses before interest expense (i) | | | 0.57 | % | | | 0.66 | % | | | 0.90 | % | | | 0.90 | % | | | 0.90 | % |
Interest expense | | | — | | | | — | %(j) | | | — | | | | — | | | | — | |
Net expenses (i) | | | 0.57 | % | | | 0.66 | % | | | 0.90 | % | | | 0.90 | % | | | 0.90 | % |
Waiver/Reimbursement | | | 0.30 | % | | | 0.22 | % | | | 0.22 | % | | | 0.30 | % | | | 0.40 | % |
Net investment income (i) | | | 3.72 | % | | | 4.62 | % | | | 4.45 | % | | | 4.36 | % | | | 4.05 | % |
Portfolio turnover rate | | | 256 | % | | | 209 | % | | | 49 | % | | | 49 | % | | | 95 | % |
Net assets, end of period (000s) | | $ | 581,596 | | | $ | 492,874 | | | $ | 546,781 | | | $ | 313,967 | | | $ | 281,767 | |
| (a) | On March 31, 2008, Shares class of Core Bond Fund, a series of Excelsior Funds, Inc., was reorganized into the Fund’s Class Z shares. The financial information of the Fund’s Class Z shares includes the financial information of Core Bond Fund’s Shares class. |
| (b) | On March 31, 2008, Core Bond Fund’s Institutional Shares class were exchanged for Class Z shares of the Fund. |
| (c) | Per share data for the year ended March 31, 2006 was audited by other auditors. |
| (d) | Per share data was calculated using the average shares outstanding during the period. |
| (e) | Rounds to less than $0.01 per share. |
| (f) | Had the investment advisor and/or any of its affiliates not waived fees or reimbursed a portion of expenses, total return would have been reduced. |
| (g) | Total return at net asset value assuming all distributions reinvested. |
| (h) | Total return includes a reimbursement of a loss experienced by the Fund due to a compliance violation. The reimbursement had an impact of less than 0.01% on total return. |
| (i) | The benefits derived from expense reductions had an impact of less than 0.01%. |
| (j) | Rounds to less than 0.01%. |
See Accompanying Notes to Financial Statements.
25
Notes to Financial Statements – Columbia Bond Fund
March 31, 2010
Note 1. Organization
Columbia Bond Fund (the “Fund), a series of Columbia Funds Series Trust I (the “Trust”), is a diversified fund. The Trust is registered under the Investment Company Act of 1940, as amended (the “1940 Act”), as an open-end management investment company organized as a Massachusetts business trust.
Investment Objective
The Fund seeks high current income, consistent with minimal fluctuation of principal.
Fund Shares
The Trust may issue an unlimited number of shares, and the Fund offers four classes of shares: Class A, Class C, Class Y and Class Z. Each share class has its own expense structure and sales charges, as applicable. Class Y shares commenced operations effective July 15, 2009.
Class A shares are subject to a maximum front-end sales charge of 4.75% based on the amount of initial investment. Class A shares purchased without an initial sales charge in accounts aggregating $1 million to $50 million at the time of purchase are subject to a 1.00% contingent deferred sales charge (“CDSC”) if the shares are sold within one year after purchase. Class C shares are subject to a 1.00% CDSC on shares sold within one year after purchase. Class Y and Class Z shares are offered continuously at net asset value. There are certain restrictions on the purchase of Class Y and Class Z shares, as described in the Fund’s prospectus.
Note 2. Significant Accounting Policies
The preparation of financial statements in accordance with accounting principles generally accepted in the United States of America (“GAAP”) requires management to make certain estimates and assumptions that affect the reported amounts of assets and liabilities, the disclosure of contingent assets and liabilities at the date of the financial statements and the reported amounts of revenue and expenses during the reporting period. Actual results could differ from those estimates.
The following is a summary of significant accounting policies consistently followed by the Fund in the preparation of its financial statements.
Security Valuation
Debt securities generally are valued by pricing services approved by the Trust’s Board of Trustees, based upon market transactions for normal, institutional-size trading units of similar securities. The services may use various pricing techniques which take into account appropriate factors such as yield, quality, coupon rate, maturity, type of issue, trading characteristics and other data, as well as broker quotes. Debt securities for which quotations are readily available may also be valued based upon an over-the-counter or exchange bid quotation.
Certain debt securities, which tend to be more thinly traded and of lesser quality, are priced based on fundamental analysis of the financial condition of the issuer and the estimated value of any collateral. Valuations developed through pricing techniques may vary from the actual amounts realized upon sale of the securities, and the potential variation may be greater for those securities valued using fundamental analysis.
Short-term investments maturing in 60 days or less are valued at amortized cost, which approximates market value.
Investments in other open-end investment companies are valued at net asset value.
Futures contracts are valued at the settlement price established each day by the board of trade or exchange on which they are traded.
Credit default swap contracts are marked to market daily based upon spread quotations from market makers.
Investments for which market quotations are not readily available, or that have quotations which management believes are not reliable, are valued at fair value as determined in good faith under consistently applied procedures established by and under the general supervision of the Board of Trustees. If a security is valued at fair value, such value is likely to be different from the last quoted market price for the security. The determination of fair value often requires significant judgment. To determine fair value, management may use assumptions including but not limited to future cash flows and estimated risk premiums. Multiple inputs from various sources may be used to determine value.
GAAP establishes a hierarchy that prioritizes the inputs to valuation techniques used to measure fair value giving the
26
Columbia Bond Fund
March 31, 2010
highest priority to unadjusted quoted prices in active markets for identical securities (level 1 measurements) and the lowest priority to unobservable inputs (level 3 measurements) when market prices are not readily available or reliable. The three levels of the fair value hierarchy are described below:
| n | | Level 1 — quoted prices in active markets for identical securities |
| n | | Level 2 — prices determined using other significant observable inputs (including quoted prices for similar securities, interest rates, prepayment speeds, credit risk and others) |
| n | | Level 3 — prices determined using significant unobservable inputs. In situations where quoted prices or observable inputs are unavailable or less reliable, unobservable inputs may be used. Unobservable inputs may include management’s own assumptions about the factors market participants would use in pricing an investment. |
The inputs or methodology used for valuing securities are not necessarily an indication of the risk associated with investing in those securities.
On January 21, 2010, the FASB issued an Accounting Standards Update (the amendment), Fair Value Measurements and Disclosures (Topic 820): Improving Disclosures about Fair Value Measurements, which provides guidance on how investment assets and liabilities are to be valued and disclosed. Specifically, the amendment requires reporting entities to disclose the input and valuation techniques used to measure fair value for both recurring and nonrecurring fair value measurements for Level 2 or Level 3 positions. The amendment also requires that transfers between all levels (including Level 1 and Level 2) be disclosed on a gross basis (i.e., transfers out must be disclosed separately from transfers in), and the reason(s) for the transfer. Additionally purchases, sales, issuances and settlements must be disclosed on a gross basis in the Level 3 rollforward. The effective date of the amendment is for interim and annual periods beginning after December 15, 2009, however, the requirement to provide the Level 3 activity for purchases, sales, issuances and settlements on a gross basis will be effective for interim and annual periods beginning after December 15, 2010. At this time, management is evaluating the implications of the amendment and the impact to the financial statements.
Security Transactions
Security transactions are accounted for on the trade date. Cost is determined and gains (losses) are based upon the specific identification method for both financial statement and federal income tax purposes.
Derivative Instruments
The Fund may invest in derivative instruments. For additional information on derivative instruments, please see Note 6.
Repurchase Agreements
The Fund may engage in repurchase agreement transactions with institutions that Columbia Management Advisors, LLC (“Columbia”), the Fund’s investment advisor, has determined are creditworthy. The Fund, through its custodian, receives delivery of the underlying securities collateralizing a repurchase agreement. Columbia is responsible for determining that the collateral is at least equal, at all times, to the value of the repurchase obligation including interest. A repurchase agreement transaction involves certain risks in the event of default or insolvency of the counterparty. These risks include possible delays in or restrictions on the Fund’s ability to dispose of the underlying securities and a possible decline in the value of the underlying securities during the period while the Fund seeks to assert its rights.
Delayed Delivery Securities
The Fund may trade securities on other than normal settlement terms, including securities purchased or sold on a “when-issued” basis. This may increase the risk if the other party to the transaction fails to deliver and causes the Fund to subsequently invest at less advantageous prices. The Fund identifies within its portfolio of investments cash or liquid securities in an amount equal to the delayed delivery commitment.
Treasury Inflation Protected Securities
The Fund may invest in treasury inflation protected securities (“TIPS”). The principal amount of TIPS is adjusted periodically and is increased for inflation or decreased for deflation based on a monthly published index. Interest payments are based on the adjusted principal at the time the interest is paid. These adjustments are recorded as interest income on the Statement of Operations.
27
Columbia Bond Fund
March 31, 2010
Income Recognition
Interest income is recorded on the accrual basis. Premium and discount are amortized and accreted, respectively, on all debt securities, unless otherwise noted. Original issue discount is accreted to interest income over the life of the security with a corresponding increase in the cost basis. Corporate actions and dividend income are recorded on the ex-date.
Expenses
General expenses of the Trust are allocated to the Fund and other series of the Trust based upon relative net assets or other expense allocation methodologies determined by the nature of the expense. Expenses directly attributable to a specific class of shares are charged to that share class. Expenses directly attributable to a Fund are charged to such Fund.
Determination of Class Net Asset Value
All income, expenses (other than class-specific expenses, as shown on the Statement of Operations) and realized and unrealized gains (losses) are allocated to each class of the Fund on a daily basis for purposes of determining the net asset value of each class. Income and expenses are allocated to each class based on the settled shares method, while realized and unrealized gains (losses) are allocated based on the relative net assets of each class.
Federal Income Tax Status
The Fund intends to qualify each year as a “regulated investment company” under Subchapter M of the Internal Revenue Code, as amended, and will distribute substantially all of its tax exempt or taxable income, if any, for its tax year, and as such will not be subject to federal income taxes. In addition, the Fund intends to distribute in each calendar year substantially all of its net investment income, capital gains and certain other amounts, if any, such that the Fund should not be subject to federal excise tax. Therefore, no federal income or excise tax provision is recorded.
Distributions to Shareholders
Distributions from net investment income are declared daily and paid monthly. Net realized capital gains, if any, are distributed at least annually. Income distributions and capital gain distributions are determined in accordance with federal income tax regulations which may differ from GAAP.
Indemnification
In the normal course of business, the Fund enters into contracts that contain a variety of representations and warranties and which provide general indemnities. The Fund’s maximum exposure under these arrangements is unknown because this would involve future claims against the Fund. Also, under the Trust’s organizational documents and by contract, the Trustees and officers of the Trust are indemnified against certain liabilities that may arise out of actions relating to their duties to the Trust. However, based on experience, the Fund expects the risk of loss due to these representations, warranties and indemnities to be minimal.
Note 3. Federal Tax Information
The timing and character of income and capital gain distributions are determined in accordance with income tax regulations, which may differ from GAAP. Reclassifications are made to the Fund’s capital accounts for permanent tax differences to reflect income and gains available for distribution (or available capital loss carryforwards) under income tax regulations.
For the year ended March 31, 2010, permanent book and tax basis differences resulting primarily from differing treatments for proceeds received from litigation settlements were identified and reclassified among the components of the Fund’s net assets as follows:
| | | | |
| | | | | |
Overdistributed Net Investment
Income | | Accumulated Net Realized
Gain | | Paid-In
Capital |
| $3,283 | | $727 | | $(4,010) |
Net investment income and net realized gains (losses), as disclosed on the Statement of Operations, and net assets were not affected by this reclassification.
The tax character of distributions paid during the years ended March 31, 2010 and March 31, 2009 was as follows:
| | | | | | |
| | | March 31, 2010 | | March 31, 2009 |
| Distributions paid from: | | |
Ordinary Income* | | $ | 26,334,036 | | $ | 24,993,533 |
Long-Term Capital Gains | | | 884,218 | | | 67,456 |
| * | For tax purposes short-term capital gain distributions, if any, are considered ordinary income distributions. |
28
Columbia Bond Fund
March 31, 2010
As of March 31, 2010, the components of distributable earnings on a tax basis were as follows:
| | | | |
| | | | | |
Undistributed
Ordinary Income | | Undistributed Long-Term Capital Gains | | Net
Unrealized Appreciation* |
| $5,100,661 | | $— | | $15,348,679 |
| * | The differences between book-basis and tax-basis net unrealized appreciation are primarily due to deferral of losses from wash sales. |
Unrealized appreciation and depreciation at March 31, 2010, based on cost of investments for federal income tax purposes were:
| | | | |
| | | | |
Unrealized appreciation | | $ | 20,516,933 | |
Unrealized depreciation | | | (5,168,254 | ) |
Net unrealized appreciation | | $ | 15,348,679 | |
Management is required to determine whether a tax position of the Fund is more likely than not to be sustained upon examination by the applicable taxing authority, including resolution of any related appeals or litigation processes, based on the technical merits of the position. The tax benefit to be recognized by the Fund is measured as the largest amount of benefit that is greater than fifty percent likely of being realized upon ultimate settlement. Management is not aware of any tax positions for which it is reasonably possible that the total amounts of unrecognized tax benefits will significantly change in the next twelve months. However, management’s conclusions may be subject to review and adjustment at a later date based on factors including, but not limited to, new tax laws, regulations, and administrative interpretations (including relevant court decisions). The Fund’s federal tax returns for the prior three fiscal years remain subject to examination by the Internal Revenue Service.
Note 4. Fees and Compensation Paid to Affiliates
Investment Advisory Fee
Columbia, an indirect, wholly owned subsidiary of Bank of America Corporation (“BOA”) provides investment advisory services to the Fund. Columbia receives a monthly investment advisory fee based on the Fund’s average daily net assets at the following annual rates:
| | | |
| | | | |
| Average Daily Net Assets | | Annual Fee Rate | |
First $500 million | | 0.65 | % |
$500 million to $1 billion | | 0.35 | % |
$1 billion to $1.5 billion | | 0.32 | % |
$1.5 billion to $3 billion | | 0.29 | % |
$3 billion to $6 billion | | 0.28 | % |
Over $6 billion | | 0.27 | % |
For the year ended March 31, 2010, the Fund’s effective investment advisory fee rate was 0.60% of the Fund’s average daily net assets.
Bank of America, N.A., an indirect parent company of Columbia, entered into an agreement dated September 29, 2009, to sell a portion of the asset management business of Columbia Management Group, LLC to Ameriprise Financial, Inc. (“Ameriprise Financial”). The transaction (“Transaction”) includes the sale of the part of the asset management business that advises long-term mutual funds, including the Fund. The Transaction is subject to certain approvals and other conditions to closing, and is currently expected to close on or about April 30, 2010 (the “Closing”).
In connection with the Closing, certain changes will occur, including a change in the entities serving as the investment advisor, administrator, distributor and transfer agent of the Fund. RiverSource Investments, LLC (the “New Advisor”), a subsidiary of Ameriprise Financial, will become the investment advisor of the Fund upon the Closing. On March 3, 2010, the Fund’s shareholders approved, among other matters, the proposed investment management services agreement with the New Advisor. The New Advisor will serve as investment advisor under a new investment management services agreement effective upon the Closing. The New Advisor will change its name to Columbia Management Investment Advisers, LLC upon or shortly after the Closing. Effective upon the Closing, as the context requires, references to Columbia shall be deemed to refer to the New Advisor.
Administration Fee
Columbia provides administrative and other services to the Fund for a monthly administration fee at the annual rate of 0.15% of the Fund’s average daily net assets less the fees payable by the Fund as described under the Pricing and Bookkeeping Fees note below.
29
Columbia Bond Fund
March 31, 2010
The New Advisor will become the administrator of the Fund under a new administrative services agreement effective upon the Closing.
Pricing and Bookkeeping Fees
The Fund has entered into a Financial Reporting Services Agreement (the “Financial Reporting Services Agreement”) with State Street Bank and Trust Company (“State Street”) and Columbia pursuant to which State Street provides financial reporting services to the Fund. The Fund has also entered into an Accounting Services Agreement (collectively with the Financial Reporting Services Agreement, the “State Street Agreements”) with State Street and Columbia pursuant to which State Street provides accounting services to the Fund. Under the State Street Agreements, the Fund pays State Street an annual fee of $38,000 paid monthly plus an additional monthly fee based on an annualized percentage rate of average daily net assets of the Fund for the month. The aggregate fee will not exceed $140,000 per year (exclusive of out-of-pocket expenses and charges). The Fund also reimburses State Street for certain out-of-pocket expenses and charges.
Among other updates to the State Street Agreements, Columbia will assign and delegate its rights and obligations thereunder to the New Advisor upon the Closing.
The Fund has entered into a Pricing and Bookkeeping Oversight and Services Agreement (the “Services Agreement”) with Columbia. Under the Services Agreement, Columbia provides services related to Fund expenses and the requirements of the Sarbanes-Oxley Act of 2002, and provides oversight of the accounting and financial reporting services provided by State Street. Under the Services Agreement, the Fund reimburses Columbia for out-of-pocket expenses.
The Services Agreement will be terminated upon the Closing, and the services provided thereunder will be covered under the administrative services agreement with the New Advisor.
Transfer Agent Fee
Columbia Management Services, Inc. (the “Transfer Agent”), an affiliate of Columbia and an indirect, wholly owned subsidiary of BOA, provides shareholder services to the Fund and has contracted with Boston Financial Data Services (“BFDS”) to serve as sub-transfer agent.
The Fund pays a monthly fee to the Transfer Agent for its services. All share classes, with the exception of Class Y shares (the “Other Share Classes”) pay a monthly service fee (the “aggregate fee”) based on the following:
| (i) | Effective November 1, 2009, an annual rate of $22.36 is applied to the aggregate number of accounts for the Other Share Classes. Prior to November 1, 2009, the annual rate was $17.34 per account. |
| (ii) | An allocated portion of fees for wire, telephone and redemption orders, Individual Retirement Account (“IRA”) trustee agent fees and account transcript fees due to the Transfer Agent from shareholders of the Fund and credits (net of bank charges) earned with respect to balances in accounts the Transfer Agent maintains in connection with its services to the Fund. The Transfer Agent also receives reimbursement for certain out-of-pocket expenses. |
The aggregate fee is allocated to the Other Share Classes based on the relative average daily net assets of each share class.
Class Y shares of the Fund pay a monthly service fee based on the following:
| (i) | Effective November 1, 2009, an annual rate of $22.36 is applied to the aggregate number of accounts for Class Y shares. Prior to November 1, 2009, the annual rate was $17.34 per account. |
| (ii) | An allocated portion of fees for wire, telephone and redemption orders, IRA trustee agent fees and account transcript fees due to the Transfer Agent from shareholders of the Fund and credits (net of bank charges) earned with respect to balances in accounts the Transfer Agent maintains in connection with its services to the Fund. The Transfer Agent also receives reimbursement for certain out-of-pocket expenses. |
The Transfer Agent is also entitled to receive reimbursement of certain sub-transfer agent fees paid by the Transfer Agent (exclusive of BFDS fees), calculated based on the combined assets held in the Other Share Classes in omnibus accounts and intended to recover the cost of payments to other parties (including affiliates of BOA) for services to those accounts. Such fees are allocated to the Other Share Classes based on the relative average daily net assets of each share class. The Transfer Agent pays the fees of BFDS for services as sub-transfer agent and is not entitled to reimbursement for such fees from the Fund.
30
Columbia Bond Fund
March 31, 2010
RiverSource Service Corporation (the “New Transfer Agent”), a subsidiary of Ameriprise Financial, will become the transfer agent of the Fund upon the Closing. The New Transfer Agent will change its name to Columbia Management Investment Services Corp. upon or shortly after the Closing.
An annual minimum account balance fee of $20 may apply to certain accounts with a value below the Fund’s initial minimum investment requirements to reduce the impact of small accounts on transfer agent fees. These minimum account balance fees are recorded as part of expense reductions on the Statement of Operations. For the year ended March 31, 2010, no minimum account balance fees were charged by the Fund.
Underwriting Discounts, Service and Distribution Fees
Columbia Management Distributors, Inc. (the “Distributor”) an affiliate of Columbia and an indirect, wholly-owned subsidiary of BOA, is the principal underwriter of the Fund’s shares. For the year ended March 31, 2010, the Distributor has retained net underwriting discounts of $10,847 on the sale of the Fund’s Class A shares and received net CDSC fees of $813 on Class C share redemptions.
RiverSource Fund Distributors, Inc. (the “New Distributor”), a subsidiary of Ameriprise Financial, will become the distributor of the Fund upon the Closing. The New Distributor will change its name to Columbia Management Investment Distributors, Inc. upon or shortly after the Closing.
The Fund has adopted distribution and shareholder servicing plans (the “Plans”) pursuant to Rule 12b-1 under the 1940 Act, which require the payment of distribution and service fees. The fees are intended to compensate the Distributor and/or eligible selling and/or servicing agents for selling shares of the Fund and providing services to investors. The Plans require the payment of a monthly service fee to the Distributor at the annual rate of 0.25% of the average daily net assets attributable to Class A and Class C shares. The Plans also require the payment of a monthly distribution fee to the Distributor at the annual rate of 0.75% of the average daily net assets attributable to Class C shares only.
The CDSC and the distribution fees received from the Plans are used principally as repayment to the Distributor for amounts paid by the Distributor to dealers who sold such shares.
Fee Waivers and Expense Reimbursements
Effective June 17, 2009, Columbia has voluntarily agreed to reimburse a portion of the Fund’s expenses so that the Fund’s ordinary operating expenses (excluding any distribution and service fees, brokerage commissions, interest, taxes and extraordinary expenses, but including custodian charges relating to overdrafts, if any), after giving effect to any balance credits from the Fund’s custodian, do not exceed 0.55% of the Fund’s average daily net assets on an annualized basis. Columbia, in its discretion, may revise or discontinue this arrangement at any time.
Prior to June 17, 2009, Columbia contractually agreed to bear a portion of the Fund’s expenses so that the Fund’s ordinary operating expenses (excluding any distribution and service fees, brokerage commissions, interest, taxes and extraordinary expenses, but including custodian charges relating to overdrafts, if any), after giving effect to any balance credits from the Fund’s custodian, did not exceed 0.66% annually of the Fund’s average daily net assets.
Fees Paid to Officers and Trustees
All officers of the Fund are employees of Columbia or its affiliates and, with the exception of the Fund’s Chief Compliance Officer, receive no compensation from the Fund. The Board of Trustees has appointed a Chief Compliance Officer to the Fund in accordance with federal securities regulations. The Fund, along with other affiliated funds, pays its pro-rata share of the expenses associated with the Chief Compliance Officer. The Fund’s expenses for the Chief Compliance Officer will not exceed $15,000 per year.
Trustees are compensated for their services to the Fund, as set forth on the Statement of Operations. The Trust’s eligible Trustees may participate in a deferred compensation plan which may be terminated at any time. Obligations of the plan will be paid solely out of the Fund’s assets.
Note 5. Custody Credits
The Fund has an agreement with its custodian bank under which custody fees may be reduced by balance credits. These credits are recorded as part of expense reductions on the Statement of Operations. The Fund could have invested a portion of the assets utilized in connection with the expense offset arrangement in an income-producing asset if it had not entered into such an agreement. For the year ended March 31, 2010, these custody credits reduced total expenses by $16 for the Fund.
31
Columbia Bond Fund
March 31, 2010
Note 6. Objectives and Strategies for Investing in Derivative Instruments
The Fund uses derivatives instruments including futures contracts and credit default swaps in order to meet its investment objectives. The Fund employs strategies in differing combinations to permit it to increase, decrease or change the level of exposure to market risk factors. The achievement of any strategy relating to derivatives depends on an analysis of various risk factors, and if the strategies for the use of derivatives do not work as intended, the Fund may not achieve its investment objectives.
In pursuit of its investment objectives, the Fund is exposed to the following market risks:
Credit Risk: Credit risk relates to the ability of the issuer or guarantor of a fixed income security, or counterparty to a derivative contract to make timely principal and/or interest payments, or to otherwise honor its obligations. Securities are subject to varying degrees of credit risk, which are often reflected in credit ratings. Generally, lower-yield higher-quality bonds are subject to credit risk to a lesser extent than lower-grade higher-yield bonds.
Interest Rate Risk: Interest rate risk relates to the fluctuation in value of fixed income securities because of the inverse relationship of price and yield. Fixed income securities generally will decline in value upon an increase in general interest rates and their value generally will increase upon a decline in general interest rates. Fixed income securities with longer durations tend to be more sensitive to changes in interest rates, usually making them more volatile than securities with shorter durations.
The following notes provide more detailed information about each derivative type held by the Fund:
Futures Contracts
The Fund entered into interest rate futures contracts to manage the duration and yield curve exposure of the Fund versus the benchmark.
The use of futures contracts involves certain risks, which include, among these: (1) imperfect correlation between the price movement of the instruments and the underlying securities, (2) inability to close out positions due to differing trading hours, or the temporary absence of a liquid market, for either the instruments or the underlying securities, and (3) an inaccurate prediction of the future direction of interest rates by Columbia.
Upon entering into a futures contract, the Fund identifies within its portfolio of investments cash or securities in an amount sufficient to meet the initial margin requirement. Subsequent payments are made or received by the Fund equal to the daily change in the contract value and are recorded as variation margin receivable or payable and offset in unrealized gains or losses. The Fund recognizes a realized gain or loss when the contract is closed or expires.
Futures contracts involve, to varying degrees, risk of loss in excess of the variation margin disclosed on the Statement of Assets and Liabilities.
During the year ended March 31, 2010, the Fund entered into 3,860 futures contracts.
Credit Default Swaps
The Fund entered into credit default swap transactions as a protection buyer to reduce credit exposure to a given issuer or issuers.
Credit default swaps are agreements in which one party pays fixed periodic payments to a counterparty in consideration for a guarantee from the counterparty to make a specific payment should a negative credit event take place. The Fund may receive or make an upfront payment as the protection buyer or seller. Credit default swaps are marked to market daily based on quotations from market makers and any change is recorded as unrealized appreciation/depreciation on the Statement of Assets and Liabilities. Periodic payments received or made are recorded as a realized gain or loss and premiums received or made are amortized on the Statement of Operations.
If the Fund is a buyer of protection and a credit event occurs, as defined under the terms of that particular swap agreement, the Fund will either (i) receive from the seller of protection an amount equal to the notional amount of the swap and deliver the referenced obligation or underlying securities comprising the referenced index or (ii) receive a net settlement amount in the form of cash or securities equal to the notional amount of the swap less the recovery value of the referenced obligation or underlying securities comprising the referenced index.
32
Columbia Bond Fund
March 31, 2010
If the Fund is a seller of protection and a credit event occurs, as defined under the terms of that particular swap agreement, the Fund will either (i) pay to the buyer of protection an amount equal to the notional amount of the swap and take delivery of the referenced obligation or underlying securities comprising the referenced index or (ii) pay a net settlement amount in the form of cash or securities equal to the notional amount of the swap less the recovery value of the referenced obligation or underlying securities comprising the referenced index.
Credit default swap agreements involve greater risks than if the Fund had invested in the reference obligation directly since, in addition to general market risks, credit default swaps are subject to illiquidity risk, counterparty risk and credit risk.
During the year ended March 31, 2010, the Fund purchased credit default swaps with a notional amount of $38,275,000.
The following table is a summary of the value of the Fund’s derivative instruments as of March 31, 2010:
| | | | | | | |
| Fair Value of Derivative Instruments |
| Assets | | Liabilities |
Statement
of Assets
and
Liabilities | | Fair
Value | | Statement
of Assets
and
Liabilities | | Fair
Value |
Futures
variation
margin | | $ | — | | Futures
variation
margin | | $126,406* |
Open credit
default
swaps/
Premiums | | | 637,713 | | Open credit
default
swaps/
Premiums | | 220,051 |
| *Includes | only current day’s variation margin. |
The effect of derivative instruments on the Statement of Operations for the year ended March 31, 2010:
| | | | | | | | |
| | | | |
| | | Amount of Realized Gain or (Loss)
and Change in Unrealized
Appreciation or (Depreciation) on
Derivatives Recognized in Income | |
| | | Risk
Exposure | | Net
Realized
Gain
(Loss) | | | Change in Unrealized
Appreciation (Depreciation) | |
| Futures Contracts | | Interest
Rate
Risk | | $(820,327) | | | $(314,890) | |
Credit Default Swap Contracts | | Credit
Risk | | (710,476 | ) | | (163,834 | ) |
Note 7. Portfolio Information
For the year ended March 31, 2010, the cost of purchases and proceeds from sales of securities, excluding short-term obligations, for the Fund were $1,553,233,950 and $1,429,355,459, respectively, of which $1,210,611,099 and $1,148,352,150, respectively, were U.S. Government securities.
Note 8. Regulatory Settlements
During the year ended March 31, 2010, the Fund received payments totaling $4,011 relating to certain regulatory settlements with third parties that the Fund had participated in during the year. The payments have been included in “Increase from regulatory settlements” on the Statement of Changes in Net Assets.
Note 9. Other
During the year ended March 31, 2010, the Fund purchased a security in violation of investment restrictions and experienced a realized loss of $3,168. Columbia reimbursed the Fund for the loss.
Note 10. Line of Credit
The Fund and other affiliated funds participate in a $280,000,000 committed, unsecured revolving line of credit provided by State Street. The maximum amount that may be borrowed by any fund is limited to the lesser of $200,000,000 and the Fund’s borrowing limit set forth in the Fund’s
33
Columbia Bond Fund
March 31, 2010
registration statement. Borrowings are available for short-term liquidity or temporary or emergency purposes.
Effective October 15, 2009, interest is charged to each participating fund based on the fund’s borrowings at a rate per annum equal to the greater of the Federal Funds Rate plus 1.25% or the overnight LIBOR Rate plus 1.25%. In addition, a commitment fee of 0.15% per annum is accrued and apportioned among the participating funds pro rata based on their relative net assets.
Prior to October 15, 2009, interest was charged to each participating fund based on the fund’s borrowings at a rate per annum equal to the greater of the Federal Funds Rate plus 0.50% or the overnight LIBOR Rate plus 0.50%. In addition, an annual operations agency fee of $20,000, an amendment fee of 0.02% and a commitment fee of 0.12% per annum were accrued and apportioned among the participating funds pro rata based on their relative net assets.
For the year ended March 31, 2010, the Fund did not borrow under these arrangements.
Note 11. Securities Lending
The Fund may lend its securities to certain approved brokers, dealers and other financial institutions. Each loan is collateralized by cash, in an amount at least equal to the market value of the securities loaned plus accrued income from the investment of collateral. The market value of the loaned securities is determined at the close of business of the Fund and any additional required collateral is delivered to the Fund on the next business day. The collateral received is invested and the income generated by the investment of the collateral, net of any fees remitted to State Street as the lending agent and borrower rebates, is paid to the Fund. Generally, in the event of borrower default, the Fund has the right to use the collateral to offset any losses incurred. In the event the Fund is delayed or prevented from exercising its right to dispose of the collateral, there may be a potential loss to the Fund. The Fund bears the risk of loss with respect to the investment of collateral.
Note 12. Shares of Beneficial Interest
As of March 31, 2010, 60.3% of the Fund’s shares outstanding were beneficially owned by one participant account over which BOA and/or any of its affiliates had either sole or joint investment discretion.
As of March 31, 2010, the Fund had one shareholder that held 7.6% of the shares outstanding, over which BOA and/or any of its affiliates did not have investment discretion.
As of March 31, 2010, no other shareholders owned more than 5% of the outstanding shares of the Fund.
Subscription and redemption activity of these accounts may have a significant effect on the operations of the Fund.
Note 13. Significant Risks and Contingencies
Asset-Backed Securities Risk
The value of asset-backed securities may be affected by, among other factors, changes in interest rates, the market’s assessment of the quality of underlying assets, the creditworthiness of the servicer for the underlying assets, factors concerning the interests in and structure of the issuer or the originator of the underlying assets, or the creditworthiness or rating of the entities that provide any supporting letters of credit, surety bonds, derivative instruments, or other credit enhancement. The value of asset-backed securities also will be affected by the exhaustion, termination or expiration of any credit enhancement. Most asset-backed securities are subject to prepayment risk, which is the possibility that the underlying debt may be refinanced or prepaid prior to maturity during periods of declining or low interest rates, causing the Fund to have to reinvest the money received in securities that have lower yields. In addition, the impact of prepayments on the value of asset-backed securities may be difficult to predict and may result in greater volatility.
Mortgage-Backed Securities Risk
The value of mortgage-backed securities may be affected by, among other things, changes in interest rates, factors concerning the interests in and structure of the issuer or the originator of the mortgages, the creditworthiness of the entities that provide any supporting letters of credit, surety bonds or other credit enhancements or the quality of underlying assets or the market’s assessment thereof. Mortgage-backed securities are subject to prepayment risk, which is the possibility that the underlying mortgage may be refinanced or prepaid prior to maturity during periods of
34
Columbia Bond Fund
March 31, 2010
declining or low interest rates, causing the Fund to have to reinvest the money received in securities that have lower yields. In addition, the impact of prepayments on the value of mortgage-backed securities may be difficult to predict and may result in greater volatility.
Information Regarding Pending and Settled Legal Proceedings
In June 2004, an action captioned John E. Gallus et al. v. American Express Financial Corp. and American Express Financial Advisors Inc. was filed in the United States District Court for the District of Arizona. The plaintiffs allege that they are investors in several American Express Company (now known as RiverSource) mutual funds and they purport to bring the action derivatively on behalf of those funds under the Investment Company Act of 1940. The plaintiffs allege that fees allegedly paid to the defendants by the funds for investment advisory and administrative services are excessive. The plaintiffs seek remedies including restitution and rescission of investment advisory and distribution agreements. The plaintiffs voluntarily agreed to transfer this case to the United States District Court for the District of Minnesota (the District Court). In response to defendants’ motion to dismiss the complaint, the District Court dismissed one of plaintiffs’ four claims and granted plaintiffs limited discovery. Defendants moved for summary judgment in April 2007. Summary judgment was granted in the defendants’ favor on July 9, 2007. The plaintiffs filed a notice of appeal with the Eighth Circuit Court of Appeals (the Eighth Circuit) on August 8, 2007. On April 8, 2009, the Eighth Circuit reversed summary judgment and remanded to the District Court for further proceedings. On August 6, 2009, defendants filed a writ of certiorari with the U.S. Supreme Court (the Supreme Court), asking the Supreme Court to stay the District Court proceedings while the Supreme Court considers and rules in a case captioned Jones v. Harris Associates, which involves issues of law similar to those presented in the Gallus case. On March 30, 2010, the Supreme Court issued its ruling in Jones v. Harris Associates, and on April 5, 2010, the Supreme Court vacated the Eighth Circuit’s decision in the Gallus case and remanded the case to the Eighth Circuit for further consideration in light of the Supreme Court’s decision in Jones v. Harris Associates.
In December 2005, without admitting or denying the allegations, American Express Financial Corporation (AEFC, which is now known as Ameriprise Financial, Inc. (Ameriprise Financial)), entered into settlement agreements with the Securities and Exchange Commission (SEC) and Minnesota Department of Commerce (MDOC) related to market timing activities. As a result, AEFC was censured and ordered to cease and desist from committing or causing any violations of certain provisions of the Investment Advisers Act of 1940, the Investment Company Act of 1940, and various Minnesota laws. AEFC agreed to pay disgorgement of $10 million and civil money penalties of $7 million. AEFC also agreed to retain an independent distribution consultant to assist in developing a plan for distribution of all disgorgement and civil penalties ordered by the SEC in accordance with various undertakings detailed at http://www.sec.gov/litigation/admin/ia-2451.pdf. Ameriprise Financial and its affiliates have cooperated with the SEC and the MDOC in these legal proceedings, and have made regular reports to the RiverSource Funds’ Boards of Directors/Trustees.
On November 7, 2008, RiverSource Investments, LLC, a subsidiary of Ameriprise Financial, Inc., acquired J. & W. Seligman & Co. Incorporated (Seligman). In late 2003, Seligman conducted an extensive internal review concerning mutual fund trading practices. Seligman’s review, which covered the period 2001-2003, noted one arrangement that permitted frequent trading in certain open-end registered investment companies managed by Seligman (the Seligman Funds); this arrangement was in the process of being closed down by Seligman before September 2003. Seligman identified three other arrangements that permitted frequent trading, all of which had been terminated by September 2002. In January 2004, Seligman, on a voluntary basis, publicly disclosed these four arrangements to its clients and to shareholders of the Seligman Funds. Seligman also provided information concerning mutual fund trading practices to the SEC and the Office of the Attorney General of the State of New York (NYAG).
In September 2006, the NYAG commenced a civil action in New York State Supreme Court against Seligman, Seligman Advisors, Inc. (now known as RiverSource Fund Distributors, Inc.), Seligman Data Corp. and Brian T. Zino (collectively, the Seligman Parties), alleging, in substance, that the Seligman Parties permitted various persons to engage in frequent trading and, as a result, the prospectus disclosure used by the registered investment companies then managed by Seligman was and had been misleading. The NYAG included other
35
Columbia Bond Fund
March 31, 2010
related claims and also claimed that the fees charged by Seligman to the Seligman Funds were excessive. On March 13, 2009, without admitting or denying any violations of law or wrongdoing, the Seligman Parties entered into a stipulation of settlement with the NYAG and settled the claims made by the NYAG. Under the terms of the settlement, Seligman paid $11.3 million to four Seligman Funds. This settlement resolved all outstanding matters between the Seligman Parties and the NYAG. In addition to the foregoing matter, the New York staff of the SEC indicated in September 2005 that it was considering recommending to the Commissioners of the SEC the instituting of a formal action against Seligman and Seligman Advisors, Inc. relating to frequent trading in the Seligman Funds. Seligman responded to the staff in October 2005 that it believed that any action would be both inappropriate and unnecessary, especially in light of the fact that Seligman had previously resolved the underlying issue with the Independent Directors of the Seligman Funds and made recompense to the affected Seligman Funds. There have been no further developments with the SEC on this matter.
Ameriprise Financial and certain of its affiliates have historically been involved in a number of legal, arbitration and regulatory proceedings, including routine litigation, class actions, and governmental actions, concerning matters arising in connection with the conduct of their business activities. Ameriprise Financial believes that the Funds are not currently the subject of, and that neither Ameriprise Financial nor any of its affiliates are the subject of, any pending legal, arbitration or regulatory proceedings that are likely to have a material adverse effect on the Funds or the ability of Ameriprise Financial or its affiliates to perform under their contracts with the Funds. Ameriprise Financial is required to make 10-Q, 10-K and, as necessary, 8-K filings with the Securities and Exchange Commission on legal and regulatory matters that relate to Ameriprise Financial and its affiliates. Copies of these filings may be obtained by accessing the SEC website at www.sec.gov.
There can be no assurance that these matters, or the adverse publicity associated with them, will not result in increased fund redemptions, reduced sale of fund shares or other adverse consequences to the Funds. Further, although we believe proceedings are not likely to have a material adverse effect on the Funds or the ability of Ameriprise Financial or its affiliates to perform under their contracts with the Funds, these proceedings are subject to uncertainties and, as such, we are unable to estimate the possible loss or range of loss that may result. An adverse outcome in one or more of these proceedings could result in adverse judgments, settlements, fines, penalties or other relief that could have a material adverse effect on the consolidated financial condition or results of operations of Ameriprise Financial.
Note 14. Subsequent Events
In connection with the preparation of the financial statements of the Fund as of and for the fiscal year ended March 31, 2010, events and transactions through the date the financial statements were issued have been evaluated by the Fund’s management for possible adjustment and/or disclosure. No subsequent events or transactions have occurred that would require adjustment of the financial statements as presented. On April 30, 2010, the Transaction disclosed in Note 4 closed. Effective May 1, 2010, the New Advisor became the investment advisor and administrator of the Fund and subsequently changed its name to Columbia Management Investment Advisers, LLC. On that date, the New Transfer Agent became the transfer agent of the Fund and changed its name to Columbia Management Investment Services Corp. Also on that date, the New Distributor became the distributor of the Fund and changed its name to Columbia Management Investment Distributors, Inc.
36
Report of Independent Registered Public Accounting Firm
To the Trustees of Columbia Funds Series Trust I and Shareholders of Columbia Bond Fund
In our opinion, the accompanying statement of assets and liabilities, including the portfolio of investments, and the related statements of operations and of changes in net assets and the financial highlights present fairly, in all material respects, the financial position of the Columbia Bond Fund, a series of Columbia Funds Series Trust I at March 31, 2010, and the results of its operations for the year then ended, the changes in its net assets for each of the two years in the period then ended and the financial highlights for each of the periods presented, in conformity with accounting principles generally accepted in the United States of America. These financial statements and financial highlights (hereafter referred to as “financial statements”) are the responsibility of the Fund’s management. Our responsibility is to express an opinion on these financial statements based on our audits. We conducted our audits of these financial statements in accordance with the standards of the Public Company Accounting Oversight Board (United States). Those standards require that we plan and perform the audits to obtain reasonable assurance about whether the financial statements are free of material misstatement. An audit includes examining, on a test basis, evidence supporting the amounts and disclosures in the financial statements, assessing the accounting principles used and significant estimates made by management, and evaluating the overall financial statement presentation. We believe that our audits, which included confirmation of securities at March 31, 2010 by correspondence with the custodian and brokers, provide a reasonable basis for our opinion. The financial highlights of the Fund for the period ended March 31, 2006 were audited by other auditors whose report dated May 22, 2006, expressed an unqualified opinion on those highlights.
PricewaterhouseCoopers LLP
Boston, Massachusetts
May 21, 2010
37
Fund Governance
The Trustees serve terms of indefinite duration. The names, addresses and birth years of the Trustees and Officers of the Funds of Columbia Funds Series Trust I, the year each was first elected or appointed to office, their principal business occupations during at least the last five years, the number of Funds overseen by each Trustee and other directorships they hold are shown below. Each officer listed below serves as an officer of each Fund in the Columbia Funds Complex.
Independent Trustees
| | |
Name, Address and Year of Birth,
Position with Funds, Year First
Elected or Appointed to Office | | Principal Occupation(s) During Past Five Years, Number of Funds in the
Columbia Funds Complex Overseen by Trustee, Other Directorships Held |
| |
| John D. Collins (Born 1938) | | |
c/o Columbia Management Investment Advisers, LLC One Financial Center Boston, MA 02111 Trustee (since 2005) | | Retired. Consultant, KPMG, LLP (accounting and tax firm) from July 1999 to June 2000; Partner, KPMG, LLP from March 1962 to June 1999. Oversees 65; Mrs. Fields Famous Brands LLC (consumer products); Suburban Propane Partners, L.P.; and Montpelier Re (insurance underwriting firm) |
| |
| Rodman L. Drake (Born 1943) | | |
c/o Columbia Management Investment Advisers, LLC One Financial Center Boston, MA 02111 Trustee (since 1994) and Chairman of the Board (since 2009) | | Co-Founder of Baringo Capital LLC (private equity) since 2002; CEO of Crystal River Capital, Inc. (real estate investment trust) since 2003; President, Continuation Investments Group, Inc. from 1997 to 2001. Oversees 65; Jackson Hewitt Tax Service Inc. (tax preparation services); Crystal Capital River Inc. (real estate investment trust); Student Loan Corporation (student loan provider); Celgene Corporation (global biotechnology company); and The Helios Funds (exchange-traded funds) |
| |
| Douglas A. Hacker (Born 1955) | | |
c/o Columbia Management Investment Advisers, LLC One Financial Center Boston, MA 02111 Trustee (since 1996) | | Independent business executive since May 2006; Executive Vice President–Strategy of United Airlines (airline) from December 2002 to May 2006; President of UAL Loyalty Services (airline marketing company) from September 2001 to December 2002; Executive Vice President and Chief Financial Officer of United Airlines from July 1999 to September 2001. Oversees 65; Nash Finch Company (food distributor); Aircastle Limited (aircraft leasing) |
|
| Janet Langford Kelly (Born 1957) |
c/o Columbia Management Investment Advisers, LLC One Financial Center Boston, MA 02111 Trustee (since 1996) | | Senior Vice President, General Counsel and Corporate Secretary, ConocoPhillips (integrated energy company) since September 2007; Deputy General Counsel–Corporate Legal Services, ConocoPhillips from August 2006 to August 2007; Partner, Zelle, Hofmann, Voelbel, Mason & Gette LLP (law firm) from March 2005 to July 2006; Adjunct Professor of Law, Northwestern University, from September 2004 to June 2006; Director, UAL Corporation (airline) from February 2006 to July 2006; Oversees 65; None |
| |
| Charles R. Nelson (Born 1942) | | |
c/o Columbia Management Investment Advisers, LLC One Financial Center Boston, MA 02111 Trustee (since 1981) | | Professor of Economics, University of Washington, since January 1976; Ford and Louisa Van Voorhis Professor of Political Economy, University of Washington, since September 1993; Adjunct Professor of Statistics, University of Washington, since September 1980; Associate Editor, Journal of Money Credit and Banking, 1993-2008 Consultant on econometric and statistical matters. Oversees 65; None |
38
Fund Governance (continued)
Independent Trustees (continued)
| | |
Name, Address and Year of Birth,
Position with Funds, Year First
Elected or Appointed to Office | | Principal Occupation(s) During Past Five Years, Number of Funds in the
Columbia Funds Complex Overseen by Trustee, Other Directorships Held |
| |
| John J. Neuhauser (Born 1943) | | |
c/o Columbia Management Investment Advisers, LLC One Financial Center Boston, MA 02111 Trustee (since 1984) | | President, Saint Michael’s College, since August 2007; University Professor, Boston College from November 2005 to August 2007; Academic Vice President and Dean of Faculties, Boston College from August 1999 to October 2005. Oversees 65; Liberty All-Star Equity Fund and Liberty All-Star Growth Fund, Inc. (closed-end funds) |
| |
| Jonathan Piel (Born 1938) | | |
c/o Columbia Management Investment Advisers, LLC One Financial Center Boston, MA 02111 Trustee (since 1994) | | Cable television producer and website designer; The Editor, Scientific American from 1984 to 1994; Vice President, Scientific American, Inc., from 1984 to 1994; Member, Advisory Board, Stone Age Institute, Bloomington, Indiana (research institute that explores the effect of technology on human evolution); Member, Board of Directors of the National Institute of Social Sciences, New York City; Member, Board of Trustees of the William Alanson White Institute, New York City (institution for training psychoanalysts); and Member, Advisory Board, Mount Sinai Children’s Environmental Health Center, New York. Oversees 65; None |
| |
| Patrick J. Simpson (Born 1944) | | |
c/o Columbia Management Investment Advisers, LLC One Financial Center Boston, MA 02111 Trustee (since 2000) | | Partner, Perkins Coie LLP (law firm). Oversees 65; None |
| |
| Anne-Lee Verville (Born 1945) | | |
c/o Columbia Management Investment Advisers, LLC One Financial Center Boston, MA 02111 Trustee (since 1998) | | Retired since 1997 (formerly General Manager–Global Education Industry (from 1994 to 1997), President–Application Systems Division (from 1991 to 1994), Chief Financial Officer–US Marketing & Services (from 1988 to 1991), and Chief Information Officer (from 1987 to 1988), IBM Corporation (computer and technology)). Oversees 65; None |
39
Fund Governance (continued)
Interested Trustee
| | |
Name, Address and Year of Birth,
Position with Funds, Year First
Elected or Appointed to Office | | Principal Occupation(s) During Past Five Years, Number of Funds in the Columbia
Funds Complex Overseen by Trustee, Other Directorships Held |
| |
| William E. Mayer1 (Born 1940) | | |
c/o Columbia Management Investment Advisers, LLC One Financial Center Boston, MA 02111 Trustee (since 1994) | | Partner, Park Avenue Equity Partners (private equity) since February 1999; Dean and Professor, College of Business, University of Maryland from 1992 to 1997. Oversees 65; Lee Enterprises (print media), WR Hambrecht + Co. (financial service provider); BlackRock Kelso Capital Corporation (investment company) |
| 1 | The Funds currently treat Mr. Mayer as an “interested person” (as defined in the Investment Company Act of 1940) by reason of his affiliation with WR Hambrecht + Co., a registered broker/dealer that may execute portfolio transactions for or engage in principal transactions with the Funds or other funds or accounts advised/managed by the Advisor or other Bank of America affiliates. |
The Statement of Additional Information includes additional information about the Trustees of the Funds and is available, without charge, upon request by calling 1-800-345-6611.
40
Fund Governance (continued)
Officers
| | |
| Name, Year of Birth and Address | | Principal Occupation(s) During the Past Five Years |
| |
| J. Kevin Connaughton (Born 1964) | | |
One Financial Center Boston, MA 02111 President (since 2009) | | Senior Vice President and General Manager–Mutual Fund Products, Columbia Management Investment Advisers, LLC since May 2010; President, Columbia Funds, since 2009, and RiverSource Funds, since May 2010 (previously Senior Vice President and Chief Financial Officer, Columbia Funds, from June 2008 to January 2009, Treasurer, Columbia Funds, from October 2003 to May 2008, and senior officer of various other affiliated funds since 2000); Managing Director, Columbia Management Advisors, LLC from December 2004 to April 2010. |
| |
| Michael G. Clarke (Born 1969) | | |
One Financial Center Boston, MA 02111 Senior Vice President and Chief Financial Officer (since 2009) | | Vice President, Columbia Management Investment Advisers, LLC since May 2010; Managing Director of Fund Administration, Columbia Management Advisors, LLC, from September 2004 to April 2010; senior officer of Columbia Funds and affiliated funds since 2002. |
| |
| Scott R. Plummer (Born 1959) | | |
5228 Ameriprise Financial Center Minneapolis, MN 55474 Senior Vice President, Secretary and Chief Legal Officer (since 2010) | | Chief Legal Officer and Assistant Secretary, Columbia Management Investment Advisers, LLC since June 2005; Vice President and Lead Chief Counsel–Asset Management, Ameriprise Financial, Inc. since May 2010 (previously Vice President and Chief Counsel–Asset Management, from 2005 to April 2010, and Vice President–Asset Management Compliance from 2004 to 2005); Vice President, Chief Counsel and Assistant Secretary, Columbia Management Investment Distributors, Inc. since 2008; Vice President, General Counsel and Secretary, Ameriprise Certificate Company since 2005; Chief Counsel, RiverSource Distributors, Inc. since 2006; Vice President, General Counsel and Secretary, RiverSource Funds, since December 2006; Senior Vice President, Secretary and Chief Legal Officer, Columbia Funds, since May 2010. |
| |
| Linda J. Wondrack (Born 1964) | | |
One Financial Center Boston, MA 02111 Senior Vice President and Chief Compliance Officer (since 2007) | | Vice President and Chief Compliance Officer, Columbia Management Investment Advisers, LLC since May 2010; Chief Compliance Officer, Columbia Funds, since 2007, and RiverSource Funds, since May 2010; Director (Columbia Management Group, LLC and Investment Product Group Compliance), Bank of America, from June 2005 to April 2010; Director of Corporate Compliance and Conflicts Officer of MFS Investment Management (investment management) from August 2004 to May 2005. |
| |
| William F. Truscott (Born 1960) | | |
53600 Ameriprise Financial Center Minneapolis, MN 55474 Senior Vice President (since 2010) | | Chairman of the Board, Columbia Management Investment Advisers, LLC since May 2010 (previously President, Chairman of the Board and Chief Investment Officer, from 2001 to April 2010); Chief Executive Officer, U.S. Asset Management & President, Annuities, Ameriprise Financial, Inc. since May 2010 (previously President–U.S. Asset Management and Chief Investment Officer from 2005 to April 2010, and Senior Vice President — Chief Investment Officer, from 2001 to 2005); Director, President and Chief Executive Officer, Ameriprise Certificate Company since 2006; Director, Columbia Management Investment Distributors, Inc. since May 2010 (previously Chairman of the Board and Chief Executive Officer from 2008 to April 2010); Chairman of the Board and Chief Executive Officer, RiverSource Distributors, Inc. since 2006. |
41
Fund Governance (continued)
Officers (continued)
| | |
| Name, Year of Birth and Address | | Principal Occupation(s) During the Past Five Years |
|
| Colin Moore (Born 1958) |
One Financial Center Boston, MA 02111 Senior Vice President (since 2010) | | Director and Chief Investment Officer, Columbia Management Investment Advisers, LLC since May 2010; Manager, Managing Director and Chief Investment Officer of Columbia Management Advisors, LLC from 2007 to April 2010; Head of Equities, Columbia Management Advisors, LLC from 2002 to 2007. |
| |
| Michael A. Jones (Born 1959) | | |
100 Federal Street Boston, MA 02110 Senior Vice President (since 2010) | | Director and President, Columbia Management Investment Advisers, LLC since May 2010; President and Director, Columbia Management Investment Distributors, Inc. since May 2010; Manager, Chairman, Chief Executive Officer and President, Columbia Management Advisors, LLC from 2007 to April 2010; Chief Executive Officer, President and Director, Columbia Management Distributors, Inc. from November 2006 to April 2010; previously, co-president and senior managing director at Robeco Investment Management. |
| |
| Amy Johnson (Born 1965) | | |
5228 Ameriprise Financial Center Minneapolis, MN 55474 Senior Vice President (since 2010) | | Senior Vice President and Chief Operating Officer, Columbia Management Investment Advisers, LLC since May 2010 (previously Chief Administrative Officer, from 2009 until April 2010, Vice President–Asset Management and Trust Company Services, from 2006 to 2009, and Vice President–Operations and Compliance from 2004 to 2006). |
| |
| Joseph F. DiMaria (Born 1968) | | |
One Financial Center Boston, MA 02111 Treasurer (since 2009) and Chief Accounting Officer (since 2008) | | Vice President, Mutual Fund Administration, Columbia Management Investment Advisers, LLC, since May 2010; Director of Fund Administration, Columbia Management Advisors, LLC from January 2006 to April 2010; Head of Tax/Compliance and Assistant Treasurer, Columbia Management Advisors, LLC, from November 2004 to December 2005. |
| |
| Marybeth Pilat (Born 1968) | | |
One Financial Center Boston, MA 02111 Deputy Treasurer (since 2010) | | Vice President, Mutual Fund Administration, Columbia Management Investment Advisers, LLC, since May 2010; Vice President, Investment Operations, Bank of America, from October 2008 to April 2010; Finance Manager, Boston Children’s Hospital from August 2008 to October 2008; Director, Mutual Fund Administration, Columbia Management Advisors, LLC, from May 2007 to July 2008; Vice President, Mutual Fund Valuation, Columbia Management Advisors, LLC, from January 2006 to May 2007; Vice President, Mutual Fund Accounting Oversight, Columbia Management Advisors, LLC from January 2005 to January 2006. |
| |
| Julian Quero (Born 1967) | | |
One Financial Center Boston, MA 02111 Deputy Treasurer (since 2008) | | Vice President, Mutual Fund Administration, Columbia Management Investment Advisers, LLC since May 2010; Director of Fund Administration, Columbia Management Advisors, LLC, from August 2008 to April 2010; Senior Tax Manager, Columbia Management Advisors, LLC from August 2006 to July 2008; Senior Compliance Manager, Columbia Management Advisors, LLC from April 2002 to August 2006. |
| |
| Stephen T. Welsh (Born 1957) | | |
One Financial Center Boston, MA 02111 Vice President (since 2006) | | President and Director, Columbia Management Investment Services Corp. since May 2010; President and Director, Columbia Management Services, Inc. from July 2004 to April 2010; Managing Director, Columbia Management Distributors, Inc. from August 2007 to April 2010. |
42
Board Consideration and Approval of Advisory Agreements
The Advisory Fees and Expenses Committee of the Board of Trustees meets several times annually to review the current advisory agreements (collectively, the “Agreements”) of the funds for which the Trustees serve as trustees (each a “fund”) and to determine whether to recommend that the full Board approve the continuation of the Agreements for an additional one-year period. After the Committee has made its recommendation, the full Board, including the Independent Trustees, determines whether to approve the continuation of the Agreements. In addition, the full Board, including the Independent Trustees, considers matters bearing on the Agreements at most of its other meetings throughout the year and meets regularly with senior management of the funds and Columbia, the funds’ investment adviser, including the senior manager of each investment area within Columbia. Through the Board’s Investment Oversight Committees, Trustees also meet with selected fund portfolio managers, research analysts and traders at various times throughout the year.
The Trustees receive and review all materials that they, their legal counsel or Columbia believe to be reasonably necessary for the Trustees to evaluate the Agreements and to determine whether to approve the continuation of the Agreements. Those materials generally include, among other items, (i) information on the investment performance of each fund relative to the performance of peer groups of mutual funds and the fund’s performance benchmarks, and additional information assessing performance on a risk-adjusted basis, (ii) information on each fund’s advisory fees and other expenses, including information comparing the fund’s expenses to those of peer groups of mutual funds and information about any applicable expense caps and fee “breakpoints,” (iii) information about the profitability of the Agreements to Columbia, including potential “fall-out” or ancillary benefits that Columbia and its affiliates may receive as a result of their relationships with the funds and (iv) information obtained through Columbia’s response to a questionnaire prepared at the request of the Trustees by counsel to the funds and independent legal counsel to the Independent Trustees. The Trustees also consider other information such as (i) Columbia’s financial results and financial condition, (ii) each fund’s investment objective and strategies and the size, education and experience of Columbia’s investment staffs and their use of technology, external research and trading cost measurement tools, (iii) the allocation of the funds’ brokerage and the use of “soft” commission dollars to pay for research products and services, (iv) Columbia’s resources devoted to, and its record of compliance with, the funds’ investment policies and restrictions, policies on personal securities transactions and other compliance policies and legal and regulatory requirements, (v) Columbia’s response to various legal and regulatory proceedings since 2003 and to the recent period of volatility in the securities markets and (vi) the economic outlook generally and for the mutual fund industry in particular. In addition, the Advisory Fees and Expenses Committee confers with the independent fee consultant (the “Fee Consultant”) appointed by the Independent Trustees pursuant to an assurance of discontinuance entered into by Columbia with the New York Attorney General (“NYAG”) to settle a civil complaint filed by the NYAG relating to trading in mutual fund shares (the “NYAG Settlement”) and reviews materials relating to the funds’ relationships with Columbia provided by the Fee Consultant. Under the NYAG Settlement, the Fee Consultant’s role is to manage the process by which management fees are negotiated so that they are negotiated in a manner that is at arms’ length and reasonable. Throughout the process, the Trustees have the opportunity to ask questions of and to request additional materials from Columbia and to consult with the Fee Consultant and independent legal counsel to the Independent Trustees.
The Board of Trustees most recently approved the continuation of the Agreements at its October, 2009 meeting, following meetings of the Advisory Fees and Expenses Committee held in December, 2008 and February, May, June, August, September and October, 2009.
The Board of Trustees also unanimously approved new advisory agreements (the “New Agreements”) for the funds with RiverSource Investments, LLC (to be renamed Columbia Management Investment Advisers, LLC) (“RiverSource”) at a meeting held on December 17, 2009. The New Agreements have since been approved by shareholders of the funds and are expected to take effect upon the closing of the acquisition of the long-term asset management business of Columbia by Ameriprise Financial, Inc. (“Ameriprise”), the parent company of RiverSource Investments, LLC (the “Transaction”).
The Advisory Fees and Expenses Committee met on multiple occasions to review the New Agreements for the funds. On
43
December 14, 2009, the Advisory Fees and Expenses Committee recommended that the full Board approve the New Agreements. On December 17, 2009, the full Board, including a majority of the Independent Trustees, approved the New Agreements. Prior to their approval of the New Agreements, the Advisory Fees and Expenses Committee and the Independent Trustees requested and evaluated materials from, and were provided materials and information about the Transaction and matters related to the proposals by, Bank of America Corp., Columbia, RiverSource and Ameriprise. In connection with their most recent approval of the Agreements (as discussed above) on October 28, 2009, the Advisory Fees and Expenses Committee and the Trustees requested and evaluated materials from Columbia, and discussed such materials with representatives of Columbia. The Advisory Fees and Expenses Committee, at meetings held on August 11, 2009, September 23, 2009, October 27, 2009, November 30, 2009, December 7, 2009 and December 14, 2009, and the Independent Trustees, at meetings held on August 12, 2009, August 20, 2009, October 28, 2009, December 8, 2009, December 14, 2009 and December 17, 2009, discussed the materials provided in connection with the October 28, 2009 approvals and the materials provided in connection with their consideration of the New Agreements and other matters relating to the Transaction with representatives of Bank of America Corp., Columbia, RiverSource and Ameriprise. The Trustees consulted with experienced legal counsel, who advised on the legal standards for consideration by the Trustees. The Independent Trustees also discussed the proposed approvals with independent legal counsel in private sessions.
The Trustees reviewed each New Agreement, as well as certain information obtained through RiverSource’s responses to initial and supplemental questionnaires prepared at the request of the Trustees by counsel to the funds and independent legal counsel to the Independent Trustees. The Advisory Fees and Expenses Committee and the Trustees also met with, and reviewed and considered a report prepared and provided by, the Fee Consultant (as discussed above).
In considering whether to approve the New Agreements and to approve the continuation of the Agreements, the Trustees, including the Independent Trustees, did not identify any single factor as determinative, and each weighed various factors as he or she deemed appropriate. In particular, the Trustees considered the following matters:
Matters Relating to the Agreements and the New Agreements
The nature, extent and quality of the services provided or to be provided to the funds under the Agreements and the New Agreements. The Trustees considered the nature, extent and quality of the services provided and the resources dedicated by Columbia and its affiliates (or to be provided and dedicated by RiverSource and its affiliates) to the funds.
Among other things, the Trustees considered, with respect to Columbia and its affiliates, (i) Columbia’s ability (including its personnel and other resources, compensation programs for personnel involved in fund management, reputation and other attributes) to attract, motivate and retain highly qualified research, advisory and supervisory investment professionals; (ii) the portfolio management services provided by those investment professionals; and (iii) the trade execution services provided on behalf of the funds. For each fund, the Trustees also considered the benefits to shareholders of investing in a mutual fund that is part of a family of funds offering exposure to a variety of asset classes and investment disciplines and providing a variety of fund and shareholder services.
Among other things, the Trustees considered, with respect to RiverSource and its affiliates, (i) the expected effect of the Transaction on the operations of the funds, (ii) the information provided by RiverSource with respect to the nature, extent and quality of services to be provided by it, (iii) RiverSource’s compliance program and compliance record, (iv) the ability of RiverSource (including personnel and other resources, compensation programs for personnel involved in fund management, reputation and other attributes) to attract, motivate and retain highly qualified research, advisory and supervisory investment professionals, (v) the trade execution services to be provided on behalf of the funds and (vi) the quality of RiverSource’s investment research capabilities and the other resources that it indicated it would devote to each fund. As noted above, the Trustees also considered RiverSource’s representations that the Chief Investment Officer of Columbia would serve as the Chief Investment Officer of RiverSource following the Transaction, and that the process for determining the portfolio
44
management team for each Fund would be substantially the same process as has customarily been followed by Columbia, and reported to the Trustees, in evaluating the performance of Columbia’s portfolio management teams. The Trustees also noted the professional experience and qualifications of the senior personnel of RiverSource. The Trustees also considered the compliance programs of and the compliance-related resources proposed to be provided to the funds by RiverSource and its affiliates, including discussions with the funds’ Chief Compliance Officer regarding RiverSource’s compliance program. The Trustees also discussed RiverSource’s compliance program with the Chief Compliance Officer for the RiverSource funds. The Trustees also considered RiverSource’s representation that the funds’ Chief Compliance Officer would serve as the Chief Compliance Officer of RiverSource following the Transaction. The Trustees considered RiverSource’s ability to provide administrative services to the funds, noting that while some Agreements contemplated the provision of certain administrative services, following the Transaction, all administrative services were anticipated to be provided pursuant to a new administrative services agreement. The Trustees also considered RiverSource’s ability to coordinate the activities of each fund’s other service providers. The Trustees considered performance information provided by RiverSource with respect to other mutual funds advised by RiverSource, and discussed with senior executives of RiverSource its process for identifying which portfolio management teams of the legacy Columbia and RiverSource organizations would be responsible for the management of the funds following the Transaction.
After reviewing those and related factors, the Trustees concluded, within the context of their overall conclusions, that the nature, extent and quality of services provided by Columbia supported the continuation of the Agreements, and that the nature, extent and quality of services expected to be provided by RiverSource supported approval of the New Agreements.
The costs of the services provided and profits realized by Columbia and its affiliates, and the expected costs of the services to be provided and the profits expected to be realized by RiverSource and its affiliates, from their relationships with the funds. With respect to Columbia and its affiliates, the Trustees considered the fees charged to the funds for advisory services as well as the total expense levels of the funds. That information included comparisons (provided by management and by an independent third-party data provider) of each fund’s advisory fees and total expense levels to those of the fund’s peer groups and information about the advisory fees charged by Columbia to comparable institutional accounts. In considering the fees charged to those accounts, the Trustees took into account, among other things, management’s representations about the differences between managing mutual funds as compared to other types of accounts, including differences in the services provided, differences in the risk profile of such business for Columbia, and the additional resources required to manage mutual funds effectively. In evaluating each fund’s advisory fees, the Trustees also took into account the demands, complexity and quality of the investment management of the fund. The Trustees considered existing advisory fee breakpoints, and Columbia’s use of advisory fee waivers and expense caps, which benefited a number of the funds. The Trustees also noted management’s stated justification for the fees charged to the funds, which included information about the investment performance of the funds and the services provided to the funds.
The Trustees considered that Columbia Bond Fund’s total expenses were in the second quintile and actual management fees were in the fourth quintile (where the lowest fees and expenses would be in the first quintile) of the peer group selected by an independent third-party data provider for purposes of expense comparisons.
The Trustees also considered the compensation directly or indirectly received by Columbia and its affiliates from their relationships with the funds. The Trustees reviewed information provided by management as to the profitability to Columbia and its affiliates of their relationships with each fund, and information about the allocation of expenses used to calculate profitability. When reviewing profitability, the Trustees also considered court cases in which adviser profitability was an issue in whole or in part, the performance of the relevant funds, the expense level of each fund, and whether Columbia had implemented breakpoints and/or expense caps with respect to the fund.
In connection with the integration of the legacy Columbia and RiverSource organizations, the Trustees considered, among other things, RiverSource’s projected annual net expense synergies (reductions in the cost of providing services to the
45
funds), the timetable over which such synergies are expected to be realized and the extent to which any such synergies are expected to be shared with the funds. The Trustees also considered information provided by RiverSource regarding their respective financial conditions. The Trustees considered that RiverSource proposed to continue voluntary expense caps currently in effect for the funds and that RiverSource had undertaken not to change these caps without further discussion with the Independent Trustees.
After reviewing those and related factors, the Trustees concluded, within the context of their overall conclusions, that the advisory fees charged to each fund, and the related profitability to Columbia and its affiliates of their relationships with the fund, supported the continuation of the Agreement pertaining to that fund, and that the expected profitability to RiverSource and its affiliates from its relationship with each fund supported the approval of the New Agreements.
Economies of Scale. With respect to Columbia and its affiliates, the Trustees considered the existence of any economies of scale in the provision by Columbia of services to each fund, to groups of related funds, and to Columbia’s investment advisory clients as a whole and whether those economies were shared with the funds through breakpoints in the investment advisory fees or other means, such as fee waivers/expense reductions and additional investments by Columbia in investment, trading and compliance resources. The Trustees noted that many of the funds benefited from breakpoints, fee waivers/expense caps, or both. In considering those issues, the Trustees also took note of the costs of the services provided (both on an absolute and a relative basis) and the profitability to Columbia and its affiliates of their relationships with the funds, as discussed above.
With respect to RiverSource and its affiliates, the Trustees considered the existence of any anticipated economies of scale in the provision by RiverSource of services to each fund, to groups of related funds and to RiverSource’s investment advisory clients as a whole, and whether those economies of scale were expected to be shared with the funds. The Trustees considered Ameriprise’s anticipated net expense synergies resulting from the Transaction, and considered the possibility that the funds might benefit from economies of scale over time as part of the larger, combined fund complex. The Trustees considered how expected synergies and potential economies of scale might benefit the funds and their shareholders. The Trustees considered the potential effect of the Transaction on the distribution of the funds, and noted that the proposed management fee schedules for the funds generally contained breakpoints that would reduce the fee rate on assets above specified threshold levels.
After reviewing those and related factors, the Trustees concluded, within the context of their overall conclusions, that the extent to which economies of scale were shared or expected to be shared with the funds supported the continuation of the Agreements and the approval of the New Agreements.
Matters Relating to the Agreements
Investment performance of the funds and Columbia. The Trustees reviewed information about the performance of each fund over various time periods, including information prepared by an independent third-party data provider that compared the performance of each fund to the performance of peer groups of mutual funds and performance benchmarks. The Trustees also reviewed a description of the third party’s methodology for identifying each fund’s peer group for purposes of performance and expense comparisons. The Trustees also considered additional information that the Advisory Fees and Expenses Committee requested from Columbia relating to funds that presented relatively weaker performance and/or relatively higher fees or expenses. In the case of each fund whose performance lagged that of a relevant peer group for certain (although not necessarily all) periods, the Trustees concluded that other factors relevant to performance were sufficient, in light of other considerations, to warrant continuation of the fund’s Agreements. Those factors varied from fund to fund, but included one or more of the following: (i) that the fund’s performance, although lagging in certain recent periods, was stronger over the longer term; (ii) that the underperformance was attributable, to a significant extent, to investment decisions that were reasonable and consistent with the fund’s investment strategy and policies and that the fund was performing within a reasonable range of expectations, given those investment decisions, market conditions and the fund’s investment strategy; (iii) that the fund’s performance was competitive when compared to other relevant performance benchmarks or peer groups; (iv) that Columbia had taken or was taking steps
46
designed to help improve the fund’s investment performance, including, but not limited to, replacing portfolio managers or modifying investment strategies; and (v) that Columbia proposed to waive advisory fees or cap the expenses of the fund.
The Trustees noted that, through April 30, 2009, Columbia Bond Fund’s performance was in the first quintile (where the best performance would be in the first quintile) for the one-, three-, five- and ten-year periods, of the peer group selected by an independent third-party data provider for purposes of performance comparisons.
The Trustees also considered Columbia’s performance and reputation generally, the funds’ performance as a fund family generally, and Columbia’s historical responsiveness to Trustee concerns about performance and Columbia’s willingness to take steps intended to improve performance. After reviewing those and related factors, the Trustees concluded, within the context of their overall conclusions regarding each of the Agreements, that the performance of each fund and Columbia was sufficient, in light of other considerations, to warrant the continuation of the Agreement pertaining to that fund.
Other Factors. The Trustees also considered other factors with respect to Columbia and its affiliates, which included but were not limited to the following:
| n | | the extent to which each fund had operated in accordance with its investment objective and investment restrictions, the nature and scope of the compliance programs of the funds and Columbia and the compliance-related resources that Columbia and its affiliates were providing to the funds; |
| n | | the nature, quality, cost and extent of administrative and shareholder services overseen and performed by Columbia and its affiliates, both under the Agreements and under separate agreements for the provision of transfer agency and administrative services; |
| n | | so-called “fall-out benefits” to Columbia and its affiliates, such as the engagement of its affiliates to provide distribution, brokerage and transfer agency services to the funds, and the benefits of research made available to Columbia by reason of brokerage commissions generated by the funds’ securities transactions, as well as possible conflicts of interest associated with those fall-out and other benefits, and the reporting, disclosure and other processes in place to disclose and monitor those possible conflicts of interest; and |
| n | | the report provided by the Fee Consultant, which included information about and analysis of the funds’ fees, expenses and performance. |
Matters Relating to the New Agreements
The Trustees considered all materials that they, their legal counsel or RiverSource believed reasonably necessary to evaluate and to determine whether to approve the New Agreements. In their deliberations, the Trustees did not identify any particular information that was all-important or controlling, and individual Trustees may have attributed different weights to the various factors. The material factors that formed the basis for the Trustees’ approvals included the factors set forth below:
| (i) | the reputation, financial strength, regulatory histories and resources of RiverSource and its parent, Ameriprise; |
| (ii) | the capabilities of RiverSource with respect to compliance, including an assessment of RiverSource’s compliance system by the funds’ Chief Compliance Officer; |
| (iii) | the qualifications of the personnel of RiverSource that would be expected to provide advisory services to each fund, including RiverSource’s representations that the Chief Investment Officer of Columbia would serve as the Chief Investment Officer of RiverSource, and that the process for determining the portfolio management team for each fund would be substantially the same process as has customarily been followed by Columbia, and reported to the Trustees, in evaluating the performance of Columbia’s portfolio management teams; |
| (iv) | the terms and conditions of the New Agreements, including the differences between the New Agreements and the Agreements; |
| (v) | the terms and conditions of other agreements and arrangements relating to the future operations of the funds, including an administrative services agreement and a Master Services and Distribution Agreement; |
47
| (vi) | the commitment of RiverSource and Ameriprise that there would not be any diminution in the nature, quality and extent of services provided to each fund or its shareholders following closing of the Transaction; |
| (vii) | that the Trustees recently had completed a full annual review of the Agreements, as required by the 1940 Act, for each fund and had determined that they were satisfied with the nature, extent and quality of services provided thereunder and that the management fee rate for each fund were sufficient to warrant their approval; |
| (viii) | that the advisory fee rates payable by each fund would not change; |
| (ix) | that RiverSource and Bank of America, and not any fund, would bear the costs of obtaining approvals of the New Agreement; |
| (x) | that Ameriprise and RiverSource had agreed to exercise reasonable best efforts to assure that, for a period of two years after the closing of the Transaction, there would not be imposed on any fund any “unfair burden” (within the meaning of Section 15(f) of 1940 Act) with respect to the Transaction; and |
| (xi) | that certain members of RiverSource’s management have a significant amount of experience integrating other fund families; that certain current Columbia personnel that would be integrated into RiverSource and its affiliates as a result of the Transaction also have experience in integrating fund families; and that the senior management of RiverSource following the Transaction would include certain senior executives of Columbia who are currently responsible for oversight of services provided to the funds. |
Investment Advisory Fee Rates and Other Expenses. The Trustees considered the fact that the advisory fee rates payable by each fund to RiverSource under the New Agreements are the same as those currently paid by each fund to Columbia under the Agreements. The Trustees noted that in connection with their October 28, 2009 approval of the continuance of the Agreements, they had concluded, within the context of their overall conclusions regarding each such agreement, that the advisory fees charged to each fund supported the continuation of the agreement pertaining to that fund.
The Trustees noted that in certain cases the effective advisory fee rate for a RiverSource fund was lower than the proposed investment advisory fee rate for a fund with generally similar investment objectives and strategies. The Trustees also noted that RiverSource’s investment advisory fee rates for equity and balanced funds generally are subject to adjustments based on investment performance, whereas the proposed investment advisory fee rates for the funds, consistent with those in the Agreements, do not reflect performance adjustments. The Trustees considered existing advisory fee breakpoints and RiverSource’s undertaking not to change expense caps previously implemented by Columbia with respect to the funds without further discussion with the Independent Trustees.
The Trustees received and considered information about the advisory fees charged by RiverSource to institutional accounts. In considering the fees charged to those accounts, the Trustees took into account, among other things, RiverSource’s representations about the differences between managing mutual funds as compared to other types of accounts, including differences in the services provided, differences in the risk profile of such business for RiverSource and the additional resources required to manage mutual funds effectively. In evaluating each fund’s expected advisory fees, the Trustees also took into account the demands, complexity and quality of the investment management of the fund.
The Trustees also considered that for certain funds, certain administrative services that are provided under the Agreements would not be provided under the New Agreements, but under a separate administrative services agreement. The Trustees noted that, unlike fees under an advisory agreement, fees under the administrative services agreement could be changed without shareholder approval, although RiverSource had not proposed any increase in such administrative fees and any such increase would require Board approval. The Trustees also noted Ameriprise’s and RiverSource’s covenants regarding compliance with Section 15(f) of the 1940 Act.
After reviewing these and related factors, the Trustees concluded, within the context of their overall conclusions, that the expected advisory fee rates and expenses of each fund supported the approval of the New Agreements.
48
Other Benefits to RiverSource. The Trustees received and considered information regarding any expected “fall-out” or ancillary benefits to be received by RiverSource and its affiliates as a result of their relationships with the funds, such as the engagement of RiverSource to provide administrative services to the funds and the engagement of RiverSource’s affiliates to provide distribution and transfer agency services to the funds. The Trustees considered that the funds’ distributor, which would be an affiliate of RiverSource, retains a portion of the distribution fees from the funds and receives a portion of the sales charges on sales or redemptions of certain classes of shares of the funds. The Trustees also considered the benefits of research made available to RiverSource by reason of brokerage commissions generated by the funds’ securities transactions, and reviewed information about RiverSource’s practices with respect to allocating portfolio brokerage for brokerage and research services. The Trustees considered the possible conflicts of interest associated with certain fall-out or other ancillary benefits and the reporting, disclosure and other processes that would be in place to disclose and to monitor such possible conflicts of interest. The Trustees recognized that RiverSource’s profitability would be somewhat lower without these benefits.
Conclusions
Based on their evaluation of all factors that they deemed to be material, including those factors described above, and assisted by the advice of independent counsel and the Fee Consultant, the Trustees, including the Independent Trustees, (i) approved the continuance of each of the Agreements through October 31, 2010 and (ii) approved each New Agreement.
49
Summary of Management Fee Evaluation by Independent Fee Consultant (Columbia Management Advisors, LLC)
REPORT OF INDEPENDENT FEE CONSULTANT TO THE FUNDS SUPERVISED BY THE COLUMBIA ATLANTIC BOARD
Prepared Pursuant to the February 9, 2005 Assurance of Discontinuance among the Office of Attorney General of New York State, Columbia Management Advisors, LLC, and Columbia Management Distributors, Inc. November 6, 2009
I. Overview
On February 9, 2005, Columbia Management Advisors, LLC (“CMA”) and Columbia Management Distributors, Inc.1 (“CMDI”) agreed to the New York Attorney General’s Assurance of Discontinuance (“AOD”). Among other things, the AOD stipulates that CMA may manage or advise a Columbia Fund (“Columbia Fund” and, together with some or all of such funds, the “Columbia Funds”) only if the Independent Members of the Columbia Fund’s Board of Trustees appoint a Senior Officer or retain an Independent Fee Consultant (“IFC”) who is to manage the process by which proposed management fees are negotiated. The AOD further stipulates that the Senior Officer or IFC is to prepare a written annual evaluation of the fee negotiation process.
With effect from January 1, 2007, the Independent Members of the Board of Trustees for certain Columbia Funds known collectively as the “Atlantic Funds” (together with the other members of that Board, the “Trustees”) retained me as IFC for the Atlantic Funds.2 In this capacity, I have prepared the fifth annual written evaluation of the fee negotiation process. As was the case with the 2007 and 2008 reports, my immediate predecessor as IFC, John Rea, provided invaluable assistance in the preparation of this year’s report.
A. Role of the Independent Fee Consultant
The AOD charges the IFC with “managing the process by which proposed management fees … to be charged the Columbia Fund are negotiated so that they are negotiated in a manner which is at arms’ length and reasonable and consistent with this Assurance of Discontinuance.” The AOD also provides that CMA “may manage or advise a Columbia Fund only if the reasonableness of the proposed management fees is determined by the Board of Trustees … using … an annual independent written evaluation prepared by or under the direction of … the Independent Fee Consultant.” Therefore, the AOD makes clear that the IFC does not supplant the Trustees in negotiating management fees with CMA, nor does the IFC substitute his or her judgment for that of the Trustees with respect to the reasonableness of proposed fees or any other matter that is committed to the business judgment of the Trustees.
B. Elements Involved in Managing the Fee Negotiation Process
In preparing the report required by the AOD, the IFC must consider at least the following six factors set forth in the AOD:
| 1. | The nature and quality of CMA’s services, including the Fund’s performance; |
| 2. | Management fees (including any components thereof) charged by other mutual fund companies for like services; |
| 3. | Possible economies of scale as the Fund grows larger; |
| 4. | Management fees (including any components thereof) charged to institutional and other clients of CMA for like services; |
| 5. | Costs to CMA and its affiliates of supplying services pursuant to the management fee agreements, excluding any intra-corporate profit; and |
| 6. | Profit margins of CMA and its affiliates from supplying such services. |
C. Organization of the Annual Evaluation
This report, like last year’s, focuses on the six factors and contains a section for each factor except that CMA’s costs and profits from managing the Funds are treated in a single section. In addition to a discussion of these factors, the report offers recommendations to improve the fee review process in future years. A review of the status of recommendations made
| 1 | CMA and CMDI are subsidiaries of Columbia Management Group, LLC (“CMG”), and are the successors to the entities named in the AOD. |
| 2 | I have no material relationship with Bank of America, CMG or any of its affiliates, aside from serving as IFC, and I am aware of no material relationship with any of their affiliates. I retained John Rea, an independent economic consultant, to assist me with this report. |
| | Unless otherwise stated or required by the context, this report covers only the Atlantic Funds, which are also referred as the “Funds.” |
50
in the 2008 Report is being provided separately with the materials for the October meeting.
II. Summary of Findings
A. General
| 1. | Based upon my examination of the information supplied by CMG in the light of the six factors set forth in the AOD, I conclude that the Trustees have the relevant information necessary to evaluate the reasonableness of the proposed management fees for each Atlantic Fund. |
| 2. | In my view, the process by which the proposed management fees of the Funds have been negotiated in 2009 thus far has been, to the extent practicable, at arms’ length and reasonable and consistent with the AOD. |
B. Nature and Quality of Services, Including Performance
| 3. | The performance of the Funds has been relatively strong in recent years, although the one-year record was weaker than longer-term records. Based upon 1-, 3-, 5-, and 10-year returns through April 30, 2009, at least half of all the Funds were in the first and second performance quintiles in each of the three longest performance periods; for the one-year period, 40% of the Funds were in the top two quintiles. No more than 13% of the Funds were in the fifth quintile in any one performance period. Domestic equity, quantitative equity, and taxable fixed-income Funds were the strongest performers in 2009, while most foreign equity Funds lagged behind their competitors. |
| 4. | Performance rankings were similar in 2008 and 2009: the 1- and 3-year rankings declined slightly over the previous year, while the 5-year rankings improved modestly. Year over year, for the 1- and 3-year periods, the performance of equity Funds, both domestic and international, declined, while that of fixed-income Funds improved. Between three-fifths to two-thirds of the Funds changed quintile rankings in 2009 in the 1-, 3-, and 5-year performance periods. |
| 5. | The performance of the domestic equity Funds against their benchmarks was good for the 3- and 5-year performance periods. In contrast, gross returns of international equity and fixed-income Funds typically fell short of their benchmarks. The performance of equity Funds against their benchmarks was highly correlated to performance versus their peers; no such correlation was observed for fixed-income Funds. |
| 6. | The Atlantic equity Funds’ overall performance adjusted for risk was solid. Based upon 3-year returns, nearly 57% of the equity Funds had a combination of risk-adjusted and unadjusted returns that placed them in the top half of their performance universes. About one quarter of the fixed-income Funds posted high returns and low risk relative to comparable funds. Just over half of the fixed-income Funds, primarily tax-exempt Funds, took on more risk than the typical fund in their performance universes. |
| 7. | The industry-standard procedure used by Lipper that includes all share classes in the performance universe tends to bias a Fund’s ranking upward within that universe. The bias occurs because either no-12b-1 fee or low-12b-1 fee share classes of the Atlantic Funds are compared with funds in performance universes that include all share classes of multi-class funds with 12b-1 fees of up to 100 basis points. Correcting this bias by limiting the performance universe to classes of comparable funds with low or no 12b-1 fees (a “filtered universe”) lowers the relative performance for the Funds, but not to a material extent. The filtering process, however, did identify one Fund for further review that had not been identified as a review fund using unfiltered universes. Conversely, two Funds that had been identified as review funds in the unfiltered universe lost that status in filtered universes. |
| 8. | A small number of Funds have consistently underperformed over the past five years. The exact number depends on the criteria used to evaluate longer-term performance. For example, only three Funds had below-median performance in each 1- and 3-year period from 2005 to 2009. |
| 9. | The services performed by CMG professionals beyond portfolio management, such as compliance, legal, information technology, risk management, finance, and fund administration, are critical to the success of the Funds and appear to be of high quality. |
C. Management Fees Charged by Other Mutual Fund Companies
| 10. | The Funds’ management fees and total expenses are generally low relative to those of their peers, with over half |
51
| | of the Funds in the most favorable two quintiles. Only 26% of the Funds ranked in the two most expensive quintiles for actual management fees, and 18% in those quintiles for total expenses. Two Funds are in the fifth quintile for total expenses; four Funds are in the fifth quintile for actual management fees. |
| 11. | The highest concentration of low-expense Funds is found among the foreign equity Funds. The 12 former Excelsior Funds have relatively high fees and expenses, with two-thirds ranking in either the fourth or fifth quintiles for actual management fees. The higher actual management fee rankings of certain former Excelsior Funds are due in part to fee schedules that are higher than standard Columbia Fund fee schedules at current asset levels. |
| 12. | The distribution of total expense and management fee rankings has improved over the prior two years. The implementation of the voluntary standardized cap system has contributed significantly to the improved rankings in 2009. |
| 13. | The management fees of the Atlantic Funds are generally in line with those of Columbia Funds supervised by the Nations Board of Trustees (the “Nations Funds”). To the extent that Atlantic Funds have higher average fees in certain investment categories than Nations Funds, the difference reflects either differences in asset size, different fee structures of the former Excelsior Funds, or special circumstances of the Funds included in the investment categories. |
D. Trustees’ Advisory Contract Review Process
| 14. | The Trustees’ evaluation process identified 16 Funds in 2009 for further review based upon long-standing criteria relating to their relative performance or expenses or both. When compared in filtered universes, one additional Fund met the criteria for further review. CMG provided further information about each of those Funds to assist the Trustees in their evaluation. |
E. Potential Economies of Scale
| 15. | CMG presented to the Trustees its analysis of the sources and sharing of potential economies of scale. CMG views economies of scale as arising at the complex level and would regard estimates of scale economies for individual funds as unreliable. In its analysis, CMG did not identify specific sources of economies of scale or provide any estimates of any economies of scale that might arise from future asset growth. CMG’s analysis included measures taken by the Trustees and CMG that seek to share any potential economies of scale through breakpoints in management fee schedules, the establishment of expense limits for each Fund, enhanced shareholder services, fund mergers, and operational consolidation. |
| 16. | An examination of the contractual fee schedules for five Atlantic Funds shows that those with standard fee structures are generally in line with those of their competitors. The fee schedules of the former Excelsior Funds, however, have high initial fees relative to competitors but otherwise have comparable breakpoint structures. |
F. Management Fees Charged to Institutional Clients
| 17. | CMG has provided Trustees with comparisons of mutual fund management fees and institutional fees based upon standardized fee schedules and upon actual fees. The results show that, consistent with industry practice, actual and scheduled institutional fees are generally lower than the Funds’ management fees. CMG provided additional data this year demonstrating that at small asset levels, the effective fee of certain Funds may be equal to or less than institutional fee levels at those asset levels, due to the effect of expense limits on small funds with high gross expenses. CMG also analyzed the differences between the services provided and risks borne on the one hand by a manager of mutual funds and on the other by institutional advisers, and suggested that these differences should be kept in mind when Trustees review the reasonableness of the Funds’ management fees. |
G. Revenues, Expenses, and Profits
| 18. | The activity-based cost allocation methodology employed by CMG to allocate costs, both direct and indirect, for purposes of calculating Fund profitability is thoughtful and detailed. This year, CMG further refined the technique by allocating additional indirect expenses on an activity basis. |
| 19. | The materials provided on CMG’s revenues and expenses with respect to the Funds and the methodology underlying |
52
| | their construction form a sufficient basis for Trustees to evaluate the expenses of and profitability to CMG arising out of its relationships with the Funds. |
| 20. | CMG provided a firm-wide pro forma 2009 income statement demonstrating the effect of market events beginning in the fourth quarter of 2008 on its revenues and profitability to provide an additional perspective on calendar 2008 profitability data. In particular, 2008 revenues reflected the higher market prices prevailing during the first three quarters of that year, while expenses dropped due to cost cutting in the wake of the market downturn late in 2008. The continuing effects of this downturn are expected to produce a significant decline in profitability this year. |
| 21. | In 2008, CMG’s pre-tax post-distribution margin on the Atlantic Fund complex was above industry medians, based on the limited data available for publicly held mutual fund managers. However, as is to be expected in a large fund complex, some Atlantic Funds had relatively high pre-tax profit margins in 2008, when calculated solely with respect to management revenues and expenses, while other Atlantic Funds operated at a loss. There is a positive relationship between Fund size and profitability to CMG, with smaller Funds generally operating at a loss to CMG. |
| 22. | CMG pays a fixed percentage of its management fee revenues to an affiliate, U.S. Trust, Bank of America Private Wealth Management, with respect to assets of its clients invested in Atlantic Funds to compensate it for services it performs with respect to those client assets and for the effect of state law limitations on affiliates charging multiple fees. Based on our analysis of the services provided by this affiliate, we have concluded that all payments other than those for sub-transfer agent or sub-accounting services should be treated as a distribution expense. |
III. Recommendations
| 1) | Criteria for review. The Trustees may wish to consider modifying the criteria for identifying a Fund for further review (a “Review Fund”) to include criteria that focus exclusively on performance. The Trustees’ supplementary data request included one such criterion. They may also wish to consider whether it would be useful to apply CMG’s own internal monitoring standards for Fund performance to the contract review process, or whether such criteria are more relevant to their ongoing investment oversight. |
| 2) | Presentation of Review Fund discussion. CMG should consider whether it could more systematically present in one discussion all relevant information regarding each Review Fund, which is now split into several different portions of the 15(c) materials. For any Fund that has been a Review Fund in consecutive years, CMG should address under what circumstances it could reasonably be anticipated that the Fund would lose that status. |
| 3) | Refinement of tax-exempt performance data. Certain single-state tax-exempt Funds compete in extremely small universes and are compared to a multi-state benchmark of uncertain relevance. Notwithstanding the difficulties, CMG should work to improve the reliability of the calculation of relative performance of these Funds. If that is not possible, CMG should provide guidance on how the Trustees should judge the quality of CMG’s management of these Funds. |
| 4) | Development of risk metrics for asset-allocation, tax-exempt, and money market funds. CMG has developed and shared with the Trustees quantitative risk metrics comparing equity and taxable fixed-income Funds against their peers. However, reliable risk metrics have not been developed for asset-allocation, tax-exempt fixed income, and money market funds. We urge CMG to continue its efforts to provide reliable risk measures for these categories of Funds, especially in the cases of asset-allocation and money market funds, because their investors are likely to be motivated at least in part by a desire to manage risk. |
| 5) | Profitability data. For any period during which CMG is an affiliate of U.S. Trust, Bank of America Private Wealth Management, CMG should continue to present to the Trustees the profitability of each Fund, each investment style and each complex (of which Atlantic is one) calculated as follows: |
| | a. | Management-only profitability should be calculated without reference to any Private Bank expense. |
| | b. | Profitability excluding distribution (which essentially covers the management and transfer agency functions) should be adjusted by removing from the expense calculation any portion of the Private Bank payment not |
53
| | attributable to the performance by the Private Bank of sub-transfer agency or sub-accounting functions. |
| | c. | Total profitability, including distribution: No adjustment for Private Bank expenses should be made, because all such expenses represent legitimate fund expenses to be taken into account in calculating CMG’s profit margin including distribution. |
| | d. | Distribution only: This should include all Private Bank expenses other than those attributable to sub-transfer agency services. |
| 6) | Contractual fee analysis. This year CMG presented a new Lipper report comparing the contractual management fees of Funds with those of competitors in similar investment styles. However, the reliability of the conclusion – that Fund management fee breakpoints compared favorably with competitive fee rates – was limited by the use of competitive funds at all asset levels. The sponsors of a $100 million mutual fund may not have given much thought to breakpoints at $5 billion; therefore, that fund’s contractual fee at that level is unlikely to compare favorably with that of a $5 billion Fund. Limiting the competitors to the Lipper expense group, whose constituents are similar in size to the relevant Fund, would make the results more meaningful. In addition, the breakpoints of a select group of Atlantic Funds (which would differ each year) should continue to be compared to those of industry rivals to ensure that the Funds’ breakpoint schedules remain within industry norms. As breakpoint schedules change relatively little each year, performing such a comparison for each Atlantic Fund each year would not be an efficient use of Trustee and CMG resources. |
| 7) | Pro forma profitability data. In any year in which CMG or the Trustees believe that the prior year’s profitability is unlikely to be representative of current business results due to changes in markets or for any other reason, CMG should, consistent with this year’s practice, prepare a pro forma income statement based on year-to-date actual data and reasonable projections used for its own business planning purposes. |
| 8) | Additional institutional data and analysis. While CMG provided a substantial amount of information on its institutional business, including a virtually complete database of all institutional accounts, we suggest some additional items for future years: (a) profitability data for the institutional business in the format, and based upon the same allocation methodologies, used to present Fund profitability, (b) an explanation of how CMA sets institutional fee breakpoints, which normally begin at asset levels far lower than those found in Fund management fee breakpoints, and (c) an analysis of differences in actual fees within specific investment categories, with special attention given to accounts established before and after the implementation of the standardized institutional fee schedules in 2005. |
| 9) | Management fee disparities. In any future study of management fees, CMG and the Atlantic Trustees should analyze the differences in management fee schedules, including those arising out of the reorganization of the former Excelsior Funds as Atlantic Funds. As part of that analysis, CMG should provide an explanation for any significant fee differences among comparable funds across fund families sponsored by CMG, such as differences in the management styles of different Funds included the same Lipper category. Finally, if CMG proposes a management fee change or an expense cap for any mutual fund managed by CMA that is comparable to any Atlantic Fund, CMG should provide the Trustees with sufficient information about the proposal to allow the Trustees to assess the applicability of the proposed change to the relevant Atlantic Fund or Funds. |
| 10) | Explanation of data supplied to Lipper. Each year, as part of the 15(c) process, CMG retains Lipper to compare the fees and expenses of each Fund to a group of competitors. In many cases, CMG, with the approval of the Trustees, adjusts the actual expense data, which is based on the most recent full fiscal year of the Fund (and each competitive fund) to reflect changes in fees or expense limits that occurred during or after the relevant fiscal year. This improves the reliability and usefulness of the comparison. However, to ensure that the Trustees know when and how CMG adjusted the data, we recommend that CMG prepare a table listing for each Fund what adjustments were made, e.g., to reflect a new expense limitation of x basis points that commenced on y date. |
Reduction of volume of paper documents submitted. The effort to streamline and better organize the data presented to the
54
Trustees and the process by which that data was prepared and organized continued to be well-received by all parties. Notwithstanding past success, it is always appropriate to look for opportunities to reduce and simplify the presentation of 15(c) data. One possibility would be to remove the 124 pages of biographical data, most if not all of which the Trustees have previously seen as part of their ongoing investment oversight duties, from the paper volume and post it on the Internet-based document storage and retrieval system used by the Funds to provide reference data to Trustees.
Respectfully Submitted,
Steven E. Asher
55
Summary of Management Fee Evaluation by Independent Fee Consultant (RiverSource Investments, LLC)
REPORT OF INDEPENDENT FEE CONSULTANT TO THE FUNDS SUPERVISED BY THE COLUMBIA ATLANTIC BOARD
Prepared Pursuant to the February 9, 2005 Assurance of Discontinuance among the Office of Attorney General of New York State, Columbia Management Advisors, LLC, and Columbia Management Distributors, Inc. December 21, 2009
I. Overview
On February 9, 2005, Columbia Management Advisors, LLC (“CMA”) and Columbia Management Distributors, Inc.1 (“CMD”) agreed to the New York Attorney General’s Assurance of Discontinuance (“AOD”). Among other things, the AOD stipulates that CMA may manage or advise a Columbia Fund (“Columbia Fund” and, together with some or all of such funds, the “Columbia Funds”) only if the Independent Members of the Columbia Fund’s Board of Trustees appoint a Senior Officer or retain an Independent Fee Consultant (“IFC”) who is to manage the process by which proposed management fees are negotiated. The AOD further stipulates that the Senior Officer or IFC is to prepare a written annual evaluation of the fee negotiation process.
With effect from January 1, 2007, the Independent Members of the Board of Trustees for certain Columbia Funds known collectively as the “Atlantic Funds” (together with the other members of that Board, the “Trustees”) retained me as IFC for the Atlantic Funds.2 In this capacity, I have prepared this written evaluation of the fee negotiation process. As was the case with the last three annual reports, my immediate predecessor as IFC, John Rea, provided invaluable assistance in the preparation of this report.
On September 29, 2009, Ameriprise entered into an asset purchase agreement with Bank of America, N.A. and its parent, Bank of America Corporation (together, the “Bank”) pursuant to which the Bank agreed to sell certain CMG assets relating to Columbia’s long-term asset management business, including management of the Atlantic Funds (the “Transaction”).3 The Transaction if completed would result in the termination of the existing Investment Management Agreements with CMA. Therefore, the Trustees have been requested to approve and recommend to the shareholders of each Atlantic Fund new Investment Management and Sub-Advisory Agreements (together, the “Management Agreements”) with RiverSource Investments, LLC (“RI”),4 investment manager of the RiverSource Funds and a subsidiary of Ameriprise. This report is intended to fulfill the requirements of the AOD with respect to the Trustees’ consideration of the new Management Agreements.
A. Role of the Independent Fee Consultant
The AOD charges the IFC with “managing the process by which proposed management fees … to be charged the Columbia Fund are negotiated so that they are negotiated in a manner which is at arms’ length and reasonable and consistent with this Assurance of Discontinuance.” The AOD also provides that CMA “may manage or advise a Columbia Fund only if the reasonableness of the proposed management fees is determined by the Board of Trustees … using … an annual independent written evaluation prepared by or under the direction of … the Independent Fee Consultant.” Therefore, the AOD makes clear that the IFC does not supplant the Trustees in negotiating management fees with CMA (or RI), nor does the IFC substitute his or her judgment for that of the Trustees with respect to the reasonableness of proposed fees or any other matter that is committed to the business judgment of the Trustees.
| 1 | CMA and CMD are subsidiaries of Columbia Management Group, LLC (“CMG”), and are the successors to the entities named in the AOD. |
| 2 | I have no material relationship with Bank of America, CMG or Ameriprise Financial, Inc. (“Ameriprise”), aside from serving as IFC, and I am aware of no material relationship with any of their affiliates. I retained John Rea, an independent economic consultant, to assist me with this report. |
| | Unless otherwise stated or required by the context, this report covers only the Atlantic Funds. |
| 3 | Preliminary Response of Ameriprise to Information Request of Columbia Atlantic Board dated October 21, 2009 (hereafter, the “Preliminary Response”), p. 1. The one money market Atlantic Fund, Money Market Fund VS, was included in the Transaction because it was an integral part of CMG's array of Funds used as investment vehicles by variable annuity and similar insurance products. |
| 4 | Ameriprise intends to re-brand RI with the “Columbia” name (which is one of the assets being sold in the Transaction). Preliminary Response, pp. 4-5. In the case of new Sub-Advisory Agreements, the current sub-adviser would also be a party. |
56
B. Elements Involved in Managing the Fee Negotiation Process
In preparing the report required by the AOD, the IFC must consider at least the following six factors set forth in the AOD:
| 1. | The nature and quality of the adviser’s services, including the Fund’s performance; |
| 2. | Management fees (including any components thereof) charged by other mutual fund companies for like services; |
| 3. | Possible economies of scale as the Fund grows larger; |
| 4. | Management fees (including any components thereof) charged to institutional and other clients of the adviser for like services; |
| 5. | Costs to the adviser and its affiliates of supplying services pursuant to the management fee agreements, excluding any intra-corporate profit; and |
| 6. | Profit margins of the adviser and its affiliates from supplying such services. |
C. Data Presented to the Trustees
In considering the proposed new Management Agreements with RI, the Trustees relied in part on the data that had been prepared as part of their annual contract review process, which concluded in late October. This data remained relevant because the fees in the proposed Management Agreements were identical to the fees approved at that time. The annual review materials included a Lipper report on the performance of each Atlantic Fund compared to its peers and its benchmark, comparisons of the fees and expenses of each Atlantic Fund to similar CMG-sponsored Funds, comparable competitive funds chosen by Lipper, and institutional accounts advised by CMA, revenues, expenses, and profits of CMG from managing the Atlantic Funds, calculated both by Fund and collectively, and CMG’s views on the existence and sharing of economies of scale.
In addition, the Trustees reviewed materials specific to the proposed new Management Agreements with RI in response to requests for information made on behalf of the Trustees, including the following:
| n | | Performance data for the RiverSource Funds showing percentile and quartile rankings of each fund within its Lipper performance universe for periods up to five years and net returns of each fund relative to its benchmark returns. This data was arguably relevant due to the possibility that some RiverSource investment teams would be providing investment management services to certain Columbia Funds. 5 |
| n | | tables comparing the fee schedules and effective fee rates of funds managed by CMA and RI and institutional accounts advised by the two firms. |
| n | | extensive discussion of the process by which the various components of the two asset management businesses would be integrated including investment management, compliance, transfer agency, custody, fund accounting, and distribution. |
| n | | information about the financial condition of Ameriprise, including its most recent annual report on Form 10-K, RI’s profit margins from managing the RiverSource Funds in 2007 and 2008, and pro forma income statements for the combined Columbia and RiverSource fund complex. |
| n | | disclosure that certain senior CMG executives, including President Michael Jones, Chief Investment Officer Colin Moore, Head of Mutual Funds J. Kevin Connaughton, and Chief Compliance Officer Linda Wondrack would continue in analogous capacities following the consummation of the Transaction, and |
| n | | a breakdown of the synergies RI expects to realize in the two years following the Transaction and the extent to which those potential synergies are expected to be shared with shareholders of funds advised by RI. |
| 5 | On page 20 of its Supplemental Response to the Atlantic Trustees (undated but delivered November 24, 2009), Ameriprise said that “most personnel decisions, including with respect to the portfolio management teams for the Atlantic Funds . . . will be made primarily by [current CMA CIO] Colin Moore using the Columbia 5P process.” |
57
II. Findings
| 1. | Based upon my examination of the information supplied by CMG and Ameriprise in the light of the six factors set forth in the AOD, I conclude that the Trustees have the relevant information necessary to evaluate the reasonableness of the proposed management fees for each Atlantic Fund. |
| 2. | In my view, the process by which the proposed management fees of the Atlantic Funds have been negotiated with RI thus far has been, to the extent practicable, at arms’ length and reasonable and consistent with the AOD. |
Respectfully submitted,
Steven E. Asher
58
Proxy Voting Results
On March 3, 2010, a special meeting of shareholders of Columbia Funds Series Trust I was held to consider the approval of several proposals listed in the proxy statement for the meeting. Proposal 1 and Proposal 2 were voted on at the March 3, 2010 meeting of shareholders and Proposal 3 was voted on at an adjourned meeting of shareholders held on March 31, 2010. The shareholder meeting results are as follows:
Proposal 1: A proposed Investment Management Services Agreement with Columbia Management Investment Advisers, LLC (formerly, RiverSource Investments, LLC) (CMIA) was approved as follows:
| | | | | | |
| | | | | | | |
| Votes For | | Votes Against | | Abstentions | | Broker Non-Votes |
| 476,030,002 | | 1,708,250 | | 2,528,843 | | 37,241,092 |
Proposal 2: A proposal authorizing CMIA to enter into and materially amend subadvisory agreements for the Fund in the future, with the approval of the Trust’s Board of Trustees, but without obtaining additional shareholder approval, was approved as follows:
| | | | | | |
| | | | | | | |
| Votes For | | Votes Against | | Abstentions | | Broker Non-Votes |
| 385,934,734 | | 92,023,971 | | 2,308,336 | | 37,241,147 |
Proposal 3: Each of the nominees for trustees was elected to the Trust’s Board of Trustees, as follows:
| | | | | | |
| | | | | | | |
| Trustee | | Votes For | | Votes Withheld | | Abstentions |
| John D. Collins | | 30,977,072,412 | | 859,827,038 | | 0 |
Rodman L. Drake | | 30,951,179,004 | | 885,720,446 | | 0 |
| Douglas A. Hacker | | 30,989,793,279 | | 847,106,171 | | 0 |
Janet Langford Kelly | | 30,999,020,814 | | 837,878,636 | | 0 |
| William E. Mayer | | 16,291,139,483 | | 15,545,759,967 | | 0 |
Charles R. Nelson | | 30,997,700,700 | | 839,198,750 | | 0 |
| John J. Neuhauser | | 30,988,095,661 | | 848,803,789 | | 0 |
Jonathon Piel | | 30,968,801,048 | | 868,098,402 | | 0 |
| Patrick J. Simpson | | 30,999,065,030 | | 837,834,420 | | 0 |
Anne-Lee Verville | | 30,996,227,913 | | 840,671,537 | | 0 |
59
[THIS PAGE INTENTIONALLY LEFT BLANK]
60
Important Information About This Report
Transfer Agent*
Columbia Management Investment Services Corp.
P.O. Box 8081
Boston, MA 02266-8081
1-800-345-6611
Distributor*
Columbia Management Investment
Distributors, Inc.
One Financial Center
Boston, MA 02111
Investment Advisor*
Columbia Management Investment Advisers, LLC
100 Federal Street
Boston, MA 02110
* As of May 1, 2010.
The fund mails one shareholder report to each shareholder address. If you would like more than one report, please call shareholder services at 1-800-345-6611 and additional reports will be sent to you. This report has been prepared for shareholders of Columbia Bond Fund.
A description of the policies and procedures that the fund uses to determine how to vote proxies and a copy of the fund’s voting records are available (i) at www.columbiamanagement.com, (ii) on the Securities and Exchange Commission’s website at www.sec.gov, and (iii) without charge, upon request, by calling 1-800-368-0346. Information regarding how the fund voted proxies relating to portfolio securities during the 12-month period ended June 30 is available from the SEC’s website. Information regarding how the fund voted proxies relating to portfolio securities is also available from the fund’s website, columbiamanagement.com.
The fund files a complete schedule of portfolio holdings with the SEC for the first and third quarters of each fiscal year on Form N-Q. The fund’s Form N-Q is available on the SEC’s website at www.sec.gov and may be reviewed and copied at the SEC’s Public Reference Room in Washington, D.C. Information on the operation of the Public Reference Room may be obtained by calling
1-800-SEC-0330.
Investors should consider the investment objectives, risks, charges and expenses of a mutual fund carefully before investing. For a free prospectus, which contains this and other important information about the funds, visit columbiamanagement.com. Read the prospectus carefully before investing.
On April 30, 2010, Ameriprise Financial, Inc., the parent company of RiverSource Investments, LLC, acquired the long-term asset management business of Columbia Management Group, LLC, including certain of its affiliates, which were, prior to this acquisition, part of Bank of America. In connection with the acquisition of the long-term assets, the Columbia Funds have a new investment adviser, RiverSource Investments, LLC, which is now known as Columbia Management Investment Advisers, LLC. For those clients that use the services of a subadviser, those arrangements are continuing unless notified otherwise. RiverSource Fund Distributors, Inc., now known as Columbia Management Investment Distributors, Inc., member FINRA, will act as the principal distributor of the Columbia Funds.
61

One Financial Center
Boston, MA 02111-2621
Columbia Bond Fund
Annual Report, March 31, 2010
©2010 Columbia Management Investment Advisers, LLC. All rights reserved.
One Financial Center, Boston, MA 02111-2621
800.345.6611 www.columbiafunds.com
SHC-42/44411-0310 (05/10) 10/D3T2P5

Annual Report
March 31, 2010
Columbia Short-Intermediate Bond Fund
Not FDIC Insured Ÿ May Lose Value Ÿ No Bank Guarantee
Table of Contents
The views expressed in this report reflect the current views of the respective parties. These views are not guarantees of future performance and involve certain risks, uncertainties and assumptions that are difficult to predict, so actual outcomes and results may differ significantly from the views expressed. These views are subject to change at any time based upon economic, market or other conditions and the respective parties disclaim any responsibility to update such views. These views may not be relied on as investment advice and, because investment decisions for a Columbia Fund are based on numerous factors, may not be relied on as an indication of trading intent on behalf of any particular Columbia Fund. References to specific securities should not be construed as a recommendation or investment advice.
President’s Message

Dear Shareholder:
On May 3, 2010, Ameriprise Financial, Inc. announced that it had completed the acquisition of the long-term asset management business of Columbia Management from Bank of America. This includes the business of managing its equity and fixed-income mutual funds. Ameriprise Financial has combined its current U.S. asset management business, RiverSource Investments, LLC, with Columbia Management. This transaction puts together two leading asset management firms to create one entity that ranks as the eighth largest manager of long-term mutual fund assets in the United States.1 This combined business will operate under the well-regarded Columbia Management brand, where we will build on the strengths of our combined investment capabilities and talent, our broad and diversified product lineup and exceptional service.
Our combined business has a new breadth and depth of investment choices. William “Ted” Truscott, CEO, U.S. asset management and president of annuities for Ameriprise Financial, leads the combined U.S. asset management business. Michael Jones serves as president, U.S. asset management. Colin Moore continues to serve as chief investment officer. I am also continuing in my role as head of mutual funds, responsible for the delivery of mutual fund products and services to investors. The Columbia funds’ advisers, distributor and transfer agent are now subsidiaries of our parent company, Ameriprise Financial but operate under the Columbia Management name. You will begin to see these names used in communications and statements going forward.
| | |
| | | Service provider name |
| Advisers | | Columbia Management Investment Advisers, LLC Columbia Wanger Asset Management, LLC |
| Distributor | | Columbia Management Investment Distributors, Inc. |
| Transfer Agent | | Columbia Management Investment Services Corp. |
As a valued investor in Columbia funds, please know that our goal is to ensure a smooth transition and provide the highest quality products and services. Transition teams across the organization continue their efforts to build on best practices from both legacy organizations with integration efforts including rebranding, vendor and system consolidations and client communications. Additionally, we want to assure you that the funds’ portfolio managers also continue to focus on providing uninterrupted service to all fund shareholders.
Although we have a lot of work ahead of us in 2010, Columbia Management and Ameriprise Financial are excited about the opportunities for our combined organization. I share this optimism and believe it positions us as a best-in-class asset management business with the ability to deliver more for our clients than ever before.
Sincerely,

J. Kevin Connaughton
President, Columbia Funds
| 1 | Source: Ameriprise Financial, Inc., based on March 31, 2010 data from the Investment Company Institute |
Investors should consider the investment objectives, risks, charges and expenses of a mutual fund carefully before investing. For a free prospectus, which contains this and other important information about the funds, visit columbiamanagement.com. Read the prospectus carefully before investing.
Securities products offered through Columbia Management Investment Distributors, Inc. (formerly known as RiverSource Fund Distributors, Inc.), member FINRA. Advisory services provided by Columbia Management Investment Advisers, LLC (formerly known as RiverSource Investments, LLC).
© 2010 Columbia Management Investment Advisers, LLC. All rights reserved.
Fund Profile – Columbia Short-Intermediate Bond Fund
Performance data quoted represents past performance and current performance may be lower or higher. Past performance is no guarantee of future results. The investment return and principal value will fluctuate so that shares, when redeemed, may be worth more or less than the original cost. Please visit www.columbiafunds.com for daily and most recent month-end performance updates.
Summary
1-year return as of 03/31/10
| | |
| |
 | | +9.98% Class A shares |
| | (without sales charge) |
| |
| | +6.92% Barclays Capital Intermediate Government/Credit Bond Index |
Summary
| n | | For the 12-month period that ended March 31, 2010, the fund’s Class A shares returned 9.98% without sales charge. |
| n | | The fund performed better than its benchmark, the Barclays Capital Intermediate Government/Credit Bond Index1, but underperformed its peer group average, the Lipper Short-Intermediate Investment Grade Debt Funds Classification2. |
| n | | The fund had more exposure than its benchmark to non-Treasury investment-grade sectors and also had investments in sectors not included in the benchmark, both of which aided relative performance. We believe the quality of the portfolio was higher than the quality of the average fund in its peer group, which was a disadvantage during the period because higher risk securities were the strongest performers. |
Portfolio Management
Alexander D. Powers, managing director of the advisor, has co-managed the fund since 2008 and has been associated with the advisor or its predecessors since 1996.
Frank A. Salem, managing director of the advisor, has co-managed the fund since 2008 and has been associated with the advisor or its predecessors since 1998.
Effective May 1, 2010, RiverSource Investments, LLC, a subsidiary of Ameriprise Financial, Inc., became the investment advisor to the fund and changed its name to Columbia Management Investment Advisers, LLC. Please see the fund’s prospectus, as supplemented, for more information regarding the change in investment advisor and certain other changes.
| 1 | The Barclays Capital Intermediate Government/Credit Bond Index tracks the performance of intermediate term U.S. government and corporate bonds. Indices are not available for investment, are not professionally managed and do not reflect sales charges, fees, brokerage commissions, taxes or other expenses of investing. Securities in the fund may not match those in an index. |
| 2 | Lipper Inc., a widely respected data provider in the industry, calculates an average total return (assuming reinvestment of distributions) for mutual funds with investment objectives similar to those of the fund. Lipper makes no adjustment for the effect of sales loads. |
1
Economic Update – Columbia Short-Intermediate Bond Fund
Summary
For the 12-month period that ended March 31, 2010
| | n | | As investors grew more comfortable with risk, non-Treasury sectors of the bond market rebounded. The Barclays Capital Aggregate Bond Index delivered solid results. High-yield bonds outperformed stocks, as measured by the BofA Merrill Lynch U.S. High Yield Cash Pay Index. | |
| | |
| Barclays Aggregate Index | | BofA ML Index |
| |

| |
|
7.69% | | 55.67% |
| | n | | Stock markets rebounded around the world, as measured by the S&P 500 Index and the MSCI EAFE Index. | |
| | |
| S&P Index | | MSCI Index |
| |
| |
|
49.77% | | 54.44% |
After a deep and difficult recession, the U.S. economy regained its footing midway through calendar year 2009. Gross domestic product (GDP) turned positive in the third quarter of 2009, rising 2.2%, and then gained 5.6% in the fourth quarter according to the estimate released by the Bureau of Economic Analysis. Growth was primarily the result of a slowdown in inventory reduction and of federal government stimulus spending. Hopes for a sustained recovery now depend on a variety of factors, including continued improvement in consumer spending, an increase in revenues to keep business profits moving higher and a turnaround in the labor market.
The housing market showed some signs of stabilizing, but stopped short of meaningful improvement during the period. Home sales moved higher in 2009 as new homebuyers took advantage of a federal tax credit. However, as the tax credit was set to expire in November 2009, sales slipped — and did not revive even though the tax credit was expanded and extended through April 2010. Housing prices remained relatively flat over the past year, but that was progress compared to 2008. The average home price fell sharply in 2008; and since then distressed properties, which account for approximately 40% of all housing sales, have held prices down because they are heavily discounted.
In the beleaguered labor market, there was some good news. While businesses continued to shed jobs through most of 2009, raising the unemployment rate to 9.7% at the end of the period*, job data turned positive in March 2010, buoyed by a swell of temporary workers hired to conduct the national once-in-a-decade census. Consumer spending also trended higher in the second half of the period. In fact, March year-over-year sales made a significant jump upward. Despite these improvements, consumer confidence, as measured monthly by The Conference Board, an independent research organization, failed to gain much ground during the year. Consumers surveyed continue to cite uncertain business conditions and still-weak labor prospects for their concerns.
On the business side of the economy, manufacturing activity gained momentum. A key measure of the nation’s manufacturing situation — the Institute for Supply Management’s Index — rose above 50 in July 2009 — then rose for eight consecutive months to remain well above 50 for the remainder of the period. (An index value of 50+ indicates a growing economy.) Industrial production moved higher for eleven out of the past 12 months, and durable goods orders took off, with a big jump upward in January. Manufacturing capacity utilization inched upward to 72.7%.
Bond returns ranged from solid to strong
As hopes for a recovery materialized, bonds from non-Treasury sectors delivered solid returns. The Barclays Capital Aggregate Bond Index1 returned 7.69%. Municipal bonds gained more than taxable investment-grade bonds even without factoring in potential tax advantages to investors in higher income-tax brackets. The Barclays Capital Municipal Bond Index2 returned 9.69%. The high-yield bond market was even stronger than the broad stock market during the period. For the 12 months covered by this report, the BofA Merrill Lynch U.S. High Yield Cash Pay Index3 returned 55.67%.
| *Source: | U.S. Bureau of Labor Statistics |
2
Economic Update (continued) – Columbia Short-Intermediate Bond Fund
The yield on the 10-year U.S. Treasury, a common bellwether for the bond market, rose from 2.7% to 3.8% during the 12-month period. Yet despite the pickup in economic activity, the Federal Reserve Board kept a key short-term interest rate — the federal funds rate — close to zero throughout the period.
Stocks staged a solid comeback
Against a strengthening economic backdrop, a stock market rally that began in mid-March 2009 continued with little interruption through the end of the period. The U.S. stock market returned 49.77% for the 12-month period, as measured by the S&P 500 Index.4 Mid-cap stocks outperformed large- and small-cap stocks, and value stocks outperformed growth stocks by a solid margin, as measured by their respective Russell indices.5 Outside the United States, stock market returns were slightly stronger. The MSCI EAFE Index,6 a broad gauge of stock market performance in foreign developed markets, gained 54.44% (net of dividends, in U.S. dollars) for the period. Emerging stock markets were caught in a downdraft in 2008, but they bounced back stronger than domestic or developed world markets as their economic growth generally outpaced the developed world. The MSCI Emerging Markets Index7 returned 81.08% (net of dividends, in U.S. dollars) for the 12-month period, after giving back some gains in the first quarter of 2010.
Past performance is no guarantee of future results.
| 1 | The Barclays Capital Aggregate Bond Index is a market value-weighted index that tracks the daily price, coupon, pay-downs and total return performance of fixed-rate, publicly placed, dollar-denominated and non-convertible investment grade debt issues with at least $250 million par amount outstanding and with at least one year to final maturity. |
| 2 | The Barclays Capital Municipal Bond Index is considered representative of the broad market for investment-grade, tax-exempt bonds with a maturity of at least one year. |
| 3 | The BofA Merrill Lynch U.S. High Yield Cash Pay Index tracks the performance of non-investment-grade corporate bonds. |
| 4 | The Standard & Poor’s (S&P) 500 Index tracks the performance of 500 widely held, large-capitalization U.S. stocks. |
| 5 | The Russell 1000 Index tracks the performance of 1,000 of the largest U.S. companies, based on market capitalization. The Russell MidCap Index measures the performance of the 800 smallest companies in the Russell 1000 Index, which represents approximately 25% of the total market capitalization of the Russell 1000 Index. The Russell 2000 Index measures the performance of the 2,000 smallest companies in the Russell 3000 Index, which represents approximately 8% of the total market capitalization of the Russell 3000 Index. The Russell 3000 Growth Index measures the performance of those Russell 3000 Index companies with higher price-to-book ratios and higher forecasted growth values. The stocks in this index are also members of either the Russell 1000 Growth or the Russell 2000 Growth indexes. The Russell 3000 Value Index measures the performance of those Russell 3000 Index companies with lower price-to-book ratios and lower forecasted growth values. The stocks in this index are also members of either the Russell 1000 Value or the Russell 2000 Value indexes. |
| 6 | The Morgan Stanley Capital International Europe, Australasia, Far East (MSCI EAFE) Index is a capitalization-weighted index that tracks the total return of common stocks in 21 developed-market countries within Europe, Australasia and the Far East. |
| 7 | The Morgan Stanley Capital International Emerging Markets Index (MSCI EMI) is a free float-adjusted market capitalization index that is designed to measure equity market performance in the global emerging markets. As of June 2009, the MSCI Emerging Markets Index consisted of the following 22 emerging market country indices: Brazil, Chile, China, Colombia, Czech Republic, Egypt, Hungary, India, Indonesia, Israel, Korea, Malaysia, Mexico, Morocco, Peru, Philippines, Poland, Russia, South Africa, Taiwan, Thailand and Turkey. |
Indices are not available for investment, are not professionally managed and do not reflect sales charges, fees, brokerage commissions, taxes or other expenses of investing. Securities in the fund may not match those in an index.
3
Performance Information – Columbia Short-Intermediate Bond Fund
Performance data quoted represents past performance and current performance may be lower or higher. Past performance is no guarantee of future results. The investment return and principal value will fluctuate so that shares, when redeemed, may be worth more or less than the original cost. Please visit www.columbiafunds.com for daily and most recent month-end performance updates.
| | |
| Annual operating expense ratio (%)* |
| |
Class A | | 0.81 |
Class C | | 1.56 |
Class Z | | 0.56 |
| * | The annual operating expense ratio is as stated in the fund’s prospectus that is current as of the date of this report. Differences in expense ratios disclosed elsewhere in this report may result from the inclusion of fee waivers and expense reimbursements as well as the use of different time periods used in calculating the ratios. | |
|
| Performance of a $10,000 investment 04/01/00 – 03/31/10 |
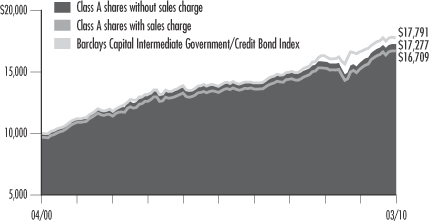
The chart above shows the change in value of a hypothetical $10,000 investment in Class A shares of Columbia Short-Intermediate Bond Fund during the stated time period, and does not reflect the deduction of taxes that a shareholder may pay on fund distributions or on the redemption of fund shares.
| | | | |
| Performance of a $10,000 investment 04/01/00 – 03/31/10 ($) |
| | |
| Sales charge | | without | | with |
Class A | | 17,277 | | 16,709 |
Class C | | 17,046 | | 17,046 |
Class Z | | 17,370 | | n/a |
| | | | | | | | | | |
| Average annual total return as of 03/31/10 (%) |
| | | |
| Share class | | A | | C | | Z |
| Inception | | 03/31/08 | | 03/31/08 | | 12/31/92 |
| Sales charge | | without | | with | | without | | with | | without |
1-year | | 9.98 | | 6.41 | | 9.15 | | 8.15 | | 10.26 |
5-year | | 4.62 | | 3.93 | | 4.34 | | 4.34 | | 4.73 |
10-year | | 5.62 | | 5.27 | | 5.48 | | 5.48 | | 5.68 |
The “with sales charge” returns include the maximum initial sales charge of 3.25% for Class A shares and the applicable contingent deferred sales charge of 1.00% for Class C shares for the first year only. The “without sales charge” returns do not include the effect of sales charges. If they had, returns would be lower.
Performance results reflect any fee waivers or reimbursements of fund expenses by the investment advisor and/or any of its affiliates. Absent these fee waivers or expense reimbursement arrangements, performance results would have been lower.
The Fund commenced operations on March 31, 2008. Class A, Class C and Class Z share performance information includes returns of Shares class shares of Intermediate-Term Bond Fund, the predecessor to the Fund and a series of Excelsior Funds, Inc. (the “Predecessor Fund”), for periods prior to March 31, 2008. These returns shown for all share classes reflect any differences in sales charges, but have not been restated to reflect any differences in expenses between the Predecessor Fund share class and the newer share classes. If differences in expenses had been reflected, the returns shown for periods prior to March 31, 2008 would be lower for Class A and Class C shares, since these newer classes of shares are subject to higher distribution and service (Rule 12b-1) fees. All results shown assume reinvestment of distributions. Class Z shares are sold at net asset value with no distribution and service (Rule 12b-1) fees. Class Z shares have limited eligibility and the investment minimum requirements may vary. Please see the fund’s prospectus for details. Performance for different share classes will vary based on differences in sales charges and fees associated with each class.
The tables do not reflect the deduction of taxes that a shareholder may pay on fund distributions or on the redemption of fund shares.
4
Understanding Your Expenses – Columbia Short-Intermediate Bond Fund
Estimating your actual expenses
To estimate the expenses that you paid over the period, first you will need your account balance at the end of the period:
| | n | | For shareholders who receive their account statements from Columbia Management Services, Inc., your account balance is available online at www.columbiafunds.com or by calling Shareholder Services at 800.345.6611. | |
| | n | | For shareholders who receive their account statements from their financial intermediary, contact your financial intermediary to obtain your account balance. | |
| | 1. | Divide your ending account balance by $ 1,000. For example, if an account balance was $8,600 at the end of the period, the result would be 8.6. | |
| | 2. | In the section of the table below titled “Expenses paid during the period,” locate the amount for your share class. You will find this number in the column labeled “Actual.” Multiply this number by the result from step 1. Your answer is an estimate of the expenses you paid on your account during the period. | |
If the value of your account falls below the minimum initial investment requirement applicable to you, your account generally will be subject to a $20 annual fee. This fee is not included in the accompanying table. If you are subject to the fee, keep it in mind when you are estimating the ongoing expenses of investing in the fund and when comparing the expenses of this fund with other funds.
As a Fund shareholder, you incur two types of costs. There are transaction costs, which generally include sales charges on purchases and may include redemption fees or exchange fees. There are also ongoing costs, which generally include investment advisory fees, distribution and service (Rule 12b-1) fees and other fund expenses. The information on this page is intended to help you understand the ongoing costs of investing in the fund and to compare these costs with the ongoing costs of investing in other mutual funds.
Analyzing your fund’s expenses by share class
To illustrate these ongoing costs, we have provided an example and calculated the expenses paid by investors in each share class during the period. The information in the following table is based on an initial investment of $1,000, which is invested at the beginning of the period and held for the entire period. Expense information is calculated two ways and each method provides you with different information. The amount listed in the “Actual” column is calculated using the fund’s actual operating expenses and total return for the period. The amount listed in the “Hypothetical” column for each share class assumes that the return each year is 5% before expenses and is calculated based on the fund’s actual operating expenses. You should not use the hypothetical account values and expenses to estimate either your actual account balance at the end of the period or the expenses you paid during this period.
Compare with other funds
Since all mutual funds are required to include the same hypothetical calculations about expenses in shareholder reports, you can use this information to compare the ongoing cost of investing in the fund with other funds. To do so, compare the 5% hypothetical example with the 5% hypothetical examples that appear in the shareholder reports of other funds. As you compare hypothetical examples of other funds, it is important to note that hypothetical examples are meant to highlight the ongoing costs of investing in a fund and do not reflect any transaction costs, such as sales charges, redemption fees or exchange fees.
| | | | | | | | | | | | | | |
| 10/01/09 – 03/31/10 | | | | | | | | | | |
| | | | |
| | | Account value at the
beginning of the period ($) | | Account value at the
end of the period ($) | | Expenses paid
during the period ($) | | Fund’s annualized
expense ratio (%) |
| | | Actual | | Hypothetical | | Actual | | Hypothetical | | Actual | | Hypothetical | | Actual |
Class A | | 1,000.00 | | 1,000.00 | | 1,024.10 | | 1,020.94 | | 4.04 | | 4.03 | | 0.80 |
Class C | | 1,000.00 | | 1,000.00 | | 1,020.30 | | 1,017.20 | | 7.81 | | 7.80 | | 1.55 |
Class Z | | 1,000.00 | | 1,000.00 | | 1,024.00 | | 1,022.19 | | 2.78 | | 2.77 | | 0.55 |
Expenses paid during the period are equal to the annualized expense ratio for the share class, multiplied by the average account value over the period, then multiplied by the number of days in the fund’s most recent fiscal half-year and divided by 365.
Had the investment advisor and/or any of its affiliates not waived fees or reimbursed a portion of expenses, account value at the end of the period would have been reduced.
It is important to note that the expense amounts shown in the table are meant to highlight only ongoing costs of investing in the fund and do not reflect any transaction costs, such as sales charges, redemption fees or exchange fees. Therefore, the hypothetical examples provided may not help you determine the relative total costs of owning shares of different funds. If these transaction costs were included, your costs would have been higher.
5
Portfolio Managers’ Report – Columbia Short-Intermediate Bond Fund
Performance data quoted represents past performance and current performance may be lower or higher. Past performance is no guarantee of future results. The investment return and principal value will fluctuate so that shares, when redeemed, may be worth more or less than the original cost. Please visit www.columbiafunds.com for daily and most recent month-end performance updates.
| | |
| Net asset value per share |
| |
as of 03/31/10 ($) | | |
Class A | | 7.29 |
Class C | | 7.30 |
Class Z | | 7.29 |
| | |
| Distributions declared per share |
| |
04/01/09 – 03/31/10 ($) | | |
Class A | | 0.25 |
Class C | | 0.19 |
Class Z | | 0.26 |
| | |
| 30-day SEC Yields |
| |
as of 03/31/10 (%) | | |
Class A | | 2.83 |
Class C | | 2.08 |
Class Z | | 3.08 |
The 30-day SEC yields reflect the fund’s earning power, net of expenses, expressed as an annualized percentage of the public offering price per share at the end of the period. Had the investment advisor and/or its affiliates not waived fees or reimbursed a portion of expenses, the 30-day SEC yields would have been lower.
For the 12-month period that ended March 31, 2010, the fund’s Class A shares returned 9.98% without sales charge. The fund’s return exceeded the 6.92% return of its benchmark, the Barclays Capital Intermediate Government/Credit Bond Index, for the same period. An overweight in sectors that trade on their yield advantage to Treasuries aided performance relative to the index. However, the fund’s return fell short of the 12.19% average return of its peer group, the Lipper Short-Intermediate Investment Grade Debt Funds Classification. We believe that many competing funds held higher-risk securities, which performed very well during the period, while the fund maintained a higher level of portfolio quality.
Sector positioning aided relative performance
Exposure to non-Treasury investment-grade sectors aided performance relative to the benchmark, as investors grew more comfortable with risk. In addition, the portfolio overweighted certain securities that outperformed during the period. We also held securities that were not in the benchmark, such as commercial mortgage-backed securities (CMBS), asset-backed securities (ABS) and mortgage-backed securities (MBS).
An overweight position in CMBS made the largest contribution to performance, as that segment of the market performed well. The fund’s corporate holdings also benefited performance, especially an overweight in hybrid issues, which have both a fixed-income and equity component. Starting as fixed-rate securities, they can convert to floating rate issues in the future if certain criteria are met. Hybrids were slightly lower-rated securities of corporations that we like as issuers — mostly financial firms. The fund did not hold a large amount of hybrids, but enough to give performance a bit of a boost. In addition, the fund held a small amount of high-yield issues early in the period, which also aided results. We used BBB-rated securities opportunistically. And in an unusual move for this fund, we increased its weight in BBB issues to a benchmark weight, moving down the quality scale to take advantage of a rebound in the sector.
Higher-quality, longer-duration positioning detracted from performance
We believe that the fund’s higher-quality positioning hampered performance relative to its peers as lower-quality securities rebounded sharply during the period. Funds with shorter duration also performed well, and the fund’s longer duration detracted from performance.
6
Portfolio Managers’ Report (continued) – Columbia Short-Intermediate Bond Fund
| | |
| Portfolio structure |
as of 03/31/10 (%) | | |
Corporate Fixed-Income Bonds & Notes | | 40.7 |
Commercial Mortgage-Backed Securities | | 22.1 |
Government & Agency Obligations | | 19.4 |
Collateralized Mortgage Obligation | | 6.2 |
Asset-Backed Securities | | 2.2 |
Mortgage-Backed Securities | | 0.4 |
Municipal Bonds | | 0.1 |
Short-Term Obligation | | 8.1 |
Other Assets & Liabilities, Net | | 0.8 |
| | |
| Maturity Breakdown |
as of 03/31/10 (%) | | |
0-1 year | | 7.6 |
1-2 years | | 10.8 |
2-3 years | | 18.1 |
3-4 years | | 11.0 |
4-5 years | | 4.4 |
5-6 years | | 2.6 |
6-7 years | | 10.6 |
7-8 years | | 11.4 |
8-9 years | | 5.8 |
9-10 years | | 7.5 |
10-20 years | | 0.5 |
20-30 years | | 1.3 |
Cash & Equivalents | | 8.4 |
| | |
| Quality Breakdown | | |
as of 03/31/10 (%) | | |
Treasury | | 17.2 |
Agency | | 7.3 |
AAA | | 31.2 |
AA | | 10.1 |
A | | 18.1 |
BBB | | 7.5 |
B | | 0.2 |
Cash & Equivalents | | 8.4 |
Ratings shown in the quality breakdown represent the rating assigned to a particular bond by one of the following nationally-recognized rating agencies: Standard and Poor’s, Moody’s Investors Service, Inc. or Fitch Ratings Ltd. Ratings are relative and subjective and are not absolute standards of quality.
The fund’s credit quality does not remove market risk. The fund is actively managed and the composition of its portfolio will change over time. Information provided is calculated as a percentage of net assets.
Looking ahead
The steepness of the yield curve (the difference between interest rates at the short and long end of the maturity spectrum) reached a record in February, reflecting the Federal Reserve Board’s (the Fed’s) reluctance to raise short-term rates and expectations that the economy would recover. We expect that the economy will strengthen, the Fed will hike rates in the future, and therefore, the yield curve will be more likely to flatten going forward. As a result, we have begun to position the fund for a flattening yield curve by underweighting bonds with two- to four-year maturities, adding to the fund’s cash position and investing more in bonds with maturities of 10 years or longer. We are also searching for corporate floating-rate notes and very short-term CMBS to enhance the fund’s yield. Looking at security selection going forward, we believe that non-Treasury sectors have done very well and now are priced fairly. As a result, it is a time to be more cautious. In this environment, the fund’s quality focus should position it well. We believe that we have the potential to add value using all of the tools available to us: research, security selection, sector allocation and yield curve positioning.
Portfolio characteristics and holdings are subject to change periodically and may not be representative of current characteristics and holdings. The outlook for the fund may differ from that presented for other Columbia Funds.
Investing in fixed-income securities may involve certain risks, including the credit quality of individual issuers, possible prepayments, market or economic developments and yields and share price fluctuations due to changes in interest rates. When interest rates go up, bond prices typically drop, and vice versa.
7
Investment Portfolio – Columbia Short-Intermediate Bond Fund
March 31, 2010
Corporate Fixed-Income Bonds & Notes – 40.7%
| | | | |
| | | Par ($) | | Value ($) |
| Basic Materials – 1.6% | | | | |
| Chemicals – 0.8% | | | | |
Dow Chemical Co. | | | | |
8.550% 05/15/19 | | 1,050,000 | | 1,270,228 |
EI Du Pont de Nemours & Co. | | | | |
6.000% 07/15/18 | | 1,460,000 | | 1,622,584 |
| | | | |
Chemicals Total | | 2,892,812 |
| | |
| Iron/Steel – 0.8% | | | | |
ArcelorMittal | | | | |
9.850% 06/01/19 | | 1,050,000 | | 1,334,547 |
Nucor Corp. | | | | |
5.850% 06/01/18 | | 1,290,000 | | 1,400,335 |
| | | | |
Iron/Steel Total | | 2,734,882 |
| | | | |
Basic Materials Total | | 5,627,694 |
| | | | |
| Communications – 4.1% | | | | |
| Media – 2.4% | | | | |
Comcast Cable Holdings LLC | | | | |
9.800% 02/01/12 | | 3,595,000 | | 4,078,333 |
Historic TW, Inc. | | | | |
9.150% 02/01/23 | | 1,330,000 | | 1,727,038 |
Time Warner Cable, Inc. | | | | |
3.500% 02/01/15 | | 530,000 | | 530,449 |
6.550% 05/01/37 | | 2,145,000 | | 2,192,420 |
| | | | |
Media Total | | 8,528,240 |
|
| Telecommunication Services – 1.7% |
AT&T, Inc. | | | | |
5.500% 02/01/18 | | 1,750,000 | | 1,857,886 |
Cincinnati Bell, Inc. | | | | |
8.375% 01/15/14 | | 500,000 | | 514,375 |
Telefonica Emisiones SAU | | | | |
6.421% 06/20/16 | | 1,125,000 | | 1,249,786 |
Telefonos de Mexico SAB de CV | | | | |
5.500% 01/27/15 | | 2,150,000 | | 2,298,395 |
| | | | |
Telecommunication Services Total | | 5,920,442 |
| | | | |
Communications Total | | 14,448,682 |
| | | | |
| Consumer Cyclical – 0.7% | | | | |
| Retail – 0.7% | | | | |
CVS Caremark Corp. | | | | |
6.125% 08/15/16 | | 1,500,000 | | 1,653,924 |
CVS Lease Pass Through Trust | | | | |
8.353% 07/10/31 (a) | | 593,404 | | 689,143 |
| | | | |
Retail Total | | 2,343,067 |
| | | | |
Consumer Cyclical Total | | 2,343,067 |
| | | | |
| | | Par ($) | | Value ($) |
| Consumer Non-Cyclical – 3.5% | | | | |
| Beverages – 1.2% | | | | |
Diageo Capital PLC | | | | |
4.375% 05/03/10 | | 4,000,000 | | 4,012,540 |
| | | | |
Beverages Total | | 4,012,540 |
| | |
| Food – 1.6% | | | | |
HJ Heinz Co. | | | | |
5.350% 07/15/13 | | 2,045,000 | | 2,217,502 |
Kraft Foods, Inc. | | | | |
4.125% 02/09/16 | | 2,105,000 | | 2,133,011 |
SYSCO Corp. | | | | |
4.200% 02/12/13 | | 1,175,000 | | 1,245,298 |
| | | | |
Food Total | | 5,595,811 |
| | |
| Pharmaceuticals – 0.7% | | | | |
Novartis Securities Investment Ltd. | | | | |
5.125% 02/10/19 | | 2,275,000 | | 2,411,229 |
| | | | |
Pharmaceuticals Total | | 2,411,229 |
| | | | |
Consumer Non-Cyclical Total | | 12,019,580 |
| | | | |
| Energy – 3.2% | | | | |
| Oil & Gas – 2.0% | | | | |
Apache Corp. | | | | |
5.250% 04/15/13 | | 1,675,000 | | 1,822,509 |
ConocoPhillips | | | | |
4.400% 05/15/13 | | 1,290,000 | | 1,369,219 |
Hess Corp. | | | | |
8.125% 02/15/19 | | 950,000 | | 1,158,002 |
Marathon Oil Corp. | | | | |
7.500% 02/15/19 | | 380,000 | | 446,350 |
Petrobras International Finance Co. | | | | |
5.750% 01/20/20 | | 2,225,000 | | 2,279,492 |
| | | | |
Oil & Gas Total | | 7,075,572 |
| | |
| Oil & Gas Services – 1.2% | | | | |
Baker Hughes, Inc. | | | | |
7.500% 11/15/18 | | 1,725,000 | | 2,062,258 |
Smith International, Inc. | | | | |
9.750% 03/15/19 | | 1,470,000 | | 1,977,308 |
| | | | |
Oil & Gas Services Total | | 4,039,566 |
| | | | |
Energy Total | | 11,115,138 |
| | | | |
| Financials – 24.1% | | | | |
| Banks – 17.7% | | | | |
American Express Credit Corp. | | | | |
5.875% 05/02/13 | | 940,000 | | 1,018,236 |
See Accompanying Notes to Financial Statements.
8
Columbia Short-Intermediate Bond Fund
March 31, 2010
Corporate Fixed-Income Bonds & Notes (continued)
| | | | |
| | | Par ($) | | Value ($) |
| Financials (continued) | | | | |
| Banks (continued) | | | | |
Barclays Bank PLC | | | | |
5.125% 01/08/20 | | 3,000,000 | | 2,958,204 |
BNP Paribas/BNP Paribas US Medium-Term Note Program LLC | | | | |
2.125% 12/21/12 | | 2,155,000 | | 2,164,025 |
Citibank NA | | | | |
1.625% 03/30/11 (b) | | 5,550,000 | | 5,606,416 |
Citigroup, Inc. | | | | |
6.375% 08/12/14 | | 3,650,000 | | 3,899,306 |
Comerica Bank | | | | |
5.200% 08/22/17 | | 1,305,000 | | 1,265,928 |
Credit Suisse/New York NY | | | | |
5.000% 05/15/13 | | 1,225,000 | | 1,316,602 |
6.000% 02/15/18 | | 1,520,000 | | 1,609,347 |
Deutsche Bank AG London | | | | |
4.875% 05/20/13 | | 2,730,000 | | 2,925,536 |
6.000% 09/01/17 | | 1,500,000 | | 1,644,668 |
Goldman Sachs Group, Inc. | | | | |
3.250% 06/15/12 | | 2,505,000 | | 2,611,953 |
6.000% 05/01/14 | | 320,000 | | 350,395 |
6.150% 04/01/18 | | 1,855,000 | | 1,962,738 |
JPMorgan Chase & Co. | | | | |
5.150% 10/01/15 | | 4,030,000 | | 4,252,980 |
6.000% 01/15/18 | | 1,395,000 | | 1,514,554 |
JPMorgan Chase Capital XVIII | | | | |
6.950% 08/17/36 | | 380,000 | | 372,444 |
JPMorgan Chase Capital XX | | | | |
6.550% 09/29/36 | | 840,000 | | 788,273 |
JPMorgan Chase Capital XXII | | | | |
6.450% 02/02/37 | | 290,000 | | 269,238 |
Keycorp | | | | |
6.500% 05/14/13 | | 1,045,000 | | 1,115,965 |
Kreditanstalt Fuer Weideraufbau | | | | |
1.875% 01/14/13 | | 1,705,000 | | 1,711,232 |
Merrill Lynch & Co., Inc. | | | | |
6.875% 04/25/18 (c) | | 1,075,000 | | 1,158,494 |
Morgan Stanley | | | | |
5.550% 04/27/17 | | 1,760,000 | | 1,800,021 |
5.950% 12/28/17 | | 1,080,000 | | 1,109,560 |
7.300% 05/13/19 | | 325,000 | | 359,063 |
National City Corp. | | | | |
4.900% 01/15/15 | | 1,260,000 | | 1,316,147 |
PNC Funding Corp. | | | | |
5.125% 02/08/20 | | 870,000 | | 876,388 |
Regions Bank | | | | |
3.250% 12/09/11 (b) | | 3,785,000 | | 3,925,791 |
Republic New York Corp. | | | | |
9.500% 04/15/14 | | 2,700,000 | | 3,176,885 |
| | | | |
| | | Par ($) | | Value ($) |
Sovereign Bank | | | | |
2.750% 01/17/12 (b) | | 1,945,000 | | 2,004,935 |
Wachovia Corp. | | | | |
5.500% 05/01/13 | | 2,940,000 | | 3,175,103 |
5.750% 02/01/18 | | 1,760,000 | | 1,871,008 |
Westpac Banking Corp. | | | | |
4.875% 11/19/19 | | 1,525,000 | | 1,514,750 |
| | | | |
Banks Total | | 61,646,185 |
| |
| Diversified Financial Services – 4.4% | | |
BP Capital Markets PLC | | | | |
1.550% 08/11/11 | | 2,920,000 | | 2,948,739 |
Capital One Financial Corp. | | | | |
6.750% 09/15/17 | | 1,630,000 | | 1,801,171 |
General Electric Capital Corp. | | | | |
5.500% 01/08/20 | | 3,825,000 | | 3,902,514 |
John Deere Capital Corp., MTN | | | | |
5.650% 07/25/11 | | 3,080,000 | | 3,264,378 |
Lehman Brothers Holdings, Inc. | | | | |
4.250% 01/27/10 (d)(e) | | 2,960,000 | | 699,300 |
5.625% 01/24/13 (d)(e) | | 1,750,000 | | 413,437 |
PACCAR Financial Corp. | | | | |
0.698% 04/05/13 (f)(g) | | 2,360,000 | | 2,353,007 |
| | | | |
Diversified Financial Services Total | | 15,382,546 |
| | |
| Insurance – 2.0% | | | | |
Berkshire Hathaway Finance Corp. | | | | |
0.376% 01/13/12 (04/13/10) (f)(h) | | 1,440,000 | | 1,440,369 |
CNA Financial Corp. | | | | |
7.350% 11/15/19 | | 935,000 | | 977,196 |
MetLife, Inc. | | | | |
7.717% 02/15/19 | | 1,660,000 | | 1,938,319 |
New York Life Global Funding | | | | |
4.650% 05/09/13 (a) | | 2,000,000 | | 2,141,156 |
Prudential Financial, Inc. | | | | |
7.375% 06/15/19 | | 480,000 | | 550,458 |
| | | | |
Insurance Total | | 7,047,498 |
| | | | |
Financials Total | | 84,076,229 |
| | | | |
| Industrials – 0.7% | | | | |
| Aerospace & Defense – 0.4% | | | | |
McDonnell Douglas Corp. | | | | |
9.750% 04/01/12 | | 1,190,000 | | 1,372,194 |
| | | | |
Aerospace & Defense Total | | 1,372,194 |
See Accompanying Notes to Financial Statements.
9
Columbia Short-Intermediate Bond Fund
March 31, 2010
Corporate Fixed-Income Bonds & Notes (continued)
| | | | |
| | | Par ($) | | Value ($) |
| Industrials (continued) | | | | |
| Transportation – 0.3% | | | | |
Norfolk Southern Corp. | | | | |
5.750% 04/01/18 | | 1,105,000 | | 1,186,071 |
| | | | |
Transportation Total | | 1,186,071 |
| | | | |
Industrials Total | | 2,558,265 |
| | | | |
| Utilities – 2.8% | | | | |
| Electric – 2.8% | | | | |
Columbus Southern Power Co. | | | | |
0.657% 03/16/12 (06/16/10) (f)(h) | | 1,895,000 | | 1,897,048 |
Dominion Resources, Inc. | | | | |
5.200% 08/15/19 | | 335,000 | | 342,880 |
Pacific Gas & Electric Co. | | | | |
5.625% 11/30/17 | | 1,910,000 | | 2,056,230 |
Southern Co. | | | | |
5.300% 01/15/12 | | 2,050,000 | | 2,179,410 |
Virginia Electric Power | | | | |
5.100% 11/30/12 | | 3,140,000 | | 3,417,642 |
| | | | |
Electric Total | | 9,893,210 |
| | | | |
Utilities Total | | 9,893,210 |
| | | | |
Total Corporate Fixed-Income Bonds & Notes
(cost of $137,529,637) | | 142,081,865 |
|
Commercial Mortgage-Backed Securities – 22.1% |
Bank of America Commercial Mortgage, Inc. | | | | |
4.760% 11/10/39 | | 4,350,000 | | 4,439,744 |
Bear Stearns Commercial Mortgage Securities | | | | |
6.480% 02/15/35 | | 457,766 | | 471,396 |
Commercial Mortgage Asset Trust | | | | |
7.230% 01/17/32 (f) | | 2,000,000 | | 2,209,558 |
7.800% 11/17/32 (04/11/10) (f)(h) | | 3,556,000 | | 3,965,095 |
Credit Suisse First Boston Mortgage Securities Corp. | | | | |
4.801% 03/15/36 | | 3,490,000 | | 3,636,951 |
Greenwich Capital Commercial Funding Corp. | | | | |
5.317% 06/10/36 (f) | | 4,590,000 | | 4,826,097 |
5.886% 07/10/38 (04/01/10) (f)(h) | | 2,600,000 | | 2,650,482 |
GS Mortgage Securities Corp. II | | | | |
4.751% 07/10/39 | | 3,575,000 | | 3,609,444 |
| | | | |
| | | Par ($) | | Value ($) |
JPMorgan Chase Commercial Mortgage Securities Corp. | | | | |
4.985% 01/12/37 | | 1,765,000 | | 1,850,323 |
5.440% 06/12/47 | | 730,000 | | 713,498 |
5.790% 06/12/43 (04/01/10) (f)(h) | | 2,501,000 | | 2,688,183 |
LB-UBS Commercial Mortgage Trust | | | | |
4.166% 05/15/32 | | 3,525,000 | | 3,603,390 |
6.653% 11/15/27 | | 3,955,506 | | 4,095,018 |
Morgan Stanley Dean Witter Capital I | | | | |
4.740% 11/13/36 | | 3,085,000 | | 3,203,063 |
4.920% 03/12/35 | | 750,000 | | 780,245 |
5.080% 09/15/37 | | 5,550,000 | | 5,819,470 |
6.390% 07/15/33 | | 854,991 | | 891,116 |
Nomura Asset Securities Corp. | | | | |
7.166% 03/15/30 (04/01/10) (f)(h) | | 4,025,000 | | 4,453,315 |
Salomon Brothers Mortgage Securities VII | | | | |
4.865% 03/18/36 | | 3,320,000 | | 3,463,156 |
Wachovia Bank Commercial Mortgage Trust | | | | |
5.001% 07/15/41 | | 1,308,520 | | 1,323,299 |
5.012% 12/15/35 (f) | | 1,655,000 | | 1,737,820 |
5.037% 03/15/42 | | 999,997 | | 1,042,258 |
5.087% 07/15/42 (04/01/10) (f)(h) | | 4,267,000 | | 4,339,254 |
5.110% 07/15/42 (04/01/10) (f)(h) | | 6,150,000 | | 6,362,189 |
5.230% 07/15/41 (04/01/10) (f)(h) | | 4,775,000 | | 4,878,830 |
| | | | |
Total Commercial Mortgage-Backed Securities
(cost of $75,219,181) | | 77,053,194 |
|
Government & Agency Obligations – 19.4% |
| U.S. Government Obligations – 19.4% |
Israel Government AID Bond | | | | |
(i) 05/15/18 | | 8,355,000 | | 5,949,754 |
Resolution Funding Corp. Interest STRIPS | | | | |
(i) 10/15/17 | | 3,209,000 | | 2,380,183 |
U.S. Treasury Inflation Indexed Note | | | | |
1.625% 01/15/18 | | 4,126,498 | | 4,221,601 |
U.S. Treasury Notes | | | | |
3.125% 01/31/17 | | 33,250,000 | | 33,013,626 |
3.375% 11/15/19 | | 9,720,000 | | 9,379,042 |
4.500% 05/15/17 | | 9,805,000 | | 10,586,341 |
See Accompanying Notes to Financial Statements.
10
Columbia Short-Intermediate Bond Fund
March 31, 2010
Government & Agency Obligations (continued)
| | | | |
| | | Par ($) | | Value ($) |
| U.S. Government Obligations (continued) |
U.S. Treasury STRIPS Coupon | | | | |
(i) 11/15/17 | | 3,020,000 | | 2,294,526 |
| | | | |
U.S. Government Obligations Total | | 67,825,073 |
| | | | |
Total Government & Agency Obligations
(cost of $68,844,772) | | 67,825,073 |
|
Collateralized Mortgage Obligations – 6.2% |
| Agency – 6.2% | | | | |
Federal Home Loan Mortgage Corp. | | | | |
4.375% 04/15/15 | | 1,150,189 | | 1,179,276 |
Government National Mortgage Association | | | | |
4.478% 08/16/32 | | 2,925,000 | | 3,049,072 |
4.667% 09/16/25 | | 2,800,000 | | 2,953,656 |
5.183% 05/16/28 (04/01/10) (f)(h) | | 10,355,000 | | 11,098,776 |
5.250% 07/16/29 (04/01/10) (f)(h) | | 3,064,573 | | 3,214,639 |
| | | | |
Agency Total | | 21,495,419 |
| | | | |
Total Collateralized Mortgage Obligations
(cost of $20,303,958) | | 21,495,419 |
|
Asset-Backed Securities – 2.2% |
Capital One Multi-Asset Execution Trust | | | | |
1.330% 04/15/13 (04/15/10) (f)(h) | | 2,215,000 | | 2,219,557 |
4.700% 06/15/15 | | 2,665,000 | | 2,839,234 |
USAA Auto Owner Trust | | | | |
4.900% 02/15/12 | | 85,146 | | 85,916 |
5.070% 06/15/13 | | 2,385,000 | | 2,481,338 |
| | | | |
Total Asset-Backed Securities
(cost of $7,316,577) | | 7,626,045 |
|
Mortgage-Backed Securities – 0.4% |
Federal National Mortgage Association | | | | |
4.680% 12/01/12 | | 1,209,549 | | 1,286,011 |
4.790% 11/01/12 | | 106,586 | | 111,614 |
Government National Mortgage Association | | | | |
8.000% 05/15/23 | | 1,243 | | 1,429 |
8.500% 01/15/17 | | 8,608 | | 9,637 |
8.500% 04/15/17 | | 5,607 | | 6,153 |
| | | | |
Total Mortgage-Backed Securities
(cost of $1,383,274) | | 1,414,844 |
Municipal Bond – 0.1%
| | | | |
| | | Par ($) | | Value ($) |
| California – 0.1% | | | | |
CA State | | | | |
Series 2009, | | | | |
5.250% 04/01/14 | | 305,000 | | 316,169 |
| | | | |
California Total | | 316,169 |
| | | | |
Total Municipal Bond
(cost of $306,340) | | 316,169 |
|
Short-Term Obligation – 8.1% |
Repurchase agreement with Fixed Income Clearing Corp., dated 03/31/10, due 04/01/10 at 0.000%, collateralized by a U.S. Government Agency obligation maturing 09/05/13, market value $28,801,825 (repurchase proceeds $28,233,000) | | 28,233,000 | | 28,233,000 |
| | | | |
Total Short-Term Obligation
(cost of $28,233,000) | | 28,233,000 |
| | | | |
Total Investments – 99.2%
(cost of $339,136,739)(j) | | 346,045,609 |
| | | | |
Other Assets & Liabilities, Net – 0.8% | | 2,725,307 |
| | | | |
Net Assets – 100.0% | | 348,770,916 |
Notes to Investment Portfolio:
| (a) | Security exempt from registration pursuant to Rule 144A under the Securities Act of 1933. These securities may be resold in transactions exempt from registration, normally to qualified institutional buyers. At March 31, 2010, these securities, which are not illiquid, amounted to $2,830,299, which represents 0.8% of net assets. |
| (b) | Security is guaranteed by the Federal Deposit Insurance Corporation. |
| (c) | Investments in affiliates during the year ended March 31, 2010: |
| | | | | | | | | | | | | | | |
Affiliate | | Value,
beginning
of period | | Purchases | | Sales
Proceeds | | Interest
Income | | Value, end
of period |
Merrill Lynch & Co., Inc.,
6.875% 04/25/18 | | $ | 840,750 | | $ | — | | $ | — | | $ | 73,906 | | $ | 1,158,494 |
| (d) | Represents fair value as determined in good faith under procedures approved by the Board of Trustees. At March 31, 2010, the value of these securities amounted to $1,112,737, which represents 0.3% of net assets. |
| (e) | The issuer has filed for bankruptcy protection under Chapter 11. Income is not being accrued. At March 31, 2010, the value of these securities amounted to $1,112,737, which represents 0.3% of net assets. |
| (f) | The interest rate shown on floating rate or variable rate securities reflects the rate at March 31, 2010. |
| (g) | Security purchased on a delayed delivery basis. |
| (h) | Parenthetical date represents the next interest rate reset date for the security. |
| (j) | Cost for federal income tax purposes is $339,136,739. |
See Accompanying Notes to Financial Statements.
11
Columbia Short-Intermediate Bond Fund
March 31, 2010
The following table summarizes the inputs used, as of March 31, 2010, in valuing the Fund’s assets:
| | | | | | | | | | | | |
Description | | Quoted Prices (Level 1) | | Other Significant Observable Inputs (Level 2) | | Significant Unobservable Inputs (Level 3) | | Total |
Total Corporate Fixed-Income Bonds & Notes | | $ | — | | $ | 142,081,865 | | $ | — | | $ | 142,081,865 |
| | | | | | | | | | | | |
Total Commercial Mortgage-Backed Securities | | | — | | | 77,053,194 | | | — | | | 77,053,194 |
| | | | | | | | | | | | |
Total Government & Agency Obligations | | | 59,495,136 | | | 8,329,937 | | | — | | | 67,825,073 |
| | | | | | | | | | | | |
Total Collateralized Mortgage Obligations | | | — | | | 21,495,419 | | | — | | | 21,495,419 |
| | | | | | | | | | | | |
Total Asset-Backed Securities | | | — | | | 7,626,045 | | | — | | | 7,626,045 |
| | | | | | | | | | | | |
Total Mortgage-Backed Securities | | | — | | | 1,414,844 | | | — | | | 1,414,844 |
| | | | | | | | | | | | |
Total Municipal Bond | | | — | | | 316,169 | | | — | | | 316,169 |
| | | | | | | | | | | | |
Total Short-Term Obligation | | | — | | | 28,233,000 | | | — | | | 28,233,000 |
| | | | | | | | | | | | |
Total Investments | | $ | 59,495,136 | | $ | 286,550,473 | | $ | — | | $ | 346,045,609 |
| | | | | | | | | | | | |
For more information on valuation inputs, and their aggregation into the levels used in the table above, please refer to the Security Valuation section in the accompanying Notes to Financial Statements.
At March 31, 2010, the asset allocation of the Fund is as follows:
| | |
Asset Allocation (Unaudited) | | % of Net Assets |
Corporate Fixed-Income Bonds & Notes | | 40.7 |
Commercial Mortgage-Backed Securities | | 22.1 |
Government & Agency Obligations | | 19.4 |
Collateralized Mortgage Obligations | | 6.2 |
Asset-Backed Securities | | 2.2 |
Mortgage-Backed Securities | | 0.4 |
Municipal Bond | | 0.1 |
| | |
| | 91.1 |
Short-Term Obligation | | 8.1 |
Other Assets & Liabilities, Net | | 0.8 |
| | |
| | 100.0 |
| | |
| | |
Acronym | | Name |
| AID | | U.S. Agency for Intermediate Development |
| MTN | | Medium-Term Note |
| STRIPS | | Separate Trading of Registered Interest and Principal of Securities |
See Accompanying Notes to Financial Statements.
12
Statement of Assets and Liabilities – Columbia Short-Intermediate Bond Fund
March 31, 2010
| | | | | |
| | | | | ($) | |
| Assets | | Unaffiliated investments, at identified cost | | 338,138,585 | |
| | Affiliated investments, at identified cost | | 998,154 | |
| | | | | |
| | Total investments, at identified cost | | 339,136,739 | |
| | |
| | Unaffiliated investments, at value | | 344,887,115 | |
| | Affiliated investments, at value | | 1,158,494 | |
| | | | | |
| | Total investments, at value | | 346,045,609 | |
| | Cash | | 140 | |
| | Receivable for: | | | |
| | Investments sold | | 9,983,622 | |
| | Fund shares sold | | 415,666 | |
| | Interest | | 2,729,680 | |
| | Expense reimbursement due from investment advisor | | 8,543 | |
| | Trustees’ deferred compensation plan | | 10,940 | |
| | Prepaid expenses | | 23,421 | |
| | | |
| | Total Assets | | 359,217,621 | |
| | |
| Liabilities | | Payable for: | | | |
| | Investments purchased | | 6,566,073 | |
| | Investments purchased on a delayed delivery basis | | 2,360,000 | |
| | Fund shares repurchased | | 234,884 | |
| | Distributions | | 1,055,570 | |
| | Investment advisory fee | | 106,552 | |
| | Administration fee | | 38,078 | |
| | Transfer agent fee | | 11,737 | |
| | Trustees’ fees | | 1,100 | |
| | Pricing and bookkeeping fees | | 9,661 | |
| | Audit fee | | 29,350 | |
| | Custody fee | | 1,771 | |
| | Distribution and service fees | | 1,850 | |
| | Chief compliance officer expenses | | 201 | |
| | Trustees’ deferred compensation plan | | 10,940 | |
| | Other liabilities | | 18,938 | |
| | | |
| | Total Liabilities | | 10,446,705 | |
| |
| | | |
| | Net Assets | | 348,770,916 | |
| | |
| Net Assets Consist of | | Paid-in capital | | 345,699,466 | |
| | Undistributed net investment income | | 41,578 | |
| | Accumulated net realized loss | | (3,878,998 | ) |
| | Net unrealized appreciation (depreciation) on investments | | 6,908,870 | |
| | | | | |
| | Net Assets | | 348,770,916 | |
See Accompanying Notes to Financial Statements.
13
Statement of Assets and Liabilities (continued) – Columbia Short-Intermediate Bond Fund
March 31, 2010
| | | | | | |
| | | | | | |
| Class A | | Net assets | | $ | 2,884,732 | |
| | Shares outstanding | | | 395,643 | |
| | Net asset value per share | | $ | 7.29 | (a) |
| | Maximum sales charge | | | 3.25 | % |
| | Maximum offering price per share ($7.29/0.9675) | | $ | 7.53 | (b) |
| | |
| Class C | | Net assets | | $ | 1,504,224 | |
| | Shares outstanding | | | 206,148 | |
| | Net asset value and offering price per share | | $ | 7.30 | (a) |
| | |
| Class Z | | Net assets | | $ | 344,381,960 | |
| | Shares outstanding | | | 47,227,509 | |
| | Net asset value and offering price per share | | $ | 7.29 | |
| (a) | Redemption price per share is equal to net asset value less any applicable contingent deferred sales charge. |
| (b) | On sales of $100,000 or more the offering price is reduced. |
See Accompanying Notes to Financial Statements.
14
Statement of Operations – Columbia Short-Intermediate Bond Fund
For the Year Ended March 31, 2010
| | | | | |
| | | | | ($) | |
| Investment Income | | Interest | | 15,999,272 | |
| | Interest from affiliates | | 73,906 | |
| | Securities lending | | 7,570 | |
| | | |
| | Total Investment Income | | 16,080,748 | |
| | |
| Expenses | | Investment advisory fee | | 1,308,299 | |
| | Administration fee | | 466,644 | |
| | Distribution fee: | | | |
| | Class C | | 9,108 | |
| | Service fee: | | | |
| | Class A | | 5,534 | |
| | Class C | | 3,039 | |
| | Transfer agent fee | | 208,041 | |
| | Pricing and bookkeeping fees | | 105,773 | |
| | Trustees’ fees | | 33,190 | |
| | Custody fee | | 5,402 | |
| | Chief compliance officer expenses | | 765 | |
| | Other expenses | | 178,757 | |
| | | |
| | Total Expenses | | 2,324,552 | |
| | |
| | Fees waived or expenses reimbursed by investment advisor and/or administrator | | (55,450 | ) |
| | Expense reductions | | (14 | ) |
| | �� | |
| | Net Expenses | | 2,269,088 | |
| |
| | | |
| | Net Investment Income | | 13,811,660 | |
| | |
| Net Realized and Unrealized Gain (Loss) on Investments | | Net realized gain on investments | | 2,679,728 | |
| | Net change in unrealized appreciation (depreciation) on investments | | 20,167,659 | |
| | | |
| | Net Gain | | 22,847,387 | |
| |
| | | |
| | Net Increase Resulting from Operations | | 36,659,047 | |
See Accompanying Notes to Financial Statements.
15
Statement of Changes in Net Assets – Columbia Short-Intermediate Bond Fund
| | | | | | | | |
| | | | | Year Ended March 31, | |
| Increase (Decrease) in Net Assets | | | | 2010 ($) | | | 2009 ($) | |
| Operations | | Net investment income | | 13,811,660 | | | 17,074,371 | |
| | Net realized gain (loss) on investments and futures contracts | | 2,679,728 | | | (5,608,398 | ) |
| | Net change in unrealized appreciation (depreciation) on investments | | 20,167,659 | | | (15,596,385 | ) |
| | | |
| | Net increase (decrease) resulting from operations | | 36,659,047 | | | (4,130,412 | ) |
| | | |
| Distributions to Shareholders | | From net investment income: | | | | | | |
| | Class A | | (75,468 | ) | | (7,256 | ) |
| | Class C | | (32,584 | ) | | (2,998 | ) |
| | Class Z | | (13,705,855 | ) | | (17,099,909 | ) |
| | From net realized gains: | | | | | | |
| | Class A | | — | | | (158 | ) |
| | Class C | | — | | | (54 | ) |
| | Class Z | | — | | | (2,310,329 | ) |
| | | |
| | Total distributions to shareholders | | (13,813,907 | ) | | (19,420,704 | ) |
| | | |
| | Net Capital Stock Transactions | | (44,103,118 | ) | | (52,067,684 | ) |
| | Increase from regulatory settlements | | 2,475 | | | — | |
| | | |
| | Total decrease in net assets | | (21,255,503 | ) | | (75,618,800 | ) |
| | | |
| Net Assets | | Beginning of period | | 370,026,419 | | | 445,645,219 | |
| | End of period | | 348,770,916 | | | 370,026,419 | |
| | Undistributed net investment income at end of period | | 41,578 | | | 38,307 | |
See Accompanying Notes to Financial Statements.
16
Statement of Changes in Net Assets (continued) – Columbia Short-Intermediate Bond Fund
| | | | | | | | | | | | |
| | | Capital Stock Activity | |
| | | Year Ended
March 31, 2010 | | | Year Ended
March 31, 2009 | |
| | | Shares | | | Dollars ($) | | | Shares | | | Dollars ($) | |
Class A | | | | | | | | | | | | |
Subscriptions | | 367,854 | | | 2,606,989 | | | 110,671 | | | 751,789 | |
Distributions reinvested | | 9,202 | | | 66,477 | | | 1,008 | | | 6,879 | |
Redemptions | | (88,117 | ) | | (637,348 | ) | | (6,356 | ) | | (43,774 | ) |
| | | | | | | | | | | | |
Net increase | | 288,939 | | | 2,036,118 | | | 105,323 | | | 714,894 | |
| | | | |
Class C | | | | | | | | | | | | |
Subscriptions | | 150,249 | | | 1,065,146 | | | 83,008 | | | 568,446 | |
Distributions reinvested | | 3,053 | | | 22,046 | | | 308 | | | 2,106 | |
Redemptions | | (24,985 | ) | | (179,279 | ) | | (6,866 | ) | | (46,753 | ) |
| | | | | | | | | | | | |
Net increase | | 128,317 | | | 907,913 | | | 76,450 | | | 523,799 | |
| | | | |
Class Z | | | | | | | | | | | | |
Subscriptions | | 11,009,445 | | | 78,582,820 | | | 10,264,770 | | | 70,878,684 | |
Distributions reinvested | | 283,783 | | | 2,036,362 | | | 421,890 | | | 2,916,529 | |
Redemptions | | (17,807,593 | ) | | (127,666,331 | ) | | (18,492,341 | ) | | (127,101,590 | ) |
| | | | | | | | | | | | |
Net decrease | | (6,514,365 | ) | | (47,047,149 | ) | | (7,805,681 | ) | | (53,306,377 | ) |
See Accompanying Notes to Financial Statements.
17
Financial Highlights – Columbia Short-Intermediate Bond Fund
Selected data for a share outstanding throughout each period is as follows:
| | | | | | | | | | | | |
| | | Year Ended
March 31, | | | Period Ended
March 31, | |
| Class A Shares | | 2010 | | | 2009 | | | 2008 (a) | |
Net Asset Value, Beginning of Period | | $ | 6.86 | | | $ | 7.24 | | | $ | 7.24 | |
| | | |
Income from Investment Operations: | | | | | | | | | | | | |
Net investment income (b) | | | 0.25 | | | | 0.27 | | | | — | (c) |
Net realized and unrealized gain (loss) on investments and futures contracts | | | 0.43 | | | | (0.33 | ) | | | — | (c) |
| | | | | | | | | | | | |
Total from investment operations | | | 0.68 | | | | (0.06 | ) | | | — | (c) |
| | | |
Less Distributions to Shareholders: | | | | | | | | | | | | |
From net investment income | | | (0.25 | ) | | | (0.28 | ) | | | — | (c) |
From net realized gains | | | — | | | | (0.04 | ) | | | — | |
| | | | | | | | | | | | |
Total distributions to shareholders | | | (0.25 | ) | | | (0.32 | ) | | | — | (c) |
| | | |
Increase from regulatory settlements | | | — | (c) | | | — | | | | — | |
| | | |
Net Asset Value, End of Period | | $ | 7.29 | | | $ | 6.86 | | | $ | 7.24 | |
Total return (d)(e) | | | 9.98 | % | | | (0.82 | )% | | | 0.01 | %(f) |
| | | |
Ratios to Average Net Assets/Supplemental Data: | | | | | | | | | | | | |
Net expenses before interest expense (g) | | | 0.85 | % | | | 0.90 | % | | | 1.00 | %(h) |
Interest expense | | | — | | | | — | %(i) | | | — | |
Net expenses (g) | | | 0.85 | % | | | 0.90 | % | | | 1.00 | %(h) |
Waiver/Reimbursement | | | 0.02 | % | | | 0.04 | % | | | 0.05 | %(h) |
Net investment income (g) | | | 3.41 | % | | | 3.96 | % | | | 3.44 | %(h) |
Portfolio turnover rate | | | 82 | % | | | 72 | % | | | 109 | %(f) |
Net assets, end of period (000s) | | $ | 2,885 | | | $ | 732 | | | $ | 10 | |
| (a) | Class A shares commenced operations on March 31, 2008. Per share data and total return reflect activity from that date. |
| (b) | Per share data was calculated using the average shares outstanding during the period. |
| (c) | Rounds to less than $0.01 per share. |
| (d) | Had the investment advisor and/or any of its affiliates not waived fees or reimbursed a portion of expenses, total return would have been reduced. |
| (e) | Total return at net asset value assuming all distributions reinvested and no initial sales charge or contingent deferred sales charge. |
| (g) | The benefits derived from expense reductions had an impact of less than 0.01%. |
| (i) | Rounds to less than 0.01%. |
See Accompanying Notes to Financial Statements.
18
Financial Highlights – Columbia Short-Intermediate Bond Fund
Selected data for a share outstanding throughout each period is as follows:
| | | | | | | | | | | | |
| | | Year Ended
March 31, | | | Period Ended
March 31, | |
| Class C Shares | | 2010 | | | 2009 | | | 2008 (a) | |
Net Asset Value, Beginning of Period | | $ | 6.87 | | | $ | 7.24 | | | $ | 7.24 | |
| | | |
Income from Investment Operations: | | | | | | | | | | | | |
Net investment income (b) | | | 0.19 | | | | 0.21 | | | | — | (c) |
Net realized and unrealized gain (loss) on investments and futures contracts | | | 0.43 | | | | (0.31 | ) | | | — | (c) |
| | | | | | | | | | | | |
Total from investment operations | | | 0.62 | | | | (0.10 | ) | | | — | (c) |
| | | |
Less Distributions to Shareholders: | | | | | | | | | | | | |
From net investment income | | | (0.19 | ) | | | (0.23 | ) | | | — | (c) |
From net realized gains | | | — | | | | (0.04 | ) | | | — | |
| | | | | | | | | | | | |
Total distributions to shareholders | | | (0.19 | ) | | | (0.27 | ) | | | — | (c) |
| | | |
Increase from regulatory settlements | | | — | (c) | | | — | | | | — | |
| | | |
Net Asset Value, End of Period | | $ | 7.30 | | | $ | 6.87 | | | $ | 7.24 | |
Total return (d)(e) | | | 9.15 | % | | | (1.41 | )% | | | 0.01 | %(f) |
| | | |
Ratios to Average Net Assets/Supplemental Data: | | | | | | | | | | | | |
Net expenses before interest expense (g) | | | 1.60 | % | | | 1.65 | % | | | 1.75 | %(h) |
Interest expense | | | — | | | | — | %(i) | | | — | |
Net expenses (g) | | | 1.60 | % | | | 1.65 | % | | | 1.75 | %(h) |
Waiver/Reimbursement | | | 0.02 | % | | | 0.04 | % | | | 0.05 | %(h) |
Net investment income (g) | | | 2.68 | % | | | 3.11 | % | | | 2.69 | %(h) |
Portfolio turnover rate | | | 82 | % | | | 72 | % | | | 109 | %(f) |
Net assets, end of period (000s) | | $ | 1,504 | | | $ | 534 | | | $ | 10 | |
| (a) | Class C shares commenced operations on March 31, 2008. Per share data and total return reflect activity from that date. |
| (b) | Per share data was calculated using the average shares outstanding during the period. |
| (c) | Rounds to less than $0.01 per share. |
| (d) | Had the investment advisor and/or any of its affiliates not waived fees or reimbursed a portion of expenses, total return would have been reduced. |
| (e) | Total return at net asset value assuming all distributions reinvested and no contingent deferred sales charge. |
| (g) | The benefits derived from expense reductions had an impact of less than 0.01%. |
| (i) | Rounds to less than 0.01%. |
See Accompanying Notes to Financial Statements.
19
Financial Highlights – Columbia Short-Intermediate Bond Fund
Selected data for a share outstanding throughout each period is as follows:
| | | | | | | | | | | | | | | | | | | | |
| | | Year Ended March 31, | |
| Class Z Shares | | 2010 | | | 2009 | | | 2008 (a) | | | 2007 | | | 2006 (b) | |
Net Asset Value, Beginning of Period | | $ | 6.86 | | | $ | 7.24 | | | $ | 7.10 | | | $ | 7.01 | | | $ | 7.16 | |
| | | | | |
Income from Investment Operations: | | | | | | | | | | | | | | | | | | | | |
Net investment income (c) | | | 0.26 | | | | 0.30 | | | | 0.31 | | | | 0.31 | | | | 0.27 | |
Net realized and unrealized gain (loss) on investments, futures contracts and swap contracts | | | 0.43 | | | | (0.34 | ) | | | 0.13 | | | | 0.09 | | | | (0.12 | ) |
| | | | | | | | | | | | | | | | | | | | |
Total from investment operations | | | 0.69 | | | | (0.04 | ) | | | 0.44 | | | | 0.40 | | | | 0.15 | |
| | | | | |
Less Distributions to Shareholders: | | | | | | | | | | | | | | | | | | | | |
From net investment income | | | (0.26 | ) | | | (0.30 | ) | | | (0.30 | ) | | | (0.31 | ) | | | (0.28 | ) |
From net realized gains | | | — | | | | (0.04 | ) | | | — | | | | — | | | | (0.02 | ) |
| | | | | | | | | | | | | | | | | | | | |
Total distributions to shareholders | | | (0.26 | ) | | | (0.34 | ) | | | (0.30 | ) | | | (0.31 | ) | | | (0.30 | ) |
| | | | | |
Increase from regulatory settlements | | | — | (d) | | | — | | | | — | | | | — | | | | — | |
| | | | | |
Net Asset Value, End of Period | | $ | 7.29 | | | $ | 6.86 | | | $ | 7.24 | | | $ | 7.10 | | | $ | 7.01 | |
Total return (e)(f) | | | 10.26 | % | | | (0.54 | )% | | | 6.42 | % | | | 5.79 | % | | | 2.06 | % |
| | | | | |
Ratios to Average Net Assets/Supplemental Data: | | | | | | | | | | | | | | | | | | | | |
Net expenses before interest expense (g) | | | 0.60 | % | | | 0.65 | % | | | 0.75 | % | | | 0.75 | % | | | 0.72 | % |
Interest expense | | | — | | | | — | %(h) | | | — | | | | — | | | | — | |
Net expenses (g) | | | 0.60 | % | | | 0.65 | % | | | 0.75 | % | | | 0.75 | % | | | 0.72 | % |
Waiver/Reimbursement | | | 0.02 | % | | | 0.04 | % | | | 0.05 | % | | | 0.05 | % | | | 0.09 | % |
Net investment income (g) | | | 3.70 | % | | | 4.28 | % | | | 4.31 | % | | | 4.38 | % | | | 3.74 | % |
Portfolio turnover rate | | | 82 | % | | | 72 | % | | | 109 | % | | | 70 | % | | | 75 | % |
Net assets, end of period (000s) | | $ | 344,382 | | | $ | 368,760 | | | $ | 445,625 | | | $ | 467,276 | | | $ | 437,073 | |
| (a) | On March 31, 2008, Shares class of Intermediate-Term Bond Fund, a series of Excelsior Funds, Inc., was reorganized into the Fund’s Class Z shares. The financial information of Class Z includes the financial information of Intermediate-Term Bond Fund’s Shares class. |
| (b) | Per share data for the year ended March 31, 2006 was audited by other auditors. |
| (c) | Per share data was calculated using the average shares outstanding during the period. |
| (d) | Rounds to less than $0.01 per share. |
| (e) | Had the investment advisor and/or any of its affiliates not waived fees or reimbursed a portion of expenses, total return would have been reduced. |
| (f) | Total return at net asset value assuming all distributions reinvested. |
| (g) | The benefits derived from expense reductions had an impact of less than 0.01%. |
| (h) | Rounds to less than 0.01%. |
See Accompanying Notes to Financial Statements.
20
Notes to Financial Statements – Columbia Short-Intermediate Bond Fund
March 31, 2010
Note 1. Organization
Columbia Short-Intermediate Bond Fund (the “Fund”), a series of Columbia Funds Series Trust I (the “Trust”), is a diversified fund. The Trust is registered under the Investment Company Act of 1940, as amended (the “1940 Act”), as an open-end management investment company organized as a Massachusetts business trust.
Investment Objective
The Fund seeks total return, consisting of current income and capital appreciation, consistent with minimal fluctuation of principal.
Fund Shares
The Trust may issue an unlimited number of shares, and the Fund offers three classes of shares: Class A, Class C and Class Z. Each share class has its own expense structure and sales charges, as applicable.
Class A shares are subject to a maximum front-end sales charge of 3.25% based on the amount of initial investment. Class A shares purchased without an initial sales charge in accounts aggregating $1 million to $50 million at the time of purchase are subject to a 1.00% contingent deferred sales charge (“CDSC”) if the shares are sold within one year after purchase. Class C shares are subject to a 1.00% CDSC on shares sold within one year after purchase. Class Z shares are offered continuously at net asset value. There are certain restrictions on the purchase of Class Z shares, as described in the Fund’s prospectus.
Note 2. Significant Accounting Policies
The preparation of financial statements in accordance with accounting principles generally accepted in the United States of America (“GAAP”) requires management to make certain estimates and assumptions that affect the reported amounts of assets and liabilities, the disclosure of contingent assets and liabilities at the date of the financial statements and the reported amounts of revenue and expenses during the reporting period. Actual results could differ from those estimates.
The following is a summary of significant accounting policies consistently followed by the Fund in the preparation of its financial statements.
Security Valuation
Debt securities generally are valued by pricing services approved by the Trust’s Board of Trustees, based upon market transactions for normal, institutional-size trading units of similar securities. The services may use various pricing techniques which take into account appropriate factors such as yield, quality, coupon rate, maturity, type of issue, trading characteristics and other data, as well as broker quotes. Debt securities for which quotations are readily available may also be valued based upon an over-the-counter or exchange bid quotation.
Certain debt securities, which tend to be more thinly traded and of lesser quality, are priced based on fundamental analysis of the financial condition of the issuer and the estimated value of any collateral. Valuations developed through pricing techniques may vary from the actual amounts realized upon sale of the securities, and the potential variation may be greater for those securities valued using fundamental analysis.
Short-term investments maturing in 60 days or less are valued at amortized cost, which approximates market value.
Investments in other open-end investment companies are valued at net asset value.
Investments for which market quotations are not readily available, or that have quotations which management believes are not reliable, are valued at fair value as determined in good faith under consistently applied procedures established by and under the general supervision of the Board of Trustees. If a security is valued at fair value, such value is likely to be different from the last quoted market price for the security. The determination of fair value often requires significant judgment. To determine fair value, management may use assumptions including but not limited to future cash flows and estimated risk premiums. Multiple inputs from various sources may be used to determine value.
GAAP establishes a hierarchy that prioritizes the inputs to valuation techniques used to measure fair value giving the highest priority to unadjusted quoted prices in active markets for identical securities (level 1 measurements) and the lowest priority to unobservable inputs (level 3 measurements) when market prices are not readily available or reliable. The three levels of the fair value hierarchy are described below:
| n | | Level 1 – quoted prices in active markets for identical securities |
21
Columbia Short-Intermediate Bond Fund
March 31, 2010
| n | | Level 2 – prices determined using other significant observable inputs (including quoted prices for similar securities, interest rates, prepayment speeds, credit risk and others) |
| n | | Level 3 – prices determined using significant unobservable inputs. In situations where quoted prices or observable inputs are unavailable or less reliable, unobservable inputs may be used. Unobservable inputs may include management’s own assumptions about the factors market participants would use in pricing an investment. |
The inputs or methodology used for valuing securities are not necessarily an indication of the risk associated with investing in those securities.
On Jan. 21, 2010, the FASB issued an Accounting Standards Update (the amendment), Fair Value Measurements and Disclosures (Topic 820): Improving Disclosures about Fair Value Measurements, which provides guidance on how investment assets and liabilities are to be valued and disclosed. Specifically, the amendment requires reporting entities to disclose the input and valuation techniques used to measure fair value for both recurring and nonrecurring fair value measurements for Level 2 or Level 3 positions. The amendment also requires that transfers between all levels (including Level 1 and Level 2) be disclosed on a gross basis (i.e., transfers out must be disclosed separately from transfers in), and the reason(s) for the transfer. Additionally purchases, sales, issuances and settlements must be disclosed on a gross basis in the Level 3 rollforward. The effective date of the amendment is for interim and annual periods beginning after Dec. 15, 2009, however, the requirement to provide the Level 3 activity for purchases, sales, issuances and settlements on a gross basis will be effective for interim and annual periods beginning after Dec. 15, 2010. At this time, management is evaluating the implications of the amendment and the impact to the financial statements.
Security Transactions
Security transactions are accounted for on the trade date. Cost is determined and gains (losses) are based upon the specific identification method for both financial statement and federal income tax purposes.
Delayed Delivery Securities
The Fund may trade securities on other than normal settlement terms, including securities purchased or sold on a “when-issued” basis. This may increase the risk if the other party to the transaction fails to deliver and causes the Fund to subsequently invest at less advantageous prices. The Fund identifies within its portfolio of investments cash or liquid securities in an amount equal to the delayed delivery commitment.
Repurchase Agreements
The Fund may engage in repurchase agreement transactions with institutions that Columbia Management Advisors, LLC (“Columbia”), the Fund’s investment advisor, has determined are creditworthy. The Fund, through its custodian, receives delivery of the underlying securities collateralizing a repurchase agreement. Columbia is responsible for determining that the collateral is at least equal, at all times, to the value of the repurchase obligation including interest. A repurchase agreement transaction involves certain risks in the event of default or insolvency of the counterparty. These risks include possible delays in or restrictions on the Fund’s ability to dispose of the underlying securities and a possible decline in the value of the underlying securities during the period while the Fund seeks to assert its rights.
Treasury Inflation Protected Securities
The Fund may invest in treasury inflation protected securities (“TIPS”). The principal amount of TIPS is adjusted periodically and is increased for inflation or decreased for deflation based on a monthly published index. Interest payments are based on the adjusted principal at the time the interest is paid. These adjustments are recorded as interest income on the Statement of Operations.
Income Recognition
Interest income is recorded on the accrual basis. Premium and discount are amortized and accreted, respectively, on all debt securities, unless otherwise noted. Original issue discount is accreted to interest income over the life of the security with a corresponding increase in the cost basis. Corporate actions and dividend income are recorded on the ex-date.
Expenses
General expenses of the Trust are allocated to the Fund and other series of the Trust based upon relative net assets or other expense allocation methodologies determined by the
22
Columbia Short-Intermediate Bond Fund
March 31, 2010
nature of the expense. Expenses directly attributable to the Fund are charged to the Fund.
Determination of Class Net Asset Value
All income, expenses (other than class-specific expenses, as shown on the Statement of Operations) and realized and unrealized gains (losses) are allocated to each class of the Fund on a daily basis for purposes of determining the net asset value of each class. Income and expenses are allocated to each class based on the settled shares method, while realized and unrealized gains (losses) are allocated based on the relative net assets of each class.
Federal Income Tax Status
The Fund intends to qualify each year as a “regulated investment company” under Subchapter M of the Internal Revenue Code, as amended, and will distribute substantially all of its tax exempt or taxable income, if any, for its tax year, and as such will not be subject to federal income taxes. In addition, the Fund intends to distribute in each calendar year substantially all of its net investment income, capital gains and certain other amounts, if any, such that the Fund should not be subject to federal excise tax. Therefore, no federal income or excise tax provision is recorded.
Distributions to Shareholders
Distributions from net investment income are declared daily and paid monthly. Net realized capital gains, if any, are distributed at least annually. Income distributions and capital gain distributions are determined in accordance with federal income tax regulations which may differ from GAAP.
Indemnification
In the normal course of business, the Fund enters into contracts that contain a variety of representations and warranties and which provide general indemnities. The Fund’s maximum exposure under these arrangements is unknown because this would involve future claims against the Fund. Also, under the Trust’s organizational documents and by contract, the Trustees and officers of the Trust are indemnified against certain liabilities that may arise out of actions relating to their duties to the Trust. However, based on experience, the Fund expects the risk of loss due to these representations, warranties and indemnities to be minimal.
Note 3. Federal Tax Information
The timing and character of income and capital gain distributions are determined in accordance with income tax regulations, which may differ from GAAP. Reclassifications are made to the Fund’s capital accounts for permanent tax differences to reflect income and gains available for distribution (or available capital loss carryforwards) under income tax regulations.
For the year ended March 31, 2010, permanent book and tax basis differences resulting primarily from differing treatments for proceeds received from litigation settlements and paydown reclasses were identified and reclassified among the components of the Fund’s net assets as follows:
| | | | |
| | | |
Undistributed Net Investment
Income | | Accumulated Net Realized
Loss | | Paid-In Capital |
| $5,518 | | $(3,043) | | $(2,475) |
Net investment income and net realized gains (losses), as disclosed on the Statement of Operations, and net assets were not affected by this reclassification.
The tax character of distributions paid during the years ended March 31, 2010 and March 31, 2009 was as follows:
| | | | | | |
| | | March 31, 2010 | | March 31, 2009 |
| Distributions paid from: | | |
Ordinary Income* | | $ | 13,813,907 | | $ | 18,788,797 |
Long-Term Capital Gains | | | — | | | 631,907 |
| * | For tax purposes short-term capital gain distributions, if any, are considered ordinary income distributions. |
As of March 31, 2010, the components of distributable earnings on a tax basis were as follows:
| | | | |
| | | | | |
Undistributed
Ordinary Income | | Undistributed Long-Term Capital Gains | | Net Unrealized Appreciation |
| $1,139,392 | | $— | | $6,908,870 |
23
Columbia Short-Intermediate Bond Fund
March 31, 2010
Unrealized appreciation and depreciation at March 31, 2010, based on cost of investments for federal income tax purposes was:
| | | | |
| | | | |
Unrealized appreciation | | $ | 12,397,393 | |
Unrealized depreciation | | | (5,488,523 | ) |
Net unrealized appreciation | | $ | 6,908,870 | |
The following capital loss carryforwards may be available to reduce taxable income arising from future net realized gains on investments, if any, to the extent permitted by the Internal Revenue Code:
| | | |
| | | |
| Year of Expiration | | Capital Loss Carryforward |
| 2017 | | $ | 3,002,758 |
| 2018 | | | 876,240 |
| | | |
| Total | | | $3,878,998 |
| | | |
Management is required to determine whether a tax position of the Fund is more likely than not to be sustained upon examination by the applicable taxing authority, including resolution of any related appeals or litigation processes, based on the technical merits of the position. The tax benefit to be recognized by the Fund is measured as the largest amount of benefit that is greater than fifty percent likely of being realized upon ultimate settlement. Management is not aware of any tax positions for which it is reasonably possible that the total amounts of unrecognized tax benefits will significantly change in the next twelve months. However, management’s conclusions may be subject to review and adjustment at a later date based on factors including, but not limited to, new tax laws, regulations, and administrative interpretations (including relevant court decisions). The Fund’s federal tax returns for the prior three fiscal years remain subject to examination by the Internal Revenue Service.
Note 4. Fees and Compensation Paid to Affiliates
Investment Advisory Fee
Columbia, an indirect, wholly owned subsidiary of Bank of America Corporation (“BOA”) provides investment advisory services to the Fund. Columbia receives a monthly investment advisory fee based on the Fund’s average daily net assets at the following annual rates:
| | | |
| | | | |
| Average Daily Net Assets | | Annual Fee Rate | |
First $1 billion | | 0.35 | % |
$1 billion to $1.5 billion | | 0.30 | % |
$1.5 billion to $3 billion | | 0.29 | % |
$3 billion to $6 billion | | 0.28 | % |
Over $6 billion | | 0.27 | % |
For the year ended March 31, 2010, the Fund’s effective investment advisory fee rate was 0.35% of the Fund’s average daily net assets.
Bank of America, N.A., an indirect parent company of Columbia, entered into an agreement dated September 29, 2009, to sell a portion of the asset management business of Columbia Management Group, LLC to Ameriprise Financial, Inc. (“Ameriprise Financial”). The transaction (“Transaction”) includes the sale of the part of the asset management business that advises long-term mutual funds, including the Fund. The Transaction is subject to certain approvals and other conditions to closing, and is currently expected to close on or about April 30, 2010 (the “Closing”).
In connection with the Closing, certain changes will occur, including a change in the entities serving as the investment advisor, administrator, distributor and transfer agent of the Fund. RiverSource Investments, LLC (the “New Advisor”), a subsidiary of Ameriprise Financial, will become the investment advisor of the Fund upon the Closing. On March 3, 2010, the Fund’s shareholders approved, among other matters, the proposed investment management services agreement with the New Advisor. The New Advisor will serve as investment advisor under a new investment management services agreement effective upon the Closing. The New Advisor will change its name to Columbia Management Investment Advisers, LLC upon or shortly after the Closing. Effective upon the Closing, as the context requires, references to Columbia shall be deemed to refer to the New Advisor.
Administration Fee
Columbia provides administrative and other services to the Fund for a monthly administration fee at the annual rate of 0.15% of the Fund’s average daily net assets less the fees
24
Columbia Short-Intermediate Bond Fund
March 31, 2010
payable by the Fund as described under the Pricing and Bookkeeping Fees note below.
The New Advisor will become the administrator of the Fund under a new administrative services agreement effective upon the Closing.
Pricing and Bookkeeping Fees
The Fund has entered into a Financial Reporting Services Agreement (the “Financial Reporting Services Agreement”) with State Street Bank and Trust Company (“State Street”) and Columbia pursuant to which State Street provides financial reporting services to the Fund. The Fund has also entered into an Accounting Services Agreement (collectively with the Financial Reporting Services Agreement, the “State Street Agreements”) with State Street and Columbia pursuant to which State Street provides accounting services to the Fund. Under the State Street Agreements, the Fund pays State Street an annual fee of $38,000 paid monthly plus an additional monthly fee based on an annualized percentage rate of average daily net assets of the Fund for the month. The aggregate fee will not exceed $140,000 per year (exclusive of out-of-pocket expenses and charges). The Fund also reimburses State Street for certain out-of-pocket expenses and charges.
Among other updates to the State Street Agreements, Columbia will assign and delegate its rights and obligations thereunder to the New Advisor upon the Closing.
The Fund has entered into a Pricing and Bookkeeping Oversight and Services Agreement (the “Services Agreement”) with Columbia. Under the Services Agreement, Columbia provides services related to Fund expenses and the requirements of the Sarbanes-Oxley Act of 2002, and provides oversight of the accounting and financial reporting services provided by State Street. Under the Services Agreement, the Fund reimburses Columbia for out-of-pocket expenses.
The Services Agreement will be terminated upon the Closing, and the services provided thereunder will be covered under the administrative services agreement with the New Advisor.
Transfer Agent Fee
Columbia Management Services, Inc. (the “Transfer Agent”), an affiliate of Columbia and an indirect, wholly owned subsidiary of BOA, provides shareholder services to the Fund and has contracted with Boston Financial Data Services (“BFDS”) to serve as sub-transfer agent. Effective November 1, 2009, the Transfer Agent is entitled to receive a fee for its services, paid monthly, at the annual rate of $22.36 per account plus reimbursement of certain sub-transfer agent fees paid by the Transfer Agent (exclusive of BFDS fees), calculated based on assets held in omnibus accounts and intended to recover the cost of payments to other parties (including affiliates of BOA) for services to those accounts. Prior to November 1, 2009, the annual rate was $17.34 per account. The Transfer Agent pays the fees of BFDS for services as sub-transfer agent and is not entitled to reimbursement for such fees from the Fund.
The Transfer Agent may also retain, as additional compensation for its services, fees for wire, telephone and redemption orders, Individual Retirement Account (“IRA”) trustee agent fees and account transcript fees due to the Transfer Agent from shareholders of the Fund and credits (net of bank charges) earned with respect to balances in accounts the Transfer Agent maintains in connection with its services to the Fund. The Transfer Agent also receives reimbursement for certain out-of-pocket expenses.
RiverSource Service Corporation (the “New Transfer Agent”), a subsidiary of Ameriprise Financial, will become the transfer agent of the Fund upon the Closing. The New Transfer Agent will change its name to Columbia Management Investment Services Corp. upon or shortly after the Closing.
An annual minimum account balance fee of $20 may apply to certain accounts with a value below the Fund’s initial minimum investment requirements to reduce the impact of small accounts on transfer agent fees. These minimum account balance fees are recorded as part of expense reductions on the Statement of Operations. For the year ended March 31, 2010, no minimum account balance fees were charged by the Fund.
Underwriting Discounts, Service and Distribution Fees
Columbia Management Distributors, Inc. (the “Distributor”) an affiliate of Columbia and an indirect, wholly-owned subsidiary of BOA, is the principal underwriter of the Fund’s shares. For the year ended March 31, 2010, the Distributor has retained net underwriting discounts of $809 on the sale of the Fund’s Class A shares and received net CDSC fees of $- and $157 on Class A and Class C share redemptions, respectively.
25
Columbia Short-Intermediate Bond Fund
March 31, 2010
RiverSource Fund Distributors, Inc. (the “New Distributor”), a subsidiary of Ameriprise Financial, will become the distributor of the Fund upon the Closing. The New Distributor will change its name to Columbia Management Investment Distributors, Inc. upon or shortly after the Closing.
The Fund has adopted distribution and shareholder servicing plans (the “Plans”) pursuant to Rule 12b-1 under the 1940 Act, which require the payment of distribution and service fees. The fees are intended to compensate the Distributor and/or eligible selling and/or servicing agents for selling shares of the Fund and providing services to investors. The Plans require the payment of a monthly service fee to the Distributor at the annual rate of 0.25% of the average daily net assets attributable to Class A and Class C shares. The Plans also require the payment of a monthly distribution fee to the Distributor at the annual rate of 0.75% of the average daily net assets attributable to Class C shares only.
The CDSC and the distribution fees received from the Plans are used principally as repayment to the Distributor for amounts paid by the Distributor to dealers who sold such shares.
Fee Waivers and Expense Reimbursements
Effective August 1, 2009, Columbia has voluntarily agreed to reimburse a portion of the Fund’s expenses so that the Fund’s ordinary operating expenses (excluding any distribution and service fees, brokerage commissions, interest, taxes and extraordinary expenses, but including custodian charges relating to overdrafts, if any), after giving effect to any balance credits from the Fund’s custodian, do not exceed 0.55% of the Fund’s average daily net assets on an annualized basis. Columbia, in its discretion, may revise or discontinue this arrangement at any time.
Prior to August 1, 2009, Columbia contractually agreed to bear a portion of the Fund’s expenses so that the Fund’s ordinary operating expenses (excluding any distribution and service fees, brokerage commissions, interest, taxes and extraordinary expenses, but including custodian charges relating to overdrafts, if any), after giving effect to any balance credits from the Fund’s custodian, did not exceed 0.75% annually of the Fund’s average daily net assets.
Fees Paid to Officers and Trustees
All officers of the Fund are employees of Columbia or its affiliates and, with the exception of the Fund’s Chief Compliance Officer, receive no compensation from the Fund. The Board of Trustees has appointed a Chief Compliance Officer to the Fund in accordance with federal securities regulations. The Fund, along with other affiliated funds, pays its pro-rata share of the expenses associated with the Chief Compliance Officer. The Fund’s expenses for the Chief Compliance Officer will not exceed $15,000 per year.
Trustees are compensated for their services to the Fund, as set forth on the Statement of Operations. The Trust’s eligible Trustees may participate in a deferred compensation plan which may be terminated at any time. Obligations of the plan will be paid solely out of the Fund’s assets.
Note 5. Custody Credits
The Fund has an agreement with its custodian bank under which custody fees may be reduced by balance credits. These credits are recorded as part of expense reductions on the Statement of Operations. The Fund could have invested a portion of the assets utilized in connection with the expense offset arrangement in an income-producing asset if it had not entered into such an agreement.
For the year ended March 31, 2010, these custody credits reduced total expenses by $14 for the Fund.
Note 6. Portfolio Information
For the year ended March 31, 2010, the cost of purchases and proceeds from sales of securities, excluding short-term obligations, for the Fund were $290,301,507 and $351,891,225, respectively, of which $186,072,159 and $222,529,459, respectively, were U.S. Government securities.
Note 7. Regulatory Settlements
During the year ended March 31, 2010, the Fund received payments totaling $2,475 relating to certain regulatory settlements with third parties that the Fund had participated in during the year. The payments have been included in “Increase from regulatory settlements” on the Statement of Changes in Net Assets.
Note 8. Line of Credit
The Fund and other affiliated funds participate in a $280,000,000 committed, unsecured revolving line of credit provided by State Street. The maximum amount that may be borrowed by any fund is limited to the lesser of $200,000,000
26
Columbia Short-Intermediate Bond Fund
March 31, 2010
and the Fund’s borrowing limit set forth in the Fund’s registration statement. Borrowings are available for short-term liquidity or temporary or emergency purposes.
Effective October 15, 2009, interest is charged to each participating fund based on the fund’s borrowings at a rate per annum equal to the greater of the Federal Funds Rate plus 1.25% or the overnight LIBOR Rate plus 1.25%. In addition, a commitment fee of 0.15% per annum is accrued and apportioned among the participating funds pro rata based on their relative net assets.
Prior to October 15, 2009, interest was charged to each participating fund based on the fund’s borrowings at a rate per annum equal to the greater of the Federal Funds Rate plus 0.50% or the overnight LIBOR Rate plus 0.50%. In addition, an annual operations agency fee of $20,000, an amendment fee of 0.02% and a commitment fee of 0.12% per annum were accrued and apportioned among the participating funds pro rata based on their relative net assets.
For the year ended March 31, 2010, the Fund did not borrow under these arrangements.
Note 9. Securities Lending
The Fund may lend its securities to certain approved brokers, dealers and other financial institutions. Each loan is collateralized by cash, in an amount at least equal to the market value of the securities loaned plus accrued income from the investment of collateral. The market value of the loaned securities is determined at the close of business of the Fund and any additional required collateral is delivered to the Fund on the next business day. The collateral received is invested and the income generated by the investment of the collateral, net of any fees remitted to State Street as the lending agent and borrower rebates, is paid to the Fund. Generally, in the event of borrower default, the Fund has the right to use the collateral to offset any losses incurred. In the event the Fund is delayed or prevented from exercising its right to dispose of the collateral, there may be a potential loss to the Fund. The Fund bears the risk of loss with respect to the investment of collateral.
Note 10. Shares of Beneficial Interest
As of March 31, 2010, 88.8% of the Fund’s outstanding shares were beneficially owned by one participant account over which BOA and/or any of its affiliates had either sole or joint investment discretion.
As of March 31, 2010, no other shareholders owned more than 5% of the outstanding shares of the Fund.
Subscription and redemption activity of this account may have a significant effect on the operations of the Fund.
Note 11. Significant Risks and Contingencies
Asset-Backed Securities Risk
The value of asset-backed securities may be affected by, among other factors, changes in interest rates, the market’s assessment of the quality of underlying assets, the creditworthiness of the servicer for the underlying assets, factors concerning the interests in and structure of the issuer or the originator of the underlying assets, or the creditworthiness or rating of the entities that provide any supporting letters of credit, surety bonds, derivative instruments, or other credit enhancement. The value of asset-backed securities also will be affected by the exhaustion, termination or expiration of any credit enhancement. Most asset-backed securities are subject to prepayment risk, which is the possibility that the underlying debt may be refinanced or prepaid prior to maturity during periods of declining or low interest rates, causing the Fund to have to reinvest the money received in securities that have lower yields. In addition, the impact of prepayments on the value of asset-backed securities may be difficult to predict and may result in greater volatility.
Mortgage-Backed Securities Risk
The value of mortgage-backed securities may be affected by, among other things, changes in interest rates, factors concerning the interests in and structure of the issuer or the originator of the mortgages, the creditworthiness of the entities that provide any supporting letters of credit, surety bonds or other credit enhancements or the quality of underlying assets or the market’s assessment thereof. Mortgage-backed securities are subject to prepayment risk, which is the possibility that the underlying mortgage may be refinanced or prepaid prior to maturity during periods of declining or low interest rates, causing the Fund to have to reinvest the money received in securities that have lower yields. In addition, the impact of prepayments on the value of mortgage-backed securities may be difficult to predict and may result in greater volatility.
27
Columbia Short-Intermediate Bond Fund
March 31, 2010
Information Regarding Pending and Settled Legal Proceedings
In June 2004, an action captioned John E. Gallus et al. v. American Express Financial Corp. and American Express Financial Advisors Inc. was filed in the United States District Court for the District of Arizona. The plaintiffs allege that they are investors in several American Express Company (now known as RiverSource) mutual funds and they purport to bring the action derivatively on behalf of those funds under the Investment Company Act of 1940. The plaintiffs allege that fees allegedly paid to the defendants by the funds for investment advisory and administrative services are excessive. The plaintiffs seek remedies including restitution and rescission of investment advisory and distribution agreements. The plaintiffs voluntarily agreed to transfer this case to the United States District Court for the District of Minnesota (the District Court). In response to defendants’ motion to dismiss the complaint, the District Court dismissed one of plaintiffs’ four claims and granted plaintiffs limited discovery. Defendants moved for summary judgment in April 2007. Summary judgment was granted in the defendants’ favor on July 9, 2007. The plaintiffs filed a notice of appeal with the Eighth Circuit Court of Appeals (the Eighth Circuit) on August 8, 2007. On April 8, 2009, the Eighth Circuit reversed summary judgment and remanded to the District Court for further proceedings. On August 6, 2009, defendants filed a writ of certiorari with the U.S. Supreme Court (the Supreme Court), asking the Supreme Court to stay the District Court proceedings while the Supreme Court considers and rules in a case captioned Jones v. Harris Associates, which involves issues of law similar to those presented in the Gallus case. On March 30, 2010, the Supreme Court issued its ruling in Jones v. Harris Associates, and on April 5, 2010, the Supreme Court vacated the Eighth Circuit’s decision in the Gallus case and remanded the case to the Eighth Circuit for further consideration in light of the Supreme Court’s decision in Jones v. Harris Associates.
In December 2005, without admitting or denying the allegations, American Express Financial Corporation (AEFC, which is now known as Ameriprise Financial, Inc. (Ameriprise Financial)), entered into settlement agreements with the Securities and Exchange Commission (SEC) and Minnesota Department of Commerce (MDOC) related to market timing activities. As a result, AEFC was censured and ordered to cease and desist from committing or causing any violations of certain provisions of the Investment Advisers Act of 1940, the Investment Company Act of 1940, and various Minnesota laws. AEFC agreed to pay disgorgement of $10 million and civil money penalties of $7 million. AEFC also agreed to retain an independent distribution consultant to assist in developing a plan for distribution of all disgorgement and civil penalties ordered by the SEC in accordance with various undertakings detailed at http://www.sec.gov/litigation/admin/ia-2451.pdf. Ameriprise Financial and its affiliates have cooperated with the SEC and the MDOC in these legal proceedings, and have made regular reports to the RiverSource Funds’ Boards of Directors/Trustees.
On November 7, 2008, RiverSource Investments, LLC, a subsidiary of Ameriprise Financial, Inc., acquired J. & W. Seligman & Co. Incorporated (Seligman). In late 2003, Seligman conducted an extensive internal review concerning mutual fund trading practices. Seligman’s review, which covered the period 2001-2003, noted one arrangement that permitted frequent trading in certain open-end registered investment companies managed by Seligman (the Seligman Funds); this arrangement was in the process of being closed down by Seligman before September 2003. Seligman identified three other arrangements that permitted frequent trading, all of which had been terminated by September 2002. In January 2004, Seligman, on a voluntary basis, publicly disclosed these four arrangements to its clients and to shareholders of the Seligman Funds. Seligman also provided information concerning mutual fund trading practices to the SEC and the Office of the Attorney General of the State of New York (NYAG).
In September 2006, the NYAG commenced a civil action in New York State Supreme Court against Seligman, Seligman Advisors, Inc. (now known as RiverSource Fund Distributors, Inc.), Seligman Data Corp. and Brian T. Zino (collectively, the Seligman Parties), alleging, in substance, that the Seligman Parties permitted various persons to engage in frequent trading and, as a result, the prospectus disclosure used by the registered investment companies then managed by Seligman was and had been misleading. The NYAG included other related claims and also claimed that the fees charged by Seligman to the Seligman Funds were excessive. On March 13, 2009, without admitting or denying any violations of law or wrongdoing, the Seligman Parties entered into a stipulation of settlement with the NYAG and settled the claims made by the NYAG. Under the terms of the settlement, Seligman paid
28
Columbia Short-Intermediate Bond Fund
March 31, 2010
$11.3 million to four Seligman Funds. This settlement resolved all outstanding matters between the Seligman Parties and the NYAG. In addition to the foregoing matter, the New York staff of the SEC indicated in September 2005 that it was considering recommending to the Commissioners of the SEC the instituting of a formal action against Seligman and Seligman Advisors, Inc. relating to frequent trading in the Seligman Funds. Seligman responded to the staff in October 2005 that it believed that any action would be both inappropriate and unnecessary, especially in light of the fact that Seligman had previously resolved the underlying issue with the Independent Directors of the Seligman Funds and made recompense to the affected Seligman Funds. There have been no further developments with the SEC on this matter.
Ameriprise Financial and certain of its affiliates have historically been involved in a number of legal, arbitration and regulatory proceedings, including routine litigation, class actions, and governmental actions, concerning matters arising in connection with the conduct of their business activities. Ameriprise Financial believes that the Funds are not currently the subject of, and that neither Ameriprise Financial nor any of its affiliates are the subject of, any pending legal, arbitration or regulatory proceedings that are likely to have a material adverse effect on the Funds or the ability of Ameriprise Financial or its affiliates to perform under their contracts with the Funds. Ameriprise Financial is required to make 10-Q, 10-K and, as necessary, 8-K filings with the Securities and Exchange Commission on legal and regulatory matters that relate to Ameriprise Financial and its affiliates. Copies of these filings may be obtained by accessing the SEC website at www.sec.gov.
There can be no assurance that these matters, or the adverse publicity associated with them, will not result in increased fund redemptions, reduced sale of fund shares or other adverse consequences to the Funds. Further, although we believe proceedings are not likely to have a material adverse effect on the Funds or the ability of Ameriprise Financial or its affiliates to perform under their contracts with the Funds, these proceedings are subject to uncertainties and, as such, we are unable to estimate the possible loss or range of loss that may result. An adverse outcome in one or more of these proceedings could result in adverse judgments, settlements, fines, penalties or other relief that could have a material adverse effect on the consolidated financial condition or results of operations of Ameriprise Financial.
Note 12. Subsequent Events
In connection with the preparation of the financial statements of the Fund as of and for the fiscal year ended March 31, 2010, events and transactions through the date the financial statements were issued have been evaluated by the Fund’s management for possible adjustment and/or disclosure. No subsequent events or transactions have occurred that would require adjustment of the financial statements as presented. On April 30, 2010, the Transaction disclosed in Note 4 closed. Effective May 1, 2010, the New Advisor became the investment advisor and administrator of the Fund and subsequently changed its name to Columbia Management Investment Advisers, LLC. On that date, the New Transfer Agent became the transfer agent of the Fund and changed its name to Columbia Management Investment Services Corp. Also on that date, the New Distributor became the distributor of the Fund and changed its name to Columbia Management Investment Distributors, Inc.
29
Report of Independent Registered Public Accounting Firm
To the Trustees of Columbia Funds Series Trust I and Shareholders of Columbia Short-Intermediate Bond Fund
In our opinion, the accompanying statement of assets and liabilities, including the portfolio of investments, and the related statement of operations and of changes in net assets and the financial highlights present fairly, in all material respects, the financial position of the Columbia Short-Intermediate Bond Fund, a series of Columbia Funds Series Trust I at March 31, 2010, the results of its operations for the year then ended, the changes in its net assets for each of the two years in the period then ended and the financial highlights for each of the periods presented, in conformity with accounting principles generally accepted in the United States of America. These financial statements and financial highlights (hereafter referred to as “financial statements”) are the responsibility of the Fund’s management; our responsibility is to express an opinion on these financial statements based on our audits. We conducted our audits of these financial statements in accordance with the standards of the Public Company Accounting Oversight Board (United States). Those standards require that we plan and perform the audit to obtain reasonable assurance about whether the financial statements are free of material misstatement. An audit includes examining, on a test basis, evidence supporting the amounts and disclosures in the financial statements, assessing the accounting principles used and significant estimates made by management, and evaluating the overall financial statement presentation. We believe that our audits, which included confirmation of securities at March 31, 2010 by correspondence with the custodian and brokers, provide a reasonable basis for our opinion. The financial highlights of the Fund for the year ended March 31, 2006 was audited by other auditors whose report dated May 22, 2006, expressed an unqualified opinion on those highlights.
PricewaterhouseCoopers LLP
Boston, Massachusetts
May 21, 2010
30
Fund Governance
The Trustees serve terms of indefinite duration. The names, addresses and birth years of the Trustees and Officers of the Funds of Columbia Funds Series Trust I, the year each was first elected or appointed to office, their principal business occupations during at least the last five years, the number of Funds overseen by each Trustee and other directorships they hold are shown below. Each officer listed below serves as an officer of each Fund in the Columbia Funds Complex.
Independent Trustees
| | |
Name, Address and Year of
Birth, Position with Funds, Year
First Elected or Appointed to Office | | Principal occupation(s) during past five years, number of funds in the
columbia funds complex overseen by trustee, other directorships held |
| |
| John D. Collins (Born 1938) | | |
c/o Columbia Management Investment Advisers, LLC One Financial Center Boston, MA 02111 Trustee (since 2005) | | Retired. Consultant, KPMG, LLP (accounting and tax firm) from July 1999 to June 2000; Partner, KPMG, LLP from March 1962 to June 1999. Oversees 65; Mrs. Fields Famous Brands LLC (consumer products); Suburban Propane Partners, L.P.; and Montpelier Re (insurance underwriting firm) |
| |
| Rodman L. Drake (Born 1943) | | |
c/o Columbia Management Investment Advisers, LLC One Financial Center Boston, MA 02111 Trustee (since 1994) and Chairman of the Board (since 2009) | | Co-Founder of Baringo Capital LLC (private equity) since 2002; CEO of Crystal River Capital, Inc. (real estate investment trust) since 2003; President, Continuation Investments Group, Inc. from 1997 to 2001. Oversees 65; Jackson Hewitt Tax Service Inc. (tax preparation services); Crystal Capital River Inc. (real estate investment trust); Student Loan Corporation (student loan provider); Celgene Corporation (global biotechnology company); and The Helios Funds (exchange-traded funds) |
| |
| Douglas A. Hacker (Born 1955) | | |
c/o Columbia Management Investment Advisers, LLC One Financial Center Boston, MA 02111 Trustee (since 1996) | | Independent business executive since May 2006; Executive Vice President–Strategy of United Airlines (airline) from December 2002 to May 2006; President of UAL Loyalty Services (airline marketing company) from September 2001 to December 2002; Executive Vice President and Chief Financial Officer of United Airlines from July 1999 to September 2001. Oversees 65; Nash Finch Company (food distributor); Aircastle Limited (aircraft leasing) |
|
| Janet Langford Kelly (Born 1957) |
c/o Columbia Management Investment Advisers, LLC One Financial Center Boston, MA 02111 Trustee (since 1996) | | Senior Vice President, General Counsel and Corporate Secretary, ConocoPhillips (integrated energy company) since September 2007; Deputy General Counsel–Corporate Legal Services, ConocoPhillips from August 2006 to August 2007; Partner, Zelle, Hofmann, Voelbel, Mason & Gette LLP (law firm) from March 2005 to July 2006; Adjunct Professor of Law, Northwestern University, from September 2004 to June 2006; Director, UAL Corporation (airline) from February 2006 to July 2006; Oversees 65; None |
| |
| Charles R. Nelson (Born 1942) | | |
c/o Columbia Management Investment Advisers, LLC One Financial Center Boston, MA 02111 Trustee (since 1981) | | Professor of Economics, University of Washington, since January 1976; Ford and Louisa Van Voorhis Professor of Political Economy, University of Washington, since September 1993; Adjunct Professor of Statistics, University of Washington, since September 1980; Associate Editor, Journal of Money Credit and Banking, 1993-2008 Consultant on econometric and statistical matters. Oversees 65; None |
31
Fund Governance (continued)
Independent Trustees (continued)
| | |
Name, Address and Year of
Birth, Position with Funds, Year
First Elected or Appointed to Office | | Principal occupation(s) during past five years, number of funds in the
columbia funds complex overseen by trustee, other directorships held |
| |
| John J. Neuhauser (Born 1943) | | |
c/o Columbia Management Investment Advisers, LLC One Financial Center Boston, MA 02111 Trustee (since 1984) | | President, Saint Michael’s College, since August 2007; University Professor, Boston College from November 2005 to August 2007; Academic Vice President and Dean of Faculties, Boston College from August 1999 to October 2005. Oversees 65; Liberty All-Star Equity Fund and Liberty All-Star Growth Fund, Inc. (closed-end funds) |
| |
| Jonathan Piel (Born 1938) | | |
c/o Columbia Management Investment Advisers, LLC One Financial Center Boston, MA 02111 Trustee (since 1994) | | Cable television producer and website designer; The Editor, Scientific American from 1984 to 1994; Vice President, Scientific American, Inc., from 1984 to 1994; Member, Advisory Board, Stone Age Institute, Bloomington, Indiana (research institute that explores the effect of technology on human evolution); Member, Board of Directors of the National Institute of Social Sciences, New York City; Member, Board of Trustees of the William Alanson White Institute, New York City (institution for training psychoanalysts); and Member, Advisory Board, Mount Sinai Children’s Environmental Health Center, New York. Oversees 65; None |
| |
| Patrick J. Simpson (Born 1944) | | |
c/o Columbia Management Investment Advisers, LLC One Financial Center Boston, MA 02111 Trustee (since 2000) | | Partner, Perkins Coie LLP (law firm). Oversees 65; None |
| |
| Anne-Lee Verville (Born 1945) | | |
c/o Columbia Management Investment Advisers, LLC One Financial Center Boston, MA 02111 Trustee (since 1998) | | Retired since 1997 (formerly General Manager–Global Education Industry (from 1994 to 1997), President–Application Systems Division (from 1991 to 1994), Chief Financial Officer–US Marketing & Services (from 1988 to 1991), and Chief Information Officer (from 1987 to 1988), IBM Corporation (computer and technology)). Oversees 65; None |
32
Fund Governance (continued)
Interested Trustee
| | |
Name, Address and Year of Birth,
Position with Funds, Year First
Elected or Appointed to Office | | Principal occupation(s) during past five years, number of funds in the columbia
funds complex overseen by trustee, other directorships held |
| |
| William E. Mayer1 (Born 1940) | | |
c/o Columbia Management Investment Advisers, LLC One Financial Center Boston, MA 02111 Trustee (since 1994) | | Partner, Park Avenue Equity Partners (private equity) since February 1999; Dean and Professor, College of Business, University of Maryland from 1992 to 1997. Oversees 65; Lee Enterprises (print media), WR Hambrecht + Co. (financial service provider); BlackRock Kelso Capital Corporation (investment company) |
| 1 | The Funds currently treat Mr. Mayer as an “interested person” (as defined in the Investment Company Act of 1940) by reason of his affiliation with WR Hambrecht + Co., a registered broker/dealer that may execute portfolio transactions for or engage in principal transactions with the Funds or other funds or accounts advised/managed by the Advisor or other Bank of America affiliates. |
The Statement of Additional Information includes additional information about the Trustees of the Funds and is available, without charge, upon request by calling 1-800-345-6611.
33
Fund Governance (continued)
Officers
| | |
| Name, Year of Birth and Address | | Principal Occupation(s) During the Past Five Years |
| |
| J. Kevin Connaughton (Born 1964) | | |
One Financial Center Boston, MA 02111 President (since 2009) | | Senior Vice President and General Manager–Mutual Fund Products, Columbia Management Investment Advisers, LLC since May 2010; President, Columbia Funds, since 2009, and RiverSource Funds, since May 2010 (previously Senior Vice President and Chief Financial Officer, Columbia Funds, from June 2008 to January 2009, Treasurer, Columbia Funds, from October 2003 to May 2008, and senior officer of various others affiliated funds since 2000); Managing Director, Columbia Management Advisors, LLC from December 2004 to April 2010. |
| |
| Michael G. Clarke (Born 1969) | | |
One Financial Center Boston, MA 02111 Senior Vice President and Chief Financial Officer (since 2009) | | Vice President, Columbia Management Investment Advisers, LLC since May 2010; Managing Director of Fund Administration, Columbia Management Advisors, LLC, from September 2004 to April 2010; senior officer of Columbia Funds and affiliated funds since 2002. |
| |
| Scott R. Plummer (Born 1959) | | |
5228 Ameriprise Financial Center Minneapolis, MN 55474 Senior Vice President, Secretary and Chief Legal Officer (since 2010) | | Chief Legal Officer and Assistant Secretary, Columbia Management Investment Advisers, LLC since June 2005; Vice President and Lead Chief Counsel–Asset Management, Ameriprise Financial, Inc. since May 2010 (previously Vice President and Chief Counsel–Asset Management, from 2005 to April 2010, and Vice President–Asset Management Compliance from 2004 to 2005); Vice President, Chief Counsel and Assistant Secretary, Columbia Management Investment Distributors, Inc. since 2008; Vice President, General Counsel and Secretary, Ameriprise Certificate Company since 2005; Chief Counsel, RiverSource Distributors, Inc. since 2006; Vice President, General Counsel and Secretary, RiverSource Funds, since December 2006; Senior Vice President, Secretary and Chief Legal Officer, Columbia Funds, since May 2010. |
| |
| Linda J. Wondrack (Born 1964) | | |
One Financial Center Boston, MA 02111 Senior Vice President and Chief Compliance Officer (since 2007) | | Vice President and Chief Compliance Officer, Columbia Management Investment Advisers, LLC since May 2010; Chief Compliance Officer, Columbia Funds, since 2007, and RiverSource Funds, since May 2010; Director (Columbia Management Group, LLC and Investment Product Group Compliance), Bank of America, from June 2005 to April 2010; Director of Corporate Compliance and Conflicts Officer of MFS Investment Management (investment management) from August 2004 to May 2005. |
| |
| William F. Truscott (Born 1960) | | |
53600 Ameriprise Financial Center Minneapolis, MN 55474 Senior Vice President (since 2010) | | Chairman of the Board, Columbia Management Investment Advisers, LLC since May 2010 (previously President, Chairman of the Board and Chief Investment Officer, from 2001 to April 2010); Chief Executive Officer, U.S. Asset Management & President, Annuities, Ameriprise Financial, Inc. since May 2010 (previously President–U.S. Asset Management and Chief Investment Officer from 2005 to April 2010, and Senior Vice President–Chief Investment Officer from 2001 to 2005); Director, President and Chief Executive Officer, Ameriprise Certificate Company since 2006; Director, Columbia Management Investment Distributors, Inc. since May 2010 (previously Chairman of the Board and Chief Executive Officer from 2008 to April 2010); Chairman of the Board and Chief Executive Officer, RiverSource Distributors, Inc. since 2006. |
34
Fund Governance (continued)
Officers (continued)
| | |
| Name, Year of Birth and Address | | Principal Occupation(s) During the Past Five Years |
| |
| Colin Moore (Born 1958) | | |
One Financial Center Boston, MA 02111 Senior Vice President (since 2010) | | Director and Chief Investment Officer, Columbia Management Investment Advisers, LLC since May 2010; Manager, Managing Director and Chief Investment Officer of Columbia Management Advisors, LLC from 2007 to April 2010; Head of Equities, Columbia Management Advisors, LLC from 2002 to 2007. |
| |
| Michael A. Jones (Born 1959) | | |
100 Federal Street Boston, MA 02110 Senior Vice President (since 2010) | | Director and President, Columbia Management Investment Advisers, LLC since May 2010; President and Director, Columbia Management Investment Distributors, Inc. since May 2010; Manager, Chairman, Chief Executive Officer and President, Columbia Management Advisors, LLC from 2007 to April 2010; Chief Executive Officer, President and Director, Columbia Management Distributors, Inc. from November 2006 to April 2010; previously, co-president and senior managing director at Robeco Investment Management. |
| |
| Amy Johnson (Born 1965) | | |
5228 Ameriprise Financial Center Minneapolis, MN 55474 Senior Vice President (since 2010) | | Senior Vice President and Chief Operating Officer, Columbia Management Investment Advisers, LLC since May 2010 (previously Chief Administrative Officer, from 2009 until April 2010, Vice President–Asset Management and Trust Company Services, from 2006 to 2009, and Vice President–Operations and Compliance from 2004 to 2006). |
| |
| Joseph F. DiMaria (Born 1968) | | |
One Financial Center Boston, MA 02111 Treasurer (since 2009) and Chief Accounting Officer (since 2008) | | Vice President, Mutual Fund Administration, Columbia Management Investment Advisers, LLC, since May 2010; Director of Fund Administration, Columbia Management Advisors, LLC from January 2006 to April 2010; Head of Tax/Compliance and Assistant Treasurer, Columbia Management Advisors, LLC, from November 2004 to December 2005. |
| |
| Marybeth Pilat (Born 1968) | | |
One Financial Center Boston, MA 02111 Deputy Treasurer (since 2010) | | Vice President, Mutual Fund Administration, Columbia Management Investment Advisers, LLC, since May 2010; Vice President, Investment Operations, Bank of America, from October 2008 to April 2010; Finance Manager, Boston Children’s Hospital from August 2008 to October 2008; Director, Mutual Fund Administration, Columbia Management Advisors, LLC, from May 2007 to July 2008; Vice President, Mutual Fund Valuation, Columbia Management Advisors, LLC, from January 2006 to May 2007; Vice President, Mutual Fund Accounting Oversight, Columbia Management Advisors, LLC from January 2005 to January 2006. |
| |
| Julian Quero (Born 1967) | | |
One Financial Center Boston, MA 02111 Deputy Treasurer (since 2008) | | Vice President, Mutual Fund Administration, Columbia Management Investment Advisers, LLC since May 2010; Director of Fund Administration, Columbia Management Advisors, LLC, from August 2008 to April 2010; Senior Tax Manager, Columbia Management Advisors, LLC from August 2006 to July 2008; Senior Compliance Manager, Columbia Management Advisors, LLC from April 2002 to August 2006. |
| |
| Stephen T. Welsh (Born 1957) | | |
One Financial Center Boston, MA 02111 Vice President (since 2006) | | President and Director, Columbia Management Investment Services Corp. since May 2010; President and Director, Columbia Management Services, Inc. from July 2004 to April 2010; Managing Director, Columbia Management Distributors, Inc. from August 2007 to April 2010. |
35
Board Consideration and Approval of Advisory Agreements
The Advisory Fees and Expenses Committee of the Board of Trustees meets several times annually to review the current advisory agreements (collectively, the “Agreements”) of the funds for which the Trustees serve as trustees (each a “fund”) and to determine whether to recommend that the full Board approve the continuation of the Agreements for an additional one-year period. After the Committee has made its recommendation, the full Board, including the Independent Trustees, determines whether to approve the continuation of the Agreements. In addition, the full Board, including the Independent Trustees, considers matters bearing on the Agreements at most of its other meetings throughout the year and meets regularly with senior management of the funds and Columbia, the funds’ investment adviser, including the senior manager of each investment area within Columbia. Through the Board’s Investment Oversight Committees, Trustees also meet with selected fund portfolio managers, research analysts and traders at various times throughout the year.
The Trustees receive and review all materials that they, their legal counsel or Columbia believe to be reasonably necessary for the Trustees to evaluate the Agreements and to determine whether to approve the continuation of the Agreements. Those materials generally include, among other items, (i) information on the investment performance of each fund relative to the performance of peer groups of mutual funds and the fund’s performance benchmarks, and additional information assessing performance on a risk-adjusted basis, (ii) information on each fund’s advisory fees and other expenses, including information comparing the fund’s expenses to those of peer groups of mutual funds and information about any applicable expense caps and fee “breakpoints,” (iii) information about the profitability of the Agreements to Columbia, including potential “fall-out” or ancillary benefits that Columbia and its affiliates may receive as a result of their relationships with the funds and (iv) information obtained through Columbia’s response to a questionnaire prepared at the request of the Trustees by counsel to the funds and independent legal counsel to the Independent Trustees. The Trustees also consider other information such as (i) Columbia’s financial results and financial condition, (ii) each fund’s investment objective and strategies and the size, education and experience of Columbia’s investment staffs and their use of technology, external research and trading cost measurement tools, (iii) the allocation of the funds’ brokerage and the use of “soft” commission dollars to pay for research products and services, (iv) Columbia’s resources devoted to, and its record of compliance with, the funds’ investment policies and restrictions, policies on personal securities transactions and other compliance policies and legal and regulatory requirements, (v) Columbia’s response to various legal and regulatory proceedings since 2003 and to the recent period of volatility in the securities markets and (vi) the economic outlook generally and for the mutual fund industry in particular. In addition, the Advisory Fees and Expenses Committee confers with the independent fee consultant (the “Fee Consultant”) appointed by the Independent Trustees pursuant to an assurance of discontinuance entered into by Columbia with the New York Attorney General (“NYAG”) to settle a civil complaint filed by the NYAG relating to trading in mutual fund shares (the “NYAG Settlement”) and reviews materials relating to the funds’ relationships with Columbia provided by the Fee Consultant. Under the NYAG Settlement, the Fee Consultant’s role is to manage the process by which management fees are negotiated so that they are negotiated in a manner that is at arms’ length and reasonable. Throughout the process, the Trustees have the opportunity to ask questions of and to request additional materials from Columbia and to consult with the Fee Consultant and independent legal counsel to the Independent Trustees.
The Board of Trustees most recently approved the continuation of the Agreements at its October, 2009 meeting, following meetings of the Advisory Fees and Expenses Committee held in December, 2008 and February, May, June, August, September and October, 2009.
The Board of Trustees also unanimously approved new advisory agreements (the “New Agreements”) for the funds with RiverSource Investments, LLC (to be renamed Columbia Management Investment Advisers, LLC) (“RiverSource”) at a meeting held on December 17, 2009. The New Agreements have since been approved by shareholders of the funds and are expected to take effect upon the closing of the acquisition of the long-term asset management business of Columbia by Ameriprise Financial, Inc. (“Ameriprise”), the parent company of RiverSource Investments, LLC (the “Transaction”).
The Advisory Fees and Expenses Committee met on multiple occasions to review the New Agreements for the funds. On
36
December 14, 2009, the Advisory Fees and Expenses Committee recommended that the full Board approve the New Agreements. On December 17, 2009, the full Board, including a majority of the Independent Trustees, approved the New Agreements. Prior to their approval of the New Agreements, the Advisory Fees and Expenses Committee and the Independent Trustees requested and evaluated materials from, and were provided materials and information about the Transaction and matters related to the proposals by, Bank of America Corp., Columbia, RiverSource and Ameriprise. In connection with their most recent approval of the Agreements (as discussed above) on October 28, 2009, the Advisory Fees and Expenses Committee and the Trustees requested and evaluated materials from Columbia, and discussed such materials with representatives of Columbia. The Advisory Fees and Expenses Committee, at meetings held on August 11, 2009, September 23, 2009, October 27, 2009, November 30, 2009, December 7, 2009 and December 14, 2009, and the Independent Trustees, at meetings held on August 12, 2009, August 20, 2009, October 28, 2009, December 8, 2009, December 14, 2009 and December 17, 2009, discussed the materials provided in connection with the October 28, 2009 approvals and the materials provided in connection with their consideration of the New Agreements and other matters relating to the Transaction with representatives of Bank of America Corp., Columbia, RiverSource and Ameriprise. The Trustees consulted with experienced legal counsel, who advised on the legal standards for consideration by the Trustees. The Independent Trustees also discussed the proposed approvals with independent legal counsel in private sessions.
The Trustees reviewed each New Agreement, as well as certain information obtained through RiverSource’s responses to initial and supplemental questionnaires prepared at the request of the Trustees by counsel to the funds and independent legal counsel to the Independent Trustees. The Advisory Fees and Expenses Committee and the Trustees also met with, and reviewed and considered a report prepared and provided by, the Fee Consultant (as discussed above).
In considering whether to approve the New Agreements and to approve the continuation of the Agreements, the Trustees, including the Independent Trustees, did not identify any single factor as determinative, and each weighed various factors as he or she deemed appropriate. In particular, the Trustees considered the following matters:
Matters Relating to the Agreements and the New Agreements
The nature, extent and quality of the services provided or to be provided to the funds under the Agreements and the New Agreements. The Trustees considered the nature, extent and quality of the services provided and the resources dedicated by Columbia and its affiliates (or to be provided and dedicated by RiverSource and its affiliates) to the funds.
Among other things, the Trustees considered, with respect to Columbia and its affiliates, (i) Columbia’s ability (including its personnel and other resources, compensation programs for personnel involved in fund management, reputation and other attributes) to attract, motivate and retain highly qualified research, advisory and supervisory investment professionals; (ii) the portfolio management services provided by those investment professionals; and (iii) the trade execution services provided on behalf of the funds. For each fund, the Trustees also considered the benefits to shareholders of investing in a mutual fund that is part of a family of funds offering exposure to a variety of asset classes and investment disciplines and providing a variety of fund and shareholder services.
Among other things, the Trustees considered, with respect to RiverSource and its affiliates, (i) the expected effect of the Transaction on the operations of the funds, (ii) the information provided by RiverSource with respect to the nature, extent and quality of services to be provided by it, (iii) RiverSource’s compliance program and compliance record, (iv) the ability of RiverSource (including personnel and other resources, compensation programs for personnel involved in fund management, reputation and other attributes) to attract, motivate and retain highly qualified research, advisory and supervisory investment professionals, (v) the trade execution services to be provided on behalf of the funds and (vi) the quality of RiverSource’s investment research capabilities and the other resources that it indicated it would devote to each fund. As noted above, the Trustees also considered RiverSource’s representations that the Chief Investment Officer of Columbia would serve as the Chief Investment Officer of RiverSource following the Transaction, and that the process for determining the portfolio management team for each Fund would be substantially the same process as has customarily been followed by Columbia, and reported to the Trustees, in evaluating the performance of Columbia’s portfolio management teams. The Trustees
37
also noted the professional experience and qualifications of the senior personnel of RiverSource. The Trustees also considered the compliance programs of and the compliance-related resources proposed to be provided to the funds by RiverSource and its affiliates, including discussions with the funds’ Chief Compliance Officer regarding RiverSource’s compliance program. The Trustees also discussed RiverSource’s compliance program with the Chief Compliance Officer for the RiverSource funds. The Trustees also considered RiverSource’s representation that the funds’ Chief Compliance Officer would serve as the Chief Compliance Officer of RiverSource following the Transaction. The Trustees considered RiverSource’s ability to provide administrative services to the funds, noting that while some Agreements contemplated the provision of certain administrative services, following the Transaction, all administrative services were anticipated to be provided pursuant to a new administrative services agreement. The Trustees also considered RiverSource’s ability to coordinate the activities of each fund’s other service providers. The Trustees considered performance information provided by RiverSource with respect to other mutual funds advised by RiverSource, and discussed with senior executives of RiverSource its process for identifying which portfolio management teams of the legacy Columbia and RiverSource organizations would be responsible for the management of the funds following the Transaction.
After reviewing those and related factors, the Trustees concluded, within the context of their overall conclusions, that the nature, extent and quality of services provided by Columbia supported the continuation of the Agreements, and that the nature, extent and quality of services expected to be provided by RiverSource supported approval of the New Agreements.
The costs of the services provided and profits realized by Columbia and its affiliates, and the expected costs of the services to be provided and the profits expected to be realized by RiverSource and its affiliates, from their relationships with the funds. With respect to Columbia and its affiliates, the Trustees considered the fees charged to the funds for advisory services as well as the total expense levels of the funds. That information included comparisons (provided by management and by an independent third-party data provider) of each fund’s advisory fees and total expense levels to those of the fund’s peer groups and information about the advisory fees charged by Columbia to comparable institutional accounts. In considering the fees charged to those accounts, the Trustees took into account, among other things, management’s representations about the differences between managing mutual funds as compared to other types of accounts, including differences in the services provided, differences in the risk profile of such business for Columbia, and the additional resources required to manage mutual funds effectively. In evaluating each fund’s advisory fees, the Trustees also took into account the demands, complexity and quality of the investment management of the fund. The Trustees considered existing advisory fee breakpoints, and Columbia’s use of advisory fee waivers and expense caps, which benefited a number of the funds. The Trustees also noted management’s stated justification for the fees charged to the funds, which included information about the investment performance of the funds and the services provided to the funds.
The Trustees considered that Columbia Short-Intermediate Bond Fund’s total expenses were in the third quintile and actual management fees were in the fourth quintile (where the lowest fees and expenses would be in the first quintile) of the peer group selected by an independent third-party data provider for purposes of expense comparisons.
The Trustees also considered the compensation directly or indirectly received by Columbia and its affiliates from their relationships with the funds. The Trustees reviewed information provided by management as to the profitability to Columbia and its affiliates of their relationships with each fund, and information about the allocation of expenses used to calculate profitability. When reviewing profitability, the Trustees also considered court cases in which adviser profitability was an issue in whole or in part, the performance of the relevant funds, the expense level of each fund, and whether Columbia had implemented breakpoints and/or expense caps with respect to the fund.
In connection with the integration of the legacy Columbia and RiverSource organizations, the Trustees considered, among other things, RiverSource’s projected annual net expense synergies (reductions in the cost of providing services to the funds), the timetable over which such synergies are expected to be realized and the extent to which any such synergies are expected to be shared with the funds. The Trustees also considered information provided by RiverSource regarding
38
their respective financial conditions. The Trustees considered that RiverSource proposed to continue voluntary expense caps currently in effect for the funds and that RiverSource had undertaken not to change these caps without further discussion with the Independent Trustees.
After reviewing those and related factors, the Trustees concluded, within the context of their overall conclusions, that the advisory fees charged to each fund, and the related profitability to Columbia and its affiliates of their relationships with the fund, supported the continuation of the Agreement pertaining to that fund, and that the expected profitability to RiverSource and its affiliates from its relationship with each fund supported the approval of the New Agreements.
Economies of Scale. With respect to Columbia and its affiliates, the Trustees considered the existence of any economies of scale in the provision by Columbia of services to each fund, to groups of related funds, and to Columbia’s investment advisory clients as a whole and whether those economies were shared with the funds through breakpoints in the investment advisory fees or other means, such as fee waivers/expense reductions and additional investments by Columbia in investment, trading and compliance resources. The Trustees noted that many of the funds benefited from breakpoints, fee waivers/expense caps, or both. In considering those issues, the Trustees also took note of the costs of the services provided (both on an absolute and a relative basis) and the profitability to Columbia and its affiliates of their relationships with the funds, as discussed above.
With respect to RiverSource and its affiliates, the Trustees considered the existence of any anticipated economies of scale in the provision by RiverSource of services to each fund, to groups of related funds and to RiverSource’s investment advisory clients as a whole, and whether those economies of scale were expected to be shared with the funds. The Trustees considered Ameriprise’s anticipated net expense synergies resulting from the Transaction, and considered the possibility that the funds might benefit from economies of scale over time as part of the larger, combined fund complex. The Trustees considered how expected synergies and potential economies of scale might benefit the funds and their shareholders. The Trustees considered the potential effect of the Transaction on the distribution of the funds, and noted that the proposed management fee schedules for the funds generally contained breakpoints that would reduce the fee rate on assets above specified threshold levels.
After reviewing those and related factors, the Trustees concluded, within the context of their overall conclusions, that the extent to which economies of scale were shared or expected to be shared with the funds supported the continuation of the Agreements and the approval of the New Agreements.
Matters Relating to the Agreements
Investment performance of the funds and Columbia. The Trustees reviewed information about the performance of each fund over various time periods, including information prepared by an independent third-party data provider that compared the performance of each fund to the performance of peer groups of mutual funds and performance benchmarks. The Trustees also reviewed a description of the third party’s methodology for identifying each fund’s peer group for purposes of performance and expense comparisons. The Trustees also considered additional information that the Advisory Fees and Expenses Committee requested from Columbia relating to funds that presented relatively weaker performance and/or relatively higher fees or expenses. In the case of each fund whose performance lagged that of a relevant peer group for certain (although not necessarily all) periods, the Trustees concluded that other factors relevant to performance were sufficient, in light of other considerations, to warrant continuation of the fund’s Agreements. Those factors varied from fund to fund, but included one or more of the following: (i) that the fund’s performance, although lagging in certain recent periods, was stronger over the longer term; (ii) that the underperformance was attributable, to a significant extent, to investment decisions that were reasonable and consistent with the fund’s investment strategy and policies and that the fund was performing within a reasonable range of expectations, given those investment decisions, market conditions and the fund’s investment strategy; (iii) that the fund’s performance was competitive when compared to other relevant performance benchmarks or peer groups; (iv) that Columbia had taken or was taking steps designed to help improve the fund’s investment performance, including, but not limited to, replacing portfolio managers or modifying investment strategies; and (v) that Columbia proposed to waive advisory fees or cap the expenses of the fund.
39
The Trustees noted that, through April 30, 2009, Columbia Short-Intermediate Bond Fund’s performance was in the third quintile (where the best performance would be in the first quintile) for the one-year period, in the second quintile for the three- and five-year periods, and in the first quintile for the ten-year period, of the peer group selected by an independent third-party data provider for purposes of performance comparisons.
The Trustees also considered Columbia’s performance and reputation generally, the funds’ performance as a fund family generally, and Columbia’s historical responsiveness to Trustee concerns about performance and Columbia’s willingness to take steps intended to improve performance. After reviewing those and related factors, the Trustees concluded, within the context of their overall conclusions regarding each of the Agreements, that the performance of each fund and Columbia was sufficient, in light of other considerations, to warrant the continuation of the Agreement pertaining to that fund.
Other Factors. The Trustees also considered other factors with respect to Columbia and its affiliates, which included but were not limited to the following:
| n | | the extent to which each fund had operated in accordance with its investment objective and investment restrictions, the nature and scope of the compliance programs of the funds and Columbia and the compliance-related resources that Columbia and its affiliates were providing to the funds; |
| n | | the nature, quality, cost and extent of administrative and shareholder services overseen and performed by Columbia and its affiliates, both under the Agreements and under separate agreements for the provision of transfer agency and administrative services; |
| n | | so-called “fall-out benefits” to Columbia and its affiliates, such as the engagement of its affiliates to provide distribution, brokerage and transfer agency services to the funds, and the benefits of research made available to Columbia by reason of brokerage commissions generated by the funds’ securities transactions, as well as possible conflicts of interest associated with those fall-out and other benefits, and the reporting, disclosure and other processes in place to disclose and monitor those possible conflicts of interest; and |
| n | | the report provided by the Fee Consultant, which included information about and analysis of the funds’ fees, expenses and performance. |
Matters Relating to the New Agreements
The Trustees considered all materials that they, their legal counsel or RiverSource believed reasonably necessary to evaluate and to determine whether to approve the New Agreements. In their deliberations, the Trustees did not identify any particular information that was all-important or controlling, and individual Trustees may have attributed different weights to the various factors. The material factors that formed the basis for the Trustees’ approvals included the factors set forth below:
| (i) | the reputation, financial strength, regulatory histories and resources of RiverSource and its parent, Ameriprise; |
| (ii) | the capabilities of RiverSource with respect to compliance, including an assessment of RiverSource’s compliance system by the funds’ Chief Compliance Officer; |
| (iii) | the qualifications of the personnel of RiverSource that would be expected to provide advisory services to each fund, including RiverSource’s representations that the Chief Investment Officer of Columbia would serve as the Chief Investment Officer of RiverSource, and that the process for determining the portfolio management team for each fund would be substantially the same process as has customarily been followed by Columbia, and reported to the Trustees, in evaluating the performance of Columbia’s portfolio management teams; |
| (iv) | the terms and conditions of the New Agreements, including the differences between the New Agreements and the Agreements; |
| (v) | the terms and conditions of other agreements and arrangements relating to the future operations of the funds, including an administrative services agreement and a Master Services and Distribution Agreement; |
| (vi) | the commitment of RiverSource and Ameriprise that there would not be any diminution in the nature, quality and extent of services provided to each fund or its shareholders following closing of the Transaction; |
| (vii) | that the Trustees recently had completed a full annual review of the Agreements, as required by the 1940 Act, for |
40
| | each fund and had determined that they were satisfied with the nature, extent and quality of services provided thereunder and that the management fee rate for each fund were sufficient to warrant their approval; |
| (viii) | that the advisory fee rates payable by each fund would not change; |
| (ix) | that RiverSource and Bank of America, and not any fund, would bear the costs of obtaining approvals of the New Agreement; |
| (x) | that Ameriprise and RiverSource had agreed to exercise reasonable best efforts to assure that, for a period of two years after the closing of the Transaction, there would not be imposed on any fund any “unfair burden” (within the meaning of Section 15(f) of 1940 Act) with respect to the Transaction; and |
| (xi) | that certain members of RiverSource’s management have a significant amount of experience integrating other fund families; that certain current Columbia personnel that would be integrated into RiverSource and its affiliates as a result of the Transaction also have experience in integrating fund families; and that the senior management of RiverSource following the Transaction would include certain senior executives of Columbia who are currently responsible for oversight of services provided to the funds. |
Investment Advisory Fee Rates and Other Expenses. The Trustees considered the fact that the advisory fee rates payable by each fund to RiverSource under the New Agreements are the same as those currently paid by each fund to Columbia under the Agreements. The Trustees noted that in connection with their October 28, 2009 approval of the continuance of the Agreements, they had concluded, within the context of their overall conclusions regarding each such agreement, that the advisory fees charged to each fund supported the continuation of the agreement pertaining to that fund.
The Trustees noted that in certain cases the effective advisory fee rate for a RiverSource fund was lower than the proposed investment advisory fee rate for a fund with generally similar investment objectives and strategies. The Trustees also noted that RiverSource’s investment advisory fee rates for equity and balanced funds generally are subject to adjustments based on investment performance, whereas the proposed investment advisory fee rates for the funds, consistent with those in the Agreements, do not reflect performance adjustments. The Trustees considered existing advisory fee breakpoints and RiverSource’s undertaking not to change expense caps previously implemented by Columbia with respect to the funds without further discussion with the Independent Trustees.
The Trustees received and considered information about the advisory fees charged by RiverSource to institutional accounts. In considering the fees charged to those accounts, the Trustees took into account, among other things, RiverSource’s representations about the differences between managing mutual funds as compared to other types of accounts, including differences in the services provided, differences in the risk profile of such business for RiverSource and the additional resources required to manage mutual funds effectively. In evaluating each fund’s expected advisory fees, the Trustees also took into account the demands, complexity and quality of the investment management of the fund.
The Trustees also considered that for certain funds, certain administrative services that are provided under the Agreements would not be provided under the New Agreements, but under a separate administrative services agreement. The Trustees noted that, unlike fees under an advisory agreement, fees under the administrative services agreement could be changed without shareholder approval, although RiverSource had not proposed any increase in such administrative fees and any such increase would require Board approval. The Trustees also noted Ameriprise’s and RiverSource’s covenants regarding compliance with Section 15(f) of the 1940 Act.
After reviewing these and related factors, the Trustees concluded, within the context of their overall conclusions, that the expected advisory fee rates and expenses of each fund supported the approval of the New Agreements.
Other Benefits to RiverSource. The Trustees received and considered information regarding any expected “fall-out” or ancillary benefits to be received by RiverSource and its affiliates as a result of their relationships with the funds, such as the engagement of RiverSource to provide administrative services to the funds and the engagement of RiverSource’s affiliates to provide distribution and transfer agency services to the funds. The Trustees considered that the funds’ distributor, which would be an affiliate of RiverSource,
41
retains a portion of the distribution fees from the funds and receives a portion of the sales charges on sales or redemptions of certain classes of shares of the funds. The Trustees also considered the benefits of research made available to RiverSource by reason of brokerage commissions generated by the funds’ securities transactions, and reviewed information about RiverSource’s practices with respect to allocating portfolio brokerage for brokerage and research services. The Trustees considered the possible conflicts of interest associated with certain fall-out or other ancillary benefits and the reporting, disclosure and other processes that would be in place to disclose and to monitor such possible conflicts of interest. The Trustees recognized that RiverSource’s profitability would be somewhat lower without these benefits.
Conclusions
Based on their evaluation of all factors that they deemed to be material, including those factors described above, and assisted by the advice of independent counsel and the Fee Consultant, the Trustees, including the Independent Trustees, (i) approved the continuance of each of the Agreements through October 31, 2010 and (ii) approved each New Agreement.
42
Summary of Management Fee Evaluation by Independent Fee Consultant (Columbia Management Advisors, LLC)
REPORT OF INDEPENDENT FEE CONSULTANT TO THE FUNDS SUPERVISED BY THE COLUMBIA ATLANTIC BOARD
Prepared Pursuant to the February 9, 2005 Assurance of Discontinuance among the Office of Attorney General of New York State, Columbia Management Advisors, LLC, and Columbia Management Distributors, Inc. November 6, 2009
I. Overview
On February 9, 2005, Columbia Management Advisors, LLC (“CMA”) and Columbia Management Distributors, Inc.1 (“CMDI”) agreed to the New York Attorney General’s Assurance of Discontinuance (“AOD”). Among other things, the AOD stipulates that CMA may manage or advise a Columbia Fund (“Columbia Fund” and, together with some or all of such funds, the “Columbia Funds”) only if the Independent Members of the Columbia Fund’s Board of Trustees appoint a Senior Officer or retain an Independent Fee Consultant (“IFC”) who is to manage the process by which proposed management fees are negotiated. The AOD further stipulates that the Senior Officer or IFC is to prepare a written annual evaluation of the fee negotiation process.
With effect from January 1, 2007, the Independent Members of the Board of Trustees for certain Columbia Funds known collectively as the “Atlantic Funds” (together with the other members of that Board, the “Trustees”) retained me as IFC for the Atlantic Funds.2 In this capacity, I have prepared the fifth annual written evaluation of the fee negotiation process. As was the case with the 2007 and 2008 reports, my immediate predecessor as IFC, John Rea, provided invaluable assistance in the preparation of this year’s report.
A. Role of the Independent Fee Consultant
The AOD charges the IFC with “managing the process by which proposed management fees … to be charged the Columbia Fund are negotiated so that they are negotiated in a manner which is at arms’ length and reasonable and consistent with this Assurance of Discontinuance.” The AOD also provides that CMA “may manage or advise a Columbia Fund only if the reasonableness of the proposed management fees is determined by the Board of Trustees … using … an annual independent written evaluation prepared by or under the direction of … the Independent Fee Consultant.” Therefore, the AOD makes clear that the IFC does not supplant the Trustees in negotiating management fees with CMA, nor does the IFC substitute his or her judgment for that of the Trustees with respect to the reasonableness of proposed fees or any other matter that is committed to the business judgment of the Trustees.
B. Elements Involved in Managing the Fee Negotiation Process
In preparing the report required by the AOD, the IFC must consider at least the following six factors set forth in the AOD:
| 1. | The nature and quality of CMA’s services, including the Fund’s performance; |
| 2. | Management fees (including any components thereof) charged by other mutual fund companies for like services; |
| 3. | Possible economies of scale as the Fund grows larger; |
| 4. | Management fees (including any components thereof) charged to institutional and other clients of CMA for like services; |
| 5. | Costs to CMA and its affiliates of supplying services pursuant to the management fee agreements, excluding any intra-corporate profit; and |
| 6. | Profit margins of CMA and its affiliates from supplying such services. |
C. Organization of the Annual Evaluation
This report, like last year’s, focuses on the six factors and contains a section for each factor except that CMA’s costs and profits from managing the Funds are treated in a single section. In addition to a discussion of these factors, the report offers recommendations to improve the fee review process in future years. A review of the status of recommendations made in the 2008 Report is being provided separately with the materials for the October meeting.
| 1 | CMA and CMDI are subsidiaries of Columbia Management Group, LLC (“CMG”), and are the successors to the entities named in the AOD. |
| 2 | I have no material relationship with Bank of America, CMG or any of its affiliates, aside from serving as IFC, and I am aware of no material relationship with any of their affiliates. I retained John Rea, an independent economic consultant, to assist me with this report. |
| | Unless otherwise stated or required by the context, this report covers only the Atlantic Funds, which are also referred as the “Funds.” |
43
II. Summary of Findings
A. General
| 1. | Based upon my examination of the information supplied by CMG in the light of the six factors set forth in the AOD, I conclude that the Trustees have the relevant information necessary to evaluate the reasonableness of the proposed management fees for each Atlantic Fund. |
| 2. | In my view, the process by which the proposed management fees of the Funds have been negotiated in 2009 thus far has been, to the extent practicable, at arms’ length and reasonable and consistent with the AOD. |
B. Nature and Quality of Services, Including Performance
| 3. | The performance of the Funds has been relatively strong in recent years, although the one-year record was weaker than longer-term records. Based upon 1-, 3-, 5-, and 10-year returns through April 30, 2009, at least half of all the Funds were in the first and second performance quintiles in each of the three longest performance periods; for the one-year period, 40% of the Funds were in the top two quintiles. No more than 13% of the Funds were in the fifth quintile in any one performance period. Domestic equity, quantitative equity, and taxable fixed-income Funds were the strongest performers in 2009, while most foreign equity Funds lagged behind their competitors. |
| 4. | Performance rankings were similar in 2008 and 2009: the 1- and 3-year rankings declined slightly over the previous year, while the 5-year rankings improved modestly. Year over year, for the 1- and 3-year periods, the performance of equity Funds, both domestic and international, declined, while that of fixed-income Funds improved. Between three-fifths to two-thirds of the Funds changed quintile rankings in 2009 in the 1-, 3-, and 5-year performance periods. |
| 5. | The performance of the domestic equity Funds against their benchmarks was good for the 3- and 5-year performance periods. In contrast, gross returns of international equity and fixed-income Funds typically fell short of their benchmarks. The performance of equity Funds against their benchmarks was highly correlated to performance versus their peers; no such correlation was observed for fixed-income Funds. |
| 6. | The Atlantic equity Funds’ overall performance adjusted for risk was solid. Based upon 3-year returns, nearly 57% of the equity Funds had a combination of risk-adjusted and unadjusted returns that placed them in the top half of their performance universes. About one quarter of the fixed-income Funds posted high returns and low risk relative to comparable funds. Just over half of the fixed-income Funds, primarily tax-exempt Funds, took on more risk than the typical fund in their performance universes. |
| 7. | The industry-standard procedure used by Lipper that includes all share classes in the performance universe tends to bias a Fund’s ranking upward within that universe. The bias occurs because either no-12b-1 fee or low-12b-1 fee share classes of the Atlantic Funds are compared with funds in performance universes that include all share classes of multi-class funds with 12b-1 fees of up to 100 basis points. Correcting this bias by limiting the performance universe to classes of comparable funds with low or no 12b-1 fees (a “filtered universe”) lowers the relative performance for the Funds, but not to a material extent. The filtering process, however, did identify one Fund for further review that had not been identified as a review fund using unfiltered universes. Conversely, two Funds that had been identified as review funds in the unfiltered universe lost that status in filtered universes. |
| 8. | A small number of Funds have consistently underperformed over the past five years. The exact number depends on the criteria used to evaluate longer-term performance. For example, only three Funds had below-median performance in each 1- and 3-year period from 2005 to 2009. |
| 9. | The services performed by CMG professionals beyond portfolio management, such as compliance, legal, information technology, risk management, finance, and fund administration, are critical to the success of the Funds and appear to be of high quality. |
C. Management Fees Charged by Other Mutual Fund Companies
| 10. | The Funds’ management fees and total expenses are generally low relative to those of their peers, with over half of the Funds in the most favorable two quintiles. Only 26% of the Funds ranked in the two most expensive quintiles for actual management fees, and 18% in those quintiles for total expenses. Two Funds are in the fifth quintile for total |
44
| | expenses; four Funds are in the fifth quintile for actual management fees. |
| 11. | The highest concentration of low-expense Funds is found among the foreign equity Funds. The 12 former Excelsior Funds have relatively high fees and expenses, with two-thirds ranking in either the fourth or fifth quintiles for actual management fees. The higher actual management fee rankings of certain former Excelsior Funds are due in part to fee schedules that are higher than standard Columbia Fund fee schedules at current asset levels. |
| 12. | The distribution of total expense and management fee rankings has improved over the prior two years. The implementation of the voluntary standardized cap system has contributed significantly to the improved rankings in 2009. |
| 13. | The management fees of the Atlantic Funds are generally in line with those of Columbia Funds supervised by the Nations Board of Trustees (the “Nations Funds”). To the extent that Atlantic Funds have higher average fees in certain investment categories than Nations Funds, the difference reflects either differences in asset size, different fee structures of the former Excelsior Funds, or special circumstances of the Funds included in the investment categories. |
D. Trustees’ Advisory Contract Review Process
| 14. | The Trustees’ evaluation process identified 16 Funds in 2009 for further review based upon long-standing criteria relating to their relative performance or expenses or both. When compared in filtered universes, one additional Fund met the criteria for further review. CMG provided further information about each of those Funds to assist the Trustees in their evaluation. |
E. Potential Economies of Scale
| 15. | CMG presented to the Trustees its analysis of the sources and sharing of potential economies of scale. CMG views economies of scale as arising at the complex level and would regard estimates of scale economies for individual funds as unreliable. In its analysis, CMG did not identify specific sources of economies of scale or provide any estimates of any economies of scale that might arise from future asset growth. CMG’s analysis included measures taken by the Trustees and CMG that seek to share any potential economies of scale through breakpoints in management fee schedules, the establishment of expense limits for each Fund, enhanced shareholder services, fund mergers, and operational consolidation. |
| 16. | An examination of the contractual fee schedules for five Atlantic Funds shows that those with standard fee structures are generally in line with those of their competitors. The fee schedules of the former Excelsior Funds, however, have high initial fees relative to competitors but otherwise have comparable breakpoint structures. |
F. Management Fees Charged to Institutional Clients
| 17. | CMG has provided Trustees with comparisons of mutual fund management fees and institutional fees based upon standardized fee schedules and upon actual fees. The results show that, consistent with industry practice, actual and scheduled institutional fees are generally lower than the Funds’ management fees. CMG provided additional data this year demonstrating that at small asset levels, the effective fee of certain Funds may be equal to or less than institutional fee levels at those asset levels, due to the effect of expense limits on small funds with high gross expenses. CMG also analyzed the differences between the services provided and risks borne on the one hand by a manager of mutual funds and on the other by institutional advisers, and suggested that these differences should be kept in mind when Trustees review the reasonableness of the Funds’ management fees. |
G. Revenues, Expenses, and Profits
| 18. | The activity-based cost allocation methodology employed by CMG to allocate costs, both direct and indirect, for purposes of calculating Fund profitability is thoughtful and detailed. This year, CMG further refined the technique by allocating additional indirect expenses on an activity basis. |
| 19. | The materials provided on CMG’s revenues and expenses with respect to the Funds and the methodology underlying their construction form a sufficient basis for Trustees to evaluate the expenses of and profitability to CMG arising out of its relationships with the Funds. |
45
| 20. | CMG provided a firm-wide pro forma 2009 income statement demonstrating the effect of market events beginning in the fourth quarter of 2008 on its revenues and profitability to provide an additional perspective on calendar 2008 profitability data. In particular, 2008 revenues reflected the higher market prices prevailing during the first three quarters of that year, while expenses dropped due to cost cutting in the wake of the market downturn late in 2008. The continuing effects of this downturn are expected to produce a significant decline in profitability this year. |
| 21. | In 2008, CMG’s pre-tax post-distribution margin on the Atlantic Fund complex was above industry medians, based on the limited data available for publicly held mutual fund managers. However, as is to be expected in a large fund complex, some Atlantic Funds had relatively high pre-tax profit margins in 2008, when calculated solely with respect to management revenues and expenses, while other Atlantic Funds operated at a loss. There is a positive relationship between Fund size and profitability to CMG, with smaller Funds generally operating at a loss to CMG. |
| 22. | CMG pays a fixed percentage of its management fee revenues to an affiliate, U.S. Trust, Bank of America Private Wealth Management, with respect to assets of its clients invested in Atlantic Funds to compensate it for services it performs with respect to those client assets and for the effect of state law limitations on affiliates charging multiple fees. Based on our analysis of the services provided by this affiliate, we have concluded that all payments other than those for sub-transfer agent or sub-accounting services should be treated as a distribution expense. |
III. Recommendations
| 1) | Criteria for review. The Trustees may wish to consider modifying the criteria for identifying a Fund for further review (a “Review Fund”) to include criteria that focus exclusively on performance. The Trustees’ supplementary data request included one such criterion. They may also wish to consider whether it would be useful to apply CMG’s own internal monitoring standards for Fund performance to the contract review process, or whether such criteria are more relevant to their ongoing investment oversight. |
| 2) | Presentation of Review Fund discussion. CMG should consider whether it could more systematically present in one discussion all relevant information regarding each Review Fund, which is now split into several different portions of the 15(c) materials. For any Fund that has been a Review Fund in consecutive years, CMG should address under what circumstances it could reasonably be anticipated that the Fund would lose that status. |
| 3) | Refinement of tax-exempt performance data. Certain single-state tax-exempt Funds compete in extremely small universes and are compared to a multi-state benchmark of uncertain relevance. Notwithstanding the difficulties, CMG should work to improve the reliability of the calculation of relative performance of these Funds. If that is not possible, CMG should provide guidance on how the Trustees should judge the quality of CMG’s management of these Funds. |
| 4) | Development of risk metrics for asset-allocation, tax-exempt, and money market funds. CMG has developed and shared with the Trustees quantitative risk metrics comparing equity and taxable fixed-income Funds against their peers. However, reliable risk metrics have not been developed for asset-allocation, tax-exempt fixed income, and money market funds. We urge CMG to continue its efforts to provide reliable risk measures for these categories of Funds, especially in the cases of asset-allocation and money market funds, because their investors are likely to be motivated at least in part by a desire to manage risk. |
| 5) | Profitability data. For any period during which CMG is an affiliate of U.S. Trust, Bank of America Private Wealth Management, CMG should continue to present to the Trustees the profitability of each Fund, each investment style and each complex (of which Atlantic is one) calculated as follows: |
| | a. | Management-only profitability should be calculated without reference to any Private Bank expense. |
| | b. | Profitability excluding distribution (which essentially covers the management and transfer agency functions) should be adjusted by removing from the expense calculation any portion of the Private Bank payment not attributable to the performance by the Private Bank of sub-transfer agency or sub-accounting functions. |
| | c. | Total profitability, including distribution: No adjustment for Private Bank expenses should be made, because all such expenses represent legitimate fund |
46
| | expenses to be taken into account in calculating CMG’s profit margin including distribution. |
| | d. | Distribution only: This should include all Private Bank expenses other than those attributable to sub-transfer agency services. |
| 6) | Contractual fee analysis. This year CMG presented a new Lipper report comparing the contractual management fees of Funds with those of competitors in similar investment styles. However, the reliability of the conclusion – that Fund management fee breakpoints compared favorably with competitive fee rates – was limited by the use of competitive funds at all asset levels. The sponsors of a $100 million mutual fund may not have given much thought to breakpoints at $5 billion; therefore, that fund’s contractual fee at that level is unlikely to compare favorably with that of a $5 billion Fund. Limiting the competitors to the Lipper expense group, whose constituents are similar in size to the relevant Fund, would make the results more meaningful. In addition, the breakpoints of a select group of Atlantic Funds (which would differ each year) should continue to be compared to those of industry rivals to ensure that the Funds’ breakpoint schedules remain within industry norms. As breakpoint schedules change relatively little each year, performing such a comparison for each Atlantic Fund each year would not be an efficient use of Trustee and CMG resources. |
| 7) | Pro forma profitability data. In any year in which CMG or the Trustees believe that the prior year’s profitability is unlikely to be representative of current business results due to changes in markets or for any other reason, CMG should, consistent with this year’s practice, prepare a pro forma income statement based on year-to-date actual data and reasonable projections used for its own business planning purposes. |
| 8) | Additional institutional data and analysis. While CMG provided a substantial amount of information on its institutional business, including a virtually complete database of all institutional accounts, we suggest some additional items for future years: (a) profitability data for the institutional business in the format, and based upon the same allocation methodologies, used to present Fund profitability, (b) an explanation of how CMA sets institutional fee breakpoints, which normally begin at asset levels far lower than those found in Fund management fee breakpoints, and (c) an analysis of differences in actual fees within specific investment categories, with special attention given to accounts established before and after the implementation of the standardized institutional fee schedules in 2005. |
| 9) | Management fee disparities. In any future study of management fees, CMG and the Atlantic Trustees should analyze the differences in management fee schedules, including those arising out of the reorganization of the former Excelsior Funds as Atlantic Funds. As part of that analysis, CMG should provide an explanation for any significant fee differences among comparable funds across fund families sponsored by CMG, such as differences in the management styles of different Funds included the same Lipper category. Finally, if CMG proposes a management fee change or an expense cap for any mutual fund managed by CMA that is comparable to any Atlantic Fund, CMG should provide the Trustees with sufficient information about the proposal to allow the Trustees to assess the applicability of the proposed change to the relevant Atlantic Fund or Funds. |
| 10) | Explanation of data supplied to Lipper. Each year, as part of the 15(c) process, CMG retains Lipper to compare the fees and expenses of each Fund to a group of competitors. In many cases, CMG, with the approval of the Trustees, adjusts the actual expense data, which is based on the most recent full fiscal year of the Fund (and each competitive fund) to reflect changes in fees or expense limits that occurred during or after the relevant fiscal year. This improves the reliability and usefulness of the comparison. However, to ensure that the Trustees know when and how CMG adjusted the data, we recommend that CMG prepare a table listing for each Fund what adjustments were made, e.g., to reflect a new expense limitation of x basis points that commenced on y date. |
Reduction of volume of paper documents submitted. The effort to streamline and better organize the data presented to the Trustees and the process by which that data was prepared and organized continued to be well-received by all parties. Notwithstanding past success, it is always appropriate to look for opportunities to reduce and simplify the presentation of 15(c) data. One possibility would be to remove the 124 pages of biographical data, most if not all of which the Trustees have
47
previously seen as part of their ongoing investment oversight duties, from the paper volume and post it on the Internet-based document storage and retrieval system used by the Funds to provide reference data to Trustees.
Respectfully Submitted,
Steven E. Asher
48
Summary of Management Fee Evaluation by Independent Fee Consultant (RiverSource Investments, LLC)
REPORT OF INDEPENDENT FEE CONSULTANT TO THE FUNDS SUPERVISED BY THE COLUMBIA ATLANTIC BOARD
Prepared Pursuant to the February 9, 2005 Assurance of Discontinuance among the Office of Attorney General of New York State, Columbia Management Advisors, LLC, and Columbia Management Distributors, Inc. December 21, 2009
I. Overview
On February 9, 2005, Columbia Management Advisors, LLC (“CMA”) and Columbia Management Distributors, Inc.1 (“CMD”) agreed to the New York Attorney General’s Assurance of Discontinuance (“AOD”). Among other things, the AOD stipulates that CMA may manage or advise a Columbia Fund (“Columbia Fund” and, together with some or all of such funds, the “Columbia Funds”) only if the Independent Members of the Columbia Fund’s Board of Trustees appoint a Senior Officer or retain an Independent Fee Consultant (“IFC”) who is to manage the process by which proposed management fees are negotiated. The AOD further stipulates that the Senior Officer or IFC is to prepare a written annual evaluation of the fee negotiation process.
With effect from January 1, 2007, the Independent Members of the Board of Trustees for certain Columbia Funds known collectively as the “Atlantic Funds” (together with the other members of that Board, the “Trustees”) retained me as IFC for the Atlantic Funds.2 In this capacity, I have prepared this written evaluation of the fee negotiation process. As was the case with the last three annual reports, my immediate predecessor as IFC, John Rea, provided invaluable assistance in the preparation of this report.
On September 29, 2009, Ameriprise entered into an asset purchase agreement with Bank of America, N.A. and its parent, Bank of America Corporation (together, the “Bank”) pursuant to which the Bank agreed to sell certain CMG assets relating to Columbia’s long-term asset management business, including management of the Atlantic Funds (the “Transaction”).3 The Transaction if completed would result in the termination of the existing Investment Management Agreements with CMA. Therefore, the Trustees have been requested to approve and recommend to the shareholders of each Atlantic Fund new Investment Management and Sub-Advisory Agreements (together, the “Management Agreements”) with RiverSource Investments, LLC (“RI”),4 investment manager of the RiverSource Funds and a subsidiary of Ameriprise. This report is intended to fulfill the requirements of the AOD with respect to the Trustees’ consideration of the new Management Agreements.
A. Role of the Independent Fee Consultant
The AOD charges the IFC with “managing the process by which proposed management fees … to be charged the Columbia Fund are negotiated so that they are negotiated in a manner which is at arms’ length and reasonable and consistent with this Assurance of Discontinuance.” The AOD also provides that CMA “may manage or advise a Columbia Fund only if the reasonableness of the proposed management fees is determined by the Board of Trustees … using … an annual independent written evaluation prepared by or under the direction of … the Independent Fee Consultant.” Therefore, the AOD makes clear that the IFC does not supplant the Trustees in negotiating management fees with CMA (or RI), nor does the IFC substitute his or her judgment for that of the Trustees with respect to the reasonableness of proposed fees or any other matter that is committed to the business judgment of the Trustees.
| 1 | CMA and CMD are subsidiaries of Columbia Management Group, LLC (“CMG”), and are the successors to the entities named in the AOD. |
| 2 | I have no material relationship with Bank of America, CMG or Ameriprise Financial, Inc. (“Ameriprise”), aside from serving as IFC, and I am aware of no material relationship with any of their affiliates. I retained John Rea, an independent economic consultant, to assist me with this report. |
| | Unless otherwise stated or required by the context, this report covers only the Atlantic Funds. |
| 3 | Preliminary Response of Ameriprise to Information Request of Columbia Atlantic Board dated October 21, 2009 (hereafter, the “Preliminary Response”), p. 1. The one money market Atlantic Fund, Money Market Fund VS, was included in the Transaction because it was an integral part of CMG’s array of Funds used as investment vehicles by variable annuity and similar insurance products. |
| 4 | Ameriprise intends to re-brand RI with the “Columbia” name (which is one of the assets being sold in the Transaction). Preliminary Response, pp. 4-5. In the case of new Sub-Advisory Agreements, the current sub-adviser would also be a party. |
49
B. Elements Involved in Managing the Fee Negotiation Process
In preparing the report required by the AOD, the IFC must consider at least the following six factors set forth in the AOD:
| 1. | The nature and quality of the adviser’s services, including the Fund’s performance; |
| 2. | Management fees (including any components thereof) charged by other mutual fund companies for like services; |
| 3. | Possible economies of scale as the Fund grows larger; |
| 4. | Management fees (including any components thereof) charged to institutional and other clients of the adviser for like services; |
| 5. | Costs to the adviser and its affiliates of supplying services pursuant to the management fee agreements, excluding any intra-corporate profit; and |
| 6. | Profit margins of the adviser and its affiliates from supplying such services. |
C. Data Presented to the Trustees
In considering the proposed new Management Agreements with RI, the Trustees relied in part on the data that had been prepared as part of their annual contract review process, which concluded in late October. This data remained relevant because the fees in the proposed Management Agreements were identical to the fees approved at that time. The annual review materials included a Lipper report on the performance of each Atlantic Fund compared to its peers and its benchmark, comparisons of the fees and expenses of each Atlantic Fund to similar CMG-sponsored Funds, comparable competitive funds chosen by Lipper, and institutional accounts advised by CMA, revenues, expenses, and profits of CMG from managing the Atlantic Funds, calculated both by Fund and collectively, and CMG’s views on the existence and sharing of economies of scale.
In addition, the Trustees reviewed materials specific to the proposed new Management Agreements with RI in response to requests for information made on behalf of the Trustees, including the following:
| n | | Performance data for the RiverSource Funds showing percentile and quartile rankings of each fund within its Lipper performance universe for periods up to five years and net returns of each fund relative to its benchmark returns. This data was arguably relevant due to the possibility that some RiverSource investment teams would be providing investment management services to certain Columbia Funds. 5 |
| n | | tables comparing the fee schedules and effective fee rates of funds managed by CMA and RI and institutional accounts advised by the two firms. |
| n | | extensive discussion of the process by which the various components of the two asset management businesses would be integrated including investment management, compliance, transfer agency, custody, fund accounting, and distribution. |
| n | | information about the financial condition of Ameriprise, including its most recent annual report on Form 10-K, RI’s profit margins from managing the RiverSource Funds in 2007 and 2008, and pro forma income statements for the combined Columbia and RiverSource fund complex. |
| n | | disclosure that certain senior CMG executives, including President Michael Jones, Chief Investment Officer Colin Moore, Head of Mutual Funds J. Kevin Connaughton, and Chief Compliance Officer Linda Wondrack would continue in analogous capacities following the consummation of the Transaction, and |
| n | | a breakdown of the synergies RI expects to realize in the two years following the Transaction and the extent to which those potential synergies are expected to be shared with shareholders of funds advised by RI. |
II. Findings
| 1. | Based upon my examination of the information supplied by CMG and Ameriprise in the light of the six factors set forth in the AOD, I conclude that the Trustees have the relevant information necessary to evaluate the reasonableness of the proposed management fees for each Atlantic Fund. |
| 2. | In my view, the process by which the proposed management fees of the Atlantic Funds have been negotiated with RI thus far has been, to the extent practicable, at arms’ length and reasonable and consistent with the AOD. |
Respectfully submitted,
Steven E. Asher
| 5 | On page 20 of its Supplemental Response to the Atlantic Trustees (undated but delivered November 24, 2009), Ameriprise said that “most personnel decisions, including with respect to the portfolio management teams for the Atlantic Funds … will be made primarily by [current CMA CIO] Colin Moore using the Columbia 5P process.” |
50
Proxy Voting Results
On March 3, 2010, a special meeting of shareholders of Columbia Funds Series Trust I was held to consider the approval of several proposals listed in the proxy statement for the meeting. Proposal 1 and Proposal 2 were voted on at the March 3, 2010 meeting of shareholders and Proposal 3 was voted on at an adjourned meeting of shareholders held on March 31, 2010. The shareholder meeting results are as follows:
Proposal 1: A proposed Investment Management Services Agreement with Columbia Management Investment Advisers, LLC (formerly, RiverSource Investments, LLC) (CMIA) was approved as follows:
| | | | | | |
| | | | | | | |
| Votes For | | Votes Against | | Abstentions | | Broker Non-Votes |
| 258,851,101 | | 4,641,210 | | 711,380 | | 9,087,374 |
Proposal 2: A proposal authorizing CMIA to enter into and materially amend subadvisory agreements for the Fund in the future, with the approval of the Trust’s Board of Trustees, but without obtaining additional shareholder approval, was approved as follows:
| | | | | | |
| | | | | | | |
| Votes For | | Votes Against | | Abstentions | | Broker Non-Votes |
| 254,751,798 | | 8,402,503 | | 1,049,397 | | 9,087,367 |
Proposal 3: Each of the nominees for trustees was elected to the Trust’s Board of Trustees, as follows:
| | | | | | |
| | | | | | | |
| Trustee | | Votes For | | Votes Withheld | | Abstentions |
| John D. Collins | | 30,977,072,412 | | 859,827,038 | | 0 |
| Rodman L. Drake | | 30,951,179,004 | | 885,720,446 | | 0 |
| Douglas A. Hacker | | 30,989,793,279 | | 847,106,171 | | 0 |
| Janet Langford Kelly | | 30,999,020,814 | | 837,878,636 | | 0 |
| William E. Mayer | | 16,291,139,483 | | 15,545,759,967 | | 0 |
| Charles R. Nelson | | 30,997,700,700 | | 839,198,750 | | 0 |
| John J. Neuhauser | | 30,988,095,661 | | 848,803,789 | | 0 |
| Jonathon Piel | | 30,968,801,048 | | 868,098,402 | | 0 |
| Patrick J. Simpson | | 30,999,065,030 | | 837,834,420 | | 0 |
| Anne-Lee Verville | | 30,996,227,913 | | 840,671,537 | | 0 |
51
[THIS PAGE INTENTIONALLY LEFT BLANK]
52
Important Information About This Report
Transfer Agent*
Columbia Management Investment Services Corp.
P.O. Box 8081
Boston, MA 02266-8081
1-800-345-6611
Distributor*
Columbia Management Investment
Distributors, Inc.
One Financial Center
Boston, MA 02111
Investment Advisor*
Columbia Management Investment Advisers, LLC
100 Federal Street
Boston, MA 02110
* As of May 1, 2010.
The fund mails one shareholder report to each shareholder address. If you would like more than one report, please call shareholder services at 1-800-345-6611 and additional reports will be sent to you. This report has been prepared for shareholders of Columbia Short-Intermediate Bond Fund.
A description of the policies and procedures that the fund uses to determine how to vote proxies and a copy of the fund’s voting records are available (i) at www.columbiamanagement.com, (ii) on the Securities and Exchange Commission’s website at www.sec.gov, and (iii) without charge, upon request, by calling 1-800-368-0346. Information regarding how the fund voted proxies relating to portfolio securities during the 12-month period ended June 30 is available from the SEC’s website. Information regarding how the fund voted proxies relating to portfolio securities is also available from the fund’s website columbiamanagement.com.
The fund files a complete schedule of portfolio holdings with the SEC for the first and third quarters of each fiscal year on Form N-Q. The fund’s Form N-Q is available on the SEC’s website at www.sec.gov and may be reviewed and copied at the SEC’s Public Reference Room in Washington, D.C. Information on the operation of the Public Reference Room may be obtained by calling
1-800-SEC-0330.
Investors should consider the investment objectives, risks, charges and expenses of a mutual fund carefully before investing. For a free prospectus, which contains this and other important information about the funds, visit columbiamanagement.com. Read the prospectus carefully before investing.
On April 30, 2010, Ameriprise Financial, Inc., the parent company of RiverSource Investments, LLC, acquired the long-term asset management business of Columbia Management Group, LLC, including certain of its affiliates, which were, prior to this acquisition, part of Bank of America. In connection with the acquisition of the long-term assets, the Columbia Funds have a new investment adviser, RiverSource Investments, LLC, which is now known as Columbia Management Investment Advisers, LLC. For those clients that use the services of a subadviser, those arrangements are continuing unless notified otherwise. RiverSource Fund Distributors, Inc., now known as Columbia Management Investment Distributors, Inc., member FINRA, will act as the principal distributor of the Columbia Funds.
53

One Financial Center
Boston, MA 02111-2621
Columbia Short-Intermediate Bond Fund
Annual Report , March 31, 2010
©2010 Columbia Management Investment Advisers, LLC. All rights reserved.
One Financial Center, Boston, MA 02111-2621
800.345.6611 www.columbiafunds.com
SHC-42/44308-0310 (05/10) 10/EOW1T5
| | (a) | The registrant has, as of the end of the period covered by this report, adopted a code of ethics that applies to the registrant’s principal executive officer, principal financial officer, principal accounting officer or controller, or persons performing similar functions, regardless of whether these individuals are employed by the registrant or a third party. |
| | (b) | During the period covered by this report, there were not any amendments to a provision of the code of ethics adopted in 2(a) above. | |
| | (c) | During the period covered by this report, there were no waivers, including any implicit waivers, from a provision of the code of ethics described in 2(a) above that relates to one or more of the items set forth in paragraph (b) of this item’s instructions. |
| Item 3. | Audit Committee Financial Expert. |
The registrant’s Board of Trustees has determined that John D. Collins, Douglas A. Hacker, Charles R. Nelson and Anne-Lee Verville, each of whom are members of the registrant’s Board of Trustees and Audit Committee, each qualify as an audit committee financial expert. Mr. Collins, Mr. Hacker, Mr. Nelson and Ms. Verville are each independent trustees, as defined in paragraph (a)(2) of this item’s instructions.
| Item 4. | Principal Accountant Fees and Services. |
Fee information below is disclosed for the sixteen series of the registrant whose report to stockholders are included in this annual filing.
(a) Audit Fees. Aggregate Audit Fees billed by the principal accountant for professional services rendered during the fiscal years ended March 31, 2010 and March 31, 2009 are approximately as follows:
| | | | |
| 2010 | | 2009 |
| $ | 471,100 | | $ | 468,600 |
Audit Fees include amounts related to the audit of the registrant’s annual financial statements or services that are normally provided by the accountant in connection with statutory and regulatory filings or engagements for those fiscal years. In fiscal year 2010, Audit Fees also include fees for the review of and provision of consent in connection with filing Form N-1A for one fund.
(b) Audit-Related Fees. Aggregate Audit-Related Fees billed to the registrant by the principal accountant for professional services rendered during the fiscal years ended March 31, 2010 and March 31, 2009 are approximately as follows:
Audit-Related Fees include amounts for assurance and related services by the principal accountant that are reasonably related to the performance of the audit of the registrant’s financial statements and are not reported in Audit Fees above. In both fiscal years 2010 and 2009, Audit-Related Fees consist of agreed-upon procedures performed for semi-annual shareholder reports.
During the fiscal years ended March 31, 2010 and March 31, 2009, there were no Audit-Related Fees billed by the registrant’s principal accountant to the registrant’s investment adviser (not including any sub-adviser whose role is primarily portfolio management and is subcontracted with or overseen by another investment adviser) and any entity controlling, controlled by, or under common control with the adviser that provides ongoing services to the registrant for an engagement that related directly to the operations and financial reporting of the registrant.
(c) Tax Fees. Aggregate Tax Fees billed by the principal accountant to the registrant for professional services rendered during the fiscal years ended March 31, 2010 and March 31, 2009 are approximately as follows:
Tax Fees include amounts for the review of annual tax returns, the review of required shareholder distribution calculations and typically include amounts for professional services by the principal accountant for tax compliance, tax advice and tax planning. In fiscal year 2010, Tax Fees also include fees for the review of foreign tax filings.
During the fiscal years ended March 31, 2010 and March 31, 2009, there were no Tax Fees billed by the registrant’s principal accountant to the registrant’s investment adviser (not including any sub-adviser whose role is primarily portfolio management and is subcontracted with or overseen by another investment adviser) and any entity controlling, controlled by, or under common control with the adviser that provides ongoing services to the registrant for an engagement that related directly to the operations and financial reporting of the registrant.
(d) All Other Fees. Aggregate All Other Fees billed by the principal accountant to the registrant for professional services rendered during the fiscal years ended March 31, 2010 and March 31, 2009 are approximately as follows:
All Other Fees include amounts for products and services provided by the principal accountant, other than the services reported in paragraphs (a) through (c) above.
Aggregate All Other Fees billed by the registrant’s principal accountant to the registrant’s investment adviser (not including any sub-adviser whose role is primarily portfolio management and is subcontracted with or overseen by another investment adviser) and any entity controlling, controlled by, or under common control with the adviser that provides ongoing services to the registrant for an engagement that related directly to the operations and financial reporting of the registrant during the fiscal years ended March 31, 2010 and March 31, 2009 are approximately as follows:
| | | | |
| 2010 | | 2009 |
| $ | 1,129,400 | | $ | 893,100 |
In both fiscal years 2010 and 2009, All Other Fees consist of fees billed for internal control examinations of the registrant’s transfer agent and investment advisor. Fiscal year 2010 also includes fees for agreed upon procedures related to the sale of the long-term asset management business and fees related to the review of revenue modeling schedules.
(e)(1) Audit Committee Pre-Approval Policies and Procedures
The registrant’s Audit Committee is required to pre-approve the engagement of the registrant’s independent accountants to provide audit and non-audit services to the registrant and non-audit services to its investment adviser (not including any sub-adviser whose role is primarily portfolio management and is subcontracted with or overseen by another investment adviser) or any entity controlling, controlled by or under common control with such investment adviser that provides ongoing services to the registrant (“Adviser Affiliates”), if the engagement relates directly to the operations and financial reporting of the registrant.
The Audit Committee has adopted a Policy for Engagement of Independent Accountants for Audit and Non-Audit Services (“Policy”). The Policy sets forth the understanding of the Audit Committee regarding the engagement of the registrant’s independent accountants to provide (i) audit and permissible audit-related, tax and other services to the registrant (collectively “Fund Services”); (ii) non-audit services to the registrant’s investment adviser (not including any sub-adviser whose role is primarily portfolio management and is subcontracted with or overseen by another investment adviser) and Adviser Affiliates, if the engagement relates directly to the operations or financial reporting of a Fund (collectively “Fund-related Adviser Services”); and (iii) certain other audit and non-audit services to the registrant’s investment adviser (not including any sub-adviser whose role is primarily portfolio management and is subcontracted with or overseen by another investment adviser) and Adviser Affiliates.
Unless a type of service receives general pre-approval under the Policy, it requires specific pre-approval by the Audit Committee if it is to be provided by the independent accountants. Pre-approval of non-audit services to the registrant, the registrant’s investment adviser (not including any sub-adviser whose role is primarily portfolio management and is subcontracted with or overseen by another investment adviser) and Adviser Affiliates may be waived provided that the “de minimis” requirements set forth under paragraph (c)(7)(i)(C) of Rule 2-01 of Regulation S-X are met.
Under the Policy, the Audit Committee may delegate pre-approval authority to any pre-designated member or members who are Independent Trustees/Directors. The member(s) to whom such authority is delegated must report, for informational purposes only, any pre-approval decisions to the Audit Committee at its next regular meeting. The Audit Committee’s responsibilities with respect to the pre-approval of services performed by the independent accountants may not be delegated to management.
The Policy requires the Fund Treasurer and/or Director of Board Administration to submit to the Audit Committee, on an annual basis, a schedule of the types of services that are subject to general pre-approval. The schedule(s) provide a description of each type of service that is subject to general pre-approval and, where possible, will provide estimated fee caps for each instance of providing each service. The Audit Committees will review and approve the types of services and review the projected fees for the next fiscal year and may add to, or subtract from, the list of general pre-approved services from time to time based on subsequent determinations. That approval acknowledges that the Audit Committee is in agreement with the specific types of services that the independent accountants will be permitted to perform.
The Fund Treasurer and/or Director of Board Administration shall report to the Audit Committee at each of its regular meetings regarding all Fund Services or Fund-related Adviser Services initiated since the last such report was rendered, including a general description of the services, actual billed and projected fees, and the means by which such Fund Services or Fund-related Adviser Services were pre-approved by the Audit Committee.
*****
(e)(2) The percentage of services described in paragraphs (b) through (d) of this Item approved pursuant to the “de minimis” exception under paragraph (c)(7)(i)(C) of Rule 2-01 of Regulation S-X during both fiscal years ended March 31, 2010 and March 31, 2009 was zero.
(f) Not applicable.
(g) The aggregate non-audit fees billed by the registrant’s accountant for services rendered to the registrant, and rendered to the registrant’s investment adviser (not including any sub-adviser whose role is primarily portfolio management and is subcontracted with or overseen by another investment adviser), and any entity
controlling, controlled by, or under common control with the adviser that provides ongoing services to the registrant for the fiscal years ended March 31, 2010 and March 31, 2009 are approximately as follows:
| | | | |
| 2010 | | 2009 |
| $ | 1,274,200 | | $ | 1,040,700 |
(h) The registrant’s Audit Committee of the Board of Directors has considered whether the provision of non-audit services that were rendered to the registrant’s adviser (not including any sub-adviser whose role is primarily portfolio management and is subcontracted with or overseen by another investment adviser), and any entity controlling, controlled by, or under common control with the investment adviser that provides ongoing services to the registrant that were not pre-approved pursuant to paragraph (c)(7)(ii) of Rule 2-01 of Regulation S-X, is compatible with maintaining the principal accountant’s independence.
| Item 5. | Audit Committee of Listed Registrants. |
Not applicable.
| | (a) | The registrant’s “Schedule I – Investments in securities of unaffiliated issuers” (as set forth in 17 CFR 210.12-12) is included in Item 1 of this Form N-CSR. |
| Item 7. | Disclosure of Proxy Voting Policies and Procedures for Closed-End Management Investment Companies. |
Not applicable.
| Item 8. | Portfolio Managers of Closed-End Management Investment Companies. |
Not applicable.
| Item 9. | Purchases of Equity Securities by Closed-End Management Investment Company and Affiliated Purchasers. |
Not applicable.
| Item 10. | Submission of Matters to a Vote of Security Holders. |
There have not been any material changes to the procedures by which shareholders may recommend nominees to the registrant’s board of directors, since those procedures were last disclosed in response to requirements of Item 407(c)(2)(iv) of Regulation S-K (as required by Item 22(b)(15) of Schedule 14A) or this Item.
| Item 11. | Controls and Procedures. |
| | (a) | The registrant’s principal executive officer and principal financial officers, based on their evaluation of the registrant’s disclosure controls and procedures as of a date within 90 days of the filing of this report, have concluded that such controls and procedures are adequately designed to ensure that information required to be disclosed by the registrant in Form N-CSR is accumulated and communicated to the registrant’s management, including the principal executive officer and principal financial officer, or persons performing similar functions, as appropriate to allow timely decisions regarding required disclosure. |
| | (b) | There was no change in the registrant’s internal control over financial reporting that occurred during the registrant’s second fiscal quarter of the period covered by this report that has materially affected, or is reasonably likely to materially affect, the registrant’s internal control over financial reporting. |
(a)(1) Code of ethics required to be disclosed under Item 2 of Form N-CSR attached hereto as Exhibit 99.CODE ETH.
(a)(2) Certifications pursuant to Rule 30a-2(a) under the Investment Company Act of 1940 (17 CFR 270.30a-2(a)) attached hereto as Exhibit 99.CERT.
(a)(3) Not applicable.
(b) Certification pursuant to Rule 30a-2(b) under the Investment Company Act of 1940 (17 CFR 270.30a-2(b)) attached hereto as Exhibit 99.906CERT.
SIGNATURES
Pursuant to the requirements of the Securities Exchange Act of 1934 and the Investment Company Act of 1940, the registrant has duly caused this report to be signed on its behalf by the undersigned, thereunto duly authorized.
(registrant) Columbia Funds Series Trust I
| | |
| By (Signature and Title) | | /s/ J. Kevin Connaughton |
| | J. Kevin Connaughton, President |
Date May 21, 2010
Pursuant to the requirements of the Securities Exchange Act of 1934 and the Investment Company Act of 1940, this report has been signed below by the following persons on behalf of the registrant and in the capacities and on the dates indicated.
| | |
| By (Signature and Title) | | /s/ J. Kevin Connaughton |
| | J. Kevin Connaughton, President |
Date May 21, 2010
| | |
| By (Signature and Title) | | /s/ Michael G. Clarke |
| | Michael G. Clarke, Chief Financial Officer |
Date May 21, 2010