UNITED STATES
SECURITIES AND EXCHANGE COMMISSION
Washington, D.C. 20549
FORM N-CSR
CERTIFIED SHAREHOLDER REPORT OF REGISTERED
MANAGEMENT INVESTMENT COMPANIES
Investment Company Act file number | 811-04367 |
|
Columbia Funds Series Trust I |
(Exact name of registrant as specified in charter) |
|
One Financial Center, Boston, Massachusetts | | 02111 |
(Address of principal executive offices) | | (Zip code) |
|
James R. Bordewick, Jr., Esq. Columbia Management Advisors, LLC One Financial Center Boston, MA 02111 |
(Name and address of agent for service) |
|
Registrant’s telephone number, including area code: | 1-617-426-3750 | |
|
Date of fiscal year end: | September 30 | |
|
Date of reporting period: | September 30, 2009 | |
| | | | | | | | |
Form N-CSR is to be used by management investment companies to file reports with the Commission not later than 10 days after the transmission to stockholders of any report that is required to be transmitted to stockholders under Rule 30e-1 under the Investment Company Act of 1940 (17 CFR 270.30e-1). The Commission may use the information provided on Form N-CSR in its regulatory, disclosure review, inspection, and policymaking roles.
A registrant is required to disclose the information specified by Form N-CSR, and the Commission will make this information public. A registrant is not required to respond to the collection of information contained in Form N-CSR unless the Form displays a currently valid Office of Management and Budget ("OMB") control number. Please direct comments concerning the accuracy of the information collection burden estimate and any suggestions for reducing the burden to Secretary, Securities and Exchange Commission, 450 Fifth Street, NW, Washington, DC 20549-0609. The OMB has reviewed this collection of information under the clearance requirements of 44 U.S.C. § 3507.
Item 1. Reports to Stockholders.
Columbia Management®
Annual Report
September 30, 2009
Stock Funds
g Columbia Asset Allocation Fund
g Columbia Large Cap Growth Fund
g Columbia Disciplined Value Fund
g Columbia Contrarian Core Fund
g Columbia Small Cap Core Fund
| NOT FDIC INSURED | | May Lose Value | |
|
| NOT BANK ISSUED | | No Bank Guarantee | |
|
Table of contents
| Economic Update | | | 1 | | |
|
| Columbia Asset Allocation Fund | | | 3 | | |
|
| Columbia Large Cap Growth Fund | | | 8 | | |
|
| Columbia Disciplined Value Fund | | | 13 | | |
|
| Columbia Contrarian Core Fund | | | 18 | | |
|
| Columbia Small Cap Core Fund | | | 23 | | |
|
| Financial Statements | |
|
| Investment Portfolios | | | 28 | | |
|
Statements of Assets and
Liabilities | | | 64 | | |
|
| Statements of Operations | | | 66 | | |
|
Statements of Changes in
Net Assets | | | 68 | | |
|
| Financial Highlights | | | 75 | | |
|
| Notes to Financial Statements | | | 103 | | |
|
Report of Independent
Registered Public Accounting
Firm | | | 120 | | |
|
| Federal Income Tax Information | | | 121 | | |
|
| Fund Governance | | | 122 | | |
|
Important Information About
This Report | | | 129 | | |
|
The views expressed in this report reflect the current views of the respective parties. These views are not guarantees of future performance and involve certain risks, uncertainties and assumptions that are difficult to predict, so actual outcomes and results may differ significantly from the views expressed. These views are subject to change at any time based upon economic, market or other conditions and the respective parties disclaim any responsibility to update such views. These views may not be relied on as investment advice and, because investment decisions for a Columbia Fund are based on numerous factors, may not be relied on as an indication of trading intent on behalf of any particular Columbia Fund. References to specific securities should not be construed as a recommendation or investment advice.
President's Message

Dear Shareholder:
We are pleased to provide this shareholder report detailing your fund's performance, portfolio holdings and financial statements. We hope this information is helpful in monitoring your investments as we work through these challenging economic times. We recognize that you have entrusted us with your money and want you to know that our professional investment teams work to interpret the latest economic and market trends with the goal of optimizing portfolio construction for our clients.
The first half of 2009 was defined by extremes. The multiyear lows we witnessed in the early months gave way to a stunning rally for the U.S. financial markets in the spring. A global market rebound may be underway, thanks to the massive fiscal and aggressive monetary policies of governments around the world. In the third quarter, the S&P 500 Index1 was up 15.61%. We believe this challenging economic environment makes it even more important to work with professional money managers while continuing to invest for life events like retirement, college planning, home improvements and career changes.
Retirement income planning has become an increasingly significant focus in the lives of millions of Americans. Recent economic conditions make it even more important to manage short-term obligations such as mortgages, monthly bills and credit card debt while also taking the steps necessary to prepare for or maximize retirement benefits. Better nutrition and medical services can result in U.S. citizens living longer, healthier lives. This means the risk of outliving one's assets in retirement is very real without proper planning. Financial security and retirement planning is an ongoing process that requires active management of your savings, investments and risks. We encourage you to review your retirement plan regularly so you'll be better able to meet your retirement needs in the future.
We recognize that economic uncertainty creates great challenges for many investors. Our professional investment teams work diligently to help investors navigate through difficult markets. Thank you for your business and for the opportunity to work together towards your investment goals.
Sincerely,

J. Kevin Connaughton
President, Columbia Funds
On September 29, 2009, Bank of America Corporation entered into an agreement to sell a portion of the asset management business of Columbia Management Group, LLC. Please see Note 4 of the Notes to Financial Statements for additional information.
Past performance is no guarantee of future results.
1The Standard & Poor's (S&P) 500 Index tracks the performance of 500 widely held, large-capitalization U.S. stocks. Indices are not available for investment, are not professionally managed and do not reflect sales charges, fees, brokerage commissions, taxes or other expenses of investing. Securities in the funds may not match those in an index.
Economic Update – Stock Funds
During the 12-month period that began October 1, 2008 and ended September 30, 2009, the U.S. economy faced the worst financial crisis since the Great Depression, then steadied itself as steps taken by a new administration began to show results in the second half of the period. Economic growth, as measured by gross domestic product (GDP), contracted by approximately 6% between October 2008 and March 2009. The lapse from growth resulted in the longest and most severe recession in nearly three decades. However, growth turned positive in the third quarter ended September 30, 2009. The initial estimate of third quarter GDP was 3.5%.
The labor market shed more than seven million jobs between 2008 and 2009, raising the unemployment rate to 9.8% and wiping out all of the jobs gained since the last recession. Manufacturing activity slowed through most of the period, but it turned up in July and August, as did consumer spending. The beleaguered housing market showed some signs of stabilizing. Pending home sales, a leading indicator of housing activity increased for eight straight months to end the period, buoyed by low interest rates and an $8,000 first-time homebuyer tax credit. Existing home sales rose, but gave back some of their strong gains late in the period. The inventory of unsold houses also fell sharply over the period. Late in 2008, consumer confidence, as measured by the Conference Board,1 plummeted to its lowest point ever. However, it has since stabilized and turned higher near the end of the period.
Troubles that began in the U.S. subprime mortgage market resulted in a meltdown within the U.S. financial sector that claimed several major institutions in 2008 and led others to seek bailouts, restructuring or both. New rigorous lending standards severely limited access to credit, further hampering economic growth. In this environment, a new administration sought to stabilize the financial system, address economic woes and introduce sweeping health care reform. Stimulus spending began to flow into the economy, raising hopes that growth would be restored. In December 2008, the Federal Reserve Board (the Fed) lowered a key short-term borrowing rate—the federal funds rate—to between zero and 0.25%—a record low. In light of protracted economic weakness and virtually no inflation, the Fed made no further change to the federal funds rate during the period.
Stocks retreated, then rebounded
Against a weakening economic backdrop, the U.S. stock market lost 6.91% for the 12-month period, as measured by the S&P 500® Index. Losses affected the stocks of companies of all sizes and investment style categories, as measured by their respective Russell indices.2 Stock markets outside the U.S. were modestly to significantly higher than the U.S. market. The MSCI EAFE Index,3 a broad gauge of stock market performance in foreign developed markets, gained 3.23% (in U.S. dollars) for the period.
1The Conference Board is a not-for-profit global independent membership organization. It conducts research, convenes conferences, makes forecasts, assesses trends and publishes information and analyses.
2The Russell 1000 Index tracks the performance of 1,000 of the largest U.S. companies, based on market capitalization. The Russell MidCap Index measures the performance of the 800 smallest companies in the Russell 1000 Index, which represents approximately 25% of the total market capitalization of the Russell 1000 Index. The Russell 2000 Index measures the performance of the 2,000 smallest companies in the Russell 3000 Index, which represents approximately 8% of the total market capitalization of the Russell 3000 Index.
3The Morgan Stanley Capital International Europe, Australasia, Far East (MSCI EAFE) Index is a capitalization-weighted index that tracks the total return of common stocks in 21 developed-market countries within Europe, Australasia and the Far East.
Summary
For the 12-month period that ended September 30, 2009
g Domestic stocks lost ground, as measured by the S&P 500® Index, but cut their losses in a rebound that began half way through the period. International stocks moved higher, as measured by the MSCI EAFE Index.
| S&P Index | | MSCI Index | |
|
 | |  | |
|
g As investors appeared to exhibit more tolerance for risk, the Barclays Capital Aggregate Bond Index delivered solid results. High-yield bonds rebounded strongly, as measured by the JPMorgan Developed BB High Yield Index.
Barclays
Aggregate
Index | | JPMorgan
Index | |
|
 | |  | |
|
1
Economic Update (continued) – Stock Funds
Emerging stock markets were also caught in the downdraft, but bounced back stronger than domestic or developed world markets in 2009. The MSCI EMI4 returned 19.07% (in U.S. dollars).
Bonds outperformed domestic stocks
As investors sought refuge from a volatile stock market, the highest-quality sectors of the U.S. bond market delivered solid gains. During the first half of the period, Treasury prices rose and yields declined sharply as the economy faltered and stock market volatility increased. As hopes for a recovery materialized in the second half of the period, yields rose and Treasuries lagged behind riskier segments of the bond market. The benchmark 10-year U.S. Treasury yield began the period at 3.8%, declined to 2.2% in December 2008, then rose to end the period at 3.3%. In this environment, the Barclays Capital Aggregate Bond Index5 returned 10.56%. High-yield bond prices fell sharply in 2008 as economic prospects weakened and default fears rose, then rebounded strongly in 2009. For the 12-month period, the JPMorgan Developed BB High Yield Index6 returned 16.36%.
Past performance is no guarantee of future results.
4The Morgan Stanley Capital International Emerging Markets Index (MSCI EMI) is a free float-adjusted market capitalization index that is designed to measure equity market performance in the global emerging markets. As of June 2006, the MSCI Emerging Markets Index consisted of the following 25 emerging market country indices: Argentina, Brazil, Chile, China, Colombia, Czech Republic, Egypt, Hungary, India, Indonesia, Israel, Jordan, Korea, Malaysia, Mexico, Morocco, Pakistan, Peru, Philippines, Poland, Russia, South Africa, Taiwan, Thailand and Turkey.
5The Barclays Capital Aggregate Bond Index is a market value-weighted index that tracks the daily price, coupon, pay-downs, and total return performance of fixed-rate, publicly placed, dollar-denominated, and non-convertible investment grade debt issues with at least $250 million par amount outstanding and with at least one year to final maturity.
6The JPMorgan Developed BB High Yield Index is an unmanaged index designed to mirror the investable universe of the U.S. dollar developed, BB-rated, high yield corporate debt market.
Indices are not available for investment, are not professionally managed and do not reflect sales charges, fees, brokerage commissions, taxes or other expenses of investing. Securities in the fund may not match those in an index.
2
Fund Profile – Columbia Asset Allocation Fund
Summary
g For the 12-month period that ended September 30, 2009, the fund's Class A shares returned 2.63% without sales charge.
g The fund outperformed the average return of its peer group, the Lipper Mixed-Asset Target Allocation Growth Funds Classification1, which was 0.73%. Its equity benchmark, the S&P 500® Index2, returned negative 6.91%. Its fixed income benchmark, the Barclays Capital Aggregate Bond Index3, returned 10.56%.
g Both the fund's large-cap and small-cap value positions beat their benchmarks, as did the fund's investment-grade bond portfolio. We believe that exposure to emerging-markets stocks and high-yield bonds, both of which were strong performers during the rally, also helped performance relative to the peer group.
Portfolio Management
Anwiti Bahuguna, PhD, has co-managed the fund since 2009 and has been associated with the advisor or its predecessors since 2002.
Colin Moore has co-managed the fund since 2008 and has been associated with the advisor or its predecessors since 2002.
Kent M. Peterson, PhD, has co-managed the fund since 2009 and has been associated with the advisor or its predecessors since January 2006.
Marie M. Schofield has co-managed the fund since 2009 and has been associated with the advisor or its predecessors since 1990.
1Lipper Inc., a widely respected data provider in the industry, calculates an average total return (assuming reinvestment of distributions) for mutual funds with investment objectives similar to those of the fund. Lipper makes no adjustment for the effect of sales loads.
2The Standard & Poor's (S&P) 500® Index tracks the performance of 500 widely held, large-capitalization U.S. stocks.
3The Barclays Capital Aggregate Bond Index is a market value-weighted index that tracks the daily price, coupon, pay-downs and total return performance of fixed-rate, publicly placed, dollar-denominated, and non-convertible investment grade debt issues with at least $250 million par amount outstanding and with at least one year to final maturity.
Indices are not available for investment, are not professionally managed and do not reflect sales charges, fees, brokerage commissions, taxes or other expenses of investing. Securities in the fund may not match those in an index.
Performance data quoted represents past performance and current performance may be lower or higher. Past performance is no guarantee of future results. The investment return and principal value will fluctuate so that shares, when redeemed, may be worth more or less than the original cost. Please visit www.columbiafunds.com for daily and most recent month-end performance updates.
Summary
1-year return as of 09/30/09
| | +2.63% | |
|
| |  | | | Class A shares
(without sales charge) | |
|
| | –6.91% | |
|
| |  | | | S&P 500® Index | |
|
| | +10.56% | |
|
| |  | | | Barclays Capital
Aggregate Bond Index | |
|
3
Performance Information – Columbia Asset Allocation Fund
Performance data quoted represents past performance and current performance may be lower or higher. Past performance is no guarantee of future results. The investment return and principal value will fluctuate so that shares, when redeemed, may be worth more or less than the original cost. Please visit www.columbiafunds.com for daily and most recent month-end performance updates.
Annual operating expense ratio (%)*
| Class A | | | 1.29 | | |
| Class B | | | 2.04 | | |
| Class C | | | 2.04 | | |
| Class T | | | 1.34 | | |
| Class Z | | | 1.04 | | |
* The annual operating expense ratio is as stated in the fund's prospectus that is current as of the date of this report. Differences in expense ratios disclosed elsewhere in this report may result from including fee waivers and expense reimbursements as well as different time periods used in calculating the ratios.
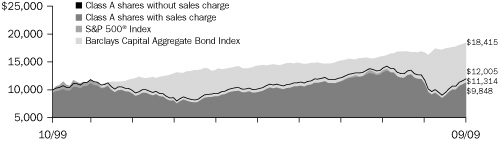
Performance of a $10,000 investment 10/01/99 – 09/30/09
 | |
|
The chart above shows the change in value of a hypothetical $10,000 investment in Class A shares of Columbia Asset Allocation Fund during the stated time period, and does not reflect the deduction of taxes that a shareholder may pay on fund distributions or on the redemption of fund shares. The Standard & Poor's (S&P) 500® Index tracks the performance of 500 widely held, large-capitalization U.S. stocks. The Barclays Capital Aggregate Bond Index is a market value-weighted index that tracks the daily price, coupon, pay-downs, and total return performance of fixed-rate, publicly placed, dollar-denominated, and non-convertible investment grade debt issues with at least $250 million par amount outstanding and with at least one year to final maturity. Indices are not available for investment, are not professionally managed and do not reflect sales charges, fees, brokerage commissions, taxes or other expenses of investing. Securities in the fund may not match those in an index.
Performance of a $10,000 investment 10/01/99 – 09/30/09 ($)
| Sales charge | | without | | with | |
| Class A | | | 12,005 | | | | 11,314 | | |
| Class B | | | 11,155 | | | | 11,155 | | |
| Class C | | | 11,155 | | | | 11,155 | | |
| Class T | | | 11,938 | | | | 11,251 | | |
| Class Z | | | 12,331 | | | | n/a | | |
Average annual total return as of 09/30/09 (%)
| Share class | | A | | B | | C | | T | | Z | |
| Inception | | 11/01/98 | | 11/01/98 | | 11/18/02 | | 12/30/91 | | 12/30/91 | |
| Sales charge | | without | | with | | without | | with | | without | | with | | without | | with | | without | |
| 1-year | | | 2.63 | | | | –3.29 | | | | 1.79 | | | | –3.21 | | | | 1.79 | | | | 0.79 | | | | 2.50 | | | | –3.41 | | | | 3.21 | | |
| 5-year | | | 3.24 | | | | 2.02 | | | | 2.45 | | | | 2.15 | | | | 2.45 | | | | 2.45 | | | | 3.17 | | | | 1.95 | | | | 3.57 | | |
| 10-year | | | 1.84 | | | | 1.24 | | | | 1.10 | | | | 1.10 | | | | 1.10 | | | | 1.10 | | | | 1.79 | | | | 1.19 | | | | 2.12 | | |
The "with sales charge" returns include the maximum initial sales charge of 5.75% for Class A and Class T shares and the applicable contingent deferred sales charge of 5.00% in the first year, declining to 1.00% in the sixth year and eliminated thereafter for Class B shares and 1.00% for Class C shares for the first year only. The "without sales charge" returns do not include the effect of sales charges. If they had, returns would be lower.
Performance results reflect any fee waivers or reimbursements of fund expenses by the investment advisor and/or any of its affiliates. Absent these fee waivers or expense reimbursement arrangements, performance results would have been lower.
All results shown assume reinvestment of distributions. Class Z shares are sold at net asset value with no distribution and service (Rule 12b-1) fees. Class Z shares have limited eligibility and the investment minimum requirements may vary. Please see the fund's prospectus for details. Performance for different share classes will vary based on differences in sales charges and fees associated with each class.
The tables do not reflect the deduction of taxes that a shareholder may pay on fund distributions or on the redemption of fund shares.
Class A, Class B, Class C, Class T and Class Z share performance information includes returns of Prime A shares (for Class A shares), Prime B shares (for Class B and Class C shares), Retail A shares (for Class T shares) and Trust shares (for Class Z shares) of Galaxy Asset Allocation Fund, the predecessor to the Fund and a series of the Galaxy Fund (the "Predecessor Fund"), for periods prior to November 18, 2002, the date on which Class A, Class B, Class C, Class T and Class Z shares were initially offered by the Fund. These returns shown for all share classes reflect any differences in sales charges, but have not been restated to reflect any differences in expenses between the Predecessor Fund share classes and the corresponding newer share classes. If differences in expenses had been reflected, the returns shown for periods prior to November 18, 2002 would be lower for Class A, Class B and Class C shares.
4
Understanding Your Expenses – Columbia Asset Allocation Fund
As a fund shareholder, you incur two types of costs. There are transaction costs, which generally include sales charges on purchases and may include redemption fees or exchange fees. There are also ongoing costs, which generally include investment advisory fees, distribution and service (Rule 12b-1) fees and other fund expenses. The information on this page is intended to help you understand the ongoing costs of investing in the fund and to compare these costs with the ongoing costs of investing in other mutual funds.
Analyzing your fund's expenses by share class
To illustrate these ongoing costs, we have provided an example and calculated the expenses paid by investors in each share class during the period. The information in the following table is based on an initial investment of $1,000, which is invested at the beginning of the period and held for the entire period. Expense information is calculated two ways and each method provides you with different information. The amount listed in the "Actual" column is calculated using the fund's actual operating expenses and total return for the period. The amount listed in the "Hypothetical" column for each share class assumes that the return each year is 5% before expenses and is calculated based on the fund's actual operating expenses. You should not use the hypothetical account values and expenses to estimate either your actual account balance at the end of the period or the expenses you paid during this period.
Compare with other funds
Since all mutual funds are required to include the same hypothetical calculations about expenses in shareholder reports, you can use this information to compare the ongoing costs of investing in the fund with other funds. To do so, compare the 5% hypothetical example with the 5% hypothetical examples that appear in the shareholder reports of other funds. As you compare hypothetical examples of other funds, it is important to note that hypothetical examples are meant to highlight the ongoing costs of investing in a fund and do not reflect any transaction costs, such as sales charges, redemption fees or exchange fees.
Estimating your actual expenses
To estimate the expenses that you paid over the period, first you will need your account balance at the end of the period:
g For shareholders who receive their account statements from Columbia Management Services, Inc., your account balance is available online at www.columbiafunds.com or by calling Shareholder Services at 800.345.6611.
g For shareholders who receive their account statements from their financial intermediary, contact your financial intermediary to obtain your account balance.
1. Divide your ending account balance by $1,000. For example, if an account balance was $8,600 at the end of the period, the result would be 8.6.
2. In the section of the table below titled "Expenses paid during the period," locate the amount for your share class. You will find this number in the column labeled "Actual." Multiply this number by the result from step 1. Your answer is an estimate of the expenses you paid on your account during the period.
If the value of your account falls below the minimum initial investment requirement applicable to you, your account generally will be subject to a $20 annual fee. This fee is not included in the accompanying table. If you are subject to the fee, keep it in mind when you are estimating the ongoing expenses of investing in the fund and when comparing the expenses of this fund with other funds.
04/01/09 – 09/30/09
| | | Account value at the
beginning of the period ($) | | Account value at the
end of the period ($) | | Expenses paid
during the period ($) | | Fund's annualized
expense ratio (%) | |
| | | Actual | | Hypothetical | | Actual | | Hypothetical | | Actual | | Hypothetical | | Actual | |
| Class A | | | 1,000.00 | | | | 1,000.00 | | | | 1,261.31 | | | | 1,019.05 | | | | 6.80 | | | | 6.07 | | | | 1.20 | | |
| Class B | | | 1,000.00 | | | | 1,000.00 | | | | 1,254.60 | | | | 1,015.29 | | | | 11.02 | | | | 9.85 | | | | 1.95 | | |
| Class C | | | 1,000.00 | | | | 1,000.00 | | | | 1,254.60 | | | | 1,015.29 | | | | 11.02 | | | | 9.85 | | | | 1.95 | | |
| Class T | | | 1,000.00 | | | | 1,000.00 | | | | 1,258.51 | | | | 1,018.80 | | | | 7.08 | | | | 6.33 | | | | 1.25 | | |
| Class Z | | | 1,000.00 | | | | 1,000.00 | | | | 1,261.51 | | | | 1,020.31 | | | | 5.39 | | | | 4.81 | | | | 0.95 | | |
Expenses paid during the period are equal to the annualized expense ratio for the share class, multiplied by the average account value over the period, then multiplied by the number of days in the fund's most recent fiscal half-year and divided by 365.
Had the investment advisor and/or any of its affiliates not waived fees or reimbursed a portion of expenses, account value at the end of the period would have been reduced.
It is important to note that the expense amounts shown in the table are meant to highlight only ongoing costs of investing in the fund and do not reflect any transaction costs, such as sales charges, redemption fees or exchange fees. Therefore, the hypothetical examples provided may not help you determine the relative total costs of owning shares of different funds. If these transaction costs were included, your costs would have been higher.
5
Portfolio Managers' Report – Columbia Asset Allocation Fund
Performance data quoted represents past performance and current performance may be lower or higher. Past performance is no guarantee of future results. The investment return and principal value will fluctuate so that shares, when redeemed, may be worth more or less than the original cost. Please visit www.columbiafunds.com for daily and most recent month-end performance updates.
Net asset value per share
as of 09/30/09 ($)
| Class A | | | 12.61 | | |
| Class B | | | 12.60 | | |
| Class C | | | 12.60 | | |
| Class T | | | 12.61 | | |
| Class Z | | | 12.66 | | |
Distributions declared per share
10/01/08 – 09/30/09 ($)
| Class A | | | 0.25 | | |
| Class B | | | 0.17 | | |
| Class C | | | 0.17 | | |
| Class T | | | 0.24 | | |
| Class Z | | | 0.28 | | |
For the 12-month period that ended September 30, 2009, the fund's Class A shares returned 2.63% without sales charge. That was higher than the average return of the fund's peer group, the Lipper Mixed-Asset Target Allocation Growth Funds Classification, which was 0.73%. The fund's equity benchmark, the S&P 500® Index, returned negative 6.91%. The fund's fixed income benchmark, the Barclays Capital Aggregate Bond Index, returned 10.56%. Outperformance from investment-grade bonds, as well as small-cap value and large-cap value stocks, aided results. Investments in high-yield bonds, as well as in emerging-markets stocks, also helped performance, particularly in the second half of the period.
Turnaround by emerging-markets stocks and high-yield bonds
The investment market rout that began in the fall of 2008 continued into March, driven by deteriorating economic data, concerns over large financial company balance sheets, frozen credit markets, a weak housing market and rising unemployment. However, in the spring of 2009, stocks took off, buoyed by hopes that an economic recovery would be fueled by unprecedented fiscal and monetary stimulus. Bonds also rallied, benefiting from historically low interest rates and a growing sense of confidence among investors. Higher-risk sectors, including emerging-markets stocks and high-yield bonds, led the rebound. Despite substantial gains in the second half of the period, equities closed the fiscal year in negative territory, lagging the positive returns posted by bonds.
Strength from corporate bond sector
Over the year, we increased the fund's fixed-income allocation from roughly 40% of assets to 48%. More than one-third of assets were in investment-grade corporate bonds, which posted strong positive gains that outperformed the return of the Barclays index. Exposure to high-yield bonds was also positive, although behind the 16.36% return of the JPMorgan Global High Yield Index.1
Gained ground from large-cap and value stocks
The fund benefited from having between 30% and 40% of its assets in large-cap stocks, which were not down as much as small-cap stocks for the period. The fund's large-cap holdings were split equally between the growth and value disciplines. Within large cap, growth stocks held up much better than value stocks. The fund picked up ground from its large-cap value holdings, which were not down as much as their benchmark, the Russell 1000 Value Index.2 The portfolio's large-cap growth allocation, however, was down slightly more than the modest decline of its benchmark, the Russell 1000 Growth Index.3 We kept 10% of assets in mid- and small-cap stocks and 10% in overseas markets, with an overweight in emerging markets that proved helpful. Most of these
1The JPMorgan Global High Yield Index is designed to mirror the investable universe of the U.S. dollar global high yield corporate debt market, including domestic and international issues.
2The Russell 1000 Value Index measures the performance of those Russell 1000 Index companies with lower price-to-book ratios and lower forecasted growth values.
3The Russell 1000 Growth Index measures the performance of those Russell 1000 Index companies with higher price-to-book ratios and higher forecasted growth values.
6
Portfolio Managers' Report (continued) – Columbia Asset Allocation Fund
positions trailed their respective benchmarks, with the exception of small-cap value, which held up better than the negative 12.61% return of the Russell 2000 Value Index.4
Strategic changes to fund allocations
As economic data began to stabilize late in the period, we decided to reduce the fund's overweights in areas that had led the rebound, namely small-cap and emerging-markets equities. Late in the period, the fund gained the ability to invest in Treasury Inflation Protected Securities (TIPS) as well as commodity-related derivative instruments, futures, exchange-traded funds (ETFs) and third-party advised mutual funds. We hope to use these less traditional asset classes to reduce portfolio risk, particularly in periods of financial turmoil. At period end, the fund had a small stake in TIPS as well as commodity ETFs, contributing to a shift in positioning from 60% equities/40% fixed income and cash early on to 52% equities/ 45% fixed-income and cash/3% commodities at period end.
Portfolio holdings and characteristics are subject to change periodically and may not be representative of current holdings and characteristics. The outlook for the fund may differ from those presented for other Columbia Funds.
Equity investments are affected by stock market fluctuations that occur in response to economic and business developments.
Investments in high-yield or "junk" bonds offer the potential for higher income than investments in investment-grade bonds, but also involve a higher degree of risk. Changes in economic conditions or other circumstances may adversely affect a high-yield bond issuer's ability to make timely principal and interest payments. High-yield bonds issued by foreign entities have greater potential risks, including less regulation, currency fluctuations, economic instability and political developments.
The fund may be subject to the same types of risks associated with direct ownership of real estate, including the decline of property values due to general, local and regional economic conditions.
International investing may involve certain risks, including currency fluctuations, risks associated with possible differences in financial accounting standards and other monetary and political risks. Significant levels of foreign taxes, including potentially confiscatory levels of taxation and withholding taxes, may also apply to some foreign investments.
4The Russell 2000 Value Index tracks the performance of those Russell 2000 Index companies with lower price-to-book ratios and lower forecasted growth values.
Indices are not available for investment, are not professionally managed and do not reflect sales charges, fees, brokerage commissions, taxes or other expenses of investing. Securities in the fund may not match those in an index.
Top 5 equity sectors
as of 09/30/09 (%)
| Financials | | | 9.4 | | |
| Information Technology | | | 8.7 | | |
| Industrials | | | 5.7 | | |
| Health Care | | | 5.7 | | |
| Consumer Discretionary | | | 5.7 | | |
Top 10 equity holdings
as of 09/30/09 (%)
| JPMorgan Chase & Co. | | | 0.9 | | |
| Microsoft Corp. | | | 0.6 | | |
| Exxon Mobil Corp. | | | 0.6 | | |
| International Business | |
| Machines | | | 0.6 | | |
| Goldman Sachs Group | | | 0.6 | | |
| Philip Morris International | | | 0.6 | | |
| Apple | | | 0.5 | | |
| EMC | | | 0.5 | | |
| United Technologies | | | 0.5 | | |
| J.C. Penney | | | 0.5 | | |
Portfolio structure
as of 09/30/09 (%)
| Common Stocks | | | 51.4 | | |
Corporate Fixed-Income
Bonds & Notes | | | 13.5 | | |
| Mortgage-Backed Securities | | | 11.9 | | |
Government & Agency
Obligations | | | 7.7 | | |
Commercial Mortgage-
Backed Securities | | | 4.1 | | |
Collateralized Mortgage
Obligations | | | 2.8 | | |
| Commodities | | | 2.5 | | |
| Asset-Backed Securities | | | 1.4 | | |
| Convertible Preferred Stock | | | 0.2 | | |
| Investment Company | | | 0.1 | | |
| Preferred Stock | | | 0.1 | | |
| Convertible Bond | | | 0.0 | * | |
| Rights | | | 0.0 | * | |
| Purchased Put Options | | | 0.0 | * | |
Cash Equivalent, Net Other
Assets & Liabilities | | | 4.3 | | |
* Rounds to less than 0.1%
The fund is actively managed and the composition of its portfolio will change over time. Information provided is calculated as a percentage of net assets.
7
Fund Profile – Columbia Large Cap Growth Fund
Performance data quoted represents past performance and current performance may be lower or higher. Past performance is no guarantee of future results. The investment return and principal value will fluctuate so that shares, when redeemed, may be worth more or less than the original cost. Please visit www.columbiafunds.com for daily and most recent month-end performance updates.
Summary
1-year return as of 09/30/09
| | –3.97% | |
|
| |  | | | Class A shares
(without sales charge) | |
|
| | –1.85% | |
|
| |  | | | Russell 1000 Growth Index | |
|
Morningstar Style BoxTM
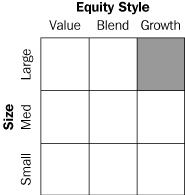
The Morningstar Style BoxTM reveals a fund's investment strategy. For equity funds, the vertical axis shows the market capitalization of the stocks owned, and the horizontal axis shows investment style (value, blend or growth). Information shown is based on the most recent data provided by Morningstar.
Summary
g For the 12-month period that ended September 30, 2009, the fund's Class A shares returned negative 3.97% without sales charge.
g The fund underperformed its benchmark, the Russell 1000 Growth Index1, and the average return of its peer group, the Lipper Large-Cap Growth Funds Classification.2
g Stock selection in the energy, telecommunications and consumer discretionary sectors detracted from relative performance. Stock selection in utilities, information technology and financials contributed positively to relative returns.
Portfolio Management
John T. Wilson, lead manager, has co-managed the fund since August 2005 and has been associated with the advisor or its predecessors since July 2005.
Roger R. Sullivan has co-managed the fund since June 2005 and has been associated with the advisor or its predecessors since January 2005.
1The Russell 1000 Growth Index measures the performance of those Russell 1000 Index companies with higher price-to-book ratios and higher forecasted growth values. Indices are not available for investment, are not professionally managed and do not reflect sales charges, fees, brokerage commissions, taxes or other expenses of investing. Securities in the fund may not match those in an index.
2Lipper, Inc. a widely respected data provider in the industry, calculates an average total return (assuming reinvestment of distributions) for mutual funds with investment objectives similar to those of the fund. Lipper makes no adjustment for the effect of sales loads.
8
Performance Information – Columbia Large Cap Growth Fund
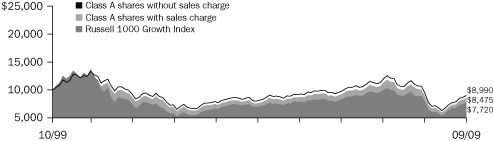
Performance of a $10,000 investment 10/01/99 – 09/30/09
The chart above shows the change in value of a hypothetical $10,000 investment in Class A shares of Columbia Large Cap Growth Fund during the stated time period, and does not reflect the deduction of taxes that a shareholder may pay on fund distributions or on the redemption of fund shares. The Russell 1000 Growth Index measures the performance of those Russell 1000 Index companies with higher price-to-book ratios and higher forecasted growth values. Indices are not available for investment, are not professionally managed and do not reflect sales charges, fees, brokerage commissions, taxes or other expenses of investing. Securities in the fund may not match those in an index.
Performance of a $10,000 investment 10/01/99 – 09/30/09 ($)
| Sales charge | | without | | with | |
| Class A | | | 8,990 | | | | 8,475 | | |
| Class B | | | 8,313 | | | | 8,313 | | |
| Class C | | | 8,322 | | | | 8,322 | | |
| Class E | | | 8,960 | | | | 8,557 | | |
| Class F | | | 8,313 | | | | 8,313 | | |
| Class T | | | 8,888 | | | | 8,376 | | |
| Class Y | | | 9,201 | | | | n/a | | |
| Class Z | | | 9,201 | | | | n/a | | |
Performance data quoted represents past performance and current performance may be lower or higher. Past performance is no guarantee of future results. The investment return and principal value will fluctuate so that shares, when redeemed, may be worth more or less than the original cost. Please visit www.columbiafunds.com for daily and most recent month-end performance updates.
Annual operating expense ratio (%)*
| Class A | | | 1.18 | | |
| Class B | | | 1.93 | | |
| Class C | | | 1.93 | | |
| Class E | | | 1.28 | | |
| Class F | | | 1.93 | | |
| Class T | | | 1.23 | | |
| Class Y | | | 0.68 | | |
| Class Z | | | 0.93 | | |
* The annual operating expense ratio is as stated in the fund's prospectus that is current as of the date of this report and includes the expenses incurred by the investment companies in which the fund invests. Differences in expense ratios disclosed elsewhere in this report may result from including fee waivers and expense reimbursements as well as different time periods used in calculating the ratios.
Average annual total return as of 09/30/09 (%)
| Share class | | A | | B | | C | | E | | F | | T | | Y | | Z | |
| Inception | | 11/01/98 | | 11/01/98 | | 11/18/02 | | 09/22/06 | | 09/22/06 | | 12/14/90 | | 07/15/09 | | 12/14/90 | |
| Sales charge | | without | | with | | without | | with | | without | | with | | without | | with | | without | | with | | without | | with | | without | | without | |
| 1-year | | | –3.97 | | | | –9.47 | | | | –4.68 | | | | –9.45 | | | | –4.68 | | | | –5.63 | | | | –4.09 | | | | –8.40 | | | | –4.69 | | | | –9.45 | | | | –4.02 | | | | –9.51 | | | | –3.71 | | | | –3.71 | | |
| 5-year | | | 2.01 | | | | 0.81 | | | | 1.26 | | | | 0.89 | | | | 1.24 | | | | 1.24 | | | | 1.94 | | | | 1.00 | | | | 1.25 | | | | 0.88 | | | | 1.96 | | | | 0.76 | | | | 2.27 | | | | 2.27 | | |
| 10-year | | | –1.06 | | | | –1.64 | | | | –1.83 | | | | –1.83 | | | | –1.82 | | | | –1.82 | | | | –1.09 | | | | –1.55 | | | | –1.83 | | | | –1.83 | | | | –1.17 | | | | –1.76 | | | | –0.83 | | | | –0.83 | | |
The "with sales charge" returns include the maximum initial sales charge of 5.75% for Class A and Class T shares, 4.50% for Class E shares and the applicable contingent deferred sales charge of 5.00% in the first year, declining to 1.00% in the sixth year and eliminated thereafter for Class B and Class F shares and 1.00% for Class C shares for the first year only. The "without sales charge" returns do not include the effect of sales charges. If they had, returns would be lower.
Performance results reflect any fee waivers or reimbursements of fund expenses by the investment advisor and/or any of its affiliates. Absent these fee waivers or expense reimbursement arrangements, performance results would have been lower.
All results shown assume reinvestment of distributions. Class Y and Class Z shares are sold at net asset value with no distribution and service (Rule 12b-1) fees. Class Y and Class Z shares have limited eligibility and the investment minimum requirements may vary. Please see the fund's prospectus for details. Performance for different share classes will vary based on differences in sales charges and fees associated with each class.
The tables do not reflect the deduction of taxes that a shareholder may pay on fund distributions or on the redemption of fund shares.
Class A, Class B, Class C, Class T and Class Z share performance information includes returns of Prime A shares (for Class A shares), Prime B shares (for Class B and Class C shares), Retail A shares (for Class T shares) and Trust shares (for Class Z shares) of Galaxy Equity Growth Fund, the predecessor to the Fund and a series of the Galaxy Fund (the "Predecessor Fund"), for periods prior to November 18, 2002, the date on which Class A, Class B, Class C, Class T and Class Z shares were initially offered by the Fund. Class E and Class F share performance information includes returns of Class A shares (for Class E shares) and Class B shares (for Class F shares) for the period from November 18, 2002 through September 21, 2006, and the returns of Prime A shares (for Class E shares) and Prime B shares (for Class F shares) for periods prior thereto. These returns shown for all share classes reflect any differences in sales charges, bu t have not been restated to reflect any differences in expenses between the Predecessor Fund share classes and the corresponding newer share classes. If differences in expenses had been reflected, the returns shown for periods prior to November 18, 2002 would be lower for Class A, Class B and Class C shares.
The returns for Class Y shares include the returns for Class Z shares for the period from November 18, 2002 until July 15, 2009, and Trust share of the predecessor Fund for periods prior thereto. The returns shown have not been adjusted to reflect any differences in expenses between Class Y shares and Class Z shares. If differences in expenses had been reflected, the returns shown would be higher. Class Y shares were initially offered on July 15, 2009.
9
Understanding Your Expenses – Columbia Large Cap Growth Fund
Estimating your actual expenses
To estimate the expenses that you paid over the period, first you will need your account balance at the end of the period:
g For shareholders who receive their account statements from Columbia Management Services, Inc., your account balance is available online at www.columbiafunds.com or by calling Shareholder Services at 800.345.6611.
g For shareholders who receive their account statements from their financial intermediary, contact your financial intermediary to obtain your account balance.
1. Divide your ending account balance by $1,000. For example, if an account balance was $8,600 at the end of the period, the result would be 8.6.
2. In the section of the table below titled "Expenses paid during the period," locate the amount for your share class. You will find this number in the column labeled "Actual." Multiply this number by the result from step 1. Your answer is an estimate of the expenses you paid on your account during the period.
If the value of your account falls below the minimum initial investment requirement applicable to you, your account generally will be subject to a $20 annual fee. This fee is not included in the accompanying table. If you are subject to the fee, keep it in mind when you are estimating the ongoing expenses of investing in the fund and when comparing the expenses of this fund with other funds.
As a fund shareholder, you incur two types of costs. There are transaction costs, which generally include sales charges on purchases and may include redemption fees or exchange fees. There are also ongoing costs, which generally include investment advisory fees, distribution and service (Rule 12b-1) fees and other fund expenses. The information on this page is intended to help you understand the ongoing costs of investing in the fund and to compare these costs with the ongoing costs of investing in other mutual funds.
Analyzing your fund's expenses by share class
To illustrate these ongoing costs, we have provided an example and calculated the expenses paid by investors in each share class during the period. The information in the following table is based on an initial investment of $1,000, which is invested at the beginning of the period and held for the entire period. Expense information is calculated two ways and each method provides you with different information. The amount listed in the "Actual" column is calculated using the fund's actual operating expenses and total return for the period. The amount listed in the "Hypothetical" column for each share class assumes that the return each year is 5% before expenses and is calculated based on the fund's actual operating expenses. You should not use the hypothetical account values and expenses to estimate either your actual account balance at the end of the period or the expenses you paid during this period.
Compare with other funds
Since all mutual funds are required to include the same hypothetical calculations about expenses in shareholder reports, you can use this information to compare the ongoing costs of investing in the fund with other funds. To do so, compare the 5% hypothetical example with the 5% hypothetical examples that appear in the shareholder reports of other funds. As you compare hypothetical examples of other funds, it is important to note that hypothetical examples are meant to highlight the ongoing costs of investing in a fund and do not reflect any transaction costs, such as sales charges, redemption fees or exchange fees.
04/01/09 – 09/30/09
| | | Account value at the
beginning of the period ($) | | Account value at the
end of the period ($) | | Expenses paid
during the period ($) | | Fund's annualized
expense ratio (%) | |
| | | Actual | | Hypothetical | | Actual | | Hypothetical | | Actual | | Hypothetical | | Actual | |
| Class A | | | 1,000.00 | | | | 1,000.00 | | | | 1,323.68 | | | | 1,019.65 | | | | 6.29 | | | | 5.47 | | | | 1.08 | | |
| Class B | | | 1,000.00 | | | | 1,000.00 | | | | 1,318.62 | | | | 1,015.89 | | | | 10.64 | | | | 9.25 | | | | 1.83 | | |
| Class C | | | 1,000.00 | | | | 1,000.00 | | | | 1,318.42 | | | | 1,015.89 | | | | 10.64 | | | | 9.25 | | | | 1.83 | | |
| Class E | | | 1,000.00 | | | | 1,000.00 | | | | 1,322.68 | | | | 1,019.15 | | | | 6.87 | | | | 5.97 | | | | 1.18 | | |
| Class F | | | 1,000.00 | | | | 1,000.00 | | | | 1,317.82 | | | | 1,015.89 | | | | 10.63 | | | | 9.25 | | | | 1.83 | | |
| Class T | | | 1,000.00 | | | | 1,000.00 | | | | 1,322.88 | | | | 1,019.40 | | | | 6.58 | | | | 5.72 | | | | 1.13 | | |
| Class Y | | | 1,000.00 | | | | 1,000.00 | | | | 1,128.10 | * | | | 1,021.91 | | | | 1.43 | * | | | 3.19 | | | | 0.63 | | |
| Class Z | | | 1,000.00 | | | | 1,000.00 | | | | 1,325.09 | | | | 1,020.91 | | | | 4.84 | | | | 4.20 | | | | 0.83 | | |
Expenses paid during the period are equal to the annualized expense ratio for the share class, multiplied by the average account value over the period, then multiplied by the number of days in the fund's most recent fiscal half-year and divided by 365.
It is important to note that the expense amounts shown in the table are meant to highlight only ongoing costs of investing in the fund and do not reflect any transaction costs, such as sales charges, redemption fees or exchange fees. Therefore, the hypothetical examples provided may not help you determine the relative total costs of owning shares of different funds. If these transaction costs were included, your costs would have been higher.
*For the period from July 15, 2009 through September 30, 2009. Class Y shares commenced operations on July 15, 2009.
10
Portfolio Managers' Report – Columbia Large Cap Growth Fund
For the 12-month period that ended September 30, 2009, the fund's Class A shares returned negative 3.97% without sales charge. The fund's benchmark, the Russell 1000 Growth Index, returned negative 1.85%. The average return of funds in its peer group, the Lipper Large Cap Growth Funds Classification, was negative 2.72%. In a period of heightened volatility, stock selection detracted from performance relative to the index. In a changing market environment, we continued to maintain a high level of diversification, emphasizing companies with strong balance sheets, low debt and ample free cash flow.
Stock selection across several sectors detracted from returns
In the energy sector, Hess (0.7% of net assets) and Schlumberger were disappointments. Hess, an oil exploration and production company, owned part of a substantial oil find off the coast of Brazil. Investors turned more cautious on the short-term prospects for these Brazilian operations. Schlumberger, an oil field service company, lost ground as the price of oil declined. We maintained the fund's position in Hess but sold Schlumberger.
In the telecommunication services sector, NII Holdings, a Latin American mobile service provider, pushed returns lower. Demand for texting and other data usage has become strong in Latin America. As a result, that market has become increasingly competitive. This "Darwinian" environment created investor concern about future market share and profitability for NII, and we sold the stock.
A weak economy drove consumer discretionary shares lower, and three fund holdings were caught in this decline: Urban Outfitters, Wynn Resorts—both of which we sold—and Lowe's (1.1% of net assets). We held onto Lowe's because we believe its prospects should improve as the economy strengthens and the housing market stabilizes.
Utilities, information technology and financial stocks were positive contributors
Certain stocks in the utilities, information technology and financials sectors helped offset losses elsewhere in the portfolio. In utilities, AES (1.0% of net assets), one of the world's largest power companies, soared. Generating power in 29 countries—primarily emerging markets—the company benefited from the deployment of stimulus money as emerging market countries rebuilt their infrastructures. Economic recoveries in emerging market countries, such as China, have exceeded our expectations.
In the technology sector, Apple (3.4 of net assets) shares climbed, as iPhone sales were strong even in the face of a weak economy. Despite its strong gains, we believe Apple has more room for growth. EMC (1.3 of net assets), the data storage giant, also gave returns a lift. EMC benefited from the anticipation of an improvement in technology spending. Search engine Google (3.0% of net assets) also did well, gaining market share at the expense of weaker competitors.
In the financials sector, the fund gained ground from positions in both Goldman Sachs Group and Morgan Stanley (0.8% and 1.5% of net assets, respectively), which also gained market share at the expense of weaker competitors. Both companies generated solid revenues and demonstrated their intent to come out ahead after the recent financial meltdown. Additionally, Goldman paid back money it received from the federal government's Troubled Asset Relief Program (TARP).
Performance data quoted represents past performance and current performance may be lower or higher. Past performance is no guarantee of future results. The investment return and principal value will fluctuate so that shares, when redeemed, may be worth more or less than the original cost. Please visit www.columbiafunds.com for daily and most recent month-end performance updates.
Net asset value per share
as of 09/30/09 ($)
| Class A | | | 18.77 | | |
| Class B | | | 17.30 | | |
| Class C | | | 17.31 | | |
| Class E | | | 18.73 | | |
| Class F | | | 17.29 | | |
| Class T | | | 18.64 | | |
| Class Y | | | 19.20 | | |
| Class Z | | | 19.20 | | |
Distributions declared per share
10/01/08 – 09/30/09 ($)
| Class A | | | 0.02 | | |
| Class E | | | — | * | |
| Class Z | | | 0.06 | | |
* Round to less than $0.01.
11
Portfolio Managers' Report (continued) – Columbia Large Cap Growth Fund
Top 5 sectors
as of 09/30/09 (%)
| Information Technology | | | 33.3 | | |
| Health Care | | | 15.1 | | |
| Consumer Staples | | | 12.9 | | |
| Industrials | | | 11.3 | | |
| Consumer Discretionary | | | 11.1 | | |
Top 10 holdings
as of 09/30/09 (%)
| Microsoft | | | 3.9 | | |
| Apple | | | 3.4 | | |
| Google | | | 3.0 | | |
| Cisco Systems | | | 2.6 | | |
| Philip Morris International | | | 2.6 | | |
| International Business | |
| Machines | | | 2.5 | | |
| Hewlett-Packard | | | 2.3 | | |
| QUALCOMM | | | 2.0 | | |
| United Technologies | | | 1.9 | | |
| Procter & Gamble | | | 1.8 | | |
The fund is actively managed and the composition of its portfolio will change over time. Information provided is calculated as a percentage of net assets.
Looking ahead
Moving forward, we intend to invest with sensitivity to the economic rebound but we are mindful that valuations have risen as the result of the market's sharp rally. Although we expect the economy to improve, the driver of future economic growth remains unclear. We believe that unemployment is likely to remain high and the stimulus package is limited in its ability to aid the employment picture. In this environment, we plan to focus on individual stock selection with an eye to avoiding overpaying for stocks that could benefit from directional growth and managing downside risk.
Portfolio holdings and characteristics are subject to change periodically and may not be representative of current holdings and characteristics. The outlook for the fund may differ from those presented for other Columbia Funds.
Equity investments are affected by stock market fluctuations that occur in response to economic and business developments.
International investing may involve certain risks, including currency fluctuations, risks associated with possible differences in financial accounting standards and other monetary and political risks. Significant levels of foreign taxes, including potentially confiscatory levels of taxation and withholding taxes, may also apply to some foreign investments.
Investing in growth stocks incurs the possibility of losses because their prices are sensitive to changes in current or expected earnings.
12
Fund Profile – Columbia Disciplined Value Fund
Summary
g For the 12-month period that ended September 30, 2009, the fund's Class A shares returned negative 7.72% without sales charge.
g In a period of extreme market volatility, the fund held up better than its benchmark, the Russell 1000 Value Index,1 and the average return of its peer group, the Lipper Large-Cap Value Funds Classification.2
g The fund's defensive positioning helped relative returns as economic fears drove stock prices down during the first six months of the period. Holdings in telecommunications, health care and consumer staples produced positive results.
Portfolio Management
Brian M. Condon has managed the fund since 2009 and has been associated with the advisor or its predecessors since 1999.
1The Russell 1000 Value Index measures the performance of those Russell 1000 Index companies with lower price-to-book ratios and lower forecasted growth values. Indices are not available for investment, are not professionally managed and do not reflect sales charges, fees, brokerage commissions, taxes or other expenses of investing. Securities in the fund may not match those in an index.
2Lipper Inc., a widely respected data provider in the industry, calculates an average total return (assuming reinvestment of distributions) for mutual funds with investment objectives similar to those of the fund. Lipper makes no adjustment for the effect of sales loads.
Performance data quoted represents past performance and current performance may be lower or higher. Past performance is no guarantee of future results. The investment return and principal value will fluctuate so that shares, when redeemed, may be worth more or less than the original cost. Please visit www.columbiafunds.com for daily and most recent month-end performance updates.
Summary
1-year return as of 09/30/09
| | –7.72% | |
|
| |  | | | Class A shares
(without sales charge) | |
|
| | –10.62% | |
|
| |  | | | Russell 1000 Value Index | |
|
Morningstar Style BoxTM
The Morningstar Style BoxTM reveals a fund's investment strategy. For equity funds, the vertical axis shows the market capitalization of the stocks owned, and the horizontal axis shows investment style (value, blend or growth). Information shown is based on the most recent data provided by Morningstar.
13
Performance Information – Columbia Disciplined Value Fund
Performance data quoted represents past performance and current performance may be lower or higher. Past performance is no guarantee of future results. The investment return and principal value will fluctuate so that shares, when redeemed, may be worth more or less than the original cost. Please visit www.columbiafunds.com for daily and most recent month-end performance updates.
Annual operating expense ratio (%)*
| Class A | | | 1.25 | | |
| Class B | | | 2.00 | | |
| Class C | | | 2.00 | | |
| Class T | | | 1.30 | | |
| Class Z | | | 1.00 | | |
* The annual operating expense ratio is as stated in the fund's prospectus that is current as of the date of this report. Differences in expense ratios disclosed elsewhere in this report may result from including fee waivers and expense reimbursements as well as different time periods used in calculating the ratios.
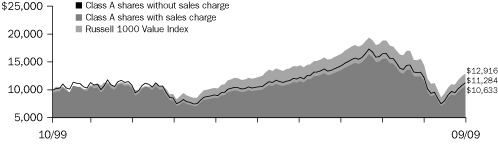
Performance of a $10,000 investment 10/01/99 – 09/30/09
The chart above shows the change in value of a hypothetical $10,000 investment in Class A shares of Columbia Disciplined Value Fund during the stated time period, and does not reflect the deduction of taxes that a shareholder may pay on fund distributions or on the redemption of fund shares. The Russell 1000 Value Index measures the performance of those Russell 1000 Index companies with lower price-to-book ratios and lower forecasted growth values. Indices are not available for investment, are not professionally managed and do not reflect sales charges, fees, brokerage commissions, taxes or other expenses of investing. Securities in the fund may not match those in an index.
Performance of a $10,000 investment 10/01/99 – 09/30/09 ($)
| Sales charge | | without | | with | |
| Class A | | | 11,284 | | | | 10,633 | | |
| Class B | | | 10,459 | | | | 10,459 | | |
| Class C | | | 10,432 | | | | 10,432 | | |
| Class T | | | 11,226 | | | | 10,579 | | |
| Class Z | | | 11,621 | | | | n/a | | |
Average annual total return as of 09/30/09 (%)
| Share class | | A | | B | | C | | T | | Z | |
| Inception | | 11/25/02 | | 11/25/02 | | 11/25/02 | | 09/01/88 | | 09/01/88 | |
| Sales charge | | without | | with | | without | | with | | without | | with | | without | | with | | without | |
| 1-year | | | –7.72 | | | | –13.01 | | | | –8.33 | | | | –12.85 | | | | –8.35 | | | | –9.26 | | | | –7.77 | | | | –13.05 | | | | –7.49 | | |
| 5-year | | | 1.33 | | | | 0.13 | | | | 0.60 | | | | 0.31 | | | | 0.58 | | | | 0.58 | | | | 1.26 | | | | 0.06 | | | | 1.57 | | |
| 10-year | | | 1.21 | | | | 0.62 | | | | 0.45 | | | | 0.45 | | | | 0.42 | | | | 0.42 | | | | 1.16 | | | | 0.56 | | | | 1.51 | | |
The "with sales charge" returns include the maximum initial sales charge of 5.75% for Class A and Class T shares and the applicable contingent deferred sales charge of 5.00% in the first year, declining to 1.00% in the sixth year and eliminated thereafter for Class B shares and 1.00% for Class C shares for the first year only. The "without sales charge" returns do not include the effect of sales charges. If they had, returns would be lower.
Performance results reflect any fee waivers or reimbursements of fund expenses by the investment advisor and/or any of its affiliates. Absent these fee waivers or expense reimbursement arrangements, performance results would have been lower.
All results shown assume reinvestment of distributions. Class Z shares are sold at net asset value with no distribution and service (Rule 12b-1) fees. Class Z shares have limited eligibility and the investment minimum requirements may vary. Please see the fund's prospectus for details. Performance for different share classes will vary based on differences in sales charges and fees associated with each class.
The tables do not reflect the deduction of taxes that a shareholder may pay on fund distributions or on the redemption of fund shares.
Class A, Class B, Class C, Class T and Class Z share performance information includes returns of Retail A shares (for Class A and Class T shares), Retail B shares (for Class B and Class C shares) and Trust shares (for Class Z shares) of Galaxy Equity Value Fund, the predecessor to the Fund and a series of the Galaxy Fund (the "Predecessor Fund"), for periods prior to November 25, 2002, the date on which Class A, Class B, Class C, Class T and Class Z shares were initially offered by the Fund. These returns shown for all share classes reflect any differences in sales charges, but have not been restated to reflect any differences in expenses between the Predecessor Fund share classes and the corresponding newer share classes. If differences in expenses had been reflected, the returns shown for periods prior to November 25, 2002 would be lower for Class B and Class C shares.
14
Understanding Your Expenses – Columbia Disciplined Value Fund
As a fund shareholder, you incur two types of costs. There are transaction costs, which generally include sales charges on purchases and may include redemption fees or exchange fees. There are also ongoing costs, which generally include investment advisory fees, distribution and service (Rule 12b-1) fees and other fund expenses. The information on this page is intended to help you understand the ongoing costs of investing in the fund and to compare these costs with the ongoing costs of investing in other mutual funds.
Analyzing your fund's expenses by share class
To illustrate these ongoing costs, we have provided an example and calculated the expenses paid by investors in each share class during the period. The information in the following table is based on an initial investment of $1,000, which is invested at the beginning of the period and held for the entire period. Expense information is calculated two ways and each method provides you with different information. The amount listed in the "Actual" column is calculated using the fund's actual operating expenses and total return for the period. The amount listed in the "Hypothetical" column for each share class assumes that the return each year is 5% before expenses and is calculated based on the fund's actual operating expenses. You should not use the hypothetical account values and expenses to estimate either your actual account balance at the end of the period or the expenses you paid during this period.
Compare with other funds
Since all mutual funds are required to include the same hypothetical calculations about expenses in shareholder reports, you can use this information to compare the ongoing costs of investing in the fund with other funds. To do so, compare the 5% hypothetical example with the 5% hypothetical examples that appear in the shareholder reports of other funds. As you compare hypothetical examples of other funds, it is important to note that hypothetical examples are meant to highlight the ongoing costs of investing in a fund and do not reflect any transaction costs, such as sales charges, redemption fees or exchange fees.
Estimating your actual expenses
To estimate the expenses that you paid over the period, first you will need your account balance at the end of the period:
g For shareholders who receive their account statements from Columbia Management Services, Inc., your account balance is available online at www.columbiafunds.com or by calling Shareholder Services at 800.345.6611.
g For shareholders who receive their account statements from their financial intermediary, contact your financial intermediary to obtain your account balance.
1. Divide your ending account balance by $1,000. For example, if an account balance was $8,600 at the end of the period, the result would be 8.6.
2. In the section of the table below titled "Expenses paid during the period," locate the amount for your share class. You will find this number in the column labeled "Actual." Multiply this number by the result from step 1. Your answer is an estimate of the expenses you paid on your account during the period.
If the value of your account falls below the minimum initial investment requirement applicable to you, your account generally will be subject to a $20 annual fee. This fee is not included in the accompanying table. If you are subject to the fee, keep it in mind when you are estimating the ongoing expenses of investing in the fund and when comparing the expenses of this fund with other funds.
04/01/09 – 09/30/09
| | | Account value at the
beginning of the period ($) | | Account value at the
end of the period ($) | | Expenses paid
during the period ($) | | Fund's annualized
expense ratio (%) | |
| | | Actual | | Hypothetical | | Actual | | Hypothetical | | Actual | | Hypothetical | | Actual | |
| Class A | | | 1,000.00 | | | | 1,000.00 | | | | 1,404.40 | | | | 1,018.80 | | | | 7.53 | | | | 6.33 | | | | 1.25 | | |
| Class B | | | 1,000.00 | | | | 1,000.00 | | | | 1,398.59 | | | | 1,015.04 | | | | 12.03 | | | | 10.10 | | | | 2.00 | | |
| Class C | | | 1,000.00 | | | | 1,000.00 | | | | 1,398.29 | | | | 1,015.04 | | | | 12.02 | | | | 10.10 | | | | 2.00 | | |
| Class T | | | 1,000.00 | | | | 1,000.00 | | | | 1,402.00 | | | | 1,018.55 | | | | 7.83 | | | | 6.58 | | | | 1.30 | | |
| Class Z | | | 1,000.00 | | | | 1,000.00 | | | | 1,403.60 | | | | 1,020.05 | | | | 6.03 | | | | 5.06 | | | | 1.00 | | |
Expenses paid during the period are equal to the annualized expense ratio for the share class, multiplied by the average account value over the period, then multiplied by the number of days in the fund's most recent fiscal half-year and divided by 365.
It is important to note that the expense amounts shown in the table are meant to highlight only ongoing costs of investing in the fund and do not reflect any transaction costs, such as sales charges, redemption fees or exchange fees. Therefore, the hypothetical examples provided may not help you determine the relative total costs of owning shares of different funds. If these transaction costs were included, your costs would have been higher.
15
Portfolio Manager's Report – Columbia Disciplined Value Fund
Performance data quoted represents past performance and current performance may be lower or higher. Past performance is no guarantee of future results. The investment return and principal value will fluctuate so that shares, when redeemed, may be worth more or less than the original cost. Please visit www.columbiafunds.com for daily and most recent month-end performance updates.
Net asset value per share
as of 09/30/09 ($)
| Class A | | | 9.52 | | |
| Class B | | | 8.97 | | |
| Class C | | | 8.94 | | |
| Class T | | | 9.52 | | |
| Class Z | | | 9.77 | | |
Distributions declared per share
10/01/08 – 09/30/09 ($)
| Class A | | | 0.16 | | |
| Class B | | | 0.10 | | |
| Class C | | | 0.10 | | |
| Class T | | | 0.16 | | |
| Class Z | | | 0.18 | | |
For the 12-month period that ended September 30, 2009, the fund's Class A shares returned negative 7.72% without sales charge. The fund held up better than both its benchmark, the Russell 1000 Value Index, which returned negative 10.62%, and the negative 7.92% average return of the Lipper Large-Cap Value Funds Classification. As fear and risk aversion gripped investors during the first half of the period, the fund's defensive positioning helped relative results. Holdings in the telecommunications, health care and consumer staples areas were positive contributors, while disappointments came from areas dependent on consumer spending and economic stability, including the consumer discretionary, technology and industrials sectors.
Telecommunications, health care and consumer holdings helped relative returns
The strongest performing sectors in the fund's portfolio were telecommunications and health care. Both generated positive results in an otherwise difficult period. Wireless provider Sprint Nextel (1.4% of net assets) and Internet and digital phone provider Qwest Communications International (0.3% of net assets) benefited from their defensively positioned, subscription-based business models and delivered solid gains for the period. Diversified global pharmaceutical company Mylan produced strong results in response to tentative FDA approval of a new HIV drug. We sold the stock. Health insurer UnitedHealth Group and Endo Pharmaceuticals Holding (1.7% and 0.8% of net assets, respectively) also made a substantial contribution to positive returns during the period, as an aging populace drove rising demand for health care services and products. In a weak economy, a perceived safe haven in the food products industry drove returns at glo bal agribusiness concern Bunge (sold during the year) and processed foods maker Del Monte Foods (0.4% of net assets).
Declines in consumer discretionary, technology and industrials holdings detracted
Sectors exposed to the weakened economic environment and slowing consumer spending were among the hardest hit during the period. As a result, holdings in consumer discretionary, technology and industrials detracted from the fund's returns. Media stocks CBS and Gannett were hurt as a downturn in advertising revenues threatened earnings. We sold both stocks. We also eliminated positions in retailers American Eagle Outfitters and Macy's, which saw poor results as consumer spending weakened. Slowing demand and increased pricing competition hurt computer hard-drive maker Seagate Technology, and we sold the stock. The economically sensitive industrials sector was also hit hard during the period. Northrop Grumman faced defense spending headwinds, while Ryder Systems and Tyco International were affected by slowing industrial production. We eliminated all three positions. Balance sheet issues in the troubled banking sector detracted from results at Wells Fargo, U.S. Bancorp and Goldman Sachs Group (3.6%, 2.5% and 2.7% of net assets, respectively).
16
Portfolio Manager's Report (continued) – Columbia Disciplined Value Fund
Focused on quality and valuation in a volatile market environment
The stock market experienced large swings over the 12-month period. Fear and risk aversion characterized the first half, causing credit markets to seize up and stock prices to move substantially lower. Central banks and governments responded with fiscal and monetary stimulus on a global basis. As liquidity worked its way through the financial system, risk aversion abated and investors began to focus on the reflationary effects of the massive policy response. Consequently, the stock market rallied in the last half of the period. Going forward, the strength and sustainability of the nascent economic recovery will be the main challenge for the stock market. Against this backdrop, we continue to follow a disciplined, quantitative approach to stock selection, emphasizing both quality and valuation. Within each sector, we seek stocks with a catalyst that may lead to improved valuations, believing that this is a sound approach over the long term.
Portfolio holdings and characteristics are subject to change periodically and may not be representative of current holdings and characteristics. The outlook for the fund may differ from those presented for other Columbia Funds.
Equity investments are affected by stock market fluctuations that occur in response to economic and business developments.
Investments in small- and mid-cap stocks may present special risks. They tend to be more volatile and tend to be less liquid than the stocks of larger companies. Small-cap stocks often have narrower markets, limited financial resources and tend to be more thinly traded than stocks of larger companies.
Value stocks are securities of companies that may have experienced adverse business or industry developments or may be subject to special risks that have caused the stocks to be out of favor. The market value of a portfolio security may not meet the manager's future value assessment of such security, or may decline.
Top 5 sectors
as of 09/30/09 (%)
| Financials | | | 25.3 | | |
| Energy | | | 18.2 | | |
| Industrials | | | 10.6 | | |
| Consumer Discretionary | | | 9.4 | | |
| Health Care | | | 9.2 | | |
Top 10 holdings
as of 09/30/09 (%)
| JPMorgan Chase | | | 4.9 | | |
| Exxon Mobil | | | 4.7 | | |
| Chevron | | | 4.2 | | |
| Pfizer | | | 3.7 | | |
| Wells Fargo | | | 3.6 | | |
| General Electric | | | 3.2 | | |
| Goldman Sachs Group | | | 2.7 | | |
| AT&T | | | 2.6 | | |
| Apache | | | 2.4 | | |
| Home Depot | | | 2.1 | | |
The fund is actively managed and the composition of its portfolio will change over time. Information provided is calculated as a percentage of net assets
17
Fund Profile – Columbia Contrarian Core Fund
Performance data quoted represents past performance and current performance may be lower or higher. Past performance is no guarantee of future results. The investment return and principal value will fluctuate so that shares, when redeemed, may be worth more or less than the original cost. Please visit www.columbiafunds.com for daily and most recent month-end performance updates.
Summary
1-year return as of 09/30/09
| | | –0.28% | |
|
| |  | | | Class A shares
(without sales charge) | |
|
| | | –6.14% | |
|
| |  | | | Russell 1000 Index | |
|
Morningstar Style BoxTM

The Morningstar Style BoxTM reveals a fund's investment strategy. For equity funds, the vertical axis shows the market capitalization of the stocks owned, and the horizontal axis shows investment style (value, blend or growth). Information shown is based on the most recent data provided by Morningstar.
Summary
g For the 12-month period that ended September 30, 2009, the fund's Class A shares returned negative 0.28% without sales charge.
g In a volatile period for stocks, the fund held up considerably better than both its benchmark, the Russell 1000 Index1, and the average return of its peer group, the Lipper Large-Cap Core Funds Classification.2
g The fund focused on higher-quality corporations with strong balance sheets early in the 12-month period and became more aggressive in its stock selection when valuations of some lower-quality stocks became increasingly attractive. This shift aided performance both during the stock market decline in the first half of the period and also in the market rebound in the second half of the period.
Portfolio Management
Guy Pope has managed the fund since March 2005 and has been associated with the advisor or its predecessors since 1993.
1The Russell 1000 Index tracks the performance of 1,000 of the largest U.S. companies, based on market capitalization. Indices are not available for investment, are not professionally managed and do not reflect sales charges, fees, brokerage commissions, taxes or other expenses of investing. Securities in the fund may not match those in an index.
2Lipper Inc., a widely respected data provider in the industry, calculates an average total return (assuming reinvestment of distributions) for mutual funds with investment objectives similar to those of the fund. Lipper makes no adjustment for the effect of sales loads.
18
Performance Information – Columbia Contrarian Core Fund
Performance of a $10,000 investment 10/01/99 – 09/30/09
The chart above shows the change in value of a hypothetical $10,000 investment in Class A shares of Columbia Contrarian Core Fund during the stated time period, and does not reflect the deduction of taxes that a shareholder may pay on fund distributions or on the redemption of fund shares. The Russell 1000 Index tracks the performance of 1,000 of the largest U.S. companies, based on market capitalization. Indices are not available for investment, are not professionally managed and do not reflect sales charges, fees, brokerage commissions, taxes or other expenses of investing. Securities in the fund may not match those in an index.
Performance of a $10,000 investment 10/01/99 – 09/30/09 ($)
| Sales charge | | without | | with | |
| Class A | | | 11,953 | | | | 11,264 | | |
| Class B | | | 11,078 | | | | 11,078 | | |
| Class C | | | 11,086 | | | | 11,086 | | |
| Class T | | | 11,843 | | | | 11,160 | | |
| Class Z | | | 12,242 | | | | n/a | | |
Average annual total return as of 09/30/09 (%)
| Share Class | | A | | B | | C | | T | | Z | |
| Inception | | 11/01/98 | | 11/01/98 | | 12/09/02 | | 02/12/93 | | 12/14/92 | |
| Sales charge | | without | | with | | without | | with | | without | | with | | without | | with | | without | |
| 1-year | | | –0.28 | | | | –6.05 | | | | –1.08 | | | | –6.02 | | | | –1.08 | | | | –2.07 | | | | –0.35 | | | | –6.08 | | | | –0.01 | | |
| 5-year | | | 5.27 | | | | 4.03 | | | | 4.46 | | | | 4.14 | | | | 4.47 | | | | 4.47 | | | | 5.21 | | | | 3.97 | | | | 5.53 | | |
| 10-year | | | 1.80 | | | | 1.20 | | | | 1.03 | | | | 1.03 | | | | 1.04 | | | | 1.04 | | | | 1.71 | | | | 1.10 | | | | 2.04 | | |
The "with sales charge" returns include the maximum initial sales charge of 5.75% for Class A and Class T shares and the applicable contingent deferred sales charge of 5.00% in the first year, declining to 1.00% in the sixth year and eliminated thereafter for Class B shares and 1.00% for Class C shares for the first year only. The "without sales charge" returns do not include the effect of sales charges. If they had, returns would be lower.
Performance results reflect any fee waivers or reimbursements of fund expenses by the investment advisor and/or any of its affiliates. Absent these fee waivers or expense reimbursement arrangements, performance results would have been lower.
All results shown assume reinvestment of distributions. Class Z shares are sold at net asset value with no distribution and service (Rule 12b-1) fees. Class Z shares have limited eligibility and the investment minimum requirements may vary. Please see the fund's prospectus for details. Performance for different share classes will vary based on differences in sales charges and fees associated with each class.
The tables do not reflect the deduction of taxes that a shareholder may pay on fund distributions or on the redemption of fund shares.
Class A, Class B, Class C, Class T and Class Z share performance information includes returns of Prime A shares (for Class A shares), Prime B shares (for Class B and Class C shares), Retail A shares (for Class T shares) and Trust shares (for Class Z shares) of Galaxy Growth & Income Fund, the predecessor to the Fund and a series of the Galaxy Fund (the "Predecessor Fund"), for periods prior to December 9, 2002, the date on which Class A, Class B, Class C, Class T and Class Z shares were initially offered by the Fund. These returns shown for all share classes reflect any differences in sales charges, but have not been restated to reflect any differences in expenses between the Predecessor Fund share classes and the corresponding newer share classes. If differences in expenses had been reflected, the returns shown for periods prior to December 9, 2002 would be lower for Class A, Class B and Class C shares.
Performance data quoted represents past performance and current performance may be lower or higher. Past performance is no guarantee of future results. The investment return and principal value will fluctuate so that shares, when redeemed, may be worth more or less than the original cost. Please visit www.columbiafunds.com for daily and most recent month-end performance updates.
Annual operating expense ratio (%)*
| Class A | | | 1.24 | | |
| Class B | | | 1.99 | | |
| Class C | | | 1.99 | | |
| Class T | | | 1.29 | | |
| Class Z | | | 0.99 | | |
*The annual operating expense ratio is as stated in the fund's prospectus that is current as of the date of this report. Differences in expense ratios disclosed elsewhere in this report may result from including fee waivers and expense reimbursements as well as different time periods used in calculating the ratios.
19
Understanding Your Expenses – Columbia Contrarian Core Fund
Estimating your actual expenses
To estimate the expenses that you paid over the period, first you will need your account balance at the end of the period:
g For shareholders who receive their account statements from Columbia Management Services, Inc., your account balance is available online at www.columbiafunds.com or by calling Shareholder Services at 800.345.6611.
g For shareholders who receive their account statements from their financial intermediary, contact your financial intermediary to obtain your account balance.
1. Divide your ending account balance by $1,000. For example, if an account balance was $8,600 at the end of the period, the result would be 8.6.
2. In the section of the table below titled "Expenses paid during the period," locate the amount for your share class. You will find this number in the column labeled "Actual." Multiply this number by the result from step 1. Your answer is an estimate of the expenses you paid on your account during the period.
If the value of your account falls below the minimum initial investment requirement applicable to you, your account generally will be subject to a $20 annual fee. This fee is not included in the accompanying table. If you are subject to the fee, keep it in mind when you are estimating the ongoing expenses of investing in the fund and when comparing the expenses of this fund with other funds.
As a fund shareholder, you incur two types of costs. There are transaction costs, which generally include sales charges on purchases and may include redemption fees or exchange fees. There are also ongoing costs, which generally include investment advisory fees, distribution and service (Rule 12b-1) fees and other fund expenses. The information on this page is intended to help you understand the ongoing costs of investing in the fund and to compare these costs with the ongoing costs of investing in other mutual funds.
Analyzing your fund's expenses by share class
To illustrate these ongoing costs, we have provided an example and calculated the expenses paid by investors in each share class during the period. The information in the following table is based on an initial investment of $1,000, which is invested at the beginning of the period and held for the entire period. Expense information is calculated two ways and each method provides you with different information. The amount listed in the "Actual" column is calculated using the fund's actual operating expenses and total return for the period. The amount listed in the "Hypothetical" column for each share class assumes that the return each year is 5% before expenses and is calculated based on the fund's actual operating expenses. You should not use the hypothetical account values and expenses to estimate either your actual account balance at the end of the period or the expenses you paid during this period.
Compare with other funds
Since all mutual funds are required to include the same hypothetical calculations about expenses in shareholder reports, you can use this information to compare the ongoing costs of investing in the fund with other funds. To do so, compare the 5% hypothetical example with the 5% hypothetical examples that appear in the shareholder reports of other funds. As you compare hypothetical examples of other funds, it is important to note that hypothetical examples are meant to highlight the ongoing costs of investing in a fund and do not reflect any transaction costs, such as sales charges, redemption fees or exchange fees.
04/01/09 – 09/30/09
| | | Account value at the
beginning of the period ($) | | Account value at the
end of the period ($) | | Expenses paid
during the period ($) | | Fund's annualized
expense ratio (%) | |
| | | Actual | | Hypothetical | | Actual | | Hypothetical | | Actual | | Hypothetical | | Actual | |
| Class A | | | 1,000.00 | | | | 1,000.00 | | | | 1,396.68 | | | | 1,019.10 | | | | 7.15 | | | | 6.02 | | | | 1.19 | | |
| Class B | | | 1,000.00 | | | | 1,000.00 | | | | 1,391.42 | | | | 1,015.34 | | | | 11.63 | | | | 9.80 | | | | 1.94 | | |
| Class C | | | 1,000.00 | | | | 1,000.00 | | | | 1,390.92 | | | | 1,015.34 | | | | 11.63 | | | | 9.80 | | | | 1.94 | | |
| Class T | | | 1,000.00 | | | | 1,000.00 | | | | 1,395.88 | | | | 1,018.85 | | | | 7.45 | | | | 6.28 | | | | 1.24 | | |
| Class Z | | | 1,000.00 | | | | 1,000.00 | | | | 1,398.29 | | | | 1,020.36 | | | | 5.65 | | | | 4.76 | | | | 0.94 | | |
Expenses paid during the period are equal to the annualized expense ratio for the share class, multiplied by the average account value over the period, then multiplied by the number of days in the fund's most recent fiscal half-year and divided by 365.
Had the investment advisor and/or any of its affiliates not waived fees or reimbursed a portion of expenses, account value at the end of the period would have been reduced.
It is important to note that the expense amounts shown in the table are meant to highlight only ongoing costs of investing in the fund and do not reflect any transaction costs, such as sales charges, redemption fees or exchange fees. Therefore, the hypothetical examples provided may not help you determine the relative total costs of owning shares of different funds. If these transaction costs were included, your costs would have been higher.
20
Portfolio Manager's Report – Columbia Contrarian Core Fund
For the 12-month period that ended September 30, 2009, the fund's Class A shares returned negative 0.28% without sales charge. The fund's benchmark, the Russell 1000 Index, returned negative 6.14% and the average return of its peer group, the Lipper Large-Cap Core Funds Classification, was negative 5.89% for the same period. The fund's stock selection strategy aided performance as the market transitioned from downturn to rebound.
Stock selection strategy aided performance
The equity market environment shifted dramatically from the beginning to the end of the 12-month period covered by this report. In the first half of the period, stock prices declined sharply as the economy struggled with the most severe recession since the Great Depression. In this environment, we emphasized higher-quality stocks with strong finances, reflecting our belief that we had no price incentive to invest in lower-quality companies. However, when we began to see valuation spreads between stocks begin to expand dramatically, some lower-quality stocks began to look more attractive. Consistent with our long-term, contrarian discipline of investing in out-of-favor stocks where we find value, we started to become more opportunistic, taking profits from some successful high-quality investments and redeploying assets into investments with weaker fundamentals but more upside potential. This shift helped position the fund for the robust market recovery that began in March 2009 and continued through the end of the period.
In addition, good stock selection, based on company-by-company analysis of business prospects, also benefited the fund's performance relative to its benchmark and peer group. Stock selection in 7 of 10 market sectors outperformed their benchmark performance, led by holdings in the information technology, telecommunication and financials groups. Within technology, the leading contributor was Apple (2.4% of net assets), as it continued to introduce innovative new consumer-oriented products, such as the new 3GS iPhone. Meanwhile, EMC (0.7% of net assets) gained as signs emerged that corporate customers found a bottom and were becoming more confident about the outlook and increased investments in information technology storage systems. In the telecommunication services sector, early in the period we emphasized higher-quality companies such as Verizon Communications and AT&T. Valuation, however, ultimately drew us to Sprint Nexte l and Millicom International Cellular (1.1% of net assets), both of which performed well in the market's rally. We subsequently sold the fund's AT&T and Sprint Nextel positions.
Within the financials sector, we de-emphasized traditional lenders and focused on corporations with exposure to the capital markets, which we believed would be the more direct beneficiaries of the Federal Reserve Board's efforts to stabilize and bring life back to capital markets activity. A large position in investment bank Goldman Sachs Group (2.4% of net assets) was the leading contributor in the financials group.
Performance data quoted represents past performance and current performance may be lower or higher. Past performance is no guarantee of future results. The investment return and principal value will fluctuate so that shares, when redeemed, may be worth more or less than the original cost. Please visit www.columbiafunds.com for daily and most recent month-end performance updates.
Net asset value per share
as of 09/30/09 ($)
| Class A | | | 11.76 | | |
| Class B | | | 11.02 | | |
| Class C | | | 11.03 | | |
| Class T | | | 11.67 | | |
| Class Z | | | 11.83 | | |
Distributions declared per share
10/01/08 – 09/30/09 ($)
| Class A | | | 0.07 | | |
| Class T | | | 0.07 | | |
| Class Z | | | 0.10 | | |
21
Portfolio Manager's Report (continued) – Columbia Contrarian Core Fund
Top 5 sectors
as of 09/30/09 (%)
| Information Technology | | | 20.6 | | |
| Financials | | | 18.1 | | |
| Energy | | | 13.0 | | |
| Health Care | | | 11.7 | | |
| Consumer Discretionary | | | 10.9 | | |
Top 10 holdings
as of 09/30/09 (%)
| Microsoft | | | 3.2 | | |
| Philip Morris | | | 3.0 | | |
| Abbott Laboratories | | | 2.9 | | |
| JPMorgan Chase | | | 2.9 | | |
| Google | | | 2.5 | | |
| Goldman Sachs | | | 2.4 | | |
| Wells Fargo | | | 2.4 | | |
| Apple | | | 2.4 | | |
| Hewlett-Packard | | | 2.4 | | |
| Chevron | | | 2.3 | | |
The fund is actively managed and the composition of its portfolio will change over time. Information provided is calculated as a percentage of net assets.
Health care selections detracted
Stock selection in the health care sector generated disappointing results. We maintained a large position in pharmaceuticals firm Abbott Laboratories (2.9% of net assets) throughout the period, as this higher-quality company continued to post solid earnings. Nevertheless, the stock declined as investors looked for companies with more aggressive characteristics. Decelerating revenues from Abbott's Humira product, a drug used in the treatment of arthritis, also weighed on the stock. Meanwhile medical instrument developer Thermo Fisher Scientific (1.6% of net assets) fell because of market concerns about slowing revenues. We retained positions in both Abbott and Thermo Fisher, as well as in Avon Products (1.0% of net assets), a weak-performing consumer staples company that was victimized both by softening demand domestically and by the strengthening dollar, which in late 2008 cut into profits from foreign sales.
Looking ahead
U.S. corporate executives appear increasingly confident that they can improve earnings over the next six months, which should bode well for stock performance. The outlook becomes less clear beyond those six months. One potential scenario is that the market rally may continue as a persistent economic recovery leads to higher profits and the creation of additional jobs. However, it also is possible that the economic revival could stall as federal stimulus spending slows. This could lead to further economic weakness, especially if the automotive and housing industries aren't able to provide the lifts that were characteristic of earlier recoveries.
Portfolio holdings and characteristics are subject to change periodically and may not be representative of current holdings and characteristics. The outlook for the fund may differ from those presented for other Columbia Funds.
Equity investments are affected by stock market fluctuations that occur in response to economic and business developments.
22
Fund Profile – Columbia Small Cap Core Fund
Summary
g For the 12-month period that ended September 30, 2009, the fund's Class A shares returned negative 7.41% without sales charge.
g Despite a period of extreme volatility, the fund held up better than both of its benchmarks, the Russell 2000 Index and the S&P SmallCap 600 Composite Index1. It underperformed the average return of its peer group, the Lipper Small-Cap Core Funds Classification.2
g An underweight in financials combined with good stock selection across several sectors helped the portfolio outperform its benchmarks. However, some of these gains were offset by stock selection in other sectors as well as an overweight in industrials as commodity prices declined.
Portfolio Management
Peter Larson, lead manager, has co-managed the fund since 1992 and has been associated with the advisor or its predecessors since 1963.
Richard D'Auteuil has co-managed the fund since 2005 and has been associated with the advisor or its predecessors since 1993.
Jeffrey Hershey has co-managed the fund since August 2009 and has been associated with the advisor or its predecessors since August 2009.
1The Russell 2000 Index measures the performance of the 2,000 smallest companies in the Russell 3000 Index, which represents approximately 8% of the total market capitalization of the Russell 3000 Index. The Standard & Poor's (S&P) SmallCap 600 Composite Index tracks the performance of 600 domestic companies traded on major stock exchanges. The S&P Small Cap 600 is heavily weighted with the stocks of companies with small market capitalizations. Indices are not available for investment, are not professionally managed and do not reflect sales charges, fees, brokerage commissions, taxes or other expenses of investing. Securities in the fund may not match those in an index.
2Lipper Inc., a widely respected data provider in the industry, calculates an average total return (assuming reinvestment of distributions) for mutual funds with investment objectives similar to those of the fund. Lipper makes no adjustment for the effect of sales loads.
Performance data quoted represents past performance and current performance may be lower or higher. Past performance is no guarantee of future results. The investment return and principal value will fluctuate so that shares, when redeemed, may be worth more or less than the original cost. Please visit www.columbiafunds.com for daily and most recent month-end performance updates.
Summary
1-year return as of 09/30/09
| | –7.41% | |
|
| |  | | | Class A shares
(without sales charge) | |
|
| | –9.55% | |
|
| |  | | | Russell 2000 Index | |
|
| | –10.61% | |
|
| |  | | | S&P SmallCap 600 Composite Index | |
|
Morningstar Style BoxTM

The Morningstar Style BoxTM reveals a fund's investment strategy. For equity funds, the vertical axis shows the market capitalization of the stocks owned, and the horizontal axis shows investment style (value, blend or growth). Information shown is based on the most recent data provided by Morningstar.
23
Performance Information – Columbia Small Cap Core Fund
Performance data quoted represents past performance and current performance may be lower or higher. Past performance is no guarantee of future results. The investment return and principal value will fluctuate so that shares, when redeemed, may be worth more or less than the original cost. Please visit www.columbiafunds.com for daily and most recent month-end performance updates.
Annual operating expense ratio (%)*
| Class A | | | 1.26 | | |
| Class B | | | 2.01 | | |
| Class C | | | 2.01 | | |
| Class T | | | 1.31 | | |
| Class Z | | | 1.01 | | |
*The annual operating expense ratio is as stated in the fund's prospectus that is current as of the date of this report. Differences in expense ratios disclosed elsewhere in this report may result from including fee waivers and expense reimbursements as well as different time periods used in calculating the ratios.
Performance of a $10,000 investment 10/01/99 – 09/30/09
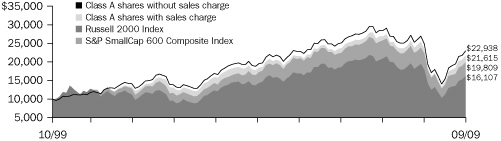 | |
|
The chart above shows the change in value of a hypothetical $10,000 investment in Class A shares of Columbia Small Cap Core Fund during the stated time period, and does not reflect the deduction of taxes that a shareholder may pay on fund distributions or on the redemption of fund shares. The Russell 2000 Index measures the performance of the 2,000 smallest companies in the Russell 3000 Index, which represents approximately 8% of the total market capitalization of the Russell 3000 Index. The Standard & Poor's (S&P) SmallCap 600 Composite Index tracks the performance of 600 domestic companies traded on major stock exchanges. The S&P Small Cap 600 is heavily weighted with the stocks of companies with small market capitalizations. Indices are not available for investment, are not professionally managed and do not reflect sales charges, fees, brokerage commissions, taxes or other expenses of investing. Securities in the fund may not match those in an index.
Performance of a $10,000 investment 10/01/99 – 09/30/09 ($)
| Sales charge | | without | | with | |
| Class A | | | 22,938 | | | | 21,615 | | |
| Class B | | | 21,235 | | | | 21,235 | | |
| Class C | | | 21,243 | | | | 21,243 | | |
| Class T | | | 22,727 | | | | 21,426 | | |
| Class Z | | | 23,586 | | | | n/a | | |
Average annual total return as of 09/30/09 (%)
| Share class | | A | | B | | C | | T | | Z | |
| Inception | | 11/01/98 | | 11/01/98 | | 11/18/02 | | 02/12/93 | | 12/14/92 | |
| Sales charge | | without | | with | | without | | with | | without | | with | | without | | with | | without | |
| 1-year | | | –7.41 | | | | –12.72 | | | | –8.08 | | | | –12.10 | | | | –8.15 | | | | –8.95 | | | | –7.45 | | | | –12.77 | | | | –7.18 | | |
| 5-year | | | 3.26 | | | | 2.05 | | | | 2.49 | | | | 2.27 | | | | 2.48 | | | | 2.48 | | | | 3.20 | | | | 1.99 | | | | 3.52 | | |
| 10-year | | | 8.66 | | | | 8.01 | | | | 7.82 | | | | 7.82 | | | | 7.83 | | | | 7.83 | | | | 8.56 | | | | 7.92 | | | | 8.96 | | |
The "with sales charge" returns include the maximum initial sales charge of 5.75% for Class A and Class T shares and the applicable contingent deferred sales charge of 5.00% in the first year, declining to 1.00% in the sixth year and eliminated thereafter for Class B shares and 1.00% for Class C shares for the first year only. The "without sales charge" returns do not include the effect of sales charges. If they had, returns would be lower.
Performance results reflect any fee waivers or reimbursements of fund expenses by the investment advisor and/or any of its affiliates. Absent these fee waivers or expense reimbursement arrangements, performance results would have been lower.
All results shown assume reinvestment of distributions. Class Z shares are sold at net asset value with no distribution and service (Rule 12b-1) fees. Class Z shares have limited eligibility and the investment minimum requirements may vary. Please see the fund's prospectus for details. Performance for different share classes will vary based on differences in sales charges and fees associated with each class.
The tables do not reflect the deduction of taxes that a shareholder may pay on fund distributions or on the redemption of fund shares.
Class A, Class B, Class C, Class T and Class Z share performance information includes returns of Prime A shares (for Class A shares), Prime B shares (for Class B shares), Retail A shares (for Class C and Class T shares) and Trust shares (for Class Z shares) of Galaxy Small Cap Value Fund, the predecessor to the Fund and a series of the Galaxy Fund (the "Predecessor Fund"), for periods prior to November 18, 2002, the date on which Class A, Class B, Class C, Class T and Class Z shares were initially offered by the Fund. These returns shown for all share classes reflect any differences in sales charges, but have not been restated to reflect any differences in expenses between the Predecessor Fund share classes and the corresponding newer share classes. If differences in expenses had been reflected, the returns shown for periods prior to November 18, 2002 would be lower for Class A, Class B and Class C shares.
24
Understanding Your Expenses – Columbia Small Cap Core Fund
As a fund shareholder, you incur two types of costs. There are transaction costs, which generally include sales charges on purchases and may include redemption fees or exchange fees. There are also ongoing costs, which generally include investment advisory fees, distribution and service (Rule 12b-1) fees and other fund expenses. The information on this page is intended to help you understand the ongoing costs of investing in the fund and to compare these costs with the ongoing costs of investing in other mutual funds.
Analyzing your fund's expenses by share class
To illustrate these ongoing costs, we have provided an example and calculated the expenses paid by investors in each share class during the period. The information in the following table is based on an initial investment of $1,000, which is invested at the beginning of the period and held for the entire period. Expense information is calculated two ways and each method provides you with different information. The amount listed in the "Actual" column is calculated using the fund's actual operating expenses and total return for the period. The amount listed in the "Hypothetical" column for each share class assumes that the return each year is 5% before expenses and is calculated based on the fund's actual operating expenses. You should not use the hypothetical account values and expenses to estimate either your actual account balance at the end of the period or the expenses you paid during this period.
Compare with other funds
Since all mutual funds are required to include the same hypothetical calculations about expenses in shareholder reports, you can use this information to compare the ongoing costs of investing in the fund with other funds. To do so, compare the 5% hypothetical example with the 5% hypothetical examples that appear in the shareholder reports of other funds. As you compare hypothetical examples of other funds, it is important to note that hypothetical examples are meant to highlight the ongoing costs of investing in a fund and do not reflect any transaction costs, such as sales charges, redemption fees or exchange fees.
Estimating your actual expenses
To estimate the expenses that you paid over the period, first you will need your account balance at the end of the period:
g For shareholders who receive their account statements from Columbia Management Services, Inc., your account balance is available online at www.columbiafunds.com or by calling Shareholder Services at 800.345.6611.
g For shareholders who receive their account statements from their financial intermediary, contact your financial intermediary to obtain your account balance.
1. Divide your ending account balance by $1,000. For example, if an account balance was $8,600 at the end of the period, the result would be 8.6.
2. In the section of the table below titled "Expenses paid during the period," locate the amount for your share class. You will find this number in the column labeled "Actual." Multiply this number by the result from step 1. Your answer is an estimate of the expenses you paid on your account during the period.
If the value of your account falls below the minimum initial investment requirement applicable to you, your account generally will be subject to a $20 annual fee. This fee is not included in the accompanying table. If you are subject to the fee, keep it in mind when you are estimating the ongoing expenses of investing in the fund and when comparing the expenses of this fund with other funds.
04/01/09 – 09/30/09
| | | Account value at the
beginning of the period ($) | | Account value at the
end of the period ($) | | Expenses paid
during the period ($) | | Fund's annualized
expense ratio (%) | |
| | | Actual | | Hypothetical | | Actual | | Hypothetical | | Actual | | Hypothetical | | Actual | |
| Class A | | | 1,000.00 | | | | 1,000.00 | | | | 1,486.48 | | | | 1,018.70 | | | | 7.92 | | | | 6.43 | | | | 1.27 | | |
| Class B | | | 1,000.00 | | | | 1,000.00 | | | | 1,480.11 | | | | 1,014.94 | | | | 12.56 | | | | 10.20 | | | | 2.02 | | |
| Class C | | | 1,000.00 | | | | 1,000.00 | | | | 1,479.41 | | | | 1,014.94 | | | | 12.56 | | | | 10.20 | | | | 2.02 | | |
| Class T | | | 1,000.00 | | | | 1,000.00 | | | | 1,484.98 | | | | 1,018.45 | | | | 8.22 | | | | 6.68 | | | | 1.32 | | |
| Class Z | | | 1,000.00 | | | | 1,000.00 | | | | 1,487.48 | | | | 1,019.95 | | | | 6.36 | | | | 5.16 | | | | 1.02 | | |
Expenses paid during the period are equal to the annualized expense ratio for the share class, multiplied by the average account value over the period, then multiplied by the number of days in the fund's most recent fiscal half-year and divided by 365.
It is important to note that the expense amounts shown in the table are meant to highlight only ongoing costs of investing in the fund and do not reflect any transaction costs, such as sales charges, redemption fees or exchange fees. Therefore, the hypothetical examples provided may not help you determine the relative total costs of owning shares of different funds. If these transaction costs were included, your costs would have been higher.
25
Portfolio Managers' Report – Columbia Small Cap Core Fund
Performance data quoted represents past performance and current performance may be lower or higher. Past performance is no guarantee of future results. The investment return and principal value will fluctuate so that shares, when redeemed, may be worth more or less than the original cost. Please visit www.columbiafunds.com for daily and most recent month-end performance updates.
Net asset value per share
as of 09/30/09 ($)
| Class A | | | 11.58 | | |
| Class B | | | 10.42 | | |
| Class C | | | 10.43 | | |
| Class T | | | 11.39 | | |
| Class Z | | | 11.87 | | |
Distributions declared per share
10/01/08 – 09/30/09 ($)
| Class A | | | 1.15 | | |
| Class B | | | 1.15 | | |
| Class C | | | 1.15 | | |
| Class T | | | 1.15 | | |
| Class Z | | | 1.15 | | |
For the 12-month period that ended September 30, 2009, the fund's Class A shares returned negative 7.41% without sales charge. The fund's benchmarks, the S&P SmallCap 600 Composite Index and the Russell 2000 Index, returned negative 10.61% and negative 9.55%, respectively, for the same period. The average return of the fund's peer group, the Lipper Small-Cap Core Funds Classification, was negative 6.42%. An underweight in financials combined with good stock selection across several sectors helped the portfolio outperform its benchmarks. However, some of these gains were offset by stock selection in other sectors as well as an overweight in industrials as commodity prices declined.
Sector weights and stock selection in key sectors aided performance
Financials, still reeling from the subprime mortgage crisis fallout, declined sharply for the 12-month period. Compared to the Russell 2000 Index's 9.55% loss, finanicals within the index lost 22.34%. The fund's losses from financial holdings were generally on par with those of the index. However its exposure to financials was less than half the exposure of the Russell 2000 benchmark, which helped stem portfolio losses and aided relative performance.
An overweight and stock selection in health care also benefited the fund. Specifically, Hi-Tech Pharmacal (0.7% of net assets) generated stellar returns as it rose from depressed levels in late 2008. This generic drug company exhibited exceptional positive earnings as a result of a newly-approved generic product.
Certain stocks within information technology, where the fund had significantly more exposure than its benchmarks, buoyed performance as well. Technology storage company STEC (0.4% of net assets) and electronics manufacturers Benchmark Electronics and Plexus (3.1% and 1.1% of net assets, respectively) were among the sector's top contributors. These companies were able to maintain strong balance sheets throughout the economic downturn, but were heavily discounted when the equity markets declined at the beginning of the period. Their strong free cash flow was rewarded when the markets turned and their stocks rose from relatively cheap prices, which benefited the fund's performance. While we continue to hold all three stocks, we trimmed the position in STEC on the belief that competitors were gaining ground on the company.
In the consumer discretionary sector, the fund's underweight relative to its benchmarks detracted from performance. However, certain stocks provided a significant boost to performance. One such stock was Cooper Tire & Rubber (0.7% of net assets), which manufactures replacement tires. The company was hurt when commodity prices soared. However, the price of energy and other commodities declined in late 2008, leading more recently to higher margins and a higher share price. Monro Muffler Brake (0.7% of net assets), a car repair and tire service provider, gained from the challenging economic conditions. As more consumers shifted from using car dealerships for service maintenance and car dealers closed, Monro grew its customer base, pushing its stock's price higher.
26
Portfolio Managers' Report (continued) – Columbia Small Cap Core Fund
Industrials dampened performance
Although an overweight in industrials aided fund performance in 2008, it was a drag on performance during this 12-month period. We had reduced the fund's exposure to industrials, yet it remained overweight, detracting from performance. In addition, the fund held a number of stocks that were particular disappointments. NCI Building Systems (0.2% of net assets), which manufactures metal products for construction, was hurt by lingering debt from an acquisition and from tight margins that resulted from the rise in commodity prices, which resulted in negative earnings. As a result, we reduced the fund's position in NCI. Aircraft component producer Moog (1.0% of net assets) was another detractor. The company suffered as the production of commercial airplanes declined.
A consistent strategy moving forward
When the markets were declining and hitting severe lows, we saw plenty of bargains. In some ways, it was difficult to prioritize the opportunities. Today, stock selection has become even more challenging. While we have seen some signs of stabilization in the economy, and many companies are exceeding their earnings expectations, we will be watching closely for a rise in company revenues. Regardless of what happens in the markets, we will maintain a consistent approach in seeking to identify companies with solid balance sheets that are trading at reasonable valuations, while keeping the portfolio's turnover of securities relatively low.
Portfolio holdings and characteristics are subject to change periodically and may not be representative of current holdings and characteristics. The outlook for the fund may differ from those presented for other Columbia Funds.
Equity investments are affected by stock market fluctuations that occur in response to economic and business developments.
Investments in small-cap stocks may be subject to greater volatility and price fluctuations because they may be thinly traded and less liquid than investments in larger companies.
Value stocks are securities of companies that may have experienced adverse business or industry developments or may be subject to special risks that have caused the stocks to be out of favor. The market value of a portfolio security may not meet the manager's future value assessment of such security, or may decline.
Top 5 sectors
as of 09/30/09 (%)
| Information Technology | | | 25.2 | | |
| Industrials | | | 20.1 | | |
| Health Care | | | 16.2 | | |
| Consumer Discretionary | | | 11.6 | | |
| Financials | | | 10.6 | | |
Top 10 holdings
as of 09/30/09 (%)
| Benchmark Electronics | | | 3.1 | | |
| Res-Care | | | 1.9 | | |
| Unifirst | | | 1.7 | | |
| Kforce | | | 1.6 | | |
| Sensient Technologies | | | 1.4 | | |
| H.B. Fuller | | | 1.4 | | |
| EMCOR Group | | | 1.4 | | |
| AAR Corp | | | 1.4 | | |
| Invacare | | | 1.2 | | |
| Progress Software | | | 1.2 | | |
The fund is actively managed and the composition of its portfolio will change over time. Information provided is calculated as a percentage of net assets.
27
Investment Portfolio – Columbia Asset Allocation Fund
September 30, 2009
| Common Stocks – 51.4% | |
| | | Shares | | Value ($) | |
| Consumer Discretionary – 5.7% | |
| Auto Components – 0.1% | |
| BorgWarner, Inc. | | | 1,300 | | | | 39,338 | | |
| Johnson Controls, Inc. | | | 2,185 | | | | 55,849 | | |
| Stanley Electric Co., Ltd. | | | 6,600 | | | | 132,761 | | |
| Auto Components Total | | | 227,948 | | |
| Automobiles – 0.2% | |
| Daihatsu Motor Co., Ltd. | | | 15,000 | | | | 152,710 | | |
| Honda Motor Co., Ltd. | | | 2,500 | | | | 75,805 | | |
| Nissan Motor Co., Ltd. (a) | | | 26,400 | | | | 177,299 | | |
| Toyota Motor Corp. | | | 3,500 | | | | 137,746 | | |
| Automobiles Total | | | 543,560 | | |
| Distributors – 0.0% | |
| Genuine Parts Co. | | | 1,200 | | | | 45,672 | | |
| LKQ Corp. (a) | | | 1,320 | | | | 24,473 | | |
| Distributors Total | | | 70,145 | | |
| Diversified Consumer Services – 0.2% | |
| Apollo Group, Inc., Class A (a) | | | 600 | | | | 44,202 | | |
| Benesse Corp. | | | 2,400 | | | | 117,308 | | |
Brink's Home Security
Holdings, Inc. (a) | | | 930 | | | | 28,635 | | |
| Capella Education Co. (a) | | | 644 | | | | 43,367 | | |
| Corinthian Colleges, Inc. (a) | | | 2,720 | | | | 50,483 | | |
| DeVry, Inc. | | | 919 | | | | 50,839 | | |
| ITT Educational Services, Inc. (a) | | | 592 | | | | 65,363 | | |
| Regis Corp. | | | 1,210 | | | | 18,755 | | |
| Sotheby's | | | 820 | | | | 14,129 | | |
| Diversified Consumer Services Total | | | 433,081 | | |
| Hotels, Restaurants & Leisure – 1.5% | |
| Ameristar Casinos, Inc. | | | 1,680 | | | | 26,510 | | |
| Bally Technologies, Inc. (a) | | | 560 | | | | 21,487 | | |
| Benihana, Inc., Class A (a) | | | 2,572 | | | | 14,738 | | |
| Bob Evans Farms, Inc. | | | 930 | | | | 27,026 | | |
| Buffalo Wild Wings, Inc. (a) | | | 630 | | | | 26,214 | | |
| Carnival Corp. | | | 16,800 | | | | 559,104 | | |
| CEC Entertainment, Inc. (a) | | | 570 | | | | 14,740 | | |
Ctrip.com International Ltd.,
ADR (a) | | | 490 | | | | 28,807 | | |
| Darden Restaurants, Inc. | | | 1,040 | | | | 35,495 | | |
| DineEquity, Inc. | | | 1,770 | | | | 43,808 | | |
| International Game Technology | | | 16,899 | | | | 362,991 | | |
| Jack in the Box, Inc. (a) | | | 420 | | | | 8,606 | | |
| Las Vegas Sands Corp. (a) | | | 7,120 | | | | 119,901 | | |
| McDonald's Corp. | | | 4,220 | | | | 240,835 | | |
| OPAP SA | | | 7,455 | | | | 192,780 | | |
| Paddy Power PLC | | | 5,044 | | | | 153,584 | | |
Red Robin Gourmet Burgers,
Inc. (a) | | | 2,314 | | | | 47,252 | | |
| | | Shares | | Value ($) | |
| Royal Caribbean Cruises Ltd. (a) | | | 5,860 | | | | 141,109 | | |
| Scientific Games Corp., Class A (a) | | | 1,680 | | | | 26,594 | | |
| Starbucks Corp. (a) | | | 10,550 | | | | 217,857 | | |
Starwood Hotels & Resorts
Worldwide, Inc. | | | 23,637 | | | | 780,730 | | |
| Vail Resorts, Inc. (a) | | | 610 | | | | 20,459 | | |
| Wynn Resorts Ltd. (a) | | | 400 | | | | 28,356 | | |
| Yum! Brands, Inc. | | | 5,500 | | | | 185,680 | | |
| Hotels, Restaurants & Leisure Total | | | 3,324,663 | | |
| Household Durables – 0.2% | |
| American Greetings Corp., Class A | | | 1,150 | | | | 25,645 | | |
| Cavco Industries, Inc. (a) | | | 512 | | | | 18,176 | | |
| CSS Industries, Inc. | | | 883 | | | | 17,457 | | |
| D.R. Horton, Inc. | | | 16,900 | | | | 192,829 | | |
| Ethan Allen Interiors, Inc. | | | 950 | | | | 15,675 | | |
| Garmin Ltd. | | | 780 | | | | 29,437 | | |
| Tempur-Pedic International, Inc. (a) | | | 2,020 | | | | 38,259 | | |
| Tupperware Brands Corp. | | | 500 | | | | 19,960 | | |
| Household Durables Total | | | 357,438 | | |
| Internet & Catalog Retail – 0.2% | |
| Amazon.com, Inc. (a) | | | 3,275 | | | | 305,754 | | |
| NetFlix, Inc. (a) | | | 1,030 | | | | 47,555 | | |
| NutriSystem, Inc. | | | 1,590 | | | | 24,264 | | |
| Priceline.com, Inc. (a) | | | 460 | | | | 76,277 | | |
| Internet & Catalog Retail Total | | | 453,850 | | |
| Leisure Equipment & Products – 0.1% | |
| Brunswick Corp. | | | 2,280 | | | | 27,315 | | |
| Hasbro, Inc. | | | 2,500 | | | | 69,375 | | |
| JAKKS Pacific, Inc. (a) | | | 1,320 | | | | 18,902 | | |
| Leisure Equipment & Products Total | | | 115,592 | | |
| Media – 0.3% | |
| Knology, Inc. (a) | | | 7,630 | | | | 74,392 | | |
| Lamar Advertising Co., Class A (a) | | | 1,560 | | | | 42,806 | | |
| LodgeNet Interactive Corp. (a) | | | 4,610 | | | | 34,806 | | |
| McGraw-Hill Companies, Inc. | | | 1,820 | | | | 45,755 | | |
| Publicis Groupe SA | | | 4,196 | | | | 168,572 | | |
| Viacom, Inc., Class B (a) | | | 8,250 | | | | 231,330 | | |
| Vivendi | | | 5,440 | | | | 168,692 | | |
| Media Total | | | 766,353 | | |
| Multiline Retail – 1.2% | |
| J.C. Penney Co., Inc. | | | 31,100 | | | | 1,049,625 | | |
| Nordstrom, Inc. | | | 31,505 | | | | 962,163 | | |
| Target Corp. | | | 12,200 | | | | 569,496 | | |
| Multiline Retail Total | | | 2,581,284 | | |
| Specialty Retail – 1.3% | |
| Advance Auto Parts, Inc. | | | 810 | | | | 31,817 | | |
| Aeropostale, Inc. (a) | | | 965 | | | | 41,948 | | |
See Accompanying Notes to Financial Statements.
28
Columbia Asset Allocation Fund
September 30, 2009
| Common Stocks (continued) | |
| | | Shares | | Value ($) | |
| America's Car-Mart, Inc. (a) | | | 865 | | | | 20,717 | | |
| American Eagle Outfitters, Inc. | | | 5,810 | | | | 97,957 | | |
| AnnTaylor Stores Corp. (a) | | | 2,158 | | | | 34,291 | | |
| Bed Bath & Beyond, Inc. (a) | | | 850 | | | | 31,909 | | |
| Best Buy Co., Inc. | | | 5,780 | | | | 216,865 | | |
| Chico's FAS, Inc. (a) | | | 1,960 | | | | 25,480 | | |
| Christopher & Banks Corp. | | | 2,560 | | | | 17,331 | | |
| Finish Line, Inc., Class A | | | 1,870 | | | | 18,999 | | |
| Foot Locker, Inc. | | | 7,287 | | | | 87,080 | | |
| Game Group PLC | | | 67,056 | | | | 171,251 | | |
| GameStop Corp., Class A (a) | | | 10,963 | | | | 290,191 | | |
| hhgregg, Inc. (a) | | | 1,580 | | | | 26,765 | | |
| J Crew Group, Inc. (a) | | | 850 | | | | 30,447 | | |
| Lowe's Companies, Inc. | | | 45,700 | | | | 956,958 | | |
| Men's Wearhouse, Inc. | | | 1,104 | | | | 27,269 | | |
| OfficeMax, Inc. (a) | | | 2,120 | | | | 26,670 | | |
Pacific Sunwear of California,
Inc. (a) | | | 8,295 | | | | 42,719 | | |
| Pier 1 Imports, Inc. (a) | | | 9,170 | | | | 35,488 | | |
| Rent-A-Center, Inc. (a) | | | 1,709 | | | | 32,266 | | |
| Sherwin-Williams Co. | | | 410 | | | | 24,666 | | |
| Shoe Carnival, Inc. (a) | | | 1,135 | | | | 17,502 | | |
| Staples, Inc. | | | 10,250 | | | | 238,005 | | |
| TJX Companies, Inc. | | | 1,390 | | | | 51,638 | | |
| Urban Outfitters, Inc. (a) | | | 1,050 | | | | 31,678 | | |
| USS Co., Ltd. | | | 2,690 | | | | 159,226 | | |
| Wet Seal, Inc., Class A (a) | | | 9,300 | | | | 35,154 | | |
| Specialty Retail Total | | | 2,822,287 | | |
| Textiles, Apparel & Luxury Goods – 0.4% | |
| Coach, Inc. | | | 1,220 | | | | 40,162 | | |
| Deckers Outdoor Corp. (a) | | | 680 | | | | 57,698 | | |
| Fossil, Inc. (a) | | | 1,387 | | | | 39,460 | | |
| Hanesbrands, Inc. (a) | | | 1,480 | | | | 31,672 | | |
| Iconix Brand Group, Inc. (a) | | | 5,570 | | | | 69,458 | | |
| LG Fashion Corp. | | | 6,770 | | | | 152,794 | | |
| Movado Group, Inc. | | | 1,500 | | | | 21,795 | | |
| Phillips-Van Heusen Corp. | | | 420 | | | | 17,972 | | |
| Polo Ralph Lauren Corp. | | | 5,414 | | | | 414,821 | | |
| True Religion Apparel, Inc. (a) | | | 1,840 | | | | 47,711 | | |
| Warnaco Group, Inc. (a) | | | 690 | | | | 30,263 | | |
| Wolverine World Wide, Inc. | | | 560 | | | | 13,910 | | |
| Youngone Corp. (a) | | | 6,960 | | | | 43,619 | | |
| Youngone Holdings Co., Ltd. | | | 420 | | | | 8,023 | | |
| Textiles, Apparel & Luxury Goods Total | | | 989,358 | | |
| Consumer Discretionary Total | | | 12,685,559 | | |
| | | Shares | | Value ($) | |
| Consumer Staples – 4.6% | |
| Beverages – 0.8% | |
| Carlsberg A/S, Class B | | | 2,094 | | | | 152,445 | | |
| Coca-Cola Co. | | | 4,850 | | | | 260,445 | | |
| Diageo PLC, ADR | | | 8,551 | | | | 525,801 | | |
Fomento Economico Mexicano
SAB de CV, ADR | | | 2,200 | | | | 83,710 | | |
| Molson Coors Brewing Co., Class B | | | 5,500 | | | | 267,740 | | |
| PepsiCo, Inc. | | | 9,800 | | | | 574,868 | | |
| Beverages Total | | | 1,865,009 | | |
| Food & Staples Retailing – 0.7% | |
| Casey's General Stores, Inc. | | | 1,880 | | | | 58,994 | | |
| Costco Wholesale Corp. | | | 3,900 | | | | 220,194 | | |
| CVS Caremark Corp. | | | 6,500 | | | | 232,310 | | |
| Koninklijke Ahold NV | | | 17,900 | | | | 215,385 | | |
| Ruddick Corp. | | | 700 | | | | 18,634 | | |
| Safeway, Inc. | | | 1,360 | | | | 26,819 | | |
| Seven & I Holdings Co., Ltd. | | | 10,600 | | | | 252,667 | | |
| Spartan Stores, Inc. | | | 897 | | | | 12,675 | | |
| Wal-Mart Stores, Inc. | | | 11,507 | | | | 564,879 | | |
| Weis Markets, Inc. | | | 1,090 | | | | 34,825 | | |
| Food & Staples Retailing Total | | | 1,637,382 | | |
| Food Products – 1.1% | |
American Italian Pasta Co.,
Class A (a) | | | 1,523 | | | | 41,395 | | |
| Campbell Soup Co. | | | 950 | | | | 30,989 | | |
| China Milk Products Group Ltd. (a) | | | 322,000 | | | | 114,958 | | |
| Corn Products International, Inc. | | | 2,440 | | | | 69,589 | | |
| Darling International, Inc. (a) | | | 5,203 | | | | 38,242 | | |
| Dean Foods Co. (a) | | | 4,410 | | | | 78,454 | | |
| Fresh Del Monte Produce, Inc. (a) | | | 1,413 | | | | 31,948 | | |
| H.J. Heinz Co. | | | 1,500 | | | | 59,625 | | |
| Hershey Co. | | | 5,550 | | | | 215,673 | | |
| J.M. Smucker Co. | | | 12,300 | | | | 652,023 | | |
| Kerry Group PLC, Class A | | | 5,154 | | | | 147,449 | | |
| Nestle SA, Registered Shares | | | 10,475 | | | | 446,861 | | |
| Toyo Suisan Kaisha Ltd. | | | 9,000 | | | | 243,862 | | |
| Viterra, Inc. (a) | | | 17,082 | | | | 170,397 | | |
| Food Products Total | | | 2,341,465 | | |
| Household Products – 0.7% | |
Central Garden & Pet Co.,
Class A (a) | | | 2,670 | | | | 29,183 | | |
| Clorox Co. | | | 1,550 | | | | 91,171 | | |
| Colgate-Palmolive Co. | | | 4,250 | | | | 324,190 | | |
| Procter & Gamble Co. | | | 17,250 | | | | 999,120 | | |
| Household Products Total | | | 1,443,664 | | |
See Accompanying Notes to Financial Statements.
29
Columbia Asset Allocation Fund
September 30, 2009
| Common Stocks (continued) | |
| | | Shares | | Value ($) | |
| Personal Products – 0.6% | |
| Avon Products, Inc. | | | 25,786 | | | | 875,693 | | |
| Chattem, Inc. (a) | | | 454 | | | | 30,150 | | |
Estee Lauder Companies, Inc.,
Class A | | | 5,675 | | | | 210,429 | | |
| Herbalife Ltd. | | | 1,180 | | | | 38,633 | | |
Mead Johnson Nutrition Co.,
Class A | | | 5,250 | | | | 236,827 | | |
| Personal Products Total | | | 1,391,732 | | |
| Tobacco – 0.7% | |
| Japan Tobacco, Inc. | | | 77 | | | | 262,207 | | |
| Lorillard, Inc. | | | 590 | | | | 43,837 | | |
| Philip Morris International, Inc. | | | 26,376 | | | | 1,285,566 | | |
| Tobacco Total | | | 1,591,610 | | |
| Consumer Staples Total | | | 10,270,862 | | |
| Energy – 5.3% | |
| Energy Equipment & Services – 1.2% | |
| Core Laboratories N.V. | | | 230 | | | | 23,711 | | |
| Diamond Offshore Drilling, Inc. | | | 730 | | | | 69,729 | | |
| Dril-Quip, Inc. (a) | | | 1,010 | | | | 50,136 | | |
| FMC Technologies, Inc. (a) | | | 690 | | | | 36,046 | | |
| Gulf Island Fabrication, Inc. | | | 940 | | | | 17,616 | | |
| Halliburton Co. | | | 11,104 | | | | 301,140 | | |
| Lufkin Industries, Inc. | | | 270 | | | | 14,359 | | |
| Matrix Service Co. (a) | | | 1,510 | | | | 16,414 | | |
| Nabors Industries Ltd. (a) | | | 37,800 | | | | 790,020 | | |
| National Oilwell Varco, Inc. (a) | | | 1,350 | | | | 58,225 | | |
| Noble Corp. | | | 7,365 | | | | 279,575 | | |
| Patterson-UTI Energy, Inc. | | | 1,170 | | | | 17,667 | | |
| Pioneer Drilling Co. (a) | | | 2,946 | | | | 21,624 | | |
| Pride International, Inc. (a) | | | 2,300 | | | | 70,012 | | |
| Shinko Plantech Co., Ltd. | | | 16,800 | | | | 163,467 | | |
| Superior Well Services, Inc. (a) | | | 1,122 | | | | 10,861 | | |
| T-3 Energy Services, Inc. (a) | | | 800 | | | | 15,760 | | |
| TGC Industries, Inc. (a) | | | 1,693 | | | | 8,211 | | |
| Tidewater, Inc. | | | 510 | | | | 24,016 | | |
| Transocean Ltd. (a) | | | 7,542 | | | | 645,067 | | |
| Union Drilling, Inc. (a) | | | 2,415 | | | | 18,451 | | |
| Energy Equipment & Services Total | | | 2,652,107 | | |
| Oil, Gas & Consumable Fuels – 4.1% | |
| Alpha Natural Resources, Inc. (a) | | | 13,450 | | | | 472,095 | | |
| Apache Corp. | | | 11,050 | | | | 1,014,721 | | |
Australian Worldwide
Exploration Ltd. (a) | | | 80,539 | | | | 192,312 | | |
| Berry Petroleum Co., Class A | | | 760 | | | | 20,353 | | |
| BP PLC, ADR | | | 6,508 | | | | 346,421 | | |
| Cabot Oil & Gas Corp. | | | 2,100 | | | | 75,075 | | |
| | | Shares | | Value ($) | |
| Chevron Corp. | | | 8,200 | | | | 577,526 | | |
| Cimarex Energy Co. | | | 480 | | | | 20,794 | | |
| Comstock Resources, Inc. (a) | | | 790 | | | | 31,663 | | |
| Concho Resources, Inc. (a) | | | 958 | | | | 34,795 | | |
| Consol Energy, Inc. | | | 1,000 | | | | 45,110 | | |
| Contango Oil & Gas Co. (a) | | | 580 | | | | 29,615 | | |
| Continental Resources, Inc. (a) | | | 1,004 | | | | 39,327 | | |
| Devon Energy Corp. | | | 4,700 | | | | 316,451 | | |
| Encore Acquisition Co. (a) | | | 760 | | | | 28,424 | | |
| EOG Resources, Inc. | | | 6,675 | | | | 557,429 | | |
| Exxon Mobil Corp. | | | 19,575 | | | | 1,343,041 | | |
| Forest Oil Corp. (a) | | | 910 | | | | 17,809 | | |
| Goodrich Petroleum Corp. (a) | | | 950 | | | | 24,519 | | |
| Hess Corp. | | | 4,450 | | | | 237,897 | | |
| Holly Corp. | | | 830 | | | | 21,265 | | |
| Marathon Oil Corp. | | | 8,600 | | | | 274,340 | | |
| Mariner Energy, Inc. (a) | | | 1,560 | | | | 22,121 | | |
| Newfield Exploration Co. (a) | | | 11,050 | | | | 470,288 | | |
| Nordic American Tanker Shipping | | | 525 | | | | 15,529 | | |
| Occidental Petroleum Corp. | | | 13,500 | | | | 1,058,400 | | |
| Peabody Energy Corp. | | | 2,790 | | | | 103,844 | | |
| PetroHawk Energy Corp. (a) | | | 2,050 | | | | 49,630 | | |
| Petroleo Brasileiro SA, ADR | | | 4,200 | | | | 192,780 | | |
| Quicksilver Resources, Inc. (a) | | | 2,340 | | | | 33,205 | | |
| Repsol YPF SA | | | 3,590 | | | | 97,811 | | |
| Royal Dutch Shell PLC, Class B | | | 11,023 | | | | 306,243 | | |
| SandRidge Energy, Inc. (a) | | | 3,060 | | | | 39,658 | | |
| Stone Energy Corp. (a) | | | 3,991 | | | | 65,093 | | |
| Swift Energy Co. (a) | | | 1,060 | | | | 25,101 | | |
| Total SA | | | 7,812 | | | | 465,060 | | |
| Ultra Petroleum Corp. (a) | | | 700 | | | | 34,272 | | |
| Williams Companies, Inc. | | | 29,500 | | | | 527,165 | | |
Yanzhou Coal Mining Co., Ltd.,
Class H | | | 62,000 | | | | 88,575 | | |
| Oil, Gas & Consumable Fuels Total | | | 9,315,757 | | |
| Energy Total | | | 11,967,864 | | |
| Financials – 9.4% | |
| Capital Markets – 1.3% | |
| Affiliated Managers Group, Inc. (a) | | | 790 | | | | 51,358 | | |
| Ameriprise Financial, Inc. | | | 3,600 | | | | 130,788 | | |
| Evercore Partners, Inc., Class A | | | 678 | | | | 19,811 | | |
| Federated Investors, Inc., Class B | | | 490 | | | | 12,921 | | |
| Goldman Sachs Group, Inc. | | | 6,950 | | | | 1,281,233 | | |
| Greenhill & Co., Inc. | | | 700 | | | | 62,706 | | |
| Intermediate Capital Group PLC | | | 22,727 | | | | 108,622 | | |
Investment Technology Group,
Inc. (a) | | | 810 | | | | 22,615 | | |
| Janus Capital Group, Inc. | | | 6,366 | | | | 90,270 | | |
See Accompanying Notes to Financial Statements.
30
Columbia Asset Allocation Fund
September 30, 2009
| Common Stocks (continued) | |
| | | Shares | | Value ($) | |
| Mass Financial Corp., Class A (a) | | | 1,750 | | | | 16,625 | | |
| Morgan Stanley | | | 26,950 | | | | 832,216 | | |
| Piper Jaffray Companies, Inc. (a) | | | 488 | | | | 23,287 | | |
| Raymond James Financial, Inc. | | | 860 | | | | 20,021 | | |
| Stifel Financial Corp. (a) | | | 907 | | | | 49,794 | | |
| T. Rowe Price Group, Inc. | | | 1,180 | | | | 53,926 | | |
Waddell & Reed Financial, Inc.,
Class A | | | 3,988 | | | | 113,459 | | |
| Capital Markets Total | | | 2,889,652 | | |
| Commercial Banks – 3.7% | |
Australia & New Zealand
Banking Group Ltd. | | | 8,540 | | | | 183,071 | | |
| BancFirst Corp. | | | 616 | | | | 22,749 | | |
Banco Bilbao Vizcaya
Argentaria SA | | | 21,239 | | | | 377,971 | | |
| Banco Santander SA | | | 31,405 | | | | 507,372 | | |
| BancTrust Financial Group, Inc. | | | 1,838 | | | | 6,562 | | |
| Bank of China Ltd., Class H | | | 248,000 | | | | 129,733 | | |
| Bank of New York Mellon Corp. | | | 14,200 | | | | 411,658 | | |
| Barclays PLC | | | 56,220 | | | | 332,260 | | |
| BB&T Corp. | | | 17,500 | | | | 476,700 | | |
| BNP Paribas | | | 2,324 | | | | 185,879 | | |
| Bryn Mawr Bank Corp. | | | 1,107 | | | | 19,339 | | |
| Chemical Financial Corp. | | | 1,570 | | | | 34,210 | | |
| City National Corp. | | | 1,600 | | | | 62,288 | | |
| Columbia Banking System, Inc. | | | 1,389 | | | | 22,988 | | |
| Comerica, Inc. | | | 2,900 | | | | 86,043 | | |
| Community Trust Bancorp, Inc. | | | 728 | | | | 19,052 | | |
| Cullen/Frost Bankers, Inc. | | | 2,100 | | | | 108,444 | | |
| CVB Financial Corp. | | | 1,330 | | | | 10,095 | | |
| DBS Group Holdings Ltd. | | | 24,000 | | | | 224,616 | | |
| Fifth Third Bancorp. | | | 31,700 | | | | 321,121 | | |
First Citizens BancShares, Inc.,
Class A | | | 243 | | | | 38,661 | | |
First Commonwealth
Financial Corp. | | | 3,169 | | | | 18,000 | | |
| First Financial Corp. of Indiana | | | 979 | | | | 29,997 | | |
| First National Bank of Alaska | | | 9 | | | | 14,850 | | |
| HSBC Holdings PLC | | | 24,543 | | | | 280,963 | | |
| Investors Bancorp, Inc. (a) | | | 2,082 | | | | 22,090 | | |
| Merchants Bancshares, Inc. | | | 1,024 | | | | 21,873 | | |
| National Australia Bank Ltd. | | | 10,321 | | | | 278,972 | | |
| National Bank of Greece SA (a) | | | 6,801 | | | | 245,931 | | |
| Northfield Bancorp, Inc. | | | 1,519 | | | | 19,443 | | |
| Northrim BanCorp, Inc. | | | 1,214 | | | | 18,513 | | |
Pinnacle Financial Partners,
Inc. (a) | | | 2,376 | | | | 30,199 | | |
| PNC Financial Services Group, Inc. | | | 6,746 | | | | 327,788 | | |
| Standard Chartered PLC | | | 12,609 | | | | 310,892 | | |
| | | Shares | | Value ($) | |
Sumitomo Mitsui Financial
Group, Inc. | | | 5,900 | | | | 204,244 | | |
Sumitomo Trust & Banking
Co., Ltd. | | | 23,000 | | | | 120,920 | | |
| SunTrust Banks, Inc. | | | 13,650 | | | | 307,807 | | |
| SVB Financial Group (a) | | | 2,008 | | | | 86,886 | | |
Svenska Handelsbanken AB,
Class A | | | 10,274 | | | | 262,586 | | |
| Taylor Capital Group, Inc. (a) | | | 1,105 | | | | 7,293 | | |
| TCF Financial Corp. | | | 7,500 | | | | 97,800 | | |
| Turkiye Is Bankasi, Class C | | | 25,494 | | | | 100,253 | | |
| U.S. Bancorp | | | 33,939 | | | | 741,907 | | |
| Wells Fargo & Co. | | | 27,266 | | | | 768,356 | | |
| West Coast Bancorp | | | 1,580 | | | | 3,918 | | |
| Whitney Holding Corp. | | | 1,350 | | | | 12,879 | | |
| Yamaguchi Financial Group, Inc. | | | 8,000 | | | | 82,740 | | |
| Zions Bancorporation | | | 13,035 | | | | 234,239 | | |
| Commercial Banks Total | | | 8,232,151 | | |
| Consumer Finance – 0.2% | |
| American Express Co. | | | 12,100 | | | | 410,190 | | |
| Cash America International, Inc. | | | 1,240 | | | | 37,399 | | |
| Discover Financial Services | | | 5,319 | | | | 86,327 | | |
| Consumer Finance Total | | | 533,916 | | |
| Diversified Financial Services – 1.0% | |
| ING Groep NV (a) | | | 13,055 | | | | 233,271 | | |
| IntercontinentalExchange, Inc. (a) | | | 250 | | | | 24,297 | | |
| JPMorgan Chase & Co. | | | 44,303 | | | | 1,941,357 | | |
| Medallion Financial Corp. | | | 2,094 | | | | 17,506 | | |
| Moody's Corp. | | | 960 | | | | 19,642 | | |
| Pico Holdings, Inc. (a) | | | 450 | | | | 15,007 | | |
Portfolio Recovery Associates,
Inc. (a) | | | 933 | | | | 42,293 | | |
| Diversified Financial Services Total | | | 2,293,373 | | |
| Insurance – 2.0% | |
| ACE Ltd. (a) | | | 8,820 | | | | 471,517 | | |
| Aon Corp. | | | 7,600 | | | | 309,244 | | |
| Axis Capital Holdings Ltd. | | | 18,524 | | | | 559,054 | | |
| Baldwin & Lyons, Inc., Class B | | | 1,000 | | | | 23,450 | | |
Baloise Holding AG,
Registered Shares | | | 2,509 | | | | 240,075 | | |
| Brit Insurance Holdings PLC | | | 57,604 | | | | 187,836 | | |
| CNA Surety Corp. (a) | | | 1,760 | | | | 28,512 | | |
| EMC Insurance Group, Inc. | | | 1,101 | | | | 23,264 | | |
| FBL Financial Group, Inc. Class A | | | 1,422 | | | | 27,629 | | |
| First Mercury Financial Corp. | | | 1,784 | | | | 23,763 | | |
| Harleysville Group, Inc. | | | 580 | | | | 18,357 | | |
| Horace Mann Educators Corp. | | | 2,201 | | | | 30,748 | | |
| Lincoln National Corp. | | | 1,350 | | | | 34,979 | | |
See Accompanying Notes to Financial Statements.
31
Columbia Asset Allocation Fund
September 30, 2009
| Common Stocks (continued) | |
| | | Shares | | Value ($) | |
Marsh & McLennan
Companies, Inc. | | | 9,600 | | | | 237,408 | | |
National Western Life Insurance
Co., Class A | | | 117 | | | | 20,590 | | |
| Navigators Group, Inc. (a) | | | 514 | | | | 28,270 | | |
Platinum Underwriters
Holdings Ltd. | | | 390 | | | | 13,978 | | |
| Principal Financial Group, Inc. | | | 5,450 | | | | 149,276 | | |
| Prudential Financial, Inc. | | | 18,178 | | | | 907,264 | | |
| Reinsurance Group of America, Inc. | | | 2,900 | | | | 129,340 | | |
| RLI Corp. | | | 446 | | | | 23,540 | | |
| Safety Insurance Group, Inc. | | | 940 | | | | 30,945 | | |
| Sampo Oyj, Class A | | | 7,646 | | | | 192,660 | | |
| Selective Insurance Group, Inc. | | | 1,029 | | | | 16,186 | | |
| Stewart Information Services Corp. | | | 1,190 | | | | 14,720 | | |
United America Indemnity Ltd.,
Class A (a) | | | 6,551 | | | | 48,412 | | |
| United Fire & Casualty Co. | | | 1,243 | | | | 22,250 | | |
| XL Capital Ltd., Class A | | | 16,550 | | | | 288,963 | | |
Zurich Financial Services AG,
Registered Shares | | | 1,078 | | | | 256,908 | | |
| Insurance Total | | | 4,359,138 | | |
| Real Estate Investment Trusts (REITs) – 0.9% | |
Alexandria Real Estate
Equities, Inc. | | | 1,200 | | | | 65,220 | | |
| Boston Properties, Inc. | | | 850 | | | | 55,717 | | |
| DCT Industrial Trust, Inc. | | | 4,364 | | | | 22,300 | | |
| DiamondRock Hospitality Co. (a) | | | 3,870 | | | | 31,347 | | |
| Digital Realty Trust, Inc. | | | 980 | | | | 44,796 | | |
| Duke Realty Corp. | | | 1,030 | | | | 12,370 | | |
| DuPont Fabros Technology, Inc. (a) | | | 1,249 | | | | 16,649 | | |
| Equity Residential Property Trust | | | 1,300 | | | | 39,910 | | |
| Franklin Street Properties Corp. | | | 2,184 | | | | 28,610 | | |
| Getty Realty Corp. | | | 750 | | | | 18,405 | | |
| Home Properties, Inc. | | | 630 | | | | 27,147 | | |
| Host Hotels & Resorts, Inc. | | | 5,200 | | | | 61,204 | | |
| Japan Retail Fund Investment Corp. | | | 40 | | | | 217,061 | | |
| LaSalle Hotel Properties | | | 1,004 | | | | 19,739 | | |
| Mack-Cali Realty Corp. | | | 460 | | | | 14,872 | | |
| National Health Investors, Inc. | | | 962 | | | | 30,447 | | |
| National Retail Properties, Inc. | | | 2,812 | | | | 60,374 | | |
| Nationwide Health Properties, Inc. | | | 1,080 | | | | 33,469 | | |
| Plum Creek Timber Co., Inc. | | | 9,300 | | | | 284,952 | | |
| Potlatch Corp. | | | 1,240 | | | | 35,278 | | |
| ProLogis | | | 2,900 | | | | 34,568 | | |
| Rayonier, Inc. | | | 8,100 | | | | 331,371 | | |
| Simon Property Group, Inc. | | | 5,417 | | | | 376,102 | | |
| Starwood Property Trust, Inc. (a) | | | 900 | | | | 18,225 | | |
| Sun Communities, Inc. | | | 750 | | | | 16,140 | | |
| | | Shares | | Value ($) | |
| Sunstone Hotel Investors, Inc. (a) | | | 3,146 | | | | 22,337 | | |
Universal Health Realty Income
Trust | | | 810 | | | | 26,366 | | |
Urstadt Biddle Properties, Inc.,
Class A | | | 1,490 | | | | 21,739 | | |
| Vornado Realty Trust | | | 649 | | | | 41,802 | | |
Washington Real Estate
Investment Trust | | | 765 | | | | 22,032 | | |
| Real Estate Investment Trusts (REITs) Total | | | 2,030,549 | | |
| Real Estate Management & Development – 0.2% | |
| Avatar Holdings, Inc. (a) | | | 827 | | | | 15,713 | | |
CB Richard Ellis Group, Inc.,
Class A (a) | | | 3,500 | | | | 41,090 | | |
| Hongkong Land Holdings Ltd. | | | 45,000 | | | | 194,578 | | |
| Leopalace21 Corp. | | | 15,600 | | | | 124,419 | | |
| Maui Land & Pineapple Co., Inc. (a) | | | 810 | | | | 5,095 | | |
| Swire Pacific Ltd., Class A | | | 11,500 | | | | 134,949 | | |
| Real Estate Management & Development Total | | | 515,844 | | |
| Thrifts & Mortgage Finance – 0.1% | |
| Bank Mutual Corp. | | | 3,225 | | | | 28,509 | | |
| BankFinancial Corp. | | | 2,281 | | | | 21,852 | | |
| Beneficial Mutual Bancorp, Inc. (a) | | | 2,761 | | | | 25,208 | | |
| Brookline Bancorp, Inc. | | | 2,920 | | | | 28,382 | | |
| Clifton Savings Bancorp, Inc. | | | 1,840 | | | | 18,032 | | |
| ESSA Bancorp, Inc. | | | 1,228 | | | | 16,222 | | |
| Home Federal Bancorp, Inc. | | | 2,417 | | | | 27,602 | | |
| TrustCo Bank Corp. NY | | | 2,400 | | | | 15,000 | | |
| United Financial Bancorp, Inc. | | | 1,449 | | | | 16,780 | | |
| Washington Federal, Inc. | | | 1,720 | | | | 28,999 | | |
| Westfield Financial, Inc. | | | 2,729 | | | | 23,115 | | |
| Thrifts & Mortgage Finance Total | | | 249,701 | | |
| Financials Total | | | 21,104,324 | | |
| Health Care – 5.7% | |
| Biotechnology – 1.0% | |
| Alexion Pharmaceuticals, Inc. (a) | | | 1,660 | | | | 73,936 | | |
| Alkermes, Inc. (a) | | | 3,700 | | | | 34,003 | | |
| Amgen, Inc. (a) | | | 11,909 | | | | 717,279 | | |
| BioMarin Pharmaceuticals, Inc. (a) | | | 3,964 | | | | 71,669 | | |
| Celgene Corp. (a) | | | 4,950 | | | | 276,705 | | |
| Gilead Sciences, Inc. (a) | | | 7,650 | | | | 356,337 | | |
| Human Genome Sciences, Inc. (a) | | | 2,723 | | | | 51,247 | | |
| Immunogen, Inc. (a) | | | 3,011 | | | | 24,419 | | |
| Isis Pharmaceuticals, Inc. (a) | | | 2,310 | | | | 33,657 | | |
| Martek Biosciences Corp. (a) | | | 1,210 | | | | 27,334 | | |
| Onyx Pharmaceuticals, Inc. (a) | | | 2,530 | | | | 75,824 | | |
| Regeneron Pharmaceuticals, Inc. (a) | | | 2,021 | | | | 39,005 | | |
| Rigel Pharmaceuticals, Inc. (a) | | | 3,539 | | | | 29,020 | | |
See Accompanying Notes to Financial Statements.
32
Columbia Asset Allocation Fund
September 30, 2009
| Common Stocks (continued) | |
| | | Shares | | Value ($) | |
| Savient Pharmaceuticals, Inc. (a) | | | 1,280 | | | | 19,456 | | |
| Seattle Genetics, Inc. (a) | | | 3,427 | | | | 48,081 | | |
| Talecris Biotherapeutics | | | 2,566 | | | | 48,754 | | |
| Theravance, Inc. (a) | | | 1,500 | | | | 21,960 | | |
| United Therapeutics Corp. (a) | | | 894 | | | | 43,797 | | |
| Vertex Pharmaceuticals, Inc. (a) | | | 6,550 | | | | 248,245 | | |
| Biotechnology Total | | | 2,240,728 | | |
| Health Care Equipment & Supplies – 0.9% | |
American Medical Systems
Holdings, Inc. (a) | | | 1,660 | | | | 28,087 | | |
| Analogic Corp. | | | 270 | | | | 9,995 | | |
| Baxter International, Inc. | | | 10,100 | | | | 575,801 | | |
| Beckman Coulter, Inc. | | | 1,000 | | | | 68,940 | | |
| Boston Scientific Corp. (a) | | | 56,600 | | | | 599,394 | | |
| Cantel Medical Corp. (a) | | | 56 | | | | 961 | | |
| Cooper Companies, Inc. | | | 1,200 | | | | 35,676 | | |
| Hologic, Inc. (a) | | | 2,710 | | | | 44,282 | | |
| Hospira, Inc. (a) | | | 4,000 | | | | 178,400 | | |
| Intuitive Surgical, Inc. (a) | | | 290 | | | | 76,053 | | |
| Masimo Corp. (a) | | | 1,243 | | | | 32,567 | | |
| Meridian Bioscience, Inc. | | | 1,793 | | | | 44,843 | | |
| NuVasive, Inc. (a) | | | 1,021 | | | | 42,637 | | |
Palomar Medical Technologies,
Inc. (a) | | | 1,300 | | | | 21,073 | | |
| Quidel Corp. (a) | | | 2,370 | | | | 38,465 | | |
| STERIS Corp. | | | 1,620 | | | | 49,329 | | |
| Symmetry Medical, Inc. (a) | | | 1,260 | | | | 13,066 | | |
| Teleflex, Inc. | | | 1,200 | | | | 57,972 | | |
| Thoratec Corp. (a) | | | 920 | | | | 27,848 | | |
| Young Innovations, Inc. | | | 418 | | | | 10,998 | | |
| Health Care Equipment & Supplies Total | | | 1,956,387 | | |
| Health Care Providers & Services – 0.9% | |
Alliance Healthcare Services,
Inc. (a) | | | 4,471 | | | | 25,306 | | |
| Allion Healthcare, Inc. (a) | | | 1,870 | | | | 10,940 | | |
| AMERIGROUP Corp. (a) | | | 1,040 | | | | 23,057 | | |
| AmerisourceBergen Corp. | | | 2,700 | | | | 60,426 | | |
| AmSurg Corp. (a) | | | 709 | | | | 15,052 | | |
| CIGNA Corp. | | | 13,300 | | | | 373,597 | | |
| Community Health Systems, Inc. (a) | | | 1,700 | | | | 54,281 | | |
| Express Scripts, Inc. (a) | | | 1,450 | | | | 112,491 | | |
| Healthspring, Inc. (a) | | | 1,894 | | | | 23,202 | | |
| inVentiv Health, Inc. (a) | | | 1,643 | | | | 27,487 | | |
| Kindred Healthcare, Inc. (a) | | | 1,420 | | | | 23,047 | | |
| Magellan Health Services, Inc. (a) | | | 460 | | | | 14,288 | | |
| Medcath Corp. (a) | | | 1,570 | | | | 13,769 | | |
| Medco Health Solutions, Inc. (a) | | | 14,380 | | | | 795,358 | | |
| Mednax, Inc. (a) | | | 720 | | | | 39,542 | | |
| MWI Veterinary Supply, Inc. (a) | | | 221 | | | | 8,829 | | |
| | | Shares | | Value ($) | |
| NovaMed, Inc. (a) | | | 3,364 | | | | 15,239 | | |
| Owens & Minor, Inc. | | | 1,246 | | | | 56,381 | | |
| Patterson Companies, Inc. (a) | | | 1,790 | | | | 48,777 | | |
| Psychiatric Solutions, Inc. (a) | | | 3,404 | | | | 91,091 | | |
| Res-Care, Inc. (a) | | | 1,890 | | | | 26,857 | | |
Triple-S Management Corp.,
Class B (a) | | | 860 | | | | 14,422 | | |
| U.S. Physical Therapy, Inc. (a) | | | 740 | | | | 11,152 | | |
| VCA Antech, Inc. (a) | | | 1,560 | | | | 41,948 | | |
| Health Care Providers & Services Total | | | 1,926,539 | | |
| Health Care Technology – 0.0% | |
Allscripts-Misys Healthcare
Solutions, Inc. | | | 1,130 | | | | 22,905 | | |
| Cerner Corp. (a) | | | 450 | | | | 33,660 | | |
| Quality Systems, Inc. | | | 450 | | | | 27,707 | | |
| Health Care Technology Total | | | 84,272 | | |
| Life Sciences Tools & Services – 0.9% | |
| Albany Molecular Research, Inc. (a) | | | 2,350 | | | | 20,351 | | |
Bio-Rad Laboratories, Inc.,
Class A (a) | | | 334 | | | | 30,688 | | |
| Covance, Inc. (a) | | | 3,550 | | | | 192,232 | | |
| Dionex Corp. (a) | | | 826 | | | | 53,665 | | |
| ICON PLC, ADR (a) | | | 3,280 | | | | 80,327 | | |
| Illumina, Inc. (a) | | | 2,352 | | | | 99,960 | | |
| Life Technologies Corp. (a) | | | 18,080 | | | | 841,624 | | |
| Mettler-Toledo International, Inc. (a) | | | 500 | | | | 45,295 | | |
| Thermo Fisher Scientific, Inc. (a) | | | 17,083 | | | | 746,015 | | |
| Life Sciences Tools & Services Total | | | 2,110,157 | | |
| Pharmaceuticals – 2.0% | |
| Abbott Laboratories | | | 10,650 | | | | 526,855 | | |
| Allergan, Inc. | | | 6,550 | | | | 371,778 | | |
| Astellas Pharma, Inc. | | | 3,400 | | | | 139,712 | | |
| AstraZeneca PLC, ADR | | | 7,216 | | | | 324,359 | | |
| Bristol-Myers Squibb Co. | | | 19,550 | | | | 440,266 | | |
| Eurand NV (a) | | | 2,168 | | | | 32,824 | | |
| Johnson & Johnson | | | 10,250 | | | | 624,122 | | |
| Novartis AG, Registered Shares | | | 5,658 | | | | 284,034 | | |
| Perrigo Co. | | | 1,310 | | | | 44,527 | | |
| Pfizer, Inc. | | | 30,300 | | | | 501,465 | | |
Roche Holding AG, Genusschein
Shares | | | 2,302 | | | | 372,641 | | |
| Sanofi-Aventis SA | | | 5,217 | | | | 383,011 | | |
| Santen Pharmaceutical Co., Ltd. | | | 4,600 | | | | 169,045 | | |
| Schering-Plough Corp. | | | 8,800 | | | | 248,600 | | |
| Vivus, Inc. (a) | | | 1,390 | | | | 14,526 | | |
| Pharmaceuticals Total | | | 4,477,765 | | |
| Health Care Total | | | 12,795,848 | | |
See Accompanying Notes to Financial Statements.
33
Columbia Asset Allocation Fund
September 30, 2009
| Common Stocks (continued) | |
| | | Shares | | Value ($) | |
| Industrials – 5.7% | |
| Aerospace & Defense – 1.6% | |
| AAR Corp. (a) | | | 792 | | | | 17,377 | | |
| AerCap Holdings NV (a) | | | 4,700 | | | | 42,629 | | |
| Alliant Techsystems, Inc. (a) | | | 400 | | | | 31,140 | | |
| BAE Systems PLC | | | 40,742 | | | | 227,371 | | |
| BE Aerospace, Inc. (a) | | | 2,830 | | | | 56,996 | | |
| Ceradyne, Inc. (a) | | | 955 | | | | 17,505 | | |
| Esterline Technologies Corp. (a) | | | 550 | | | | 21,566 | | |
| Goodrich Corp. | | | 5,600 | | | | 304,304 | | |
| HEICO Corp. | | | 755 | | | | 32,737 | | |
| Hexcel Corp. (a) | | | 2,460 | | | | 28,142 | | |
| Honeywell International, Inc. | | | 10,900 | | | | 404,935 | | |
| ITT Corp. | | | 750 | | | | 39,113 | | |
| L-3 Communications Holdings, Inc. | | | 4,175 | | | | 335,336 | | |
| Ladish Co., Inc. (a) | | | 1,380 | | | | 20,879 | | |
| Lockheed Martin Corp. | | | 2,200 | | | | 171,776 | | |
| MTU Aero Engines Holding AG | | | 3,848 | | | | 182,254 | | |
| Precision Castparts Corp. | | | 4,360 | | | | 444,153 | | |
Spirit Aerosystems Holdings, Inc.,
Class A (a) | | | 3,439 | | | | 62,108 | | |
| Stanley, Inc. (a) | | | 740 | | | | 19,033 | | |
| Teledyne Technologies, Inc. (a) | | | 1,179 | | | | 42,432 | | |
| United Technologies Corp. | | | 18,530 | | | | 1,129,033 | | |
| Aerospace & Defense Total | | | 3,630,819 | | |
| Air Freight & Logistics – 0.2% | |
Expeditors International of
Washington, Inc. | | | 1,080 | | | | 37,962 | | |
| FedEx Corp. | | | 3,100 | | | | 233,182 | | |
| HUB Group, Inc., Class A (a) | | | 1,963 | | | | 44,854 | | |
| Pacer International, Inc. | | | 3,324 | | | | 12,831 | | |
| Air Freight & Logistics Total | | | 328,829 | | |
| Airlines – 0.1% | |
| Delta Air Lines, Inc. (a) | | | 7,500 | | | | 67,200 | | |
| Skywest, Inc. | | | 1,650 | | | | 27,357 | | |
| Turk Hava Yollari | | | 48,571 | | | | 126,860 | | |
| Airlines Total | | | 221,417 | | |
| Building Products – 0.0% | |
| Ameron International Corp. | | | 277 | | | | 19,384 | | |
| Builders FirstSource, Inc. (a) | | | 2,046 | | | | 8,921 | | |
| Lennox International, Inc. | | | 400 | | | | 14,448 | | |
| NCI Building Systems, Inc. (a) | | | 1,700 | | | | 5,440 | | |
| Universal Forest Products, Inc. | | | 470 | | | | 18,546 | | |
| Building Products Total | | | 66,739 | | |
| Commercial Services & Supplies – 0.3% | |
| ABM Industries, Inc. | | | 810 | | | | 17,042 | | |
| Aeon Delight Co., Ltd. | | | 8,200 | | | | 115,704 | | |
| ATC Technology Corp. (a) | | | 940 | | | | 18,574 | | |
| | | Shares | | Value ($) | |
| Consolidated Graphics, Inc. (a) | | | 650 | | | | 16,218 | | |
| Ennis, Inc. | | | 1,163 | | | | 18,759 | | |
| Geo Group, Inc. (a) | | | 1,884 | | | | 38,000 | | |
| Republic Services, Inc. | | | 11,750 | | | | 312,198 | | |
| Stericycle, Inc. (a) | | | 690 | | | | 33,431 | | |
| United Stationers, Inc. (a) | | | 560 | | | | 26,662 | | |
| Waste Connections, Inc. (a) | | | 1,590 | | | | 45,887 | | |
| Commercial Services & Supplies Total | | | 642,475 | | |
| Construction & Engineering – 0.7% | |
| Comfort Systems USA, Inc. | | | 1,472 | | | | 17,061 | | |
| COMSYS Holdings Corp. | | | 12,800 | | | | 139,494 | | |
| CTCI Corp. | | | 124,000 | | | | 120,482 | | |
| Dycom Industries, Inc. (a) | | | 1,810 | | | | 22,263 | | |
| EMCOR Group, Inc. (a) | | | 1,320 | | | | 33,422 | | |
| Foster Wheeler AG (a) | | | 2,430 | | | | 77,541 | | |
| Granite Construction, Inc. | | | 659 | | | | 20,390 | | |
| Great Lakes Dredge & Dock Corp. | | | 6,249 | | | | 43,618 | | |
| Impregilo SpA | | | 45,733 | | | | 200,471 | | |
| KBR, Inc. | | | 16,390 | | | | 381,723 | | |
KHD Humboldt Wedag
International Ltd. (a) | | | 1,180 | | | | 12,248 | | |
| Layne Christensen Co. (a) | | | 650 | | | | 20,833 | | |
| Sterling Construction Co., Inc. (a) | | | 750 | | | | 13,433 | | |
| Toyo Engineering Corp. | | | 42,000 | | | | 141,983 | | |
| Vinci SA | | | 4,070 | | | | 230,669 | | |
| Construction & Engineering Total | | | 1,475,631 | | |
| Electrical Equipment – 0.3% | |
| Acuity Brands, Inc. | | | 510 | | | | 16,427 | | |
| American Superconductor Corp. (a) | | | 1,090 | | | | 36,559 | | |
| A.O. Smith Corp. | | | 560 | | | | 21,336 | | |
| AMETEK, Inc. | | | 970 | | | | 33,863 | | |
| AZZ, Inc. (a) | | | 670 | | | | 26,914 | | |
| Belden, Inc. | | | 930 | | | | 21,483 | | |
| Cooper Industries PLC, Class A | | | 1,600 | | | | 60,112 | | |
| GrafTech International Ltd. (a) | | | 4,250 | | | | 62,475 | | |
| II-VI, Inc. (a) | | | 1,744 | | | | 44,367 | | |
| Regal-Beloit Corp. | | | 660 | | | | 30,169 | | |
| Roper Industries, Inc. | | | 860 | | | | 43,843 | | |
| Schneider Electric SA | | | 2,145 | | | | 217,603 | | |
| Thomas & Betts Corp. (a) | | | 1,220 | | | | 36,697 | | |
| Electrical Equipment Total | | | 651,848 | | |
| Industrial Conglomerates – 0.7% | |
| DCC PLC | | | 5,351 | | | | 138,531 | | |
| General Electric Co. | | | 33,479 | | | | 549,725 | | |
| McDermott International, Inc. (a) | | | 2,960 | | | | 74,799 | | |
| Siemens AG, Registered Shares | | | 1,026 | | | | 95,105 | | |
| Textron, Inc. | | | 1,820 | | | | 34,544 | | |
| Tyco International Ltd. | | | 22,414 | | | | 772,835 | | |
| Industrial Conglomerates Total | | | 1,665,539 | | |
See Accompanying Notes to Financial Statements.
34
Columbia Asset Allocation Fund
September 30, 2009
| Common Stocks (continued) | |
| | | Shares | | Value ($) | |
| Machinery – 1.0% | |
| Astec Industries, Inc. (a) | | | 555 | | | | 14,136 | | |
| Bucyrus International, Inc. | | | 1,280 | | | | 45,594 | | |
| CIRCOR International, Inc. | | | 660 | | | | 18,652 | | |
| Cummins, Inc. | | | 1,160 | | | | 51,980 | | |
| Demag Cranes AG | | | 3,610 | | | | 129,679 | | |
| Dover Corp. | | | 6,700 | | | | 259,692 | | |
| Dynamic Materials Corp. | | | 1,180 | | | | 23,553 | | |
| Eaton Corp. | | | 3,400 | | | | 192,406 | | |
| EnPro Industries, Inc. (a) | | | 1,000 | | | | 22,860 | | |
| Flowserve Corp. | | | 3,150 | | | | 310,401 | | |
| FreightCar America, Inc. | | | 747 | | | | 18,152 | | |
| Harsco Corp. | | | 2,340 | | | | 82,859 | | |
| Kadant, Inc. (a) | | | 1,168 | | | | 14,168 | | |
| Kennametal, Inc. | | | 2,100 | | | | 51,681 | | |
| LB Foster Co., Class A (a) | | | 437 | | | | 13,363 | | |
| Mueller Industries, Inc. | | | 850 | | | | 20,289 | | |
| Navistar International Corp. (a) | | | 6,881 | | | | 257,487 | | |
| PACCAR, Inc. | | | 2,300 | | | | 86,733 | | |
| Pall Corp. | | | 1,170 | | | | 37,768 | | |
| Parker Hannifin Corp. | | | 4,600 | | | | 238,464 | | |
| Robbins & Myers, Inc. | | | 770 | | | | 18,080 | | |
| SPX Corp. | | | 3,500 | | | | 214,445 | | |
| Stanley Works | | | 1,925 | | | | 82,178 | | |
| Trinity Industries, Inc. | | | 1,450 | | | | 24,925 | | |
| Wabtec Corp. | | | 1,778 | | | | 66,728 | | |
| Machinery Total | | | 2,296,273 | | |
| Marine – 0.0% | |
| Alexander & Baldwin, Inc. | | | 1,200 | | | | 38,508 | | |
| Genco Shipping & Trading Ltd. | | | 1,096 | | | | 22,775 | | |
| Kirby Corp. (a) | | | 820 | | | | 30,192 | | |
| Marine Total | | | 91,475 | | |
| Professional Services – 0.3% | |
| CDI Corp. | | | 1,211 | | | | 17,015 | | |
| Dun & Bradstreet Corp. | | | 520 | | | | 39,166 | | |
| Kforce, Inc. (a) | | | 1,139 | | | | 13,691 | | |
| Korn/Ferry International (a) | | | 2,424 | | | | 35,366 | | |
| LECG Corp. (a) | | | 2,253 | | | | 7,908 | | |
| Manpower, Inc. | | | 4,700 | | | | 266,537 | | |
| Monster Worldwide, Inc. (a) | | | 3,105 | | | | 54,275 | | |
| MPS Group, Inc. (a) | | | 3,860 | | | | 40,607 | | |
| Navigant Consulting, Inc. (a) | | | 930 | | | | 12,555 | | |
| Teleperformance | | | 2,779 | | | | 93,313 | | |
| Professional Services Total | | | 580,433 | | |
| Road & Rail – 0.3% | |
| Arkansas Best Corp. | | | 530 | | | | 15,868 | | |
| Con-way, Inc. | | | 2,025 | | | | 77,598 | | |
| Heartland Express, Inc. | | | 1,080 | | | | 15,552 | | |
| Landstar System, Inc. | | | 1,160 | | | | 44,150 | | |
| | | Shares | | Value ($) | |
| Norfolk Southern Corp. | | | 5,350 | | | | 230,638 | | |
| Old Dominion Freight Line, Inc. (a) | | | 1,670 | | | | 50,818 | | |
| Ryder System, Inc. | | | 3,920 | | | | 153,115 | | |
| Werner Enterprises, Inc. | | | 2,220 | | | | 41,359 | | |
| Road & Rail Total | | | 629,098 | | |
| Trading Companies & Distributors – 0.2% | |
| Beacon Roofing Supply, Inc. (a) | | | 3,000 | | | | 47,940 | | |
| Fastenal Co. | | | 970 | | | | 37,539 | | |
| Kaman Corp. | | | 1,043 | | | | 22,925 | | |
| Mitsui & Co., Ltd. | | | 9,100 | | | | 118,433 | | |
| W.W. Grainger, Inc. | | | 3,150 | | | | 281,484 | | |
| Watsco, Inc. | | | 280 | | | | 15,095 | | |
| Trading Companies & Distributors Total | | | 523,416 | | |
| Industrials Total | | | 12,803,992 | | |
| Information Technology – 8.7% | |
| Communications Equipment – 1.1% | |
| 3Com Corp. (a) | | | 10,340 | | | | 54,078 | | |
| ADC Telecommunications, Inc. (a) | | | 1,700 | | | | 14,178 | | |
| Anaren, Inc. (a) | | | 1,172 | | | | 19,924 | | |
| Arris Group, Inc. (a) | | | 2,863 | | | | 37,248 | | |
| Avocent Corp. (a) | | | 930 | | | | 18,851 | | |
| Bel Fuse, Inc., Class B | | | 479 | | | | 9,115 | | |
| Black Box Corp. | | | 787 | | | | 19,746 | | |
Brocade Communications Systems,
Inc. (a) | | | 3,220 | | | | 25,309 | | |
| Cisco Systems, Inc. (a) | | | 38,995 | | | | 917,942 | | |
| CommScope, Inc. (a) | | | 9,404 | | | | 281,462 | | |
Comtech Telecommunications
Corp. (a) | | | 740 | | | | 24,583 | | |
| Digi International, Inc. (a) | | | 2,148 | | | | 18,301 | | |
| Plantronics, Inc. | | | 910 | | | | 24,397 | | |
| Polycom, Inc. (a) | | | 3,454 | | | | 92,395 | | |
| QUALCOMM, Inc. | | | 15,400 | | | | 692,692 | | |
| Research In Motion Ltd. (a) | | | 2,650 | | | | 179,007 | | |
| Symmetricom, Inc. (a) | | | 2,310 | | | | 11,966 | | |
| Tandberg ASA | | | 1,390 | | | | 33,335 | | |
| Tekelec (a) | | | 870 | | | | 14,294 | | |
| Tellabs, Inc. (a) | | | 3,310 | | | | 22,905 | | |
| Communications Equipment Total | | | 2,511,728 | | |
| Computers & Peripherals – 2.3% | |
| Adaptec, Inc. (a) | | | 4,020 | | | | 13,427 | | |
| Apple, Inc. (a) | | | 6,450 | | | | 1,195,636 | | |
| Dell, Inc. (a) | | | 18,500 | | | | 282,310 | | |
| Diebold, Inc. | | | 2,100 | | | | 69,153 | | |
| Electronics for Imaging, Inc. (a) | | | 1,450 | | | | 16,342 | | |
| EMC Corp. (a) | | | 68,850 | | | | 1,173,204 | | |
| Hewlett-Packard Co. | | | 17,270 | | | | 815,317 | | |
See Accompanying Notes to Financial Statements.
35
Columbia Asset Allocation Fund
September 30, 2009
| Common Stocks (continued) | |
| | | Shares | | Value ($) | |
International Business Machines
Corp. | | | 11,000 | | | | 1,315,710 | | |
| NCR Corp. (a) | | | 7,110 | | | | 98,260 | | |
| NetApp, Inc. (a) | | | 1,160 | | | | 30,949 | | |
| Synaptics, Inc. (a) | | | 770 | | | | 19,404 | | |
| Teradata Corp. (a) | | | 1,000 | | | | 27,520 | | |
| Western Digital Corp. (a) | | | 980 | | | | 35,799 | | |
| Computers & Peripherals Total | | | 5,093,031 | | |
| Electronic Equipment, Instruments & Components – 0.4% | |
| Agilent Technologies, Inc. (a) | | | 1,400 | | | | 38,962 | | |
| Anixter International, Inc. (a) | | | 650 | | | | 26,072 | | |
| Arrow Electronics, Inc. (a) | | | 2,300 | | | | 64,745 | | |
| Benchmark Electronics, Inc. (a) | | | 2,100 | | | | 37,800 | | |
| Brightpoint, Inc. (a) | | | 15,929 | | | | 139,379 | | |
| Corning, Inc. | | | 11,350 | | | | 173,768 | | |
| CPI International, Inc. (a) | | | 1,363 | | | | 15,252 | | |
| CTS Corp. | | | 1,800 | | | | 16,740 | | |
| Electro Scientific Industries, Inc. (a) | | | 1,320 | | | | 17,675 | | |
| Flextronics International Ltd. (a) | | | 4,350 | | | | 32,451 | | |
| FUJIFILM Holdings Corp. | | | 5,100 | | | | 151,668 | | |
| Littelfuse, Inc. (a) | | | 538 | | | | 14,091 | | |
| Methode Electronics, Inc. | | | 1,884 | | | | 16,334 | | |
| MTS Systems Corp. | | | 750 | | | | 21,908 | | |
| NAM TAI Electronics, Inc. | | | 3,081 | | | | 16,637 | | |
| TTM Technologies, Inc. (a) | | | 3,970 | | | | 45,536 | | |
Electronic Equipment, Instruments &
Components Total | | | 829,018 | | |
| Internet Software & Services – 1.0% | |
| Akamai Technologies, Inc. (a) | | | 10,660 | | | | 209,789 | | |
| comScore, Inc. (a) | | | 1,470 | | | | 26,475 | | |
| eBay, Inc. (a) | | | 10,900 | | | | 257,349 | | |
| Equinix, Inc. (a) | | | 3,954 | | | | 363,768 | | |
| Google, Inc., Class A (a) | | | 2,072 | | | | 1,027,401 | | |
| IAC/InterActiveCorp (a) | | | 1,330 | | | | 26,853 | | |
| InfoSpace, Inc. (a) | | | 1,540 | | | | 11,920 | | |
| MercadoLibre, Inc. (a) | | | 350 | | | | 13,461 | | |
| Perficient, Inc. (a) | | | 3,080 | | | | 25,471 | | |
| Switch & Data Facilities Co., Inc. (a) | | | 2,550 | | | | 34,705 | | |
| United Online, Inc. | | | 1,670 | | | | 13,427 | | |
| ValueClick, Inc. (a) | | | 2,910 | | | | 38,383 | | |
| VeriSign, Inc. (a) | | | 3,590 | | | | 85,047 | | |
| Yahoo! Japan Corp. | | | 333 | | | | 112,499 | | |
| Internet Software & Services Total | | | 2,246,548 | | |
| IT Services – 0.4% | |
| Acxiom Corp. (a) | | | 1,200 | | | | 11,352 | | |
| Alliance Data Systems Corp. (a) | | | 610 | | | | 37,259 | | |
| Amdocs Ltd. (a) | | | 1,030 | | | | 27,686 | | |
| CACI International, Inc., Class A (a) | | | 1,394 | | | | 65,894 | | |
| Cap Gemini SA | | | 2,322 | | | | 121,766 | | |
| | | Shares | | Value ($) | |
Cognizant Technology
Solutions Corp., Class A (a) | | | 1,410 | | | | 54,511 | | |
| CSG Systems International, Inc. (a) | | | 1,051 | | | | 16,827 | | |
| Cybersource Corp. (a) | | | 1,490 | | | | 24,838 | | |
| Hewitt Associates, Inc., Class A (a) | | | 860 | | | | 31,330 | | |
| MasterCard, Inc., Class A | | | 130 | | | | 26,280 | | |
| MAXIMUS, Inc. | | | 350 | | | | 16,310 | | |
| Paychex, Inc. | | | 910 | | | | 26,435 | | |
| Redecard SA | | | 7,100 | | | | 109,209 | | |
| Syntel, Inc. | | | 1,130 | | | | 53,935 | | |
| TeleTech Holdings, Inc. (a) | | | 3,674 | | | | 62,678 | | |
| Visa, Inc., Class A | | | 2,450 | | | | 169,319 | | |
| Western Union Co. | | | 2,830 | | | | 53,544 | | |
| Wright Express Corp. (a) | | | 1,210 | | | | 35,707 | | |
| IT Services Total | | | 944,880 | | |
| Office Electronics – 0.1% | |
| Canon, Inc. | | | 6,000 | | | | 240,023 | | |
| Office Electronics Total | | | 240,023 | | |
| Semiconductors & Semiconductor Equipment – 1.9% | |
| Altera Corp. | | | 1,480 | | | | 30,355 | | |
| Amkor Technology, Inc. (a) | | | 2,380 | | | | 16,374 | | |
| Analog Devices, Inc. | | | 13,169 | | | | 363,201 | | |
| Atheros Communications, Inc. (a) | | | 1,510 | | | | 40,060 | | |
| Atmel Corp. (a) | | | 3,500 | | | | 14,665 | | |
| ATMI, Inc. (a) | | | 730 | | | | 13,250 | | |
| Broadcom Corp., Class A (a) | | | 8,750 | | | | 268,538 | | |
| Cabot Microelectronics Corp. (a) | | | 850 | | | | 29,631 | | |
| Cavium Networks, Inc. (a) | | | 1,520 | | | | 32,634 | | |
| Cirrus Logic, Inc. (a) | | | 2,680 | | | | 14,901 | | |
| Cypress Semiconductor Corp. (a) | | | 7,750 | | | | 80,058 | | |
Fairchild Semiconductor
International, Inc. (a) | | | 1,906 | | | | 19,498 | | |
| Intel Corp. | | | 34,700 | | | | 679,079 | | |
| Intersil Corp., Class A | | | 14,097 | | | | 215,825 | | |
| KLA-Tencor Corp. | | | 10,100 | | | | 362,186 | | |
| Kulicke & Soffa Industries, Inc. (a) | | | 2,276 | | | | 13,706 | | |
| Lam Research Corp. (a) | | | 10,416 | | | | 355,811 | | |
| Linear Technology Corp. | | | 1,620 | | | | 44,761 | | |
| Maxim Integrated Products, Inc. | | | 11,100 | | | | 201,354 | | |
| MEMC Electronic Materials, Inc. (a) | | | 1,550 | | | | 25,777 | | |
| Microchip Technology, Inc. | | | 1,560 | | | | 41,340 | | |
| Micron Technology, Inc. (a) | | | 4,090 | | | | 33,538 | | |
| MKS Instruments, Inc. (a) | | | 893 | | | | 17,226 | | |
| Monolithic Power Systems, Inc. (a) | | | 911 | | | | 21,363 | | |
| Novellus Systems, Inc. (a) | | | 2,390 | | | | 50,142 | | |
| NVIDIA Corp. (a) | | | 2,780 | | | | 41,783 | | |
| OmniVision Technologies, Inc. (a) | | | 1,635 | | | | 26,618 | | |
| ON Semiconductor Corp. (a) | | | 3,570 | | | | 29,453 | | |
| RF Micro Devices, Inc. (a) | | | 2,810 | | | | 15,258 | | |
See Accompanying Notes to Financial Statements.
36
Columbia Asset Allocation Fund
September 30, 2009
| Common Stocks (continued) | |
| | | Shares | | Value ($) | |
| Semtech Corp. (a) | | | 2,310 | | | | 39,293 | | |
| Silicon Laboratories, Inc. (a) | | | 750 | | | | 34,770 | | |
| Skyworks Solutions, Inc. (a) | | | 3,780 | | | | 50,047 | | |
| Teradyne, Inc. (a) | | | 19,800 | | | | 183,150 | | |
| Texas Instruments, Inc. | | | 27,850 | | | | 659,766 | | |
| TriQuint Semiconductor, Inc. (a) | | | 4,220 | | | | 32,578 | | |
United Microelectronics
Corp., ADR (a) | | | 40,160 | | | | 152,608 | | |
| Verigy Ltd. (a) | | | 4,293 | | | | 49,885 | | |
| Xilinx, Inc. | | | 1,720 | | | | 40,282 | | |
| Zoran Corp. (a) | | | 1,385 | | | | 15,955 | | |
Semiconductors & Semiconductor
Equipment Total | | | 4,356,719 | | |
| Software – 1.5% | |
| Activision Blizzard, Inc. (a) | | | 14,856 | | | | 184,066 | | |
| Adobe Systems, Inc. (a) | | | 6,570 | | | | 217,073 | | |
| ANSYS, Inc. (a) | | | 1,169 | | | | 43,802 | | |
| Autodesk, Inc. (a) | | | 2,370 | | | | 56,406 | | |
| Autonomy Corp. PLC (a) | | | 3,938 | | | | 102,755 | | |
| BMC Software, Inc. (a) | | | 7,380 | | | | 276,971 | | |
| Cadence Design Systems, Inc. (a) | | | 3,070 | | | | 22,534 | | |
| Citrix Systems, Inc. (a) | | | 2,200 | | | | 86,306 | | |
| Concur Technologies, Inc. (a) | | | 704 | | | | 27,991 | | |
| Electronic Arts, Inc. (a) | | | 1,380 | | | | 26,289 | | |
| Intuit, Inc. (a) | | | 1,290 | | | | 36,765 | | |
| Jack Henry & Associates, Inc. | | | 520 | | | | 12,204 | | |
| McAfee, Inc. (a) | | | 740 | | | | 32,405 | | |
| Mentor Graphics Corp. (a) | | | 2,521 | | | | 23,470 | | |
| Micros Systems, Inc. (a) | | | 1,120 | | | | 33,813 | | |
| Microsoft Corp. | | | 52,530 | | | | 1,360,002 | | |
| Monotype Imaging Holdings, Inc. (a) | | | 293 | | | | 2,464 | | |
| Net 1 UEPS Technologies, Inc. (a) | | | 3,156 | | | | 66,150 | | |
| Nintendo Co., Ltd. | | | 600 | | | | 153,419 | | |
| Oracle Corp. | | | 12,700 | | | | 264,668 | | |
| Parametric Technology Corp. (a) | | | 1,190 | | | | 16,446 | | |
| Progress Software Corp. (a) | | | 750 | | | | 16,987 | | |
| Rovi Corp. (a) | | | 870 | | | | 29,232 | | |
| Salesforce.com, Inc. (a) | | | 850 | | | | 48,390 | | |
| Solera Holdings, Inc. | | | 1,250 | | | | 38,887 | | |
| Synopsys, Inc. (a) | | | 1,600 | | | | 35,872 | | |
| THQ, Inc. (a) | | | 5,690 | | | | 38,920 | | |
| Websense, Inc. (a) | | | 2,931 | | | | 49,241 | | |
| Software Total | | | 3,303,528 | | |
| Information Technology Total | | | 19,525,475 | | |
| Materials – 2.9% | |
| Chemicals – 0.8% | |
| Air Products & Chemicals, Inc. | | | 1,100 | | | | 85,338 | | |
| Albemarle Corp. | | | 1,725 | | | | 59,685 | | |
| | | Shares | | Value ($) | |
| BASF SE | | | 6,046 | | | | 320,102 | | |
| Celanese Corp., Series A | | | 7,350 | | | | 183,750 | | |
| CF Industries Holdings, Inc. | | | 870 | | | | 75,020 | | |
| Clariant AG, Registered Shares (a) | | | 17,658 | | | | 160,580 | | |
| Cytec Industries, Inc. | | | 810 | | | | 26,301 | | |
| Ecolab, Inc. | | | 720 | | | | 33,286 | | |
| H.B. Fuller Co. | | | 1,860 | | | | 38,874 | | |
| Koppers Holdings, Inc. | | | 1,090 | | | | 32,318 | | |
| Monsanto Co. | | | 4,900 | | | | 379,260 | | |
| OM Group, Inc. (a) | | | 950 | | | | 28,871 | | |
| Potash Corp. of Saskatchewan, Inc. | | | 2,060 | | | | 186,100 | | |
| PPG Industries, Inc. | | | 1,300 | | | | 75,673 | | |
| Solutia, Inc. (a) | | | 2,210 | | | | 25,592 | | |
| Syngenta AG, Registered Shares | | | 475 | | | | 109,050 | | |
| Chemicals Total | | | 1,819,800 | | |
| Construction Materials – 0.1% | |
| Ciments Francais SA | | | 1,254 | | | | 140,783 | | |
| Eagle Materials, Inc. | | | 542 | | | | 15,491 | | |
| Martin Marietta Materials, Inc. | | | 560 | | | | 51,559 | | |
| Construction Materials Total | | | 207,833 | | |
| Containers & Packaging – 0.4% | |
| Crown Holdings, Inc. (a) | | | 12,360 | | | | 336,192 | | |
| Greif, Inc., Class A | | | 1,672 | | | | 92,043 | | |
| Greif, Inc., Class B | | | 941 | | | | 49,092 | | |
| Owens-Illinois, Inc. (a) | | | 5,350 | | | | 197,415 | | |
| Packaging Corp. of America | | | 5,312 | | | | 108,365 | | |
| Toyo Seikan Kaisha Ltd. | | | 7,400 | | | | 141,692 | | |
| Containers & Packaging Total | | | 924,799 | | |
| Metals & Mining – 1.4% | |
| Agnico-Eagle Mines Ltd. | | | 570 | | | | 38,674 | | |
| Anglo American PLC (a) | | | 5,060 | | | | 161,076 | | |
| BHP Billiton PLC | | | 14,956 | | | | 411,020 | | |
| BlueScope Steel Ltd. | | | 49,675 | | | | 127,245 | | |
| Carpenter Technology Corp. | | | 700 | | | | 16,373 | | |
| Cliffs Natural Resources, Inc. | | | 2,600 | | | | 84,136 | | |
Compass Minerals
International, Inc. | | | 280 | | | | 17,254 | | |
Freeport-McMoRan Copper &
Gold, Inc. | | | 3,575 | | | | 245,281 | | |
| Harry Winston Diamond Corp. | | | 2,877 | | | | 24,080 | | |
| Haynes International, Inc. (a) | | | 707 | | | | 22,497 | | |
| Nucor Corp. | | | 8,000 | | | | 376,080 | | |
| Olympic Steel, Inc. | | | 849 | | | | 24,358 | | |
| RTI International Metals, Inc. (a) | | | 1,160 | | | | 28,896 | | |
| Salzgitter AG | | | 1,660 | | | | 159,108 | | |
| Steel Dynamics, Inc. | | | 16,750 | | | | 256,945 | | |
| Tokyo Steel Manufacturing Co., Ltd. | | | 12,300 | | | | 149,735 | | |
| United States Steel Corp. | | | 14,325 | | | | 635,600 | | |
See Accompanying Notes to Financial Statements.
37
Columbia Asset Allocation Fund
September 30, 2009
| Common Stocks (continued) | |
| | | Shares | | Value ($) | |
| Walter Energy, Inc. | | | 710 | | | | 42,643 | | |
| Yamato Kogyo Co., Ltd. | | | 5,900 | | | | 164,971 | | |
| Metals & Mining Total | | | 2,985,972 | | |
| Paper & Forest Products – 0.2% | |
| Weyerhaeuser Co. | | | 12,600 | | | | 461,790 | | |
| Paper & Forest Products Total | | | 461,790 | | |
| Materials Total | | | 6,400,194 | | |
| Telecommunication Services – 1.4% | |
| Diversified Telecommunication Services – 1.0% | |
| AT&T, Inc. | | | 27,052 | | | | 730,674 | | |
| BCE, Inc. | | | 5,900 | | | | 145,427 | | |
Bezeq Israeli Telecommunication
Corp., Ltd. | | | 76,526 | | | | 164,703 | | |
| France Telecom SA | | | 4,879 | | | | 130,506 | | |
| Neutral Tandem, Inc. (a) | | | 760 | | | | 17,298 | | |
Nippon Telegraph &
Telephone Corp. | | | 4,800 | | | | 221,576 | | |
| Tele2 AB, Class B | | | 9,485 | | | | 126,087 | | |
| Telefonica O2 Czech Republic AS | | | 6,938 | | | | 171,811 | | |
| Telekomunikacja Polska SA | | | 24,844 | | | | 137,036 | | |
| Verizon Communications, Inc. | | | 9,085 | | | | 275,003 | | |
| Vimpel-Communications, ADR (a) | | | 1,740 | | | | 32,538 | | |
| Warwick Valley Telephone Co. | | | 1,293 | | | | 15,270 | | |
Diversified Telecommunication
Services Total | | | 2,167,929 | | |
| Wireless Telecommunication Services – 0.4% | |
| American Tower Corp., Class A (a) | | | 9,494 | | | | 345,582 | | |
| Leap Wireless International, Inc. (a) | | | 780 | | | | 15,249 | | |
Millicom International
Cellular SA (a) | | | 1,912 | | | | 139,079 | | |
| NII Holdings, Inc. (a) | | | 2,270 | | | | 68,055 | | |
| NTELOS Holdings Corp. | | | 3,750 | | | | 66,225 | | |
SBA Communications Corp.,
Class A (a) | | | 1,760 | | | | 47,573 | | |
| Softbank Corp. | | | 4,800 | | | | 104,794 | | |
| Syniverse Holdings, Inc. (a) | | | 1,255 | | | | 21,962 | | |
| Vodafone Group PLC | | | 39,407 | | | | 88,446 | | |
| Wireless Telecommunication Services Total | | | 896,965 | | |
| Telecommunication Services Total | | | 3,064,894 | | |
| Utilities – 2.0% | |
| Electric Utilities – 0.8% | |
| ALLETE, Inc. | | | 830 | | | | 27,863 | | |
| American Electric Power Co., Inc. | | | 11,800 | | | | 365,682 | | |
| El Paso Electric Co. (a) | | | 1,370 | | | | 24,208 | | |
| Enel SpA | | | 20,183 | | | | 128,174 | | |
| | | Shares | | Value ($) | |
| Exelon Corp. | | | 3,700 | | | | 183,594 | | |
| FPL Group, Inc. | | | 9,900 | | | | 546,777 | | |
| Great Plains Energy, Inc. | | | 940 | | | | 16,873 | | |
| Hawaiian Electric Industries, Inc. | | | 620 | | | | 11,234 | | |
| Iberdrola SA | | | 20,115 | | | | 197,697 | | |
| Maine & Maritimes Corp. | | | 269 | | | | 9,670 | | |
| MGE Energy, Inc. | | | 790 | | | | 28,819 | | |
| Northeast Utilities | | | 8,024 | | | | 190,490 | | |
| PPL Corp. | | | 960 | | | | 29,126 | | |
| UIL Holdings Corp. | | | 840 | | | | 22,168 | | |
| Electric Utilities Total | | | 1,782,375 | | |
| Gas Utilities – 0.0% | |
| Laclede Group, Inc. | | | 810 | | | | 26,050 | | |
| Questar Corp. | | | 1,070 | | | | 40,189 | | |
| Gas Utilities Total | | | 66,239 | | |
| Independent Power Producers & Energy Traders – 0.4% | |
| AES Corp. (a) | | | 36,735 | | | | 544,413 | | |
| Black Hills Corp. | | | 1,340 | | | | 33,728 | | |
| Drax Group PLC | | | 23,304 | | | | 175,602 | | |
| International Power PLC | | | 38,120 | | | | 176,290 | | |
Independent Power Producers & Energy
Traders Total | | | 930,033 | | |
| Multi-Utilities – 0.8% | |
| AGL Energy Ltd. | | | 16,666 | | | | 200,860 | | |
| Avista Corp. | | | 1,750 | | | | 35,385 | | |
| CH Energy Group, Inc. | | | 480 | | | | 21,269 | | |
| NorthWestern Corp. | | | 1,170 | | | | 28,583 | | |
| PG&E Corp. | | | 12,458 | | | | 504,424 | | |
Public Service Enterprise
Group, Inc. | | | 2,200 | | | | 69,168 | | |
| RWE AG | | | 2,900 | | | | 269,684 | | |
| Sempra Energy | | | 2,150 | | | | 107,091 | | |
| United Utilities Group PLC | | | 9,452 | | | | 69,016 | | |
| Wisconsin Energy Corp. | | | 6,500 | | | | 293,605 | | |
| Xcel Energy, Inc. | | | 4,870 | | | | 93,699 | | |
| Multi-Utilities Total | | | 1,692,784 | | |
| Utilities Total | | | 4,471,431 | | |
Total Common Stocks
(cost of $96,360,934) | | | 115,090,443 | | |
| Corporate Fixed-Income Bonds & Notes – 13.5% | |
| | | Par ($) | | | |
| Basic Materials – 0.9% | |
| Chemicals – 0.3% | |
| EI Du Pont de Nemours & Co. | |
| 5.000% 07/15/13 | | | 100,000 | | | | 108,931 | | |
See Accompanying Notes to Financial Statements.
38
Columbia Asset Allocation Fund
September 30, 2009
| Corporate Fixed-Income Bonds & Notes (continued) | |
| | | Par ($) | | Value ($) | |
| Huntsman International LLC | |
| 7.875% 11/15/14 | | | 475,000 | | | | 442,937 | | |
| Chemicals Total | | | 551,868 | | |
| Forest Products & Paper – 0.2% | |
| Georgia-Pacific Corp. | |
| 8.000% 01/15/24 | | | 470,000 | | | | 465,300 | | |
| Forest Products & Paper Total | | | 465,300 | | |
| Iron/Steel – 0.1% | |
| Nucor Corp. | |
| 5.850% 06/01/18 | | | 215,000 | | | | 235,443 | | |
| Iron/Steel Total | | | 235,443 | | |
| Metals & Mining – 0.3% | |
| Freeport-McMoRan Copper & Gold, Inc. | |
| 8.375% 04/01/17 | | | 395,000 | | | | 420,181 | | |
| Vale Overseas Ltd. | |
| 6.250% 01/23/17 | | | 275,000 | | | | 294,413 | | |
| Metals & Mining Total | | | 714,594 | | |
| Basic Materials Total | | | 1,967,205 | | |
| Communications – 2.1% | |
| Media – 0.5% | |
| Comcast Corp. | |
| 7.050% 03/15/33 | | | 275,000 | | | | 311,868 | | |
| DISH DBS Corp. | |
| 6.625% 10/01/14 | | | 440,000 | | | | 427,900 | | |
| News America, Inc. | |
| 6.550% 03/15/33 | | | 275,000 | | | | 281,462 | | |
| Viacom, Inc. | |
| 6.125% 10/05/17 | | | 110,000 | | | | 117,786 | | |
| Media Total | | | 1,139,016 | | |
| Telecommunication Services – 1.6% | |
| AT&T, Inc. | |
| 4.950% 01/15/13 | | | 350,000 | | | | 373,170 | | |
| British Telecommunications PLC | |
| 5.150% 01/15/13 | | | 225,000 | | | | 234,406 | | |
| Cricket Communications, Inc. | |
| 9.375% 11/01/14 | | | 425,000 | | | | 431,375 | | |
| Intelsat Corp. | |
| 9.250% 06/15/16 | | | 410,000 | | | | 422,300 | | |
| Lucent Technologies, Inc. | |
| 6.450% 03/15/29 | | | 685,000 | | | | 521,456 | | |
| New Cingular Wireless Services, Inc. | |
| 8.750% 03/01/31 | | | 175,000 | | | | 231,816 | | |
| Qwest Communications International, Inc. | |
| 7.500% 02/15/14 | | | 440,000 | | | | 434,500 | | |
| | | Par ($) | | Value ($) | |
| Telefonica Emisiones SAU | |
| 5.984% 06/20/11 | | | 300,000 | | | | 319,650 | | |
| Verizon Wireless Capital LLC | |
| 5.550% 02/01/14 (b) | | | 365,000 | | | | 394,449 | | |
| Vodafone Group PLC | |
| 5.750% 03/15/16 | | | 175,000 | | | | 187,529 | | |
| Telecommunication Services Total | | | 3,550,651 | | |
| Communications Total | | | 4,689,667 | | |
| Consumer Cyclical – 0.6% | |
| Apparel – 0.2% | |
| Levi Strauss & Co. | |
| 9.750% 01/15/15 | | | 405,000 | | | | 421,200 | | |
| Apparel Total | | | 421,200 | | |
| Lodging – 0.2% | |
| Host Hotels & Resorts LP | |
| 6.750% 06/01/16 | | | 440,000 | | | | 418,000 | | |
| Lodging Total | | | 418,000 | | |
| Retail – 0.2% | |
| CVS Caremark Corp. | |
| 6.125% 09/15/39 | | | 255,000 | | | | 259,392 | | |
| Wal-Mart Stores, Inc. | |
| 5.800% 02/15/18 | | | 250,000 | | | | 280,822 | | |
| Retail Total | | | 540,214 | | |
| Consumer Cyclical Total | | | 1,379,414 | | |
| Consumer Non-Cyclical – 1.2% | |
| Beverages – 0.2% | |
| Bottling Group LLC | |
| 6.950% 03/15/14 | | | 200,000 | | | | 233,090 | | |
| Miller Brewing Co. | |
| 5.500% 08/15/13 (b) | | | 250,000 | | | | 264,209 | | |
| Beverages Total | | | 497,299 | | |
| Food – 0.3% | |
| Campbell Soup Co. | |
| 4.500% 02/15/19 | | | 115,000 | | | | 118,001 | | |
| ConAgra Foods, Inc. | |
| 6.750% 09/15/11 | | | 16,000 | | | | 17,458 | | |
| JBS USA LLC/JBS USA Finance, Inc. | |
| 11.625% 05/01/14 (b) | | | 405,000 | | | | 435,375 | | |
| Food Total | | | 570,834 | | |
| Healthcare Services – 0.3% | |
| HCA, Inc. | |
PIK,
9.625% 11/15/16 | | | 205,000 | | | | 213,200 | | |
See Accompanying Notes to Financial Statements.
39
Columbia Asset Allocation Fund
September 30, 2009
| Corporate Fixed-Income Bonds & Notes (continued) | |
| | | Par ($) | | Value ($) | |
| Roche Holdings, Inc. | |
| 6.000% 03/01/19 (b) | | | 310,000 | | | | 345,073 | | |
| Healthcare Services Total | | | 558,273 | | |
| Pharmaceuticals – 0.4% | |
| Express Scripts, Inc. | |
| 5.250% 06/15/12 | | | 200,000 | | | | 212,308 | | |
| Omnicare, Inc. | |
| 6.875% 12/15/15 | | | 445,000 | | | | 427,200 | | |
| Wyeth | |
| 5.500% 02/01/14 | | | 280,000 | | | | 305,790 | | |
| Pharmaceuticals Total | | | 945,298 | | |
| Consumer Non-Cyclical Total | | | 2,571,704 | | |
| Energy – 1.5% | |
| Oil & Gas – 0.7% | |
| Canadian Natural Resources Ltd. | |
| 5.700% 05/15/17 | | | 250,000 | | | | 265,680 | | |
| Chesapeake Energy Corp. | |
| 6.375% 06/15/15 | | | 470,000 | | | | 436,513 | | |
| Chevron Corp. | |
| 4.950% 03/03/19 | | | 175,000 | | | | 186,793 | | |
| Nexen, Inc. | |
| 5.875% 03/10/35 | | | 260,000 | | | | 238,125 | | |
| PetroHawk Energy Corp. | |
| 7.875% 06/01/15 | | | 280,000 | | | | 275,800 | | |
| Talisman Energy, Inc. | |
| 6.250% 02/01/38 | | | 255,000 | | | | 260,134 | | |
| Oil & Gas Total | | | 1,663,045 | | |
| Oil & Gas Services – 0.2% | |
| Halliburton Co. | |
| 5.900% 09/15/18 | | | 200,000 | | | | 219,499 | | |
| Weatherford International Ltd. | |
| 5.150% 03/15/13 | | | 190,000 | | | | 199,574 | | |
| Oil & Gas Services Total | | | 419,073 | | |
| Pipelines – 0.6% | |
| El Paso Corp. | |
| 6.875% 06/15/14 | | | 245,000 | | | | 240,100 | | |
| Enterprise Products Operating LLC | |
| 4.600% 08/01/12 | | | 190,000 | | | | 196,870 | | |
| MarkWest Energy Partners LP | |
| 8.500% 07/15/16 | | | 450,000 | | | | 445,500 | | |
| Plains All American Pipeline LP/PAA Finance Corp. | |
| 6.650% 01/15/37 | | | 200,000 | | | | 210,657 | | |
| TransCanada Pipelines Ltd. | |
| 6.350% 05/15/67 (c) | | | 320,000 | | | | 280,365 | | |
| Pipelines Total | | | 1,373,492 | | |
| Energy Total | | | 3,455,610 | | |
| | | Par ($) | | Value ($) | |
| Financials – 4.9% | |
| Banks – 3.1% | |
| ANZ National International Ltd. | |
| 6.200% 07/19/13 (b) | | | 350,000 | | | | 382,978 | | |
| Bank of New York Mellon Corp. | |
| 5.125% 08/27/13 | | | 350,000 | | | | 378,334 | | |
| Barclays Bank PLC | |
| 6.750% 05/22/19 | | | 375,000 | | | | 419,413 | | |
| Capital One Financial Corp. | |
| 5.500% 06/01/15 | | | 300,000 | | | | 310,671 | | |
| Citicorp Lease Pass-Through Trust | |
| 8.040% 12/15/19 (b) | | | 750,000 | | | | 742,231 | | |
| Citigroup Funding, Inc. | |
| 2.000% 03/30/12 (d) | | | 800,000 | | | | 808,766 | | |
| Credit Suisse/New York NY | |
| 6.000% 02/15/18 | | | 375,000 | | | | 392,609 | | |
| Deutsche Bank AG | |
| 4.875% 05/20/13 | | | 300,000 | | | | 319,550 | | |
| Goldman Sachs Group, Inc. | |
| 6.345% 02/15/34 | | | 290,000 | | | | 266,330 | | |
| HSBC Capital Funding LP | |
| 9.547% 12/31/49 (b)(c) | | | 450,000 | | | | 454,500 | | |
| JPMorgan Chase & Co. | |
| 6.000% 01/15/18 | | | 450,000 | | | | 482,996 | | |
| Keycorp | |
| 6.500% 05/14/13 | | | 255,000 | | | | 261,037 | | |
| Merrill Lynch & Co., Inc. | |
| 6.050% 08/15/12 (e) | | | 350,000 | | | | 373,270 | | |
| Morgan Stanley | |
| 6.750% 04/15/11 | | | 150,000 | | | | 159,941 | | |
| Northern Trust Corp. | |
| 4.625% 05/01/14 | | | 285,000 | | | | 303,254 | | |
| U.S. Bank N.A. | |
| 6.300% 02/04/14 | | | 350,000 | | | | 391,814 | | |
| Wachovia Corp. | |
| 4.875% 02/15/14 | | | 375,000 | | | | 381,985 | | |
| Banks Total | | | 6,829,679 | | |
| Diversified Financial Services – 0.9% | |
| AGFC Capital Trust I | |
| 6.000% 01/15/67 (b)(c) | | | 350,000 | | | | 140,000 | | |
| Ameriprise Financial, Inc. | |
| 7.300% 06/28/19 | | | 230,000 | | | | 253,546 | | |
| CDX North America High Yield | |
| 8.875% 06/29/13 (b) | | | 348,000 | | | | 327,120 | | |
| General Electric Capital Corp. | |
| 2.250% 03/12/12 (d) | | | 800,000 | | | | 814,447 | | |
| 5.000% 01/08/16 | | | 430,000 | | | | 431,553 | | |
| Lehman Brothers Holdings, Inc. | |
| 5.750% 07/18/11 (f)(g) | | | 350,000 | | | | 62,125 | | |
| Diversified Financial Services Total | | | 2,028,791 | | |
See Accompanying Notes to Financial Statements.
40
Columbia Asset Allocation Fund
September 30, 2009
| Corporate Fixed-Income Bonds & Notes (continued) | |
| | | Par ($) | | Value ($) | |
| Insurance – 0.6% | |
| Chubb Corp. | |
| 5.750% 05/15/18 | | | 150,000 | | | | 164,535 | | |
| Lincoln National Corp. | |
| 8.750% 07/01/19 | | | 225,000 | | | | 260,228 | | |
| MetLife, Inc. | |
| 6.817% 08/15/18 | | | 285,000 | | | | 317,206 | | |
| Principal Life Income Funding Trusts | |
| 5.300% 04/24/13 | | | 225,000 | | | | 230,824 | | |
| Prudential Financial, Inc. | |
| 6.100% 06/15/17 | | | 275,000 | | | | 276,213 | | |
| UnitedHealth Group, Inc. | |
| 5.250% 03/15/11 | | | 200,000 | | | | 207,865 | | |
| Insurance Total | | | 1,456,871 | | |
| Real Estate Investment Trusts (REITs) – 0.3% | |
| Duke Realty LP | |
| 7.375% 02/15/15 | | | 250,000 | | | | 257,836 | | |
| Health Care Property Investors, Inc. | |
| 6.450% 06/25/12 | | | 250,000 | | | | 257,741 | | |
| Simon Property Group LP | |
| 5.750% 12/01/15 | | | 185,000 | | | | 189,239 | | |
| Real Estate Investment Trusts (REITs) Total | | | 704,816 | | |
| Financials Total | | | 11,020,157 | | |
| Industrials – 0.8% | |
| Aerospace & Defense – 0.3% | |
| BE Aerospace, Inc. | |
| 8.500% 07/01/18 | | | 410,000 | | | | 420,250 | | |
| United Technologies Corp. | |
| 5.375% 12/15/17 | | | 250,000 | | | | 272,745 | | |
| Aerospace & Defense Total | | | 692,995 | | |
| Miscellaneous Manufacturing – 0.3% | |
| Bombardier, Inc. | |
| 6.300% 05/01/14 (b) | | | 445,000 | | | | 429,425 | | |
Tyco International Ltd./
Tyco International Finance SA | |
| 7.000% 12/15/19 | | | 95,000 | | | | 102,841 | | |
| Miscellaneous Manufacturing Total | | | 532,266 | | |
| Transportation – 0.2% | |
| Burlington Northern Santa Fe Corp. | |
| 6.200% 08/15/36 | | | 225,000 | | | | 252,073 | | |
| Norfolk Southern Corp. | |
| 5.750% 04/01/18 | | | 250,000 | | | | 271,938 | | |
| Transportation Total | | | 524,011 | | |
| Industrials Total | | | 1,749,272 | | |
| | | Par ($) | | Value ($) | |
| Technology – 0.3% | |
| Computers – 0.1% | |
| Hewlett-Packard Co. | |
| 5.500% 03/01/18 | | | 250,000 | | | | 273,177 | | |
| Computers Total | | | 273,177 | | |
| Networking Products – 0.1% | |
| Cisco Systems, Inc. | |
| 4.950% 02/15/19 | | | 245,000 | | | | 257,539 | | |
| Networking Products Total | | | 257,539 | | |
| Software – 0.1% | |
| Oracle Corp. | |
| 6.500% 04/15/38 | | | 190,000 | | | | 220,235 | | |
| Software Total | | | 220,235 | | |
| Technology Total | | | 750,951 | | |
| Utilities – 1.2% | |
| Electric – 1.0% | |
| Commonwealth Edison Co. | |
| 5.950% 08/15/16 | | | 200,000 | | | | 218,064 | | |
| Consolidated Edison Co. of New York | |
| 5.850% 04/01/18 | | | 230,000 | | | | 250,707 | | |
| Dominion Resources, Inc. | |
| 5.200% 08/15/19 | | | 240,000 | | | | 249,196 | | |
| Indiana Michigan Power Co. | |
| 5.650% 12/01/15 | | | 225,000 | | | | 237,896 | | |
| Pacific Gas & Electric Co. | |
| 5.800% 03/01/37 | | | 225,000 | | | | 243,586 | | |
| Progress Energy, Inc. | |
| 7.750% 03/01/31 | | | 200,000 | | | | 250,343 | | |
| Southern California Edison Co. | |
| 5.000% 01/15/14 | | | 300,000 | | | | 322,408 | | |
| Texas Competitive Electric Holdings Co., LLC | |
PIK,
10.500% 11/01/16 | | | 667,937 | | | | 418,296 | | |
| Electric Total | | | 2,190,496 | | |
| Gas – 0.2% | |
| Atmos Energy Corp. | |
| 6.350% 06/15/17 | | | 225,000 | | | | 244,050 | | |
| Sempra Energy | |
| 6.500% 06/01/16 | | | 230,000 | | | | 254,252 | | |
| Gas Total | | | 498,302 | | |
| Utilities Total | | | 2,688,798 | | |
Total Corporate Fixed-Income Bonds & Notes
(cost of $28,609,702) | | | 30,272,778 | | |
See Accompanying Notes to Financial Statements.
41
Columbia Asset Allocation Fund
September 30, 2009
| Mortgage-Backed Securities – 11.9% | |
| | | Par ($) | | Value ($) | |
| Federal Home Loan Mortgage Corp. | |
| 5.000% 06/01/36 | | | 587,761 | | | | 608,632 | | |
| 5.000% 02/01/38 | | | 811,058 | | | | 839,306 | | |
| 5.000% 05/01/39 | | | 715,504 | | | | 740,353 | | |
| 5.500% 04/01/21 | | | 1,515,191 | | | | 1,606,931 | | |
| 5.500% 12/01/37 | | | 863,449 | | | | 905,047 | | |
| 5.500% 07/01/38 | | | 773,546 | | | | 810,770 | | |
| 5.500% 01/01/39 | | | 509,568 | | | | 534,088 | | |
| 6.000% 12/01/37 | | | 1,555,052 | | | | 1,645,051 | | |
| 6.500% 02/01/11 | | | 7,901 | | | | 8,112 | | |
| 6.500% 04/01/11 | | | 16,805 | | | | 17,502 | | |
| 6.500% 05/01/11 | | | 15,982 | | | | 16,728 | | |
| 6.500% 10/01/11 | | | 9,338 | | | | 9,731 | | |
| 6.500% 07/01/16 | | | 9,838 | | | | 10,535 | | |
| 6.500% 04/01/26 | | | 24,449 | | | | 26,361 | | |
| 6.500% 06/01/26 | | | 29,552 | | | | 31,862 | | |
| 6.500% 02/01/27 | | | 23,848 | | | | 25,716 | | |
| 6.500% 06/01/31 | | | 34,158 | | | | 36,774 | | |
| 6.500% 07/01/31 | | | 13,108 | | | | 14,120 | | |
| 6.500% 01/01/38 | | | 678,632 | | | | 724,323 | | |
| 7.000% 07/01/28 | | | 38,544 | | | | 42,417 | | |
| 7.000% 04/01/29 | | | 23,559 | | | | 25,925 | | |
| 7.000% 01/01/30 | | | 6,686 | | | | 7,353 | | |
| 7.000% 06/01/31 | | | 7,010 | | | | 7,709 | | |
| 7.000% 08/01/31 | | | 82,555 | | | | 90,784 | | |
| 7.500% 08/01/15 | | | 371 | | | | 401 | | |
| 7.500% 01/01/30 | | | 44,055 | | | | 49,478 | | |
| 8.000% 09/01/15 | | | 20,702 | | | | 22,445 | | |
| Federal National Mortgage Association | |
| 5.000% 05/01/37 | | | 712,129 | | | | 736,750 | | |
| 5.000% 01/01/38 | | | 961,382 | | | | 994,620 | | |
| 5.500% 11/01/21 | | | 265,267 | | | | 281,411 | | |
| 5.500% 11/01/36 | | | 1,505,512 | | | | 1,578,984 | | |
| 5.500% 02/01/37 | | | 709,827 | | | | 743,913 | | |
| 5.500% 06/01/38 | | | 1,530,612 | | | | 1,603,396 | | |
| 5.500% 10/01/38 | | | 350,000 | | | | 366,643 | | |
| 6.000% 09/01/36 | | | 611,225 | | | | 646,791 | | |
| 6.000% 06/01/38 | | | 1,514,893 | | | | 1,600,352 | | |
| 6.000% 03/01/39 | | | 543,345 | | | | 574,452 | | |
| 6.500% 03/01/11 | | | 2,621 | | | | 2,743 | | |
| 6.500% 03/01/38 | | | 906,070 | | | | 969,957 | | |
| 7.000% 03/01/15 | | | 38,553 | | | | 41,243 | | |
| 7.000% 07/01/16 | | | 8,148 | | | | 8,823 | | |
| 7.000% 02/01/31 | | | 18,077 | | | | 19,955 | | |
| 7.000% 07/01/31 | | | 72,314 | | | | 79,850 | | |
| 7.000% 07/01/32 | | | 5,305 | | | | 5,846 | | |
| 7.500% 06/01/15 | | | 11,229 | | | | 12,224 | | |
| 7.500% 08/01/15 | | | 31,822 | | | | 34,639 | | |
| | | Par ($) | | Value ($) | |
| 7.500% 09/01/15 | | | 11,923 | | | | 12,979 | | |
| 7.500% 02/01/31 | | | 20,052 | | | | 22,467 | | |
| 7.500% 08/01/31 | | | 19,753 | | | | 22,136 | | |
| 8.000% 12/01/29 | | | 21,770 | | | | 24,669 | | |
| 8.000% 04/01/30 | | | 28,652 | | | | 32,483 | | |
| 8.000% 05/01/30 | | | 2,720 | | | | 3,084 | | |
| 8.000% 07/01/31 | | | 28,821 | | | | 32,679 | | |
TBA:
5.000% 10/01/39 (h) | | | 1,550,000 | | | | 1,600,859 | | |
| 5.500% 10/01/39 (h) | | | 1,530,000 | | | | 1,600,285 | | |
| Government National Mortgage Association | |
| 5.000% 04/15/39 | | | 1,952,316 | | | | 2,024,735 | | |
| 5.500% 02/15/37 | | | 1,348,192 | | | | 1,417,919 | | |
| 6.000% 04/15/13 | | | 2,787 | | | | 2,991 | | |
| 6.500% 05/15/13 | | | 7,969 | | | | 8,543 | | |
| 6.500% 06/15/13 | | | 3,050 | | | | 3,270 | | |
| 6.500% 08/15/13 | | | 6,099 | | | | 6,538 | | |
| 6.500% 11/15/13 | | | 16,997 | | | | 18,220 | | |
| 6.500% 07/15/14 | | | 16,951 | | | | 18,171 | | |
| 6.500% 01/15/29 | | | 6,291 | | | | 6,800 | | |
| 6.500% 03/15/29 | | | 61,628 | | | | 66,609 | | |
| 6.500% 04/15/29 | | | 108,373 | | | | 117,131 | | |
| 6.500% 05/15/29 | | | 94,619 | | | | 102,265 | | |
| 6.500% 07/15/31 | | | 42,908 | | | | 46,308 | | |
| 7.000% 11/15/13 | | | 111,329 | | | | 118,557 | | |
| 7.000% 05/15/29 | | | 19,111 | | | | 21,106 | | |
| 7.000% 09/15/29 | | | 26,242 | | | | 28,981 | | |
| 7.000% 06/15/31 | | | 22,262 | | | | 24,600 | | |
| 7.500% 06/15/23 | | | 782 | | | | 872 | | |
| 7.500% 01/15/26 | | | 18,555 | | | | 20,765 | | |
| 7.500% 09/15/29 | | | 28,727 | | | | 32,197 | | |
| 8.000% 07/15/25 | | | 9,135 | | | | 10,356 | | |
| 8.500% 12/15/30 | | | 3,026 | | | | 3,480 | | |
| 9.000% 12/15/17 | | | 19,189 | | | | 20,925 | | |
Total Mortgage-Backed Securities
(cost of $25,721,400) | | | 26,634,026 | | |
| Government & Agency Obligations – 7.7% | |
| Foreign Government Obligations – 0.6% | |
| Province of Ontario | |
| 5.450% 04/27/16 | | | 500,000 | | | | 558,661 | | |
| Province of Quebec | |
| 4.625% 05/14/18 | | | 435,000 | | | | 453,363 | | |
| United Mexican States | |
| 7.500% 04/08/33 | | | 250,000 | | | | 296,875 | | |
| Foreign Government Obligations Total | | | 1,308,899 | | |
See Accompanying Notes to Financial Statements.
42
Columbia Asset Allocation Fund
September 30, 2009
| Government & Agency Obligations (continued) | |
| | | Par ($) | | Value ($) | |
| U.S. Government Agencies – 0.7% | |
| Federal Home Loan Bank | |
| 5.500% 08/13/14 | | | 165,000 | | | | 187,001 | | |
| Federal Home Loan Mortgage Corp. | |
| 3.125% 10/25/10 (i) | | | 85,000 | | | | 87,302 | | |
| 5.500% 08/23/17 | | | 1,125,000 | | | | 1,280,630 | | |
| U.S. Government Agencies Total | | | 1,554,933 | | |
| U.S. Government Obligations – 6.4% | |
| U.S. Treasury Bonds | |
| 5.375% 02/15/31 | | | 4,070,000 | | | | 4,835,669 | | |
| U.S. Treasury Inflation Indexed Bonds | |
| 1.625% 01/15/15 | | | 609,055 | | | | 620,475 | | |
| 2.000% 01/15/14 | | | 571,115 | | | | 591,461 | | |
| 2.375% 01/15/25 | | | 731,219 | | | | 766,638 | | |
| 3.500% 01/15/11 | | | 1,361,129 | | | | 1,416,851 | | |
| 3.875% 04/15/29 | | | 759,823 | | | | 978,272 | | |
| U.S. Treasury Inflation Indexed Notes | |
| 1.875% 07/15/13 | | | 404,544 | | | | 417,944 | | |
| 2.000% 01/15/16 | | | 423,177 | | | | 439,046 | | |
| 2.125% 01/15/19 | | | 476,468 | | | | 500,291 | | |
| 2.375% 04/15/11 | | | 206,154 | | | | 212,274 | | |
| 2.625% 07/15/17 | | | 342,906 | | | | 372,268 | | |
| 3.000% 07/15/12 | | | 299,448 | | | | 318,350 | | |
| U.S. Treasury Notes | |
| 0.875% 04/30/11 | | | 2,835,000 | | | | 2,842,751 | | |
| U.S. Government Obligations Total | | | 14,312,290 | | |
Total Government & Agency Obligations
(cost of $16,566,887) | | | 17,176,122 | | |
| Commercial Mortgage-Backed Securities – 4.1% | |
| Bear Stearns Commercial Mortgage Securities | |
| 5.742% 09/11/42 | | | 1,000,000 | | | | 935,790 | | |
| Citigroup/Deutsche Bank Commercial Mortgage Trust | |
| 5.366% 12/11/49 | | | 420,000 | | | | 285,354 | | |
| Commercial Mortgage Pass Through Certificates | |
| 5.234% 07/10/37 (c) | | | 980,000 | | | | 977,786 | | |
| CS First Boston Mortgage Securities Corp. | |
| 4.577% 04/15/37 | | | 1,586,000 | | | | 1,598,206 | | |
| GE Capital Commercial Mortgage Corp. | |
| 4.819% 01/10/38 | | | 725,000 | | | | 742,805 | | |
| JPMorgan Chase Commercial Mortgage Securities Corp. | |
| 4.780% 07/15/42 | | | 310,000 | | | | 261,548 | | |
| 5.201% 08/12/37 | | | 575,000 | | | | 598,601 | | |
| 5.440% 06/12/47 | | | 1,020,000 | | | | 876,380 | | |
| 5.447% 06/12/47 | | | 509,000 | | | | 456,605 | | |
| 5.525% 04/15/43 | | | 1,457,000 | | | | 1,111,414 | | |
| | | Par ($) | | Value ($) | |
| Morgan Stanley Capital I | |
| 5.809% 12/12/49 | | | 1,500,000 | | | | 1,283,802 | | |
Total Commercial Mortgage-Backed Securities
(cost of $9,764,355) | | | 9,128,291 | | |
| Collateralized Mortgage Obligations – 2.8% | |
| Agency – 1.8% | |
| Federal Home Loan Mortgage Corp. | |
| 4.500% 02/15/18 | | | 392,086 | | | | 409,285 | | |
| 5.000% 08/15/32 | | | 670,000 | | | | 704,803 | | |
| 5.000% 05/15/33 | | | 720,000 | | | | 758,581 | | |
| 6.000% 02/15/28 | | | 580,675 | | | | 603,396 | | |
| Federal National Mortgage Association | |
| 4.000% 12/25/20 | | | 1,097,781 | | | | 1,136,298 | | |
| 5.000% 12/25/15 | | | 423,366 | | | | 430,286 | | |
| Agency Total | | | 4,042,649 | | |
| Non-Agency – 1.0% | |
| American Mortgage Trust | |
| 8.445% 09/27/22 (c) | | | 6,738 | | | | 4,086 | | |
| Bear Stearns Adjustable Rate Mortgage Trust | |
| 5.449% 02/25/47 (c) | | | 862,727 | | | | 521,118 | | |
| Countrywide Alternative Loan Trust | |
| 5.250% 08/25/35 | | | 284,340 | | | | 236,573 | | |
| 5.500% 10/25/35 | | | 590,365 | | | | 445,666 | | |
| JPMorgan Mortgage Trust | |
| 6.007% 10/25/36 (c) | | | 570,606 | | | | 467,478 | | |
| Lehman Mortgage Trust | |
| 6.500% 01/25/38 | | | 709,239 | | | | 509,765 | | |
| Non-Agency Total | | | 2,184,686 | | |
Total Collateralized Mortgage Obligations
(cost of $7,051,423) | | | 6,227,335 | | |
| Commodities – 2.5% | |
| | | Shares | | | |
iShares GSCI Commodity
Indexed Trust | | | 23,230 | | | | 689,466 | | |
| PowerShares DB Agriculture Fund | | | 33,190 | | | | 845,017 | | |
PowerShares DB Commodity Index
Tracking Fund | | | 72,310 | | | | 1,595,159 | | |
| SPDR Gold Trust | | | 8,600 | | | | 850,110 | | |
| United States Oil Fund LP | | | 48,360 | | | | 1,750,149 | | |
Total Commodities
(cost of $5,554,539) | | | 5,729,901 | | |
See Accompanying Notes to Financial Statements.
43
Columbia Asset Allocation Fund
September 30, 2009
| Asset-Backed Securities – 1.4% | |
| | | Par ($) | | Value ($) | |
| Citicorp Residential Mortgage Securities, Inc. | |
| 6.080% 06/25/37 | | | 490,000 | | | | 448,898 | | |
| Ford Credit Auto Owner Trust | |
| 5.470% 06/15/12 | | | 761,000 | | | | 801,969 | | |
| Franklin Auto Trust | |
| 5.360% 05/20/16 | | | 989,000 | | | | 993,666 | | |
| Green Tree Financial Corp. | |
| 6.870% 01/15/29 | | | 116,490 | | | | 110,118 | | |
| Harley-Davidson Motorcycle Trust | |
| 5.350% 03/15/13 | | | 690,625 | | | | 713,058 | | |
Total Asset-Backed Securities
(cost of $3,048,964) | | | 3,067,709 | | |
| Convertible Preferred Stock – 0.2% | |
| | | Shares | | | |
| Health Care – 0.1% | |
| Pharmaceuticals – 0.1% | |
| Schering-Plough Corp., 6.000% | | | 600 | | | | 145,620 | | |
| Pharmaceuticals Total | | | 145,620 | | |
| Health Care Total | | | 145,620 | | |
| Materials – 0.1% | |
| Metals & Mining – 0.1% | |
Freeport-McMoRan Copper &
Gold, Inc., 6.750% | | | 3,850 | | | | 396,550 | | |
| Metals & Mining Total | | | 396,550 | | |
| Materials Total | | | 396,550 | | |
Total Convertible Preferred Stock
(cost of $316,920) | | | 542,170 | | |
| Investment Company – 0.1% | |
| iShares MSCI EAFE Index Fund | | | 2,323 | | | | 127,068 | | |
Total Investment Company
(cost of $127,319) | | | 127,068 | | |
| Preferred Stock – 0.1% | |
| | | Shares | | Value ($) | |
| Utilities – 0.1% | |
| Electric Utilities – 0.1% | |
Cia Energetica de Minas
Gerais 5.000% | | | 6,525 | | | | 99,444 | | |
| Electric Utilities Total | | | 99,444 | | |
| Utilities Total | | | 99,444 | | |
Total Preferred Stock
(cost of $117,589) | | | 99,444 | | |
| Convertible Bond – 0.0% | |
| | | Par ($) | | | |
| Financials – 0.0% | |
| Real Estate Investment Trusts (REITs) – 0.0% | |
| Vornado Realty Trust | |
| 3.625% 11/15/26 | | | 18,000 | | | | 17,482 | | |
| Real Estate Investment Trusts (REITs) Total | | | 17,482 | | |
| Financials Total | | | 17,482 | | |
Total Convertible Bond
(cost of $14,260) | | | 17,482 | | |
| Rights – 0.0% | |
| | | Shares | | | |
| Financials – 0.0% | |
| BNP Paribas Ltd. | |
| Expires 10/13/09 (a) | | | 2,324 | | | | 5,033 | | |
| Fortis | |
| Expires 07/04/14 (a)(f) | | | 8,439 | | | | — | | |
| Financials Total | | | 5,033 | | |
Total Rights
(cost of $—) | | | 5,033 | | |
| Purchased Put Options – 0.0% | |
| | | Units | | | |
CBOE SPX Volatility Index
November Put Strike price $23
Expires: 11/21/09 | | | 14 | | | | 7,980 | | |
| Purchased Options Total | | | 7,980 | | |
Total Purchased Put Options
(cost of $8,709) | | | 7,980 | | |
See Accompanying Notes to Financial Statements.
44
Columbia Asset Allocation Fund
September 30, 2009
| Short-Term Obligation – 3.3% | |
| | | Par ($) | | Value ($) | |
Repurchase agreement with
Fixed Income Clearing Corp.,
dated 09/30/09, due on 10/01/09,
at 0.010%, collateralized by
U.S. Government Agency
obligations with various
maturities to 01/13/14, market
value $7,585,700 (repurchase
proceeds $7,429,002) | | | 7,429,000 | | | | 7,429,000 | | |
Total Short-Term Obligation
(cost of $7,429,000) | | | 7,429,000 | | |
Total Investments – 99.0%
(cost of $200,692,001) (j) | | | 221,554,782 | | |
| Other Assets & Liabilities, Net – 1.0% | | | 2,284,014 | | |
| Net Assets – 100.0% | | | 223,838,796 | | |
Notes to Investment Portfolio:
(a) Non-income producing security.
(b) Security exempt from registration pursuant to Rule 144A under the Securities Act of 1933. These securities may be resold in transactions exempt from registration, normally to qualified institutional buyers. At September 30, 2009, these securities, which are not illiquid, amounted to $3,915,360, which represents 1.7% of net assets.
(c) The interest rate shown on floating rate or variable rate securities reflects the rate at September 30, 2009.
(d) Security is guaranteed by the Federal Deposit Insurance Corporation.
(e) Investments in affiliates during the twelve months ended September 30, 2009:
Security name: Merrill Lynch & Co., Inc., 6.050% 08/15/12
| Par as of 09/30/08: | | $ | 350,000 | | |
| Par purchased: | | $ | – | | |
| Par sold: | | $ | – | | |
| Par as of 09/30/09: | | $ | 350,000 | | |
| Net realized gain (loss): | | $ | – | | |
| Interest income earned: | | $ | 21,175 | | |
| Value at end of period: | | $ | 373,270 | | |
As of January 1, 2009, Merrill Lynch & Co., Inc. is a wholly owned subsidiary of Bank of America Corporation and an affiliate of Columbia Management.
(f) Represents fair value as determined in good faith under procedures approved by the Board of Trustees. The value of these securities amounted to $62,125, which represents less than 0.1% of net assets.
(g) The issuer has filed for bankruptcy protection under Chapter 11, and is in default of certain debt covenants. Income is not being accrued. At September 30, 2009, the value of this security amounted to $62,125, which represents less than 0.1% of net assets.
(h) Security purchased on a delayed delivery basis.
(i) All or a portion of this security is held as collateral for open futures contracts. At September 30, 2009, market value of the security pledged amounted to $71,896.
(j) Cost for federal income tax purposes is $202,595,625.
The following table summarizes the inputs used, as of September 30, 2009 in valuing the Fund's assets:
| Description | | Quoted Prices
(Level 1) | | Other
Significant
Observable
Inputs
(Level 2) | | Significant
Unobservable
Inputs
(Level 3) | | Total | |
| Common Stocks | |
Consumer
Discretionary | | $ | 10,673,389 | | | $ | 2,012,170 | | | $ | — | | | $ | 12,685,559 | | |
| Consumer Staples | | | 8,435,028 | | | | 1,835,834 | | | | — | | | | 10,270,862 | | |
| Energy | | | 10,654,396 | | | | 1,313,468 | | | | — | | | | 11,967,864 | | |
| Financials | | | 15,580,120 | | | | 5,524,204 | | | | — | | | | 21,104,324 | | |
| Health Care | | | 11,447,405 | | | | 1,348,443 | | | | — | | | | 12,795,848 | | |
| Industrials | | | 10,526,040 | | | | 2,277,952 | | | | — | | | | 12,803,992 | | |
| Information Technology | | | 18,610,010 | | | | 915,465 | | | | — | | | | 19,525,475 | | |
| Materials | | | 4,354,832 | | | | 2,045,362 | | | | — | | | | 6,400,194 | | |
Telecommunication
Services | | | 1,919,935 | | | | 1,144,959 | | | | — | | | | 3,064,894 | | |
| Utilities | | | 3,254,108 | | | | 1,217,323 | | | | — | | | | 4,471,431 | | |
| Total Common Stocks | | | 95,455,263 | | | | 19,635,180 | | | | — | | | | 115,090,443 | | |
Corporate Fixed-Income
Bonds & Notes | |
| Basic Materials | | | — | | | | 1,967,205 | | | | — | | | | 1,967,205 | | |
| Communications | | | — | | | | 4,689,667 | | | | — | | | | 4,689,667 | | |
| Consumer Cyclical | | | — | | | | 1,379,414 | | | | — | | | | 1,379,414 | | |
| Consumer Non-Cyclical | | | — | | | | 2,571,704 | | | | — | | | | 2,571,704 | | |
| Energy | | | — | | | | 3,455,610 | | | | — | | | | 3,455,610 | | |
| Financials | | | — | | | | 11,020,157 | | | | — | | | | 11,020,157 | | |
| Industrials | | | — | | | | 1,749,272 | | | | — | | | | 1,749,272 | | |
| Technology | | | — | | | | 750,951 | | | | — | | | | 750,951 | | |
| Utilities | | | — | | | | 2,688,798 | | | | — | | | | 2,688,798 | | |
Total Corporate
Fixed-Income
Bonds & Notes | | | — | | | | 30,272,778 | | | | — | | | | 30,272,778 | | |
Total Mortgage-Backed
Securities | | | 3,201,144 | | | | 23,432,882 | | | | — | | | | 26,634,026 | | |
Total Government &
Agency Obligations | | | 14,312,290 | | | | 2,863,832 | | | | — | | | | 17,176,122 | | |
Total Commercial
Mortgage-Backed
Securities | | | — | | | | 9,128,291 | | | | — | | | | 9,128,291 | | |
Total Collateralized
Mortgage Obligations | | | — | | | | 6,227,335 | | | | — | | | | 6,227,335 | | |
| Total Commodities | | | 5,729,901 | | | | — | | | | — | | | | 5,729,901 | | |
Total Asset-Backed
Securities | | | — | | | | 3,067,709 | | | | — | | | | 3,067,709 | | |
Total Convertible
Preferred Stock | | | 542,170 | | | | — | | | | — | | | | 542,170 | | |
Total Investment
Company | | | 127,068 | | | | — | | | | — | | | | 127,068 | | |
| Total Preferred Stock | | | 99,444 | | | | — | | | | — | | | | 99,444 | | |
| Total Convertible Bond | | | — | | | | 17,482 | | | | — | | | | 17,482 | | |
| Total Rights | | | — | | | | 5,033 | | | | — | | | | 5,033 | | |
Total Purchased Put
Options | | | 7,980 | | | | — | | | | — | | | | 7,980 | | |
Total Short-Term
Obligation | | | — | | | | 7,429,000 | | | | — | | | | 7,429,000 | | |
| Total Investments | | | 119,475,260 | | | | 102,079,522 | | | | — | | | | 221,554,782 | | |
Unrealized Appreciation
on Futures Contracts | | | 52,875 | | | | — | | | | — | | | | 52,875 | | |
Unrealized Appreciation
(Depreciation) on
Forward Foreign
Currency Exchange
Contracts | | | — | | | | 82,585 | | | | — | | | | 82,585 | | |
| Total | | $ | 119,528,135 | | | $ | 102,162,107 | | | $ | — | | | $ | 221,690,242 | | |
The Fund's assets assigned to the Level 2 input category include certain foreign securities for which a third party statistical pricing service may be employed for purposes of fair market valuation.
For more information on valuation inputs, and their aggregation into the levels used in the table above, please refer to the Security Valuation section in the accompanying Notes to Financial Statements.
See Accompanying Notes to Financial Statements.
45
Columbia Asset Allocation Fund
September 30, 2009
At September 30, 2009, the Fund held the following open long futures contracts:
Risk
Exposure | | Number of
Contracts | | Value | | Aggregate
Face Value | | Expiration
Date | | Unrealized
Appreciation | |
| Interest Rate Risk | |
10-Year
U.S. Treasury
Notes | | | 7 | | | $ | 828,297 | | | $ | 815,468 | | | Dec-09 | | $ | 12,829 | | |
| Equity Risk | |
| S&P 500® Index | | | 22 | | | | 5,790,950 | | | | 5,750,904 | | | Dec-09 | | | 40,046 | | |
| | | $ | 52,875 | | |
At September 30, 2009, cash of $965,000 was pledged as collateral for open futures contracts.
For the year ended September 30, 2009, transactions in written option contracts were as follows:
| | | Number of
contracts | | Premium
received | |
| Options outstanding at September 30, 2008 | | | 106 | | | $ | 3,896 | | |
| Options written | | | 949 | | | | 37,598 | | |
Options terminated in closing
purchase transactions | | | (7 | ) | | | (1,974 | ) | |
| Options expired | | | (786 | ) | | | (27,823 | ) | |
| Options exercised | | | (262 | ) | | | (11,697 | ) | |
| Options outstanding at September 30, 2009 | | | – | | | $ | – | | |
Forward foreign currency exchange contracts outstanding on September 30, 2009 are:
Foreign Exchange Rate Risk
Forward
Foreign
Currency
Exchange
Contracts
to Buy | | Value | | Aggregate
Face Value | | Settlement
Date | | Unrealized
Appreciation
(Depreciation) | |
| AUD | | | | $ | 894,130 | | | $ | 793,252 | | | 10/08/09 | | $ | 100,878 | | |
| AUD | | | | | 119,922 | | | | 114,022 | | | 10/08/09 | | | 5,900 | | |
| CAD | | | | | 19,614 | | | | 19,706 | | | 10/08/09 | | | (92 | ) | |
| CHF | | | | | 87,817 | | | | 85,278 | | | 10/08/09 | | | 2,539 | | |
| CHF | | | | | 8,685 | | | | 8,735 | | | 10/08/09 | | | (50 | ) | |
| CZK | | | | | 18,838 | | | | 19,035 | | | 10/08/09 | | | (197 | ) | |
| DKK | | | | | 154,299 | | | | 147,230 | | | 10/08/09 | | | 7,069 | | |
| EUR | | | | | 554,608 | | | | 529,160 | | | 10/08/09 | | | 25,448 | | |
| EUR | | | | | 65,850 | | | | 64,063 | | | 10/08/09 | | | 1,787 | | |
| EUR | | | | | 48,290 | | | | 47,012 | | | 10/08/09 | | | 1,278 | | |
| EUR | | | | | 118,531 | | | | 115,704 | | | 10/08/09 | | | 2,827 | | |
| EUR | | | | | 89,264 | | | | 89,891 | | | 10/08/09 | | | (627 | ) | |
| EUR | | | | | 21,950 | | | | 22,218 | | | 10/08/09 | | | (268 | ) | |
| GBP | | | | | 775,083 | | | | 790,002 | | | 10/08/09 | | | (14,919 | ) | |
| GBP | | | | | 124,653 | | | | 128,708 | | | 10/08/09 | | | (4,055 | ) | |
| GBP | | | | | 63,924 | | | | 65,498 | | | 10/08/09 | | | (1,574 | ) | |
| ILS | | | | | 14,603 | | | | 14,694 | | | 10/08/09 | | | (91 | ) | |
| JPY | | | | | 68,983 | | | | 65,275 | | | 10/08/09 | | | 3,708 | | |
| JPY | | | | | 47,303 | | | | 46,071 | | | 10/08/09 | | | 1,232 | | |
| JPY | | | | | 9,313 | | | | 9,211 | | | 10/08/09 | | | 102 | | |
| NOK | | | | | 132,765 | | | | 118,364 | | | 10/08/09 | | | 14,401 | | |
| PLN | | | | | 9,055 | | | | 9,283 | | | 10/08/09 | | | (228 | ) | |
| SEK | | | | | 222,061 | | | | 196,992 | | | 10/08/09 | | | 25,069 | | |
| SGD | | | | | 68,857 | | | | 67,312 | | | 10/08/09 | | | 1,545 | | |
| SGD | | | | | 97,962 | | | | 96,862 | | | 10/08/09 | | | 1,100 | | |
| TWD | | | | | 20,683 | | | | 20,564 | | | 10/08/09 | | | 119 | | |
| | | $ | 172,901 | | |
Forward
Foreign
Currency
Exchange
Contracts
to Sell | | Value | | Aggregate
Face Value | | Settlement
Date | | Unrealized
Appreciation
(Depreciation) | |
| AUD | | | | $ | 123,450 | | | $ | 122,150 | | | 10/08/09 | | $ | (1,300 | ) | |
| CAD | | | | | 212,023 | | | | 198,426 | | | 10/08/09 | | | (13,597 | ) | |
| CAD | | | | | 66,315 | | | | 65,021 | | | 10/08/09 | | | (1,294 | ) | |
| CHF | | | | | 204,583 | | | | 195,734 | | | 10/08/09 | | | (8,849 | ) | |
| CZK | | | | | 233,530 | | | | 217,725 | | | 10/08/09 | | | (15,805 | ) | |
| CZK | | | | | 34,487 | | | | 32,478 | | | 10/08/09 | | | (2,009 | ) | |
| DKK | | | | | 47,174 | | | | 46,006 | | | 10/08/09 | | | (1,168 | ) | |
| DKK | | | | | 71,155 | | | | 70,662 | | | 10/08/09 | | | (493 | ) | |
| DKK | | | | | 2,555 | | | | 2,572 | | | 10/08/09 | | | 17 | | |
| GBP | | | | | 63,924 | | | | 67,948 | | | 10/08/09 | | | 4,024 | | |
| GBP | | | | | 63,924 | | | | 66,028 | | | 10/08/09 | | | 2,104 | | |
| ILS | | | | | 206,832 | | | | 197,190 | | | 10/08/09 | | | (9,642 | ) | |
| JPY | | | | | 181,759 | | | | 175,204 | | | 10/08/09 | | | (6,555 | ) | |
| JPY | | | | | 66,799 | | | | 63,476 | | | 10/08/09 | | | (3,323 | ) | |
| KRW | | | | | 121,491 | | | | 114,877 | | | 10/08/09 | | | (6,614 | ) | |
| KRW | | | | | 33,853 | | | | 33,042 | | | 10/08/09 | | | (811 | ) | |
| KRW | | | | | 69,162 | | | | 68,224 | | | 10/08/09 | | | (938 | ) | |
| NOK | | | | | 9,347 | | | | 9,225 | | | 10/08/09 | | | (122 | ) | |
| PLN | | | | | 129,552 | | | | 118,358 | | | 10/08/09 | | | (11,194 | ) | |
| SEK | | | | | 56,519 | | | | 57,363 | | | 10/08/09 | | | 844 | | |
| SGD | | | | | 122,097 | | | | 117,913 | | | 10/08/09 | | | (4,184 | ) | |
| SGD | | | | | 44,722 | | | | 43,486 | | | 10/08/09 | | | (1,236 | ) | |
| TWD | | | | | 201,878 | | | | 195,919 | | | 10/08/09 | | | (5,959 | ) | |
| TWD | | | | | 44,263 | | | | 43,284 | | | 10/08/09 | | | (979 | ) | |
| TWD | | | | | 47,721 | | | | 46,488 | | | 10/08/09 | | | (1,233 | ) | |
| | | $ | (90,316 | ) | |
At September 30, 2009, the asset allocation of the Fund is as follows:
| Asset Allocation (Unaudited) | | % of
Net Assets | |
| Common Stocks | | | 51.4 | | |
| Corporate Fixed-Income Bonds & Notes | | | 13.5 | | |
| Mortgage-Backed Securities | | | 11.9 | | |
| Government & Agency Obligations | | | 7.7 | | |
| Commercial Mortgage-Backed Securities | | | 4.1 | | |
| Collateralized Mortgage Obligations | | | 2.8 | | |
| Asset-Backed Securities | | | 1.4 | | |
| Convertible Preferred Stock | | | 0.2 | | |
| Preferred Stock | | | 0.1 | | |
| Convertible Bond | | | 0.0 | * | |
| Rights | | | 0.0 | * | |
| Purchased Put Options | | | 0.0 | * | |
| | | | 93.1 | | |
| Commodities | | | 2.5 | | |
| Investment Company | | | 0.1 | | |
| Short Term Obligation | | | 3.3 | | |
| Other Assets & Liabilities, Net | | | 1.0 | | |
| | | | 100.0 | | |
* Rounds to less than 0.1%.
See Accompanying Notes to Financial Statements.
46
Columbia Asset Allocation Fund
September 30, 2009
| Acronym | | Name | |
| ADR | | American Depositary Receipt | |
|
| AUD | | Australian Dollar | |
|
| CAD | | Canadian Dollar | |
|
| CHF | | Swiss Franc | |
|
| CZK | | Czech Koruna | |
|
| DKK | | Danish Krone | |
|
| EUR | | Euro | |
|
| GBP | | Pound Sterling | |
|
| ILS | | Israeli Shekel | |
|
| JPY | | Japanese Yen | |
|
| KRW | | South Korean Won | |
|
| NOK | | Norwegian Krone | |
|
| PIK | | Payment-in-Kind | |
|
| PLN | | Polish Zloty | |
|
| SEK | | Swedish Krona | |
|
| SGD | | Singapore Dollar | |
|
| TBA | | To Be Announced | |
|
| TWD | | Taiwan Dollar | |
|
See Accompanying Notes to Financial Statements.
47
Investment Portfolio – Columbia Large Cap Growth Fund
September 30, 2009
| Common Stocks – 99.9% | |
| | | Shares | | Value ($) | |
| Consumer Discretionary – 11.1% | |
| Hotels, Restaurants & Leisure – 2.9% | |
| International Game Technology | | | 508,714 | | | | 10,927,177 | | |
| Las Vegas Sands Corp. (a) | | | 216,400 | | | | 3,644,176 | | |
| Starbucks Corp. (a) | | | 393,800 | | | | 8,131,970 | | |
Starwood Hotels & Resorts
Worldwide, Inc. | | | 251,200 | | | | 8,297,136 | | |
| Yum! Brands, Inc. | | | 205,600 | | | | 6,941,056 | | |
| Hotels, Restaurants & Leisure Total | | | 37,941,515 | | |
| Internet & Catalog Retail – 0.9% | |
| Amazon.com, Inc. (a) | | | 121,300 | | | | 11,324,568 | | |
| Internet & Catalog Retail Total | | | 11,324,568 | | |
| Media – 0.7% | |
| Viacom, Inc., Class B (a) | | | 307,100 | | | | 8,611,084 | | |
| Media Total | | | 8,611,084 | | |
| Multiline Retail – 3.1% | |
| J.C. Penney Co., Inc. | | | 284,200 | | | | 9,591,750 | | |
| Nordstrom, Inc. | | | 333,200 | | | | 10,175,928 | | |
| Target Corp. | | | 453,000 | | | | 21,146,040 | | |
| Multiline Retail Total | | | 40,913,718 | | |
| Specialty Retail – 2.8% | |
| Best Buy Co., Inc. | | | 190,900 | | | | 7,162,568 | | |
| GameStop Corp., Class A (a) | | | 260,200 | | | | 6,887,494 | | |
| Lowe's Companies, Inc. | | | 664,900 | | | | 13,923,006 | | |
| Staples, Inc. | | | 383,800 | | | | 8,911,836 | | |
| Specialty Retail Total | | | 36,884,904 | | |
| Textiles, Apparel & Luxury Goods – 0.7% | |
| Polo Ralph Lauren Corp. | | | 114,400 | | | | 8,765,328 | | |
| Textiles, Apparel & Luxury Goods Total | | | 8,765,328 | | |
| Consumer Discretionary Total | | | 144,441,117 | | |
| Consumer Staples – 12.9% | |
| Beverages – 3.2% | |
| Coca-Cola Co. | | | 181,800 | | | | 9,762,660 | | |
Molson Coors Brewing Co.,
Class B | | | 206,600 | | | | 10,057,288 | | |
| PepsiCo, Inc. | | | 365,600 | | | | 21,446,096 | | |
| Beverages Total | | | 41,266,044 | | |
| Food & Staples Retailing – 2.0% | |
| Costco Wholesale Corp. | | | 145,900 | | | | 8,237,514 | | |
| CVS Caremark Corp. | | | 241,300 | | | | 8,624,062 | | |
| Wal-Mart Stores, Inc. | | | 194,500 | | | | 9,548,005 | | |
| Food & Staples Retailing Total | | | 26,409,581 | | |
| | | Shares | | Value ($) | |
| Food Products – 0.5% | |
| Hershey Co. | | | 162,400 | | | | 6,310,864 | | |
| Food Products Total | | | 6,310,864 | | |
| Household Products – 2.7% | |
| Colgate-Palmolive Co. | | | 157,900 | | | | 12,044,612 | | |
| Procter & Gamble Co. | | | 404,800 | | | | 23,446,016 | | |
| Household Products Total | | | 35,490,628 | | |
| Personal Products – 1.9% | |
| Avon Products, Inc. | | | 286,300 | | | | 9,722,748 | | |
Estee Lauder Companies, Inc.,
Class A | | | 168,000 | | | | 6,229,440 | | |
Mead Johnson Nutrition Co.,
Class A | | | 193,400 | | | | 8,724,274 | | |
| Personal Products Total | | | 24,676,462 | | |
| Tobacco – 2.6% | |
| Philip Morris International, Inc. | | | 697,400 | | | | 33,991,276 | | |
| Tobacco Total | | | 33,991,276 | | |
| Consumer Staples Total | | | 168,144,855 | | |
| Energy – 4.8% | |
| Energy Equipment & Services – 1.4% | |
| Nabors Industries Ltd. (a) | | | 451,600 | | | | 9,438,440 | | |
| Transocean Ltd. (a) | | | 112,762 | | | | 9,644,534 | | |
| Energy Equipment & Services Total | | | 19,082,974 | | |
| Oil, Gas & Consumable Fuels – 3.4% | |
| Alpha Natural Resources, Inc. (a) | | | 252,400 | | | | 8,859,240 | | |
| Apache Corp. | | | 155,200 | | | | 14,252,016 | | |
| Devon Energy Corp. | | | 176,175 | | | | 11,861,863 | | |
| Hess Corp. | | | 167,400 | | | | 8,949,204 | | |
| Oil, Gas & Consumable Fuels Total | | | 43,922,323 | | |
| Energy Total | | | 63,005,297 | | |
| Financials – 6.3% | |
| Capital Markets – 2.3% | |
| Goldman Sachs Group, Inc. | | | 56,600 | | | | 10,434,210 | | |
| Morgan Stanley | | | 632,300 | | | | 19,525,424 | | |
| Capital Markets Total | | | 29,959,634 | | |
| Commercial Banks – 0.9% | |
| SunTrust Banks, Inc. | | | 510,000 | | | | 11,500,500 | | |
| Commercial Banks Total | | | 11,500,500 | | |
| Diversified Financial Services – 0.7% | |
| JPMorgan Chase & Co. | | | 220,100 | | | | 9,644,782 | | |
| Diversified Financial Services Total | | | 9,644,782 | | |
See Accompanying Notes to Financial Statements.
48
Columbia Large Cap Growth Fund
September 30, 2009
| Common Stocks (continued) | |
| | | Shares | | Value ($) | |
| Insurance – 2.4% | |
| Principal Financial Group, Inc. | | | 203,500 | | | | 5,573,865 | | |
| Prudential Financial, Inc. | | | 291,000 | | | | 14,523,810 | | |
| XL Capital Ltd., Class A | | | 612,700 | | | | 10,697,742 | | |
| Insurance Total | | | 30,795,417 | | |
| Financials Total | | | 81,900,333 | | |
| Health Care – 15.1% | |
| Biotechnology – 3.3% | |
| Amgen, Inc. (a) | | | 192,000 | | | | 11,564,160 | | |
| Celgene Corp. (a) | | | 182,600 | | | | 10,207,340 | | |
| Gilead Sciences, Inc. (a) | | | 284,300 | | | | 13,242,694 | | |
| Vertex Pharmaceuticals, Inc. (a) | | | 203,000 | | | | 7,693,700 | | |
| Biotechnology Total | | | 42,707,894 | | |
| Health Care Equipment & Supplies – 2.8% | |
| Baxter International, Inc. | | | 376,100 | | | | 21,441,461 | | |
| Boston Scientific Corp. (a) | | | 1,014,200 | | | | 10,740,378 | | |
| Hospira, Inc. (a) | | | 87,600 | | | | 3,906,960 | | |
| Health Care Equipment & Supplies Total | | | 36,088,799 | | |
| Health Care Providers & Services – 1.9% | |
| CIGNA Corp. | | | 409,000 | | | | 11,488,810 | | |
| Medco Health Solutions, Inc. (a) | | | 234,800 | | | | 12,986,788 | | |
| Health Care Providers & Services Total | | | 24,475,598 | | |
| Life Sciences Tools & Services – 2.4% | |
| Covance, Inc. (a) | | | 132,100 | | | | 7,153,215 | | |
| Life Technologies Corp. (a) | | | 280,900 | | | | 13,075,895 | | |
| Thermo Fisher Scientific, Inc. (a) | | | 267,169 | | | | 11,667,270 | | |
| Life Sciences Tools & Services Total | | | 31,896,380 | | |
| Pharmaceuticals – 4.7% | |
| Abbott Laboratories | | | 396,100 | | | | 19,595,067 | | |
| Allergan, Inc. | | | 244,000 | | | | 13,849,440 | | |
| Bristol-Myers Squibb Co. | | | 729,400 | | | | 16,426,088 | | |
| Johnson & Johnson | | | 191,600 | | | | 11,666,524 | | |
| Pharmaceuticals Total | | | 61,537,119 | | |
| Health Care Total | | | 196,705,790 | | |
| Industrials – 11.3% | |
| Aerospace & Defense – 3.4% | |
| Lockheed Martin Corp. | | | 82,100 | | | | 6,410,368 | | |
| Precision Castparts Corp. | | | 127,800 | | | | 13,018,986 | | |
| United Technologies Corp. | | | 401,500 | | | | 24,463,395 | | |
| Aerospace & Defense Total | | | 43,892,749 | | |
| | | Shares | | Value ($) | |
| Air Freight & Logistics – 0.6% | |
| FedEx Corp. | | | 115,400 | | | | 8,680,388 | | |
| Air Freight & Logistics Total | | | 8,680,388 | | |
| Commercial Services & Supplies – 0.9% | |
| Republic Services, Inc. | | | 438,700 | | | | 11,656,259 | | |
| Commercial Services & Supplies Total | | | 11,656,259 | | |
| Industrial Conglomerates – 1.6% | |
| Tyco International Ltd. | | | 605,100 | | | | 20,863,848 | | |
| Industrial Conglomerates Total | | | 20,863,848 | | |
| Machinery – 2.7% | |
| Dover Corp. | | | 250,000 | | | | 9,690,000 | | |
| Flowserve Corp. | | | 117,100 | | | | 11,539,034 | | |
| Parker Hannifin Corp. | | | 115,600 | | | | 5,992,704 | | |
| SPX Corp. | | | 131,400 | | | | 8,050,878 | | |
| Machinery Total | | | 35,272,616 | | |
| Road & Rail – 1.3% | |
| Con-way, Inc. | | | 76,900 | | | | 2,946,808 | | |
| Norfolk Southern Corp. | | | 201,400 | | | | 8,682,354 | | |
| Ryder System, Inc. | | | 128,000 | | | | 4,999,680 | | |
| Road & Rail Total | | | 16,628,842 | | |
| Trading Companies & Distributors – 0.8% | |
| W.W. Grainger, Inc. | | | 116,200 | | | | 10,383,632 | | |
| Trading Companies & Distributors Total | | | 10,383,632 | | |
| Industrials Total | | | 147,378,334 | | |
| Information Technology – 33.3% | |
| Communications Equipment – 5.7% | |
| Cisco Systems, Inc. (a) | | | 1,454,723 | | | | 34,244,179 | | |
| CommScope, Inc. (a) | | | 253,500 | | | | 7,587,255 | | |
| QUALCOMM, Inc. | | | 575,200 | | | | 25,872,496 | | |
| Research In Motion Ltd. (a) | | | 98,800 | | | | 6,673,940 | | |
| Communications Equipment Total | | | 74,377,870 | | |
| Computers & Peripherals – 10.4% | |
| Apple, Inc. (a) | | | 241,117 | | | | 44,695,859 | | |
| Dell, Inc. (a) | | | 689,200 | | | | 10,517,192 | | |
| EMC Corp. (a) | | | 1,013,200 | | | | 17,264,928 | | |
| Hewlett-Packard Co. | | | 644,149 | | | | 30,410,274 | | |
International Business
Machines Corp. | | | 269,000 | | | | 32,175,090 | | |
| Computers & Peripherals Total | | | 135,063,343 | | |
| Electronic Equipment, Instruments & Components – 0.5% | |
| Corning, Inc. | | | 422,600 | | | | 6,470,006 | | |
Electronic Equipment, Instruments &
Components Total | | | 6,470,006 | | |
See Accompanying Notes to Financial Statements.
49
Columbia Large Cap Growth Fund
September 30, 2009
| Common Stocks (continued) | |
| | | Shares | | Value ($) | |
| Internet Software & Services – 4.9% | |
| Akamai Technologies, Inc. (a) | | | 343,100 | | | | 6,752,208 | | |
| eBay, Inc. (a) | | | 406,700 | | | | 9,602,187 | | |
| Equinix, Inc. (a) | | | 101,400 | | | | 9,328,800 | | |
| Google, Inc., Class A (a) | | | 78,566 | | | | 38,956,951 | | |
| Internet Software & Services Total | | | 64,640,146 | | |
| IT Services – 0.5% | |
| Visa, Inc., Class A | | | 91,400 | | | | 6,316,654 | | |
| IT Services Total | | | 6,316,654 | | |
| Semiconductors & Semiconductor Equipment – 5.6% | |
| Analog Devices, Inc. | | | 375,000 | | | | 10,342,500 | | |
| Broadcom Corp., Class A (a) | | | 326,500 | | | | 10,020,285 | | |
| Cypress Semiconductor Corp. (a) | | | 289,000 | | | | 2,985,370 | | |
| Intel Corp. | | | 925,344 | | | | 18,108,982 | | |
| Maxim Integrated Products, Inc. | | | 409,300 | | | | 7,424,702 | | |
| Teradyne, Inc. (a) | | | 736,000 | | | | 6,808,000 | | |
| Texas Instruments, Inc. | | | 738,300 | | | | 17,490,327 | | |
Semiconductors & Semiconductor
Equipment Total | | | 73,180,166 | | |
| Software – 5.7% | |
| Activision Blizzard, Inc. (a) | | | 553,681 | | | | 6,860,107 | | |
| Adobe Systems, Inc. (a) | | | 207,700 | | | | 6,862,408 | | |
| Microsoft Corp. | | | 1,961,198 | | | | 50,775,416 | | |
| Oracle Corp. | | | 474,036 | | | | 9,878,910 | | |
| Software Total | | | 74,376,841 | | |
| Information Technology Total | | | 434,425,026 | | |
| Materials – 2.9% | |
| Chemicals – 0.5% | |
| Celanese Corp., Series A | | | 273,700 | | | | 6,842,500 | | |
| Chemicals Total | | | 6,842,500 | | |
| Containers & Packaging – 1.3% | |
| Crown Holdings, Inc. (a) | | | 346,300 | | | | 9,419,360 | | |
| Owens-Illinois, Inc. (a) | | | 200,900 | | | | 7,413,210 | | |
| Containers & Packaging Total | | | 16,832,570 | | |
| Metals & Mining – 1.1% | |
Freeport-McMoRan Copper &
Gold, Inc. | | | 74,600 | | | | 5,118,306 | | |
| Steel Dynamics, Inc. | | | 624,800 | | | | 9,584,432 | | |
| Metals & Mining Total | | | 14,702,738 | | |
| Materials Total | | | 38,377,808 | | |
| | | Shares | | Value ($) | |
| Telecommunication Services – 1.2% | |
| Wireless Telecommunication Services – 1.2% | |
American Tower Corp.,
Class A (a) | | | 293,200 | | | | 10,672,480 | | |
Millicom International
Cellular SA (a) | | | 59,251 | | | | 4,309,918 | | |
Wireless Telecommunication
Services Total | | | 14,982,398 | | |
| Telecommunication Services Total | | | 14,982,398 | | |
| Utilities – 1.0% | |
| Independent Power Producers & Energy Traders – 1.0% | |
| AES Corp. (a) | | | 904,900 | | | | 13,410,618 | | |
Independent Power Producers &
Energy Traders Total | | | 13,410,618 | | |
| Utilities Total | | | 13,410,618 | | |
Total Common Stocks
(cost of $1,080,520,522) | | | 1,302,771,576 | | |
| Short-Term Obligation – 0.1% | |
| | | Par ($) | | | |
Repurchase agreement with
Fixed Income Clearing Corp.,
dated 09/30/09, due 10/01/09,
at 0.010%, collateralized by
a U.S. Treasury obligation
maturing 02/12/15, market
value $1,793,132 (repurchase
proceeds $1,753,000) | | | 1,753,000 | | | | 1,753,000 | | |
Total Short-Term Obligation
(cost of $1,753,000) | | | 1,753,000 | | |
Total Investments – 100.0%
(cost of $1,082,273,522) (b) | | | 1,304,524,576 | | |
| Other Assets & Liabilities, Net – (0.0)% | | | (511,110 | ) | |
| Net Assets – 100.0% | | | 1,304,013,466 | | |
Notes to Investment Portfolio:
(a) Non-income producing security.
(b) Cost for federal income tax purposes is $1,092,031,688.
See Accompanying Notes to Financial Statements.
50
Columbia Large Cap Growth Fund
September 30, 2009
The following table summarizes the inputs used, as of September 30, 2009 in valuing the Fund's assets:
| Description | | Quoted Prices
(Level 1) | | Other
Significant
Observable
Inputs
(Level 2) | | Significant
Unobservable
Inputs
(Level 3) | | Total | |
| Common Stocks | |
Consumer
Discretionary | | $ | 144,441,117 | | | $ | — | | | $ | — | | | $ | 144,441,117 | | |
| Consumer Staples | | | 168,144,855 | | | | — | | | | — | | | | 168,144,855 | | |
| Energy | | | 63,005,297 | | | | — | | | | — | | | | 63,005,297 | | |
| Financials | | | 81,900,333 | | | | — | | | | — | | | | 81,900,333 | | |
| Health Care | | | 196,705,790 | | | | — | | | | — | | | | 196,705,790 | | |
| Industrials | | | 147,378,334 | | | | — | | | | — | | | | 147,378,334 | | |
Information
Technology | | | 434,425,026 | | | | — | | | | — | | | | 434,425,026 | | |
| Materials | | | 38,377,808 | | | | — | | | | — | | | | 38,377,808 | | |
Telecommunication
Services | | | 14,982,398 | | | | — | | | | — | | | | 14,982,398 | | |
| Utilities | | | 13,410,618 | | | | — | | | | — | | | | 13,410,618 | | |
| Total Common Stocks | | | 1,302,771,576 | | | | — | | | | — | | | | 1,302,771,576 | | |
Total Short-Term
Obligation | | | — | | | | 1,753,000 | | | | — | | | | 1,753,000 | | |
| Total Investments | | $ | 1,302,771,576 | | | $ | 1,753,000 | | | $ | — | | | $ | 1,304,524,576 | | |
For more information on valuation inputs, and their aggregation into the levels used in the table above, please refer to the Security Valuation section in the accompanying Notes to Financial Statements.
At September 30, 2009, the Fund held investments in the following sectors:
| Sector (Unaudited) | | % of
Net Assets | |
| Information Technology | | | 33.3 | | |
| Health Care | | | 15.1 | | |
| Consumer Staples | | | 12.9 | | |
| Industrials | | | 11.3 | | |
| Consumer Discretionary | | | 11.1 | | |
| Financials | | | 6.3 | | |
| Energy | | | 4.8 | | |
| Materials | | | 2.9 | | |
| Telecommunication Services | | | 1.2 | | |
| Utilities | | | 1.0 | | |
| | | | 99.9 | | |
| Short-Term Obligation | | | 0.1 | | |
| Other Assets & Liabilities, Net | | | (0.0 | )* | |
| | | | 100.0 | | |
* Rounds to less than 0.1%.
See Accompanying Notes to Financial Statements.
51
Investment Portfolio – Columbia Disciplined Value Fund
September 30, 2009
| Common Stocks – 99.7% | |
| | | Shares | | Value ($) | |
| Consumer Discretionary – 9.4% | |
| Automobiles – 0.4% | |
| Ford Motor Co. (a) | | | 181,000 | | | | 1,305,010 | | |
| Automobiles Total | | | 1,305,010 | | |
| Hotels, Restaurants & Leisure – 0.2% | |
| Carnival Corp. | | | 20,200 | | | | 672,256 | | |
| Hotels, Restaurants & Leisure Total | | | 672,256 | | |
| Household Durables – 1.5% | |
| Garmin Ltd. | | | 95,300 | | | | 3,596,622 | | |
| Leggett & Platt, Inc. | | | 56,500 | | | | 1,096,100 | | |
| Household Durables Total | | | 4,692,722 | | |
| Media – 1.9% | |
| Comcast Corp., Class A | | | 203,700 | | | | 3,440,493 | | |
| DISH Network Corp., Class A (a) | | | 28,400 | | | | 546,984 | | |
| Viacom, Inc., Class B (a) | | | 700 | | | | 19,628 | | |
| Walt Disney Co. | | | 68,600 | | | | 1,883,756 | | |
| Media Total | | | 5,890,861 | | |
| Multiline Retail – 0.6% | |
| J.C. Penney Co., Inc. | | | 44,400 | | | | 1,498,500 | | |
| Kohl's Corp. (a) | | | 1,100 | | | | 62,755 | | |
| Sears Holdings Corp. (a) | | | 2,900 | | | | 189,399 | | |
| Multiline Retail Total | | | 1,750,654 | | |
| Specialty Retail – 4.2% | |
| Barnes & Noble, Inc. | | | 47,900 | | | | 1,064,338 | | |
| Gap, Inc. | | | 207,800 | | | | 4,446,920 | | |
| Home Depot, Inc. | | | 244,600 | | | | 6,516,144 | | |
| Limited Brands, Inc. | | | 5,000 | | | | 84,950 | | |
| RadioShack Corp. | | | 39,700 | | | | 657,829 | | |
| Specialty Retail Total | | | 12,770,181 | | |
| Textiles, Apparel & Luxury Goods – 0.6% | |
| Polo Ralph Lauren Corp. | | | 21,600 | | | | 1,654,992 | | |
| Textiles, Apparel & Luxury Goods Total | | | 1,654,992 | | |
| Consumer Discretionary Total | | | 28,736,676 | | |
| Consumer Staples – 5.3% | |
| Beverages – 0.0% | |
| Pepsi Bottling Group, Inc. | | | 1,600 | | | | 58,304 | | |
| Beverages Total | | | 58,304 | | |
| Food Products – 1.6% | |
| Archer-Daniels-Midland Co. | | | 2,300 | | | | 67,206 | | |
| Campbell Soup Co. | | | 66,200 | | | | 2,159,444 | | |
| ConAgra Foods, Inc. | | | 23,900 | | | | 518,152 | | |
| | | Shares | | Value ($) | |
| Del Monte Foods Co. | | | 104,700 | | | | 1,212,426 | | |
| Kraft Foods, Inc., Class A | | | 39,900 | | | | 1,048,173 | | |
| Food Products Total | | | 5,005,401 | | |
| Household Products – 2.8% | |
| Kimberly-Clark Corp. | | | 43,300 | | | | 2,553,834 | | |
| Procter & Gamble Co. | | | 102,900 | | | | 5,959,968 | | |
| Household Products Total | | | 8,513,802 | | |
| Personal Products – 0.1% | |
Mead Johnson Nutrition Co.,
Class A | | | 9,100 | | | | 410,501 | | |
| Personal Products Total | | | 410,501 | | |
| Tobacco – 0.8% | |
| Lorillard, Inc. | | | 26,100 | | | | 1,939,230 | | |
| Reynolds American, Inc. | | | 9,200 | | | | 409,584 | | |
| Tobacco Total | | | 2,348,814 | | |
| Consumer Staples Total | | | 16,336,822 | | |
| Energy – 18.2% | |
| Energy Equipment & Services – 1.5% | |
| Exterran Holdings, Inc. (a) | | | 1,900 | | | | 45,106 | | |
| Nabors Industries Ltd. (a) | | | 7,200 | | | | 150,480 | | |
| National Oilwell Varco, Inc. (a) | | | 7,900 | | | | 340,727 | | |
| Oil States International, Inc. (a) | | | 60,400 | | | | 2,121,852 | | |
| Patterson-UTI Energy, Inc. | | | 7,600 | | | | 114,760 | | |
| SEACOR Holdings, Inc. (a) | | | 10,700 | | | | 873,441 | | |
| Superior Energy Services, Inc. (a) | | | 36,400 | | | | 819,728 | | |
| Energy Equipment & Services Total | | | 4,466,094 | | |
| Oil, Gas & Consumable Fuels – 16.7% | |
| Anadarko Petroleum Corp. | | | 19,600 | | | | 1,229,508 | | |
| Apache Corp. | | | 81,600 | | | | 7,493,328 | | |
| Arch Coal, Inc. | | | 3,500 | | | | 77,455 | | |
| Chevron Corp. | | | 181,700 | | | | 12,797,131 | | |
| ConocoPhillips | | | 85,800 | | | | 3,874,728 | | |
| Devon Energy Corp. | | | 1,900 | | | | 127,927 | | |
| EOG Resources, Inc. | | | 22,300 | | | | 1,862,273 | | |
| Exxon Mobil Corp. (b) | | | 209,800 | | | | 14,394,378 | | |
| Marathon Oil Corp. | | | 41,000 | | | | 1,307,900 | | |
| Massey Energy Co. | | | 13,700 | | | | 382,093 | | |
| Occidental Petroleum Corp. | | | 13,200 | | | | 1,034,880 | | |
| Sunoco, Inc. | | | 39,100 | | | | 1,112,395 | | |
| Tesoro Corp. | | | 177,700 | | | | 2,661,946 | | |
| Valero Energy Corp. | | | 30,000 | | | | 581,700 | | |
| XTO Energy, Inc. | | | 53,900 | | | | 2,227,148 | | |
| Oil, Gas & Consumable Fuels Total | | | 51,164,790 | | |
| Energy Total | | | 55,630,884 | | |
See Accompanying Notes to Financial Statements.
52
Columbia Disciplined Value Fund
September 30, 2009
| Common Stocks (continued) | |
| | | Shares | | Value ($) | |
| Financials – 25.3% | |
| Capital Markets – 4.0% | |
| Ameriprise Financial, Inc. | | | 18,300 | | | | 664,839 | | |
| Franklin Resources, Inc. | | | 1,300 | | | | 130,780 | | |
| Goldman Sachs Group, Inc. | | | 44,300 | | | | 8,166,705 | | |
| Morgan Stanley | | | 105,200 | | | | 3,248,576 | | |
| State Street Corp. | | | 900 | | | | 47,340 | | |
| Capital Markets Total | | | 12,258,240 | | |
| Commercial Banks – 4.7% | |
| BB&T Corp. | | | 81,300 | | | | 2,214,612 | | |
| Fifth Third Bancorp. | | | 43,000 | | | | 435,590 | | |
| U.S. Bancorp | | | 34,300 | | | | 749,798 | | |
| Wells Fargo & Co. | | | 394,100 | | | | 11,105,738 | | |
| Commercial Banks Total | | | 14,505,738 | | |
| Consumer Finance – 1.3% | |
| American Express Co. | | | 29,300 | | | | 993,270 | | |
| Discover Financial Services | | | 160,000 | | | | 2,596,800 | | |
| SLM Corp. (a) | | | 42,100 | | | | 367,112 | | |
| Consumer Finance Total | | | 3,957,182 | | |
| Diversified Financial Services – 6.2% | |
| Citigroup, Inc. | | | 821,700 | | | | 3,977,028 | | |
| JPMorgan Chase & Co. | | | 339,200 | | | | 14,863,744 | | |
| Diversified Financial Services Total | | | 18,840,772 | | |
| Insurance – 6.2% | |
Allied World Assurance
Holdings Ltd. | | | 55,300 | | | | 2,650,529 | | |
| American Financial Group, Inc. | | | 91,100 | | | | 2,323,050 | | |
| Aspen Insurance Holdings Ltd. | | | 4,800 | | | | 127,056 | | |
| CNA Financial Corp. (a) | | | 77,800 | | | | 1,878,092 | | |
| Genworth Financial, Inc., Class A | | | 121,900 | | | | 1,456,705 | | |
Hartford Financial Services
Group, Inc. | | | 700 | | | | 18,550 | | |
| MetLife, Inc. | | | 33,400 | | | | 1,271,538 | | |
| PartnerRe Ltd. | | | 100 | | | | 7,694 | | |
| Protective Life Corp. | | | 44,300 | | | | 948,906 | | |
| Prudential Financial, Inc. | | | 19,300 | | | | 963,263 | | |
| Reinsurance Group of America, Inc. | | | 52,200 | | | | 2,328,120 | | |
| Transatlantic Holdings, Inc. | | | 48,400 | | | | 2,428,228 | | |
| Travelers Companies, Inc. | | | 20,500 | | | | 1,009,215 | | |
| Unum Group | | | 80,500 | | | | 1,725,920 | | |
| Insurance Total | | | 19,136,866 | | |
| Real Estate Investment Trusts (REITs) – 2.9% | |
| Annaly Capital Management, Inc. | | | 94,600 | | | | 1,716,044 | | |
| Brandywine Realty Trust | | | 41,300 | | | | 455,952 | | |
| Hospitality Properties Trust | | | 5,500 | | | | 112,035 | | |
| HRPT Properties Trust | | | 771,700 | | | | 5,803,184 | | |
| | | Shares | | Value ($) | |
| Liberty Property Trust | | | 10,300 | | | | 335,059 | | |
| Nationwide Health Properties, Inc. | | | 11,200 | | | | 347,088 | | |
| Real Estate Investment Trusts (REITs) Total | | | 8,769,362 | | |
| Real Estate Management & Development – 0.0% | |
Forest City Enterprises, Inc.,
Class A | | | 4,900 | | | | 65,513 | | |
Real Estate Management &
Development Total | | | 65,513 | | |
| Financials Total | | | 77,533,673 | | |
| Health Care – 9.2% | |
| Health Care Equipment & Supplies – 0.0% | |
| Kinetic Concepts, Inc. (a) | | | 1,600 | | | | 59,168 | | |
| Health Care Equipment & Supplies Total | | | 59,168 | | |
| Health Care Providers & Services – 2.4% | |
| Coventry Health Care, Inc. (a) | | | 5,500 | | | | 109,780 | | |
| McKesson Corp. | | | 23,400 | | | | 1,393,470 | | |
| Tenet Healthcare Corp. (a) | | | 2,700 | | | | 15,876 | | |
| UnitedHealth Group, Inc. | | | 210,800 | | | | 5,278,432 | | |
| WellPoint, Inc. (a) | | | 12,400 | | | | 587,264 | | |
| Health Care Providers & Services Total | | | 7,384,822 | | |
| Pharmaceuticals – 6.8% | |
| Bristol-Myers Squibb Co. | | | 19,400 | | | | 436,888 | | |
| Eli Lilly & Co. | | | 27,900 | | | | 921,537 | | |
Endo Pharmaceuticals
Holdings, Inc. (a) | | | 110,900 | | | | 2,509,667 | | |
| Johnson & Johnson | | | 36,100 | | | | 2,198,129 | | |
| Merck & Co., Inc. | | | 54,800 | | | | 1,733,324 | | |
| Pfizer, Inc. | | | 675,900 | | | | 11,186,145 | | |
| Schering-Plough Corp. | | | 900 | | | | 25,425 | | |
| Wyeth | | | 34,200 | | | | 1,661,436 | | |
| Pharmaceuticals Total | | | 20,672,551 | | |
| Health Care Total | | | 28,116,541 | | |
| Industrials – 10.6% | |
| Aerospace & Defense – 2.3% | |
| Boeing Co. | | | 9,600 | | | | 519,840 | | |
| General Dynamics Corp. | | | 2,300 | | | | 148,580 | | |
| Raytheon Co. | | | 96,500 | | | | 4,629,105 | | |
| United Technologies Corp. | | | 30,800 | | | | 1,876,644 | | |
| Aerospace & Defense Total | | | 7,174,169 | | |
| Commercial Services & Supplies – 1.8% | |
| R.R. Donnelley & Sons Co. | | | 262,300 | | | | 5,576,498 | | |
| Commercial Services & Supplies Total | | | 5,576,498 | | |
See Accompanying Notes to Financial Statements.
53
Columbia Disciplined Value Fund
September 30, 2009
| Common Stocks (continued) | |
| | | Shares | | Value ($) | |
| Construction & Engineering – 0.3% | |
| KBR, Inc. | | | 30,400 | | | | 708,016 | | |
| URS Corp. (a) | | | 1,400 | | | | 61,110 | | |
| Construction & Engineering Total | | | 769,126 | | |
| Electrical Equipment – 1.3% | |
| Rockwell Automation, Inc. | | | 6,300 | | | | 268,380 | | |
| Thomas & Betts Corp. (a) | | | 120,500 | | | | 3,624,640 | | |
| Electrical Equipment Total | | | 3,893,020 | | |
| Industrial Conglomerates – 3.2% | |
| General Electric Co. | | | 602,700 | | | | 9,896,334 | | |
| Industrial Conglomerates Total | | | 9,896,334 | | |
| Machinery – 1.5% | |
| Eaton Corp. | | | 8,500 | | | | 481,015 | | |
| Harsco Corp. | | | 6,700 | | | | 237,247 | | |
| Illinois Tool Works, Inc. | | | 15,700 | | | | 670,547 | | |
| Joy Global, Inc. | | | 63,000 | | | | 3,083,220 | | |
| Parker Hannifin Corp. | | | 3,500 | | | | 181,440 | | |
| Timken Co. | | | 1,800 | | | | 42,174 | | |
| Machinery Total | | | 4,695,643 | | |
| Professional Services – 0.1% | |
| Equifax, Inc. | | | 1,600 | | | | 46,624 | | |
| Manpower, Inc. | | | 2,700 | | | | 153,117 | | |
| Professional Services Total | | | 199,741 | | |
| Road & Rail – 0.1% | |
| CSX Corp. | | | 3,800 | | | | 159,068 | | |
| Road & Rail Total | | | 159,068 | | |
| Industrials Total | | | 32,363,599 | | |
| Information Technology – 5.2% | |
| Computers & Peripherals – 1.5% | |
| EMC Corp. (a) | | | 55,500 | | | | 945,720 | | |
| Hewlett-Packard Co. | | | 55,500 | | | | 2,620,155 | | |
| Teradata Corp. (a) | | | 40,200 | | | | 1,106,304 | | |
| Western Digital Corp. (a) | | | 1,300 | | | | 47,489 | | |
| Computers & Peripherals Total | | | 4,719,668 | | |
| Electronic Equipment, Instruments & Components – 0.6% | |
| Corning, Inc. | | | 107,500 | | | | 1,645,825 | | |
| Tech Data Corp. (a) | | | 2,900 | | | | 120,669 | | |
Electronic Equipment, Instruments &
Components Total | | | 1,766,494 | | |
| Internet Software & Services – 0.2% | |
| eBay, Inc. (a) | | | 28,600 | | | | 675,246 | | |
| Internet Software & Services Total | | | 675,246 | | |
| | | Shares | | Value ($) | |
| IT Services – 1.7% | |
| Computer Sciences Corp. (a) | | | 96,300 | | | | 5,075,973 | | |
| IT Services Total | | | 5,075,973 | | |
| Semiconductors & Semiconductor Equipment – 1.2% | |
| Intel Corp. | | | 185,200 | | | | 3,624,364 | | |
Semiconductors & Semiconductor
Equipment Total | | | 3,624,364 | | |
| Information Technology Total | | | 15,861,745 | | |
| Materials – 4.0% | |
| Chemicals – 2.4% | |
| Ashland, Inc. | | | 47,800 | | | | 2,065,916 | | |
| Dow Chemical Co. | | | 59,900 | | | | 1,561,593 | | |
| Eastman Chemical Co. | | | 71,700 | | | | 3,838,818 | | |
| Chemicals Total | | | 7,466,327 | | |
| Metals & Mining – 0.6% | |
| AK Steel Holding Corp. | | | 44,100 | | | | 870,093 | | |
| Cliffs Natural Resources, Inc. | | | 16,800 | | | | 543,648 | | |
| Commercial Metals Co. | | | 23,800 | | | | 426,020 | | |
| Metals & Mining Total | | | 1,839,761 | | |
| Paper & Forest Products – 1.0% | |
| International Paper Co. | | | 134,700 | | | | 2,994,381 | | |
| Paper & Forest Products Total | | | 2,994,381 | | |
| Materials Total | | | 12,300,469 | | |
| Telecommunication Services – 5.7% | |
| Diversified Telecommunication Services – 4.3% | |
| AT&T, Inc. | | | 289,500 | | | | 7,819,395 | | |
Qwest Communications
International, Inc. | | | 208,900 | | | | 795,909 | | |
| Verizon Communications, Inc. | | | 145,900 | | | | 4,416,393 | | |
Diversified Telecommunication
Services Total | | | 13,031,697 | | |
| Wireless Telecommunication Services – 1.4% | |
| Sprint Nextel Corp. (a) | | | 1,083,500 | | | | 4,279,825 | | |
Wireless Telecommunication
Services Total | | | 4,279,825 | | |
| Telecommunication Services Total | | | 17,311,522 | | |
| Utilities – 6.8% | |
| Electric Utilities – 2.5% | |
| Edison International | | | 18,900 | | | | 634,662 | | |
| Entergy Corp. | | | 17,200 | | | | 1,373,592 | | |
See Accompanying Notes to Financial Statements.
54
Columbia Disciplined Value Fund
September 30, 2009
| Common Stocks (continued) | |
| | | Shares | | Value ($) | |
| Exelon Corp. | | | 111,300 | | | | 5,522,706 | | |
| FPL Group, Inc. | | | 300 | | | | 16,569 | | |
| Electric Utilities Total | | | 7,547,529 | | |
| Gas Utilities – 1.7% | |
| Energen Corp. | | | 104,500 | | | | 4,503,950 | | |
| Questar Corp. | | | 11,500 | | | | 431,940 | | |
| UGI Corp. | | | 14,600 | | | | 365,876 | | |
| Gas Utilities Total | | | 5,301,766 | | |
| Independent Power Producers & Energy Traders – 1.2% | |
| AES Corp. (a) | | | 236,300 | | | | 3,501,966 | | |
| Mirant Corp. (a) | | | 8,400 | | | | 138,012 | | |
Independent Power Producers &
Energy Traders Total | | | 3,639,978 | | |
| Multi-Utilities – 1.4% | |
| NiSource, Inc. | | | 54,800 | | | | 761,172 | | |
| NSTAR | | | 15,700 | | | | 499,574 | | |
Public Service Enterprise
Group, Inc. | | | 97,800 | | | | 3,074,832 | | |
| Multi-Utilities Total | | | 4,335,578 | | |
| Utilities Total | | | 20,824,851 | | |
Total Common Stocks
(cost of $255,940,287) | | | 305,016,782 | | |
| Short-Term Obligation – 0.8% | |
| | | Par ($) | | | |
Repurchase agreement with
Fixed Income Clearing Corp.,
dated 09/30/09, due 10/01/09
at 0.010%, collateralized by a
U.S. Treasury obligation,
maturing 02/12/15, market
value $2,479,059 (repurchase
proceeds $2,426,001) | | | 2,426,000 | | | | 2,426,000 | | |
Total Short-Term Obligation
(cost of $2,426,000) | | | 2,426,000 | | |
Total Investments – 100.5%
(cost of $258,366,287) (c) | | | 307,442,782 | | |
| Other Assets & Liabilities, Net – (0.5)% | | | (1,464,597 | ) | |
| Net Assets – 100.0% | | | 305,978,185 | | |
Notes to Investment Portfolio:
(a) Non-income producing security.
(b) A portion of this security with a market value of $1,732,403 is pledged as collateral for open futures contracts.
(c) Cost for federal income tax purposes is $261,509,111.
The following table summarizes the inputs used, as of September 30, 2009 in valuing the Fund's assets:
| Description | | Quoted Prices
(Level 1) | | Other
Significant
Observable
Inputs
(Level 2) | | Significant
Unobservable
Inputs
(Level 3) | | Total | |
| Common Stocks | |
Consumer
Discretionary | | $ | 28,736,676 | | | $ | — | | | $ | — | | | $ | 28,736,676 | | |
| Consumer Staples | | | 16,336,822 | | | | — | | | | — | | | | 16,336,822 | | |
| Energy | | | 55,630,884 | | | | — | | | | — | | | | 55,630,884 | | |
| Financials | | | 77,533,673 | | | | — | | | | — | | | | 77,533,673 | | |
| Health Care | | | 28,116,541 | | | | — | | | | — | | | | 28,116,541 | | |
| Industrials | | | 32,363,599 | | | | — | | | | — | | | | 32,363,599 | | |
Information
Technology | | | 15,861,745 | | | | — | | | | — | | | | 15,861,745 | | |
| Materials | | | 12,300,469 | | | | — | | | | — | | | | 12,300,469 | | |
Telecommunication
Services | | | 17,311,522 | | | | — | | | | — | | | | 17,311,522 | | |
| Utilities | | | 20,824,851 | | | | — | | | | — | | | | 20,824,851 | | |
| Total Common Stocks | | | 305,016,782 | | | | — | | | | — | | | | 305,016,782 | | |
Total Short-Term
Obligation | | | — | | | | 2,426,000 | | | | — | | | | 2,426,000 | | |
| Total Investments | | | 305,016,782 | | | | 2,426,000 | | | | — | | | | 307,442,782 | | |
Unrealized Appreciation
on Futures Contracts | | | 27,918 | | | | — | | | | — | | | | 27,918 | | |
| Total | | $ | 305,044,700 | | | $ | 2,426,000 | | | $ | — | | | $ | 307,470,700 | | |
For more information on valuation inputs, and their aggregation into the levels used in the table above, please refer to the Security Valuation section in the accompanying Notes to Financial Statements.
At September 30, 2009, the Fund held investments in the following sectors:
| Sector (Unaudited) | | % of
Net Assets | |
| Financials | | | 25.3 | | |
| Energy | | | 18.2 | | |
| Industrials | | | 10.6 | | |
| Consumer Discretionary | | | 9.4 | | |
| Health Care | | | 9.2 | | |
| Utilities | | | 6.8 | | |
| Telecommunication Services | | | 5.7 | | |
| Consumer Staples | | | 5.3 | | |
| Information Technology | | | 5.2 | | |
| Materials | | | 4.0 | | |
| | | | 99.7 | | |
| Short Term Obligation | | | 0.8 | | |
| Other Assets & Liabilities, Net | | | (0.5 | ) | |
| | | | 100.0 | | |
At September 30, 2009, the Fund held the following open long futures contracts:
Risk
Exposure | | Number of
Contracts | | Value | | Aggregate
Face Value | | Expiration
Date | | Unrealized
Appreciation | |
| Equity Risk | |
| S&P 500 Index | | | 12 | | | $ | 3,158,700 | | | $ | 3,130,782 | | | Dec-09 | | $ | 27,918 | | |
See Accompanying Notes to Financial Statements.
55
Investment Portfolio – Columbia Contrarian Core Fund
September 30, 2009
| Common Stocks – 98.3% | |
| | | Shares | | Value ($) | |
| Consumer Discretionary – 10.9% | |
| Auto Components – 0.6% | |
| Dana Holding Corp. (a) | | | 335,205 | | | | 2,282,746 | | |
| Auto Components Total | | | 2,282,746 | | |
| Hotels, Restaurants & Leisure – 2.8% | |
| Carnival Corp. | | | 153,700 | | | | 5,115,136 | | |
| Las Vegas Sands Corp. (a) | | | 106,500 | | | | 1,793,460 | | |
Melco Crown Entertainment, Ltd.,
ADR (a) | | | 267,600 | | | | 1,862,496 | | |
| Penn National Gaming, Inc. (a) | | | 83,800 | | | | 2,317,908 | | |
| Hotels, Restaurants & Leisure Total | | | 11,089,000 | | |
| Household Durables – 1.4% | |
| Newell Rubbermaid, Inc. | | | 370,800 | | | | 5,817,852 | | |
| Household Durables Total | | | 5,817,852 | | |
| Media – 0.8% | |
| News Corp., Class A | | | 258,400 | | | | 3,098,216 | | |
| Media Total | | | 3,098,216 | | |
| Multiline Retail – 2.1% | |
| Target Corp. | | | 183,500 | | | | 8,565,780 | | |
| Multiline Retail Total | | | 8,565,780 | | |
| Specialty Retail – 2.3% | |
| GameStop Corp., Class A (a) | | | 149,700 | | | | 3,962,559 | | |
| Lowe's Companies, Inc. | | | 258,400 | | | | 5,410,896 | | |
| Specialty Retail Total | | | 9,373,455 | | |
| Textiles, Apparel & Luxury Goods – 0.9% | |
| NIKE, Inc., Class B | | | 54,600 | | | | 3,532,620 | | |
| Textiles, Apparel & Luxury Goods Total | | | 3,532,620 | | |
| Consumer Discretionary Total | | | 43,759,669 | | |
| Consumer Staples – 9.2% | |
| Beverages – 2.1% | |
| PepsiCo, Inc. | | | 144,500 | | | | 8,476,370 | | |
| Beverages Total | | | 8,476,370 | | |
| Food & Staples Retailing – 1.5% | |
| CVS Caremark Corp. | | | 166,000 | | | | 5,932,840 | | |
| Food & Staples Retailing Total | | | 5,932,840 | | |
| Personal Products – 2.6% | |
| Avon Products, Inc. | | | 114,700 | | | | 3,895,212 | | |
| Herbalife Ltd. | | | 123,200 | | | | 4,033,568 | | |
Mead Johnson Nutrition Co.,
Class A | | | 61,154 | | | | 2,758,657 | | |
| Personal Products Total | | | 10,687,437 | | |
| | | Shares | | Value ($) | |
| Tobacco – 3.0% | |
| Philip Morris International, Inc. | | | 244,300 | | | | 11,907,182 | | |
| Tobacco Total | | | 11,907,182 | | |
| Consumer Staples Total | | | 37,003,829 | | |
| Energy – 13.0% | |
| Energy Equipment & Services – 2.1% | |
| Transocean Ltd. (a) | | | 59,100 | | | | 5,054,823 | | |
| Weatherford International Ltd. (a) | | | 172,000 | | | | 3,565,560 | | |
| Energy Equipment & Services Total | | | 8,620,383 | | |
| Oil, Gas & Consumable Fuels – 10.9% | |
| Alpha Natural Resources, Inc. (a) | | | 71,300 | | | | 2,502,630 | | |
| Apache Corp. | | | 72,000 | | | | 6,611,760 | | |
| Canadian Natural Resources Ltd. | | | 60,000 | | | | 4,031,400 | | |
| Chevron Corp. | | | 132,400 | | | | 9,324,932 | | |
| ConocoPhillips | | | 152,000 | | | | 6,864,320 | | |
| Devon Energy Corp. | | | 64,900 | | | | 4,369,717 | | |
| Petroleo Brasileiro SA, ADR | | | 160,300 | | | | 6,301,393 | | |
| Suncor Energy, Inc. | | | 114,800 | | | | 3,967,488 | | |
| Oil, Gas & Consumable Fuels Total | | | 43,973,640 | | |
| Energy Total | | | 52,594,023 | | |
| Financials – 18.1% | |
| Capital Markets – 7.0% | |
| Bank of New York Mellon Corp. | | | 139,900 | | | | 4,055,701 | | |
| Goldman Sachs Group, Inc. | | | 53,000 | | | | 9,770,550 | | |
| Morgan Stanley | | | 219,200 | | | | 6,768,896 | | |
| State Street Corp. | | | 147,800 | | | | 7,774,280 | | |
| Capital Markets Total | | | 28,369,427 | | |
| Commercial Banks – 3.3% | |
| PNC Financial Services Group, Inc. | | | 73,400 | | | | 3,566,506 | | |
| Wells Fargo & Co. | | | 339,122 | | | | 9,556,458 | | |
| Commercial Banks Total | | | 13,122,964 | | |
| Diversified Financial Services – 2.9% | |
| JPMorgan Chase & Co. | | | 269,072 | | | | 11,790,735 | | |
| Diversified Financial Services Total | | | 11,790,735 | | |
| Insurance – 4.0% | |
Berkshire Hathaway, Inc.,
Class B (a) | | | 1,589 | | | | 5,280,247 | | |
| MetLife, Inc. | | | 140,500 | | | | 5,348,835 | | |
| Prudential Financial, Inc. | | | 105,236 | | | | 5,252,329 | | |
| Insurance Total | | | 15,881,411 | | |
See Accompanying Notes to Financial Statements.
56
Columbia Contrarian Core Fund
September 30, 2009
| Common Stocks (continued) | |
| | | Shares | | Value ($) | |
| Real Estate Investment Trusts (REITs) – 0.4% | |
PennyMac Mortgage Investment
Trust (a) | | | 83,900 | | | | 1,670,449 | | |
| Real Estate Investment Trusts (REITs) Total | | | 1,670,449 | | |
| Real Estate Management & Development – 0.5% | |
CB Richard Ellis Group, Inc.,
Class A (a) | | | 182,200 | | | | 2,139,028 | | |
Real Estate Management &
Development Total | | | 2,139,028 | | |
| Financials Total | | | 72,974,014 | | |
| Health Care – 11.7% | |
| Health Care Equipment & Supplies – 2.1% | |
| Baxter International, Inc. | | | 109,200 | | | | 6,225,492 | | |
| CareFusion Corp. (a) | | | 99,600 | | | | 2,171,280 | | |
| Health Care Equipment & Supplies Total | | | 8,396,772 | | |
| Health Care Providers & Services – 2.6% | |
| Cardinal Health, Inc. | | | 277,400 | | | | 7,434,320 | | |
| Medco Health Solutions, Inc. (a) | | | 54,300 | | | | 3,003,333 | | |
| Health Care Providers & Services Total | | | 10,437,653 | | |
| Life Sciences Tools & Services – 1.6% | |
| Thermo Fisher Scientific, Inc. (a) | | | 147,250 | | | | 6,430,408 | | |
| Life Sciences Tools & Services Total | | | 6,430,408 | | |
| Pharmaceuticals – 5.4% | |
| Abbott Laboratories | | | 238,387 | | | | 11,793,005 | | |
| Allergan, Inc. | | | 39,500 | | | | 2,242,020 | | |
| Pfizer, Inc. | | | 475,900 | | | | 7,876,145 | | |
| Pharmaceuticals Total | | | 21,911,170 | | |
| Health Care Total | | | 47,176,003 | | |
| Industrials – 7.6% | |
| Aerospace & Defense – 2.8% | |
| Honeywell International, Inc. | | | 138,750 | | | | 5,154,562 | | |
| United Technologies Corp. | | | 101,100 | | | | 6,160,023 | | |
| Aerospace & Defense Total | | | 11,314,585 | | |
| Industrial Conglomerates – 2.9% | |
| General Electric Co. | | | 221,040 | | | | 3,629,477 | | |
| Tyco International Ltd. | | | 231,200 | | | | 7,971,776 | | |
| Industrial Conglomerates Total | | | 11,601,253 | | |
| Machinery – 0.8% | |
| Navistar International Corp. (a) | | | 83,100 | | | | 3,109,602 | | |
| Machinery Total | | | 3,109,602 | | |
| | | Shares | | Value ($) | |
| Road & Rail – 1.1% | |
| Union Pacific Corp. | | | 79,120 | | | | 4,616,652 | | |
| Road & Rail Total | | | 4,616,652 | | |
| Industrials Total | | | 30,642,092 | | |
| Information Technology – 20.6% | |
| Communications Equipment – 1.2% | |
| QUALCOMM, Inc. | | | 108,400 | | | | 4,875,832 | | |
| Communications Equipment Total | | | 4,875,832 | | |
| Computers & Peripherals – 5.4% | |
| Apple, Inc. (a) | | | 51,500 | | | | 9,546,555 | | |
| EMC Corp. (a) | | | 168,600 | | | | 2,872,944 | | |
| Hewlett-Packard Co. | | | 201,900 | | | | 9,531,699 | | |
| Computers & Peripherals Total | | | 21,951,198 | | |
| Electronic Equipment, Instruments & Components – 1.3% | |
| Corning, Inc. | | | 342,500 | | | | 5,243,675 | | |
Electronic Equipment, Instruments &
Components Total | | | 5,243,675 | | |
| Internet Software & Services – 3.8% | |
| Google, Inc., Class A (a) | | | 20,300 | | | | 10,065,755 | | |
| IAC/InterActiveCorp (a) | | | 257,300 | | | | 5,194,887 | | |
| Internet Software & Services Total | | | 15,260,642 | | |
| IT Services – 3.6% | |
| MasterCard, Inc., Class A | | | 25,000 | | | | 5,053,750 | | |
| Visa, Inc., Class A | | | 26,500 | | | | 1,831,415 | | |
| Western Union Co. | | | 391,885 | | | | 7,414,464 | | |
| IT Services Total | | | 14,299,629 | | |
| Semiconductors & Semiconductor Equipment – 1.2% | |
| Atmel Corp. (a) | | | 589,500 | | | | 2,470,005 | | |
| Marvell Technology Group Ltd. (a) | | | 157,500 | | | | 2,549,925 | | |
Semiconductors & Semiconductor
Equipment Total | | | 5,019,930 | | |
| Software – 4.1% | |
| Autodesk, Inc. (a) | | | 155,900 | | | | 3,710,420 | | |
| Microsoft Corp. | | | 497,220 | | | | 12,873,026 | | |
| Software Total | | | 16,583,446 | | |
| Information Technology Total | | | 83,234,352 | | |
| Materials – 3.9% | |
| Chemicals – 1.3% | |
| Agrium, Inc. | | | 60,900 | | | | 3,032,211 | | |
| Potash Corp. of Saskatchewan, Inc. | | | 21,400 | | | | 1,933,276 | | |
| Chemicals Total | | | 4,965,487 | | |
See Accompanying Notes to Financial Statements.
57
Columbia Contrarian Core Fund
September 30, 2009
| Common Stocks (continued) | |
| | | Shares | | Value ($) | |
| Metals & Mining – 2.6% | |
ArcelorMittal, NY
Registered Shares | | | 79,087 | | | | 2,937,291 | | |
| Vale SA, ADR | | | 124,700 | | | | 2,884,311 | | |
| Walter Energy, Inc. | | | 79,200 | | | | 4,756,752 | | |
| Metals & Mining Total | | | 10,578,354 | | |
| Materials Total | | | 15,543,841 | | |
| Telecommunication Services – 2.3% | |
| Diversified Telecommunication Services – 1.2% | |
| Verizon Communications, Inc. | | | 160,700 | | | | 4,864,389 | | |
| Diversified Telecommunication Services Total | | | 4,864,389 | | |
| Wireless Telecommunication Services – 1.1% | |
Millicom International
Cellular SA (a) | | | 62,700 | | | | 4,560,798 | | |
| Wireless Telecommunication Services Total | | | 4,560,798 | | |
| Telecommunication Services Total | | | 9,425,187 | | |
| Utilities – 1.0% | |
| Independent Power Producers & Energy Traders – 1.0% | |
| AES Corp. (a) | | | 273,800 | | | | 4,057,716 | | |
Independent Power Producers & Energy
Traders Total | | | 4,057,716 | | |
| Utilities Total | | | 4,057,716 | | |
Total Common Stocks
(cost of $321,233,836) | | | 396,410,726 | | |
| Short-Term Obligation – 1.5% | |
| | | Par ($) | | | |
Repurchase agreement with
Fixed Income Clearing Corp.,
dated 09/30/09, due 10/01/09
at 0.010%, collateralized by a
U.S. Treasury obligation
maturing 01/31/14, market
value $6,152,850 (repurchase
proceeds $6,031,002) | | | 6,031,000 | | | | 6,031,000 | | |
Total Short-Term Obligation
(cost of $6,031,000) | | | 6,031,000 | | |
Total Investments – 99.8%
(cost of $327,264,836) (b) | | | 402,441,726 | | |
| Other Assets & Liabilities, Net – 0.2% | | | 957,670 | | |
| Net Assets – 100.0% | | | 403,399,396 | | |
Notes to Investment Portfolio:
(a) Non-income producing security.
(b) Cost for federal income tax purposes is $331,571,123.
The following table summarizes the inputs used, as of September 30, 2009 in valuing the Fund's assets:
| Description | | Quoted Prices
(Level 1) | | Other
Significant
Observable
Inputs
(Level 2) | | Significant
Unobservable
Inputs
(Level 3) | | Total | |
| Common Stocks | |
Consumer
Discretionary | | $ | 43,759,669 | | | $ | — | | | $ | — | | | $ | 43,759,669 | | |
| Consumer Staples | | | 37,003,829 | | | | — | | | | — | | | | 37,003,829 | | |
| Energy | | | 52,594,023 | | | | — | | | | — | | | | 52,594,023 | | |
| Financials | | | 72,974,014 | | | | — | | | | — | | | | 72,974,014 | | |
| Health Care | | | 47,176,003 | | | | — | | | | — | | | | 47,176,003 | | |
| Industrials | | | 30,642,092 | | | | — | | | | — | | | | 30,642,092 | | |
Information
Technology | | | 83,234,352 | | | | — | | | | — | | | | 83,234,352 | | |
| Materials | | | 15,543,841 | | | | — | | | | — | | | | 15,543,841 | | |
Telecommunication
Services | | | 9,425,187 | | | | — | | | | — | | | | 9,425,187 | | |
| Utilities | | | 4,057,716 | | | | — | | | | — | | | | 4,057,716 | | |
| Total Common Stocks | | | 396,410,726 | | | | — | | | | — | | | | 396,410,726 | | |
Total Short-Term
Obligation | | | — | | | | 6,031,000 | | | | — | | | | 6,031,000 | | |
| Total Investments | | $ | 396,410,726 | | | $ | 6,031,000 | | | $ | — | | | $ | 402,441,726 | | |
For more information on valuation inputs, and their aggregation into the levels used in the table above, please refer to the Security Valuation section in the accompanying Notes to Financial Statements.
At September 30, 2009, the Fund held investments in the following sectors:
| Sector (Unaudited) | | % of
Net Assets | |
| Information Technology | | | 20.6 | | |
| Financials | | | 18.1 | | |
| Energy | | | 13.0 | | |
| Health Care | | | 11.7 | | |
| Consumer Discretionary | | | 10.9 | | |
| Consumer Staples | | | 9.2 | | |
| Industrials | | | 7.6 | | |
| Materials | | | 3.9 | | |
| Telecommunication Services | | | 2.3 | | |
| Utilities | | | 1.0 | | |
| | | | 98.3 | | |
| Short Term Obligation | | | 1.5 | | |
| Other Assets & Liabilities, Net | | | 0.2 | | |
| | | | 100.0 | | |
| Acronym | | Name | |
| ADR | | American Depositary Receipt | |
|
See Accompanying Notes to Financial Statements.
58
Investment Portfolio – Columbia Small Cap Core Fund
September 30, 2009
| Common Stocks – 96.8% | |
| | | Shares | | Value ($) | |
| Consumer Discretionary – 11.6% | |
| Auto Components – 1.4% | |
| Cooper Tire & Rubber Co. | | | 213,096 | | | | 3,746,228 | | |
| Dorman Products, Inc. (a) | | | 219,075 | | | | 3,290,506 | | |
| Hawk Corp., Class A (a) | | | 26,596 | | | | 364,897 | | |
| Auto Components Total | | | 7,401,631 | | |
| Diversified Consumer Services – 0.8% | |
Nobel Learning
Communities, Inc. (a) | | | 165,966 | | | | 1,556,761 | | |
| Regis Corp. | | | 192,320 | | | | 2,980,960 | | |
| Diversified Consumer Services Total | | | 4,537,721 | | |
| Hotels, Restaurants & Leisure – 1.4% | |
| CEC Entertainment, Inc. (a) | | | 166,007 | | | | 4,292,941 | | |
| Morgans Hotel Group Co. (a) | | | 204,831 | | | | 1,110,184 | | |
| O'Charleys, Inc. (a) | | | 240,062 | | | | 2,249,381 | | |
| Hotels, Restaurants & Leisure Total | | | 7,652,506 | | |
| Household Durables – 0.3% | |
| Jarden Corp. | | | 64,092 | | | | 1,799,063 | | |
| Household Durables Total | | | 1,799,063 | | |
| Leisure Equipment & Products – 1.1% | |
| Callaway Golf Co. | | | 222,847 | | | | 1,695,865 | | |
| RC2 Corp. (a) | | | 172,447 | | | | 2,457,370 | | |
Steinway Musical
Instruments, Inc. (a) | | | 147,764 | | | | 1,753,959 | | |
| Leisure Equipment & Products Total | | | 5,907,194 | | |
| Media – 0.8% | |
| John Wiley & Sons, Inc., Class A | | | 69,500 | | | | 2,417,210 | | |
| Scholastic Corp. | | | 83,986 | | | | 2,044,219 | | |
| Media Total | | | 4,461,429 | | |
| Specialty Retail – 3.9% | |
| Buckle, Inc. | | | 91,331 | | | | 3,118,041 | | |
| Collective Brands, Inc. (a) | | | 280,307 | | | | 4,857,720 | | |
| Monro Muffler Brake, Inc. | | | 128,105 | | | | 4,072,458 | | |
| Penske Auto Group, Inc. | | | 66,500 | | | | 1,275,470 | | |
| Rent-A-Center, Inc. (a) | | | 225,282 | | | | 4,253,324 | | |
| Stage Stores, Inc. | | | 302,028 | | | | 3,914,283 | | |
| Specialty Retail Total | | | 21,491,296 | | |
| Textiles, Apparel & Luxury Goods – 1.9% | |
| Rocky Brands, Inc. (a) | | | 107,199 | | | | 661,418 | | |
| Unifirst Corp. (b) | | | 213,819 | | | | 9,504,254 | | |
| Textiles, Apparel & Luxury Goods Total | | | 10,165,672 | | |
| Consumer Discretionary Total | | | 63,416,512 | | |
| | | Shares | | Value ($) | |
| Consumer Staples – 1.8% | |
| Food & Staples Retailing – 0.9% | |
| Casey's General Stores, Inc. | | | 82,451 | | | | 2,587,312 | | |
| Pantry, Inc. (a) | | | 141,116 | | | | 2,212,699 | | |
| Food & Staples Retailing Total | | | 4,800,011 | | |
| Food Products – 0.6% | |
| Corn Products International, Inc. | | | 115,401 | | | | 3,291,236 | | |
| Food Products Total | | | 3,291,236 | | |
| Household Products – 0.3% | |
| Central Garden & Pet Co. (a) | | | 57,183 | | | | 671,900 | | |
Central Garden & Pet Co.,
Class A (a) | | | 115,566 | | | | 1,263,137 | | |
| Household Products Total | | | 1,935,037 | | |
| Consumer Staples Total | | | 10,026,284 | | |
| Energy – 3.0% | |
| Energy Equipment & Services – 2.3% | |
| Gulfmark Offshore, Inc. (a) | | | 114,691 | | | | 3,754,983 | | |
| Newpark Resources, Inc. (a) | | | 415,440 | | | | 1,333,563 | | |
| Oceaneering International, Inc. (a) | | | 36,570 | | | | 2,075,348 | | |
| Superior Well Services, Inc. (a) | | | 82,380 | | | | 797,438 | | |
| Tetra Technologies, Inc. (a) | | | 508,281 | | | | 4,925,243 | | |
| Energy Equipment & Services Total | | | 12,886,575 | | |
| Oil, Gas & Consumable Fuels – 0.7% | |
| EXCO Resources, Inc. (a) | | | 157,187 | | | | 2,937,825 | | |
| GeoMet, Inc. (a) | | | 113,417 | | | | 191,675 | | |
| Petroquest Energy, Inc. (a) | | | 83,354 | | | | 540,967 | | |
| Oil, Gas & Consumable Fuels Total | | | 3,670,467 | | |
| Energy Total | | | 16,557,042 | | |
| Financials – 10.6% | |
| Capital Markets – 0.5% | |
Waddell & Reed Financial, Inc.,
Class A | | | 86,607 | | | | 2,463,969 | | |
| Capital Markets Total | | | 2,463,969 | | |
| Commercial Banks – 2.9% | |
Boston Private Financial
Holdings, Inc. | | | 46,950 | | | | 305,644 | | |
| Centerstate Banks, Inc. | | | 261,060 | | | | 2,059,763 | | |
| Encore Bancshares, Inc. (a) | | | 22,025 | | | | 198,005 | | |
| Iberiabank Corp. | | | 51,901 | | | | 2,364,610 | | |
| Oriental Financial Group | | | 277,309 | | | | 3,521,824 | | |
| SCBT Financial Corp. | | | 97,436 | | | | 2,737,952 | | |
| Taylor Capital Group, Inc. (a) | | | 195,582 | | | | 1,290,841 | | |
See Accompanying Notes to Financial Statements.
59
Columbia Small Cap Core Fund
September 30, 2009
| Common Stocks (continued) | |
| | | Shares | | Value ($) | |
| Union Bankshares Corp. | | | 121,924 | | | | 1,517,954 | | |
| Webster Financial Corp. | | | 156,870 | | | | 1,956,169 | | |
| Commercial Banks Total | | | 15,952,762 | | |
| Consumer Finance – 0.6% | |
| Cash America International, Inc. | | | 69,700 | | | | 2,102,152 | | |
| QC Holdings, Inc. | | | 177,170 | | | | 1,195,897 | | |
| Consumer Finance Total | | | 3,298,049 | | |
| Insurance – 2.6% | |
| Arthur J. Gallagher & Co. | | | 49,900 | | | | 1,216,063 | | |
Delphi Financial Group, Inc.,
Class A | | | 94,100 | | | | 2,129,483 | | |
| First Mercury Financial Corp. | | | 206,217 | | | | 2,746,810 | | |
| Horace Mann Educators Corp. | | | 208,017 | | | | 2,905,998 | | |
| National Interstate Corp. | | | 72,821 | | | | 1,274,368 | | |
| NYMAGIC, Inc. | | | 79,543 | | | | 1,372,912 | | |
| State Auto Financial Corp. | | | 143,254 | | | | 2,568,544 | | |
| Insurance Total | | | 14,214,178 | | |
| Real Estate Investment Trusts (REITs) – 2.6% | |
| Acadia Realty Trust | | | 150,596 | | | | 2,269,482 | | |
American Campus
Communities, Inc. | | | 97,932 | | | | 2,629,474 | | |
| DiamondRock Hospitality Co. (a) | | | 258,924 | | | | 2,097,284 | | |
| DuPont Fabros Technology, Inc. (a) | | | 139,800 | | | | 1,863,534 | | |
| First Potomac Realty Trust | | | 239,848 | | | | 2,772,643 | | |
| Mack-Cali Realty Corp. | | | 52,200 | | | | 1,687,626 | | |
| Sunstone Hotel Investors, Inc. (a) | | | 81,359 | | | | 577,649 | | |
| Real Estate Investment Trusts (REITs) Total | | | 13,897,692 | | |
| Thrifts & Mortgage Finance – 1.4% | |
| Abington Bancorp, Inc. | | | 176,921 | | | | 1,369,369 | | |
| Dime Community Bancshares | | | 163,167 | | | | 1,864,999 | | |
| First Niagara Financial Group, Inc. | | | 100,759 | | | | 1,242,358 | | |
| Jefferson Bancshares, Inc. | | | 219,422 | | | | 1,134,412 | | |
| NewAlliance Bancshares, Inc. | | | 196,389 | | | | 2,101,362 | | |
| Thrifts & Mortgage Finance Total | | | 7,712,500 | | |
| Financials Total | | | 57,539,150 | | |
| Health Care – 16.2% | |
| Biotechnology – 0.3% | |
| BioMarin Pharmaceuticals, Inc. (a) | | | 81,841 | | | | 1,479,685 | | |
| Biotechnology Total | | | 1,479,685 | | |
| Health Care Equipment & Supplies – 5.5% | |
| Analogic Corp. | | | 148,606 | | | | 5,501,394 | | |
| Cooper Companies, Inc. | | | 142,174 | | | | 4,226,833 | | |
| Greatbatch, Inc. (a) | | | 79,953 | | | | 1,796,544 | | |
| Invacare Corp. | | | 304,951 | | | | 6,794,308 | | |
| | | Shares | | Value ($) | |
| STAAR Surgical Co. (a) | | | 989,667 | | | | 4,037,841 | | |
| Symmetry Medical, Inc. (a) | | | 218,558 | | | | 2,266,447 | | |
| Thoratec Corp. (a) | | | 62,287 | | | | 1,885,428 | | |
| West Pharmaceutical Services, Inc. | | | 84,740 | | | | 3,441,291 | | |
| Health Care Equipment & Supplies Total | | | 29,950,086 | | |
| Health Care Providers & Services – 6.8% | |
| Air Methods Corp. (a) | | | 116,629 | | | | 3,798,606 | | |
| LifePoint Hospitals, Inc. (a) | | | 149,095 | | | | 4,034,511 | | |
| Magellan Health Services, Inc. (a) | | | 81,426 | | | | 2,529,092 | | |
| Owens & Minor, Inc. | | | 60,752 | | | | 2,749,028 | | |
| Providence Service Corp. (a) | | | 351,805 | | | | 4,102,046 | | |
| PSS World Medical, Inc. (a) | | | 143,202 | | | | 3,126,100 | | |
| Psychiatric Solutions, Inc. (a) | | | 161,545 | | | | 4,322,944 | | |
| Res-Care, Inc. (a) | | | 739,384 | | | | 10,506,647 | | |
| U.S. Physical Therapy, Inc. (a) | | | 149,407 | | | | 2,251,563 | | |
| Health Care Providers & Services Total | | | 37,420,537 | | |
| Life Sciences Tools & Services – 1.3% | |
| Cambrex Corp. (a) | | | 435,103 | | | | 2,741,149 | | |
| Varian, Inc. (a) | | | 86,981 | | | | 4,441,250 | | |
| Life Sciences Tools & Services Total | | | 7,182,399 | | |
| Pharmaceuticals – 2.3% | |
| Hi-Tech Pharmacal Co., Inc. (a) | | | 168,865 | | | | 3,789,331 | | |
| Obagi Medical Products, Inc. (a) | | | 395,931 | | | | 4,592,799 | | |
Valeant Pharmaceuticals
International (a) | | | 142,910 | | | | 4,010,055 | | |
| Pharmaceuticals Total | | | 12,392,185 | | |
| Health Care Total | | | 88,424,892 | | |
| Industrials – 20.1% | |
| Aerospace & Defense – 3.8% | |
| AAR Corp. (a) | | | 336,794 | | | | 7,389,260 | | |
American Science &
Engineering, Inc. | | | 51,300 | | | | 3,490,452 | | |
| Argon ST, Inc. (a) | | | 133,831 | | | | 2,549,481 | | |
| Ladish Co., Inc. (a) | | | 87,637 | | | | 1,325,948 | | |
| LMI Aerospace, Inc. (a) | | | 71,907 | | | | 721,227 | | |
| Moog, Inc., Class A (a) | | | 176,441 | | | | 5,205,009 | | |
| Aerospace & Defense Total | | | 20,681,377 | | |
| Air Freight & Logistics – 0.1% | |
| Pacer International, Inc. | | | 169,838 | | | | 655,575 | | |
| Air Freight & Logistics Total | | | 655,575 | | |
| Building Products – 0.2% | |
| NCI Building Systems, Inc. (a) | | | 265,479 | | | | 849,533 | | |
| Building Products Total | | | 849,533 | | |
See Accompanying Notes to Financial Statements.
60
Columbia Small Cap Core Fund
September 30, 2009
| Common Stocks (continued) | |
| | | Shares | | Value ($) | |
| Commercial Services & Supplies – 1.0% | |
| Consolidated Graphics, Inc. (a) | | | 100,444 | | | | 2,506,078 | | |
| McGrath Rentcorp | | | 147,897 | | | | 3,145,769 | | |
| Commercial Services & Supplies Total | | | 5,651,847 | | |
| Construction & Engineering – 2.8% | |
| EMCOR Group, Inc. (a) | | | 293,068 | | | | 7,420,482 | | |
| MasTec, Inc. (a) | | | 261,828 | | | | 3,181,210 | | |
| Northwest Pipe Co. (a) | | | 93,981 | | | | 3,151,183 | | |
| Sterling Construction Co., Inc. (a) | | | 97,162 | | | | 1,740,171 | | |
| Construction & Engineering Total | | | 15,493,046 | | |
| Electrical Equipment – 2.9% | |
| AZZ, Inc. (a) | | | 23,522 | | | | 944,879 | | |
| Baldor Electric Co. | | | 78,754 | | | | 2,153,134 | | |
| BTU International, Inc. (a) | | | 277,842 | | | | 1,711,507 | | |
| GrafTech International Ltd. (a) | | | 238,946 | | | | 3,512,506 | | |
| LaBarge, Inc. (a) | | | 103,500 | | | | 1,164,375 | | |
| LSI Industries, Inc. | | | 471,588 | | | | 3,136,060 | | |
| Powell Industries, Inc. (a) | | | 78,251 | | | | 3,004,056 | | |
| Electrical Equipment Total | | | 15,626,517 | | |
| Industrial Conglomerates – 0.4% | |
| Otter Tail Corp. | | | 81,900 | | | | 1,959,867 | | |
| Industrial Conglomerates Total | | | 1,959,867 | | |
| Machinery – 2.7% | |
Albany International Corp.,
Class A | | | 162,464 | | | | 3,151,802 | | |
| Flanders Corp. (a) | | | 476,926 | | | | 2,460,938 | | |
| Key Technology, Inc. (a)(b) | | | 175,893 | | | | 1,890,850 | | |
| Miller Industries, Inc. (a) | | | 150,482 | | | | 1,655,302 | | |
| Nordson Corp. | | | 41,764 | | | | 2,342,543 | | |
| Tennant Co. | | | 116,409 | | | | 3,382,845 | | |
| Machinery Total | | | 14,884,280 | | |
| Professional Services – 3.7% | |
| FTI Consulting, Inc. (a) | | | 105,562 | | | | 4,497,997 | | |
| Kforce, Inc. (a) | | | 727,637 | | | | 8,746,197 | | |
| MPS Group, Inc. (a) | | | 175,282 | | | | 1,843,967 | | |
| Navigant Consulting, Inc. (a) | | | 180,378 | | | | 2,435,103 | | |
| Spherion Corp. (a) | | | 427,145 | | | | 2,652,570 | | |
| Professional Services Total | | | 20,175,834 | | |
| Road & Rail – 1.1% | |
| Arkansas Best Corp. | | | 28,192 | | | | 844,069 | | |
| Frozen Food Express Industries | | | 132,197 | | | | 387,337 | | |
| Kansas City Southern (a) | | | 92,015 | | | | 2,437,477 | | |
| Werner Enterprises, Inc. | | | 120,809 | | | | 2,250,672 | | |
| Road & Rail Total | | | 5,919,555 | | |
| | | Shares | | Value ($) | |
| Trading Companies & Distributors – 1.4% | |
| Kaman Corp. | | | 130,695 | | | | 2,872,676 | | |
| Rush Enterprises, Inc., Class A (a) | | | 120,130 | | | | 1,552,080 | | |
| Rush Enterprises, Inc., Class B (a) | | | 159,851 | | | | 1,740,777 | | |
| Titan Machinery, Inc. (a) | | | 104,200 | | | | 1,304,584 | | |
| Trading Companies & Distributors Total | | | 7,470,117 | | |
| Industrials Total | | | 109,367,548 | | |
| Information Technology – 25.2% | |
| Communications Equipment – 1.8% | |
| ADC Telecommunications, Inc. (a) | | | 269,170 | | | | 2,244,878 | | |
| Adtran, Inc. | | | 146,346 | | | | 3,592,794 | | |
| EMS Technologies, Inc. (a) | | | 35,100 | | | | 730,782 | | |
| Globecomm Systems, Inc. (a) | | | 217,539 | | | | 1,581,508 | | |
Performance
Technologies, Inc. (a)(b) | | | 619,141 | | | | 1,776,935 | | |
| Communications Equipment Total | | | 9,926,897 | | |
| Computers & Peripherals – 2.3% | |
| Avid Technology, Inc. (a) | | | 71,328 | | | | 1,005,012 | | |
| Hypercom Corp. (a) | | | 541,615 | | | | 1,679,007 | | |
| iGO, Inc. (a) | | | 428,053 | | | | 466,578 | | |
| Imation Corp. | | | 220,204 | | | | 2,041,291 | | |
| Presstek, Inc. (a) | | | 396,137 | | | | 835,849 | | |
| Rimage Corp. (a) | | | 235,461 | | | | 4,024,028 | | |
| STEC, Inc. (a) | | | 79,949 | | | | 2,349,701 | | |
| Computers & Peripherals Total | | | 12,401,466 | | |
| Electronic Equipment, Instruments & Components – 6.8% | |
| Benchmark Electronics, Inc. (a) | | | 947,100 | | | | 17,047,800 | | |
| FARO Technologies, Inc. (a) | | | 270,406 | | | | 4,645,575 | | |
| Gerber Scientific, Inc. (a) | | | 108,771 | | | | 650,451 | | |
| Keithley Instruments, Inc. | | | 246,594 | | | | 1,366,131 | | |
| LeCroy Corp. (a) | | | 122,148 | | | | 494,699 | | |
| Newport Corp. (a) | | | 270,756 | | | | 2,371,823 | | |
| NU Horizons Electronics Corp. (a) | | | 166,162 | | | | 658,001 | | |
| Plexus Corp. (a) | | | 220,132 | | | | 5,798,277 | | |
| Rogers Corp. (a) | | | 55,400 | | | | 1,660,338 | | |
| Technitrol, Inc. | | | 268,223 | | | | 2,470,334 | | |
Electronic Equipment, Instruments &
Components Total | | | 37,163,429 | | |
| Internet Software & Services – 1.2% | |
| EarthLink, Inc. | | | 708,940 | | | | 5,962,185 | | |
| Selectica, Inc. (a) | | | 1,431,470 | | | | 472,385 | | |
| Internet Software & Services Total | | | 6,434,570 | | |
| IT Services – 2.8% | |
| Analysts International Corp. (a) | | | 856,765 | | | | 616,871 | | |
| Computer Task Group, Inc. (a) | | | 663,206 | | | | 5,378,601 | | |
| infoGROUP, Inc. (a) | | | 394,307 | | | | 2,764,092 | | |
See Accompanying Notes to Financial Statements.
61
Columbia Small Cap Core Fund
September 30, 2009
| Common Stocks (continued) | |
| | | Shares | | Value ($) | |
| Integral Systems, Inc. (a) | | | 206,955 | | | | 1,427,989 | | |
| Startek, Inc. (a) | | | 114,054 | | | | 989,989 | | |
| TNS, Inc. (a) | | | 139,301 | | | | 3,816,847 | | |
| IT Services Total | | | 14,994,389 | | |
| Semiconductors & Semiconductor Equipment – 5.0% | |
| ATMI, Inc. (a) | | | 204,551 | | | | 3,712,601 | | |
| Cirrus Logic, Inc. (a) | | | 468,092 | | | | 2,602,591 | | |
| Exar Corp. (a) | | | 302,013 | | | | 2,219,796 | | |
Fairchild Semiconductor
International, Inc. (a) | | | 436,187 | | | | 4,462,193 | | |
| FEI Co. (a) | | | 50,900 | | | | 1,254,685 | | |
| International Rectifier Corp. (a) | | | 60,596 | | | | 1,181,016 | | |
| IXYS Corp. | | | 193,929 | | | | 1,650,336 | | |
| ON Semiconductor Corp. (a) | | | 639,506 | | | | 5,275,924 | | |
| Pericom Semiconductor Corp. (a) | | | 246,157 | | | | 2,414,800 | | |
| Ultratech, Inc. (a) | | | 194,130 | | | | 2,568,340 | | |
Semiconductors & Semiconductor
Equipment Total | | | 27,342,282 | | |
| Software – 5.3% | |
| Bottomline Technologies, Inc. (a) | | | 184,412 | | | | 2,378,915 | | |
| Epicor Software Corp. (a) | | | 310,023 | | | | 1,974,847 | | |
| Lawson Software, Inc. (a) | | | 520,925 | | | | 3,250,572 | | |
| Mentor Graphics Corp. (a) | | | 396,924 | | | | 3,695,362 | | |
| MSC.Software Corp. (a) | | | 170,802 | | | | 1,436,445 | | |
| PLATO Learning, Inc. (a) | | | 262,046 | | | | 1,132,039 | | |
| Progress Software Corp. (a) | | | 288,290 | | | | 6,529,768 | | |
| S1 Corp. (a) | | | 324,260 | | | | 2,003,927 | | |
| Sonic Solutions (a) | | | 248,744 | | | | 1,475,052 | | |
| Sybase, Inc. (a) | | | 132,887 | | | | 5,169,304 | | |
| Software Total | | | 29,046,231 | | |
| Information Technology Total | | | 137,309,264 | | |
| Materials – 5.0% | |
| Chemicals – 3.7% | |
| H.B. Fuller Co. | | | 366,114 | | | | 7,651,783 | | |
| Sensient Technologies Corp. | | | 281,086 | | | | 7,805,758 | | |
| Spartech Corp. | | | 446,607 | | | | 4,809,957 | | |
| Chemicals Total | | | 20,267,498 | | |
| Containers & Packaging – 0.8% | |
| Greif, Inc., Class A | | | 73,190 | | | | 4,029,109 | | |
| Containers & Packaging Total | | | 4,029,109 | | |
| Paper & Forest Products – 0.5% | |
| Glatfelter Co. | | | 237,822 | | | | 2,730,197 | | |
| Paper & Forest Products Total | | | 2,730,197 | | |
| Materials Total | | | 27,026,804 | | |
| | | Shares | | Value ($) | |
| Telecommunication Services – 0.3% | |
| Diversified Telecommunication Services – 0.3% | |
General Communication, Inc.,
Class A (a) | | | 197,142 | | | | 1,352,394 | | |
| Diversified Telecommunication Services Total | | | 1,352,394 | | |
| Telecommunication Services Total | | | 1,352,394 | | |
| Utilities – 3.0% | |
| Electric Utilities – 0.3% | |
| ALLETE, Inc. | | | 42,300 | | | | 1,420,011 | | |
| Electric Utilities Total | | | 1,420,011 | | |
| Gas Utilities – 1.6% | |
| New Jersey Resources Corp. | | | 96,499 | | | | 3,503,879 | | |
| Northwest Natural Gas Co. | | | 36,786 | | | | 1,532,505 | | |
| South Jersey Industries, Inc. | | | 108,890 | | | | 3,843,817 | | |
| Gas Utilities Total | | | 8,880,201 | | |
| Water Utilities – 1.1% | |
| American States Water Co. | | | 114,859 | | | | 4,155,598 | | |
| California Water Service Group | | | 52,873 | | | | 2,058,875 | | |
| Water Utilities Total | | | 6,214,473 | | |
| Utilities Total | | | 16,514,685 | | |
Total Common Stocks
(cost of $555,108,353) | | | 527,534,575 | | |
| Short-Term Obligation – 3.2% | |
| | | Par ($) | | | |
Repurchase agreement with
Fixed Income Clearing Corp.,
dated 09/30/09, due 10/01/09
at 0.010%, collateralized by a
U.S. Treasury obligation
maturing 01/31/14, market
value $17,676,450 (repurchase
proceeds $17,329,005) | | | 17,329,000 | | | | 17,329,000 | | |
Total Short-Term Obligation
(cost of $17,329,000) | | | 17,329,000 | | |
Total Investments – 100.0%
(cost of $572,437,353) (c) | | | 544,863,575 | | |
| Other Assets & Liabilities, Net – 0.0% | | | 227,062 | | |
| Net Assets – 100.0% | | | 545,090,637 | | |
See Accompanying Notes to Financial Statements.
62
Columbia Small Cap Core Fund
September 30, 2009
Notes to Investment Portfolio:
(a) Non-income producing security.
(b) An affiliate may include any company in which the fund owns five percent or more of its outstanding voting shares. Transactions with companies which are or were affiliates during the year ended September 30, 2009, are as follows:
| Security name: Key Technology, Inc. | |
| Shares as of 09/30/08: | | | 150,933 | | |
| Shares purchased: | | | 24,960 | | |
| Shares sold: | | | – | | |
| Shares as of 09/30/09: | | | 175,893 | | |
| Dividend income earned: | | $ | – | | |
| Value at end of period: | | $ | – | | |
| Security name: Performance Technologies, Inc. | |
| Shares as of 09/30/08: | | | 619,141 | | |
| Shares purchased: | | | – | | |
| Shares sold: | | | – | | |
| Shares as of 09/30/09: | | | 619,141 | | |
| Dividend income earned: | | $ | – | | |
| Value at end of period: | | $ | 1,776,935 | | |
| Security name: Unifirst Corp. | |
| Shares as of 09/30/08: | | | 212,019 | | |
| Shares purchased: | | | 16,900 | | |
| Shares sold: | | | (15,100 | ) | |
| Shares as of 09/30/09: | | | 213,819 | | |
| Dividend income earned: | | $ | 32,571 | | |
| Value at end of period: | | $ | – | | |
(c) Cost for federal income tax purposes is $573,479,311.
The following table summarizes the inputs used, as of September 30, 2009 in valuing the Fund's assets:
| Description | | Quoted Prices
(Level 1) | | Other
Significant
Observable
Inputs
(Level 2) | | Significant
Unobservable
Inputs
(Level 3) | | Total | |
| Common Stocks | |
Consumer
Discretionary | | $ | 63,416,512 | | | $ | — | | | $ | — | | | $ | 63,416,512 | | |
| Consumer Staples | | | 10,026,284 | | | | — | | | | — | | | | 10,026,284 | | |
| Energy | | | 16,557,042 | | | | — | | | | — | | | | 16,557,042 | | |
| Financials | | | 57,539,150 | | | | — | | | | — | | | | 57,539,150 | | |
| Health Care | | | 88,424,892 | | | | — | | | | — | | | | 88,424,892 | | |
| Industrials | | | 109,367,548 | | | | — | | | | — | | | | 109,367,548 | | |
Information
Technology | | | 137,309,264 | | | | — | | | | — | | | | 137,309,264 | | |
| Materials | | | 27,026,804 | | | | — | | | | — | | | | 27,026,804 | | |
Telecommunication
Services | | | 1,352,394 | | | | — | | | | — | | | | 1,352,394 | | |
| Utilities | | | 16,514,685 | | | | — | | | | — | | | | 16,514,685 | | |
| Total Common Stocks | | | 527,534,575 | | | | — | | | | — | | | | 527,534,575 | | |
Total Short-Term
Obligation | | | — | | | | 17,329,000 | | | | — | | | | 17,329,000 | | |
| Total Investments | | $ | 527,534,575 | | | $ | 17,329,000 | | | $ | — | | | $ | 544,863,575 | | |
For more information on valuation inputs, and their aggregation into the levels used in the table above, please refer to the Security Valuation section in the accompanying Notes to Financial Statements.
At September 30, 2009, the Fund held investments in the following sectors:
| Sector (Unaudited) | | % of
Net Assets | |
| Information Technology | | | 25.2 | | |
| Industrials | | | 20.1 | | |
| Health Care | | | 16.2 | | |
| Consumer Discretionary | | | 11.6 | | |
| Financials | | | 10.6 | | |
| Materials | | | 5.0 | | |
| Energy | | | 3.0 | | |
| Utilities | | | 3.0 | | |
| Consumer Staples | | | 1.8 | | |
| Telecommunication Services | | | 0.3 | | |
| | | | 96.8 | | |
| Short Term Obligation | | | 3.2 | | |
| Other Assets & Liabilities, Net | | | 0.0 | * | |
| | | | 100.0 | | |
* Round to less than 0.1%.
See Accompanying Notes to Financial Statements.
63
Statements of Assets and Liabilities – Stock Funds
September 30, 2009
| | | ($) | | ($) | | ($) | | ($) | | ($) | |
| | | Columbia
Asset
Allocation Fund | | Columbia
Large Cap
Growth Fund | | Columbia
Disciplined
Value Fund | | Columbia
Contrarian
Core Fund | | Columbia
Small Cap
Core Fund | |
| Assets | |
| Unaffiliated investments, at identified cost | | | 200,342,491 | | | | 1,082,273,522 | | | | 258,366,287 | | | | 327,264,836 | | | | 567,024,121 | | |
| Affiliated investments, at identified cost | | | 349,510 | | | | — | | | | — | | | | — | | | | 5,413,232 | | |
| Total investments, at identified cost | | | 200,692,001 | | | | 1,082,273,522 | | | | 258,366,287 | | | | 327,264,836 | | | | 572,437,353 | | |
| Unaffiliated investments, at value | | | 221,181,512 | | | | 1,304,524,576 | | | | 307,442,782 | | | | 402,441,726 | | | | 543,086,640 | | |
| Affiliated investments, at value | | | 373,270 | | | | — | | | | — | | | | — | | | | 1,776,935 | | |
| Total investments, at value | | | 221,554,782 | | | | 1,304,524,576 | | | | 307,442,782 | | | | 402,441,726 | | | | 544,863,575 | | |
| Cash | | | — | | | | 501 | | | | 871 | | | | 190 | | | | 996 | | |
| Cash collateral for open futures contracts | | | 965,000 | | | | — | | | | — | | | | — | | | | — | | |
Foreign currency (cost of $11,509,
$—, $—, $— and $—, respectively) | | | 11,578 | | | | — | | | | — | | | | — | | | | — | | |
Unrealized appreciation on forward foreign
currency exchange contracts | | | 201,991 | | | | — | | | | — | | | | — | | | | — | | |
| Receivable for: | |
| Investments sold | | | 12,918,954 | | | | 19,081,941 | | | | 15,390,071 | | | | 214,866 | | | | 2,939,930 | | |
| Fund shares sold | | | 46,896 | | | | 401,597 | | | | 267,392 | | | | 5,051,633 | | | | 631,186 | | |
| Dividends | | | 192,652 | | | | 1,151,894 | | | | 305,315 | | | | 431,288 | | | | 246,967 | | |
| Interest | | | 803,212 | | | | — | * | | | 1 | | | | 2 | | | | 5 | | |
| Foreign tax reclaims | | | 56,547 | | | | — | | | | — | | | | — | | | | — | | |
| Futures variation margin | | | 218 | | | | — | | | | — | | | | — | | | | — | | |
Expense reimbursement due
from investment advisor | | | 89,508 | | | | — | | | | — | | | | 10,685 | | | | — | | |
| Regulatory settlements | | | — | | | | 1,078,511 | | | | — | | | | — | | | | — | | |
| Trustees' deferred compensation plan | | | 44,980 | | | | 181,486 | | | | 43,677 | | | | 48,287 | | | | 79,431 | | |
| Prepaid expenses | | | 1,717 | | | | 9,989 | | | | 2,379 | | | | 2,306 | | | | 4,607 | | |
| Total Assets | | | 236,888,035 | | | | 1,326,430,495 | | | | 323,452,488 | | | | 408,200,983 | | | | 548,766,697 | | |
| Liabilities | |
| Payable to custodian bank | | | 1,043,447 | | | | — | | | | — | | | | — | | | | — | | |
Unrealized depreciation on forward foreign
currency exchange contracts | | | 119,406 | | | | — | | | | — | | | | — | | | | — | | |
| Payable for: | |
| Investments purchased | | | 8,132,989 | | | | 19,258,633 | | | | 13,432,899 | | | | 4,078,925 | | | | 1,698,131 | | |
Investments purchased on a delayed
delivery basis | | | 3,189,822 | | | | — | | | | — | | | | — | | | | — | | |
| Fund shares repurchased | | | 134,845 | | | | 1,826,548 | | | | 3,585,984 | | | | 264,898 | | | | 1,137,670 | | |
| Futures variation margin | | | 8,459 | | | | — | | | | 12,179 | | | | — | | | | — | | |
| Investment advisory fee | | | 121,317 | | | | 550,502 | | | | 175,952 | | | | 221,537 | | | | 343,435 | | |
| Administration fee | | | 12,505 | | | | 53,154 | | | | 16,860 | | | | 21,204 | | | | 31,192 | | |
| Pricing and bookkeeping fees | | | 15,465 | | | | 11,903 | | | | 7,148 | | | | 7,017 | | | | 8,890 | | |
| Transfer agent fee | | | 49,652 | | | | 275,454 | | | | 123,951 | | | | 51,744 | | | | 169,077 | | |
| Trustees' fees | | | 2,155 | | | | 216 | | | | 276 | | | | 1,436 | | | | 4,684 | | |
| Audit fee | | | 41,675 | | | | 31,300 | | | | 28,100 | | | | 32,700 | | | | 30,692 | | |
| Custody fee | | | 37,614 | | | | 5,205 | | | | 1,545 | | | | 2,825 | | | | 2,232 | | |
| Distribution and service fees | | | 35,923 | | | | 103,952 | | | | 23,269 | | | | 41,112 | | | | 65,877 | | |
| Chief compliance officer expenses | | | 189 | | | | 219 | | | | 168 | | | | 170 | | | | 164 | | |
| Interest payable | | | — | | | | 22 | | | | — | | | | — | | | | — | | |
| Trustees' deferred compensation plan | | | 44,980 | | | | 181,486 | | | | 43,677 | | | | 48,287 | | | | 79,431 | | |
| Other liabilities | | | 58,796 | | | | 118,435 | | | | 22,295 | | | | 29,732 | | | | 104,585 | | |
| Total Liabilities | | | 13,049,239 | | | | 22,417,029 | | | | 17,474,303 | | | | 4,801,587 | | | | 3,676,060 | | |
| Net Assets | | | 223,838,796 | | | | 1,304,013,466 | | | | 305,978,185 | | | | 403,399,396 | | | | 545,090,637 | | |
| Net Assets Consist of | |
| Paid-in capital | | | 248,102,061 | | | | 1,554,538,704 | | | | 406,740,389 | | | | 363,510,811 | | | | 604,420,990 | | |
Undistributed (Overdistributed)
net investment income | | | 266,974 | | | | 6,455,976 | | | | 53,837 | | | | 1,963,211 | | | | (85,558 | ) | |
| Accumulated net realized loss | | | (45,534,924 | ) | | | (479,232,268 | ) | | | (149,920,454 | ) | | | (37,251,553 | ) | | | (31,671,017 | ) | |
| Net unrealized appreciation (depreciation) on: | |
| Investments | | | 20,862,781 | | | | 222,251,054 | | | | 49,076,495 | | | | 75,176,890 | | | | (27,573,778 | ) | |
| Foreign currency translations | | | 89,029 | | | | — | | | | — | | | | 37 | | | | — | | |
| Futures contracts | | | 52,875 | | | | — | | | | 27,918 | | | | — | | | | — | | |
| Net Assets | | | 223,838,796 | | | | 1,304,013,466 | | | | 305,978,185 | | | | 403,399,396 | | | | 545,090,637 | | |
* Rounds to less than $1.00.
See Accompanying Notes to Financial Statements.
64
Statements of Assets and Liabilities (continued) – Stock Funds
September 30, 2009
| | | Columbia
Asset
Allocation Fund | | Columbia
Large Cap
Growth Fund | | Columbia
Disciplined
Value Fund | | Columbia
Contrarian
Core Fund | | Columbia
Small Cap
Core Fund | |
| Class A | |
| Net assets | | $ | 7,832,662 | | | $ | 145,825,417 | | | $ | 10,543,493 | | | $ | 27,741,982 | | | $ | 81,473,887 | | |
| Shares outstanding | | | 621,192 | | | | 7,770,280 | | | | 1,108,080 | | | | 2,358,503 | | | | 7,033,906 | | |
| Net asset value per share (a) | | $ | 12.61 | | | $ | 18.77 | | | $ | 9.52 | | | $ | 11.76 | | | $ | 11.58 | | |
| Maximum sales charge | | | 5.75 | % | | | 5.75 | % | | | 5.75 | % | | | 5.75 | % | | | 5.75 | % | |
| Maximum offering price per share (b) | | $ | 13.38 | | | $ | 19.92 | | | $ | 10.10 | | | $ | 12.48 | | | $ | 12.29 | | |
| Class B | |
| Net assets | | $ | 3,835,453 | | | $ | 24,950,914 | | | $ | 2,168,969 | | | $ | 3,427,815 | | | $ | 17,316,810 | | |
| Shares outstanding | | | 304,497 | | | | 1,442,489 | | | | 241,933 | | | | 311,020 | | | | 1,661,807 | | |
Net asset value and offering
price per share (a) | | $ | 12.60 | | | $ | 17.30 | | | $ | 8.97 | | | $ | 11.02 | | | $ | 10.42 | | |
| Class C | |
| Net assets | | $ | 1,468,102 | | | $ | 17,282,686 | | | $ | 2,019,681 | | | $ | 7,094,226 | | | $ | 18,460,992 | | |
| Shares outstanding | | | 116,512 | | | | 998,582 | | | | 225,983 | | | | 643,068 | | | | 1,769,244 | | |
Net asset value and offering
price per share (a) | | $ | 12.60 | | | $ | 17.31 | | | $ | 8.94 | | | $ | 11.03 | | | $ | 10.43 | | |
| Class E | |
| Net assets | | | — | | | $ | 13,143,835 | | | | — | | | | — | | | | — | | |
| Shares outstanding | | | — | | | | 701,580 | | | | — | | | | — | | | | — | | |
| Net asset value per share (a) | | | — | | | $ | 18.73 | | | | — | | | | — | | | | — | | |
| Maximum sales charge | | | — | | | | 4.50 | % | | | — | | | | — | | | | — | | |
| Maximum offering price per share (b) | | | — | | | $ | 19.61 | | | | — | | | | — | | | | — | | |
| Class F | |
| Net assets | | | — | | | $ | 291,738 | | | | — | | | | — | | | | — | | |
| Shares outstanding | | | — | | | | 16,873 | | | | — | | | | — | | | | — | | |
Net asset value and offering
price per share (a) | | | — | | | $ | 17.29 | | | | — | | | | — | | | | — | | |
| Class T | |
| Net assets | | $ | 113,895,440 | | | $ | 145,010,800 | | | $ | 72,555,391 | | | $ | 117,161,381 | | | $ | 74,721,658 | | |
| Shares outstanding | | | 9,030,237 | | | | 7,780,077 | | | | 7,621,385 | | | | 10,035,993 | | | | 6,558,877 | | |
| Net asset value per share (a) | | $ | 12.61 | | | $ | 18.64 | | | $ | 9.52 | | | $ | 11.67 | | | $ | 11.39 | | |
| Maximum sales charge | | | 5.75 | % | | | 5.75 | % | | | 5.75 | % | | | 5.75 | % | | | 5.75 | % | |
| Maximum offering price per share (b) | | $ | 13.38 | | | $ | 19.78 | | | $ | 10.10 | | | $ | 12.38 | | | $ | 12.08 | | |
| Class Y (c) | |
| Net assets | | | — | | | $ | 16,685,536 | | | | — | | | | — | | | | — | | |
| Shares outstanding | | | — | | | | 868,853 | | | | — | | | | — | | | | — | | |
Net asset value, offering
and redemption price per share | | | — | | | $ | 19.20 | | | | — | | | | — | | | | — | | |
| Class Z | |
| Net assets | | $ | 96,807,139 | | | $ | 940,822,540 | | | $ | 218,690,651 | | | $ | 247,973,992 | | | $ | 353,117,290 | | |
| Shares outstanding | | | 7,647,374 | | | | 49,002,683 | | | | 22,380,533 | | | | 20,967,373 | | | | 29,745,992 | | |
Net asset value, offering
and redemption price per share | | $ | 12.66 | | | $ | 19.20 | | | $ | 9.77 | | | $ | 11.83 | | | $ | 11.87 | | |
(a) Redemption price per share is equal to net asset value less any applicable contingent deferred sales charge.
(b) On sales of $50,000 or more the offering price is reduced.
(c) Class Y shares commenced operations on July 15, 2009.
See Accompanying Notes to Financial Statements.
65
Statements of Operations – Stock Funds
For the Year Ended September 30, 2009
| | | ($) | | ($) | | ($) | | ($) | | ($) | |
| | | Columbia
Asset
Allocation Fund | | Columbia
Large Cap
Growth Fund(a) | | Columbia
Disciplined
Value Fund | | Columbia
Contrarian
Core Fund | | Columbia
Small Cap
Core Fund | |
| Investment Income | |
| Income | |
| Dividends | | | 2,695,537 | | | | 17,268,969 | | | | 8,663,821 | | | | 6,101,623 | | | | 4,673,578 | | |
| Dividends from affiliates | | | — | | | | — | | | | — | | | | — | | | | 32,571 | | |
| Interest | | | 4,611,835 | | | | 17,160 | | | | 3,876 | | | | 4,263 | | | | 23,671 | | |
| Interest from affiliates | | | 21,175 | | | | — | | | | — | | | | — | | | | — | | |
| Securities lending | | | 52,585 | | | | 34 | | | | — | | | | — | | | | — | | |
| Foreign taxes withheld | | | (76,892 | ) | | | (19,190 | ) | | | — | | | | (11,212 | ) | | | (7,858 | ) | |
| Total Investment Income | | | 7,304,240 | | | | 17,266,973 | | | | 8,667,697 | | | | 6,094,674 | | | | 4,721,962 | | |
| Expenses | |
| Investment advisory fee | | | 1,317,805 | | | | 5,877,711 | | | | 1,906,835 | | | | 2,110,310 | | | | 3,382,545 | | |
| Administration fee | | | 135,835 | | | | 555,279 | | | | 182,490 | | | | 201,987 | | | | 302,523 | | |
| Distribution fee: | |
| Class B | | | 28,029 | | | | 227,129 | | | | 17,248 | | | | 20,833 | | | | 113,507 | | |
| Class C | | | 9,303 | | | | 118,242 | | | | 13,457 | | | | 23,402 | | | | 116,645 | | |
| Class E | | | — | | | | 11,426 | | | | — | | | | — | | | | — | | |
| Class F | | | — | | | | 1,852 | | | | — | | | | — | | | | — | | |
| Service fee: | |
| Class A | | | 16,382 | | | | 308,522 | | | | 25,982 | | | | 35,066 | | | | 183,736 | | |
| Class B | | | 9,343 | | | | 75,710 | | | | 5,772 | | | | 6,953 | | | | 37,882 | | |
| Class C | | | 3,101 | | | | 39,444 | | | | 4,490 | | | | 7,797 | | | | 38,938 | | |
| Class E | | | — | | | | 28,565 | | | | — | | | | — | | | | — | | |
| Class F | | | — | | | | 617 | | | | — | | | | — | | | | — | | |
| Shareholder service fee—Class T | | | 313,253 | | | | 380,511 | | | | 191,682 | | | | 299,111 | | | | 191,678 | | |
| Pricing and bookkeeping fees | | | 134,898 | | | | 141,538 | | | | 79,979 | | | | 83,251 | | | | 104,080 | | |
Transfer agent fee—Class A, Class B, Class C,
Class E, Class F, Class T and Class Z | | | 340,395 | | | | 2,382,332 | | | | 434,859 | | | | 398,862 | | | | 687,612 | | |
| Transfer agent fee—Class Y | | | — | | | | 10 | | | | — | | | | — | | | | — | | |
| Trustees' fees | | | 26,530 | | | | 71,013 | | | | 27,445 | | | | 28,375 | | | | 44,000 | | |
| Custody fee | | | 229,600 | | | | 31,117 | | | | 17,856 | | | | 22,397 | | | | 15,291 | | |
| Chief compliance officer expenses | | | 700 | | | | 940 | | | | 666 | | | | 675 | | | | 660 | | |
| Other expenses | | | 295,389 | | | | 676,540 | | | | 192,058 | | | | 264,107 | | | | 357,889 | | |
| Expenses before interest expense | | | 2,860,563 | | | | 10,928,498 | | | | 3,100,819 | | | | 3,503,126 | | | | 5,576,986 | | |
| Interest expense | | | 17 | | | | 166 | | | | 524 | | | | 78 | | | | — | | |
| Total Expenses | | | 2,860,580 | | | | 10,928,664 | | | | 3,101,343 | | | | 3,503,204 | | | | 5,576,986 | | |
Fees waived or expenses reimbursed by
investment advisor | | | (454,903 | ) | | | — | | | | — | | | | (318,233 | ) | | | — | | |
| Expense reductions | | | (213 | ) | | | (11 | ) | | | (22 | ) | | | (3 | ) | | | (79 | ) | |
| Net Expenses | | | 2,405,464 | | | | 10,928,653 | | | | 3,101,321 | | | | 3,184,968 | | | | 5,576,907 | | |
| Net Investment Income (Loss) | | | 4,898,776 | | | | 6,338,320 | | | | 5,566,376 | | | | 2,909,706 | | | | (854,945 | ) | |
(a) Class Y shares commenced operations on July 15, 2009.
See Accompanying Notes to Financial Statements.
66
Statements of Operations (continued) – Stock Funds
For the Year Ended September 30, 2009
| | | ($) | | ($) | | ($) | | ($) | | ($) | |
| | | Columbia
Asset
Allocation Fund | | Columbia
Large Cap
Growth Fund | | Columbia
Disciplined
Value Fund | | Columbia
Contrarian
Core Fund | | Columbia
Small Cap
Core Fund | |
Net Realized and Unrealized Gain (Loss)
on Investments, Foreign Currency,
Futures Contracts and Written Options | |
| Net realized gain (loss) on: | |
| Unaffiliated investments | | | (34,872,938 | ) | | | (338,092,454 | ) | | | (101,617,710 | ) | | | (34,481,266 | ) | | | (30,300,820 | ) | |
| Affiliated investments | | | — | | | | — | | | | — | | | | — | | | | (19,723 | ) | |
| Foreign currency transactions | | | (123,648 | ) | | | — | | | | — | | | | (383 | ) | | | — | | |
| Futures contracts | | | (353,442 | ) | | | — | | | | (1,480,194 | ) | | | — | | | | — | | |
| Written options | | | 29,755 | | | | — | | | | — | | | | — | | | | — | | |
| Net realized loss | | | (35,320,273 | ) | | | (338,092,454 | ) | | | (103,097,904 | ) | | | (34,481,649 | ) | | | (30,320,543 | ) | |
Net change in unrealized appreciation
(depreciation) on: | |
| Investments | | | 31,203,257 | | | | 266,910,172 | | | | 70,642,580 | | | | 50,682,737 | | | | (37,219,629 | ) | |
| Foreign currency translations | | | 53,850 | | | | — | | | | — | | | | 37 | | | | — | | |
| Futures contracts | | | 233,936 | | | | — | | | | 457,257 | | | | — | | | | — | | |
| Written options | | | 774 | | | | — | | | | — | | | | — | | | | — | | |
Net change in unrealized appreciation
(depreciation) | | | 31,491,817 | | | | 266,910,172 | | | | 71,099,837 | | | | 50,682,774 | | | | (37,219,629 | ) | |
| Net Gain (Loss) | | | (3,828,456 | ) | | | (71,182,282 | ) | | | (31,998,067 | ) | | | 16,201,125 | | | | (67,540,172 | ) | |
Net Increase (Decrease) Resulting
from Operations | | | 1,070,320 | | | | (64,843,962 | ) | | | (26,431,691 | ) | | | 19,110,831 | | | | (68,395,117 | ) | |
See Accompanying Notes to Financial Statements.
67
Statements of Changes in Net Assets – Stock Funds
| Increase (Decrease) in Net Assets | | Columbia Asset Allocation Fund | | Columbia Large Cap Growth Fund | | Columbia Disciplined Value Fund | |
| | | Year Ended September 30, | | Year Ended September 30, | | Year Ended September 30, | |
| | | 2009 ($) | | 2008 ($) | | 2009 ($) | | 2008 ($) | | 2009 ($) | | 2008 ($) | |
| Operations | |
| Net investment income (loss) | | | 4,898,776 | | | | 6,771,638 | | | | 6,338,320 | | | | 1,811,100 | | | | 5,566,376 | | | | 6,142,695 | | |
Net realized gain (loss) on investments,
foreign currency transactions, futures
contracts and written options | | | (35,320,273 | ) | | | (7,106,071 | ) | | | (338,092,454 | ) | | | (7,970,706 | ) | | | (103,097,904 | ) | | | (45,412,189 | ) | |
Net change in unrealized appreciation
(depreciation) on investments, foreign
currency translations, futures contracts
and written options | | | 31,491,817 | | | | (51,187,909 | ) | | | 266,910,172 | | | | (388,568,864 | ) | | | 71,099,837 | | | | (87,003,903 | ) | |
| Net increase (decrease) resulting from operations | | | 1,070,320 | | | | (51,522,342 | ) | | | (64,843,962 | ) | | | (394,728,470 | ) | | | (26,431,691 | ) | | | (126,273,397 | ) | |
| Distributions to Shareholders | |
| From net investment income: | |
| Class A | | | (150,796 | ) | | | (197,762 | ) | | | (140,147 | ) | | | — | | | | (209,449 | ) | | | (308,780 | ) | |
| Class B | | | (55,722 | ) | | | (91,484 | ) | | | — | | | | — | | | | (31,603 | ) | | | (31,729 | ) | |
| Class C | | | (18,706 | ) | | | (26,950 | ) | | | — | | | | — | | | | (24,079 | ) | | | (20,476 | ) | |
| Class E | | | — | | | | — | | | | (1,130 | ) | | | — | | | | — | | | | — | | |
| Class T | | | (2,288,522 | ) | | | (3,560,124 | ) | | | — | | | | — | | | | (1,247,692 | ) | | | (1,411,835 | ) | |
| Class Z | | | (2,159,589 | ) | | | (3,298,884 | ) | | | (2,956,052 | ) | | | (2,224,336 | ) | | | (4,279,319 | ) | | | (4,202,294 | ) | |
| From net realized gains: | |
| Class A | | | — | | | | (723,894 | ) | | | — | | | | (11,577,199 | ) | | | — | | | | (3,659,576 | ) | |
| Class B | | | — | | | | (545,891 | ) | | | — | | | | (11,130,619 | ) | | | — | | | | (870,037 | ) | |
| Class C | | | — | | | | (160,133 | ) | | | — | | | | (2,290,476 | ) | | | — | | | | (639,638 | ) | |
| Class E | | | — | | | | — | | | | — | | | | (1,232,359 | ) | | | — | | | | — | | |
| Class F | | | — | | | | — | | | | — | | | | (188,065 | ) | | | — | | | | — | | |
| Class T | | | — | | | | (14,928,189 | ) | | | — | | | | (16,307,165 | ) | | | — | | | | (15,296,653 | ) | |
| Class Z | | | — | | | | (12,207,866 | ) | | | — | | | | (85,740,579 | ) | | | — | | | | (36,691,117 | ) | |
| Total distributions to shareholders | | | (4,673,335 | ) | | | (35,741,177 | ) | | | (3,097,329 | ) | | | (130,690,798 | ) | | | (5,792,142 | ) | | | (63,132,135 | ) | |
| Net Capital Stock Transactions | | | (24,306,040 | ) | | | (2,597,208 | ) | | | (28,921,925 | ) | | | (11,914,912 | ) | | | 3,409,644 | | | | (5,902,983 | ) | |
| Increase from regulatory settlements | | | — | | | | — | | | | 663,170 | | | | 1,089,186 | | | | — | | | | — | | |
| Total increase (decrease) in net assets | | | (27,909,055 | ) | | | (89,860,727 | ) | | | (96,200,046 | ) | | | (536,244,994 | ) | | | (28,814,189 | ) | | | (195,308,515 | ) | |
| Net Assets | |
| Beginning of period | | | 251,747,851 | | | | 341,608,578 | | | | 1,400,213,512 | | | | 1,936,458,506 | | | | 334,792,374 | | | | 530,100,889 | | |
| End of period | | | 223,838,796 | | | | 251,747,851 | | | | 1,304,013,466 | | | | 1,400,213,512 | | | | 305,978,185 | | | | 334,792,374 | | |
Undistributed (Overdistributed) net investment
income at end of period | | | 266,974 | | | | (158,517 | ) | | | 6,455,976 | | | | 2,551,815 | | | | 53,837 | | | | 279,605 | | |
See Accompanying Notes to Financial Statements.
68
| Increase (Decrease) in Net Assets | | Columbia Contrarian Core Fund | | Columbia Small Cap Core Fund | |
| | | Year Ended September 30, | | Year Ended September 30, | |
| | | 2009 ($) | | 2008 ($) | | 2009 ($) | | 2008 ($) | |
| Operations | |
| Net investment income (loss) | | | 2,909,706 | | | | 2,442,541 | | | | (854,945 | ) | | | (3,922,421 | ) | |
Net realized gain (loss) on investments,
foreign currency transactions, futures
contracts and written options | | | (34,481,649 | ) | | | 3,542,460 | | | | (30,320,543 | ) | | | 92,085,637 | | |
Net change in unrealized appreciation
(depreciation) on investments, foreign
currency translations, futures contracts
and written options | | | 50,682,774 | | | | (65,572,460 | ) | | | (37,219,629 | ) | | | (219,195,085 | ) | |
| Net increase (decrease) resulting from operations | | | 19,110,831 | | | | (59,587,459 | ) | | | (68,395,117 | ) | | | (131,031,869 | ) | |
| Distributions to Shareholders | |
| From net investment income: | |
| Class A | | | (87,616 | ) | | | (41,459 | ) | | | — | | | | (313,396 | ) | |
| Class B | | | — | | | | — | | | | — | | | | — | | |
| Class C | | | — | | | | — | | | | — | | | | — | | |
| Class E | | | — | | | | — | | | | — | | | | — | | |
| Class T | | | (717,940 | ) | | | (523,167 | ) | | | — | | | | (184,037 | ) | |
| Class Z | | | (2,057,319 | ) | | | (1,372,481 | ) | | | — | | | | (3,485,596 | ) | |
| From net realized gains: | |
| Class A | | | — | | | | (1,125,847 | ) | | | (8,907,282 | ) | | | (30,396,930 | ) | |
| Class B | | | — | | | | (466,120 | ) | | | (1,940,780 | ) | | | (6,593,541 | ) | |
| Class C | | | — | | | | (131,887 | ) | | | (1,989,757 | ) | | | (7,737,478 | ) | |
| Class E | | | — | | | | — | | | | — | | | | — | | |
| Class F | | | — | | | | — | | | | — | | | | — | | |
| Class T | | | — | | | | (16,463,774 | ) | | | (7,421,795 | ) | | | (24,251,745 | ) | |
| Class Z | | | — | | | | (22,118,426 | ) | | | (31,170,222 | ) | | | (144,889,355 | ) | |
| Total distributions to shareholders | | | (2,862,875 | ) | | | (42,243,161 | ) | | | (51,429,836 | ) | | | (217,852,078 | ) | |
| Net Capital Stock Transactions | | | 64,862,004 | | | | (17,037,006 | ) | | | (10,237,809 | ) | | | (201,619,486 | ) | |
| Increase from regulatory settlements | | | 5,432 | | | | — | | | | 5,313 | | | | — | | |
| Total increase (decrease) in net assets | | | 81,115,392 | | | | (118,867,626 | ) | | | (130,057,449 | ) | | | (550,503,433 | ) | |
| Net Assets | |
| Beginning of period | | | 322,284,004 | | | | 441,151,630 | | | | 675,148,086 | | | | 1,225,651,519 | | |
| End of period | | | 403,399,396 | | | | 322,284,004 | | | | 545,090,637 | | | | 675,148,086 | | |
Undistributed (Overdistributed) net investment
income at end of period | | | 1,963,211 | | | | 1,911,330 | | | | (85,558 | ) | | | (80,111 | ) | |
See Accompanying Notes to Financial Statements.
69
Statements of Changes in Net Assets (continued) – Capital Stock Activity
| | | Columbia Asset Allocation Fund | |
| | | Year Ended
September 30, 2009 | | Year Ended
September 30, 2008 | |
| | | Shares | | Dollars ($) | | Shares | | Dollars ($) | |
| Class A | |
| Subscriptions | | | 242,754 | | | | 2,594,996 | | | | 197,474 | | | | 2,903,127 | | |
| Distributions reinvested | | | 12,955 | | | | 141,198 | | | | 58,632 | | | | 883,969 | | |
| Redemptions | | | (212,773 | ) | | | (2,318,316 | ) | | | (172,671 | ) | | | (2,495,559 | ) | |
| Net increase | | | 42,936 | | | | 417,878 | | | | 83,435 | | | | 1,291,537 | | |
| Class B | |
| Subscriptions | | | 63,535 | | | | 696,944 | | | | 100,624 | | | | 1,491,826 | | |
| Distributions reinvested | | | 4,637 | | | | 49,933 | | | | 38,828 | | | | 589,166 | | |
| Redemptions | | | (137,489 | ) | | | (1,481,838 | ) | | | (135,789 | ) | | | (1,949,904 | ) | |
| Net increase (decrease) | | | (69,317 | ) | | | (734,961 | ) | | | 3,663 | | | | 131,088 | | |
| Class C | |
| Subscriptions | | | 40,293 | | | | 442,888 | | | | 40,510 | | | | 586,522 | | |
| Distributions reinvested | | | 1,489 | | | | 16,136 | | | | 11,064 | | | | 167,904 | | |
| Redemptions | | | (44,295 | ) | | | (486,881 | ) | | | (40,020 | ) | | | (572,939 | ) | |
| Net increase (decrease) | | | (2,513 | ) | | | (27,857 | ) | | | 11,554 | | | | 181,487 | | |
| Class T | |
| Subscriptions | | | 47,805 | | | | 517,944 | | | | 74,641 | | | | 1,095,793 | | |
| Distributions reinvested | | | 203,820 | | | | 2,211,059 | | | | 1,192,504 | | | | 18,031,577 | | |
| Redemptions | | | (1,620,242 | ) | | | (17,373,997 | ) | | | (1,612,931 | ) | | | (23,705,569 | ) | |
| Net decrease | | | (1,368,617 | ) | | | (14,644,994 | ) | | | (345,786 | ) | | | (4,578,199 | ) | |
| Class Z | |
| Subscriptions | | | 268,237 | | | | 3,235,752 | | | | 1,182,443 | | | | 17,148,685 | | |
| Distributions reinvested | | | 167,719 | | | | 1,827,162 | | | | 900,520 | | | | 13,588,996 | | |
| Redemptions | | | (1,324,767 | ) | | | (14,379,020 | ) | | | (2,140,627 | ) | | | (30,360,802 | ) | |
| Net increase (decrease) | | | (888,811 | ) | | | (9,316,106 | ) | | | (57,664 | ) | | | 376,879 | | |
See Accompanying Notes to Financial Statements.
70
Statements of Changes in Net Assets (continued) – Capital Stock Activity
| | | Columbia Large Cap Growth Fund | |
| | | Year Ended
September 30, 2009(a)(b) | | Year Ended
September 30, 2008 | |
| | | Shares | | Dollars ($) | | Shares | | Dollars ($) | |
| Class A | |
| Subscriptions | | | 1,591,508 | | | | 24,021,794 | | | | 3,052,442 | | | | 71,281,501 | | |
| Distributions reinvested | | | 8,857 | | | | 126,318 | | | | 400,865 | | | | 10,342,317 | | |
| Redemptions | | | (1,831,457 | ) | | | (28,061,174 | ) | | | (1,708,127 | ) | | | (39,787,035 | ) | |
| Net increase (decrease) | | | (231,092 | ) | | | (3,913,062 | ) | | | 1,745,180 | | | | 41,836,783 | | |
| Class B | |
| Subscriptions | | | 107,673 | | | | 1,522,097 | | | | 89,653 | | | | 1,994,153 | | |
| Distributions reinvested | | | — | | | | — | | | | 427,139 | | | | 10,285,500 | | |
| Redemptions | | | (1,894,336 | ) | | | (26,316,082 | ) | | | (3,985,922 | ) | | | (86,976,811 | ) | |
| Net decrease | | | (1,786,663 | ) | | | (24,793,985 | ) | | | (3,469,130 | ) | | | (74,697,158 | ) | |
| Class C | |
| Subscriptions | | | 345,304 | | | | 4,759,197 | | | | 130,752 | | | | 2,970,379 | | |
| Distributions reinvested | | | — | | | | — | | | | 76,612 | | | | 1,845,584 | | |
| Redemptions | | | (514,603 | ) | | | (7,172,499 | ) | | | (305,949 | ) | | | (6,640,695 | ) | |
| Net decrease | | | (169,299 | ) | | | (2,413,302 | ) | | | (98,585 | ) | | | (1,824,732 | ) | |
| Class E | |
| Subscriptions | | | 4,972 | | | | 74,331 | | | | 97,348 | | | | 2,306,175 | | |
| Distributions reinvested | | | 79 | | | | 1,128 | | | | 47,726 | | | | 1,229,898 | | |
| Redemptions | | | (60,277 | ) | | | (935,864 | ) | | | (68,432 | ) | | | (1,626,700 | ) | |
| Net increase (decrease) | | | (55,226 | ) | | | (860,405 | ) | | | 76,642 | | | | 1,909,373 | | |
| Class F | |
| Subscriptions | | | 23 | | | | 354 | | | | 3,297 | | | | 72,377 | | |
| Distributions reinvested | | | — | | | | — | | | | 7,813 | | | | 188,065 | | |
| Redemptions | | | (4,123 | ) | | | (57,722 | ) | | | (106,218 | ) | | | (2,348,463 | ) | |
| Net decrease | | | (4,100 | ) | | | (57,368 | ) | | | (95,108 | ) | | | (2,088,021 | ) | |
| Class T | |
| Subscriptions | | | 97,232 | | | | 1,472,114 | | | | 136,148 | | | | 3,185,655 | | |
| Distributions reinvested | | | — | | | | — | | | | 623,267 | | | | 15,961,865 | | |
| Redemptions | | | (1,034,974 | ) | | | (15,755,361 | ) | | | (1,255,111 | ) | | | (29,455,246 | ) | |
| Net decrease | | | (937,742 | ) | | | (14,283,247 | ) | | | (495,696 | ) | | | (10,307,726 | ) | |
| Class Y | |
| Subscriptions | | | 1,566,787 | | | | 28,038,000 | | | | — | | | | — | | |
| Redemptions | | | (697,934 | ) | | | (12,618,649 | ) | | | — | | | | — | | |
| Net increase | | | 868,853 | | | | 15,419,351 | | | | — | | | | — | | |
| Class Z | |
| Subscriptions | | | 9,868,328 | | | | 157,965,419 | | | | 5,946,708 | | | | 141,918,882 | | |
| Distributions reinvested | | | 119,365 | | | | 1,738,022 | | | | 2,365,715 | | | | 62,336,591 | | |
| Redemptions | | | (9,894,536 | ) | | | (157,723,348 | ) | | | (7,096,396 | ) | | | (170,998,904 | ) | |
| Net increase | | | 93,157 | | | | 1,980,093 | | | | 1,216,027 | | | | 33,256,569 | | |
(a) Class Y shares commenced operations on July 15, 2009.
(b) Class Y shares reflect activity for the period July 15, 2009 through September 30, 2009.
See Accompanying Notes to Financial Statements.
71
Statements of Changes in Net Assets (continued) – Capital Stock Activity
| | | Columbia Disciplined Value Fund | |
| | | Year Ended
September 30, 2009 | | Year Ended
September 30, 2008 | |
| | | Shares | | Dollars ($) | | Shares | | Dollars ($) | |
| Class A | |
| Subscriptions | | | 288,028 | | | | 2,281,055 | | | | 405,173 | | | | 5,404,894 | | |
| Distributions reinvested | | | 23,100 | | | | 179,703 | | | | 251,100 | | | | 3,493,211 | | |
| Redemptions | | | (739,426 | ) | | | (5,805,700 | ) | | | (1,246,088 | ) | | | (16,101,999 | ) | |
| Net decrease | | | (428,298 | ) | | | (3,344,942 | ) | | | (589,815 | ) | | | (7,203,894 | ) | |
| Class B | |
| Subscriptions | | | 17,707 | | | | 131,169 | | | | 48,749 | | | | 624,153 | | |
| Distributions reinvested | | | 3,913 | | | | 28,225 | | | | 59,953 | | | | 790,418 | | |
| Redemptions | | | (174,185 | ) | | | (1,255,003 | ) | | | (211,203 | ) | | | (2,524,882 | ) | |
| Net decrease | | | (152,565 | ) | | | (1,095,609 | ) | | | (102,501 | ) | | | (1,110,311 | ) | |
| Class C | |
| Subscriptions | | | 67,614 | | | | 542,251 | | | | 89,813 | | | | 1,116,398 | | |
| Distributions reinvested | | | 2,863 | | | | 20,584 | | | | 42,444 | | | | 557,859 | | |
| Redemptions | | | (127,694 | ) | | | (912,243 | ) | | | (214,878 | ) | | | (2,553,953 | ) | |
| Net decrease | | | (57,217 | ) | | | (349,408 | ) | | | (82,621 | ) | | | (879,696 | ) | |
| Class T | |
| Subscriptions | | | 65,624 | | | | 514,004 | | | | 59,829 | | | | 756,203 | | |
| Distributions reinvested | | | 157,011 | | | | 1,221,118 | | | | 1,185,592 | | | | 16,464,091 | | |
| Redemptions | | | (1,123,058 | ) | | | (8,716,795 | ) | | | (1,326,278 | ) | | | (16,955,125 | ) | |
| Net increase (decrease) | | | (900,423 | ) | | | (6,981,673 | ) | | | (80,857 | ) | | | 265,169 | | |
| Class Z | |
| Subscriptions | | | 8,733,478 | | | | 71,166,602 | | | | 4,055,288 | | | | 53,584,460 | | |
| Distributions reinvested | | | 206,897 | | | | 1,660,628 | | | | 1,351,091 | | | | 19,295,848 | | |
| Redemptions | | | (7,144,516 | ) | | | (57,645,954 | ) | | | (5,288,025 | ) | | | (69,854,559 | ) | |
| Net increase | | | 1,795,859 | | | | 15,181,276 | | | | 118,354 | | | | 3,025,749 | | |
See Accompanying Notes to Financial Statements.
72
Statements of Changes in Net Assets (continued) – Capital Stock Activity
| | | Columbia Contrarian Core Fund | |
| | | Year Ended
September 30, 2009 | | Year Ended
September 30, 2008 | |
| | | Shares | | Dollars ($) | | Shares | | Dollars ($) | |
| Class A | |
| Subscriptions | | | 1,851,140 | | | | 18,894,886 | | | | 251,873 | | | | 3,365,188 | | |
| Distributions reinvested | | | 8,794 | | | | 77,084 | | | | 77,223 | | | | 1,125,917 | | |
| Redemptions | | | (442,332 | ) | | | (4,101,888 | ) | | | (165,492 | ) | | | (2,251,895 | ) | |
| Net increase | | | 1,417,602 | | | | 14,870,082 | | | | 163,604 | | | | 2,239,210 | | |
| Class B | |
| Subscriptions | | | 107,507 | | | | 1,009,446 | | | | 61,049 | | | | 772,905 | | |
| Distributions reinvested | | | — | | | | — | | | | 30,457 | | | | 418,472 | | |
| Redemptions | | | (122,331 | ) | | | (1,037,793 | ) | | | (92,569 | ) | | | (1,164,528 | ) | |
| Net increase (decrease) | | | (14,824 | ) | | | (28,347 | ) | | | (1,063 | ) | | | 26,849 | | |
| Class C | |
| Subscriptions | | | 604,409 | | | | 5,864,349 | | | | 101,333 | | | | 1,290,847 | | |
| Distributions reinvested | | | — | | | | — | | | | 7,977 | | | | 109,683 | | |
| Redemptions | | | (115,428 | ) | | | (1,028,223 | ) | | | (52,521 | ) | | | (692,498 | ) | |
| Net increase | | | 488,981 | | | | 4,836,126 | | | | 56,789 | | | | 708,032 | | |
| Class T | |
| Subscriptions | | | 57,531 | | | | 530,596 | | | | 107,254 | | | | 1,482,245 | | |
| Distributions reinvested | | | 77,542 | | | | 675,392 | | | | 1,125,256 | | | | 16,293,706 | | |
| Redemptions | | | (1,305,440 | ) | | | (11,973,025 | ) | | | (1,538,327 | ) | | | (20,983,001 | ) | |
| Net decrease | | | (1,170,367 | ) | | | (10,767,037 | ) | | | (305,817 | ) | | | (3,207,050 | ) | |
| Class Z | |
| Subscriptions | | | 11,481,253 | | | | 103,217,377 | | | | 684,939 | | | | 9,231,408 | | |
| Distributions reinvested | | | 178,491 | | | | 1,572,554 | | | | 1,341,183 | | | | 19,648,343 | | |
| Redemptions | | | (5,182,054 | ) | | | (48,838,751 | ) | | | (3,271,455 | ) | | | (45,683,798 | ) | |
| Net increase (decrease) | | | 6,477,690 | | | | 55,951,180 | | | | (1,245,333 | ) | | | (16,804,047 | ) | |
See Accompanying Notes to Financial Statements.
73
Statements of Changes in Net Assets (continued) – Capital Stock Activity
| | | Columbia Small Cap Core Fund | |
| | | Year Ended
September 30, 2009 | | Year Ended
September 30, 2008 | |
| | | Shares | | Dollars ($) | | Shares | | Dollars ($) | |
| Class A | |
| Subscriptions | | | 2,080,374 | | | | 19,805,781 | | | | 922,622 | | | | 14,115,438 | | |
| Distributions reinvested | | | 980,677 | | | | 8,610,346 | | | | 1,853,851 | | | | 29,216,697 | | |
| Redemptions | | | (4,177,022 | ) | | | (38,542,843 | ) | | | (3,448,586 | ) | | | (53,363,614 | ) | |
| Net decrease | | | (1,115,971 | ) | | | (10,126,716 | ) | | | (672,113 | ) | | | (10,031,479 | ) | |
| Class B | |
| Subscriptions | | | 96,693 | | | | 842,189 | | | | 13,702 | | | | 197,333 | | |
| Distributions reinvested | | | 228,050 | | | | 1,813,000 | | | | 418,959 | | | | 6,095,850 | | |
| Redemptions | | | (442,312 | ) | | | (3,691,488 | ) | | | (569,202 | ) | | | (8,150,007 | ) | |
| Net decrease | | | (117,569 | ) | | | (1,036,299 | ) | | | (136,541 | ) | | | (1,856,824 | ) | |
| Class C | |
| Subscriptions | | | 271,949 | | | | 2,444,023 | | | | 57,885 | | | | 832,429 | | |
| Distributions reinvested | | | 226,347 | | | | 1,801,724 | | | | 473,257 | | | | 6,890,619 | | |
| Redemptions | | | (635,154 | ) | | | (5,307,813 | ) | | | (879,920 | ) | | | (12,565,729 | ) | |
| Net decrease | | | (136,858 | ) | | | (1,062,066 | ) | | | (348,778 | ) | | | (4,842,681 | ) | |
| Class T | |
| Subscriptions | | | 81,099 | | | | 725,579 | | | | 187,496 | | | | 2,838,894 | | |
| Distributions reinvested | | | 800,276 | | | | 6,914,381 | | | | 1,454,898 | | | | 22,609,113 | | |
| Redemptions | | | (1,373,498 | ) | | | (13,187,203 | ) | | | (1,486,975 | ) | | | (22,864,774 | ) | |
| Net increase (decrease) | | | (492,123 | ) | | | (5,547,243 | ) | | | 155,419 | | | | 2,583,233 | | |
| Class Z | |
| Subscriptions | | | 9,744,342 | | | | 94,177,339 | | | | 4,643,406 | | | | 72,532,539 | | |
| Distributions reinvested | | | 2,513,202 | | | | 22,568,553 | | | | 6,363,669 | | | | 102,073,253 | | |
| Redemptions | | | (11,209,503 | ) | | | (109,211,377 | ) | | | (23,349,696 | ) | | | (362,077,527 | ) | |
| Net increase (decrease) | | | 1,048,041 | | | | 7,534,515 | | | | (12,342,621 | ) | | | (187,471,735 | ) | |
See Accompanying Notes to Financial Statements.
74
Financial Highlights – Columbia Asset Allocation Fund
Selected data for a share outstanding throughout each period is as follows:
| | | Year Ended September 30, | |
| Class A Shares | | 2009 | | 2008 | | 2007 | | 2006 | | 2005 | |
| Net Asset Value, Beginning of Period | | $ | 12.57 | | | $ | 16.80 | | | $ | 16.06 | | | $ | 16.47 | | | $ | 15.06 | | |
| Income from Investment Operations: | |
| Net investment income (a) | | | 0.26 | | | | 0.31 | | | | 0.32 | | | | 0.22 | | | | 0.27 | (b) | |
Net realized and unrealized gain (loss) on investments,
foreign currency, futures contracts, foreign capital gains tax
and written options | | | 0.03 | | | | (2.76 | ) | | | 1.86 | | | | 0.92 | | | | 1.41 | | |
| Total from investment operations | | | 0.29 | | | | (2.45 | ) | | | 2.18 | | | | 1.14 | | | | 1.68 | | |
| Less Distributions to Shareholders: | |
| From net investment income | | | (0.25 | ) | | | (0.34 | ) | | | (0.33 | ) | | | (0.31 | ) | | | (0.27 | ) | |
| From net realized gains | | | — | | | | (1.44 | ) | | | (1.11 | ) | | | (1.24 | ) | | | — | | |
| Total distributions to shareholders | | | (0.25 | ) | | | (1.78 | ) | | | (1.44 | ) | | | (1.55 | ) | | | (0.27 | ) | |
| Net Asset Value, End of Period | | $ | 12.61 | | | $ | 12.57 | | | $ | 16.80 | | | $ | 16.06 | | | $ | 16.47 | | |
| Total return (c) | | | 2.63 | %(d) | | | (16.23 | )% | | | 14.24 | % | | | 7.39 | %(d)(e) | | | 11.20 | %(d) | |
| Ratios to Average Net Assets/Supplemental Data: | |
| Net expenses before interest expense | | | 1.25 | %(f) | | | 1.29 | %(g) | | | 1.32 | %(f) | | | 1.31 | %(f) | | | 1.35 | %(f) | |
| Interest expense | | | — | %(h) | | | — | | | | — | | | | — | | | | — | | |
| Net expenses | | | 1.25 | %(f) | | | 1.29 | %(g) | | | 1.32 | %(f) | | | 1.31 | %(f) | | | 1.35 | %(f) | |
| Waiver/Reimbursement | | | 0.22 | % | | | — | | | | — | | | | 0.01 | % | | | 0.01 | % | |
| Net investment income | | | 2.35 | %(f) | | | 2.17 | %(g) | | | 1.98 | %(f) | | | 1.38 | %(f) | | | 1.66 | %(f) | |
| Portfolio turnover rate | | | 107 | % | | | 94 | % | | | 100 | % | | | 98 | % | | | 86 | % | |
| Net assets, end of period (000s) | | $ | 7,833 | | | $ | 7,266 | | | $ | 8,314 | | | $ | 5,863 | | | $ | 4,206 | | |
(a) Per share data was calculated using the average shares outstanding during the period.
(b) Net investment income per share reflects a special dividend. The effect of this dividend amounted to $0.02 per share.
(c) Total return at net asset value assuming all distributions reinvested and no initial sales charge or contingent deferred sales charge.
(d) Had the investment advisor and/or any of its affiliates not waived fees or reimbursed a portion of expenses, total return would have been reduced.
(e) Total return includes a voluntary reimbursement by the investment advisor for a realized investment loss due to a trading error. This reimbursement increased total return and net asset value per share by less than 0.01% and less than $0.01, respectively.
(f) The benefits derived from expense reductions had an impact of less than 0.01%.
(g) The benefits derived from expense reductions had an impact of 0.01%.
(h) Rounds to less than 0.01%.
See Accompanying Notes to Financial Statements.
75
Financial Highlights – Columbia Asset Allocation Fund
Selected data for a share outstanding throughout each period is as follows:
| | | Year Ended September 30, | |
| Class B Shares | | 2009 | | 2008 | | 2007 | | 2006 | | 2005 | |
| Net Asset Value, Beginning of Period | | $ | 12.57 | | | $ | 16.80 | | | $ | 16.06 | | | $ | 16.47 | | | $ | 15.06 | | |
| Income from Investment Operations: | |
| Net investment income (a) | | | 0.18 | | | | 0.20 | | | | 0.20 | | | | 0.17 | | | | 0.15 | (b) | |
Net realized and unrealized gain (loss) on investments,
foreign currency, futures contracts, foreign capital gains tax
and written options | | | 0.02 | | | | (2.76 | ) | | | 1.86 | | | | 0.85 | | | | 1.41 | | |
| Total from investment operations | | | 0.20 | | | | (2.56 | ) | | | 2.06 | | | | 1.02 | | | | 1.56 | | |
| Less Distributions to Shareholders: | |
| From net investment income | | | (0.17 | ) | | | (0.23 | ) | | | (0.21 | ) | | | (0.19 | ) | | | (0.15 | ) | |
| From net realized gains | | | — | | | | (1.44 | ) | | | (1.11 | ) | | | (1.24 | ) | | | — | | |
| Total distributions to shareholders | | | (0.17 | ) | | | (1.67 | ) | | | (1.32 | ) | | | (1.43 | ) | | | (0.15 | ) | |
| Net Asset Value, End of Period | | $ | 12.60 | | | $ | 12.57 | | | $ | 16.80 | | | $ | 16.06 | | | $ | 16.47 | | |
| Total return (c) | | | 1.79 | %(d) | | | (16.88 | )% | | | 13.40 | % | | | 6.59 | %(d)(e) | | | 10.37 | %(d) | |
| Ratios to Average Net Assets/Supplemental Data: | |
| Net expenses before interest expense | | | 2.00 | %(f) | | | 2.04 | %(g) | | | 2.07 | %(f) | | | 2.06 | %(f) | | | 2.10 | %(f) | |
| Interest expense | | | — | %(h) | | | — | | | | — | | | | — | | | | — | | |
| Net expenses | | | 2.00 | %(f) | | | 2.04 | %(g) | | | 2.07 | %(f) | | | 2.06 | %(f) | | | 2.10 | %(f) | |
| Waiver/Reimbursement | | | 0.22 | % | | | — | | | | — | | | | 0.01 | % | | | 0.01 | % | |
| Net investment income | | | 1.61 | %(f) | | | 1.40 | %(g) | | | 1.21 | %(f) | | | 1.08 | %(f) | | | 0.91 | %(f) | |
| Portfolio turnover rate | | | 107 | % | | | 94 | % | | | 100 | % | | | 98 | % | | | 86 | % | |
| Net assets, end of period (000s) | | $ | 3,835 | | | $ | 4,699 | | | $ | 6,219 | | | $ | 6,788 | | | $ | 7,166 | | |
(a) Per share data was calculated using the average shares outstanding during the period.
(b) Net investment income per share reflects a special dividend. The effect of this dividend amounted to $0.02 per share.
(c) Total return at net asset value assuming all distributions reinvested and no contingent deferred sales charge.
(d) Had the investment advisor and/or any of its affiliates not waived fees or reimbursed a portion of expenses, total return would have been reduced.
(e) Total return includes a voluntary reimbursement by the investment advisor for a realized investment loss due to a trading error. This reimbursement increased total return and net asset value per share by less than 0.01% and less than $0.01, respectively.
(f) The benefits derived from expense reductions had an impact of less than 0.01%.
(g) The benefits derived from expense reductions had an impact of 0.01%.
(h) Rounds to less than 0.01%.
See Accompanying Notes to Financial Statements.
76
Financial Highlights – Columbia Asset Allocation Fund
Selected data for a share outstanding throughout each period is as follows:
| | | Year Ended September 30, | |
| Class C Shares | | 2009 | | 2008 | | 2007 | | 2006 | | 2005 | |
| Net Asset Value, Beginning of Period | | $ | 12.57 | | | $ | 16.81 | | | $ | 16.06 | | | $ | 16.47 | | | $ | 15.06 | | |
| Income from Investment Operations: | |
| Net investment income (a) | | | 0.17 | | | | 0.21 | | | | 0.20 | | | | 0.16 | | | | 0.14 | (b) | |
Net realized and unrealized gain (loss) on investments,
foreign currency, futures contracts, foreign capital gains tax
and written options | | | 0.03 | | | | (2.78 | ) | | | 1.87 | | | | 0.86 | | | | 1.42 | | |
| Total from investment operations | | | 0.20 | | | | (2.57 | ) | | | 2.07 | | | | 1.02 | | | | 1.56 | | |
| Less Distributions to Shareholders: | |
| From net investment income | | | (0.17 | ) | | | (0.23 | ) | | | (0.21 | ) | | | (0.19 | ) | | | (0.15 | ) | |
| From net realized gains | | | — | | | | (1.44 | ) | | | (1.11 | ) | | | (1.24 | ) | | | — | | |
| Total distributions to shareholders | | | (0.17 | ) | | | (1.67 | ) | | | (1.32 | ) | | | (1.43 | ) | | | (0.15 | ) | |
| Net Asset Value, End of Period | | $ | 12.60 | | | $ | 12.57 | | | $ | 16.81 | | | $ | 16.06 | | | $ | 16.47 | | |
| Total return (c) | | | 1.79 | %(d) | | | (16.93 | )% | | | 13.46 | % | | | 6.59 | %(d)(e) | | | 10.37 | %(d) | |
| Ratios to Average Net Assets/Supplemental Data: | |
| Net expenses before interest expense | | | 2.00 | %(f) | | | 2.04 | %(g) | | | 2.07 | %(f) | | | 2.06 | %(f) | | | 2.10 | %(f) | |
| Interest expense | | | — | %(h) | | | — | | | | — | | | | — | | | | — | | |
| Net expenses | | | 2.00 | %(f) | | | 2.04 | %(g) | | | 2.07 | %(f) | | | 2.06 | %(f) | | | 2.10 | %(f) | |
| Waiver/Reimbursement | | | 0.22 | % | | | — | | | | — | | | | 0.01 | % | | | 0.01 | % | |
| Net investment income | | | 1.60 | %(f) | | | 1.41 | %(g) | | | 1.23 | %(f) | | | 0.98 | %(f) | | | 0.91 | %(f) | |
| Portfolio turnover rate | | | 107 | % | | | 94 | % | | | 100 | % | | | 98 | % | | | 86 | % | |
| Net assets, end of period (000s) | | $ | 1,468 | | | $ | 1,496 | | | $ | 1,806 | | | $ | 1,281 | | | $ | 704 | | |
(a) Per share data was calculated using the average shares outstanding during the period.
(b) Net investment income per share reflects a special dividend. The effect of this dividend amounted to $0.02 per share.
(c) Total return at net asset value assuming all distributions reinvested and no contingent deferred sales charge.
(d) Had the investment advisor and/or any of its affiliates not waived fees or reimbursed a portion of expenses, total return would have been reduced.
(e) Total return includes a voluntary reimbursement by the investment advisor for a realized investment loss due to a trading error. This reimbursement increased total return and net asset value per share by less than 0.01% and less than $0.01, respectively.
(f) The benefits derived from expense reductions had an impact of less than 0.01%.
(g) The benefits derived from expense reductions had an impact of 0.01%.
(h) Rounds to less than 0.01%.
See Accompanying Notes to Financial Statements.
77
Financial Highlights – Columbia Asset Allocation Fund
Selected data for a share outstanding throughout each period is as follows:
| | | Year Ended September 30, | |
| Class T Shares | | 2009 | | 2008 | | 2007 (a) | | 2006 | | 2005 | |
| Net Asset Value, Beginning of Period | | $ | 12.58 | | | $ | 16.82 | | | $ | 16.08 | | | $ | 16.48 | | | $ | 15.07 | | |
| Income from Investment Operations: | |
| Net investment income (b) | | | 0.25 | | | | 0.31 | | | | 0.31 | | | | 0.28 | | | | 0.26 | (c) | |
Net realized and unrealized gain (loss) on investments,
foreign currency, futures contracts, foreign capital gains tax
and written options | | | 0.02 | | | | (2.78 | ) | | | 1.86 | | | | 0.87 | | | | 1.41 | | |
| Total from investment operations | | | 0.27 | | | | (2.47 | ) | | | 2.17 | | | | 1.15 | | | | 1.67 | | |
| Less Distributions to Shareholders: | |
| From net investment income | | | (0.24 | ) | | | (0.33 | ) | | | (0.32 | ) | | | (0.31 | ) | | | (0.26 | ) | |
| From net realized gains | | | — | | | | (1.44 | ) | | | (1.11 | ) | | | (1.24 | ) | | | — | | |
| Total distributions to shareholders | | | (0.24 | ) | | | (1.77 | ) | | | (1.43 | ) | | | (1.55 | ) | | | (0.26 | ) | |
| Net Asset Value, End of Period | | $ | 12.61 | | | $ | 12.58 | | | $ | 16.82 | | | $ | 16.08 | | | $ | 16.48 | | |
| Total return (d) | | | 2.50 | %(e) | | | (16.32 | )% | | | 14.17 | % | | | 7.39 | %(e)(f) | | | 11.14 | %(e) | |
| Ratios to Average Net Assets/Supplemental Data: | |
| Net expenses before interest expense | | | 1.30 | %(g) | | | 1.34 | %(h) | | | 1.37 | %(g) | | | 1.36 | %(g) | | | 1.40 | %(g) | |
| Interest expense | | | — | %(i) | | | — | | | | — | | | | — | | | | — | | |
| Net expenses | | | 1.30 | %(g) | | | 1.34 | %(h) | | | 1.37 | %(g) | | | 1.36 | %(g) | | | 1.40 | %(g) | |
| Waiver/Reimbursement | | | 0.22 | % | | | — | | | | — | | | | 0.01 | % | | | 0.01 | % | |
| Net investment income | | | 2.31 | %(g) | | | 2.10 | %(h) | | | 1.92 | %(g) | | | 1.78 | %(g) | | | 1.62 | %(g) | |
| Portfolio turnover rate | | | 107 | % | | | 94 | % | | | 100 | % | | | 98 | % | | | 86 | % | |
| Net assets, end of period (000s) | | $ | 113,895 | | | $ | 130,863 | | | $ | 180,757 | | | $ | 175,348 | | | $ | 184,795 | | |
(a) On August 8, 2007, Class G shares were converted to Class T shares.
(b) Per share data was calculated using the average shares outstanding during the period.
(c) Net investment income per share reflects a special dividend. The effect of this dividend amounted to $0.02 per share.
(d) Total return at net asset value assuming all distributions reinvested and no initial sales charge or contingent deferred sales charge.
(e) Had the investment advisor and/or any of its affiliates not waived fees or reimbursed a portion of expenses, total return would have been reduced.
(f) Total return includes a voluntary reimbursement by the investment advisor for a realized investment loss due to a trading error. This reimbursement increased total return and net asset value per share by less than 0.01% and less than $0.01, respectively.
(g) The benefits derived from expense reductions had an impact of less than 0.01%.
(h) The benefits derived from expense reductions had an impact of 0.01%.
(i) Rounds to less than 0.01%.
See Accompanying Notes to Financial Statements.
78
Financial Highlights – Columbia Asset Allocation Fund
Selected data for a share outstanding throughout each period is as follows:
| | | Year Ended September 30, | |
| Class Z Shares | | 2009 | | 2008 | | 2007 | | 2006 | | 2005 | |
| Net Asset Value, Beginning of Period | | $ | 12.58 | | | $ | 16.82 | | | $ | 16.07 | | | $ | 16.48 | | | $ | 15.06 | | |
| Income from Investment Operations: | |
| Net investment income (a) | | | 0.29 | | | | 0.35 | | | | 0.36 | | | | 0.33 | | | | 0.31 | (b) | |
Net realized and unrealized gain (loss) on investments,
foreign currency, futures contracts, foreign capital gains tax
and written options | | | 0.07 | | | | (2.77 | ) | | | 1.87 | | | | 0.85 | | | | 1.42 | | |
| Total from investment operations | | | 0.36 | | | | (2.42 | ) | | | 2.23 | | | | 1.18 | | | | 1.73 | | |
| Less Distributions to Shareholders: | |
| From net investment income | | | (0.28 | ) | | | (0.38 | ) | | | (0.37 | ) | | | (0.35 | ) | | | (0.31 | ) | |
| From net realized gains | | | — | | | | (1.44 | ) | | | (1.11 | ) | | | (1.24 | ) | | | — | | |
| Total distributions to shareholders | | | (0.28 | ) | | | (1.82 | ) | | | (1.48 | ) | | | (1.59 | ) | | | (0.31 | ) | |
| Net Asset Value, End of Period | | $ | 12.66 | | | $ | 12.58 | | | $ | 16.82 | | | $ | 16.07 | | | $ | 16.48 | | |
| Total return (c) | | | 3.21 | %(d) | | | (16.06 | )% | | | 14.58 | % | | | 7.65 | %(d)(e) | | | 11.54 | %(d) | |
| Ratios to Average Net Assets/Supplemental Data: | |
| Net expenses before interest expense | | | 1.00 | %(f) | | | 1.04 | %(g) | | | 1.07 | %(f) | | | 1.06 | %(f) | | | 1.10 | %(f) | |
| Interest expense | | | — | %(h) | | | — | | | | — | | | | — | | | | — | | |
| Net expenses | | | 1.00 | %(f) | | | 1.04 | %(g) | | | 1.07 | %(f) | | | 1.06 | %(f) | | | 1.10 | %(f) | |
| Waiver/Reimbursement | | | 0.22 | % | | | — | | | | — | | | | 0.01 | % | | | 0.01 | % | |
| Net investment income | | | 2.60 | %(f) | | | 2.40 | %(g) | | | 2.21 | %(f) | | | 2.09 | %(f) | | | 1.92 | %(f) | |
| Portfolio turnover rate | | | 107 | % | | | 94 | % | | | 100 | % | | | 98 | % | | | 86 | % | |
| Net assets, end of period (000s) | | $ | 96,807 | | | $ | 107,424 | | | $ | 144,513 | | | $ | 151,703 | | | $ | 167,278 | | |
(a) Per share data was calculated using the average shares outstanding during the period.
(b) Net investment income per share reflects a special dividend. The effect of this dividend amounted to $0.02 per share.
(c) Total return at net asset value assuming all distributions reinvested.
(d) Had the investment advisor and/or any of its affiliates not waived fees or reimbursed a portion of expenses, total return would have been reduced.
(e) Total return includes a voluntary reimbursement by the investment advisor for a realized investment loss due to a trading error. This reimbursement increased total return and net asset value per share by less than 0.01% and less than $0.01, respectively.
(f) The benefits derived from expense reductions had an impact of less than 0.01%.
(g) The benefits derived from expense reductions had an impact of 0.01%.
(h) Rounds to less than 0.01%.
See Accompanying Notes to Financial Statements.
79
Financial Highlights – Columbia Large Cap Growth Fund
Selected data for a share outstanding throughout each period is as follows:
| | | Year Ended September 30, | |
| Class A Shares | | 2009 | | 2008 | | 2007 | | 2006 | | 2005 | |
| Net Asset Value, Beginning of Period | | $ | 19.57 | | | $ | 26.76 | | | $ | 22.27 | | | $ | 21.11 | | | $ | 18.57 | | |
| Income from Investment Operations: | |
| Net investment income (a) | | | 0.07 | | | | 0.01 | | | | 0.02 | | | | 0.01 | | | | 0.05 | (b) | |
| Net realized and unrealized gain (loss) on investments | | | (0.86 | ) | | | (5.40 | ) | | | 4.87 | | | | 1.19 | | | | 2.51 | | |
| Total from investment operations | | | (0.79 | ) | | | (5.39 | ) | | | 4.89 | | | | 1.20 | | | | 2.56 | | |
| Less Distributions to Shareholders: | |
| From net investment income | | | (0.02 | ) | | | — | | | | (0.03 | ) | | | (0.04 | ) | | | (0.02 | ) | |
| From net realized gains | | | — | | | | (1.81 | ) | | | (0.37 | ) | | | — | | | | — | | |
| Total distributions to shareholders | | | (0.02 | ) | | | (1.81 | ) | | | (0.40 | ) | | | (0.04 | ) | | | (0.02 | ) | |
| Increase from regulatory settlements | | | 0.01 | | | | 0.01 | | | | — | | | | — | | | | — | | |
| Net Asset Value, End of Period | | $ | 18.77 | | | $ | 19.57 | | | $ | 26.76 | | | $ | 22.27 | | | $ | 21.11 | | |
| Total return (c) | | | (3.97 | )% | | | (21.73 | )% | | | 22.19 | % | | | 5.69 | %(d) | | | 13.80 | %(d) | |
| Ratios to Average Net Assets/Supplemental Data: | |
| Net expenses before interest expense | | | 1.13 | %(e) | | | 1.02 | %(f) | | | 1.00 | %(e) | | | 1.01 | %(e) | | | 1.11 | %(e) | |
| Interest expense | | | — | %(g) | | | — | | | | — | %(g) | | | — | %(g) | | | — | | |
| Net expenses | | | 1.13 | %(e) | | | 1.02 | %(f) | | | 1.00 | %(e) | | | 1.01 | %(e) | | | 1.11 | %(e) | |
| Waiver/Reimbursement | | | — | | | | — | | | | — | | | | — | %(g) | | | — | %(g) | |
| Net investment income | | | 0.43 | %(e) | | | 0.01 | %(f) | | | 0.07 | %(e) | | | 0.07 | %(e) | | | 0.25 | %(e) | |
| Portfolio turnover rate | | | 146 | % | | | 164 | % | | | 151 | % | | | 171 | % | | | 113 | % | |
| Net assets, end of period (000s) | | $ | 145,825 | | | $ | 156,585 | | | $ | 167,408 | | | $ | 125,124 | | | $ | 10,422 | | |
(a) Per share data was calculated using the average shares outstanding during the period.
(b) Net investment income per share reflects a special dividend. The effect of this dividend amounted to $0.09 per share.
(c) Total return at net asset value assuming all distributions reinvested and no initial sales charge or contingent deferred sales charge.
(d) Had the investment advisor and/or any of its affiliates not waived fees or reimbursed a portion of expenses, total return would have been reduced.
(e) The benefits derived from expense reductions had an impact of less than 0.01%.
(f) The benefits derived from expense reductions had an impact of 0.01%.
(g) Rounds to less than 0.01%.
See Accompanying Notes to Financial Statements.
80
Financial Highlights – Columbia Large Cap Growth Fund
Selected data for a share outstanding throughout each period is as follows:
| | | Year Ended September 30, | |
| Class B Shares | | 2009 | | 2008 | | 2007 | | 2006 | | 2005 | |
| Net Asset Value, Beginning of Period | | $ | 18.15 | | | $ | 25.12 | | | $ | 21.05 | | | $ | 20.07 | | | $ | 17.76 | | |
| Income from Investment Operations: | |
| Net investment loss (a) | | | (0.04 | ) | | | (0.17 | ) | | | (0.16 | ) | | | (0.13 | ) | | | (0.09 | )(b) | |
| Net realized and unrealized gain (loss) on investments | | | (0.82 | ) | | | (5.00 | ) | | | 4.60 | | | | 1.11 | | | | 2.40 | | |
| Total from investment operations | | | (0.86 | ) | | | (5.17 | ) | | | 4.44 | | | | 0.98 | | | | 2.31 | | |
| Less Distributions to Shareholders: | |
| From net realized gains | | | — | | | | (1.81 | ) | | | (0.37 | ) | | | — | | | | — | | |
| Increase from regulatory settlements | | | 0.01 | | | | 0.01 | | | | — | | | | — | | | | — | | |
| Net Asset Value, End of Period | | $ | 17.30 | | | $ | 18.15 | | | $ | 25.12 | | | $ | 21.05 | | | $ | 20.07 | | |
| Total return (c) | | | (4.68 | )% | | | (22.31 | )% | | | 21.31 | % | | | 4.88 | %(d) | | | 13.01 | %(d) | |
| Ratios to Average Net Assets/Supplemental Data: | |
| Net expenses before interest expense | | | 1.88 | %(e) | | | 1.77 | %(f) | | | 1.75 | %(e) | | | 1.76 | %(e) | | | 1.86 | %(e) | |
| Interest expense | | | — | %(g) | | | — | | | | — | %(g) | | | — | %(g) | | | — | | |
| Net expenses | | | 1.88 | %(e) | | | 1.77 | %(f) | | | 1.75 | %(e) | | | 1.76 | %(e) | | | 1.86 | %(e) | |
| Waiver/Reimbursement | | | — | | | | — | | | | — | | | | — | %(g) | | | — | %(g) | |
| Net investment loss | | | (0.30 | )%(e) | | | (0.77 | )%(f) | | | (0.69 | )%(e) | | | (0.72 | )%(e) | | | (0.48 | )%(e) | |
| Portfolio turnover rate | | | 146 | % | | | 164 | % | | | 151 | % | | | 171 | % | | | 113 | % | |
| Net assets, end of period (000s) | | $ | 24,951 | | | $ | 58,609 | | | $ | 168,284 | | | $ | 227,160 | | | $ | 7,799 | | |
(a) Per share data was calculated using the average shares outstanding during the period.
(b) Net investment income per share reflects a special dividend. The effect of this dividend amounted to $0.09 per share.
(c) Total return at net asset value assuming all distributions reinvested and no contingent deferred sales charge.
(d) Had the investment advisor and/or any of its affiliates not waived fees or reimbursed a portion of expenses, total return would have been reduced.
(e) The benefits derived from expense reductions had an impact of less than 0.01%.
(f) The benefits derived from expense reductions had an impact of 0.01%.
(g) Rounds to less than 0.01%.
See Accompanying Notes to Financial Statements.
81
Financial Highlights – Columbia Large Cap Growth Fund
Selected data for a share outstanding throughout each period is as follows:
| | | Year Ended September 30, | |
| Class C Shares | | 2009 | | 2008 | | 2007 | | 2006 | | 2005 | |
| Net Asset Value, Beginning of Period | | $ | 18.16 | | | $ | 25.14 | | | $ | 21.06 | | | $ | 20.10 | | | $ | 17.79 | | |
| Income from Investment Operations: | |
| Net investment loss (a) | | | (0.05 | ) | | | (0.16 | ) | | | (0.16 | ) | | | (0.13 | ) | | | (0.09 | )(b) | |
| Net realized and unrealized gain (loss) on investments | | | (0.81 | ) | | | (5.02 | ) | | | 4.61 | | | | 1.09 | | | | 2.40 | | |
| Total from investment operations | | | (0.86 | ) | | | (5.18 | ) | | | 4.45 | | | | 0.96 | | | | 2.31 | | |
| Less Distributions to Shareholders: | |
| From net realized gains | | | — | | | | (1.81 | ) | | | (0.37 | ) | | | — | | | | — | | |
| Increase from regulatory settlements | | | 0.01 | | | | 0.01 | | | | — | | | | — | | | | — | | |
| Net Asset Value, End of Period | | $ | 17.31 | | | $ | 18.16 | | | $ | 25.14 | | | $ | 21.06 | | | $ | 20.10 | | |
| Total return (c) | | | (4.68 | )% | | | (22.33 | )% | | | 21.34 | % | | | 4.78 | %(d) | | | 12.98 | %(d) | |
| Ratios to Average Net Assets/Supplemental Data: | |
| Net expenses before interest expense | | | 1.88 | %(e) | | | 1.77 | %(f) | | | 1.75 | %(e) | | | 1.76 | %(e) | | | 1.86 | %(e) | |
| Interest expense | | | — | %(g) | | | — | | | | — | %(g) | | | — | %(g) | | | — | | |
| Net expenses | | | 1.88 | %(e) | | | 1.77 | %(f) | | | 1.75 | %(e) | | | 1.76 | %(e) | | | 1.86 | %(e) | |
| Waiver/Reimbursement | | | — | | | | — | | | | — | | | | — | %(g) | | | — | %(g) | |
| Net investment loss | | | (0.33 | )%(e) | | | (0.75 | )%(f) | | | (0.68 | )%(e) | | | (0.69 | )%(e) | | | (0.45 | )%(e) | |
| Portfolio turnover rate | | | 146 | % | | | 164 | % | | | 151 | % | | | 171 | % | | | 113 | % | |
| Net assets, end of period (000s) | | $ | 17,283 | | | $ | 21,208 | | | $ | 31,834 | | | $ | 31,046 | | | $ | 1,419 | | |
(a) Per share data was calculated using the average shares outstanding during the period.
(b) Net investment income per share reflects a special dividend. The effect of this dividend amounted to $0.09 per share.
(c) Total return at net asset value assuming all distributions reinvested and no contingent deferred sales charge.
(d) Had the investment advisor and/or any of its affiliates not waived fees or reimbursed a portion of expenses, total return would have been reduced.
(e) The benefits derived from expense reductions had an impact of less than 0.01%.
(f) The benefits derived from expense reductions had an impact of 0.01%.
(g) Rounds to less than 0.01%.
See Accompanying Notes to Financial Statements.
82
Financial Highlights – Columbia Large Cap Growth Fund
Selected data for a share outstanding throughout each period is as follows:
| | | Year Ended September 30, | | Period Ended
September 30, | |
| Class E Shares | | 2009 | | 2008 | | 2007 | | 2006 (a) | |
| Net Asset Value, Beginning of Year | | $ | 19.53 | | | $ | 26.74 | | | $ | 22.27 | | | $ | 22.13 | | |
| Income from Investment Operations: | |
| Net investment income (loss) (b) | | | 0.05 | | | | (0.02 | ) | | | (0.01 | ) | | | — | (c) | |
| Net realized and unrealized gain (loss) on investments | | | (0.86 | ) | | | (5.39 | ) | | | 4.87 | | | | 0.14 | | |
| Total from investment operations | | | (0.81 | ) | | | (5.41 | ) | | | 4.86 | | | | 0.14 | | |
| Less Distributions to Shareholders: | |
| From net investment income | | | — | (c) | | | — | | | | (0.02 | ) | | | — | | |
| From net realized gains | | | — | | | | (1.81 | ) | | | (0.37 | ) | | | — | | |
| Total distributions to shareholders | | | — | (c) | | | (1.81 | ) | | | (0.39 | ) | | | — | | |
| Increase from regulatory settlements | | | 0.01 | | | | 0.01 | | | | — | | | | — | | |
| Net Asset Value, End of Year | | $ | 18.73 | | | $ | 19.53 | | | $ | 26.74 | | | $ | 22.27 | | |
| Total return (d) | | | (4.09 | )% | | | (21.82 | )% | | | 22.07 | % | | | 0.63 | %(e)(f) | |
| Ratios to Average Net Assets/Supplemental Data: | |
| Net expenses before interest expense | | | 1.23 | %(g) | | | 1.12 | %(h) | | | 1.10 | %(g) | | | 1.12 | %(g)(i) | |
| Interest expense | | | — | %(j) | | | — | | | | — | %(j) | | | — | %(i)(j) | |
| Net expenses | | | 1.23 | %(g) | | | 1.12 | %(h) | | | 1.10 | %(g) | | | 1.12 | %(g)(i) | |
| Waiver/Reimbursement | | | — | | | | — | | | | — | | | | — | %(i)(j) | |
| Net investment income (loss) | | | 0.33 | %(g) | | | (0.09 | )%(h) | | | (0.03 | )%(g) | | | (0.23 | )%(g)(i) | |
| Portfolio turnover rate | | | 146 | % | | | 164 | % | | | 151 | % | | | 171 | %(f) | |
| Net assets, end of period (000s) | | $ | 13,144 | | | $ | 14,782 | | | $ | 18,185 | | | $ | 13,071 | | |
(a) Class E shares commenced operations on September 22, 2006. Per share data and total return reflect activity from that date.
(b) Per share data was calculated using the average shares outstanding during the period.
(c) Rounds to less than $0.01 per share.
(d) Total return at net asset value assuming all distributions reinvested and no initial sales charge or contingent deferred sales charge.
(e) Had the investment advisor and/or any of its affiliates not waived fees or reimbursed a portion of expenses, total return would have been reduced.
(f) Not annualized.
(g) The benefits derived from expense reductions had an impact of less than 0.01%.
(h) The benefits derived from expense reductions had an impact of 0.01%.
(i) Annualized.
(j) Rounds to less than 0.01%.
See Accompanying Notes to Financial Statements.
83
Financial Highlights – Columbia Large Cap Growth Fund
Selected data for a share outstanding throughout each period is as follows:
| | | Year Ended September 30, | | Period Ended
September 30, | |
| Class F Shares | | 2009 | | 2008 | | 2007 | | 2006 (a) | |
| Net Asset Value, Beginning of Year | | $ | 18.14 | | | $ | 25.11 | | | $ | 21.05 | | | $ | 20.93 | | |
| Income from Investment Operations: | |
| Net investment loss (b) | | | (0.05 | ) | | | (0.18 | ) | | | (0.16 | ) | | | — | (c) | |
| Net realized and unrealized gain (loss) on investments | | | (0.81 | ) | | | (4.99 | ) | | | 4.59 | | | | 0.12 | | |
| Total from investment operations | | | (0.86 | ) | | | (5.17 | ) | | | 4.43 | | | | 0.12 | | |
| Less Distributions to Shareholders: | |
| From net realized gains | | | — | | | | (1.81 | ) | | | (0.37 | ) | | | — | | |
| Increase from regulatory settlements | | | 0.01 | | | | 0.01 | | | | — | | | | — | | |
| Net Asset Value, End of Year | | $ | 17.29 | | | $ | 18.14 | | | $ | 25.11 | | | $ | 21.05 | | |
| Total return (d) | | | (4.69 | )% | | | (22.31 | )% | | | 21.26 | % | | | 0.57 | %(e)(f) | |
| Ratios to Average Net Assets/Supplemental Data: | |
| Net expenses before interest expense | | | 1.88 | %(g) | | | 1.77 | %(h) | | | 1.75 | %(g) | | | 1.77 | %(g)(i) | |
| Interest expense | | | — | %(j) | | | — | | | | — | %(j) | | | — | %(i)(j) | |
| Net expenses | | | 1.88 | %(g) | | | 1.77 | %(h) | | | 1.75 | %(g) | | | 1.77 | %(g)(i) | |
| Waiver/Reimbursement | | | — | | | | — | | | | — | | | | — | %(i)(j) | |
| Net investment loss | | | (0.32 | )%(g) | | | (0.80 | )%(h) | | | (0.70 | )%(g) | | | (0.88 | )%(g)(i) | |
| Portfolio turnover rate | | | 146 | % | | | 164 | % | | | 151 | % | | | 171 | %(f) | |
| Net assets, end of period (000s) | | $ | 292 | | | $ | 380 | | | $ | 2,915 | | | $ | 5,319 | | |
(a) Class F shares commenced operations on September 22, 2006. Per share data and total return reflect activity from that date.
(b) Per share data was calculated using the average shares outstanding during the period.
(c) Rounds to less than $0.01 per share.
(d) Total return at net asset value assuming all distributions reinvested and no contingent deferred sales charge.
(e) Had the investment advisor and/or any of its affiliates not waived fees or reimbursed a portion of expenses, total return would have been reduced.
(f) Not annualized.
(g) The benefits derived from expense reductions had an impact of less than 0.01%.
(h) The benefits derived from expense reductions had an impact of 0.01%.
(i) Annualized.
(j) Rounds to less than 0.01%.
See Accompanying Notes to Financial Statements.
84
Financial Highlights – Columbia Large Cap Growth Fund
Selected data for a share outstanding throughout each period is as follows:
| | | Year Ended September 30, | |
| Class T Shares | | 2009 | | 2008 | | 2007 (a) | | 2006 | | 2005 | |
| Net Asset Value, Beginning of Period | | $ | 19.42 | | | $ | 26.58 | | | $ | 22.13 | | | $ | 20.98 | | | $ | 18.46 | | |
| Income from Investment Operations: | |
| Net investment income (loss) (b) | | | 0.06 | | | | (0.01 | ) | | | 0.01 | | | | 0.01 | | | | 0.07 | (c) | |
| Net realized and unrealized gain (loss) on investments | | | (0.85 | ) | | | (5.35 | ) | | | 4.84 | | | | 1.17 | | | | 2.47 | | |
| Total from investment operations | | | (0.79 | ) | | | (5.36 | ) | | | 4.85 | | | | 1.18 | | | | 2.54 | | |
| Less Distributions to Shareholders: | |
| From net investment income | | | — | | | | — | | | | (0.03 | ) | | | (0.03 | ) | | | (0.02 | ) | |
| From net realized gains | | | — | | | | (1.81 | ) | | | (0.37 | ) | | | — | | | | — | | |
| Total distributions to shareholders | | | — | | | | (1.81 | ) | | | (0.40 | ) | | | (0.03 | ) | | | (0.02 | ) | |
| Increase from regulatory settlements | | | 0.01 | | | | 0.01 | | | | — | | | | — | | | | — | | |
| Net Asset Value, End of Period | | $ | 18.64 | | | $ | 19.42 | | | $ | 26.58 | | | $ | 22.13 | | | $ | 20.98 | | |
| Total return (d) | | | (4.02 | )% | | | (21.76 | )% | | | 22.14 | % | | | 5.63 | %(e) | | | 13.76 | %(e) | |
| Ratios to Average Net Assets/Supplemental Data: | |
| Net expenses before interest expense | | | 1.18 | %(f) | | | 1.07 | %(g) | | | 1.05 | %(f) | | | 1.06 | %(f) | | | 1.16 | %(f) | |
| Interest expense | | | — | %(h) | | | — | | | | — | %(h) | | | — | %(h) | | | — | | |
| Net expenses | | | 1.18 | %(f) | | | 1.07 | %(g) | | | 1.05 | %(f) | | | 1.06 | %(f) | | | 1.16 | %(f) | |
| Waiver/Reimbursement | | | — | | | | — | | | | — | | | | — | %(h) | | | — | %(h) | |
| Net investment income (loss) | | | 0.38 | %(f) | | | (0.05 | )%(g) | | | 0.02 | %(f) | | | 0.06 | %(f) | | | 0.33 | %(f) | |
| Portfolio turnover rate | | | 146 | % | | | 164 | % | | | 151 | % | | | 171 | % | | | 113 | % | |
| Net assets, end of period (000s) | | $ | 145,011 | | | $ | 169,295 | | | $ | 244,901 | | | $ | 209,952 | | | $ | 218,095 | | |
(a) On August 8, 2007, Class G shares were converted to Class T shares.
(b) Per share data was calculated using the average shares outstanding during the period.
(c) Net investment income per share reflects a special dividend. The effect of this dividend amounted to $0.09 per share.
(d) Total return at net asset value assuming all distributions reinvested and no initial sales charge or contingent deferred sales charge.
(e) Had the investment advisor and/or any of its affiliates not waived fees or reimbursed a portion of expenses, total return would have been reduced.
(f) The benefits derived from expense reductions had an impact of less than 0.01%.
(g) The benefits derived from expense reductions had an impact of 0.01%.
(h) Rounds to less than 0.01%.
See Accompanying Notes to Financial Statements.
85
Financial Highlights – Columbia Large Cap Growth Fund
Selected data for a share outstanding throughout the period is as follows:
| Class Y Shares | | Period Ended
September 30,
2009 (a) | |
| Net Asset Value, Beginning of Year | | $ | 17.02 | | |
| Income from Investment Operations: | |
| Net investment income (b) | | | 0.03 | | |
| Net realized and unrealized gain on investments | | | 2.15 | | |
| Total from investment operations | | | 2.18 | | |
| Net Asset Value, End of Period | | $ | 19.20 | | |
| Total return (c)(d) | | | 12.81 | % | |
| Ratios to Average Net Assets: | |
| Net expenses before interest expense (e)(f) | | | 0.63 | % | |
| Interest expense (f)(g) | | | — | % | |
| Net expenses (e)(f) | | | 0.63 | % | |
| Net investment income (e)(f) | | | 0.78 | % | |
| Portfolio turnover rate (d) | | | 146 | % | |
| Net assets, end of period (000s) | | $ | 16,686 | | |
(a) Class Y shares commenced operations on July 15, 2009. Per share data and total return reflect activity from that date.
(b) Per share data was calculated using the average shares outstanding during the period.
(c) Total return at net asset value.
(d) Not annualized.
(e) The benefits derived from expense reductions had an impact of less than 0.01%.
(f) Annualized.
(g) Rounds to less than 0.01%.
See Accompanying Notes to Financial Statements.
86
Financial Highlights – Columbia Large Cap Growth Fund
Selected data for a share outstanding throughout each period is as follows:
| | | Year Ended September 30, | |
| Class Z Shares | | 2009 | | 2008 | | 2007 | | 2006 | | 2005 | |
| Net Asset Value, Beginning of Period | | $ | 20.02 | | | $ | 27.32 | | | $ | 22.68 | | | $ | 21.50 | | | $ | 18.87 | | |
| Income from Investment Operations: | |
| Net investment income (a) | | | 0.11 | | | | 0.06 | | | | 0.08 | | | | 0.08 | | | | 0.11 | (b) | |
| Net realized and unrealized gain (loss) on investments | | | (0.88 | ) | | | (5.51 | ) | | | 4.97 | | | | 1.19 | | | | 2.55 | | |
| Total from investment operations | | | (0.77 | ) | | | (5.45 | ) | | | 5.05 | | | | 1.27 | | | | 2.66 | | |
| Less Distributions to Shareholders: | |
| From net investment income | | | (0.06 | ) | | | (0.05 | ) | | | (0.04 | ) | | | (0.09 | ) | | | (0.03 | ) | |
| From net realized gains | | | — | | | | (1.81 | ) | | | (0.37 | ) | | | — | | | | — | | |
| Total distributions to shareholders | | | (0.06 | ) | | | (1.86 | ) | | | (0.41 | ) | | | (0.09 | ) | | | (0.03 | ) | |
| Increase from regulatory settlements | | | 0.01 | | | | 0.01 | | | | — | | | | — | | | | — | | |
| Net Asset Value, End of Period | | $ | 19.20 | | | $ | 20.02 | | | $ | 27.32 | | | $ | 22.68 | | | $ | 21.50 | | |
| Total return (c) | | | (3.71 | )% | | | (21.55 | )% | | | 22.53 | % | | | 5.92 | %(d) | | | 14.12 | %(d) | |
| Ratios to Average Net Assets/Supplemental Data: | |
| Net expenses before interest expense | | | 0.88 | %(e) | | | 0.77 | %(f) | | | 0.75 | %(e) | | | 0.76 | %(e) | | | 0.86 | %(e) | |
| Interest expense | | | — | %(g) | | | — | | | | — | %(g) | | | — | %(g) | | | — | | |
| Net expenses | | | 0.88 | %(e) | | | 0.77 | %(f) | | | 0.75 | %(e) | | | 0.76 | %(e) | | | 0.86 | %(e) | |
| Waiver/Reimbursement | | | — | | | | — | | | | — | | | | — | %(g) | | | — | %(g) | |
| Net investment income | | | 0.67 | %(e) | | | 0.25 | %(f) | | | 0.32 | %(e) | | | 0.35 | %(e) | | | 0.53 | %(e) | |
| Portfolio turnover rate | | | 146 | % | | | 164 | % | | | 151 | % | | | 171 | % | | | 113 | % | |
| Net assets, end of period (000s) | | $ | 940,823 | | | $ | 979,353 | | | $ | 1,302,932 | | | $ | 1,169,103 | | | $ | 1,242,736 | | |
(a) Per share data was calculated using the average shares outstanding during the period.
(b) Net investment income per share reflects a special dividend. The effect of this dividend amounted to $0.09 per share.
(c) Total return at net asset value assuming all distributions reinvested.
(d) Had the investment advisor and/or any of its affiliates not waived fees or reimbursed a portion of expenses, total return would have been reduced.
(e) The benefits derived from expense reductions had an impact of less than 0.01%.
(f) The benefits derived from expense reductions had an impact of 0.01%.
(g) Rounds to less than 0.01%.
See Accompanying Notes to Financial Statements.
87
Financial Highlights – Columbia Disciplined Value Fund
Selected data for a share outstanding throughout each period is as follows:
| | | Year Ended September 30, | |
| Class A Shares | | 2009 | | 2008 | | 2007 | | 2006 | | 2005 | |
| Net Asset Value, Beginning of Period | | $ | 10.53 | | | $ | 16.32 | | | $ | 15.70 | | | $ | 14.60 | | | $ | 12.71 | | |
| Income from Investment Operations: | |
| Net investment income (a) | | | 0.15 | | | | 0.17 | | | | 0.14 | | | | 0.17 | | | | 0.17 | (b) | |
Net realized and unrealized gain (loss) on investments
and futures contracts | | | (1.00 | ) | | | (3.96 | ) | | | 2.10 | | | | 2.18 | | | | 1.88 | | |
| Total from investment operations | | | (0.85 | ) | | | (3.79 | ) | | | 2.24 | | | | 2.35 | | | | 2.05 | | |
| Less Distributions to Shareholders: | |
| From net investment income | | | (0.16 | ) | | | (0.17 | ) | | | (0.16 | ) | | | (0.18 | ) | | | (0.16 | ) | |
| From net realized gains | | | — | | | | (1.83 | ) | | | (1.46 | ) | | | (1.07 | ) | | | — | | |
| Total distributions to shareholders | | | (0.16 | ) | | | (2.00 | ) | | | (1.62 | ) | | | (1.25 | ) | | | (0.16 | ) | |
| Net Asset Value, End of Period | | $ | 9.52 | | | $ | 10.53 | | | $ | 16.32 | | | $ | 15.70 | | | $ | 14.60 | | |
| Total return (c) | | | (7.72 | )% | | | (26.09 | )% | | | 15.00 | % | | | 17.19 | %(d) | | | 16.21 | %(d) | |
| Ratios to Average Net Assets/Supplemental Data: | |
| Net expenses before interest expense (e) | | | 1.29 | % | | | 1.28 | % | | | 1.24 | % | | | 1.21 | % | | | 1.23 | % | |
| Interest expense | | | — | %(f) | | | — | %(f) | | | — | | | | — | %(f) | | | — | | |
| Net expenses (e) | | | 1.29 | % | | | 1.28 | % | | | 1.24 | % | | | 1.21 | % | | | 1.23 | % | |
| Waiver/Reimbursement | | | — | | | | — | | | | — | | | | — | %(f) | | | 0.01 | % | |
| Net investment income (e) | | | 1.94 | % | | | 1.32 | % | | | 0.89 | % | | | 1.15 | % | | | 1.21 | % | |
| Portfolio turnover rate | | | 170 | % | | | 78 | % | | | 91 | % | | | 81 | % | | | 94 | % | |
| Net assets, end of period (000s) | | $ | 10,543 | | | $ | 16,171 | | | $ | 34,706 | | | $ | 12,717 | | | $ | 4,269 | | |
(a) Per share data was calculated using the average shares outstanding during the period.
(b) Net investment income per share reflects a special dividend. The effect of this dividend amounted to $0.02 per share.
(c) Total return at net asset value assuming all distributions reinvested and no initial sales charge or contingent deferred sales charge.
(d) Had the investment advisor and/or any of its affiliates not waived fees or reimbursed a portion of expenses, total return would have been reduced.
(e) The benefits derived from expense reductions had an impact of less than 0.01%.
(f) Rounds to less than 0.01%.
See Accompanying Notes to Financial Statements.
88
Financial Highlights – Columbia Disciplined Value Fund
Selected data for a share outstanding throughout each period is as follows:
| | | Year Ended September 30, | |
| Class B Shares | | 2009 | | 2008 | | 2007 | | 2006 | | 2005 | |
| Net Asset Value, Beginning of Period | | $ | 9.92 | | | $ | 15.47 | | | $ | 14.96 | | | $ | 13.96 | | | $ | 12.16 | | |
| Income from Investment Operations: | |
| Net investment income (a) | | | 0.09 | | | | 0.07 | | | | 0.03 | | | | 0.06 | | | | 0.06 | (b) | |
Net realized and unrealized gain (loss) on investments
and futures contracts | | | (0.94 | ) | | | (3.72 | ) | | | 1.98 | | | | 2.08 | | | | 1.80 | | |
| Total from investment operations | | | (0.85 | ) | | | (3.65 | ) | | | 2.01 | | | | 2.14 | | | | 1.86 | | |
| Less Distributions to Shareholders: | |
| From net investment income | | | (0.10 | ) | | | (0.07 | ) | | | (0.04 | ) | | | (0.07 | ) | | | (0.06 | ) | |
| From net realized gains | | | — | | | | (1.83 | ) | | | (1.46 | ) | | | (1.07 | ) | | | — | | |
| Total distributions to shareholders | | | (0.10 | ) | | | (1.90 | ) | | | (1.50 | ) | | | (1.14 | ) | | | (0.06 | ) | |
| Net Asset Value, End of Period | | $ | 8.97 | | | $ | 9.92 | | | $ | 15.47 | | | $ | 14.96 | | | $ | 13.96 | | |
| Total return (c) | | | (8.33 | )% | | | (26.59 | )% | | | 14.12 | % | | | 16.35 | %(d) | | | 15.30 | %(d) | |
| Ratios to Average Net Assets/Supplemental Data: | |
| Net expenses before interest expense (e) | | | 2.04 | % | | | 2.03 | % | | | 1.99 | % | | | 1.96 | % | | | 1.98 | % | |
| Interest expense | | | — | %(f) | | | — | %(f) | | | — | | | | — | %(f) | | | — | | |
| Net expenses (e) | | | 2.04 | % | | | 2.03 | % | | | 1.99 | % | | | 1.96 | % | | | 1.98 | % | |
| Waiver/Reimbursement | | | — | | | | — | | | | — | | | | — | %(f) | | | 0.01 | % | |
| Net investment income (e) | | | 1.22 | % | | | 0.56 | % | | | 0.19 | % | | | 0.43 | % | | | 0.46 | % | |
| Portfolio turnover rate | | | 170 | % | | | 78 | % | | | 91 | % | | | 81 | % | | | 94 | % | |
| Net assets, end of period (000s) | | $ | 2,169 | | | $ | 3,914 | | | $ | 7,690 | | | $ | 5,332 | | | $ | 3,974 | | |
(a) Per share data was calculated using the average shares outstanding during the period.
(b) Net investment income per share reflects a special dividend. The effect of this dividend amounted to $0.02 per share.
(c) Total return at net asset value assuming all distributions reinvested and no contingent deferred sales charge.
(d) Had the investment advisor and/or any of its affiliates not waived fees or reimbursed a portion of expenses, total return would have been reduced.
(e) The benefits derived from expense reductions had an impact of less than 0.01%.
(f) Rounds to less than 0.01%.
See Accompanying Notes to Financial Statements.
89
Financial Highlights – Columbia Disciplined Value Fund
Selected data for a share outstanding throughout each period is as follows:
| | | Year Ended September 30, | |
| Class C Shares | | 2009 | | 2008 | | 2007 | | 2006 | | 2005 | |
| Net Asset Value, Beginning of Period | | $ | 9.89 | | | $ | 15.44 | | | $ | 14.93 | | | $ | 13.94 | | | $ | 12.14 | | |
| Income from Investment Operations: | |
| Net investment income (a) | | | 0.09 | | | | 0.07 | | | | 0.02 | | | | 0.05 | | | | 0.06 | (b) | |
Net realized and unrealized gain (loss) on investments
and futures contracts | | | (0.94 | ) | | | (3.72 | ) | | | 1.99 | | | | 2.08 | | | | 1.80 | | |
| Total from investment operations | | | (0.85 | ) | | | (3.65 | ) | | | 2.01 | | | | 2.13 | | | | 1.86 | | |
| Less Distributions to Shareholders: | |
| From net investment income | | | (0.10 | ) | | | (0.07 | ) | | | (0.04 | ) | | | (0.07 | ) | | | (0.06 | ) | |
| From net realized gains | | | — | | | | (1.83 | ) | | | (1.46 | ) | | | (1.07 | ) | | | — | | |
| Total distributions to shareholders | | | (0.10 | ) | | | (1.90 | ) | | | (1.50 | ) | | | (1.14 | ) | | | (0.06 | ) | |
| Net Asset Value, End of Period | | $ | 8.94 | | | $ | 9.89 | | | $ | 15.44 | | | $ | 14.93 | | | $ | 13.94 | | |
| Total return (c) | | | (8.35 | )% | | | (26.64 | )% | | | 14.15 | % | | | 16.30 | %(d) | | | 15.33 | %(d) | |
| Ratios to Average Net Assets/Supplemental Data: | |
| Net expenses before interest expense (e) | | | 2.04 | % | | | 2.03 | % | | | 1.99 | % | | | 1.96 | % | | | 1.98 | % | |
| Interest expense | | | — | %(f) | | | — | %(f) | | | — | | | | — | %(f) | | | — | | |
| Net expenses (e) | | | 2.04 | % | | | 2.03 | % | | | 1.99 | % | | | 1.96 | % | | | 1.98 | % | |
| Waiver/Reimbursement | | | — | | | | — | | | | — | | | | — | %(f) | | | 0.01 | % | |
| Net investment income (e) | | | 1.18 | % | | | 0.55 | % | | | 0.14 | % | | | 0.39 | % | | | 0.49 | % | |
| Portfolio turnover rate | | | 170 | % | | | 78 | % | | | 91 | % | | | 81 | % | | | 94 | % | |
| Net assets, end of period (000s) | | $ | 2,020 | | | $ | 2,801 | | | $ | 5,650 | | | $ | 1,801 | | | $ | 453 | | |
(a) Per share data was calculated using the average shares outstanding during the period.
(b) Net investment income per share reflects a special dividend. The effect of this dividend amounted to $0.02 per share.
(c) Total return at net asset value assuming all distributions reinvested and no contingent deferred sales charge.
(d) Had the investment advisor and/or any of its affiliates not waived fees or reimbursed a portion of expenses, total return would have been reduced.
(e) The benefits derived from expense reductions had an impact of less than 0.01%.
(f) Rounds to less than 0.01%.
See Accompanying Notes to Financial Statements.
90
Financial Highlights – Columbia Disciplined Value Fund
Selected data for a share outstanding throughout each period is as follows:
| | | Year Ended September 30, | |
| Class T Shares | | 2009 | | 2008 | | 2007 (a) | | 2006 | | 2005 | |
| Net Asset Value, Beginning of Period | | $ | 10.53 | | | $ | 16.33 | | | $ | 15.70 | | | $ | 14.60 | | | $ | 12.72 | | |
| Income from Investment Operations: | |
| Net investment income (b) | | | 0.15 | | | | 0.16 | | | | 0.15 | | | | 0.17 | | | | 0.17 | (c) | |
Net realized and unrealized gain (loss) on investments
and futures contracts | | | (1.00 | ) | | | (3.97 | ) | | | 2.09 | | | | 2.18 | | | | 1.86 | | |
| Total from investment operations | | | (0.85 | ) | | | (3.81 | ) | | | 2.24 | | | | 2.35 | | | | 2.03 | | |
| Less Distributions to Shareholders: | |
| From net investment income | | | (0.16 | ) | | | (0.16 | ) | | | (0.15 | ) | | | (0.18 | ) | | | (0.15 | ) | |
| From net realized gains | | | — | | | | (1.83 | ) | | | (1.46 | ) | | | (1.07 | ) | | | — | | |
| Total distributions to shareholders | | | (0.16 | ) | | | (1.99 | ) | | | (1.61 | ) | | | (1.25 | ) | | | (0.15 | ) | |
| Net Asset Value, End of Period | | $ | 9.52 | | | $ | 10.53 | | | $ | 16.33 | | | $ | 15.70 | | | $ | 14.60 | | |
| Total return (d) | | | (7.77 | )% | | | (26.18 | )% | | | 15.01 | % | | | 17.13 | %(e) | | | 16.06 | %(e) | |
| Ratios to Average Net Assets/Supplemental Data: | |
| Net expenses before interest expense (f) | | | 1.34 | % | | | 1.33 | % | | | 1.29 | % | | | 1.26 | % | | | 1.28 | % | |
| Interest expense | | | — | %(g) | | | — | %(g) | | | — | | | | — | %(g) | | | — | | |
| Net expenses (f) | | | 1.34 | % | | | 1.33 | % | | | 1.29 | % | | | 1.26 | % | | | 1.28 | % | |
| Waiver/Reimbursement | | | — | | | | — | | | | — | | | | — | %(g) | | | 0.01 | % | |
| Net investment income (f) | | | 1.84 | % | | | 1.27 | % | | | 0.91 | % | | | 1.15 | % | | | 1.22 | % | |
| Portfolio turnover rate | | | 170 | % | | | 78 | % | | | 91 | % | | | 81 | % | | | 94 | % | |
| Net assets, end of period (000s) | | $ | 72,555 | | | $ | 89,694 | | | $ | 140,443 | | | $ | 137,595 | | | $ | 134,792 | | |
(a) On August 8, 2007, Class G shares were converted to Class T shares.
(b) Per share data was calculated using the average shares outstanding during the period.
(c) Net investment income per share reflects a special dividend. The effect of this dividend amounted to $0.02 per share.
(d) Total return at net asset value assuming all distributions reinvested and no initial sales charge or contingent deferred sales charge.
(e) Had the investment advisor and/or any of its affiliates not waived fees or reimbursed a portion of expenses, total return would have been reduced.
(f) The benefits derived from expense reductions had an impact of less than 0.01%.
(g) Rounds to less than 0.01%.
See Accompanying Notes to Financial Statements.
91
Financial Highlights – Columbia Disciplined Value Fund
Selected data for a share outstanding throughout each period is as follows:
| | | Year Ended September 30, | |
| Class Z Shares | | 2009 | | 2008 | | 2007 | | 2006 | | 2005 | |
| Net Asset Value, Beginning of Period | | $ | 10.80 | | | $ | 16.69 | | | $ | 16.02 | | | $ | 14.87 | | | $ | 12.95 | | |
| Income from Investment Operations: | |
| Net investment income (a) | | | 0.17 | | | | 0.21 | | | | 0.20 | | | | 0.22 | | | | 0.21 | (b) | |
Net realized and unrealized gain (loss) on investments
and futures contracts | | | (1.02 | ) | | | (4.07 | ) | | | 2.13 | | | | 2.22 | | | | 1.91 | | |
| Total from investment operations | | | (0.85 | ) | | | (3.86 | ) | | | 2.33 | | | | 2.44 | | | | 2.12 | | |
| Less Distributions to Shareholders: | |
| From net investment income | | | (0.18 | ) | | | (0.20 | ) | | | (0.20 | ) | | | (0.22 | ) | | | (0.20 | ) | |
| From net realized gains | | | — | | | | (1.83 | ) | | | (1.46 | ) | | | (1.07 | ) | | | — | | |
| Total distributions to shareholders | | | (0.18 | ) | | | (2.03 | ) | | | (1.66 | ) | | | (1.29 | ) | | | (0.20 | ) | |
| Net Asset Value, End of Period | | $ | 9.77 | | | $ | 10.80 | | | $ | 16.69 | | | $ | 16.02 | | | $ | 14.87 | | |
| Total return (c) | | | (7.49 | )% | | | (25.92 | )% | | | 15.29 | % | | | 17.50 | %(d) | | | 16.43 | %(d) | |
| Ratios to Average Net Assets/Supplemental Data: | |
| Net expenses before interest expense (e) | | | 1.04 | % | | | 1.03 | % | | | 0.99 | % | | | 0.96 | % | | | 0.98 | % | |
| Interest expense | | | — | %(f) | | | — | %(f) | | | — | | | | — | %(f) | | | — | | |
| Net expenses (e) | | | 1.04 | % | | | 1.03 | % | | | 0.99 | % | | | 0.96 | % | | | 0.98 | % | |
| Waiver/Reimbursement | | | — | | | | — | | | | — | | | | — | %(f) | | | 0.01 | % | |
| Net investment income (e) | | | 2.13 | % | | | 1.58 | % | | | 1.20 | % | | | 1.45 | % | | | 1.53 | % | |
| Portfolio turnover rate | | | 170 | % | | | 78 | % | | | 91 | % | | | 81 | % | | | 94 | % | |
| Net assets, end of period (000s) | | $ | 218,691 | | | $ | 222,212 | | | $ | 341,612 | | | $ | 285,941 | | | $ | 283,187 | | |
(a) Per share data was calculated using the average shares outstanding during the period.
(b) Net investment income per share reflects a special dividend. The effect of this dividend amounted to $0.02 per share.
(c) Total return at net asset value assuming all distributions reinvested.
(d) Had the investment advisor and/or any of its affiliates not waived fees or reimbursed a portion of expenses, total return would have been reduced.
(e) The benefits derived from expense reductions had an impact of less than 0.01%.
(f) Rounds to less than 0.01%.
See Accompanying Notes to Financial Statements.
92
Financial Highlights – Columbia Contrarian Core Fund
Selected data for a share outstanding throughout each period is as follows:
| | | Year Ended September 30, | |
| Class A Shares | | 2009 (a) | | 2008 | | 2007 | | 2006 | | 2005 (b) | |
| Net Asset Value, Beginning of Period | | $ | 11.89 | | | $ | 15.51 | | | $ | 14.03 | | | $ | 13.59 | | | $ | 12.01 | | |
| Income from Investment Operations: | |
| Net investment income (c) | | | 0.08 | | | | 0.07 | | | | 0.05 | | | | — | (d) | | | 0.07 | (e) | |
Net realized and unrealized gain (loss) on investments
and foreign currency | | | (0.14 | ) | | | (2.17 | ) | | | 2.60 | | | | 1.21 | | | | 1.93 | | |
| Total from investment operations | | | (0.06 | ) | | | (2.10 | ) | | | 2.65 | | | | 1.21 | | | | 2.00 | | |
| Less Distributions to Shareholders: | |
| From net investment income | | | (0.07 | ) | | | (0.05 | ) | | | — | | | | (0.01 | ) | | | (0.07 | ) | |
| From net realized gains | | | — | | | | (1.47 | ) | | | (1.17 | ) | | | (0.76 | ) | | | (0.35 | ) | |
| Total distributions to shareholders | | | (0.07 | ) | | | (1.52 | ) | | | (1.17 | ) | | | (0.77 | ) | | | (0.42 | ) | |
| Increase from regulatory settlements | | | — | (d) | | | — | | | | — | | | | — | | | | — | | |
| Net Asset Value, End of Period | | $ | 11.76 | | | $ | 11.89 | | | $ | 15.51 | | | $ | 14.03 | | | $ | 13.59 | | |
| Total return (f)(g) | | | (0.28 | )% | | | (15.35 | )% | | | 19.82 | % | | | 9.24 | % | | | 16.98 | % | |
| Ratios to Average Net Assets/Supplemental Data: | |
| Net expenses before interest expense | | | 1.17 | %(h) | | | 1.14 | %(i) | | | 1.14 | %(h) | | | 1.14 | %(h) | | | 1.14 | %(h) | |
| Interest expense | | | — | %(j) | | | — | %(j) | | | — | | | | — | | | | — | | |
| Net expenses | | | 1.17 | %(h) | | | 1.14 | %(i) | | | 1.14 | %(h) | | | 1.14 | %(h) | | | 1.24 | %(h) | |
| Waiver/Reimbursement | | | 0.11 | % | | | 0.10 | % | | | 0.10 | % | | | 0.12 | % | | | 0.09 | % | |
| Net investment income | | | 0.77 | %(h) | | | 0.53 | %(i) | | | 0.32 | %(h) | | | — | %(h)(j) | | | 0.59 | %(h) | |
| Portfolio turnover rate | | | 131 | % | | | 106 | % | | | 88 | % | | | 63 | % | | | 105 | % | |
| Net assets, end of period (000s) | | $ | 27,742 | | | $ | 11,187 | | | $ | 12,054 | | | $ | 10,578 | | | $ | 10,393 | | |
(a) On November 14, 2008, the Columbia Common Stock Fund was renamed the Columbia Contrarian Core Fund.
(b) On September 23, 2005, the Columbia Large Cap Core Fund was renamed the Columbia Common Stock Fund.
(c) Per share data was calculated using the average shares outstanding during the period.
(d) Rounds to less than $0.01 per share.
(e) Net investment income per share reflects a special dividend. The effect of this dividend amounted to $0.05 per share.
(f) Total return at net asset value assuming all distributions reinvested and no initial sales charge or contingent deferred sales charge.
(g) Had the investment advisor and/or any of its affiliates not waived fees or reimbursed a portion of expenses, total return would have been reduced.
(h) The benefits derived from expense reductions had an impact of less than 0.01%.
(i) The benefits derived from expense reductions had an impact of 0.01%.
(j) Rounds to less than 0.01%.
See Accompanying Notes to Financial Statements.
93
Financial Highlights – Columbia Contrarian Core Fund
Selected data for a share outstanding throughout each period is as follows:
| | | Year Ended September 30, | |
| Class B Shares | | 2009 (a) | | 2008 | | 2007 | | 2006 | | 2005 (b) | |
| Net Asset Value, Beginning of Period | | $ | 11.14 | | | $ | 14.67 | | | $ | 13.42 | | | $ | 13.12 | | | $ | 11.68 | | |
| Income from Investment Operations: | |
| Net investment income (loss) (c) | | | 0.01 | | | | (0.03 | ) | | | (0.06 | ) | | | (0.10 | ) | | | (0.04 | )(d) | |
Net realized and unrealized gain (loss) on investments
and foreign currency | | | (0.13 | ) | | | (2.03 | ) | | | 2.48 | | | | 1.16 | | | | 1.88 | | |
| Total from investment operations | | | (0.12 | ) | | | (2.06 | ) | | | 2.42 | | | | 1.06 | | | | 1.84 | | |
| Less Distributions to Shareholders: | |
| From net investment income | | | — | | | | — | | | | — | | | | — | | | | (0.05 | ) | |
| From net realized gains | | | — | | | | (1.47 | ) | | | (1.17 | ) | | | (0.76 | ) | | | (0.35 | ) | |
| Total distributions to shareholders | | | — | | | | (1.47 | ) | | | (1.17 | ) | | | (0.76 | ) | | | (0.40 | ) | |
| Increase from regulatory settlements | | | — | (e) | | | — | | | | — | | | | — | | | | — | | |
| Net Asset Value, End of Period | | $ | 11.02 | | | $ | 11.14 | | | $ | 14.67 | | | $ | 13.42 | | | $ | 13.12 | | |
| Total return (f)(g) | | | (1.08 | )% | | | (15.96 | )% | | | 18.94 | % | | | 8.40 | % | | | 16.02 | % | |
| Ratios to Average Net Assets/Supplemental Data: | |
| Net expenses before interest expense | | | 1.92 | %(h) | | | 1.89 | %(i) | | | 1.89 | %(h) | | | 1.89 | %(h) | | | 1.99 | %(h) | |
| Interest expense | | | — | %(j) | | | — | %(j) | | | — | | | | — | | | | — | | |
| Net expenses | | | 1.92 | %(h) | | | 1.89 | %(i) | | | 1.89 | %(h) | | | 1.89 | %(h) | | | 1.99 | %(h) | |
| Waiver/Reimbursement | | | 0.11 | % | | | 0.10 | % | | | 0.10 | % | | | 0.12 | % | | | 0.09 | % | |
| Net investment income (loss) | | | 0.12 | %(h) | | | (0.22 | )%(i) | | | (0.44 | )%(h) | | | (0.75 | )%(h) | | | (0.31 | )%(h) | |
| Portfolio turnover rate | | | 131 | % | | | 106 | % | | | 88 | % | | | 63 | % | | | 105 | % | |
| Net assets, end of period (000s) | | $ | 3,428 | | | $ | 3,629 | | | $ | 4,796 | | | $ | 5,637 | | | $ | 6,628 | | |
(a) On November 14, 2008, the Columbia Common Stock Fund was renamed the Columbia Contrarian Core Fund.
(b) On September 23, 2005, the Columbia Large Cap Core Fund was renamed the Columbia Common Stock Fund.
(c) Per share data was calculated using the average shares outstanding during the period.
(d) Net investment income per share reflects a special dividend. The effect of this dividend amounted to $0.05 per share.
(e) Rounds to less than $0.01 per share.
(f) Total return at net asset value assuming all distributions reinvested and no contingent deferred sales charge.
(g) Had the investment advisor and/or any of its affiliates not waived fees or reimbursed a portion of expenses, total return would have been reduced.
(h) The benefits derived from expense reductions had an impact of less than 0.01%.
(i) The benefits derived from expense reductions had an impact of 0.01%.
(j) Rounds to less than 0.01%.
See Accompanying Notes to Financial Statements.
94
Financial Highlights – Columbia Contrarian Core Fund
Selected data for a share outstanding throughout each period is as follows:
| | | Year Ended September 30, | |
| Class C Shares | | 2009 (a) | | 2008 | | 2007 | | 2006 | | 2005 (b) | |
| Net Asset Value, Beginning of Period | | $ | 11.15 | | | $ | 14.68 | | | $ | 13.43 | | | $ | 13.13 | | | $ | 11.68 | | |
| Income from Investment Operations: | |
| Net investment income (loss) (c) | | | 0.01 | | | | (0.03 | ) | | | (0.06 | ) | | | (0.10 | ) | | | (0.03 | )(d) | |
Net realized and unrealized gain (loss) on investments
and foreign currency | | | (0.13 | ) | | | (2.03 | ) | | | 2.48 | | | | 1.16 | | | | 1.88 | | |
| Total from investment operations | | | (0.12 | ) | | | (2.06 | ) | | | 2.42 | | | | 1.06 | | | | 1.85 | | |
| Less Distributions to Shareholders: | |
| From net investment income | | | — | | | | — | | | | — | | | | — | | | | (0.05 | ) | |
| From net realized gains | | | — | | | | (1.47 | ) | | | (1.17 | ) | | | (0.76 | ) | | | (0.35 | ) | |
| Total distributions to shareholders | | | — | | | | (1.47 | ) | | | (1.17 | ) | | | (0.76 | ) | | | (0.40 | ) | |
| Increase from regulatory settlements | | | — | (e) | | | — | | | | — | | | | — | | | | — | | |
| Net Asset Value, End of Period | | $ | 11.03 | | | $ | 11.15 | | | $ | 14.68 | | | $ | 13.43 | | | $ | 13.13 | | |
| Total return (f)(g) | | | (1.08 | )% | | | (15.95 | )% | | | 18.93 | % | | | 8.40 | % | | | 16.10 | % | |
| Ratios to Average Net Assets/Supplemental Data: | |
| Net expenses before interest expense | | | 1.92 | %(h) | | | 1.89 | %(i) | | | 1.89 | %(h) | | | 1.89 | %(h) | | | 1.99 | %(h) | |
| Interest expense | | | — | %(j) | | | — | %(j) | | | — | | | | — | | | | — | | |
| Net expenses | | | 1.92 | %(h) | | | 1.89 | %(i) | | | 1.89 | %(h) | | | 1.89 | %(h) | | | 1.99 | %(h) | |
| Waiver/Reimbursement | | | 0.11 | % | | | 0.10 | % | | | 0.10 | % | | | 0.12 | % | | | 0.09 | % | |
| Net investment income (loss) | | | 0.03 | %(h) | | | (0.21 | )%(i) | | | (0.41 | )%(h) | | | (0.75 | )%(h) | | | (0.25 | )%(h) | |
| Portfolio turnover rate | | | 131 | % | | | 106 | % | | | 88 | % | | | 63 | % | | | 105 | % | |
| Net assets, end of period (000s) | | $ | 7,094 | | | $ | 1,718 | | | $ | 1,428 | | | $ | 906 | | | $ | 605 | | |
(a) On November 14, 2008, the Columbia Common Stock Fund was renamed the Columbia Contrarian Core Fund.
(b) On September 23, 2005, the Columbia Large Cap Core Fund was renamed the Columbia Common Stock Fund.
(c) Per share data was calculated using the average shares outstanding during the period.
(d) Net investment income per share reflects a special dividend. The effect of this dividend amounted to $0.05 per share.
(e) Rounds to less than $0.01 per share.
(f) Total return at net asset value assuming all distributions reinvested and no contingent deferred sales charge.
(g) Had the investment advisor and/or any of its affiliates not waived fees or reimbursed a portion of expenses, total return would have been reduced.
(h) The benefits derived from expense reductions had an impact of less than 0.01%.
(i) The benefits derived from expense reductions had an impact of 0.01%.
(j) Rounds to less than 0.01%.
See Accompanying Notes to Financial Statements.
95
Financial Highlights – Columbia Contrarian Core Fund
Selected data for a share outstanding throughout each period is as follows:
| | | Year Ended September 30, | |
| Class T Shares | | 2009 (a) | | 2008 | | 2007 (b) | | 2006 | | 2005 (c) | |
| Net Asset Value, Beginning of Period | | $ | 11.80 | | | $ | 15.40 | | | $ | 13.95 | | | $ | 13.52 | | | $ | 11.95 | | |
| Income from Investment Operations: | |
| Net investment income (loss) (d) | | | 0.08 | | | | 0.06 | | | | 0.04 | | | | (0.01 | ) | | | 0.07 | (e) | |
Net realized and unrealized gain (loss) on investments
and foreign currency | | | (0.14 | ) | | | (2.15 | ) | | | 2.58 | | | | 1.21 | | | | 1.92 | | |
| Total from investment operations | | | (0.06 | ) | | | (2.09 | ) | | | 2.62 | | | | 1.20 | | | | 1.99 | | |
| Less Distributions to Shareholders: | |
| From net investment income | | | (0.07 | ) | | | (0.04 | ) | | | — | (f) | | | (0.01 | ) | | | (0.07 | ) | |
| From net realized gains | | | — | | | | (1.47 | ) | | | (1.17 | ) | | | (0.76 | ) | | | (0.35 | ) | |
| Total distributions to shareholders | | | (0.07 | ) | | | (1.51 | ) | | | (1.17 | ) | | | (0.77 | ) | | | (0.42 | ) | |
| Increase from regulatory settlements | | | — | (f) | | | — | | | | — | | | | — | | | | — | | |
| Net Asset Value, End of Period | | $ | 11.67 | | | $ | 11.80 | | | $ | 15.40 | | | $ | 13.95 | | | $ | 13.52 | | |
| Total return (g)(h) | | | (0.35 | )% | | | (15.37 | )% | | | 19.70 | % | | | 9.16 | % | | | 16.97 | % | |
| Ratios to Average Net Assets/Supplemental Data: | |
| Net expenses before interest expense | | | 1.22 | %(i) | | | 1.19 | %(j) | | | 1.19 | %(i) | | | 1.19 | %(i) | | | 1.29 | %(i) | |
| Interest expense | | | — | %(k) | | | — | %(k) | | | — | | | | — | | | | — | | |
| Net expenses | | | 1.22 | %(i) | | | 1.19 | %(j) | | | 1.19 | %(i) | | | 1.19 | %(i) | | | 1.29 | %(i) | |
| Waiver/Reimbursement | | | 0.11 | % | | | 0.10 | % | | | 0.10 | % | | | 0.12 | % | | | 0.09 | % | |
| Net investment income (loss) | | | 0.81 | %(i) | | | 0.48 | %(j) | | | 0.27 | %(i) | | | (0.05 | )%(i) | | | 0.57 | %(i) | |
| Portfolio turnover rate | | | 131 | % | | | 106 | % | | | 88 | % | | | 63 | % | | | 105 | % | |
| Net assets, end of period (000s) | | $ | 117,161 | | | $ | 132,272 | | | $ | 177,345 | | | $ | 168,506 | | | $ | 180,345 | | |
(a) On November 14, 2008, the Columbia Common Stock Fund was renamed the Columbia Contrarian Core Fund.
(b) On August 8, 2007, Class G shares were converted to Class T shares.
(c) On September 23, 2005, the Columbia Large Cap Core Fund was renamed the Columbia Common Stock Fund.
(d) Per share data was calculated using the average shares outstanding during the period.
(e) Net investment income per share reflects a special dividend. The effect of this dividend amounted to $0.05 per share.
(f) Rounds to less than $0.01 per share.
(g) Total return at net asset value assuming all distributions reinvested and no initial sales charge or contingent deferred sales charge.
(h) Had the investment advisor and/or any of its affiliates not waived fees or reimbursed a portion of expenses, total return would have been reduced.
(i) The benefits derived from expense reductions had an impact of less than 0.01%.
(j) The benefits derived from expense reductions had an impact of 0.01%.
(k) Rounds to less than 0.01%.
See Accompanying Notes to Financial Statements.
96
Financial Highlights – Columbia Contrarian Core Fund
Selected data for a share outstanding throughout each period is as follows:
| | | Year Ended September 30, | |
| Class Z Shares | | 2009 (a) | | 2008 | | 2007 | | 2006 | | 2005 (b) | |
| Net Asset Value, Beginning of Period | | $ | 11.97 | | | $ | 15.60 | | | $ | 14.10 | | | $ | 13.66 | | | $ | 12.05 | | |
| Income from Investment Operations: | |
| Net investment income (c) | | | 0.11 | | | | 0.11 | | | | 0.08 | | | | 0.03 | | | | 0.09 | (d) | |
Net realized and unrealized gain (loss) on investments
and foreign currency | | | (0.15 | ) | | | (2.18 | ) | | | 2.62 | | | | 1.21 | | | | 1.95 | | |
| Total from investment operations | | | (0.04 | ) | | | (2.07 | ) | | | 2.70 | | | | 1.24 | | | | 2.04 | | |
| Less Distributions to Shareholders: | |
| From net investment income | | | (0.10 | ) | | | (0.09 | ) | | | (0.03 | ) | | | (0.04 | ) | | | (0.08 | ) | |
| From net realized gains | | | — | | | | (1.47 | ) | | | (1.17 | ) | | | (0.76 | ) | | | (0.35 | ) | |
| Total distributions to shareholders | | | (0.10 | ) | | | (1.56 | ) | | | (1.20 | ) | | | (0.80 | ) | | | (0.43 | ) | |
| Increase from regulatory settlements | | | — | (e) | | | — | | | | — | | | | — | | | | — | | |
| Net Asset Value, End of Period | | $ | 11.83 | | | $ | 11.97 | | | $ | 15.60 | | | $ | 14.10 | | | $ | 13.66 | | |
| Total return (f)(g) | | | (0.01 | )% | | | (15.11 | )% | | | 20.13 | % | | | 9.45 | % | | | 17.25 | % | |
| Ratios to Average Net Assets/Supplemental Data: | |
| Net expenses before interest expense | | | 0.92 | %(h) | | | 0.89 | %(i) | | | 0.89 | %(h) | | | 0.89 | %(h) | | | 0.99 | %(h) | |
| Interest expense | | | — | %(j) | | | — | %(j) | | | — | | | | — | | | | — | | |
| Net expenses | | | 0.92 | %(h) | | | 0.89 | %(i) | | | 0.89 | %(h) | | | 0.89 | %(h) | | | 0.99 | %(h) | |
| Waiver/Reimbursement | | | 0.11 | % | | | 0.10 | % | | | 0.10 | % | | | 0.12 | % | | | 0.09 | % | |
| Net investment income | | | 1.09 | %(h) | | | 0.77 | %(i) | | | 0.57 | %(h) | | | 0.25 | %(h) | | | 0.67 | %(h) | |
| Portfolio turnover rate | | | 131 | % | | | 106 | % | | | 88 | % | | | 63 | % | | | 105 | % | |
| Net assets, end of period (000s) | | $ | 247,974 | | | $ | 173,479 | | | $ | 245,529 | | | $ | 256,039 | | | $ | 310,472 | | |
(a) On November 14, 2008, the Columbia Common Stock Fund was renamed the Columbia Contrarian Core Fund.
(b) On September 23, 2005, the Columbia Large Cap Core Fund was renamed the Columbia Common Stock Fund.
(c) Per share data was calculated using the average shares outstanding during the period.
(d) Net investment income per share reflects a special dividend. The effect of this dividend amounted to $0.05 per share.
(e) Rounds to less than $0.01 per share.
(f) Total return at net asset value assuming all distributions reinvested.
(g) Had the investment advisor and/or any of its affiliates not waived fees or reimbursed a portion of expenses, total return would have been reduced.
(h) The benefits derived from expense reductions had an impact of less than 0.01%.
(i) The benefits derived from expense reductions had an impact of 0.01%.
(j) Rounds to less than 0.01%.
See Accompanying Notes to Financial Statements.
97
Financial Highlights – Columbia Small Cap Core Fund
Selected data for a share outstanding throughout each period is as follows:
| | | Year Ended September 30, | |
| Class A Shares | | 2009 | | 2008 | | 2007 | | 2006 | | 2005 (a) | |
| Net Asset Value, Beginning of Period | | $ | 14.14 | | | $ | 20.01 | | | $ | 19.72 | | | $ | 19.32 | | | $ | 17.54 | | |
| Income from Investment Operations: | |
| Net investment income (loss) (b) | | | (0.02 | ) | | | (0.09 | ) | | | 0.04 | (c) | | | (0.06 | ) | | | (0.06 | ) | |
| Net realized and unrealized gain (loss) on investments | | | (1.39 | ) | | | (2.11 | ) | | | 2.46 | | | | 1.91 | | | | 2.91 | | |
| Total from investment operations | | | (1.41 | ) | | | (2.20 | ) | | | 2.50 | | | | 1.85 | | | | 2.85 | | |
| Less Distributions to Shareholders: | |
| From net investment income | | | — | | | | (0.03 | ) | | | — | | | | — | | | | — | | |
| From net realized gains | | | (1.15 | ) | | | (3.64 | ) | | | (2.21 | ) | | | (1.45 | ) | | | (1.07 | ) | |
| Total distributions to shareholders | | | (1.15 | ) | | | (3.67 | ) | | | (2.21 | ) | | | (1.45 | ) | | | (1.07 | ) | |
| Increase from regulatory settlements | | | — | (d) | | | — | | | | — | | | | — | | | | — | | |
| Net Asset Value, End of Period | | $ | 11.58 | | | $ | 14.14 | | | $ | 20.01 | | | $ | 19.72 | | | $ | 19.32 | | |
| Total return (e) | | | (7.41 | )% | | | (12.86 | )% | | | 13.30 | % | | | 10.08 | %(f) | | | 16.69 | %(f) | |
| Ratios to Average Net Assets/Supplemental Data: | |
| Net expenses before interest expense (g) | | | 1.33 | % | | | 1.25 | % | | | 1.21 | % | | | 1.16 | % | | | 1.13 | % | |
| Interest expense | | | — | | | | — | | | | — | | | | — | %(h) | | | — | | |
| Net expenses (g) | | | 1.33 | % | | | 1.25 | % | | | 1.21 | % | | | 1.16 | % | | | 1.13 | % | |
| Waiver/Reimbursement | | | — | | | | — | | | | — | | | | — | %(h) | | | — | %(h) | |
| Net investment income (loss) (g) | | | (0.28 | )% | | | (0.56 | )% | | | 0.22 | % | | | (0.30 | )% | | | (0.31 | )% | |
| Portfolio turnover rate | | | 11 | % | | | 25 | % | | | 44 | % | | | 14 | % | | | 16 | % | |
| Net assets, end of period (000s) | | $ | 81,474 | | | $ | 115,246 | | | $ | 176,504 | | | $ | 190,390 | | | $ | 211,527 | | |
(a) On October 7, 2005, the Columbia Small Cap Fund was renamed the Columbia Small Cap Core Fund.
(b) Per share data was calculated using the average shares outstanding during the period.
(c) Net investment income per share reflects a special dividend. The effect of this dividend amounted to $0.07 per share.
(d) Rounds to less than $0.01 per share.
(e) Total return at net asset value assuming all distributions reinvested and no initial sales charge or contingent deferred sales charge.
(f) Had the investment advisor and/or any of its affiliates not waived fees or reimbursed a portion of expenses, total return would have been reduced.
(g) The benefits derived from expense reductions had an impact of less than 0.01%.
(h) Rounds to less than 0.01%.
See Accompanying Notes to Financial Statements.
98
Financial Highlights – Columbia Small Cap Core Fund
Selected data for a share outstanding throughout each period is as follows:
| | | Year Ended September 30, | |
| Class B Shares | | 2009 | | 2008 | | 2007 | | 2006 | | 2005 (a) | |
| Net Asset Value, Beginning of Period | | $ | 12.97 | | | $ | 18.75 | | | $ | 18.73 | | | $ | 18.56 | | | $ | 16.89 | | |
| Income from Investment Operations: | |
| Net investment loss (b) | | | (0.09 | ) | | | (0.19 | ) | | | (0.10 | )(c) | | | (0.19 | ) | | | (0.19 | ) | |
| Net realized and unrealized gain (loss) on investments | | | (1.31 | ) | | | (1.95 | ) | | | 2.33 | | | | 1.81 | | | | 2.81 | | |
| Total from investment operations | | | (1.40 | ) | | | (2.14 | ) | | | 2.23 | | | | 1.62 | | | | 2.62 | | |
| Less Distributions to Shareholders: | |
| From net realized gains | | | (1.15 | ) | | | (3.64 | ) | | | (2.21 | ) | | | (1.45 | ) | | | (0.95 | ) | |
| Increase from regulatory settlements | | | — | (d) | | | — | | | | — | | | | — | | | | — | | |
| Net Asset Value, End of Period | | $ | 10.42 | | | $ | 12.97 | | | $ | 18.75 | | | $ | 18.73 | | | $ | 18.56 | | |
| Total return (e) | | | (8.08 | )% | | | (13.53 | )% | | | 12.49 | % | | | 9.17 | %(f) | | | 15.87 | %(f) | |
| Ratios to Average Net Assets/Supplemental Data: | |
| Net expenses before interest expense (g) | | | 2.08 | % | | | 2.00 | % | | | 1.96 | % | | | 1.91 | % | | | 1.88 | % | |
| Interest expense | | | — | | | | — | | | | — | | | | — | %(h) | | | — | | |
| Net expenses (g) | | | 2.08 | % | | | 2.00 | % | | | 1.96 | % | | | 1.91 | % | | | 1.88 | % | |
| Waiver/Reimbursement | | | — | | | | — | | | | — | | | | — | %(h) | | | — | %(h) | |
| Net investment loss (g) | | | (1.03 | )% | | | (1.31 | )% | | | (0.53 | )% | | | (1.05 | )% | | | (1.06 | )% | |
| Portfolio turnover rate | | | 11 | % | | | 25 | % | | | 44 | % | | | 14 | % | | | 16 | % | |
| Net assets, end of period (000s) | | $ | 17,317 | | | $ | 23,085 | | | $ | 35,918 | | | $ | 39,109 | | | $ | 42,439 | | |
(a) On October 7, 2005, the Columbia Small Cap Fund was renamed the Columbia Small Cap Core Fund.
(b) Per share data was calculated using the average shares outstanding during the period.
(c) Net investment loss per share reflects a special dividend. The effect of this dividend amounted to $0.06 per share.
(d) Rounds to less than $0.01 per share.
(e) Total return at net asset value assuming all distributions reinvested and no contingent deferred sales charge.
(f) Had the investment advisor and/or any of its affiliates not waived fees or reimbursed a portion of expenses, total return would have been reduced.
(g) The benefits derived from expense reductions had an impact of less than 0.01%.
(h) Rounds to less than 0.01%.
See Accompanying Notes to Financial Statements.
99
Financial Highlights – Columbia Small Cap Core Fund
Selected data for a share outstanding throughout each period is as follows:
| | | Year Ended September 30, | |
| Class C Shares | | 2009 | | 2008 | | 2007 | | 2006 | | 2005 (a) | |
| Net Asset Value, Beginning of Period | | $ | 12.99 | | | $ | 18.76 | | | $ | 18.75 | | | $ | 18.57 | | | $ | 16.91 | | |
| Income from Investment Operations: | |
| Net investment loss (b) | | | (0.09 | ) | | | (0.19 | ) | | | (0.10 | )(c) | | | (0.19 | ) | | | (0.19 | ) | |
| Net realized and unrealized gain (loss) on investments | | | (1.32 | ) | | | (1.94 | ) | | | 2.32 | | | | 1.82 | | | | 2.80 | | |
| Total from investment operations | | | (1.41 | ) | | | (2.13 | ) | | | 2.22 | | | | 1.63 | | | | 2.61 | | |
| Less Distributions to Shareholders: | |
| From net realized gains | | | (1.15 | ) | | | (3.64 | ) | | | (2.21 | ) | | | (1.45 | ) | | | (0.95 | ) | |
| Increase from regulatory settlements | | | — | (d) | | | — | | | | — | | | | — | | | | — | | |
| Net Asset Value, End of Period | | $ | 10.43 | | | $ | 12.99 | | | $ | 18.76 | | | $ | 18.75 | | | $ | 18.57 | | |
| Total return (e) | | | (8.15 | )% | | | (13.46 | )% | | | 12.41 | % | | | 9.23 | %(f) | | | 15.79 | %(f) | |
| Ratios to Average Net Assets/Supplemental Data: | |
| Net expenses before interest expense (g) | | | 2.08 | % | | | 2.00 | % | | | 1.96 | % | | | 1.91 | % | | | 1.88 | % | |
| Interest expense | | | — | | | | — | | | | — | | | | — | %(h) | | | — | | |
| Net expenses (g) | | | 2.08 | % | | | 2.00 | % | | | 1.96 | % | | | 1.91 | % | | | 1.88 | % | |
| Waiver/Reimbursement | | | — | | | | — | | | | — | | | | — | %(h) | | | — | %(h) | |
| Net investment loss (g) | | | (1.03 | )% | | | (1.29 | )% | | | (0.53 | )% | | | (1.05 | )% | | | (1.06 | )% | |
| Portfolio turnover rate | | | 11 | % | | | 25 | % | | | 44 | % | | | 14 | % | | | 16 | % | |
| Net assets, end of period (000s) | | $ | 18,461 | | | $ | 24,756 | | | $ | 42,312 | | | $ | 46,241 | | | $ | 56,163 | | |
(a) On October 7, 2005, the Columbia Small Cap Fund was renamed the Columbia Small Cap Core Fund.
(b) Per share data was calculated using the average shares outstanding during the period.
(c) Net investment loss per share reflects a special dividend. The effect of this dividend amounted to $0.06 per share.
(d) Rounds to less than $0.01 per share.
(e) Total return at net asset value assuming all distributions reinvested and no contingent deferred sales charge.
(f) Had the investment advisor and/or any of its affiliates not waived fees or reimbursed a portion of expenses, total return would have been reduced.
(g) The benefits derived from expense reductions had an impact of less than 0.01%.
(h) Rounds to less than 0.01%.
See Accompanying Notes to Financial Statements.
100
Financial Highlights – Columbia Small Cap Core Fund
Selected data for a share outstanding throughout each period is as follows:
| | | Year Ended September 30, | |
| Class T Shares | | 2009 | | 2008 | | 2007 (a) | | 2006 | | 2005 (b) | |
| Net Asset Value, Beginning of Period | | $ | 13.94 | | | $ | 19.78 | | | $ | 19.53 | | | $ | 19.15 | | | $ | 17.40 | | |
| Income from Investment Operations: | |
| Net investment income (loss) (c) | | | (0.03 | ) | | | (0.10 | ) | | | 0.03 | (d) | | | (0.07 | ) | | | (0.07 | ) | |
| Net realized and unrealized gain (loss) on investments | | | (1.37 | ) | | | (2.08 | ) | | | 2.43 | | | | 1.90 | | | | 2.88 | | |
| Total from investment operations | | | (1.40 | ) | | | (2.18 | ) | | | 2.46 | | | | 1.83 | | | | 2.81 | | |
| Less Distributions to Shareholders: | |
| From net investment income | | | — | | | | (0.02 | ) | | | — | | | | — | | | | — | | |
| From net realized gains | | | (1.15 | ) | | | (3.64 | ) | | | (2.21 | ) | | | (1.45 | ) | | | (1.06 | ) | |
| Total distributions to shareholders | | | (1.15 | ) | | | (3.66 | ) | | | (2.21 | ) | | | (1.45 | ) | | | (1.06 | ) | |
| Increase from regulatory settlements | | | — | (e) | | | — | | | | — | | | | — | | | | — | | |
| Net Asset Value, End of Period | | $ | 11.39 | | | $ | 13.94 | | | $ | 19.78 | | | $ | 19.53 | | | $ | 19.15 | | |
| Total return (f) | | | (7.45 | )% | | | (12.90 | )% | | | 13.22 | % | | | 10.04 | %(g) | | | 16.58 | %(g) | |
| Ratios to Average Net Assets/Supplemental Data: | |
| Net expenses before interest expense (h) | | | 1.38 | % | | | 1.30 | % | | | 1.26 | % | | | 1.21 | % | | | 1.18 | % | |
| Interest expense | | | — | | | | — | | | | — | | | | — | %(i) | | | — | | |
| Net expenses (h) | | | 1.38 | % | | | 1.30 | % | | | 1.26 | % | | | 1.21 | % | | | 1.18 | % | |
| Waiver/Reimbursement | | | — | | | | — | | | | — | | | | — | %(i) | | | — | %(i) | |
| Net investment income (loss) (h) | | | (0.34 | )% | | | (0.63 | )% | | | 0.17 | % | | | (0.35 | )% | | | (0.36 | )% | |
| Portfolio turnover rate | | | 11 | % | | | 25 | % | | | 44 | % | | | 14 | % | | | 16 | % | |
| Net assets, end of period (000s) | | $ | 74,722 | | | $ | 98,299 | | | $ | 136,381 | | | $ | 135,538 | | | $ | 150,042 | | |
(a) On August 8, 2007, Class G shares were converted to Class T shares.
(b) On October 7, 2005, the Columbia Small Cap Fund was renamed the Columbia Small Cap Core Fund.
(c) Per share data was calculated using the average shares outstanding during the period.
(d) Net investment income per share reflects a special dividend. The effect of this dividend amounted to $0.07 per share.
(e) Rounds to less than $0.01 per share.
(f) Total return at net asset value assuming all distributions reinvested and no initial sales charge or contingent deferred sales charge.
(g) Had the investment advisor and/or any of its affiliates not waived fees or reimbursed a portion of expenses, total return would have been reduced.
(h) The benefits derived from expense reductions had an impact of less than 0.01%.
(i) Rounds to less than 0.01%.
See Accompanying Notes to Financial Statements.
101
Financial Highlights – Columbia Small Cap Core Fund
Selected data for a share outstanding throughout each period is as follows:
| | | Year Ended September 30, | |
| Class Z Shares | | 2009 | | 2008 | | 2007 | | 2006 | | 2005 (a) | |
| Net Asset Value, Beginning of Period | | $ | 14.42 | | | $ | 20.33 | | | $ | 19.96 | | | $ | 19.54 | | | $ | 17.73 | | |
| Income from Investment Operations: | |
| Net investment income (loss) (b) | | | — | (c) | | | (0.04 | ) | | | 0.09 | (d) | | | (0.01 | ) | | | (0.01 | ) | |
| Net realized and unrealized gain (loss) on investments | | | (1.40 | ) | | | (2.15 | ) | | | 2.49 | | | | 1.93 | | | | 2.94 | | |
| Total from investment operations | | | (1.40 | ) | | | (2.19 | ) | | | 2.58 | | | | 1.92 | | | | 2.93 | | |
| Less Distributions to Shareholders: | |
| From net investment income | | | — | | | | (0.08 | ) | | | — | | | | — | | | | — | | |
| From net realized gains | | | (1.15 | ) | | | (3.64 | ) | | | (2.21 | ) | | | (1.50 | ) | | | (1.12 | ) | |
| Total distributions to shareholders | | | (1.15 | ) | | | (3.72 | ) | | | (2.21 | ) | | | (1.50 | ) | | | (1.12 | ) | |
| Increase from regulatory settlements | | | — | (c) | | | — | | | | — | | | | — | | | | — | | |
| Net Asset Value, End of Period | | $ | 11.87 | | | $ | 14.42 | | | $ | 20.33 | | | $ | 19.96 | | | $ | 19.54 | | |
| Total return (e) | | | (7.18 | )% | | | (12.60 | )% | | | 13.56 | % | | | 10.32 | %(f) | | | 16.96 | %(f) | |
| Ratios to Average Net Assets/Supplemental Data: | |
| Net expenses before interest expense (g) | | | 1.08 | % | | | 1.00 | % | | | 0.96 | % | | | 0.91 | % | | | 0.88 | % | |
| Interest expense | | | — | | | | — | | | | — | | | | — | %(h) | | | — | | |
| Net expenses (g) | | | 1.08 | % | | | 1.00 | % | | | 0.96 | % | | | 0.91 | % | | | 0.88 | % | |
| Waiver/Reimbursement | | | — | | | | — | | | | — | | | | — | %(h) | | | — | %(h) | |
| Net investment income (loss) (g) | | | (0.04 | )% | | | (0.27 | )% | | | 0.46 | % | | | (0.05 | )% | | | (0.06 | )% | |
| Portfolio turnover rate | | | 11 | % | | | 25 | % | | | 44 | % | | | 14 | % | | | 16 | % | |
| Net assets, end of period (000s) | | $ | 353,117 | | | $ | 413,763 | | | $ | 834,537 | | | $ | 929,791 | | | $ | 1,058,362 | | |
(a) On October 7, 2005, the Columbia Small Cap Fund was renamed the Columbia Small Cap Core Fund.
(b) Per share data was calculated using the average shares outstanding during the period.
(c) Rounds to less than $0.01 per share.
(d) Net investment income per share reflects a special dividend. The effect of this dividend amounted to $0.07 per share.
(e) Total return at net asset value assuming all distributions reinvested.
(f) Had the investment advisor and/or any of its affiliates not waived fees or reimbursed a portion of expenses, total return would have been reduced.
(g) The benefits derived from expense reductions had an impact of less than 0.01%.
(h) Rounds to less than 0.01%.
See Accompanying Notes to Financial Statements.
102
Notes to Financial Statements – Stock Funds
September 30, 2009
Note 1. Organization
Columbia Funds Series Trust I (the "Trust") is a Massachusetts business trust registered under the Investment Company Act of 1940, as amended (the "1940 Act"), as an open-end management investment company. Information presented in these financial statements pertains to the following diversified funds (each, a "Fund" and collectively, the "Funds"), each a series of the Trust:
Columbia Asset Allocation Fund
Columbia Large Cap Growth Fund
Columbia Disciplined Value Fund
Columbia Contrarian Core Fund
Columbia Small Cap Core Fund
Investment Objectives
Columbia Asset Allocation Fund seeks total return, consisting of current income and long-term capital appreciation. Columbia Large Cap Growth Fund and Columbia Small Cap Core Fund each seek long-term capital appreciation. Columbia Disciplined Value Fund seeks total return, consisting primarily of long-term capital appreciation and secondarily of current income. Columbia Contrarian Core Fund seeks total return, consisting of long-term capital appreciation and current income.
Fund Shares
The Trust may issue an unlimited number of shares, and each Fund offers the following classes of shares: Class A, Class B, Class C, Class T and Class Z. Columbia Large Cap Growth Fund also offers Class E, Class F and Class Y shares. Each share class has its own expense structure and sales charges, as applicable. Class Y shares commenced operations effective July 15, 2009. Columbia Large Cap Growth Fund's Class E and Class F shares are closed to new investors and new accounts. Effective February 17, 2009, Columbia Small Cap Core Fund was reopened to new investors and new accounts. Effective June 22, 2009, the Funds no longer accept investments in Class B shares from new or existing investors in the Funds' Class B shares, except in connection with the reinvestment of any dividend and/or capital gain distributions in Class B shares of each Fund and exchanges by existing Class B shareholders of the other Columbia Funds.
Class A, Class E and Class T shares are subject to a front-end sales charge based on the amount of initial investment. Class A and Class T shares purchased without an initial sales charge in accounts aggregating $1 million to $50 million at the time of purchase are subject to a 1.00% contingent deferred sales charge ("CDSC") if the shares are sold within one year after purchase. Class E shares purchased without an initial sales charge in accounts aggregating $1 million to $5 million at the time of purchase are subject to a 1.00% CDSC if the shares are sold within one year after purchase. Class B and Class F shares are subject to a maximum CDSC of 5.00% based upon the holding period after purchase. Class B and Class F shares will generally convert to Class A and Class E shares, respectively, eight years after purchase. Class C shares are subject to a 1.00% CDSC on shares sold within one year after purchase. Class Y and Class Z sh ares are offered continuously at net asset value. There are certain restrictions on the purchase of Class Y and Class Z shares, as described in each Fund's prospectus.
Note 2. Significant Accounting Policies
The preparation of financial statements in accordance with accounting principles generally accepted in the United States of America ("GAAP") requires management to make certain estimates and assumptions that affect the reported amounts of assets and liabilities, the disclosure of contingent assets and liabilities at the date of the financial statements and the reported amounts of revenue and expenses during the reporting period. Actual results could differ from those estimates.
Management has evaluated the events and transactions that have occurred through November 20, 2009, the date the financial statements were issued, and except as disclosed in Note 13, noted no items requiring adjustment of the financial statements or additional disclosures. The following is a summary of significant accounting policies consistently followed by the Funds in the preparation of their financial statements.
Security Valuation
Equity securities, exchange-traded funds and securities of certain investment companies are valued at the last sale price on the principal exchange on which they trade, except for securities traded on the NASDAQ, which are valued at the NASDAQ official close price. Unlisted securities or listed securities for which there were no sales during the day are
103
Stock Funds, September 30, 2009 (continued)
valued at the closing bid price on such exchanges or over-the-counter markets.
Debt securities generally are valued by pricing services approved by the Trust's Board of Trustees, based upon market transactions for normal, institutional-size trading units of similar securities. The services may use various pricing techniques which take into account appropriate factors such as yield, quality, coupon rate, maturity, type of issue, trading characteristics and other data, as well as broker quotes. Debt securities for which quotations are readily available are valued at an over-the-counter or exchange bid quotation.
Certain debt securities, which tend to be more thinly traded and of lesser quality, are priced based on fundamental analysis of the financial condition of the issuer and the estimated value of any collateral. Valuations developed through pricing techniques may vary from the actual amounts realized upon sale of the securities, and the potential variation may be greater for those securities valued using fundamental analysis.
Short-term investments maturing in 60 days or less are valued at amortized cost, which approximates market value.
Futures contracts are valued at the settlement price established each day by the board of trade or exchange on which they are traded.
Purchased options are valued at the last reported sale price, or in the absence of a sale, at the last quoted bid price. Written options are valued at the last reported sale price, or in the absence of a sale, at the last quoted ask price.
Forward foreign currency exchange contracts are valued at the prevailing forward exchange rate of the underlying currencies.
Foreign securities are generally valued at the last sale price on the foreign exchange or market on which they trade. If any foreign share prices are not readily available as a result of limited share activity, the securities are valued at the last sale price of the local shares in the principal market in which such securities are normally traded.
Generally, trading in foreign securities is substantially completed each day at various times prior to the close of the New York Stock Exchange ("NYSE"). The values of such securities used in computing the net asset value of the Funds' shares are determined as of such times. Foreign currency exchange rates are generally determined at 4:00 p.m. Eastern (U.S.) time. Occasionally, events affecting the values of such foreign securities and such exchange rates may occur between the times at which they are determined and the close of the customary trading session of the NYSE, which would not be reflected in the computation of the Funds' net asset values. If events materially affecting the values of such foreign securities occur and it is determined that market quotations are not reliable, then these foreign securities will be valued at their fair value using procedures approved by the Board of Trustees.
Certain Funds may use a systematic fair valuation model provided by an independent third party to value securities principally traded in foreign markets in order to adjust for possible stale pricing that may occur between the close of the foreign exchanges and the time for valuation.
Investments for which market quotations are not readily available, or that have quotations which management believes are not reliable, are valued at fair value as determined in good faith under consistently applied procedures established by and under the general supervision of the Board of Trustees. If a security is valued at fair value, such value is likely to be different from the last quoted market price for the security. The determination of fair value often requires significant judgment. To determine fair value, management may use assumptions including but not limited to future cash flows and estimated risk premiums. Multiple inputs from various sources may be used to determine value.
Management establishes a hierarchy that prioritizes the inputs to valuation techniques used to measure fair value giving the highest priority to unadjusted quoted prices in active markets for identical securities (level 1 measurements) and the lowest priority to unobservable inputs (level 3 measurements) when market prices are not readily available or reliable. The three levels of the fair value hierarchy are described below:
• Level 1 – quoted prices in active markets for identical securities
• Level 2 – prices determined using other significant observable inputs (including quoted prices for similar securities, interest rates, prepayment speeds, credit risk and others)
• Level 3 – prices determined using significant unobservable inputs. In situations where quoted
104
Stock Funds, September 30, 2009 (continued)
prices or observable inputs are unavailable or less reliable, unobservable inputs may be used. Unobservable inputs may include management's own assumptions about the factors market participants would use in pricing an investment.
The inputs or methodology used for valuing securities are not necessarily an indication of the risk associated with investing in those securities.
Security Transactions
Security transactions are accounted for on the trade date. Cost is determined and gains (losses) are based upon the specific identification method for both financial statement and federal income tax purposes.
Management is required to provide disclosures regarding the Funds' derivative instruments and hedging activities, by providing for qualitative disclosures about the objectives and strategies for using derivatives, quantitative data about the fair value of and gains and losses on derivative contracts, and details of credit-risk-related contingent features in their derivative contracts. For additional information on derivative instruments, please see Note 6.
Repurchase Agreements
Each Fund may engage in repurchase agreement transactions with institutions that Columbia Management Advisors, LLC ("Columbia"), the Funds' investment advisor, has determined are creditworthy. Each Fund, through its custodian, receives delivery of the underlying securities collateralizing a repurchase agreement. Columbia is responsible for determining that the collateral is at least equal, at all times, to the value of the repurchase obligation including interest. A repurchase agreement transaction involves certain risks in the event of default or insolvency of the counterparty. These risks include possible delays in or restrictions on each Fund's ability to dispose of the underlying securities and a possible decline in the value of the underlying securities during the period while the Funds seek to assert their rights.
Delayed Delivery Securities
Each Fund may trade securities on other than normal settlement terms, including securities purchased or sold on a "when-issued" basis. This may increase the risk if the other party to the transaction fails to deliver and causes the Funds to subsequently invest at less advantageous prices. Each Fund holds until the settlement date, in a segregated account, cash or liquid securities in an amount equal to the delayed delivery commitment.
Treasury Inflation Protected Securities
Columbia Asset Allocation Fund may invest in treasury inflation protected securities ("TIPS"). The principal amount of TIPS is adjusted periodically and is increased for inflation or decreased for deflation based on a monthly published index. Interest payments are based on the adjusted principal at the time the interest is paid. These adjustments are recorded as interest income on the Statements of Operations.
Foreign Currency Transactions and Translations
The values of all assets and liabilities quoted in foreign currencies are translated into U.S. dollars at that day's exchange rates. Net realized and unrealized gains (losses) on foreign currency transactions and translations include gains (losses) arising from the fluctuation in exchange rates between trade and settlement dates on securities transactions, gains (losses) arising from the disposition of foreign currency and currency gains (losses) between the accrual and payment dates on dividends, interest income and foreign withholding taxes.
For financial statement purposes, the Funds do not distinguish that portion of gains (losses) on investments which is due to changes in foreign exchange rates from that which is due to changes in market prices of the investments. Such fluctuations are included with the net realized and unrealized gains (losses) on investments on the Statements of Operations.
Income Recognition
Interest income is recorded on the accrual basis. Premium and discount are amortized and accreted, respectively, on all debt securities, unless otherwise noted.
Corporate actions and dividend income are recorded on the ex-date except for certain foreign securities which are recorded as soon after the ex-date as the Funds become aware of such, net of any non-reclaimable tax withholdings.
105
Stock Funds, September 30, 2009 (continued)
Distributions received from real estate investment trusts (REITs) in excess of their income are recorded as a reduction of the cost of the related investments. If the Funds no longer own the applicable securities, any distributions received in excess of income are recorded as realized gains.
Awards from class action litigation are recorded as a reduction of cost if the Funds still own the applicable securities on the payment date. If the Funds no longer own the applicable securities, the proceeds are recorded as realized gains.
Expenses
General expenses of the Trust are allocated to the Funds and other series of the Trust based upon relative net assets or other expense allocation methodologies determined by the nature of the expense. Expenses directly attributable to a Fund are charged to such Fund.
Determination of Class Net Asset Value
All income, expenses (other than class-specific expenses, as shown on the Statements of Operations) and realized and unrealized gains (losses) are allocated to each class of the Funds on a daily basis, based on the relative net assets of each class, for purposes of determining the net asset value of each class.
Federal Income Tax Status
Each Fund intends to qualify each year as a "regulated investment company" under Subchapter M of the Internal Revenue Code, as amended, and will distribute substantially all of its taxable income, if any, for its tax year, and as such will not be subject to federal income taxes. In addition, each Fund intends to distribute in each calendar year substantially all of its net investment income, capital gains and certain other amounts, if any, such that each Fund should not be subject to federal excise tax. Therefore, no federal income or excise tax provision is recorded.
Distributions to Shareholders
Distributions from net investment income for Columbia Asset Allocation Fund and Columbia Disciplined Value Fund, if any, are declared and paid quarterly. Distributions from net investment income for Columbia Large Cap Growth Fund, Columbia Contrarian Core Fund and Columbia Small Cap Core Fund, if any, are declared and paid annually. Net realized capital gains, if any, are declared and distributed at least annually for all Funds. Income distributions and capital gain distributions are determined in accordance with federal income tax regulations which may differ from GAAP.
Indemnification
In the normal course of business, each Fund enters into contracts that contain a variety of representations and warranties and which provide general indemnities. A Fund's maximum exposure under these arrangements is unknown because this would involve future claims against a Fund. Also, under the Trust's organizational documents and by contract, the Trustees and officers of the Trust are indemnified against certain liabilities that may arise out of actions relating to their duties to the Trust. However, based on experience, the Funds expect the risk of loss due to these representations, warranties and indemnities to be minimal.
Note 3. Federal Tax Information
The timing and character of income and capital gain distributions are determined in accordance with income tax regulations, which may differ from GAAP. Reclassifications are made to each Fund's capital accounts for permanent tax differences to reflect income and gains available for distribution (or available capital loss carryforwards) under income tax regulations.
For the year ended September 30, 2009, permanent book and tax basis differences resulting primarily from differing
106
Stock Funds, September 30, 2009 (continued)
treatments for net operating losses, foreign currency transactions, expired capital loss carryforwards, market discount accretion/premium amortization on debt securities, REIT adjustments, proceeds from litigation settlements, passive foreign investment company ("PFIC") adjustments and paydown adjustments were identified and reclassified among the components of each Fund's net assets as follows:
| | | Undistributed
(Overdistributed)
Net Investment
Income | | Accumulated
Net Realized
Gain (Loss) | | Paid-In Capital | |
| Columbia Asset Allocation Fund | | $ | 200,050 | | | $ | (195,871 | ) | | $ | (4,179 | ) | |
| Columbia Large Cap Growth Fund | | | 663,170 | | | | 49,224,309 | | | | (49,887,479 | ) | |
| Columbia Disciplined Value Fund | | | (2 | ) | | | (3 | ) | | | 5 | | |
| Columbia Contrarian Core Fund | | | 5,050 | | | | 380 | | | | (5,430 | ) | |
| Columbia Small Cap Core Fund | | | 849,498 | | | | (155,408 | ) | | | (694,090 | ) | |
Net investment income and net realized gains (losses), as disclosed on the Statements of Operations, and net assets were not affected by these reclassifications.
The tax character of distributions paid during the years ended September 30, 2009 and September 30, 2008 was as follows:
| | | September 30, 2009 | |
| | | Ordinary
Income* | | Long-Term
Capital Gains | |
| Columbia Asset Allocation Fund | | $ | 4,673,335 | | | $ | — | | |
| Columbia Large Cap Growth Fund | | | 3,097,329 | | | | — | | |
| Columbia Disciplined Value Fund | | | 5,792,142 | | | | — | | |
| Columbia Contrarian Core Fund | | | 2,862,875 | | | | — | | |
| Columbia Small Cap Core Fund | | | — | | | | 51,429,836 | | |
| | | September 30, 2008 | |
| | | Ordinary
Income* | | Long-Term
Capital Gains | |
| Columbia Asset Allocation Fund | | $ | 16,866,926 | | | $ | 18,874,251 | | |
| Columbia Large Cap Growth Fund | | | 45,787,868 | | | | 84,902,930 | | |
| Columbia Disciplined Value Fund | | | 30,074,083 | | | | 33,058,052 | | |
| Columbia Contrarian Core Fund | | | 4,007,433 | | | | 38,235,728 | | |
| Columbia Small Cap Core Fund | | | 15,046,065 | | | | 202,806,013 | | |
* For tax purposes short-term capital gain distributions, if any, are considered ordinary income distributions.
107
Stock Funds, September 30, 2009 (continued)
As of September 30, 2009, the components of distributable earnings on a tax basis were as follows:
| | | Undistributed
Ordinary
Income | | Undistributed
Long-Term
Capital Gains | | Net Unrealized
Appreciation
(Depreciation)* | |
| Columbia Asset Allocation Fund | | $ | 540,175 | | | $ | — | | | $ | 18,959,157 | | |
| Columbia Large Cap Growth Fund | | | 6,636,758 | | | | — | | | | 212,492,888 | | |
| Columbia Disciplined Value Fund | | | 99,388 | | | | — | | | | 45,933,671 | | |
| Columbia Contrarian Core Fund | | | 2,006,092 | | | | — | | | | 70,870,603 | | |
| Columbia Small Cap Core Fund | | | — | | | | — | | | | (28,615,736 | ) | |
* The differences between book-basis and tax-basis net unrealized appreciation/depreciation are primarily due to deferral of losses from wash sales and discount accretion/premium amortization on debt securities.
Unrealized appreciation and depreciation at September 30, 2009, based on cost of investments for federal income tax purposes, excluding any unrealized appreciation and depreciation from changes in the value of other assets and liabilities resulting from changes in exchange rates, were:
| | | Unrealized
Appreciation | | Unrealized
Depreciation | | Net Unrealized
Appreciation
(Depreciation) | |
| Columbia Asset Allocation Fund | | $ | 25,302,167 | | | $ | (6,343,010 | ) | | $ | 18,959,157 | | |
| Columbia Large Cap Growth Fund | | | 227,550,063 | | | | (15,057,175 | ) | | | 212,492,888 | | |
| Columbia Disciplined Value Fund | | | 60,866,271 | | | | (14,932,600 | ) | | | 45,933,671 | | |
| Columbia Contrarian Core Fund | | | 78,956,075 | | | | (8,085,472 | ) | | | 70,870,603 | | |
| Columbia Small Cap Core Fund | | | 112,031,056 | | | | (140,646,792 | ) | | | (28,615,736 | ) | |
The following capital loss carryforwards may be available to reduce taxable income arising from future net realized gains on investments, if any, to the extent permitted by the Internal Revenue Code:
| | | Year of Expiration | |
| | | 2010 | | 2011 | | 2017 | | Total | |
| Columbia Asset Allocation Fund | | $ | — | | | $ | — | | | $ | 15,394,963 | | | $ | 15,394,963 | | |
| Columbia Large Cap Growth Fund | | | 92,626,019 | | | | 5,529,590 | | | | 101,274,621 | | | | 199,430,230 | | |
| Columbia Disciplined Value Fund | | | — | | | | — | | | | 57,648,687 | | | | 57,648,687 | | |
| Columbia Contrarian Core Fund | | | 1,963,275 | | | | — | | | | 13,558,761 | | | | 15,522,036 | | |
| Columbia Small Cap Core Fund | | | — | | | | — | | | | 6,883,381 | | | | 6,883,381 | | |
Of the capital loss carryforwards attributable to Columbia Contrarian Core Fund, $1,963,275 (expiring September 30, 2010) remains from the Columbia Large Cap Core Fund merger with Columbia Contrarian Core Fund.
Of the capital loss carryforwards attributable to Columbia Large Cap Growth Fund, $43,705,919 (expiring September 30, 2010) remain from the merger with Columbia Growth Fund. The availability of a portion of the remaining capital loss carryforwards from the Columbia Growth Fund may be limited in a given year.
108
Stock Funds, September 30, 2009 (continued)
Of the capital loss carryforwards attributable to Columbia Large Cap Growth Fund, $12,700,626 (expiring September 30, 2010) remain from the merger with Columbia Tax Managed Growth Fund. The availability of a portion of the remaining capital loss carryforwards from the Columbia Tax Managed Fund may be limited in a given year.
Of the capital loss carryforwards attributable to Columbia Large Cap Growth Fund, $41,749,064 ($36,219,474 expiring September 30, 2010, and $5,529,590 expiring September 30, 2011) remain from the merger with Columbia Growth Stock. The availability of a portion of the remaining capital loss carryforwards from the Columbia Growth Stock Fund may be limited in a given year.
Under current tax rules, certain currency and capital losses realized after October 31 may be deferred and treated as occurring on the first day of the following fiscal year. As of September 30, 2009, post-October capital losses attributed to security transactions were deferred to October 1, 2009 as follows:
| Columbia Asset Allocation Fund | | $ | 28,327,068 | | |
| Columbia Large Cap Growth Fund | | | 270,043,871 | | |
| Columbia Disciplined Value Fund | | | 89,101,025 | | |
| Columbia Contrarian Core Fund | | | 17,423,230 | | |
| Columbia Small Cap Core Fund | | | 23,745,679 | | |
Management is required to determine whether a tax position of the Funds is more likely than not to be sustained upon examination by the applicable taxing authority, including resolution of any related appeals or litigation processes, based on the technical merits of the position. The tax benefit to be recognized by each Fund is measured as the largest amount of benefit that is greater than fifty percent likely of being realized upon ultimate settlement. Management is not aware of any tax positions for which it is reasonably possible that the total amounts of unrecognized tax benefits will significantly change in the next twelve months. However, management's conclusions may be subject to review and adjustment at a later date based on factors including, but not limited to, new tax laws, regulations, and administrative interpretations (including relevant court decisions). The Funds' federal tax returns for the prior three fiscal ye ars remain subject to examination by the Internal Revenue Service.
Note 4. Fees and Compensation Paid to Affiliates
Investment Advisory Fee
Columbia, an indirect, wholly owned subsidiary of Bank of America Corporation ("BOA"), provides investment advisory services to the Funds. In rendering investment advisory services to the Funds, Columbia may use the portfolio management and research resources of Columbia Management Pte. Ltd., an affiliate of Columbia. Columbia receives a monthly investment advisory fee based on each Fund's average daily net assets at the following annual rates:
| | | First
$200
Million | | $200 Million
to $500
Million | | $500 Million
to $1
Billion | | $1 Billion
to $1.5
Billion | | $1.5 Billion
to $2
Billion | | $2 Billion
to $3
Billion | | $3 Billion
to $6
Billion | | Over
$6 Billion | |
Columbia Asset
Allocation Fund | | | 0.650 | % | | | 0.650 | % | | | 0.600 | % | | | 0.550 | % | | | 0.500 | % | | | 0.500 | % | | | 0.480 | % | | | 0.460 | % | |
Columbia Large Cap
Growth Fund | | | 0.700 | % | | | 0.575 | % | | | 0.450 | % | | | 0.450 | % | | | 0.450 | % | | | 0.450 | % | | | 0.450 | % | | | 0.450 | % | |
Columbia Disciplined
Value Fund | | | 0.700 | % | | | 0.700 | % | | | 0.650 | % | | | 0.600 | % | | | 0.550 | % | | | 0.550 | % | | | 0.530 | % | | | 0.510 | % | |
Columbia Contrarian
Core Fund | | | 0.700 | % | | | 0.700 | % | | | 0.650 | % | | | 0.600 | % | | | 0.550 | % | | | 0.550 | % | | | 0.530 | % | | | 0.510 | % | |
Columbia Small Cap
Core Fund | | | 0.750 | % | | | 0.750 | % | | | 0.700 | % | | | 0.650 | % | | | 0.600 | % | | | 0.550 | % | | | 0.550 | % | | | 0.550 | % | |
109
Stock Funds, September 30, 2009 (continued)
For the year ended September 30, 2009, the effective investment advisory fee rates for the Funds, as a percentage of each Fund's average daily net assets, were as follows:
| | | Effective
Fee Rate | |
| Columbia Asset Allocation Fund | | | 0.65 | % | |
| Columbia Large Cap Growth Fund | | | 0.53 | % | |
| Columbia Disciplined Value Fund | | | 0.70 | % | |
| Columbia Contrarian Core Fund | | | 0.70 | % | |
| Columbia Small Cap Core Fund | | | 0.75 | % | |
BOA entered into an agreement dated September 29, 2009 to sell a portion of the asset management business of Columbia Management Group, LLC to Ameriprise Financial, Inc. The transaction ("Transaction") includes a sale of the part of the asset management business that advises long-term mutual funds, including the Funds. The Transaction is subject to certain approvals and other conditions to closing, and is currently expected to close in the spring of 2010.
Administration Fee
Columbia provides administrative and other services to the Funds. Columbia receives a monthly administration fee from each Fund, except Columbia Large Cap Growth Fund, at the annual rate of 0.067% of each Fund's average daily net assets. Columbia receives a monthly administration fee from Columbia Large Cap Growth Fund at the annual rate of 0.050% of the Fund's average daily net assets.
Pricing and Bookkeeping Fees
The Funds have entered into a Financial Reporting Services Agreement (the "Financial Reporting Services Agreement") with State Street Bank & Trust Company ("State Street") and Columbia pursuant to which State Street provides financial reporting services to the Funds. The Funds have also entered into an Accounting Services Agreement (collectively with the Financial Reporting Services Agreement, the "State Street Agreements") with State Street and Columbia pursuant to which State Street provides accounting services to the Funds. Under the State Street Agreements, each Fund pays State Street an annual fee of $38,000 paid monthly plus an additional monthly fee based on an annualized percentage rate of average daily net assets of each Fund for the month. The aggregate fee per Fund will not exceed $140,000 per year (exclusive of out-of-pocket expenses and charges). The Funds also reimburse State Street for certain out-of-pocket ex penses and charges.
The Funds have entered into a Pricing and Bookkeeping Oversight and Services Agreement (the "Services Agreement") with Columbia. Under the Services Agreement, Columbia provides services related to Fund expenses and the requirements of the Sarbanes-Oxley Act of 2002, and provides oversight of the accounting and financial reporting services provided by State Street. Under the Services Agreement, the Funds reimburse Columbia for out-of-pocket expenses.
Transfer Agent Fee
Columbia Management Services, Inc. (the "Transfer Agent"), an affiliate of Columbia and an indirect, wholly owned subsidiary of BOA, provides shareholder services to the Funds and has contracted with Boston Financial Data Services ("BFDS") to serve as sub-transfer agent.
The Funds pay a monthly fee to the Transfer Agent for its services. All share classes with the exception of Class Y shares (the "Other Share Classes") pay a monthly service fee (the "aggregate fee") based on the following:
(i) An annual rate of $17.34 is applied to the aggregate number of open accounts for the Other Share Classes, and
(ii) An allocated portion of fees for wire, telephone and redemption orders, Individual Retirement Account ("IRA") trustee agent fees and account transcript fees due to the Transfer Agent from shareholders of the Funds and credits (net of bank charges) earned with respect to balances in accounts the Transfer Agent maintains in connection with its services to the Funds. The Transfer Agent also receives reimbursement for certain out-of-pocket expenses.
The aggregate fee is allocated to the Other Share Classes based on the relative average daily net assets of each share class.
The Class Y shares of Columbia Large Cap Growth Fund pay a monthly service fee based on the following:
(i) An annual rate of $17.34 is applied to the aggregate number of open accounts for Class Y shares, and
(ii) An allocated portion of fees for wire, telephone and redemption orders, IRA trustee agent fees and account transcript fees due to the Transfer Agent from shareholders
110
Stock Funds, September 30, 2009 (continued)
of the Funds and credits (net of bank charges) earned with respect to balances in accounts the Transfer Agent maintains in connection with its services to the Funds. The Transfer Agent also receives reimbursement for certain out-of-pocket expenses.
The Transfer Agent is also entitled to receive reimbursement of certain sub-transfer agent fees paid by the Transfer Agent (exclusive of BFDS fees), calculated based on the combined assets held in the Other Share Classes in omnibus accounts and intended to recover the cost of payments to other parties (including affiliates of BOA) for services to those accounts. Such fees are allocated to the Other Share Classes based on the relative average daily net assets of each share class. The Transfer Agent pays the fees of BFDS for services as sub-transfer agent and is not entitled to reimbursement for such fees from the Funds.
An annual minimum account balance fee of $20 may apply to certain accounts with a value below each Fund's initial minimum investment requirements to reduce the impact of small accounts on transfer agent fees. These minimum account balance fees are recorded as part of expense reductions on the Statements of Operations. For the year ended September 30, 2009, no minimum account balance fees were charged by the Funds.
Underwriting Discounts, Service and Distribution Fees
Columbia Management Distributors, Inc. (the "Distributor"), an affiliate of Columbia and an indirect, wholly owned subsidiary of BOA, is the principal underwriter of the Funds' shares. For the year ended September 30, 2009, the Distributor has retained net underwriting discounts and received net CDSC fees as follows:
| | | Front-End Sales Charge | | CDSC | |
| | | Class A | | Class E | | Class T | | Class A | | Class B | | Class C | |
| Columbia Asset Allocation Fund | | $ | 5,369 | | | $ | — | | | $ | 1,915 | | | $ | — | | | $ | 4,882 | | | $ | 194 | | |
| Columbia Large Cap Growth Fund | | | 18,093 | | | | 87 | | | | 5,524 | | | | 212 | | | | 33,744 | | | | 2,549 | | |
| Columbia Disciplined Value Fund | | | 1,422 | | | | — | | | | 2,109 | | | | — | | | | 6,297 | | | | 598 | | |
| Columbia Contrarian Core Fund | | | 12,914 | | | | — | | | | 1,659 | | | | 7 | | | | 4,070 | | | | 442 | | |
| Columbia Small Cap Core Fund | | | 9,768 | | | | — | | | | 1,442 | | | | 6 | | | | 20,617 | | | | 100 | | |
The Funds have adopted plans pursuant to Rule 12b-1 under the 1940 Act (the "Plans") which require the payment of monthly distribution and service fees to the Distributor based on the average daily net assets of each Fund at the following annual rates:
| | | Distribution Fee | |
| | | Class A | | Class B | | Class C | | Class E | | Class F | |
| Columbia Asset Allocation Fund | | | 0.10 | % | | | 0.75 | % | | | 0.75 | % | | | — | | | | — | | |
| Columbia Large Cap Growth Fund | | | 0.10 | % | | | 0.75 | % | | | 0.75 | % | | | 0.10 | % | | | 0.75 | % | |
| Columbia Disciplined Value Fund | | | 0.10 | % | | | 0.75 | % | | | 0.75 | % | | | — | | | | — | | |
| Columbia Contrarian Core Fund | | | 0.10 | % | | | 0.75 | % | | | 0.75 | % | | | — | | | | — | | |
| Columbia Small Cap Core Fund | | | 0.10 | % | | | 0.75 | % | | | 0.75 | % | | | — | | | | — | | |
111
Stock Funds, September 30, 2009 (continued)
| | | Service Fee | |
| | | Class A | | Class B | | Class C | | Class E | | Class F | |
| Columbia Asset Allocation Fund | | | 0.25 | % | | | 0.25 | % | | | 0.25 | % | | | — | | | | — | | |
| Columbia Large Cap Growth Fund | | | 0.25 | % | | | 0.25 | % | | | 0.25 | % | | | 0.25 | % | | | 0.25 | % | |
| Columbia Disciplined Value Fund | | | 0.25 | % | | | 0.25 | % | | | 0.25 | % | | | — | | | | — | | |
| Columbia Contrarian Core Fund | | | 0.25 | % | | | 0.25 | % | | | 0.25 | % | | | — | | | | — | | |
| Columbia Small Cap Core Fund | | | 0.25 | % | | | 0.25 | % | | | 0.25 | % | | | — | | | | — | | |
The Funds may pay distribution and service (12b-1) fees at the maximum annual rate of 0.35% of each Fund's average daily net assets attributable to Class A shares (comprised of up to 0.10% for distribution services and up to 0.25% for shareholder services), but limited such fees to an aggregate of not more than 0.25% for Class A shares during the current fiscal year. For the year ended September 30, 2009, the distribution and service fees were 0.00% and 0.25%, respectively, of each Fund's average daily net assets attributable to Class A shares.
The CDSC and the distribution fees received from the Plans are used principally as repayment to the Distributor for amounts paid by the Distributor to dealers who sold such shares.
Shareholder Services Fees
The Funds have adopted a shareholder services plan that permits them to pay for certain services provided to Class T shareholders by service organizations. The Funds may pay shareholder services fees of up to 0.25% of each Fund's average daily net assets attributable to Class T shares for shareholder liaison services and up to 0.25% of each Fund's average daily net assets attributable to Class T shares for administrative support services, provided, however, that the aggregate fee shall not exceed 0.30% of each Fund's average daily net assets attributable to Class T shares. For the year ended September 30, 2009, the shareholder services fee was 0.30% of each Fund's average daily net assets attributable to Class T shares.
Fee Waivers and Expense Reimbursements
Effective January 1, 2009, Columbia has voluntarily agreed to reimburse a portion of the Funds' expenses so that the Funds' ordinary operating expenses (excluding any distribution and service fees, brokerage commissions, interest, taxes and extraordinary expenses, but including custodian charges relating to overdrafts, if any), after giving effect to any balance credits from the Funds' custodian, do not exceed the following annual rates, based on each Fund's average daily net assets:
| | | Annual Rate | |
| Columbia Asset Allocation Fund | | | 0.95 | % | |
| Columbia Large Cap Growth Fund | | | 1.00 | % | |
| Columbia Disciplined Value Fund | | | 1.00 | % | |
| Columbia Small Cap Core Fund | | | 1.10 | % | |
Columbia, in its discretion, may revise or discontinue this arrangement at any time.
Effective February 1, 2009, Columbia has voluntarily agreed to reimburse a portion of the Columbia Contrarian Core Fund's expenses so that the Fund's ordinary operating expenses (excluding any distribution and service fees, brokerage commissions, interest, taxes and extraordinary expenses, but including custodian charges relating to overdrafts, if any), after giving effect to any balance credits from the Fund's custodian, do not exceed 0.94% of the Fund's average daily net assets on an annualized basis. Columbia, in its discretion, may revise or discontinue this arrangement at any time. Prior to February 1, 2009, Columbia voluntarily reimbursed Columbia Contrarian Core Fund so that ordinary operating expenses did not exceed 0.89% of the Fund's average daily net assets.
Fees Paid to Officers and Trustees
All officers of the Funds are employees of Columbia or its affiliates and, with the exception of the Funds' Chief Compliance Officer, receive no compensation from the Funds. The Board of Trustees has appointed a Chief Compliance
112
Stock Funds, September 30, 2009 (continued)
Officer to the Funds in accordance with federal securities regulations. The Funds, along with other affiliated funds, pay their pro-rata share of the expenses associated with the Chief Compliance Officer. Each Fund's expenses for the Chief Compliance Officer will not exceed $15,000 per year.
The Trust's eligible Trustees may participate in a deferred compensation plan which may be terminated at any time. Obligations of the plan will be paid solely out of the Funds' assets.
As a result of fund mergers, certain Funds assumed the liabilities of the deferred compensation plan of the acquired funds, which are included in "Trustees' fees" on the Statements of Assets and Liabilities. The deferred compensation plan may be terminated at any time. Any payments to plan participants are paid solely out of the Funds' assets.
Other Related Party Transactions
In connection with the purchase and sale of their securities during the period, the Funds used one or more brokers that are affiliates of BOA. Total brokerage commissions paid to affiliated brokers for the year ended September 30, 2009 were as follows:
| | | Amount | |
| Columbia Asset Allocation Fund | | $ | 4,897 | | |
| Columbia Large Cap Growth Fund | | | 99,531 | | |
| Columbia Disciplined Value Fund | | | 18,780 | | |
| Columbia Contrarian Core Fund | | | 789 | | |
| Columbia Small Cap Core Fund | | | 2,511 | | |
Note 5. Custody Credits
Each Fund has an agreement with its custodian bank under which custody fees may be reduced by balance credits. These credits are recorded as part of expense reductions on the Statements of Operations. The Funds could have invested a portion of the assets utilized in connection with the expense offset arrangement in an income-producing asset if they had not entered into such an agreement.
For the year ended September 30, 2009, these custody credits reduced total expenses for the Funds as follows:
| | | Custody
Credits | |
| Columbia Asset Allocation Fund | | $ | 213 | | |
| Columbia Large Cap Growth Fund | | | 11 | | |
| Columbia Disciplined Value Fund | | | 22 | | |
| Columbia Contrarian Core Fund | | | 3 | | |
| Columbia Small Cap Core Fund | | | 79 | | |
Note 6. Objectives and Strategies for Investing in Derivatives Instruments
Objectives
Columbia Asset Allocation Fund and Columbia Disciplined Value Fund use derivatives instruments, including futures contracts, options, and forward foreign currency exchange contracts, in order to meet their investment objectives. The Funds employ strategies in differing combinations to permit them to increase, decrease or change the level of exposure to market risk factors. The achievement of any strategy relating to derivatives depends on analysis of various risk factors, and if the derivatives investment strategies do not work as intended, the Funds may not achieve their objectives.
In pursuit of the Funds' investment objectives, Columbia Asset Allocation Fund and Columbia Disciplined Value Fund are exposed to the following market risks:
Equity Risk: Equity risk relates to changes in value of equity securities such as common stocks due to general market conditions such as real or perceived adverse economic conditions, changes in the general outlook for corporate earnings, or adverse investor sentiment. Equity securities generally have greater price volatility than fixed income securities.
Interest Rate Risk: Interest rate risk refers to the fluctuation in value of fixed income securities because of the inverse relationship of price and yield. Fixed income securities generally will decline in value upon an increase in general interest rates, and their value generally will increase upon a decline in general interest rates. Fixed income securities with
113
Stock Funds, September 30, 2009 (continued)
longer durations tend to be more sensitive to changes in interest rates, usually making them more volatile than securities with shorter durations.
Foreign Exchange Rate Risk: Foreign exchange rate risk relates to the change in the U.S. dollar value of a security that is denominated in a foreign currency. The U.S. dollar value of a foreign-currency-denominated security will decrease as the dollar appreciates against the currency, while the U.S. dollar value will increase as the dollar depreciates against the currency.
The following notes provide more detailed information about each derivative type held by Columbia Asset Allocation Fund and Columbia Disciplined Value Fund:
Futures Contracts—Columbia Asset Allocation Fund and Columbia Disciplined Value Fund entered into stock index futures contracts to equitize cash in order to maintain appropriate equity market exposure while keeping sufficient cash to accommodate daily redemptions. Columbia Asset Allocation Fund entered into interest rate futures contracts to manage the duration and yield curve exposure of the Fund versus the benchmark.
The use of futures contracts involves certain risks, which include: (1) imperfect correlation between the price movement of the instruments and the underlying securities, (2) inability to close out positions due to differing trading hours, or the temporary absence of a liquid market, for either the instruments or the underlying securities, or (3) an inaccurate prediction of the future direction of interest rates by Columbia. Upon entering into a futures contract, the Funds pledge cash or securities with the broker in an amount sufficient to meet the initial margin requirement. Subsequent payments are made or received by a Fund equal to the daily change in the contract value and are recorded as variation margin receivable or payable and offset in unrealized gains or losses. The Funds recognize a realized gain or loss when the contract is closed or expires.
Futures contracts involve, to varying degrees, risk of loss in excess of the variation margin disclosed on the Fund's Statements of Assets and Liabilities.
Options—Columbia Asset Allocation Fund had written covered call and purchased put options to decrease the Fund's exposure to equity risk and to increase return on instruments. A written covered call and purchased put options become more valuable as the price of the underlying instruments depreciates relative to the strike price.
Writing put options tends to increase the Fund's exposure to the underlying instrument. When the Fund writes a call or put option, an amount equal to the premium received is recorded as a liability and subsequently marked-to-market to reflect the current value of the option written. Premiums received from writing options which expire are treated as realized gains. Premiums received from writing options which are exercised or closed are added to the proceeds or offset against the amounts paid on the underlying security transaction to determine the realized gain or loss. The Fund, as writer of an option, has no control over whether the underlying security may be sold (call) or purchased (put) and as a result bears the market risk of an unfavorable change in the price of the security underlying the written option. There is the risk that the Fund may not be able to enter into a closing transaction because of an illiquid market. The Fund's custodian will set aside cash or liquid portfolio securities equal to the amount of the written options contract commitment in a separate account.
The Fund may also purchase put and call options. Purchasing call options tends to increase the Fund's exposure to the underlying instrument. Purchasing put options tends to decrease the Fund's exposure to the underlying instrument. The Fund may pay a premium, which is included in the Fund's Statement of Assets and Liabilities as an investment and subsequently marked-to-market to reflect the current value of the option. The risk associated with purchasing put and call options is limited to the premium paid. Premiums paid for purchasing options which expire are treated as realized losses. Premiums paid for purchasing options which are exercised are added to the amounts paid (call) or offset against the proceeds (put) on the underlying security to determine the realized gain or loss. If a Fund enters into a closing transaction, the Fund will realize a gain or loss, depending on whether the proceeds from the closing transaction are greater or less than the cost of the option.
Forward Foreign Currency Exchange Contracts—Columbia Asset Allocation Fund entered into forward foreign currency exchange contracts to shift its investment exposure from one currency to another. The Fund used forward contracts to shift its U.S. dollar exposure in order to achieve a representative weighted mix of major currencies in its benchmark and/or to recover an underweight country exposure in its portfolio.
114
Stock Funds, September 30, 2009 (continued)
Forward foreign currency exchange contracts are agreements to exchange one currency for another at a future date at a specified price. These contracts are used to minimize the exposure to foreign exchange rate fluctuations during the period between the trade and settlement dates of the contract. The Fund may utilize forward foreign currency exchange contracts in connection with the settlement of purchases and sales of securities. The Fund may also enter into these contracts to reduce the exposure to adverse price movements in certain other foreign currency denominated assets. Contracts to buy generally are used to acquire exposure to foreign currencies, while contracts to sell are generally used to reduce the exposure to foreign exchange rate fluctuations. Forward foreign currency exchange contracts are valued daily at the current exchange rate of the underlying currency, resulting in unrealized gains (losses) which become reali zed at the time the contracts are closed or mature. Realized and unrealized gains (losses) arising from such transactions are included in net realized and unrealized gains (losses) on foreign currency transactions. The use of forward foreign currency exchange contracts does not eliminate fluctuations in the prices of the Fund's portfolio securities. While the maximum potential loss from such contracts is the aggregate face value in U.S. dollars at the time the contract was opened, exposure is typically limited to the change in value of the contract (in U.S. dollars) over the period it remains open. The Fund could also be exposed to risk that counterparties of the contracts may be unable to fulfill the terms of the contracts.
The following table is a summary of the Funds' value of derivative instruments as of September 30, 2009.
| | | Fair Value of Derivative Instruments | |
| | | Asset Derivatives | | Liability Derivatives | |
| | | Statements of Assets and Liabilities
Fair Value | | Statements of Assets and Liabilities
Fair Value | |
| Funds | | Futures
Variation
Margin* | | Unrealized
Appreciation
on Forward
Foreign
Currency
Exchange
Contracts | | Futures
Variation
Margin* | | Unrealized
Depreciation
on Forward
Foreign
Currency
Exchange
Contracts | |
| Columbia Asset Allocation Fund | | $ | 218 | | | $ | 201,991 | | | $ | 8,459 | | | $ | 119,406 | | |
| Columbia Disciplined Value Fund | | | — | | | | — | | | | 12,179 | | | | — | | |
* Includes only the current day's variation margin.
The effect of derivative instruments on the Statements of Operations for the year ended September 30, 2009.
| | |
| | Amount of Realized Gain or (Loss) on
Derivatives Recognized in Income | | Change in Unrealized Appreciation
(Depreciation) on Derivatives
Recognized in Income | |
| Funds | |
Risk
Exposure | | Futures
Contracts | | Written
Options | | Forward
Foreign
Currency
Exchange
Contracts | | Futures
Contracts | | Written
Options | | Forward
Foreign
Currency
Exchange
Contracts | |
Columbia Asset
Allocation Fund | | Equity, Interest Rate and
Foreign Exchange Rate | | $ | (353,442 | ) | | $ | 29,755 | | | $ | (80,962 | ) | | $ | 233,936 | | | $ | 774 | | | $ | 36,673 | | |
Columbia Disciplined
Value Fund | | Equity | | | (1,480,194 | ) | | | — | | | | — | | | | 457,257 | | | | — | | | | — | | |
115
Stock Funds, September 30, 2009 (continued)
Note 7. Portfolio Information
For the year ended September 30, 2009, the cost of purchases and proceeds from sales of securities, excluding short-term obligations, for the Funds were as follows:
| | | U.S. Government Securities | | Other Investment Securities | |
| | | Purchases | | Sales | | Purchases | | Sales | |
| Columbia Asset Allocation Fund | | $ | 42,099,035 | | | $ | 45,934,202 | | | $ | 168,994,685 | | | $ | 183,763,598 | | |
| Columbia Large Cap Growth Fund | | | — | | | | — | | | | 1,665,787,400 | | | | 1,653,875,268 | | |
| Columbia Disciplined Value Fund | | | — | | | | — | | | | 477,088,039 | | | | 467,832,407 | | |
| Columbia Contrarian Core Fund | | | — | | | | — | | | | 464,246,894 | | | | 403,997,122 | | |
| Columbia Small Cap Core Fund | | | — | | | | — | | | | 50,848,502 | | | | 84,329,098 | | |
Note 8. Line of Credit
The Funds and other affiliated funds participate in a $280,000,000 committed, unsecured revolving line of credit provided by State Street. The maximum amount that may be borrowed by any fund is limited to the lesser of $200,000,000 and the Fund's borrowing limit set forth in the Fund's registration statement. Borrowings are available for short-term liquidity or temporary or emergency purposes.
Interest is charged to each participating fund based on the fund's borrowings at a rate per annum equal to the greater of the Federal Funds Rate plus 0.50% or the overnight LIBOR Rate plus 0.50%. In addition, an annual operations agency fee of $20,000, an amendment fee of 0.02% and a commitment fee of 0.12% per annum are accrued and apportioned among the participating funds pro rata based on their relative net assets. Prior to October 16, 2008, the Funds and other affiliated funds participated in a $350,000,000 committed, unsecured revolving line of credit and a $150,000,000 uncommitted, unsecured line of credit, both provided by State Street. Interest on the committed line of credit was charged to each participating fund based on the fund's borrowings at a rate per annum equal to the Federal Funds Rate plus 0.50%. In addition, a commitment fee of 0.10% per annum was accrued and apportioned among the participating funds pro rata based on their relative net assets. Interest on the uncommitted line of credit was charged to each participating fund based on the fund's borrowings at a rate per annum equal to the Federal Funds Rate plus 0.375%. State Street charged an annual operations agency fee of $40,000 for the committed line of credit and was able to charge an annual administration fee of $15,000 for the uncommitted line of credit. The commitment fee, the operations agency fee and the administration fee were accrued and apportioned among the participating funds pro rata based on their relative net assets.
For the year ended September 30, 2009, the average daily loan balance outstanding on days where borrowing existed, and the weighted average interest rate of each Fund that borrowed were as follows:
| | | Average
Borrowings | | Weighted
Average
Interest
Rate | |
| Columbia Asset Allocation Fund | | $ | 1,000,000 | | | | 0.625 | % | |
| Columbia Large Cap Growth Fund | | | 2,520,000 | | | | 0.661 | % | |
| Columbia Disciplined Value Fund | | | 1,810,000 | | | | 1.013 | % | |
| Columbia Contrarian Core Fund | | | 1,450,000 | | | | 1.000 | % | |
Note 9. Securities Lending
Each Fund may lend its securities to certain approved brokers, dealers and other financial institutions. Each loan is collateralized by cash, in an amount at least equal to the market value of the securities loaned plus accrued income from the investment of collateral. The market value of the loaned securities is determined at the close of business of the Funds and any additional required collateral is delivered to the Funds on the next business day. The collateral received is invested and the income generated by the investment of the collateral, net of any fees remitted to State Street as the
116
Stock Funds, September 30, 2009 (continued)
lending agent and borrower rebates, is paid to the Funds. Generally, in the event of borrower default, the Funds have the right to use the collateral to offset any losses incurred. In the event the Funds are delayed or prevented from exercising their right to dispose of the collateral, there may be a potential loss to the Funds. The Funds bear the risk of loss with respect to the investment of collateral.
Note 10. Shares of Beneficial Interest
As of September 30, 2009, the Funds had shareholders that held greater than 5% of the shares outstanding of a Fund, whose shares were beneficially owned by participant accounts over which BOA and/or any of its affiliates had either sole or joint investment discretion. The percentages of shares of beneficial interest outstanding held therein are as follows:
| | | % of Shares
Outstanding
Held | |
| Columbia Large Cap Growth Fund | | | 31.3 | | |
| Columbia Disciplined Value Fund | | | 49.0 | | |
| Columbia Contrarian Core Fund | | | 22.5 | | |
| Columbia Small Cap Core Fund | | | 31.0 | | |
As of September 30, 2009, the Funds had shareholders that held greater than 5% of the shares outstanding of a Fund, over which BOA and/or any of its affiliates did not have investment discretion. The number of accounts and the percentages of shares of beneficial interest outstanding held therein are as follows:
| | | Number of
Shareholders | | % of Shares
Outstanding
Held | |
Columbia Disciplined
Value Fund | | | 1 | | | | 5.5 | | |
Columbia Contrarian
Core Fund | | | 1 | | | | 5.6 | | |
Columbia Small Cap
Core Fund | | | 1 | | | | 8.8 | | |
Subscription and redemption activity of these accounts may have a significant effect on the operations of the Funds.
Note 11. Regulatory Settlements
During the year ended September 30, 2009, Columbia Large Cap Growth Fund, Columbia Contrarian Core Fund and Columbia Small Cap Core Fund were entitled to receive payments of $663,170, $5,432 and $5,313, relating to certain regulatory settlements with third parties that each of these Funds has participated in during the year. The payments have been included in "Increase from regulatory settlements" on the Statements of Changes in Net Assets.
Note 12. Significant Risks and Contingencies
Sector Focus Risk
Certain Funds may focus their investments in certain sectors, subjecting them to greater risk than a fund that is less focused.
High-Yield Securities Risk
Columbia Asset Allocation Fund invests in high yield securities. Investing in high-yield securities may involve greater credit risk and considerations not typically associated with investing in U.S. Government bonds and other higher quality fixed income securities. These securities are non-investment grade securities, often referred to as "junk" bonds. Economic downturns may disrupt the high yield market and impair the ability of issuers to repay principal and interest. Also, an increase in interest rates would likely have an adverse impact on the value of such obligations. Moreover, high-yield securities may be less liquid to the extent that there is no established secondary market.
Foreign Securities Risk
There are certain additional risks involved when investing in foreign securities. These risks may involve foreign currency exchange rate fluctuations, adverse political and economic developments and the possible prevention of currency exchange or other foreign governmental laws or restrictions. In addition, the liquidity of foreign securities may be more limited than that of domestic securities.
Investments in emerging market countries are subject to additional risk. The risk of foreign investments is typically increased in less developed countries. These countries are
117
Stock Funds, September 30, 2009 (continued)
also more likely to experience high levels of inflation, deflation or currency devaluation which could hurt their economies and securities markets.
Asset-Backed Securities Risk
Columbia Asset Allocation Fund invests in asset-backed securities. The value of asset-backed securities may be affected by, among other factors, changes in interest rates, the market's assessment of the quality of underlying assets, the creditworthiness of the servicer for the underlying assets, factors concerning the interests in and structure of the issuer or the originator of the underlying assets, or the creditworthiness or rating of the entities that provide any supporting letters of credit, surety bonds, derivative instruments, or other credit enhancement. The value of asset-backed securities also will be affected by the exhaustion, termination or expiration of any credit enhancement. Most asset-backed securities are subject to prepayment risk, which is the possibility that the underlying debt may be refinanced or prepaid prior to maturity during periods of declining or low interest rates, causing the Fund to have to reinv est the money received in securities that have lower yields. In addition, the impact of prepayments on the value of asset-backed securities may be difficult to predict and may result in greater volatility.
Mortgage-Backed Securities Risk
Columbia Asset Allocation Fund invests in mortgage-backed securities. The value of mortgage-backed securities may be affected by, among other things, changes in interest rates, factors concerning the interests in and structure of the issuer or the originator of the mortgages, the creditworthiness of the entities that provide any supporting letters of credit, surety bonds or other credit enhancements or the quality of underlying assets or the market's assessment thereof. Mortgage-backed securities are subject to prepayment risk, which is the possibility that the underlying mortgage may be refinanced or prepaid prior to maturity during periods of declining or low interest rates, causing the Funds to have to reinvest the money received in securities that have lower yields. In addition, the impact of prepayments on the value of mortgage-backed securities may be difficult to predict and may result in greater volatility.
Legal Proceedings
Columbia Management Advisors, LLC and Columbia Management Distributors, Inc. (collectively, the "Columbia Group") are subject to a settlement agreement with the New York Attorney General ("NYAG") (the "NYAG Settlement") and a settlement order with the SEC (the "SEC Order") on matters relating to mutual fund trading, each dated February 9, 2005. Under the terms of the SEC Order, the Columbia Group (or predecessor entities) agreed, among other things, to: pay disgorgement and civil money penalties collectively totaling $140 million; cease and desist from violations of the antifraud provisions and certain other provisions of the federal securities laws; maintain certain compliance and ethics oversight structures; and retain an independent consultant to review the Columbia Group's applicable supervisory, compliance, control and other policies and procedures. The NYAG Settlement, among other things, requires Columbia Management Advis ors, LLC and its affiliates to reduce management fees for certain funds in the Columbia family of mutual funds in a projected total of $160 million over five years through November 30, 2009 and to make certain disclosures to investors relating to expenses. In connection with the Columbia Group providing services to the Columbia Funds, the Columbia Funds have voluntarily undertaken to implement certain governance measures designed to maintain the independence of their boards of trustees and certain special consulting and compliance measures.
Pursuant to the SEC Order and related procedures, the $140 million in settlement amounts described above has been substantially distributed in accordance with a distribution plan that was developed by an independent distribution consultant and approved by the SEC on April 6, 2007.
In connection with the events described above, various parties have filed suit against certain funds, the Trustees of the Columbia Funds, FleetBoston Financial Corporation and its affiliated entities and/or Bank of America and its affiliated entities.
On February 20, 2004, the Judicial Panel on Multidistrict Litigation transferred these cases and cases against other mutual fund companies based on similar allegations to the United States District Court in Maryland for consolidated or
118
Stock Funds, September 30, 2009 (continued)
coordinated pretrial proceedings (the "MDL"). Subsequently, additional related cases were transferred to the MDL. On September 29, 2004, the plaintiffs in the MDL filed amended and consolidated complaints. One of these amended complaints is a putative class action that includes claims under the federal securities laws and state common law, and that names Columbia Management Advisors, Inc. (which has since merged into Banc of America Capital Management, LLC (now named Columbia Management Advisors, LLC)) ("Columbia"), Columbia Funds Distributor, Inc. (now named Columbia Management Distributors, Inc.) (the "Distributor"), the Trustees of the Columbia Funds, Bank of America Corporation and others as defendants. Another of the amended complaints is a derivative action purportedly on behalf of the Columbia Funds that asserts claims under federal securities laws and state common law.
On February 25, 2005, Columbia and other defendants filed motions to dismiss the claims in the pending cases. On March 1, 2006, for reasons stated in the court's memoranda dated November 3, 2005, the United States District Court for the District of Maryland granted in part and denied in part the defendants' motions to dismiss. The court dismissed all of the class action claims pending against the Columbia Funds Trusts. As to Columbia and the Distributor, the claims under the Securities Act of 1933, the claims under Sections 34(b) and 36(a) of the Investment Company Act of 1940 ("ICA") and the state law claims were dismissed. The claims under Sections 10(b) and 20(a) of the Securities Exchange Act of 1934 and claims under Section 36(b) of the ICA were not dismissed.
On March 21, 2005, a purported class action was filed in Massachusetts state court alleging that certain conduct, including market timing, entitled Class B shareholders in certain Columbia Funds to an exemption from contingent deferred sales charges upon early redemption (the "CDSC Lawsuit"). The CDSC Lawsuit was removed to federal court in Massachusetts and transferred to the MDL.
On September 14, 2007, the plaintiffs and the Columbia defendants named in the MDL, including the Columbia Funds, entered into a stipulation of settlement with respect to all Columbia-related claims in the MDL described above, including the CDSC Lawsuit. The settlement is subject to court approval.
Note 13. Subsequent Events
On October 15, 2009 the committed line of credit discussed in Note 8 was renewed on amended terms. Pursuant to the amended terms, interest is charged to each participating fund based on the fund's borrowings at a rate per annum equal to the greater of the Federal Funds Rate plus 1.25% or the overnight LIBOR Rate plus 1.25%. In addition, a commitment fee of 0.15% per annum is accrued and apportioned among the participating funds pro rata based on their relative net assets. The annual operations agency fee of $20,000 was waived.
Effective November 1, 2009, the annual rate the Transfer Agent receives for the services discussed in Note 4 will change to $22.36 per open account.
119
Report of Independent Registered Public Accounting Firm
To the Trustees and the Shareholders of Columbia Funds Series Trust I
In our opinion, the accompanying statements of assets and liabilities, including the investment portfolios, and the related statements of operations and of changes in net assets and the financial highlights present fairly, in all material respects, the financial position of Columbia Asset Allocation Fund, Columbia Large Cap Growth Fund, Columbia Disciplined Value Fund, Columbia Contrarian Core Fund and Columbia Small Cap Core Fund (the "Funds") (constituting part of Columbia Funds Series Trust I) at September 30, 2009, the results of each of their operations for the year then ended, the changes in each of their net assets for each of the two years in the period then ended, and the financial highlights for each of the periods indicated in conformity with accounting principles generally accepted in the United States of America. These financial statements and financial highlights (hereafter referred to as "financial statements") ar e the responsibility of the Funds' management. Our responsibility is to express an opinion on these financial statements based on our audits. We conducted our audits of these financial statements in accordance with the standards of the Public Company Accounting Oversight Board (United States). Those standards require that we plan and perform the audit to obtain reasonable assurance about whether the financial statements are free of material misstatement. An audit includes examining, on a test basis, evidence supporting the amounts and disclosures in the financial statements, assessing the accounting principles used and significant estimates made by management, and evaluating the overall financial statement presentation. We believe that our audits, which included confirmation of securities at September 30, 2009 by correspondence with the custodian and brokers, provide a reasonable basis for our opinion.
PricewaterhouseCoopers LLP
Boston, Massachusetts
November 20, 2009
120
Federal Income Tax Information (Unaudited)
Columbia Asset Allocation Fund
For non-corporate shareholders 49.81% or the maximum amount allowable under the Jobs and Growth Tax Relief Reconciliation Act of 2003, of the ordinary income distributed by the Fund for the fiscal year ended September 30, 2009 may represent qualified dividend income.
35.31% of the ordinary income distributed by the Fund, for the fiscal year ended September 30, 2009, qualifies for the corporate dividends received deduction.
The Fund will notify shareholders in January 2010 of amounts for use in preparing 2009 income tax returns.
Columbia Large Cap Growth Fund
For non-corporate shareholders 100.00% or the maximum amount allowable under the Jobs and Growth Tax Relief Reconciliation Act of 2003, of the ordinary income distributed by the Fund for the fiscal year ended September 30, 2009 may represent qualified dividend income.
100.00% of the ordinary income distributed by the Fund, for the fiscal year ended September 30, 2009, qualifies for the corporate dividends received deduction.
The Fund will notify shareholders in January 2010 of amounts for use in preparing 2009 income tax returns.
Columbia Disciplined Value Fund
For non-corporate shareholders 100.00% or the maximum amount allowable under the Jobs and Growth Tax Relief Reconciliation Act of 2003, of the ordinary income distributed by the Fund for the fiscal year ended September 30, 2009 may represent qualified dividend income.
100.00% of the ordinary income distributed by the Fund, for the fiscal year ended September 30, 2009, qualifies for the corporate dividends received deduction.
The Fund will notify shareholders in January 2010 of amounts for use in preparing 2009 income tax returns.
Columbia Contrarian Core Fund
For non-corporate shareholders 100.00% or the maximum amount allowable under the Jobs and Growth Tax Relief Reconciliation Act of 2003, of the ordinary income distributed by the Fund for the fiscal year ended September 30, 2009 may represent qualified dividend income.
100.00% of the ordinary income distributed by the Fund, for the fiscal year ended September 30, 2009, qualifies for the corporate dividends received deduction.
The Fund will notify shareholders in January 2010 of amounts for use in preparing 2009 income tax returns.
121
Fund Governance – Stock Funds
The Trustees serve terms of indefinite duration. The names, addresses and ages of the Trustees and officers of the Funds in the Columbia Funds Complex, the year each was first elected or appointed to office, their principal business occupations during at least the last five years, the number of Funds overseen by each Trustee and other directorships they hold are shown below. Each officer listed below serves as an officer of each Fund in the Columbia Funds Complex.
Independent Trustees
Name, Address and Year of Birth,
Position with Funds, Year First
Elected or Appointed to Office | | Principal Occupation(s) During Past Five Years, Number of Funds in the Columbia
Funds Complex Overseen by Trustee, Other Directorships Held
| |
| John D. Collins (Born 1938) | |
|
c/o Columbia Management
Advisors, LLC
One Financial Center
Boston, MA 02111
Trustee (since 2007) | | Retired. Consultant, KPMG, LLP (accounting and tax firm) from July 1999 to June 2000; Partner, KPMG, LLP from March 1962 to June 1999. Oversees 66, Mrs. Fields Famous Brands LLC (consumer products); Suburban Propane Partners, L.P.; and Montpelier Re (insurance underwriting firm) | |
|
| Rodman L. Drake (Born 1943) | |
|
c/o Columbia Management
Advisors, LLC
One Financial Center
Boston, MA 02111
Trustee (since 2007)
and Chairman of the Board
(since 2009) | | Co-Founder of Baringo Capital LLC (private equity) since 2002; President, Continuation Investments Group, Inc. from 1997 to 2001. Oversees 66, Jackson Hewitt Tax Service Inc. (tax preparation services); Crystal Capital River Inc. (real estate investment trust); Student Loan Corporation (student loan provider); Celgene Corporation (global biotechnology company); and The Helios Funds (exchange-traded funds) | |
|
| Douglas A. Hacker (Born 1955) | |
|
c/o Columbia Management
Advisors, LLC
One Financial Center
Boston, MA 02111
Trustee (since 1996) | | Independent business executive since May 2006; Executive Vice President—Strategy of United Airlines (airline) from December 2002 to May 2006; President of UAL Loyalty Services (airline marketing company) from September 2001 to December 2002; Executive Vice President and Chief Financial Officer of United Airlines from July 1999 to September 2001. Oversees 66, Nash Finch Company (food distributor); Aircastle Limited (aircraft leasing) | |
|
| Janet Langford Kelly (Born 1957) | |
|
c/o Columbia Management
Advisors, LLC
One Financial Center
Boston, MA 02111
Trustee (since 1996) | | Senior Vice President, General Counsel and Corporate Secretary, ConocoPhillips (integrated energy company) since September 2007; Deputy General Counsel—Corporate Legal Services, ConocoPhillips from August 2006 to August 2007; Partner, Zelle, Hofmann, Voelbel, Mason&Gette LLP (law firm) from March 2005 to July 2006; Adjunct Professor of Law, Northwestern University, from September 2004 to June 2006; Director, UAL Corporation (airline) from February 2006 to July 2006; Oversees 66, None | |
|
| Charles R. Nelson (Born 1942) | |
|
c/o Columbia Management
Advisors, LLC
One Financial Center
Boston, MA 02111
Trustee (since 1981) | | Professor of Economics, University of Washington, since January 1976; Ford and Louisa Van Voorhis Professor of Political Economy, University of Washington, since September 1993; Adjunct Professor of Statistics, University of Washington, since September 1980; Associate Editor, Journal of Money Credit and Banking, 1993-2008 Consultant on econometric and statistical matters. Oversees 66, None | |
|
122
Fund Governance (continued) – Stock Funds
Independent Trustees (continued)
Name, Address and Year of Birth,
Position with Funds, Year First
Elected or Appointed to Office | | Principal Occupation(s) During Past Five Years, Number of Funds in the Columbia
Funds Complex Overseen by Trustee, Other Directorships Held
| |
| John J. Neuhauser (Born 1943) | |
|
c/o Columbia Management
Advisors, LLC
One Financial Center
Boston, MA 02111
Trustee (since 1985) | | President, Saint Michael's College, since August 2007; University Professor, Boston College from November 2005 to August 2007; Academic Vice President and Dean of Faculties, Boston College from August 1999 to October 2005. Oversees 66, Liberty All-Star Equity Fund and Liberty All-Star Growth Fund, Inc. (closed-end funds) | |
|
| Jonathan Piel (Born 1938) | |
|
c/o Columbia Management
Advisors, LLC
One Financial Center
Boston, MA 02111
Trustee (since 2007) | | Cable television producer and website designer; The Editor, Scientific American from 1984 to 1994; Vice President, Scientific American, Inc., from 1984 to 1994; Member, Advisory Board, Stone Age Institute, Bloomington, Indiana (research institute that explores the effect of technology on human evolution); Member, Board of Directors of the National Institute of Social Sciences, New York City; Member, Board of Trustees of the William Alanson White Institute, New York City (institution for training psychoanalysts); and Member, Advisory Board, Mount Sinai Children's Environmental Health Center, New York. Oversees 66, None | |
|
| Patrick J. Simpson (Born 1944) | |
|
c/o Columbia Management
Advisors, LLC
One Financial Center
Boston, MA 02111
Trustee (since 2000) | | Partner, Perkins Coie LLP (law firm). Oversees 66, None | |
|
| Thomas C. Theobald (Born 1937) | |
|
c/o Columbia Management
Advisors, LLC
One Financial Center
Boston, MA 02111
Trustee (since 1996) | | Partner and Senior Advisor, Chicago Growth Partners (private equity investing) since September 2004; Managing Director, William Blair Capital Partners (private equity investing) from September 1994 to September 2004. Oversees 66, Anixter International (network support equipment distributor); Ventas, Inc. (real estate investment trust); Jones Lang LaSalle (real estate management services); Ambac Financial Group (financial guaranty insurance) | |
|
| Anne-Lee Verville (Born 1945) | |
|
c/o Columbia Management
Advisors, LLC
One Financial Center
Boston, MA 02111
Trustee (since 1998) | | Retired since 1997 (formerly General Manager—Global Education Industry (from 1994 to 1997), President-Application Systems Division (from 1991 to 1994), Chief Financial Officer—US Marketing&Services (from 1988 to 1991), and Chief Information Officer (from 1987 to 1988), IBM Corporation (computer and technology)). Oversees 66, None | |
|
123
Fund Governance (continued) – Stock Funds
Interested Trustee
Name, Address and Year of Birth,
Position with Funds, Year First
Elected or Appointed to Office | | Principal Occupation(s) During Past Five Years, Number of Funds in the Columbia
Funds Complex Overseen by Trustee, Other Directorships Held
| |
| William E. Mayer1 (Born 1940) | |
|
c/o Columbia Management
Advisors, LLC
One Financial Center
Boston, MA 02111
Trustee (since 1994) | | Partner, Park Avenue Equity Partners (private equity) since February 1999; Dean and Professor, College of Business, University of Maryland from 1992 to 1997. Oversees 66, Lee Enterprises (print media),WRHambrecht + Co. (financial (investment company) service provider); BlackRock Kelso Capital Corporation | |
|
1 The Funds currently treat Mr. Mayer as an "interested person" (as defined in the Investment Company Act of 1940) by reason of his affiliation with WR Hambrecht + Co., a registered broker/dealer that may execute portfolio transactions for or engage in principal transactions with the Funds or other funds or accounts advised/managed by the Advisor or other Bank of America affiliates.
The Statement of Additional Information includes additional information about the Trustees of the Funds and is available, without charge, upon request by calling 1-800-345-6611.
Officers
Name, Address and Year of Birth,
Position with Funds, Year First
Elected or Appointed to Office | | Principal Occupation(s) During Past Five Years
| |
| J. Kevin Connaughton (Born 1964) | |
|
One Financial Center
Boston, MA 02111
President (since 2009) | | Managing Director of Columbia Management Advisors, LLC since December 2004; Senior Vice President and Chief Financial Officer—Columbia Funds, from June 2008 to January 2009; Treasurer—Columbia Funds, from October 2003 to May 2008; Treasurer—the Liberty Funds, Stein Roe Funds and Liberty All-Star Funds, December 2000-December 2006; Senior Vice President—Columbia Management Advisors, LLC, from April 2003 to December 2004; President—Columbia Funds, Liberty Funds and Stein Roe Funds, February 2004 to October 2004; Treasurer—Galaxy Funds, September 2002 to December 2005; Treasurer, December 2002 to December 2004, and President, February 2004 to December 2004—Columbia Management Multi-Strategy Hedge Fund, LLC; and a senior officer of various other Bank of America-affiliated entities, including other registered and unregistered funds. | |
|
| James R. Bordewick, Jr. (Born 1959) | |
|
One Financial Center
Boston, MA 02111
Senior Vice President, Secretary
and Chief Legal Officer (since 2006) | | Associate General Counsel, Bank of America since April 2005; Senior Vice President and Associate General Counsel, MFS Investment Management (investment management) prior to April 2005. | |
|
| Linda J. Wondrack (Born 1964) | |
|
One Financial Center
Boston, MA 02111
Senior Vice President and
Chief Compliance Officer
(since 2007) | | Director (Columbia Management Group LLC and Investment Product Group Compliance), Bank of America since June 2005; Director of Corporate Compliance and Conflicts Officer, MFS Investment Management (investment management), August 2004 to May 2005; Managing Director, Deutsche Asset Management (investment management) prior to August 2004. | |
|
124
Fund Governance (continued) – Stock Funds
Officers (continued)
Name, Address and Year of Birth,
Position with Funds, Year First
Elected or Appointed to Office | | Principal Occupation(s) During Past Five Years
| |
| Michael G. Clarke (Born 1969) | |
|
One Financial Center
Boston, MA 02111
Senior Vice President and
Chief Financial Officer
(since 2009) | | Director of Fund Administration of the Advisor since January 2006; Managing Director of the Advisor September 2004 to December 2005; Vice President Fund Administration June 2002 to September 2004. | |
|
| Jeffrey R. Coleman (Born 1969) | |
|
One Financial Center
Boston, MA 02111
Deputy Treasurer (since 2006) | | Director of Fund Administration of the Advisor since January 2006; Fund Controller of the Advisor from October 2004 to January 2006; Vice President of CDC IXIS Asset Management Services, Inc. (investment management) from August 2000 to September 2004. | |
|
| Joseph F. DiMaria (Born 1968) | |
|
One Financial Center
Boston, MA 02111
Chief Accounting Officer and
Treasurer (since 2009) | | Director of Fund Administration of the Advisor since January 2006; Head of Tax/Compliance and Assistant Treasurer of the Advisor from November 2004 to December 2005; Director of Trustee Administration (Sarbanes-Oxley) of the Advisor from May 2003 to October 2004. | |
|
| Julian Quero (Born 1967) | |
|
One Financial Center
Boston, MA 02111
Deputy Treasurer (since 2008) | | Senior Tax Manager of the Advisor since August 2006; Senior Compliance Manager of the Advisor from April 2002 to August 2006. | |
|
| Barry S. Vallan (Born 1969) | |
|
One Financial Center
Boston, MA 02111
Controller (since 2006) | | Vice President—Fund Treasury of the Advisor since October 2004; Vice President—Trustee Reporting of the Advisor from April 2002 to October 2004. | |
|
| Stephen T. Welsh (Born 1957) | |
|
One Financial Center
Boston, MA 02111
Vice President (since 1996) | | President, Columbia Management Services, Inc. since July 2004; Senior Vice President and Controller, Columbia Management Services, Inc. prior to July 2004. | |
|
125
This page intentionally left blank.
This page intentionally left blank.
This page intentionally left blank.
Important Information About This Report
The funds mail one shareholder report to each shareholder address. If you would like more than one report, please call shareholder services at 1-800-345-6611 and additional reports will be sent to you. This report has been prepared for shareholders of the Stock Funds listed on the front cover.
A description of the policies and procedures that each fund uses to determine how to vote proxies and a copy of each fund's voting records are available (i) at www.columbiamanagement.com, (ii) on the Securities and Exchange Commission's website at www.sec.gov, and (iii) without charge, upon request, by calling 1-800-368-0346. Information regarding how each fund voted proxies relating to portfolio securities during the 12-month period ended June 30 is available from the SEC's website. Information regarding how each fund voted proxies relating to portfolio securities is also available from the funds' website, www.columbiamanagement.com.
Each fund files a complete schedule of portfolio holdings with the SEC for the first and third quarters of each fiscal year on Form N-Q. Each fund's Form N-Q is available on the SEC's website at www.sec.gov and may be reviewed and copied at the SEC's Public Reference Room in Washington, D.C. Information on the operation of the Public Reference Room may be obtained by calling 1-800-SEC-0330.
Please read and consider the investment objectives, risks, charges and expenses for any fund carefully before investing. For a prospectus which contains this and other important information about the fund, contact your Columbia Management representative or financial advisor or go to www.columbiamanagement.com.
Columbia Management Group, LLC ("Columbia Management") is the investment management division of Bank of America Corporation. Columbia Management entities furnish investment management services and products for institutional and individual investors. Columbia Funds are distributed by Columbia Management Distributors, Inc., member of FINRA, SIPC, part of Columbia Management and an affiliate of Bank of America Corporation.
Transfer Agent
Columbia Management Services, Inc.
P.O. Box 8081
Boston, MA 02266-8081
1-800-345-6611
Distributor
Columbia Management
Distributors, Inc.
One Financial Center
Boston, MA 02111
Investment Advisor
Columbia Management Advisors, LLC
100 Federal Street
Boston, MA 02110
129
Columbia Management®
One Financial Center
Boston, MA 02111-2621
PRSRT STD
U.S. Postage
PAID
Holliston, MA
Permit NO. 20
Columbia Management®
Stock Funds
Annual Report, September 30, 2009
©2009 Columbia Management Distributors, Inc.
One Financial Center, Boston, MA 02111-2621
800-345-6611 www.columbiafunds.com
SHC-42/24708-0909 (11/09) 09/94958

Annual Report
September 30, 2009
Columbia Dividend Income Fund
| | |
| NOT FDIC INSURED | | May Lose Value |
| NOT BANK ISSUED | | No Bank Guarantee |
Table of contents
The views expressed in this report reflect the current views of the respective parties. These views are not guarantees of future performance and involve certain risks, uncertainties and assumptions that are difficult to predict, so actual outcomes and results may differ significantly from the views expressed. These views are subject to change at any time based upon economic, market or other conditions and the respective parties disclaim any responsibility to update such views. These views may not be relied on as investment advice and, because investment decisions for a Columbia Fund are based on numerous factors, may not be relied on as an indication of trading intent on behalf of any particular Columbia Fund. References to specific securities should not be construed as a recommendation or investment advice.
President’s Message

Dear Shareholder:
We are pleased to provide this shareholder report detailing your fund’s performance, portfolio holdings and financial statements. We hope this information is helpful in monitoring your investments as we work through these challenging economic times. We recognize that you have entrusted us with your money and want you to know that our professional investment teams work to interpret the latest economic and market trends with the goal of optimizing portfolio construction for our clients.
The first half of 2009 was defined by extremes. The multiyear lows we witnessed in the early months gave way to a stunning rally for the U.S. financial markets in the spring. A global market rebound may be underway, thanks to the massive fiscal and aggressive monetary policies of governments around the world. In the third quarter, the S&P 500 Index1 was up 15.61%. We believe this challenging economic environment makes it even more important to work with professional money managers while continuing to invest for life events like retirement, college planning, home improvements and career changes.
Retirement income planning has become an increasingly significant focus in the lives of millions of Americans. Recent economic conditions make it even more important to manage short-term obligations such as mortgages, monthly bills and credit card debt while also taking the steps necessary to prepare for or maximize retirement benefits. Better nutrition and medical services can result in U.S. citizens living longer, healthier lives. This means the risk of outliving one’s assets in retirement is very real without proper planning. Financial security and retirement planning is an ongoing process that requires active management of your savings, investments and risks. We encourage you to review your retirement plan regularly so you’ll be better able to meet your retirement needs in the future.
We recognize that economic uncertainty creates great challenges for many investors. Our professional investment teams work diligently to help investors navigate through difficult markets. Thank you for your business and for the opportunity to work together towards your investment goals.
Sincerely,

J. Kevin Connaughton
President, Columbia Funds
On September 29, 2009, Bank of America Corporation entered into an agreement to sell a portion of the asset management business of Columbia Management Group, LLC. Please see Note 4 of the Notes to Financial Statements for additional information.
1The Standard & Poor’s (S&P) 500 Index tracks the performance of 500 widely held, large-capitalization U.S. stocks. Indices are not available for investment, are not professionally managed and do not reflect sales charges, fees, brokerage commissions, taxes or other expenses of investing. Securities in the fund may not match those in an index.
| Past | performance is no guarantee of future results. |
Fund Profile – Columbia Dividend Income Fund
Performance data quoted represents past performance and current performance may be lower or higher. Past performance is no guarantee of future results. The investment return and principal value will fluctuate so that shares, when redeemed, may be worth more or less than the original cost. Please visit www.columbiafunds.com for daily and most recent month-end performance updates.
Summary
1-year return as of 09/30/09
| | |
| |
 | | –4.33% Class A shares |
| | (without sales charge) |
| |
| | –6.14% Russell 1000 Index |
|
Morningstar Style BoxTM |
|
Equity Style |
|
The Morningstar Style BoxTM reveals a fund’s investment strategy. For equity funds, the vertical axis shows the market capitalization of the stocks owned, and the horizontal axis shows investment style (value, blend or growth). Information shown is based on the most recent data provided by Morningstar.
Summary
| n | | For the 12-month period that ended September 30, 2009, the fund’s Class A shares returned negative 4.33% without sales charge. |
| n | | In a volatile environment, the fund held up better than its benchmark, the Russell 1000 Index1, and the average return of its peer group, the Lipper Equity Income Funds Classification.2 |
| n | | Health care and energy provided the best returns, while financial and materials holdings detracted. |
Portfolio Management
Scott L. Davis has co-managed the fund since November 2001 and has been associated with the advisor or its predecessors since 1985.
Richard E. Dahlberg has co-managed the fund since October 2003 and has been associated with the advisor or its predecessors since 2003.
| 1 | The Russell 1000 Index tracks the performance of 1,000 of the largest U.S. companies, based on market capitalization. Indices are not available for investment, are not professionally managed and do not reflect sales charges, fees, brokerage commissions, taxes or other expenses of investing. Securities in the fund may not match those in an index. |
| 2 | Lipper Inc., a widely respected data provider in the industry, calculates an average total return (assuming reinvestment of distributions) for mutual funds with investment objectives similar to those of the fund. Lipper makes no adjustment for the effect of sales loads. |
1
Economic Update – Columbia Dividend Income Fund
Summary
For the 12-month period that ended September 30, 2009
| | n | | Domestic stocks lost ground, as measured by the S&P 500 Index, but cut their losses in a rebound that began half way through the period. International stocks moved higher, as measured by the MSCI EAFE Index. | |
| | |
| S&P Index | | MSCI Index |
| |

| | 
|
-6.91% | | 3.23% |
| | n | | As investors appeared to exhibit more tolerance for risk, the Barclays Capital Aggregate Bond Index delivered solid results. High-yield bonds rebounded strongly, as measured by the JPMorgan Developed BB High Yield Index. | |
| | |
| Barclays Aggregate Index | | JPMorgan Index |
| |
| |
|
10.56% | | 16.36% |
During the 12-month period that began October 1, 2008 and ended September 30, 2009, the U.S. economy faced the worst financial crisis since the Great Depression, then steadied itself as steps taken by a new administration began to show results in the second half of the period. Economic growth, as measured by Gross Domestic Product (GDP), contracted by approximately 6% between October 2008 and March 2009. The lapse from growth resulted in the longest-and most severe-recession in nearly three decades. However, growth turned positive in the third quarter ended September 30, 2009. The initial estimate of third quarter GDP was 3.5%.
The labor market shed more than seven million jobs between 2008 and 2009, raising the unemployment rate to 9.8% and wiping out all of the jobs gained since the last recession. Manufacturing activity slowed through most of the period, but it turned up in July and August, as did consumer spending. The beleaguered housing market showed some signs of stabilizing. Pending home sales, a leading indicator of housing activity increased for eight straight months to end the period, buoyed by low interest rates and an $8,000 first-time homebuyer tax credit. Existing home sales rose, but gave back some of their strong gains late in the period. The inventory of unsold houses also fell sharply over the period. Late in 2008, consumer confidence, as measured by the Conference Board,1 plummeted to its lowest point ever. However, it has since stabilized and turned higher near the end of the period.
Troubles that began in the U.S. subprime mortgage market resulted in a meltdown within the U.S. financial sector that claimed several major institutions in 2008 and led others to seek bailouts, restructuring or both. New rigorous lending standards severely limited access to credit, further hampering economic growth. In this environment, a new administration sought to stabilize the financial system, address economic woes and introduce sweeping health care reform. Stimulus spending began to flow into the economy, raising hopes that growth would be restored. In December 2008, the Federal Reserve Board (the Fed) lowered a key short-term borrowing rate — the federal funds rate — to between zero and 0.25% — a record low. In light of protracted economic weakness and virtually no inflation, the Fed made no further change to the federal funds rate during the period.
Stocks retreated, then rebounded
Against a weakening economic backdrop, the U.S. stock market lost 6.91% for the 12-month period, as measured by the S&P 500 Index. 2 Losses affected the stocks of companies of all sizes and investment style categories, as measured by their respective Russell indices.3 Stock markets outside the U.S. were modestly to significantly higher. The MSCI EAFE Index,4 a broad gauge of stock market performance in foreign developed markets, gained 3.23% (in U.S. dollars) for the period. Emerging stock markets were also caught in the downdraft, but bounced back stronger than domestic or developed world markets in 2009. The MSCI Emerging Markets Index5 returned 19.07% (in U.S. dollars).
2
Economic Update (continued) – Columbia Dividend Income Fund
Bonds outperformed domestic stocks
As investors sought refuge from a volatile stock market, the highest-quality sectors of the U.S. bond market delivered solid gains. During the first half of the period, Treasury prices rose and yields declined sharply as the economy faltered and stock market volatility increased. As hopes for a recovery materialized in the second half of the period, yields rose and Treasuries lagged riskier segments of the bond market. The benchmark 10-year U.S. Treasury yield began the period at 3.8%, declined to 2.2% in December 2008, then rose to end the period at 3.3%. In this environment, the Barclays Capital Aggregate Bond Index6 returned 10.56%. High-yield bond prices fell sharply in 2008 as economic prospects weakened and default fears rose, then rebounded strongly in 2009. For the 12-month period, the JPMorgan Developed BB High Yield Index7 returned 16.36%.
Past performance is no guarantee of future results.
| 1 | The Conference Board is a not-for-profit global independent membership organization. It conducts research, convenes conferences, makes forecasts, assesses trends and publishes information and analysis. |
| 2 | The Standard & Poor’s (S&P) 500 Index tracks the performance of 500 widely held, large-capitalization U.S. stocks. |
| 3 | The Russell 1000 Index tracks the performance of 1,000 of the largest U.S. companies, based on market capitalization. The Russell MidCap Index measures the performance of the 800 smallest companies in the Russell 1000 Index, which represent approximately 25% of the total market capitalization of the Russell 1000 Index. The Russell 2000 Index measures the performance of the 2,000 smallest companies in the Russell 3000 Index, which represents approximately 8% of the total market capitalization of the Russell 3000 Index. |
| 4 | The Morgan Stanley Capital International Europe, Australasia, Far East (MSCI EAFE) Index is a capitalization-weighted index that tracks the total return of common stocks in 21 developed-market countries within Europe, Australasia and the Far East. |
| 5 | The Morgan Stanley Capital International Emerging Markets Index (MSCI EMI) is a free float-adjusted market capitalization index that is designed to measure equity market performance in the global emerging markets. As of June 2006, the MSCI Emerging Markets Index consisted of the following 25 emerging market country indices: Argentina, Brazil, Chile, China, Colombia, Czech Republic, Egypt, Hungary, India, Indonesia, Israel, Jordan, Korea, Malaysia, Mexico, Morocco, Pakistan, Peru, Philippines, Poland, Russia, South Africa, Taiwan, Thailand and Turkey. |
| 6 | The Barclays Capital Aggregate Bond Index (formerly the Lehman Brothers Aggregate Bond Index) is a market value-weighted index that tracks the daily price, coupon, pay-downs and total return performance of fixed-rate, publicly placed, dollar-denominated and non-convertible investment grade debt issues with at least $250 million par amount outstanding and with at least one year to final maturity. |
| 7 | The JPMorgan Developed BB High Yield Index is designed to mirror the investable universe of the U.S. dollar developed, BB-rated, high yield corporate debt market. |
Indices are not available for investment, are not professionally managed and do not reflect sales charges, fees, brokerage commissions, taxes or other expenses of investing. Securities in the fund may not match those in an index.
Effective November 3, 2008, the Lehman Brothers indices were renamed the Barclays Capital indices.
3
Performance Information – Columbia Dividend Income Fund
Performance data quoted represents past performance and current performance may be lower or higher. Past performance is no guarantee of future results. The investment return and principal value will fluctuate so that shares, when redeemed, may be worth more or less than the original cost. Please visit www.columbiafunds.com for daily and most recent month-end performance updates.
| | |
Annual operating expense
ratio (%)* |
| |
Class A | | 1.11 |
Class B | | 1.86 |
Class C | | 1.86 |
Class R | | 1.36 |
Class T | | 1.16 |
Class Z | | 0.86 |
| * | The annual operating expense ratio is as stated in the fund’s prospectus that is current as of the date of this report. Differences in expense ratios disclosed elsewhere in this report may result from including fee waivers and expense reimbursements as well as different time periods used in calculating the ratios. |
|
| Performance of a $10,000 investment 10/01/99 – 09/30/09 |
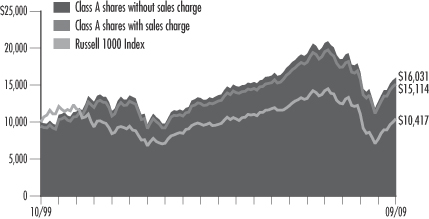
The chart above shows the change in the value of a hypothetical $10,000 investment in Class A shares of Columbia Dividend Income Fund during the stated time period, and does not reflect the deduction of taxes that a shareholder may pay on fund distributions or on the redemption of fund shares. The Russell 1000 Index tracks the performance of 1,000 of the largest U.S. companies, based on market capitalization. Indices are not available for investment, are not professionally managed and do not reflect sales charges, fees, brokerage commissions, taxes or other expenses of investing. Securities in the fund may not match those in an index.
| | | | |
| Performance of a $10,000 investment 10/01/99 – 09/30/09 ($) |
| | |
| Sales charge | | without | | with |
Class A | | 16,031 | | 15,114 |
Class B | | 14,882 | | 14,882 |
Class C | | 14,870 | | 14,870 |
Class R | | 15,970 | | n/a |
Class T | | 15,970 | | 15,057 |
Class Z | | 16,569 | | n/a |
| | | | | | | | | | | | | | | | | | | | |
| Average annual total return as of 09/30/09 (%) |
| | | | | | |
| Share class | | A | | B | | C | | R | | T | | Z |
| Inception | | 11/25/02 | | 11/25/02 | | 11/25/02 | | 03/28/08 | | 03/04/98 | | 03/04/98 |
| Sales charge | | without | | with | | without | | with | | without | | with | | without | | without | | with | | without |
1-year | | –4.33 | | –9.81 | | –4.97 | | –9.63 | | –4.98 | | –5.91 | | –4.57 | | –4.38 | | –9.86 | | –4.10 |
5-year | | 3.29 | | 2.08 | | 2.52 | | 2.16 | | 2.52 | | 2.52 | | 3.21 | | 3.24 | | 2.02 | | 3.55 |
10-year | | 4.83 | | 4.22 | | 4.06 | | 4.06 | | 4.05 | | 4.05 | | 4.79 | | 4.79 | | 4.18 | | 5.18 |
The “with sales charge” returns include the maximum initial sales charge of 5.75% for Class A and Class T shares and the applicable contingent deferred sales charge of 5.00% in the first year, declining to 1.00% in the sixth year and eliminated thereafter for Class B shares and 1.00% for Class C shares for the first year only. The “without sales charge” returns do not include the effect of sales charges. If they had, returns would be lower.
Performance results reflect any fee waivers or reimbursements of fund expenses by the investment advisor and/or any of its affiliates. Absent these fee waivers or expense reimbursement arrangements, performance results would have been lower.
All results shown assume reinvestment of distributions. Class R shares are sold at net asset value with distribution and service (Rule 12b-1) fees. Class Z shares are sold at net asset value with no distribution and service (Rule 12b-1) fees. Class R and Class Z shares have limited eligibility and the investment minimum requirements may vary. Please see the fund’s prospectus for details. Performance for different share classes will vary based on differences in sales charges and fees associated with each class.
The tables do not reflect the deduction of taxes that a shareholder may pay on fund distributions or on the redemption of fund shares.
Class A, Class B, Class C, Class T and Class Z share performance information includes returns of Retail A shares (for Class A and Class T shares), Retail B shares (for Class B and Class C shares) and Trust shares (for Class Z shares) of Galaxy Strategic Equity Fund, the predecessor to the Fund and a series of the Galaxy Fund (the “Predecessor Fund”), for periods prior to November 25, 2002, the date on which Class A, Class B, Class C, Class T and Class Z shares were initially offered by the Fund. Class R share performance information includes returns of Class A shares for the period from November 25, 2002 through March 27, 2008, and the returns of Retail A shares for periods prior thereto. These returns shown for all share classes reflect any differences in sales charges, but have not been restated to reflect any differences in expenses between the Predecessor Fund share classes (and, in the case of Class R shares, Class A shares) and the corresponding newer share classes. If differences in expenses had been reflected, the returns shown for periods prior to November 25, 2002 would be lower for Class A, Class B, Class C, Class T and Class Z shares, and the returns shown for periods prior to March 28, 2008 would be lower for Class R shares.
4
Understanding Your Expenses – Columbia Dividend Income Fund
Estimating your actual expenses
To estimate the expenses that you paid over the period, first you will need your account balance at the end of the period:
| | n | | For shareholders who receive their account statements from Columbia Management Services, Inc., your account balance is available online at www.columbiafunds.com or by calling Shareholder Services at 800.345.6611. | |
| | n | | For shareholders who receive their account statements from their financial intermediary, contact your financial intermediary firm to obtain your account balance. | |
| | 1. | Divide your ending account balance by $1,000. For example, if an account balance was $8,600 at the end of the period, the result would be 8.6. | |
| | 2. | In the section of the table below titled “Expenses paid during the period,” locate the amount for your share class. You will find this number in the column labeled “Actual.” Multiply this number by the result from step 1. Your answer is an estimate of the expenses you paid on your account during the period. | |
If the value of your account falls below the minimum initial investment requirement applicable to you, your account generally will be subject to a $20 annual fee. This fee is not included in the accompanying table. If you are subject to the fee, keep it in mind when you are estimating the ongoing expenses of investing in the fund and when comparing the expenses of this fund with other funds.
As a fund shareholder, you incur two types of costs. There are transaction costs, which generally include sales charges on purchases and may include redemption fees or exchange fees. There are also ongoing costs, which generally include investment advisory fees, distribution and service (Rule 12b-1) fees and other fund expenses. The information on this page is intended to help you understand the ongoing costs of investing in the fund and to compare these costs with the ongoing costs of investing in other mutual funds.
Analyzing your fund’s expenses by share class
To illustrate these ongoing costs, we have provided an example and calculated the expenses paid by investors in each share class during the period. The information in the following table is based on an initial investment of $1,000, which is invested at the beginning of the period and held for the entire period. Expense information is calculated two ways and each method provides you with different information. The amount listed in the “Actual” column is calculated using the fund’s actual operating expenses and total return for the period. The amount listed in the “Hypothetical” column for each share class assumes that the return each year is 5% before expenses and is calculated based on the fund’s actual operating expenses. You should not use the hypothetical account values and expenses to estimate either your actual account balance at the end of the period or the expenses you paid during this period.
Compare with other funds
Since all mutual funds are required to include the same hypothetical calculations about expenses in shareholder reports, you can use this information to compare the ongoing costs of investing in the fund with other funds. To do so, compare the 5% hypothetical example with the 5% hypothetical examples that appear in the shareholder reports of other funds. As you compare hypothetical examples of other funds, it is important to note that hypothetical examples are meant to highlight the ongoing costs of investing in a fund and do not reflect any transaction costs, such as sales charges, redemption fees or exchange fees.
| | | | | | | | | | | | | | |
| 04/01/09 – 09/30/09 |
| | | | |
| | | Account value at the
beginning of the period ($) | | Account value at the end of the period ($) | | Expenses paid
during the period ($) | | Fund’s annualized
expense ratio (%) |
| | | Actual | | Hypothetical | | Actual | | Hypothetical | | Actual | | Hypothetical | | Actual |
Class A | | 1,000.00 | | 1,000.00 | | 1,256.10 | | 1,019.80 | | 5.94 | | 5.32 | | 1.05 |
Class B | | 1,000.00 | | 1,000.00 | | 1,252.69 | | 1,016.04 | | 10.16 | | 9.10 | | 1.80 |
Class C | | 1,000.00 | | 1,000.00 | | 1,251.59 | | 1,016.04 | | 10.16 | | 9.10 | | 1.80 |
Class R | | 1,000.00 | | 1,000.00 | | 1,254.60 | | 1,018.55 | | 7.35 | | 6.58 | | 1.30 |
Class T | | 1,000.00 | | 1,000.00 | | 1,255.80 | | 1,019.55 | | 6.22 | | 5.57 | | 1.10 |
Class Z | | 1,000.00 | | 1,000.00 | | 1,257.60 | | 1,021.06 | | 4.53 | | 4.05 | | 0.80 |
Expenses paid during the period are equal to the annualized expense ratio for the share class, multiplied by the average account value over the period, then multiplied by the number of days in the fund’s most recent fiscal half-year and divided by 365.
Had the investment advisor and/or any of its affiliates not waived fees or reimbursed a portion of expenses, account value at the end of the period would have been reduced.
It is important to note that the expense amounts shown in the table are meant to highlight only ongoing costs of investing in the fund and do not reflect any transaction costs, such as sales charges, redemption fees or exchange fees. Therefore, the hypothetical examples provided may not help you determine the relative total costs of owning shares of different funds. If these transaction costs were included, your costs would have been higher.
5
Portfolio Managers’ Report – Columbia Dividend Income Fund
Performance data quoted represents past performance and current performance may be lower or higher. Past performance is no guarantee of future results. The investment return and principal value will fluctuate so that shares, when redeemed, may be worth more or less than the original cost. Please visit www.columbiafunds.com for daily and most recent month-end performance updates.
| | |
| Net asset value per share |
| |
as of 09/30/09 ($) | | |
Class A | | 11.18 |
Class B | | 10.94 |
Class C | | 10.93 |
Class R | | 11.18 |
Class T | | 11.18 |
Class Z | | 11.18 |
| | |
| Distributions declared per share |
| |
10/01/08 – 09/30/09 ($) | | |
Class A | | 0.27 |
Class B | | 0.20 |
Class C | | 0.20 |
Class R | | 0.25 |
Class T | | 0.27 |
Class Z | | 0.30 |
For the 12-month period that ended September 30, 2009, the fund’s Class A shares returned negative 4.33% without sales charge. The fund’s benchmark, the Russell 1000 Index, returned negative 6.14% for the same period. The average return of the fund’s peer group, the Lipper Equity Income Funds Classification, was negative 6.42%. Although the fund’s dividend distribution declined by 13%, from $0.31 to $0.27, it fared better than the market overall. Many firms cut or eliminated their dividends, and the fund’s return on cash holdings fell to near zero. However, we believe that the fund’s dividend has the potential to stabilize and improve next year.
Signs that the recession was at an end became more convincing over the past few months. Investors responded energetically, moving assets from more secure investments into equities. Markets rose sharply from low points reached in March and continued to rise over the summer. Government programs and historically low interest rates fed waves of liquidity into the financial system, shoring up bank reserves and rebuilding confidence. Consumers, who make up the bulk of U.S. economic activity, gradually began to loosen their purse strings, offering hope that a recovery could be sustained.
The fund’s relative performance benefited early in the period because high-quality stocks with good dividends tend to be more resilient in falling markets. But during the subsequent rally, these better-quality issues lagged. Companies carrying Standard & Poor’s ratings of B+ and higher trailed those rated B and below.
Health care and energy led performance
Takeovers in the pharmaceutical sector drove health care results. Schering-Plough surged when it was announced that a major competitor would acquire the company, and Wyeth’s shares rose in response to Pfizer’s takeover bid. In energy, the fund’s focus on integrated oil companies buffered the portfolio when oil prices declined. We later used low valuations to add exploration and development companies EnCana and Murphy Oil and were rewarded when oil rebounded. Being underweight in the weak industrial sector also aided relative performance.
Financials and materials disappointed
The financial sector detracted from the fund’s relative performance. Insurers Principal Financial Group, Lincoln National and Hartford Group fell when a credit crisis slashed the values of their portfolios. All three securities were sold. However, mutual fund managers Eaton Vance and T. Rowe Price moved up with the recovering markets. In materials, Dow Chemical fell when Kuwait reneged on an agreement to purchase certain Dow assets; we eliminated the fund’s Dow holdings. Timely purchases of miner BHP Billiton, steelmaker Nucor and Allegheny Technologies, maker of specialty metals, helped offset declines elsewhere in the portfolio.
Looking ahead
We believe that the economy has the potential to continue improving. Furthermore, a huge pool of available capital may provide support for stock prices and liquidity for the economy over the next few quarters. Businesses are leaner and many, including autos and semiconductors, have slashed inventories, implying a need to expand production
6
Portfolio Managers’ Report (continued) – Columbia Dividend Income Fund
as demand improves. Retail inventories are also very lean. Government stimulus packages will run out early next year, and it remains to be seen whether the economy can move ahead on its own steam. Also, several tax cuts are due to expire at the end of 2010, and calls for new taxes may forestall a meaningful recovery.
Portfolio holdings and characteristics are subject to change periodically and may not be representative of current holdings and characteristics. The outlook for the fund may differ from those presented for other Columbia Funds.
Equity securities are affected by stock market fluctuations that occur in response to economic and business developments.
Value stocks are securities of companies that may have experienced adverse business or industry developments or may be subject to special risks that have caused the stocks to be out of favor. The market value of a portfolio security may not meet the manager’s future value assessment of such security, or may decline.
Dividend payments by an issuer are not guaranteed, and are paid only when declared by an issuer’s board of directors. The amount of a dividend payment, if any, can vary over time.
| | |
| Sectors |
|
as of 09/30/09 (%) |
Financials | | 14.2 |
Consumer Staples | | 13.4 |
Health Care | | 11.0 |
Energy | | 10.9 |
Information Technology | | 10.8 |
Industrials | | 9.4 |
Consumer Discretionary | | 9.3 |
Telecommunications Services | | 6.2 |
Utilities | | 4.8 |
Materials | | 4.2 |
| | |
| Holdings discussed in this report |
|
as of 09/30/09 (%) |
Schering-Plough | | 2.9 |
Pfizer | | 1.9 |
EnCana | | 0.9 |
Murphy Oil | | 0.5 |
Eaton Vance | | 0.7 |
T. Row Price | | 0.7 |
BHP Billiton | | 0.7 |
Nucor | | 0.7 |
Allegheny Technologies | | 0.6 |
The fund is actively managed and the composition of its portfolio will change over time. Information provided is calculated as a percentage of net assets.
7
Investment Portfolio – Columbia Dividend Income Fund
September 30, 2009
Common Stocks – 90.7%
| | | | |
| | | Shares | | Value ($) |
| Consumer Discretionary – 9.3% |
| Hotels, Restaurants & Leisure – 1.9% | | |
McDonald’s Corp. | | 570,000 | | 32,529,900 |
| | | | |
Hotels, Restaurants & Leisure Total | | 32,529,900 |
| | |
| Media – 2.5% | | | | |
McGraw-Hill Companies, Inc. | | 340,000 | | 8,547,600 |
Meredith Corp. | | 469,000 | | 14,041,860 |
Time Warner, Inc. | | 720,000 | | 20,721,600 |
| | | | |
Media Total | | | | 43,311,060 |
| | |
| Specialty Retail – 4.9% | | | | |
Gap, Inc. | | 480,000 | | 10,272,000 |
Home Depot, Inc. | | 860,000 | | 22,910,400 |
Sherwin-Williams Co. | | 440,000 | | 26,470,400 |
Staples, Inc. | | 400,000 | | 9,288,000 |
TJX Companies, Inc. | | 360,000 | | 13,374,000 |
| | | | |
Specialty Retail Total | | | | 82,314,800 |
| | | | |
Consumer Discretionary Total | | | | 158,155,760 |
| | | | |
| Consumer Staples – 12.8% | | | | |
| Beverages – 2.1% | | | | |
Coca-Cola Co. | | 155,000 | | 8,323,500 |
Diageo PLC, ADR | | 320,000 | | 19,676,800 |
PepsiCo, Inc. | | 120,000 | | 7,039,200 |
| | | | |
Beverages Total | | | | 35,039,500 |
| | |
| Food & Staples Retailing – 1.4% | | | | |
Wal-Mart Stores, Inc. | | 480,000 | | 23,563,200 |
| | | | |
Food & Staples Retailing Total | | | | 23,563,200 |
| | |
| Food Products – 2.7% | | | | |
General Mills, Inc. | | 160,000 | | 10,300,800 |
H.J. Heinz Co. | | 480,000 | | 19,080,000 |
J.M. Smucker Co. | | 140,000 | | 7,421,400 |
Kraft Foods, Inc., Class A | | 320,000 | | 8,406,400 |
| | | | |
Food Products Total | | | | 45,208,600 |
| | |
| Household Products – 2.6% | | | | |
Kimberly-Clark Corp. | | 340,000 | | 20,053,200 |
Procter & Gamble Co. | | 410,000 | | 23,747,200 |
| | | | |
Household Products Total | | | | 43,800,400 |
| | |
| Personal Products – 0.6% | | | | |
Avon Products, Inc. | | 320,000 | | 10,867,200 |
| | | | |
Personal Products Total | | | | 10,867,200 |
| | |
| Tobacco – 3.4% | | | | |
Altria Group, Inc. | | 925,000 | | 16,474,250 |
Philip Morris International, Inc. | | 845,000 | | 41,185,300 |
| | | | |
Tobacco Total | | | | 57,659,550 |
| | | | |
Consumer Staples Total | | | | 216,138,450 |
| | | | |
| | | Shares | | Value ($) |
| Energy – 10.9% | | | | |
| Energy Equipment & Services – 0.5% | | |
Smith International, Inc. | | 300,000 | | 8,610,000 |
| | | | |
Energy Equipment & Services Total | | 8,610,000 |
| |
| Oil, Gas & Consumable Fuels – 10.4% | | |
Chevron Corp. | | 440,000 | | 30,989,200 |
ConocoPhillips | | 285,000 | | 12,870,600 |
EnCana Corp. | | 260,000 | | 14,978,600 |
Exxon Mobil Corp. | | 720,000 | | 49,399,200 |
Murphy Oil Corp. | | 155,000 | | 8,923,350 |
Occidental Petroleum Corp. | | 230,000 | | 18,032,000 |
Royal Dutch Shell PLC, ADR | | 720,000 | | 41,176,800 |
| | | | |
Oil, Gas & Consumable Fuels Total | | 176,369,750 |
| | | | |
Energy Total | | | | 184,979,750 |
| | | | |
| Financials – 14.2% | | | | |
| Capital Markets – 3.6% | | | | |
Bank of New York Mellon Corp. | | 355,000 | | 10,291,450 |
Eaton Vance Corp. | | 440,000 | | 12,315,600 |
Federated Investors, Inc., Class B | | 340,000 | | 8,965,800 |
Morgan Stanley | | 580,000 | | 17,910,400 |
T. Rowe Price Group, Inc. | | 245,000 | | 11,196,500 |
| | | | |
Capital Markets Total | | | | 60,679,750 |
| | |
| Commercial Banks – 2.4% | | | | |
PNC Financial Services Group, Inc. | | 280,000 | | 13,605,200 |
U.S. Bancorp | | 680,000 | | 14,864,800 |
Wells Fargo & Co. | | 450,000 | | 12,681,000 |
| | | | |
Commercial Banks Total | | | | 41,151,000 |
| | |
| Consumer Finance – 1.3% | | | | |
American Express Co. | | 650,000 | | 22,035,000 |
| | | | |
Consumer Finance Total | | | | 22,035,000 |
| |
| Diversified Financial Services – 2.8% | | |
JPMorgan Chase & Co. | | 1,085,000 | | 47,544,700 |
| | | | |
Diversified Financial Services Total | | 47,544,700 |
| |
| Insurance – 3.7% | | |
Arthur J. Gallagher & Co. | | 610,000 | | 14,865,700 |
Chubb Corp. | | 230,000 | | 11,594,300 |
MetLife, Inc. | | 425,000 | | 16,179,750 |
RenaissanceRe Holdings Ltd. | | 100,000 | | 5,476,000 |
Unum Group | | 700,000 | | 15,008,000 |
| | | | |
Insurance Total | | | | 63,123,750 |
|
| Real Estate Investment Trusts (REITs) – 0.2% |
Rayonier, Inc. | | 60,000 | | 2,454,600 |
| | | | |
Real Estate Investment Trusts (REITs) Total | | 2,454,600 |
See Accompanying Notes to Financial Statements.
8
Columbia Dividend Income Fund
September 30, 2009
Common Stocks (continued)
| | | | |
| | | Shares | | Value ($) |
| Financials (continued) | | | | |
| Thrifts & Mortgage Finance – 0.2% |
People’s United Financial, Inc. | | 240,000 | | 3,734,400 |
| | | | |
Thrifts & Mortgage Finance Total | | 3,734,400 |
| | | | |
Financials Total | | | | 240,723,200 |
| | | | |
| Health Care – 8.1% | | | | |
| Pharmaceuticals – 8.1% | | | | |
Abbott Laboratories | | 400,000 | | 19,788,000 |
Bristol-Myers Squibb Co. | | 1,640,000 | | 36,932,800 |
Johnson & Johnson | | 525,000 | | 31,967,250 |
Merck & Co., Inc. | | 510,000 | | 16,131,300 |
Pfizer, Inc. | | 1,900,000 | | 31,445,000 |
| | | | |
Pharmaceuticals Total | | | | 136,264,350 |
| | | | |
Health Care Total | | | | 136,264,350 |
| | | | |
| Industrials – 9.4% | | | | |
| Aerospace & Defense – 3.0% | | | | |
Honeywell International, Inc. | | 480,000 | | 17,832,000 |
Raytheon Co. | | 260,000 | | 12,472,200 |
United Technologies Corp. | | 335,000 | | 20,411,550 |
| | | | |
Aerospace & Defense Total | | | | 50,715,750 |
| |
| Commercial Services & Supplies – 1.0% | | |
Waste Management, Inc. | | 580,000 | | 17,295,600 |
| | | | |
Commercial Services & Supplies Total | | 17,295,600 |
| | |
| Electrical Equipment – 0.8% | | | | |
Emerson Electric Co. | | 320,000 | | 12,825,600 |
| | | | |
Electrical Equipment Total | | | | 12,825,600 |
| |
| Industrial Conglomerates – 1.5% | | |
General Electric Co. | | 1,560,000 | | 25,615,200 |
| | | | |
Industrial Conglomerates Total | | 25,615,200 |
| | |
| Machinery – 2.4% | | | | |
Deere & Co. | | 310,000 | | 13,305,200 |
Dover Corp. | | 377,000 | | 14,612,520 |
Parker Hannifin Corp. | | 260,000 | | 13,478,400 |
| | | | |
Machinery Total | | | | 41,396,120 |
| | |
| Road & Rail – 0.7% | | | | |
Norfolk Southern Corp. | | 280,000 | | 12,070,800 |
| | | | |
Road & Rail Total | | | | 12,070,800 |
| | | | |
Industrials Total | | | | 159,919,070 |
| | | | |
| Information Technology – 10.8% | | | | |
| Communications Equipment – 0.5% | | |
Nokia Oyj, ADR | | 580,000 | | 8,479,600 |
| | | | |
Communications Equipment Total | | 8,479,600 |
| | | | |
| | | Shares | | Value ($) |
| Computers & Peripherals – 3.9% | | | | |
Hewlett-Packard Co. | | 452,000 | | 21,338,920 |
International Business Machines Corp. | | 370,000 | | 44,255,700 |
| | | | |
Computers & Peripherals Total | | | | 65,594,620 |
| | |
| IT Services – 1.0% | | | | |
Automatic Data Processing, Inc. | | 435,000 | | 17,095,500 |
| | | | |
IT Services Total | | | | 17,095,500 |
| | |
| Office Electronics – 0.6% | | | | |
Canon, Inc., ADR | | 270,000 | | 10,797,300 |
| | | | |
Office Electronics Total | | | | 10,797,300 |
| |
| Semiconductors & Semiconductor Equipment – 2.3% | | |
Intel Corp. | | 1,720,000 | | 33,660,400 |
Linear Technology Corp. | | 190,000 | | 5,249,700 |
| | | | |
Semiconductors & Semiconductor Equipment Total | | 38,910,100 |
| | |
| Software – 2.5% | | | | |
Microsoft Corp. | | 1,620,000 | | 41,941,800 |
| | | | |
Software Total | | | | 41,941,800 |
| | | | |
Information Technology Total | | | | 182,818,920 |
| | | | |
| Materials – 4.2% | | | | |
| Chemicals – 1.6% | | | | |
E.I. Du Pont de Nemours & Co. | | 320,000 | | 10,284,800 |
International Flavors & Fragrances, Inc. | | 270,000 | | 10,241,100 |
RPM International, Inc. | | 395,000 | | 7,303,550 |
| | | | |
Chemicals Total | | | | 27,829,450 |
| | |
| Containers & Packaging – 0.6% | | | | |
Sonoco Products Co. | | 345,000 | | 9,501,300 |
| | | | |
Containers & Packaging Total | | | | 9,501,300 |
| | |
| Metals & Mining – 2.0% | | | | |
Allegheny Technologies, Inc. | | 300,000 | | 10,497,000 |
BHP Billiton Ltd., ADR | | 180,000 | | 11,881,800 |
Nucor Corp. | | 255,000 | | 11,987,550 |
| | | | |
Metals & Mining Total | | | | 34,366,350 |
| | | | |
Materials Total | | | | 71,697,100 |
| | | | |
| Telecommunication Services – 6.2% |
| Diversified Telecommunication Services – 6.2% |
AT&T, Inc. | | 2,100,000 | | 56,721,000 |
Verizon Communications, Inc. | | 1,400,000 | | 42,378,000 |
See Accompanying Notes to Financial Statements.
9
Columbia Dividend Income Fund
September 30, 2009
Common Stocks (continued)
| | | | |
| | | Shares | | Value ($) |
| Telecommunication Services (continued) |
Windstream Corp. | | 565,000 | | 5,723,450 |
| | | | |
Diversified Telecommunication Services Total | | 104,822,450 |
| | | | |
Telecommunication Services Total | | 104,822,450 |
| | | | |
| Utilities – 4.8% | | | | |
| Electric Utilities – 2.5% | | | | |
American Electric Power Co., Inc. | | 150,000 | | 4,648,500 |
Entergy Corp. | | 80,000 | | 6,388,800 |
Exelon Corp. | | 165,000 | | 8,187,300 |
FirstEnergy Corp. | | 85,000 | | 3,886,200 |
FPL Group, Inc. | | 160,000 | | 8,836,800 |
PPL Corp. | | 340,000 | | 10,315,600 |
| | | | |
Electric Utilities Total | | | | 42,263,200 |
| | |
| Gas Utilities – 0.8% | | | | |
National Fuel Gas Co. | | 288,000 | | 13,193,280 |
| | | | |
Gas Utilities Total | | | | 13,193,280 |
| | |
| Multi-Utilities – 1.5% | | | | |
Dominion Resources, Inc. | | 140,000 | | 4,830,000 |
PG&E Corp. | | 288,000 | | 11,661,120 |
Public Service Enterprise Group, Inc. | | 300,000 | | 9,432,000 |
| | | | |
Multi-Utilities Total | | | | 25,923,120 |
| | | | |
Utilities Total | | | | 81,379,600 |
| | | | |
Total Common Stocks
(Cost of $1,428,343,251) | | | | 1,536,898,650 |
| |
Convertible Preferred Stocks – 3.5% | | |
| | | | |
| Consumer Staples – 0.6% | | | | |
| Food Products – 0.6% | | | | |
Archer-Daniels-Midland Co., 6.250% | | 250,000 | | 9,975,000 |
| | | | |
Food Products Total | | | | 9,975,000 |
| | | | |
Consumer Staples Total | | | | 9,975,000 |
| | | | |
| Health Care – 2.9% | | | | |
| Pharmaceuticals – 2.9% | | | | |
Schering-Plough Corp., 6.000% | | 200,000 | | 48,540,000 |
| | | | |
Pharmaceuticals Total | | | | 48,540,000 |
| | | | |
Health Care Total | | | | 48,540,000 |
| | | | |
Total Convertible Preferred Stocks
(Cost of $46,408,245) | | 58,515,000 |
Investment Company – 2.2%
| | | | |
| | | Shares | | Value ($) |
SPDR Trust Series 1 | | 360,000 | | 38,001,600 |
| | | | |
Total Investment Company
(Cost of $35,979,398) | | | | 38,001,600 |
| | |
Short-Term Obligation – 3.2% | | | | |
| | | Par ($) | | |
Repurchase agreement with Fixed Income Clearing Corp., dated 09/30/09, due on 10/01/09 at 0.010%, collateralized by a U.S. Treasury obligation maturing 01/31/14, market value $56,073,600 (repurchase proceeds $54,970,015) | | 54,970,000 | | 54,970,000 |
| | | | |
Total Short-Term Obligation
(Cost of $54,970,000) | | 54,970,000 |
| | | | |
Total Investments – 99.6%
(Cost of $1,565,700,894) (a) | | 1,688,385,250 |
| | | | |
Other Assets & Liabilities, Net – 0.4% | | 6,672,245 |
| | | | |
Net Assets – 100.0% | | | | 1,695,057,495 |
Notes to Investment Portfolio:
| (a) | Cost for federal income tax purposes is $1,565,988,522. |
The following table summarizes the inputs used, as of September 30, 2009, in valuing the Fund’s assets:
| | | | | | | | | | | | |
Description | | Quoted Prices
(Level 1) | | Other
Significant
Observable
Inputs
(Level 2) | | Significant
Unobservable
Inputs
(Level 3) | | Total |
Common Stocks | | | | | | | | | | | | |
Consumer Discretionary | | $ | 158,155,760 | | $ | — | | $ | — | | $ | 158,155,760 |
Consumer Staples | | | 216,138,450 | | | — | | | — | | | 216,138,450 |
Energy | | | 184,979,750 | | | — | | | — | | | 184,979,750 |
Financials | | | 240,723,200 | | | — | | | — | | | 240,723,200 |
Health Care | | | 136,264,350 | | | — | | | — | | | 136,264,350 |
Industrials | | | 159,919,070 | | | — | | | — | | | 159,919,070 |
Information Technology | | | 182,818,920 | | | — | | | — | | | 182,818,920 |
Materials | | | 71,697,100 | | | — | | | — | | | 71,697,100 |
Telecommunication Services | | | 104,822,450 | | | — | | | — | | | 104,822,450 |
Utilities | | | 81,379,600 | | | — | | | — | | | 81,379,600 |
| | | | | | | | | | | | |
Total Common Stocks | | | 1,536,898,650 | | | — | | | — | | | 1,536,898,650 |
| | | | | | | | | | | | |
See Accompanying Notes to Financial Statements.
10
Columbia Dividend Income Fund
September 30, 2009
| | | | | | | | | | | | |
Description | | Quoted Prices
(Level 1) | | Other
Significant
Observable
Inputs
(Level 2) | | Significant
Unobservable
Inputs
(Level 3) | | Total |
Convertible Preferred Stocks | | | | | | | | | | | | |
Consumer Staples | | $ | 9,975,000 | | $ | — | | $ | — | | $ | 9,975,000 |
Health Care | | | 48,540,000 | | | — | | | — | | | 48,540,000 |
| | | | | | | | | | | | |
Total Convertible Preferred Stocks | | | 58,515,000 | | | — | | | — | | | 58,515,000 |
| | | | | | | | | | | | |
Total Investment Company | | | 38,001,600 | | | — | | | — | | | 38,001,600 |
| | | | | | | | | | | | |
Total Short-Term Obligation | | | — | | | 54,970,000 | | | — | | | 54,970,000 |
| | | | | | | | | | | | |
Total Investments | | $ | 1,633,415,250 | | $ | 54,970,000 | | $ | — | | $ | 1,688,385,250 |
| | | | | | | | | | | | |
For more information on valuation inputs, and their aggregation into the levels used in the table above, please refer to the Security Valuation section in the accompanying Notes to Financial Statements.
At September 30, 2009, the Fund held investments in the following sectors:
| | |
Sector (Unaudited) | | % of Net Assets |
Financials | | 14.2 |
Consumer Staples | | 13.4 |
Health Care | | 11.0 |
Energy | | 10.9 |
Information Technology | | 10.8 |
Industrials | | 9.4 |
Consumer Discretionary | | 9.3 |
Telecommunication Services | | 6.2 |
Utilities | | 4.8 |
Materials | | 4.2 |
| | |
| | 94.2 |
Investment Company | | 2.2 |
Short-Term Obligations | | 3.2 |
Other Assets & Liabilities, Net | | 0.4 |
| | |
| | 100.0 |
| | |
| | |
Acronym | | Name |
| ADR | | American Depositary Receipt |
See Accompanying Notes to Financial Statements.
11
Statement of Assets and Liabilities – Columbia Dividend Income Fund
September 30, 2009
| | | | | |
| | | | | ($) | |
| Assets | | Investments, at identified cost | | 1,565,700,894 | |
| | | | | |
| | Investments, at value | | 1,688,385,250 | |
| | Cash | | 316 | |
| | Receivable for: | | | |
| | Fund shares sold | | 6,500,590 | |
| | Dividends | | 4,509,665 | |
| | Interest | | 15 | |
| | Expense reimbursement due from investment advisor | | 112,464 | |
| | Trustees’ deferred compensation plan | | 89,021 | |
| | Prepaid expenses | | 10,025 | |
| | | | | |
| | Total Assets | | 1,699,607,346 | |
| | |
| Liabilities | | Payable for: | | | |
| | Fund shares repurchased | | 3,007,862 | |
| | Distributions | | 32 | |
| | Investment advisory fee | | 878,228 | |
| | Administration fee | | 91,457 | |
| | Pricing and bookkeeping fees | | 11,895 | |
| | Transfer agent fee | | 180,299 | |
| | Trustees’ fees | | 2,577 | |
| | Custody fee | | 7,415 | |
| | Distribution and service fees | | 176,312 | |
| | Chief compliance officer expenses | | 276 | |
| | Trustees’ deferred compensation plan | | 89,021 | |
| | Other liabilities | | 104,477 | |
| | | | | |
| | Total Liabilities | | 4,549,851 | |
| | |
| | | | | |
| | Net Assets | | 1,695,057,495 | |
| | |
| Net Assets Consist of | | Paid-in capital | | 1,785,888,141 | |
| | Undistributed net investment income | | 1,358,520 | |
| | Accumulated net realized loss | | (214,873,522 | ) |
| | Net unrealized appreciation on investments | | 122,684,356 | |
| | | | | |
| | Net Assets | | 1,695,057,495 | |
See Accompanying Notes to Financial Statements.
12
Statement of Assets and Liabilities (continued) – Columbia Dividend Income Fund
September 30, 2009
| | | | | | |
| | | | | | |
| Class A | | Net assets | | $ | 483,916,146 | |
| | Shares outstanding | | | 43,285,657 | |
| | Net asset value per share | | $ | 11.18 | (a) |
| | Maximum sales charge | | | 5.75 | % |
| | Maximum offering price per share ($11.18/0.9425) | | $ | 11.86 | (b) |
| | |
| Class B | | | | | | |
| | Net assets | | $ | 28,006,163 | |
| | Shares outstanding | | | 2,560,617 | |
| | Net asset value and offering price per share | | $ | 10.94 | (a) |
| | |
| Class C | | | | | | |
| | Net assets | | $ | 48,437,845 | |
| | Shares outstanding | | | 4,431,662 | |
| | Net asset value and offering price per share | | $ | 10.93 | (a) |
| | |
| Class R | | | | | | |
| | Net assets | | $ | 657,055 | |
| | Shares outstanding | | | 58,751 | |
| | Net asset value, offering and redemption price per share | | $ | 11.18 | |
| | |
| Class T | | | | | | |
| | Net assets | | $ | 73,772,770 | |
| | Shares outstanding | | | 6,597,716 | |
| | Net asset value per share | | $ | 11.18 | (a) |
| | Maximum sales charge | | | 5.75 | % |
| | Maximum offering price per share ($11.18/0.9425) | | $ | 11.86 | (b) |
| | |
| Class Z | | | | | | |
| | Net assets | | $ | 1,060,267,516 | |
| | Shares outstanding | | | 94,803,580 | |
| | Net asset value, offering and redemption price per share | | $ | 11.18 | |
| (a) | Redemption price per share is equal to net asset value less any applicable contingent deferred sales charge. |
| (b) | On sales of $50,000 or more the offering price is reduced. |
See Accompanying Notes to Financial Statements.
13
Statement of Operations – Columbia Dividend Income Fund
For the Year Ended September 30, 2009
| | | | | | | |
| | | | | ($) | |
| Investment Income | | Dividends | | 49,522,327 | |
| | Interest | | 85,785 | |
| | Securities lending | | 15,644 | |
| | Foreign taxes withheld | | (382,732 | ) |
| | | |
| | Total Investment Income | | 49,241,024 | �� |
| | |
| Expenses | | Investment advisory fee | | 8,227,244 | |
| | Administration fee | | 836,788 | |
| | Distribution fee: | | | |
| | Class B | | 192,252 | |
| | Class C | | 194,696 | |
| | Class R | | 689 | |
| | Service fee: | | | |
| | Class A | | 810,948 | |
| | Class B | | 64,084 | |
| | Class C | | 64,929 | |
| | Shareholder services fee – Class T | | 179,754 | |
| | Pricing and bookkeeping fees | | 141,429 | |
| | Transfer agent fee | | 930,975 | |
| | Trustees’ fees | | 54,502 | |
| | Custody fee | | 41,125 | |
| | Chief compliance officer expenses | | 1,031 | |
| | Other expenses | | 549,578 | |
| | | |
| | Total Expenses | | 12,290,024 | |
| | |
| | Fees waived or expenses reimbursed by investment advisor | | (791,034 | ) |
| | Expense reductions | | (143 | ) |
| | | |
| | Net Expenses | | 11,498,847 | |
| |
| | | |
| | Net Investment Income | | 37,742,177 | |
| | |
| Net Realized and Unrealized Gain (Loss) on Investments | | Net realized loss on investments | | (97,509,148 | ) |
| | Net change in unrealized appreciation (depreciation) on investments | | 103,911,886 | |
| | | |
| | Net Gain | | 6,402,738 | |
| |
| | | |
| | Net Increase Resulting from Operations | | 44,144,915 | |
See Accompanying Notes to Financial Statements.
14
Statement of Changes in Net Assets – Columbia Dividend Income Fund
| | | | | | | | |
| | | | | Year Ended September 30, | |
| Increase (Decrease) in Net Assets | | | | 2009 ($) | | | 2008 ($)(a) | |
| Operations | | Net investment income | | 37,742,177 | | | 26,516,601 | |
| | Net realized loss on investments | | (97,509,148 | ) | | (31,537,547 | ) |
| | Net change in unrealized appreciation (depreciation) on investments | | 103,911,886 | | | (226,151,392 | ) |
| | | | | | | | |
| | Net increase (decrease) resulting from operations | | 44,144,915 | | | (231,172,338 | ) |
| | | |
| Distributions to Shareholders | | From net investment income: | | | | | | |
| | Class A | | (9,328,760 | ) | | (7,344,786 | ) |
| | Class B | | (520,145 | ) | | (618,508 | ) |
| | Class C | | (572,360 | ) | | (239,863 | ) |
| | Class R | | (3,846 | ) | | (125 | ) |
| | Class T | | (1,630,665 | ) | | (1,886,431 | ) |
| | Class Z | | (25,318,495 | ) | | (16,590,521 | ) |
| | From net realized gains: | | | | | | |
| | Class A | | — | | | (3,801,052 | ) |
| | Class B | | — | | | (529,218 | ) |
| | Class C | | — | | | (204,324 | ) |
| | Class R | | — | | | (1,011,104 | ) |
| | Class Z | | — | | | (6,242,104 | ) |
| | | | | | | | |
| | Total distributions to shareholders | | (37,374,271 | ) | | (38,468,036 | ) |
| | | |
| | Net Capital Stock Transactions | | 621,633,779 | | | 195,920,032 | |
| | Increase from regulatory settlements | | 665,701 | | | — | |
| | | | | | | | |
| | Total increase (decrease) in net assets | | 629,070,124 | | | (73,720,342 | ) |
| | | |
| Net Assets | | Beginning of period | | 1,065,987,371 | | | 1,139,707,713 | |
| | End of period | | 1,695,057,495 | | | 1,065,987,371 | |
| | Undistributed net investment income at end of period | | 1,358,520 | | | 180,736 | |
| | | | | | | | |
| (a) | Class R shares commenced operations on March 28, 2008. |
See Accompanying Notes to Financial Statements.
15
Statement of Changes in Net Assets (continued) – Columbia Dividend Income Fund
| | | | | | | | | | | | | | |
| | | Capital Stock Activity | |
| | | Year Ended
September 30, 2009 | | | | | Year Ended
September 30, 2008(a) | |
| | | Shares | | | Dollars ($) | | | | | Shares | | | Dollars ($) | |
Class A | | | | | | | | | | | | | | |
Subscriptions | | 27,895,461 | | | 276,099,772 | | | | | 3,040,373 | | | 41,888,249 | |
Distributions reinvested | | 778,447 | | | 7,861,416 | | | | | 671,595 | | | 9,255,016 | |
Redemptions | | (8,547,450 | ) | | (85,291,578 | ) | | | | (4,675,333 | ) | | (64,381,794 | ) |
| | | | | | | | | | | | | | |
Net increase (decrease) | | 20,126,458 | | | 198,669,610 | | | | | (963,365 | ) | | (13,238,529 | ) |
| | | | | |
| Class B | | | | | | | | | | | | | | |
Subscriptions | | 1,129,813 | | | 10,598,969 | | | | | 236,708 | | | 3,185,642 | |
Distributions reinvested | | 44,163 | | | 430,960 | | | | | 70,180 | | | 965,509 | |
Redemptions | | (1,277,029 | ) | | (12,135,167 | ) | | | | (1,165,286 | ) | | (15,738,910 | ) |
| | | | | | | | | | | | | | |
Net decrease | | (103,053 | ) | | (1,105,238 | ) | | | | (858,398 | ) | | (11,587,759 | ) |
| | | | | |
| Class C | | | | | | | | | | | | | | |
Subscriptions | | 3,828,234 | | | 36,845,519 | | | | | 244,503 | | | 3,295,088 | |
Distributions reinvested | | 43,574 | | | 432,821 | | | | | 27,268 | | | 374,494 | |
Redemptions | | (515,925 | ) | | (5,019,427 | ) | | | | (568,860 | ) | | (7,771,162 | ) |
| | | | | | | | | | | | | | |
Net increase (decrease) | | 3,355,883 | | | 32,258,913 | | | | | (297,089 | ) | | (4,101,580 | ) |
| | | | | |
| Class R | | | | | | | | | | | | | | |
Subscriptions | | 57,996 | | | 584,229 | | | | | 761 | | | 10,178 | |
Proceeds received in connection with merger | | — | | | — | | | | | 141 | | | 1,894 | |
Distributions reinvested | | 346 | | | 3,834 | | | | | 10 | | | 125 | |
Redemptions | | (503 | ) | | (5,468 | ) | | | | — | | | — | |
| | | | | | | | | | | | | | |
Net increase | | 57,839 | | | 582,595 | | | | | 912 | | | 12,197 | |
| | | | | |
| Class T | | | | | | | | | | | | | | |
Subscriptions | | 1,258,177 | | | 12,683,562 | | | | | 60,101 | | | 834,348 | |
Distributions reinvested | | 156,696 | | | 1,572,896 | | | | | 202,390 | | | 2,793,219 | |
Redemptions | | (830,271 | ) | | (8,164,564 | ) | | | | (823,169 | ) | | (11,391,329 | ) |
| | | | | | | | | | | | | | |
Net increase (decrease) | | 584,602 | | | 6,091,894 | | | | | (560,678 | ) | | (7,763,762 | ) |
| | | | | |
| Class Z | | | | | | | | | | | | | | |
Subscriptions | | 71,665,405 | | | 704,770,708 | | | | | 15,600,509 | | | 213,411,245 | |
Proceeds received in connection with merger | | — | | | — | | | | | 12,606,624 | | | 168,957,597 | |
Distributions reinvested | | 524,210 | | | 5,276,709 | | | | | 319,451 | | | 4,324,304 | |
Redemptions | | (33,309,318 | ) | | (324,911,412 | ) | | | | (11,343,303 | ) | | (154,093,681 | ) |
| | | | | | | | | | | | | | |
Net increase | | 38,880,297 | | | 385,136,005 | | | | | 17,183,281 | | | 232,599,465 | |
| (a) | Class R shares commenced operations on March 28, 2008. |
See Accompanying Notes to Financial Statements.
16
Financial Highlights – Columbia Dividend Income Fund
Selected data for a share outstanding throughout each period is as follows:
| | | | | | | | | | | | | | | | | | | | |
| | | Year Ended September 30, | |
| Class A Shares | | 2009 | | | 2008 | | | 2007 | | | 2006 | | | 2005 | |
Net Asset Value, Beginning of Period | | $ | 12.01 | | | $ | 15.35 | | | $ | 13.45 | | | $ | 12.01 | | | $ | 10.80 | |
| | | | | |
Income from Investment Operations: | | | | | | | | | | | | | | | | | | | | |
Net investment income (a) | | | 0.29 | | | | 0.31 | | | | 0.28 | | | | 0.26 | | | | 0.25 | |
Net realized and unrealized gain (loss) on investments | | | (0.86 | ) | | | (3.18 | ) | | | 2.02 | | | | 1.45 | | | | 1.16 | |
| | | | | | | | | | | | | | | | | | | | |
Total from investment operations | | | (0.57 | ) | | | (2.87 | ) | | | 2.30 | | | | 1.71 | | | | 1.41 | |
| | | | | |
Less Distributions to Shareholders: | | | | | | | | | | | | | | | | | | | | |
From net investment income | | | (0.27 | ) | | | (0.31 | ) | | | (0.27 | ) | | | (0.27 | ) | | | (0.20 | ) |
From net realized gains | | | — | | | | (0.16 | ) | | | (0.13 | ) | | | — | | | | — | |
| | | | | | | | | | | | | | | | | | | | |
Total distributions to shareholders | | | (0.27 | ) | | | (0.47 | ) | | | (0.40 | ) | | | (0.27 | ) | | | (0.20 | ) |
| | | | | |
Increase from Regulatory Settlements | | | 0.01 | | | | — | | | | — | | | | — | | | | — | |
| | | | | |
Net Asset Value, End of Period | | $ | 11.18 | | | $ | 12.01 | | | $ | 15.35 | | | $ | 13.45 | | | $ | 12.01 | |
Total return (b)(c) | | | (4.33 | )% | | | (19.06 | )% | | | 17.31 | % | | | 14.45 | % | | | 13.10 | % |
| | | | | |
Ratios to Average Net Assets/Supplemental Data: | | | | | | | | | | | | | | | | | | | | |
Net expenses (d) | | | 1.05 | % | | | 1.05 | % | | | 1.05 | % | | | 1.05 | % | | | 1.05 | % |
Waiver/Reimbursement | | | 0.06 | % | | | 0.06 | % | | | 0.07 | % | | | 0.12 | % | | | 0.18 | % |
Net investment income (d) | | | 2.88 | % | | | 2.24 | % | | | 1.90 | % | | | 2.19 | % | | | 2.11 | % |
Portfolio turnover rate | | | 23 | % | | | 16 | % | | | 21 | % | | | 52 | % | | | 18 | % |
Net assets, end of period (000s) | | $ | 483,916 | | | $ | 278,122 | | | $ | 370,358 | | | $ | 345,595 | | | $ | 27,534 | |
| (a) | Per share data was calculated using the average shares outstanding during the period. |
| (b) | Had the investment advisor and/or any of its affiliates not waived fees or reimbursed a portion of expenses, total return would have been reduced. |
| (c) | Total return at net asset value assuming all distributions reinvested and no initial sales charge or contingent deferred sales charge. |
| (d) | The benefits derived from expense reductions had an impact of less than 0.01%. |
See Accompanying Notes to Financial Statements.
17
Financial Highlights – Columbia Dividend Income Fund
Selected data for a share outstanding throughout each period is as follows:
| | | | | | | | | | | | | | | | | | | | |
| | | Year Ended September 30, | |
| Class B Shares | | 2009 | | | 2008 | | | 2007 | | | 2006 | | | 2005 | |
Net Asset Value, Beginning of Period | | $ | 11.75 | | | $ | 15.03 | | | $ | 13.17 | | | $ | 11.77 | | | $ | 10.59 | |
| | | | | |
Income from Investment Operations: | | | | | | | | | | | | | | | | | | | | |
Net investment income (a) | | | 0.21 | | | | 0.20 | | | | 0.16 | | | | 0.16 | | | | 0.16 | |
Net realized and unrealized gain (loss) on investments | | | (0.82 | ) | | | (3.11 | ) | | | 1.99 | | | | 1.42 | | | | 1.13 | |
| | | | | | | | | | | | | | | | | | | | |
Total from investment operations | | | (0.61 | ) | | | (2.91 | ) | | | 2.15 | | | | 1.58 | | | | 1.29 | |
| | | | | |
Less Distributions to Shareholders: | | | | | | | | | | | | | | | | | | | | |
From net investment income | | | (0.20 | ) | | | (0.21 | ) | | | (0.16 | ) | | | (0.18 | ) | | | (0.11 | ) |
From net realized gains | | | — | | | | (0.16 | ) | | | (0.13 | ) | | | — | | | | — | |
| | | | | | | | | | | | | | | | | | | | |
Total distributions to shareholders | | | (0.20 | ) | | | (0.37 | ) | | | (0.29 | ) | | | (0.18 | ) | | | (0.11 | ) |
| | | | | |
Increase from Regulatory Settlements | | | — | (b) | | | — | | | | — | | | | — | | | | — | |
| | | | | |
Net Asset Value, End of Period | | $ | 10.94 | | | $ | 11.75 | | | $ | 15.03 | | | $ | 13.17 | | | $ | 11.77 | |
Total return (c)(d) | | | (4.97 | )% | | | (19.71 | )% | | | 16.49 | % | | | 13.55 | % | | | 12.23 | % |
| | | | | |
Ratios to Average Net Assets/Supplemental Data: | | | | | | | | | | | | | | | | | | | | |
Net expenses (e) | | | 1.80 | % | | | 1.80 | % | | | 1.80 | % | | | 1.80 | % | | | 1.80 | % |
Waiver/Reimbursement | | | 0.06 | % | | | 0.06 | % | | | 0.07 | % | | | 0.12 | % | | | 0.18 | % |
Net investment income (e) | | | 2.18 | % | | | 1.48 | % | | | 1.16 | % | | | 1.30 | % | | | 1.36 | % |
Portfolio turnover rate | | | 23 | % | | | 16 | % | | | 21 | % | | | 52 | % | | | 18 | % |
Net assets, end of period (000s) | | $ | 28,006 | | | $ | 31,307 | | | $ | 52,937 | | | $ | 57,644 | | | $ | 17,359 | |
| (a) | Per share data was calculated using the average shares outstanding during the period. |
| (b) | Rounds to less than $0.01 per share. |
| (c) | Total return at net asset value assuming all distributions reinvested and no contingent deferred sales charge. |
| (d) | Had the investment advisor and/or any of its affiliates not waived fees or reimbursed a portion of expenses, total return would have been reduced. |
| (e) | The benefits derived from expense reductions had an impact of less than 0.01%. |
See Accompanying Notes to Financial Statements.
18
Financial Highlights – Columbia Dividend Income Fund
Selected data for a share outstanding throughout each period is as follows:
| | | | | | | | | | | | | | | | | | | | |
| | | Year Ended September 30, | |
| Class C Shares | | 2009 | | | 2008 | | | 2007 | | | 2006 | | | 2005 | |
Net Asset Value, Beginning of Period | | $ | 11.74 | | | $ | 15.02 | | | $ | 13.17 | | | $ | 11.76 | | | $ | 10.58 | |
| | | | | |
Income from Investment Operations: | | | | | | | | | | | | | | | | | | | | |
Net investment income (a) | | | 0.20 | | | | 0.20 | | | | 0.16 | | | | 0.16 | | | | 0.16 | |
Net realized and unrealized gain (loss) on investments | | | (0.82 | ) | | | (3.11 | ) | | | 1.98 | | | | 1.43 | | | | 1.13 | |
| | | | | | | | | | | | | | | | | | | | |
Total from investment operations | | | (0.62 | ) | | | (2.91 | ) | | | 2.14 | | | | 1.59 | | | | 1.29 | |
| | | | | |
Less Distributions to Shareholders: | | | | | | | | | | | | | | | | | | | | |
From net investment income | | | (0.20 | ) | | | (0.21 | ) | | | (0.16 | ) | | | (0.18 | ) | | | (0.11 | ) |
From net realized gains | | | — | | | | (0.16 | ) | | | (0.13 | ) | | | — | | | | — | |
| | | | | | | | | | | | | | | | | | | | |
Total distributions to shareholders | | | (0.20 | ) | | | (0.37 | ) | | | (0.29 | ) | | | (0.18 | ) | | | (0.11 | ) |
| | | | | |
Increase from Regulatory Settlements | | | 0.01 | | | | — | | | | — | | | | — | | | | — | |
| | | | | |
Net Asset Value, End of Period | | $ | 10.93 | | | $ | 11.74 | | | $ | 15.02 | | | $ | 13.17 | | | $ | 11.76 | |
Total return (b)(c) | | | (4.98 | )% | | | (19.72 | )% | | | 16.42 | % | | | 13.64 | % | | | 12.24 | % |
| | | | | |
Ratios to Average Net Assets/Supplemental Data: | | | | | | | | | | | | | | | | | | | | |
Net expenses (d) | | | 1.80 | % | | | 1.80 | % | | | 1.80 | % | | | 1.80 | % | | | 1.80 | % |
Waiver/Reimbursement | | | 0.06 | % | | | 0.06 | % | | | 0.07 | % | | | 0.12 | % | | | 0.18 | % |
Net investment income (d) | | | 2.08 | % | | | 1.48 | % | | | 1.14 | % | | | 1.29 | % | | | 1.36 | % |
Portfolio turnover rate | | | 23 | % | | | 16 | % | | | 21 | % | | | 52 | % | | | 18 | % |
Net assets, end of period (000s) | | $ | 48,438 | | | $ | 12,635 | | | $ | 20,622 | | | $ | 12,950 | | | $ | 3,959 | |
| (a) | Per share data was calculated using the average shares outstanding during the period. |
| (b) | Had the investment advisor and/or any of its affiliates not waived fees or reimbursed a portion of expenses, total return would have been reduced. |
| (c) | Total return at net asset value assuming all distributions reinvested and no contingent deferred sales charge. |
| (d) | The benefits derived from expense reductions had an impact of less than 0.01%. |
See Accompanying Notes to Financial Statements.
19
Financial Highlights – Columbia Dividend Income Fund
Selected data for a share outstanding throughout each period is as follows:
| | | | | | | | |
| Class R Shares | | Year Ended
September 30,
2009 | | | Period Ended
September 30,
2008 (a) | |
Net Asset Value, Beginning of Period | | $ | 12.01 | | | $ | 13.39 | |
| | |
Income from Investment Operations: | | | | | | | | |
Net investment income (b) | | | 0.28 | | | | 0.14 | |
Net realized and unrealized loss on investments | | | (0.86 | ) | | | (1.38 | ) |
| | | | | | | | |
Total from investment operations | | | (0.58 | ) | | | (1.24 | ) |
| | |
Less Distributions to Shareholders: | | | | | | | | |
From net investment income | | | (0.25 | ) | | | (0.14 | ) |
| | |
Increase from Regulatory Settlements | | | — | (c) | | | — | |
| | |
Net Asset Value, End of Period | | $ | 11.18 | | | $ | 12.01 | |
Total return (d)(e) | | | (4.57 | )% | | | (9.28 | )%(f) |
| | |
Ratios to Average Net Assets/Supplemental Data: | | | | | | | | |
Net expenses (g) | | | 1.30 | % | | | 1.30 | %(h) |
Waiver/Reimbursement | | | 0.06 | % | | | 0.06 | %(h) |
Net investment income (g) | | | 2.59 | % | | | 2.10 | %(h) |
Portfolio turnover rate | | | 23 | % | | | 16 | %(f) |
Net assets, end of period (000s) | | $ | 657 | | | $ | 11 | |
| (a) | Class R shares commenced operations on March 28, 2008. Per share data and total return reflect activity from that date. |
| (b) | Per share data was calculated using the average shares outstanding during the period. |
| (c) | Rounds to less than $0.01 per share. |
| (d) | Total return at net asset value assuming all distributions reinvested. |
| (e) | Had the investment advisor and/or any of its affiliates not waived fees or reimbursed a portion of expenses, total return would have been reduced. |
| (g) | The benefits derived from expense reductions had an impact of less than 0.01%. |
See Accompanying Notes to Financial Statements.
20
Financial Highlights – Columbia Dividend Income Fund
Selected data for a share outstanding throughout each period is as follows:
| | | | | | | | | | | | | | | | | | | | |
| | | Year Ended September 30, | |
| Class T Shares | | 2009 | | | 2008 | | | 2007 | | | 2006 | | | 2005 | |
Net Asset Value, Beginning of Period | | $ | 12.01 | | | $ | 15.35 | | | $ | 13.45 | | | $ | 12.01 | | | $ | 10.80 | |
| | | | | |
Income from Investment Operations: | | | | | | | | | | | | | | | | | | | | |
Net investment income (a) | | | 0.29 | | | | 0.30 | | | | 0.27 | | | | 0.25 | | | | 0.24 | |
Net realized and unrealized gain (loss) on investments | | | (0.85 | ) | | | (3.18 | ) | | | 2.02 | | | | 1.46 | | | | 1.16 | |
| | | | | | | | | | | | | | | | | | | | |
Total from investment operations | | | (0.56 | ) | | | (2.88 | ) | | | 2.29 | | | | 1.71 | | | | 1.40 | |
| | | | | |
Less Distributions to Shareholders: | | | | | | | | | | | | | | | | | | | | |
From net investment income | | | (0.27 | ) | | | (0.30 | ) | | | (0.26 | ) | | | (0.27 | ) | | | (0.19 | ) |
From net realized gains | | | — | | | | (0.16 | ) | | | (0.13 | ) | | | — | | | | — | |
| | | | | | | | | | | | | | | | | | | | |
Total distributions to shareholders | | | (0.27 | ) | | | (0.46 | ) | | | (0.39 | ) | | | (0.27 | ) | | | (0.19 | ) |
| | | | | |
Increase from Regulatory Settlements | | | — | (b) | | | — | | | | — | | | | — | | | | — | |
| | | | | |
Net Asset Value, End of Period | | $ | 11.18 | | | $ | 12.01 | | | $ | 15.35 | | | $ | 13.45 | | | $ | 12.01 | |
Total return (c)(d) | | | (4.38 | )% | | | (19.10 | )% | | | 17.25 | % | | | 14.39 | % | | | 13.04 | % |
| | | | | |
Ratios to Average Net Assets/Supplemental Data: | | | | | | | | | | | | | | | | | | | | |
Net expenses (e) | | | 1.10 | % | | | 1.10 | % | | | 1.10 | % | | | 1.10 | % | | | 1.10 | % |
Waiver/Reimbursement | | | 0.06 | % | | | 0.06 | % | | | 0.07 | % | | | 0.12 | % | | | 0.18 | % |
Net investment income (e) | | | 2.87 | % | | | 2.19 | % | | | 1.85 | % | | | 1.96 | % | | | 2.06 | % |
Portfolio turnover rate | | | 23 | % | | | 16 | % | | | 21 | % | | | 52 | % | | | 18 | % |
Net assets, end of period (000s) | | $ | 73,773 | | | $ | 72,213 | | | $ | 100,932 | | | $ | 96,651 | | | $ | 99,148 | |
| (a) | Per share data was calculated using the average shares outstanding during the period. |
| (b) | Rounds to less than $0.01 per share. |
| (c) | Total return at net asset value assuming all distributions reinvested and no initial sales charge or contingent deferred sales charge. |
| (d) | Had the investment advisor and/or any of its affiliates not waived fees or reimbursed a portion of expenses, total return would have been reduced. |
| (e) | The benefits derived from expense reductions had an impact of less than 0.01%. |
See Accompanying Notes to Financial Statements.
21
Financial Highlights – Columbia Dividend Income Fund
Selected data for a share outstanding throughout each period is as follows:
| | | | | | | | | | | | | | | | | | | | |
| | | Year Ended September 30, | |
| Class Z Shares | | 2009 | | | 2008 | | | 2007 | | | 2006 | | | 2005 | |
Net Asset Value, Beginning of Period | | $ | 12.01 | | | $ | 15.36 | | | $ | 13.45 | | | $ | 12.01 | | | $ | 10.80 | |
| | | | | |
Income from Investment Operations: | | | | | | | | | | | | | | | | | | | | |
Net investment income (a) | | | 0.31 | | | | 0.34 | | | | 0.31 | | | | 0.28 | | | | 0.28 | |
Net realized and unrealized gain (loss) on investments | | | (0.85 | ) | | | (3.19 | ) | | | 2.04 | | | | 1.47 | | | | 1.16 | |
| | | | | | | | | | | | | | | | | | | | |
Total from investment operations | | | (0.54 | ) | | | (2.85 | ) | | | 2.35 | | | | 1.75 | | | | 1.44 | |
| | | | | |
Less Distributions to Shareholders: | | | | | | | | | | | | | | | | | | | | |
From net investment income | | | (0.30 | ) | | | (0.34 | ) | | | (0.31 | ) | | | (0.31 | ) | | | (0.23 | ) |
From net realized gains | | | — | | | | (0.16 | ) | | | (0.13 | ) | | | — | | | | — | |
| | | | | | | | | | | | | | | | | | | | |
Total distributions to shareholders | | | (0.30 | ) | | | (0.50 | ) | | | (0.44 | ) | | | (0.31 | ) | | | (0.23 | ) |
| | | | | |
Increase from Regulatory Settlements | | | 0.01 | | | | — | | | | — | | | | — | | | | — | |
| | | | | |
Net Asset Value, End of Period | | $ | 11.18 | | | $ | 12.01 | | | $ | 15.36 | | | $ | 13.45 | | | $ | 12.01 | |
Total return (b)(c) | | | (4.10 | )% | | | (18.90 | )% | | | 17.67 | % | | | 14.73 | % | | | 13.38 | % |
| | | | | |
Ratios to Average Net Assets/Supplemental Data: | | | | | | | | | | | | | | | | | | | | |
Net expenses (d) | | | 0.80 | % | | | 0.80 | % | | | 0.80 | % | | | 0.80 | % | | | 0.80 | % |
Waiver/Reimbursement | | | 0.06 | % | | | 0.06 | % | | | 0.07 | % | | | 0.12 | % | | | 0.18 | % |
Net investment income (d) | | | 3.15 | % | | | 2.51 | % | | | 2.15 | % | | | 2.27 | % | | | 2.37 | % |
Portfolio turnover rate | | | 23 | % | | | 16 | % | | | 21 | % | | | 52 | % | | | 18 | % |
Net assets, end of period (000s) | | $ | 1,060,268 | | | $ | 671,700 | | | $ | 594,859 | | | $ | 471,876 | | | $ | 358,125 | |
| (a) | Per share data was calculated using the average shares outstanding during the period. |
| (b) | Total return at net asset value assuming all distributions reinvested. |
| (c) | Had the investment advisor and/or any of its affiliates not waived fees or reimbursed a portion of expenses, total return would have been reduced. |
| (d) | The benefits derived from expense reductions had an impact of less than 0.01%. |
See Accompanying Notes to Financial Statements.
22
Notes to Financial Statements – Columbia Dividend Income Fund
September 30, 2009
Note 1. Organization
Columbia Dividend Income Fund (the “Fund”), a series of Columbia Funds Series Trust I (the “Trust”), is a diversified portfolio. The Trust is a Massachusetts business trust registered under the Investment Company Act of 1940, as amended (the “1940 Act”), as an open-end management investment company.
Investment Objective
The Fund seeks total return, consisting of current income and capital appreciation.
Fund Shares
The Trust may issue an unlimited number of shares, and the Fund offers six classes of shares: Class A, Class B, Class C, Class R, Class T and Class Z. Each share class has its own expense structure and sales charges, as applicable. Effective June 22, 2009, the Fund no longer accepts investments from new or existing investors in the Fund’s Class B shares, except in connection with the reinvestment of any dividend and/or capital gain distributions in Class B shares of the Fund, and exchanges by existing Class B shareholders of other Columbia Funds.
Class A and Class T shares are subject to a maximum front-end sales charge of 5.75% based on the amount of initial investment. Class A and Class T shares purchased without an initial sales charge in accounts aggregating $1 million to $50 million at the time of purchase are subject to a 1.00% contingent deferred sales charge (“CDSC”) if the shares are sold within one year after purchase. Class B shares are subject to a maximum CDSC of 5.00% based upon the holding period after purchase. Class B shares will generally convert to Class A shares eight years after purchase. Class C shares are subject to a 1.00% CDSC on shares sold within one year after purchase. Class R and Class Z shares are offered continuously at net asset value. There are certain restrictions on the purchase of Class R and Class Z shares, as described in the Fund’s prospectus.
Note 2. Significant Accounting Policies
The preparation of financial statements in accordance with accounting principles generally accepted in the United States of America (“GAAP”) requires management to make certain estimates and assumptions that affect the reported amounts of assets and liabilities, the disclosure of contingent assets and liabilities at the date of the financial statements and the reported amounts of revenue and expenses during the reporting period. Actual results could differ from those estimates.
Management has evaluated the events and transactions that have occurred through November 20, 2009, the date the financial statements were issued, and except as disclosed in Note 13, noted no items requiring adjustment of the financial statements or additional disclosures.
The following is a summary of significant accounting policies consistently followed by the Fund in the preparation of its financial statements.
Security Valuation
Equity securities are valued at the last sale price on the principal exchange on which they trade, except for securities traded on the NASDAQ, which are valued at the NASDAQ official close price. Unlisted securities or listed securities for which there were no sales during the day are valued at the closing bid price on such exchanges or over-the-counter markets.
Short-term investments maturing in 60 days or less are valued at amortized cost, which approximates market value.
Investments for which market quotations are not readily available, or that have quotations which management believes are not reliable, are valued at fair value as determined in good faith under consistently applied procedures established by and under the general supervision of the Board of Trustees. If a security is valued at fair value, such value is likely to be different from the last quoted market price for the security. The determination of fair value often requires significant judgment. To determine fair value, management may use assumptions including but not limited to future cash flows and estimated risk premiums. Multiple inputs from various sources may be used to determine value.
Management establishes a hierarchy that prioritizes the inputs to valuation techniques used to measure fair value giving the highest priority to unadjusted quoted prices in active markets for identical securities (level 1 measurements) and the lowest priority to unobservable inputs (level 3 measurements) when market prices are not readily available or reliable. The three levels of the fair value hierarchy are described below:
| n | | Level 1 — quoted prices in active markets for identical securities |
23
Columbia Dividend Income Fund
September 30, 2009
| n | | Level 2 — prices determined using other significant observable inputs (including quoted prices for similar securities, interest rates, prepayment speeds, credit risk and others) |
| n | | Level 3 — prices determined using significant unobservable inputs. In situations where quoted prices or observable inputs are unavailable or less reliable, unobservable inputs may be used. Unobservable inputs may include management’s own assumptions about the factors market participants would use in pricing an investment. |
The inputs or methodology used for valuing securities are not necessarily an indication of the risk associated with investing in those securities.
Security Transactions
Security transactions are accounted for on the trade date. Cost is determined and gains (losses) are based upon the specific identification method for both financial statement and federal income tax purposes.
Repurchase Agreements
The Fund may engage in repurchase agreement transactions with institutions that Columbia Management Advisors, LLC (“Columbia”), the Fund’s investment advisor, has determined are creditworthy. The Fund, through its custodian, receives delivery of the underlying securities collateralizing a repurchase agreement. Columbia is responsible for determining that the collateral is at least equal, at all times, to the value of the repurchase obligation including interest. A repurchase agreement transaction involves certain risks in the event of default or insolvency of the counterparty. These risks include possible delays in or restrictions on the Fund’s ability to dispose of the underlying securities and a possible decline in the value of the underlying securities during the period while the Fund seeks to assert its rights.
Income Recognition
Interest income is recorded on the accrual basis.
Corporate actions and dividend income are recorded on the ex-date.
Distributions received from real estate investment trusts (REITs) in excess of their income are recorded as a reduction of the cost of the related investments. If the Fund no longer owns the applicable securities, any distributions received in excess of income are recorded as realized gains.
Awards from class action litigation are recorded as a reduction of cost if the Fund still owns the applicable securities on the payment date. If the Fund no longer owns the applicable securities, the proceeds are recorded as realized gains.
Expenses
General expenses of the Trust are allocated to the Fund and other series of the Trust based upon relative net assets or other expense allocation methodologies determined by the nature of the expense. Expenses directly attributable to the Fund are charged to the Fund.
Determination of Class Net Asset Value
All income, expenses (other than class-specific expenses, as shown on the Statement of Operations) and realized and unrealized gains (losses) are allocated to each class of the Fund on a daily basis, based on the relative net assets of each class, for purposes of determining the net asset value of each class.
Federal Income Tax Status
The Fund intends to qualify each year as a “regulated investment company” under Subchapter M of the Internal Revenue Code, as amended, and will distribute substantially all of its tax exempt or taxable income, if any, for its tax year, and as such will not be subject to federal income taxes. In addition, the Fund intends to distribute in each calendar year substantially all of its net investment income, capital gains and certain other amounts, if any, such that the Fund should not be subject to federal excise tax. Therefore, no federal income or excise tax provision is recorded.
Distributions to Shareholders
Distributions from net investment income are declared and paid quarterly. Net realized capital gains, if any, are distributed at least annually. Income distributions and capital gain distributions are determined in accordance with federal income tax regulations which may differ from GAAP.
Indemnification
In the normal course of business, the Fund enters into contracts that contain a variety of representations and
24
Columbia Dividend Income Fund
September 30, 2009
warranties and which provide general indemnities. The Fund’s maximum exposure under these arrangements is unknown because this would involve future claims against the Fund. Also, under the Trust’s organizational documents and by contract, the Trustees and officers of the Trust are indemnified against certain liabilities that may arise out of actions relating to their duties to the Trust. However, based on experience, the Fund expects the risk of loss due to these representations, warranties and indemnities to be minimal.
Note 3. Federal Tax Information
The timing and character of income and capital gain distributions are determined in accordance with income tax regulations, which may differ from GAAP. Reclassifications are made to the Fund’s capital accounts for permanent tax differences to reflect income and gains available for distribution (or available capital loss carryforwards) under income tax regulations.
For the year ended September 30, 2009, permanent book and tax basis differences resulting primarily from differing treatments for proceeds from litigation settlements, expired capital loss carryforwards and adjustments on certain convertible preferred securities were identified and reclassified among the components of the Fund’s net assets as follows:
| | | | |
| | | | | |
Undistributed
Net Investment
Income | | Accumulated
Net Realized Loss | | Paid-In Capital |
| $809,878 | | $(44,593) | | $(765,285) |
Net investment income and net realized gains (losses), as disclosed on the Statement of Operations, and net assets were not affected by this reclassification.
The tax character of distributions paid during the years ended September 30, 2009 and September 30, 2008 was as follows:
| | | | | | |
| | | September 30,
2009 | | September 30,
2008 |
Ordinary Income* | | $ | 37,374,271 | | $ | 26,591,941 |
Long-Term Capital Gains | | | — | | | 11,876,095 |
| * | For tax purposes short-term capital gain distributions, if any, are considered ordinary income distributions. |
As of September 30, 2009, the components of distributable earnings on a tax basis were as follows:
| | | | |
| | | | | |
Undistributed
Ordinary
Income | | Undistributed
Long-Term
Capital Gains | | Net Unrealized
Appreciation* |
| $1,510,671 | | $— | | $122,396,728 |
| * | The differences between book-basis and tax-basis net unrealized appreciation are primarily due to deferral of losses from wash sales. |
Unrealized appreciation and depreciation at September 30, 2009, based on cost of investments for federal income tax purposes were:
| | | | |
| | | | |
Unrealized appreciation | | $ | 222,725,685 | |
Unrealized depreciation | | | (100,328,957 | ) |
Net unrealized appreciation | | $ | 122,396,728 | |
The following capital loss carryforwards, determined as of September 30, 2009, may be available to reduce taxable income arising from future net realized gains on investments, if any, to the extent permitted by the Internal Revenue Code:
| | | |
| | | |
| Year of Expiration | | Capital Loss Carryforward |
| 2010 | | $ | 74,425,965 |
| 2011 | | | 1,266,110 |
| 2013 | | | 990,327 |
| 2014 | | | 2,808,003 |
| 2017 | | | 65,052,409 |
| | | |
| Total | | $ | 144,542,814 |
Of the capital loss carryforwards attributable to the Fund, $79,490,405 ($74,425,965 of which expires on September 30, 2010, $1,266,110 of which expires on September 30, 2011, $990,327 of which expires on September 30, 2013, and $2,808,003 of which expires on September 30, 2014) was acquired from fund mergers. The availability of a portion of the remaining capital loss carryforwards acquired as part of a fund merger may be limited in a given year.
Capital loss carryforwards of $34,704 expired during the year ended September 30, 2009. Expired capital loss carryforwards are recorded as a reduction of paid-in capital.
Under current tax rules, certain currency and capital losses realized after October 31 may be deferred and treated as
25
Columbia Dividend Income Fund
September 30, 2009
occurring on the first day of the following fiscal year. As of September 30, 2009, post-October capital losses of $70,043,080 attributed to security transactions were deferred to October 1, 2009.
Management is required to determine whether a tax position of the Fund is more likely than not to be sustained upon examination by the applicable taxing authority, including resolution of any related appeals or litigation processes, based on the technical merits of the position. The tax benefit to be recognized by the Fund is measured as the largest amount of benefit that is greater than fifty percent likely of being realized upon ultimate settlement. Management is not aware of any tax positions for which it is reasonably possible that the total amounts of unrecognized tax benefits will significantly change in the next twelve months. However, management’s conclusions may be subject to review and adjustment at a later date based on factors including, but not limited to, new tax laws, regulations, and administrative interpretations (including relevant court decisions). The Fund’s federal tax returns for the prior three fiscal years remain subject to examination by the Internal Revenue Service.
Note 4. Fees and Compensation Paid to Affiliates
Investment Advisory Fee
Columbia, an indirect, wholly owned subsidiary of Bank of America Corporation (“BOA”) provides investment advisory services to the Fund. In rendering investment advisory services to the Fund, Columbia may use the portfolio management and research resources of Columbia Management Pte. Ltd., an affiliate of Columbia. Columbia receives a monthly investment advisory fee based on the Fund’s average daily net assets at the following annual rates:
| | |
| | | |
| Average Daily Net Assets | | Annual Fee Rate |
First $500 million | | 0.70% |
$500 million to $1 billion | | 0.65% |
$1 billion to $1.5 billion | | 0.60% |
$1.5 billion to $3 billion | | 0.55% |
$3 billion to $6 billion | | 0.53% |
Over $6 billion | | 0.51% |
For the year ended September 30, 2009, the Fund’s effective investment advisory fee rate was 0.66% of the Fund’s average daily net assets.
BOA entered into an agreement dated September 29, 2009 to sell a portion of the asset management business of Columbia Management Group, LLC to Ameriprise Financial, Inc. The transaction (“Transaction”) includes a sale of the part of the asset management business that advises long-term mutual funds, including the Fund. The Transaction is subject to certain approvals and other conditions to closing, and is currently expected to close in the spring of 2010.
Administration Fee
Columbia provides administrative and other services to the Fund for a monthly administration fee at the annual rate of 0.067% of the Fund’s average daily net assets.
Pricing and Bookkeeping Fees
The Fund has entered into a Financial Reporting Services Agreement (the “Financial Reporting Services Agreement”) with State Street Bank & Trust Company (“State Street”) and Columbia pursuant to which State Street provides financial reporting services to the Fund. The Fund has also entered into an Accounting Services Agreement (collectively with the Financial Reporting Services Agreement, the “State Street Agreements”) with State Street and Columbia pursuant to which State Street provides accounting services to the Fund. Under the State Street Agreements, the Fund pays State Street an annual fee of $38,000 paid monthly plus an additional monthly fee based on an annualized percentage rate of average daily net assets of the Fund for the month. The aggregate fee will not exceed $140,000 per year (exclusive of out-of-pocket expenses and charges). The Fund also reimburses State Street for certain out-of-pocket expenses and charges.
The Fund has entered into a Pricing and Bookkeeping Oversight and Services Agreement (the “Services Agreement”) with Columbia. Under the Services Agreement, Columbia provides services related to Fund expenses and the requirements of the Sarbanes-Oxley Act of 2002, and provides oversight of the accounting and financial reporting services provided by State Street. Under the Services Agreement, the Fund reimburses Columbia for out-of-pocket expenses.
26
Columbia Dividend Income Fund
September 30, 2009
Transfer Agent Fee
Columbia Management Services, Inc. (the “Transfer Agent”), an affiliate of Columbia and an indirect, wholly owned subsidiary of BOA, provides shareholder services to the Fund and has contracted with Boston Financial Data Services (“BFDS”) to serve as sub-transfer agent. The Transfer Agent is entitled to receive a fee for its services, paid monthly, at the annual rate of $17.34 per open account plus reimbursement of certain sub-transfer agent fees paid by the Transfer Agent (exclusive of BFDS fees), calculated based on assets held in omnibus accounts and intended to recover the cost of payments to other parties (including affiliates of BOA) for services to those accounts. The Transfer Agent pays the fees of BFDS for services as sub-transfer agent and is not entitled to reimbursement for such fees from the Fund.
The Transfer Agent may also retain, as additional compensation for its services, fees for wire, telephone and redemption orders, Individual Retirement Account (“IRA”) trustee agent fees and account transcript fees due to the Transfer Agent from shareholders of the Fund and credits (net of bank charges) earned with respect to balances in accounts the Transfer Agent maintains in connection with its services to the Fund. The Transfer Agent also receives reimbursement for certain out-of-pocket expenses.
An annual minimum account balance fee of $20 may apply to certain accounts with a value below the Fund’s initial minimum investment requirements to reduce the impact of small accounts on transfer agent fees. These minimum account balance fees are recorded as part of expense reductions on the Statement of Operations. For the year ended September 30, 2009, no minimum account balance fees were charged by the Fund.
Underwriting Discounts, Service and Distribution Fees
Columbia Management Distributors, Inc. (the “Distributor”), an affiliate of Columbia and an indirect, wholly owned subsidiary of BOA, is the principal underwriter of the Fund’s shares. For the year ended September 30, 2009, the Distributor has retained net underwriting discounts of $124,635 and $930 on sales of the Fund’s Class A and Class T shares, respectively. For the same period, the Distributor received net CDSC fees of $687, $39,378 and $5,857 on Class A, Class B and Class C share redemptions, respectively.
The Fund has adopted plans pursuant to Rule 12b-1 under the 1940 Act (the “Plans”) which requires the payment of monthly distribution and service fees to the Distributor based on the average daily net assets of the applicable class of the Fund at the following annual rates:
| | | | | | |
| Distribution Fee |
| Class A | | Class B | | Class C | | Class R |
| 0.10% | | 0.75% | | 0.75% | | 0.50% |
| | | | |
| Service Fee |
| Class A | | Class B | | Class C |
| 0.25% | | 0.25% | | 0.25% |
The Fund may pay distribution and service fees up to a maximum annual rate of 0.35% of the Fund’s average daily net assets attributable to Class A shares (comprised of up to 0.10% for distribution services and up to 0.25% for shareholder services), but limited such fees to an aggregate of not more than 0.25% for Class A shares during the current fiscal year. For the year ended September 30, 2009, the distribution and service fees were 0.00% and 0.25%, respectively, of the Fund’s average daily net assets.
The CDSC and the distribution fees received from the Plans are used principally as repayment to the Distributor for amounts paid by the Distributor to dealers who sold such shares.
Shareholder Services Fees
The Fund has adopted a shareholder services plan that permits it to pay for certain services provided to Class T shareholders by service organizations. The Fund may pay shareholder services fees (which are included in other expenses) of up to 0.25% of the Fund’s average daily net assets attributable to Class T shares for shareholder liaison services and up to 0.25% of the Fund’s average daily net assets attributable to Class T shares for administrative support services, provided, however, that the aggregate fee shall not exceed 0.30% of the Fund’s average daily net assets attributable to Class T shares. For the year ended September 30, 2009, the shareholder services fee was 0.30% of the Fund’s average daily net assets attributable to Class T shares.
27
Columbia Dividend Income Fund
September 30, 2009
Fee Waivers and Expense Reimbursements
Effective February 1, 2009, Columbia has voluntarily agreed to reimburse a portion of the Fund’s expenses so that the Fund’s ordinary operating expenses (excluding any distribution and service fees, brokerage commissions, interest, taxes and extraordinary expenses, but including custodian charges relating to overdrafts, if any), after giving effect to any balance credits from the Fund’s custodian, do not exceed 0.80% of the Fund’s average daily net assets on an annualized basis. Columbia, in its discretion, may revise or discontinue this arrangement at any time. Prior to February 1, 2009, Columbia reimbursed a portion of the Fund’s expenses at the same fee rate, on a contractual basis.
Fees Paid to Officers and Trustees
All officers of the Fund are employees of Columbia or its affiliates and, with the exception of the Fund’s Chief Compliance Officer, receive no compensation from the Fund. The Board of Trustees has appointed a Chief Compliance Officer to the Fund in accordance with federal securities regulations. The Fund, along with other affiliated funds, pays its pro-rata share of the expenses associated with the Chief Compliance Officer. The Fund’s expenses for the Chief Compliance Officer will not exceed $15,000 per year.
The Trust’s eligible Trustees may participate in a deferred compensation plan which may be terminated at any time. Obligations of the plan will be paid solely out of the Fund’s assets.
Other Related Party Transactions
In connection with the purchase and sale of its securities during the period, the Fund used one or more brokers that are affiliates of BOA. Total brokerage commissions paid to affiliated brokers for the year ended September 30, 2009 were $11,520.
Note 5. Custody Credits
The Fund has an agreement with its custodian bank under which custody fees may be reduced by balance credits. These credits are recorded as part of expense reductions on the Statement of Operations. The Fund could have invested a portion of the assets utilized in connection with the expense offset arrangement in an income-producing asset if it had not entered into such an agreement.
For the year ended September 30, 2009, these custody credits reduced total expenses by $143 for the Fund.
Note 6. Portfolio Information
For the year ended September 30, 2009, the cost of purchases and proceeds from sales of securities, excluding short-term obligations, for the Fund were $929,376,679 and $276,378,634, respectively.
Note 7. Regulatory Settlements
As of September 30, 2009, the Fund had received payments of $665,701 relating to certain regulatory settlements with third parties that the Fund had participated in during the year. The payments have been included in “Increase from regulatory settlements” on the Statement of Changes in Net Assets.
Note 8. Line of Credit
The Fund and other affiliated funds participate in a $280,000,000 committed, unsecured revolving line of credit provided by State Street. The maximum amount that may be borrowed by any fund is limited to the lesser of $200,000,000 and the Fund’s borrowing limit set forth in the Fund’s registration statement. Borrowings are available for short-term liquidity or temporary or emergency purposes.
Interest is charged to each participating fund based on the fund’s borrowings at a rate per annum equal to the greater of the Federal Funds Rate plus 0.50% or the overnight LIBOR Rate plus 0.50%. In addition, an annual operations agency fee of $20,000, an amendment fee of 0.02% and a commitment fee of 0.12% per annum are accrued and apportioned among the participating funds pro rata based on their relative net assets. Prior to October 16, 2008, the Fund and other affiliated funds participated in a $350,000,000 committed, unsecured revolving line of credit and a $150,000,000 uncommitted, unsecured line of credit, both provided by State Street. Interest on the committed line of credit was charged to each participating fund based on the fund’s borrowings at a rate per annum equal to the Federal Funds Rate plus 0.50%. In addition, a commitment fee of 0.10% per annum was accrued and apportioned among the participating funds pro rata based on their relative net assets. Interest on the uncommitted line of credit was charged to each participating fund based on the fund’s borrowings at a rate per annum equal to the Federal Funds Rate plus 0.375%. State Street
28
Columbia Dividend Income Fund
September 30, 2009
charged an annual operations agency fee of $40,000 for the committed line of credit and was able to charge an annual administration fee of $15,000 for the uncommitted line of credit. The commitment fee, the operations agency fee and the administration fee were accrued and apportioned among the participating funds pro rata based on their relative net assets.
For the year ended September 30, 2009, the Fund did not borrow under these arrangements.
Note 9. Securities Lending
The Fund may lend its securities to certain approved brokers, dealers and other financial institutions. Each loan is collateralized by cash, in an amount at least equal to the market value of the securities loaned plus accrued income from the investment of collateral. The market value of the loaned securities is determined at the close of business of the Fund and any additional required collateral is delivered to the Fund on the next business day. The collateral received is invested and the income generated by the investment of the collateral, net of any fees remitted to State Street as the lending agent and borrower rebates, is paid to the Fund. Generally, in the event of borrower default, the Fund has the right to use the collateral to offset any losses incurred. In the event the Fund is delayed or prevented from exercising its right to dispose of the collateral, there may be a potential loss to the Fund. The Fund bears the risk of loss with respect to the investment of collateral.
Note 10. Shares of Beneficial Interest
As of September 30, 2009, 45.4% of the Fund’s shares outstanding were beneficially owned by one participant account over which BOA and/or any of its affiliates had either sole or joint investment discretion. On that date, no other shareholder owned more than 5% of the outstanding shares of the Fund.
As of September 30, 2009, the Fund had one shareholder that held 9.1% of the shares outstanding, over which BOA and/or any of its affiliates did not have investment discretion. On that date, no other shareholder owned more than 5% of the outstanding shares of the Fund.
Subscription and redemption activity of these accounts may have a significant effect on the operations of the Fund.
Note 11. Significant Risks and Contingencies
Legal Proceedings
Columbia Management Advisors, LLC and Columbia Management Distributors, Inc. (collectively, the “Columbia Group”) are subject to a settlement agreement with the New York Attorney General (“NYAG”) (the “NYAG Settlement”) and a settlement order with the SEC (the “SEC Order”) on matters relating to mutual fund trading, each dated February 9, 2005. Under the terms of the SEC Order, the Columbia Group (or predecessor entities) agreed, among other things, to: pay disgorgement and civil money penalties collectively totaling $140 million; cease and desist from violations of the antifraud provisions and certain other provisions of the federal securities laws; maintain certain compliance and ethics oversight structures; and retain an independent consultant to review the Columbia Group’s applicable supervisory, compliance, control and other policies and procedures. The NYAG Settlement, among other things, requires Columbia Management Advisors, LLC and its affiliates to reduce management fees for certain funds in the Columbia family of mutual funds in a projected total of $160 million over five years through November 30, 2009 and to make certain disclosures to investors relating to expenses. In connection with the Columbia Group providing services to the Columbia Funds, the Columbia Funds have voluntarily undertaken to implement certain governance measures designed to maintain the independence of their boards of trustees and certain special consulting and compliance measures.
Pursuant to the SEC Order and related procedures, the $140 million in settlement amounts described above has been substantially distributed in accordance with a distribution plan that was developed by an independent distribution consultant and approved by the SEC on April 6, 2007.
In connection with the events described above, various parties have filed suit against certain funds, the Trustees of the Columbia Funds, FleetBoston Financial Corporation and its affiliated entities and/or Bank of America and its affiliated entities.
On February 20, 2004, the Judicial Panel on Multidistrict Litigation transferred these cases and cases against other mutual fund companies based on similar allegations to the United States District Court in Maryland for consolidated or
29
Columbia Dividend Income Fund
September 30, 2009
coordinated pretrial proceedings (the “MDL”). Subsequently, additional related cases were transferred to the MDL. On September 29, 2004, the plaintiffs in the MDL filed amended and consolidated complaints. One of these amended complaints is a putative class action that includes claims under the federal securities laws and state common law, and that names Columbia Management Advisors, Inc. (which has since merged into Banc of America Capital Management, LLC (now named Columbia Management Advisors, LLC)) (“Columbia”), Columbia Funds Distributor, Inc. (now named Columbia Management Distributors, Inc.) (the “Distributor”), the Trustees of the Columbia Funds, Bank of America Corporation and others as defendants. Another of the amended complaints is a derivative action purportedly on behalf of the Columbia Funds that asserts claims under federal securities laws and state common law.
On February 25, 2005, Columbia and other defendants filed motions to dismiss the claims in the pending cases. On March 1, 2006, for reasons stated in the court’s memoranda dated November 3, 2005, the United States District Court for the District of Maryland granted in part and denied in part the defendants’ motions to dismiss. The court dismissed all of the class action claims pending against the Columbia Funds Trusts. As to Columbia and the Distributor, the claims under the Securities Act of 1933, the claims under Sections 34(b) and 36(a) of the Investment Company Act of 1940 (“ICA”) and the state law claims were dismissed. The claims under Sections 10(b) and 20(a) of the Securities Exchange Act of 1934 and claims under Section 36(b) of the ICA were not dismissed.
On March 21, 2005, a purported class action was filed in Massachusetts state court alleging that certain conduct, including market timing, entitled Class B shareholders in certain Columbia Funds to an exemption from contingent deferred sales charges upon early redemption (the “CDSC Lawsuit”). The CDSC Lawsuit was removed to federal court in Massachusetts and transferred to the MDL.
On September 14, 2007, the plaintiffs and the Columbia defendants named in the MDL, including the Columbia Funds, entered into a stipulation of settlement with respect to all Columbia-related claims in the MDL described above, including the CDSC Lawsuit. The settlement is subject to court approval.
Note 12. Business Combinations and Mergers
Effective March 28, 2008, Equity Income Fund, a series of Excelsior Funds Trust, merged into Columbia Dividend Income Fund. Columbia Dividend Income Fund received a tax-free transfer of assets from Equity Income Fund as follows:
| | | | |
| | | | | |
Shares
Issued | | Net Assets
Received | | Unrealized
Appreciation1 |
| 12,606,765 | | $168,959,491 | | $15,594,333 |
| 1 | Unrealized appreciation is included in the Net Assets Received. |
| | | | |
| | | | | |
Net Assets of
Columbia
Dividend
Income Fund
Prior to
Combination | | Net Assets of
Equity Income
Fund
Immediately
Prior to
Combination | | Net Assets of
Columbia
Dividend
Income Fund
Immediately After
Combination |
| $1,020,836,297 | | $168,959,491 | | $1,189,795,788 |
Note 13. Subsequent Events
On October 15, 2009, the committed line of credit discussed in Note 8 was renewed on amended terms. Pursuant to the amended terms, interest is charged to each participating fund based on the fund’s borrowings at a rate per annum equal to the greater of the Federal Funds Rate plus 1.25% or the overnight LIBOR Rate plus 1.25%. In addition, a commitment fee of 0.15% per annum is accrued and apportioned among the participating funds pro rata based on their relative net assets. The annual operations agency fee of $20,000 was waived.
Effective November 1, 2009, the annual rate the Transfer Agent receives for the services discussed in Note 4 will change to $22.36 per open account.
30
Report of Independent Registered Public Accounting Firm
To the Trustees of Columbia Funds Series Trust I and the Shareholders of Columbia Dividend Income Fund
In our opinion, the accompanying statement of assets and liabilities, including the investment portfolio, and the related statements of operations and of changes in net assets and the financial highlights present fairly, in all material respects, the financial position of Columbia Dividend Income Fund (the “Fund”) (a series of Columbia Funds Series Trust I) at September 30, 2009, the results of its operations for the year then ended, the changes in its net assets for each of the two years in the period then ended, and the financial highlights for each of the five years in the period then ended, in conformity with accounting principles generally accepted in the United States of America. These financial statements and financial highlights (hereafter referred to as “financial statements”) are the responsibility of the Fund’s management. Our responsibility is to express an opinion on these financial statements based on our audits. We conducted our audits of these financial statements in accordance with the standards of the Public Company Accounting Oversight Board (United States). Those standards require that we plan and perform the audit to obtain reasonable assurance about whether the financial statements are free of material misstatement. An audit includes examining, on a test basis, evidence supporting the amounts and disclosures in the financial statements, assessing the accounting principles used and significant estimates made by management, and evaluating the overall financial statement presentation. We believe that our audits, which included confirmation of securities at September 30, 2009 by correspondence with the custodian and brokers, provide a reasonable basis for our opinion.
PricewaterhouseCoopers LLP
Boston, Massachusetts
November 20, 2009
31
Federal Income Tax Information (Unaudited)
For non-corporate shareholders, 100.00%, or the maximum amount allowable under the Jobs and Growth Tax Relief Reconciliation Act of 2003, of the ordinary income distributed by the Fund for the fiscal year ended September 30, 2009 may represent qualified dividend income.
100.00% of the ordinary income distributed by the Fund, for the year ended September 30, 2009, qualifies for the corporate dividends received deduction.
The Fund will notify shareholders in January 2010, of amounts for use in preparing 2009 income tax returns.
32
Fund Governance – Columbia Dividend Income Fund
The Trustees serve terms of indefinite duration. The names, addresses and ages of the Trustees and Officers of the Funds in the Columbia Funds Complex, the year each was first elected or appointed to office, their principal business occupations during at least the last five years, the number of Funds overseen by each Trustee and other directorships they hold are shown below. Each officer listed below serves as an officer of each Fund in the Columbia Funds Complex.
Independent Trustees
| | |
Name, Address and Year of
Birth, Position with Funds, Year
First Elected or Appointed to Office | | Principal Occupation(s) During Past Five Years, Number of Funds in the
Columbia Funds Complex Overseen by Trustee, Other Directorships Held |
| |
| John D. Collins (Born 1938) | | |
c/o Columbia Management Advisors, LLC One Financial Center Boston, MA 02111 Trustee (since 2007) | | Retired. Consultant, KPMG, LLP (accounting and tax firm) from July 1999 to June 2000; Partner, KPMG, LLP from March 1962 to June 1999. Oversees 66, Mrs. Fields Famous Brands LLC (consumer products); Suburban Propane Partners, L.P.; and Montpelier Re (insurance underwriting firm) |
| |
| Rodman L. Drake (Born 1943) | | |
c/o Columbia Management Advisors, LLC One Financial Center Boston, MA 02111 Trustee (since 2007) and Chairman of the Board (since 2009) | | Co-Founder of Baringo Capital LLC (private equity) since 2002; President, Continuation Investments Group, Inc. from 1997 to 2001. Oversees 66, Jackson Hewitt Tax Service Inc. (tax preparation services); Crystal Capital River Inc. (real estate investment trust); Student Loan Corporation (student loan provider); Celgene Corporation (global biotechnology company); and The Helios Funds (exchange-traded funds) |
| |
| Douglas A. Hacker (Born 1955) | | |
c/o Columbia Management Advisors, LLC One Financial Center Boston, MA 02111 Trustee (since 1996) | | Independent business executive since May 2006; Executive Vice President–Strategy of United Airlines (airline) from December 2002 to May 2006; President of UAL Loyalty Services (airline marketing company) from September 2001 to December 2002; Executive Vice President and Chief Financial Officer of United Airlines from July 1999 to September 2001. Oversees 66, Nash Finch Company (food distributor); Aircastle Limited (aircraft leasing) |
|
| Janet Langford Kelly (Born 1957) |
c/o Columbia Management Advisors, LLC One Financial Center Boston, MA 02111 Trustee (since 1996) | | Senior Vice President, General Counsel and Corporate Secretary, ConocoPhillips (integrated energy company) since September 2007; Deputy General Counsel–Corporate Legal Services, ConocoPhillips from August 2006 to August 2007; Partner, Zelle, Hofmann, Voelbel, Mason & Gette LLP (law firm) from March 2005 to July 2006; Adjunct Professor of Law, Northwestern University, from September 2004 to June 2006; Director, UAL Corporation (airline) from February 2006 to July 2006; Oversees 66, None |
| |
| Charles R. Nelson (Born 1942) | | |
c/o Columbia Management Advisors, LLC One Financial Center Boston, MA 02111 Trustee (since 1981) | | Professor of Economics, University of Washington, since January 1976; Ford and Louisa Van Voorhis Professor of Political Economy, University of Washington, since September 1993; Adjunct Professor of Statistics, University of Washington, since September 1980; Associate Editor, Journal of Money Credit and Banking, 1993-2008 Consultant on econometric and statistical matters. Oversees 66, None |
33
Fund Governance (continued) – Columbia Dividend Income Fund
Independent Trustees (continued)
| | |
Name, Address and Year of
Birth, Position with Funds, Year
First Elected or Appointed to Office | | Principal Occupation(s) During Past Five Years, Number of Funds in the
Columbia Funds Complex Overseen by Trustee, Other Directorships Held |
| |
| John J. Neuhauser (Born 1943) | | |
c/o Columbia Management Advisors, LLC One Financial Center Boston, MA 02111 Trustee (since 1985) | | President, Saint Michael’s College, since August 2007; University Professor, Boston College from November 2005 to August 2007; Academic Vice President and Dean of Faculties, Boston College from August 1999 to October 2005. Oversees 66, Liberty All-Star Equity Fund and Liberty All-Star Growth Fund, Inc. (closed-end funds) |
| |
| Jonathan Piel (Born 1938) | | |
c/o Columbia Management Advisors, LLC One Financial Center Boston, MA 02111 Trustee (since 2007) | | Cable television producer and website designer; The Editor, Scientific American from 1984 to 1994; Vice President, Scientific American, Inc., from 1984 to 1994; Member, Advisory Board, Stone Age Institute, Bloomington, Indiana (research institute that explores the effect of technology on human evolution); Member, Board of Directors of the National Institute of Social Sciences, New York City; Member, Board of Trustees of the William Alanson White Institute, New York City (institution for training psychoanalysts); and Member, Advisory Board, Mount Sinai Children’s Environmental Health Center, New York. Oversees 66, None |
| |
| Patrick J. Simpson (Born 1944) | | |
c/o Columbia Management Advisors, LLC One Financial Center Boston, MA 02111 Trustee (since 2000) | | Partner, Perkins Coie LLP (law firm). Oversees 66, None |
|
| Thomas C. Theobald (Born 1937) |
c/o Columbia Management Advisors, LLC One Financial Center Boston, MA 02111 Trustee (since 1996) | | Partner and Senior Advisor, Chicago Growth Partners (private equity investing) since September 2004; Managing Director, William Blair Capital Partners (private equity investing) from September 1994 to September 2004. Oversees 66, Anixter International (network support equipment distributor); Ventas, Inc. (real estate investment trust); Jones Lang LaSalle (real estate management services); Ambac Financial Group (financial guaranty insurance) |
| |
| Anne-Lee Verville (Born 1945) | | |
c/o Columbia Management Advisors, LLC One Financial Center Boston, MA 02111 Trustee (since 1998) | | Retired since 1997 (formerly General Manager–Global Education Industry (from 1994 to 1997), President–Application Systems Division (from 1991 to 1994), Chief Financial Officer–US Marketing & Services (from 1988 to 1991), and Chief Information Officer (from 1987 to 1988), IBM Corporation (computer and technology)). Oversees 66, None |
34
Fund Governance (continued) – Columbia Dividend Income Fund
Interested Trustee
| | |
| |
| William E. Mayer1 (Born 1940) | | |
c/o Columbia Management Advisors, LLC One Financial Center Boston, MA 02111 Trustee (since 1994) | | Partner, Park Avenue Equity Partners (private equity) since February 1999; Dean and Professor, College of Business, University of Maryland from 1992 to 1997. Oversees 66, Lee Enterprises (print media), WR Hambrecht + Co. (financial service provider); BlackRock Kelso Capital Corporation (investment company) |
| 1 | The Funds currently treat Mr. Mayer as an “interested person” (as defined in the Investment Company Act of 1940) by reason of his affiliation with WR Hambrecht + Co., a registered broker/dealer that may execute portfolio transactions for or engage in principal transactions with the Funds or other funds or accounts advised/managed by the Advisor or other Bank of America affiliates. |
The Statement of Additional Information includes additional information about the Trustees of the Funds and is available, without charge, upon request by calling 1-800-345-6611.
35
Fund Governance (continued) – Columbia Dividend Income Fund
Officers
| | |
Name, Address and Year of Birth,
Position with Funds, Year First
Elected or Appointed to Office | | Principal Occupation(s) During Past Five Years |
|
| J. Kevin Connaughton (Born 1964) |
One Financial Center Boston, MA 02111 President (since 2009) | | Managing Director of Columbia Management Advisors, LLC since December 2004; Senior Vice President and Chief Financial Officer–Columbia Funds, from June 2008 to January 2009; Treasurer–Columbia Funds, from October 2003 to May 2008; Treasurer–the Liberty Funds, Stein Roe Funds and Liberty All-Star Funds, December 2000–December 2006; Senior Vice President–Columbia Management Advisors, LLC, from April 2003 to December 2004; President–Columbia Funds, Liberty Funds and Stein Roe Funds, February 2004 to October 2004; Treasurer–Galaxy Funds, September 2002 to December 2005; Treasurer, December 2002 to December 2004, and President, February 2004 to December 2004–Columbia Management Multi-Strategy Hedge Fund, LLC; and a senior officer of various other Bank of America-affiliated entities, including other registered and unregistered funds. |
|
| James R. Bordewick, Jr. (Born 1959) |
One Financial Center Boston, MA 02111 Senior Vice President, Secretary and Chief Legal Officer (since 2006) | | Associate General Counsel, Bank of America since April 2005; Senior Vice President and Associate General Counsel, MFS Investment Management (investment management) prior to April 2005. |
| |
| Linda J. Wondrack (Born 1964) | | |
One Financial Center Boston, MA 02111 Senior Vice President and Chief Compliance Officer (since 2007) | | Director (Columbia Management Group LLC and Investment Product Group Compliance), Bank of America since June 2005; Director of Corporate Compliance and Conflicts Officer, MFS Investment Management (investment management), August 2004 to May 2005; Managing Director, Deutsche Asset Management (investment management) prior to August 2004. |
| |
| Michael G. Clarke (Born 1969) | | |
One Financial Center Boston, MA 02111 Senior Vice President and Chief Financial Officer (since 2009) | | Director of Fund Administration of the Advisor since January 2006; Managing Director of the Advisor September 2004 to December 2005; Vice President Fund Administration June 2002 to September 2004. |
| |
| Jeffrey R. Coleman (Born 1969) | | |
One Financial Center Boston, MA 02111 Deputy Treasurer (since 2006) | | Director of Fund Administration of the Advisor since January 2006; Fund Controller of the Advisor from October 2004 to January 2006; Vice President of CDC IXIS Asset Management Services, Inc. (investment management) from August 2000 to September 2004. |
| |
| Joseph F. DiMaria (Born 1968) | | |
One Financial Center Boston, MA 02111 Chief Accounting Officer and Treasurer (since 2009) | | Director of Fund Administration of the Advisor since January 2006; Head of Tax/Compliance and Assistant Treasurer of the Advisor from November 2004 to December 2005; Director of Trustee Administration (Sarbanes-Oxley) of the Advisor from May 2003 to October 2004. |
36
Fund Governance (continued) – Columbia Dividend Income Fund
Officers (continued)
| | |
Name, Address and Year of Birth,
Position with Funds, Year First
Elected or Appointed to Office | | Principal Occupation(s) During Past Five Years |
| |
| Julian Quero (Born 1967) | | |
One Financial Center Boston, MA 02111 Deputy Treasurer (since 2008) | | Senior Tax Manager of the Advisor since August 2006; Senior Compliance Manager of the Advisor from April 2002 to August 2006. |
| |
| Barry S. Vallan (Born 1969) | | |
One Financial Center Boston, MA 02111 Controller (since 2006) | | Vice President–Fund Treasury of the Advisor since October 2004; Vice President–Trustee Reporting of the Advisor from April 2002 to October 2004. |
| |
| Stephen T. Welsh (Born 1957) | | |
One Financial Center Boston, MA 02111 Vice President (since 1996) | | President, Columbia Management Services, Inc. since July 2004; Senior Vice President and Controller, Columbia Management Services, Inc. prior to July 2004. |
37
[THIS PAGE INTENTIONALLY LEFT BLANK]
38
[THIS PAGE INTENTIONALLY LEFT BLANK]
39
[THIS PAGE INTENTIONALLY LEFT BLANK]
40
Important Information About This Report
Transfer Agent
Columbia Management Services, Inc.
P.O. Box 8081
Boston, MA 02266-8081
1-800-345-6611
Distributor
Columbia Management
Distributors, Inc.
One Financial Center
Boston, MA 02111
Investment Advisor
Columbia Management Advisors, LLC
100 Federal Street
Boston, MA 02110
The fund mails one shareholder report to each shareholder address. If you would like more than one report, please call shareholder services at 1-800-345-6611 and additional reports will be sent to you. This report has been prepared for shareholders of Columbia Dividend Income Fund.
A description of the policies and procedures that the fund uses to determine how to vote proxies and a copy of the fund’s voting records are available (i) at www.columbiamanagement.com, (ii) on the Securities and Exchange Commission’s website at www.sec.gov, and (iii) without charge, upon request, by calling 1-800-368-0346. Information regarding how the fund voted proxies relating to portfolio securities during the 12-month period ended June 30 is available from the SEC’s website. Information regarding how the fund voted proxies relating to portfolio securities is also available from the fund’s website, www.columbiamanagement.com.
The fund files a complete schedule of portfolio holdings with the SEC for the first and third quarters of each fiscal year on Form N-Q. The fund’s Form N-Q is available on the SEC’s website at www.sec.gov and may be reviewed and copied at the SEC’s Public Reference Room in Washington, D.C. Information on the operation of the Public Reference Room may be obtained by calling 1-800-SEC-0330.
Please read and consider the investment objectives, risks, charges and expenses for any fund carefully before investing. For a prospectus which contains this and other important information about the fund, contact your Columbia Management representative or financial advisor or go to www.columbiamanagement.com.
Columbia Management Group, LLC (“Columbia Management”) is the investment management division of Bank of America Corporation. Columbia Management entities furnish investment management services and products for institutional and individual investors. Columbia Funds are distributed by Columbia Management Distributors, Inc., member of FINRA, SIPC, part of Columbia Management and an affiliate of Bank of America Corporation.
41

One Financial Center
Boston, MA 02111-2621
Columbia Dividend Income Fund
Annual Report, September 30, 2009
©2009 Columbia Management Distributors, Inc.
One Financial Center, Boston, MA 02111-2621
800.345.6611 www.columbiafunds.com
SHC-42/24706-0909 (11/09) 09/94815

Annual Report
September 30, 2009
Columbia Liberty Fund
| | |
| NOT FDIC INSURED | | May Lose Value |
| NOT BANK ISSUED | | No Bank Guarantee |
Table of contents
The views expressed in this report reflect the current views of the respective parties. These views are not guarantees of future performance and involve certain risks, uncertainties and assumptions that are difficult to predict, so actual outcomes and results may differ significantly from the views expressed. These views are subject to change at any time based upon economic, market or other conditions and the respective parties disclaim any responsibility to update such views. These views may not be relied on as investment advice and, because investment decisions for a Columbia Fund are based on numerous factors, may not be relied on as an indication of trading intent on behalf of any particular Columbia Fund. References to specific securities should not be construed as a recommendation or investment advice.
President’s Message

Dear Shareholder:
We are pleased to provide this shareholder report detailing your fund’s performance, portfolio holdings and financial statements. We hope this information is helpful in monitoring your investments as we work through these challenging economic times. We recognize that you have entrusted us with your money and want you to know that our professional investment teams work to interpret the latest economic and market trends with the goal of optimizing portfolio construction for our clients.
The first half of 2009 was defined by extremes. The multiyear lows we witnessed in the early months gave way to a stunning rally for the U.S. financial markets in the spring. A global market rebound may be underway, thanks to the massive fiscal and aggressive monetary policies of governments around the world. In the third quarter, the S&P 500 Index1 was up 15.61%. We believe this challenging economic environment makes it even more important to work with professional money managers while continuing to invest for life events like retirement, college planning, home improvements and career changes.
Retirement income planning has become an increasingly significant focus in the lives of millions of Americans. Recent economic conditions make it even more important to manage short-term obligations such as mortgages, monthly bills and credit card debt while also taking the steps necessary to prepare for or maximize retirement benefits. Better nutrition and medical services can result in U.S. citizens living longer, healthier lives. This means the risk of outliving one’s assets in retirement is very real without proper planning. Financial security and retirement planning is an ongoing process that requires active management of your savings, investments and risks. We encourage you to review your retirement plan regularly so you’ll be better able to meet your retirement needs in the future.
We recognize that economic uncertainty creates great challenges for many investors. Our professional investment teams work diligently to help investors navigate through difficult markets. Thank you for your business and for the opportunity to work together towards your investment goals.
Sincerely,

J. Kevin Connaughton
President, Columbia Funds
On September 29, 2009, Bank of America Corporation entered into an agreement to sell a portion of the asset management business of Columbia Management Group, LLC. Please see Note 4 of the Notes to Financial Statements for additional information.
| 1 | The Standard & Poor’s (S&P) 500 Index tracks the performance of 500 widely held, large-capitalization U.S. stocks. Indices are not available for investment, are not professionally managed and do not reflect sales charges, fees, brokerage commissions, taxes or other expenses of investing. Securities in the fund may not match those in an index. |
Past performance is no guarantee of future results.
Fund Profile – Columbia Liberty Fund
Performance data quoted represents past performance and current performance may be lower or higher. Past performance is no guarantee of future results. The investment return and principal value will fluctuate so that shares, when redeemed, may be worth more or less than the original cost. Please visit www.columbiafunds.com for daily and most recent month-end performance updates.
Summary
1-year return as of 09/30/09
| | |
| |
 | | +1.07% Class A shares (without sales charge) |
| |
 | | –6.91% S&P 500 Index2 |
| |
| | +10.56% Barclays Capital Aggregate Bond Index3 |
Summary
| n | | For the 12-month period that ended September 30, 2009, the fund’s Class A shares returned 1.07% without sales charge. |
| n | | In a period of sharp turnaround in the financial markets, the fund’s return was slightly ahead of its peer group, the Lipper Mixed Asset Target Allocation Growth Funds Classification.1 |
| n | | A shift from a slight overweight in equities to a slight overweight in fixed income benefited performance versus the peer group. |
Portfolio Management
Anwiti Bahuguna, PhD, has co-managed the fund since 2009 and has been associated with the advisor or its predecessors since 2002.
Colin Moore has co-managed the fund since 2008 and has been associated with the advisor or its predecessors since 2002.
Kent M. Peterson, PhD has co-managed the fund since 2009 and has been associated with the advisor or its predecessors since 2006.
Marie M. Schofield has co-managed the fund since 2009 and has been associated with the advisor or its predecessors since 1990.
| 1 | Lipper Inc., a widely respected data provider in the industry, calculates an average total return (assuming reinvestment of distributions) for mutual funds with investment objectives similar to those of the fund. Lipper makes no adjustment for the effect of sales loads. |
| 2 | The Standard & Poor’s (S&P) 500 Index tracks the performance of 500 widely held, large-capitalization U.S. stocks. |
| 3 | The Barclays Capital Aggregate Bond Index is a market value-weighted index that tracks the daily price, coupon, pay-downs, and total return performance of fixed-rate, publicly placed, dollar-denominated, and non-convertible investment grade debt issues with at least $250 million par amount outstanding and with at least one year to final maturity. |
Indices are not available for investment, are not professionally managed and do not reflect sales charges, fees, brokerage commissions, taxes or other expenses of investing. Securities in the fund may not match those in an index.
1
Economic Update – Columbia Liberty Fund
Summary
For the 12-month period that ended September 30, 2009
| | n | | Domestic stocks lost ground, as measured by the S&P 500 Index, but cut their losses in a rebound that began half way through the period. International stocks moved higher, as measured by the MSCI EAFE Index. | |
| | |
| S&P Index | | MSCI Index |
| |

| | 
|
-6.91% | | 3.23% |
| | n | | As investors appeared to exhibit more tolerance for risk, the Barclays Capital Aggregate Bond Index delivered solid results. High-yield bonds rebounded strongly, as measured by the JPMorgan Developed BB High Yield Index. | |
| | |
| Barclays Aggregate Index | | JPMorgan Index |
| |
| |
|
10.56% | | 16.36% |
During the 12-month period that began October 1, 2008 and ended September 30, 2009, the U.S. economy faced the worst financial crisis since the Great Depression, then steadied itself as steps taken by a new administration began to show results in the second half of the period. Economic growth, as measured by Gross Domestic Product (GDP), contracted by approximately 6% between October 2008 and March 2009. The lapse from growth resulted in the longest – and most severe – recession in nearly three decades. However, growth turned positive in the third quarter ended September 30, 2009. The initial estimate of third quarter GDP was 3.5%.
The labor market shed more than seven million jobs between 2008 and 2009, raising the unemployment rate to 9.8% and wiping out all of the jobs gained since the last recession. Manufacturing activity slowed through most of the period, but it turned up in July and August, as did consumer spending. The beleaguered housing market showed some signs of stabilizing. Pending home sales, a leading indicator of housing activity increased for eight straight months to end the period, buoyed by low interest rates and an $8,000 first-time homebuyer tax credit. Existing home sales rose, but gave back some of their strong gains late in the period. The inventory of unsold houses also fell sharply over the period. Late in 2008, consumer confidence, as measured by the Conference Board1, plummeted to its lowest point ever. However, it has since stabilized and turned higher near the end of the period.
Troubles that began in the U.S. subprime mortgage market resulted in a meltdown within the U.S. financial sector that claimed several major institutions in 2008 and led others to seek bailouts, restructuring or both. New rigorous lending standards severely limited access to credit, further hampering economic growth. In this environment, a new administration sought to stabilize the financial system, address economic woes and introduce sweeping health care reform. Stimulus spending began to flow into the economy, raising hopes that growth would be restored. In December 2008, the Federal Reserve Board (the Fed) lowered a key short-term borrowing rate — the federal funds rate — to between zero and 0.25% — a record low. In light of protracted economic weakness and virtually no inflation, the Fed made no further change to the federal funds rate during the period.
Stocks retreated, then rebounded
Against a weakening economic backdrop, the U.S. stock market lost 6.91% for the 12-month period, as measured by the S&P 500® Index.2 Losses affected the stocks of companies of all sizes and investment style categories, as measured by their respective Russell indices.3 Stock markets outside the U.S. were modestly to significantly higher. The MSCI EAFE Index,4 a broad gauge of stock market performance in foreign developed markets, gained 3.23% (in U.S. dollars) for the period. Emerging stock markets were also caught in the downdraft, but bounced back stronger than domestic or developed world markets in 2009. The MSCI Emerging Markets Index5 returned 19.07% (in U.S. dollars).
2
Economic Update (continued) – Columbia Liberty Fund
Bonds outperformed domestic stocks
As investors sought refuge from a volatile stock market, the highest-quality sectors of the U.S. bond market delivered solid gains. During the first half of the period, Treasury prices rose and yields declined sharply as the economy faltered and stock market volatility increased. As hopes for a recovery materialized in the second half of the period, yields rose and Treasuries lagged riskier segments of the bond market. The benchmark 10-year U.S. Treasury yield began the period at 3.8%, declined to 2.2% in December 2008, then rose to end the period at 3.3%. In this environment, the Barclays Capital Aggregate Bond Index6 returned 10.56%. High-yield bond prices fell sharply in 2008 as economic prospects weakened and default fears rose, then rebounded strongly in 2009. For the 12-month period, the JPMorgan Developed BB High Yield Index7 returned 16.36%.
Past performance is no guarantee of future results.
| 1 | The Conference Board is a not-for-profit global independent membership organization. It conducts research, convenes conferences, makes forecasts, assesses trends and publishes information and analysis. |
| 2 | The Standard & Poor’s (S&P) 500 Index tracks the performance of 500 widely held, large-capitalization U.S. stocks. |
| 3 | The Russell 1000 Index tracks the performance of 1,000 of the largest U.S. companies, based on market capitalization. The Russell Midcap Index measures the performance of the 800 smallest companies in the Russell 1000 Index, which represents approximately 25% of the total market capitalization of the Russell 1000 Index. The Russell 2000 Index measures the performance of the 2,000 smallest companies in the Russell 3000 Index, which represents approximately 8% of the total market capitalization of the Russell 3000 Index. |
| 4 | The Morgan Stanley Capital International Europe, Australasia, Far East (MSCI EAFE) Index is a capitalization-weighted index that tracks the total return of common stocks in 21 developed-market countries within Europe, Australasia and the Far East. |
| 5 | The Morgan Stanley Capital International Emerging Markets Index (MSCI EMI) is a free float-adjusted market capitalization index that is designed to measure equity market performance in the global emerging markets. As of June 2006, the MSCI Emerging Markets Index consisted of the following 25 emerging market country indices: Argentina, Brazil, Chile, China, Colombia, Czech Republic, Egypt, Hungary, India, Indonesia, Israel, Jordan, Korea, Malaysia, Mexico, Morocco, Pakistan, Peru, Philippines, Poland, Russia, South Africa, Taiwan, Thailand and Turkey. |
| 6 | The Barclays Capital Aggregate Bond Index (formerly the Lehman Brothers Aggregate Bond Index) is a market value-weighted index that tracks the daily price, coupon, pay-downs and total return performance of fixed-rate, publicly placed, dollar-denominated and non-convertible investment grade debt issues with at least $250 million par amount outstanding and with at least one year to final maturity. |
| 7 | The JPMorgan Developed BB High Yield Index is an unmanaged index designed to mirror the investable universe of the U.S. dollar developed, BB-rated, high yield corporate debt market. |
Indices are not available for investment, are not professionally managed and do not reflect sales charges, fees, brokerage commissions, taxes or other expenses of investing. Securities in the fund may not match those in an index.
Effective November 3, 2008, the Lehman Brothers indices were renamed the Barclays Capital indices.
3
Performance Information – Columbia Liberty Fund
Performance data quoted represents past performance and current performance may be lower or higher. Past performance is no guarantee of future results. The investment return and principal value will fluctuate so that shares, when redeemed, may be worth more or less than the original cost. Please visit www.columbiafunds.com for daily and most recent month-end performance updates.
| | |
| Annual operating expense ratio (%)* |
| |
Class A | | 1.05 |
Class B | | 1.80 |
Class C | | 1.80 |
Class Z | | 0.81 |
| * | The annual operating expense ratio is as stated in the fund’s prospectus that is current as of the date of this report. Differences in expense ratios disclosed elsewhere in this report may result from including fee waivers and expense reimbursement as well as different time periods used in calculating the ratios. |
|
| Performance of a $10,000 investment 10/01/99 – 09/30/09 |
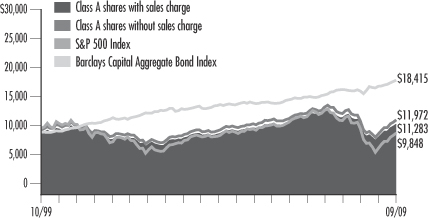
The chart above shows the change in value of a hypothetical $10,000 investment in Class A shares of Columbia Liberty Fund during the stated time period, and does not reflect the deduction of taxes that a shareholder may pay on fund distributions or on the redemption of fund shares.
| | | | |
| Performance of a $10,000 investment 10/01/99 – 09/30/09 ($) |
| | |
| Sales charge | | without | | with |
Class A | | 11,972 | | 11,283 |
Class B | | 11,099 | | 11,099 |
Class C | | 11,089 | | 11,089 |
Class Z | | 12,261 | | n/a |
| | | | | | | | | | | | | | |
| Average annual total return as of 09/30/09 (%) |
| | | | |
| Share class | | A | | B | | C | | Z |
| Inception | | 04/30/82 | | 05/05/92 | | 08/01/97 | | 07/31/95 |
| Sales charge | | without | | with | | without | | with | | without | | with | | without |
1-year | | 1.07 | | –4.74 | | 0.32 | | –4.61 | | 0.33 | | –0.66 | | 1.35 |
5-year | | 3.21 | | 2.00 | | 2.41 | | 2.08 | | 2.42 | | 2.42 | | 3.45 |
10-year | | 1.82 | | 1.21 | | 1.05 | | 1.05 | | 1.04 | | 1.04 | | 2.06 |
The “with sales charge” returns include the maximum initial sales charge of 5.75% for Class A shares and the applicable contingent deferred sales charge of 5.00% in the first year, declining to 1.00% in the sixth year and eliminated thereafter for Class B shares and 1.00% for Class C shares for the first year only. The “without sales charge” returns do not include the effect of sales charges. If they had, returns would be lower.
Performance results reflect any fee waivers or reimbursements of fund expenses by the investment advisor and/or any of its affiliates. Absent these fee waivers or expense reimbursement arrangements, performance results would have been lower.
All results shown assume reinvestment of distributions. Class Z shares are sold at net asset value with no distribution and service (Rule 12b-1) fees. Class Z shares have limited eligibility and the investment minimum requirements may vary. Please see the fund’s prospectus for details. Performance for different share classes will vary based on differences in sales charges and fees associated with each class.
The tables do not reflect the deduction of taxes that a shareholder may pay on fund distributions or on the redemption of fund shares.
4
Understanding Your Expenses – Columbia Liberty Fund
Estimating your actual expenses
To estimate the expenses that you paid over the period, first you will need your account balance at the end of the period:
| | n | | For shareholders who receive their account statements from Columbia Management Services, Inc., your account balance is available online at www.columbiafunds.com or by calling Shareholder Services at 800.345.6611. | |
| | n | | For shareholders who receive their account statements from their financial intermediary, contact your financial intermediary to obtain your account balance. | |
| | 1. | Divide your ending account balance by $1,000. For example, if an account balance was $8,600 at the end of the period, the result would be 8.6. | |
| | 2. | In the section of the table below titled “Expenses paid during the period,” locate the amount for your share class. You will find this number in the column labeled “Actual.” Multiply this number by the result from step 1. Your answer is an estimate of the expenses you paid on your account during the period. | |
If the value of your account falls below the minimum initial investment requirement applicable to you, your account generally will be subject to a $20 annual fee. This fee is not included in the accompanying table. If you are subject to the fee, keep it in mind when you are estimating the ongoing expenses of investing in the fund and when comparing the expenses of this fund with other funds.
As a fund shareholder, you incur two types of costs. There are transaction costs, which generally include sales charges on purchases and may include redemption fees or exchange fees. There are also ongoing costs, which generally include investment advisory fees, distribution and service (Rule 12b-1) fees and other fund expenses. The information on this page is intended to help you understand the ongoing costs of investing in the fund and to compare these costs with the ongoing costs of investing in other mutual funds.
Analyzing your fund’s expenses by share class
To illustrate these ongoing costs, we have provided an example and calculated the expenses paid by investors in each share class during the period. The information in the following table is based on an initial investment of $1,000, which is invested at the beginning of the period and held for the entire period. Expense information is calculated two ways and each method provides you with different information. The amount listed in the “Actual” column is calculated using the fund’s actual operating expenses and total return for the period. The amount listed in the “Hypothetical” column for each share class assumes that the return each year is 5% before expenses and is calculated based on the fund’s actual operating expenses. You should not use the hypothetical account values and expenses to estimate either your actual account balance at the end of the period or the expenses you paid during this period.
Compare with other funds
Since all mutual funds are required to include the same hypothetical calculations about expenses in shareholder reports, you can use this information to compare the ongoing costs of investing in the fund with other funds. To do so, compare the 5% hypothetical example with the 5% hypothetical examples that appear in the shareholder reports of other funds. As you compare hypothetical examples of other funds, it is important to note that hypothetical examples are meant to highlight the ongoing costs of investing in a fund and do not reflect any transaction costs, such as sales charges, redemption fees or exchange fees.
| | | | | | | | | | | | | | |
| 04/01/09 – 09/30/09 |
| | | | |
| | | Account value at the
beginning of the period ($) | | Account value at the
end of the period ($) | | Expenses paid
during the period ($) | | Fund’s annualized
expense ratio (%) |
| | | Actual | | Hypothetical | | Actual | | Hypothetical | | Actual | | Hypothetical | | Actual |
Class A | | 1,000.00 | | 1,000.00 | | 1,236.50 | | 1,019.20 | | 6.56 | | 5.92 | | 1.17 |
Class B | | 1,000.00 | | 1,000.00 | | 1,232.99 | | 1,015.44 | | 10.75 | | 9.70 | | 1.92 |
Class C | | 1,000.00 | | 1,000.00 | | 1,231.58 | | 1,015.44 | | 10.74 | | 9.70 | | 1.92 |
Class Z | | 1,000.00 | | 1,000.00 | | 1,239.20 | | 1,020.41 | | 5.22 | | 4.71 | | 0.93 |
Expenses paid during the period are equal to the annualized expense ratio for the share class, multiplied by the average account value over the period, then multiplied by the number of days in the fund’s most recent fiscal half-year and divided by 365.
It is important to note that the expense amounts shown in the table are meant to highlight only ongoing costs of investing in the fund and do not reflect any transaction costs, such as sales charges, redemption fees or exchange fees. Therefore, the hypothetical examples provided may not help you determine the relative total costs of owning shares of different funds. If these transaction costs were included, your costs would have been higher.
5
Portfolio Managers’ Report – Columbia Liberty Fund
Performance data quoted represents past performance and current performance may be lower or higher. Past performance is no guarantee of future results. The investment return and principal value will fluctuate so that shares, when redeemed, may be worth more or less than the original cost. Please visit www.columbiafunds.com for daily and most recent month-end performance updates.
| | |
| Net asset value per share |
|
as of 09/30/09 ($) |
Class A | | 7.05 |
Class B | | 7.08 |
Class C | | 7.06 |
Class Z | | 7.59 |
| | |
| Distributions declared per share |
|
10/01/08 – 09/30/09 ($) |
Class A | | 0.15 |
Class B | | 0.11 |
Class C | | 0.11 |
Class Z | | 0.17 |
For the 12-month period that ended September 30, 2009, the fund’s Class A shares returned 1.07% without sales charge. The fund’s equity benchmark, the S&P 500 Index1, returned negative 6.91% and the fund’s fixed-income benchmark, the Barclays Capital Aggregate Bond Index2 returned 10.56%. The fund outperformed its peer group, the Lipper Mixed-Asset Target Allocation Growth Funds Classification, which averaged a return of 0.73%. Performance benefited from our decision to shift from a slight overweight in equities to a slight overweight in fixed income. In addition, the fund’s fixed-income holdings outperformed the Barclays index.
Stock and bond markets turned around
The investment market rout that began in the fall of 2008 continued into March 2009, driven by deteriorating global economic data, concerns over the strength of large financial company balance sheets, frozen credit markets, a weak housing market and rising unemployment. In March, stocks finally staged a sharp turnaround, buoyed by hopes that an economic recovery would be fueled by unprecedented fiscal and monetary stimulus. Bonds also rallied, benefiting from historically low interest rates and a growing sense of confidence among investors. Higher-risk sectors, including emerging-markets stocks and high-yield bonds, led the rebound, but investment-grade corporate bonds also did well. U.S. Treasuries ended the period behind most other bond sectors. Fixed-income returns for the period were quite strong, while equities — despite recouping a large part of their previous losses — still remained in negative territory.
Strength from corporate bond sector
During the period, we increased the fund’s allocation to fixed income, which worked well as bonds ended the period with much stronger returns than stocks. By period end, about 41% of the fund’s assets were in bonds, compared to 36% at the start of the period. We remained focused on investment-grade corporate bonds, whose prices climbed as the economic outlook improved and investors gained more confidence in issuer balance sheets.
Reduced stake in large-cap stocks
Over the period, we trimmed the fund’s stake in stocks to about 46% of assets at period end. Our focus was on large-cap stocks, which held up well relative to their smaller-cap counterparts. The fund’s holdings were equally divided between the value and growth disciplines. Within the large cap sector, growth stocks — which investors buy because of their strong potential for earnings growth — did much better than value stocks, which attract investors because their prices are cheap relative to their earnings. The fund’s position in large-cap growth stocks lost slightly more than its equity benchmark, the Russell 1000 Growth Index.3 However, the fund’s large-cap value holdings held up better than the Russell 1000 Value Index.4 Approximately 10% of assets were invested in overseas developed markets, which outperformed U.S. stocks with a small net gain for the year, as measured by the MSCI EAFE Index.5 However, the fund’s overseas holdings lagged the MSCI index and posted a modest loss for the 12-month period.
6
Portfolio Managers’ Report (continued) – Columbia Liberty Fund
| | |
| Top 5 equity sectors | | |
| |
as of 09/30/09 (%) | | |
Information Technology | | 10.6 |
Financials | | 8.9 |
Health Care | | 6.4 |
Energy | | 6.4 |
Industrials | | 6.3 |
| | |
| Top 10 equity holdings | | |
| |
as of 09/30/09 (%) | | |
JPMorgan Chase & Co. | | 1.3 |
Microsoft Corp. | | 0.9 |
Exxon Mobil Corp. | | 0.9 |
International Business Machines Corp. | | 0.9 |
Goldman Sachs Group, Inc. | | 0.9 |
Philip Morris, International | | 0.9 |
EMC Corp. | | 0.8 |
Apple, Inc. | | 0.8 |
United Technologies Corp. | | 0.8 |
Google, Inc. | | 0.7 |
| | |
| Portfolio structure | | |
| |
as of 09/30/09 (%) | | |
Common Stocks | | 55.8 |
Mortgage-Backed Securities | | 14.1 |
Corporate Fixed-Income Bonds & Notes | | 10.9 |
Government & Agency Obligations | | 6.2 |
Commercial Mortgage-Backed Securities | | 4.6 |
Collateralized Mortgage Obligations | | 2.2 |
Asset-Backed Securities | | 1.7 |
Convertible Preferred Stocks | | 0.3 |
Other | | 4.2 |
The fund is actively managed and the composition of its portfolio will change over time. Information provided is calculated as a percentage of net assets.
Shift back toward equities
At period end, the debate continued as to how long the current market rally would last. What happens going forward will depend largely on the strength and sustainability of the economic recovery. While economic data has continued to improve, unemployment levels have remained elevated. With the possibility of rising interest rates, we decided late in the period to begin reducing fund’s fixed income holdings, particularly cash, and investing the proceeds in both large-cap U.S. and developed market overseas stocks.
Portfolio holdings and characteristics are subject to change periodically and may not be representative of current holdings and characteristics. The outlook for the fund may differ from that presented for other Columbia Funds.
Equity securities are affected by stock market fluctuations that occur in response to economic and business developments.
Investing in fixed-income securities may involve certain risks, including the credit quality of individual issuers, possible prepayments, market or economic developments and yield and share price fluctuations due to changes in interest rates. When interest rates go up, bond prices typically drop, and vice versa.
International investing may involve certain risks, including currency fluctuations, risks associated with possible differences in financial accounting standards and other monetary and political risks. Significant levels of foreign taxes, including potentially confiscatory levels of taxation and withholding taxes, may also apply to some foreign investments.
| 1 | The Standard & Poor’s (S&P) 500 Index tracks the performance of 500 widely held, large-capitalization U.S. stocks. |
| 2 | The Barclays Capital Aggregate Bond Index is a market value-weighted index that tracks the daily price, coupon, pay-downs and total return performance of fixed-rate, publicly placed, dollar-denominated and non-convertible investment grade debt issues with at least $250 million par amount outstanding and with at least one year to final maturity. |
| 3 | The Russell 1000 Growth Index measures the performance of those Russell 1000 Index companies with higher price-to-book ratios and higher forecasted growth values. |
| 4 | The Russell 1000 Value Index measures the performance of those Russell 1000 Index companies with lower price-to-book ratios and lower forecasted growth values. |
| 5 | The Morgan Stanley Capital International Europe, Australasia, Far East (MSCI EAFE) Index is a capitalization-weighted index that tracks the total return of common stocks in 21 developed-market countries within Europe, Australasia and the Far East. |
Indices are not available for investment, are not professionally managed and do not reflect sales charges, fees, brokerage commissions, taxes or other expenses of investing. Securities in the fund may not match those in an index.
7
Investment Portfolio – Columbia Liberty Fund
September 30, 2009
Common Stocks – 55.8%
| | | | |
| | | Shares | | Value ($) |
| Consumer Discretionary – 5.9% | | | | |
| Auto Components – 0.2% | | | | |
Bridgestone Corp. | | 47,600 | | 847,653 |
| | | | |
Auto Components Total | | | | 847,653 |
| | |
| Automobiles – 0.1% | | | | |
Suzuki Motor Corp. | | 23,700 | | 550,621 |
| | | | |
Automobiles Total | | | | 550,621 |
| | |
| Distributors – 0.2% | | | | |
Li & Fung Ltd. | | 152,000 | | 619,977 |
| | | | |
Distributors Total | | | | 619,977 |
| |
| Hotels, Restaurants & Leisure – 1.7% | | |
Carnival Corp. (a) | | 41,900 | | 1,394,432 |
Carnival PLC | | 17,687 | | 603,170 |
International Game Technology | | 35,461 | | 761,702 |
Las Vegas Sands Corp. (a) | | 15,080 | | 253,947 |
McDonald’s Corp. | | 10,406 | | 593,871 |
Starbucks Corp. (a) | | 25,500 | | 526,575 |
Starwood Hotels & Resorts Worldwide, Inc. | | 47,145 | | 1,557,199 |
Yum! Brands, Inc. | | 13,280 | | 448,333 |
| | | | |
Hotels, Restaurants & Leisure Total | | 6,139,229 |
| | |
| Household Durables – 0.1% | | | | |
D.R. Horton, Inc. | | 29,300 | | 334,313 |
| | | | |
Household Durables Total | | | | 334,313 |
| | |
| Internet & Catalog Retail – 0.3% | | | | |
Amazon.com, Inc. (a) | | 7,900 | | 737,544 |
Rakuten, Inc. | | 319 | | 212,054 |
| | | | |
Internet & Catalog Retail Total | | | | 949,598 |
| | |
| Media – 0.6% | | | | |
Reed Elsevier NV | | 82,699 | | 934,016 |
Viacom, Inc., Class B (a) | | 19,900 | | 557,996 |
WPP PLC | | 63,940 | | 549,596 |
| | | | |
Media Total | | | | 2,041,608 |
| | |
| Multiline Retail – 1.5% | | | | |
J.C. Penney Co., Inc. | | 67,800 | | 2,288,250 |
Nordstrom, Inc. | | 63,530 | | 1,940,206 |
Target Corp. | | 29,330 | | 1,369,125 |
| | | | |
Multiline Retail Total | | | | 5,597,581 |
| | |
| Specialty Retail – 1.0% | | | | |
Best Buy Co., Inc. | | 12,540 | | 470,501 |
GameStop Corp., Class A (a) | | 16,810 | | 444,960 |
Lowe’s Companies, Inc. | | 112,750 | | 2,360,985 |
Staples, Inc. | | 24,800 | | 575,856 |
| | | | |
Specialty Retail Total | | | | 3,852,302 |
| | | | |
| | | Shares | | Value ($) |
| Textiles, Apparel & Luxury Goods – 0.2% | | |
Polo Ralph Lauren Corp. | | 7,430 | | 569,287 |
| | | | |
Textiles, Apparel & Luxury Goods Total | | 569,287 |
| | |
Consumer Discretionary Total | | 21,502,169 |
| | |
| Consumer Staples – 5.5% | | | | |
| Beverages – 1.2% | | | | |
Carlsberg A/S, Class B | | 11,898 | | 866,184 |
Coca-Cola Co. | | 11,700 | | 628,290 |
Diageo PLC, ADR | | 17,826 | | 1,096,121 |
Molson Coors Brewing Co., Class B | | 13,380 | | 651,338 |
PepsiCo, Inc. | | 23,600 | | 1,384,376 |
| | | | |
Beverages Total | | | | 4,626,309 |
| | |
| Food & Staples Retailing – 0.8% | | | | |
Costco Wholesale Corp. | | 9,450 | | 533,547 |
CVS Caremark Corp. | | 15,620 | | 558,259 |
Tesco PLC | | 115,756 | | 740,689 |
Wal-Mart Stores, Inc. | | 20,600 | | 1,011,254 |
| | | | |
Food & Staples Retailing Total | | | | 2,843,749 |
| | |
| Food Products – 0.7% | | | | |
Hershey Co. | | 10,520 | | 408,807 |
J.M. Smucker Co. | | 22,000 | | 1,166,220 |
Nestle SA, Registered Shares | | 22,260 | | 949,607 |
| | | | |
Food Products Total | | | | 2,524,634 |
| | |
| Household Products – 0.9% | | | | |
Colgate-Palmolive Co. | | 10,230 | | 780,345 |
Procter & Gamble Co. | | 41,910 | | 2,427,427 |
| | | | |
Household Products Total | | | | 3,207,772 |
| | |
| Personal Products – 0.7% | | | | |
Avon Products, Inc. | | 51,593 | | 1,752,098 |
Estee Lauder Companies, Inc., Class A | | 10,870 | | 403,060 |
Mead Johnson Nutrition Co., Class A | | 12,450 | | 561,619 |
| | | | |
Personal Products Total | | | | 2,716,777 |
| | |
| Tobacco – 1.2% | | | | |
Japan Tobacco, Inc. | | 357 | | 1,215,687 |
Philip Morris International, Inc. | | 63,824 | | 3,110,782 |
| | | | |
Tobacco Total | | | | 4,326,469 |
| | | | |
Consumer Staples Total | | | | 20,245,710 |
| | | | |
| Energy – 6.4% | | | | |
| Energy Equipment & Services – 1.2% | | |
Halliburton Co. | | 27,534 | | 746,722 |
Nabors Industries Ltd. (a) | | 91,970 | | 1,922,173 |
See Accompanying Notes to Financial Statements.
8
Columbia Liberty Fund
September 30, 2009
Common Stocks (continued)
| | | | |
| | | Shares | | Value ($) |
| Energy (continued) | | | | |
| Energy Equipment & Services (continued) | | |
Transocean Ltd. (a) | | 18,481 | | 1,580,680 |
| | | | |
Energy Equipment & Services Total | | 4,249,575 |
| |
| Oil, Gas & Consumable Fuels – 5.2% | | |
Alpha Natural Resources, Inc. (a) | | 30,250 | | 1,061,775 |
Apache Corp. | | 24,450 | | 2,245,244 |
BG Group PLC | | 56,220 | | 978,417 |
Cairn Energy PLC (a) | | 14,821 | | 660,995 |
Chevron Corp. | | 19,900 | | 1,401,557 |
Devon Energy Corp. | | 11,430 | | 769,582 |
EOG Resources, Inc. | | 15,800 | | 1,319,458 |
Exxon Mobil Corp. | | 47,902 | | 3,286,556 |
Hess Corp. | | 10,840 | | 579,506 |
Marathon Oil Corp. | | 21,000 | | 669,900 |
Newfield Exploration Co. (a) | | 22,100 | | 940,576 |
Occidental Petroleum Corp. | | 28,000 | | 2,195,200 |
Petroleo Brasileiro SA, ADR | | 22,534 | | 1,034,311 |
Santos Ltd. | | 68,451 | | 912,932 |
Williams Companies, Inc. | | 60,000 | | 1,072,200 |
| | | | |
Oil, Gas & Consumable Fuels Total | | | | 19,128,209 |
| | | | |
Energy Total | | | | 23,377,784 |
| | | | |
| Financials – 8.9% | | | | |
| Capital Markets – 1.8% | | | | |
Bank of New York Mellon Corp. | | 34,600 | | 1,003,054 |
Credit Suisse Group AG, Registered Shares | | 9,845 | | 547,975 |
Goldman Sachs Group, Inc. | | 16,995 | | 3,133,028 |
Morgan Stanley | | 65,870 | | 2,034,066 |
| | | | |
Capital Markets Total | | | | 6,718,123 |
| | |
| Commercial Banks – 3.0% | | | | |
Banco Santander SA | | 31,823 | | 514,126 |
BB&T Corp. | | 34,000 | | 926,160 |
BNP Paribas | | 8,657 | | 692,407 |
Fifth Third Bancorp. | | 62,600 | | 634,138 |
Mitsubishi UFJ Financial
Group, Inc. | | 153,300 | | 820,044 |
National Bank of Greece SA (a)(b) | | 19,610 | | 709,118 |
PNC Financial Services Group, Inc. | | 16,529 | | 803,144 |
Raiffeisen International Bank Holding AG | | 30 | | 1,958 |
Societe Generale | | 9,825 | | 791,704 |
SunTrust Banks, Inc. | | 32,980 | | 743,699 |
U.S. Bancorp | | 83,213 | | 1,819,036 |
Wells Fargo & Co. | | 68,196 | | 1,921,763 |
Zions Bancorporation | | 22,400 | | 402,528 |
| | | | |
Commercial Banks Total | | | | 10,779,825 |
| | | | |
| | | Shares | | Value ($) |
| Consumer Finance – 0.2% | | | | |
American Express Co. | | 25,100 | | 850,890 |
| | | | |
Consumer Finance Total | | | | 850,890 |
| |
| Diversified Financial Services – 1.3% | | |
JPMorgan Chase & Co. | | 108,388 | | 4,749,562 |
| | | | |
Diversified Financial Services Total | | 4,749,562 |
| | |
| Insurance – 1.8% | | | | |
ACE Ltd. (a) | | 17,299 | | 924,805 |
Aon Corp. | | 15,300 | | 622,557 |
Axis Capital Holdings Ltd. | | 29,700 | | 896,346 |
Catlin Group Ltd. | | 58,230 | | 327,014 |
Marsh & McLennan Companies, Inc. | | 23,600 | | 583,628 |
Principal Financial Group, Inc. | | 13,100 | | 358,809 |
Prudential Financial, Inc. | | 39,280 | | 1,960,465 |
XL Capital Ltd., Class A | | 40,040 | | 699,098 |
| | | | |
Insurance Total | | | | 6,372,722 |
|
| Real Estate Investment Trusts (REITs) – 0.5% |
Plum Creek Timber Co., Inc. | | 17,600 | | 539,264 |
Rayonier, Inc. | | 14,800 | | 605,468 |
Simon Property Group, Inc. | | 11,314 | | 785,531 |
| | | | |
Real Estate Investment Trusts (REITs) Total | | 1,930,263 |
| | |
| Thrifts & Mortgage Finance – 0.3% | | | | |
Housing Development Finance Corp., Ltd. | | 18,709 | | 1,068,198 |
| | | | |
Thrifts & Mortgage Finance Total | | | | 1,068,198 |
| | | | |
Financials Total | | | | 32,469,583 |
| | | | |
| Health Care – 6.4% | | | | |
| Biotechnology – 1.1% | | | | |
Amgen, Inc. (a) | | 23,740 | | 1,429,860 |
Celgene Corp. (a) | | 11,800 | | 659,620 |
CSL Ltd. | | 19,212 | | 565,538 |
Gilead Sciences, Inc. (a) | | 18,300 | | 852,414 |
Vertex Pharmaceuticals, Inc. (a) | | 13,100 | | 496,490 |
| | | | |
Biotechnology Total | | | | 4,003,922 |
| |
| Health Care Equipment & Supplies – 0.9% | | |
Baxter International, Inc. | | 24,340 | | 1,387,624 |
Boston Scientific Corp. (a) | | 137,770 | | 1,458,984 |
Hospira, Inc. (a) | | 5,670 | | 252,882 |
| | | | |
Health Care Equipment & Supplies Total | | 3,099,490 |
| |
| Health Care Providers & Services – 0.7% | | |
CIGNA Corp. | | 26,380 | | 741,014 |
Medco Health Solutions, Inc. (a) | | 33,810 | | 1,870,031 |
| | | | |
Health Care Providers & Services Total | | 2,611,045 |
See Accompanying Notes to Financial Statements.
9
Columbia Liberty Fund
September 30, 2009
Common Stocks (continued)
| | | | |
| | | Shares | | Value ($) |
| Health Care (continued) | | | | |
| Life Sciences Tools & Services – 1.4% | | |
Covance, Inc. (a) | | 8,560 | | 463,524 |
Life Technologies Corp. (a) | | 39,910 | | 1,857,810 |
Qiagen N.V. (a) | | 49,096 | | 1,042,250 |
Thermo Fisher Scientific, Inc. (a) | | 42,286 | | 1,846,630 |
| | | | |
Life Sciences Tools & Services Total | | 5,210,214 |
| | |
| Pharmaceuticals – 2.3% | | | | |
Abbott Laboratories | | 25,670 | | 1,269,895 |
Allergan, Inc. | | 15,790 | | 896,240 |
Bristol-Myers Squibb Co. | | 47,100 | | 1,060,692 |
Johnson & Johnson | | 24,920 | | 1,517,379 |
Novartis AG, Registered Shares | | 20,438 | | 1,025,997 |
Pfizer, Inc. | | 74,500 | | 1,232,975 |
Roche Holding AG, Genusschein Shares | | 5,527 | | 894,695 |
Schering-Plough Corp. | | 21,700 | | 613,025 |
| | | | |
Pharmaceuticals Total | | | | 8,510,898 |
| | | | |
Health Care Total | | | | 23,435,569 |
| | | | |
| Industrials – 6.3% | | | | |
| Aerospace & Defense – 1.7% | | | | |
Goodrich Corp. | | 13,900 | | 755,326 |
Honeywell International, Inc. | | 26,100 | | 969,615 |
L-3 Communications Holdings, Inc. | | 7,450 | | 598,384 |
Lockheed Martin Corp. | | 5,310 | | 414,605 |
Precision Castparts Corp. | | 8,280 | | 843,484 |
United Technologies Corp. | | 45,136 | | 2,750,136 |
| | | | |
Aerospace & Defense Total | | | | 6,331,550 |
| | |
| Air Freight & Logistics – 0.2% | | | | |
FedEx Corp. | | 7,480 | | 562,646 |
| | | | |
Air Freight & Logistics Total | | | | 562,646 |
| | |
| Airlines – 0.2% | | | | |
Ryanair Holdings PLC, ADR (a) | | 26,490 | | 769,269 |
| | | | |
Airlines Total | | | | 769,269 |
| |
| Commercial Services & Supplies – 0.2% | | |
Republic Services, Inc. | | 28,400 | | 754,588 |
| | | | |
Commercial Services & Supplies Total | | 754,588 |
| | |
| Construction & Engineering – 0.2% | | | | |
KBR, Inc. | | 37,200 | | 866,388 |
| | | | |
Construction & Engineering Total | | | | 866,388 |
| | |
| Electrical Equipment – 0.6% | | | | |
ABB Ltd., Registered Shares (a) | | 40,716 | | 818,218 |
Dongfang Electrical Machinery Co., Ltd., Class H | | 115 | | 573 |
| | | | |
| | | Shares | | Value ($) |
Vestas Wind Systems A/S (a) | | 16,189 | | 1,176,008 |
| | | | |
Electrical Equipment Total | | | | 1,994,799 |
| | |
| Industrial Conglomerates – 0.7% | | | | |
General Electric Co. | | 82,255 | | 1,350,627 |
Tyco International Ltd. | | 39,110 | | 1,348,513 |
| | | | |
Industrial Conglomerates Total | | | | 2,699,140 |
| | |
| Machinery – 1.4% | | | | |
Dover Corp. | | 16,190 | | 627,524 |
Eaton Corp. | | 8,200 | | 464,038 |
Flowserve Corp. | | 7,580 | | 746,933 |
GEA Group AG | | 23,725 | | 495,030 |
Jain Irrigation Systems Ltd. | | 42,235 | | 691,971 |
Navistar International Corp. (a) | | 12,367 | | 462,773 |
PACCAR, Inc. | | 5,500 | | 207,405 |
Parker Hannifin Corp. | | 7,520 | | 389,837 |
Sandvik AB | | 54,925 | | 607,889 |
SPX Corp. | | 8,550 | | 523,859 |
| | | | |
Machinery Total | | | | 5,217,259 |
| | |
| Professional Services – 0.3% | | | | |
Manpower, Inc. | | 7,700 | | 436,667 |
SGS SA, Registered Shares | | 369 | | 497,061 |
| | | | |
Professional Services Total | | | | 933,728 |
| | |
| Road & Rail – 0.3% | | | | |
Con-way, Inc. | | 4,945 | | 189,492 |
Norfolk Southern Corp. | | 13,010 | | 560,861 |
Ryder System, Inc. | | 8,290 | | 323,808 |
| | | | |
Road & Rail Total | | | | 1,074,161 |
| |
| Trading Companies & Distributors – 0.4% | | |
Mitsui & Co., Ltd. | | 70,500 | | 917,531 |
W.W. Grainger, Inc. | | 7,520 | | 671,987 |
| | | | |
Trading Companies & Distributors Total | | 1,589,518 |
| |
| Transportation Infrastructure – 0.1% | | |
Koninklijke Vopak NV (a) | | 7,519 | | 488,864 |
| | | | |
Transportation Infrastructure Total | | 488,864 |
| | |
Industrials Total | | | | 23,281,910 |
| | | | |
| Information Technology – 10.6% | | | | |
| Communications Equipment – 1.3% | | |
Cisco Systems, Inc. (a) | | 94,135 | | 2,215,938 |
CommScope, Inc. (a) | | 16,440 | | 492,049 |
QUALCOMM, Inc. | | 37,250 | | 1,675,505 |
Research In Motion Ltd. | | 6,400 | | 432,320 |
| | | | |
Communications Equipment Total | | 4,815,812 |
| | |
| Computers & Peripherals – 3.6% | | | | |
Apple, Inc. (a) | | 15,510 | | 2,875,089 |
See Accompanying Notes to Financial Statements.
10
Columbia Liberty Fund
September 30, 2009
Common Stocks (continued)
| | | | |
| | | Shares | | Value ($) |
| Information Technology (continued) | | |
| Computers & Peripherals (continued) | | |
Asustek Computer, Inc. | | 487,722 | | 834,782 |
Compal Electronics, Inc. | | 649,000 | | 752,595 |
Dell, Inc. (a) | | 44,620 | | 680,901 |
EMC Corp. (a) | | 170,290 | | 2,901,742 |
Hewlett-Packard Co. | | 41,900 | | 1,978,099 |
International Business Machines Corp. | | 26,960 | | 3,224,685 |
| | | | |
Computers & Peripherals Total | | | | 13,247,893 |
| |
| Electronic Equipment, Instruments & Components – 0.1% | | |
Corning, Inc. | | 27,380 | | 419,188 |
| | | | |
Electronic Equipment, Instruments & Components Total | | 419,188 |
| |
| Internet Software & Services – 1.3% | | |
Akamai Technologies, Inc. (a) | | 22,230 | | 437,487 |
Baidu, Inc., ADR (a) | | 1,086 | | 424,680 |
eBay, Inc. (a) | | 26,360 | | 622,360 |
Equinix, Inc. (a) | | 6,600 | | 607,200 |
Google, Inc., Class A (a) | | 5,051 | | 2,504,538 |
| | | | |
Internet Software & Services Total | | | | 4,596,265 |
| | |
| IT Services – 0.1% | | | | |
Visa, Inc., Class A | | 5,920 | | 409,131 |
| | | | |
IT Services Total | | | | 409,131 |
| |
Semiconductors & Semiconductor
Equipment – 2.5% | | |
Analog Devices, Inc. | | 24,340 | | 671,297 |
ASML Holding NV | | 24,156 | | 712,335 |
Broadcom Corp., Class A (a) | | 21,140 | | 648,787 |
Cypress Semiconductor Corp. (a) | | 18,760 | | 193,791 |
Intel Corp. | | 84,520 | | 1,654,056 |
Intersil Corp., Class A | | 27,600 | | 422,556 |
KLA-Tencor Corp. | | 24,700 | | 885,742 |
Lam Research Corp. (a) | | 22,519 | | 769,249 |
Maxim Integrated Products, Inc. | | 26,750 | | 485,245 |
Teradyne, Inc. (a) | | 47,750 | | 441,688 |
Texas Instruments, Inc. | | 67,450 | | 1,597,890 |
Tokyo Electron Ltd. | | 11,000 | | 695,295 |
| | | | |
Semiconductors & Semiconductor Equipment Total | | 9,177,931 |
| | |
| Software – 1.7% | | | | |
Activision Blizzard, Inc. (a) | | 35,853 | | 444,219 |
Adobe Systems, Inc. (a) | | 13,560 | | 448,022 |
Autonomy Corp. PLC (a) | | 25,149 | | 656,215 |
BMC Software, Inc. (a) | | 16,200 | | 607,986 |
Microsoft Corp. | | 126,875 | | 3,284,794 |
| | | | |
| | | Shares | | Value ($) |
Oracle Corp. | | 30,720 | | 640,205 |
| | | | |
Software Total | | | | 6,081,441 |
| | | | |
Information Technology Total | | 38,747,661 |
| | |
| Materials – 2.8% | | | | |
| Chemicals – 0.9% | | | | |
Celanese Corp., Series A | | 17,720 | | 443,000 |
Monsanto Co. | | 11,900 | | 921,060 |
Potash Corp. of Saskatchewan, Inc. | | 3,600 | | 325,224 |
Shin-Etsu Chemical Co., Ltd. | | 11,100 | | 678,456 |
Syngenta AG, Registered Shares | | 2,280 | | 523,442 |
Umicore | | 47 | | 1,409 |
Yara International ASA | | 14,318 | | 450,032 |
| | | | |
Chemicals Total | | | | 3,342,623 |
| | |
| Containers & Packaging – 0.3% | | | | |
Crown Holdings, Inc. (a) | | 22,440 | | 610,368 |
Owens-Illinois, Inc. (a) | | 13,010 | | 480,069 |
| | | | |
Containers & Packaging Total | | | | 1,090,437 |
| | |
| Metals & Mining – 1.3% | | | | |
BHP Billiton Ltd. | | 21,438 | | 708,429 |
Freeport-McMoRan Copper & Gold, Inc. (a) | | 8,720 | | 598,279 |
Newcrest Mining Ltd. | | 25,718 | | 723,046 |
Nucor Corp. | | 19,800 | | 930,798 |
Steel Dynamics, Inc. | | 40,410 | | 619,890 |
United States Steel Corp. | | 30,400 | | 1,348,848 |
| | | | |
Metals & Mining Total | | | | 4,929,290 |
| | |
| Paper & Forest Products – 0.3% | | | | |
Weyerhaeuser Co. | | 24,800 | | 908,920 |
| | | | |
Paper & Forest Products Total | | | | 908,920 |
| | | | |
Materials Total | | | | 10,271,270 |
| | | | |
| Telecommunication Services – 1.3% | | |
Diversified Telecommunication
Services – 0.8% | | |
AT&T, Inc. | | 66,715 | | 1,801,972 |
China Unicom Ltd. | | 306,000 | | 428,106 |
Verizon Communications, Inc. | | 22,402 | | 678,109 |
| | | | |
Diversified Telecommunication
Services Total | | 2,908,187 |
| |
Wireless Telecommunication
Services – 0.5% | | |
American Tower Corp., Class A (a) | | 18,950 | | 689,780 |
Millicom International Cellular
SA (a) | | 3,819 | | 277,794 |
See Accompanying Notes to Financial Statements.
11
Columbia Liberty Fund
September 30, 2009
Common Stocks (continued)
| | | | |
| | | Shares | | Value ($) |
| Telecommunication Services (continued) |
| Wireless Telecommunication Services (continued) |
Vodafone Group PLC | | 339,700 | | 762,430 |
| | | | |
Wireless Telecommunication
Services Total | | 1,730,004 |
| | |
Telecommunication Services Total | | 4,638,191 |
| | |
| Utilities – 1.7% |
| Electric Utilities – 0.7% | | | | |
American Electric Power Co., Inc. | | 24,700 | | 765,453 |
Exelon Corp. | | 9,000 | | 446,580 |
FPL Group, Inc. | | 21,200 | | 1,170,876 |
Northeast Utilities | | 13,921 | | 330,485 |
| | | | |
Electric Utilities Total | | | | 2,713,394 |
|
| Independent Power Producers & Energy Traders – 0.5% |
AES Corp. (a) | | 74,245 | | 1,100,311 |
Iberdrola Renovables SA | | 107,425 | | 529,027 |
| | | | |
Independent Power Producers &
Energy Traders Total | | 1,629,338 |
| | |
| Multi-Utilities – 0.4% | | | | |
PG&E Corp. | | 25,348 | | 1,026,340 |
Wisconsin Energy Corp. | | 11,000 | | 496,870 |
| | | | |
Multi-Utilities Total | | | | 1,523,210 |
| | |
| Water Utilities – 0.1% | | | | |
Epure International Ltd. | | 892,000 | | 357,582 |
| | | | |
Water Utilities Total | | | | 357,582 |
| | | | |
Utilities Total | | | | 6,223,524 |
| | | | |
Total Common Stocks
(cost of $169,450,395) | | | | 204,193,371 |
|
Mortgage-Backed Securities – 14.1% |
| | | Par ($) | | |
| Federal Home Loan Mortgage Corp. | | |
4.500% 02/01/39 | | 412,474 | | 417,886 |
4.500% 04/01/39 | | 794,719 | | 805,067 |
5.000% 08/15/32 | | 1,450,000 | | 1,525,319 |
5.000% 05/15/33 | | 1,400,000 | | 1,475,018 |
5.000% 12/01/35 | | 1,112,916 | | 1,154,001 |
5.000% 06/01/36 | | 1,089,086 | | 1,127,760 |
5.000% 07/01/38 | | 1,711,000 | | 1,770,592 |
5.000% 11/01/38 | | 2,412,707 | | 2,496,740 |
5.000% 05/01/39 | | 1,324,651 | | 1,370,655 |
5.000% 08/01/39 | | 1,372,665 | | 1,420,337 |
5.500% 07/01/21 | | 1,848,696 | | 1,960,629 |
5.500% 12/01/37 | | 4,159,455 | | 4,359,845 |
| | | | |
| | | Par ($) | | Value ($) |
5.500% 01/01/39 | | 958,292 | | 1,004,405 |
6.500% 07/01/14 | | 22,974 | | 24,563 |
6.500% 12/01/14 | | 22,646 | | 24,212 |
6.500% 06/01/29 | | 26,427 | | 28,485 |
6.500% 01/01/30 | | 68,178 | | 73,486 |
6.500% 11/01/37 | | 1,353,566 | | 1,444,701 |
7.000% 11/01/29 | | 42,769 | | 47,034 |
7.000% 01/01/30 | | 4,012 | | 4,412 |
8.000% 07/01/20 | | 18,584 | | 20,069 |
|
| Federal National Mortgage Association |
5.000% 05/01/37 | | 1,550,957 | | 1,604,578 |
5.500% 05/01/36 | | 2,084,708 | | 2,186,446 |
5.500% 11/01/36 | | 2,003,015 | | 2,100,767 |
5.500% 02/01/37 | | 670,933 | | 703,152 |
5.500% 10/01/38 | | 949,999 | | 995,174 |
6.000% 11/01/35 | | 313,284 | | 332,101 |
6.000% 09/01/36 | | 855,110 | | 904,867 |
6.000% 06/01/38 | | 2,263,222 | | 2,390,895 |
6.000% 03/01/39 | | 2,562,645 | | 2,709,357 |
6.500% 04/01/11 | | 62,853 | | 65,800 |
6.500% 05/01/11 | | 211,508 | | 221,426 |
6.500% 11/01/25 | | 3 | | 3 |
6.500% 08/01/34 | | 338,069 | | 363,439 |
6.500% 11/01/36 | | 1,445,596 | | 1,548,429 |
6.500% 06/01/38 | | 1,350,501 | | 1,445,725 |
7.000% 08/15/23 | | 121,793 | | 133,999 |
7.000% 07/01/32 | | 12,157 | | 13,398 |
7.000% 01/01/37 | | 75,052 | | 82,084 |
7.000% 07/01/37 | | 495,970 | | 541,775 |
TBA: | | | | |
5.000% 10/01/39 (c) | | 2,880,000 | | 2,974,499 |
5.500% 10/01/39 (c) | | 2,820,000 | | 2,949,545 |
| |
| Government National Mortgage Association | | |
5.000% 08/15/39 | | 1,373,471 | | 1,424,418 |
5.500% 02/15/37 | | 2,596,520 | | 2,730,808 |
6.000% 12/15/37 | | 709,540 | | 750,671 |
| | | | |
Total Mortgage-Backed Securities
(cost of $50,094,657) | | 51,728,572 |
|
Corporate Fixed-Income Bonds & Notes – 10.9% |
| Basic Materials – 0.3% | | | | |
| Chemicals – 0.1% | | | | |
| EI Du Pont de Nemours & Co. |
5.000% 07/15/13 | | 230,000 | | 250,541 |
| | | | |
Chemicals Total | | | | 250,541 |
|
Iron/Steel – 0.1% |
| Nucor Corp. |
5.850% 06/01/18 | | 380,000 | | 416,131 |
| | | | |
Iron/Steel Total | | | | 416,131 |
See Accompanying Notes to Financial Statements.
12
Columbia Liberty Fund
September 30, 2009
Corporate Fixed-Income Bonds & Notes (continued)
| | | | |
| | | Par ($) | | Value ($) |
| Basic Materials (continued) |
| Metals & Mining – 0.1% |
| Vale Overseas Ltd. |
6.250% 01/23/17 | | 500,000 | | 535,296 |
| | | | |
Metals & Mining Total | | | | 535,296 |
| | | | |
Basic Materials Total | | | | 1,201,968 |
| | | | |
| Communications – 1.2% | | | | |
| Media – 0.3% |
| Comcast Corp. |
7.050% 03/15/33 | | 475,000 | | 538,681 |
|
| News America, Inc. |
6.550% 03/15/33 | | 495,000 | | 506,632 |
|
| Viacom, Inc. |
6.125% 10/05/17 | | 225,000 | | 240,925 |
| | | | |
Media Total | | | | 1,286,238 |
|
Telecommunication Services – 0.9% |
| AT&T, Inc. |
4.950% 01/15/13 | | 650,000 | | 693,030 |
|
| British Telecommunications PLC |
5.150% 01/15/13 | | 400,000 | | 416,722 |
|
| Cellco Partnership/Verizon Wireless Capital LLC |
5.550% 02/01/14 (b)(d) | | 625,000 | | 675,426 |
|
| New Cingular Wireless Services, Inc. |
8.750% 03/01/31 | | 315,000 | | 417,268 |
|
| Telefonica Emisiones SAU |
5.984% 06/20/11 | | 550,000 | | 586,026 |
|
| Vodafone Group PLC |
5.750% 03/15/16 | | 370,000 | | 396,489 |
| | | | |
Telecommunication Services Total | | | | 3,184,961 |
| | | | |
Communications Total | | | | 4,471,199 |
| | | | |
| Consumer Cyclical – 0.2% | | | | |
| Retail – 0.2% |
| CVS Caremark Corp. |
6.125% 09/15/39 | | 450,000 | | 457,750 |
|
| Wal-Mart Stores, Inc. |
5.800% 02/15/18 | | 350,000 | | 393,151 |
| | | | |
Retail Total | | | | 850,901 |
| | | | |
Consumer Cyclical Total | | | | 850,901 |
| | | | |
| | | Par ($) | | Value ($) |
| Consumer Non-cyclical – 0.7% | | | | |
| Beverages – 0.2% |
| Bottling Group LLC |
6.950% 03/15/14 | | 300,000 | | 349,635 |
|
| Miller Brewing Co. |
5.500% 08/15/13 (b)(d) | | 441,000 | | 466,065 |
| | | | |
Beverages Total | | | | 815,700 |
|
| Food – 0.1% |
| Campbell Soup Co. |
4.500% 02/15/19 | | 205,000 | | 210,349 |
|
| ConAgra Foods, Inc. |
6.750% 09/15/11 | | 33,000 | | 36,008 |
| | | | |
Food Total | | | | 246,357 |
|
| Healthcare Services – 0.2% |
| Roche Holdings, Inc. |
6.000% 03/01/19 (b)(d) | | 560,000 | | 623,358 |
| | | | |
Healthcare Services Total | | | | 623,358 |
|
| Pharmaceuticals – 0.2% |
| Express Scripts, Inc. |
5.250% 06/15/12 | | 385,000 | | 408,693 |
|
| Wyeth |
5.500% 02/01/14 | | 480,000 | | 524,211 |
| | | | |
Pharmaceuticals Total | | | | 932,904 |
| | | | |
Consumer Non-cyclical Total | | | | 2,618,319 |
| | | | |
| Energy – 1.1% | | | | |
| Oil & Gas – 0.5% |
| Canadian Natural Resources Ltd. |
5.700% 05/15/17 | | 400,000 | | 425,088 |
|
| Chevron Corp. |
4.950% 03/03/19 | | 400,000 | | 426,956 |
|
| Nexen, Inc. |
5.875% 03/10/35 | | 475,000 | | 435,036 |
|
| Talisman Energy, Inc. |
6.250% 02/01/38 | | 465,000 | | 474,363 |
| | | | |
Oil & Gas Total | | | | 1,761,443 |
|
Oil & Gas Services – 0.2% |
| Halliburton Co. |
5.900% 09/15/18 | | 325,000 | | 356,685 |
|
| Weatherford International Ltd. |
5.150% 03/15/13 | | 340,000 | | 357,133 |
| | | | |
Oil & Gas Services Total | | | | 713,818 |
See Accompanying Notes to Financial Statements.
13
Columbia Liberty Fund
September 30, 2009
Corporate Fixed-Income Bonds & Notes (continued)
| | | | |
| | | Par ($) | | Value ($) |
| Energy (continued) |
| Pipelines – 0.4% |
| Enterprise Products Operating LLC |
4.600% 08/01/12 | | 350,000 | | 362,654 |
|
| Plains All American Pipeline LP/PAA Finance Corp. |
6.650% 01/15/37 | | 365,000 | | 384,450 |
|
| TransCanada Pipelines Ltd. |
6.350% 05/15/67 (e) | | 640,000 | | 560,730 |
| | | | |
Pipelines Total | | | | 1,307,834 |
| | | | |
Energy Total | | | | 3,783,095 |
| | | | |
| Financials – 5.5% | | | | |
| Banks – 3.3% |
| ANZ National International Ltd. |
6.200% 07/19/13 (b)(d) | | 650,000 | | 711,245 |
|
| Bank of New York Mellon Corp. |
5.125% 08/27/13 | | 650,000 | | 702,619 |
|
| Capital One Financial Corp. |
5.500% 06/01/15 | | 675,000 | | 699,009 |
|
| Citicorp Lease Pass-Through Trust |
8.040% 12/15/19 (b)(d) | | 1,360,000 | | 1,345,912 |
|
| Citigroup Funding, Inc. |
2.000% 03/30/12 (f) | | 1,500,000 | | 1,516,437 |
|
| Credit Suisse/New York NY |
6.000% 02/15/18 | | 700,000 | | 732,869 |
|
| Deutsche Bank AG London |
4.875% 05/20/13 | | 475,000 | | 505,955 |
|
| Goldman Sachs Group, Inc. |
6.345% 02/15/34 | | 515,000 | | 472,966 |
|
| HSBC Capital Funding LP |
9.547% 12/31/49 (b)(d)(e) | | 765,000 | | 772,650 |
|
| JPMorgan Chase & Co. |
6.000% 01/15/18 | | 800,000 | | 858,660 |
|
| Keycorp |
6.500% 05/14/13 | | 520,000 | | 532,310 |
|
| Merrill Lynch & Co., Inc. |
6.050% 08/15/12 (g) | | 725,000 | | 773,203 |
|
| Morgan Stanley |
6.750% 04/15/11 | | 310,000 | | 330,545 |
|
| Northern Trust Corp. |
4.625% 05/01/14 | | 605,000 | | 643,750 |
| | | | |
| | | Par ($) | | Value ($) |
| U.S. Bank N.A. |
6.300% 02/04/14 | | 650,000 | | 727,654 |
|
| Wachovia Corp. |
4.875% 02/15/14 | | 650,000 | | 662,108 |
| | | | |
Banks Total | | | | 11,987,892 |
|
| Commercial Banks – 0.2% |
| Barclays Bank PLC |
6.750% 05/22/19 | | 700,000 | | 782,905 |
| | | | |
Commercial Banks Total | | | | 782,905 |
|
| Diversified Financial Services – 0.9% |
| AGFC Capital Trust I |
6.000% 01/15/67 (b)(d)(e) | | 725,000 | | 290,000 |
|
| Ameriprise Financial, Inc. |
7.300% 06/28/19 | | 435,000 | | 479,532 |
|
| General Electric Capital Corp. |
2.250% 03/12/12 (f) | | 1,500,000 | | 1,527,088 |
5.000% 01/08/16 | | 755,000 | | 757,727 |
|
| Lehman Brothers Holdings, Inc. |
5.750% 07/18/11 (h)(i) | | 750,000 | | 133,125 |
| | | | |
Diversified Financial Services Total | | 3,187,472 |
|
| Insurance – 0.8% |
| Chubb Corp. |
5.750% 05/15/18 | | 375,000 | | 411,338 |
|
| Lincoln National Corp. |
8.750% 07/01/19 | | 485,000 | | 560,935 |
|
| MetLife, Inc. |
6.817% 08/15/18 | | 515,000 | | 573,196 |
|
| Principal Life Income Funding Trusts |
5.300% 04/24/13 | | 500,000 | | 512,943 |
|
| Prudential Financial, Inc. |
6.100% 06/15/17 | | 485,000 | | 487,140 |
|
| UnitedHealth Group, Inc. |
5.250% 03/15/11 | | 376,000 | | 390,786 |
| | | | |
Insurance Total | | | | 2,936,338 |
|
| Real Estate Investment Trusts (REITs) – 0.3% |
| Duke Realty LP |
7.375% 02/15/15 | | 450,000 | | 464,105 |
|
| Health Care Property Investors, Inc. |
6.450% 06/25/12 | | 500,000 | | 515,483 |
See Accompanying Notes to Financial Statements.
14
Columbia Liberty Fund
September 30, 2009
Corporate Fixed-Income Bonds & Notes (continued)
| | | | |
| | | Par ($) | | Value ($) |
| Financials (continued) | | | | |
| Real Estate Investment Trusts (REITs) (continued) | | |
| Simon Property Group LP |
5.750% 12/01/15 | | 350,000 | | 358,019 |
| | | | |
Real Estate Investment Trusts (REITs) Total | | 1,337,607 |
| | | | |
Financials Total | | | | 20,232,214 |
| | | | |
| Industrials – 0.4% | | | | |
| Aerospace & Defense – 0.1% |
| United Technologies Corp. |
5.375% 12/15/17 | | 350,000 | | 381,842 |
| | | | |
Aerospace & Defense Total | | | | 381,842 |
|
| Miscellaneous Manufacturing – 0.1% |
| Tyco International Ltd./Tyco International Finance SA | | |
7.000% 12/15/19 | | 179,000 | | 193,775 |
| | | | |
Miscellaneous Manufacturing Total | | 193,775 |
|
| Transportation – 0.2% |
| Burlington Northern Santa Fe Corp. |
6.200% 08/15/36 | | 390,000 | | 436,926 |
|
| Norfolk Southern Corp. |
5.750% 04/01/18 | | 450,000 | | 489,489 |
| | | | |
Transportation Total | | | | 926,415 |
| | | | |
Industrials Total | | | | 1,502,032 |
| | | | |
| Technology – 0.3% | | | | |
| Networking Products – 0.2% |
| Cisco Systems, Inc. |
4.950% 02/15/19 | | 525,000 | | 551,870 |
| | | | |
Networking Products Total | | | | 551,870 |
|
| Software – 0.1% |
| Oracle Corp. |
6.500% 04/15/38 | | 325,000 | | 376,718 |
| | | | |
Software Total | | | | 376,718 |
| | | | |
Technology Total | | | | 928,588 |
| | | | |
| Utilities – 1.2% | | | | |
| Electric – 0.9% |
| Commonwealth Edison Co. |
5.950% 08/15/16 | | 350,000 | | 381,612 |
|
| Consolidated Edison Co. of New York |
5.850% 04/01/18 | | 350,000 | | 381,511 |
| | | | |
| | | Par ($) | | Value ($) |
| Dominion Resources, Inc. |
5.200% 08/15/19 | | 460,000 | | 477,626 |
| Indiana Michigan Power Co. |
5.650% 12/01/15 | | 523,000 | | 552,975 |
|
| Pacific Gas & Electric Co. |
5.800% 03/01/37 | | 510,000 | | 552,128 |
|
| Progress Energy, Inc. |
7.750% 03/01/31 | | 325,000 | | 406,808 |
|
| Southern California Edison Co. |
5.000% 01/15/14 | | 450,000 | | 483,613 |
| | | | |
Electric Total | | | | 3,236,273 |
|
| Gas – 0.3% |
| Atmos Energy Corp. |
6.350% 06/15/17 | | 400,000 | | 433,866 |
|
| Sempra Energy |
6.500% 06/01/16 | | 450,000 | | 497,449 |
| | | | |
Gas Total | | | | 931,315 |
| | | | |
Utilities Total | | | | 4,167,588 |
| | | | |
Total Corporate Fixed-Income Bonds & Notes (cost of $39,103,330) | | 39,755,904 |
|
Government & Agency Obligations – 6.2% |
| Foreign Government Obligations – 0.7% |
| Province of Ontario |
5.450% 04/27/16 | | 900,000 | | 1,005,589 |
|
| Province of Quebec |
4.625% 05/14/18 | | 760,000 | | 792,083 |
|
| United Mexican States |
7.500% 04/08/33 | | 575,000 | | 682,812 |
| | | | |
Foreign Government Obligations Total | | 2,480,484 |
| | | | |
| U.S. Government Agencies – 1.0% |
| Federal Home Loan Bank |
5.500% 08/13/14 | | 2,055,000 | | 2,329,012 |
|
| Federal Home Loan Mortgage Corp. |
3.125% 10/25/10 (j) | | 95,000 | | 97,573 |
5.500% 08/23/17 | | 1,300,000 | | 1,479,839 |
| | | | |
U.S. Government Agencies Total | | 3,906,424 |
| | | | |
| U.S. Government Obligations – 4.5% |
| U.S. Treasury Bond |
5.375% 02/15/31 | | 7,781,000 | | 9,244,801 |
|
| U.S. Treasury Inflation Indexed Bond |
3.500% 01/15/11 | | 2,678,949 | | 2,788,620 |
See Accompanying Notes to Financial Statements.
15
Columbia Liberty Fund
September 30, 2009
Government & Agency Obligations (continued)
| | | | |
| | | Par ($) | | Value ($) |
| U.S. Government Obligations (continued) |
| U.S. Treasury Note |
0.875% 04/30/11 | | 4,420,000 | | 4,432,084 |
| | | | |
U.S. Government Obligations Total | | 16,465,505 |
| | | | |
Total Government & Agency Obligations (cost of $21,643,276) | | 22,852,413 |
|
Commercial Mortgage-Backed Securities – 4.6% |
| Bear Stearns Commercial Mortgage Securities |
5.6947% 09/11/38 (10/01/09) (e)(k) | | 1,500,000 | | 1,516,774 |
| |
| Citigroup/Deutsche Bank Commercial Mortgage Trust | | |
5.366% 12/11/49 (10/01/09) (e)(k) | | 1,010,000 | | 686,209 |
|
| GE Capital Commercial Mortgage Corp. |
4.819% 01/10/38 | | 1,375,000 | | 1,408,768 |
|
| Greenwich Capital Commercial Funding Corp. |
5.918% 07/10/38 (10/01/09) (e)(k) | | 1,500,000 | | 1,372,349 |
| |
| JPMorgan Chase Commercial Mortgage Securities Corp. | | |
4.780% 07/15/42 | | 630,000 | | 531,533 |
5.201% 08/12/37 (10/01/09) (e)(k) | | 750,000 | | 780,784 |
5.440% 06/12/47 | | 2,040,000 | | 1,752,759 |
5.447% 06/12/47 | | 1,023,000 | | 917,695 |
5.525% 04/15/43 (10/01/09) (e)(k) | | 2,902,000 | | 2,213,675 |
|
| LB-UBS Commercial Mortgage Trust |
6.510% 12/15/26 | | 2,827,399 | | 2,922,371 |
|
| Morgan Stanley Capital I |
5.385% 03/12/44 (10/01/09) (e)(k) | | 2,800,000 | | 2,677,552 |
| | | | |
Total Commercial Mortgage-Backed Securities (cost of $17,503,343) | | 16,780,469 |
|
Collateralized Mortgage Obligations – 2.2% |
| Agency – 0.4% |
| Federal Home Loan Mortgage Corp. |
4.500% 08/15/28 | | 380,000 | | 397,622 |
|
| Federal National Mortgage Association |
5.000% 12/25/15 | | 952,573 | | 968,144 |
| | | | |
Agency Total | | 1,365,766 |
| | | | |
| | | Par ($) | | Value ($) |
| Non-Agency – 1.8% |
| Bear Stearns Adjustable Rate Mortgage Trust |
5.426% 02/25/47 (10/01/09) (e)(k) | | 1,088,663 | | 657,591 |
|
| Countrywide Alternative Loan Trust |
5.250% 03/25/35 | | 1,354,795 | | 1,078,332 |
5.250% 08/25/35 | | 284,340 | | 236,573 |
5.500% 10/25/35 | | 983,941 | | 742,776 |
|
| JPMorgan Mortgage Trust |
6.007% 10/25/36 (10/01/09) (e)(k) | | 1,711,819 | | 1,402,434 |
|
| Lehman Mortgage Trust |
6.500% 01/25/38 | | 1,541,332 | | 1,107,833 |
|
| Residential Asset Securitization Trust |
4.500% 08/25/34 | | 1,292,015 | | 1,130,675 |
|
Washington Mutual Alternative Mortgage
Pass-Through Certificates |
5.500% 07/25/35 | | 523,799 | | 439,277 |
| | | | |
Non-Agency Total | | 6,795,491 |
| | | | |
Total Collateralized Mortgage Obligations (cost of $10,163,525) | | 8,161,257 |
|
Asset-Backed Securities – 1.7% |
| Citicorp Residential Mortgage Securities, Inc. | | |
6.080% 06/25/37 | | 1,050,000 | | 961,924 |
|
| Ford Credit Auto Owner Trust |
5.470% 06/15/12 | | 1,470,000 | | 1,549,140 |
|
| Franklin Auto Trust |
5.360% 05/20/16 | | 1,890,000 | | 1,898,916 |
|
| Green Tree Financial Corp. |
6.870% 01/15/29 | | 279,577 | | 264,283 |
|
| Harley-Davidson Motorcycle Trust |
5.350% 03/15/13 | | 1,434,375 | | 1,480,965 |
| | | | |
Total Asset-Backed Securities
(cost of $6,116,392) | | 6,155,228 |
|
Convertible Preferred Stocks – 0.3% |
| | | Shares | | |
| Health Care – 0.1% |
| Pharmaceuticals – 0.1% |
Schering-Plough Corp., 6.000% | | 1,800 | | 436,860 |
| | | | |
Pharmaceuticals Total | | 436,860 |
| | | | |
Health Care Total | | 436,860 |
See Accompanying Notes to Financial Statements.
16
Columbia Liberty Fund
September 30, 2009
Convertible Preferred Stocks (continued)
| | | | | |
| | | Shares | | Value ($) | |
| Materials – 0.2% | | | | | |
| Metals & Mining – 0.2% | |
Freeport-McMoRan Copper & Gold, Inc., 6.750% | | 8,400 | | 865,200 | |
| | | | | |
Metals & Mining Total | | | | 865,200 | |
| | | | | |
Materials Total | | | | 865,200 | |
| | | | | |
Total Convertible Preferred Stocks
(cost of $804,658) | | 1,302,060 | |
| | | |
|
Rights – 0.0% | |
| | | Units | | | |
| Financials – 0.0% | |
BNP Paribas Ltd. Expires 10/13/09 | | 8,657 | | 18,749 | |
| | | | | |
Financials Total | | | | 18,749 | |
| | | | | |
Total Rights (cost of $—) | | | | 18,749 | |
|
Short-Term Obligation – 5.3% | |
| | | Par ($) | | | |
Repurchase agreement with Fixed Income Clearing Corp., dated 09/30/09, due 10/01/09, at 0.010%, collateralized by U.S. Government Agency obligations with various maturities to 01/22/18, market value $19,680,011 (repurchase proceeds $19,281,005) | | 19,281,000 | | 19,281,000 | |
| | | | | |
Total Short-Term Obligation
(cost of $19,281,000) | | 19,281,000 | |
| | | | | |
Total Investments – 101.1%
(cost of $334,160,576) (l) | | 370,229,023 | |
| | | | | |
Other Assets & Liabilities, Net – (1.1)% | | (4,192,230 | ) |
| | | | | |
Net Assets – 100.0% | | 366,036,793 | |
Notes to Investment Portfolio:
| (a) | Non-income producing security. |
| (b) | Denotes a restricted security, which is subject to restrictions on resale under federal securities laws or in transactions exempt from registration. At September 30, 2009, the value of these securities amounted to $5,593,774, which represents 1.5% of net assets. |
| | | | | | | | | | | |
Security | | Acquisition
Date | | Par/Shares | | Acquisition
Cost | | Market
Value |
AGFC Capital Trust I, 6.000%, 01/15/67 | | 01/17/2007 | | $ | 725,000 | | $ | 723,238 | | $ | 290,000 |
ANZ National International Ltd., 6.200%, 07/19/13 | | 04/27/2009 -
05/19/2009 | | | 650,000 | | | 657,050 | | | 711,245 |
Citicorp Lease Pass-Through Trust, 8.040%, 12/15/19 | | 01/06/2000 &
04/12/2001 | | | 1,360,000 | | | 1,371,414 | | | 1,345,912 |
HSBC Capital Funding LP,
9.547%, 12/31/49 | | 01/02/2003 | | | 765,000 | | | 935,875 | | | 772,650 |
Miller Brewing Co., 5.500%, 08/15/13 | | 06/09/2009 | | | 441,000 | | | 450,971 | | | 466,065 |
National Bank of Greece SA | | 07/05/06 -
02/26/09 | | | 19,610 | | | 622,109 | | | 709,118 |
Roche Holdings, Inc., 6.000%, 03/01/19 | | 07/30/2009 | | | 560,000 | | | 609,022 | | | 623,358 |
Cellco Partnership/ Verizon Wireless Capital LLC,
5.550%, 02/01/14 | | 01/30/2009 | | | 625,000 | | | 649,925 | | | 675,426 |
| | | | | | | | | | | |
| | | | | | | | | | $ | 5,593,774 |
| | | | | | | | | | | |
| (c) | Security, or a portion thereof, purchased on a delayed delivery basis. |
| (d) | Security exempt from registration pursuant to Rule 144A under the Securities Act of 1933. These securities may be resold in transactions exempt from registration, normally to qualified institutional buyers. At September 30, 2009, the value of these securities, which are not illiquid, amounted to $4,884,656, which represents 1.3% of net assets. |
| (e) | The interest rate shown on floating rate or variable rate securities reflects the rate at September 30, 2009. |
| (f) | Security is guaranteed by the Federal Deposit Insurance Company. |
| (g) | Investments in affiliates during the twelve months ended September 30, 2009: |
Security name: Merrill Lynch & Co., Inc., 6.050%, 08/15/12
| | | |
Par as of 09/30/08: | | $ | 725,000 |
Par purchased: | | $ | — |
Par sold: | | $ | — |
Par as of 09/30/09: | | $ | 725,000 |
Net realized gain (loss): | | $ | — |
Interest income earned: | | $ | 43,863 |
Value at end of period: | | $ | 773,203 |
As of January 1, 2009, Merrill Lynch & Co., Inc. is a wholly owned subsidiary of Bank of America Corporation and an affiliate of Columbia Management.
| (h) | The issuer has filed for bankruptcy protection under Chapter 11 and is in default of certain debt covenants. Income is not being accrued. At September 30, 2009, the value of this security amounted to $133,125 which represents less than 0.1% of net assets. |
| (i) | Represents fair value as determined in good faith under procedures approved by the Board of Trustees. The value of this security amounted to $133,125, which represents less than 0.1% of net assets. |
| (j) | All of this security with a market value of $97,573 is pledged as collateral for open futures contracts. |
| (k) | Parenthetical date represents the next reset date for the security. |
| (l) | Cost for federal income tax purposes is $337,401,198. |
See Accompanying Notes to Financial Statements.
17
Columbia Liberty Fund
September 30, 2009
The following table summarizes the inputs used, as of September 30, 2009, 2009 in valuing the Fund’s assets:
| | | | | | | | | | | | |
Description | | Quoted Prices
(Level 1) | | Other
Significant
Observable
Inputs
(Level 2) | | Significant
Unobser-
vable
Inputs
(Level 3) | | Total |
Common Stocks | | | | | | | | | | | | |
Consumer Discretionary | | $ | 17,185,082 | | $ | 4,317,087 | | $ | — | | $ | 21,502,169 |
Consumer Staples | | | 16,473,543 | | | 3,772,167 | | | — | | | 20,245,710 |
Energy | | | 20,825,440 | | | 2,552,344 | | | — | | | 23,377,784 |
Financials | | | 26,997,039 | | | 5,472,544 | | | — | | | 32,469,583 |
Health Care | | | 19,907,089 | | | 3,528,480 | | | — | | | 23,435,569 |
Industrials | | | 17,588,765 | | | 5,693,145 | | | — | | | 23,281,910 |
Information Technology | | | 35,096,439 | | | 3,651,222 | | | — | | | 38,747,661 |
Materials | | | 7,186,456 | | | 3,084,814 | | | — | | | 10,271,270 |
Telecommunication Services | | | 3,447,655 | | | 1,190,536 | | | — | | | 4,638,191 |
Utilities | | | 5,336,915 | | | 886,609 | | | — | | | 6,223,524 |
| | | | | | | | | | | | |
Total Common Stocks | | | 170,044,423 | | | 34,148,948 | | | — | | | 204,193,371 |
| | | | | | | | | | | | |
Mortgage-Backed Securities | | | 5,924,044 | | | 45,804,528 | | | — | | | 51,728,572 |
| | | | | | | | | | | | |
Corporate Fixed-Income Bonds & Notes | | | | | | | | | | | | |
Basic Materials | | | — | | | 1,201,968 | | | — | | | 1,201,968 |
Communication | | | — | | | 4,471,199 | | | — | | | 4,471,199 |
Consumer Cyclical | | | — | | | 850,901 | | | — | | | 850,901 |
Consumer Non-Cyclical | | | — | | | 2,618,319 | | | — | | | 2,618,319 |
Energy | | | — | | | 3,783,095 | | | — | | | 3,783,095 |
Financials | | | — | | | 20,232,214 | | | — | | | 20,232,214 |
Industrials | | | — | | | 1,502,032 | | | — | | | 1,502,032 |
Technology | | | — | | | 928,588 | | | — | | | 928,588 |
Utilities | | | — | | | 4,167,588 | | | — | | | 4,167,588 |
| | | | | | | | | | | | |
Total Corporate Fixed-Income Bonds & Notes | | | — | | | 39,755,904 | | | — | | | 39,755,904 |
| | | | | | | | | | | | |
Total Government & Agency Obligations | | | 16,465,505 | | | 6,386,908 | | | — | | | 22,852,413 |
| | | | | | | | | | | | |
Total Commercial Mortgage-Backed Securities | | | — | | | 16,780,469 | | | — | | | 16,780,469 |
| | | | | | | | | | | | |
Total Collateralized Mortgage Obligations | | | — | | | 8,161,257 | | | — | | | 8,161,257 |
| | | | | | | | | | | | |
Total Asset-Backed Securities | | | — | | | 6,155,228 | | | — | | | 6,155,228 |
| | | | | | | | | | | | |
Total Convertible Preferred Stock | | | 1,302,060 | | | — | | | — | | | 1,302,060 |
| | | | | | | | | | | | |
Total Rights | | | — | | | 18,749 | | | — | | | 18,749 |
| | | | | | | | | | | | |
Total Short-
Term Obligation | | | — | | | 19,281,000 | | | — | | | 19,281,000 |
| | | | | | | | | | | | |
Total Investments | | | 193,736,032 | | | 176,492,991 | | | — | | | 370,229,023 |
| | | | | | | | | | | | |
Total Futures Contracts | | | 38,618 | | | — | | | — | | | 38,618 |
| | | | | | | | | | | | |
Total | | $ | 193,774,650 | | $ | 176,492,991 | | $ | — | | $ | 370,267,641 |
| | | | | | | | | | | | |
The Fund’s assets assigned to the Level 2 input category include certain foreign securities for which a third party statistical pricing service may be employed for purposes of fair market valuation.
For more information on valuation inputs, and their aggregation into the levels used in the table above, please refer to the Security Valuation section in the accompanying Notes to Financial Statements.
At September 30, 2009, the Fund held the following open long futures contracts:
Equity Risk
| | | | | | | | | | | | | |
Type | | Number of
Contracts | | Value | | Aggregate
Face Value | | Expiration
Date | | Unrealized
Appreciation |
S&P 500 Index Futures | | 33 | | $ | 8,686,425 | | $ | 8,647,807 | | Dec–09 | | $ | 38,618 |
At September 30, 2009, cash of $1,415,000 was pledged as collateral for open futures contracts.
At September 30, 2009, the asset allocation of the Fund is as follows:
| | | |
Asset Allocation (Unaudited) | | % of
Net Assets | |
Common Stocks | | 55.8 | |
Mortgage-Backed Securities | | 14.1 | |
Corporate Fixed-Income Bonds & Notes | | 10.9 | |
Government & Agency Obligations | | 6.2 | |
Commercial Mortgage-Backed Securities | | 4.6 | |
Collateralized Mortgage Obligations | | 2.2 | |
Asset-Backed Securities | | 1.7 | |
Convertible Preferred Stocks | | 0.3 | |
Rights | | 0.0 | * |
| | | |
| | 95.8 | |
Short-Term Obligation | | 5.3 | |
Other Assets & Liabilities, Net | | (1.1 | ) |
| | | |
| | 100.0 | |
| | | |
* Rounds to less than 0.1%
| | |
Acronym | | Name |
| ADR | | American Depositary Receipt |
| TBA | | To Be Announced |
See Accompanying Notes to Financial Statements.
18
Statement of Assets and Liabilities – Columbia Liberty Fund
September 30, 2009
| | | | | |
| | | | | ($) | |
| Assets | | Unaffiliated investments, at identified cost | | 333,435,576 | |
| | Affiliated investments, at identified cost | | 725,000 | |
| | | | | |
| | Total investments, at identified cost | | 334,160,576 | |
| | |
| | Unaffiliated investments, at value | | 369,455,820 | |
| | Affiliated investments, at value | | 773,203 | |
| | | | | |
| | Total investments, at value | | 370,229,023 | |
| | |
| | Cash | | 16,723 | |
| | Cash collateral for open futures contracts | | 1,415,000 | |
| | Foreign currency (cost of $235,036) | | 236,300 | |
| | Receivable for: | | | |
| | Investments sold | | 1,915,268 | |
| | Fund shares sold | | 96,659 | |
| | Dividends | | 224,985 | |
| | Interest | | 998,966 | |
| | Foreign tax reclaims | | 54,395 | |
| | Trustees’ deferred compensation plan | | 84,049 | |
| | Other assets | | 10,972 | |
| | | | | |
| | Total Assets | | 375,282,340 | |
| | |
| Liabilities | | Payable for: | | | |
| | Investments purchased | | 2,354,325 | |
| | Investments purchased on a delayed delivery basis | | 5,903,073 | |
| | Fund shares repurchased | | 335,381 | |
| | Futures variation margin | | 15,675 | |
| | Foreign capital gains tax withheld | | 70,593 | |
| | Investment advisory fee | | 164,497 | |
| | Pricing and bookkeeping fees | | 11,889 | |
| | Transfer agent fee | | 94,730 | |
| | Trustees’ fees | | 833 | |
| | Audit fee | | 50,675 | |
| | Custody fee | | 24,000 | |
| | Distribution and service fees | | 82,210 | |
| | Chief compliance officer expenses | | 176 | |
| | Trustees’ deferred compensation plan | | 84,049 | |
| | Other liabilities | | 53,441 | |
| | | | | |
| | Total Liabilities | | 9,245,547 | |
| | |
| | | | | |
| | Net Assets | | 366,036,793 | |
| | |
| Net Assets Consist of | | Paid-in capital | | 411,078,483 | |
| | Undistributed net investment income | | 376,153 | |
| | Accumulated net realized loss | | (81,459,452 | ) |
| | Net unrealized appreciation (depreciation) on: | | | |
| | Investments | | 36,068,447 | |
| | Foreign currency translations | | 5,137 | |
| | Futures contracts | | 38,618 | |
| | Foreign capital gains tax | | (70,593 | ) |
| | | | | |
| | Net Assets | | 366,036,793 | |
See Accompanying Notes to Financial Statements.
19
Statement of Assets and Liabilities (continued) – Columbia Liberty Fund
September 30, 2009
| | | | | | |
| | | | | | |
| Class A | | Net assets | | $ | 348,921,545 | |
| | Shares outstanding | | | 49,485,664 | |
| | Net asset value per share | | $ | 7.05 | (a) |
| | Maximum sales charge | | | 5.75 | % |
| | Maximum offering price per share ($7.05/0.9425) | | $ | 7.48 | (b) |
| | |
| Class B | | Net assets | | $ | 11,965,433 | |
| | Shares outstanding | | | 1,689,119 | |
| | Net asset value and offering price per share | | $ | 7.08 | (a) |
| | |
| Class C | | Net assets | | $ | 4,247,196 | |
| | Shares outstanding | | | 601,254 | |
| | Net asset value and offering price per share | | $ | 7.06 | (a) |
| | |
| Class Z | | Net assets | | $ | 902,619 | |
| | Shares outstanding | | | 118,917 | |
| | Net asset value, offering and redemption price per share | | $ | 7.59 | |
| (a) | Redemption price per share is equal to net asset value less any applicable contingent deferred sales charge. |
| (b) | On sales of $50,000 or more the offering price is reduced. |
See Accompanying Notes to Financial Statements.
20
Statement of Operations – Columbia Liberty Fund
For the Year Ended September 30, 2009
| | | | | |
| | | | | ($) | |
| Investment Income | | Dividends | | 4,626,044 | |
| | Interest | | 7,399,011 | |
| | Interest from affiliates | | 43,863 | |
| | Securities lending | | 40 | |
| | Foreign taxes withheld | | (87,380 | ) |
| | | | | |
| | Total Investment Income | | 11,981,578 | |
| | |
| Expenses | | Investment advisory fee | | 1,869,229 | |
| | Distribution fee: | | | |
| | Class B | | 111,573 | |
| | Class C | | 27,289 | |
| | Service fee: | | | |
| | Class A | | 772,410 | |
| | Class B | | 35,911 | |
| | Class C | | 8,750 | |
| | Pricing and bookkeeping fees | | 114,555 | |
| | Transfer agent fee | | 660,040 | |
| | Trustees’ fees | | 32,502 | |
| | Custody fee | | 146,319 | |
| | Chief compliance officer expenses | | 689 | |
| | Other expenses | | 309,925 | |
| | | | | |
| | Total Expenses | | 4,089,192 | |
| | Expense reductions | | (210 | ) |
| | | | | |
| | Net Expenses | | 4,088,982 | |
| | |
| | | | | |
| | Net Investment Income | | 7,892,596 | |
| | |
| Net Realized and Unrealized Gain (Loss) on Investments, Futures Contracts and Foreign Currency Transactions | | Net realized gain (loss) on: | | | |
| | Investments | | (65,032,936 | ) |
| | Net realized loss on violation of investment restriction (See Note 11) | | (7,944 | ) |
| | Foreign currency transactions | | (57,022 | ) |
| | Futures contracts | | (951,729 | ) |
| | Reimbursement of realized loss on violation of investment restriction (See Note 11) | | 7,944 | |
| | | | | |
| | Net realized loss | | (66,041,687 | ) |
| | |
| | Net change in unrealized appreciation (depreciation) on: | | | |
| | Investments | | 53,330,019 | |
| | Foreign currency translations | | 12,894 | |
| | Futures contracts | | 339,470 | |
| | Foreign capital gains tax | | (70,593 | ) |
| | | | | |
| | Net change in unrealized appreciation (depreciation) | | 53,611,790 | |
| | | | | |
| | Net Loss | | (12,429,897 | ) |
| | |
| | | | | |
| | Net Decrease Resulting from Operations | | (4,537,301 | ) |
See Accompanying Notes to Financial Statements.
21
Statement of Changes in Net Assets – Columbia Liberty Fund
| | | | | | | | |
| | | | | Year Ended September 30, | |
| Increase (Decrease) in Net Assets | | | | 2009 ($) | | | 2008 ($) | |
| Operations | | Net investment income | | 7,892,596 | | | 10,945,918 | |
| | Net realized loss on investments, foreign currency transactions, futures contracts and written options | | (66,041,687 | ) | | (7,821,536 | ) |
| | Net change in unrealized appreciation (depreciation) on investments, foreign currency translations, futures contracts and written options | | 53,611,790 | | | (87,478,094 | ) |
| | | | | | | | |
| | Net decrease resulting from operations | | (4,537,301 | ) | | (84,353,712 | ) |
| | | |
| Distributions to Shareholders | | From net investment income: | | | | | | |
| | Class A | | (7,937,444 | ) | | (11,104,201 | ) |
| | Class B | | (263,578 | ) | | (319,877 | ) |
| | Class C | | (62,787 | ) | | (50,399 | ) |
| | Class Z | | (19,444 | ) | | (23,222 | ) |
| | From net realized gains: | | | | | | |
| | Class A | | — | | | (50,512,404 | ) |
| | Class B | | — | | | (4,495,161 | ) |
| | Class C | | — | | | (525,979 | ) |
| | Class Z | | — | | | (76,984 | ) |
| | | | | | | | |
| | Total distributions to shareholders | | (8,283,253 | ) | | (67,108,227 | ) |
| | | |
| | Net Capital Stock Transactions | | (44,655,167 | ) | | (14,970,215 | ) |
| | | | | | | | |
| | Total decrease in net assets | | (57,475,721 | ) | | (166,432,154 | ) |
| | | |
| Net Assets | | | | | | | | |
| | Beginning of period | | 423,512,514 | | | 589,944,668 | |
| | End of period | | 366,036,793 | | | 423,512,514 | |
| | Undistributed net investment income at end of period | | 376,153 | | | 301,747 | |
See Accompanying Notes to Financial Statements.
22
Statement of Changes in Net Assets (continued)– Columbia Liberty Fund
| | | | | | | | | | | | |
| | | Capital Stock Activity | |
| | | Year Ended
September 30, 2009 | | | Year Ended
September 30, 2008 | |
| | | Shares | | | Dollars ($) | | | Shares | | | Dollars ($) | |
Class A | | | | | | | | | | | | |
Subscriptions | | 1,615,185 | | | 9,816,547 | | | 2,207,022 | | | 18,516,910 | |
Distributions reinvested | | 1,176,047 | | | 7,279,444 | | | 6,558,485 | | | 56,303,542 | |
Redemptions | | (8,541,579 | ) | | (52,173,187 | ) | | (8,818,413 | ) | | (73,218,546 | ) |
| | | | | | | | | | | | |
Net increase (decrease) | | (5,750,347 | ) | | (35,077,196 | ) | | (52,906 | ) | | 1,601,906 | |
| | | | |
Class B | | | | | | | | | | | | |
Subscriptions | | 82,928 | | | 496,044 | | | 111,331 | | | 919,752 | |
Distributions reinvested | | 41,084 | | | 251,924 | | | 532,903 | | | 4,631,736 | |
Redemptions | | (1,730,218 | ) | | (10,553,453 | ) | | (2,674,631 | ) | | (22,456,168 | ) |
| | | | | | | | | | | | |
Net decrease | | (1,606,206 | ) | | (9,805,485 | ) | | (2,030,397 | ) | | (16,904,680 | ) |
| | | | |
Class C | | | | | | | | | | | | |
Subscriptions | | 121,898 | | | 763,588 | | | 82,775 | | | 692,833 | |
Distributions reinvested | | 9,606 | | | 59,444 | | | 63,240 | | | 546,221 | |
Redemptions | | (104,380 | ) | | (644,439 | ) | | (139,553 | ) | | (1,145,539 | ) |
| | | | | | | | | | | | |
Net increase | | 27,124 | | | 178,593 | | | 6,462 | | | 93,515 | |
| | | | |
Class Z | | | | | | | | | | | | |
Subscriptions | | 23,681 | | | 151,192 | | | 21,569 | | | 191,142 | |
Distributions reinvested | | 2,750 | | | 18,379 | | | 10,734 | | | 98,502 | |
Redemptions | | (17,473 | ) | | (120,650 | ) | | (5,649 | ) | | (50,600 | ) |
| | | | | | | | | | | | |
Net increase | | 8,958 | | | 48,921 | | | 26,654 | | | 239,044 | |
See Accompanying Notes to Financial Statements.
23
Financial Highlights – Columbia Liberty Fund
Selected data for a share outstanding throughout each period is as follows:
| | | | | | | | | | | | | | | | | | | | |
| | | Year Ended September 30, | |
| Class A Shares | | 2009 | | | 2008 | | | 2007 | | | 2006 | | | 2005 | |
Net Asset Value, Beginning of Period | | $ | 7.15 | | | $ | 9.63 | | | $ | 8.79 | | | $ | 8.36 | | | $ | 7.68 | |
| | | | | |
Income from Investment Operations: | | | | | | | | | | | | | | | | | | | | |
Net investment income (a) | | | 0.15 | | | | 0.18 | | | | 0.19 | | | | 0.18 | | | | 0.15 | |
Net realized and unrealized gain (loss) on investments, foreign currency, futures contracts, foreign capital gains tax and written options | | | (0.10 | ) | | | (1.53 | ) | | | 1.12 | | | | 0.44 | | | | 0.70 | |
| | | | | | | | | | | | | | | | | | | | |
Total from investment operations | | | 0.05 | | | | (1.35 | ) | | | 1.31 | | | | 0.62 | | | | 0.85 | |
| | | | | |
Less Distributions to Shareholders: | | | | | | | | | | | | | | | | | | | | |
From net investment income | | | (0.15 | ) | | | (0.20 | ) | | | (0.21 | ) | | | (0.19 | ) | | | (0.17 | ) |
From net realized gains | | | — | | | | (0.93 | ) | | | (0.26 | ) | | | — | | | | — | |
| | | | | | | | | | | | | | | | | | | | |
Total distributions to shareholders | | | (0.15 | ) | | | (1.13 | ) | | | (0.47 | ) | | | (0.19 | ) | | | (0.17 | ) |
| | | | | |
Net Asset Value, End of Period | | $ | 7.05 | | | $ | 7.15 | | | $ | 9.63 | | | $ | 8.79 | | | $ | 8.36 | |
Total return (b) | | | 1.07 | %(h) | | | (15.83 | )% | | | 15.29 | % | | | 7.47 | %(c)(d) | | | 11.12 | %(d) |
| | | | | |
Ratios to Average Net Assets/Supplemental Data: | | | | | | | | | | | | | | | | | | | | |
Net expenses before interest expense | | | 1.16 | %(e) | | | 1.03 | %(f) | | | 1.04 | %(e) | | | 1.03 | %(e) | | | 1.13 | %(e) |
Interest expense | | | — | | | | — | %(g) | | | — | | | | — | | | | — | |
Net expenses | | | 1.16 | %(e) | | | 1.03 | %(f) | | | 1.04 | %(e) | | | 1.03 | %(e) | | | 1.13 | %(e) |
Waiver/Reimbursement | | | — | | | | — | | | | — | | | | 0.01 | % | | | 0.01 | % |
Net investment income | | | 2.36 | %(e) | | | 2.18 | %(f) | | | 2.06 | %(e) | | | 2.07 | %(e) | | | 1.88 | %(e) |
Portfolio turnover rate | | | 105 | % | | | 88 | % | | | 106 | % | | | 98 | % | | | 83 | % |
Net assets, end of period (000s) | | $ | 348,922 | | | $ | 394,884 | | | $ | 532,413 | | | $ | 514,826 | | | $ | 545,773 | |
| (a) | Per share data was calculated using the average shares outstanding during the period. |
| (b) | Total return at net asset value assuming all distributions reinvested and no initial sales charge or contingent deferred sales charge. |
| (c) | Total return includes a voluntary reimbursement by the investment advisor for a realized investment loss due to a trading error. This reimbursement had an impact of less than 0.01%. |
| (d) | Had the investment advisor and/or any of its affiliates not waived fees or reimbursed a portion of expenses, total return would have been reduced. |
| (e) | The benefits derived from expense reductions had an impact of less than 0.01%. |
| (f) | The benefits derived from expense reductions had an impact of 0.01%. |
| (g) | Rounds to less than 0.01%. |
| (h) | Total return includes a reimbursement of a loss experienced by the Fund due to a compliance violation. This reimbursement had an impact of less than 0.01% on total return. |
See Accompanying Notes to Financial Statements.
24
Financial Highlights – Columbia Liberty Fund
Selected data for a share outstanding throughout each period is as follows:
| | | | | | | | | | | | | | | | | | | | |
| | | Year Ended September 30, | |
| Class B Shares | | 2009 | | | 2008 | | | 2007 | | | 2006 | | | 2005 | |
Net Asset Value, Beginning of Period | | $ | 7.18 | | | $ | 9.62 | | | $ | 8.78 | | | $ | 8.36 | | | $ | 7.68 | |
| | | | | |
Income from Investment Operations: | | | | | | | | | | | | | | | | | | | | |
Net investment income (a) | | | 0.10 | | | | 0.12 | | | | 0.12 | | | | 0.11 | | | | 0.09 | |
Net realized and unrealized gain (loss) on investments, foreign currency, futures contracts, foreign capital gains tax and written options | | | (0.09 | ) | | | (1.54 | ) | | | 1.12 | | | | 0.43 | | | | 0.70 | |
| | | | | | | | | | | | | | | | | | | | |
Total from investment operations | | | 0.01 | | | | (1.42 | ) | | | 1.24 | | | | 0.54 | | | | 0.79 | |
| | | | | |
Less Distributions to Shareholders: | | | | | | | | | | | | | | | | | | | | |
From net investment income | | | (0.11 | ) | | | (0.09 | ) | | | (0.14 | ) | | | (0.12 | ) | | | (0.11 | ) |
From net realized gains | | | — | | | | (0.93 | ) | | | (0.26 | ) | | | — | | | | — | |
| | | | | | | | | | | | | | | | | | | | |
Total distributions to shareholders | | | (0.11 | ) | | | (1.02 | ) | | | (0.40 | ) | | | (0.12 | ) | | | (0.11 | ) |
| | | | | |
Net Asset Value, End of Period | | $ | 7.08 | | | $ | 7.18 | | | $ | 9.62 | | | $ | 8.78 | | | $ | 8.36 | |
Total return (b) | | | 0.32 | %(h) | | | (16.51 | )% | | | 14.46 | % | | | 6.55 | %(c)(d) | | | 10.30 | %(d) |
| | | | | |
Ratios to Average Net Assets/Supplemental Data: | | | | | | | | | | | | | | | | | | | | |
Net expenses before interest expense | | | 1.91 | %(e) | | | 1.78 | %(f) | | | 1.79 | %(e) | | | 1.78 | %(e) | | | 1.88 | %(e) |
Interest expense | | | — | | | | — | %(g) | | | — | | | | — | | | | — | |
Net expenses | | | 1.91 | %(e) | | | 1.78 | %(f) | | | 1.79 | %(e) | | | 1.78 | %(e) | | | 1.88 | %(e) |
Waiver/Reimbursement | | | — | | | | — | | | | — | | | | 0.01 | % | | | 0.01 | % |
Net investment income | | | 1.67 | %(e) | | | 1.39 | %(f) | | | 1.28 | %(e) | | | 1.31 | %(e) | | | 1.14 | %(e) |
Portfolio turnover rate | | | 105 | % | | | 88 | % | | | 106 | % | | | 98 | % | | | 83 | % |
Net assets, end of period (000s) | | $ | 11,965 | | | $ | 23,672 | | | $ | 51,229 | | | $ | 85,766 | | | $ | 130,724 | |
| (a) | Per share data was calculated using the average shares outstanding during the period. |
| (b) | Total return at net asset value assuming all distributions reinvested and no contingent deferred sales charge. |
| (c) | Total return includes a voluntary reimbursement by the investment advisor for a realized investment loss due to a trading error. This reimbursement had an impact of less than 0.01%. |
| (d) | Had the investment advisor and/or any of its affiliates not waived fees or reimbursed a portion of expenses, total return would have been reduced. |
| (e) | The benefits derived from expense reductions had an impact of less than 0.01%. |
| (f) | The benefits derived from expense reductions had an impact of 0.01%. |
| (g) | Rounds to less than 0.01%. |
| (h) | Total return includes a reimbursement of a loss experienced by the Fund due to a compliance violation. This reimbursement had an impact of less than 0.01% on total return. |
See Accompanying Notes to Financial Statements.
25
Financial Highlights – Columbia Liberty Fund
Selected data for a share outstanding throughout each period is as follows:
| | | | | | | | | | | | | | | | | | | | |
| | | Year Ended September 30, | |
| Class C Shares | | 2009 | | | 2008 | | | 2007 | | | 2006 | | | 2005 | |
Net Asset Value, Beginning of Period | | $ | 7.16 | | | $ | 9.59 | | | $ | 8.76 | | | $ | 8.34 | | | $ | 7.66 | |
| | | | | |
Income from Investment Operations: | | | | | | | | | | | | | | | | | | | | |
Net investment income (a) | | | 0.10 | | | | 0.12 | | | | 0.12 | | | | 0.11 | | | | 0.09 | |
Net realized and unrealized gain (loss) on investments, foreign currency, futures contracts, foreign capital gains tax and written options | | | (0.09 | ) | | | (1.53 | ) | | | 1.11 | | | | 0.43 | | | | 0.70 | |
| | | | | | | | | | | | | | | | | | | | |
Total from investment operations | | | 0.01 | | | | (1.41 | ) | | | 1.23 | | | | 0.54 | | | | 0.79 | |
| | | | | |
Less Distributions to Shareholders: | | | | | | | | | | | | | | | | | | | | |
From net investment income | | | (0.11 | ) | | | (0.09 | ) | | | (0.14 | ) | | | (0.12 | ) | | | (0.11 | ) |
From net realized gains | | | — | | | | (0.93 | ) | | | (0.26 | ) | | | — | | | | — | |
| | | | | | | | | | | | | | | | | | | | |
Total distributions to shareholders | | | (0.11 | ) | | | (1.02 | ) | | | (0.40 | ) | | | (0.12 | ) | | | (0.11 | ) |
| | | | | |
Net Asset Value, End of Period | | $ | 7.06 | | | $ | 7.16 | | | $ | 9.59 | | | $ | 8.76 | | | $ | 8.34 | |
Total return (b) | | | 0.33 | %(h) | | | (16.46 | )% | | | 14.38 | % | | | 6.56 | %(c)(d) | | | 10.33 | %(d) |
| | | | | |
Ratios to Average Net Assets/Supplemental Data: | | | | | | | | | | | | | | | | | | | | |
Net expenses before interest expense | | | 1.91 | %(e) | | | 1.78 | %(f) | | | 1.79 | %(e) | | | 1.78 | %(e) | | | 1.88 | %(e) |
Interest expense | | | — | | | | — | %(g) | | | — | | | | — | | | | — | |
Net expenses | | | 1.91 | %(e) | | | 1.78 | %(f) | | | 1.79 | %(e) | | | 1.78 | %(e) | | | 1.88 | %(e) |
Waiver/Reimbursement | | | — | | | | — | | | | — | | | | 0.01 | % | | | 0.01 | % |
Net investment income | | | 1.60 | %(e) | | | 1.43 | %(f) | | | 1.31 | %(e) | | | 1.31 | %(e) | | | 1.13 | %(e) |
Portfolio turnover rate | | | 105 | % | | | 88 | % | | | 106 | % | | | 98 | % | | | 83 | % |
Net assets, end of period (000s) | | $ | 4,247 | | | $ | 4,112 | | | $ | 5,447 | | | $ | 5,076 | | | $ | 5,478 | |
| (a) | Per share data was calculated using the average shares outstanding during the period. |
| (b) | Total return at net asset value assuming all distributions reinvested and no contingent deferred sales charge. |
| (c) | Total return includes a voluntary reimbursement by the investment advisor for a realized investment loss due to a trading error. This reimbursement had an impact of less than 0.01%. |
| (d) | Had the investment advisor and/or any of its affiliates not waived fees or reimbursed a portion of expenses, total return would have been reduced. |
| (e) | The benefits derived from expense reductions had an impact of less than 0.01%. |
| (f) | The benefits derived from expense reductions had an impact of 0.01%. |
| (g) | Rounds to less than 0.01%. |
| (h) | Total return includes a reimbursement of a loss experienced by the Fund due to a compliance violation. This reimbursement had an impact of less than 0.01% on total return. |
See Accompanying Notes to Financial Statements.
26
Financial Highlights – Columbia Liberty Fund
Selected data for a share outstanding throughout each period is as follows:
| | | | | | | | | | | | | | | | | | | | |
| | | Year Ended September 30, | |
| Class Z Shares | | 2009 | | | 2008 | | | 2007 | | | 2006 | | | 2005 | |
Net Asset Value, Beginning of Period | | $ | 7.68 | | | $ | 10.28 | | | $ | 9.34 | | | $ | 8.88 | | | $ | 8.15 | |
| | | | | |
Income from Investment Operations: | | | | | | | | | | | | | | | | | | | | |
Net investment income (a) | | | 0.17 | | | | 0.22 | | | | 0.22 | | | | 0.21 | | | | 0.18 | |
Net realized and unrealized gain (loss) on investments, foreign currency, futures contracts, foreign capital gains tax and written options | | | (0.09 | ) | | | (1.65 | ) | | | 1.21 | | | | 0.46 | | | | 0.74 | |
| | | | | | | | | | | | | | | | | | | | |
Total from investment operations | | | 0.08 | | | | (1.43 | ) | | | 1.43 | | | | 0.67 | | | | 0.92 | |
| | | | | |
Less Distributions to Shareholders: | | | | | | | | | | | | | | | | | | | | |
From net investment income | | | (0.17 | ) | | | (0.24 | ) | | | (0.23 | ) | | | (0.21 | ) | | | (0.19 | ) |
From net realized gains | | | — | | | | (0.93 | ) | | | (0.26 | ) | | | — | | | | — | |
| | | | | | | | | | | | | | | | | | | | |
Total distributions to shareholders | | | (0.17 | ) | | | (1.17 | ) | | | (0.49 | ) | | | (0.21 | ) | | | (0.19 | ) |
| | | | | |
Net Asset Value, End of Period | | $ | 7.59 | | | $ | 7.68 | | | $ | 10.28 | | | $ | 9.34 | | | $ | 8.88 | |
Total return (b) | | | 1.35 | %(h) | | | (15.67 | )% | | | 15.72 | % | | | 7.60 | %(c)(d) | | | 11.33 | %(d) |
| | | | | |
Ratios to Average Net Assets/Supplemental Data: | | | | | | | | | | | | | | | | | | | | |
Net expenses before interest expense | | | 0.92 | %(e) | | | 0.79 | %(f) | | | 0.80 | %(e) | | | 0.79 | %(e) | | | 0.90 | %(e) |
Interest expense | | | — | | | | — | %(g) | | | — | | | | — | | | | — | |
Net expenses | | | 0.92 | %(e) | | | 0.79 | %(f) | | | 0.80 | %(e) | | | 0.79 | %(e) | | | 0.90 | %(e) |
Waiver/Reimbursement | | | — | | | | — | | | | — | | | | 0.01 | % | | | 0.01 | % |
Net investment income | | | 2.58 | %(e) | | | 2.44 | %(f) | | | 2.29 | %(e) | | | 2.34 | %(e) | | | 2.11 | %(e) |
Portfolio turnover rate | | | 105 | % | | | 88 | % | | | 106 | % | | | 98 | % | | | 83 | % |
Net assets, end of period (000s) | | $ | 903 | | | $ | 845 | | | $ | 856 | | | $ | 1,175 | | | $ | 700 | |
| (a) | Per share data was calculated using the average shares outstanding during the period. |
| (b) | Total return at net asset value assuming all distributions reinvested. |
| (c) | Total return includes a voluntary reimbursement by the investment advisor for a realized investment loss due to a trading error. This reimbursement had an impact of less than 0.01%. |
| (d) | Had the investment advisor and/or any of its affiliates not waived fees or reimbursed a portion of expenses, total return would have been reduced. |
| (e) | The benefits derived from expense reductions had an impact of less than 0.01%. |
| (f) | The benefits derived from expense reductions had an impact of 0.01%. |
| (g) | Rounds to less than 0.01%. |
| (h) | Total return includes a reimbursement of a loss experienced by the Fund due to a compliance violation. This reimbursement had an impact of less than 0.01% on total return. |
See Accompanying Notes to Financial Statements.
27
Notes to Financial Statements – Columbia Liberty Fund
September 30, 2009
Note 1. Organization
Columbia Liberty Fund (the “Fund”), a series of Columbia Funds Series Trust I (the “Trust”), is a diversified portfolio. The Trust is a Massachusetts business trust registered under the Investment Company Act of 1940, as amended (the “1940 Act”), as an open-end management investment company.
Investment Objective
The Fund seeks total return, consisting of current income and long-term capital appreciation.
Fund Shares
The Trust may issue an unlimited number of shares, and the Fund offers four classes of shares: Class A, Class B, Class C and Class Z. Each share class has its own expense structure and sales charges, as applicable. Effective June 22, 2009, the Fund no longer accepts investments in Class B shares from new or existing investors in the Fund’s Class B shares, except in connection with the reinvestment of any dividend and/or capital gain distributions in Class B shares of the Fund, and exchanges by existing Class B shareholders of other Columbia Funds.
Class A shares are subject to a maximum front-end sales charge of 5.75% based on the amount of initial investment. Class A shares purchased without an initial sales charge in accounts aggregating $1 million to $50 million at the time of purchase are subject to a 1.00% contingent deferred sales charge (“CDSC”) if the shares are sold within one year after purchase. Class B shares are subject to a maximum CDSC of 5.00% based upon the holding period after purchase. Class B shares will convert to Class A shares eight years after purchase. Class C shares are subject to a 1.00% CDSC on shares sold within one year after purchase. Class Z shares are offered continuously at net asset value. There are certain restrictions on the purchase of Class Z shares, as described in the Fund’s prospectus.
Note 2. Significant Accounting Policies
The preparation of financial statements in accordance with accounting principles generally accepted in the United States of America (“GAAP”) requires management to make certain estimates and assumptions that affect the reported amounts of assets and liabilities, the disclosure of contingent assets and liabilities at the date of the financial statements and the reported amounts of revenue and expenses during the reporting period. Actual results could differ from those estimates. Management has evaluated the events and transactions that have occurred through November 20, 2009, the date the financial statements were issued, and noted no items requiring adjustment of the financial statements or additional disclosures except as disclosed in Note 13.
The following is a summary of significant accounting policies consistently followed by the Fund in the preparation of its financial statements.
Security Valuation
Debt securities generally are valued by pricing services approved by the Trust’s Board of Trustees, based upon market transactions for normal, institutional-size trading units of similar securities. The services may use various pricing techniques which take into account appropriate factors such as yield, quality, coupon rate, maturity, type of issue, trading characteristics and other data, as well as broker quotes. Debt securities for which quotations are readily available are valued at an over-the-counter or exchange bid quotation.
Certain debt securities, which tend to be more thinly traded and of lesser quality, are priced based on fundamental analysis of the financial condition of the issuer and the estimated value of any collateral. Valuations developed through pricing techniques may vary from the actual amounts realized upon sale of the securities, and the potential variation may be greater for those securities valued using fundamental analysis.
Equity securities are valued at the last sale price on the principal exchange on which they trade, except for securities traded on the NASDAQ, which are valued at the NASDAQ official close price. Unlisted securities or listed securities for which there were no sales during the day are valued at the closing bid price on such exchanges or over-the-counter markets.
Short-term investments maturing in 60 days or less are valued at amortized cost, which approximates market value.
Futures contracts are valued at the settlement price established each day by the board of trade or exchange on which they are traded.
28
Columbia Liberty Fund
September 30, 2009
Foreign securities are generally valued at the last sale price on the foreign exchange or market on which they trade. If any foreign share prices are not readily available as a result of limited share activity, the securities are valued at the last sale price of the local shares in the principal market in which such securities are normally traded.
Generally, trading in foreign securities is substantially completed each day at various times prior to the close of the New York Stock Exchange (“NYSE”). The values of such securities used in computing the net asset value of the Fund’s shares are determined as of such times. Foreign currency exchange rates are generally determined at 4:00 p.m. Eastern (U.S.) time. Occasionally, events affecting the values of such foreign securities and such exchange rates may occur between the times at which they are determined and the close of the customary trading session of the NYSE, which would not be reflected in the computation of the Fund’s net asset value. If events materially affecting the values of such foreign securities occur and it is determined that market quotations are not reliable, then these foreign securities will be valued at their fair value using procedures approved by the Board of Trustees.
The Fund may use a systematic fair valuation model provided by an independent third party to value securities principally traded in foreign markets in order to adjust for possible stale pricing that may occur between the close of the foreign exchanges and the time for valuation.
Investments for which market quotations are not readily available, or that have quotations which management believes are not reliable, are valued at fair value as determined in good faith under consistently applied procedures established by and under the general supervision of the Board of Trustees. If a security is valued at fair value, such value is likely to be different from the last quoted market price for the security. The determination of fair value often requires significant judgment. To determine fair value, management may use assumptions including but not limited to future cash flows and estimated risk premiums. Multiple inputs from various sources may be used to determine value.
Management establishes a hierarchy that prioritizes the inputs to valuation techniques used to measure fair value giving the highest priority to unadjusted quoted prices in active markets for identical securities (level 1 measurements) and the lowest priority to unobservable inputs (level 3 measurements) when market prices are not readily available or reliable. The three levels of the fair value hierarchy are described below:
| n | | Level 1 – quoted prices in active markets for identical securities |
| n | | Level 2 – prices determined using other significant observable inputs (including quoted prices for similar securities, interest rates, prepayment speeds, credit risk and others) |
| n | | Level 3 – prices determined using significant unobservable inputs. In situations where quoted prices or observable inputs are unavailable or less reliable, unobservable inputs may be used. Unobservable inputs may include management’s own assumptions about the factors market participants would use in pricing an investment. |
The inputs or methodology used for valuing securities are not necessarily an indication of the risk associated with investing in those securities.
Security Transactions
Security transactions are accounted for on the trade date. Cost is determined and gains (losses) are based upon the specific identification method for both financial statement and federal income tax purposes.
Management is required to provide disclosures regarding the Fund’s derivative instruments and hedging activities, by providing qualitative disclosures about the objectives and strategies for using derivatives, quantitative data about the fair value of and gains and losses on derivative contracts, and details of credit-risk-related contingent features in their derivative contracts. For additional information on derivative instruments, please see Note 6.
Repurchase Agreements
The Fund may engage in repurchase agreement transactions with institutions that Columbia Management Advisors, LLC (“Columbia”), the Fund’s investment advisor, has determined are creditworthy. The Fund, through its custodian, receives delivery of the underlying securities collateralizing a repurchase agreement. Columbia is responsible for determining that the collateral is at least equal, at all times, to the value of the repurchase obligation including interest. A repurchase agreement transaction involves certain risks in the event of default or insolvency of
29
Columbia Liberty Fund
September 30, 2009
the counterparty. These risks include possible delays in or restrictions on the Fund’s ability to dispose of the underlying securities and a possible decline in the value of the underlying securities during the period while the Fund seeks to assert its rights.
Treasury Inflation Protected Securities
The Fund may invest in treasury inflation protected securities (“TIPS”). The principal amount of TIPS is adjusted periodically and is increased for inflation or decreased for deflation based on a monthly published index. Interest payments are based on the adjusted principal at the time the interest is paid. These adjustments are recorded as interest income on the Statement of Operations.
Foreign Currency Transactions and Translations
The values of all assets and liabilities quoted in foreign currencies are translated into U.S. dollars at that day’s exchange rates. Net realized and unrealized gains (losses) on foreign currency transactions and translations include gains (losses) arising from the fluctuation in exchange rates between trade and settlement dates on securities transactions, gains (losses) arising from the disposition of foreign currency and currency gains (losses) between the accrual and payment dates on dividends, interest income and foreign withholding taxes.
For financial statement purposes, the Fund does not distinguish that portion of gains (losses) on investments which is due to changes in foreign exchange rates from that which is due to changes in market prices of the investments. Such fluctuations are included with the net realized and unrealized gains (losses) on investments on the Statement of Operations.
Income Recognition
Interest income is recorded on the accrual basis. Premium and discount are amortized and accreted, respectively, on all debt securities, unless otherwise noted.
Corporate actions and dividend income are recorded on the ex-date except for certain foreign securities which are recorded as soon after the ex-date as the Fund becomes aware of such, net of any non-reclaimable tax withholdings.
Distributions received from real estate investment trusts (REITs) in excess of their income are recorded as a reduction of the cost of the related investments. If the Fund no longer owns the applicable securities, any distributions received in excess of income are recorded as realized gains.
Awards from class action litigation are recorded as a reduction of cost if the Fund still owns the applicable securities on the payment date. If the Fund no longer owns the applicable securities, the proceeds are recorded as realized gains.
The value of additional securities received as an income payment is recorded as income and as the cost basis of such securities.
Expenses
General expenses of the Trust are allocated to the Fund and other series of the Trust based upon relative net assets or other expense allocation methodologies determined by the nature of the expense. Expenses directly attributable to the Fund are charged to the Fund.
Determination of Class Net Asset Value
All income, expenses (other than class-specific expenses, as shown on the Statement of Operations) and realized and unrealized gains (losses) are allocated to each class of the Fund on a daily basis, based on the relative net assets of each class, for purposes of determining the net asset value of each class.
Federal Income Tax Status
The Fund intends to qualify each year as a “regulated investment company” under Subchapter M of the Internal Revenue Code, as amended, and will distribute substantially all of its taxable income, if any, for its tax year, and as such will not be subject to federal income taxes. In addition, the Fund intends to distribute in each calendar year substantially all of its net investment income, capital gains and certain other amounts, if any, such that the Fund should not be subject to federal excise tax. Therefore, no provision is made for federal income or excise taxes.
Foreign Capital Gains Taxes
Realized gains in certain countries may be subject to foreign taxes at the fund level, at rates ranging from approximately 10% to 15%. The Fund accrues for such foreign taxes on net realized and unrealized gains at the appropriate rate for each jurisdiction.
30
Columbia Liberty Fund
September 30, 2009
Distributions to Shareholders
Distributions from net investment income are declared and paid quarterly. Net realized capital gains, if any, are distributed at least annually. Income distributions and capital gain distributions are determined in accordance with federal income tax regulations which may differ from GAAP.
Indemnification
In the normal course of business, the Fund enters into contracts that contain a variety of representations and warranties and which provide general indemnities. The Fund’s maximum exposure under these arrangements is unknown because this would involve future claims against the Fund. Also, under the Trust’s organizational documents and by contract, the Trustees and officers of the Trust are indemnified against certain liabilities that may arise out of actions relating to their duties to the Trust. However, based on experience, the Fund expects the risk of loss due to these representations, warranties and indemnities to be minimal.
Note 3. Federal Tax Information
The timing and character of income and capital gain distributions are determined in accordance with income tax regulations, which may differ from GAAP. Reclassifications are made to the Fund’s capital accounts for permanent tax differences to reflect income and gains available for distribution (or available capital loss carryforwards) under income tax regulations.
For the year ended September 30, 2009, permanent book and tax basis differences resulting primarily from differing treatments for paydown reclassifications, Treasury inflation protected securities (TIPS), Section 988 currency gain/loss, market discount reclassifications and discount accretion/premium amortization on debt securities were identified and reclassified among the components of the Fund’s net assets as follows:
| | | | |
| | | | | |
Undistributed Net Investment
Income | | Accumulated Net Realized
Loss | | Paid-In Capital |
| $465,063 | | $(465,060) | | $(3) |
Net investment income and net realized gains (losses), as disclosed on the Statement of Operations, and net assets were not affected by these reclassifications.
The tax character of distributions paid during the years ended September 30, 2009 and September 30, 2008 was as follows:
| | | | | | |
| | | September 30,
2009 | | September 30,
2008 |
| Distributions paid from: |
Ordinary Income* | | $ | 8,283,253 | | $ | 30,729,193 |
Long-Term Capital Gains | | | — | | | 36,379,034 |
| * | For tax purposes short-term capital gains distributions, if any, are considered ordinary income distributions. |
As of September 30, 2009, the components of distributable earnings on a tax basis were as follows:
| | | | |
| | | | | |
Undistributed
Ordinary Income | | Undistributed Long-term Capital Gains | | Net Unrealized Depreciation* |
| $553,078 | | $— | | $32,827,825 |
| * | The differences between book-basis and tax-basis net unrealized appreciation (depreciation) are primarily due to deferral of losses from wash sales and discount accretion/premium amortization adjustments. |
Unrealized appreciation and depreciation at September 30, 2009, based on cost of investments for federal income tax purposes and excluding any unrealized appreciation and depreciation from changes in the value of other assets and liabilities resulting from changes in exchange rates were:
| | | | |
| | | | |
Unrealized appreciation | | $ | 42,456,915 | |
Unrealized depreciation | | | (9,629,090 | ) |
Net unrealized appreciation (depreciation) | | $ | 32,827,825 | |
The following capital loss carryforwards may be available to reduce taxable income arising from future net realized gains on investments, if any, to the extent permitted by the Internal Revenue Code:
| | |
| | | |
| Year of Expiration | | Capital Loss Carryforward |
| 2017 | | $25,018,329 |
Under current tax rules, certain currency and capital losses realized after October 31 may be deferred and treated as occurring on the first day of the following fiscal year. As of September 30, 2009, post-October capital losses of $53,219,110 attributed to security transactions were deferred to October 1, 2009.
31
Columbia Liberty Fund
September 30, 2009
Management is required to determine whether a tax position of the Fund is more likely than not to be sustained upon examination by the applicable taxing authority, including resolution of any related appeals or litigation processes, based on the technical merits of the position. The tax benefit to be recognized by the Fund is measured as the largest amount of benefit that is greater than fifty percent likely of being realized upon ultimate settlement. Management is not aware of any tax positions for which it is reasonably possible that the total amounts of unrecognized tax benefits will significantly change in the next twelve months. However, management’s conclusions may be subject to review and adjustment at a later date based on factors including, but not limited to, new tax laws, regulations, and administrative interpretations (including relevant court decisions). The Fund’s federal tax returns for the prior three fiscal years remain subject to examination by the Internal Revenue Service.
Note 4. Fees and Compensation Paid to Affiliates
Investment Advisory Fee
Columbia, an indirect, wholly owned subsidiary of Bank of America Corporation (“BOA”) provides investment advisory, administrative and other services to the Fund.
In rendering investment advisory services to the Fund, Columbia may use the portfolio management and research resources of Columbia Management Pte. Ltd., an affiliate of Columbia. Columbia receives a monthly investment advisory fee based on the Fund’s average daily net assets at the following annual rates:
| | | |
| | | | |
| Average Daily Net Assets | | Annual Fee Rate | |
First $1 billion | | 0.55 | % |
$1 billion to $1.5 billion | | 0.50 | % |
Over $1.5 billion | | 0.45 | % |
For the year ended September 30, 2009, the Fund’s effective investment advisory fee rate was 0.55% of the Fund’s average daily net assets.
BOA entered into an agreement dated September 29, 2009 to sell a portion of the asset management business of Columbia Management Group, LLC to Ameriprise Financial, Inc. The transaction (“Transaction”) includes a sale of the part of the asset management business that advises long-term mutual funds, including the Fund. The Transaction is subject to certain approvals and other conditions to closing, and is currently expected to close in the spring of 2010.
Sub-Advisory Fee
Nordea Investment Management North America, Inc. (“NIMNAI”) has been retained by Columbia to serve as the investment sub-advisor and to manage a portion of the Fund’s assets. As the sub-advisor, and subject to the oversight of Columbia and the Fund’s Board of Trustees, NIMNAI is responsible for daily investment operations, including placing all orders for the purchase and sale of portfolio securities for foreign stocks of the Fund. Columbia, from the investment advisory fee it receives, pays NIMNAI a monthly sub-advisory fee.
Pricing and Bookkeeping Fees
The Fund has entered into a Financial Reporting Services Agreement (the “Financial Reporting Services Agreement”) with State Street Bank & Trust Company (“State Street”) and Columbia pursuant to which State Street provides financial reporting services to the Fund. The Fund has also entered into an Accounting Services Agreement (collectively with the Financial Reporting Services Agreement, the “State Street Agreements”) with State Street and Columbia pursuant to which State Street provides accounting services to the Fund. Under the State Street Agreements, the Fund pays State Street an annual fee of $38,000 paid monthly plus an additional monthly fee based on an annualized percentage rate of average daily net assets of the Fund for the month. The aggregate fee will not exceed $140,000 per year (exclusive of out-of-pocket expenses and charges). The Fund also reimburses State Street for certain out-of-pocket expenses and charges.
The Fund has entered into a Pricing and Bookkeeping Oversight and Services Agreement (the “Services Agreement”) with Columbia. Under the Services Agreement, Columbia provides services related to Fund expenses and the requirements of the Sarbanes-Oxley Act of 2002, and provides oversight of the accounting and financial reporting services provided by State Street. Under the Services Agreement, the Fund reimburses Columbia for out-of-pocket expenses.
32
Columbia Liberty Fund
September 30, 2009
Transfer Agent Fee
Columbia Management Services, Inc. (the “Transfer Agent”), an affiliate of Columbia and an indirect, wholly owned subsidiary of BOA, provides shareholder services to the Fund and has contracted with Boston Financial Data Services (“BFDS”) to serve as sub-transfer agent. The Transfer Agent is entitled to receive a fee for its services, paid monthly, at the annual rate of $17.34 per open account plus reimbursement of certain sub-transfer agent fees paid by the Transfer Agent (exclusive of BFDS fees), calculated based on assets held in omnibus accounts and intended to recover the cost of payments to other parties (including affiliates of BOA) for services to those accounts. The Transfer Agent pays the fees of BFDS for services as sub-transfer agent and is not entitled to reimbursement for such fees from the Fund.
The Transfer Agent may also retain, as additional compensation for its services, fees for wire, telephone and redemption orders, Individual Retirement Account (“IRA”) trustee agent fees and account transcript fees due to the Transfer Agent from shareholders of the Fund and credits (net of bank charges) earned with respect to balances in accounts the Transfer Agent maintains in connection with its services to the Fund. The Transfer Agent also receives reimbursement for certain out-of-pocket expenses.
An annual minimum account balance fee of $20 may apply to certain accounts with a value below the Fund’s initial minimum investment requirements to reduce the impact of small accounts on transfer agent fees. These minimum account balance fees are recorded as part of expense reductions on the Statement of Operations. For the year ended September 30, 2009, no minimum account balance fees were charged by the Fund.
Underwriting Discounts, Service and Distribution Fees
Columbia Management Distributors, Inc. (the “Distributor”), an affiliate of Columbia and an indirect, wholly owned subsidiary of BOA, is the principal underwriter of the Fund’s shares. For the year ended September 30, 2009, the Distributor has retained net underwriting discounts of $9,346 on sales of the Fund’s Class A shares and received net CDSC fees of $141, $15,401 and $336 on Class A, Class B and Class C share redemptions, respectively.
The Fund has adopted plans pursuant to Rule 12b-1 under the 1940 Act (the “Plans”) for Class A, Class B and Class C shares, which require the payment of a monthly service fee to the Distributor. The annual service fee portion of the Plans may equal up to 0.15% of the net assets attributable to shares issued prior to April 1, 1989 and 0.25% on net assets attributable to shares issued thereafter. This arrangement results in a rate of service fee for all shares that is a blend between the 0.15% and 0.25% annual rates. For the year ended September 30, 2009, the Class A, Class B and Class C shares’ effective service fee rate was 0.24%.
The Plans also require the payment of a monthly distribution fee to the Distributor at the annual rate of 0.75% of the average daily net assets attributable to Class B and Class C shares only.
The CDSC and the distribution fees received from the Plans are used principally as repayment to the Distributor for amounts paid by the Distributor to dealers who sold such shares.
Fee Waivers and Expense Reimbursements
Effective January 1, 2009, Columbia has voluntarily agreed to reimburse a portion of the Fund’s expenses so that the Fund’s ordinary operating expenses (excluding any distribution and service fees, brokerage commissions, interest, taxes and extraordinary expenses, but including custodian charges relating to overdrafts, if any), after giving effect to any balance credits from the Fund’s custodian, do not exceed 0.95% of the Fund’s average daily net assets on an annualized basis. Columbia, in its discretion, may revise or discontinue this arrangement at any time.
Fees Paid to Officers and Trustees
All officers of the Fund are employees of Columbia or its affiliates and, with the exception of the Fund’s Chief Compliance Officer, receive no compensation from the Fund. The Board of Trustees has appointed a Chief Compliance Officer to the Fund in accordance with federal securities regulations. The Fund, along with other affiliated funds, pays its pro-rata share of the expenses associated with the Chief Compliance Officer. The Fund’s expenses for the Chief Compliance Officer will not exceed $15,000 per year.
The Trust’s eligible Trustees may participate in a deferred compensation plan which may be terminated at any time. Obligations of the plan will be paid solely out of the Fund’s assets.
33
Columbia Liberty Fund
September 30, 2009
Other Related Party Transactions
In connection with the purchase and sale of its securities during the period, the Fund used one or more brokers that are affiliates of BOA. Total brokerage commissions paid to affiliated brokers for the year ended September 30, 2009 were $2,550.
Note 5. Custody Credits
The Fund has an agreement with its custodian bank under which custody fees may be reduced by balance credits. These credits are recorded as part of expense reductions on the Statement of Operations. The Fund could have invested a portion of the assets utilized in connection with the expense offset arrangement in an income-producing asset if it had not entered into such an agreement.
For the year ended September 30, 2009, these custody credits reduced total expenses by $210 for the Fund.
Note 6. Objectives and Strategies for Investing in Derivative Instruments
The Fund uses derivative instruments including futures contracts in order to meet its investment objectives. The Fund employs strategies in differing combinations to permit it to increase, decrease or change the level of exposure to market risk factors. The achievement of any strategy relating to derivatives depends on analysis of various risk factors, and if the strategies for use of derivatives do not work as intended, the Fund may not achieve its investment objectives.
In pursuit of its investment objectives, the Fund is exposed to the following market risks:
Equity Risk: Equity risk relates to changes in value of equity securities such as common stocks due to general market conditions such as real or perceived adverse economic conditions, changes in the general outlook for corporate earnings, or adverse investor sentiment. Equity securities generally have greater price volatility than fixed income securities.
Interest Rate Risk: Interest rate risk relates to the fluctuation in value of fixed income securities because of the inverse relationship of price and yield. Fixed income securities will decline in value because of an increase in general interest rates and their value will increase because of a decline in general interest rates. Fixed income securities with longer durations tend to be more sensitive to changes in interest rates, usually making them more volatile than securities with shorter durations.
The following note provides more detailed information about each derivative type held by the Fund:
Futures Contracts — The Fund entered into U.S. Treasury Note futures contracts to manage the duration and yield curve exposure of the Fund versus the benchmark and equity index futures contracts to equitize cash in order to maintain appropriate equity market exposure while keeping sufficient cash to accommodate daily redemptions.
The use of futures contracts involves certain risks, which include: (1) imperfect correlation between the price movement of the instruments and the underlying securities, (2) inability to close out positions due to differing trading hours, or the temporary absence of a liquid market, for either the instruments or the underlying securities, or (3) an inaccurate prediction of the future direction of interest rates by Columbia. Upon entering into a futures contract, the Fund pledges cash or securities with the broker in an amount sufficient to meet the initial margin requirement. Subsequent payments are made or received by the Fund equal to the daily change in the contract value and are recorded as variation margin receivable or payable and offset in unrealized gains or losses. The Fund recognizes a realized gain or loss when the contract is closed or expires.
Futures contracts involve, to varying degrees, risk of loss in excess of the variation margin disclosed on the Fund’s Statement of Assets and Liabilities.
The following table is a summary of the value of the Fund’s derivative instruments as of September 30, 2009.
| | | | | | |
| Fair Value of Derivative Instruments |
Asset
derivatives | | | | Liability
derivatives | | |
Statement of
Assets and
Liabilities | | Fair Value | | Statement of
Assets and
Liabilities | | Fair Value* |
| — | | — | | Futures Variation
Margin | | $15,675 |
| * | Includes only current day’s variation margin. |
34
Columbia Liberty Fund
September 30, 2009
The effect of derivative instruments on the Statement of Operations for the year ended September 30, 2009.
| | | | | | | | | |
| | | Amount of Realized Gain or (Loss) and
Change in Unrealized Appreciation or
(Depreciation) on Derivatives
Recognized in Income |
| | | Risk
Exposure | | Net
Realized Gain
(Loss) | | | Change in
Unrealized Appreciation (Depreciation) |
Futures Contracts | | Interest Rate and Equity Risks | | $ | (951,729 | ) | | $ | 339,470 |
Note 7. Portfolio Information
For the year ended September 30, 2009, the cost of purchases and proceeds from sales of securities, excluding short-term obligations, for the Fund were $347,495,133 and $384,028,232, respectively, of which $64,702,391 and $70,785,777, respectively, were U.S. Government securities.
Note 8. Line of Credit
The Fund and other affiliated funds participate in a $280,000,000 committed, unsecured revolving line of credit provided by State Street. The maximum amount that may be borrowed by any fund is limited to the lesser of $200,000,000 and the Fund’s borrowing limit set forth in the Fund’s registration statement. Borrowings are available for short-term liquidity or temporary or emergency purposes.
Interest is charged to each participating fund based on the fund’s borrowings at a rate per annum equal to the greater of the Federal Funds Rate plus 0.50% or the overnight LIBOR Rate plus 0.50%. In addition, an annual operations agency fee of $20,000, an amendment fee of 0.02% and a commitment fee of 0.12% per annum are accrued and apportioned among the participating funds pro rata based on their relative net assets. Prior to October 16, 2008, the Fund and other affiliated funds participated in a $350,000,000 committed, unsecured revolving line of credit and a $150,000,000 uncommitted, unsecured line of credit, both provided by State Street. Interest on the committed line of credit was charged to each participating fund based on the fund’s borrowings at a rate per annum equal to the Federal Funds Rate plus 0.50%. In addition, a commitment fee of 0.10% per annum was accrued and apportioned among the participating funds pro rata based on their relative net assets. Interest on the uncommitted line of credit was charged to each participating fund based on the fund’s borrowings at a rate per annum equal to the Federal Funds Rate plus 0.375%. State Street charged an annual operations agency fee of $40,000 for the committed line of credit and was able to charge an annual administration fee of $15,000 for the uncommitted line of credit. The commitment fee, the operations agency fee and the administration fee were accrued and apportioned among the participating funds pro rata based on their relative net assets.
For the year ended September 30, 2009, the Fund did not borrow under these arrangements.
Note 9. Securities Lending
The Fund may lend its securities to certain approved brokers, dealers and other financial institutions. Each loan is collateralized by cash, in an amount at least equal to the market value of the securities loaned plus accrued income from the investment of collateral. The market value of the loaned securities is determined at the close of business of the Fund and any additional required collateral is delivered to the Fund on the next business day. The collateral received is invested and the income generated by the investment of the collateral, net of any fees remitted to State Street as the lending agent and borrower rebates, is paid to the Fund. Generally, in the event of borrower default, the Fund has the right to use the collateral to offset any losses incurred. In the event the Fund is delayed or prevented from exercising its right to dispose of the collateral, there may be a potential loss to the Fund. The Fund bears the risk of loss with respect to the investment of collateral.
Note 10. Shares of Beneficial Interest
As of September 30, 2009, 15.5% of the Fund’s shares outstanding were beneficially owned by one participant account over which BOA and/or any of its affiliates had either sole or joint investment discretion. On that date, no other shareholder owned more than 5% of the outstanding shares of the Fund.
Subscription and redemption activity of this account may have a significant effect on the operations of the Fund.
35
Columbia Liberty Fund
September 30, 2009
Note 11. Other
During the year ended September 30, 2009, the Fund purchased shares of Ryanair in violation of European Union investment restrictions and experienced a realized loss of $7,944. The Sub-Advisor of the Fund will reimburse the Fund for the loss.
Note 12. Significant Risks and Contingencies
Asset-Backed Securities Risk
The value of asset-backed securities may be affected by, among other factors, changes in interest rates, the market’s assessment of the quality of underlying assets, the creditworthiness of the servicer for the underlying assets, factors concerning the interests in and structure of the issuer or the originator of the underlying assets, or the creditworthiness or rating of the entities that provide any supporting letters of credit, surety bonds, derivative instruments, or other credit enhancement. The value of asset-backed securities also will be affected by the exhaustion, termination or expiration of any credit enhancement. Most asset-backed securities are subject to prepayment risk, which is the possibility that the underlying debt may be refinanced or prepaid prior to maturity during periods of declining or low interest rates, causing the Fund to have to reinvest the money received in securities that have lower yields. In addition, the impact of prepayments on the value of asset-backed securities may be difficult to predict and may result in greater volatility.
Mortgage-Backed Securities Risk
The value of mortgage-backed securities may be affected by, among other things, changes in interest rates, factors concerning the interests in and structure of the issuer or the originator of the mortgages, the creditworthiness of the entities that provide any supporting letters of credit, surety bonds or other credit enhancements or the quality of underlying assets or the market’s assessment thereof. Mortgage-backed securities are subject to prepayment risk, which is the possibility that the underlying mortgage may be refinanced or prepaid prior to maturity during periods of declining or low interest rates, causing the Funds to have to reinvest the money received in securities that have lower yields. In addition, the impact of prepayments on the value of mortgage-backed securities may be difficult to predict and may result in greater volatility.
Legal Proceedings
Columbia Management Advisors, LLC and Columbia Management Distributors, Inc. (collectively, the “Columbia Group”) are subject to a settlement agreement with the New York Attorney General (“NYAG”) (the “NYAG Settlement”) and a settlement order with the SEC (the “SEC Order”) on matters relating to mutual fund trading, each dated February 9, 2005. Under the terms of the SEC Order, the Columbia Group (or predecessor entities) agreed, among other things, to: pay disgorgement and civil money penalties collectively totaling $140 million; cease and desist from violations of the antifraud provisions and certain other provisions of the federal securities laws; maintain certain compliance and ethics oversight structures; and retain an independent consultant to review the Columbia Group’s applicable supervisory, compliance, control and other policies and procedures. The NYAG Settlement, among other things, requires Columbia Management Advisors, LLC and its affiliates to reduce management fees for certain funds in the Columbia family of mutual funds in a projected total of $160 million over five years through November 30, 2009 and to make certain disclosures to investors relating to expenses. In connection with the Columbia Group providing services to the Columbia Funds, the Columbia Funds have voluntarily undertaken to implement certain governance measures designed to maintain the independence of their boards of trustees and certain special consulting and compliance measures.
Pursuant to the SEC Order and related procedures, the $140 million in settlement amounts described above has been substantially distributed in accordance with a distribution plan that was developed by an independent distribution consultant and approved by the SEC on April 6, 2007.
In connection with the events described above, various parties have filed suit against certain funds, the Trustees of the Columbia Funds, FleetBoston Financial Corporation and its affiliated entities and/or Bank of America and its affiliated entities.
On February 20, 2004, the Judicial Panel on Multidistrict Litigation transferred these cases and cases against other mutual fund companies based on similar allegations to the United States District Court in Maryland for consolidated or coordinated pretrial proceedings (the “MDL”). Subsequently, additional related cases were transferred to the MDL. On
36
Columbia Liberty Fund
September 30, 2009
September 29, 2004, the plaintiffs in the MDL filed amended and consolidated complaints. One of these amended complaints is a putative class action that includes claims under the federal securities laws and state common law, and that names Columbia Management Advisors, Inc. (which has since merged into Banc of America Capital Management, LLC (now named Columbia Management Advisors, LLC)) (“Columbia”), Columbia Funds Distributor, Inc. (now named Columbia Management Distributors, Inc.) (the “Distributor”), the Trustees of the Columbia Funds, Bank of America Corporation and others as defendants. Another of the amended complaints is a derivative action purportedly on behalf of the Columbia Funds that asserts claims under federal securities laws and state common law.
On February 25, 2005, Columbia and other defendants filed motions to dismiss the claims in the pending cases. On March 1, 2006, for reasons stated in the court’s memoranda dated November 3, 2005, the United States District Court for the District of Maryland granted in part and denied in part the defendants’ motions to dismiss. The court dismissed all of the class action claims pending against the Columbia Funds Trusts. As to Columbia and the Distributor, the claims under the Securities Act of 1933, the claims under Sections 34(b) and 36(a) of the Investment Company Act of 1940 (“ICA”) and the state law claims were dismissed. The claims under Sections 10(b) and 20(a) of the Securities Exchange Act of 1934 and claims under Section 36(b) of the ICA were not dismissed.
On March 21, 2005, a purported class action was filed in Massachusetts state court alleging that certain conduct, including market timing, entitled Class B shareholders in certain Columbia Funds to an exemption from contingent deferred sales charges upon early redemption (the “CDSC Lawsuit”). The CDSC Lawsuit was removed to federal court in Massachusetts and transferred to the MDL.
On September 14, 2007, the plaintiffs and the Columbia defendants named in the MDL, including the Columbia Funds, entered into a stipulation of settlement with respect to all Columbia-related claims in the MDL described above, including the CDSC Lawsuit. The settlement is subject to court approval.
Note 13. Subsequent Events
On October 15, 2009, the committed line of credit discussed in Note 8 was renewed on amended terms. Pursuant to the amended terms, interest is charged to each participating fund based on the fund’s borrowings at a rate per annum equal to the greater of the Federal Funds Rate plus 1.25% or the overnight LIBOR Rate plus 1.25%. In addition, a commitment fee of 0.15% per annum is accrued and apportioned among the participating funds pro rata based on their relative net assets. The annual operations agency fee of $20,000 was waived.
Effective November 1, 2009, the annual rate the Transfer Agent receives for the services discussed in Note 4 will change to $22.36 per open account.
37
Report of Independent Registered Public Accounting Firm
To the Trustees of the Columbia Funds Series Trust I and the Shareholders of Columbia Liberty Fund
In our opinion, the accompanying statement of assets and liabilities, including the investment portfolio, and the related statements of operations and of changes in net assets and the financial highlights present fairly, in all material respects, the financial position of Columbia Liberty Fund (the “Fund”) (a series of Columbia Funds Series Trust I), at September 30, 2009, the results of its operations for the year then ended, the changes in its net assets for each of the two years in the period then ended and the financial highlights for each of the five years in the period then ended, in conformity with accounting principles generally accepted in the United States of America. These financial statements and financial highlights (hereafter referred to as “financial statements”) are the responsibility of the Fund’s management. Our responsibility is to express an opinion on these financial statements based on our audits. We conducted our audits of these financial statements in accordance with the standards of the Public Company Accounting Oversight Board (United States). Those standards require that we plan and perform the audit to obtain reasonable assurance about whether the financial statements are free of material misstatement. An audit includes examining, on a test basis, evidence supporting the amounts and disclosures in the financial statements, assessing the accounting principles used and significant estimates made by management, and evaluating the overall financial statement presentation. We believe that our audits, which included confirmation of securities at September 30, 2009 by correspondence with the custodian and brokers, provide a reasonable basis for our opinion.
PricewaterhouseCoopers LLP
Boston, Massachusetts
November 20, 2009
38
Federal Income Tax Information (Unaudited) – Columbia Liberty Fund
For non-corporate shareholders, 50.99%, or the maximum amount allowable under the Jobs and Growth Tax Relief Reconciliation Act of 2003, of the ordinary income distributed by the Fund for the fiscal year ended September 30, 2009 may represent qualified dividend income.
41.21% of the ordinary income distributed by the Fund, for the fiscal year ended September 30, 2009, qualifies for the corporate dividends received deduction.
The Fund will notify shareholders in January 2010, of amounts for use in preparing 2009 income tax returns.
39
Fund Governance
The Trustees serve terms of indefinite duration. The names, addresses and ages of the Trustees and Officers of the Funds in the Columbia Funds Series Trust I, the year each was first elected or appointed to office, their principal business occupations during at least the last five years, the number of Funds overseen by each Trustee and other directorships they hold are shown below. Each officer listed below serves as an officer of each Fund in the Columbia Funds Complex.
Independent Trustees
| | |
Name, Address and Year of
Birth, Position with Funds, Year
First Elected or Appointed to Office | | Principal Occupation(s) During Past Five Years, Number of Funds in the
Columbia Funds Complex Overseen by Trustee, Other Directorships Held |
| |
| John D. Collins (Born 1938) | | |
c/o Columbia Management Advisors, LLC One Financial Center Boston, MA 02111 Trustee (since 2007) | | Retired. Consultant, KPMG, LLP (accounting and tax firm) from July 1999 to June 2000; Partner, KPMG, LLP from March 1962 to June 1999. Oversees 66; Mrs. Fields Famous Brands LLC (consumer products); Suburban Propane Partners, L.P.; and Montpelier Re (insurance underwriting firm) |
| |
| Rodman L. Drake (Born 1943) | | |
c/o Columbia Management Advisors, LLC One Financial Center Boston, MA 02111 Trustee (since 2007) and Chairman of the Board (since 2009) | | Co-Founder of Baringo Capital LLC (private equity) since 2002; President, Continuation Investments Group, Inc. from 1997 to 2001. Oversees 66; Jackson Hewitt Tax Service Inc. (tax preparation services); Crystal Capital River Inc. (real estate investment trust); Student Loan Corporation (student loan provider); Celgene Corporation (global biotechnology company); and The Helios Funds (exchange-traded funds) |
| |
| Douglas A. Hacker (Born 1955) | | |
c/o Columbia Management Advisors, LLC One Financial Center Boston, MA 02111 Trustee (since 1996) | | Independent business executive since May 2006; Executive Vice President–Strategy of United Airlines (airline) from December 2002 to May 2006; President of UAL Loyalty Services (airline marketing company) from September 2001 to December 2002; Executive Vice President and Chief Financial Officer of United Airlines from July 1999 to September 2001. Oversees 66; Nash Finch Company (food distributor); Aircastle Limited (aircraft leasing) |
|
| Janet Langford Kelly (Born 1957) |
c/o Columbia Management Advisors, LLC One Financial Center Boston, MA 02111 Trustee (since 1996) | | Senior Vice President, General Counsel and Corporate Secretary, ConocoPhillips (integrated energy company) since September 2007; Deputy General Counsel–Corporate Legal Services, ConocoPhillips from August 2006 to August 2007; Partner, Zelle, Hofmann, Voelbel, Mason & Gette LLP (law firm) from March 2005 to July 2006; Adjunct Professor of Law, Northwestern University, from September 2004 to June 2006; Director, UAL Corporation (airline) from February 2006 to July 2006; Oversees 66; None |
| |
| Charles R. Nelson (Born 1942) | | |
c/o Columbia Management Advisors, LLC One Financial Center Boston, MA 02111 Trustee (since 1981) | | Professor of Economics, University of Washington, since January 1976; Ford and Louisa Van Voorhis Professor of Political Economy, University of Washington, since September 1993; Adjunct Professor of Statistics, University of Washington, since September 1980; Associate Editor, Journal of Money Credit and Banking, 1993 to 2008; Consultant on econometric and statistical matters. Oversees 66; None |
40
Fund Governance (continued)
Independent Trustees (continued)
| | |
Name, Address and Year of
Birth, Position with Funds, Year
First Elected or Appointed to Office | | Principal Occupation(s) During Past Five Years, Number of Funds in the
Columbia Funds Complex Overseen by Trustee, Other Directorships Held |
| |
| John J. Neuhauser (Born 1943) | | |
c/o Columbia Management Advisors, LLC One Financial Center Boston, MA 02111 Trustee (since 1985) | | President, Saint Michael’s College, since August 2007; University Professor, Boston College from November 2005 to August 2007; Academic Vice President and Dean of Faculties, Boston College from August 1999 to October 2005. Oversees 66; Liberty All-Star Equity Fund and Liberty All-Star Growth Fund, Inc. (closed-end funds) |
| |
| Jonathan Piel (Born 1938) | | |
c/o Columbia Management Advisors, LLC One Financial Center Boston, MA 02111 Trustee (since 2007) | | Cable television producer and website designer; The Editor, Scientific American from 1984 to 1994; Vice President, Scientific American, Inc., from 1984 to 1994; Member, Advisory Board, Stone Age Institute, Bloomington, Indiana (research institute that explores the effect of technology on human evolution); Member, Board of Directors of the National Institute of Social Sciences, New York City; Member, Board of Trustees of the William Alanson White Institute, New York City (institution for training psychoanalysts); and Member, Advisory Board, Mount Sinai Children’s Environmental Health Center, New York. Oversees 66; None |
| |
| Patrick J. Simpson (Born 1944) | | |
c/o Columbia Management Advisors, LLC One Financial Center Boston, MA 02111 Trustee (since 2000) | | Partner, Perkins Coie LLP (law firm). Oversees 66; None |
|
| Thomas C. Theobald (Born 1937) |
c/o Columbia Management Advisors, LLC One Financial Center Boston, MA 02111 Trustee (since 1996) | | Partner and Senior Advisor, Chicago Growth Partners (private equity investing) since September 2004; Managing Director, William Blair Capital Partners (private equity investing) from September 1994 to September 2004. Oversees 66; Anixter International (network support equipment distributor); Ventas, Inc. (real estate investment trust); Jones Lang LaSalle (real estate management services); Ambac Financial Group (financial guaranty insurance) |
| |
| Anne-Lee Verville (Born 1945) | | |
c/o Columbia Management Advisors, LLC One Financial Center Boston, MA 02111 Trustee (since 1998) | | Retired since 1997 (formerly General Manager–Global Education Industry (from 1994 to 1997), President–Application Systems Division (from 1991 to 1994), Chief Financial Officer–US Marketing & Services (from 1988 to 1991), and Chief Information Officer (from 1987 to 1988), IBM Corporation (computer and technology)). Oversees 66; None |
41
Fund Governance (continued)
Interested Trustee
| | |
| |
| William E. Mayer1 (Born 1940) | | |
c/o Columbia Management Advisors, LLC One Financial Center Boston, MA 02111 Trustee (since 1994) | | Partner, Park Avenue Equity Partners (private equity) since February 1999; Dean and Professor, College of Business, University of Maryland from 1992 to 1997. Oversees 66; Lee Enterprises (print media), WR Hambrecht + Co. (financial service provider); BlackRock Kelso Capital Corporation (investment company) |
| 1 | The Funds currently treat Mr. Mayer as an “interested person” (as defined in the Investment Company Act of 1940) by reason of his affiliation with WR Hambrecht + Co., a registered broker/dealer that may execute portfolio transactions for or engage in principal transactions with the Funds or other funds or accounts advised/managed by the Advisor or other Bank of America affiliates. |
The Statement of Additional Information includes additional information about the Trustees of the Funds and is available, without charge, upon request by calling 1-800-345-6611.
42
Fund Governance (continued)
Officers
| | |
Name, Address and Year of Birth,
Position with Funds, Year First
Elected or Appointed to Office | | Principal Occupation(s) During Past Five Years |
|
| J. Kevin Connaughton (Born 1964) |
One Financial Center Boston, MA 02111 President (since 2009) | | Managing Director of Columbia Management Advisors, LLC since December 2004; Senior Vice President and Chief Financial Officer–Columbia Funds, from June 2008 to January 2009; Treasurer–Columbia Funds, from October 2003 to May 2008; Treasurer–the Liberty Funds, Stein Roe Funds and Liberty All-Star Funds, December 2000–December 2006; Senior Vice President–Columbia Management Advisors, LLC, from April 2003 to December 2004; President–Columbia Funds, Liberty Funds and Stein Roe Funds, February 2004 to October 2004; Treasurer–Galaxy Funds, September 2002 to December 2005; Treasurer, December 2002 to December 2004, and President, February 2004 to December 2004–Columbia Management Multi-Strategy Hedge Fund, LLC; and a senior officer of various other Bank of America-affiliated entities, including other registered and unregistered funds. |
|
| James R. Bordewick, Jr. (Born 1959) |
One Financial Center Boston, MA 02111 Senior Vice President, Secretary and Chief Legal Officer (since 2006) | | Associate General Counsel, Bank of America since April 2005; Senior Vice President and Associate General Counsel, MFS Investment Management (investment management) prior to April 2005. |
| |
| Linda J. Wondrack (Born 1964) | | |
One Financial Center Boston, MA 02111 Senior Vice President and Chief Compliance Officer (since 2007) | | Director (Columbia Management Group LLC and Investment Product Group Compliance), Bank of America since June 2005; Director of Corporate Compliance and Conflicts Officer, MFS Investment Management (investment management), August 2004 to May 2005; Managing Director, Deutsche Asset Management (investment management) prior to August 2004. |
| |
| Michael G. Clarke (Born 1969) | | |
One Financial Center Boston, MA 02111 Senior Vice President and Chief Financial Officer (since 2009) | | Director of Fund Administration of the Advisor since January 2006; Managing Director of the Advisor September 2004 to December 2005; Vice President Fund Administration June 2002 to September 2004. |
| |
| Jeffrey R. Coleman (Born 1969) | | |
One Financial Center Boston, MA 02111 Deputy Treasurer (since 2006) | | Director of Fund Administration of the Advisor since January 2006; Fund Controller of the Advisor from October 2004 to January 2006; Vice President of CDC IXIS Asset Management Services, Inc. (investment management) from August 2000 to September 2004. |
| |
| Joseph F. DiMaria (Born 1968) | | |
One Financial Center Boston, MA 02111 Chief Accounting Officer and Treasurer (since 2009) | | Director of Fund Administration of the Advisor since January 2006; Head of Tax/Compliance and Assistant Treasurer of the Advisor from November 2004 to December 2005; Director of Trustee Administration (Sarbanes-Oxley) of the Advisor from May 2003 to October 2004. |
43
Fund Governance (continued)
Officers (continued)
| | |
Name, Address and Year of Birth,
Position with Funds, Year First
Elected or Appointed to Office | | Principal Occupation(s) During Past Five Years |
| |
| Julian Quero (Born 1967) | | |
One Financial Center Boston, MA 02111 Deputy Treasurer (since 2008) | | Senior Tax Manager of the Advisor since August 2006; Senior Compliance Manager of the Advisor from April 2002 to August 2006. |
| |
| Barry S. Vallan (Born 1969) | | |
One Financial Center Boston, MA 02111 Controller (since 2006) | | Vice President–Fund Treasury of the Advisor since October 2004; Vice President–Trustee Reporting of the Advisor from April 2002 to October 2004. |
| |
| Stephen T. Welsh (Born 1957) | | |
One Financial Center Boston, MA 02111 Vice President (since 1996) | | President, Columbia Management Services, Inc. since July 2004; Senior Vice President and Controller, Columbia Management Services, Inc. prior to July 2004. |
44
Important Information About This Report
Transfer Agent
Columbia Management Services, Inc.
P.O. Box 8081
Boston, MA 02266-8081
1-800-345-6611
Distributor
Columbia Management
Distributors, Inc.
One Financial Center
Boston, MA 02111
Investment Advisor
Columbia Management Advisors, LLC
100 Federal Street
Boston, MA 02110
The fund mails one shareholder report to each shareholder address. If you would like more than one report, please call shareholder services at 1-800-345-6611 and additional reports will be sent to you. This report has been prepared for shareholders of Columbia Liberty Fund.
A description of the policies and procedures that the fund uses to determine how to vote proxies and a copy of the fund’s voting records are available (i) at www.columbiamanagement.com, (ii) on the Securities and Exchange Commission’s website at www.sec.gov, and (iii) without charge, upon request, by calling 1-800-368-0346. Information regarding how the fund voted proxies relating to portfolio securities during the 12-month period ended June 30 is available from the SEC’s website. Information regarding how the fund voted proxies relating to portfolio securities is also available from the fund’s website, www.columbiamanagement.com.
The fund files a complete schedule of portfolio holdings with the SEC for the first and third quarters of each fiscal year on Form N-Q. The fund’s Form N-Q is available on the SEC’s website at www.sec.gov and may be reviewed and copied at the SEC’s Public Reference Room in Washington, D.C. Information on the operation of the Public Reference Room may be obtained by calling
1-800-SEC-0330.
Please read and consider the investment objectives, risks, charges and expenses for any fund carefully before investing. For a prospectus which contains this and other important information about the fund, contact your Columbia Management representative or financial advisor or go to www.columbiamanagement.com.
Columbia Management Group, LLC (“Columbia Management”) is the investment management division of Bank of America Corporation. Columbia Management entities furnish investment management services and products for institutional and individual investors. Columbia Funds are distributed by Columbia Management Distributors, Inc., member of FINRA, SIPC, part of Columbia Management and an affiliate of Bank of America Corporation.
45

One Financial Center
Boston, MA 02111-2621
Columbia Liberty Fund
Annual Report, September 30, 2009
©2009 Columbia Management Distributors, Inc.
One Financial Center, Boston, MA 02111-2621
800.345.6611 www.columbiafunds.com
SHC-42/24564-0909 (11/09) 09/94956
Item 2. Code of Ethics.
(a) The registrant has, as of the end of the period covered by this report, adopted a code of ethics that applies to the registrant’s principal executive officer, principal financial officer, principal accounting officer or controller, or persons performing similar functions, regardless of whether these individuals are employed by the registrant or a third party.
(b) During the period covered by this report, there were not any amendments to a provision of the code of ethics adopted in 2(a) above.
(c) During the period covered by this report, there were no waivers, including any implicit waivers, from a provision of the code of ethics described in 2(a) above that relates to one or more of the items set forth in paragraph (b) of this item’s instructions.
Item 3. Audit Committee Financial Expert.
The registrant’s Board of Trustees has determined that John D. Collins, Douglas A. Hacker, Charles R. Nelson and Anne-Lee Verville, each of whom are members of the registrant’s Board of Trustees and Audit Committee, each qualify as an audit committee financial expert. Mr. Collins, Mr. Hacker, Mr. Nelson and Ms. Verville are each independent trustees, as defined in paragraph (a)(2) of this item’s instructions.
Item 4. Principal Accountant Fees and Services.
Fee information below is disclosed for the seven series of the registrant whose reports to stockholders are included in this annual filing. Fee information for fiscal year ended September 30, 2008 also includes fees for one series that was merged into the registrant during the period.
(a) Audit Fees. Aggregate Audit Fees billed by the principal accountant for professional services rendered during the fiscal years ended September 30, 2009 and September 30, 2008 are approximately as follows:
2009 | | 2008 | |
$ | 241,000 | | $ | 238,500 | |
| | | | | |
Audit Fees include amounts related to the audit of the registrant’s annual financial statements or services that are normally provided by the accountant in connection with statutory and regulatory filings or engagements for those fiscal years. Fiscal year 2009 also includes audit fees for the review of and provision of consent in connection with filing Form N-1A for a new share class.
(b) Audit-Related Fees. Aggregate Audit-Related Fees billed to the registrant by the principal accountant for professional services rendered during the fiscal years ended September 30, 2009 and September 30, 2008 are approximately as follows:
2009 | | 2008 | |
$ | 32,200 | | $ | 44,000 | |
| | | | | |
Audit-Related Fees include amounts for assurance and related services by the principal accountant that are reasonably related to the performance of the audit of the registrant’s financial statements and are not reported in Audit Fees above. In both fiscal years 2009 and 2008, Audit-Related Fees consist of agreed-upon procedures performed for semi-annual shareholder reports. Fiscal year 2008 also includes Audit-Related Fees for agreed-upon procedures related to a fund merger and a fund accounting and custody conversion.
During the fiscal years ended September 30, 2009 and September 30, 2008, there were no Audit-Related Fees billed by the registrant’s principal accountant to the registrant’s investment adviser (not including any sub-adviser whose role is primarily portfolio management and is subcontracted with or overseen by another investment adviser) and any entity controlling, controlled by, or under common control with the adviser that provides ongoing services to the registrant for an engagement that related directly to the operations and financial reporting of the registrant.
(c) Tax Fees. Aggregate Tax Fees billed by the principal accountant to the registrant for professional services rendered during the fiscal years ended September 30, 2009 and September 30, 2008 are approximately as follows:
2009 | | 2008 | |
$ | 27,700 | | $ | 64,000 | |
| | | | | |
Tax Fees include amounts for the review of annual tax returns, the review of required shareholder distribution calculations and typically include amounts for professional services by the principal accountant for tax compliance, tax advice and tax planning. Fiscal year 2008 also includes tax fees for agreed-upon procedures related to a fund merger and the review of a final tax return and for assistance with foreign tax filings.
During the fiscal years ended September 30, 2009 and September 30, 2008, there were no Tax Fees billed by the registrant’s principal accountant to the registrant’s investment adviser (not including any sub-adviser whose role is primarily portfolio management and is subcontracted with or overseen by another investment adviser) and any entity
controlling, controlled by, or under common control with the adviser that provides ongoing services to the registrant for an engagement that related directly to the operations and financial reporting of the registrant.
(d) All Other Fees. Aggregate All Other Fees billed by the principal accountant to the registrant for professional services rendered during the fiscal years ended September 30, 2009 and September 30, 2008 are approximately as follows:
All Other Fees include amounts for products and services provided by the principal accountant, other than the services reported in paragraphs (a) through (c) above.
Aggregate All Other Fees billed by the registrant’s principal accountant to the registrant’s investment adviser (not including any sub-adviser whose role is primarily portfolio management and is subcontracted with or overseen by another investment adviser) and any entity controlling, controlled by, or under common control with the adviser that provides ongoing services to the registrant for an engagement that related directly to the operations and financial reporting of the registrant during the fiscal years ended September 30, 2009 and September 30, 2008 are approximately as follows:
2009 | | 2008 | |
$ | 891,900 | | $ | 946,300 | |
| | | | | |
In both fiscal years 2009 and 2008, All Other Fees consist of fees billed for internal control examinations of the registrant’s transfer agent and investment advisor.
(e)(1) Audit Committee Pre-Approval Policies and Procedures
The registrant’s Audit Committee is required to pre-approve the engagement of the registrant’s independent accountants to provide audit and non-audit services to the registrant and non-audit services to its investment adviser (not including any sub-adviser whose role is primarily portfolio management and is subcontracted with or overseen by another investment adviser) or any entity controlling, controlled by or under common control with such investment adviser that provides ongoing services to the registrant (“Adviser Affiliates”), if the engagement relates directly to the operations and financial reporting of the registrant.
The Audit Committee has adop ted a Policy for Engagement of Independent Accountants for Audit and Non-Audit Services (“Policy”). The Policy sets forth the understanding of the Audit Committee regarding the engagement of the registrant’s independent accountants to provide (i) audit and permissible audit-related, tax and other services to the registrant (collectively “Fund Services”); (ii) non-audit services to the registrant’s investment adviser (not including any sub-adviser whose role is primarily portfolio management and is subcontracted with or overseen by another investment
adviser) and Adviser Affiliates, if the engagement relates directly to the operations or financial reporting of a Fund (collectively “Fund-related Adviser Services”); and (iii) certain other audit and non-audit services to the registrant’s investment adviser (not including any sub-adviser whose role is primarily portfolio management and is subcontracted with or overseen by another investment adviser) and Adviser Affiliates. Unless a type of service receives general pre-approval under the Policy, it requires specific pre-approval by the Audit Committee if it is to be provided by the independent accountants. Pre-approval of non-audit services to the registrant, the registrant’s investment adviser (not including any sub-adviser whose role is primarily portfolio management and is subcontracted with or overseen by another investment adviser) and Adviser Affiliates may be waived provide d that the “de minimis” requirements set forth under paragraph (c)(7)(i)(C) of Rule 2-01 of Regulation S-X are met.
Under the Policy, the Audit Committee may delegate pre-approval authority to any pre-designated member or members who are Independent Trustees/Directors. The member(s) to whom such authority is delegated must report, for informational purposes only, any pre-approval decisions to the Audit Committee at its next regular meeting. The Audit Committee’s responsibilities with respect to the pre-approval of services performed by the independent accountants may not be delegated to management.
The Policy requires the Fund Treasurer and/or Director of Board Administration to submit to the Audit Committee, on an annual basis, a schedule of the types of services that are subject to general pre-approval. The schedule(s) provide a description of each type of service that is subject to general pre-approval and, where possible, will provide estimated fee caps for each instance of providing each service. The Audit Committees will review and approve the types of services and review the projected fees for the next fiscal year and may add to, or subtract from, the list of general pre-approved services from time to time based on subsequent determinations. That approval acknowledges that the Audit Committee is in agreement with the specific types of services that the independent accountants will be permitted to perform.
The Fund Treasurer and/or Director of Board Administration shall report to the Audit Committee at each of its regular meetings regarding all Fund Services or Fund-related Adviser Services initiated since the last such report was rendered, including a general description of the services, actual billed and projected fees, and the means by which such Fund Services or Fund-related Adviser Services were pre-approved by the Audit Committee.
*****
(e)(2) The percentage of services described in paragraphs (b) through (d) of this Item approved pursuant to the “de minimis” exception under paragraph (c)(7)(i)(C) of Rule 2-01 of Regulation S-X during both fiscal years ended September 30, 2009 and September 30, 2008 was zero.
(f) Not applicable.
(g) The aggregate non-audit fees billed by the registrant’s accountant for services rendered to the registrant, and rendered to the registrant’s investment adviser (not including any sub-adviser whose role is primarily portfolio management and is subcontracted with or overseen by another investment adviser), and any entity controlling, controlled by, or under common control with the adviser that provides ongoing services to the registrant for the fiscal years ended September 30, 2009 and September 30, 2008 are approximately as follows:
2009 | | 2008 | |
$ | 951,800 | | $ | 1,054,300 | |
| | | | | |
(h) The registrant’s Audit Committee of the Board of Directors has considered whether the provision of non-audit services that were rendered to the registrant’s adviser (not including any sub-adviser whose role is primarily portfolio management and is subcontracted with or overseen by another investment adviser), and any entity controlling, controlled by, or under common control with the investment adviser that provides ongoing services to the registrant that were not pre-approved pursuant to paragraph (c)(7)(ii) of Rule 2-01 of Regulation S-X, is compatible with maintaining the principal accountant’s independence.
Item 5. Audit Committee of Listed Registrants.
Not applicable.
Item 6. Investments
(a) The registrant’s “Schedule I — Investments in securities of unaffiliated issuers” (as set forth in 17 CFR 210.12-12) is included in Item 1 of this Form N-CSR.
(b) Not applicable.
Item 7. Disclosure of Proxy Voting Policies and Procedures for Closed-End Management Investment Companies.
Not applicable.
Item 8. Portfolio Managers of Closed-End Management Investment Companies.
Not applicable.
Item 9. Purchases of Equity Securities by Closed-End Management Investment Company and Affiliated Purchasers.
Not applicable.
Item 10. Submission of Matters to a Vote of Security Holders.
There have not been any material changes to the procedures by which shareholders may recommend nominees to the registrant’s board of directors, since those procedures were last disclosed in response to requirements of Item 407(c)(2)(iv) of Regulation S-K (as required by Item 22(b)(15) of Schedule 14A) or this Item.
Item 11. Controls and Procedures.
(a) The registrant’s principal executive officer and principal financial officers, based on their evaluation of the registrant’s disclosure controls and procedures as of a date within 90 days of the filing of this report, have concluded that such controls and procedures are adequately designed to ensure that information required to be disclosed by the registrant in Form N-CSR is accumulated and communicated to the registrant’s management, including the principal executive officer and principal financial officer, or persons performing similar functions, as appropriate to allow timely decisions regarding required disclosure.
(b) There was no change in the registrant’s internal control over financial reporting that occurred during the registrant’s second fiscal quarter of the period covered by this report that has materially affected, or is reasonably likely to materially affect, the registrant’s internal control over financial reporting.
Item 12. Exhibits.
(a)(1) Code of ethics required to be disclosed under Item 2 of Form N-CSR attached hereto as Exhibit 99.CODE ETH.
(a)(2) Certifications pursuant to Rule 30a-2(a) under the Investment Company Act of 1940 (17 CFR 270.30a-2(a)) attached hereto as Exhibit 99.CERT.
(a)(3) Not applicable.
(b) Certification pursuant to Rule 30a-2(b) under the Investment Company Act of 1940 (17 CFR 270.30a-2(b)) attached hereto as Exhibit 99.906CERT.
SIGNATURES
Pursuant to the requirements of the Securities Exchange Act of 1934 and the Investment Company Act of 1940, the registrant has duly caused this report to be signed on its behalf by the undersigned, thereunto duly authorized.
(registrant) | | Columbia Funds Series Trust I |
|
|
By (Signature and Title) | | /s/ J. Kevin Connaughton |
| | J. Kevin Connaughton, President |
|
|
Date | | November 20, 2009 |
| | | | |
Pursuant to the requirements of the Securities Exchange Act of 1934 and the Investment Company Act of 1940, this report has been signed below by the following persons on behalf of the registrant and in the capacities and on the dates indicated.
By (Signature and Title) | | /s/ J. Kevin Connaughton |
| J. Kevin Connaughton, President |
|
|
Date | | November 20, 2009 |
| |
| |
By (Signature and Title) | | /s/ Michael G. Clarke |
| Michael G. Clarke, Chief Financial Officer |
|
|
Date | | November 20, 2009 |
| | | | |