UNITED STATES
SECURITIES AND EXCHANGE COMMISSION
Washington, D.C. 20549
FORM N-CSR
CERTIFIED SHAREHOLDER REPORT OF REGISTERED
MANAGEMENT INVESTMENT COMPANIES
| | |
Investment Company Act file number | | 811-04367 |
Columbia Funds Series Trust I
|
| (Exact name of registrant as specified in charter) |
| | |
| One Financial Center, Boston, Massachusetts | | 02111 |
| (Address of principal executive offices) | | (Zip code) |
James R. Bordewick, Jr., Esq.
Columbia Management Advisors, LLC
One Financial Center
Boston, MA 02111
|
| (Name and address of agent for service) |
Registrant’s telephone number, including area code: 1-617-426-3750
Date of fiscal year end: April 30
Date of reporting period: April 30, 2009
Form N-CSR is to be used by management investment companies to file reports with the Commission not later than 10 days after the transmission to stockholders of any report that is required to be transmitted to stockholders under Rule 30e-1 under the Investment Company Act of 1940 (17 CFR 270.30e-1). The Commission may use the information provided on Form N-CSR in its regulatory, disclosure review, inspection, and policymaking roles.
A registrant is required to disclose the information specified by Form N-CSR, and the Commission will make this information public. A registrant is not required to respond to the collection of information contained in Form N-CSR unless the Form displays a currently valid Office of Management and Budget (“OMB”) control number. Please direct comments concerning the accuracy of the information collection burden estimate and any suggestions for reducing the burden to Secretary, Securities and Exchange Commission, 450 Fifth Street, NW, Washington, DC 20549-0609. The OMB has reviewed this collection of information under the clearance requirements of 44 U.S.C. § 3507.
| Item 1. | Reports to Stockholders. |

Annual Report
April 30, 2009
Columbia Core Bond Fund
| | |
| NOT FDIC INSURED | | May Lose Value |
| NOT BANK ISSUED | | No Bank Guarantee |
Table of contents
The views expressed in this report reflect the current views of the respective parties. These views are not guarantees of future performance and involve certain risks, uncertainties and assumptions that are difficult to predict, so actual outcomes and results may differ significantly from the views expressed. These views are subject to change at any time based upon economic, market or other conditions and the respective parties disclaim any responsibility to update such views. These views may not be relied on as investment advice and, because investment decisions for a Columbia Fund are based on numerous factors, may not be relied on as an indication of trading intent on behalf of any particular Columbia Fund. References to specific securities should not be construed as a recommendation or investment advice.
President’s Message

Dear Shareholder:
Recent events have shown great volatility in the markets and uncertainty in the economy. During these challenging times, it becomes even more important to focus on long-term horizons and key investment tools that can help manage volatility. This may be the time to reflect on your investment goals and evaluate your portfolio to ensure you are positioned for any potential market rebound.
A long-term financial plan can serve as a road map and guide you through the necessary steps designed to meet your financial goals. Your financial plan should take into account your investment goals, time horizon, overall financial situation, risk tolerance and willingness to ride out market volatility. Your investment professional can be a key resource as you work through this process. The knowledge and experience of an investment professional can help as you create or reevaluate your investment strategy.
The importance of diversification
Although diversification does not ensure a profit or guarantee against loss, a diversified portfolio can be a strategy for successful long-term investing. Diversification refers to the mix of investments within a portfolio. A mutual fund can contribute to portfolio diversification given that a mutual fund’s portfolio represents several investments. Additionally, the way you allocate your money among stocks, bonds and cash, and geographically between foreign and domestic investments, can help to reduce risks. Diversification can result in multiple investments where the positive performance of certain holdings can offset any negative performance from other holdings. Having a diversified portfolio doesn’t mean that the value of the portfolio will never go down, but rather helps strike a balance between risk and reward.
Reevaluate your strategy
An annual review of your investments is a key opportunity to determine if your investment needs have changed or if you need minor adjustments to rebalance your portfolio. Life events like a birth, marriage, home improvement, or change in employment can have a major effect on your spending and goals. Ask yourself how your spending or goals have changed and factor this into your financial plan. Are you using automated investments or payroll deductions to help keep your savings on track? Are you able to set aside additional savings or increase your 401(k) plan contributions? If during your review you find that your investments in any one category (e.g., stocks, bonds or cash) have grown too large based on your diversification plan, you may want to consider redirecting future investments to get back on track.
History has shown that the U.S. stock market has been remarkably resilient¹. Volatility can lead to opportunity. Patience and a commitment to your long-term financial plan may position you to potentially benefit over your investment horizon. We appreciate your business and continued support of Columbia Funds.
Sincerely,

J. Kevin Connaughton
President, Columbia Funds
The board of trustees elected J. Kevin Connaughton president of Columbia Funds on January 16, 2009.
| 1 | The Dow Jones Industrial Average is the most widely used indicator of the overall condition of the stock market. The Dow Jones Industrial Average Index is a price-weighted average of 30 actively traded blue-chip stocks as selected by the editors of the Wall Street Journal. Indices are not investments, do not incur fees or expenses and are not professionally managed. It is not possible to invest directly in an index. |
Fund Profile – Columbia Core Bond Fund
Summary
| n | | For the 12-month period that ended April 30, 2009, the fund’s Class A shares returned 1.48% without sales charge. |
n | | The fund underperformed its benchmark, the Barclays Capital U.S. Aggregate Bond Index1, because it had more exposure to securitized asset classes, which lagged Treasury securities. |
n | | The fund’s relatively conservative security selection enabled it to outperform its peer group, the Lipper Corporate Debt Funds A Rated Classification2. |
Portfolio Management
Alexander D. Powers has co-managed the fund since December 2007 and has been associated with the advisor or its predecessors since 1996.
Jonathan P. Carlson has co-managed the fund since December 2007 and has been associated with the advisor or its predecessors since 2007.
Michael Zazzarino has co-managed the fund since December 2007 and has been associated with the advisor or its predecessors since 2005.
Carl Pappo has co-managed the fund since March 2008 and has been associated with the advisor or its predecessors since 1993.
1 | The Barclays Capital U.S. Aggregate Bond Index is a market value-weighted index that tracks the daily price, coupon, pay-downs and total return performance of fixed-rate, publicly placed, dollar-denominated and non-convertible investment grade debt issues with at least $250 million par amount outstanding and with at least one year to final maturity. Indices are not available for investment and do not reflect sales charges, fees, brokerage commissions, taxes or other expenses of investing. Securities in the fund may not match those in an index. |
2 | Lipper Inc., a widely respected data provider in the industry, calculates an average total return (assuming reinvestment of distributions) for mutual funds with investment objectives similar to those of the fund. Lipper makes no adjustment for the effect of sales loads. |
Performance data quoted represents past performance and current performance may be lower or higher. Past performance is no guarantee of future results. The investment return and principal value will fluctuate so that shares, when redeemed, may be worth more or less than the original cost. Please visit www.columbiafunds.com for daily and most recent month-end performance updates.
Summary
1-year return as of 04/30/09
| | |
| |
 | | +1.48% Class A shares |
| | (without sales charge) |
| |
| | +3.84% Barclays Capital U.S. Aggregate Bond Index |
|
Morningstar Style Box™ |
|
Fixed Income Maturity |
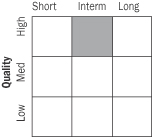
|
The Morningstar Style Box™ reveals a fund’s investment strategy. For fixed-income funds, the vertical axis shows the average credit quality of the bonds owned, and the horizontal axis shows interest rate sensitivity as measured by a bond’s duration (short, intermediate or long). Information shown is based on the most recent data provided by Morningstar.
1
Economic Update – Columbia Core Bond Fund
Summary
For the 12-month period that ended April 30, 2009
| | n | | Despite volatility, the Barclays Capital U.S. Aggregate Bond Index delivered a modest gain. High-yield bonds lost ground, as measured by the Merrill Lynch U.S. High Yield, Cash Pay Index. | |
| | |
| Barclays Aggregate Index | | Merrill Lynch Index |
| |

| | 
|
3.84% | | –14.48% |
| | n | | The broad U.S. stock market, as measured by the S&P 500 Index, returned negative 35.31%. Stock markets outside the United States returned negative 42.76%, as measured (in U.S. dollars) by the MSCI EAFE Index. | |
| | |
| S&P Index | | MSCI Index |
| |
| |
|
–35.31% | | –42.76% |
Economic growth ground to a halt during the 12-month period that began May 1, 2008 and ended April 30, 2009. The National Bureau of Economic Research reported that the U.S. economy had slipped into recession late in 2007, and the downturn worsened as the period wore on. Gross domestic product, a common measure of economic growth, declined 6.3% in the fourth quarter of 2008 and 6.1% in the first quarter of 2009.
A host of factors weighed on consumers and businesses alike. The most severe housing downturn in decades showed few signs of abating as inventories of homes for sale rose, home prices declined and tighter credit standards, the result of continued turmoil in the subprime mortgage market, made it more difficult for homebuyers to qualify for loans. In addition, home mortgage foreclosure rates soared in March and April.
Consumers bore the brunt of the recession on more than one front. In addition to housing woes, the labor market continued to contract throughout the period, driving the unemployment rate to 8.9%. More than 5.5 million jobs have been lost since the recession commenced late in 2007, although the April decline was smaller than it had been in the prior five months. An increase in chain store sales in the early months of 2009 raised hopes that this severe recession may not be intensifying. However, overall retail sales continued to lose ground, as consumers remained reluctant to spend, especially on higher-end goods.
A weakening economy and turmoil in the financial markets took a toll on consumer confidence, which set new all-time lows during the period. However, the monthly Conference Board gauge was nearly unchanged in March and actually rose in April. Another bright spot during this period of relative uncertainty: energy and commodity prices declined. Gasoline prices came down from $4 per gallon or more last summer to just above $2 per gallon. The price of oil fell below $40 per barrel in December before rising just above $50 at the end of April.
In an effort to restore confidence in the capital markets, loosen the reins on credit and shore up economic growth, the Federal Reserve Board (the Fed) brought a key short-term rate — the federal funds rate — down from 2.00% to a target between zero and 0.25% during the 12-month period — a record low.
Bonds outperformed stocks
The U.S. bond market seesawed during the 12-month period, but many sectors delivered positive returns. As the economy faltered and stock market volatility increased, the benchmark 10-year U.S. Treasury yield declined from 3.8% to 3.1% and Treasury prices rose. High quality corporate bonds had a poor showing in 2008, but they rebounded early in 2009. The Barclays Capital U.S. Aggregate Bond Index (formerly the Lehman Brothers U.S. Aggregate Bond Index) returned 3.84%. High-yield bond prices fell sharply as economic prospects weakened and default fears rose. The Merrill Lynch U.S. High Yield, Cash Pay Index1 returned negative 14.48% despite a modest comeback in the final months of the period. The Barclays Capital Municipal Bond Index2 returned 3.11% for the 12-month period.
2
Economic Update (continued) – Columbia Core Bond Fund
After sharp retreat, stocks regain some ground
Against a weakening economic backdrop, the U.S. stock market lost 35.31% for the 12-month period, as measured by the S&P 500 Index.3 Losses affected the stocks of companies of all sizes and investment style categories, although growth stocks held up better than value stocks, as measured by their respective Russell indices.4 Stock markets outside the U.S. suffered even greater losses. The MSCI EAFE Index,5 a broad gauge of stock market performance in foreign developed markets, lost 42.76% (in U.S. dollars) for the period. Emerging stock markets, which generally have had a strong run over the past several years, were also caught in the downdraft. As investors backed away from risk, the MSCI Emerging Markets Index6 returned negative 42.90% (in U.S. dollars).
Past performance is no guarantee of future results.
1 | The Merrill Lynch U.S. High Yield, Cash Pay Index tracks the performance of non-investment-grade corporate bonds. As of 01/01/2009, Merrill Lynch & Co., Inc. is a wholly-owned subsidiary of Bank of America Corporation and an affiliate of Columbia Management. |
2 | The Barclays Capital Municipal Bond Index is considered representative of the broad market for investment-grade, tax-exempt bonds with maturities of at least one year. |
3 | The Standard & Poor’s (S&P) 500 Index tracks the performance of 500 widely held, large-capitalization U.S. stocks. |
4 | The Russell 1000® Index measures the performance of 1,000 of the largest U.S. companies, based on market capitalization. The Russell Midcap Index measures the performance of the 800 smallest companies in the Russell 1000 Index, as ranked by total market capitalization. The Russell 2000 Index measures the performance of the 2,000 smallest of the 3,000 largest U.S. companies, based on market capitalization. The Russell 1000 Growth Index measures the performance of those Russell 1000 Index companies with higher price-to-book ratios and higher forecasted growth values. The Russell 1000 Value Index measures the performance of those companies in the Russell 1000 Index with lower price-to-book ratios and lower forecasted growth values. The Russell 2000 Growth Index measures the performance of those Russell 2000 Index companies with higher price-to-book ratios and higher forecasted growth values. The Russell 2000 Value Index measures the performance of those Russell 2000 Index companies with lower price-to-book ratios and lower forecasted growth values. The Russell 3000 Growth Index measures the performance of those Russell 3000 Index companies with higher price-to-book ratios and higher forecasted growth values. The Russell 3000 Value Index measures the performance of those Russell 3000 Index companies with lower price-to-book ratios and lower forecasted growth values. The Russell Midcap Growth Index measures the performance of those Russell Midcap companies with higher price-to-book ratios and higher forecasted growth values. The Russell Midcap Value Index measures the performance of those Russell Midcap Index companies with lower price-to-book ratios and lower forecasted growth values. |
5 | The Morgan Stanley Capital International (MSCI) Europe, Australasia, Far East (EAFE) Index is a free float-adjusted market capitalization index that is designed to measure developed market equity performance, excluding the U.S. and Canada. |
6 | The Morgan Stanley Capital International (MSCI) Emerging Markets Index is a widely accepted index composed of a sample of companies from 25 countries representing the global emerging stock markets. |
Indicesare not available for investment, and do not reflect sales charges, fees, brokerage commissions, taxes or other expenses of investing. Securities in the fund may not match those in an index.
3
Performance Information – Columbia Core Bond Fund
Performance data quoted represents past performance and current performance may be lower or higher. Past performance is no guarantee of future results. The investment return and principal value will fluctuate so that shares, when redeemed, may be worth more or less than the original cost. Please visit www.columbiafunds.com for daily and most recent month-end performance updates.
| | |
| Annual operating expense ratio (%)* |
Class A | | 0.88 |
Class B | | 1.63 |
Class C | | 1.63 |
Class T | | 0.78 |
Class Z | | 0.63 |
| | |
Annual operating expense ratio
after contractual waivers (%)* |
Class A | | 0.70 |
Class B | | 1.45 |
Class C | | 1.45 |
Class T | | 0.60 |
Class Z | | 0.45 |
| * | The annual operating expense ratio and annual operating expense ratio after contractual waivers are as stated in the fund’s prospectus that is current as of the date of this report. The contractual waiver expires 08/31/09. Differences in expense ratios disclosed elsewhere in this report may result from including fee waivers and expense reimbursements as well as different time periods used in calculating the ratios. |
|
| Performance of a $10,000 investment 05/01/99 – 04/30/09 |
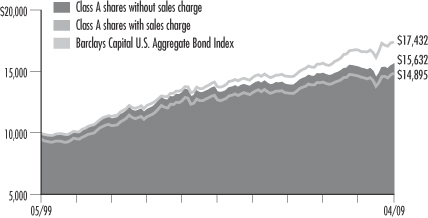
The chart above shows the change in value of a hypothetical $10,000 investment in Class A shares of Columbia Core Bond Fund during the stated time period, and does not reflect the deduction of taxes a shareholder may pay on fund distributions or on the redemption of fund shares. The Barclays Capital U.S. Aggregate Bond Index is a market value weighted index that tracks the daily price, coupon, pay-downs and total return performance of fixed-rate, publicly placed, dollar denominated non-convertible investment grade debt issues with at least $250 million par amount outstanding and with at least one year to final maturity. Indices are not available for investment, and do not reflect sales charges, fees, brokerage commissions, taxes or other expenses of investing. Securities in the fund may not match those in an index.
| | | | |
| Performance of a $10,000 investment 05/01/99 – 04/30/09 ($) |
| Sales charge | | without | | with |
Class A | | 15,632 | | 14,895 |
Class B | | 14,535 | | 14,535 |
Class C | | 14,671 | | 14,671 |
Class T | | 15,725 | | 14,984 |
Class Z | | 16,009 | | n/a |
| | | | | | | | | | | | | | | | | | |
| Average annual total return as of 04/30/09 (%) |
| Share class | | A | | B | | C | | T | | Z |
| Inception | | 11/01/98 | | 11/01/98 | | 11/25/02 | | 12/14/90 | | 12/14/90 |
| Sales charge | | without | | with | | without | | with | | without | | with | | without | | with | | without |
1-year | | 1.48 | | –3.33 | | 0.72 | | –4.13 | | 0.87 | | –0.10 | | 1.58 | | –3.24 | | 1.73 |
5-year | | 3.17 | | 2.16 | | 2.41 | | 2.07 | | 2.55 | | 2.55 | | 3.28 | | 2.27 | | 3.43 |
10-year | | 4.57 | | 4.06 | | 3.81 | | 3.81 | | 3.91 | | 3.91 | | 4.63 | | 4.13 | | 4.82 |
| Average annual total return as of 03/31/09 (%) |
| Share class | | A | | B | | C | | T | | Z |
| Sales charge | | without | | with | | without | | with | | without | | with | | without | | with | | without |
1-year | | 0.14 | | –4.58 | | –0.61 | | –5.39 | | –0.46 | | –1.42 | | 0.24 | | –4.48 | | 0.39 |
5-year | | 2.37 | | 1.38 | | 1.61 | | 1.27 | | 1.76 | | 1.76 | | 2.47 | | 1.49 | | 2.63 |
10-year | | 4.48 | | 3.97 | | 3.72 | | 3.72 | | 3.81 | | 3.81 | | 4.54 | | 4.03 | | 4.73 |
The “with sales charge” returns include the maximum initial sales charge of 4.75% for Class A and T shares, the applicable contingent deferred sales charge of 5.00% in the first year, declining to 1.00% in the sixth year and eliminated thereafter for Class B shares and 1.00% for Class C shares for the first year only. The “without sales charge” returns do not include the effect of sales charges. If they had, returns would be lower.
All results shown assume reinvestment of distributions. Class Z shares are sold at net asset value with no distribution and service (Rule 12b-1) fees. Class Z shares have limited eligibility and the investment minimum requirements may vary. Please see the fund’s prospectus for details. Performance for different share classes will vary based on differences in sales charges and fees associated with each class.
Performance results reflect any fee waivers or reimbursements of fund expenses by the investment advisor and/or any of its affiliates. Absent these fee waivers or expense reimbursement arrangements, performance results would have been lower.
The tables do not reflect the deduction of taxes that a shareholder may pay on fund distributions or on the redemption of fund shares.
Class A, Class B, Class C, Class T and Class Z share performance information includes returns of Prime A shares (for Class A shares), Prime B shares (for Class B and Class C shares), Retail A shares (for Class T shares) and Trust shares (for Class Z shares) of Galaxy Quality Plus Bond Fund, the predecessor to the fund and a series of The Galaxy Fund (the “Predecessor Fund”), for periods prior to November 25, 2002, the date on which Class A, Class B, Class C, Class T and Class Z shares were initially offered by the fund. The returns shown for all share classes reflect any differences in sales charges, but have not been restated to reflect any differences in expenses between the Predecessor Fund share classes and the corresponding newer share classes. If differences in expenses had been reflected, the returns shown for periods prior to November 25, 2002 would be lower for Class C and Class T shares.
4
Understanding Your Expenses – Columbia Core Bond Fund
Estimating your actual expenses
To estimate the expenses that you paid over the period, first you will need your account balance at the end of the period:
| | n | | For shareholders who receive their account statements from Columbia Management Services, Inc., your account balance is available online at www.columbiafunds.com or by calling Shareholder Services at 800.345.6611. | |
| | n | | For shareholders who receive their account statements from their financial intermediary, contact your financial intermediary to obtain your account balance. | |
| | 1. | Divide your ending account balance by $1,000. For example, if an account balance was $8,600 at the end of the period, the result would be 8.6. | |
| | 2. | In the section of the table below titled “Expenses paid during the period,” locate the amount for your share class. You will find this number in the column labeled “Actual.” Multiply this number by the result from step 1. Your answer is an estimate of the expenses you paid on your account during the period. | |
If the value of your account falls below the minimum initial investment requirement applicable to you, your account generally will be subject to a $20 annual fee. This fee is not included in the accompanying table. If you are subject to the fee, keep it in mind when you are estimating the ongoing expenses of investing in the fund and when comparing the expenses of this fund with other funds.
As a fund shareholder, you incur two types of costs. There are transaction costs, which generally include sales charges on purchases and may include redemption fees or exchange fees. There are also ongoing costs, which generally include investment advisory fees, distribution and service (Rule 12b-1) fees and other fund expenses. The information on this page is intended to help you understand the ongoing costs of investing in the fund and to compare these costs with the ongoing costs of investing in other mutual funds.
Analyzing your fund’s expenses by share class
To illustrate these ongoing costs, we have provided an example and calculated the expenses paid by investors in each share class during the period. The information in the following table is based on an initial investment of $1,000, which is invested at the beginning of the period and held for the entire period. Expense information is calculated two ways and each method provides you with different information. The amount listed in the “Actual” column is calculated using the fund’s actual operating expenses and total return for the period. The amount listed in the “Hypothetical” column for each share class assumes that the return each year is 5% before expenses and is calculated based on the fund’s actual operating expenses. You should not use the hypothetical account values and expenses to estimate either your actual account balance at the end of the period or the expenses you paid during this period.
Compare with other funds
Since all mutual funds are required to include the same hypothetical calculations about expenses in shareholder reports, you can use this information to compare the ongoing cost of investing in the fund with other funds. To do so, compare the 5% hypothetical example with the 5% hypothetical examples that appear in the shareholder reports of other funds. As you compare hypothetical examples of other funds, it is important to note that hypothetical examples are meant to highlight the ongoing costs of investing in a fund and do not reflect any transaction costs, such as sales charges, redemption fees or exchange fees.
| | | | | | | | | | | | | | |
| 11/01/08 – 04/30/09 |
| | | | |
| | | Account value at the
beginning of the period ($) | | Account value at the
end of the period ($) | | Expenses paid
during the period ($) | | Fund’s annualized
expense ratio (%) |
| | | Actual | | Hypothetical | | Actual | | Hypothetical | | Actual | | Hypothetical | | Actual |
Class A | | 1,000.00 | | 1,000.00 | | 1,077.01 | | 1,021.32 | | 3.60 | | 3.51 | | 0.70 |
Class B | | 1,000.00 | | 1,000.00 | | 1,073.00 | | 1,017.60 | | 7.45 | | 7.25 | | 1.45 |
Class C | | 1,000.00 | | 1,000.00 | | 1,073.79 | | 1,018.35 | | 6.68 | | 6.51 | | 1.30 |
Class T | | 1,000.00 | | 1,000.00 | | 1,077.61 | | 1,021.82 | | 3.09 | | 3.01 | | 0.60 |
Class Z | | 1,000.00 | | 1,000.00 | | 1,078.30 | | 1,022.56 | | 2.32 | | 2.26 | | 0.45 |
Expenses paid during the period are equal to the annualized expense ratio for the share class, multiplied by the average account value over the period, then multiplied by the number of days in the fund’s most recent fiscal half-year and divided by 365.
Had the investment advisor and/or any of its affiliates not waived fees or reimbursed a portion of expenses, account value at the end of the period would have been reduced.
It is important to note that the expense amounts shown in the table are meant to highlight only ongoing costs of investing in the fund and do not reflect any transaction costs, such as sales charges, redemption fees or exchange fees. Therefore, the hypothetical examples provided may not help you determine the relative total costs of owning shares of different funds. If these transaction costs were included, your costs would have been higher.
5
Portfolio Managers’ Report – Columbia Core Bond Fund
Performance data quoted represents past performance and current performance may be lower or higher. Past performance is no guarantee of future results. The investment return and principal value will fluctuate so that shares, when redeemed, may be worth more or less than the original cost. Please visit www.columbiafunds.com for daily and most recent month-end performance updates.
| | |
| Net asset value per share |
| |
as of 04/30/09 ($) | | |
Class A | | 10.13 |
Class B | | 10.13 |
Class C | | 10.13 |
Class T | | 10.13 |
Class Z | | 10.13 |
| | |
| Distributions declared per share |
| |
05/01/08 – 04/30/09 ($) | | |
Class A | | 0.45 |
Class B | | 0.38 |
Class C | | 0.39 |
Class T | | 0.46 |
Class Z | | 0.48 |
| | |
| |
as of 04/30/09 (%) | | |
Class A | | 4.11 |
Class B | | 3.57 |
Class C | | 3.72 |
Class T | | 4.20 |
Class Z | | 4.56 |
The 30-day SEC yields reflect the fund’s earning power net of expenses, expressed as an annualized percentage of the public offering price per share at the end of the period. Had the investment advisor not waived fees or reimbursed a portion of expenses, the 30-day SEC yields would have been lower.
For the 12-month period that ended April 30, 2008, the fund’s Class A shares returned 1.48% without sales charge. The fund’s Class Z shares returned 1.73%. By comparison, the fund’s benchmark, the Barclays Capital U.S. Aggregate Bond Index (formerly the Lehman Brothers U.S. Aggregate Bond Index), returned 3.84%. The average return of the fund’s peer group, the Lipper Corporate Debt Funds A Rated Classification, was negative 4.47%. In a risk-averse environment, performance was almost entirely determined by credit quality and risk orientation.
Overweights in CMBS and ABS hampered performance
The fund underperformed its benchmark generally because it had more exposure to commercial mortgage-backed securities (CMBS) and asset-backed securities (ABS). A slowdown in the housing market, a faltering national economy and a lack of confidence in a wide range of securitized investments induced a flight to quality among investors. Against this backdrop of economic uncertainty and investor fear, Treasury securities were the instruments of choice. Investor demand pushed long-term Treasury yields to all-time lows in late 2008, and short-term rates ended just above zero following a series of interventions by the Federal Reserve Board. For the 12 months as a whole, Treasury securities outperformed virtually all other fixed-income asset classes, in some cases by a significant margin.
Conservative security selection aided performance versus peer group
Although the fund underperformed the index, it held up significantly better than many of its peers because we hedged our asset-allocation decisions with conservative security selections. Our CMBS selections were almost exclusively seasoned securities at the high end of the credit tier, minimizing the fund’s exposure to the lax credit standards that have plagued more recent issues. A concentration in high quality agency mortgages paid off when the federal government assumed control over the operations of Fannie Mae and Freddie Mac in the summer of 2008. In the months that followed, the government announced a series of recovery-oriented plans (notably the Troubled Asset Relief Plan, or TARP, and the Term Asset-Backed Securities Loan Facility, or TALF), and we positioned the fund to potentially benefit from these capital infusions. We reintroduced some banks into the fund’s corporate bond holdings following the passage of TARP, and these positions were additive to performance for the period. In addition, some of the fund’s ABS positions rallied nicely as a result of the TALF legislation, and we took some profits in this group in the last months of the period. The overall impact of security selection was sufficiently positive that the fund easily outperformed its peer group average for the period.
6
Portfolio Managers’ Report (continued) – Columbia Core Bond Fund
| | |
| Portfolio structure |
|
as of 04/30/09 (%) |
Mortgage-Backed Securities | | 46.6 |
Corporate Fixed-Income Bonds & Notes | | 21.7 |
Government & Agency Obligations | | 12.5 |
Commercial Mortgage-Backed Securities | | 9.3 |
Asset-Backed Securities | | 8.1 |
Collateralized Mortgage Obligations | | 0.5 |
Short-Term Obligation | | 7.9 |
The fund is actively managed and the composition of its portfolio will change over time. Portfolio structure is calculated as a percentage of total net assets.
| | |
| Maturity breakdown | | |
| |
as of 04/30/09 (%) | | |
0-1 year | | 5.2 |
1-5 years | | 64.8 |
5-10 years | | 23.0 |
10-20 years | | 2.4 |
20 years and over | | 4.6 |
Maturity breakdown is based on weighted average life and calculated as a percentage of total investments. Swaps are not calculated in maturity years.
| | |
| Quality breakdown | | |
| |
as of 04/30/09 (%) | | |
AAA | | 18.4 |
AA | | 6.1 |
A | | 8.4 |
BBB | | 9.0 |
BB | | 0.1 |
Treasury | | 6.4 |
Agency | | 50.6 |
Cash and Equivalents | | 0.9 |
Other | | 0.1 |
Quality breakdown is calculated as a percentage of total investments.
Ratings shown in the quality breakdown represent the rating assigned to a particular bond by one of the following nationally-recognized rating agencies: Standard & Poor’s, a division of The McGraw-Hill Companies, Inc., Moody’s Investors Service, Inc. or Fitch Ratings Ltd. Ratings are relative and subjective and are not absolute standards of quality. The fund’s credit quality does not remove market risk.
Looking ahead
We plan to continue to focus on the areas of the market under active sponsorship by the federal government, hedging our decisions by investing in high quality assets. Implicit in this strategy is a vigilance that helps us separate short-term beneficiaries of the Treasury’s largesse from those issues that make attractive long-term investments in their own right. We have been cautiously optimistic that the government’s efforts will prove successful over time, and we note the market enters the new reporting period having shed at least some of the rampant pessimism that prevailed in 2008.
Investing in fixed-income securities may involve certain risks, including the credit quality of individual issuers, possible prepayments, market or economic developments and yield and share price fluctuations due to changes in interest rates. Investing in foreign fixed-income markets carries additional risks associated with foreign political and economic developments and changes in currency exchange rates. When interest rates go up, bond prices typically drop, and vice versa.
7
Investment Portfolio – Columbia Core Bond Fund
April 30, 2009
Mortgage-Backed Securities – 46.6%
| | | | |
| | | Par ($) | | Value ($) |
| Federal Home Loan Mortgage Corp. | | |
5.000% 08/01/35 | | 2,423,219 | | 2,495,394 |
5.000% 10/01/35 | | 21,528,638 | | 22,169,858 |
5.000% 12/01/36 | | 10,897,589 | | 11,217,060 |
5.000% 03/01/37 | | 2,860,197 | | 2,942,991 |
5.500% 01/01/37 | | 116,978,094 | | 121,159,935 |
7.000% 12/01/10 | | 14,423 | | 14,919 |
7.000% 12/01/14 | | 38,350 | | 40,604 |
7.000% 11/01/25 | | 4,099 | | 4,474 |
7.000% 03/01/27 | | 3,539 | | 3,824 |
7.000% 10/01/31 | | 28,944 | | 31,047 |
7.500% 09/01/25 | | 1,839 | | 2,014 |
7.500% 10/01/29 | | 87,377 | | 95,181 |
8.000% 06/01/26 | | 2,212 | | 2,435 |
9.500% 09/01/10 | | 1,071 | | 1,093 |
9.500% 04/01/11 | | 160 | | 171 |
9.500% 09/01/16 | | 861 | | 959 |
10.000% 05/01/11 | | 2,128 | | 2,256 |
| |
| Federal National Mortgage Association | | |
4.000% 03/01/39 | | 44,019,510 | | 43,930,585 |
4.500% 02/01/39 | | 65,647,530 | | 66,872,761 |
4.852% 04/01/38 (a) | | 8,734,169 | | 9,005,003 |
4.901% 04/01/38 (a) | | 9,563,822 | | 9,845,888 |
5.000% 03/01/37 | | 29,425,531 | | 30,301,955 |
5.000% 05/01/37 | | 7,414,615 | | 7,633,879 |
5.000% 03/01/38 | | 22,032,653 | | 22,684,202 |
5.199% 08/01/36 (a) | | 119,074 | | 121,408 |
5.240% 09/01/12 | | 2,336,410 | | 2,461,709 |
5.500% 02/01/37 | | 7,974,429 | | 8,270,506 |
5.765% 09/01/37 (a) | | 7,940,512 | | 8,277,747 |
6.500% 09/01/36 | | 7,110,182 | | 7,543,574 |
6.500% 09/01/37 | | 15,250,733 | | 16,179,463 |
6.500% 10/01/37 | | 8,003,713 | | 8,491,119 |
6.500% 12/01/37 | | 18,378,119 | | 19,497,299 |
6.500% 03/01/38 | | 7,655,597 | | 8,121,803 |
7.000% 06/01/32 | | 12,607 | | 13,592 |
7.500% 10/01/15 | | 23,031 | | 24,342 |
7.500% 01/01/30 | | 12,163 | | 13,261 |
7.500% 03/01/30 | | 19,123 | | 20,821 |
7.785% 02/01/19 | | 1,745,617 | | 1,882,324 |
8.000% 12/01/09 | | 1 | | 1 |
8.000% 12/01/29 | | 249,205 | | 272,726 |
8.000% 02/01/30 | | 18,286 | | 20,023 |
8.000% 03/01/30 | | 59,709 | | 65,261 |
8.000% 04/01/30 | | 67,621 | | 73,908 |
8.000% 05/01/30 | | 5,214 | | 5,699 |
8.500% 08/01/17 | | 1,159 | | 1,251 |
10.000% 10/01/20 | | 71,078 | | 78,396 |
| | | | |
| | | Par ($) | | Value ($) |
10.000% 12/01/20 | | 151,827 | | 166,955 |
TBA | | | | |
6.000% 05/01/39 (b) | | 204,000,000 | | 213,243,648 |
| |
| Government National Mortgage Association | | |
4.625% 07/20/21 (a) | | 46,596 | | 47,163 |
4.625% 07/20/22 (a) | | 53,679 | | 54,210 |
5.000% 05/19/09 (b) | | 57,800,000 | | 59,851,028 |
5.375% 04/20/22 (a) | | 223,770 | | 230,058 |
7.000% 05/15/12 | | 26,854 | | 28,405 |
7.000% 09/15/13 | | 29,122 | | 30,842 |
7.000% 11/15/22 | | 51,990 | | 55,688 |
7.000% 10/15/23 | | 25,503 | | 27,272 |
7.000% 06/15/26 | | 172,434 | | 184,820 |
7.000% 10/15/27 | | 19,632 | | 21,051 |
7.000% 05/15/28 | | 39,942 | | 42,842 |
7.000% 06/15/28 | | 7,425 | | 7,965 |
7.000% 12/15/28 | | 37,624 | | 40,356 |
7.000% 08/15/29 | | 20,437 | | 21,957 |
7.000% 02/15/30 | | 4,503 | | 4,840 |
7.000% 05/15/32 | | 148,295 | | 158,338 |
7.500% 04/15/26 | | 124,557 | | 134,569 |
7.500% 02/15/27 | | 13,941 | | 15,072 |
7.500% 09/15/29 | | 449,657 | | 486,472 |
7.500% 03/15/30 | | 81,693 | | 88,147 |
8.000% 06/15/25 | | 3,827 | | 4,166 |
8.000% 10/15/25 | | 17,613 | | 19,171 |
8.000% 01/15/26 | | 11,681 | | 12,725 |
8.000% 02/15/26 | | 2,270 | | 2,473 |
8.000% 05/15/26 | | 2,144 | | 2,335 |
8.000% 06/15/26 | | 10,695 | | 11,642 |
8.000% 03/15/27 | | 18,425 | | 20,066 |
9.000% 11/15/17 | | 40,328 | | 43,617 |
9.500% 08/15/20 | | 1,837 | | 2,023 |
9.500% 12/15/20 | | 1,262 | | 1,390 |
10.000% 05/15/16 | | 2,771 | | 3,036 |
10.000% 07/15/17 | | 14,681 | | 16,034 |
10.000% 08/15/17 | | 3,857 | | 4,213 |
10.000% 08/15/18 | | 35 | | 38 |
11.500% 06/15/13 | | 16,262 | | 18,063 |
| | | | |
Total Mortgage-Backed Securities
(cost of $690,137,271) | | 706,997,411 |
See Accompanying Notes to Financial Statements.
8
Columbia Core Bond Fund
April 30, 2009
Corporate Fixed-Income Bonds & Notes – 21.7%
| | | | |
| | | Par ($) | | Value ($) |
| Basic Materials – 0.5% | | | | |
| Chemicals – 0.2% | | | | |
| Dow Chemical Co. | | | | |
5.700% 05/15/18 | | 2,485,000 | | 2,105,329 |
| | |
| Lubrizol Corp. | | | | |
6.500% 10/01/34 | | 1,000,000 | | 767,842 |
| | | | |
Chemicals Total | | | | 2,873,171 |
| | |
| Iron/Steel – 0.3% | | | | |
| Nucor Corp. | | | | |
5.000% 06/01/13 | | 2,575,000 | | 2,686,541 |
5.850% 06/01/18 | | 1,575,000 | | 1,600,394 |
| | | | |
Iron/Steel Total | | | | 4,286,935 |
| | | | |
Basic Materials Total | | | | 7,160,106 |
| | | | |
| Communications – 2.1% | | | | |
| Media – 0.8% | | | | |
| Comcast Corp. | | | | |
5.700% 05/15/18 | | 1,680,000 | | 1,642,482 |
6.300% 11/15/17 | | 770,000 | | 783,991 |
6.950% 08/15/37 | | 1,635,000 | | 1,614,440 |
| | |
| Time Warner Cable, Inc. | | | | |
7.300% 07/01/38 | | 2,630,000 | | 2,628,998 |
| | |
| Time Warner, Inc. | | | | |
6.875% 05/01/12 | | 3,435,000 | | 3,612,624 |
| | |
| Viacom, Inc. | | | | |
5.750% 04/30/11 | | 1,635,000 | | 1,634,231 |
6.875% 04/30/36 | | 250,000 | | 203,870 |
| | | | |
Media Total | | | | 12,120,636 |
| |
Telecommunication Services – 1.3% | | |
| AT&T, Inc. | | | | |
5.625% 06/15/16 | | 2,275,000 | | 2,314,956 |
6.550% 02/15/39 | | 2,535,000 | | 2,437,953 |
| | |
| BellSouth Corp. | | | | |
5.200% 09/15/14 | | 765,000 | | 792,388 |
| |
| British Telecommunications PLC | | |
5.150% 01/15/13 | | 565,000 | | 531,757 |
| |
| Telefonica Emisiones SAU | | |
6.221% 07/03/17 | | 1,325,000 | | 1,371,698 |
6.421% 06/20/16 | | 2,500,000 | | 2,615,445 |
| |
| Verizon Wireless Capital LLC | | |
5.550% 02/01/14 (c) | | 6,010,000 | | 6,304,658 |
8.500% 11/15/18 (c) | | 2,450,000 | | 2,934,127 |
|
Telecommunication Services Total | | 19,302,982 |
| | | | |
Communications Total | | 31,423,618 |
| | | | |
| | | Par ($) | | Value ($) |
| Consumer Cyclical – 0.8% | | | | |
| Airlines – 0.0% | | | | |
| Continental Airlines, Inc. | | |
7.461% 04/01/15 | | 665,228 | | 485,617 |
|
Airlines Total | | 485,617 |
| | |
| Home Builders – 0.0% | | | | |
| D.R. Horton, Inc. | | |
5.625% 09/15/14 | | 365,000 | | 308,425 |
|
Home Builders Total | | 308,425 |
| | |
| Restaurants – 0.2% | | | | |
| McDonald’s Corp. | | |
5.000% 02/01/19 | | 510,000 | | 517,019 |
5.700% 02/01/39 | | 1,900,000 | | 1,808,492 |
|
Restaurants Total | | 2,325,511 |
| | |
| Retail – 0.6% | | | | |
| Best Buy Co., Inc. | | |
6.750% 07/15/13 | | 2,745,000 | | 2,711,258 |
| |
| CVS Pass-Through Trust | | |
5.298% 01/11/27 (c) | | 771,448 | | 559,912 |
6.036% 12/10/28 (c) | | 3,308,636 | | 2,452,129 |
| |
| Macy’s Retail Holdings, Inc. | | |
5.350% 03/15/12 | | 455,000 | | 415,245 |
| |
| Starbucks Corp. | | |
6.250% 08/15/17 | | 2,710,000 | | 2,500,352 |
|
Retail Total | | 8,638,896 |
| | | | |
Consumer Cyclical Total | | 11,758,449 |
| | | | |
| Consumer Non-cyclical – 2.4% |
| Beverages – 0.8% | | | | |
| Anheuser-Busch InBev Worldwide, Inc. | | |
7.750% 01/15/19 (c)(d) | | 3,660,000 | | 3,831,910 |
8.200% 01/15/39 (c) | | 930,000 | | 931,872 |
| |
| Bottling Group LLC | | |
5.125% 01/15/19 | | 1,700,000 | | 1,726,501 |
| |
| PepsiCo, Inc. | | |
7.900% 11/01/18 | | 2,530,000 | | 3,053,389 |
| |
| SABMiller PLC | | |
6.200% 07/01/11 (c) | | 2,755,000 | | 2,773,395 |
|
Beverages Total | | 12,317,067 |
| | |
| Food – 0.7% | | | | |
| Campbell Soup Co. | | |
4.500% 02/15/19 | | 2,470,000 | | 2,437,082 |
| |
| ConAgra Foods, Inc. | | |
7.000% 10/01/28 | | 3,160,000 | | 3,062,135 |
| |
| Kraft Foods, Inc. | | |
6.500% 08/11/17 | | 1,405,000 | | 1,457,504 |
See Accompanying Notes to Financial Statements.
9
Columbia Core Bond Fund
April 30, 2009
Corporate Fixed-Income Bonds & Notes (continued)
| | | | |
| | | Par ($) | | Value ($) |
| Consumer Non-cyclical (continued) |
| Kroger Co. | | |
8.000% 09/15/29 | | 2,260,000 | | 2,446,226 |
|
Food Total | | 9,402,947 |
| |
| Healthcare Services – 0.1% | | |
| WellPoint, Inc. | | |
7.000% 02/15/19 | | 1,700,000 | | 1,733,413 |
|
Healthcare Services Total | | 1,733,413 |
| |
| Household Products/Wares – 0.3% | | |
| Clorox Co. | | |
5.950% 10/15/17 | | 900,000 | | 910,671 |
| |
| Fortune Brands, Inc. | | |
5.125% 01/15/11 | | 3,815,000 | | 3,816,412 |
|
Household Products/Wares Total | | 4,727,083 |
| |
| Pharmaceuticals – 0.5% | | |
| Novartis Securities Investment Ltd. | | |
5.125% 02/10/19 | | 3,640,000 | | 3,727,091 |
| |
| Wyeth | | |
5.500% 02/15/16 | | 3,680,000 | | 3,774,138 |
|
Pharmaceuticals Total | | 7,501,229 |
| | | | |
Consumer Non-cyclical Total | | 35,681,739 |
| | | | |
| Energy – 2.8% | | | | |
| Oil & Gas – 1.3% | | | | |
| Canadian Natural Resources Ltd. | | |
6.250% 03/15/38 | | 1,445,000 | | 1,174,999 |
| | |
| Devon Energy Corp. | | | | |
6.300% 01/15/19 | | 1,230,000 | | 1,273,129 |
| | |
| Gazprom International SA | | | | |
7.201% 02/01/20 | | 176,498 | | 158,848 |
| | |
| Hess Corp. | | | | |
7.300% 08/15/31 | | 1,980,000 | | 1,789,286 |
| | |
| Marathon Oil Corp. | | | | |
6.000% 07/01/12 | | 3,065,000 | | 3,119,686 |
7.500% 02/15/19 | | 1,160,000 | | 1,215,454 |
| | |
| Nexen, Inc. | | | | |
5.875% 03/10/35 | | 1,995,000 | | 1,380,304 |
| | |
| Qatar Petroleum | | | | |
5.579% 05/30/11 (c) | | 1,552,902 | | 1,576,893 |
|
| Ras Laffan Liquefied Natural Gas Co., Ltd. III |
5.832% 09/30/16 (c) | | 2,130,000 | | 2,072,660 |
| | |
| Talisman Energy, Inc. | | | | |
5.850% 02/01/37 | | 2,145,000 | | 1,450,994 |
| | | | |
| | | Par ($) | | Value ($) |
| Valero Energy Corp. | | | | |
6.625% 06/15/37 | | 2,235,000 | | 1,769,584 |
6.875% 04/15/12 | | 2,547,000 | | 2,605,540 |
| | | | |
Oil & Gas Total | | | | 19,587,377 |
| | |
| Oil & Gas Services – 0.6% | | | | |
| Halliburton Co. | | | | |
5.900% 09/15/18 | | 2,040,000 | | 2,118,581 |
| | |
| Smith International, Inc. | | | | |
9.750% 03/15/19 | | 1,855,000 | | 1,960,503 |
| | |
| Weatherford International Ltd. | | | | |
5.150% 03/15/13 | | 4,500,000 | | 4,225,527 |
7.000% 03/15/38 | | 1,090,000 | | 806,131 |
| | | | |
Oil & Gas Services Total | | 9,110,742 |
|
| Pipelines – 0.9% |
| Enbridge Energy Partners LP |
7.500% 04/15/38 | | 1,060,000 | | 837,332 |
| | |
| Energy Transfer Partners LP | | | | |
6.000% 07/01/13 | | 3,195,000 | | 3,166,993 |
8.500% 04/15/14 | | 2,175,000 | | 2,347,636 |
| |
| Kinder Morgan Energy Partners LP | | |
6.950% 01/15/38 | | 1,945,000 | | 1,691,061 |
| | |
| ONEOK Partners LP | | | | |
6.850% 10/15/37 | | 835,000 | | 628,139 |
| | |
| Plains All American Pipeline LP | | | | |
6.500% 05/01/18 | | 635,000 | | 568,386 |
| | |
| TEPPCO Partners LP | | | | |
7.625% 02/15/12 | | 1,311,000 | | 1,294,758 |
| | |
| TransCanada Pipelines Ltd. | | | | |
6.350% 05/15/67 (a) | | 5,160,000 | | 3,302,400 |
| | | | |
Pipelines Total | | | | 13,836,705 |
| | | | |
Energy Total | | | | 42,534,824 |
| | | | |
| Financials – 8.7% | | | | |
| Banks – 5.5% | | | | |
| American Express Centurion Bank | | |
4.375% 07/30/09 | | 1,265,000 | | 1,265,230 |
| | |
| ANZ National International Ltd. | | | | |
6.200% 07/19/13 (c) | | 5,490,000 | | 5,481,150 |
| | |
| Bank of New York Mellon Corp. | | | | |
4.500% 04/01/13 (d) | | 2,100,000 | | 2,130,912 |
5.125% 08/27/13 | | 1,125,000 | | 1,165,900 |
| | |
| Capital One Capital IV | | | | |
6.745% 02/17/37 (a) | | 3,185,000 | | 1,353,335 |
| | |
| Capital One Financial Corp. | | | | |
5.700% 09/15/11 | | 4,485,000 | | 4,285,072 |
See Accompanying Notes to Financial Statements.
10
Columbia Core Bond Fund
April 30, 2009
Corporate Fixed-Income Bonds & Notes (continued)
| | | | |
| | | Par ($) | | Value ($) |
| Financials (continued) | | | | |
| Citigroup, Inc. | | | | |
6.500% 08/19/13 | | 8,265,000 | | 7,542,680 |
| | |
| Comerica Bank | | | | |
5.200% 08/22/17 | | 2,425,000 | | 1,649,677 |
5.750% 11/21/16 | | 545,000 | | 403,489 |
| | |
| Deutsche Bank AG | | | | |
4.875% 05/20/13 | | 5,880,000 | | 5,839,158 |
| | |
| HSBC Bank USA | | | | |
3.875% 09/15/09 | | 4,145,000 | | 4,106,941 |
| | |
| JPMorgan Chase & Co. | | | | |
6.300% 04/23/19 | | 7,125,000 | | 7,011,306 |
| | |
| JPMorgan Chase Capital XXII | | | | |
6.450% 02/02/37 | | 1,930,000 | | 1,375,548 |
| | |
| KeyBank NA | | | | |
5.800% 07/01/14 | | 1,770,000 | | 1,500,250 |
| | |
| Keycorp | | | | |
6.500% 05/14/13 | | 5,850,000 | | 5,558,243 |
| | |
| Lloyds TSB Group PLC | | | | |
6.267% 12/31/49 (a)(c) | | 1,425,000 | | 406,125 |
| | |
| M&I Marshall & Ilsley Bank | | | | |
5.300% 09/08/11 | | 2,490,000 | | 2,255,708 |
| | |
| Merrill Lynch & Co., Inc. | | | | |
6.050% 08/15/12 (e) | | 645,000 | | 593,260 |
6.150% 04/25/13 (e) | | 2,200,000 | | 2,022,680 |
5.700% 05/02/17 (e) | | 3,850,000 | | 2,524,029 |
7.750% 05/14/38 (e) | | 2,075,000 | | 1,417,161 |
| | |
| National Australia Bank Ltd. | | | | |
5.350% 06/12/13 (c) | | 3,530,000 | | 3,473,647 |
| | |
| National City Bank of Cleveland | | | | |
6.200% 12/15/11 | | 715,000 | | 708,340 |
| | |
| National City Bank of Kentucky | | | | |
6.300% 02/15/11 | | 1,275,000 | | 1,252,527 |
| | |
| National City Corp. | | | | |
4.900% 01/15/15 | | 655,000 | | 587,653 |
6.875% 05/15/19 | | 2,135,000 | | 1,823,907 |
| | |
| Northern Trust Co. | | | | |
6.500% 08/15/18 | | 1,620,000 | | 1,680,301 |
| | |
| Northern Trust Corp. | | | | |
5.500% 08/15/13 | | 1,865,000 | | 1,919,846 |
| | |
| Regions Financing Trust II | | | | |
6.625% 05/15/47 (a) | | 1,075,000 | | 367,515 |
| | | | |
| | | Par ($) | | Value ($) |
| Scotland International Finance No. 2 | | |
4.250% 05/23/13 (c) | | 1,700,000 | | 1,257,898 |
| | |
| Union Planters Corp. | | | | |
4.375% 12/01/10 | | 1,665,000 | | 1,574,805 |
| | |
| USB Capital IX | | | | |
6.189% 04/15/42 (a) | | 2,965,000 | | 1,645,575 |
| | |
| Wachovia Corp. | | | | |
5.500% 05/01/13 | | 2,975,000 | | 2,916,636 |
5.750% 02/01/18 | | 3,700,000 | | 3,385,615 |
| | | | |
Banks Total | | | | 82,482,119 |
| | | | |
| Diversified Financial Services – 0.9% | | |
| Eaton Vance Corp. | | | | |
6.500% 10/02/17 | | 1,970,000 | | 1,715,716 |
| | |
| General Electric Capital Corp. | | | | |
5.450% 01/15/13 | | 3,015,000 | | 3,039,639 |
6.875% 01/10/39 | | 6,520,000 | | 5,108,668 |
| | |
| International Lease Finance Corp. | | | | |
4.750% 07/01/09 | | 630,000 | | 615,793 |
4.875% 09/01/10 | | 2,095,000 | | 1,826,796 |
| | |
| Lehman Brothers Holdings, Inc. | | | | |
5.625% 01/24/13 (f)(g) | | 6,620,000 | | 943,350 |
6.875% 05/02/18 (f)(g) | | 505,000 | | 71,962 |
| | | | |
Diversified Financial Services Total | | 13,321,924 |
| | |
| Insurance – 1.8% | | | | |
| Hartford Life Global Funding Trusts | | |
1.490% 09/15/09 (a) | | 3,530,000 | | 3,368,361 |
| | |
| ING Groep NV | | | | |
5.775% 12/29/49 (a) | | 2,845,000 | | 1,052,650 |
| | |
| Liberty Mutual Group, Inc. | | | | |
7.500% 08/15/36 (c) | | 4,615,000 | | 2,906,135 |
| | |
| MetLife, Inc. | | | | |
7.717% 02/15/19 | | 3,610,000 | | 3,620,877 |
| |
| Metropolitan Life Global Funding I | | |
5.125% 04/10/13 (c) | | 5,650,000 | | 5,401,005 |
| | |
| New York Life Global Funding | | | | |
4.650% 05/09/13 (c) | | 6,080,000 | | 6,018,203 |
| |
| Principal Life Income Funding Trusts | | |
5.300% 04/24/13 | | 5,930,000 | | 5,587,821 |
| | | | |
Insurance Total | | | | 27,955,052 |
| | | | |
| Real Estate Investment Trusts (REITs) – 0.2% |
| Camden Property Trust | | | | |
5.375% 12/15/13 | | 1,744,000 | | 1,374,369 |
See Accompanying Notes to Financial Statements.
11
Columbia Core Bond Fund
April 30, 2009
Corporate Fixed-Income Bonds & Notes (continued)
| | | | |
| | | Par ($) | | Value ($) |
| Financials (continued) | | | | |
| Highwoods Properties, Inc. | | | | |
5.850% 03/15/17 | | 995,000 | | 662,872 |
| | |
| Hospitality Properties Trust | | | | |
5.625% 03/15/17 | | 2,140,000 | | 1,421,812 |
| | | | |
Real Estate Investment Trusts (REITs) Total | | 3,459,053 |
| | |
| Savings & Loans – 0.3% | | | | |
| World Savings Bank | | | | |
4.125% 12/15/09 | | 3,905,000 | | 3,937,076 |
4.500% 06/15/09 | | 630,000 | | 629,821 |
| | | | |
Savings & Loans Total | | | | 4,566,897 |
| | | | |
Financials Total | | | | 131,785,045 |
| | | | |
| Industrials – 1.5% | | | | |
| Aerospace & Defense – 0.3% | | | | |
| Boeing Co. | | | | |
6.000% 03/15/19 | | 1,660,000 | | 1,745,610 |
| | |
| Raytheon Co. | | | | |
7.200% 08/15/27 | | 2,595,000 | | 2,846,424 |
| | |
| United Technologies Corp. | | | | |
6.125% 02/01/19 | | 355,000 | | 382,242 |
| | | | |
Aerospace & Defense Total | | | | 4,974,276 |
| | |
Machinery – 0.5% | | | | |
| Caterpillar Financial Services Corp. | | |
4.250% 02/08/13 | | 2,830,000 | | 2,754,083 |
5.450% 04/15/18 | | 1,485,000 | | 1,265,680 |
6.200% 09/30/13 | | 300,000 | | 308,280 |
| | |
| Caterpillar, Inc. | | | | |
8.250% 12/15/38 | | 2,040,000 | | 2,207,757 |
| | |
| John Deere Capital Corp. | | | | |
4.950% 12/17/12 | | 1,035,000 | | 1,056,158 |
| | | | |
Machinery Total | | | | 7,591,958 |
| | |
Transportation – 0.7% | | | | |
| BNSF Funding Trust I | | | | |
6.613% 12/15/55 (a) | | 800,000 | | 592,000 |
| |
| Burlington Northern Santa Fe Corp. | | |
6.200% 08/15/36 | | 785,000 | | 724,991 |
7.950% 08/15/30 | | 1,260,000 | | 1,383,810 |
| | |
| Union Pacific Corp. | | | | |
5.700% 08/15/18 | | 1,835,000 | | 1,762,061 |
6.650% 01/15/11 | | 5,550,000 | | 5,850,194 |
| | | | |
Transportation Total | | | | 10,313,056 |
| | | | |
Industrials Total | | | | 22,879,290 |
| | | | |
| | | Par ($) | | Value ($) |
| Technology – 0.6% | | | | |
| Networking & Telecom Equipment – 0.2% | | |
| Cisco Systems, Inc. | | | | |
5.900% 02/15/39 | | 2,900,000 | | 2,744,598 |
| | | | |
Networking & Telecom Equipment Total | | 2,744,598 |
| | |
Software – 0.4% | | | | |
| Oracle Corp. | | | | |
5.000% 01/15/11 | | 2,455,000 | | 2,586,851 |
6.500% 04/15/38 | | 3,995,000 | | 4,073,717 |
| | | | |
Software Total | | | | 6,660,568 |
| | | | |
Technology Total | | | | 9,405,166 |
| | | | |
| Utilities – 2.3% |
| Electric – 1.8% |
| American Electric Power Co., Inc. | | |
5.250% 06/01/15 | | 1,465,000 | | 1,422,442 |
| | |
| Carolina Power & Light Co. | | | | |
5.125% 09/15/13 | | 2,545,000 | | 2,690,650 |
| | |
| Commonwealth Edison Co. | | | | |
4.700% 04/15/15 | | 1,250,000 | | 1,162,373 |
5.900% 03/15/36 | | 790,000 | | 656,327 |
5.950% 08/15/16 | | 2,825,000 | | 2,775,079 |
6.150% 09/15/17 | | 1,200,000 | | 1,182,668 |
6.950% 07/15/18 | | 1,575,000 | | 1,530,743 |
| |
| Consolidated Edison Co. of New York, Inc. | | |
6.750% 04/01/38 | | 2,710,000 | | 2,761,233 |
| | |
| Duke Energy Corp. | | | �� | |
5.300% 10/01/15 | | 2,400,000 | | 2,455,560 |
| | |
| Exelon Generation Co. LLC | | | | |
6.200% 10/01/17 | | 1,000,000 | | 927,327 |
| | |
| FPL Energy National Wind LLC | | | | |
5.608% 03/10/24 (c) | | 773,480 | | 619,047 |
| | |
| Hydro Quebec | | | | |
8.500% 12/01/29 | | 1,195,000 | | 1,605,754 |
| |
| MidAmerican Energy Holdings Co. | | |
5.875% 10/01/12 | | 2,855,000 | | 2,951,039 |
| | |
| Oncor Electric Delivery Co. | | | | |
5.950% 09/01/13 (c) | | 2,370,000 | | 2,384,007 |
| | |
| Southern California Edison Co. | | | | |
5.000% 01/15/16 | | 2,500,000 | | 2,531,877 |
| | |
| Southern Power Co. | | | | |
6.375% 11/15/36 | | 850,000 | | 697,081 |
| | | | |
Electric Total | | | | 28,353,207 |
See Accompanying Notes to Financial Statements.
12
Columbia Core Bond Fund
April 30, 2009
Corporate Fixed-Income Bonds & Notes (continued)
| | | | |
| | | Par ($) | | Value ($) |
| Utilities (continued) |
| Gas – 0.5% |
| Atmos Energy Corp. | | | | |
6.350% 06/15/17 | | 1,760,000 | | 1,626,013 |
8.500% 03/15/19 | | 2,220,000 | | 2,352,760 |
| | |
| Nakilat, Inc. | | | | |
6.067% 12/31/33 (c) | | 1,895,000 | | 1,276,908 |
| | |
| Southern California Gas Co. | | | | |
1.431% 12/01/09 (a) | | 2,080,000 | | 2,073,513 |
| | | | |
Gas Total | | | | 7,329,194 |
| | | | |
Utilities Total | | | | 35,682,401 |
| | | | |
Total Corporate Fixed-Income Bonds & Notes
(cost of $354,407,958) | | 328,310,638 |
|
Commercial Mortgage-Backed Securities – 9.3% |
| Bear Stearns Commercial Mortgage Securities |
4.740% 03/13/40 | | 14,889,000 | | 13,879,986 |
4.933% 02/13/42 (a) | | 2,707,000 | | 2,379,384 |
5.145% 01/12/45 | | 6,748,055 | | 6,593,046 |
5.588% 09/11/42 | | 9,635,000 | | 8,232,432 |
5.742% 09/11/42 (a) | | 2,540,000 | | 2,093,346 |
|
| Chase Commercial Mortgage Securities Corp. |
6.484% 02/12/16 (a)(c) | | 12,585,000 | | 12,735,724 |
|
| Citigroup Commercial Mortgage Trust |
4.733% 10/15/41 | | 3,765,000 | | 3,213,513 |
|
| Citigroup/Deutsche Bank Commercial Mortgage Trust |
5.399% 07/15/44 (a) | | 8,510,000 | | 7,418,948 |
|
| JPMorgan Chase Commercial Mortgage Securities Corp. |
4.878% 01/15/42 | | 2,000,000 | | 1,688,290 |
5.255% 07/12/37 (a) | | 3,875,000 | | 3,740,806 |
5.440% 06/12/47 | | 4,710,000 | | 3,571,638 |
|
| LB-UBS Commercial Mortgage Trust |
4.853% 09/15/31 | | 7,150,000 | | 6,848,348 |
5.124% 11/15/32 (a) | | 6,865,000 | | 6,325,242 |
5.611% 04/15/41 | | 3,360,909 | | 3,415,494 |
6.462% 03/15/31 | | 6,825,000 | | 6,934,418 |
|
| Merrill Lynch Mortgage Investors, Inc. |
I.O., | | | | |
0.583% 12/15/30 (a) | | 3,917,967 | | 59,948 |
|
| Merrill Lynch Mortgage Trust |
4.747% 06/12/43 (a) | | 7,500,000 | | 6,412,346 |
|
| Morgan Stanley Capital I |
4.970% 12/15/41 | | 7,949,000 | | 7,214,885 |
4.989% 08/13/42 | | 3,940,000 | | 3,394,726 |
| | | | |
| | | Par ($) | | Value ($) |
5.328% 11/12/41 | | 6,000,000 | | 4,918,202 |
5.378% 11/14/42 (a) | | 3,495,000 | | 3,090,706 |
|
| Morgan Stanley Dean Witter Capital I |
4.920% 03/12/35 | | 6,335,000 | | 6,000,667 |
5.980% 01/15/39 | | 7,730,000 | | 7,718,652 |
|
| Wachovia Bank Commercial Mortgage Trust |
5.037% 03/15/42 | | 5,560,000 | | 5,426,560 |
5.609% 03/15/45 (a) | | 5,052,000 | | 2,596,934 |
5.726% 06/15/45 | | 3,484,789 | | 3,485,846 |
5.997% 06/15/45 | | 2,610,000 | | 2,348,418 |
| | | | |
Total Commercial Mortgage-Backed Securities (cost of $148,379,610) | | 141,738,505 |
|
Government & Agency Obligations – 12.5% |
| | | | |
| Foreign Government Obligations – 2.3% |
| European Investment Bank |
3.000% 04/08/14 | | 3,295,000 | | 3,251,681 |
5.125% 05/30/17 | | 5,935,000 | | 6,297,266 |
|
| Export-Import Bank of Korea |
5.500% 10/17/12 | | 700,000 | | 694,031 |
|
International Bank for Reconstruction &
Development |
5.000% 04/01/16 | | 10,570,000 | | 11,413,169 |
|
| Kreditanstalt fuer Wiederaufbau |
4.500% 07/16/18 | | 1,695,000 | | 1,698,192 |
|
| Pemex Project Funding Master Trust |
5.750% 03/01/18 | | 5,765,000 | | 5,217,325 |
|
| Province of Quebec |
4.625% 05/14/18 | | 6,395,000 | | 6,189,049 |
| | | | |
Foreign Government Obligations Total | | 34,760,713 |
|
| U.S. Government Agency – 3.9% |
| Federal National Mortgage Association |
3.625% 08/15/11 | | 45,000,000 | | 47,218,410 |
|
| Resolution Funding Corp., STRIPS |
(h) 01/15/21 | | 19,755,000 | | 11,573,072 |
| | | | |
U.S. Government Agency Total | | 58,791,482 |
|
| U.S. Government Obligations – 6.3% |
| U.S. Treasury Bonds |
4.500% 05/15/38 (i) | | 7,370,000 | | 7,930,813 |
6.125% 11/15/27 | | 10,000,000 | | 12,639,060 |
|
| U.S. Treasury Inflation-Indexed Notes |
1.625% 01/15/18 | | 20,780,604 | | 20,676,701 |
3.000% 07/15/12 | | 3,038,423 | | 3,207,435 |
See Accompanying Notes to Financial Statements.
13
Columbia Core Bond Fund
April 30, 2009
Government & Agency Obligations (continued)
| | | | |
| | | Par ($) | | Value ($) |
| U.S. Government Obligations (continued) |
| U.S. Treasury Notes |
1.875% 02/28/14 | | 7,185,000 | | 7,148,500 |
2.375% 03/31/16 | | 25,000,000 | | 24,554,700 |
2.625% 02/29/16 | | 20,000,000 | | 20,006,240 |
|
U.S. Government Obligations Total | | 96,163,449 |
| | | | |
Total Government & Agency Obligations
(cost of $190,252,220) | | 189,715,644 |
| |
Asset-Backed Securities – 8.1% | | |
| AmeriCredit Automobile Receivables Trust | | |
3.930% 10/06/11 | | 1,442,748 | | 1,382,707 |
4.730% 07/06/10 | | 335,946 | | 335,903 |
| |
| Bay View Auto Trust | | |
5.310% 06/25/14 | | 2,550,000 | | 2,295,402 |
|
| Bombardier Capital Mortgage Securitization Corp. |
6.230% 04/15/28 | | 2,469 | | 2,014 |
| |
| Capital Auto Receivables Asset Trust | | |
5.500% 04/20/10 (c) | | 1,850,000 | | 1,841,472 |
5.730% 03/15/11 | | 4,000,000 | | 2,800,656 |
| |
| Capital One Multi-Asset Execution Trust | | |
0.431% 08/15/12 (a) | | 7,505,000 | | 7,435,062 |
4.850% 11/15/13 | | 3,675,000 | | 3,692,879 |
4.850% 02/18/14 | | 9,330,000 | | 9,260,255 |
4.950% 08/15/12 | | 6,215,000 | | 6,274,503 |
| |
| Capital One Prime Auto Receivables Trust | | |
4.890% 01/15/12 | | 5,300,914 | | 5,359,060 |
| |
| Chase Issuance Trust | | |
4.260% 05/15/13 | | 6,990,000 | | 7,075,559 |
| |
| Citibank Credit Card Issuance Trust | | |
1.241% 05/21/12 (a) | | 2,405,000 | | 2,353,836 |
| |
| CitiFinancial Mortgage Securities, Inc. | | |
2.645% 04/25/34 | | 387,069 | | 353,327 |
| |
| Citigroup Mortgage Loan Trust, Inc. | | |
5.517% 08/25/35 | | 2,800,000 | | 271,823 |
5.666% 08/25/35 | | 1,885,000 | | 116,075 |
| |
| Daimler Chrysler Auto Trust | | |
4.940% 02/08/12 | | 7,891,000 | | 7,716,129 |
| |
| Discover Card Master Trust | | |
5.100% 10/15/13 | | 6,640,000 | | 6,696,139 |
| |
| Equity One ABS, Inc. | | |
0.778% 07/25/34 (a) | | 416,020 | | 157,944 |
| |
| First Plus Home Loan Trust | | |
7.720% 05/10/24 | | 14,810 | | 14,756 |
| | | | |
| | | Par ($) | | Value ($) |
| Ford Credit Auto Owner Trust | | |
5.150% 11/15/11 | | 6,525,000 | | 6,671,269 |
5.160% 04/15/13 | | 9,405,000 | | 9,097,983 |
5.680% 06/15/12 | | 2,300,000 | | 1,822,854 |
| |
| Franklin Auto Trust | | |
5.360% 05/20/16 | | 4,980,000 | | 4,843,313 |
| |
| GE Capital Credit Card Master Note Trust | | |
4.130% 06/15/13 | | 3,966,000 | | 3,924,907 |
| |
| GE Equipment Small Ticket LLC | | |
4.620% 12/22/14 (c) | | 243,868 | | 239,674 |
5.120% 06/22/15 (c) | | 1,197,688 | | 1,111,272 |
| |
| Green Tree Financial Corp. | | |
8.250% 07/15/27 (a) | | 402,118 | | 348,005 |
| |
| GS Auto Loan Trust | | |
4.980% 11/15/13 | | 19,028 | | 18,983 |
| |
| GSAA Trust | | |
4.316% 11/25/34 (a) | | 1,177,843 | | 903,259 |
| |
| Honda Auto Receivables Owner Trust | | |
4.470% 01/18/12 | | 7,020,000 | | 7,132,390 |
| |
| Long Beach Auto Receivables Trust | | |
4.522% 06/15/12 | | 1,672,798 | | 1,624,181 |
| |
| Oakwood Mortgage Investors, Inc. | | |
7.100% 08/15/27 | | 182,282 | | 174,173 |
| |
| Origen Manufactured Housing | | |
4.490% 05/15/18 | | 311,508 | | 296,263 |
|
| Residential Funding Mortgage Securities II, Inc. |
4.700% 08/25/34 | | 412,899 | | 379,966 |
| |
| USAA Auto Owner Trust | | |
4.280% 10/15/12 | | 5,295,000 | | 5,410,365 |
4.900% 02/15/12 | | 6,967,910 | | 7,068,491 |
| |
| Wachovia Auto Loan Owner Trust | | |
5.650% 02/20/13 | | 5,000,000 | | 2,210,375 |
| |
| WFS Financial Owner Trust | | |
4.620% 11/19/12 | | 3,500,000 | | 3,453,862 |
| | | | |
Total Asset-Backed Securities
(cost of $132,205,609) | | 122,167,086 |
|
Collateralized Mortgage Obligations – 0.5% |
| | | | |
| Agency – 0.5% | | | | |
| Federal Home Loan Mortgage Corp. | | |
I.O., | | | | |
5.500% 05/15/27 | | 366,765 | | 3,244 |
See Accompanying Notes to Financial Statements.
14
Columbia Core Bond Fund
April 30, 2009
Collateralized Mortgage Obligations (continued)
| | | | | |
| | | Par ($) | | Value ($) | |
| Federal National Mortgage Association | | | |
4.717% 08/25/12 | | 3,713,154 | | 3,867,154 | |
5.500% 09/25/35 | | 3,707,718 | | 3,749,007 | |
| |
| Vendee Mortgage Trust | | | |
I.O., | | | |
0.300% 03/15/29 (a) | | 7,462,931 | | 37,736 | |
0.439% 03/15/28 (a) | | 5,727,588 | | 91,528 | |
| | | | | |
Agency Total | | 7,748,669 | |
| | | | | |
| Non-agency – 0.0% | | | | | |
| Countrywide Alternative Loan Trust | | | |
5.500% 09/25/35 | | 4,698,367 | | 367,385 | |
| | | | | |
Non-Agency Total | | 367,385 | |
| | | | | |
Total Collateralized Mortgage Obligations (cost of $12,042,748) | | 8,116,054 | |
| |
Short-Term Obligation – 7.9% | | | |
Repurchase agreement with Fixed Income Clearing Corp., dated 04/30/09, due 05/01/09, at 0.120%, collateralized by U.S. Government Agency Obligations with various maturities to 07/14/28, market value $121,427,713 (repurchase proceeds $119,046,397) | | 119,046,000 | | 119,046,000 | |
| | | | | |
Total Short-Term Obligation (cost of $119,046,000) | | 119,046,000 | |
| | | | | |
Total Investments – 106.6%
(cost of $1,646,471,416) (j) | | 1,616,091,338 | |
| | | | | |
Other Assets & Liabilities, Net – (6.6)% | | (99,575,305 | ) |
| | | | | |
Net Assets – 100.0% | | 1,516,516,033 | |
Notes to Investment Portfolio:
| (a) | The interest rate shown on floating rate or variable rate securities reflects the rate at April 30, 2009. |
| (b) | Security purchased on a delayed delivery basis. |
| (c) | Security exempt from registration pursuant to Rule 144A under the Securities Act of 1933. These securities may be resold in transactions exempt from registration, normally to qualified institutional buyers. At April 30, 2009, these securities, which are not illiquid, except for the following, amounted to $68,589,823, which represents 4.5% of net assets. |
| | | | | | | | | | | |
Security | | Acquisition
Date | | Par/Unit | | Cost | | Value |
Qatar Petroleum 5.579%, 05/30/11 | | 05/19/06 | | $ | 1,552,902 | | $ | 1,552,902 | | $ | 1,576,893 |
| (d) | A portion of this security is pledged as collateral for credit default swaps. At April 30, 2009, the total market value of securities pledged amounted to $2,331,535. |
| (e) | Investments in affiliates during the year ended April 30, 2009: Security name: Merrill Lynch & Co., Inc., 6.050%, 08/15/12 |
| | | |
Par as of 04/30/08: | | $ | 645,000 |
Par purchased: | | $ | — |
Par sold: | | $ | — |
Par as of 04/30/09: | | $ | 645,000 |
Net realized gain (loss): | | $ | — |
Interest income earned: | | $ | 39,023 |
Value at end of period: | | $ | 593,260 |
| | Security name: Merrill Lynch & Co., Inc., 6.150%, 04/25/13 |
| | | | |
Par as of 04/30/08: | | $ | 2,685,000 | |
Par purchased: | | $ | — | |
Par sold: | | $ | (485,000 | ) |
Par as of 04/30/09: | | $ | 2,200,000 | |
Net realized loss: | | $ | (22,460 | ) |
Interest income earned: | | $ | 145,408 | |
Value at end of period: | | $ | 2,022,680 | |
| | Security name: Merrill Lynch & Co., Inc., 5.700%, 05/02/17 |
| | | |
Par as of 04/30/08: | | $ | 3,850,000 |
Par purchased: | | $ | — |
Par sold: | | $ | — |
Par as of 04/30/09: | | $ | 3,850,000 |
Net realized gain (loss): | | $ | — |
Interest income earned: | | $ | 219,450 |
Value at end of period: | | $ | 2,524,029 |
| | Security name: Merrill Lynch & Co., Inc., 7.750%, 05/14/38 |
| | | | |
Par as of 04/30/08: | | $ | — | |
Par purchased: | | $ | 2,280,000 | |
Par sold: | | $ | (745,000 | ) |
Par as of 04/30/09: | | $ | 2,075,000 | |
Net realized loss: | | $ | (12,859 | ) |
Interest income earned: | | $ | 155,807 | |
Value at end of period: | | $ | 1,417,161 | |
As of 01/01/2009, Merrill Lynch & Co., Inc. is a wholly owned subsidiary of Bank of America Corporation and an affiliate of Columbia Management.
| (f) | The issuer has filed for bankruptcy protection under Chapter 11 and is in default of certain debt covenants. Income is not being accrued. At April 30, 2009, the value of these securities amounted to $1,015,312, which represents 0.1% of net assets. |
| (g) | Represents fair value as determined in good faith under procedures approved by the Board of Trustees. At April 30, 2009, the value of these securities amounted to $1,015,312, which represents 0.1% of net assets. |
| (i) | A portion of this security is pledged as collateral for open futures contracts. At April 30, 2009, the market value of this security pledged amounted to $2,582,626. |
| (j) | Cost for federal income tax purposes is $1,646,345,388. |
See Accompanying Notes to Financial Statements.
15
Columbia Core Bond Fund
April 30, 2009
The following table summarizes the inputs used, as of April 30, 2009, in valuing the Fund’s assets:
| | | | | | | |
Valuation Inputs | | Investments in
Securities | | Other Financial
Instruments* | |
Level 1 – Quoted Prices | | $ | 309,407,097 | | $ | 139,866 | |
Level 2 – Other Significant Observable Inputs | | | 1,306,198,624 | | | (413,925 | ) |
Level 3 – Significant Unobservable Inputs | | | 485,617 | | | — | |
| | | | | | | |
Total | | $ | 1,616,091,338 | | $ | (274,059 | ) |
| | | | | | | |
* Other financial instruments consist of futures contracts and credit default swap contracts which are not included in the investment portfolio.
The following table reconciles asset balances for the year ended April 30, 2009, in which significant unobservable inputs (Level 3) were used in determining value:
| | | | | | | |
| | | Investments in
Securities | | | Other Financial
Instruments |
Balance as of April 30, 2008 | | $ | 653,291 | | | $ | — |
Accretion of discounts/Amortization of premiums | | | — | | | | — |
Realized gain | | | 2,999 | | | | — |
Change in unrealized depreciation | | | (552,981 | ) | | | — |
Net purchases | | | 11,528,696 | | | | — |
Transfers out of Level 3 | | | (11,146,388 | ) | | | — |
| | | | | | | |
Balance as of April 30, 2009 | | $ | 485,617 | | | $ | — |
| | | | | | | |
The change in unrealized losses attributable to securities owned at April 30, 2009 which were valued using significant unobservable inputs (Level 3) amounted to $552,981. This amount is included in net change in unrealized depreciation on the Statement of Changes in Net Assets
The information in the above reconciliation represents fiscal year to date activity for any securities identified as using Level 3 inputs at either the beginning or the end of the current fiscal period.
For more information on valuation inputs, and their aggregation into the levels used in the tables above, please refer to the Security Valuation section in the accompanying Notes to Financial Statements.
At April 30, 2009, the Fund held the following open long futures contracts:
| | | | | | | | | | | | | | |
Type | | Number of
Contracts | | Value | | Aggregate
Face Value | | Expiration
Date | | Unrealized
Appreciation
(Depreciation) | |
5-Year U.S. Treasury Notes | | 470 | | $ | 55,056,094 | | $ | 54,903,403 | | Jun-2009 | | $ | 152,691 | |
10-Year U.S. Treasury Notes | | 100 | | | 12,093,750 | | | 12,106,575 | | Jun-2009 | | | (12,825 | ) |
| | | | | | | | | | | | | | |
| | | | | | | | | | | | $ | 139,866 | |
| | | | | | | | | | | | | | |
At April 30, 2009, the Fund had entered into the following credit default swap contracts:
| | | | | | | | | | | | | | | | |
Swap
Counterparty | | Referenced
Obligation | | Receive
Buy/Sell
Protection | | Fixed
Rate | | | Expiration
Date | | Notional
Amount | | Value of
Contract | |
Morgan Stanley | | Limited Brands, Inc.
6.125% 12/01/12 | | Buy | | 5.270 | % | | 12/20/13 | | $ | 500,000 | | $ | (58,905 | ) |
Barclays Capital | | Limited Brands, Inc.
6.125% 12/01/12 | | Buy | | 6.150 | % | | 03/20/14 | | | 500,000 | | | (81,341 | ) |
JPMorgan | | Macy’s, Inc.
7.450% 07/15/17 | | Buy | | 3.600 | % | | 12/20/13 | | | 5,070,000 | | | (273,679 | ) |
| | | | | | | | | | | | | | | | |
| | | | | | | | | | | | | | $ | (413,925 | ) |
| | | | | | | | | | | | | | | | |
At April 30, 2009, the asset allocation of the Fund is as follows:
| | | |
Asset Allocation (Unaudited) | | % of
Net Assets | |
Mortgage-Backed Securities | | 46.6 | |
Corporate Fixed-Income Bonds & Notes | | 21.7 | |
Government & Agency Obligations | | 12.5 | |
Commercial Mortgage-Backed Securities | | 9.3 | |
Asset-Backed Securities | | 8.1 | |
Collateralized Mortgage Obligations | | 0.5 | |
| | | |
| | 98.7 | |
Short-Term Obligation | | 7.9 | |
Other Assets & Liabilities, Net | | (6.6 | ) |
| | | |
| | 100.0 | |
| | | |
| | |
Acronym | | Name |
| I.O. | | Interest Only |
| TBA | | To Be Announced |
| STRIPS | | Separate Trading of Registered Interest and Principal of Securities |
See Accompanying Notes to Financial Statements.
16
Statement of Assets and Liabilities – Columbia Core Bond Fund
April 30, 2009
| | | | | |
| | | | | ($) | |
| Assets | | Unaffiliated investments, at cost | | 1,637,737,942 | |
| | Affiliated investments, at cost | | 8,733,474 | |
| | | | | |
| | Total investments, at cost | | 1,646,471,416 | |
| | Unaffiliated investments, at value | | 1,609,534,208 | |
| | Affiliated investments, at value | | 6,557,130 | |
| | | | | |
| | Total investments, at value | | 1,616,091,338 | |
| | |
| | Cash | | 725 | |
| | Receivable for: | | | |
| | Investments sold | | 54,976,022 | |
| | Investments sold on a delayed delivery basis | | 113,371,741 | |
| | Fund shares sold | | 2,774,306 | |
| | Interest | | 10,379,741 | |
| | Securities lending | | 19,477 | |
| | Expense reimbursement due from investment advisor | | 270,687 | |
| | Trustees’ deferred compensation plan | | 65,332 | |
| | Other assets | | 39,648 | |
| | | |
| | Total Assets | | 1,797,989,017 | |
| | |
| Liabilities | | Open credit default swap contracts | | 413,925 | |
| | Payable for: | | | |
| | Investments purchased | | 399,900 | |
| | Investments purchased on a delayed delivery basis | | 274,012,375 | |
| | Fund shares repurchased | | 2,214,800 | |
| | Futures variation margin | | 26,094 | |
| | Distributions | | 3,362,283 | |
| | Investment advisory fee | | 544,169 | |
| | Administration fee | | 83,347 | |
| | Transfer agent fee | | 140,645 | |
| | Trustees’ fees | | 42,749 | |
| | Pricing and bookkeeping fees | | 21,335 | |
| | Custody fee | | 10,838 | |
| | Distribution and service fees | | 32,474 | |
| | Chief compliance officer expenses | | 91 | |
| | Trustees’ deferred compensation plan | | 65,332 | |
| | Other liabilities | | 102,627 | |
| �� | | |
| | Total Liabilities | | 281,472,984 | |
| |
| | | |
| | Net Assets | | 1,516,516,033 | |
| | |
| Net Assets Consist of | | Paid-in capital | | 1,621,594,305 | |
| | Undistributed net investment income | | 2,417,142 | |
| | Accumulated net realized loss | | (76,830,793 | ) |
| | Net unrealized appreciation (depreciation) on: | | | |
| | Investments | | (30,380,078 | ) |
| | Credit default swap contracts | | (424,409 | ) |
| | Futures contracts | | 139,866 | |
| | | |
| | Net Assets | | 1,516,516,033 | |
See Accompanying Notes to Financial Statements.
17
Statement of Assets and Liabilities (continued) – Columbia Core Bond Fund
April 30, 2009
| | | | | | |
| | | | | | |
| Class A | | Net assets | | $ | 50,600,079 | |
| | Shares outstanding | | | 4,995,803 | |
| | Net asset value per share | | $ | 10.13 | (a) |
| | Maximum sales charge | | | 4.75 | % |
| | Maximum offering price per share ($10.13/0.9525) | | $ | 10.64 | (b) |
| | |
| | | | | | |
Class B | | Net assets | | $ | 13,809,463 | |
| | Shares outstanding | | | 1,363,428 | |
| | Net asset value and offering price per share | | $ | 10.13 | (a) |
| | |
| | | | | | |
Class C | | Net assets | | $ | 11,002,419 | |
| | Shares outstanding | | | 1,086,282 | |
| | Net asset value and offering price per share | | $ | 10.13 | (a) |
| | |
| | | | | | |
Class T | | Net assets | | $ | 18,277,794 | |
| | Shares outstanding | | | 1,804,585 | |
| | Net asset value per share | | $ | 10.13 | (a) |
| | Maximum sales charge | | | 4.75 | % |
| | Maximum offering price per share ($10.13/0.9525) | | $ | 10.64 | (b) |
| | |
| | | | | | |
Class Z | | Net assets | | $ | 1,422,826,278 | |
| | Shares outstanding | | | 140,476,845 | |
| | Net asset value, offering and redemption price per share | | $ | 10.13 | |
| (a) | Redemption price per share is equal to net asset value less any applicable contingent deferred sales charge. |
| (b) | On sales of $50,000 or more the offering price is reduced. |
See Accompanying Notes to Financial Statements.
18
Statement of Operations – Columbia Core Bond Fund
For the Year Ended April 30, 2009
| | | | | |
| | | | | ($) | |
| Investment Income | | Interest | | 75,923,135 | |
| | Interest from affiliates | | 559,688 | |
| | Dollar roll fee income | | 1,331,244 | |
| | Securities lending income | | 1,210,992 | |
| | | |
| | Total Investment Income | | 79,025,059 | |
| | |
| Expenses | | Investment advisory fee | | 6,560,169 | |
| | Administration fee | | 1,008,173 | |
| | Distribution fee: | | | |
| | Class B | | 99,429 | |
| | Class C | | 59,492 | |
| | Service fee: | | | |
| | Class A | | 119,571 | |
| | Class B | | 33,136 | |
| | Class C | | 19,804 | |
| | Shareholders services fees – Class T | | 29,016 | |
| | Transfer agent fee | | 753,575 | |
| | Pricing and bookkeeping fees | | 170,165 | |
| | Trustees’ fees | | 81,740 | |
| | Custody fee | | 92,458 | |
| | Chief compliance officer expenses | | 1,005 | |
| | Other expenses | | 456,143 | |
| | | |
| | Total Expenses | | 9,483,876 | |
| | |
| | Fees waived or expenses reimbursed by investment advisor | | (2,346,702 | ) |
| | Fees waived by distributor – Class C | | (11,882 | ) |
| | Expense reductions | | (5,186 | ) |
| | | |
| | Net Expenses | | 7,120,106 | |
| |
| | | |
| | Net Investment Income | | 71,904,953 | |
| | |
| Net Realized and Unrealized Gain (Loss) on Investments, Futures Contracts and Credit Default Swap Contracts | | Net realized gain (loss) on: | | | |
| | Investments | | (37,785,864 | ) |
| | Affiliated investments | | (35,319 | ) |
| | Futures contracts | | 1,827,124 | |
| | Credit default swap contracts | | (314,014 | ) |
| | | |
| | Net realized loss | | (36,308,073 | ) |
| | |
| | Net change in unrealized appreciation (depreciation) on: | | | |
| | Investments | | (14,182,188 | ) |
| | Credit default swap contracts | | (193,815 | ) |
| | Futures contracts | | 431,083 | |
| | | |
| | Net change in unrealized appreciation (depreciation) | | (13,944,920 | ) |
| | | |
| | Net Loss | | (50,252,993 | ) |
| |
| | | |
| | Net Increase Resulting from Operations | | 21,651,960 | |
See Accompanying Notes to Financial Statements.
19
Statement of Changes in Net Assets – Columbia Core Bond Fund
| | | | | | | | |
| | | | | Year Ended April 30, | |
| Increase (Decrease) in Net Assets | | 2009 ($) | | | 2008 ($)(a) | |
| Operations | | Net investment income | | 71,904,953 | | | 82,072,015 | |
| | Net realized loss on investments, futures contracts and credit default swap contracts | | (36,308,073 | ) | | (2,188,683 | ) |
| | Net change in unrealized appreciation (depreciation) on investments, futures contracts and credit default swap contracts | | (13,944,920 | ) | | (19,504,679 | ) |
| | | |
| | Net increase resulting from operations | | 21,651,960 | | | 60,378,653 | |
| | | |
| Distributions to Shareholders | | From net investment income: | | | | | | |
| | Class A | | (2,141,011 | ) | | (2,344,270 | ) |
| | Class B | | (495,010 | ) | | (579,078 | ) |
| | Class C | | (304,638 | ) | | (234,436 | ) |
| | Class G | | — | | | (6,579 | ) |
| | Class T | | (886,840 | ) | | (1,075,790 | ) |
| | Class Z | | (67,016,734 | ) | | (76,699,483 | ) |
| | | |
| | Total distributions to shareholders | | (70,844,233 | ) | | (80,939,636 | ) |
| | | |
| | Net Capital Stock Transactions | | (51,466,764 | ) | | (66,913,361 | ) |
| | | |
| | Total decrease in net assets | | (100,659,037 | ) | | (87,474,344 | ) |
| | | |
| Net Assets | | Beginning of period | | 1,617,175,070 | | | 1,704,649,414 | |
| | End of period | | 1,516,516,033 | | | 1,617,175,070 | |
| | Undistributed net investment income at end of period | | 2,417,142 | | | 1,513,848 | |
| (a) | Class G shares reflects activity for the period May 1, 2007 through August 8, 2007. |
See Accompanying Notes to Financial Statements.
20
Statement of Changes in Net Assets (continued) – Capital Stock Activity
| | | | | | | | | | | | |
| | | Columbia Core Bond Fund | |
| | | Year Ended
April 30, 2009 | | | Year Ended
April 30, 2008(a) | |
| | | Shares | | | Dollars ($) | | | Shares | | | Dollars ($) | |
Class A | | | | | | | | | | | | |
Subscriptions | | 1,460,417 | | | 14,673,774 | | | 840,100 | | | 8,817,927 | |
Distributions reinvested | | 183,205 | | | 1,840,015 | | | 189,911 | | | 1,989,128 | |
Redemptions | | (1,490,353 | ) | | (14,954,699 | ) | | (1,119,290 | ) | | (11,709,180 | ) |
| | | | | | | | | | | | |
Net increase (decrease) | | 153,269 | | | 1,559,090 | | | (89,279 | ) | | (902,125 | ) |
Class B | | | | | | | | | | | | |
Subscriptions | | 485,359 | | | 4,868,353 | | | 374,347 | | | 3,938,934 | |
Distributions reinvested | | 38,473 | | | 386,376 | | | 44,741 | | | 468,582 | |
Redemptions | | (568,412 | ) | | (5,700,069 | ) | | (497,706 | ) | | (5,205,749 | ) |
| | | | | | | | | | | | |
Net decrease | | (44,580 | ) | | (445,340 | ) | | (78,618 | ) | | (798,233 | ) |
Class C | | | | | | | | | | | | |
Subscriptions | | 695,422 | | | 6,958,451 | | | 276,991 | | | 2,928,581 | |
Distributions reinvested | | 13,433 | | | 134,800 | | | 8,940 | | | 93,691 | |
Redemptions | | (279,345 | ) | | (2,822,254 | ) | | (168,061 | ) | | (1,758,744 | ) |
| | | | | | | | | | | | |
Net increase | | 429,510 | | | 4,270,997 | | | 117,870 | | | 1,263,528 | |
Class G | | | | | | | | | | | | |
Subscriptions | | — | | | — | | | 103 | | | 1,071 | |
Distributions reinvested | | — | | | — | | | 510 | | | 5,299 | |
Redemptions | | — | | | — | | | (64,935 | ) | | (670,599 | ) |
| | | | | | | | | | | | |
Net decrease | | — | | | — | | | (64,322 | ) | | (664,229 | ) |
Class T | | | | | | | | | | | | |
Subscriptions | | 25,521 | | | 257,061 | | | 72,464 | | | 749,273 | |
Distributions reinvested | | 76,812 | | | 771,485 | | | 88,672 | | | 928,675 | |
Redemptions | | (362,996 | ) | | (3,645,900 | ) | | (327,528 | ) | | (3,430,324 | ) |
| | | | | | | | | | | | |
Net decrease | | (260,663 | ) | | (2,617,354 | ) | | (166,392 | ) | | (1,752,376 | ) |
Class Z | | | | | | | | | | | | |
Subscriptions | | 26,589,690 | | | 267,735,587 | | | 26,399,905 | | | 276,337,804 | |
Distributions reinvested | | 2,003,439 | | | 20,117,839 | | | 1,887,315 | | | 19,771,437 | |
Redemptions | | (34,039,804 | ) | | (342,087,583 | ) | | (34,423,713 | ) | | (360,169,167 | ) |
| | | | | | | | | | | | |
Net decrease | | (5,446,675 | ) | | (54,234,157 | ) | | (6,136,493 | ) | | (64,059,926 | ) |
| (a) | Class G shares reflect activity for the period May 1, 2007 through August 8, 2007. |
See Accompanying Notes to Financial Statements.
21
Financial Highlights – Columbia Core Bond Fund
Selected data for a share outstanding throughout each period is as follows:
| | | | | | | | | | | | | | | | | | | | |
| | | Year Ended April 30, | |
| Class A Shares | | 2009 | | | 2008 | | | 2007 | | | 2006 (a) | | | 2005 | |
Net Asset Value, Beginning of Period | | $ | 10.44 | | | $ | 10.57 | | | $ | 10.36 | | | $ | 10.81 | | | $ | 10.93 | |
| | | | | |
Income from Investment Operations: | | | | | | | | | | | | | | | | | | | | |
Net investment income (b) | | | 0.46 | | | | 0.49 | | | | 0.48 | | | | 0.42 | | | | 0.39 | |
Net realized and unrealized gain (loss) on investments,
credit default swap contracts and futures contracts | | | (0.32 | ) | | | (0.13 | ) | | | 0.21 | | | | (0.44 | ) | | | 0.09 | |
| | | | | | | | | | | | | | | | | | | | |
Total from investment operations | | | 0.14 | | | | 0.36 | | | | 0.69 | | | | (0.02 | ) | | | 0.48 | |
| | | | | |
Less Distributions to Shareholders: | | | | | | | | | | | | | | | | | | | | |
From net investment income | | | (0.45 | ) | | | (0.49 | ) | | | (0.48 | ) | | | (0.43 | ) | | | (0.41 | ) |
From net realized gains | | | — | | | | — | | | | — | | | | — | | | | (0.19 | ) |
| | | | | | | | | | | | | | | | | | | | |
Total distributions to shareholders | | | (0.45 | ) | | | (0.49 | ) | | | (0.48 | ) | | | (0.43 | ) | | | (0.60 | ) |
| | | | | |
Net Asset Value, End of Period | | $ | 10.13 | | | $ | 10.44 | | | $ | 10.57 | | | $ | 10.36 | | | $ | 10.81 | |
Total return (c) | | | 1.48 | %(d) | | | 3.47 | %(d) | | | 6.81 | % | | | (0.27 | )%(d) | | | 4.52 | %(d) |
| | | | | |
Ratios to Average Net Assets/Supplemental Data: | | | | | | | | | | | | | | | | | | | | |
Net expenses (e) | | | 0.70 | % | | | 0.81 | % | | | 0.90 | % | | | 0.91 | % | | | 0.94 | % |
Waiver/Reimbursement | | | 0.16 | % | | | 0.06 | % | | | — | | | | — | %(f) | | | — | %(f) |
Net investment income (e) | | | 4.55 | % | | | 4.73 | % | | | 4.58 | % | | | 3.90 | % | | | 3.75 | % |
Portfolio turnover rate | | | 214 | % | | | 195 | % | | | 175 | % | | | 105 | % | | | 118 | % |
Net assets, end of period (000’s) | | $ | 50,600 | | | $ | 50,558 | | | $ | 52,116 | | | $ | 24,417 | | | $ | 32,601 | |
| (a) | On October 7, 2005, the Columbia Quality Plus Bond Fund was renamed the Columbia Core Bond Fund. |
| (b) | Per share data was calculated using the average shares outstanding during the period. |
| (c) | Total return at net asset value assuming all distributions reinvested and no initial sales charge or contingent deferred sales charge. |
| (d) | Had the investment advisor and/or any of its affiliates not waived fees or reimbursed a portion of expenses, total return would have been reduced. |
| (e) | The benefits derived from expense reductions had an impact of less than 0.01%. |
| (f) | Rounds to less than 0.01%. |
See Accompanying Notes to Financial Statements.
22
Financial Highlights – Columbia Core Bond Fund
Selected data for a share outstanding throughout each period is as follows:
| | | | | | | | | | | | | | | | | | | | |
| | | Year Ended April 30, | |
| Class B Shares | | 2009 | | | 2008 | | | 2007 | | | 2006 (a) | | | 2005 | |
Net Asset Value, Beginning of Period | | $ | 10.44 | | | $ | 10.57 | | | $ | 10.36 | | | $ | 10.81 | | | $ | 10.93 | |
| | | | | |
Income from Investment Operations: | | | | | | | | | | | | | | | | | | | | |
Net investment income (b) | | | 0.38 | | | | 0.42 | | | | 0.40 | | | | 0.34 | | | | 0.31 | |
Net realized and unrealized gain (loss) on investments,
credit default swap contracts and futures contracts | | | (0.31 | ) | | | (0.14 | ) | | | 0.21 | | | | (0.44 | ) | | | 0.09 | |
| | | | | | | | | | | | | | | | | | | | |
Total from investment operations | | | 0.07 | | | | 0.28 | | | | 0.61 | | | | (0.10 | ) | | | 0.40 | |
| | | | | |
Less Distributions to Shareholders: | | | | | | | | | | | | | | | | | | | | |
From net investment income | | | (0.38 | ) | | | (0.41 | ) | | | (0.40 | ) | | | (0.35 | ) | | | (0.33 | ) |
From net realized gains | | | — | | | | — | | | | — | | | | — | | | | (0.19 | ) |
| | | | | | | | | | | | | | | | | | | | |
Total distributions to shareholders | | | (0.38 | ) | | | (0.41 | ) | | | (0.40 | ) | | | (0.35 | ) | | | (0.52 | ) |
| | | | | |
Net Asset Value, End of Period | | $ | 10.13 | | | $ | 10.44 | | | $ | 10.57 | | | $ | 10.36 | | | $ | 10.81 | |
Total return (c) | | | 0.72 | %(d) | | | 2.70 | %(d) | | | 6.01 | % | | | (1.01 | )%(d) | | | 3.74 | %(d) |
| | | | | |
Ratios to Average Net Assets/Supplemental Data: | | | | | | | | | | | | | | | | | | | | |
Net expenses (e) | | | 1.45 | % | | | 1.56 | % | | | 1.65 | % | | | 1.66 | % | | | 1.69 | % |
Waiver/Reimbursement | | | 0.16 | % | | | 0.06 | % | | | — | | | | — | %(f) | | | — | %(f) |
Net investment income (e) | | | 3.81 | % | | | 3.99 | % | | | 3.83 | % | | | 3.15 | % | | | 2.97 | % |
Portfolio turnover rate | | | 214 | % | | | 195 | % | | | 175 | % | | | 105 | % | | | 118 | % |
Net assets, end of period (000’s) | | $ | 13,809 | | | $ | 14,700 | | | $ | 15,710 | | | $ | 9,704 | | | $ | 12,019 | |
| (a) | On October 7, 2005, the Columbia Quality Plus Bond Fund was renamed the Columbia Core Bond Fund. |
| (b) | Per share data was calculated using the average shares outstanding during the period. |
| (c) | Total return at net asset value assuming all distributions reinvested and no contingent deferred sales charge. |
| (d) | Had the investment advisor and/or any of its affiliates not waived fees or reimbursed a portion of expenses, total return would have been reduced. |
| (e) | The benefits derived from expense reductions had an impact of less than 0.01%. |
| (f) | Rounds to less than 0.01%. |
See Accompanying Notes to Financial Statements.
23
Financial Highlights – Columbia Core Bond Fund
Selected data for a share outstanding throughout each period is as follows:
| | | | | | | | | | | | | | | | | | | | |
| | | Year Ended April 30, | |
| Class C Shares | | 2009 | | | 2008 | | | 2007 | | | 2006 (a) | | | 2005 | |
Net Asset Value, Beginning of Period | | $ | 10.44 | | | $ | 10.57 | | | $ | 10.36 | | | $ | 10.81 | | | $ | 10.93 | |
| | | | | |
Income from Investment Operations: | | | | | | | | | | | | | | | | | | | | |
Net investment income (b) | | | 0.39 | | | | 0.43 | | | | 0.42 | | | | 0.35 | | | | 0.33 | |
Net realized and unrealized gain (loss) on investments,
credit default swap contracts and futures contracts | | | (0.31 | ) | | | (0.14 | ) | | | 0.21 | | | | (0.44 | ) | | | 0.09 | |
| | | | | | | | | | | | | | | | | | | | |
Total from investment operations | | | 0.08 | | | | 0.29 | | | | 0.63 | | | | (0.09 | ) | | | 0.42 | |
| | | | | |
Less Distributions to Shareholders: | | | | | | | | | | | | | | | | | | | | |
From net investment income | | | (0.39 | ) | | | (0.42 | ) | | | (0.42 | ) | | | (0.36 | ) | | | (0.35 | ) |
From net realized gains | | | — | | | | — | | | | — | | | | — | | | | (0.19 | ) |
| | | | | | | | | | | | | | | | | | | | |
Total distributions to shareholders | | | (0.39 | ) | | | (0.42 | ) | | | (0.42 | ) | | | (0.36 | ) | | | (0.54 | ) |
| | | | | |
Net Asset Value, End of Period | | $ | 10.13 | | | $ | 10.44 | | | $ | 10.57 | | | $ | 10.36 | | | $ | 10.81 | |
Total return (c)(d) | | | 0.87 | % | | | 2.84 | % | | | 6.17 | % | | | (0.86 | )% | | | 3.89 | % |
| | | | | |
Ratios to Average Net Assets/Supplemental Data: | | | | | | | | | | | | | | | | | | | | |
Net expenses (e) | | | 1.30 | % | | | 1.41 | % | | | 1.50 | % | | | 1.51 | % | | | 1.54 | % |
Waiver/Reimbursement | | | 0.31 | % | | | 0.21 | % | | | 0.15 | % | | | 0.15 | % | | | 0.15 | % |
Net investment income (e) | | | 3.90 | % | | | 4.13 | % | | | 3.99 | % | | | 3.30 | % | | | 3.12 | % |
Portfolio turnover rate | | | 214 | % | | | 195 | % | | | 175 | % | | | 105 | % | | | 118 | % |
Net assets, end of period (000’s) | | $ | 11,002 | | | $ | 6,857 | | | $ | 5,695 | | | $ | 4,073 | | | $ | 5,140 | |
| (a) | On October 7, 2005, the Columbia Quality Plus Bond Fund was renamed the Columbia Core Bond Fund. |
| (b) | Per share data was calculated using the average shares outstanding during the period. |
| (c) | Total return at net asset value assuming all distributions reinvested and no contingent deferred sales charge. |
| (d) | Had the investment advisor and/or any of its affiliates not waived fees or reimbursed a portion of expenses, total return would have been reduced. |
| (e) | The benefits derived from expense reductions had an impact of less than 0.01%. |
See Accompanying Notes to Financial Statements.
24
Financial Highlights – Columbia Core Bond Fund
Selected data for a share outstanding throughout each period is as follows:
| | | | | | | | | | | | | | | | | | | | |
| | | Year Ended April 30, | |
| Class T Shares | | 2009 | | | 2008 (a) | | | 2007 | | | 2006 (b) | | | 2005 | |
Net Asset Value, Beginning of Period | | $ | 10.44 | | | $ | 10.57 | | | $ | 10.36 | | | $ | 10.81 | | | $ | 10.93 | |
| | | | | |
Income from Investment Operations: | | | | | | | | | | | | | | | | | | | | |
Net investment income (c) | | | 0.47 | | | | 0.51 | | | | 0.49 | | | | 0.42 | | | | 0.41 | |
Net realized and unrealized gain (loss) on investments,
credit default swap contracts and futures contracts | | | (0.32 | ) | | | (0.14 | ) | | | 0.21 | | | | (0.43 | ) | | | 0.09 | |
| | | | | | | | | | | | | | | | | | | | |
Total from investment operations | | | 0.15 | | | | 0.37 | | | | 0.70 | | | | (0.01 | ) | | | 0.50 | |
| | | | | |
Less Distributions to Shareholders: | | | | | | | | | | | | | | | | | | | | |
From net investment income | | | (0.46 | ) | | | (0.50 | ) | | | (0.49 | ) | | | (0.44 | ) | | | (0.43 | ) |
From net realized gains | | | — | | | | — | | | | — | | | | — | | | | (0.19 | ) |
| | | | | | | | | | | | | | | | | | | | |
Total distributions to shareholders | | | (0.46 | ) | | | (0.50 | ) | | | (0.49 | ) | | | (0.44 | ) | | | (0.62 | ) |
| | | | | |
Net Asset Value, End of Period | | $ | 10.13 | | | $ | 10.44 | | | $ | 10.57 | | | $ | 10.36 | | | $ | 10.81 | |
Total return (d) | | | 1.58 | %(e) | | | 3.57 | %(e) | | | 6.91 | % | | | (0.17 | )%(e) | | | 4.62 | %(e) |
| | | | | |
Ratios to Average Net Assets/Supplemental Data: | | | | | | | | | | | | | | | | | | | | |
Net expenses (f) | | | 0.60 | % | | | 0.71 | % | | | 0.80 | % | | | 0.81 | % | | | 0.84 | % |
Waiver/Reimbursement | | | 0.16 | % | | | 0.06 | % | | | — | | | | — | %(g) | | | — | %(g) |
Net investment income (f) | | | 4.66 | % | | | 4.83 | % | | | 4.68 | % | | | 4.01 | % | | | 3.72 | % |
Portfolio turnover rate | | | 214 | % | | | 195 | % | | | 175 | % | | | 105 | % | | | 118 | % |
Net assets, end of period (000’s) | | $ | 18,278 | | | $ | 21,562 | | | $ | 23,582 | | | $ | 26,372 | | | $ | 30,832 | |
| (a) | On August 8, 2007, Class G shares were exchanged for Class T shares. |
| (b) | On October 7, 2005, the Columbia Quality Plus Bond Fund was renamed the Columbia Core Bond Fund. |
| (c) | Per share data was calculated using the average shares outstanding during the period. |
| (d) | Total return at net asset value assuming all distributions reinvested and no initial sales charge or contingent deferred sales charge. |
| (e) | Had the investment advisor and/or any of its affiliates not waived fees or reimbursed a portion of expenses, total return would have been reduced. |
| (f) | The benefits derived from expense reductions had an impact of less than 0.01%. |
| (g) | Rounds to less than 0.01%. |
See Accompanying Notes to Financial Statements.
25
Financial Highlights – Columbia Core Bond Fund
Selected data for a share outstanding throughout each period is as follows:
| | | | | | | | | | | | | | | | | | | | |
| | | Year Ended April 30, | |
| Class Z Shares | | 2009 | | | 2008 | | | 2007 | | | 2006 (a) | | | 2005 | |
Net Asset Value, Beginning of Period | | $ | 10.44 | | | $ | 10.57 | | | $ | 10.36 | | | $ | 10.81 | | | $ | 10.93 | |
| | | | | |
Income from Investment Operations: | | | | | | | | | | | | | | | | | | | | |
Net investment income (b) | | | 0.48 | | | | 0.52 | | | | 0.51 | | | | 0.44 | | | | 0.42 | |
Net realized and unrealized gain (loss) on investments, credit default swap contracts and futures contracts | | | (0.31 | ) | | | (0.14 | ) | | | 0.21 | | | | (0.44 | ) | | | 0.09 | |
| | | | | | | | | | | | | | | | | | | | |
Total from investment operations | | | 0.17 | | | | 0.38 | | | | 0.72 | | | | — | | | | 0.51 | |
| | | | | |
Less Distributions to Shareholders: | | | | | | | | | | | | | | | | | | | | |
From net investment income | | | (0.48 | ) | | | (0.51 | ) | | | (0.51 | ) | | | (0.45 | ) | | | (0.44 | ) |
From net realized gains | | | — | | | | — | | | | — | | | | — | | | | (0.19 | ) |
| | | | | | | | | | | | | | | | | | | | |
Total distributions to shareholders | | | (0.48 | ) | | | (0.51 | ) | | | (0.51 | ) | | | (0.45 | ) | | | (0.63 | ) |
| | | | | |
Net Asset Value, End of Period | | $ | 10.13 | | | $ | 10.44 | | | $ | 10.57 | | | $ | 10.36 | | | $ | 10.81 | |
Total return (c) | | | 1.73 | %(d) | | | 3.72 | %(d) | | | 7.07 | % | | | (0.02 | )%(d) | | | 4.78 | %(d) |
| | | | | |
Ratios to Average Net Assets/Supplemental Data: | | | | | | | | | | | | | | | | | | | | |
Net expenses (e) | | | 0.45 | % | | | 0.56 | % | | | 0.65 | % | | | 0.66 | % | | | 0.69 | % |
Waiver/Reimbursement | | | 0.16 | % | | | 0.06 | % | | | — | | | | — | %(f) | | | — | %(f) |
Net investment income (e) | | | 4.80 | % | | | 4.98 | % | | | 4.83 | % | | | 4.16 | % | | | 3.87 | % |
Portfolio turnover rate | | | 214 | % | | | 195 | % | | | 175 | % | | | 105 | % | | | 118 | % |
Net assets, end of period (000’s) | | $ | 1,422,826 | | | $ | 1,523,499 | | | $ | 1,606,867 | | | $ | 948,279 | | | $ | 926,434 | |
| (a) | On October 7, 2005, the Columbia Quality Plus Bond Fund was renamed the Columbia Core Bond Fund. |
| (b) | Per share data was calculated using the average shares outstanding during the period. |
| (c) | Total return at net asset value assuming all distributions reinvested. |
| (d) | Had the investment advisor and/or any of its affiliates not waived fees or reimbursed a portion of expenses, total return would have been reduced. |
| (e) | The benefits derived from expense reductions had an impact of less than 0.01%. |
| (f) | Rounds to less than 0.01%. |
See Accompanying Notes to Financial Statements.
26
Notes to Financial Statements – Columbia Core Bond Fund
April 30, 2009
Note 1. Organization
Columbia Core Bond Fund (the “Fund”), a series of Columbia Funds Series Trust I (the “Trust”), is a diversified portfolio. The Trust is a Massachusetts business trust registered under the Investment Company Act of 1940, as amended (the “1940 Act”), as an open-end management investment company.
Investment Objective
The Fund seeks total return, consisting of current income and capital appreciation.
Fund Shares
The Trust may issue an unlimited number of shares, and the Fund offers five classes of shares: Class A, Class B, Class C, Class T and Class Z. Each share class has its own expense structure and sales charges, as applicable. Beginning on or about June 22, 2009, the Fund will no longer accept investment in Class B shares from new or existing investors in the Fund’s Class B shares, except in connection with the reinvestment of any dividend and/or capital gain distributions in Class B shares of the Fund and exchanges by existing Class B shareholders of the other Columbia Funds.
Class A and Class T shares are subject to a maximum front-end sales charge of 4.75% based on the amount of initial investment. Class A and Class T shares purchased without an initial sales charge in accounts aggregating $1 million to $50 million at the time of purchase are subject to a 1.00% contingent deferred sales charge (“CDSC”) if the shares are sold within one year after purchase. Class B shares are subject to a maximum CDSC of 5.00% based upon the holding period after purchase. Class B shares will convert to Class A shares eight years after purchase. Class C shares are subject to a 1.00% CDSC on shares sold within one year after purchase. Class Z shares are offered continuously at net asset value. There are certain restrictions on the purchase of Class T and Class Z shares, as described in the Fund’s prospectus.
Note 2. Significant Accounting Policies
The preparation of financial statements in accordance with accounting principles generally accepted in the United States of America (“GAAP”) requires management to make certain estimates and assumptions that affect the reported amounts of assets and liabilities, the disclosure of contingent assets and liabilities at the date of the financial statements and the reported amounts of revenue and expenses during the reporting period. Actual results could differ from those estimates. The following is a summary of significant accounting policies consistently followed by the Fund in the preparation of its financial statements.
Security Valuation
Debt securities generally are valued by pricing services approved by the Trust’s Board of Trustees, based upon market transactions for normal, institutional-size trading units of similar securities. The services may use various pricing techniques which take into account appropriate factors such as yield, quality, coupon rate, maturity, type of issue, trading characteristics and other data, as well as broker quotes. Debt securities for which quotations are readily available are valued at an over-the-counter or exchange bid quotation.
Certain debt securities, which tend to be more thinly traded and of lesser quality, are priced based on fundamental analysis of the financial condition of the issuer and the estimated value of any collateral. Valuations developed through pricing techniques may vary from the actual amounts realized upon sale of the securities, and the potential variation may be greater for those securities valued using fundamental analysis.
Short-term investments maturing in 60 days or less are valued at amortized cost, which approximates market value.
Futures contracts are valued at the settlement price established each day by the board of trade or exchange on which they are traded.
Credit default swap contracts are marked to market daily based upon quotations from market makers. Quotations obtained from independent pricing services use information provided by market makers.
Investments for which market quotations are not readily available, or that have quotations which management believes are not reliable, are valued at fair value as determined in good faith under consistently applied procedures established by and under the general supervision of the Board of Trustees. If a security is valued at fair value, such value is likely to be different from the last quoted market price for the security. The determination of fair value often requires significant judgment. To determine fair value,
27
Columbia Core Bond Fund
April 30, 2009
management may use assumptions including but not limited to future cash flows and estimated risk premiums. Multiple inputs from various sources may be used to determine value.
On May 1, 2008, the Fund adopted Financial Accounting Standards Board (“FASB”) Statement of Financial Accounting Standards No. 157, Fair Value Measurements (“SFAS 157”). SFAS 157 establishes a hierarchy that prioritizes the inputs to valuation techniques used to measure fair value giving the highest priority to unadjusted quoted prices in active markets for identical securities (level 1 measurements) and the lowest priority to unobservable inputs (level 3 measurements) when market prices are not readily available or reliable. The three levels of the fair value hierarchy under SFAS 157 are described below:
| | • | | Level 1—quoted prices in active markets for identical securities | |
| | • | | Level 2—prices determined using other significant observable inputs (including quoted prices for similar securities, interest rates, prepayment speeds, credit risk, and others) | |
| | • | | Level 3—prices determined using significant unobservable inputs. In situations where quoted prices or observable inputs are unavailable or less reliable, unobservable inputs may be used. Unobservable inputs may include management’s own assumptions about the factors market participants would use in pricing an investment. | |
The inputs or methodology used for valuing securities are not necessarily an indication of the risk associated with investing in those securities.
In April 2009, FASB issued new FASB Staff Position 157-4, Determining Fair Value When the Value and Level of Activity for the Asset or Liability Have Significantly Decreased and Identifying Transactions That Are Not Orderly (“FSP FAS 157-4”), which amends SFAS 157 and is effective for interim and annual periods ending after June 15, 2009. FSP FAS 157-4 provides additional guidance when the volume and level of activity for the asset or liability measured at fair value has significantly decreased. Additionally, FSP FAS 157-4 expands disclosure requirements for reporting entities with respect to categories of assets and liabilities carried at fair value. Management is evaluating the impact that the application of FSP FAS 157-4 will have on the Fund’s financial statement disclosures.
Security Transactions
Security transactions are accounted for on the trade date. Cost is determined and gains (losses) are based upon the specific identification method for both financial statement and federal income tax purposes.
In March 2008, Statement of Financial Accounting Standards No. 161, Disclosures about Derivative Instruments and Hedging Activities-an amendment of FASB Statement No. 133 (“SFAS 161”), was issued. SFAS 161 is effective for fiscal years and interim periods beginning after November 15, 2008. SFAS 161 requires additional discussion about the reporting entity’s derivative instruments and hedging activities, by providing for qualitative disclosures about the objectives and strategies for using derivatives, quantitative data about the fair value of and gains and losses on derivative contracts, and details of credit-risk-related contingent features in their derivative contracts. Management is evaluating the impact the application of SFAS 161 will have on the Fund’s financial statement disclosures.
Futures Contracts
The Fund may invest in futures contracts for both hedging and non-hedging purposes, including, for example, to seek to enhance returns or as a substitute for a position in an underlying asset.
The use of futures contracts involves certain risks, which include: (1) imperfect correlation between the price movement of the instruments and the underlying securities, (2) inability to close out positions due to differing trading hours, or the temporary absence of a liquid market, for either the instruments or the underlying securities, or (3) an inaccurate prediction of the future direction of interest rates by Columbia Management Advisors, LLC (“Columbia”), the Fund’s investment advisor. Any of these risks may involve amounts exceeding the variation margin recorded in the Fund’s Statement of Assets and Liabilities at any given time.
Upon entering into a futures contract, the Fund pledges cash or securities with the broker in an amount sufficient to meet the initial margin requirement. Subsequent payments are made or received by the Fund equal to the daily change in the contract value and are recorded as variation margin receivable or payable and offset in unrealized gains or losses. The Fund recognizes a realized gain or loss when the contract is closed or expires.
28
Columbia Core Bond Fund
April 30, 2009
Repurchase Agreements
The Fund may engage in repurchase agreement transactions with institutions that Columbia has determined are creditworthy. The Fund, through its custodian, receives delivery of the underlying securities collateralizing a repurchase agreement. Columbia is responsible for determining that the collateral is at least equal, at all times, to the value of the repurchase obligation including interest. A repurchase agreement transaction involves certain risks in the event of default or insolvency of the counterparty. These risks include possible delays in or restrictions on the Fund’s ability to dispose of the underlying securities and a possible decline in the value of the underlying securities during the period while the Fund seeks to assert its rights.
Mortgage Dollar Roll Transactions
The Fund may enter into mortgage “dollar rolls” in which the Fund sells securities for delivery in the current month and simultaneously contracts with the same counterparty to repurchase similar (same type, coupon and maturity) but not identical securities on a specified future date not exceeding 120 days. During the roll period, the Fund loses the right to receive principal and interest paid on the securities sold. However, the Fund would benefit to the extent of any difference between the price received for the securities sold and the lower forward price for the future purchase (often referred to as the “drop”) or fee income plus the interest earned on the cash proceeds of the securities sold until the settlement date of the forward purchase. Unless such benefits exceed the income, capital appreciation and gain or loss due to mortgage prepayments that would have been realized on the securities sold as part of the mortgage dollar roll, the use of this technique will diminish the investment performance of the Fund compared with what such performance would have been without the use of mortgage dollar rolls. All cash proceeds will be invested in instruments that are permissible investments for the Fund. The Fund will hold and maintain in a segregated account until the settlement date, cash or liquid securities in an amount equal to the forward purchase price.
The Fund’s policy is to record the components of mortgage dollar rolls using “to be announced” mortgage-backed securities. For financial reporting and tax purposes, the Fund treats mortgage dollar rolls as two separate transactions, one involving the purchase of a security and a separate transaction involving a sale. The Fund does not currently enter into mortgage dollar rolls that are accounted for as financing transactions.
Mortgage dollar rolls involve certain risks. If the broker-dealer to whom the Fund sells the securities becomes insolvent, the Fund’s right to purchase or repurchase the mortgage-related securities may be restricted and the instruments which the Fund is required to repurchase may be worth less than instruments which the Fund originally held. Successful use of mortgage dollar rolls may depend upon the investment advisor’s ability to predict correctly interest rates and mortgage prepayments. For these reasons, there is no assurance that mortgage dollar rolls can be successfully employed.
Delayed Delivery Securities
The Fund may trade securities on other than normal settlement terms, including securities purchased or sold on a “when-issued” basis. This may increase the risk if the other party to the transaction fails to deliver and causes the Fund to subsequently invest at less advantageous prices. The Fund holds until the settlement date, in a segregated account, cash or liquid securities in an amount equal to the delayed delivery commitment.
Treasury Inflation Protected Securities
The Fund may invest in treasury inflation protected securities (“TIPS”). The principal amount of TIPS is adjusted periodically and is increased for inflation or decreased for deflation based on a monthly published index. Interest payments are based on the inflation-adjusted principal at the time the interest is paid. These adjustments are recorded as interest income on the Statement of Operations.
Credit Default Swaps
The Fund may engage in credit default swap transactions for hedging purposes or to seek to increase total return. Credit default swaps are agreements in which one party pays fixed periodic payments to a counterparty in consideration for a guarantee from the counterparty to make a specific payment should a negative credit event take place. The Fund may receive an upfront payment as the protection seller or make an upfront payment as the protection buyer.
If the Fund is a seller of protection and a credit event occurs, as defined under the terms of that particular swap agreement, the Fund will either (i) pay to the buyer of
29
Columbia Core Bond Fund
April 30, 2009
protection an amount equal to the notional amount of the swap and take delivery of the referenced obligation or underlying securities comprising the referenced index or (ii) pay a net settlement amount in the form of cash or securities equal to the notional amount of the swap less the recovery value of the referenced obligation or underlying securities comprising the referenced index. Recovery values are assumed by market makers considering either industry standard recovery rates or entity specific factors and considerations until a credit event occurs. If a credit event has occurred, the recovery value is determined by a facilitated auction whereby a minimum number of allowable broker bids, together with a specified valuation method, are used to calculate the settlement value.
If the Fund is a buyer of protection and a credit event occurs, as defined under the terms of that particular swap agreement, the Fund will either (i) receive from the seller of protection an amount equal to the notional amount of the swap and deliver the referenced obligation or underlying securities compromising the referenced index or (ii) receive a net settlement amount in the form of cash or securities equal to the notional amount of the swap less the recovery value of the referenced obligation or underlying securities compromising the referenced index.
Credit default swaps are marked to market daily based on quotations from market makers and any change is recorded as unrealized appreciation/depreciation on the Fund’s Statement of Assets and Liabilities. Periodic payments received or made are recorded as a realized gain or loss and premiums received or made are amortized on the Statement of Operations.
Interest Only Securities
The Fund may invest in Interest Only Securities (“IOs”). IOs are stripped mortgage backed securities entitled to receive all of the security’s interest, but none of its principal. Interest is accrued daily. The daily accrual factor is adjusted each month to reflect the paydown of principal.
Stripped Securities
Stripped mortgage-backed securities are derivative multi-class mortgage securities structured so that one class receives most, if not all, of the principal from the underlying mortgage assets, while the other class receives most, if not all, of the interest and the remainder of the principal. If the underlying mortgage assets experience greater than anticipated prepayments of principal, the Fund may fail to fully recoup its initial investment in an interest-only security. The market value of these securities can be extremely volatile in response to changes in interest rates. Credit risk reflects the risk that the Fund may not receive all or part of its principal because the issuer or credit enhancer has defaulted on its obligation.
Income Recognition
Interest income is recorded on an accrual basis and includes accretion of discounts, amortization of premiums and paydown gains and losses. Fee income attributable to mortgage dollar roll transactions is recorded on the accrual basis over the term of the transaction. The value of additional securities received as an income payment is recorded as income and as the cost basis of such securities.
Expenses
General expenses of the Trust are allocated to the Fund and other series of the Trust based upon relative net assets or other expense allocation methodologies determined by the nature of the expense. Expenses directly attributable to the Fund are charged to the Fund.
Determination of Class Net Asset Value
All income, expenses (other than class-specific expenses, as shown on the Statement of Operations) and realized and unrealized gains (losses) are allocated to each class of the Fund on a daily basis for purposes of determining the net asset value of each class. Income and expenses are allocated to each class based on the settled shares method, while realized and unrealized gains (losses) are allocated based on the relative net assets of each class.
Federal Income Tax Status
The Fund intends to qualify each year as a “regulated investment company” under Subchapter M of the Internal Revenue Code, as amended, and will distribute substantially all of its tax exempt or taxable income, if any, for its tax year, and as such will not be subject to federal income taxes. In addition, the Fund intends to distribute in each calendar year substantially all of its net investment income, capital gains and certain other amounts, if any, such that the Fund should not be subject to federal excise tax. Therefore, no federal income or excise tax provision is recorded.
30
Columbia Core Bond Fund
April 30, 2009
Distributions to Shareholders
Distributions from net investment income are declared daily and paid monthly. Net realized capital gains, if any, are distributed at least annually. Income distributions and capital gain distributions are determined in accordance with federal income tax regulations which may differ from GAAP.
Indemnification
In the normal course of business, the Fund enters into contracts that contain a variety of representations and warranties and which provide general indemnities. The Fund’s maximum exposure under these arrangements is unknown because this would involve future claims against the Fund. Also, under the Trust’s organizational documents and by contract, the Trustees and officers of the Trust are indemnified against certain liabilities that may arise out of actions relating to their duties to the Trust. However, based on experience, the Fund expects the risk of loss due to these representations, warranties and indemnities to be minimal.
Note 3. Federal Tax Information
The timing and character of income and capital gain distributions are determined in accordance with income tax regulations, which may differ from GAAP. Reclassifications are made to the Fund’s capital accounts for permanent tax differences to reflect income and gains available for distribution (or available capital loss carryforwards) under income tax regulations.
For the year ended April 30, 2009, permanent book and tax basis differences resulting primarily from differing treatments for treasury inflation protected securities, discount accretion/premium amortization on debt securities and market discount were identified and reclassified among the components of the Fund’s net assets as follows:
| | | | |
| | | | | |
Undistributed Net Investment Income | | Accumulated
Net Realized Loss | | Paid-In
Capital |
| $(157,426) | | $157,426 | | $— |
Net investment income and net realized gains (losses), as disclosed on the Statement of Operations, and net assets were not affected by this reclassification.
The tax character of distributions paid during the years ended April 30, 2009 and April 30, 2008 was as follows:
| | | | | | |
| | | 2009 | | 2008 |
| Distributions paid from: | | | | |
Ordinary Income* | | $ | 70,844,233 | | $ | 80,939,636 |
| * | For tax purposes short-term capital gain distributions, if any, are considered ordinary income distributions. |
As of April 30, 2009, the components of distributable earnings on a tax basis were as follows:
| | | | |
| | | | | |
Undistributed
Ordinary Income | | Undistributed Long-term Capital Gains | | Net Unrealized Depreciation* |
| $5,495,009 | | $— | | $(30,254,050) |
| * | The differences between book-basis and tax-basis net unrealized depreciation are primarily due to deferral of losses from wash sales and discount accretion/premium amortization on debt securities. |
Unrealized appreciation and depreciation at April 30, 2009, based on cost of investments for federal income tax purposes were:
| | | | |
| | |
Unrealized appreciation | | $ | 29,317,306 | |
Unrealized depreciation | | | (59,571,356 | ) |
Net unrealized depreciation | | $ | (30,254,050 | ) |
The following capital loss carryforwards, determined as of April 30, 2009, may be available to reduce taxable income arising from future net realized gains on investments, if any, to the extent permitted by the Internal Revenue Code:
| | | |
| |
| Year of Expiration | | Capital Loss Carryforwards |
| 2012 | | $ | 2,067,727 |
| 2013 | | | 5,618,112 |
| 2014 | | | 19,745,385 |
| 2015 | | | 5,076,609 |
| 2017 | | | 35,127,545 |
| | | | |
| Total | | $ | 67,635,378 |
Under current tax rules, certain currency and capital losses realized after October 31 may be deferred and treated as occurring on the first day of the following fiscal year. As of April 30, 2009, post-October capital losses of $8,237,058 attributed to security transactions were deferred to May 1, 2009.
31
Columbia Core Bond Fund
April 30, 2009
Under Financial Accounting Standards Board (“FASB”) Interpretation No. 48, Accounting for Uncertainty in Income Taxes — an Interpretation of FASB Statement No. 109 (“FIN 48”), management determines whether a tax position of the Fund is more likely than not to be sustained upon examination by the applicable taxing authority, including resolution of any related appeals or litigation processes, based on the technical merits of the position. The tax benefit to be recognized is measured as the largest amount of benefit that is greater than fifty percent likely of being realized upon ultimate settlement. Management has evaluated the known implications of FIN 48 on its computation of net assets for the Fund. As a result of this evaluation, management has concluded that FIN 48 did not have any effect on the Fund’s financial statements. However, management’s conclusions regarding FIN 48 may be subject to review and adjustment at a later date based on factors including, but not limited to, further implementation guidance from the FASB, new tax laws, regulations, and administrative interpretations (including relevant court decisions). The Fund’s federal tax returns for the prior three fiscal years remain subject to examination by the Internal Revenue Service. The Fund is not aware of any tax positions for which it is reasonably possible that the total amounts of unrecognized tax benefits will significantly change in the next twelve months.
Note 4. Fees and Compensation Paid to Affiliates
Investment Advisory Fee
Columbia, an indirect, wholly owned subsidiary of Bank of America Corporation (“BOA”) provides investment advisory services to the Fund. In rendering investment advisory services to the Fund, Columbia may use the portfolio management and research resources of Columbia Management Pte. Ltd., an affiliate of Columbia. Columbia receives a monthly investment advisory fee based on the Fund’s average daily net assets at the following annual rates:
| | | |
| | |
| Average Daily Net Assets | | Annual Fee Rate | |
First $500 million | | 0.48 | % |
$500 million to $1 billion | | 0.43 | % |
$1 billion to $1.5 billion | | 0.40 | % |
$1.5 billion to $3 billion | | 0.37 | % |
$3 billion to $6 billion | | 0.36 | % |
Over $6 billion | | 0.35 | % |
For the year ended April 30, 2009, the Fund’s effective investment advisory fee rate was 0.44% of the Fund’s average daily net assets.
Administration Fee
Columbia provides administrative and other services to the Fund for a monthly administration fee at the annual rate of 0.067% of the Fund’s average daily net assets.
Pricing and Bookkeeping Fees
The Fund has entered into a Financial Reporting Services Agreement (the “Financial Reporting Services Agreement”) with State Street Bank & Trust Company (“State Street”) and Columbia pursuant to which State Street provides financial reporting services to the Fund. The Fund has also entered into an Accounting Services Agreement (collectively with the Financial Reporting Services Agreement, the “State Street Agreements”) with State Street and Columbia pursuant to which State Street provides accounting services to the Fund. Under the State Street Agreements, the Fund pays State Street an annual fee of $38,000 paid monthly plus an additional monthly fee based on an annualized percentage rate of average daily net assets of the Fund for the month. The aggregate fee will not exceed $140,000 per year (exclusive of out-of-pocket expenses and charges). The Fund also reimburses State Street for certain out-of-pocket expenses and charges.
The Fund has entered into a Pricing and Bookkeeping Oversight and Services Agreement (the “Services Agreement”) with Columbia. Under the Services Agreement, Columbia provides services related to Fund expenses and the requirements of the Sarbanes-Oxley Act of 2002, and provides oversight of the accounting and financial reporting services provided by State Street. Under the Services Agreement, the Fund reimburses Columbia for out-of-pocket expenses.
Transfer Agent Fee
Columbia Management Services, Inc. (the “Transfer Agent”), an affiliate of Columbia and an indirect, wholly owned subsidiary of BOA, provides shareholder services to the Fund and has contracted with Boston Financial Data Services (“BFDS”) to serve as sub-transfer agent. The Transfer Agent is entitled to receive a fee for its services, paid monthly, at the annual rate of $17.34 per open account plus reimbursement of certain sub-transfer agent fees paid by the Transfer Agent (exclusive of BFDS fees), calculated based on assets held in
32
Columbia Core Bond Fund
April 30, 2009
omnibus accounts and intended to recover the cost of payments to other parties (including affiliates of BOA) for services to those accounts. The Transfer Agent pays the fees of BFDS for services as sub-transfer agent and is not entitled to reimbursement for such fees from the Fund.
The Transfer Agent may also retain, as additional compensation for its services, fees for wire, telephone and redemption orders, Individual Retirement Account (“IRA”) trustee agent fees and account transcript fees due to the Transfer Agent from shareholders of the Fund and credits (net of bank charges) earned with respect to balances in accounts the Transfer Agent maintains in connection with its services to the Fund. The Transfer Agent also receives reimbursement for certain out-of-pocket expenses.
An annual minimum account balance fee of $20 may apply to certain accounts with a value below the Fund’s initial minimum investment requirements to reduce the impact of small accounts on transfer agent fees. These minimum account balance fees are recorded as part of expense reductions on the Statement of Operations. For the year ended April 30, 2009, these minimum account balance fees reduced total expenses by $4,928.
Underwriting Discounts, Service and Distribution Fees
Columbia Management Distributors, Inc. (the “Distributor”), an affiliate of Columbia and an indirect, wholly owned subsidiary of BOA, is the principal underwriter of the Fund’s shares. For the year ended April 30, 2009, the Distributor has retained net underwriting discounts of $5,543 and $113 on sales of the Fund’s Class A and Class T shares, respectively. For the same period, the Distributor received net CDSC fees of $165, $19,095 and $1,391 on Class A, Class B and Class C shares redemptions, respectively.
The Fund has adopted distribution and shareholder servicing plans (the “Plans”) pursuant to Rule 12b-1 under the 1940 Act, which require the payment of distribution and service fees. The fees are intended to compensate the Distributor and/or eligible selling and/or servicing agents for selling shares of the Fund and providing services to investors. Payments under the Plans, which are calculated daily and paid monthly, are based on the average daily net assets of the applicable class of the Fund at the following annual rates:
| | | | | | | | |
| Distribution Fee | | Service Fee |
| Class B | | Class C1 | | Class A | | Class B | | Class C1 |
| 0.75% | | 0.75% | | 0.25% | | 0.25% | | 0.25% |
1 | The Distributor has voluntarily agreed to waive a portion of the distribution and service fees for Class C shares so that the combined distribution and service fees do not exceed 0.85% annually of the average daily net assets attributable to Class C shares. This arrangement may be modified or terminated by the Distributor at any time. |
Shareholder Services Fee
The Fund may pay shareholder service fees up to a maximum of 0.40% of the Fund’s average daily net assets attributable to Class T shares (comprised of up to 0.20% for shareholder liaison services and up to 0.20% for administrative support services) but will limit such fees to an aggregate of not more than 0.15% during the current fiscal year.
For the year ended April 30, 2009, the effective shareholder service fee was 0.15% of the Funds average daily net assets attributable to Class T shares.
Fee Waivers and Expense Reimbursements
Columbia has contractually agreed to bear a portion of the Fund’s expenses through August 31, 2009, so that the Fund’s ordinary operating expenses (excluding any distribution and service fees, brokerage commissions, interest, taxes and extraordinary expenses, but including custodial charges relating to overdrafts, if any), after giving effect to any balance credits from the Fund’s custodian, do not exceed 0.45% of the Fund’s average daily net assets on an annualized basis.
Effective September 1, 2009, Columbia will voluntarily reimburse a portion of the Fund’s expenses so that the Fund’s ordinary operating expenses (excluding any distribution and service fees, brokerage commissions, interest, taxes and extraordinary expenses, but including custodial charges relating to overdrafts, if any), after giving effect to any balance credits from the Fund’s custodian, will not exceed 0.70% annually of the Fund’s average daily net assets.
Fees Paid to Officers and Trustees
All officers of the Fund are employees of Columbia or its affiliates and, with the exception of the Fund’s Chief Compliance Officer, receive no compensation from the Fund. The Board of Trustees has appointed a Chief Compliance Officer to the Fund in accordance with federal securities
33
Columbia Core Bond Fund
April 30, 2009
regulations. The Fund, along with other affiliated funds, pays its pro-rata share of the expenses associated with the Chief Compliance Officer. The Fund’s expenses for the Chief Compliance Officer will not exceed $15,000 per year.
The Trust’s eligible Trustees may participate in a deferred compensation plan which may be terminated at any time. Obligations of the plan will be paid solely out of the Fund’s assets.
Note 5. Custody Credits
The Fund has an agreement with its custodian bank under which custody fees may be reduced by balance credits. These credits are recorded as part of expense reductions on the Statement of Operations. The Fund could have invested a portion of the assets utilized in connection with the expense offset arrangement in an income-producing asset if it had not entered into such an agreement.
For the year ended April 30, 2009, these custody credits reduced total expenses by $258 for the Fund.
Note 6. Portfolio Information
For the year ended April 30, 2009, the cost of purchases and proceeds from sales of securities, excluding short-term obligations, for the Fund were $3,042,872,200 and $3,249,590,015, respectively, of which $2,275,133,529 and $2,319,904,765, respectively, were U.S. Government securities.
Note 7. Line of Credit
The Fund and other affiliated funds participate in a $280,000,000 committed, unsecured revolving line of credit provided by State Street. The maximum amount that may be borrowed by any fund is limited to the lesser of $200,000,000 and the Fund’s borrowing limit set forth in the Fund’s registration statement. Borrowings are available for short-term liquidity or temporary or emergency purposes.
Interest is charged to each participating fund based on the fund’s borrowings at a rate per annum equal to the greater of the Federal Funds Rate plus 0.50% or the overnight LIBOR Rate plus 0.50%. In addition, an annual operations agency fee of $20,000, an amendment fee of 0.02% and a commitment fee of 0.12% per annum are accrued and apportioned among the participating funds pro rata based on their relative net assets. Prior to October 16, 2008, the Fund and other affiliated funds participated in a $350,000,000 committed, unsecured revolving line of credit and a $150,000,000 uncommitted, unsecured line of credit, both provided by State Street. Interest on the committed line of credit was charged to each participating fund based on the fund’s borrowings at a rate per annum equal to the Federal Funds Rate plus 0.50%. In addition, a commitment fee of 0.10% per annum was accrued and apportioned among the participating funds pro rata based on their relative net assets. Interest on the uncommitted line of credit was charged to each participating fund based on the fund’s borrowings at a rate per annum equal to the Federal Funds Rate plus 0.375%. State Street charged an annual operations agency fee of $40,000 for the committed line of credit and was able to charge an annual administration fee of $15,000 for the uncommitted line of credit. The commitment fee, the operations agency fee and the administration fee were accrued and apportioned among the participating funds pro rata based on their relative net assets.
For the year ended April 30, 2009, the Fund did not borrow under these arrangements.
Note 8. Securities Lending
The Fund may lend its securities to certain approved brokers, dealers and other financial institutions. Each loan is collateralized by cash, in an amount at least equal to the market value of the securities loaned plus accrued income from the investment of collateral. The market value of the loaned securities is determined at the close of business of the Fund and any additional required collateral is delivered to the Fund on the next business day. The collateral received is invested and the income generated by the investment of the collateral, net of any fees remitted to State Street as the lending agent and borrower rebates, is paid to the Fund. Generally, in the event of borrower default, the Fund has the right to use the collateral to offset any losses incurred. In the event the Fund is delayed in or prevented from exercising its right to dispose of the collateral, there may be a potential loss to the Fund. The Fund bears the risk of loss with respect to the investment of collateral.
Note 9. Shares of Beneficial Interest
As of April 30, 2009, 86.2% of the Fund’s shares outstanding were beneficially owned by five participant accounts over
34
Columbia Core Bond Fund
April 30, 2009
which BOA and/or any of its affiliates had either sole or joint investment discretion.
Subscription and redemption activity of these accounts may have a significant effect on the operations of the Fund.
Note 10. Significant Risks and Contingencies
Sector Focus Risk
The Fund may focus its investments in certain sectors, subjecting it to greater risk than a fund that is less focused.
Foreign Securities Risk
There are certain additional risks involved when investing in foreign securities. These risks may involve foreign currency exchange rate fluctuations, adverse political and economic developments and the possible prevention of currency exchange or other foreign governmental laws or restrictions. In addition, the liquidity of foreign securities may be more limited than that of domestic securities.
Asset-Backed Securities Risk
The value of asset-backed securities may be affected by, among other factors, changes in interest rates, the market’s assessment of the quality of underlying assets, the creditworthiness of the servicer for the underlying assets, factors concerning the interests in and structure of the issuer or the originator of the underlying assets, or the creditworthiness or rating of the entities that provide any supporting letters of credit, surety bonds, derivative instruments, or other credit enhancement. The value of asset-backed securities also will be affected by the exhaustion, termination or expiration of any credit enhancement. Most asset-backed securities are subject to prepayment risk, which is the possibility that the underlying debt may be refinanced or prepaid prior to maturity during periods of declining or low interest rates, causing the Fund to have to reinvest the money received in securities that have lower yields. In addition, the impact of prepayments on the value of asset-backed securities may be difficult to predict and may result in greater volatility.
Mortgage-Backed Securities Risk
The value of the mortgage-backed securities may be affected by, among other things, changes in interest rates, factors concerning the interests in and structure of the issuer or the originator of the mortgages, the creditworthiness of the entities that provide any supporting letters of credit, surety bonds or other credit enhancements or the quality of underlying assets or the market’s assessment thereof. Mortgage-backed securities are subject to prepayment risk, which is the possibility that the underlying mortgage may be refinanced or prepaid prior to maturity during periods of declining or low interest rates, causing the Funds to have to reinvest the money received in securities that have lower yields. In addition, the impact of prepayments on the value of mortgage-backed securities may be difficult to predict and may result in greater volatility.
Legal Proceedings
Columbia Management Advisors, LLC and Columbia Management Distributors, Inc. (collectively, the “Columbia Group”) are subject to a settlement agreement with the New York Attorney General (“NYAG”) (the “NYAG Settlement”) and a settlement order with the SEC (the “SEC Order”) on matters relating to mutual fund trading, each dated February 9, 2005. Under the terms of the SEC Order, the Columbia Group (or predecessor entities) agreed, among other things, to: pay disgorgement and civil money penalties collectively totaling $140 million; cease and desist from violations of the antifraud provisions and certain other provisions of the federal securities laws; maintain certain compliance and ethics oversight structures; and retain an independent consultant to review the Columbia Group’s applicable supervisory, compliance, control and other policies and procedures. The NYAG Settlement, among other things, requires Columbia Management Advisors, LLC and its affiliates to reduce management fees for certain funds in the Columbia family of mutual funds in a projected total of $160 million over five years through November 30, 2009 and to make certain disclosures to investors relating to expenses. In connection with the Columbia Group providing services to the Columbia Funds, the Columbia Funds have voluntarily undertaken to implement certain governance measures designed to maintain the independence of their boards of trustees and certain special consulting and compliance measures.
Pursuant to the SEC Order and related procedures, the $140 million in settlement amounts described above has been substantially distributed in accordance with a distribution plan that was developed by an independent distribution consultant and approved by the SEC on April 6, 2007.
35
Columbia Core Bond Fund
April 30, 2009
In connection with the events described above, various parties have filed suit against certain funds, the Trustees of the Columbia Funds, FleetBoston Financial Corporation and its affiliated entities and/or Bank of America and its affiliated entities.
On February 20, 2004, the Judicial Panel on Multidistrict Litigation transferred these cases and cases against other mutual fund companies based on similar allegations to the United States District Court in Maryland for consolidated or coordinated pretrial proceedings (the “MDL”). Subsequently, additional related cases were transferred to the MDL. On September 29, 2004, the plaintiffs in the MDL filed amended and consolidated complaints. One of these amended complaints is a putative class action that includes claims under the federal securities laws and state common law, and that names Columbia Management Advisors, Inc. (which has since merged into Banc of America Capital Management, LLC (now named Columbia Management Advisors, LLC)) (“Columbia”), Columbia Funds Distributor, Inc. (now named Columbia Management Distributors, Inc.) (the “Distributor”), the Trustees of the Columbia Funds, Bank of America Corporation and others as defendants. Another of the amended complaints is a derivative action purportedly on behalf of the Columbia Funds that asserts claims under federal securities laws and state common law.
On February 25, 2005, Columbia and other defendants filed motions to dismiss the claims in the pending cases. On March 1, 2006, for reasons stated in the court’s memoranda dated November 3, 2005, the United States District Court for the District of Maryland granted in part and denied in part the defendants’ motions to dismiss. The court dismissed all of the class action claims pending against the Columbia Funds Trusts. As to Columbia and the Distributor, the claims under the Securities Act of 1933, the claims under Sections 34(b) and 36(a) of the Investment Company Act of 1940 (“ICA”) and the state law claims were dismissed. The claims under Sections 10(b) and 20(a) of the Securities Exchange Act of 1934 and claims under Section 36(b) of the ICA were not dismissed.
On March 21, 2005, a purported class action was filed in Massachusetts state court alleging that certain conduct, including market timing, entitled Class B shareholders in certain Columbia Funds to an exemption from contingent deferred sales charges upon early redemption (the “CDSC Lawsuit”). The CDSC Lawsuit was removed to federal court in Massachusetts and transferred to the MDL.
On September 14, 2007, the plaintiffs and the Columbia defendants named in the MDL, including the Columbia Funds, entered into a stipulation of settlement with respect to all Columbia-related claims in the MDL described above, including the CDSC Lawsuit. The settlement is subject to court approval.
36
Report of Independent Registered Public Accounting Firm
To the Trustees of Columbia Funds Series Trust I and Shareholders of Columbia Core Bond Fund
In our opinion, the accompanying statement of assets and liabilities, including the portfolio of investments, and the related statements of operations and of changes in net assets and the financial highlights present fairly, in all material respects, the financial position of the Columbia Core Bond Fund (the “Fund”) (a series of Columbia Funds Series Trust I) at April 30, 2009, the results of its operations for the year then ended, the changes in its net assets for each of the two years in the period then ended and the financial highlights for each of the five years in the period then ended, in conformity with accounting principles generally accepted in the United States of America. These financial statements and financial highlights (hereafter referred to as “financial statements”) are the responsibility of the Fund’s management. Our responsibility is to express an opinion on these financial statements based on our audits. We conducted our audits of these financial statements in accordance with the standards of the Public Company Accounting Oversight Board (United States). Those standards require that we plan and perform the audit to obtain reasonable assurance about whether the financial statements are free of material misstatement. An audit includes examining, on a test basis, evidence supporting the amounts and disclosures in the financial statements, assessing the accounting principles used and significant estimates made by management, and evaluating the overall financial statement presentation. We believe that our audits, which included confirmation of securities at April 30, 2009 by correspondence with the custodian and brokers, provide a reasonable basis for our opinion.
PricewaterhouseCoopers LLP
Boston, Massachusetts
June 19, 2009
37
Fund Governance
The Trustees serve terms of indefinite duration. The names, addresses and ages of the Trustees and officers of the Funds in Columbia Funds Series Trust I, the year each was first elected or appointed to office, their principal business occupations during at least the last five years, the number of Funds overseen by each Trustee and other directorships they hold are shown below. Each officer listed below serves as an officer of each Fund in the Columbia Funds Complex.
Independent Trustees
| | |
Name, Address and Year of Birth,
Position with Funds, Year First
Elected or Appointed to Office | | Principal Occupation(s) During Past Five Years, Number of Funds in Columbia Funds
Complex Overseen by Trustee, Other Directorships Held |
| |
| John D. Collins (Born 1938) | | |
c/o Columbia Management Advisors, LLC One Financial Center Boston, MA 02111 Trustee (since 2007) | | Retired. Consultant, KPMG, LLP (accounting and tax firm) from July 1999 to June 2000; Partner, KPMG, LLP from March 1962 to June 1999. Oversees 79; Mrs. Fields Famous Brands LLC (consumer products); Suburban Propane Partners, L.P.; and Montpelier Re (underwriting firm) |
| |
| Rodman L. Drake (Born 1943) | | |
c/o Columbia Management Advisors, LLC One Financial Center Boston, MA 02111 Trustee (since 2007) | | Co-Founder of Baringo Capital LLC (private equity) since 2002; President, Continuation Investments Group, Inc. from 1997 to 2001. Oversees 79; Jackson Hewitt Tax Service Inc. (tax preparation services); Crystal Capital River Inc. (real estate investment trust); Student Loan Corporation (student loan provider); Celgene Corporation (global biotechnology company); Apex Silver Mines Ltd. (mining); and Helios Total Return Fund, Inc. and Helios Strategic Mortgage Income Fund, Inc. (exchange-traded funds) |
| |
| Douglas A. Hacker (Born 1955) | | |
c/o Columbia Management Advisors, LLC One Financial Center Boston, MA 02111 Trustee (since 1996) | | Independent business executive since May 2006; Executive Vice President–Strategy of United Airlines (airline) from December 2002 to May 2006; President of UAL Loyalty Services (airline marketing company) from September 2001 to December 2002; Executive Vice President and Chief Financial Officer of United Airlines from July 1999 to September 2001. Oversees 79; Nash Finch Company (food distributor); Aircastle Limited (aircraft leasing) |
| |
| Janet Langford Kelly (Born 1957) | | |
c/o Columbia Management Advisors, LLC One Financial Center Boston, MA 02111 Trustee (since 1996) | | Senior Vice President, General Counsel and Corporate Secretary, ConocoPhillips (integrated energy company) since September 2007; Deputy General Counsel–Corporate Legal Services, ConocoPhillips from August 2006 to August 2007; Partner, Zelle, Hofmann, Voelbel, Mason & Gette LLP (law firm) from March 2005 to July 2006; Adjunct Professor of Law, Northwestern University, from September 2004 to June 2006; Director, UAL Corporation (airline) from February 2006 to July 2006; Oversees 79; None |
38
Fund Governance (continued)
Independent Trustees (continued)
| | |
Name, Address and Year of Birth,
Position with Funds, Year First
Elected or Appointed to Office | | Principal Occupation(s) During Past Five Years, Number of Funds in Columbia Funds
Complex Overseen by Trustee, Other Directorships Held |
| |
| Charles R. Nelson (Born 1942) | | |
c/o Columbia Management Advisors, LLC One Financial Center Boston, MA 02111 Trustee (since 1981) | | Professor of Economics, University of Washington, since January 1976; Ford and Louisa Van Voorhis Professor of Political Economy, University of Washington, since September 1993; Adjunct Professor of Statistics, University of Washington, since September 1980; Associate Editor, Journal of Money Credit and Banking from 1993 to 2008; Consultant on econometric and statistical matters. Oversees 79; None |
| |
| John J. Neuhauser (Born 1943) | | |
c/o Columbia Management Advisors, LLC One Financial Center Boston, MA 02111 Trustee (since 1985) | | President, Saint Michael’s College, since August 2007; University Professor, Boston College from November 2005 to August 2007; Academic Vice President and Dean of Faculties, Boston College from August 1999 to October 2005. Oversees 79; Liberty All-Star Equity Fund and Liberty All-Star Growth Fund, Inc. (closed-end funds) |
| |
| Jonathan Piel (Born 1938) | | |
c/o Columbia Management Advisors, LLC One Financial Center Boston, MA 02111 Trustee (since 2007) | | Cable television producer and website designer; The Editor, Scientific American from 1984 to 1994; Vice President, Scientific American, Inc., from 1984 to 1994; Member, Advisory Board, Stone Age Institute, Bloomington, Indiana (research institute that explores the effect of technology on human evolution); Member, Board of Directors of the National Institute of Social Sciences, New York City; Member, Board of Trustees of the William Alanson White Institute, New York City (institution for training psychoanalysts) and Member, Advisory Board, Mount Sinai Children’s Environmental Health Center, New York; Oversees 79; None |
| |
| Patrick J. Simpson (Born 1944) | | |
c/o Columbia Management Advisors, LLC One Financial Center Boston, MA 02111 Trustee (since 2000) | | Partner, Perkins Coie LLP (law firm). Oversees 79; None |
| |
| Thomas C. Theobald (Born 1937) | | |
c/o Columbia Management Advisors, LLC One Financial Center Boston, MA 02111 Trustee and Chairman of the Board (since 1996) | | Partner and Senior Advisor, Chicago Growth Partners (private equity investing) since September 2004; Managing Director, William Blair Capital Partners (private equity investing) from September 1994 to September 2004. Oversees 79; Anixter International (network support equipment distributor); Ventas, Inc. (real estate investment trust); Jones Lang LaSalle (real estate management services); Ambac Financial Group (financial guaranty insurance) |
| |
| Anne-Lee Verville (Born 1945) | | |
c/o Columbia Management Advisors, LLC One Financial Center Boston, MA 02111 Trustee (since 1998) | | Retired since 1997 (formerly General Manager–Global Education Industry (from 1994 to 1997), President–Application Systems Division (from 1991 to 1994), Chief Financial Officer–US Marketing & Services (from 1988 to 1991), and Chief Information Officer (from 1987 to 1988), IBM Corporation (computer and technology)). Oversees 79; None |
39
Fund Governance (continued)
Interested Trustee
| | |
Name, Address and Year of Birth,
Position with Funds, Year First
Elected or Appointed to Office | | Principal Occupation(s) During Past Five Years, Number of Funds in Columbia Funds
Complex Overseen by Trustee, Other Directorships Held |
| |
| William E. Mayer1 (Born 1940) | | |
c/o Columbia Management Advisors, LLC One Financial Center Boston, MA 02111 Trustee (since 1994) | | Partner, Park Avenue Equity Partners (private equity) since February 1999; Dean and Professor, College of Business, University of Maryland from 1992 to 1997. Oversees 79, Lee Enterprises (print media), WR Hambrecht + Co. (financial service provider); BlackRock Kelso Capital Corporation (investment company) |
1 | The Funds currently treat Mr. Mayer as an “interested person” (as defined in the Investment Company Act of 1940) by reason of his affiliation with WR Hambrecht + Co., a registered broker/dealer that may execute portfolio transactions for or engage in principal transactions with the Funds or other funds or accounts advised/managed by the Advisor or other Bank of America affiliates. |
The Statement of Additional Information includes additional information about the Trustees of the Funds and is available, without charge, upon request by calling 1-800-345-6611.
40
Fund Governance (continued)
Officers
| | |
Name, Address and Year of Birth,
Position with Columbia Funds, Year
First Elected or Appointed to Office | | Principal Occupation(s) During Past Five Years |
| |
| J. Kevin Connaughton (Born 1964) | | |
One Financial Center Boston, MA 02111 President (since 2009) | | Managing Director of Columbia Management Advisors, LLC since December 2004; Senior Vice President and Chief Financial Officer–Columbia Funds, from June 2008 to January 2009; Treasurer–Columbia Funds, from October 2003 to May 2008; Treasurer–the Liberty Funds, Stein Roe Funds and Liberty All-Star Funds, December 2000–December 2006; Senior Vice President–Columbia Management Advisors, LLC, from April 2003 to December 2004; President–Columbia Funds, Liberty Funds and Stein Roe Funds, February 2004 to October 2004; Treasurer–Galaxy Funds, September 2002 to December 2005; Treasurer, December 2002 to December 2004, and President, February 2004 to December 2004–Columbia Management Multi-Strategy Hedge Fund, LLC; and a senior officer of various other Bank of America-affiliated entities, including other registered and unregistered funds. |
| |
| James R. Bordewick, Jr. (Born 1959) | | |
One Financial Center Boston, MA 02111 Senior Vice President, Secretary and Chief Legal Officer (since 2006) | | Associate General Counsel, Bank of America since April 2005; Senior Vice President and Associate General Counsel, MFS Investment Management (investment management) prior to April 2005. |
| |
| Linda J. Wondrack (Born 1964) | | |
One Financial Center Boston, MA 02111 Senior Vice President and Chief Compliance Officer (since 2007) | | Director (Columbia Management Group LLC and Investment Product Group Compliance), Bank of America since June 2005; Director of Corporate Compliance and Conflicts Officer, MFS Investment Management (investment management), August 2004 to May 2005; Managing Director, Deutsche Asset Management (investment management) prior to August 2004. |
| |
| Michael G. Clarke (Born 1969) | | |
One Financial Center Boston, MA 02111 Senior Vice President and Chief Financial Officer (since 2009) | | Director of Fund Administration of the Advisor since January 2006; Managing Director of the Advisor September 2004 to December 2005; Vice President Fund Administration June 2002 to September 2004. |
| |
| Jeffrey R. Coleman (Born 1969) | | |
One Financial Center Boston, MA 02111 Deputy Treasurer (since 2006) | | Director of Fund Administration of the Advisor since January 2006; Fund Controller of the Advisor from October 2004 to January 2006; Vice President of CDC IXIS Asset Management Services, Inc. (investment management) from August 2000 to September 2004. |
| |
| Joseph F. DiMaria (Born 1968) | | |
One Financial Center Boston, MA 02111 Chief Accounting Officer and Treasurer (since 2009) | | Director of Fund Administration of the Advisor since January 2006; Head of Tax/Compliance and Assistant Treasurer of the Advisor from November 2004 to December 2005; Director of Trustee Administration (Sarbanes-Oxley) of the Advisor from May 2003 to October 2004. |
41
Fund Governance (continued)
Officers (continued)
| | |
Name, Address and Year of Birth,
Position with Columbia Funds, Year
First Elected or Appointed to Office | | Principal Occupation(s) During Past Five Years |
| |
| Julian Quero (Born 1967) | | |
One Financial Center Boston, MA 02111 Deputy Treasurer (since 2008) | | Senior Tax Manager of the Advisor since August 2006; Senior Compliance Manager of the Advisor from April 2002 to August 2006. |
| |
| Barry S. Vallan (Born 1969) | | |
One Financial Center Boston, MA 02111 Controller (since 2006) | | Vice President–Fund Treasury of the Advisor since October 2004; Vice President–Trustee Reporting of the Advisor from April 2002 to October 2004 |
42
[THIS PAGE INTENTIONALLY LEFT BLANK]
43
[THIS PAGE INTENTIONALLY LEFT BLANK]
44
Important Information About This Report
Transfer Agent
Columbia Management Services, Inc.
P.O. Box 8081
Boston, MA 02266-8081
1-800-345-6611
Distributor
Columbia Management
Distributors, Inc.
One Financial Center
Boston, MA 02111
Investment Advisor
Columbia Management Advisors, LLC
100 Federal Street
Boston, MA 02110
The fund mails one shareholder report to each shareholder address. If you would like more than one report, please call shareholder services at 1-800-345-6611 and additional reports will be sent to you. This report has been prepared for shareholders of Columbia Core Bond Fund.
A description of the policies and procedures that the fund uses to determine how to vote proxies and a copy of the fund’s voting records are available (i) at www.columbiamanagement.com; (ii) on the Securities and Exchange Commission’s website at www.sec.gov, and (iii) without charge, upon request, by calling 1-800-368-0346. Information regarding how the fund voted proxies relating to portfolio securities during the 12-month period ended June 30 is available from the SEC’s website. Information regarding how the fund voted proxies relating to portfolio securities is also available from the fund’s website, columbiamanagement.com.
The fund files a complete schedule of portfolio holdings with the SEC for the first and third quarters of each fiscal year on Form N-Q. The fund’s Form N-Q is available on the SEC’s website at www.sec.gov and may be reviewed and copied at the SEC’s Public Reference Room in Washington, D.C. Information on the operation of the Public Reference Room may be obtained by calling 1-800-SEC-0330.
Please read and consider the investment objectives, risks, charges and expenses for any fund carefully before investing. For a prospectus which contains this and other important information about the fund, contact your Columbia Management representative or financial advisor or go to www.columbiamanagement.com.
Columbia Management Group, LLC (“Columbia Management”) is the investment management division of Bank of America Corporation. Columbia Management entities furnish investment management services and products for institutional and individual investors. Columbia Funds are distributed by Columbia Management Distributors, Inc., member of FINRA, SIPC, part of Columbia Management and an affiliate of Bank of America Corporation.
45

One Financial Center
Boston, MA 02111-2621
Columbia Core Bond Fund
Annual Report, April 30, 2009
©2009 Columbia Management Distributors, Inc.
One Financial Center, Boston, MA 02111-2621
800.345.6611 www.columbiafunds.com
SHC-42/12033-0409 (06/09) 09/80910
| | (a) | The registrant has, as of the end of the period covered by this report, adopted a code of ethics that applies to the registrant’s principal executive officer, principal financial officer, principal accounting officer or controller, or persons performing similar functions, regardless of whether these individuals are employed by the registrant or a third party. |
| | (b) | During the period covered by this report, there were not any amendments to a provision of the code of ethics adopted in 2(a) above. |
| | (c) | During the period covered by this report, there were no waivers, including any implicit waivers, from a provision of the code of ethics described in 2(a) above that relates to one or more of the items set forth in paragraph (b) of this item’s instructions. |
| Item 3. | Audit Committee Financial Expert. |
The registrant’s Board of Trustees has determined that Douglas A. Hacker, John D. Collins and Anne-Lee Verville, each of whom are members of the registrant’s Board of Trustees and Audit Committee, each qualify as an audit committee financial expert. Mr. Hacker, Mr. Collins and Ms. Verville are each independent trustees, as defined in paragraph (a)(2) of this item’s instructions.
| Item 4. | Principal Accountant Fees and Services. |
Fee information below is disclosed for the one series of the registrant whose report to stockholders is included in this annual filing.
(a) Audit Fees. Aggregate Audit Fees billed by the principal accountant for professional services rendered during the fiscal years ended April 30, 2009 and April 30, 2008 are approximately as follows:
Audit Fees include amounts related to the audit of the registrant’s annual financial statements or services that are normally provided by the accountant in connection with statutory and regulatory filings or engagements for those fiscal years.
(b) Audit-Related Fees. Aggregate Audit-Related Fees billed to the registrant by the principal accountant for professional services rendered during the fiscal years ended April 30, 2009 and April 30, 2008 are approximately as follows:
Audit-Related Fees include amounts for assurance and related services by the principal accountant that are reasonably related to the performance of the audit of the registrant’s financial statements and are not reported in Audit Fees above. In both fiscal years 2009 and 2008, Audit-Related Fees consist of agreed-upon procedures performed for semi-annual shareholder reports.
During the fiscal years ended April 30, 2009 and April 30, 2008, there were no Audit-Related Fees billed by the registrant’s principal accountant to the registrant’s investment adviser (not including any sub-adviser whose role is primarily portfolio management and is subcontracted with or overseen by another investment adviser) and any entity controlling, controlled by, or under common control with the adviser that provides ongoing services to the registrant for an engagement that related directly to the operations and financial reporting of the registrant.
(c) Tax Fees. Aggregate Tax Fees billed by the principal accountant to the registrant for professional services rendered during the fiscal years ended April 30, 2009 and April 30, 2008 are approximately as follows:
Tax Fees include amounts for the review of annual tax returns, the review of required shareholder distribution calculations and typically include amounts for professional services by the principal accountant for tax compliance, tax advice and tax planning.
During the fiscal years ended April 30, 2009 and April 30, 2008, there were no Tax Fees billed by the registrant’s principal accountant to the registrant’s investment adviser (not including any sub-adviser whose role is primarily portfolio management and is subcontracted with or overseen by another investment adviser) and any entity controlling, controlled by, or under common control with the adviser that provides ongoing services to the registrant for an engagement that related directly to the operations and financial reporting of the registrant.
(d) All Other Fees. Aggregate All Other Fees billed by the principal accountant to the registrant for professional services rendered during the fiscal years ended April 30, 2009 and April 30, 2008 are approximately as follows:
All Other Fees include amounts for products and services provided by the principal accountant, other than the services reported in paragraphs (a) through (c) above.
Aggregate All Other Fees billed by the registrant’s principal accountant to the registrant’s investment adviser (not including any sub-adviser whose role is primarily portfolio management and is subcontracted with or overseen by another investment adviser) and any entity controlling, controlled by, or under common control with the adviser that provides ongoing services to the registrant for an engagement that related directly to the operations and financial reporting of the registrant during the fiscal years ended April 30, 2009 and April 30, 2008 are approximately as follows:
| | |
2009 | | 2008 |
$636,800 | | $1,210,800 |
In both fiscal years 2009 and 2008, All Other Fees consist of fees billed for internal control examinations of the registrant’s transfer agent and investment advisor.
(e)(1) Audit Committee Pre-Approval Policies and Procedures
The registrant’s Audit Committee is required to pre-approve the engagement of the registrant’s independent accountants to provide audit and non-audit services to the registrant and non-audit services to its investment adviser (not including any sub-adviser whose role is primarily portfolio management and is subcontracted with or overseen by another investment adviser) or any entity controlling, controlled by or under common control with such investment adviser that provides ongoing services to the registrant (“Adviser Affiliates”), if the engagement relates directly to the operations and financial reporting of the registrant.
The Audit Committee has adopted a Policy for Engagement of Independent Accountants for Audit and Non-Audit Services (“Policy”). The Policy sets forth the understanding of the Audit Committee regarding the engagement of the registrant’s independent accountants to provide (i) audit and permissible audit-related, tax and other services to the registrant (collectively “Fund Services”); (ii) non-audit services to the registrant’s investment adviser (not including any sub-adviser whose role is primarily portfolio management and is subcontracted with or overseen by another investment adviser) and Adviser Affiliates, if the engagement relates directly to the operations or financial reporting of a Fund (collectively “Fund-related Adviser Services”); and (iii) certain other audit and non-audit services to the registrant’s investment adviser (not including any sub-adviser whose role is primarily portfolio management and is
subcontracted with or overseen by another investment adviser) and Adviser Affiliates. Unless a type of service receives general pre-approval under the Policy, it requires specific pre-approval by the Audit Committee if it is to be provided by the independent accountants. Pre-approval of non-audit services to the registrant, the registrant’s investment adviser (not including any sub-adviser whose role is primarily portfolio management and is subcontracted with or overseen by another investment adviser) and Adviser Affiliates may be waived provided that the “de minimis” requirements set forth under paragraph (c)(7)(i)(C) of Rule 2-01 of Regulation S-X are met.
Under the Policy, the Audit Committee may delegate pre-approval authority to any pre-designated member or members who are Independent Trustees/Directors. The member(s) to whom such authority is delegated must report, for informational purposes only, any pre-approval decisions to the Audit Committee at its next regular meeting. The Audit Committee’s responsibilities with respect to the pre-approval of services performed by the independent accountants may not be delegated to management.
The Policy requires the Fund Treasurer and/or Director of Board Administration to submit to the Audit Committee, on an annual basis, a schedule of the types of services that are subject to general pre-approval. The schedule(s) provide a description of each type of service that is subject to general pre-approval and, where possible, will provide estimated fee caps for each instance of providing each service. The Audit Committees will review and approve the types of services and review the projected fees for the next fiscal year and may add to, or subtract from, the list of general pre-approved services from time to time based on subsequent determinations. That approval acknowledges that the Audit Committee is in agreement with the specific types of services that the independent accountants will be permitted to perform.
The Fund Treasurer and/or Director of Board Administration shall report to the Audit Committee at each of its regular meetings regarding all Fund Services or Fund-related Adviser Services initiated since the last such report was rendered, including a general description of the services, actual billed and projected fees, and the means by which such Fund Services or Fund-related Adviser Services were pre-approved by the Audit Committee.
*****
(e)(2) The percentage of services described in paragraphs (b) through (d) of this Item approved pursuant to the “de minimis” exception under paragraph (c)(7)(i)(C) of Rule 2-01 of Regulation S-X during both fiscal years ended April 30, 2009 and April 30, 2008 was zero.
(f) Not applicable.
(g) The aggregate non-audit fees billed by the registrant’s accountant for services rendered to the registrant, and rendered to the registrant’s investment adviser (not including any sub-adviser whose role is primarily portfolio management and is
subcontracted with or overseen by another investment adviser), and any entity controlling, controlled by, or under common control with the adviser that provides ongoing services to the registrant for the fiscal years ended April 30, 2009 and April 30, 2008 are approximately as follows:
| | |
2009 | | 2008 |
$646,500 | | $1,228,000 |
(h) The registrant’s Audit Committee of the Board of Directors has considered whether the provision of non-audit services that were rendered to the registrant’s adviser (not including any sub-adviser whose role is primarily portfolio management and is subcontracted with or overseen by another investment adviser), and any entity controlling, controlled by, or under common control with the investment adviser that provides ongoing services to the registrant that were not pre-approved pursuant to paragraph (c)(7)(ii) of Rule 2-01 of Regulation S-X, is compatible with maintaining the principal accountant’s independence.
| Item 5. | Audit Committee of Listed Registrants. |
Not applicable.
| | (a) | The registrant’s “Schedule I – Investments in securities of unaffiliated issuers” (as set forth in 17 CFR 210.12-12) is included in Item 1 of this Form N-CSR. |
| Item 7. | Disclosure of Proxy Voting Policies and Procedures for Closed-End Management Investment Companies. |
Not applicable.
| Item 8. | Portfolio Managers of Closed-End Management Investment Companies. |
Not applicable.
| Item 9. | Purchases of Equity Securities by Closed-End Management Investment Company and Affiliated Purchasers. |
Not applicable.
| Item 10. | Submission of Matters to a Vote of Security Holders. |
There have not been any material changes to the procedures by which shareholders may recommend nominees to the registrant’s board of directors, since those procedures were last disclosed in response to requirements of Item 407(c)(2)(iv) of Regulation S-K (as required by Item 22(b)(15) of Schedule 14A) or this Item.
| Item 11. | Controls and Procedures. |
| | (a) | The registrant’s principal executive officer and principal financial officers, based on their evaluation of the registrant’s disclosure controls and procedures as of a date within 90 days of the filing of this report, have concluded that such controls and procedures are adequately designed to ensure that information required to be disclosed by the registrant in Form N-CSR is accumulated and communicated to the registrant’s management, including the principal executive officer and principal financial officer, or persons performing similar functions, as appropriate to allow timely decisions regarding required disclosure. |
| | (b) | There was no change in the registrant’s internal control over financial reporting that occurred during the registrant’s second fiscal quarter of the period covered by this report that has materially affected, or is reasonably likely to materially affect, the registrant’s internal control over financial reporting. |
(a)(1) Code of ethics required to be disclosed under Item 2 of Form N-CSR attached hereto as Exhibit 99.CODE ETH.
(a)(2) Certifications pursuant to Rule 30a-2(a) under the Investment Company Act of 1940 (17 CFR 270.30a-2(a)) attached hereto as Exhibit 99.CERT.
(a)(3) Not applicable.
(b) Certification pursuant to Rule 30a-2(b) under the Investment Company Act of 1940 (17 CFR 270.30a-2(b)) attached hereto as Exhibit 99.906CERT.
SIGNATURES
Pursuant to the requirements of the Securities Exchange Act of 1934 and the Investment Company Act of 1940, the registrant has duly caused this report to be signed on its behalf by the undersigned, thereunto duly authorized.
| | | | |
| (registrant) | | Columbia Funds Series Trust I | | |
| | |
| By (Signature and Title) | | /s/ J. Kevin Connaughton | | |
| | J. Kevin Connaughton, President | | |
| | |
| Date | | June 19, 2009 | | |
Pursuant to the requirements of the Securities Exchange Act of 1934 and the Investment Company Act of 1940, this report has been signed below by the following persons on behalf of the registrant and in the capacities and on the dates indicated.
| | | | |
| By (Signature and Title) | | /s/ J. Kevin Connaughton | | |
| | J. Kevin Connaughton, President | | |
| | |
| Date | | June 19, 2009 | | |
| | |
| By (Signature and Title) | | /s/ Michael G. Clarke | | |
| | Michael G. Clarke, Chief Financial Officer | | |
| | |
| Date | | June 19, 2009 | | |