UNITED STATES
SECURITIES AND EXCHANGE COMMISSION
Washington, D.C. 20549
FORM N-CSR
CERTIFIED SHAREHOLDER REPORT OF REGISTERED
MANAGEMENT INVESTMENT COMPANIES
Investment Company Act file number | 811-4367 |
|
Columbia Funds Series Trust I |
(Exact name of registrant as specified in charter) |
|
One Financial Center, Boston, Massachusetts | | 02111 |
(Address of principal executive offices) | | (Zip code) |
|
James R. Bordewick, Jr., Esq. Columbia Management Advisors, LLC One Financial Center Boston, MA 02111 |
(Name and address of agent for service) |
|
Registrant’s telephone number, including area code: | 1-617-426-3750 | |
|
Date of fiscal year end: | August 31 | |
|
Date of reporting period: | August 31, 2008 | |
| | | | | | | | |
Form N-CSR is to be used by management investment companies to file reports with the Commission not later than 10 days after the transmission to stockholders of any report that is required to be transmitted to stockholders under Rule 30e-1 under the Investment Company Act of 1940 (17 CFR 270.30e-1). The Commission may use the information provided on Form N-CSR in its regulatory, disclosure review, inspection, and policymaking roles.
A registrant is required to disclose the information specified by Form N-CSR, and the Commission will make this information public. A registrant is not required to respond to the collection of information contained in Form N-CSR unless the Form displays a currently valid Office of Management and Budget (“OMB”) control number. Please direct comments concerning the accuracy of the information collection burden estimate and any suggestions for reducing the burden to Secretary, Securities and Exchange Commission, 450 Fifth Street, NW, Washington, DC 20549-0609. The OMB has reviewed this collection of information under the clearance requirements of 44 U.S.C. § 3507.
Item 1. Reports to Stockholders.
Columbia Management®
Annual Report
August 31, 2008
Columbia Funds
g Columbia International Stock Fund
g Columbia Mid Cap Growth Fund
g Columbia Small Cap Growth Fund I
g Columbia Real Estate Equity Fund
g Columbia Technology Fund
g Columbia Strategic Investor Fund
g Columbia Balanced Fund
g Columbia Oregon Intermediate Municipal Bond Fund
g Columbia Conservative High Yield Fund
| NOT FDIC INSURED | | May Lose Value | |
|
| NOT BANK ISSUED | | No Bank Guarantee | |
|
Table of Contents
| Economic Update | | | 1 | | |
|
| Columbia International Stock Fund | | | 3 | | |
|
| Columbia Mid Cap Growth Fund | | | 8 | | |
|
| Columbia Small Cap Growth Fund I | | | 13 | | |
|
| Columbia Real Estate Equity Fund | | | 18 | | |
|
| Columbia Technology Fund | | | 23 | | |
|
| Columbia Strategic Investor Fund | | | 28 | | |
|
| Columbia Balanced Fund | | | 33 | | |
|
Columbia Oregon Intermediate
Municipal Bond Fund | | | 38 | | |
|
Columbia Conservative
High Yield Fund | | | 43 | | |
|
| Financial Statements | | | | | |
|
| Investment Portfolios | | | 48 | | |
|
Statements of Assets and
Liabilities | | | 96 | | |
|
| Statements of Operations | | | 100 | | |
|
Statements of Changes in
Net Assets | | | 104 | | |
|
| Financial Highlights | | | 117 | | |
|
| Notes to Financial Statements | | | 155 | | |
|
| Report of Independent Registered Public Accounting Firm | | | 174 | | |
|
| Federal Income Tax Information | | | 175 | | |
|
| Fund Governance | | | 176 | | |
|
Important Information About
This Report | | | 181 | | |
|
The views expressed in this report reflect the current views of the respective parties. These views are not guarantees of future performance and involve certain risks, uncertainties and assumptions that are difficult to predict, so actual outcomes and results may differ significantly from the views expressed. These views are subject to change at any time based upon economic, market or other conditions and the respective parties disclaim any responsibility to update such views. These views may not be relied on as investment advice and, because investment decisions for a Columbia Fund are based on numerous factors, may not be relied on as an indication of trading intent on behalf of any particular Columbia Fund. References to specific securities should not be construed as a recommendation or investment advice.
President's Message

Dear Shareholder:
We are pleased to provide this shareholder report for your Columbia fund and hope you will find the portfolio management details, discussions and performance information helpful in monitoring your investments. As we've seen this past year, the financial markets can be quite volatile, with significant short-term price fluctuations. It's important to keep these ups and downs in perspective, particularly in light of your long-term investment strategy.
Staying the course with your long-term strategy typically involves riding out short-term price fluctuations, though we recognize that at times this can be tough. To support your efforts and give you the information you need to make prudent decisions, Columbia Management offers several valuable online resources. We encourage you to visit www.columbiamanagement.com/investor, where you can receive the most up-to-date information, including:
g Daily pricing and performance. View pricing and performance from a link in Fund Tracker on the homepage. This listing of funds is updated nightly with the current net asset value and the amount and percentage change from the prior day.
g News & Commentary. This tab provides links to quarterly fund commentaries and information from our investment strategies group, including trends in the economy and market impact.
If you would like more details on individual funds, select a fund from the dropdown menu on the top right side of the homepage for access to:
g Monthly and quarterly performance information.
g Portfolio holdings. Full holdings are updated monthly for money market funds except for Columbia Cash Reserves, Columbia Money Market Reserves and Columbia Daily Cash Reserves which are updated daily, monthly for equity funds and quarterly for most other funds.
g Quarterly fact sheets. Accessible from the Literature tab in each fund page.
By registering on the site, you'll receive secured, 24-hour access to*:
g Mutual fund account details with balances, dividend and transaction information.
g Fund Tracker to customize your homepage with current net asset values for the funds that interest you
g On-line transactions including purchases, exchanges and redemptions.
g Account maintenance for updating your address and dividend payment options.
g Electronic delivery of prospectuses and shareholder reports.
I encourage you to visit our website for access to the product information and tools described above. These valuable online resources can help you monitor your investments and provide direct access to your account. All of these tools, and more, can be found on www.columbiamanagement.com/investor.
While your financial advisor is a great resource for investment guidance, you can also access our website or call our service representatives at 800.345.6611 for additional assistance. We thank you for investing with Columbia Management and look forward to helping with your ongoing investment needs.
Sincerely,

Christopher L. Wilson
President, Columbia Funds
*Some restrictions apply. Shareholders who purchase shares through certain third-party organizations may not have the ability to register for online access.
Economic Update – Columbia Funds
The pace of economic growth slowed during the 12-month period that began September 1, 2007 and ended August 31, 2008, as a multitude of factors weighed on consumers and businesses alike. However, the economy stayed comfortably clear of a widely-anticipated recession, with an uptick in growth at the end of the period. The most severe housing downturn in decades continued to take a toll on growth. Inventories of homes for sale rose, home prices declined and tighter credit standards, the result of continued turmoil in the subprime mortgage market, made it more difficult for homebuyers to qualify for loans. Food prices rose, raising concerns about inflation, and energy prices soared to record highs before backing down sharply in the last month of the period. Consumer confidence declined sharply through June, then improved modestly in August and September, according to The Conference Board, which tracks consumer attitudes on a monthl y basis.
As growth weakened near the end of 2007, businesses began to pull back on hiring, which further dimmed the outlook for consumers. More than 440,000 job losses were reported in the first eight months of 2008, and the unemployment rate spiked to 6.1%, with the biggest jump coming in August. Manufacturing activity slowed, one of the last major indicators to turn negative. Federal tax rebates, which began to arrive in May, helped bolster consumer spending until the end of the period. However, spending declined in July and August, continuing concerns that the economy is headed for recession.
In an effort to inspire confidence in the capital markets, loosen the reins on credit and shore up economic growth, the Federal Reserve Board (the Fed) brought a key short-term rate—the federal funds rate—down from 5.25% to 2.0% during the 12-month period.1 After seven rate cuts, the Fed acknowledged that downside risks to growth remained but also that the inflation outlook was a concern and that it would monitor inflation developments carefully. Continued strains on the credit markets present the Fed with some tough choices, but it held the line on any further rate cuts from April through the end of the period.
Stocks retreat as economic storm clouds gather
Against a shifting economic backdrop, the U.S. stock market lost 11.14% for the 12-month period, as measured by the S&P 500 Index.2 Small- and mid- cap stocks held up better than large-cap stocks, as measured by their respective Russell indices.3 Growth stocks also held up better than value stocks by a significant margin. As the dollar rebounded modestly against the euro, investors reaped even lower returns from investments outside the U.S. The MSCI EAFE Index4, a broad gauge of stock market
1On October 8, 2008, the Federal Reserve Board Open Market Committee reduced the federal funds rate to 1.50%.
2The Standard & Poor's (S&P) 500 Index tracks the performance of 500 widely held, large-capitalization US stocks. Indices are not investments, do not incur fees or expenses and are not professionally managed. It is not possible to invest directly in an index. Securities in the fund may not match those in an index.
3The Russell 1000 Index measures the performance of 1,000 of the largest US companies, based on market capitalization. The Russell Midcap Index measures the performance of the 800 smallest companies in the Russell 1000 Index, as ranked by total market capitalization. The Russell 2000 Index measures the performance of the 2,000 smallest of the 3,000 largest U.S. companies based on market capitalization. Indices are not investments, do not incur fees or expenses and are not professionally managed. It is not possible to invest directly in an index. Securities in the fund may not match those in an index.
4The Morgan Stanley Capital International (MSCI) Europe, Australasia, Far East (EAFE) Index is a free float-adjusted market capitalization index that is designed to measure developed market equity performance excluding the US and Canada. Indices are not investments, do not incur fees or expenses and are not professionally managed. It is not possible to invest directly in an index. Securities in the fund may not match those in an index.
Summary
For the 12-month period that ended August 31, 2008
g The broad U.S. stock market, as measured by the S&P 500 Index, returned negative 11.14%. Stock markets outside the United States returned negative 14.41%, as measured (in U.S. dollars) by the MSCI EAFE Index.
| S&P Index | | MSCI Index | |
|
 | |  | |
|
g Despite volatility in many segments of the bond market, the Lehman Brothers U.S. Aggregate Bond Index delivered a solid return. High-yield bonds lost ground, as measured by the Merrill Lynch U.S. High Yield Cash Pay Index.
Lehman
Index | | Merrill
Lynch Index | |
|
 | |  | |
|
The Lehman Brothers U.S. Aggregate Bond Index is a market value-weighted index that tracks the daily price, coupon, pay-downs and total return performance of fixed-rate, publicly placed, dollar-denominated and non-convertible investment grade debt issues with at least $250 million par amount outstanding and with at least one year to final maturity.
The Merrill Lynch U.S. High Yield, Cash Pay Index tracks the performance of non-investment-grade corporate bonds.
1
Economic Update (continued) – Columbia Funds
performance in foreign developed markets, lost 14.41% (in U.S. dollars) for the period. Emerging stock markets, which have had a strong run over the past several years, were also caught in the downdraft. The MSCI Emerging Markets Index5 returned negative 9.83% (in U.S. dollars).
Bonds delivered solid gains
The U.S. bond market seesawed during the 12-month period but delivered a solid gain as investors sought the relative safety of the highest quality sectors. After a weak start, bond prices generally rose and yields declined as economic growth slowed and stock market volatility increased. Although the benchmark 10-year U.S. Treasury yield edged back above 4.0% earlier in 2008, it slipped back to 3.81% at the end of the period, more than one full percentage point below where it was one year ago. In this environment, the Lehman Brothers U.S. Aggregate Bond Index6 returned 5.86%. High-yield bonds took a beating in 2007 but regained some ground thus far in 2008. The Merrill Lynch U.S. High Yield, Cash Pay Index7 returned negative 1.24%. Municipal bonds generated higher returns than taxable bonds despite industry-specific events, which threatened investor confidence half way through the period. In February, yields on municipal bonds rose above yields on comparable maturity Treasuries—and prices fell—in a difficult month for the municipal market. In this environment, the Lehman Brothers Municipal Bond Index8 returned 4.48% for the one-year period.
Past performance is no guarantee of future results.
5The MSCI Emerging Markets Index is a widely accepted index composed of a sample of companies from 25 countries representing the global emerging stock markets. Indices are not investments, do not incur fees or expenses and are not professionally managed. It is not possible to invest directly in an index. Securities in the fund may not match those in an index.
6The Lehman Brothers U.S. Aggregate Bond Index is a market value-weighted index that tracks the daily price, coupon, pay-downs and total return performance of fixed-rate, publicly placed, dollar-denominated and non-convertible investment-grade debt issues with at least $250 million par amount outstanding and with at least one year to final maturity. Indices are not investments, do not incur fees or expenses and are not professionally managed. It is not possible to invest directly in an index. Securities in the fund may not match those in an index.
7The Merrill Lynch U.S. High Yield Cash Pay Index tracks the performance of non-investment-grade corporate bonds. Indices are not investments, do not incur fees or expenses and are not professionally managed. It is not possible to invest directly in an index. Securities in the fund may not match those in an index.
8The Lehman Brothers Municipal Bond Index is considered representative of the broad market for investment grade, tax exempt bonds with a maturity of at least one year. Indices are not investments, do not incur fees or expenses and are not professionally managed. It is not possible to invest directly in an index. Securities in the fund may not match those in an index.
2
Fund Profile – Columbia International Stock Fund
Summary
g For the 12-month period that ended August 31, 2008, the fund's Class A shares returned negative 17.74% without sales charge.
g The fund underperformed its benchmarks and peer group classification.
g The fund's value approach was out of favor with investors during the period. Underweights in Australia and the UK, markets that declined less than other overseas markets, also held back returns.
Portfolio Management
Fred Copper, lead manager of the fund, has managed or co-managed the fund since October 2005 and has been with the advisor or its predecessors or affiliate organizations since 2005.
Jasmine (Weili) Huang has co-managed the fund since May 2006 and has been with the advisor or its predecessors or affiliate organizations since 2003.
Timothy R. Anderson has co-managed the fund since May 2006 and has been associated with the advisor since 2006.
Paul J. DiGiacomo has co-managed the fund since May 2006 and has been with the advisor since 2006.
Daisuke Nomoto has co-managed the fund since May 2006 and has been with the advisor or its predecessors or affiliate organizations since 2005.
1The Morgan Stanley Capital International (MSCI) Europe, Australasia, Far East (EAFE) Index is a free float-adjusted market capitalization index that is designed to measure developed market equity performance excluding the US and Canada. Indices are not investments, do not incur fees or expenses and are not professionally managed. It is not possible to invest directly in an index. Securities in the fund may not match those in an index.
2The MSCI All Country (AC) World ex U.S. Index is an index of global stock market performance that includes developed and emerging markets but excludes the US. Indices are not investments, do not incur fees or expenses and are not professionally managed. It is not possible to invest directly in an index. Securities in the fund may not match those in an index.
Performance data quoted represents past performance and current performance may be lower or higher. Past performance is no guarantee of future results. The investment return and principal value will fluctuate so that shares, when redeemed, may be worth more or less than the original cost. Please visit www.columbiafunds.com for daily and most recent month-end performance updates.
Summary
1 year return as of 08/31/08
| | –17.74% | |
|
 | | Class A shares
(without sales charge) | |
|
| | –14.41% | |
|
 | | MSCI EAFE Index1 | |
|
| | –12.17% | |
|
 | | MSCI All Country World ex
U.S. Index2 | |
|
Morningstar Style Box

The Morningstar Style Box reveals a fund's investment strategy. For equity funds the vertical axis shows the market capitalization of the stocks owned and the horizontal axis shows investment style (value, blend or growth). All of these numbers are drawn from the data most recently provided by the fund and entered into Morningstar's database as of month end. Although the data is gathered from reliable sources, Morningstar cannot guarantee completeness and accuracy. Information shown is as of 07/31/2008.
3
Performance Information – Columbia International Stock Fund
Performance data quoted represents past performance and current performance may be lower or higher. Past performance is no guarantee of future results. The investment return and principal value will fluctuate so that shares, when redeemed, may be worth more or less than the original cost. Please visit www.columbiafunds.com for daily and most recent month-end performance updates.
Annual operating expense ratio (%)*
| Class A | | | 1.36 | | |
| Class B | | | 2.11 | | |
| Class C | | | 2.11 | | |
| Class Z | | | 1.11 | | |
* The annual operating expense ratio is as stated in the fund's prospectus that is current as of the date of this report. Differences in expense ratios disclosed elsewhere in this report may result from including fee waivers and expense reimbursements as well as different time periods used in calculating the ratios.
Growth of a $10,000 investment 09/01/98 – 08/31/08
The chart above shows the growth in value of a hypothetical $10,000 investment in Class A shares of Columbia International Stock Fund during the stated time period, and does not reflect the deduction of taxes that a shareholder may pay on fund distributions or on the redemption of fund shares. The Morgan Stanley Capital International (MSCI) Europe, Australasia, Far East (EAFE) Index is a free float-adjusted market capitalization index that is designed to measure developed market equity performance excluding the US and Canada. The MSCI All Country (AC) World ex U.S. Index is an index of global stock market performance that includes developed and emerging markets but excludes the US. Indices are not investments, do not incur fees or expenses and are not professionally managed. It is not possible to invest directly in an index. Securities in the fund may not match those in an index.
Performance of a $10,000 investment 09/01/98 – 08/31/08 ($)
| Sales charge | | without | | with | |
| Class A | | | 17,891 | | | | 16,864 | | |
| Class B | | | 17,093 | | | | 17,093 | | |
| Class C | | | 17,160 | | | | 17,160 | | |
| Class Z | | | 18,296 | | | | n/a | | |
Average annual total return as of 08/31/08 (%)
| Share class | | A | | B | | C | | Z | |
| Inception | | 11/01/02 | | 11/01/02 | | 10/13/03 | | 10/01/92 | |
| Sales charge | | without | | with | | without | | with | | without | | with | | without | |
| 1-year | | | –17.74 | | | | –22.47 | | | | –18.31 | | | | –21.82 | | | | –18.33 | | | | –19.03 | | | | –17.52 | | |
| 5-year | | | 10.57 | | | | 9.26 | | | | 9.77 | | | | 9.50 | | | | 9.86 | | | | 9.86 | | | | 10.94 | | |
| 10-year | | | 5.99 | | | | 5.36 | | | | 5.51 | | | | 5.51 | | | | 5.55 | | | | 5.55 | | | | 6.23 | | |
Average annual total return as of 09/30/08 (%)
| Share class | | A | | B | | C | | Z | |
| Sales charge | | without | | with | | without | | with | | without | | with | | without | |
| 1-year | | | –34.06 | | | | –37.85 | | | | –34.56 | | | | –37.37 | | | | –34.55 | | | | –35.12 | | | | –33.92 | | |
| 5-year | | | 6.30 | | | | 5.05 | | | | 5.52 | | | | 5.20 | | | | 5.61 | | | | 5.61 | | | | 6.65 | | |
| 10-year | | | 4.77 | | | | 4.15 | | | | 4.28 | | | | 4.28 | | | | 4.32 | | | | 4.32 | | | | 5.01 | | |
The "with sales charge" returns include the maximum initial sales charge of 5.75% for Class A shares, the applicable contingent deferred sales charge of 5.00% in the first year, declining to 1.00% in the sixth year and eliminated thereafter for Class B shares and 1.00% for Class C shares for the first year only. The "without sales charge" returns do not include the effect of sales charges. If they had, returns would be lower.
Performance results reflect any fee waivers or reimbursements of fund expenses by the investment advisor and/or any of its affiliates. Absent these fee waivers or expense reimbursement arrangements, performance results would have been lower.
All results shown assume reinvestment of distributions. Class Z shares are sold at net asset value with no distribution and service (Rule 12b-1) fees. Class Z shares have limited eligibility and the investment minimum requirements may vary. Please see the fund's prospectus for details. Performance for different share classes will vary based on differences in sales charges and fees associated with each class.
The tables do not reflect the deduction of taxes that a shareholder may pay on fund distributions or on the redemption of fund shares.
Class A and Class B share performance information includes returns of the fund's Class Z shares (the oldest existing fund class) for periods prior to the inception of the newer class shares. The returns for Class C include the returns of Class B prior to 10/13/03, the date on which Class C was initially offered by the fund. The returns shown for Class C also include the performance of Class Z prior to the inception of Class B (11/01/02). Class Z share returns have not been restated to reflect any differences in expenses, such as distribution and service (Rule 12b-1) fees between Class Z shares and the newer class shares. If differences in expenses had been reflected, the returns for the periods prior to the inception of Classes A, B, and C would have been lower.
4
Understanding Your Expenses – Columbia International Stock Fund
As a fund shareholder, you incur two types of costs. There are transaction costs, which generally include sales charges on purchases and may include redemption fees or exchange fees. There are also ongoing costs, which generally include investment advisory fees, distribution and service (Rule 12b-1) fees and other fund expenses. The information on this page is intended to help you understand the ongoing costs of investing in the fund and to compare these costs with the ongoing costs of investing in other mutual funds.
Analyzing your fund's expenses by share class
To illustrate these ongoing costs, we have provided an example and calculated the expenses paid by investors in each share class during the period. The information in the following table is based on an initial investment of $1,000, which is invested at the beginning of the period and held for the entire period. Expense information is calculated two ways and each method provides you with different information. The amount listed in the "actual" column is calculated using the fund's actual operating expenses and total return for the period. The amount listed in the "hypothetical" column for each share class assumes that the return each year is 5% before expenses and is calculated based on the fund's actual operating expenses. You should not use the hypothetical account values and expenses to estimate either your actual account balance at the end of the period or the expenses you paid during this period.
Compare with other funds
Since all mutual funds are required to include the same hypothetical calculations about expenses in shareholder reports, you can use this information to compare the ongoing costs of investing in the fund with other funds. To do so, compare the 5% hypothetical example with the 5% hypothetical examples that appear in the shareholder reports of other funds. As you compare hypothetical examples of other funds, it is important to note that hypothetical examples are meant to highlight the ongoing costs of investing in a fund and do not reflect any transaction costs, such as sales charges, redemption fees or exchange fees.
Estimating your actual expenses
To estimate the expenses that you paid over the period, first you will need your account balance at the end of the period:
g For shareholders who receive their account statements from Columbia Management Services, Inc., your account balance is available online at www.columbiafunds.com or by calling Shareholder Services at 800.345.6611.
g For shareholders who receive their account statements from their financial intermediary, contact your financial intermediary to obtain your account balance.
1. Divide your ending account balance by $1,000. For example, if an account balance was $8,600 at the end of the period, the result would be 8.6.
2. In the section of the table below titled "Expenses paid during the period," locate the amount for your share class. You will find this number in the column labeled "actual." Multiply this number by the result from step 1. Your answer is an estimate of the expenses you paid on your account during the period.
If the value of your account falls below the minimum initial investment requirement applicable to you, your account generally will be subject to a $20 annual fee. This fee is not included in the accompanying table. If you are subject to the fee, keep it in mind when you are estimating the ongoing expenses of investing in the fund and when comparing the expenses of this fund with other funds.
03/01/08 – 08/31/08
| | | Account value at the
beginning of the period ($) | | Account value at the
end of the period ($) | | Expenses paid
during the period ($) | | Fund's annualized
expense ratio (%) | |
| | | Actual | | Hypothetical | | Actual | | Hypothetical | | Actual | | Hypothetical | | Actual | |
| Class A | | | 1,000.00 | | | | 1,000.00 | | | | 894.68 | | | | 1,019.15 | | | | 5.67 | | | | 6.04 | | | | 1.19 | | |
| Class B | | | 1,000.00 | | | | 1,000.00 | | | | 891.91 | | | | 1,015.38 | | | | 9.23 | | | | 9.83 | | | | 1.94 | | |
| Class C | | | 1,000.00 | | | | 1,000.00 | | | | 891.81 | | | | 1,015.38 | | | | 9.23 | | | | 9.83 | | | | 1.94 | | |
| Class Z | | | 1,000.00 | | | | 1,000.00 | | | | 896.09 | | | | 1,020.41 | | | | 4.48 | | | | 4.77 | | | | 0.94 | | |
Expenses paid during the period are equal to the annualized expense ratio for the share class, multiplied by the average account value over the period, then multiplied by the number of days in the fund's most recent fiscal half-year and divided by 366.
Had the investment advisor and/or any of its affiliates not waived fees or reimbursed a portion of expenses, account value at the end of the period would have been reduced.
It is important to note that the expense amounts shown in the table are meant to highlight only ongoing costs of investing in the fund and do not reflect any transaction costs, such as sales charges, redemption fees or exchange fees. Therefore, the hypothetical examples provided may not help you determine the relative total costs of owning shares of different funds. If these transaction costs were included, your costs would have been higher.
5
Portfolio Managers' Report – Columbia International Stock Fund
Performance data quoted represents past performance and current performance may be lower or higher. Past performance is no guarantee of future results. The investment return and principal value will fluctuate so that shares, when redeemed, may be worth more or less than the original cost. Please visit www.columbiafunds.com for daily and most recent month-end performance updates.
Net asset value per share
as of 08/31/08 ($)
| Class A | | | 14.02 | | |
| Class B | | | 13.61 | | |
| Class C | | | 13.68 | | |
| Class Z | | | 14.15 | | |
Distributions declared per share
09/01/07 – 08/31/08 ($)
| Class A | | | 2.85 | | |
| Class B | | | 2.70 | | |
| Class C | | | 2.70 | | |
| Class Z | | | 2.90 | | |
Top 5 countries
as of 08/31/08 (%)
| Japan | | | 19.5 | | |
| United Kingdom | | | 16.3 | | |
| Switzerland | | | 9.8 | | |
| Germany | | | 7.6 | | |
| France | | | 7.0 | | |
Top 10 holdings
as of 08/31/08 (%)
| E.ON AG | | | 2.2 | | |
| Banco Santander SA | | | 2.0 | | |
| Roche Holding AG | | | 2.0 | | |
| Novartis AG | | | 1.9 | | |
| Total SA | | | 1.7 | | |
| AstraZeneca PLC | | | 1.7 | | |
| BHP Billiton PLC | | | 1.7 | | |
| Nokia Oyj | | | 1.6 | | |
| Vivendi | | | 1.5 | | |
| BASF SE | | | 1.5 | | |
For the 12-month period that ended August 31, 2008, Columbia International Stock Fund Class A shares returned negative 17.74% without sales charge. The fund's return was less than both the negative 14.41% return of the MSCI EAFE Index1 and the negative 12.17% return of the MSCI All Country World ex U.S. Index.2 It was also less than the negative 14.21% average return of its peer group, the Lipper International Multi-Cap Core Funds Classification.3 Stock selection drove underperformance relative to the fund's two benchmarks. As economic growth slowed, investors were willing to pay a premium for more defensive stocks, such as consumer staples, utilities and health care. Because we take a value approach to investing, we did not participate in the run-up of these stocks, which we felt were overvalued relative to their earnings prospects. Underweights in Australia and the UK, markets that declined les s than other overseas markets, also held back returns.
Individual stocks that underperformed included: MTU Aero Engines Holding AG, which suffered from general problems in the airline industry; Societe Generale SA, a French bank with large U.S. holdings, which was at the center of the credit crisis; and Biovail Corp., a Canadian pharmaceutical company, which declined because one of its blockbuster drugs faced generic competition. Societe Generale was sold, but the other underperformers remain in the portfolio.
Utilities and certain Japanese companies boosted performance
Utilities made a positive contribution to performance relative to its benchmark, with the biggest boost coming from British Energy Group PLC, which owns licenses for some of the available sites for building nuclear power plants. Its share price rose significantly on speculation that it might be a takeover target, and we sold the stock. Two Japanese companies were particularly helpful to performance, including Toyo Suisan Kaisha Ltd., a maker of processed foods, which surpassed market expectations. Matsushita Electric Industrial Co,. Ltd. was another positive performer. The stock was strong due to resilience in the electronics sector, despite an overall tough consumer market.
Strategic and tactical decisions about country and sector weights
We maintained an overweight in China, even though the market declined when the government took measures to slow the economy to reduce inflation. We believe China's rate of economic growth will stabilize at around 10%. In light of this expectation, we have taken advantage of companies with valuations that are on par with competitors in markets with economies that are growing at a rate that is less than 10%. We also added
1The Morgan Stanley Capital International (MSCI) Europe, Australasia, Far East (EAFE) Index is a free float-adjusted market capitalization index that is designed to measure developed market equity performance excluding the US and Canada. Indices are not investments, do not incur fees or expenses and are not professionally managed. It is not possible to invest directly in an index. Securities in the fund may not match those in an index.
2The MSCI All Country (AC) World ex U.S. Index is an index of global stock market performance that includes developed and emerging markets but excludes the US. Indices are not investments, do not incur fees or expenses and are not professionally managed. It is not possible to invest directly in an index. Securities in the fund may not match those in an index.
3Lipper Inc., a widely respected data provider in the industry, calculates an average total return (assuming reinvestment of distributions) for mutual funds with investment objectives similar to those of the fund. Lipper makes no adjustment for the effect of sales loads.
6
Portfolio Managers' Report (continued) – Columbia International Stock Fund
to the fund's position in Brazil, a country rich in fresh water, arable land and other natural resources.
We raised the fund's position in banks from an underweight to a neutral weight relative to its benchmarks, because we believe these stocks have dropped to levels that reflect the worst of the news in the financials sector. We also added commodity stocks after they sold off sharply. We favored PT Bumi Resources Tbk and maintained a position in Yanzhou Coal Mining Co., Ltd.
Infrastructure development has been a portfolio theme for a long time, and the fund's relatively large position in ABB Ltd. in Switzerland, a global engineering company, reflects our belief that trillions of dollars could be spent on infrastructure expansion. Alternative energy is also a focus, with Vestas Wind Systems A/S being an example. While these stocks underperformed during this reporting period, we believe they could be the beneficiary of a multi-year trend toward alternative energy sources.
Looking ahead
We anticipate market volatility to continue as weak economic news persists. However, we believe that the market has the potential to rally before news gets better and have positioned the portfolio to take advantage of that outlook.
Portfolio holdings and characteristics are subject to change periodically and may not be representative of current holdings and characteristics. The outlook for the fund may differ from those presented for other Columbia Funds.
Equity investments are affected by stock market fluctuations that occur in response to economic and business developments.
International investing may involve certain risks, including currency fluctuations, risks associated with possible differences in financial accounting standards and other monetary and political risks. Significant levels of foreign taxes, including potentially confiscatory levels of taxation and withholding taxes, may also apply to some foreign investments.
Investing in emerging markets may involve greater risks than investing in more developed countries. In addition, concentration of investments in a single region may result in greater volatility.
Holdings discussed in this report
as of 08/31/08 (%)
MTU Aero Engines
Holding AG | | | 0.5 | | |
| Biovail Corp. | | | 0.7 | | |
| Toyo Suisan Kaisha Ltd. | | | 0.5 | | |
Matsushita Electric
Industrial Co., Ltd. | | | 1.3 | | |
| PT Bumi Resources Tbk | | | 0.4 | | |
Yanzhou Coal
Mining Co., Ltd. | | | 0.8 | | |
| ABB Ltd. | | | 1.5 | | |
| Vestas Wind Systems A/S | | | 0.6 | | |
The fund is actively managed and the composition of its portfolio will change over time. Information provided is calculated as a percentage of net assets.
7
Fund Profile – Columbia Mid Cap Growth Fund
Performance data quoted represents past performance and current performance may be lower or higher. Past performance is no guarantee of future results. The investment return and principal value will fluctuate so that shares, when redeemed, may be worth more or less than the original cost. Please visit www.columbiafunds.com for daily and most recent month-end performance updates.
Summary
1 year return as of 08/31/08
| | –2.21% | |
|
 | | Class A shares
(without sales charge) | |
|
| | –7.57% | |
|
 | | Russell Midcap Growth Index | |
|
| | –8.60% | |
|
 | | Russell Midcap Index | |
|
Morningstar Style Box

The Morningstar Style Box reveals a fund's investment strategy. For equity funds the vertical axis shows the market capitalization of the stocks owned and the horizontal axis shows investment style (value, blend or growth). All of these numbers are drawn from the data most recently provided by the fund and entered into Morningstar's database as of month end. Although the data is gathered from reliable sources, Morningstar cannot guarantee completeness and accuracy. Information shown is as of 07/31/2008.
Summary
g For the 12-month period that ended August 31, 2008, the fund's Class A shares returned negative 2.21% without sales charge.
g The fund outperformed both the Russell Midcap Growth Index1 and the Russell Midcap Index,2 and its return was higher than the average return of its peer group, the Lipper Mid-Cap Growth Funds Classification.3
g Positive stock selection helped the fund, with the biggest gains coming from materials and energy, while sector weights, modestly hindered relative performance.
Portfolio Management
Wayne M. Collette has co-managed the fund since February 2006 and has been with the advisor or its predecessors or affiliate organizations since 2001.
George J. Myers has co-managed the fund since February 2006 and has been with the advisor or its predecessors or affiliate organizations since 2004.
Lawrence W. Lin has co-managed the fund since October 2007 and has been with the advisor since 2006.
Brian D. Neigut has co-managed the fund since October 2007 and has been with the advisor since 2007.
1The Russell Midcap Growth Index measures the performance of those Russell Midcap companies with higher price-to-book ratios and higher forecasted growth values. Indices are not investments, do not incur fees or expenses and are not professionally managed. It is not possible to invest directly in an index. Securities in the fund may not match those in an index.
2The Russell Midcap Index measures the performance of the 800 smallest companies in the Russell 1000 Index, as ranked by total market capitalization. Indices are not investments, do not incur fees or expenses and are not professionally managed. It is not possible to invest directly in an index. Securities in the fund may not match those in an index.
3Lipper Inc., a widely respected data provider in the industry, calculates an average total return (assuming reinvestment of distributions) for mutual funds with investment objectives similar to those of the fund. Lipper makes no adjustment for the effect of sales loads.
8
Performance Information – Columbia Mid Cap Growth Fund
Growth of a $10,000 investment 09/01/98 – 08/31/08
The chart above shows the growth in value of a hypothetical $10,000 investment in Class A shares of Columbia Mid Cap Growth Fund during the stated time period, and does not reflect the deduction of taxes that a shareholder may pay on fund distributions or on the redemption of fund shares. The Russell Midcap Growth Index measures the performance of those Russell Midcap companies with higher price-to-book ratios and higher forecasted growth values. The Russell Midcap Index measures the performance of the 800 smallest companies in the Russell 1000 Index, as ranked by total market capitalization. Indices are not investments, do not incur fees or expenses and are not professionally managed. It is not possible to invest directly in an index. Securities in the fund may not match those in an index.
Performance of a $10,000 investment 09/01/98 – 08/31/08 ($)
| Sales charge | | without | | with | |
| Class A | | | 23,766 | | | | 22,405 | | |
| Class B | | | 22,751 | | | | 22,751 | | |
| Class C | | | 22,802 | | | | 22,802 | | |
| Class R | | | 23,612 | | | | n/a | | |
| Class T | | | 23,767 | | | | 22,406 | | |
| Class Z | | | 24,208 | | | | n/a | | |
Performance data quoted represents past performance and current performance may be lower or higher. Past performance is no guarantee of future results. The investment return and principal value will fluctuate so that shares, when redeemed, may be worth more or less than the original cost. Please visit www.columbiafunds.com for daily and most recent month-end performance updates.
Annual operating expense ratio (%)*
| Class A | | | 1.19 | | |
| Class B | | | 1.94 | | |
| Class C | | | 1.94 | | |
| Class R | | | 1.44 | | |
| Class T | | | 1.24 | | |
| Class Z | | | 0.94 | | |
* The annual operating expense ratio is as stated in the fund's prospectus that is current as of the date of this report. Differences in expense ratios disclosed elsewhere in this report may result from including fee waivers and expense reimbursements as well as different time periods used in calculating the ratios.
Average annual total return as of 08/31/08 (%)
| Share class | | A | | B | | C | | R | | T | | Z | |
| Inception | | 11/01/02 | | 11/01/02 | | 10/13/03 | | 01/23/06 | | 11/01/02 | | 11/20/85 | |
| Sales charge | | without | | with | | without | | with | | without | | with | | without | | without | | with | | without | |
| 1-year | | | –2.21 | | | | –7.84 | | | | –2.92 | | | | –7.14 | | | | –2.91 | | | | –3.75 | | | | –2.44 | | | | –2.27 | | | | –7.89 | | | | –1.97 | | |
| 5-year | | | 9.77 | | | | 8.49 | | | | 8.95 | | | | 8.67 | | | | 9.00 | | | | 9.00 | | | | 9.63 | | | | 9.74 | | | | 8.44 | | | | 10.08 | | |
| 10-year | | | 9.04 | | | | 8.40 | | | | 8.57 | | | | 8.57 | | | | 8.59 | | | | 8.59 | | | | 8.97 | | | | 9.04 | | | | 8.40 | | | | 9.24 | | |
Average annual total return as of 09/30/08 (%)
| Share class | | A | | B | | C | | R | | T | | Z | |
| Sales charge | | without | | with | | without | | with | | without | | with | | without | | without | | with | | without | |
| 1-year | | | –21.95 | | | | –26.43 | | | | –22.52 | | | | –25.89 | | | | –22.50 | | | | –23.18 | | | | –22.14 | | | | –22.02 | | | | –26.51 | | | | –21.77 | | |
| 5-year | | | 7.40 | | | | 6.14 | | | | 6.59 | | | | 6.28 | | | | 6.64 | | | | 6.64 | | | | 7.26 | | | | 7.35 | | | | 6.08 | | | | 7.70 | | |
| 10-year | | | 6.54 | | | | 5.91 | | | | 6.07 | | | | 6.07 | | | | 6.10 | | | | 6.10 | | | | 6.47 | | | | 6.54 | | | | 5.92 | | | | 6.74 | | |
The "with sales charge" returns include the maximum initial sales charge of 5.75% for Class A and T shares, the applicable contingent deferred sales charge of 5.00% in the first year, declining to 1.00% in the sixth year and eliminated thereafter for Class B shares and 1.00% for Class C shares for the first year only. The "without sales charge" returns do not include the effect of sales charges. If they had, returns would be lower.
Performance results reflect any fee waivers or reimbursements of fund expenses by the investment advisor and/or any of its affiliates. Absent these fee waivers or expense reimbursement arrangements, performance results would have been lower.
All results shown assume reinvestment of distributions. Class Z shares are sold at net asset value with no distribution and service (Rule 12b-1) fees. Class R shares are sold at net asset value with distribution and service (Rule 12b-1) fees. Class R and Class Z shares have limited eligibility and the investment minimum requirements may vary. Please see the fund's prospectus for details. Performance for different share classes will vary based on differences in sales charges and fees associated with each class.
The tables do not reflect the deduction of taxes that a shareholder may pay on fund distributions or on the redemption of fund shares.
Class A, Class B, and Class T share performance information includes returns of the fund's Class Z shares (the oldest existing share class) for periods prior to the inception of the newer class shares. The returns for Class C include the returns of Class B prior to 10/13/03, the date on which Class C was initially offered by the fund.
The returns shown for Class C also include the performance of Class Z prior to the inception of Class B (11/01/02). The returns for Class R include the returns of Class A prior to 01/23/06, the date on which Class R was initially offered by the fund. The returns shown for Class R also include the performance of Class Z prior to the inception of Class A (11/01/02). If differences in expenses had been reflected, the returns shown would have been lower, since the Class R shares are subject to a higher distribution and service (Rule 12b-1) fees than Class A shares. Class Z share returns have not been restated to reflect any differences in expenses such as distribution and service (Rule 12b-1) fees between Class Z shares and the newer class shares. If differences in expenses had been reflected, the returns shown for the periods prior to the inception of Classes A, B, C, R, and T would have been lower.
9
Understanding Your Expenses – Columbia Mid Cap Growth Fund
Estimating your actual expenses
To estimate the expenses that you paid over the period, first you will need your account balance at the end of the period:
g For shareholders who receive their account statements from Columbia Management Services, Inc., your account balance is available online at www.columbiafunds.com or by calling Shareholder Services at 800.345.6611.
g For shareholders who receive their account statements from their financial intermediary, contact your financial intermediary to obtain your account balance.
1. Divide your ending account balance by $1,000. For example, if an account balance was $8,600 at the end of the period, the result would be 8.6.
2. In the section of the table below titled "Expenses paid during the period," locate the amount for your share class. You will find this number in the column labeled "actual." Multiply this number by the result from step 1. Your answer is an estimate of the expenses you paid on your account during the period.
If the value of your account falls below the minimum initial investment requirement applicable to you, your account generally will be subject to a $20 annual fee. This fee is not included in the accompanying table. If you are subject to the fee, keep it in mind when you are estimating the ongoing expenses of investing in the fund and when comparing the expenses of this fund with other funds.
As a fund shareholder, you incur two types of costs. There are transaction costs, which generally include sales charges on purchases and may include redemption fees or exchange fees. There are also ongoing costs, which generally include investment advisory fees, distribution and service (Rule 12b-1) fees and other fund expenses. The information on this page is intended to help you understand the ongoing costs of investing in the fund and to compare these costs with the ongoing costs of investing in other mutual funds.
Analyzing your fund's expenses by share class
To illustrate these ongoing costs, we have provided an example and calculated the expenses paid by investors in each share class during the period. The information in the following table is based on an initial investment of $1,000, which is invested at the beginning of the period and held for the entire period. Expense information is calculated two ways and each method provides you with different information. The amount listed in the "actual" column is calculated using the fund's actual operating expenses and total return for the period. The amount listed in the "hypothetical" column for each share class assumes that the return each year is 5% before expenses and is calculated based on the fund's actual operating expenses. You should not use the hypothetical account values and expenses to estimate either your actual account balance at the end of the period or the expenses you paid during this period.
Compare with other funds
Since all mutual funds are required to include the same hypothetical calculations about expenses in shareholder reports, you can use this information to compare the ongoing costs of investing in the fund with other funds. To do so, compare the 5% hypothetical example with the 5% hypothetical examples that appear in the shareholder reports of other funds. As you compare hypothetical examples of other funds, it is important to note that hypothetical examples are meant to highlight the ongoing costs of investing in a fund and do not reflect any transaction costs, such as sales charges, redemption fees or exchange fees.
03/01/08 – 08/31/08
| | | Account value at the
beginning of the period ($) | | Account value at the
end of the period ($) | | Expenses paid
during the period ($) | | Fund's annualized
expense ratio (%) | |
| | | Actual | | Hypothetical | | Actual | | Hypothetical | | Actual | | Hypothetical | | Actual | |
| Class A | | | 1,000.00 | | | | 1,000.00 | | | | 1,012.52 | | | | 1,019.15 | | | | 6.02 | | | | 6.04 | | | | 1.19 | | |
| Class B | | | 1,000.00 | | | | 1,000.00 | | | | 1,008.60 | | | | 1,015.38 | | | | 9.79 | | | | 9.83 | | | | 1.94 | | |
| Class C | | | 1,000.00 | | | | 1,000.00 | | | | 1,008.60 | | | | 1,015.38 | | | | 9.79 | | | | 9.83 | | | | 1.94 | | |
| Class R | | | 1,000.00 | | | | 1,000.00 | | | | 1,011.31 | | | | 1,017.90 | | | | 7.28 | | | | 7.30 | | | | 1.44 | | |
| Class T | | | 1,000.00 | | | | 1,000.00 | | | | 1,012.12 | | | | 1,018.90 | | | | 6.27 | | | | 6.29 | | | | 1.24 | | |
| Class Z | | | 1,000.00 | | | | 1,000.00 | | | | 1,013.62 | | | | 1,020.41 | | | | 4.76 | | | | 4.77 | | | | 0.94 | | |
Expenses paid during the period are equal to the annualized expense ratio for the share class, multiplied by the average account value over the period, then multiplied by the number of days in the fund's most recent fiscal half-year and divided by 366.
It is important to note that the expense amounts shown in the table are meant to highlight only ongoing costs of investing in the fund and do not reflect any transaction costs, such as sales charges, redemption fees or exchange fees. Therefore, the hypothetical examples provided may not help you determine the relative total costs of owning shares of different funds. If these transaction costs were included, your costs would have been higher.
10
Portfolio Managers' Report – Columbia Mid Cap Growth Fund
For the 12-month period that ended August 31, 2008, Columbia Mid Cap Growth Fund Class A shares returned negative 2.21% without sales charge. The fund held up better than its benchmarks, the Russell Midcap Growth Index, which returned negative 7.57%1, and the Russell Midcap Index, which returned negative 8.60%2 for the same period. The fund's return was also higher than the negative 8.03% average return of its peer group, the Lipper Mid-Cap Growth Funds Classification.3 Positive stock selection helped the fund, with the biggest gains coming from the materials and energy sectors. Sector weights, despite being relatively close to those in one of the fund's benchmarks, the Russell Midcap Growth Index, modestly hindered relative performance.
Energy and material stocks made positive contributions to returns
The fund's energy stocks climbed nearly 30% for the year, benefiting as rising global demand and constrained supply drove oil prices up more than 40% in the first seven months of 2008 before backing down near the end of the period. Natural gas prices also rose sharply. Among the winners were domestic exploration and production companies Continental Resources, Inc. and Concho Resources, Inc. Both stocks posted substantial gains, driven by positive pricing as well as strong production growth.
In materials, where the fund's investments returned nearly 40%, agricultural stocks benefited as rising demand for ethanol and growing global food consumption, especially in emerging markets, drove commodity prices higher. Companies that could help farmers increase their crop yields did especially well. Among the winners were Potash Corp. of Saskatchewan, Inc., which produces potash for fertilizer; Agrium, Inc., another fertilizer company; and Monsanto Co., which sells genetically-enhanced seeds. Some mining stocks also rallied nicely, including Cleveland-Cliffs, Inc., an iron ore company that gained from positive pricing in the wake of growing global demand. Bucyrus International, Inc., a mining equipment company in the industrials sector, also rose sharply, as mining companies stepped up production to take advantage of higher commodity prices.
Telecom services and technology disappointed
A modest overweight in, and below-average performance from, the fund's telecommunication services stocks hampered returns relative to the Russell Midcap Growth Index. Disappointments included NII Holdings, Inc., a leading Latin American wireless provider whose stock price declined as increased competition pressured subscriber growth rates. In technology, Equinix, Inc., an operator of large offsite data centers, retreated amid concerns that corporate technology spending would slow.
1The Russell Midcap Growth Index measures the performance of those Russell Midcap companies with higher price-to-book ratios and higher forecasted growth values. Indices are not investments, do not incur fees or expenses and are not professionally managed. It is not possible to invest directly in an index. Securities in the fund may not match those in an index.
2The Russell Midcap Index measures the performance of the 800 smallest companies in the Russell 1000 Index, as ranked by total market capitalization. Indices are not investments, do not incur fees or expenses and are not professionally managed. It is not possible to invest directly in an index. Securities in the fund may not match those in an index.
3Lipper Inc., a widely respected data provider in the industry, calculates an average total return (assuming reinvestment of distributions) for mutual funds with investment objectives similar to those of the fund. Lipper makes no adjustment for the effect of sales loads.
Performance data quoted represents past performance and current performance may be lower or higher. Past performance is no guarantee of future results. The investment return and principal value will fluctuate so that shares, when redeemed, may be worth more or less than the original cost. Please visit www.columbiafunds.com for daily and most recent month-end performance updates.
Net asset value per share
as of 08/31/08 ($)
| Class A | | | 23.47 | | |
| Class B | | | 22.35 | | |
| Class C | | | 22.41 | | |
| Class R | | | 23.32 | | |
| Class T | | | 23.48 | | |
| Class Z | | | 23.92 | | |
Distributions declared per share
09/01/07 – 08/31/08 ($)
| Class A | | | 3.86 | | |
| Class B | | | 3.78 | | |
| Class C | | | 3.78 | | |
| Class R | | | 3.83 | | |
| Class T | | | 3.85 | | |
| Class Z | | | 3.88 | | |
Top 5 sectors
as of 08/31/08 (%)
| Information Technology | | | 17.5 | | |
| Consumer Discretionary | | | 17.4 | | |
| Industrials | | | 16.4 | | |
| Health Care | | | 13.0 | | |
| Energy | | | 12.1 | | |
Top 10 holdings
as of 08/31/08 (%)
Potash Corp. of
Saskatchewan, Inc. | | | 1.5 | | |
| McDermott International, Inc. | | | 1.3 | | |
| Denbury Resources, Inc. | | | 1.2 | | |
| Cummins, Inc. | | | 1.2 | | |
| American Tower Corp. | | | 1.2 | | |
| Precision Castparts Corp. | | | 1.1 | | |
| Diamond Offshore Drilling, Inc. | | | 1.1 | | |
Laboratory Corp. of
America Holdings | | | 1.0 | | |
| Express Scripts, Inc. | | | 1.0 | | |
Charles River Laboratories
International, Inc. | | | 1.0 | | |
The fund is actively managed and the composition of its portfolio will change over time. Information provided is calculated as a percentage of net assets.
11
Portfolio Managers' Report (continued) – Columbia Mid Cap Growth Fund
Holdings discussed in this report
as of 08/31/08 (%)
| Continental Resources, Inc. | | | 1.0 | | |
| Concho Resources, Inc. | | | 0.5 | | |
Potash Corp. of
Saskatchewan, Inc. | | | 1.6 | | |
| Agrium, Inc. | | | 0.6 | | |
| Monsanto Co. | | | 0.9 | | |
| Cleveland-Cliffs, Inc. | | | 0.8 | | |
| Bucyrus International, Inc. | | | 0.6 | | |
| NII Holdings, Inc. | | | 0.6 | | |
| Equinix, Inc. | | | 0.9 | | |
| Hologic, Inc. | | | 0.8 | | |
The fund is actively managed and the composition of its portfolio will change over time. Information provided is calculated as a percentage of net assets.
Other detractors
In consumer discretionary, Crocs, Inc., a footwear manufacturer, and Scientific Games, which makes gaming systems, both fell sharply. Crocs suffered from decelerating sales, excess inventory and disappointing earnings. Scientific Games Corp. was hurt by the loss of a key contract and the weak economy. We sold both stocks. In health care, Hologic, Inc., which specializes in digital mammography, declined amid worries that the stock's price had surpassed expectations.
Although we believe that the market will remain volatile in the near term, we should be able to find ample opportunities to invest in mid-cap stocks that fit our investment criteria. We plan to focus on companies that can pass on rising input costs, as well as companies that can help other businesses be more efficient.
Portfolio holdings and characteristics are subject to change periodically and may not be representative of current holdings and characteristics. The outlook for the fund may differ from those presented for other Columbia Funds.
Equity investments are affected by stock market fluctuations that occur in response to economic and business developments.
Investing in mid-cap stocks may present special risks, including possible illiquidity and greater price volatility than stocks of larger, more established companies.
12
Fund Profile – Columbia Small Cap Growth Fund I
Summary
g For the 12-month period that ended August 31, 2008, the fund's Class A shares returned negative 1.34% without sales charge.
g The fund's return was higher than the returns of both its benchmarks, the Russell 2000 Growth Index1 and the Russell 2000 Index2, and the average return of its peer group, the Lipper Small-Cap Growth Funds Classification.3
g Stock selection accounted for the fund's strong performance.
Portfolio Management
Wayne M. Collette has co-managed the fund since February 2006 and has been with the advisor or its predecessors or affiliate organizations since 2001.
George J. Myers has co-managed the fund since February 2006 and has been with the advisor or its predecessors or affiliate organizations since 2004.
Lawrence W. Lin has co-managed the fund since October 2007 and has been with the advisor since 2006.
Brian D. Neigut has co-managed the fund since October 2007 and has been with the advisor since 2007.
1The Russell 2000 Growth Index measures the performance of those Russell 2000 Index companies with higher price-to-book ratios and higher forecasted growth values. Indices are not investments, do not incur fees or expenses and are not professionally managed. It is not possible to invest directly in an index. Securities in the fund may not match those in an index.
2The Russell 2000 Index measures the performance of the 2,000 smallest of 3,000 largest US companies based on market capitalization. Indices are not investments, do not incur fees or expenses and are not professionally managed. It is not possible to invest directly in an index. Securities in the fund may not match those in an index.
3Lipper Inc., a widely respected data provider in the industry, calculates an average total return (assuming reinvestment of distributions) for mutual funds with investment objectives similar to those of the fund. Lipper makes no adjustment for the effect of sales loads.
Performance data quoted represents past performance and current performance may be lower or higher. Past performance is no guarantee of future results. The investment return and principal value will fluctuate so that shares, when redeemed, may be worth more or less than the original cost. Please visit www.columbiafunds.com for daily and most recent month-end performance updates.
Summary
1 year return as of 08/31/08
| | –1.34% | |
|
 | | Class A shares
(without sales charge) | |
|
| | –3.79% | |
|
 | | Russell 2000 Growth Index | |
|
| | –5.48% | |
|
 | | Russell 2000 Index | |
|
Morningstar Style Box

The Morningstar Style Box reveals a fund's investment strategy. For equity funds the vertical axis shows the market capitalization of the stocks owned and the horizontal axis shows investment style (value, blend or growth). All of these numbers are drawn from the data most recently provided by the fund and entered into Morningstar's database as of month end. Although the data is gathered from reliable sources, Morningstar cannot guarantee completeness and accuracy. Information shown is as of 07/31/2008.
13
Performance Information – Columbia Small Cap Growth Fund I
Performance data quoted represents past performance and current performance may be lower or higher. Past performance is no guarantee of future results. The investment return and principal value will fluctuate so that shares, when redeemed, may be worth more or less than the original cost. Please visit www.columbiafunds.com for daily and most recent month-end performance updates.
Annual operating expense ratio (%)*
| Class A | | | 1.45 | | |
| Class B | | | 2.20 | | |
| Class C | | | 2.20 | | |
| Class Z | | | 1.20 | | |
* The annual operating expense ratio is as stated in the fund's prospectus that is current as of the date of this report. Differences in expense ratios disclosed elsewhere in this report may result from including fee waivers and expense reimbursements as well as different time periods used in calculating the ratios.
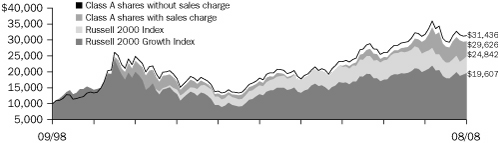
Growth of a $10,000 investment 09/01/98 – 08/31/08
The chart above shows the growth in value of a hypothetical $10,000 investment in Class A shares of Columbia Small Cap Growth Fund I during the stated time period, and does not reflect the deduction of taxes that a shareholder may pay on fund distributions or on the redemption of fund shares. The Russell 2000 Growth Index measures the performance of those Russell 2000 Index companies with higher price-to-book ratios and higher forecasted growth values. The Russell 2000 Index measures the performance of the 2,000 smallest of 3,000 largest US companies based on market capitalization. Indices are not investments, do not incur fees or expenses and are not professionally managed. It is not possible to invest directly in an index. Securities in the fund may not match those in an index.
Performance of a $10,000 investment 09/01/98 – 08/31/08 ($)
| Sales charge | | without | | with | |
| Class A | | | 31,436 | | | | 29,626 | | |
| Class B | | | 30,807 | | | | 30,807 | | |
| Class C | | | 30,784 | | | | 30,784 | | |
| Class Z | | | 31,658 | | | | n/a | | |
Average annual total return as of 08/31/08 (%)
| Share class | | A | | B | | C | | Z | |
| Inception | | 11/01/05 | | 11/01/05 | | 11/01/05 | | 10/01/96 | |
| Sales charge | | without | | with | | without | | with | | without | | with | | without | |
| 1-year | | | –1.34 | | | | –7.00 | | | | –2.10 | | | | –6.48 | | | | –2.14 | | | | –3.02 | | | | –1.09 | | |
| 5-year | | | 11.71 | | | | 10.39 | | | | 11.26 | | | | 10.99 | | | | 11.24 | | | | 11.24 | | | | 11.87 | | |
| 10-year | | | 12.14 | | | | 11.47 | | | | 11.91 | | | | 11.91 | | | | 11.90 | | | | 11.90 | | | | 12.21 | | |
Average annual total return as of 09/30/08 (%)
| Share class | | A | | B | | C | | Z | |
| Sales charge | | without | | with | | without | | with | | without | | with | | without | |
| 1-year | | | –18.48 | | | | –23.18 | | | | –19.12 | | | | –22.74 | | | | –19.19 | | | | –19.92 | | | | –18.29 | | |
| 5-year | | | 9.42 | | | | 8.13 | | | | 8.97 | | | | 8.68 | | | | 8.95 | | | | 8.95 | | | | 9.58 | | |
| 10-year | | | 9.67 | | | | 9.02 | | | | 9.44 | | | | 9.44 | | | | 9.43 | | | | 9.43 | | | | 9.75 | | |
The "with sales charge" returns include the maximum initial sales charge of 5.75% for Class A shares, the applicable contingent deferred sales charge of 5.00% in the first year, declining to 1.00% in the sixth year and eliminated thereafter for Class B shares and 1.00% for Class C shares for the first year only. The "without sales charge" returns do not include the effect of sales charges. If they had, returns would be lower.
Performance results reflect any fee waivers or reimbursements of fund expenses by the investment advisor and/or any of its affiliates. Absent these fee waivers or expense reimbursement arrangements, performance results would have been lower.
All results shown assume reinvestment of distributions. Class Z shares are sold at net asset value with no distribution and service (Rule 12b-1) fees. Class Z shares have limited eligibility and the investment minimum requirements may vary. Please see the fund's prospectus for details. Performance for different share classes will vary based on differences in sales charges and fees associated with each class.
The tables do not reflect the deduction of taxes that a shareholder may pay on fund distributions or on the redemption of fund shares.
Class A, Class B and Class C share performance information includes returns of the fund's Class Z shares (the oldest existing fund class) for periods prior to the inception of the newer class shares. Class Z share returns have not been restated to reflect any differences in expenses, such as distribution and service (Rule 12b-1) fees between Class Z shares and the newer class shares. If differences in expenses had been reflected, the returns for the periods prior to the inception of Classes A, B and C would have been lower.
14
Understanding Your Expenses – Columbia Small Cap Growth Fund I
As a fund shareholder, you incur two types of costs. There are transaction costs, which generally include sales charges on purchases and may include redemption fees or exchange fees. There are also ongoing costs, which generally include investment advisory fees, distribution and service (Rule 12b-1) fees and other fund expenses. The information on this page is intended to help you understand the ongoing costs of investing in the fund and to compare these costs with the ongoing costs of investing in other mutual funds.
Analyzing your fund's expenses by share class
To illustrate these ongoing costs, we have provided an example and calculated the expenses paid by investors in each share class during the period. The information in the following table is based on an initial investment of $1,000, which is invested at the beginning of the period and held for the entire period. Expense information is calculated two ways and each method provides you with different information. The amount listed in the "actual" column is calculated using the fund's actual operating expenses and total return for the period. The amount listed in the "hypothetical" column for each share class assumes that the return each year is 5% before expenses and is calculated based on the fund's actual operating expenses. You should not use the hypothetical account values and expenses to estimate either your actual account balance at the end of the period or the expenses you paid during this period.
Compare with other funds
Since all mutual funds are required to include the same hypothetical calculations about expenses in shareholder reports, you can use this information to compare the ongoing costs of investing in the fund with other funds. To do so, compare the 5% hypothetical example with the 5% hypothetical examples that appear in the shareholder reports of other funds. As you compare hypothetical examples of other funds, it is important to note that hypothetical examples are meant to highlight the ongoing costs of investing in a fund and do not reflect any transaction costs, such as sales charges, redemption fees or exchange fees.
Estimating your actual expenses
To estimate the expenses that you paid over the period, first you will need your account balance at the end of the period:
g For shareholders who receive their account statements from Columbia Management Services, Inc., your account balance is available online at www.columbiafunds.com or by calling Shareholder Services at 800.345.6611.
g For shareholders who receive their account statements from their financial intermediary, contact your financial intermediary to obtain your account balance.
1. Divide your ending account balance by $1,000. For example, if an account balance was $8,600 at the end of the period, the result would be 8.6.
2. In the section of the table below titled "Expenses paid during the period," locate the amount for your share class. You will find this number in the column labeled "actual." Multiply this number by the result from step 1. Your answer is an estimate of the expenses you paid on your account during the period.
If the value of your account falls below the minimum initial investment requirement applicable to you, your account generally will be subject to a $20 annual fee. This fee is not included in the accompanying table. If you are subject to the fee, keep it in mind when you are estimating the ongoing expenses of investing in the fund and when comparing the expenses of this fund with other funds.
03/01/08 – 08/31/08
| | | Account value at the
beginning of the period ($) | | Account value at the
end of the period ($) | | Expenses paid
during the period ($) | | Fund's annualized
expense ratio (%) | |
| | | Actual | | Hypothetical | | Actual | | Hypothetical | | Actual | | Hypothetical | | Actual | |
| Class A | | | 1,000.00 | | | | 1,000.00 | | | | 1,062.59 | | | | 1,018.25 | | | | 7.10 | | | | 6.95 | | | | 1.37 | | |
| Class B | | | 1,000.00 | | | | 1,000.00 | | | | 1,058.82 | | | | 1,014.48 | | | | 10.97 | | | | 10.74 | | | | 2.12 | | |
| Class C | | | 1,000.00 | | | | 1,000.00 | | | | 1,058.82 | | | | 1,014.48 | | | | 10.97 | | | | 10.74 | | | | 2.12 | | |
| Class Z | | | 1,000.00 | | | | 1,000.00 | | | | 1,064.30 | | | | 1,019.51 | | | | 5.81 | | | | 5.69 | | | | 1.12 | | |
Expenses paid during the period are equal to the annualized expense ratio for the share class, multiplied by the average account value over the period, then multiplied by the number of days in the fund's most recent fiscal half-year and divided by 366.
It is important to note that the expense amounts shown in the table are meant to highlight only ongoing costs of investing in the fund and do not reflect any transaction costs, such as sales charges, redemption fees or exchange fees. Therefore, the hypothetical examples provided may not help you determine the relative total costs of owning shares of different funds. If these transaction costs were included, your costs would have been higher.
15
Portfolio Managers' Report – Columbia Small Cap Growth Fund I
Performance data quoted represents past performance and current performance may be lower or higher. Past performance is no guarantee of future results. The investment return and principal value will fluctuate so that shares, when redeemed, may be worth more or less than the original cost. Please visit www.columbiafunds.com for daily and most recent month-end performance updates.
Net asset value per share
as of 08/31/08 ($)
| Class A | | | 27.82 | | |
| Class B | | | 27.39 | | |
| Class C | | | 27.37 | | |
| Class Z | | | 27.99 | | |
Distributions declared per share
09/01/07 – 08/31/08 ($)
| Class A | | | 3.80 | | |
| Class B | | | 3.56 | | |
| Class C | | | 3.56 | | |
| Class Z | | | 3.88 | | |
Top 5 sectors
as of 08/31/08 (%)
| Health Care | | | 21.7 | | |
| Information Technology | | | 20.9 | | |
| Industrials | | | 15.0 | | |
| Consumer Discretionary | | | 12.6 | | |
| Energy | | | 11.7 | | |
Top 10 holdings
as of 08/31/08 (%)
| ICON PLC | | | 2.9 | | |
| Bucyrus International, Inc. | | | 1.4 | | |
| Hologic, Inc. | | | 1.4 | | |
| Waddell & Reed Financial, Inc. | | | 1.4 | | |
| Alexion Pharmaceuticals, Inc. | | | 1.3 | | |
| Atwood Oceanics, Inc. | | | 1.3 | | |
| Psychiatric Solutions, Inc. | | | 1.2 | | |
| OSI Pharmaceuticals, Inc. | | | 1.2 | | |
| NuVasive, Inc. | | | 1.2 | | |
| Intrepid Potash, Inc. | | | 1.2 | | |
The fund is actively managed and the composition of its portfolio will change over time. Information provided is calculated as a percentage of net assets.
For the 12-month period that ended August 31, 2008, Columbia Small Cap Growth Fund I Class A shares returned negative 1.34% without sales charge. The fund outperformed the Russell 2000 Growth Index, which returned negative 3.79%1, and the Russell 2000 Index, which returned negative 5.48%2, for the same period. The fund's return was higher than the negative 10.29% average return of its peer group, the Lipper Small-Cap Growth Funds Classification.3 Stock selection, with a focus on companies that have high or improving returns on invested capital, high or improving profit margins and strong management teams, accounted for the fund's strong performance. Sector weights remained close to those in the Russell 2000 Growth Index.
Health care, materials and energy stocks boosted performance
Health care stocks, which accounted for approximately 22% of assets, delivered outsized gains. Standouts included ICON PLC, an Irish contract organization, and NuVasive, Inc., a medical device company. ICON benefited as more companies outsourced their clinical drug trials. NuVasive rose in anticipation of more orthopedic surgeons using its innovative, minimally invasive approach to spine surgery. Illumina, Inc., a medical device company, also rallied nicely, buoyed by expectations for its human genome analyzer, a unique tool to help uncover genetic markers for disease. Yet health care also delivered one of the fund's major disappointments: Hologic, Inc., which specializes in digital mammography, declined after a 2007 acquisition drove its stock price ahead of expectations.
The fund's materials and energy stocks, which together accounted for another 18% of assets, each delivered strong double-digit gains for the year. In the materials sector, agricultural stocks gained nicely as growing worldwide food consumption drove commodity prices higher. Fertilizer companies, including CF Industries Holdings, Inc., did especially well, as farmers sought to increase crop yields. Metals stocks—led by Cleveland-Cliffs, Inc., an iron ore producer—also rallied nicely, buoyed by rising demand and improved pricing.
Energy stocks benefited as growing global demand and constrained supply drove oil and natural gas prices to new highs throughout most of the period. Standouts included exploration and production companies Concho Resources, Inc. and PetroHawk Energy Corp. Other top contributors came from a variety of sectors. Bucyrus International, Inc., a mining equipment company, rallied as higher commodity prices led to increased demand for its services. Vocus, Inc., which provides online public relations software, climbed as companies looked for ways to cut costs and improve efficiency.
1The Russell 2000 Growth Index measures the performance of those Russell 2000 companies with higher price-to-book ratios and higher forecasted growth values. Indices are not investments, do not incur fees or expenses and are not professionally managed. It is not possible to invest directly in an index. Securities in the fund may not match those in an index.
2The Russell 2000 Index measures the performance of the 2,000 smallest of the 3,000 largest U.S. companies, based on market capitalization. Indices are not investments, do not incur fees or expenses and are not professionally managed. It is not possible to invest directly in an index. Securities in the fund may not match those in an index.
3Lipper Inc., a widely respected data provider in the industry, calculates an average total return (assuming reinvestment of distributions) for mutual funds with investment objectives similar to those of the fund. Lipper makes no adjustment for the effect of sales loads.
16
Portfolio Managers' Report (continued) – Columbia Small Cap Growth Fund I
Financial and certain consumer stocks disappointed
Financial stocks declined, pressured by continued woes in the subprime mortgage sector and tight credit. Detractors included First Cash Financial Services, a pawn shop chain that suffered as the economy weakened and loan defaults increased. Elsewhere, disappointments included consumer discretionary holding J. Crew Group, Inc., a clothing retailer that was hurt by the slowdown in consumer spending. We sold both stocks before the period's end.
We believe that small-cap stocks, which led the downturn, will be among the first to rebound once the economy improves. In the meantime, investors appear to be willing to pay a premium for companies that can still sustain or grow their earnings. Our focus will remain on small-cap growth companies that can pass on rising input costs through improved pricing, as well as companies that can help other businesses run more efficiently. We plan to remain diversified across sectors, while looking for opportunities in companies with good earnings growth prospects and attractive valuations.
Portfolio holdings and characteristics are subject to change periodically and may not be representative of current holdings and characteristics. The outlook for the fund may differ from those presented for other Columbia Funds.
Equity investments are affected by stock market fluctuations that occur in response to economic and business developments.
Investments in small-cap stocks may be subject to greater volatility and price fluctuations because they may be thinly traded and less liquid than investments in larger companies.
Holdings discussed in this report
as of 08/31/08 (%)
| ICON PLC | | | 2.9 | | |
| NuVasive, Inc. | | | 1.2 | | |
| Illumina, Inc. | | | 0.9 | | |
| Hologic, Inc. | | | 1.4 | | |
| CF Industries Holdings, Inc. | | | 1.1 | | |
| Cleveland-Cliffs, Inc. | | | 0.9 | | |
| Concho Resources, Inc. | | | 1.1 | | |
| PetroHawk Energy Corp. | | | 0.7 | | |
| Bucyrus International, Inc. | | | 1.4 | | |
| Vocus, Inc. | | | 0.9 | | |
The fund is actively managed and the composition of its portfolio will change over time. Information provided is calculated as a percentage of net assets.
17
Fund Profile – Columbia Real Estate Equity Fund
Performance data quoted represents past performance and current performance may be lower or higher. Past performance is no guarantee of future results. The investment return and principal value will fluctuate so that shares, when redeemed, may be worth more or less than the original cost. Please visit www.columbiafunds.com for daily and most recent month-end performance updates.
Summary
1 year return as of 08/31/08
| | | –5.46% | |
|
 | | Class A shares
(without sales charge) | |
|
| | | –7.04% | |
|
 | | FTSE NAREIT | |
|
| | | Equity REITs Index | |
|
Summary
g For the 12-month period that ended August 31, 2008, the fund's Class A shares returned negative 5.46% without sales charge.
g In a difficult environment, the fund held up better than its benchmark, the FTSE NAREIT Equity REITs Index,1 and its peer group, the Lipper Real Estate Funds Classification.2
g Management did well to emphasize office and industrial REITs, and stock selection within those subsectors was positive for performance. Strong performance from selected retail REITs also aided returns.
Portfolio Management
Arthur J. Hurley has managed the fund since September 2006 and has been with the advisor or its predecessors or affiliate organizations since 2006.
1The FTSE National Association of Real Estate Investment Trusts (NAREIT) Equity REITs Index tracks the performance of all publicly traded equity real estate investment trusts (REITs). Indices are not investments, do not incur fees or expenses and are not professionally managed. It is not possible to invest directly in an index. Securities in the fund may not match those in an index.
2Lipper Inc., a widely respected data provider in the industry, calculates an average total return (assuming reinvestment of distributions) for mutual funds with investment objectives similar to those of the fund. Lipper makes no adjustment for the effect of sales loads.
18
Performance Information – Columbia Real Estate Equity Fund
Growth of a $10,000 investment 09/01/98 – 08/31/08
The chart above shows the growth in value of a hypothetical $10,000 investment in Class A shares of Columbia Real Estate Equity Fund during the stated time period, and does not reflect the deduction of taxes that a shareholder may pay on fund distributions or on the redemption of fund shares. The FTSE National Association of Real Estate Investment Trusts (NAREIT) Equity REITs Index tracks the performance of all publicly traded equity real estate investment trusts (REITs). Indices are not investments, do not incur fees or expenses and are not professionally managed. It is not possible to invest directly in an index. Securities in the fund may not match those in an index.
Performance of a $10,000 investment 09/01/98 – 08/31/08 ($)
| Sales charge | | without | | with | |
| Class A | | | 31,108 | | | | 29,319 | | |
| Class B | | | 29,814 | | | | 29,814 | | |
| Class C | | | 29,792 | | | | 29,792 | | |
| Class Z | | | 31,658 | | | | n/a | | |
Average annual total return as of 08/31/08 (%)
| Share class | | A | | B | | C | | Z | |
| Inception | | 11/01/02 | | 11/01/02 | | 10/13/03 | | 04/01/94 | |
| Sales charge | | without | | with | | without | | with | | without | | with | | without | |
| 1-year | | | –5.46 | | | | –10.88 | | | | –6.21 | | | | –9.54 | | | | –6.18 | | | | –6.84 | | | | –5.21 | | |
| 5-year | | | 12.65 | | | | 11.33 | | | | 11.82 | | | | 11.65 | | | | 11.80 | | | | 11.80 | | | | 12.94 | | |
| 10-year | | | 12.02 | | | | 11.36 | | | | 11.54 | | | | 11.54 | | | | 11.53 | | | | 11.53 | | | | 12.21 | | |
Average annual total return as of 09/30/08 (%)
| Share class | | A | | B | | C | | Z | |
| Sales charge | | without | | with | | without | | with | | without | | with | | without | |
| 1-year | | | –8.97 | | | | –14.21 | | | | –9.65 | | | | –12.87 | | | | –9.66 | | | | –10.31 | | | | –8.74 | | |
| 5-year | | | 12.09 | | | | 10.77 | | | | 11.26 | | | | 11.09 | | | | 11.24 | | | | 11.24 | | | | 12.37 | | |
| 10-year | | | 11.46 | | | | 10.80 | | | | 10.98 | | | | 10.98 | | | | 10.97 | | | | 10.97 | | | | 11.65 | | |
The "with sales charge" returns include the maximum initial sales charge of 5.75% for Class A shares, the applicable contingent deferred sales charge of 5.00% in the first year, declining to 1.00% in the sixth year and eliminated thereafter for Class B shares and 1.00% for Class C shares for the first year only. The "without sales charge" returns do not include the effect of sales charges. If they had, returns would be lower.
Performance results reflect any fee waivers or reimbursements of fund expenses by the investment advisor and/or any of its affiliates. Absent these fee waivers or expense reimbursement arrangements, performance results would have been lower.
All results shown assume reinvestment of distributions. Class Z shares are sold at net asset value with no distribution and service (Rule 12b-1) fees. Class Z shares have limited eligibility and the investment minimum requirements may vary. Please see the fund's prospectus for details. Performance for different share classes will vary based on differences in sales charges and fees associated with each class.
The tables do not reflect the deduction of taxes that a shareholder may pay on fund distributions or on the redemption of fund shares.
Class A and Class B share performance information includes returns of the fund's Class Z shares (the oldest existing fund class) for periods prior to the inception of the newer class shares. The returns for Class C include the returns of Class B prior to 10/13/03, the date on which Class C was initially offered by the fund. The returns shown for Class C also include the performance of Class Z prior to the inception of Class B (11/01/02). Class Z share returns have not been restated to reflect any differences in expenses such as distribution and service (Rule 12b-1) fees between Class Z shares and the newer class shares. If differences in expenses had been reflected, the returns for the periods prior to the inception of Classes A, B and C would have been lower.
Performance data quoted represents past performance and current performance may be lower or higher. Past performance is no guarantee of future results. The investment return and principal value will fluctuate so that shares, when redeemed, may be worth more or less than the original cost. Please visit www.columbiafunds.com for daily and most recent month-end performance updates.
Annual operating expense ratio (%)*
| Class A | | | 1.23 | | |
| Class B | | | 1.98 | | |
| Class C | | | 1.98 | | |
| Class Z | | | 0.98 | | |
* The annual operating expense ratio is as stated in the fund's prospectus that is current as of the date of this report. Differences in expense ratios disclosed elsewhere in this report may result from including fee waivers and expense reimbursements as well as different time periods used in calculating the ratios.
19
Understanding Your Expenses – Columbia Real Estate Equity Fund
Estimating your actual expenses
To estimate the expenses that you paid over the period, first you will need your account balance at the end of the period:
g For shareholders who receive their account statements from Columbia Management Services, Inc., your account balance is available online at www.columbiafunds.com or by calling Shareholder Services at 800.345.6611.
g For shareholders who receive their account statements from their financial intermediary, contact your financial intermediary to obtain your account balance.
1. Divide your ending account balance by $1,000. For example, if an account balance was $8,600 at the end of the period, the result would be 8.6.
2. In the section of the table below titled "Expenses paid during the period," locate the amount for your share class. You will find this number in the column labeled "actual." Multiply this number by the result from step 1. Your answer is an estimate of the expenses you paid on your account during the period.
If the value of your account falls below the minimum initial investment requirement applicable to you, your account generally will be subject to a $20 annual fee. This fee is not included in the accompanying table. If you are subject to the fee, keep it in mind when you are estimating the ongoing expenses of investing in the fund and when comparing the expenses of this fund with other funds.
As a fund shareholder, you incur two types of costs. There are transaction costs, which generally include sales charges on purchases and may include redemption fees or exchange fees. There are also ongoing costs, which generally include investment advisory fees, distribution and service (Rule 12b-1) fees and other fund expenses. The information on this page is intended to help you understand the ongoing costs of investing in the fund and to compare these costs with the ongoing costs of investing in other mutual funds.
Analyzing your fund's expenses by share class
To illustrate these ongoing costs, we have provided an example and calculated the expenses paid by investors in each share class during the period. The information in the following table is based on an initial investment of $1,000, which is invested at the beginning of the period and held for the entire period. Expense information is calculated two ways and each method provides you with different information. The amount listed in the "actual" column is calculated using the fund's actual operating expenses and total return for the period. The amount listed in the "hypothetical" column for each share class assumes that the return each year is 5% before expenses and is calculated based on the fund's actual operating expenses. You should not use the hypothetical account values and expenses to estimate either your actual account balance at the end of the period or the expenses you paid during this period.
Compare with other funds
Since all mutual funds are required to include the same hypothetical calculations about expenses in shareholder reports, you can use this information to compare the ongoing costs of investing in the fund with other funds. To do so, compare the 5% hypothetical example with the 5% hypothetical examples that appear in the shareholder reports of other funds. As you compare hypothetical examples of other funds, it is important to note that hypothetical examples are meant to highlight the ongoing costs of investing in a fund and do not reflect any transaction costs, such as sales charges, redemption fees or exchange fees.
03/01/08 – 08/31/08
| | | Account value at the
beginning of the period ($) | | Account value at the
end of the period ($) | | Expenses paid
during the period ($) | | Fund's annualized
expense ratio (%) | |
| | | Actual | | Hypothetical | | Actual | | Hypothetical | | Actual | | Hypothetical | | Actual | |
| Class A | | | 1,000.00 | | | | 1,000.00 | | | | 1,109.39 | | | | 1,019.05 | | | | 6.42 | | | | 6.14 | | | | 1.21 | | |
| Class B | | | 1,000.00 | | | | 1,000.00 | | | | 1,105.12 | | | | 1,015.28 | | | | 10.37 | | | | 9.93 | | | | 1.96 | | |
| Class C | | | 1,000.00 | | | | 1,000.00 | | | | 1,105.42 | | | | 1,015.28 | | | | 10.37 | | | | 9.93 | | | | 1.96 | | |
| Class Z | | | 1,000.00 | | | | 1,000.00 | | | | 1,111.41 | | | | 1,020.31 | | | | 5.10 | | | | 4.88 | | | | 0.96 | | |
Expenses paid during the period are equal to the annualized expense ratio for the share class, multiplied by the average account value over the period, then multiplied by the number of days in the fund's most recent fiscal half-year and divided by 366.
It is important to note that the expense amounts shown in the table are meant to highlight only ongoing costs of investing in the fund and do not reflect any transaction costs, such as sales charges, redemption fees or exchange fees. Therefore, the hypothetical examples provided may not help you determine the relative total costs of owning shares of different funds. If these transaction costs were included, your costs would have been higher.
20
Portfolio Manager's Report – Columbia Real Estate Equity Fund
For the 12-month period that ended August 31, 2008, Columbia Real Estate Equity Fund Class A shares returned negative 5.46% without sales charge. The fund's benchmark, the FTSE NAREIT Equity REITs Index1, returned negative 7.04%. The average return of its peer group, the Lipper Real Estate Funds Classification2, was negative 9.14%. An economic slowdown and lack of available debt capital due to a credit crisis have negatively affected real estate fundamentals and asset valuations. In this environment, the fund's favorable performance relative to its benchmark was due to an emphasis on office and industrial real estate investment trusts ("REITs"), combined with positive stock selection in these property groups and among retail REITs.
Positioning in office and industrial REITs aided performance
An overweight in the office property group, together with careful stock selection within the group, helped drive returns during the period. Alexandria Real Estate Equities, Inc., a niche office REIT specializing in the life sciences sector, benefited from continued positive business fundamentals in the sector which increased demand for space. The fund's underweight in office REITs with exposure to the New York City market also aided returns, as the Manhattan office market grappled with fallout from the failures of major financial institutions.
During the first half of the year, the industrial property group was a positive contributor to REIT sector performance and an overweight in the group helped the fund's returns. Among key contributors in the group, industrial REIT ProLogis benefited from strong demand for space due to worldwide economic growth trends, including infrastructure development in Asia. Over the past six months, however, we have moved to an underweight position in both the industrial REIT group and ProLogis. This positioning was rewarded as ProLogis has since significantly underperformed due to concerns about its growing real estate development pipeline. Stock selection within the retail property group also provided a boost to the fund during the period. A top performer was premier mall operator Simon Property Group, Inc., which saw positive results from its high-quality real estate assets and industry-leading growth. Another top contributor was Plum Cr eek Timber Co., Inc., which benefited from timber's resiliency in the real estate market's downturn.
An underweight in apartment REITs detracted from returns
The fund had less exposure than the index to the apartment sector, which detracted from relative performance as apartment fundamentals proved more resilient than in prior cycles to a slowing economy and rising job losses. While the fund's overall light exposure to the hotel sector helped during the second half of the year as the hotel business faltered, an overweight position in LaSalle Hotel Properties relative to the index hurt as the company underperformed the broader REIT market. Commercial
1The FTSE National Association of Real Estate Investment Trusts (NAREIT) Equity REITs Index tracks the performance of all publicly traded equity real estate investment trusts (REITs). Indices are not investments, do not incur fees or expenses and are not professionally managed. It is not possible to invest directly in an index. Securities in the fund may not match those in an index.
2Lipper Inc., a widely respected data provider in the industry, calculates an average total return (assuming reinvestment of distributions) for mutual funds with investment objectives similar to those of the fund. Lipper makes no adjustment for the effect of sales loads.
Performance data quoted represents past performance and current performance may be lower or higher. Past performance is no guarantee of future results. The investment return and principal value will fluctuate so that shares, when redeemed, may be worth more or less than the original cost. Please visit www.columbiafunds.com for daily and most recent month-end performance updates.
Net asset value per share
as of 08/31/08 ($)
| Class A | | | 13.85 | | |
| Class B | | | 13.85 | | |
| Class C | | | 13.82 | | |
| Class Z | | | 13.88 | | |
Distribution declared per share
09/01/07 – 08/31/08 ($)
| Class A | | | 6.06 | | |
| Class B | | | 5.97 | | |
| Class C | | | 5.97 | | |
| Class Z | | | 6.09 | | |
Top 10 holdings
as of 08/31/08 (%)
| Simon Property Group, Inc. | | | 11.6 | | |
| Kimco Realty Corp. | | | 7.0 | | |
| Plum Creek Timber Co., Inc. | | | 5.8 | | |
| Ventas, Inc. | | | 5.2 | | |
Alexandria Real Estate
Equities, Inc. | | | 5.1 | | |
| Digital Realty Trust, Inc. | | | 4.5 | | |
Entertainment Properties
Trust | | | 4.4 | | |
Corporate Office
Properties Trust | | | 4.2 | | |
| Vornado Realty Trust | | | 4.1 | | |
| Essex Property Trust, Inc. | | | 4.1 | | |
Top sectors
as of 08/31/08 (%)
| Retail REITs | | | 27.1 | | |
| Specialized REITs | | | 23.2 | | |
| Office REITs | | | 22.9 | | |
| Residential REITs | | | 13.1 | | |
| Diversified REITs | | | 4.3 | | |
| Unclassified | | | 4.2 | | |
| Industrials REITs | | | 2.7 | | |
| Hotel Resorts & Cruise Lines | | | 2.7 | | |
21
Portfolio Manager's Report (continued) – Columbia Real Estate Equity Fund
Holdings discussed in this report
as of 08/31/08 (%)
Alexandria Real Estate
Equities, Inc. | | | 5.1 | | |
| ProLogis | | | 1.7 | | |
| Simon Property Group, Inc. | | | 11.6 | | |
| Plum Creek Timber Co., Inc. | | | 5.8 | | |
| LaSalle Hotel Properties | | | 2.6 | | |
The fund is actively managed and the composition of its portfolio will change over time. Information provided is calculated as a percentage of net assets.
mortgage loan underwriter iStar Financial, Inc. also detracted from returns when its stock fell out of favor with investors on concerns that credit issues in the housing market could be replicated in the commercial real estate market. We sold the stock during the period.
Defensive positioning
We believe that we are in the early stages of a downturn in the commercial real estate market, brought on by economic uncertainty and reduced availability of debt capital. As a result, we anticipate the REIT market will remain volatile and commercial real estate asset values and fundamentals will continue to be negatively affected for the remainder of 2008 and 2009. Against this backdrop, we have positioned the portfolio defensively, with a focus on companies with strong balance sheets and visible funding sources, seeking to avoid those with large development and redevelopment pipelines. We also look to take advantage of opportunities to invest in companies trading at steep discounts with visible catalysts by which to strengthen their balance sheets.
Portfolio holdings and characteristics are subject to change periodically and may not be representative of current holdings and characteristics. The outlook for the fund may differ from those presented for other Columbia Funds.
Equity investments are affected by stock market fluctuations that occur in response to economic and business developments.
The fund may be subject to the same types of risks associated with direct ownership of real estate including the decline of property values due to general, local and regional economic conditions. In addition, the fund's share price will likely be subject to more volatility than the overall stock market because it concentrates in real estate stocks.
22
Fund Profile – Columbia Technology Fund
Summary
g For the 12-month period that ended August 31, 2008, the fund's Class A shares returned negative 12.13% without sales charge.
g The fund outperformed the Merrill Lynch 100 Technology Index.1 The average return of the fund's peer group, the Lipper Science & Technology Funds Classification, was negative 10.56%.2
g Continued stock market volatility and weakness in the technology sector due to reduced corporate spending contributed to the fund's negative return for the year. However, positive performance from stock selection in key technology segments aided performance relative to the benchmark.
Portfolio Management
Wayne M. Collette has managed the fund since June 2002 and has been with the advisor or its predecessors or affiliate organizations since 2001.
1The Merrill Lynch 100 Technology Index is an equally-weighted index of 100 leading technology stocks. Indices are not investments, do not incur fees or expenses and are not professionally managed. It is not possible to invest directly in an index. Securities in the fund may not match those in an index.
2Lipper Inc., a widely respected data provider in the industry, calculates an average total return (assuming reinvestment of distributions) for mutual funds with investment objectives similar to those of the fund. Lipper makes no adjustment for the effect of sales loads.
Performance data quoted represents past performance and current performance may be lower or higher. Past performance is no guarantee of future results. The investment return and principal value will fluctuate so that shares, when redeemed, may be worth more or less than the original cost. Please visit www.columbiafunds.com for daily and most recent month-end performance updates.
Summary
1 year return as of 08/31/08
| | | –12.13% | |
|
 | | Class A shares
(without sales charge) | |
|
| | | –14.45% | |
|
 | | Merrill Lynch | |
|
| | | 100 Technology Index | |
|
23
Performance Information – Columbia Technology Fund
Performance data quoted represents past performance and current performance may be lower or higher. Past performance is no guarantee of future results. The investment return and principal value will fluctuate so that shares, when redeemed, may be worth more or less than the original cost. Please visit www.columbiafunds.com for daily and most recent month-end performance updates.
Annual operating expense ratio (%)*
| Class A | | | 1.46 | | |
| Class B | | | 2.21 | | |
| Class C | | | 2.21 | | |
| Class Z | | | 1.21 | | |
* The annual operating expense ratio is as stated in the fund's prospectus that is current as of the date of this report. Differences in expense ratios disclosed elsewhere in this report may result from including fee waivers and expense reimbursements as well as different time periods used in calculating the ratios.
Growth of a $10,000 investment 11/09/00 – 08/31/08
The chart above shows the growth in value of a hypothetical $10,000 investment in Class A shares of Columbia Technology Fund during the stated time period, and does not reflect the deduction of taxes that a shareholder may pay on fund distributions or on the redemption of fund shares. The Merrill Lynch 100 Technology Index is an equally-weighted index of 100 leading technology stocks. Indices are not investments, do not incur fees or expenses and are not professionally managed. It is not possible to invest directly in an index. Securities in the fund may not match those in an index.
Performance of a $10,000 investment 11/09/00 – 08/31/08 ($)
| Sales charge | | without | | with | |
| Class A | | | 10,814 | | | | 10,193 | | |
| Class B | | | 10,335 | | | | 10,335 | | |
| Class C | | | 10,355 | | | | 10,355 | | |
| Class Z | | | 11,005 | | | | n/a | | |
Average annual total return as of 08/31/08 (%)
| Share class | | A | | B | | C | | Z | |
| Inception | | 11/01/02 | | 11/01/02 | | 10/13/03 | | 11/09/00 | |
| Sales charge | | without | | with | | without | | with | | without | | with | | without | |
| 1-year | | | –12.13 | | | | –17.19 | | | | –12.80 | | | | –16.98 | | | | –12.78 | | | | –13.62 | | | | –11.93 | | |
| 5-year | | | 12.86 | | | | 11.54 | | | | 12.04 | | | | 11.78 | | | | 12.08 | | | | 12.08 | | | | 13.18 | | |
| Life | | | 1.01 | | | | 0.25 | | | | 0.42 | | | | 0.42 | | | | 0.45 | | | | 0.45 | | | | 1.23 | | |
Average annual total return as of 09/30/08 (%)
| Share class | | A | | B | | C | | Z | |
| Sales charge | | without | | with | | without | | with | | without | | with | | without | |
| 1-year | | | –31.68 | | | | –35.61 | | | | –32.17 | | | | –35.42 | | | | –32.18 | | | | –32.82 | | | | –31.49 | | |
| 5-year | | | 8.59 | | | | 7.33 | | | | 7.78 | | | | 7.49 | | | | 7.83 | | | | 7.83 | | | | 8.91 | | |
| Life | | | –1.30 | | | | –2.03 | | | | –1.87 | | | | –1.87 | | | | –1.84 | | | | –1.84 | | | | –1.07 | | |
The "with sales charge" returns include the maximum initial sales charge of 5.75% for Class A shares, the applicable contingent deferred sales charge of 5.00% in the first year, declining to 1.00% in the sixth year and eliminated thereafter for Class B shares and 1.00% for Class C shares for the first year only. The "without sales charge" returns do not include the effect of sales charges. If they had, returns would be lower.
Performance results reflect any fee waivers or reimbursements of fund expenses by the investment advisor and/or any of its affiliates. Absent these fee waivers or expense reimbursement arrangements, performance results would have been lower.
All results shown assume reinvestment of distributions. Class Z shares are sold at net asset value with no distribution and service (Rule 12b-1) fees. Class Z shares have limited eligibility and the investment minimum requirements may vary. Please see the fund's prospectus for details. Performance for different share classes will vary based on differences in sales charges and fees associated with each class.
The tables do not reflect the deduction of taxes that a shareholder may pay on fund distributions or on the redemption of fund shares.
Class A and Class B share performance information includes returns of the fund's Class Z shares (the oldest existing fund class) for periods prior to the inception of the newer class shares. The returns for Class C include the returns of Class B prior to 10/13/03, the date on which Class C was initially offered by the fund. The returns shown for Class C also include the performance of Class Z prior to the inception of Class B (11/01/02). Class Z share returns have not been restated to reflect any differences in expenses, such as distribution and service (Rule 12b-1) fees between Class Z shares and the newer class shares. If differences in expenses had been reflected, the returns for the periods prior to the inception of Classes A, B and C would have been lower.
24
Understanding Your Expenses – Columbia Technology Fund
As a fund shareholder, you incur two types of costs. There are transaction costs, which generally include sales charges on purchases and may include redemption fees or exchange fees. There are also ongoing costs, which generally include investment advisory fees, distribution and service (Rule 12b-1) fees and other fund expenses. The information on this page is intended to help you understand the ongoing costs of investing in the fund and to compare these costs with the ongoing costs of investing in other mutual funds.
Analyzing your fund's expenses by share class
To illustrate these ongoing costs, we have provided an example and calculated the expenses paid by investors in each share class during the period. The information in the following table is based on an initial investment of $1,000, which is invested at the beginning of the period and held for the entire period. Expense information is calculated two ways and each method provides you with different information. The amount listed in the "actual" column is calculated using the fund's actual operating expenses and total return for the period. The amount listed in the "hypothetical" column for each share class assumes that the return each year is 5% before expenses and is calculated based on the fund's actual operating expenses. You should not use the hypothetical account values and expenses to estimate either your actual account balance at the end of the period or the expenses you paid during this period.
Compare with other funds
Since all mutual funds are required to include the same hypothetical calculations about expenses in shareholder reports, you can use this information to compare the ongoing costs of investing in the fund with other funds. To do so, compare the 5% hypothetical example with the 5% hypothetical examples that appear in the shareholder reports of other funds. As you compare hypothetical examples of other funds, it is important to note that hypothetical examples are meant to highlight the ongoing costs of investing in a fund and do not reflect any transaction costs, such as sales charges, redemption fees or exchange fees.
Estimating your actual expenses
To estimate the expenses that you paid over the period, first you will need your account balance at the end of the period:
g For shareholders who receive their account statements from Columbia Management Services, Inc., your account balance is available online at www.columbiafunds.com or by calling Shareholder Services at 800.345.6611.
g For shareholders who receive their account statements from their financial intermediary, contact your financial intermediary to obtain your account balance.
1. Divide your ending account balance by $1,000. For example, if an account balance was $8,600 at the end of the period, the result would be 8.6.
2. In the section of the table below titled "Expenses paid during the period," locate the amount for your share class. You will find this number in the column labeled "actual." Multiply this number by the result from step 1. Your answer is an estimate of the expenses you paid on your account during the period.
If the value of your account falls below the minimum initial investment requirement applicable to you, your account generally will be subject to a $20 annual fee. This fee is not included in the accompanying table. If you are subject to the fee, keep it in mind when you are estimating the ongoing expenses of investing in the fund and when comparing the expenses of this fund with other funds.
03/01/08 – 08/31/08
| | | Account value at the
beginning of the period ($) | | Account value at the
end of the period ($) | | Expenses paid
during the period ($) | | Fund's annualized
expense ratio (%) | |
| | | Actual | | Hypothetical | | Actual | | Hypothetical | | Actual | | Hypothetical | | Actual | |
| Class A | | | 1,000.00 | | | | 1,000.00 | | | | 1,002.11 | | | | 1,018.30 | | | | 6.84 | | | | 6.90 | | | | 1.36 | | |
| Class B | | | 1,000.00 | | | | 1,000.00 | | | | 998.89 | | | | 1,014.53 | | | | 10.60 | | | | 10.68 | | | | 2.11 | | |
| Class C | | | 1,000.00 | | | | 1,000.00 | | | | 998.89 | | | | 1,014.53 | | | | 10.60 | | | | 10.68 | | | | 2.11 | | |
| Class Z | | | 1,000.00 | | | | 1,000.00 | | | | 1,004.12 | | | | 1,019.56 | | | | 5.59 | | | | 5.63 | | | | 1.11 | | |
Expenses paid during the period are equal to the annualized expense ratio for the share class, multiplied by the average account value over the period, then multiplied by the number of days in the fund's most recent fiscal half-year and divided by 366.
It is important to note that the expense amounts shown in the table are meant to highlight only ongoing costs of investing in the fund and do not reflect any transaction costs, such as sales charges, redemption fees or exchange fees. Therefore, the hypothetical examples provided may not help you determine the relative total costs of owning shares of different funds. If these transaction costs were included, your costs would have been higher.
25
Portfolio Managers' Report – Columbia Technology Fund
Performance data quoted represents past performance and current performance may be lower or higher. Past performance is no guarantee of future results. The investment return and principal value will fluctuate so that shares, when redeemed, may be worth more or less than the original cost. Please visit www.columbiafunds.com for daily and most recent month-end performance updates.
Net asset value per share
as of 08/31/08 ($)
| Class A | | | 9.72 | | |
| Class B | | | 9.39 | | |
| Class C | | | 9.41 | | |
| Class Z | | | 9.86 | | |
Distributions declared per share
09/01/07 – 08/31/08 ($)
| Class A | | | 0.61 | | |
| Class B | | | 0.52 | | |
| Class C | | | 0.52 | | |
| Class Z | | | 0.64 | | |
Top 5 sectors
as of 08/31/08 (%)
| Software & Services | | | 35.8 | | |
Technology Hardware &
Equipment | | | 26.8 | | |
Semiconductors &
Semi Equipment | | | 15.2 | | |
| Telecommunication Services | | | 6.5 | | |
| Capital Goods | | | 3.6 | | |
Top 10 holdings
as of 08/31/08 (%)
| Research In Motion Ltd. | | | 4.4 | | |
| Nokia Corp. | | | 3.8 | | |
| QUALCOMM, Inc. | | | 3.2 | | |
| Hewlett-Packard Co. | | | 2.4 | | |
| Apple, Inc. | | | 2.3 | | |
| Salesforce.com, Inc. | | | 2.2 | | |
| First Solar, Inc. | | | 2.0 | | |
| Harris Corp. | | | 1.9 | | |
Cognizant Technology
Solutions Corp. | | | 1.8 | | |
| Omniture, Inc. | | | 1.8 | | |
Tables exclude investment in short-term obligations.
The fund is actively managed and the composition of its portfolio will change over time. Information provided is calculated as a percentage of net assets.
For the 12-month period that ended August 31, 2008, Columbia Technology Fund Class A shares returned negative 12.13% without sales charge. The fund outperformed its benchmark, the Merrill Lynch 100 Technology Index, which returned negative 14.45% for the same period.1 Its return was less than the average return of its peer group, the Lipper Science & Technology Funds Classification, which was negative 10.56%.2 The fund's absolute return reflected a deteriorating economic environment, which affected stock returns, in general, and technology spending in particular. Stock selection in the communications equipment, computers and peripherals and software groups aided performance relative to the fund's benchmark. We believe that exposure to the technology services sector hurt the fund relative to its peers.
Areas of favorable stock selection
While technology spending was down overall, communications equipment has held up well despite a weakening economy. Blackberry-maker Research in Motion Ltd. was a top contributor during the period, benefiting from strong subscriber growth. QUALCOMM, Inc., which makes chips for handsets such as the Blackberry, experienced revenue growth as increased multi-media functionality drove strong demand for cellphones and related wireless devices. Apple, Inc. was another beneficiary of this trend, capturing consumer attention with its 3G network iPhone, while also generating surprising demand for its Mac laptops in a weak consumer spending environment.
Among computer names, International Business Machines Corp. received a revenue tailwind from the weakening dollar because it derives a significant portion of its revenues from overseas. The company also gained market share in the information technology outsourcing space due to corporate cost-cutting and wage inflation in India, making companies in that country less competitively priced. Several software names also aided returns. Travel expense software maker, Concur Technologies, Inc., benefited from corporate cost-cutting initiatives and the 13% stake that American Express took in the firm, boosting its stock. Nintendo soared on success of its Wii product, which has completely altered the gaming and video gaming console business. The fund was also significantly underweight in semiconductors, which is at the mercy of corporate spending decisions and was one of the worst-performing technology segments during the period.
Performance detractors
The information technology services group held the fund back overall. We subsequently sold the fund's largest negative contributor, Total Systems Services, which suffered due to the negative effect of the credit turmoil on its business of electronic payment processing. While the smartphone phenomenon has been a boon to the fund overall, Finnish handset maker Nokia performed poorly due to investor concerns about growing competition from Research in Motion and Apple. However, we believe that investors
1The Merrill Lynch 100 Technology Index is an equally-weighted index of 100 leading technology stocks. Indices are not investments, do not incur fees or expenses and are not professionally managed. It is not possible to invest directly in an index. Securities in the fund may not match those in an index.
2Lipper Inc., a widely respected data provider in the industry, calculates an average total return (assuming reinvestment of distributions) for mutual funds with investment objectives similar to those of the fund. Lipper makes no adjustment for the effect of sales loads.
26
Portfolio Manager's Report (continued) – Columbia Technology Fund
have underestimated the strong management, product set and advantages that Nokia has in overseas markets. Therefore, we continue to hold the stock.
A cautious approach
We remain cautious in our approach to the technology sector as spending on technology has slowed. As a result, we plan to continue to examine companies on an individual basis and to seek those with quality management and earnings growth. We remain mindful that many companies are susceptible to the corporate technology spending cycle and look to identify firms that can benefit from a weak economy, including those that provide products or services that help companies cut costs and improve productivity. We are particularly interested in smartphones, which offer the alluring prospect of Internet access and media functionality.
Portfolio holdings and characteristics are subject to change periodically and may not be representative of current holdings and characteristics. The outlook for the fund may differ from those presented for other Columbia Funds.
Equity investments are affected by stock market fluctuations that occur in response to economic and business developments.
The share price of a fund that invests primarily in one sector will likely be subject to more volatility than a fund that invests across many sectors. Technology stocks may be more volatile than stocks in other sectors. The fund should be considered part of an overall investment program, and not a complete investment program.
International investing may involve certain risks, including currency fluctuation, risks associated with possible differences in financial standards and other monetary and political risks. Significant levels of foreign taxes, including potentially confiscatory levels of taxation and withholding taxes, may also apply to some foreign investments.
Investing in emerging markets may involve greater risks than investing in more developed countries. In addition, concentration of investments in a single region may result in greater volatility.
Holdings discussed in this report
as of 08/31/08 (%)
| Research in Motion Ltd. | | | 4.4 | | |
| QUALCOMM, Inc. | | | 3.2 | | |
| Apple, Inc. | | | 2.3 | | |
International Business
Machines Corp. | | | 1.3 | | |
| Concur Technologies, Inc. | | | 0.7 | | |
| Nintendo Co., Ltd. | | | 1.4 | | |
| Nokia Corp. | | | 3.8 | | |
The fund is actively managed and the composition of its portfolio will change over time. Information provided is calculated as a percentage of net assets.
27
Fund Profile – Columbia Strategic Investor Fund
Performance data quoted represents past performance and current performance may be lower or higher. Past performance is no guarantee of future results. The investment return and principal value will fluctuate so that shares, when redeemed, may be worth more or less than the original cost. Please visit www.columbiafunds.com for daily and most recent month-end performance updates.
Summary
1 year return as of 08/31/08
| | | –7.09% | |
|
 | | Class A shares
(without sales charge) | |
|
| | | –10.60% | |
|
 | | Russell 1000 Index1 | |
|
Morningstar Style Box
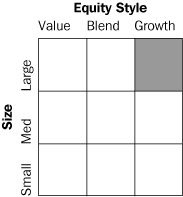
The Morningstar Style Box reveals a fund's investment strategy. For equity funds the vertical axis shows the market capitalization of the stocks owned and the horizontal axis shows investment style (value, blend or growth). All of these numbers are drawn from the data most recently provided by the fund and entered into Morningstar's database as of month end. Although the data is gathered from reliable sources, Morningstar cannot guarantee completeness and accuracy. Information shown is as of 07/31/2008.
Summary
g For the 12-month period that ended August 31, 2008, the fund's Class A shares returned negative 7.09% without sales charge.
g In a difficult environment for stocks overall, the fund held up better than its benchmark and peer group.
g Stock selection and, to a lesser extent, favorable sector weights contributed to the fund's relative outperformance. Stocks in the energy, financials, health care and materials sectors were particularly helpful.
Portfolio Management
Emil A. Gjester, lead manager of the fund, has managed or co-managed the fund since May 2002 and has been with the advisor or its predecessors or affiliate organizations since 1996.
Jonas Patrikson has co-managed the fund since February 2006 and has been with the advisor or its predecessors or affiliate organizations since 2004.
Michael T. Welter has co-managed the fund since July 2006 and has been with the advisor since 2006.
Mary-Ann Ward has co-managed the fund since April 2008 and has been with the advisor or its predecessors or affiliate organizations since 1997.
1The Russell 1000 Index measures the performance of 1,000 of the largest US companies, based on market capitalization. Indices are not investments, do not incur fees or expenses and are not professionally managed. It is not possible to invest directly in an index. Securities in the fund may not match those in an index.
28
Performance Information – Columbia Strategic Investor Fund
Growth of a $10,000 investment 11/09/00 – 08/31/08
The chart above shows the growth in value of a hypothetical $10,000 investment in Class A shares of Columbia Strategic Investor Fund during the stated time period, and does not reflect the deduction of taxes that a shareholder may pay on fund distributions or on the redemption of fund shares. The Russell 1000 Index measures the performance of 1,000 of the largest US companies, based on market capitalization. Indices are not investments, do not incur fees or expenses and are not professionally managed. It is not possible to invest directly in an index. Securities in the fund may not match those in an index.
Performance of a $10,000 investment 11/09/00 – 08/31/08 ($)
| Sales charge | | without | | with | |
| Class A | | | 25,565 | | | | 24,098 | | |
| Class B | | | 24,447 | | | | 24,447 | | |
| Class C | | | 24,457 | | | | 24,457 | | |
| Class Z | | | 25,942 | | | | n/a | | |
Average annual total return as of 08/31/08 (%)
| Share class | | A | | B | | C | | Z | |
| Inception | | 11/01/02 | | 11/01/02 | | 10/13/03 | | 11/09/00 | |
| Sales charge | | without | | with | | without | | with | | without | | with | | without | |
| 1-year | | | –7.09 | | | | –12.43 | | | | –7.77 | | | | –11.94 | | | | –7.72 | | | | –8.56 | | | | –6.85 | | |
| 5-year | | | 9.60 | | | | 8.31 | | | | 8.80 | | | | 8.51 | | | | 8.81 | | | | 8.81 | | | | 9.88 | | |
| Life | | | 12.77 | | | | 11.92 | | | | 12.13 | | | | 12.13 | | | | 12.14 | | | | 12.14 | | | | 12.99 | | |
Average annual total return as of 09/30/08 (%)
| Share class | | A | | B | | C | | Z | |
| Sales charge | | without | | with | | without | | with | | without | | with | | without | |
| 1-year | | | –21.90 | | | | –26.39 | | | | –22.50 | | | | –25.99 | | | | –22.45 | | | | –23.15 | | | | –21.69 | | |
| 5-year | | | 7.30 | | | | 6.04 | | | | 6.51 | | | | 6.20 | | | | 6.52 | | | | 6.52 | | | | 7.57 | | |
| Life | | | 11.02 | | | | 10.19 | | | | 10.38 | | | | 10.38 | | | | 10.39 | | | | 10.39 | | | | 11.23 | | |
The "with sales charge" returns include the maximum initial sales charge of 5.75% for Class A shares, the applicable contingent deferred sales charge of 5.00% in the first year, declining to 1.00% in the sixth year and eliminated thereafter for Class B shares and 1.00% for Class C shares for the first year only. The "without sales charge" returns do not include the effect of sales charges. If they had, returns would be lower.
Performance results reflect any fee waivers or reimbursements of fund expenses by the investment advisor and/or any of its affiliates. Absent these fee waivers or expense reimbursement arrangements, performance results would have been lower.
All results shown assume reinvestment of distributions, Class Z shares are sold at net asset value with no distribution and service (Rule 12b-1) fees. Class Z shares have limited eligibility and the investment minimum requirements may vary. Please see the fund's prospectus for details. Performance for different share classes will vary based on differences in sales charges and fees associated with each class.
The tables do not reflect the deduction of taxes that a shareholder may pay on fund distributions or on the redemption of fund shares.
Class A and Class B share performance information includes returns of the fund's Class Z shares (the oldest existing fund class) for periods prior to the inception of the newer class shares. The returns for Class C include the returns of Class B prior to 10/13/03, the date on which Class C was initially offered by the fund. The returns shown for Class C also include the performance of Class Z prior to the inception of Class B (11/01/02). Class Z share returns have not been restated to reflect any differences in expenses, such as distribution and service (Rule 12b-1) fees between Class Z shares and the newer class shares. If differences in expenses had been reflected, the returns for the periods prior to the inception of Classes A, B and C would have been lower.
Performance data quoted represents past performance and current performance may be lower or higher. Past performance is no guarantee of future results. The investment return and principal value will fluctuate so that shares, when redeemed, may be worth more or less than the original cost. Please visit www.columbiafunds.com for daily and most recent month-end performance updates.
Annual operating expense ratio (%)*
| Class A | | | 1.32 | | |
| Class B | | | 2.07 | | |
| Class C | | | 2.07 | | |
| Class Z | | | 1.07 | | |
* The annual operating expense ratio is as stated in the fund's prospectus that is current as of the date of this report. Differences in expense ratios disclosed elsewhere in this report may result from including fee waivers and expense reimbursements as well as different time periods used in calculating the ratios.
29
Understanding Your Expenses – Columbia Strategic Investor Fund
Estimating your actual expenses
To estimate the expenses that you paid over the period, first you will need your account balance at the end of the period:
g For shareholders who receive their account statements from Columbia Management Services, Inc., your account balance is available online at www.columbiafunds.com or by calling Shareholder Services at 800.345.6611.
g For shareholders who receive their account statements from their financial intermediary, contact your financial intermediary to obtain your account balance.
1. Divide your ending account balance by $1,000. For example, if an account balance was $8,600 at the end of the period, the result would be 8.6.
2. In the section of the table below titled "Expenses paid during the period," locate the amount for your share class. You will find this number in the column labeled "actual." Multiply this number by the result from step 1. Your answer is an estimate of the expenses you paid on your account during the period.
If the value of your account falls below the minimum initial investment requirement applicable to you, your account generally will be subject to a $20 annual fee. This fee is not included in the accompanying table. If you are subject to the fee, keep it in mind when you are estimating the ongoing expenses of investing in the fund and when comparing the expenses of this fund with other funds.
As a fund shareholder, you incur two types of costs. There are transaction costs, which generally include sales charges on purchases and may include redemption fees or exchange fees. There are also ongoing costs, which generally include investment advisory fees, distribution and service (Rule 12b-1) fees and other fund expenses. The information on this page is intended to help you understand the ongoing costs of investing in the fund and to compare these costs with the ongoing costs of investing in other mutual funds.
Analyzing your fund's expenses by share class
To illustrate these ongoing costs, we have provided an example and calculated the expenses paid by investors in each share class during the period. The information in the following table is based on an initial investment of $1,000, which is invested at the beginning of the period and held for the entire period. Expense information is calculated two ways and each method provides you with different information. The amount listed in the "actual" column is calculated using the fund's actual operating expenses and total return for the period. The amount listed in the "hypothetical" column for each share class assumes that the return each year is 5% before expenses and is calculated based on the fund's actual operating expenses. You should not use the hypothetical account values and expenses to estimate either your actual account balance at the end of the period or the expenses you paid during this period.
Compare with other funds
Since all mutual funds are required to include the same hypothetical calculations about expenses in shareholder reports, you can use this information to compare the ongoing costs of investing in the fund with other funds. To do so, compare the 5% hypothetical example with the 5% hypothetical examples that appear in the shareholder reports of other funds. As you compare hypothetical examples of other funds, it is important to note that hypothetical examples are meant to highlight the ongoing costs of investing in a fund and do not reflect any transaction costs, such as sales charges, redemption fees or exchange fees.
03/01/08 – 08/31/08
| | | Account value at the
beginning of the period ($) | | Account value at the
end of the period ($) | | Expenses paid
during the period ($) | | Fund's annualized
expense ratio (%) | |
| | | Actual | | Hypothetical | | Actual | | Hypothetical | | Actual | | Hypothetical | | Actual | |
| Class A | | | 1,000.00 | | | | 1,000.00 | | | | 973.51 | | | | 1,018.95 | | | | 6.10 | | | | 6.24 | | | | 1.23 | | |
| Class B | | | 1,000.00 | | | | 1,000.00 | | | | 969.99 | | | | 1,015.18 | | | | 9.80 | | | | 10.03 | | | | 1.98 | | |
| Class C | | | 1,000.00 | | | | 1,000.00 | | | | 969.99 | | | | 1,015.18 | | | | 9.80 | | | | 10.03 | | | | 1.98 | | |
| Class Z | | | 1,000.00 | | | | 1,000.00 | | | | 974.61 | | | | 1,020.21 | | | | 4.86 | | | | 4.98 | | | | 0.98 | | |
Expenses paid during the period are equal to the annualized expense ratio for the share class, multiplied by the average account value over the period, then multiplied by the number of days in the fund's most recent fiscal half-year and divided by 366.
Had the investment advisor and/or any of its affiliates not waived fees or reimbursed a portion of expenses, account value at the end of the period would have been reduced.
It is important to note that the expense amounts shown in the table are meant to highlight only ongoing costs of investing in the fund and do not reflect any transaction costs, such as sales charges, redemption fees or exchange fees. Therefore, the hypothetical examples provided may not help you determine the relative total costs of owning shares of different funds. If these transaction costs were included, your costs would have been higher.
30
Portfolio Managers' Report – Columbia Strategic Investor Fund
For the 12-month period that ended August 31, 2008, Columbia Strategic Investor Fund Class A shares returned negative 7.09% without sales charge. The fund's benchmark, the Russell 1000 Index, returned negative 10.60%,1 and the average return of its peer group, the Lipper Multi-Cap Core Funds Classification, was negative 10.81%.2 In a period that was generally challenging for stocks, the fund held up better than its benchmark and peers because of good stock selection and, to a lesser extent, because of favorable sector weights.
Stocks in a broad range of economic sectors drove performance
Stock selection in the energy, financials, health care and materials sectors provided the biggest benefit to return. In the energy sector, Continental Resources, Inc. and Southwestern Energy Co. were strong performers. Among health care companies, Masimo Corp., Express Scripts, Inc. and Illumina, Inc. made positive contributions to results. Monsanto Co. was an important holding in the materials sector.
Throughout the period, the financials sector was in significant turmoil; however, the fund's financials holdings did better than the benchmark, primarily because of stock selection. Digital Realty Trust, Inc. and State Street Corp. were particularly noteworthy. However, Ambac Financial Group, Inc., National Financial Partners Corp. and Freddie Mac faced a challenging environment and were eliminated from the portfolio.
Several other sectors also contributed modestly to the fund's solid relative performance. In the consumer discretionary area, NIKE, Inc. was helpful. In consumer staples, Longs Drug Stores Corp. aided return, and we took profits in the stock. Exelon Corp., in the utilities sector, also helped performance. The telecommunication services sector also contributed modestly to the fund's relative performance. Stocks that made poor showings included Home Inns & Hotels Management, Inc. in consumer discretionary; Bare Escentuals, Inc. in consumer staples; NII Holdings, Inc. in telecommunications and Mirant Corp. in utilities. All of these were sold.
The fund's investments in the industrials and information technology sectors detracted from performance. In industrials, Huron Consulting Group, Inc. and Rockwell Collins Corp. did poorly, and we sold them. Conversely, Joy Global, Inc. benefited return. In information technology, 3Par, Inc., DST Systems, Inc. and RF Micro Devices, Inc. were disappointments. All were sold. More positively, software developer Ansys, Inc. contributed to performance, and we took profits in the stock.
1The Russell 1000 Index measures the performance of 1,000 of the largest US companies, based on market capitalization. Indices are not investments, do not incur fees or expenses and are not professionally managed. It is not possible to invest directly in an index. Securities in the fund may not match those in an index.
2Lipper Inc., a widely respected data provider in the industry, calculates an average total return (assuming reinvestment of distributions) for mutual funds with investment objectives similar to those of the fund. Lipper makes no adjustment for the effect of sales loads.
Performance data quoted represents past performance and current performance may be lower or higher. Past performance is no guarantee of future results. The investment return and principal value will fluctuate so that shares, when redeemed, may be worth more or less than the original cost. Please visit www.columbiafunds.com for daily and most recent month-end performance updates.
Net asset value per share
as of 08/31/08 ($)
| Class A | | | 18.01 | | |
| Class B | | | 17.45 | | |
| Class C | | | 17.46 | | |
| Class Z | | | 18.06 | | |
Distributions declared per share
09/01/07 – 08/31/08 ($)
| Class A | | | 2.28 | | |
| Class B | | | 2.21 | | |
| Class C | | | 2.21 | | |
| Class Z | | | 2.33 | | |
Top 5 sectors
as of 08/31/08 (%)
| Information Technology | | | 17.3 | | |
| Financials | | | 14.6 | | |
| Energy | | | 14.3 | | |
| Health Care | | | 12.3 | | |
| Industrials | | | 11.2 | | |
Top 10 holdings
as of 08/31/08 (%)
| Exxon Mobil Corp. | | | 2.0 | | |
| JPMorgan Chase & Co. | | | 1.7 | | |
| General Electric Co. | | | 1.5 | | |
| Hewlett-Packard Co. | | | 1.5 | | |
| Cisco Systems, Inc. | | | 1.5 | | |
| Microsoft Corp. | | | 1.4 | | |
| Apple, Inc. | | | 1.4 | | |
| Coca-Cola Co. | | | 1.3 | | |
| ConocoPhillips | | | 1.2 | | |
Freeport McMoRan
Copper & Gold, Inc. | | | 1.2 | | |
The fund is actively managed and the composition of its portfolio will change over time. Information provided is calculated as a percentage of net assets.
31
Portfolio Managers' Report (continued) – Columbia Strategic Investor Fund
Holdings discussed in this report
as of 08/31/08 (%)
| Continental Resources, Inc. | | | 0.2 | | |
| Southwestern Energy Co. | | | 0.5 | | |
| Masimo Corp. | | | 0.4 | | |
| Express Scripts, Inc. | | | 0.3 | | |
| Illumina, Inc. | | | 0.3 | | |
| Monsanto Co. | | | 0.4 | | |
| Digital Realty Trust, Inc. | | | 0.5 | | |
| State Street Corp. | | | 0.4 | | |
| NIKE, Inc. | | | 0.9 | | |
| Exelon Corp. | | | 0.8 | | |
| Joy Global, Inc. | | | 0.5 | | |
The fund is actively managed and the composition of its portfolio will change over time. Information provided is calculated as a percentage of net assets.
Opportunities despite difficult economic environment
During the period, we have dealt with a U.S. economy that experienced declining consumer confidence, high energy prices, a weak housing sector and problems in the financial system. We believe that these issues will continue to weigh on the U.S. economy. While the investment environment is very difficult, it is presenting us with an opportunity to invest in high quality companies at attractive valuations in many sector. We also continue to hold a favorable long-term view of the energy sector. Finally, we plan to continue to evaluate compelling growth trends and valuations in overseas markets.
Portfolio holdings and characteristics are subject to change periodically and may not be representative of current holdings and characteristics. The outlook for the fund may differ from those presented for other Columbia Funds.
Equity investments are affected by stock market fluctuations that occur in response to economic and business developments.
Investments in small- and mid-cap stocks may present special risks. They tend to be more volatile and may be less liquid than the stocks of larger companies. Small-cap stocks often have narrower markets, limited financial resources and tend to be more thinly traded than stocks of larger companies.
32
Fund Profile – Columbia Balanced Fund
Summary
g For the 12-month period that ended August 31, 2008, the fund's class A shares returned negative 0.22% without sales charge.
g The fund's return was higher than the average return of its peer group.
g Strong stock selection in the equity portion of the fund helped offset laggards on the fixed-income side of the fund.
Portfolio Management
Columbia Balanced Fund is managed by a manager from Columbia's large-cap core team:
Guy W. Pope
and by managers from Columbia's bond team:
Leonard A. Aplet Ronald B. Stahl Kevin L. Cronk Thomas A. LaPointe
Guy W. Pope has co-managed the fund since 1997 and has been associated with the advisor or its predecessors or affiliate organizations since 1993.
Leonard A. Aplet has co-managed the fund since October 1991 and has been associated with the advisor or its predecessors or affiliate organizations since 1987.
Ronald B. Stahl has co-managed the fund since March 2005 and has been associated with the advisor or its predecessors or affiliate organizations since 1998.
Kevin L. Cronk has co-managed the fund since November 2006 and has been associated with the advisor or its predecessors or affiliate organizations since 1999.
Thomas A. LaPointe has co-managed the fund since November 2006 and has been associated with the advisor or its predecessors or affiliate organizations since 1999.
1The Standard & Poor's (S&P) 500 Index tracks the performance of 500 widely held, large-capitalization US stocks. Indices are not investments, do not incur fees or expenses and are not professionally managed. It is not possible to invest directly in an index. Securities in the fund may not match those in an index.
2The Lehman Brothers U.S. Aggregate Bond Index is a market value-weighted index that tracks the daily price, coupon, pay-downs and total return performance of fixed-rate, publicly placed, dollar-denominated and non-convertible investment-grade debt issues with at least $250 million par amount outstanding and with at least one year to final maturity. Indices are not investments, do not incur fees or expenses and are not professionally managed. It is not possible to invest directly in an index. Securities in the fund may not match those in an index.
Performance data quoted represents past performance and current performance may be lower or higher. Past performance is no guarantee of future results. The investment return and principal value will fluctuate so that shares, when redeemed, may be worth more or less than the original cost. Please visit www.columbiafunds.com for daily and most recent month-end performance updates.
Summary
1 year return as of 08/31/08
| | –0.22% | |
|
 | | Class A share
(without sales charge) | |
|
| | –11.14% | |
|
 | | S&P 500 Index1 | |
|
| | +5.86% | |
|
 | | Lehman Brothers
U.S. Aggregate Bond Index2 | |
|
33
Performance Information – Columbia Balanced Fund
Performance data quoted represents past performance and current performance may be lower or higher. Past performance is no guarantee of future results. The investment return and principal value will fluctuate so that shares, when redeemed, may be worth more or less than the original cost. Please visit www.columbiafunds.com for daily and most recent month-end performance updates.
Annual operating expense ratio (%)*
| Class A | | | 1.03 | | |
| Class B | | | 1.78 | | |
| Class C | | | 1.78 | | |
| Class Z | | | 0.78 | | |
* The annual operating expense ratio is as stated in the fund's prospectus that is current as of the date of this report. Differences in expense ratios disclosed elsewhere in this report may result from including fee waivers and expense reimbursements as well as different time periods used in calculating the ratios.
Growth of a $10,000 investment 09/01/98 – 08/31/08
The chart above shows the growth in value of a hypothetical $10,000 investment in Class A shares of Columbia Balanced Fund during the stated time period, and does not reflect the deduction of taxes that a shareholder may pay on fund distributions or on the redemption of fund shares. The Standard & Poor's (S&P) 500 Index tracks the performance of 500 widely held, large-capitalization US stocks. The Lehman Brothers U.S. Aggregate Bond Index is a market value-weighted index that tracks the daily price, coupon, pay-downs and total return performance of fixed-rate, publicly placed, dollar-denominated and non-convertible investment-grade debt issues with at least $250 million par amount outstanding and with at least one year to final maturity. Indices are not investments, do not incur fees or expenses and are not professionally managed. It is not possible to invest directly in an index. Securities in the fund may not match tho se in an index.
Performance of a $10,000 investment 09/01/98 – 08/31/08 ($)
| Sales charge | | without | | with | |
| Class A | | | 16,329 | | | | 15,392 | | |
| Class B | | | 15,631 | | | | 15,631 | | |
| Class C | | | 15,631 | | | | 15,631 | | |
| Class Z | | | 16,618 | | | | n/a | | |
Average annual total return as of 08/31/08 (%)
| Share class | | A | | B | | C | | Z | |
| Inception | | 11/01/02 | | 11/01/02 | | 10/13/03 | | 10/01/91 | |
| Sales charge | | without | | with | | without | | with | | without | | with | | without | |
| 1-year | | | –0.22 | | | | –5.95 | | | | –0.97 | | | | –5.82 | | | | –0.97 | | | | –1.94 | | | | 0.07 | | |
| 5-year | | | 6.73 | | | | 5.47 | | | | 5.93 | | | | 5.61 | | | | 5.93 | | | | 5.93 | | | | 7.01 | | |
| 10-year | | | 5.03 | | | | 4.41 | | | | 4.57 | | | | 4.57 | | | | 4.57 | | | | 4.57 | | | | 5.21 | | |
Average annual total return as of 09/30/08 (%)
| Share class | | A | | B | | C | | Z | |
| Sales charge | | without | | with | | without | | with | | without | | with | | without | |
| 1-year | | | –9.63 | | | | –14.81 | | | | –10.29 | | | | –14.68 | | | | –10.33 | | | | –11.20 | | | | –9.41 | | |
| 5-year | | | 5.41 | | | | 4.17 | | | | 4.61 | | | | 4.27 | | | | 4.61 | | | | 4.61 | | | | 5.67 | | |
| 10-year | | | 3.99 | | | | 3.37 | | | | 3.53 | | | | 3.53 | | | | 3.53 | | | | 3.53 | | | | 4.17 | | |
The "with sales charge" returns include the maximum initial sales charge of 5.75% for Class A shares, the applicable contingent deferred sales charge of 5.00% in the first year, declining to 1.00% in the sixth year and eliminated thereafter for Class B shares and 1.00% for Class C shares for the first year only. The "without sales charge" returns do not include the effect of sales charges. If they had, returns would be lower.
Performance results reflect any fee waivers or reimbursements of fund expenses by the investment advisor and/or any of its affiliates. Absent these fee waivers or expense reimbursement arrangements, performance results would have been lower.
All results shown assume reinvestment of distributions. Class Z shares are sold at net asset value with no distribution and service (Rule 12b-1) fees. Class Z shares have limited eligibility and the investment minimum requirements may vary. Please see the fund's prospectus for details. Performance for different share classes will vary based on differences in sales charges and fees associated with each class.
The tables do not reflect the deduction of taxes that a shareholder may pay on fund distributions or on the redemption of fund shares.
Class A and Class B share performance information includes returns of the fund's Class Z shares (the oldest existing fund class) for periods prior to the inception of the newer class shares. The returns for Class C include the returns of Class B prior to 10/13/03, the date on which Class C was initially offered by the fund. The returns shown for Class C also include the performance of Class Z prior to the inception of Class B (11/01/02). Class Z share returns have not been restated to reflect any differences in expenses such as distribution and service (Rule 12b-1) fees between Class Z shares and the newer class shares. If differences in expenses had been reflected, the returns for the periods prior to the inception of Classes A, B, and C would have been lower.
34
Understanding Your Expenses – Columbia Balanced Fund
As a fund shareholder, you incur two types of costs. There are transaction costs, which generally include sales charges on purchases and may include redemption fees or exchange fees. There are also ongoing costs, which generally include investment advisory fees, distribution and service (Rule 12b-1) fees and other fund expenses. The information on this page is intended to help you understand the ongoing costs of investing in the fund and to compare these costs with the ongoing costs of investing in other mutual funds.
Analyzing your fund's expenses by share class
To illustrate these ongoing costs, we have provided an example and calculated the expenses paid by investors in each share class during the period. The information in the following table is based on an initial investment of $1,000, which is invested at the beginning of the period and held for the entire period. Expense information is calculated two ways and each method provides you with different information. The amount listed in the "actual" column is calculated using the fund's actual operating expenses and total return for the period. The amount listed in the "hypothetical" column for each share class assumes that the return each year is 5% before expenses and is calculated based on the fund's actual operating expenses. You should not use the hypothetical account values and expenses to estimate either your actual account balance at the end of the period or the expenses you paid during this period.
Compare with other funds
Since all mutual funds are required to include the same hypothetical calculations about expenses in shareholder reports, you can use this information to compare the ongoing costs of investing in the fund with other funds. To do so, compare the 5% hypothetical example with the 5% hypothetical examples that appear in the shareholder reports of other funds. As you compare hypothetical examples of other funds, it is important to note that hypothetical examples are meant to highlight the ongoing costs of investing in a fund and do not reflect any transaction costs, such as sales charges, redemption fees or exchange fees.
Estimating your actual expenses
To estimate the expenses that you paid over the period, first you will need your account balance at the end of the period:
g For shareholders who receive their account statements from Columbia Management Services, Inc., your account balance is available online at www.columbiafunds.com or by calling Shareholder Services at 800.345.6611.
g For shareholders who receive their account statements from their financial intermediary, contact your financial intermediary to obtain your account balance.
1. Divide your ending account balance by $1,000. For example, if an account balance was $8,600 at the end of the period, the result would be 8.6.
2. In the section of the table below titled "Expenses paid during the period," locate the amount for your share class. You will find this number in the column labeled "actual." Multiply this number by the result from step 1. Your answer is an estimate of the expenses you paid on your account during the period.
If the value of your account falls below the minimum initial investment requirement applicable to you, your account generally will be subject to a $20 annual fee. This fee is not included in the accompanying table. If you are subject to the fee, keep it in mind when you are estimating the ongoing expenses of investing in the fund and when comparing the expenses of this fund with other funds.
03/01/08 – 08/31/08
| | | Account value at the
beginning of the period ($) | | Account value at the
end of the period ($) | | Expenses paid
during the period ($) | | Fund's annualized
expense ratio (%) | |
| | | Actual | | Hypothetical | | Actual | | Hypothetical | | Actual | | Hypothetical | | Actual | |
| Class A | | | 1,000.00 | | | | 1,000.00 | | | | 997.49 | | | | 1,020.41 | | | | 4.72 | | | | 4.77 | | | | 0.94 | | |
| Class B | | | 1,000.00 | | | | 1,000.00 | | | | 993.62 | | | | 1,016.64 | | | | 8.47 | | | | 8.57 | | | | 1.69 | | |
| Class C | | | 1,000.00 | | | | 1,000.00 | | | | 993.62 | | | | 1,016.64 | | | | 8.47 | | | | 8.57 | | | | 1.69 | | |
| Class Z | | | 1,000.00 | | | | 1,000.00 | | | | 998.69 | | | | 1,021.67 | | | | 3.47 | | | | 3.51 | | | | 0.69 | | |
Expenses paid during the period are equal to the annualized expense ratio for the share class, multiplied by the average account value over the period, then multiplied by the number of days in the fund's most recent fiscal half-year and divided by 366.
It is important to note that the expense amounts shown in the table are meant to highlight only ongoing costs of investing in the fund and do not reflect any transaction costs, such as sales charges, redemption fees or exchange fees. Therefore, the hypothetical examples provided may not help you determine the relative total costs of owning shares of different funds. If these transaction costs were included, your costs would have been higher.
35
Portfolio Managers' Report – Columbia Balanced Fund
Performance data quoted represents past performance and current performance may be lower or higher. Past performance is no guarantee of future results. The investment return and principal value will fluctuate so that shares, when redeemed, may be worth more or less than the original cost. Please visit www.columbiafunds.com for daily and most recent month-end performance updates.
Net asset value per share
as of 08/31/08 ($)
| Class A | | | 24.03 | | |
| Class B | | | 23.99 | | |
| Class C | | | 23.99 | | |
| Class Z | | | 24.02 | | |
Distributions declared per share
09/01/07 – 08/31/08 ($)
| Class A | | | 0.71 | | |
| Class B | | | 0.52 | | |
| Class C | | | 0.52 | | |
| Class Z | | | 0.77 | | |
For the 12-month period that ended August 31, 2008, Columbia Balanced Fund Class A shares returned negative 0.22% without sales charge. The S&P 500 Index returned negative 11.14%1 and the Lehman Brothers U.S. Aggregate Bond Index (the "Lehman Index") returned 5.86%.2 The fund's return was above the negative 7.58% average return of the Lipper Mixed-Asset Target Allocation Growth Funds Classification.3 The fund's managers were able to minimize losses within the equity portion of the portfolio at a time when stocks overall produced double-digit negative returns.
Strong stock selection in a challenging environment
The past 12 months were a difficult time for the financial markets. As economic growth faltered, corporate earnings and equity prices followed suit, notably in the financials sector. Against this backdrop, the fund's stock selection produced above-average results in many important market sectors. In financials, the fund emphasized Berkshire Hathaway, Inc. and State Street Corp., with a corresponding de-emphasis on companies whose fortunes are tied to extending credit. In the energy sector, the fund moved toward exploration and production companies, such as Apache Corp. and Devon Energy Corp. These companies attracted increased investor interest while oil prices advanced, and ended up outperforming most of the major integrated oil companies during the period. The fund's health care selections also boosted results, led by Covidien Ltd., which was added to the portfolio at attractive prices following its spinout from Tyco Internati onal Ltd. in the fall of 2007. Amgen, Inc. was another strong performer in this sector.
On the negative side, the fund's position in Northwest Airlines was a disappointment. We purchased the stock because we felt that the company's business prospects were improving and that the company may play a role in, and benefit from, the current trend toward industry consolidation. The relentless rise in energy prices, however, had a negative impact on the company. We eventually sold the stock in the first quarter of the year.
Fixed-income investments lagged as Treasuries topped other sectors
The fixed-income portion of the portfolio underperformed its benchmark because it had more exposure to non-Treasury sectors, which lagged in a risk-averse environment. Investors flocked to the safety of the Treasury markets, making it difficult for diversified bond funds to compete. In particular, the fund's position in commercial mortgage-backed securities hampered performance despite the sector's nominally high credit ratings. In general, securities tied to the weakening housing market came under pressure during the period.
1The Standard & Poor's (S&P) 500 Index tracks the performance of 500 widely held, large-capitalization US stocks. Indices are not investments, do not incur fees or expenses and are not professionally managed. It is not possible to invest directly in an index. Securities in the fund may not match those in an index.
2The Lehman Brothers U.S. Aggregate Bond Index is a market value-weighted index that tracks the daily price, coupon, pay-downs and total return performance of fixed-rate, publicly placed, dollar-denominated and non-convertible investment-grade debt issues with at least $250 million par amount outstanding and with at least one year to final maturity. Indices are not investments, do not incur fees or expenses and are not professionally managed. It is not possible to invest directly in an index. Securities in the fund may not match those in an index.
3Lipper Inc., a widely respected data provider in the industry, calculates an average total return (assuming reinvestment of distributions) for mutual funds with investment objectives similar to those of the fund. Lipper makes no adjustment for the effect of sales loads.
36
Portfolio Managers' Report (continued) – Columbia Balanced Fund
A decision to overweight energy and electric utility bonds was more successful, as both sectors outperformed the broader corporate bond market. The other noteworthy sector allocation was an underweight in the insurance sector, which paid off as investors became concerned about the health of balance sheets throughout the financial sector.
In general, the fixed-income portion of the portfolio carried a slightly longer average duration than the Lehman index. This positioning produced incremental gains when interest rates came down across the entire maturity spectrum. Yields declined more on bonds in the two-year maturity range than on bonds with longer maturities. The fund's more bulleted maturity structure, emphasizing two-year securities, enabled it to capture nice gains from this sector of the market.
Looking ahead
The risk of inflation has caused the Federal Reserve Board to signal a pause to its campaign to lower short-term interest rates. At the same time, the overall economy may not be strong enough to sustain an increase in rates. As a result, we are neutral in our view of rates and we have positioned the portfolio accordingly. Despite the difficulties in the mortgage market over the past year, we are encouraged by the federal government's recent commitment to Fannie Mae and Freddie Mac. In the near term, we plan to take a defensive position vis-à-vis the corporate bond market, but we also recognize that the prevailing gap in yields between corporate bonds and Treasuries could benefit the fund's investments in that sector over a longer time horizon.
Portfolio holdings and characteristics are subject to change periodically and may not be representative of current holdings and characteristics. The outlook for the fund may differ from those presented for other Columbia Funds.
Equity investments are affected by stock market fluctuations that occur in response to economic and business developments.
Investing in fixed-income securities may involve certain risks, including the credit quality of individual issuers, possible prepayments, market or economic developments and yield and share price fluctuations due to changes in interest rates. When interest rates go up, bond prices generally drop, and vice versa.
Investments in high yield or "junk" bonds offer the potential for higher income than investments in investment-grade bonds, but they also have a higher degree of risk. Changes in economic conditions or other circumstances may adversely affect a high-yield bond issuer's ability to make timely principal and interest payments.
Top 10 equity holdings
as of 08/31/08 (%)
| Microsoft Corp. | | | 2.4 | | |
| ConocoPhillips | | | 2.0 | | |
| Hewlett-Packard Co. | | | 1.8 | | |
| Philip Morris International Inc. | | | 1.8 | | |
| Abbott Laboratories | | | 1.7 | | |
| Google Inc. | | | 1.5 | | |
| General Electric Co. | | | 1.5 | | |
| Tyco International Ltd. | | | 1.5 | | |
| JPMorgan Chase & Co. | | | 1.4 | | |
| AT&T Inc. | | | 1.2 | | |
Portfolio composition
as of 08/31/08 (%)
| Common Stock | | | 58.9 | | |
| Mortgage-Backed Securities | | | 12.5 | | |
Corporate Fixed-Income
Bonds & Notes | | | 10.4 | | |
Government & Agency
Obligations | | | 4.6 | | |
Commercial Mortgage-Backed
Securities | | | 4.3 | | |
Collateralized Mortgage
Obligations | | | 4.1 | | |
| Cash & Equivalents | | | 3.3 | | |
| Asset-Backed Securities | | | 1.9 | | |
Holdings discussed in this report
as of 08/31/08 (%)
| Berkshire Hathaway, Inc. | | | 0.8 | | |
| State Street Corp. | | | 1.0 | | |
| Apache Corp. | | | 1.2 | | |
| Devon Energy Corp. | | | 1.2 | | |
| Covidien Ltd. | | | 1.2 | | |
| Tyco International Ltd. | | | 1.5 | | |
| Amgen, Inc. | | | 0.8 | | |
The fund is actively managed and the composition of its portfolio will change over time. Information provided is calculated as a percentage of net assets.
37
Fund Profile – Columbia Oregon Intermediate Municipal Bond Fund
Performance data quoted represents past performance and current performance may be lower or higher. Past performance is no guarantee of future results. The investment return and principal value will fluctuate so that shares, when redeemed, may be worth more or less than the original cost. Please visit www.columbiafunds.com for daily and most recent month-end performance updates.
Summary
1 year return as of 08/31/08
| | +4.31% | |
|
 | | Class A shares
(without sales charge) | |
|
| | +6.11% | |
|
 | | Lehman Brothers General
Obligation Bond Index | |
|
Morningstar Style Box
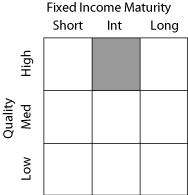
The Morningstar Style Box reveals a fund's investment strategy. For fixed-income funds the vertical axis shows the average credit quality of the bonds owned, and the horizontal axis shows interest rate sensitivity as measured by a bond's duration (short, intermediate or long). All of these numbers are drawn from the data most recently provided by the fund and entered into Morningstar's database as of quarter-end. Although the data gathered is from reliable sources, Morningstar cannot guarantee its completeness and accuracy. Information shown is as of 05/31/08.
Summary
g For the 12-month period that ended August 31, 2008, the fund's Class A shares returned 4.31% without sales charge.
g The fund underperformed its benchmark but outperformed the average fund in its peer group.
g Pre-refunded bonds and state and local general obligation bonds contributed to the fund's positive return while exposure to non-rated issues, hospital bonds and zero-coupon holdings detracted from performance.
Portfolio Management
Brian McGreevy has managed the fund since December 2003 and has been with the advisor and its predecessors or affiliate organizations since 1994.
The Lehman Brothers General Obligation Bond Index represents average market-weighted performance of general obligation securities that have been issued in the last five years with maturities greater than one year. Indices are not investments, do not incur fees or expenses and are not professionally managed. It is not possible to invest directly in an index. Securities in the fund may not match those in an index.
38
Performance Information – Columbia Oregon Intermediate Municipal Bond Fund
Growth of a $10,000 investment 09/01/98 – 08/31/08
The chart above shows the growth in value of a hypothetical $10,000 investment in Class A shares of Columbia Oregon Intermediate Municipal Bond Fund during the stated time period, and does not reflect the deduction of taxes that a shareholder may pay on fund distributions or on the redemption of fund shares. The growth of $10,000 with sales charge for Class A is calculated with an initial sales charge of 4.75%. The Lehman Brothers General Obligation Bond Index represents average market-weighted performance of general obligation securities that have been issued in the last five years with maturities greater than one year. Indices are not investments, do not incur fees or expenses and are not professionally managed. It is not possible to invest directly in an index. Securities in the fund may not match those in an index.
Performance of a $10,000 investment 09/01/98 – 08/31/08 ($)
| Sales charge | | without | | with | |
| Class A | | | 15,075 | | | | 14,355 | | |
| Class B | | | 14,434 | | | | 14,434 | | |
| Class C | | | 14,680 | | | | 14,680 | | |
| Class Z | | | 15,329 | | | | n/a | | |
Average annual total return as of 08/31/08 (%)
| Share class | | A | | B | | C | | Z | |
| Inception | | 11/01/02 | | 11/01/02 | | 10/13/03 | | 07/02/84 | |
| Sales charge | | without | | with | | without | | with | | without | | with | | without | |
| 1-year | | | 4.31 | | | | 0.95 | | | | 3.56 | | | | 0.56 | | | | 3.88 | | | | 2.88 | | | | 4.59 | | |
| 5-year | | | 3.79 | | | | 2.78 | | | | 3.01 | | | | 3.01 | | | | 3.36 | | | | 3.36 | | | | 4.05 | | |
| 10-year | | | 4.19 | | | | 3.68 | | | | 3.74 | | | | 3.74 | | | | 3.91 | | | | 3.91 | | | | 4.36 | | |
Average annual total return as of 09/30/08 (%)
| Share class | | A | | B | | C | | Z | |
| Sales charge | | without | | with | | without | | with | | without | | with | | without | |
| 1-year | | | –0.22 | | | | –3.48 | | | | –0.93 | | | | –3.81 | | | | –0.62 | | | | –1.59 | | | | 0.05 | | |
| 5-year | | | 2.49 | | | | 1.50 | | | | 1.73 | | | | 1.73 | | | | 2.08 | | | | 2.08 | | | | 2.76 | | |
| 10-year | | | 3.72 | | | | 3.22 | | | | 3.26 | | | | 3.26 | | | | 3.44 | | | | 3.44 | | | | 3.89 | | |
The "with sales charge" returns include the maximum initial sales charge of 3.25% for Class A shares, the applicable contingent deferred sales charge of 3.00% in the first year, declining to 1.00% in the fourth year, and eliminated thereafter for Class B shares and 1.00% for Class C shares for the first year only. The "without sales charge" returns do not include the effect of sales charges. If they had, returns would be lower.
The 5 & 10-year Class A average annual returns with sales charge as of 08/31/08 and 09/30/08 include the previous sales charge of 4.75%. The Class A 1-year average annual return with sales charge as of 08/31/08 and 09/30/08 include the new sales charge of 3.25%. This change was effective beginning August 22, 2005.
Performance results reflect any fee waivers or reimbursements of fund expenses by the investment advisor and/or any of its affiliates. Absent these fee waivers or expense reimbursement arrangements, performance results would have been lower.
All results shown assume reinvestment of distributions. Class Z shares are sold at net asset value with no distribution and service (Rule 12b-1) fees. Class Z shares have limited eligibility and the investment minimum requirements may vary. Please see the fund's prospectus for details. Performance for different share classes will vary based on differences in sales charges and fees associated with each class.
The tables do not reflect the deduction of taxes that a shareholder may pay on fund distributions or on the redemption of fund shares.
Class A and Class B share performance information includes returns of the fund's Class Z shares (the oldest existing fund class) for periods prior to the inception of the newer class shares. The returns for Class C shares include the returns of Class B shares prior to 10/13/03, the date on which Class C shares were initially offered by the fund. The returns shown for Class C shares also include the returns of Class Z shares prior to the inception of Class B shares (11/01/02). Class Z share returns have not been restated to reflect any differences in expenses, such as distribution and service (Rule 12b-1) fees between Class Z shares and the newer class shares. If differences in expenses had been reflected, the returns shown for the periods prior to the inception of Classes A, B and C shares would have been lower.
Performance data quoted represents past performance and current performance may be lower or higher. Past performance is no guarantee of future results. The investment return and principal value will fluctuate so that shares, when redeemed, may be worth more or less than the original cost. Please visit www.columbiafunds.com for daily and most recent month-end performance updates.
Annual operating expense ratio (%)*
| Class A | | | 0.88 | | |
| Class B | | | 1.63 | | |
| Class C | | | 1.63 | | |
| Class Z | | | 0.63 | | |
Annual operating expense ratio
after contractual waivers (%)*
| Class A | | | 0.75 | | |
| Class B | | | 1.50 | | |
| Class C | | | 1.50 | | |
| Class Z | | | 0.50 | | |
* The annual operating expense ratio and annual operating expense ratio after contractual waivers are as stated in the fund's prospectus that is current as of the date of this report. The contractual waiver expires 12/31/08. Differences in expense ratios disclosed elsewhere in this report may result from including fee waivers and expense reimbursements as well as different time periods used in calculating the ratios.
39
Understanding Your Expenses – Columbia Oregon Intermediate Municipal Bond Fund
Estimating your actual expenses
To estimate the expenses that you paid over the period, first you will need your account balance at the end of the period:
g For shareholders who receive their account statements from Columbia Management Services, Inc., your account balance is available online at www.columbiafunds.com or by calling Shareholder Services at 800.345.6611.
g For shareholders who receive their account statements from their financial intermediary, contact your financial intermediary to obtain your account balance.
1. Divide your ending account balance by $1,000. For example, if an account balance was $8,600 at the end of the period, the result would be 8.6.
2. In the section of the table below titled "Expenses paid during the period," locate the amount for your share class. You will find this number in the column labeled "actual." Multiply this number by the result from step 1. Your answer is an estimate of the expenses you paid on your account during the period.
If the value of your account falls below the minimum initial investment requirement applicable to you, your account generally will be subject to a $20 annual fee. This fee is not included in the accompanying table. If you are subject to the fee, keep it in mind when you are estimating the ongoing expenses of investing in the fund and when comparing the expenses of this fund with other funds.
As a fund shareholder, you incur two types of costs. There are transaction costs, which generally include sales charges on purchases and may include redemption fees or exchange fees. There are also ongoing costs, which generally include investment advisory fees, distribution and service (Rule 12b-1) fees and other fund expenses. The information on this page is intended to help you understand the ongoing costs of investing in the fund and to compare these costs with the ongoing costs of investing in other mutual funds.
Analyzing your fund's expenses by share class
To illustrate these ongoing costs, we have provided an example and calculated the expenses paid by investors in each share class during the period. The information in the following table is based on an initial investment of $1,000, which is invested at the beginning of the period and held for the entire period. Expense information is calculated two ways and each method provides you with different information. The amount listed in the "actual" column is calculated using the fund's actual operating expenses and total return for the period. The amount listed in the "hypothetical" column for each share class assumes that the return each year is 5% before expenses and is calculated based on the fund's actual operating expenses. You should not use the hypothetical account values and expenses to estimate either your actual account balance at the end of the period or the expenses you paid during this period.
Compare with other funds
Since all mutual funds are required to include the same hypothetical calculations about expenses in shareholder reports, you can use this information to compare the ongoing costs of investing in the fund with other funds. To do so, compare the 5% hypothetical example with the 5% hypothetical examples that appear in the shareholder reports of other funds. As you compare hypothetical examples of other funds, it is important to note that hypothetical examples are meant to highlight the ongoing costs of investing in a fund and do not reflect any transaction costs, such as sales charges, redemption fees or exchange fees.
03/01/08 – 08/31/08
| | | Account value at the
beginning of the period ($) | | Account value at the
end of the period ($) | | Expenses paid
during the period ($) | | Fund's annualized
expense ratio (%) | |
| | | Actual | | Hypothetical | | Actual | | Hypothetical | | Actual | | Hypothetical | | Actual | |
| Class A | | | 1,000.00 | | | | 1,000.00 | | | | 1,041.68 | | | | 1,021.37 | | | | 3.85 | | | | 3.81 | | | | 0.75 | | |
| Class B | | | 1,000.00 | | | | 1,000.00 | | | | 1,037.91 | | | | 1,017.60 | | | | 7.68 | | | | 7.61 | | | | 1.50 | | |
| Class C | | | 1,000.00 | | | | 1,000.00 | | | | 1,039.72 | | | | 1,019.36 | | | | 5.90 | | | | 5.84 | | | | 1.15 | | |
| Class Z | | | 1,000.00 | | | | 1,000.00 | | | | 1,043.08 | | | | 1,022.62 | | | | 2.57 | | | | 2.54 | | | | 0.50 | | |
Expenses paid during the period are equal to the annualized expense ratio for the share class, multiplied by the average account value over the period, then multiplied by the number of days in the fund's most recent fiscal half-year and divided by 366.
Had the investment advisor and/or any of its affiliates not waived fees or reimbursed a portion of expenses, account value at the end of the period would have been reduced.
It is important to note that the expense amounts shown in the table are meant to highlight only ongoing costs of investing in the fund and do not reflect any transaction costs, such as sales charges, redemption fees or exchange fees. Therefore, the hypothetical examples provided may not help you determine the relative total costs of owning shares of different funds. If these transaction costs were included, your costs would have been higher.
40
Portfolio Managers' Report – Columbia Oregon Intermediate Municipal Bond Fund
For the 12-month period that ended August 31, 2008, Columbia Oregon Intermediate Municipal Bond Fund Class A shares returned 4.31% without sales charge. This was less than the fund's benchmark, the Lehman Brothers General Obligation Bond Index1, which returned 6.11%. The fund's return was greater than the 4.05% average return of its peer group, the Lipper Other States Intermediate Municipal Debt Funds Classification2. As the credit crisis unfolded, investors drove yields down and prices up on shorter and intermediate-term issues, while bonds maturing in 15 years or later recorded declines.
Volatility kept markets on edge
The yield difference between lower and higher quality bonds tripled over the period, reflecting market dislocations triggered by the spreading subprime credit crisis and driving lower-quality bond prices down. In addition, municipal bonds underperformed Treasuries as investors sought more secure havens. At times, municipals offered tax-exempt yields exceeding the taxable yields on Treasuries of similar maturities.
Pre-refunded and general obligation bonds aided returns
The fund's higher yield as well as its large stake in the strong-performing pre-refunded sector helped the fund modestly outperform its peer group. Pre-refunded bonds are backed by escrowed funds that are sufficient to pay off the bonds at maturity. Better-quality local and state general obligation bonds (GOs), which made up more than 20% of the portfolio, also aided results as GOs were strong performers during the period. In fact, the fund could not keep up with its benchmark because it is composed exclusively of these bonds. Bonds maturing between 2010 and 2013 were the portfolio's best-performing maturity segment, while AA-rated uninsured issues led quality sectors. The AAA component lagged due to concerns surrounding bond insurers.
Insurer downgrades shifted portfolio balance
Rating downgrades of companies that insure municipal bonds led to severe market disruptions during the period. As a result, yields on insured bonds rose—and prices fell—reflecting a lack of confidence in insurance coverage. As insurers were downgraded, the fund's exposure to insured AAA-rated bonds declined from nearly 50% to 17% as the ratings of most insured bonds dropped to AA, reflecting the inherent quality of the bonds independent of insurance. At the end of the period, more than half the portfolio was rated AA. Even so, its quality was generally high overall. And as yields fell sharply on short-term assets, we reallocated into A- and BBB-rated bonds at the longer end of the intermediate range because battered prices in that segment appeared to offer good opportunity.
1The Lehman Brothers General Obligation Bond Index represents average market-weighted performance of general obligation securities that have been issued in the last five years with maturities greater than one year. Indices are not investments, do not incur fees or expenses and are not professionally managed. It is not possible to invest directly in an index. Securities in the fund may not match those in an index.
2Lipper Inc., a widely respected data provider in the industry, calculates an average total return (assuming reinvestment of distributions) for mutual funds with investment objectives similar to those of the fund. Lipper makes no adjustment for the effect of sales loads.
Performance data quoted represents past performance and current performance may be lower or higher. Past performance is no guarantee of future results. The investment return and principal value will fluctuate so that shares, when redeemed, may be worth more or less than the original cost. Please visit www.columbiafunds.com for daily and most recent month-end performance updates.
Net asset value per share
as of 08/31/08 ($)
| Class A | | | 12.07 | | |
| Class B | | | 12.07 | | |
| Class C | | | 12.07 | | |
| Class Z | | | 12.07 | | |
Distribution declared per share
09/01/07 – 08/31/08 ($)
| Class A | | | 0.46 | | |
| Class B | | | 0.37 | | |
| Class C | | | 0.41 | | |
| Class Z | | | 0.49 | | |
A portion of the fund's income may be subject to the alternative minimum tax. The fund may at times purchase tax-exempt securities at a discount. Some or all of this discount may be included in the fund's ordinary income, and is taxable when distributed.
41
Portfolio Managers' Report (continued) – Columbia Oregon Intermediate Municipal Bond Fund
Maturity breakdown
as of 08/31/08 (%)
| 0-1 year | | | 2.0 | | |
| 1-3 years | | | 19.1 | | |
| 3-5 years | | | 16.0 | | |
| 5-7 years | | | 10.3 | | |
| 7-10 years | | | 16.5 | | |
| 10-15 years | | | 19.4 | | |
| 15-20 years | | | 11.4 | | |
| 20-25 years | | | 2.9 | | |
| 25+ years | | | 0.7 | | |
| Net Cash & Equivalents | | | 1.7 | | |
Your fund is actively managed and the composition of its portfolio will change over time. Information provided is calculated as a percentage of net assets.
Taxable-equivalent SEC yields
| as of 08/31/08 (%) | |
| Class A | | | 4.92 | | |
| Class B | | | 3.97 | | |
| Class C | | | 4.53 | | |
| Class Z | | | 5.56 | | |
Taxable-equivalent SEC yields are based on the combined maximum effective 35.0% federal income tax rate and applicable state income tax rate. This tax rate does not reflect the phase out of exemptions or the reduction of otherwise allowable deductions that occur when adjusted gross income exceeds certain levels.
Top 5 sectors
as of 08/31/08 (%)
| Refunded/Escrowed | | | 24.1 | | |
| Local General Obligations | | | 23.6 | | |
| Hospitals | | | 7.4 | | |
| Special Property Tax | | | 6.7 | | |
| State Appropriated | | | 5.8 | | |
Portfolio quality
as of 08/31/08 (%)
| AAA | | | 17.1 | | |
| AA | | | 56.3 | | |
| A | | | 7.9 | | |
| BBB | | | 5.7 | | |
| Non Rated | | | 11.3 | | |
| Net Cash & Equivalents | | | 1.7 | | |
Ratings shown in the quality breakdown represent the rating assigned to a particular bond by one of the following nationally-recognized rating agencies: Standard and Poor's, Moody's Investors Service, Inc. or Fitch Ratings Ltd. Ratings are relative and subjective and are not absolute standards of quality. The fund's credit quality does not remove market risk.
30-day SEC yields
as of 08/31/08 (%)
| Class A | | | 2.91 | | |
| Class B | | | 2.35 | | |
| Class C | | | 2.68 | | |
| Class Z | | | 3.29 | | |
The 30-day SEC yields reflect the portfolio's earning power, net of expenses, expressed as an annualized percentage of the public offering price per share at the end of the period.
In an atmosphere of extreme investor caution, non-rated issues were among the weakest performers for the fund even though, in our opinion, approximately half of the fund's non-rated holdings are of investment grade quality. Bonds may be unrated because issuers forego the ratings process, or because the issues themselves are too small. Hospital bonds also detracted from performance as the market was forced to absorb additional supply because issuers had to refinance their auction rate securities when this market collapsed. The added volume widened the yield difference between Treasuries and hospital bonds amid meager demand. The portfolio's longer-term zero-coupon holdings also detracted from return.
Economic diversity aids Oregon's outlook
The nationwide housing downturn has been felt in Oregon's wood-processing industry. However, conditions are more stable at the state's high-tech firms, as well as at metal companies and food manufacturers. We believe that any slowdown should be mild, thanks to Oregon's diverse economy, solid international business profile and low energy costs stemming from the use of hydroelectric power.
Portfolio holdings and characteristics are subject to change and may not be representative of current holdings and characteristics. The outlook for this fund may differ from that presented for other Columbia Funds.
Tax-exempt investing offers current tax-exempt income, but it also involves special risks. The value of the fund will be affected by interest rate changes and the creditworthiness of issues held in the fund. When interest rates go up, bond prices generally drop and vice versa.
Interest income from certain tax-exempt bonds may be subject to certain state and local taxes and, if applicable, the AMT. Capital gains are not exempt from income taxes.
Single-state municipal bond funds pose additional risks, due to limited geographical diversification.
42
Fund Profile – Columbia Conservative High Yield Fund
Summary
g For the 12-month period that ended August 31, 2008, the fund's Class A shares returned 0.07% without sales charge.
g The fund underperformed its benchmark but outperformed its peer group classification average.
g The fund was less conservatively positioned than its benchmark but more conservatively positioned than its peer group in a highly risk-averse environment.
Portfolio Management
Thomas A. LaPointe, CFA, has co-managed the fund since September 2005 and has been with the advisor or its predecessors or affiliate organizations since 1999.
Kevin L. Cronk, CFA has co-managed the fund since September 2005 and has been with the advisor or its predecessors or affiliate organizations since 1999.
The JPMorgan Developed BB High Yield Index is an index that is designed to mirror the investable universe of the US dollar developed, BB-rated, high yield corporate debt market. Indices are not investments, do not incur fees or expenses and are not professionally managed. It is not possible to invest directly in an index. Securities in the fund may not match those in an index.
Performance data quoted represents past performance and current performance may be lower or higher. Past performance is no guarantee of future results. The investment return and principal value will fluctuate so that shares, when redeemed, may be worth more or less than the original cost. Please visit www.columbiafunds.com for daily and most recent month-end performance updates.
Summary
1 year return as of 08/31/08
| | +0.07% | |
|
 | | Class A shares
(without sales charge) | |
|
| | +2.84% | |
|
 | | JPMorgan Developed
BB High Yield Index | |
|
Morningstar Style Box
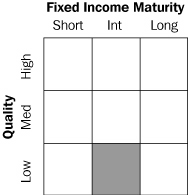
The Morningstar Style Box reveals a fund's investment strategy. For fixed-income funds the vertical axis shows the average credit quality of the bonds owned, and the horizontal axis shows interest rate sensitivity as measured by a bond's duration (short, intermediate or long). All these numbers are drawn from the data most recently provided by the fund and entered into Morningstar's database as of quarter-end. Although the data is gathered from reliable sources, Morningstar cannot guarantee completeness and accuracy. Information shown is as of 05/31/08.
43
Performance Information – Columbia Conservative High Yield Fund
Performance data quoted represents past performance and current performance may be lower or higher. Past performance is no guarantee of future results. The investment return and principal value will fluctuate so that shares, when redeemed, may be worth more or less than the original cost. Please visit www.columbiafunds.com for daily and most recent month-end performance updates.
Annual operating expense ratio (%)*
| Class A | | | 1.03 | | |
| Class B | | | 1.78 | | |
| Class C | | | 1.78 | | |
| Class Z | | | 0.78 | | |
* The annual operating expense ratio is as stated in the fund's prospectus that is current as of the date of this report. Differences in expense ratios disclosed elsewhere in this report may result from including fee waivers and expense reimbursements as well as different time periods used in calculating the ratios.
Growth of a $10,000 investment 09/01/98 – 08/31/08
The chart above shows the growth in value of a hypothetical $10,000 investment in Class A shares of Columbia Conservative High Yield Fund during the stated time period, and does not reflect the deduction of taxes that a shareholder may pay on fund distributions or on the redemption of fund shares. The JPMorgan Developed BB High Yield Index is an index that is designed to mirror the investable universe of the US dollar developed, BB-rated, high yield corporate debt market. Indices are not investments, do not incur fees or expenses and are not professionally managed. It is not possible to invest directly in an index. Securities in the fund may not match those in an index.
Performance of a $10,000 investment 09/01/98 – 08/31/08 ($)
| Sales charge | | without | | with | |
| Class A | | | 15,702 | | | | 14,961 | | |
| Class B | | | 15,015 | | | | 15,015 | | |
| Class C | | | 15,115 | | | | 15,115 | | |
| Class Z | | | 15,939 | | | | n/a | | |
Average annual total return as of 08/31/08 (%)
| Share class | | A | | B | | C | | Z | |
| Inception | | 11/01/02 | | 11/01/02 | | 10/13/03 | | 10/01/93 | |
| Sales charge | | without | | with | | without | | with | | without | | with | | without | |
| 1-year | | | 0.07 | | | | –4.63 | | | | –0.67 | | | | –5.36 | | | | –0.52 | | | | –1.46 | | | | 0.32 | | |
| 5-year | | | 4.19 | | | | 3.19 | | | | 3.42 | | | | 3.10 | | | | 3.56 | | | | 3.56 | | | | 4.45 | | |
| 10-year | | | 4.62 | | | | 4.11 | | | | 4.15 | | | | 4.15 | | | | 4.22 | | | | 4.22 | | | | 4.77 | | |
Average annual total return as of 09/30/08 (%)
| Share class | | A | | B | | C | | Z | |
| Sales charge | | without | | with | | without | | with | | without | | with | | without | |
| 1-year | | | –7.50 | | | | –11.86 | | | | –8.18 | | | | –12.51 | | | | –8.05 | | | | –8.91 | | | | –7.26 | | |
| 5-year | | | 2.61 | | | | 1.62 | | | | 1.85 | | | | 1.54 | | | | 1.99 | | | | 1.99 | | | | 2.86 | | |
| 10-year | | | 3.86 | | | | 3.35 | | | | 3.39 | | | | 3.39 | | | | 3.46 | | | | 3.46 | | | | 4.02 | | |
The "with sales charge" returns include the maximum initial sales charge of 4.75% for Class A shares, the applicable contingent deferred sales charge of 5.00% in the first year, declining to 1.00% in the sixth year, and eliminated thereafter for Class B shares and 1.00% for Class C shares for the first year only. The "without sales charge" returns do not include the effect of sales charges. If they had, returns would have been lower.
Performance results reflect any fee waivers or reimbursements of fund expenses by the investment advisor and/or any of its affiliates. Absent these fee waivers or expense reimbursement arrangements, performance results would have been lower.
All results shown assume reinvestment of distributions. Class Z shares are sold at net asset value with no distribution and service (Rule 12b-1) fees. Class Z shares have limited eligibility and the investment minimum requirements may vary. Please see the fund's prospectus for details. Performance for different share classes will vary based on differences in sales charges and fees associated with each class.
The tables do not reflect the deduction of taxes that a shareholder may pay on fund distributions or on the redemption of fund shares.
Class A and Class B share performance information includes returns of the fund's Class Z shares (the oldest existing fund class) for periods prior to the inception of the newer class shares. The returns for Class C shares include the returns of Class B shares prior to 10/13/03, the date on which Class C shares were initially offered by the fund. The returns shown for Class C shares also include the returns of Class Z shares prior to the inception of Class B shares (11/01/02). Class Z share returns have not been restated to reflect any differences in expenses, such as distribution and service (Rule 12b-1) fees between Class Z shares and the newer class shares. If differences in expenses had been reflected, the returns shown for the periods prior to the inception of Classes A, B and C shares would have been lower.
44
Understanding Your Expenses – Columbia Conservative High Yield Fund
As a fund shareholder, you incur two types of costs. There are transaction costs, which generally include sales charges on purchases and may include redemption fees or exchange fees. There are also ongoing costs, which generally include investment advisory fees, distribution and service (Rule 12b-1) fees and other fund expenses. The information on this page is intended to help you understand the ongoing costs of investing in the fund and to compare these costs with the ongoing costs of investing in other mutual funds.
Analyzing your fund's expenses by share class
To illustrate these ongoing costs, we have provided an example and calculated the expenses paid by investors in each share class during the period. The information in the following table is based on an initial investment of $1,000, which is invested at the beginning of the period and held for the entire period. Expense information is calculated two ways and each method provides you with different information. The amount listed in the "actual" column is calculated using the fund's actual operating expenses and total return for the period. The amount listed in the "hypothetical" column for each share class assumes that the return each year is 5% before expenses and is calculated based on the fund's actual operating expenses. You should not use the hypothetical account values and expenses to estimate either your actual account balance at the end of the period or the expenses you paid during this period.
Compare with other funds
Since all mutual funds are required to include the same hypothetical calculations about expenses in shareholder reports, you can use this information to compare the ongoing costs of investing in the fund with other funds. To do so, compare the 5% hypothetical example with the 5% hypothetical examples that appear in the shareholder reports of other funds. As you compare hypothetical examples of other funds, it is important to note that hypothetical examples are meant to highlight the ongoing costs of investing in a fund and do not reflect any transaction costs, such as sales charges, redemption fees or exchange fees.
Estimating your actual expenses
To estimate the expenses that you paid over the period, first you will need your account balance at the end of the period:
g For shareholders who receive their account statements from Columbia Management Services, Inc., your account balance is available online at www.columbiafunds.com or by calling Shareholder Services at 800.345.6611.
g For shareholders who receive their account statements from their financial intermediary, contact your financial intermediary to obtain your account balance.
1. Divide your ending account balance by $1,000. For example, if an account balance was $8,600 at the end of the period, the result would be 8.6.
2. In the section of the table below titled "Expenses paid during the period," locate the amount for your share class. You will find this number in the column labeled "actual." Multiply this number by the result from step 1. Your answer is an estimate of the expenses you paid on your account during the period.
If the value of your account falls below the minimum initial investment requirement applicable to you, your account generally will be subject to a $20 annual fee. This fee is not included in the accompanying table. If you are subject to the fee, keep it in mind when you are estimating the ongoing expenses of investing in the fund and when comparing the expenses of this fund with other funds.
03/01/08 – 08/31/08
| | | Account value at the
beginning of the period ($) | | Account value at the
end of the period ($) | | Expenses paid
during the period ($) | | Fund's annualized
expense ratio (%) | |
| | | Actual | | Hypothetical | | Actual | | Hypothetical | | Actual | | Hypothetical | | Actual | |
| Class A | | | 1,000.00 | | | | 1,000.00 | | | | 1,006.49 | | | | 1,019.76 | | | | 5.40 | | | | 5.43 | | | | 1.07 | | |
| Class B | | | 1,000.00 | | | | 1,000.00 | | | | 1,002.71 | | | | 1,015.99 | | | | 9.16 | | | | 9.22 | | | | 1.82 | | |
| Class C | | | 1,000.00 | | | | 1,000.00 | | | | 1,003.52 | | | | 1,016.74 | | | | 8.41 | | | | 8.47 | | | | 1.67 | | |
| Class Z | | | 1,000.00 | | | | 1,000.00 | | | | 1,007.79 | | | | 1,021.01 | | | | 4.14 | | | | 4.17 | | | | 0.82 | | |
Expenses paid during the period are equal to the annualized expense ratio for the share class, multiplied by the average account value over the period, then multiplied by the number of days in the fund's most recent fiscal half-year and divided by 366.
Had the distributor not waived fees or reimbursed a portion of Class C expenses, Class C account value at the end of the period would have been reduced.
It is important to note that the expense amounts shown in the table are meant to highlight only ongoing costs of investing in the fund and do not reflect any transaction costs, such as sales charges, redemption fees or exchange fees. Therefore, the hypothetical examples provided may not help you determine the relative total costs of owning shares of different funds. If these transaction costs were included, your costs would have been higher.
45
Portfolio Managers' Report – Columbia Conservative High Yield Fund
Performance data quoted represents past performance and current performance may be lower or higher. Past performance is no guarantee of future results. The investment return and principal value will fluctuate so that shares, when redeemed, may be worth more or less than the original cost. Please visit www.columbiafunds.com for daily and most recent month-end performance updates.
Net asset value per share
as of 08/31/08 ($)
| Class A | | | 7.61 | | |
| Class B | | | 7.61 | | |
| Class C | | | 7.61 | | |
| Class Z | | | 7.61 | | |
Distributions declared per share
09/01/07 – 08/31/08 ($)
| Class A | | | 0.52 | | |
| Class B | | | 0.46 | | |
| Class C | | | 0.47 | | |
| Class Z | | | 0.54 | | |
Portfolio Manager's Report
For the 12-month period that ended August 31, 2008, Columbia Conservative High Yield Fund Class A shares returned 0.07% without sales charge. The fund's return was lower than the 2.84% return of the JPMorgan Developed BB High Yield Index1 and higher than the negative 2.17% average return of its peer group, the Lipper High Current Yield Funds Classification.2 The performance differential was the result of the fund's positioning relative to risk: we believe it was more conservatively positioned than its peer group but less conservatively positioned than its benchmark during a period when market sentiment was highly risk-averse.
Focus on quality aided performance
The fund concentrates on the higher quality segments of the high-yield market, and this positioning was extremely helpful during the period. Turmoil in the mortgage markets created an environment in which fixed-income investors made near-term safety a much greater priority than long-term potential. As a result, Treasury securities were the best-performing asset class within the fixed-income markets; and, more generally, lower credit quality translated into weaker near-term performance. The high-yield market was rendered especially vulnerable as the economy slowed and corporate earnings came under pressure.
Holdings across a variety of sectors benefited performance
Specific holdings that benefited the fund's performance during the period included Teekay Shipping Corp.; power generating companies, such as Intergen NV and Mirant North America LLC; and forest-products company Domtar and packaging/containers companies Owens-Illinois and Crown Holdings. The fund's holdings in hospital company HCA, Inc. and mining company Freeport-McMoRan Copper & Gold were also helpful to overall performance, because the industries they represent were somewhat insulated from the fortunes of the national economy.
Economically sensitive holdings detracted from performance
Holdings that detracted from performance included a range of more economically sensitive companies, notably printer Quebecor World, Inc. and telephone directory companies R.H. Donnelley Corp. and Idearc, Inc. A position in Sprint was hurt by poor operating performance and, ultimately, a ratings downgrade, while GMAC (General Motors Acceptance Corporation) came under pressure as mortgage and auto financing became more difficult. We sold Quebecor World and Sprint before the end of the period. More generally, the fund was underweight in BB-rated bonds relative to its benchmark. This hurt relative performance because BB bonds represent the best credit quality available in the high-yield markets.
1The JPMorgan Developed BB High Yield Index is designed to mirror the investable universe of the US dollar developed, BB-rated, high yield corporate debt market. Indices are not investments, do not incur fees or expenses and are not professionally managed. It is not possible to invest directly in an index. Securities in the fund may not match those in an index.
2Lipper Inc., a widely respected data provider in the industry, calculates an average total return (assuming reinvestment of distributions) for mutual funds with investment objectives similar to those of the fund. Lipper makes no adjustment for the effect of sales loads.
46
Portfolio Managers' Report (continued) – Columbia Conservative High Yield Fund
Looking ahead
We believe that the financial markets will continue to be volatile in the year ahead. As the economy struggles, we would not be surprised to see an increase in the corporate default rate, representing a significant challenge for the high-yield marketplace. We intend to maintain the fund's focus on conservative, higher quality issues, a stance that we believe should continue to benefit our shareholders. We will continue to seek out companies with strong underlying assets that generate solid free cash flow. We believe such companies are well-positioned to survive near-term economic weakness and offer upside potential when market conditions improve.
Portfolio holdings and characteristics are subject to change and may not be representative of current holdings and characteristics. The outlook for this fund may differ from that presented for other Columbia Funds.
Investing in fixed-income securities may involve certain risks, including the credit quality of individual issuers, possible prepayments, market or economic developments and yields and share price fluctuations due to changes in interest rates. When interest rates go up, bond prices typically drop, and vice versa.
The term "conservative" in the Columbia Conservative High Yield Fund's name, and as used in the discussion above, is intended to describe the fund's credit approach relative to other high yield funds; the fund invests primarily in bonds rated Ba or B by Moody's Investors Service, Inc. or BB or B by Standard & Poor's. These lower rated bonds, commonly referred to as "junk" bonds, are subject to greater credit risk, and are generally less liquid, than higher-rated, lower yielding bonds. Also, changes in economic conditions or other circumstances may adversely affect a junk bond issuer's ability to make principal and interest payments. Rising interest rates tend to lower the value of all bonds.
Maturity breakdown
as of 08/31/08 (%)
| 1-3 years | | | 6.2 | | |
| 3-5 years | | | 9.2 | | |
| 5-7 years | | | 34.0 | | |
| 7-10 years | | | 36.3 | | |
| 10-15 years | | | 2.0 | | |
| 15-20 years | | | 2.5 | | |
| 20-30 years | | | 2.3 | | |
| 30 years and over | | | 1.0 | | |
| Repurchase Agreement | | | 4.8 | | |
| Other | | | 1.7 | | |
Portfolio quality
as of 08/31/08 (%)
| AAA | | | 4.8 | | |
| BBB | | | 2.4 | | |
| BB | | | 48.5 | | |
| B | | | 40.7 | | |
| CCC | | | 1.0 | | |
| Not Rated | | | 0.9 | | |
| Other | | | 1.7 | | |
Ratings shown in the quality breakdown represent the rating assigned to a particular bond by one of the following nationally-recognized rating agencies: Standard and Poor's, Moody's Investors Service, Inc. or Fitch Ratings Ltd. Ratings are relative and subjective and are not absolute standards of quality. The fund's credit quality does not remove market risk.
Holdings discussed in this report
as of 08/31/08 (%)
| Teekay Shipping Corp. | | | 1.1 | | |
| Intergen NV | | | 1.3 | | |
| Mirant North America LLC | | | 1.1 | | |
| Owens-Illinois, Inc. | | | 0.8 | | |
| Domtar Corp. | | | 0.7 | | |
| Crown Holdings | | | 0.8 | | |
| HCA, Inc. | | | 2.9 | | |
Freeport-McMoRan
Copper & Gold | | | 1.8 | | |
| R.H. Donnelley Corp. | | | 0.5 | | |
| Idearc, Inc. | | | 0.3 | | |
General Motors
Acceptance Corp. | | | 0.7 | | |
Your fund is actively managed and the composition of its portfolio will change over time. Information provided is calculated as a percentage of net assets.
47
Investment Portfolio – Columbia International Stock Fund
August 31, 2008
| Common Stocks – 98.7% | |
| | | Shares | | Value ($) | |
| Consumer Discretionary – 7.5% | |
| Automobiles – 1.4% | |
Dongfeng Motor Group
Co., Ltd., Class H | | | 12,854,000 | | | | 5,429,254 | | |
| Honda Motor Co., Ltd. | | | 115,300 | | | | 3,753,632 | | |
| Toyota Motor Corp. | | | 82,700 | | | | 3,706,928 | | |
| Automobiles Total | | | 12,889,814 | | |
| Distributors – 0.7% | |
| Inchcape PLC | | | 1,265,837 | | | | 5,949,220 | | |
| Distributors Total | | | 5,949,220 | | |
| Hotels, Restaurants & Leisure – 1.2% | |
| Kangwon Land, Inc. | | | 212,870 | | | | 3,739,109 | | |
| Paddy Power PLC | | | 292,570 | | | | 6,829,744 | | |
| Hotels, Restaurants & Leisure Total | | | 10,568,853 | | |
| Household Durables – 2.3% | |
| JM AB | | | 460,700 | | | | 5,538,180 | | |
Matsushita Electric Industrial
Co., Ltd. | | | 556,000 | | | | 11,435,707 | | |
| Sony Corp. | | | 82,400 | | | | 3,155,129 | | |
| Household Durables Total | | | 20,129,016 | | |
| Leisure Equipment & Products – 0.4% | |
| Nikon Corp. | | | 115,000 | | | | 3,736,029 | | |
| Leisure Equipment & Products Total | | | 3,736,029 | | |
| Media – 1.5% | |
| Vivendi | | | 343,880 | | | | 13,299,358 | | |
| Media Total | | | 13,299,358 | | |
| Consumer Discretionary Total | | | 66,572,290 | | |
| Consumer Staples – 7.7% | |
| Beverages – 1.4% | |
Fomento Economico Mexicano
SAB de CV, ADR (a) | | | 160,516 | | | | 7,130,121 | | |
| Heineken NV | | | 105,932 | | | | 4,972,242 | | |
| Beverages Total | | | 12,102,363 | | |
| Food & Staples Retailing – 1.2% | |
| Seven & I Holdings Co., Ltd. | | | 362,700 | | | | 10,556,124 | | |
| Food & Staples Retailing Total | | | 10,556,124 | | |
| Food Products – 2.8% | |
| China Milk Products Group Ltd. | | | 8,354,000 | | | | 4,005,834 | | |
| Nestle SA, Registered Shares | | | 218,847 | | | | 9,644,086 | | |
| Toyo Suisan Kaisha Ltd. | | | 185,000 | | | | 4,600,029 | | |
| Unilever PLC | | | 259,684 | | | | 6,978,763 | | |
| Food Products Total | | | 25,228,712 | | |
| | | Shares | | Value ($) | |
| Household Products – 0.5% | |
| Unicharm Corp. | | | 64,300 | | | | 4,788,938 | | |
| Household Products Total | | | 4,788,938 | | |
| Personal Products – 0.7% | |
| Shiseido Co., Ltd. | | | 249,000 | | | | 5,831,240 | | |
| Personal Products Total | | | 5,831,240 | | |
| Tobacco – 1.1% | |
| British American Tobacco PLC | | | 167,550 | | | | 5,673,550 | | |
| Japan Tobacco, Inc. | | | 849 | | | | 4,040,555 | | |
| Tobacco Total | | | 9,714,105 | | |
| Consumer Staples Total | | | 68,221,482 | | |
| Energy – 9.6% | |
| Energy Equipment & Services – 1.7% | |
| Noble Corp. | | | 96,508 | | | | 4,853,387 | | |
| Technip SA | | | 99,609 | | | | 8,179,644 | | |
| Wellstream Holdings PLC | | | 91,245 | | | | 2,076,230 | | |
| Energy Equipment & Services Total | | | 15,109,261 | | |
| Oil, Gas & Consumable Fuels – 7.9% | |
| BP PLC | | | 576,621 | | | | 5,544,723 | | |
| BP PLC, ADR | | | 135,965 | | | | 7,835,663 | | |
| Centennial Coal Co., Ltd. | | | 1,133,094 | | | | 5,514,600 | | |
| PetroChina Co., Ltd., Class H | | | 6,422,000 | | | | 8,290,136 | | |
| PT Bumi Resources Tbk | | | 5,403,500 | | | | 3,209,500 | | |
| Royal Dutch Shell PLC, Class B | | | 243,786 | | | | 8,393,963 | | |
| StatoilHydro ASA | | | 295,850 | | | | 9,092,364 | | |
| Total SA | | | 214,086 | | | | 15,391,171 | | |
Yanzhou Coal Mining Co., Ltd.,
Class H | | | 4,058,000 | | | | 7,038,441 | | |
| Oil, Gas & Consumable Fuels Total | | | 70,310,561 | | |
| Energy Total | | | 85,419,822 | | |
| Financials – 24.2% | |
| Capital Markets – 2.6% | |
Credit Suisse Group AG,
Registered Shares | | | 122,793 | | | | 5,708,355 | | |
Deutsche Bank AG,
Registered Shares | | | 104,461 | | | | 8,931,261 | | |
| Goldman Sachs Group, Inc. (a) | | | 21,082 | | | | 3,456,815 | | |
| State Street Corp. | | | 73,791 | | | | 4,993,437 | | |
| Capital Markets Total | | | 23,089,868 | | |
| Commercial Banks – 12.8% | |
Australia & New Zealand
Banking Group Ltd. | | | 271,315 | | | | 3,821,733 | | |
Banco Bilbao Vizcaya
Argentaria SA | | | 762,502 | | | | 12,879,945 | | |
See Accompanying Notes to Financial Statements.
48
Columbia International Stock Fund
August 31, 2008
| Common Stocks (continued) | |
| | | Shares | | Value ($) | |
| Banco Santander SA | | | 1,044,104 | | | | 17,759,853 | | |
| Barclays PLC | | | 1,142,549 | | | | 7,358,390 | | |
| BNP Paribas | | | 109,926 | | | | 9,920,363 | | |
| DBS Group Holdings Ltd. | | | 514,000 | | | | 6,505,623 | | |
| HBOS PLC | | | 992,879 | | | | 5,718,199 | | |
| HSBC Holdings PLC | | | 726,276 | | | | 11,441,259 | | |
Industrial & Commercial
Bank of China, Class H | | | 5,244,000 | | | | 3,601,813 | | |
| Lloyds TSB Group PLC | | | 881,004 | | | | 4,880,874 | | |
| Mizuho Financial Group, Inc. | | | 1,937 | | | | 8,163,812 | | |
| Swedbank AB, Class A | | | 328,400 | | | | 5,795,804 | | |
Uniao de Bancos Brasileiros
SA, GDR | | | 32,268 | | | | 3,857,962 | | |
| United Overseas Bank Ltd. | | | 240,900 | | | | 3,213,760 | | |
| Westpac Banking Corp. | | | 231,515 | | | | 4,623,427 | | |
| Yamaguchi Financial Group, Inc. | | | 342,000 | | | | 3,928,800 | | |
| Commercial Banks Total | | | 113,471,617 | | |
| Consumer Finance – 0.4% | |
| ORIX Corp. | | | 30,870 | | | | 3,795,734 | | |
| Consumer Finance Total | | | 3,795,734 | | |
| Diversified Financial Services – 1.7% | |
| Fortis | | | 241,237 | | | | 3,357,059 | | |
| ING Groep NV | | | 382,796 | | | | 11,990,464 | | |
| Diversified Financial Services Total | | | 15,347,523 | | |
| Insurance – 4.5% | |
| Aviva PLC | | | 552,658 | | | | 5,163,358 | | |
| Axis Capital Holdings Ltd. | | | 243,446 | | | | 8,138,400 | | |
Baloise Holding AG,
Registered Shares | | | 109,014 | | | | 9,322,058 | | |
| Brit Insurance Holdings PLC | | | 1,922,072 | | | | 6,787,453 | | |
Swiss Reinsurance,
Registered Shares | | | 166,420 | | | | 10,273,763 | | |
| Insurance Total | | | 39,685,032 | | |
| Real Estate Management & Development – 2.2% | |
| Emaar Properties PJSC | | | 2,258,762 | | | | 5,799,030 | | |
| Hongkong Land Holdings Ltd. | | | 2,058,000 | | | | 7,359,457 | | |
| Swire Pacific Ltd., Class A | | | 681,300 | | | | 6,799,215 | | |
Real Estate Management &
Development Total | | | 19,957,702 | | |
| Financials Total | | | 215,347,476 | | |
| Health Care – 9.2% | |
| Biotechnology – 0.4% | |
| Amgen, Inc. (b) | | | 55,171 | | | | 3,467,497 | | |
| Biotechnology Total | | | 3,467,497 | | |
| | | Shares | | Value ($) | |
| Pharmaceuticals – 8.8% | |
| Astellas Pharma, Inc. | | | 130,200 | | | | 5,863,969 | | |
| AstraZeneca PLC | | | 306,337 | | | | 14,921,595 | | |
| Biovail Corp. | | | 592,192 | | | | 6,336,454 | | |
| Daiichi Sankyo Co., Ltd. | | | 200,200 | | | | 6,047,833 | | |
| Merck & Co., Inc. | | | 100,047 | | | | 3,568,677 | | |
| Novartis AG, Registered Shares | | | 298,779 | | | | 16,674,447 | | |
| Roche Holding AG | | | 103,975 | | | | 17,527,284 | | |
| Takeda Pharmaceutical Co., Ltd. | | | 134,000 | | | | 6,987,518 | | |
| Pharmaceuticals Total | | | 77,927,777 | | |
| Health Care Total | | | 81,395,274 | | |
| Industrials – 13.1% | |
| Aerospace & Defense – 0.5% | |
| MTU Aero Engines Holding AG | | | 132,718 | | | | 4,633,727 | | |
| Aerospace & Defense Total | | | 4,633,727 | | |
| Commercial Services & Supplies – 0.7% | |
| Randstad Holding NV | | | 191,163 | | | | 5,868,022 | | |
| Commercial Services & Supplies Total | | | 5,868,022 | | |
| Construction & Engineering – 1.0% | |
| Outotec Oyj | | | 188,129 | | | | 8,560,301 | | |
| Construction & Engineering Total | | | 8,560,301 | | |
| Electrical Equipment – 3.8% | |
| ABB Ltd., Registered Shares (b) | | | 528,383 | | | | 12,949,910 | | |
| Gamesa Corp. Tecnologica SA | | | 125,705 | | | | 5,955,001 | | |
Harbin Power Equipment
Co., Ltd., Class H | | | 3,282,000 | | | | 4,059,284 | | |
| Mitsubishi Electric Corp. | | | 708,000 | | | | 6,034,902 | | |
| Vestas Wind Systems A/S (b) | | | 36,061 | | | | 4,896,327 | | |
| Electrical Equipment Total | | | 33,895,424 | | |
| Industrial Conglomerates – 1.0% | |
| Keppel Corp. Ltd. | | | 1,270,000 | | | | 8,840,642 | | |
| Industrial Conglomerates Total | | | 8,840,642 | | |
| Machinery – 4.0% | |
Georg Fischer AG,
Registered Shares (b) | | | 12,598 | | | | 4,789,726 | | |
| Gildemeister AG | | | 131,154 | | | | 3,176,672 | | |
| Glory Ltd. | | | 359,000 | | | | 7,712,684 | | |
| Hino Motors Ltd. | | | 39,000 | | | | 189,899 | | |
| Komatsu Ltd. | | | 352,300 | | | | 7,394,632 | | |
| SKF AB, Class B | | | 454,800 | | | | 6,889,290 | | |
| Volvo AB, Class B | | | 482,650 | | | | 5,476,271 | | |
| Machinery Total | | | 35,629,174 | | |
See Accompanying Notes to Financial Statements.
49
Columbia International Stock Fund
August 31, 2008
| Common Stocks (continued) | |
| | | Shares | | Value ($) | |
| Marine – 0.5% | |
| U-Ming Marine Transport Corp. | | | 1,609,000 | | | | 4,239,146 | | |
| Marine Total | | | 4,239,146 | | |
| Road & Rail – 0.3% | |
| Central Japan Railway Co. | | | 257 | | | | 2,679,180 | | |
| Road & Rail Total | | | 2,679,180 | | |
| Trading Companies & Distributors – 1.3% | |
| ITOCHU Corp. | | | 750,000 | | | | 6,035,838 | | |
| Mitsubishi Corp. | | | 203,800 | | | | 5,643,865 | | |
| Trading Companies & Distributors Total | | | 11,679,703 | | |
| Industrials Total | | | 116,025,319 | | |
| Information Technology – 5.9% | |
| Communications Equipment – 1.6% | |
| Nokia Oyj | | | 582,555 | | | | 14,656,894 | | |
| Communications Equipment Total | | | 14,656,894 | | |
| Electronic Equipment & Instruments – 0.7% | |
| FUJIFILM Holdings Corp. | | | 233,300 | | | | 6,417,116 | | |
| Electronic Equipment & Instruments Total | | | 6,417,116 | | |
| IT Services – 0.4% | |
| Computershare Ltd. | | | 443,813 | | | | 3,423,612 | | |
| IT Services Total | | | 3,423,612 | | |
| Office Electronics – 1.4% | |
| Canon, Inc. | | | 272,600 | | | | 12,197,821 | | |
| Office Electronics Total | | | 12,197,821 | | |
| Semiconductors & Semiconductor Equipment – 0.4% | |
| Verigy Ltd. (a)(b) | | | 197,733 | | | | 3,652,129 | | |
Semiconductors & Semiconductor
Equipment Total | | | 3,652,129 | | |
| Software – 1.4% | |
| Nintendo Co., Ltd. | | | 25,600 | | | | 12,099,686 | | |
| Software Total | | | 12,099,686 | | |
| Information Technology Total | | | 52,447,258 | | |
| Materials – 10.8% | |
| Chemicals – 3.2% | |
| BASF SE | | | 228,349 | | | | 13,163,557 | | |
| Linde AG | | | 84,387 | | | | 10,631,775 | | |
| Potash Corp. of Saskatchewan | | | 26,100 | | | | 4,541,567 | | |
| Chemicals Total | | | 28,336,899 | | |
| Construction Materials – 0.9% | |
| Ciments Francais SA | | | 61,737 | | | | 8,509,249 | | |
| Construction Materials Total | | | 8,509,249 | | |
| | | Shares | | Value ($) | |
| Metals & Mining – 6.7% | |
| Anglo American PLC | | | 144,151 | | | | 7,677,778 | | |
| BHP Billiton PLC | | | 475,311 | | | | 14,884,167 | | |
Freeport-McMoRan
Copper & Gold, Inc. | | | 25,424 | | | | 2,270,872 | | |
| Norsk Hydro ASA | | | 454,500 | | | | 4,840,089 | | |
| Rio Tinto PLC | | | 70,998 | | | | 6,755,636 | | |
| Salzgitter AG | | | 53,921 | | | | 8,305,210 | | |
| SSAB Svenskt Stal AB, Series A | | | 159,800 | | | | 3,898,509 | | |
| Xstrata PLC | | | 51,388 | | | | 2,863,955 | | |
| Yamato Kogyo Co., Ltd. | | | 213,500 | | | | 7,733,214 | | |
| Metals & Mining Total | | | 59,229,430 | | |
| Materials Total | | | 96,075,578 | | |
| Telecommunication Services – 6.7% | |
| Diversified Telecommunication Services – 4.8% | |
Bezeq Israeli
Telecommunication Corp., Ltd. | | | 5,120,349 | | | | 9,147,716 | | |
| France Telecom SA | | | 240,853 | | | | 7,109,973 | | |
Nippon Telegraph &
Telephone Corp. | | | 1,791 | | | | 8,793,015 | | |
| Telefonica O2 Czech Republic AS | | | 284,796 | | | | 8,762,995 | | |
| Telekomunikacja Polska SA | | | 891,628 | | | | 8,945,000 | | |
Diversified Telecommunication
Services Total | | | 42,758,699 | | |
| Wireless Telecommunication Services – 1.9% | |
| China Mobile Ltd. | | | 587,300 | | | | 6,677,083 | | |
| Mobile TeleSystems OJSC, ADR | | | 77,059 | | | | 5,240,012 | | |
| Vodafone Group PLC | | | 2,051,767 | | | | 5,255,388 | | |
Wireless Telecommunication
Services Total | | | 17,172,483 | | |
| Telecommunication Services Total | | | 59,931,182 | | |
| Utilities – 4.0% | |
| Electric Utilities – 3.0% | |
| E.ON AG | | | 329,607 | | | | 19,258,598 | | |
| Iberdrola SA | | | 601,972 | | | | 7,254,906 | | |
| Electric Utilities Total | | | 26,513,504 | | |
| Multi Utilities – 1.0% | |
| United Utilities Group PLC | | | 713,768 | | | | 9,290,815 | | |
| Multi Utilities Total | | | 9,290,815 | | |
| Utilities Total | | | 35,804,319 | | |
Total Common Stocks
(cost of $879,084,941) | | | 877,240,000 | | |
See Accompanying Notes to Financial Statements.
50
Columbia International Stock Fund
August 31, 2008
| Preferred Stocks – 0.7% | |
| | | Shares | | Value ($) | |
| Consumer Staples – 0.3% | |
| Food Products – 0.3% | |
| Sadia SA | | | 427,000 | | | | 2,821,344 | | |
| Food Products Total | | | 2,821,344 | | |
| Consumer Staples Total | | | 2,821,344 | | |
| Utilities – 0.4% | |
| Electric Utilities – 0.4% | |
| Cia Energetica de Minas Gerais | | | 175,100 | | | | 3,780,226 | | |
| Electric Utilities Total | | | 3,780,226 | | |
| Utilities Total | | | 3,780,226 | | |
Total Preferred Stocks
(cost of $7,410,109) | | | 6,601,570 | | |
| Investment Company – 0.4% | |
| iShares MSCI Brazil Index Fund | | | 43,957 | | | | 3,226,004 | | |
Total Investment Company
(cost of $3,392,008) | | | 3,226,004 | | |
| Purchased Call Option – 0.1% | |
| | | Units | | | |
| CBOE SPX Volatility Index | |
| Strike Price: $25.00 | |
| Expires: 10/18/08 | | | 476,600 | | | | 786,390 | | |
Total Purchased Call Option
(cost of $835,283) | | | 786,390 | | |
| Short-Term Obligation – 0.4% | |
| | | Par ($) | | | |
Repurchase agreement with
Fixed Income Clearing Corp.,
dated 08/29/08, due 09/02/08
at 1.930%, collateralized by a
U.S. Treasury Obligation
maturing 04/15/09, market
value $3,637,563 (repurchase
proceeds $3,566,765) | | | 3,566,000 | | | | 3,566,000 | | |
Total Short-Term Obligation
(cost of $3,566,000) | | | 3,566,000 | | |
Total Investments – 100.3%
(cost of $894,288,341) (c) | | | 891,419,964 | | |
| Other Assets & Liabilities, Net – (0.3)% | | | (2,417,029 | ) | |
| Net Assets – 100.0% | | | 889,002,935 | | |
Notes to Investment Portfolio:
(a) Security pledged as collateral for written option contracts.
(b) Non-income producing security.
(c) Cost for federal income tax purposes is $900,611,211.
At August 31, 2008, the Fund had the following written call option contracts:
| Name of Issuer | | Strike
Price | | Number of
Contracts | | Expiration
Date | | Premium | | Value | |
Fomento
Economico Mexicano | | $ | 50 | | | | 535 | | | 09/20/08 | | $ | 62,594 | | | $ | 2,675 | | |
Goldman Sachs
Group, Inc. | | | 190 | | | | 126 | | | 09/20/08 | | | 13,986 | | | | 4,032 | | |
| Verigy Ltd. | | | 25 | | | | 1,977 | | | 09/20/08 | | | 77,103 | | | | 9,885 | | |
| Total written call options (proceeds $153,683) | | $ | 16,592 | | |
For the year ended August 31, 2008, transactions in written option contracts were as follows:
| | | Number of
contracts | | Premium
received | |
| Options outstanding at August 31, 2007 | | | 1,340 | | | $ | 63,381 | | |
| Options written | | | 8,363 | | | | 683,102 | | |
| Options terminated in closing | |
| purchase transactions | | | (950 | ) | | | (68,222 | ) | |
| Options exercised | | | (63 | ) | | | (20,916 | ) | |
| Options expired | | | (6,052 | ) | | | (503,662 | ) | |
| Options outstanding at August 31, 2008 | | | 2,638 | | | $ | 153,683 | | |
The Fund is invested in the following countries at August 31, 2008:
| Country (Unaudited) | | Value | | % of Total
Investments | |
| Japan | | $ | 173,323,829 | | | | 19.4 | | |
| United Kingdom | | | 145,450,979 | | | | 16.3 | | |
| Switzerland | | | 86,889,629 | | | | 9.8 | | |
| Germany | | | 68,100,800 | | | | 7.6 | | |
| France | | | 62,409,758 | | | | 7.0 | | |
| United States* | | | 45,686,938 | | | | 5.1 | | |
| Spain | | | 43,849,705 | | | | 4.9 | | |
| China | | | 32,424,761 | | | | 3.6 | | |
| Sweden | | | 27,598,054 | | | | 3.1 | | |
| Finland | | | 23,217,195 | | | | 2.6 | | |
| Netherlands | | | 22,830,728 | | | | 2.6 | | |
| Singapore | | | 22,212,154 | | | | 2.5 | | |
| Australia | | | 17,383,372 | | | | 2.0 | | |
| Norway | | | 13,932,453 | | | | 1.6 | | |
| Hong Kong | | | 13,476,298 | | | | 1.5 | | |
| Canada | | | 10,878,021 | | | | 1.2 | | |
| Brazil | | | 10,459,532 | | | | 1.2 | | |
| Israel | | | 9,147,716 | | | | 1.0 | | |
| Poland | | | 8,945,000 | | | | 1.0 | | |
| Czech Republic | | | 8,762,994 | | | | 1.0 | | |
| Mexico | | | 7,130,121 | | | | 0.8 | | |
| Ireland | | | 6,829,744 | | | | 0.8 | | |
| United Arab Emirates | | | 5,799,030 | | | | 0.6 | | |
| Russia | | | 5,240,012 | | | | 0.6 | | |
| Denmark | | | 4,896,327 | | | | 0.5 | | |
| Taiwan | | | 4,239,146 | | | | 0.5 | | |
| Korea | | | 3,739,109 | | | | 0.4 | | |
| Belgium | | | 3,357,059 | | | | 0.4 | | |
| Indonesia | | | 3,209,500 | | | | 0.4 | | |
| | | $ | 891,419,964 | | | | 100.0 | | |
* Includes short-term obligation and investment company.
Certain securities are listed by country of underlying exposure but may trade predominantly on other exchanges.
See Accompanying Notes to Financial Statements.
51
Columbia International Stock Fund
August 31, 2008
Forward foreign currency exchange contracts outstanding on August 31, 2008 are:
Forward
Currency
Contracts
to Buy | |
Value | |
Aggregate
Face Value | |
Settlement
Date | |
Unrealized
Depreciation | |
| AUD | | | | $ | 42,822,190 | | | $ | 46,163,808 | | | 09/17/08 | | $ | (3,341,618 | ) | |
| AUD | | | | | 1,798,647 | | | | 1,831,021 | | | 09/17/08 | | | (32,374 | ) | |
| AUD | | | | | 3,539,024 | | | | 3,574,081 | | | 09/17/08 | | | (35,057 | ) | |
| CAD | | | | | 1,819,095 | | | | 1,887,511 | | | 09/17/08 | | | (68,416 | ) | |
| CHF | | | | | 3,103,758 | | | | 3,318,120 | | | 09/17/08 | | | (214,362 | ) | |
| CHF | | | | | 2,715,902 | | | | 2,882,678 | | | 09/17/08 | | | (166,776 | ) | |
| DKK | | | | | 4,401,617 | | | | 4,424,427 | | | 09/17/08 | | | (22,810 | ) | |
| EUR | | | | | 98,383,088 | | | | 103,042,481 | | | 09/17/08 | | | (4,659,393 | ) | |
| EUR | | | | | 2,880,213 | | | | 3,069,644 | | | 09/17/08 | | | (189,431 | ) | |
| GBP | | | | | 40,768,692 | | | | 43,251,184 | | | 09/17/08 | | | (2,482,492 | ) | |
| JPY | | | | | 14,247,432 | | | | 14,413,818 | | | 09/17/08 | | | (166,386 | ) | |
| NOK | | | | | 5,629,465 | | | | 6,002,748 | | | 09/17/08 | | | (373,283 | ) | |
| NOK | | | | | 1,833,470 | | | | 1,918,032 | | | 09/17/08 | | | (84,562 | ) | |
| NOK | | | | | 1,799,779 | | | | 1,889,447 | | | 09/17/08 | | | (89,668 | ) | |
| SGD | | | | | 908,118 | | | | 948,587 | | | 09/17/08 | | | (40,469 | ) | |
| SGD | | | | | 5,274,995 | | | | 5,299,075 | | | 09/17/08 | | | (24,080 | ) | |
| | | $ | (11,991,177 | ) | |
Forward
Currency
Contracts
to Sell | |
Value | |
Aggregate
Face Value | |
Settlement
Date | |
Unrealized
Appreciation
(Depreciation) | |
| AUD | | | | $ | 7,304,271 | | | $ | 8,119,280 | | | 09/17/08 | | $ | 815,009 | | |
| CAD | | | | | 10,972,008 | | | | 11,349,956 | | | 09/17/08 | | | 377,948 | | |
| CHF | | | | | 31,197,449 | | | | 32,860,696 | | | 09/17/08 | | | 1,663,247 | | |
| CZK | | | | | 11,592,633 | | | | 12,443,421 | | | 09/17/08 | | | 850,788 | | |
| DKK | | | | | 4,920,230 | | | | 5,148,892 | | | 09/17/08 | | | 228,662 | | |
| EUR | | | | | 4,498,408 | | | | 4,792,949 | | | 09/17/08 | | | 294,541 | | |
| EUR | | | | | 10,581,301 | | | | 10,457,696 | | | 09/17/08 | | | (123,605 | ) | |
| EUR | | | | | 5,282,589 | | | | 5,305,881 | | | 09/17/08 | | | 23,292 | | |
| GBP | | | | | 2,838,315 | | | | 3,059,849 | | | 09/17/08 | | | 221,534 | | |
| IDR | | | | | 3,234,346 | | | | 3,109,815 | | | 09/17/08 | | | (124,531 | ) | |
| ILS | | | | | 14,750,280 | | | | 15,439,078 | | | 09/17/08 | | | 688,798 | | |
| KRW | | | | | 4,926,518 | | | | 5,171,396 | | | 09/17/08 | | | 244,878 | | |
| NOK | | | | | 11,917,094 | | | | 12,305,104 | | | 09/17/08 | | | 388,010 | | |
| PLN | | | | | 5,016,911 | | | | 5,152,829 | | | 09/17/08 | | | 135,918 | | |
| PLN | | | | | 2,802,314 | | | | 2,994,364 | | | 09/17/08 | | | 192,050 | | |
| RUB | | | | | 3,522,493 | | | | 3,526,899 | | | 09/17/08 | | | 4,406 | | |
| SEK | | | | | 1,952,392 | | | | 2,061,849 | | | 09/17/08 | | | 109,457 | | |
| SEK | | | | | 3,555,744 | | | | 3,774,038 | | | 09/17/08 | | | 218,294 | | |
| SEK | | | | | 1,777,871 | | | | 1,824,002 | | | 09/17/08 | | | 46,131 | | |
| SGD | | | | | 15,050,331 | | | | 15,492,476 | | | 09/17/08 | | | 442,145 | | |
| TWD | | | | | 8,955,312 | | | | 9,307,857 | | | 09/17/08 | | | 352,545 | | |
| | | $ | 7,049,517 | | |
| Acronym | | Name | |
| ADR | | American Depositary Receipt | |
|
| AUD | | Australian Dollar | |
|
| CAD | | Canadian Dollar | |
|
| CHF | | Swiss Franc | |
|
| CZK | | Czech Koruna | |
|
| DKK | | Danish Krone | |
|
| EUR | | Euro | |
|
| GBP | | Pound Sterling | |
|
| IDR | | Indonesian Rupiah | |
|
| ILS | | Israeli Shekel | |
|
| JPY | | Japanese Yen | |
|
| KRW | | South Korean Won | |
|
| MXN | | Mexican Peso | |
|
| MYR | | Malaysian Ringgit | |
|
| NOK | | Norwegian Krone | |
|
| PLN | | Polish Zloty | |
|
| SEK | | Swedish Krona | |
|
| SGD | | Singapore Dollar | |
|
| TWD | | Taiwan Dollar | |
|
See Accompanying Notes to Financial Statements.
52
Investment Portfolio – Columbia Mid Cap Growth Fund
August 31, 2008
| Common Stocks – 98.4% | |
| | | Shares | | Value ($) | |
| Consumer Discretionary – 17.4% | |
| Auto Components – 0.5% | |
| WABCO Holdings, Inc. | | | 153,373 | | | | 6,717,737 | | |
| Auto Components Total | | | 6,717,737 | | |
| Diversified Consumer Services – 2.4% | |
| Apollo Group, Inc., Class A (a) | | | 140,860 | | | | 8,969,965 | | |
| DeVry, Inc. | | | 219,130 | | | | 11,302,725 | | |
ITT Educational
Services, Inc. (a) | | | 105,810 | | | | 9,407,567 | | |
New Oriental Education &
Technology Group, ADR (a) | | | 62,730 | | | | 4,648,293 | | |
| Diversified Consumer Services Total | | | 34,328,550 | | |
| Hotels, Restaurants & Leisure – 4.5% | |
Ctrip.com International
Ltd., ADR | | | 160,564 | | | | 8,073,158 | | |
| Darden Restaurants, Inc. | | | 279,880 | | | | 8,197,685 | | |
Penn National
Gaming, Inc. (a) | | | 216,030 | | | | 7,306,135 | | |
| Royal Caribbean Cruises Ltd. | | | 213,330 | | | | 5,798,309 | | |
| Starbucks Corp. (a) | | | 594,070 | | | | 9,243,729 | | |
Starwood Hotels & Resorts
Worldwide, Inc. | | | 149,130 | | | | 5,405,963 | | |
| WMS Industries, Inc. (a) | | | 223,910 | | | | 7,523,376 | | |
| Yum! Brands, Inc. | | | 344,160 | | | | 12,279,629 | | |
| Hotels, Restaurants & Leisure Total | | | 63,827,984 | | |
| Internet & Catalog Retail – 0.6% | |
| Priceline.com, Inc. (a) | | | 82,840 | | | | 7,702,463 | | |
| Internet & Catalog Retail Total | | | 7,702,463 | | |
| Media – 2.0% | |
Central European Media
Enterprises Ltd., Class A (a) | | | 77,060 | | | | 6,003,745 | | |
| Liberty Media Corp., Class A (a) | | | 511,640 | | | | 14,218,475 | | |
| McGraw-Hill Companies, Inc. | | | 181,170 | | | | 7,761,323 | | |
| Media Total | | | 27,983,543 | | |
| Multiline Retail – 1.0% | |
| Kohl's Corp. (a) | | | 158,680 | | | | 7,802,296 | | |
| Nordstrom, Inc. | | | 217,970 | | | | 6,778,867 | | |
| Multiline Retail Total | | | 14,581,163 | | |
| Specialty Retail – 4.6% | |
| Advance Auto Parts, Inc. | | | 155,440 | | | | 6,690,138 | | |
| GameStop Corp., Class A (a) | | | 188,240 | | | | 8,258,089 | | |
| Guess ?, Inc. | | | 167,940 | | | | 6,259,124 | | |
| Ross Stores, Inc. | | | 190,480 | | | | 7,659,201 | | |
| Sherwin-Williams Co. | | | 120,960 | | | | 7,082,208 | | |
| Tiffany & Co. | | | 161,360 | | | | 7,127,271 | | |
| | | Shares | | Value ($) | |
| TJX Companies, Inc. | | | 292,840 | | | | 10,612,521 | | |
| Urban Outfitters, Inc. (a) | | | 328,550 | | | | 11,702,951 | | |
| Specialty Retail Total | | | 65,391,503 | | |
| Textiles, Apparel & Luxury Goods – 1.8% | |
| Deckers Outdoor Corp. (a) | | | 85,250 | | | | 9,692,073 | | |
| Phillips-Van Heusen Corp. | | | 240,690 | | | | 9,160,661 | | |
| Polo Ralph Lauren Corp. | | | 77,610 | | | | 5,889,047 | | |
| Textiles, Apparel & Luxury Goods Total | | | 24,741,781 | | |
| Consumer Discretionary Total | | | 245,274,724 | | |
| Consumer Staples – 4.1% | |
| Beverages – 0.5% | |
Central European
Distribution Corp. (a) | | | 110,570 | | | | 6,378,783 | | |
| Beverages Total | | | 6,378,783 | | |
| Food & Staples Retailing – 1.2% | |
| BJ's Wholesale Club, Inc. (a) | | | 185,430 | | | | 7,051,903 | | |
| Kroger Co. | | | 344,350 | | | | 9,510,947 | | |
| Food & Staples Retailing Total | | | 16,562,850 | | |
| Food Products – 0.5% | |
| H.J. Heinz Co. | | | 132,150 | | | | 6,649,788 | | |
| Food Products Total | | | 6,649,788 | | |
| Household Products – 0.4% | |
| Clorox Co. | | | 101,730 | | | | 6,012,243 | | |
| Household Products Total | | | 6,012,243 | | |
| Personal Products – 0.9% | |
| Avon Products, Inc. | | | 292,980 | | | | 12,548,333 | | |
| Personal Products Total | | | 12,548,333 | | |
| Tobacco – 0.6% | |
| Lorillard, Inc. | | | 120,420 | | | | 8,699,141 | | |
| Tobacco Total | | | 8,699,141 | | |
| Consumer Staples Total | | | 56,851,138 | | |
| Energy – 12.1% | |
| Energy Equipment & Services – 4.4% | |
| Cameron International Corp. (a) | | | 231,450 | | | | 10,783,256 | | |
| Core Laboratories N.V. | | | 55,110 | | | | 6,841,356 | | |
| Diamond Offshore Drilling, Inc. | | | 137,420 | | | | 15,103,832 | | |
| FMC Technologies, Inc. (a) | | | 107,890 | | | | 5,778,588 | | |
| IHS, Inc., Class A (a) | | | 105,590 | | | | 6,774,655 | | |
| National-Oilwell Varco, Inc. (a) | | | 87,740 | | | | 6,469,070 | | |
| Noble Corp. | | | 218,570 | | | | 10,991,885 | | |
| Energy Equipment & Services Total | | | 62,742,642 | | |
See Accompanying Notes to Financial Statements.
53
Columbia Mid Cap Growth Fund
August 31, 2008
| Common Stocks (continued) | |
| | | Shares | | Value ($) | |
| Oil, Gas & Consumable Fuels – 7.7% | |
Alpha Natural
Resources, Inc. (a) | | | 73,430 | | | | 7,276,913 | | |
| Concho Resources, Inc. (a) | | | 232,489 | | | | 7,595,416 | | |
| CONSOL Energy, Inc. | | | 179,810 | | | | 12,174,935 | | |
| Continental Resources, Inc. (a) | | | 276,837 | | | | 13,888,912 | | |
| Denbury Resources, Inc. (a) | | | 689,540 | | | | 17,162,651 | | |
| Frontier Oil Corp. | | | 307,520 | | | | 5,956,662 | | |
| Peabody Energy Corp. | | | 111,830 | | | | 7,039,698 | | |
| PetroHawk Energy Corp. (a) | | | 328,280 | | | | 11,361,771 | | |
| Range Resources Corp. | | | 122,910 | | | | 5,705,482 | | |
| Southwestern Energy Co. (a) | | | 368,448 | | | | 14,137,350 | | |
| Ultra Petroleum Corp. (a) | | | 83,200 | | | | 5,670,080 | | |
| Oil, Gas & Consumable Fuels Total | | | 107,969,870 | | |
| Energy Total | | | 170,712,512 | | |
| Financials – 5.8% | |
| Capital Markets – 3.7% | |
| Invesco Ltd. | | | 388,500 | | | | 9,957,255 | | |
| Janus Capital Group, Inc. | | | 242,900 | | | | 6,551,013 | | |
| Northern Trust Corp. | | | 105,590 | | | | 8,488,380 | | |
| T. Rowe Price Group, Inc. | | | 205,810 | | | | 12,216,882 | | |
Waddell & Reed Financial,
Inc., Class A | | | 448,530 | | | | 14,442,666 | | |
| Capital Markets Total | | | 51,656,196 | | |
| Diversified Financial Services – 0.9% | |
| CME Group, Inc. | | | 23,396 | | | | 7,846,550 | | |
| IntercontinentalExchange, Inc. (a) | | | 63,430 | | | | 5,583,743 | | |
| Diversified Financial Services Total | | | 13,430,293 | | |
| Real Estate Investment Trusts (REITs) – 1.2% | |
| Macerich Co. | | | 91,310 | | | | 5,654,828 | | |
| Plum Creek Timber Co., Inc. | | | 126,630 | | | | 6,283,381 | | |
| ProLogis | | | 111,080 | | | | 4,783,105 | | |
Real Estate Investment
Trusts (REITs) Total | | | 16,721,314 | | |
| Financials Total | | | 81,807,803 | | |
| Health Care – 13.0% | |
| Biotechnology – 1.7% | |
Alexion Pharmaceuticals,
Inc. (a) | | | 181,940 | | | | 8,201,855 | | |
| Celgene Corp. (a) | | | 149,890 | | | | 10,387,377 | | |
| Onyx Pharmaceuticals, Inc. (a) | | | 135,850 | | | | 5,552,190 | | |
| Biotechnology Total | | | 24,141,422 | | |
| | | Shares | | Value ($) | |
| Health Care Equipment & Supplies – 2.3% | |
| Hologic, Inc. (a) | | | 506,292 | | | | 10,743,516 | | |
| Intuitive Surgical, Inc. (a) | | | 35,701 | | | | 10,541,434 | | |
| Varian Medical Systems, Inc. (a) | | | 172,150 | | | | 10,872,994 | | |
| Health Care Equipment & Supplies Total | | | 32,157,944 | | |
| Health Care Providers & Services – 3.5% | |
| Express Scripts, Inc. (a) | | | 198,420 | | | | 14,566,012 | | |
Laboratory Corp. of America
Holdings (a) | | | 199,520 | | | | 14,594,888 | | |
| McKesson Corp. | | | 137,620 | | | | 7,951,684 | | |
| Medco Health Solutions, Inc. (a) | | | 145,980 | | | | 6,839,163 | | |
Pediatrix Medical
Group, Inc. (a) | | | 91,910 | | | | 5,234,274 | | |
| Health Care Providers & Services Total | | | 49,186,021 | | |
| Life Sciences Tools & Services – 4.4% | |
Charles River Laboratories
International, Inc. (a) | | | 220,370 | | | | 14,458,476 | | |
| Covance, Inc. (a) | | | 149,780 | | | | 14,130,245 | | |
| Illumina, Inc. (a) | | | 66,311 | | | | 5,711,366 | | |
Pharmaceutical Product
Development, Inc. | | | 269,520 | | | | 10,996,416 | | |
| Thermo Fisher Scientific, Inc. (a) | | | 132,380 | | | | 8,016,933 | | |
| Waters Corp. (a) | | | 123,540 | | | | 8,431,605 | | |
| Life Sciences Tools & Services Total | | | 61,745,041 | | |
| Pharmaceuticals – 1.1% | |
| Allergan, Inc. | | | 181,960 | | | | 10,166,105 | | |
| Perrigo Co. | | | 174,760 | | | | 6,114,853 | | |
| Pharmaceuticals Total | | | 16,280,958 | | |
| Health Care Total | | | 183,511,386 | | |
| Industrials – 16.4% | |
| Aerospace & Defense – 1.9% | |
| Goodrich Corp. | | | 215,810 | | | | 11,060,262 | | |
| Precision Castparts Corp. | | | 155,783 | | | | 16,086,153 | | |
| Aerospace & Defense Total | | | 27,146,415 | | |
| Air Freight & Logistics – 0.5% | |
| C.H. Robinson Worldwide, Inc. | | | 143,690 | | | | 7,487,686 | | |
| Air Freight & Logistics Total | | | 7,487,686 | | |
| Commercial Services & Supplies – 2.4% | |
| Dun & Bradstreet Corp. | | | 62,870 | | | | 5,782,154 | | |
| FTI Consulting, Inc. (a) | | | 51,787 | | | | 3,801,166 | | |
| Manpower, Inc. | | | 120,100 | | | | 5,772,006 | | |
| Robert Half International, Inc. | | | 214,480 | | | | 5,490,688 | | |
| Stericycle, Inc. (a) | | | 214,270 | | | | 12,706,211 | | |
| Commercial Services & Supplies Total | | | 33,552,225 | | |
See Accompanying Notes to Financial Statements.
54
Columbia Mid Cap Growth Fund
August 31, 2008
| Common Stocks (continued) | |
| | | Shares | | Value ($) | |
| Construction & Engineering – 0.7% | |
| Foster Wheeler Ltd. (a) | | | 187,260 | | | | 9,304,949 | | |
| Construction & Engineering Total | | | 9,304,949 | | |
| Electrical Equipment – 3.5% | |
| AMETEK, Inc. | | | 180,850 | | | | 8,778,459 | | |
| First Solar, Inc. (a) | | | 35,200 | | | | 9,738,080 | | |
| General Cable Corp. (a) | | | 250,010 | | | | 12,305,492 | | |
| Roper Industries, Inc. | | | 159,650 | | | | 9,432,122 | | |
| SunPower Corp., Class A (a) | | | 91,300 | | | | 8,906,315 | | |
| Electrical Equipment Total | | | 49,160,468 | | |
| Industrial Conglomerates – 2.0% | |
| McDermott International, Inc. (a) | | | 534,460 | | | | 18,561,796 | | |
| Textron, Inc. | | | 223,610 | | | | 9,190,371 | | |
| Industrial Conglomerates Total | | | 27,752,167 | | |
| Machinery – 4.3% | |
| Bucyrus International, Inc. | | | 120,720 | | | | 8,432,292 | | |
| Cummins, Inc. | | | 254,850 | | | | 16,606,026 | | |
| Flowserve Corp. | | | 83,170 | | | | 10,988,421 | | |
| Joy Global, Inc. | | | 178,118 | | | | 12,653,503 | | |
| Manitowoc Co., Inc. | | | 195,780 | | | | 4,929,740 | | |
| Parker Hannifin Corp. | | | 117,460 | | | | 7,525,662 | | |
| Machinery Total | | | 61,135,644 | | |
| Marine – 0.4% | |
| DryShips, Inc. | | | 81,500 | | | | 5,985,360 | | |
| Marine Total | | | 5,985,360 | | |
| Road & Rail – 0.7% | |
| Landstar System, Inc. | | | 197,980 | | | | 9,704,979 | | |
| Road & Rail Total | | | 9,704,979 | | |
| Industrials Total | | | 231,229,893 | | |
| Information Technology – 17.5% | |
| Communications Equipment – 2.2% | |
| CommScope, Inc. (a) | | | 122,700 | | | | 6,008,619 | | |
| Harris Corp. | | | 238,930 | | | | 12,510,375 | | |
| Juniper Networks, Inc. (a) | | | 270,190 | | | | 6,943,883 | | |
| Research In Motion Ltd. (a) | | | 45,840 | | | | 5,574,144 | | |
| Communications Equipment Total | | | 31,037,021 | | |
| Computers & Peripherals – 0.6% | |
| Seagate Technology | | | 558,850 | | | | 8,332,454 | | |
| Computers & Peripherals Total | | | 8,332,454 | | |
| | | Shares | | Value ($) | |
| Electronic Equipment & Instruments – 1.2% | |
| Amphenol Corp., Class A | | | 148,620 | | | | 7,062,422 | | |
| Avnet, Inc. (a) | | | 215,900 | | | | 6,336,665 | | |
| Tyco Electronics Ltd. | | | 140,900 | | | | 4,637,019 | | |
| Electronic Equipment & Instruments Total | | | 18,036,106 | | |
| Internet Software & Services – 1.5% | |
| Equinix, Inc. (a) | | | 160,130 | | | | 12,890,465 | | |
| VeriSign, Inc. (a) | | | 249,870 | | | | 7,988,344 | | |
| Internet Software & Services Total | | | 20,878,809 | | |
| IT Services – 4.0% | |
| Alliance Data Systems Corp. (a) | | | 187,890 | | | | 12,070,054 | | |
Cognizant Technology
Solutions Corp., Class A (a) | | | 343,860 | | | | 10,081,975 | | |
| Fiserv, Inc. (a) | | | 149,440 | | | | 7,749,958 | | |
| Global Payments, Inc. | | | 136,150 | | | | 6,563,791 | | |
| Mastercard, Inc., Class A | | | 31,220 | | | | 7,572,411 | | |
| Paychex, Inc. | | | 195,120 | | | | 6,649,690 | | |
| Total System Services, Inc. | | | 272,830 | | | | 5,434,774 | | |
| IT Services Total | | | 56,122,653 | | |
| Semiconductors & Semiconductor Equipment – 3.7% | |
ASML Holding N.V., N.Y.
Registered Shares | | | 369,070 | | | | 8,728,506 | | |
| Broadcom Corp., Class A (a) | | | 485,990 | | | | 11,692,919 | | |
| Lam Research Corp. (a) | | | 144,420 | | | | 5,308,879 | | |
| Linear Technology Corp. | | | 179,560 | | | | 5,860,838 | | |
Marvell Technology
Group Ltd. (a) | | | 550,810 | | | | 7,771,929 | | |
| Microchip Technology, Inc. | | | 219,310 | | | | 7,020,113 | | |
| NVIDIA Corp. (a) | | | 459,240 | | | | 5,804,794 | | |
Semiconductors & Semiconductor
Equipment Total | | | 52,187,978 | | |
| Software – 4.3% | |
| Activision Blizzard, Inc. (a) | | | 265,650 | | | | 8,718,633 | | |
| Autodesk, Inc. (a) | | | 254,189 | | | | 9,031,335 | | |
| Citrix Systems, Inc. (a) | | | 199,894 | | | | 6,050,791 | | |
| FactSet Research Systems, Inc. | | | 124,680 | | | | 7,818,683 | | |
| McAfee, Inc. (a) | | | 176,330 | | | | 6,975,615 | | |
| Salesforce.com, Inc. (a) | | | 236,690 | | | | 13,259,374 | | |
| UBISOFT Entertainment (a) | | | 90,130 | | | | 8,440,056 | | |
| Software Total | | | 60,294,487 | | |
| Information Technology Total | | | 246,889,508 | | |
| Materials – 6.9% | |
| Chemicals – 4.4% | |
| Agrium, Inc. | | | 98,840 | | | | 8,332,212 | | |
| Ecolab, Inc. | | | 152,150 | | | | 6,959,341 | | |
See Accompanying Notes to Financial Statements.
55
Columbia Mid Cap Growth Fund
August 31, 2008
| Common Stocks (continued) | |
| | | Shares | | Value ($) | |
| Intrepid Potash, Inc. (a) | | | 121,018 | | | | 5,731,412 | | |
| Monsanto Co. | | | 110,010 | | | | 12,568,643 | | |
Potash Corp. of
Saskatchewan, Inc. | | | 125,260 | | | | 21,745,136 | | |
| Wacker Chemie AG | | | 31,450 | | | | 5,790,211 | | |
| Chemicals Total | | | 61,126,955 | | |
| Metals & Mining – 2.5% | |
| Agnico-Eagle Mines Ltd. (b) | | | 119,750 | | | | 6,854,490 | | |
| AK Steel Holding Corp. | | | 96,020 | | | | 5,051,612 | | |
| Cleveland-Cliffs, Inc. | | | 112,180 | | | | 11,354,860 | | |
Freeport-McMoRan Copper &
Gold, Inc. | | | 76,979 | | | | 6,875,764 | | |
| Nucor Corp. | | | 105,530 | | | | 5,540,325 | | |
| Metals & Mining Total | | | 35,677,051 | | |
| Materials Total | | | 96,804,006 | | |
| Telecommunication Services – 2.6% | |
| Wireless Telecommunication Services – 2.6% | |
American Tower Corp.,
Class A (a) | | | 399,687 | | | | 16,519,064 | | |
Crown Castle International
Corp. (a) | | | 317,520 | | | | 11,875,248 | | |
| NII Holdings, Inc. (a) | | | 150,330 | | | | 7,895,331 | | |
Wireless Telecommunication
Services Total | | | 36,289,643 | | |
| Telecommunication Services Total | | | 36,289,643 | | |
| Utilities – 2.6% | |
| Electric Utilities – 1.3% | |
| ITC Holdings Corp. | | | 129,949 | | | | 7,278,442 | | |
| PPL Corp. | | | 267,500 | | | | 11,708,475 | | |
| Electric Utilities Total | | | 18,986,917 | | |
| Gas Utilities – 0.8% | |
| Questar Corp. | | | 206,270 | | | | 10,703,350 | | |
| Gas Utilities Total | | | 10,703,350 | | |
| Independent Power Producers & Energy Traders – 0.5% | |
| NRG Energy, Inc. (a) | | | 183,620 | | | | 6,911,458 | | |
Independent Power Producers &
Energy Traders Total | | | 6,911,458 | | |
| Utilities Total | | | 36,601,725 | | |
Total Common Stocks
(cost of $1,211,107,243) | | | 1,385,972,338 | | |
| Purchased Put Option – 0.0% | |
| | | Units | | Value ($) | |
| Agnico Eagle Mines Ltd. | |
| Strike Price: $55.00 | |
| Expire: 09/20/08 | | | 119,700 | | | | 215,460 | | |
Total Purchased Put Option
(cost of $302,889) | | | 215,460 | | |
| Short-Term Obligation – 1.0% | |
| | | Par ($) | | | |
Repurchase agreement with
Fixed Income Clearing Corp.,
dated 08/29/08, due 09/02/08
at 1.930%, collateralized by a
U.S. Treasury Obligation
maturing 05/15/09, market
value $14,059,481 (repurchase
proceeds $13,782,955) | | | 13,780,000 | | | | 13,780,000 | | |
Total Short-Term Obligation
(cost of $13,780,000) | | | 13,780,000 | | |
Total Investments – 99.4%
(cost of $1,225,190,132) (c) | | | 1,399,967,798 | | |
| Other Assets & Liabilities, Net – 0.6% | | | 8,196,706 | | |
| Net Assets – 100.0% | | | 1,408,164,504 | | |
Notes to Investment Portfolio:
(a) Non-income producing security.
(b) Security pledged as collateral for written option contracts.
(c) Cost for federal income tax purposes is $1,234,003,985.
At August 31, 2008, the Fund held investments in the following sectors:
| Sector (Unaudited) | | % of
Net Assets | |
| Information Technology | | | 17.5 | | |
| Consumer Discretionary | | | 17.4 | | |
| Industrials | | | 16.4 | | |
| Health Care | | | 13.0 | | |
| Energy | | | 12.1 | | |
| Materials | | | 6.9 | | |
| Financials | | | 5.8 | | |
| Consumer Staples | | | 4.1 | | |
| Utilities | | | 2.6 | | |
| Telecommunication Services | | | 2.6 | | |
| | | | 98.4 | | |
| Purchased Put Option | | | 0.0 | * | |
| Short-Term Obligation | | | 1.0 | | |
| Other Assets & Liabilities, Net | | | 0.6 | | |
| | | | 100.0 | | |
* Rounds to less than 0.1%
See Accompanying Notes to Financial Statements.
56
Columbia Mid Cap Growth Fund
August 31, 2008
At August 31, 2008, the Fund had the following written call option contracts:
| Name of Issuer | | Strike
Price | | Number of
Contracts | | Expiration
Date | | Premium | | Value | |
Agnico Eagle
Mines Ltd. | | $ | 70 | | | | 1,197 | | | | 10/18/08 | | | $ | 128,030 | | | $ | 107,730 | | |
| Total written call options (proceeds $128,030) | | | |
For the year ended August 31, 2008, transactions in written option contracts were as follows:
| | | Number of
contracts | | Premium
received | |
| Options outstanding at August 31, 2007 | | | – | | | $ | – | | |
| Options written | | | 5,160 | | | | 1,516,266 | | |
Options terminated in closing purchase
transactions | | | (3,963 | ) | | | (1,388,236 | ) | |
| Options exercised | | | – | | | | – | | |
| Options expired | | | – | | | | – | | |
| Options outstanding at August 31, 2008 | | | 1,197 | | | $ | 128,030 | | |
| Acronym | | Name | |
| ADR | | American Depositary Receipt | |
|
See Accompanying Notes to Financial Statements.
57
Investment Portfolio – Columbia Small Cap Growth Fund I
August 31, 2008
| Common Stocks – 95.5% | |
| | | Shares | | Value ($) | |
| Consumer Discretionary – 12.6% | |
| Auto Components – 0.5% | |
| WABCO Holdings, Inc. | | | 44,377 | | | | 1,943,712 | | |
| Auto Components Total | | | 1,943,712 | | |
| Distributors – 0.5% | |
| LKQ Corp. (a) | | | 114,500 | | | | 2,144,585 | | |
| Distributors Total | | | 2,144,585 | | |
| Diversified Consumer Services – 2.5% | |
| Capella Education Co. (a) | | | 59,241 | | | | 2,944,870 | | |
| Coinstar, Inc. (a) | | | 82,800 | | | | 2,725,776 | | |
| DeVry, Inc. | | | 62,800 | | | | 3,239,224 | | |
New Oriental Education &
Technology Group, ADR (a) | | | 18,100 | | | | 1,341,210 | | |
| Diversified Consumer Services Total | | | 10,251,080 | | |
| Hotels, Restaurants & Leisure – 1.7% | |
| Ctrip.com International Ltd., ADR | | | 46,874 | | | | 2,356,825 | | |
| Panera Bread Co., Class A (a) | | | 39,000 | | | | 2,095,860 | | |
| WMS Industries, Inc. (a) | | | 70,600 | | | | 2,372,160 | | |
| Hotels, Restaurants & Leisure Total | | | 6,824,845 | | |
| Household Durables – 0.5% | |
| Tupperware Brands Corp. | | | 56,400 | | | | 2,014,608 | | |
| Household Durables Total | | | 2,014,608 | | |
| Internet & Catalog Retail – 0.4% | |
| Priceline.com, Inc. (a) | | | 19,800 | | | | 1,841,004 | | |
| Internet & Catalog Retail Total | | | 1,841,004 | | |
| Leisure Equipment & Products – 0.6% | |
| Polaris Industries, Inc. | | | 55,200 | | | | 2,488,968 | | |
| Leisure Equipment & Products Total | | | 2,488,968 | | |
| Media – 1.6% | |
Central European Media
Enterprises Ltd., Class A (a) | | | 22,000 | | | | 1,714,020 | | |
| Marvel Entertainment, Inc. (a) | | | 76,000 | | | | 2,574,120 | | |
| Morningstar, Inc. (a) | | | 35,800 | | | | 2,338,098 | | |
| Media Total | | | 6,626,238 | | |
| Specialty Retail – 1.6% | |
| Aeropostale, Inc. (a) | | | 66,300 | | | | 2,311,218 | | |
Children's Place Retail Stores,
Inc. (a) | | | 40,000 | | | | 1,678,000 | | |
| Gymboree Corp. (a) | | | 61,900 | | | | 2,429,575 | | |
| Specialty Retail Total | | | 6,418,793 | | |
| Textiles, Apparel & Luxury Goods – 2.7% | |
| Deckers Outdoor Corp. (a) | | | 39,200 | | | | 4,456,648 | | |
| True Religion Apparel, Inc. (a) | | | 159,500 | | | | 4,330,425 | | |
| | | Shares | | Value ($) | |
| Warnaco Group, Inc. (a) | | | 47,300 | | | | 2,439,261 | | |
| Textiles, Apparel & Luxury Goods Total | | | 11,226,334 | | |
| Total Consumer Discretionary | | | 51,780,167 | | |
| Consumer Staples – 2.2% | |
| Beverages – 0.7% | |
Central European Distribution
Corp. (a) | | | 53,800 | | | | 3,103,722 | | |
| Beverages Total | | | 3,103,722 | | |
| Food & Staples Retailing – 0.5% | |
| BJ's Wholesale Club, Inc. (a) | | | 53,200 | | | | 2,023,196 | | |
| Food & Staples Retailing Total | | | 2,023,196 | | |
| Food Products – 0.6% | |
Green Mountain Coffee Roasters,
Inc. (a) | | | 66,700 | | | | 2,433,883 | | |
| Food Products Total | | | 2,433,883 | | |
| Personal Products – 0.4% | |
| Chattem, Inc. (a) | | | 23,100 | | | | 1,619,772 | | |
| Personal Products Total | | | 1,619,772 | | |
| Consumer Staples Total | | | 9,180,573 | | |
| Energy – 11.7% | |
| Energy Equipment & Services – 3.3% | |
| Atwood Oceanics, Inc. (a) | | | 127,300 | | | | 5,176,018 | | |
| Core Laboratories N.V. | | | 27,300 | | | | 3,389,022 | | |
| IHS, Inc., Class A (a) | | | 26,800 | | | | 1,719,488 | | |
| Tesco Corp. (a) | | | 99,400 | | | | 3,376,618 | | |
| Energy Equipment & Services Total | | | 13,661,146 | | |
| Oil, Gas & Consumable Fuels – 8.4% | |
| Arena Resources, Inc. (a) | | | 102,885 | | | | 4,595,873 | | |
| Berry Petroleum Co., Class A | | | 60,200 | | | | 2,505,524 | | |
| BPZ Resources, Inc. (a) | | | 124,400 | | | | 2,450,680 | | |
| Carrizo Oil & Gas, Inc. (a) | | | 65,200 | | | | 3,236,528 | | |
| Concho Resources, Inc. (a) | | | 138,524 | | | | 4,525,579 | | |
| EXCO Resources, Inc. (a) | | | 119,500 | | | | 3,164,360 | | |
| Foundation Coal Holdings, Inc. | | | 40,700 | | | | 2,407,405 | | |
| Holly Corp. | | | 50,200 | | | | 1,606,400 | | |
| Parallel Petroleum Corp. (a) | | | 197,569 | | | | 2,615,814 | | |
| Penn Virginia Corp. | | | 33,300 | | | | 2,203,794 | | |
| PetroHawk Energy Corp. (a) | | | 79,300 | | | | 2,744,573 | | |
| Ship Finance International Ltd. | | | 79,900 | | | | 2,223,617 | | |
| Oil, Gas & Consumable Fuels Total | | | 34,280,147 | | |
| Energy Total | | | 47,941,293 | | |
See Accompanying Notes to Financial Statements.
58
Columbia Small Cap Growth Fund I
August 31, 2008
| Common Stocks (continued) | |
| | | Shares | | Value ($) | |
| Financials – 3.6% | |
| Capital Markets – 1.4% | |
Waddell & Reed Financial, Inc.,
Class A | | | 174,100 | | | | 5,606,020 | | |
| Capital Markets Total | | | 5,606,020 | | |
| Consumer Finance – 0.4% | |
| Cash America International, Inc. | | | 42,300 | | | | 1,750,797 | | |
| Consumer Finance Total | | | 1,750,797 | | |
| Real Estate Investment Trusts (REITs) – 1.8% | |
| Alexandria Real Estate Equities, Inc. | | | 23,800 | | | | 2,563,498 | | |
| Home Properties, Inc. | | | 47,800 | | | | 2,521,450 | | |
Washington Real Estate
Investment Trust | | | 59,600 | | | | 2,106,860 | | |
| Total Real Estate Investment Trusts (REITs) | | | 7,191,808 | | |
| Financials Total | | | 14,548,625 | | |
| Health Care – 21.7% | |
| Biotechnology – 6.6% | |
| Alexion Pharmaceuticals, Inc. (a) | | | 116,300 | | | | 5,242,804 | | |
| BioMarin Pharmaceuticals, Inc. (a) | | | 77,800 | | | | 2,344,892 | | |
| Celera Corp. (a) | | | 112,800 | | | | 1,579,200 | | |
| Cepheid, Inc. (a) | | | 61,300 | | | | 1,140,180 | | |
| Myriad Genetics, Inc. (a) | | | 31,400 | | | | 2,141,480 | | |
| Onyx Pharmaceuticals, Inc. (a) | | | 90,400 | | | | 3,694,648 | | |
| OSI Pharmaceuticals, Inc. (a) | | | 96,100 | | | | 4,853,050 | | |
| Savient Pharmaceuticals, Inc. (a) | | | 81,790 | | | | 1,859,087 | | |
| United Therapeutics Corp. (a) | | | 40,300 | | | | 4,277,039 | | |
| Biotechnology Total | | | 27,132,380 | | |
| Health Care Equipment & Supplies – 6.3% | |
| Align Technology, Inc. (a) | | | 77,900 | | | | 1,015,816 | | |
| Haemonetics Corp. (a) | | | 42,700 | | | | 2,678,144 | | |
| Hologic, Inc. (a) | | | 264,474 | | | | 5,612,138 | | |
| Immucor, Inc. (a) | | | 57,100 | | | | 1,839,191 | | |
| Masimo Corp. (a) | | | 58,770 | | | | 2,349,037 | | |
| Natus Medical, Inc. (a) | | | 104,212 | | | | 2,563,615 | | |
| NuVasive, Inc. (a) | | | 101,400 | | | | 4,832,724 | | |
| Spectranetics Corp. (a) | | | 255,300 | | | | 2,052,612 | | |
| Thoratec Corp. (a) | | | 97,100 | | | | 2,586,744 | | |
| Health Care Equipment & Supplies Total | | | 25,530,021 | | |
| Health Care Providers & Services – 3.6% | |
| CardioNet, Inc. (a) | | | 87,352 | | | | 2,664,236 | | |
| Genoptix, Inc. (a) | | | 49,000 | | | | 1,715,000 | | |
| HealthExtras, Inc. (a) | | | 76,336 | | | | 2,488,554 | | |
| IPC The Hospitalist Co., Inc. (a) | | | 76,905 | | | | 1,964,923 | | |
| | | Shares | | Value ($) | |
| Pediatrix Medical Group, Inc. (a) | | | 17,600 | | | | 1,002,320 | | |
| Psychiatric Solutions, Inc. (a) | | | 130,654 | | | | 4,932,188 | | |
| Health Care Providers & Services Total | | | 14,767,221 | | |
| Health Care Technology – 0.5% | |
| Phase Forward, Inc. (a) | | | 108,274 | | | | 2,091,853 | | |
| Health Care Technology Total | | | 2,091,853 | | |
| Life Sciences Tools & Services – 3.9% | |
| ICON PLC, ADR (a) | | | 292,956 | | | | 11,932,098 | | |
| Illumina, Inc. (a) | | | 44,800 | | | | 3,858,624 | | |
| Life Sciences Tools & Services Total | | | 15,790,722 | | |
| Pharmaceuticals – 0.8% | |
| Cypress Bioscience, Inc. (a) | | | 137,000 | | | | 939,820 | | |
| Perrigo Co. | | | 68,600 | | | | 2,400,314 | | |
| Pharmaceuticals Total | | | 3,340,134 | | |
| Health Care Total | | | 88,652,331 | | |
| Industrials – 15.0% | |
| Aerospace & Defense – 0.8% | |
| Hexcel Corp. (a) | | | 158,400 | | | | 3,291,552 | | |
| Aerospace & Defense Total | | | 3,291,552 | | |
| Air Freight & Logistics – 0.5% | |
| HUB Group, Inc., Class A (a) | | | 50,754 | | | | 2,027,115 | | |
| Air Freight & Logistics Total | | | 2,027,115 | | |
| Commercial Services & Supplies – 3.6% | |
| CoStar Group, Inc. (a) | | | 41,200 | | | | 2,175,772 | | |
| FTI Consulting, Inc. (a) | | | 14,890 | | | | 1,092,926 | | |
| Geo Group, Inc. (a) | | | 90,900 | | | | 2,011,617 | | |
| Huron Consulting Group, Inc. (a) | | | 27,653 | | | | 1,783,065 | | |
| Ritchie Bros Auctioneers, Inc. | | | 126,700 | | | | 3,352,482 | | |
| Waste Connections, Inc. (a) | | | 120,250 | | | | 4,366,278 | | |
| Commercial Services & Supplies Total | | | 14,782,140 | | |
| Construction & Engineering – 0.6% | |
| EMCOR Group, Inc. (a) | | | 72,600 | | | | 2,473,482 | | |
| Construction & Engineering Total | | | 2,473,482 | | |
| Electrical Equipment – 3.2% | |
| Acuity Brands, Inc. | | | 70,900 | | | | 3,084,859 | | |
| Energy Conversion Devices, Inc. (a) | | | 34,200 | | | | 2,570,814 | | |
| General Cable Corp. (a) | | | 72,300 | | | | 3,558,606 | | |
| GrafTech International Ltd. (a) | | | 177,300 | | | | 3,602,736 | | |
| Electrical Equipment Total | | | 12,817,015 | | |
| Machinery – 4.2% | |
| Actuant Corp., Class A | | | 62,200 | | | | 1,962,410 | | |
| Barnes Group, Inc. | | | 100,300 | | | | 2,419,236 | | |
See Accompanying Notes to Financial Statements.
59
Columbia Small Cap Growth Fund I
August 31, 2008
| Common Stocks (continued) | |
| | | Shares | | Value ($) | |
| Bucyrus International, Inc. | | | 82,500 | | | | 5,762,625 | | |
| Kaydon Corp. | | | 32,600 | | | | 1,816,798 | | |
| Key Technology, Inc. (a) | | | 66,178 | | | | 1,890,044 | | |
| RBC Bearings, Inc. (a) | | | 86,275 | | | | 3,445,823 | | |
| Machinery Total | | | 17,296,936 | | |
| Marine – 0.5% | |
| Excel Maritime Carriers Ltd. | | | 53,800 | | | | 1,920,122 | | |
| Marine Total | | | 1,920,122 | | |
| Road & Rail – 1.2% | |
Genesee & Wyoming, Inc.,
Class A (a) | | | 71,600 | | | | 3,079,516 | | |
| Landstar System, Inc. | | | 38,600 | | | | 1,892,172 | | |
| Road & Rail Total | | | 4,971,688 | | |
| Transportation Infrastructure – 0.4% | |
Aegean Marine Petroleum
Network, Inc. | | | 55,900 | | | | 1,736,813 | | |
| Transportation Infrastructure Total | | | 1,736,813 | | |
| Industrials Total | | | 61,316,863 | | |
| Information Technology – 20.9% | |
| Communications Equipment – 0.7% | |
| Neutral Tandem, Inc. (a) | | | 137,193 | | | | 2,812,456 | | |
| Communications Equipment Total | | | 2,812,456 | | |
| Electronic Equipment & Instruments – 1.5% | |
| DTS, Inc. (a) | | | 108,400 | | | | 3,487,228 | | |
| Itron, Inc. (a) | | | 23,800 | | | | 2,465,204 | | |
| Electronic Equipment & Instruments Total | | | 5,952,432 | | |
| Internet Software & Services – 4.1% | |
| Ariba, Inc. (a) | | | 172,700 | | | | 2,543,871 | | |
| Equinix, Inc. (a) | | | 46,657 | | | | 3,755,889 | | |
| Omniture, Inc. (a) | | | 261,967 | | | | 4,668,252 | | |
| VistaPrint Ltd. (a) | | | 65,000 | | | | 2,160,600 | | |
| Vocus, Inc. (a) | | | 108,594 | | | | 3,871,376 | | |
| Internet Software & Services Total | | | 16,999,988 | | |
| IT Services – 0.9% | |
| VeriFone Holdings, Inc. (a) | | | 82,100 | | | | 1,655,136 | | |
| Wright Express Corp. (a) | | | 74,500 | | | | 2,216,375 | | |
| IT Services Total | | | 3,871,511 | | |
| Semiconductors & Semiconductor Equipment – 6.2% | |
| Atheros Communications, Inc. (a) | | | 115,159 | | | | 3,755,335 | | |
| Entegris, Inc. (a) | | | 271,200 | | | | 1,670,592 | | |
| FEI Co. (a) | | | 81,700 | | | | 2,212,436 | | |
| | | Shares | | Value ($) | |
| Hittite Microwave Corp. (a) | | | 70,601 | | | | 2,498,569 | | |
| Microsemi Corp. (a) | | | 106,500 | | | | 2,928,750 | | |
| Monolithic Power Systems, Inc. (a) | | | 113,500 | | | | 2,765,995 | | |
| Netlogic Microsystems, Inc. (a) | | | 82,700 | | | | 2,872,171 | | |
| Power Integrations, Inc. (a) | | | 108,400 | | | | 3,190,212 | | |
| Trina Solar Ltd., ADR (a) | | | 56,300 | | | | 1,841,010 | | |
| Verigy Ltd. (a) | | | 89,810 | | | | 1,658,791 | | |
Semiconductors & Semiconductor
Equipment Total | | | 25,393,861 | | |
| Software – 7.5% | |
| Advent Software, Inc. (a) | | | 17,000 | | | | 786,250 | | |
| ArcSight, Inc. (a) | | | 203,700 | | | | 1,979,964 | | |
| Blackboard, Inc. (a) | | | 98,500 | | | | 3,936,060 | | |
| Concur Technologies, Inc. (a) | | | 63,643 | | | | 2,797,110 | | |
| FactSet Research Systems, Inc. | | | 29,900 | | | | 1,875,029 | | |
| Informatica Corp. (a) | | | 105,300 | | | | 1,776,411 | | |
| Jack Henry & Associates, Inc. | | | 60,500 | | | | 1,211,815 | | |
Magma Design Automation,
Inc. (a) | | | 234,100 | | | | 1,189,228 | | |
| Micros Systems, Inc. (a) | | | 49,200 | | | | 1,516,344 | | |
| Net 1 UEPS Technologies, Inc. (a) | | | 109,000 | | | | 2,923,380 | | |
| Netscout Systems, Inc. (a) | | | 166,400 | | | | 2,479,360 | | |
| Nuance Communications, Inc. (a) | | | 154,100 | | | | 2,434,780 | | |
| Solera Holdings, Inc. (a) | | | 112,098 | | | | 3,455,981 | | |
| Ultimate Software Group, Inc. (a) | | | 80,900 | | | | 2,268,436 | | |
| Software Total | | | 30,630,148 | | |
| Information Technology Total | | | 85,660,396 | | |
| Materials – 6.2% | |
| Chemicals – 3.3% | |
| CF Industries Holdings, Inc. | | | 29,200 | | | | 4,450,080 | | |
| Intrepid Potash, Inc. (a) | | | 101,600 | | | | 4,811,776 | | |
| Terra Industries, Inc. | | | 87,500 | | | | 4,396,875 | | |
| Chemicals Total | | | 13,658,731 | | |
| Containers & Packaging – 0.7% | |
| Silgan Holdings, Inc. | | | 55,000 | | | | 2,878,700 | | |
| Containers & Packaging Total | | | 2,878,700 | | |
| Metals & Mining – 2.2% | |
| Cleveland-Cliffs, Inc. | | | 34,600 | | | | 3,502,212 | | |
| Pan American Silver Corp. (a) | | | 95,600 | | | | 2,541,048 | | |
| Steel Dynamics, Inc. | | | 118,600 | | | | 2,944,838 | | |
| Metals & Mining Total | | | 8,988,098 | | |
| Materials Total | | | 25,525,529 | | |
See Accompanying Notes to Financial Statements.
60
Columbia Small Cap Growth Fund I
August 31, 2008
| Common Stocks (continued) | |
| | | Shares | | Value ($) | |
| Telecommunication Services – 1.1% | |
| Wireless Telecommunication Services – 1.1% | |
SBA Communications Corp.,
Class A (a) | | | 132,307 | | | | 4,621,484 | | |
| Wireless Telecommunication Services Total | | | 4,621,484 | | |
| Telecommunication Services Total | | | 4,621,484 | | |
| Utilities – 0.5% | |
| Electric Utilities – 0.5% | |
| ITC Holdings Corp. | | | 36,400 | | | | 2,038,764 | | |
| Electric Utilities Total | | | 2,038,764 | | |
| Utilities Total | | | 2,038,764 | | |
Total Common Stocks
(cost of $345,984,774) | | | 391,266,025 | | |
| Short-Term Obligation – 6.3% | |
| | | Par ($) | | | |
Repurchase agreement with
Fixed Income Clearing Corp.,
dated 08/29/08, due 09/02/08
at 1.930%, collateralized by a
U.S. Treasury Obligation
maturing 05/15/09, market
value of $26,202,469
(repurchase proceeds
$25,690,508) | | | 25,685,000 | | | | 25,685,000 | | |
Total Short-Term Obligation
(cost of $25,685,000) | | | 25,685,000 | | |
Total Investments – 101.8%
(cost of $371,669,774) (b) | | | 416,951,025 | | |
| Other Assets & Liabilities, Net – (1.8)% | | | (7,427,721 | ) | |
| Net Assets – 100.0% | | | 409,523,304 | | |
Notes to Investment Portfolio:
(a) Non-income producing security.
(b) Cost for federal income tax purposes is $374,573,539.
For the year ended August 31, 2008, transactions in written option contracts were as follows:
| | | Number of
contracts | | Premium
received | |
| Options outstanding at August 31, 2007 | | | – | | | $ | – | | |
| Options written | | | 1,511 | | | | 431,171 | | |
| Options terminated in closing | |
| purchase transactions | | | (911 | ) | | | (327,748 | ) | |
| Options exercised | | | – | | | | – | | |
| Options expired | | | (600 | ) | | | (103,423 | ) | |
| Options outstanding at August 31, 2008 | | | – | | | $ | – | | |
At August 31, 2008, the Fund held investments in the following sectors:
| Sector (Unaudited) | | % of
Net Assets | |
| Health Care | | | 21.7 | | |
| Information Technology | | | 20.9 | | |
| Industrials | | | 15.0 | | |
| Consumer Discretionary | | | 12.6 | | |
| Energy | | | 11.7 | | |
| Materials | | | 6.2 | | |
| Financials | | | 3.6 | | |
| Consumer Staples | | | 2.2 | | |
| Telecommunication Services | | | 1.1 | | |
| Utilities | | | 0.5 | | |
| | | | 95.5 | | |
| Short-Term Obligation | | | 6.3 | | |
| Other Assets & Liabilities, Net | | | (1.8 | ) | |
| | | | 100.0 | | |
| Acronym | | Name | |
| ADR | | American Depositary Receipt | |
|
See Accompanying Notes to Financial Statements.
61
Investment Portfolio – Columbia Real Estate Equity Fund
August 31, 2008
| Common Stocks – 92.3% | |
| | | Shares | | Value ($) | |
| Financials – 92.3% | |
| Real Estate Investment Trusts (REITs) – 92.3% | |
Alexandria Real Estate Equities,
Inc. | | | 149,403 | | | | 16,092,197 | | |
| BioMed Realty Trust, Inc. | | | 188,400 | | | | 5,045,352 | | |
Boardwalk Real Estate
Investment Trust | | | 180,678 | | | | 6,636,318 | | |
| Boston Properties, Inc. | | | 77,699 | | | | 7,961,816 | | |
| Brandywine Realty Trust | | | 352,500 | | | | 6,133,500 | | |
| Corporate Office Properties Trust | | | 343,764 | | | | 13,441,172 | | |
| Digital Realty Trust, Inc. | | | 312,584 | | | | 14,338,228 | | |
| EastGroup Properties, Inc. | | | 66,700 | | | | 2,965,482 | | |
| Entertainment Properties Trust | | | 257,643 | | | | 13,982,286 | | |
| Equity Residential Property Trust | | | 120,700 | | | | 5,093,540 | | |
| Essex Property Trust, Inc. | | | 111,622 | | | | 13,098,842 | | |
| Extra Space Storage, Inc. | | | 58,100 | | | | 915,075 | | |
| General Growth Properties, Inc. | | | 146,700 | | | | 3,803,931 | | |
| HCP, Inc. | | | 240,400 | | | | 8,707,288 | | |
| Kimco Realty Corp. | | | 599,047 | | | | 22,248,606 | | |
| LaSalle Hotel Properties | | | 314,044 | | | | 8,187,127 | | |
| Mack-Cali Realty Corp. | | | 179,500 | | | | 7,255,390 | | |
Mid-America Apartment
Communities, Inc. | | | 172,442 | | | | 8,649,691 | | |
| National Retail Properties, Inc. | | | 367,248 | | | | 8,332,857 | | |
| Plum Creek Timber Co., Inc. | | | 373,470 | | | | 18,531,581 | | |
| Potlatch Corp. | | | 107,267 | | | | 5,008,296 | | |
| ProLogis | | | 124,208 | | | | 5,348,396 | | |
| Public Storage, Inc. | | | 85,300 | | | | 7,533,696 | | |
| Regency Centers Corp. | | | 181,900 | | | | 11,272,343 | | |
| Simon Property Group, Inc. | | | 387,412 | | | | 36,757,651 | | |
| Sun Communities, Inc. | | | 344,389 | | | | 6,650,152 | | |
| Ventas, Inc. | | | 363,780 | | | | 16,522,888 | | |
| Vornado Realty Trust | | | 132,216 | | | | 13,150,203 | | |
Real Estate Investment Trusts
(REITs) Total | | | 293,663,904 | | |
| Financials Total | | | 293,663,904 | | |
Total Common Stocks
(cost of $233,207,561) | | | 293,663,904 | | |
| Investment Company – 4.0% | |
iShares Dow Jones U.S. Real
Estate Index Fund | | | 202,882 | | | | 12,868,805 | | |
Total Investment Company
(cost of $13,398,798) | | | 12,868,805 | | |
| Short-Term Obligation – 3.7% | |
| | | Par ($) | | Value ($) | |
Repurchase agreement with
Fixed Income Clearing Corp.,
dated 08/29/08, due 09/02/08
at 1.930%, collateralized by a
U.S. Treasury Obligation
maturing 05/15/09, market
value of $11,919,656
(repurchase proceeds
$11,684,505) | | | 11,682,000 | | | | 11,682,000 | | |
Total Short-Term Obligation
(cost of $11,682,000) | | | 11,682,000 | | |
Total Investments – 100.0%
(cost of $258,288,359) (a) | | | 318,214,709 | | |
| Other Assets & Liabilities, Net – 0.0% | | | (15,336 | ) | |
| Net Assets – 100.0% | | | 318,199,373 | | |
Notes to Investment Portfolio:
(a) Cost for federal income tax purposes is $258,939,597.
At August 31, 2008, the asset allocation of the Fund is as follows:
| Asset Allocation (Unaudited) | | % of
Net Assets | |
| Financials | | | 92.3 | | |
| Investment Company | | | 4.0 | | |
| Short-Term Obligation | | | 3.7 | | |
| Other Assets & Liabilities, Net | | | 0.0 | * | |
| | | | 100.0 | | |
* Rounds to less than 0.1%.
See Accompanying Notes to Financial Statements.
62
Investment Portfolio – Columbia Technology Fund
August 31, 2008
| Common Stocks – 97.0% | |
| | | Shares | | Value ($) | |
| Consumer Discretionary – 2.8% | |
| Hotels, Restaurants & Leisure – 1.0% | |
| Ctrip.com International Ltd., ADR | | | 83,208 | | | | 4,183,698 | | |
| Hotels, Restaurants & Leisure Total | | | 4,183,698 | | |
| Internet & Catalog Retail – 1.8% | |
| Amazon.com, Inc. (a) | | | 49,610 | | | | 4,008,984 | | |
| Priceline.com, Inc. (a) | | | 34,790 | | | | 3,234,774 | | |
| Internet & Catalog Retail Total | | | 7,243,758 | | |
| Consumer Discretionary Total | | | 11,427,456 | | |
| Energy – 1.1% | |
| Energy Equipment & Services – 1.1% | |
| FMC Technologies, Inc. (a) | | | 79,080 | | | | 4,235,525 | | |
| Energy Equipment & Services Total | | | 4,235,525 | | |
| Energy Total | | | 4,235,525 | | |
| Health Care – 4.5% | |
| Biotechnology – 1.0% | |
| BioMarin Pharmaceuticals, Inc. (a) | | | 81,350 | | | | 2,451,889 | | |
| Celgene Corp. (a) | | | 21,410 | | | | 1,483,713 | | |
| Biotechnology Total | | | 3,935,602 | | |
| Health Care Equipment & Supplies – 1.5% | |
| Intuitive Surgical, Inc. (a) | | | 8,460 | | | | 2,497,984 | | |
| Natus Medical, Inc. (a) | | | 68,919 | | | | 1,695,408 | | |
| Varian Medical Systems, Inc. (a) | | | 29,530 | | | | 1,865,115 | | |
| Health Care Equipment & Supplies Total | | | 6,058,507 | | |
| Health Care Providers & Services – 0.8% | |
| CardioNet, Inc. (a) | | | 35,284 | | | | 1,076,162 | | |
Laboratory Corp. of America
Holdings (a) | | | 26,100 | | | | 1,909,215 | | |
| Health Care Providers & Services Total | | | 2,985,377 | | |
| Life Sciences Tools & Services – 1.2% | |
| Illumina, Inc. (a) | | | 41,910 | | | | 3,609,708 | | |
Pharmaceutical Product
Development, Inc. | | | 33,350 | | | | 1,360,680 | | |
| Life Sciences Tools & Services Total | | | 4,970,388 | | |
| Health Care Total | | | 17,949,874 | | |
| Industrials – 3.8% | |
| Commercial Services & Supplies – 0.3% | |
| FTI Consulting, Inc. (a) | | | 19,511 | | | | 1,432,107 | | |
| Commercial Services & Supplies Total | | | 1,432,107 | | |
| | | Shares | | Value ($) | |
| Electrical Equipment – 3.5% | |
| First Solar, Inc. (a) | | | 28,940 | | | | 8,006,251 | | |
| General Cable Corp. (a) | | | 37,170 | | | | 1,829,507 | | |
| SunPower Corp., Class A (a) | | | 42,430 | | | | 4,139,047 | | |
| Electrical Equipment Total | | | 13,974,805 | | |
| Industrials Total | | | 15,406,912 | | |
| Information Technology – 75.4% | |
| Communications Equipment – 14.2% | |
| Harris Corp. | | | 145,630 | | | | 7,625,187 | | |
| Juniper Networks, Inc. (a) | | | 129,630 | | | | 3,331,491 | | |
| Neutral Tandem, Inc. (a) | | | 16,960 | | | | 347,680 | | |
| Nokia Corp., ADR | | | 599,530 | | | | 15,090,170 | | |
| QUALCOMM, Inc. | | | 246,910 | | | | 12,999,811 | | |
| Research In Motion Ltd. (a) | | | 144,460 | | | | 17,566,336 | | |
| Communications Equipment Total | | | 56,960,675 | | |
| Computers & Peripherals – 9.0% | |
| Apple, Inc. (a) | | | 54,960 | | | | 9,317,369 | | |
| EMC Corp. (a) | | | 259,040 | | | | 3,958,131 | | |
| Hewlett-Packard Co. | | | 201,450 | | | | 9,452,034 | | |
International Business
Machines Corp. | | | 41,990 | | | | 5,111,443 | | |
| NetApp, Inc. (a) | | | 57,590 | | | | 1,467,393 | | |
| Seagate Technology | | | 328,650 | | | | 4,900,172 | | |
| Teradata Corp. (a) | | | 84,530 | | | | 2,076,902 | | |
| Computers & Peripherals Total | | | 36,283,444 | | |
| Electronic Equipment & Instruments – 2.8% | |
| Amphenol Corp., Class A | | | 90,560 | | | | 4,303,411 | | |
| Avnet, Inc. (a) | | | 157,310 | | | | 4,617,049 | | |
| DTS, Inc. (a) | | | 38,440 | | | | 1,236,615 | | |
| PC Connection, Inc. (a) | | | 121,716 | | | | 923,824 | | |
| Electronic Equipment & Instruments Total | | | 11,080,899 | | |
| Internet Software & Services – 7.5% | |
| Equinix, Inc. (a) | | | 76,210 | | | | 6,134,905 | | |
| Google, Inc., Class A (a) | | | 5,970 | | | | 2,765,841 | | |
| Omniture, Inc. (a) | | | 396,111 | | | | 7,058,698 | | |
| VeriSign, Inc. (a) | | | 157,560 | | | | 5,037,193 | | |
| VistaPrint Ltd. (a) | | | 68,650 | | | | 2,281,926 | | |
| Vocus, Inc. (a) | | | 102,667 | | | | 3,660,079 | | |
| Yahoo!, Inc. (a) | | | 162,640 | | | | 3,151,963 | | |
| Internet Software & Services Total | | | 30,090,605 | | |
| IT Services – 6.8% | |
| Accenture Ltd., Class A | | | 110,570 | | | | 4,573,175 | | |
Affiliated Computer Services, Inc.,
Class A (a) | | | 121,480 | | | | 6,467,595 | | |
See Accompanying Notes to Financial Statements.
63
Columbia Technology Fund
August 31, 2008
| Common Stocks (continued) | |
| | | Shares | | Value ($) | |
Cognizant Technology Solutions
Corp., Class A (a) | | | 244,860 | | | | 7,179,295 | | |
| Fiserv, Inc. (a) | | | 84,470 | | | | 4,380,614 | | |
| Satyam Computer Services Ltd., ADR | | | 77,080 | | | | 1,715,801 | | |
| Total System Services, Inc. | | | 152,570 | | | | 3,039,195 | | |
| IT Services Total | | | 27,355,675 | | |
| Semiconductors & Semiconductor Equipment – 14.8% | |
ASML Holding N.V., N.Y.
Registered Shares | | | 258,164 | | | | 6,105,579 | | |
| Atheros Communications, Inc. (a) | | | 181,178 | | | | 5,908,214 | | |
| ATMI, Inc. (a) | | | 54,820 | | | | 1,337,060 | | |
| Broadcom Corp., Class A (a) | | | 290,010 | | | | 6,977,640 | | |
| FEI Co. (a) | | | 124,580 | | | | 3,373,626 | | |
| Hittite Microwave Corp. (a) | | | 99,360 | | | | 3,516,350 | | |
| Lam Research Corp. (a) | | | 110,050 | | | | 4,045,438 | | |
| Linear Technology Corp. | | | 31,290 | | | | 1,021,306 | | |
| Marvell Technology Group Ltd. (a) | | | 370,300 | | | | 5,224,933 | | |
| Microchip Technology, Inc. | | | 129,380 | | | | 4,141,454 | | |
| Microsemi Corp. (a) | | | 78,740 | | | | 2,165,350 | | |
| Monolithic Power Systems, Inc. (a) | | | 118,840 | | | | 2,896,131 | | |
| Netlogic Microsystems, Inc. (a) | | | 78,720 | | | | 2,733,946 | | |
| NVIDIA Corp. (a) | | | 219,320 | | | | 2,772,205 | | |
| Power Integrations, Inc. (a) | | | 108,400 | | | | 3,190,212 | | |
| Trina Solar Ltd., ADR (a) | | | 91,120 | | | | 2,979,624 | | |
Varian Semiconductor Equipment
Associates, Inc. (a) | | | 28,812 | | | | 930,628 | | |
Semiconductors & Semiconductor
Equipment Total | | | 59,319,696 | | |
| Software – 20.3% | |
| Activision Blizzard, Inc. (a) | | | 79,560 | | | | 2,611,159 | | |
| Adobe Systems, Inc. (a) | | | 132,440 | | | | 5,672,405 | | |
| Advent Software, Inc. (a) | | | 17,760 | | | | 821,400 | | |
| Amdocs Ltd. (a) | | | 107,650 | | | | 3,249,954 | | |
| Autodesk, Inc. (a) | | | 124,480 | | | | 4,422,774 | | |
| Blackboard, Inc. (a) | | | 91,240 | | | | 3,645,950 | | |
| CA, Inc. | | | 177,500 | | | | 4,244,025 | | |
Check Point Software
Technologies Ltd. (a) | | | 228,620 | | | | 5,598,904 | | |
| Citrix Systems, Inc. (a) | | | 135,475 | | | | 4,100,828 | | |
| Concur Technologies, Inc. (a) | | | 65,711 | | | | 2,887,999 | | |
| Magma Design Automation, Inc. (a) | | | 325,700 | | | | 1,654,556 | | |
| McAfee, Inc. (a) | | | 129,810 | | | | 5,135,284 | | |
| Microsoft Corp. | | | 181,440 | | | | 4,951,498 | | |
| Net 1 UEPS Technologies, Inc. (a) | | | 95,020 | | | | 2,548,436 | | |
| Nintendo Co., Ltd. | | | 12,070 | | | | 5,704,813 | | |
| Nuance Communications, Inc. (a) | | | 121,030 | | | | 1,912,274 | | |
| Oracle Corp. (a) | | | 213,970 | | | | 4,692,362 | | |
| Salesforce.com, Inc. (a) | | | 160,650 | | | | 8,999,613 | | |
| Solera Holdings, Inc. (a) | | | 115,786 | | | | 3,569,682 | | |
| | | Shares | | Value ($) | |
| UBISOFT Entertainment (a) | | | 31,030 | | | | 2,905,747 | | |
| Ultimate Software Group, Inc. (a) | | | 84,550 | | | | 2,370,782 | | |
| Software Total | | | 81,700,445 | | |
| Information Technology Total | | | 302,791,439 | | |
| Materials – 3.1% | |
| Chemicals – 3.1% | |
| Intrepid Potash, Inc. (a) | | | 93,325 | | | | 4,419,872 | | |
| Monsanto Co. | | | 41,830 | | | | 4,779,077 | | |
| Wacker Chemie AG | | | 16,770 | | | | 3,087,499 | | |
| Chemicals Total | | | 12,286,448 | | |
| Materials Total | | | 12,286,448 | | |
| Telecommunication Services – 6.3% | |
| Diversified Telecommunication Services – 1.0% | |
| Fairpoint Communications, Inc. | | | 456,800 | | | | 4,042,680 | | |
| Diversified Telecommunication Services Total | | | 4,042,680 | | |
| Wireless Telecommunication Services – 5.3% | |
| American Tower Corp., Class A (a) | | | 164,583 | | | | 6,802,215 | | |
| Crown Castle International Corp. (a) | | | 178,070 | | | | 6,659,818 | | |
| NII Holdings, Inc. (a) | | | 42,740 | | | | 2,244,705 | | |
SBA Communications Corp.,
Class A (a) | | | 154,220 | | | | 5,386,905 | | |
| Wireless Telecommunication Services Total | | | 21,093,643 | | |
| Telecommunication Services Total | | | 25,136,323 | | |
Total Common Stocks
(cost of $367,853,103) | | | 389,233,977 | | |
| | | Par ($) | | | |
| Short-Term Obligation – 6.0% | |
Repurchase agreement with
Fixed Income Clearing Corp.,
dated 08/29/08, due 09/02/08,
at 1.930%, collateralized by a
U.S. Treasury Obligation
maturing 05/15/09, market
value $24,696,281 (repurchase
proceeds $24,217,192) | | | 24,212,000 | | | | 24,212,000 | | |
Total Short-Term Obligation
(cost of $24,212,000) | | | 24,212,000 | | |
Total Investments – 103.0%
(cost of $392,065,103) (b) | | | 413,445,977 | | |
| Other Assets & Liabilities, Net – (3.0)% | | | (12,103,150 | ) | |
| Net Assets – 100.0% | | | 401,342,827 | | |
See Accompanying Notes to Financial Statements.
64
Columbia Technology Fund
August 31, 2008
Notes to Investment Portfolio:
(a) Non-income producing security.
(b) Cost for federal income tax purposes is $397,804,438.
At August 31, 2008, the asset allocation of the Fund is as follows:
| Asset Allocation (Unaudited) | | % of
Net Assets | |
| Information Technology | | | 75.4 | | |
| Telecommunication Services | | | 6.3 | | |
| Health Care | | | 4.5 | | |
| Industrials | | | 3.8 | | |
| Materals | | | 3.1 | | |
| Consumer Discretionary | | | 2.8 | | |
| Energy | | | 1.1 | | |
| | | | 97.0 | | |
| Short-Term Obligation | | | 6.0 | | |
| Other Assets & Liabilities, Net | | | (3.0 | ) | |
| | | | 100.0 | | |
For the year ended August 31, 2008, transactions in written option contracts were as follows:
| | | Number of
contracts | | Premium
received | |
| Options outstanding at August 31, 2007 | | | – | | | $ | – | | |
| Options written | | | 403 | | | | 51,871 | | |
Options terminated in closing
purchase transactions | | | – | | | | – | | |
| Options exercised | | | (403 | ) | | | (51,871 | ) | |
| Options expired | | | – | | | | – | | |
| Options outstanding at August 31, 2008 | | | – | | | $ | – | | |
| Acronym | | Name | |
| ADR | | American Depositary Receipt | |
|
See Accompanying Notes to Financial Statements.
65
Investment Portfolio – Columbia Strategic Investor Fund
August 31, 2008
| Common Stocks – 99.4% | |
| | | Shares | | Value ($) | |
| Consumer Discretionary – 9.6% | |
| Auto Components – 0.4% | |
| Nokian Renkaat Oyj | | | 121,000 | | | | 4,326,654 | | |
| Auto Components Total | | | 4,326,654 | | |
| Hotels, Restaurants & Leisure – 0.7% | |
| Las Vegas Sands Corp. (a) | | | 58,300 | | | | 2,764,003 | | |
| Royal Caribbean Cruises Ltd. | | | 98,900 | | | | 2,688,102 | | |
| Starbucks Corp. (a) | | | 126,500 | | | | 1,968,340 | | |
| Hotels, Restaurants & Leisure Total | | | 7,420,445 | | |
| Household Durables – 0.9% | |
| Cyrela Brazil Realty SA | | | 295,500 | | | | 3,714,598 | | |
| Gafisa SA, ADR | | | 56,800 | | | | 1,629,024 | | |
| Whirlpool Corp. | | | 49,000 | | | | 3,986,640 | | |
| Household Durables Total | | | 9,330,262 | | |
| Internet & Catalog Retail – 0.2% | |
| Amazon.com, Inc. (a) | | | 28,200 | | | | 2,278,842 | | |
| Internet & Catalog Retail Total | | | 2,278,842 | | |
| Media – 1.2% | |
| Comcast Corp., Class A | | | 200,600 | | | | 4,248,708 | | |
| McGraw-Hill Companies, Inc. | | | 83,600 | | | | 3,581,424 | | |
| News Corp., Class A | | | 341,400 | | | | 4,834,224 | | |
| Media Total | | | 12,664,356 | | |
| Multiline Retail – 2.2% | |
| Kohl's Corp. (a) | | | 120,700 | | | | 5,934,819 | | |
| Macy's, Inc. | | | 233,000 | | | | 4,851,060 | | |
| Stockmann Oyj Abp, Class B | | | 118,600 | | | | 3,346,400 | | |
| Target Corp. | | | 172,500 | | | | 9,145,950 | | |
| Multiline Retail Total | | | 23,278,229 | | |
| Specialty Retail – 1.6% | |
| Best Buy Co., Inc. | | | 120,800 | | | | 5,408,216 | | |
| Home Depot, Inc. | | | 214,100 | | | | 5,806,392 | | |
| Stage Stores, Inc. | | | 218,600 | | | | 3,480,112 | | |
| Urban Outfitters, Inc. (a) | | | 69,000 | | | | 2,457,780 | | |
| Specialty Retail Total | | | 17,152,500 | | |
| Textiles, Apparel & Luxury Goods – 2.4% | |
| Hanesbrands, Inc. (a) | | | 183,900 | | | | 4,384,176 | | |
LVMH Moet Hennessy Louis
Vuitton SA | | | 40,800 | | | | 4,338,626 | | |
| NIKE, Inc., Class B | | | 153,100 | | | | 9,279,391 | | |
| Polo Ralph Lauren Corp. | | | 91,700 | | | | 6,958,196 | | |
| Textiles, Apparel & Luxury Goods Total | | | 24,960,389 | | |
| Total Consumer Discretionary | | | 101,411,677 | | |
| | | Shares | | Value ($) | |
| Consumer Staples – 9.4% | |
| Beverages – 2.9% | |
| Carlsberg A/S | | | 54,500 | | | | 4,834,201 | | |
| Coca-Cola Co. | | | 270,200 | | | | 14,069,314 | | |
| PepsiCo, Inc. | | | 166,800 | | | | 11,422,464 | | |
| Beverages Total | | | 30,325,979 | | |
| Food & Staples Retailing – 2.3% | |
| Kroger Co. | | | 131,600 | | | | 3,634,792 | | |
| Sysco Corp. | | | 84,500 | | | | 2,689,635 | | |
| United Natural Foods, Inc. (a) | | | 137,500 | | | | 2,642,750 | | |
| Wal-Mart Stores, Inc. | | | 194,900 | | | | 11,512,743 | | |
| Walgreen Co. | | | 109,300 | | | | 3,981,799 | | |
| Food & Staples Retailing Total | | | 24,461,719 | | |
| Food Products – 1.4% | |
| ConAgra Foods, Inc. | | | 204,700 | | | | 4,353,969 | | |
| Nestle SA, Registered Shares | | | 107,000 | | | | 4,715,245 | | |
| Pilgrim's Pride Corp. | | | 123,300 | | | | 1,583,172 | | |
Unilever N.V., N.Y. Registered
Shares | | | 142,200 | | | | 3,924,720 | | |
| Food Products Total | | | 14,577,106 | | |
| Household Products – 1.0% | |
| Procter & Gamble Co. | | | 153,500 | | | | 10,709,695 | | |
| Household Products Total | | | 10,709,695 | | |
| Personal Products – 0.7% | |
| Avon Products, Inc. | | | 175,400 | | | | 7,512,382 | | |
| Personal Products Total | | | 7,512,382 | | |
| Tobacco – 1.1% | |
| Altria Group, Inc. | | | 96,800 | | | | 2,035,704 | | |
| Universal Corp. | | | 116,300 | | | | 6,038,296 | | |
| UST, Inc. | | | 68,500 | | | | 3,670,915 | | |
| Tobacco Total | | | 11,744,915 | | |
| Consumer Staples Total | | | 99,331,796 | | |
| Energy – 14.3% | |
| Energy Equipment & Services – 6.3% | |
| Cameron International Corp. (a) | | | 181,900 | | | | 8,474,721 | | |
| Core Laboratories N.V. | | | 45,600 | | | | 5,660,784 | | |
| Diamond Offshore Drilling, Inc. | | | 31,100 | | | | 3,418,201 | | |
| National-Oilwell Varco, Inc. (a) | | | 87,800 | | | | 6,473,494 | | |
| Noble Corp. | | | 86,700 | | | | 4,360,143 | | |
| Oceaneering International, Inc. | | | 67,900 | | | | 4,237,639 | | |
| Schlumberger Ltd. | | | 107,500 | | | | 10,128,650 | | |
| Tenaris SA, ADR | | | 46,600 | | | | 2,548,554 | | |
| Transocean, Inc. (a) | | | 65,499 | | | | 8,331,473 | | |
See Accompanying Notes to Financial Statements.
66
Columbia Strategic Investor Fund
August 31, 2008
| Common Stocks (continued) | |
| | | Shares | | Value ($) | |
| Weatherford International Ltd. (a) | | | 209,600 | | | | 8,086,368 | | |
| Wellstream Holdings PLC | | | 248,000 | | | | 5,643,104 | | |
| Energy Equipment & Services Total | | | 67,363,131 | | |
| Oil, Gas & Consumable Fuels – 8.0% | |
| Apache Corp. | | | 28,700 | | | | 3,282,706 | | |
| ConocoPhillips | | | 158,700 | | | | 13,094,337 | | |
| Continental Resources, Inc. (a) | | | 47,034 | | | | 2,359,696 | | |
| Devon Energy Corp. | | | 75,600 | | | | 7,714,980 | | |
| Exxon Mobil Corp. | | | 258,300 | | | | 20,666,583 | | |
| Hess Corp. | | | 51,500 | | | | 5,392,565 | | |
| Marathon Oil Corp. | | | 93,900 | | | | 4,232,073 | | |
| Occidental Petroleum Corp. | | | 90,300 | | | | 7,166,208 | | |
| Peabody Energy Corp. | | | 48,000 | | | | 3,021,600 | | |
| Petroleo Brasileiro SA, ADR | | | 96,200 | | | | 5,073,588 | | |
| Southwestern Energy Co. (a) | | | 141,500 | | | | 5,429,355 | | |
| XTO Energy, Inc. | | | 136,050 | | | | 6,858,280 | | |
| Oil, Gas & Consumable Fuels Total | | | 84,291,971 | | |
| Energy Total | | | 151,655,102 | | |
| Financials – 14.6% | |
| Capital Markets – 3.5% | |
| Charles Schwab Corp. | | | 200,900 | | | | 4,819,591 | | |
| Goldman Sachs Group, Inc. | | | 61,600 | | | | 10,100,552 | | |
| Invesco Ltd. | | | 249,600 | | | | 6,397,248 | | |
| Lazard Ltd., Class A | | | 144,800 | | | | 6,138,072 | | |
| State Street Corp. | | | 68,000 | | | | 4,601,560 | | |
Waddell & Reed Financial, Inc.,
Class A | | | 141,300 | | | | 4,549,860 | | |
| Capital Markets Total | | | 36,606,883 | | |
| Commercial Banks – 3.4% | |
| Banco Bradesco SA, ADR | | | 192,850 | | | | 3,550,368 | | |
| BB&T Corp. | | | 226,000 | | | | 6,780,000 | | |
| First Horizon National Corp. | | | 557,600 | | | | 6,261,848 | | |
| Glacier Bancorp, Inc. | | | 140,400 | | | | 2,993,328 | | |
| Prosperity Bancshares, Inc. | | | 143,100 | | | | 4,574,907 | | |
| Wells Fargo & Co. | | | 391,400 | | | | 11,847,678 | | |
| Commercial Banks Total | | | 36,008,129 | | |
| Consumer Finance – 0.9% | |
| American Express Co. | | | 252,300 | | | | 10,011,264 | | |
| Consumer Finance Total | | | 10,011,264 | | |
| Diversified Financial Services – 2.1% | |
| Citigroup, Inc. | | | 221,700 | | | | 4,210,083 | | |
| JPMorgan Chase & Co. | | | 467,800 | | | | 18,005,622 | | |
| Diversified Financial Services Total | | | 22,215,705 | | |
| | | Shares | | Value ($) | |
| Insurance – 3.4% | |
| ACE Ltd. | | | 80,200 | | | | 4,219,322 | | |
| Allstate Corp. | | | 133,700 | | | | 6,033,881 | | |
Marsh & McLennan Companies,
Inc. | | | 169,300 | | | | 5,405,749 | | |
| Principal Financial Group, Inc. | | | 110,700 | | | | 5,068,953 | | |
| Prudential Financial, Inc. | | | 117,300 | | | | 8,646,183 | | |
| Unum Group | | | 241,200 | | | | 6,128,892 | | |
| Insurance Total | | | 35,502,980 | | |
| Real Estate Investment Trusts (REITs) – 1.3% | |
Alexandria Real Estate Equities,
Inc. | | | 32,200 | | | | 3,468,262 | | |
| Digital Realty Trust, Inc. | | | 123,100 | | | | 5,646,597 | | |
| SL Green Realty Corp. | | | 55,500 | | | | 4,773,000 | | |
Total Real Estate Investment
Trusts (REITs) | | | 13,887,859 | | |
| Financials Total | | | 154,232,820 | | |
| Health Care – 12.3% | |
| Biotechnology – 2.8% | |
| Amgen, Inc. (a) | | | 75,700 | | | | 4,757,745 | | |
| BioMarin Pharmaceuticals, Inc. (a) | | | 77,200 | | | | 2,326,808 | | |
| Celgene Corp. (a) | | | 85,107 | | | | 5,897,915 | | |
| Genentech, Inc. (a) | | | 37,900 | | | | 3,742,625 | | |
| Gilead Sciences, Inc. (a) | | | 184,900 | | | | 9,740,532 | | |
| Onyx Pharmaceuticals, Inc. (a) | | | 69,500 | | | | 2,840,465 | | |
| Biotechnology Total | | | 29,306,090 | | |
| Health Care Equipment & Supplies – 2.1% | |
| Baxter International, Inc. | | | 149,700 | | | | 10,143,672 | | |
| Masimo Corp. (a) | | | 104,730 | | | | 4,186,058 | | |
Mindray Medical International
Ltd., ADR | | | 127,415 | | | | 4,955,169 | | |
| Varian Medical Systems, Inc. (a) | | | 49,300 | | | | 3,113,788 | | |
| Health Care Equipment & Supplies Total | | | 22,398,687 | | |
| Health Care Providers & Services – 1.8% | |
| Aetna, Inc. | | | 110,000 | | | | 4,745,400 | | |
| Express Scripts, Inc. (a) | | | 49,700 | | | | 3,648,477 | | |
| Humana, Inc. (a) | | | 84,000 | | | | 3,897,600 | | |
Laboratory Corp. of America
Holdings (a) | | | 28,900 | | | | 2,114,035 | | |
| McKesson Corp. | | | 72,100 | | | | 4,165,938 | | |
| Health Care Providers & Services Total | | | 18,571,450 | | |
| Life Sciences Tools & Services – 3.2% | |
Charles River Laboratories
International, Inc. (a) | | | 58,800 | | | | 3,857,868 | | |
| Covance, Inc. (a) | | | 68,200 | | | | 6,433,988 | | |
See Accompanying Notes to Financial Statements.
67
Columbia Strategic Investor Fund
August 31, 2008
| Common Stocks (continued) | |
| | | Shares | | Value ($) | |
| Illumina, Inc. (a) | | | 35,083 | | | | 3,021,699 | | |
Pharmaceutical Product
Development, Inc. | | | 132,200 | | | | 5,393,760 | | |
| Qiagen N.V. (a) | | | 235,500 | | | | 4,987,890 | | |
| Thermo Fisher Scientific, Inc. (a) | | | 75,900 | | | | 4,596,504 | | |
| Waters Corp. (a) | | | 84,600 | | | | 5,773,950 | | |
| Life Sciences Tools & Services Total | | | 34,065,659 | | |
| Pharmaceuticals – 2.4% | |
| Abbott Laboratories | | | 198,700 | | | | 11,411,341 | | |
| Johnson & Johnson | | | 134,070 | | | | 9,442,550 | | |
| Novartis AG, ADR | | | 84,900 | | | | 4,723,836 | | |
| Pharmaceuticals Total | | | 25,577,727 | | |
| Health Care Total | | | 129,919,613 | | |
| Industrials – 11.2% | |
| Aerospace & Defense – 2.1% | |
| Boeing Co. | | | 25,300 | | | | 1,658,668 | | |
| General Dynamics Corp. | | | 63,600 | | | | 5,870,280 | | |
| Goodrich Corp. | | | 84,300 | | | | 4,320,375 | | |
| Honeywell International, Inc. | | | 75,800 | | | | 3,802,886 | | |
| United Technologies Corp. | | | 105,300 | | | | 6,906,627 | | |
| Aerospace & Defense Total | | | 22,558,836 | | |
| Air Freight & Logistics – 0.3% | |
| UTI Worldwide, Inc. | | | 167,200 | | | | 3,360,720 | | |
| Air Freight & Logistics Total | | | 3,360,720 | | |
| Commercial Services & Supplies – 1.2% | |
| Dun & Bradstreet Corp. | | | 61,400 | | | | 5,646,958 | | |
| Republic Services, Inc. | | | 127,000 | | | | 4,174,490 | | |
| Waste Connections, Inc. (a) | | | 72,100 | | | | 2,617,951 | | |
| Commercial Services & Supplies Total | | | 12,439,399 | | |
| Construction & Engineering – 0.5% | |
| Quanta Services, Inc. (a) | | | 156,500 | | | | 4,998,610 | | |
| Construction & Engineering Total | | | 4,998,610 | | |
| Electrical Equipment – 0.3% | |
Suntech Power Holdings Co.,
Ltd., ADR (a) | | | 63,900 | | | | 3,055,059 | | |
| Electrical Equipment Total | | | 3,055,059 | | |
| Industrial Conglomerates – 2.0% | |
| General Electric Co. | | | 581,000 | | | | 16,326,100 | | |
McDermott International,
Inc. (a) | | | 149,800 | | | | 5,202,554 | | |
| Industrial Conglomerates Total | | | 21,528,654 | | |
| | | Shares | | Value ($) | |
| Machinery – 2.0% | |
| AGCO Corp. (a) | | | 61,700 | | | | 3,802,571 | | |
| Deere & Co. | | | 67,100 | | | | 4,735,247 | | |
| Joy Global, Inc. | | | 79,200 | | | | 5,626,368 | | |
| Parker Hannifin Corp. | | | 58,200 | | | | 3,728,874 | | |
| SPX Corp. | | | 22,200 | | | | 2,647,350 | | |
| Machinery Total | | | 20,540,410 | | |
| Marine – 0.7% | |
| A.P. Moller - Maersk A/S | | | 280 | | | | 3,131,092 | | |
| D/S Norden | | | 21,100 | | | | 1,993,782 | | |
| DryShips, Inc. | | | 35,300 | | | | 2,592,432 | | |
| Marine Total | | | 7,717,306 | | |
| Road & Rail – 1.9% | |
| Con-way, Inc. | | | 48,100 | | | | 2,361,710 | | |
| Landstar System, Inc. | | | 64,100 | | | | 3,142,182 | | |
| Norfolk Southern Corp. | | | 59,700 | | | | 4,389,741 | | |
| Union Pacific Corp. | | | 120,600 | | | | 10,118,340 | | |
| Road & Rail Total | | | 20,011,973 | | |
| Trading Companies & Distributors – 0.2% | |
| W.W. Grainger, Inc. | | | 23,100 | | | | 2,079,693 | | |
| Trading Companies & Distributors Total | | | 2,079,693 | | |
| Industrials Total | | | 118,290,660 | | |
| Information Technology – 17.3% | |
| Communications Equipment – 3.4% | |
| Cisco Systems, Inc. (a) | | | 664,200 | | | | 15,974,010 | | |
| Nokia Oyj, ADR | | | 194,600 | | | | 4,898,082 | | |
| QUALCOMM, Inc. | | | 133,000 | | | | 7,002,450 | | |
| Research In Motion Ltd. (a) | | | 27,400 | | | | 3,331,840 | | |
Telefonaktiebolaget LM
Ericsson, ADR | | | 368,200 | | | | 4,204,844 | | |
| Communications Equipment Total | | | 35,411,226 | | |
| Computers & Peripherals – 4.4% | |
| Apple, Inc. (a) | | | 85,300 | | | | 14,460,909 | | |
| EMC Corp. (a) | | | 250,600 | | | | 3,829,168 | | |
| Hewlett-Packard Co. | | | 347,600 | | | | 16,309,392 | | |
International Business
Machines Corp. | | | 93,162 | | | | 11,340,610 | | |
| Computers & Peripherals Total | | | 45,940,079 | | |
| Electronic Equipment & Instruments – 0.4% | |
Mettler-Toledo International,
Inc. (a) | | | 42,800 | | | | 4,502,560 | | |
| Electronic Equipment & Instruments Total | | | 4,502,560 | | |
See Accompanying Notes to Financial Statements.
68
Columbia Strategic Investor Fund
August 31, 2008
| Common Stocks (continued) | |
| | | Shares | | Value ($) | |
| Internet Software & Services – 1.9% | |
| DealerTrack Holdings, Inc. (a) | | | 119,900 | | | | 2,209,757 | | |
| Equinix, Inc. (a) | | | 39,800 | | | | 3,203,900 | | |
| Google, Inc., Class A (a) | | | 25,100 | | | | 11,628,579 | | |
| Omniture, Inc. (a) | | | 195,100 | | | | 3,476,682 | | |
| Internet Software & Services Total | | | 20,518,918 | | |
| IT Services – 1.1% | |
Cognizant Technology Solutions
Corp., Class A (a) | | | 108,500 | | | | 3,181,220 | | |
| Paychex, Inc. | | | 120,300 | | | | 4,099,824 | | |
| Redecard SA | | | 233,800 | | | | 4,163,935 | | |
| IT Services Total | | | 11,444,979 | | |
| Semiconductors & Semiconductor Equipment – 2.0% | |
ASML Holding N.V., N.Y.
Registered Shares | | | 91,822 | | | | 2,171,590 | | |
| Intel Corp. | | | 336,300 | | | | 7,691,181 | | |
| Intersil Corp., Class A | | | 86,000 | | | | 2,014,980 | | |
MEMC Electronic Materials,
Inc. (a) | | | 73,629 | | | | 3,614,448 | | |
| Texas Instruments, Inc. | | | 230,900 | | | | 5,659,359 | | |
Semiconductors & Semiconductor
Equipment Total | | | 21,151,558 | | |
| Software – 4.1% | |
| Advent Software, Inc. (a) | | | 43,100 | | | | 1,993,375 | | |
| Amdocs Ltd. (a) | | | 125,000 | | | | 3,773,750 | | |
| McAfee, Inc. (a) | | | 69,900 | | | | 2,765,244 | | |
| Microsoft Corp. | | | 538,700 | | | | 14,701,123 | | |
| Nintendo Co., Ltd. | | | 6,410 | | | | 3,029,648 | | |
| Oracle Corp. (a) | | | 398,200 | | | | 8,732,526 | | |
| SAP AG, ADR | | | 78,200 | | | | 4,385,456 | | |
| UBISOFT Entertainment (a) | | | 20,500 | | | | 1,919,684 | | |
| VMware, Inc., Class A (a) | | | 63,200 | | | | 2,509,040 | | |
| Software Total | | | 43,809,846 | | |
| Information Technology Total | | | 182,779,166 | | |
| Materials – 4.8% | |
| Chemicals – 1.6% | |
| CF Industries Holdings, Inc. | | | 19,100 | | | | 2,910,840 | | |
| Ecolab, Inc. | | | 60,700 | | | | 2,776,418 | | |
| Monsanto Co. | | | 39,200 | | | | 4,478,600 | | |
Potash Corp. of Saskatchewan,
Inc. | | | 28,600 | | | | 4,964,960 | | |
| Syngenta AG, ADR | | | 44,800 | | | | 2,404,864 | | |
| Chemicals Total | | | 17,535,682 | | |
| | | Shares | | Value ($) | |
| Metals & Mining – 3.2% | |
| Alcoa, Inc. | | | 130,300 | | | | 4,186,539 | | |
| Allegheny Technologies, Inc. | | | 21,000 | | | | 1,029,000 | | |
ArcelorMittal, N.Y.
Registered Shares | | | 94,000 | | | | 7,390,280 | | |
| Cia Vale do Rio Doce, ADR | | | 198,100 | | | | 5,259,555 | | |
Freeport-McMoRan Copper &
Gold, Inc. | | | 137,400 | | | | 12,272,568 | | |
Thompson Creek Metals Co.,
Inc. (a) | | | 229,600 | | | | 3,600,339 | | |
| Metals & Mining Total | | | 33,738,281 | | |
| Materials Total | | | 51,273,963 | | |
| Telecommunication Services – 2.6% | |
| Diversified Telecommunication Services – 1.4% | |
| AT&T, Inc. | | | 329,818 | | | | 10,550,878 | | |
| Telekomunikasi Indonesia, ADR | | | 127,000 | | | | 4,422,140 | | |
Diversified Telecommunication
Services Total | | | 14,973,018 | | |
| Wireless Telecommunication Services – 1.2% | |
American Tower Corp.,
Class A (a) | | | 102,200 | | | | 4,223,926 | | |
| China Mobile Ltd., ADR | | | 74,700 | | | | 4,236,984 | | |
| Mobile TeleSystems OJSC, ADR | | | 54,900 | | | | 3,733,200 | | |
| Wireless Telecommunication Services Total | | | 12,194,110 | | |
| Telecommunication Services Total | | | 27,167,128 | | |
| Utilities – 3.3% | |
| Electric Utilities – 2.7% | |
| Entergy Corp. | | | 65,800 | | | | 6,803,062 | | |
| Exelon Corp. | | | 117,900 | | | | 8,955,684 | | |
| FirstEnergy Corp. | | | 90,700 | | | | 6,588,448 | | |
| FPL Group, Inc. | | | 109,800 | | | | 6,594,588 | | |
| Electric Utilities Total | | | 28,941,782 | | |
| Multi-Utilities – 0.6% | |
Public Service Enterprise
Group, Inc. | | | 143,100 | | | | 5,834,188 | | |
| Multi-Utilities Total | | | 5,834,188 | | |
| Utilities Total | | | 34,775,970 | | |
Total Common Stocks
(cost of $891,742,775) | | | 1,050,837,895 | | |
See Accompanying Notes to Financial Statements.
69
Columbia Strategic Investor Fund
August 31, 2008
| Short-Term Obligation – 0.6% | |
| | | Par ($) | | Value ($) | |
Repurchase agreement with
Fixed Income Clearing Corp.,
dated 08/29/08, due on 09/02/08,
at 1.930%, collateralized by a
U.S. Treasury Obligation
maturing 05/15/09, market
value of $7,006,369
(repurchase proceeds
$6,865,472) | | | 6,864,000 | | | | 6,864,000 | | |
Total Short-Term Obligation
(cost of $6,864,000) | | | 6,864,000 | | |
Total Investments – 100.0%
(cost of $898,606,775) (b) | | | 1,057,701,895 | | |
| Other Assets & Liabilities, Net – 0.0% | | | (499,006 | ) | |
| Net Assets – 100.0% | | | 1,057,202,889 | | |
Notes to Investment Portfolio:
(a) Non-income producing security.
(b) Cost for federal income tax purposes is $899,681,468.
At August 31, 2008, the Fund held investments in the following sectors:
| Sector (Unaudited) | | % of
Net Assets | |
| Information Technology | | | 17.3 | | |
| Financials | | | 14.6 | | |
| Energy | | | 14.3 | | |
| Health Care | | | 12.3 | | |
| Industrials | | | 11.2 | | |
| Consumer Discretionary | | | 9.6 | | |
| Consumer Staples | | | 9.4 | | |
| Materials | | | 4.8 | | |
| Utilities | | | 3.3 | | |
| Telecommunication Services | | | 2.6 | | |
| | | | 99.4 | | |
| Short-Term Obligation | | | 0.6 | | |
| Other Assets & Liabilities, Net | | | 0.0 | * | |
| | | | 100.0 | | |
* Rounds to less than 0.1%.
The Fund was invested in the following countries at August 31, 2008:
| Country (Unaudited) | | Value | | % of Total
Investments | |
| United States* | | $ | 908,501,624 | | | | 85.9 | | |
| Brazil | | | 23,391,069 | | | | 2.2 | | |
| Netherlands | | | 16,744,984 | | | | 1.6 | | |
| Switzerland | | | 16,063,267 | | | | 1.5 | | |
| Finland | | | 12,571,136 | | | | 1.2 | | |
| Canada | | | 11,897,139 | | | | 1.1 | | |
| Netherlands Antilles | | | 10,128,650 | | | | 1.0 | | |
| Denmark | | | 9,959,074 | | | | 0.9 | | |
| Luxembourg | | | 9,938,834 | | | | 0.9 | | |
| France | | | 6,258,310 | | | | 0.6 | | |
| United Kingdom | | | 5,643,104 | | | | 0.5 | | |
| Indonesia | | | 4,422,140 | | | | 0.4 | | |
| Germany | | | 4,385,456 | | | | 0.4 | | |
| Hong Kong | | | 4,236,984 | | | | 0.4 | | |
| Sweden | | | 4,204,844 | | | | 0.4 | | |
| Russian Federation | | | 3,733,200 | | | | 0.4 | | |
| Japan | | | 3,029,648 | | | | 0.4 | | |
| Greece | | | 2,592,432 | | | | 0.2 | | |
| | | $ | 1,057,701,895 | | | | 100.0 | | |
* Includes short-term obligation.
Certain securities are listed by country of underlying exposure but may trade predominantly on another exchange.
| Acronym | | Name | |
| ADR | | American Depositary Receipt | |
|
See Accompanying Notes to Financial Statements.
70
Investment Portfolio – Columbia Balanced Fund
August 31, 2008
| Common Stocks – 58.9% | |
| | | Shares | | Value ($) | |
| Consumer Discretionary – 4.8% | |
| Hotels, Restaurants & Leisure – 0.3% | |
| Penn National Gaming, Inc. (a) | | | 16,500 | | | | 558,030 | | |
| Hotels, Restaurants & Leisure Total | | | 558,030 | | |
| Media – 2.3% | |
Focus Media Holding Ltd.,
ADR (a) | | | 32,700 | | | | 1,069,944 | | |
| McGraw-Hill Companies, Inc. | | | 46,000 | | | | 1,970,640 | | |
NET Servicos de
Comunicacao SA, ADR | | | 26,900 | | | | 309,888 | | |
| News Corp., Class A | | | 86,500 | | | | 1,224,840 | | |
| Media Total | | | 4,575,312 | | |
| Multiline Retail – 0.6% | |
| Kohl's Corp. (a) | | | 12,200 | | | | 599,874 | | |
| Target Corp. | | | 13,000 | | | | 689,260 | | |
| Multiline Retail Total | | | 1,289,134 | | |
| Textiles, Apparel & Luxury Goods – 1.6% | |
| NIKE, Inc., Class B | | | 32,900 | | | | 1,994,069 | | |
| Polo Ralph Lauren Corp. | | | 14,600 | | | | 1,107,848 | | |
| Textiles, Apparel & Luxury Goods Total | | | 3,101,917 | | |
| Consumer Discretionary Total | | | 9,524,393 | | |
| Consumer Staples – 5.9% | |
| Beverages – 1.4% | |
| Diageo PLC, ADR | | | 8,400 | | | | 624,960 | | |
| PepsiCo, Inc. | | | 30,500 | | | | 2,088,640 | | |
| Beverages Total | | | 2,713,600 | | |
| Food & Staples Retailing – 0.7% | |
| Kroger Co. | | | 47,975 | | | | 1,325,069 | | |
| Food & Staples Retailing Total | | | 1,325,069 | | |
| Food Products – 0.5% | |
| ConAgra Foods, Inc. | | | 42,300 | | | | 899,721 | | |
| Food Products Total | | | 899,721 | | |
| Household Products – 0.3% | |
| Colgate-Palmolive Co. | | | 8,030 | | | | 610,521 | | |
| Household Products Total | | | 610,521 | | |
| Personal Products – 1.3% | |
| Avon Products, Inc. | | | 30,100 | | | | 1,289,183 | | |
| Herbalife Ltd. | | | 27,300 | | | | 1,285,830 | | |
| Personal Products Total | | | 2,575,013 | | |
| | | Shares | | Value ($) | |
| Tobacco – 1.7% | |
| Philip Morris International, Inc. | | | 64,400 | | | | 3,458,280 | | |
| Tobacco Total | | | 3,458,280 | | |
| Consumer Staples Total | | | 11,582,204 | | |
| Energy – 7.8% | |
| Energy Equipment & Services – 2.8% | |
| Halliburton Co. | | | 51,300 | | | | 2,254,122 | | |
| Oceaneering International, Inc. (a) | | | 7,600 | | | | 474,316 | | |
| Transocean, Inc. (a) | | | 12,819 | | | | 1,630,577 | | |
| Weatherford International Ltd. (a) | | | 32,100 | | | | 1,238,418 | | |
| Energy Equipment & Services Total | | | 5,597,433 | | |
| Oil, Gas & Consumable Fuels – 5.0% | |
| Anadarko Petroleum Corp. | | | 22,100 | | | | 1,364,233 | | |
| Apache Corp. | | | 20,300 | | | | 2,321,914 | | |
| ConocoPhillips | | | 46,900 | | | | 3,869,719 | | |
| Devon Energy Corp. | | | 23,070 | | | | 2,354,293 | | |
| Oil, Gas & Consumable Fuels Total | | | 9,910,159 | | |
| Energy Total | | | 15,507,592 | | |
| Financials – 8.9% | |
| Capital Markets – 3.8% | |
| Bank of New York Mellon Corp. | | | 40,600 | | | | 1,405,166 | | |
| Charles Schwab Corp. | | | 44,200 | | | | 1,060,358 | | |
| Goldman Sachs Group, Inc. | | | 10,200 | | | | 1,672,494 | | |
| Invesco Ltd. | | | 57,500 | | | | 1,473,725 | | |
| State Street Corp. | | | 28,600 | | | | 1,935,362 | | |
| Capital Markets Total | | | 7,547,105 | | |
| Commercial Banks – 0.8% | |
| BB&T Corp. | | | 38,700 | | | | 1,161,000 | | |
| HSBC Holdings PLC, ADR | | | 4,700 | | | | 369,937 | | |
| Commercial Banks Total | | | 1,530,937 | | |
| Consumer Finance – 0.5% | |
| American Express Co. | | | 25,205 | | | | 1,000,135 | | |
| Consumer Finance Total | | | 1,000,135 | | |
| Diversified Financial Services – 1.4% | |
| JPMorgan Chase & Co. | | | 73,780 | | | | 2,839,792 | | |
| Diversified Financial Services Total | | | 2,839,792 | | |
| Insurance – 2.2% | |
| ACE Ltd. | | | 16,700 | | | | 878,587 | | |
Berkshire Hathaway, Inc.,
Class B (a) | | | 426 | | | | 1,662,252 | | |
| Unum Group | | | 67,000 | | | | 1,702,470 | | |
| Insurance Total | | | 4,243,309 | | |
See Accompanying Notes to Financial Statements.
71
Columbia Balanced Fund
August 31, 2008
| Common Stocks (continued) | |
| | | Shares | | Value ($) | |
| Real Estate Management & Development – 0.2% | |
CB Richard Ellis Group, Inc.,
Class A (a) | | | 25,600 | | | | 334,592 | | |
Real Estate Management &
Development Total | | | 334,592 | | |
| Financials Total | | | 17,495,870 | | |
| Health Care – 9.8% | |
| Biotechnology – 0.8% | |
| Amgen, Inc. (a) | | | 25,100 | | | | 1,577,535 | | |
| Biotechnology Total | | | 1,577,535 | | |
| Health Care Equipment & Supplies – 2.9% | |
| Baxter International, Inc. | | | 31,600 | | | | 2,141,216 | | |
| Covidien Ltd. | | | 42,225 | | | | 2,283,106 | | |
| Zimmer Holdings, Inc. (a) | | | 17,700 | | | | 1,281,303 | | |
| Health Care Equipment & Supplies Total | | | 5,705,625 | | |
| Health Care Providers & Services – 1.7% | |
| Aetna, Inc. | | | 28,800 | | | | 1,242,432 | | |
| McKesson Corp. | | | 37,430 | | | | 2,162,705 | | |
| Health Care Providers & Services Total | | | 3,405,137 | | |
| Life Sciences Tools & Services – 1.0% | |
| Thermo Fisher Scientific, Inc. (a) | | | 32,230 | | | | 1,951,849 | | |
| Life Sciences Tools & Services Total | | | 1,951,849 | | |
| Pharmaceuticals – 3.4% | |
| Abbott Laboratories | | | 59,599 | | | | 3,422,771 | | |
| Johnson & Johnson | | | 34,000 | | | | 2,394,620 | | |
| Schering-Plough Corp. | | | 47,000 | | | | 911,800 | | |
| Pharmaceuticals Total | | | 6,729,191 | | |
| Health Care Total | | | 19,369,337 | | |
| Industrials – 7.1% | |
| Aerospace & Defense – 1.8% | |
| Honeywell International, Inc. | | | 35,790 | | | | 1,795,584 | | |
| Northrop Grumman Corp. | | | 13,000 | | | | 895,050 | | |
| United Technologies Corp. | | | 13,600 | | | | 892,024 | | |
| Aerospace & Defense Total | | | 3,582,658 | | |
| Commercial Services & Supplies – 0.6% | |
| Dun & Bradstreet Corp. | | | 13,900 | | | | 1,278,383 | | |
| Commercial Services & Supplies Total | | | 1,278,383 | | |
| Construction & Engineering – 0.2% | |
| Foster Wheeler Ltd. (a) | | | 9,700 | | | | 481,993 | | |
| Construction & Engineering Total | | | 481,993 | | |
| | | Shares | | Value ($) | |
| Industrial Conglomerates – 3.0% | |
| General Electric Co. | | | 104,500 | | | | 2,936,450 | | |
| Tyco International Ltd. | | | 68,225 | | | | 2,925,488 | | |
| Industrial Conglomerates Total | | | 5,861,938 | | |
| Machinery – 0.5% | |
| Eaton Corp. | | | 12,287 | | | | 899,163 | | |
| Machinery Total | | | 899,163 | | |
| Road & Rail – 1.0% | |
| Union Pacific Corp. | | | 22,920 | | | | 1,922,988 | | |
| Road & Rail Total | | | 1,922,988 | | |
| Industrials Total | | | 14,027,123 | | |
| Information Technology – 10.8% | |
| Communications Equipment – 1.9% | |
| Nokia Oyj, ADR | | | 50,600 | | | | 1,273,602 | | |
| QUALCOMM, Inc. | | | 45,700 | | | | 2,406,105 | | |
| Communications Equipment Total | | | 3,679,707 | | |
| Computers & Peripherals – 3.3% | |
| Apple, Inc. (a) | | | 10,500 | | | | 1,780,065 | | |
| EMC Corp. (a) | | | 66,900 | | | | 1,022,232 | | |
| Hewlett-Packard Co. | | | 76,900 | | | | 3,608,148 | | |
| Computers & Peripherals Total | | | 6,410,445 | | |
| Internet Software & Services – 2.2% | |
| eBay, Inc. (a) | | | 33,900 | | | | 845,127 | | |
| Google, Inc., Class A (a) | | | 6,500 | | | | 3,011,385 | | |
| VeriSign, Inc. (a) | | | 16,900 | | | | 540,293 | | |
| Internet Software & Services Total | | | 4,396,805 | | |
| IT Services – 0.3% | |
Cognizant Technology
Solutions Corp., Class A (a) | | | 22,200 | | | | 650,904 | | |
| IT Services Total | | | 650,904 | | |
| Software – 3.1% | |
| Autodesk, Inc. (a) | | | 17,200 | | | | 611,116 | | |
| Microsoft Corp. | | | 172,890 | | | | 4,718,168 | | |
| Oracle Corp. (a) | | | 36,475 | | | | 799,897 | | |
| Software Total | | | 6,129,181 | | |
| Information Technology Total | | | 21,267,042 | | |
| Materials – 1.2% | |
| Chemicals – 0.5% | |
| Intrepid Potash, Inc. (a) | | | 20,400 | | | | 966,144 | | |
| Chemicals Total | | | 966,144 | | |
See Accompanying Notes to Financial Statements.
72
Columbia Balanced Fund
August 31, 2008
| Common Stocks (continued) | |
| | | Shares | | Value ($) | |
| Metals & Mining – 0.7% | |
| Alcoa, Inc. | | | 28,800 | | | | 925,344 | | |
Freeport-McMoRan Copper &
Gold, Inc. | | | 6,300 | | | | 562,716 | | |
| Metals & Mining Total | | | 1,488,060 | | |
| Materials Total | | | 2,454,204 | | |
| Telecommunication Services – 1.8% | |
| Diversified Telecommunication Services – 1.8% | |
| AT&T, Inc. | | | 75,600 | | | | 2,418,444 | | |
| Verizon Communications, Inc. | | | 29,900 | | | | 1,050,088 | | |
Diversified Telecommunication
Services Total | | | 3,468,532 | | |
| Telecommunication Services Total | | | 3,468,532 | | |
| Utilities – 0.8% | |
| Electric Utilities – 0.8% | |
| Entergy Corp. | | | 10,600 | | | | 1,095,934 | | |
| FPL Group, Inc. | | | 9,500 | | | | 570,570 | | |
| Electric Utilities Total | | | 1,666,504 | | |
| Utilities Total | | | 1,666,504 | | |
Total Common Stocks
(cost of $99,041,235) | | | 116,362,801 | | |
| Mortgage-Backed Securities – 12.5% | |
| | | Par ($) | | | |
| Federal Home Loan Mortgage Corp. | |
| 5.000% 03/01/38 | | | 739,414 | | | | 710,937 | | |
| 5.500% 12/01/18 | | | 899,471 | | | | 914,688 | | |
| 5.500% 07/01/19 | | | 252,382 | | | | 256,021 | | |
| 5.500% 07/01/21 | | | 268,821 | | | | 271,352 | | |
| 5.500% 08/01/21 | | | 58,862 | | | | 59,416 | | |
| 5.500% 12/01/37 | | | 767,482 | | | | 757,433 | | |
| 5.500% 07/01/38 | | | 1,500,000 | | | | 1,480,361 | | |
| 6.000% 03/01/17 | | | 66,316 | | | | 67,917 | | |
| 6.000% 04/01/17 | | | 418,708 | | | | 428,818 | | |
| 6.000% 05/01/17 | | | 242,183 | | | | 248,030 | | |
| 6.000% 08/01/17 | | | 135,824 | | | | 139,104 | | |
| 6.000% 08/01/38 | | | 1,000,000 | | | | 1,009,095 | | |
| 6.500% 08/01/32 | | | 135,268 | | | | 140,106 | | |
| 6.500% 08/01/36 | | | 243,725 | | | | 250,690 | | |
| TBA, | |
| 5.000% 09/01/38 (b) | | | 2,600,000 | | | | 2,497,625 | | |
| | | Par ($) | | Value ($) | |
| Federal National Mortgage Association | |
| 5.000% 05/01/37 | | | 670,948 | | | | 645,595 | | |
| 5.500% 04/01/36 | | | 1,973,968 | | | | 1,953,058 | | |
| 5.500% 05/01/36 | | | 72,989 | | | | 72,216 | | |
| 5.500% 11/01/36 | | | 2,478,269 | | | | 2,452,018 | | |
| 5.623% 07/01/32 (c) | | | 250,047 | | | | 254,460 | | |
| 6.000% 09/01/36 | | | 556,091 | | | | 562,278 | | |
| 6.000% 10/01/36 | | | 1,348,759 | | | | 1,363,765 | | |
| 6.000% 07/01/37 | | | 182,226 | | | | 184,186 | | |
| 6.000% 08/01/37 | | | 684,561 | | | | 691,925 | | |
| 6.000% 09/01/37 | | | 683,234 | | | | 690,583 | | |
| 6.000% 11/01/37 | | | 1,298,444 | | | | 1,312,412 | | |
| 6.500% 03/01/37 | | | 346,413 | | | | 356,746 | | |
| 6.500% 05/01/37 | | | 579,486 | | | | 596,647 | | |
| 6.500% 08/01/37 | | | 1,260,341 | | | | 1,297,667 | | |
| 6.500% 11/01/37 | | | 1,135,942 | | | | 1,169,583 | | |
| 6.500% 06/01/38 | | | 780,000 | | | | 803,100 | | |
| Government National Mortgage Association | |
| 5.500% 05/15/38 | | | 740,745 | | | | 740,682 | | |
| 7.000% 10/15/31 | | | 59,690 | | | | 63,444 | | |
| 7.000% 04/15/32 | | | 57,674 | | | | 61,289 | | |
| 7.000% 05/15/32 | | | 73,343 | | | | 77,940 | | |
Total Mortgage-Backed Securities
(cost of $24,400,914) | | | 24,581,187 | | |
| Corporate Fixed-Income Bonds & Notes – 10.4% | |
| Basic Materials – 0.4% | |
| Chemicals – 0.1% | |
| EI Du Pont de Nemours & Co. | |
| 5.000% 07/15/13 | | | 185,000 | | | | 186,583 | | |
| Huntsman International LLC | |
| 7.875% 11/15/14 | | | 105,000 | | | | 97,650 | | |
| Chemicals Total | | | 284,233 | | |
| Forest Products & Paper – 0.1% | |
| Domtar Corp. | |
| 7.125% 08/15/15 | | | 105,000 | | | | 101,325 | | |
| Georgia-Pacific Corp. | |
| 8.000% 01/15/24 | | | 120,000 | | | | 109,800 | | |
| Forest Products & Paper Total | | | 211,125 | | |
| Iron/Steel – 0.1% | |
| Nucor Corp. | |
| 5.850% 06/01/18 | | | 265,000 | | | | 267,322 | | |
| Iron/Steel Total | | | 267,322 | | |
See Accompanying Notes to Financial Statements.
73
Columbia Balanced Fund
August 31, 2008
| Corporate Fixed-Income Bonds & Notes (continued) | |
| | | Par ($) | | Value ($) | |
| Metals & Mining – 0.1% | |
| Freeport-McMoRan Copper & Gold, Inc. | |
| 8.375% 04/01/17 | | | 105,000 | | | | 111,300 | | |
| Metals & Mining Total | | | 111,300 | | |
| Basic Materials Total | | | 873,980 | | |
| Communications – 1.6% | |
| Media – 0.7% | |
Charter Communications
Holdings II LLC | |
| 10.250% 09/15/10 | | | 100,000 | | | | 96,000 | | |
| Comcast Corp. | |
| 7.050% 03/15/33 | | | 275,000 | | | | 277,947 | | |
| CSC Holdings, Inc. | |
| 7.625% 04/01/11 | | | 100,000 | | | | 100,500 | | |
| EchoStar DBS Corp. | |
| 6.625% 10/01/14 | | | 110,000 | | | | 101,200 | | |
| Lamar Media Corp. | |
| 7.250% 01/01/13 | | | 95,000 | | | | 90,250 | | |
| News America, Inc. | |
| 6.550% 03/15/33 | | | 275,000 | | | | 266,841 | | |
| R.H. Donnelley Corp. | |
| 8.875% 10/15/17 | | | 200,000 | | | | 103,000 | | |
| Time Warner Cable, Inc. | |
| 7.300% 07/01/38 | | | 250,000 | | | | 251,207 | | |
| Viacom, Inc. | |
| 6.125% 10/05/17 | | | 75,000 | | | | 70,570 | | |
| Media Total | | | 1,357,515 | | |
| Telecommunication Services – 0.9% | |
| AT&T, Inc. | |
| 5.100% 09/15/14 | | | 225,000 | | | | 222,539 | | |
| British Telecommunications PLC | |
| 5.150% 01/15/13 | | | 175,000 | | | | 170,775 | | |
| Citizens Communications Co. | |
| 7.875% 01/15/27 | | | 130,000 | | | | 111,800 | | |
| Cricket Communications, Inc. | |
| 9.375% 11/01/14 | | | 120,000 | | | | 118,950 | | |
| Intelsat Bermuda Ltd. | |
| 9.250% 06/15/16 (d) | | | 100,000 | | | | 99,000 | | |
| Lucent Technologies, Inc. | |
| 6.450% 03/15/29 | | | 145,000 | | | | 100,775 | | |
| New Cingular Wireless Services, Inc. | |
| 8.750% 03/01/31 | | | 200,000 | | | | 238,895 | | |
| Qwest Communications International, Inc. | |
| 7.500% 02/15/14 | | | 110,000 | | | | 100,100 | | |
| Telefonica Emisones SAU | |
| 5.984% 06/20/11 | | | 300,000 | | | | 304,677 | | |
| Vodafone Group PLC | |
| 5.000% 12/16/13 | | | 300,000 | | | | 295,577 | | |
| | | Par ($) | | Value ($) | |
| Windstream Corp. | |
| 8.625% 08/01/16 | | | 110,000 | | | | 108,900 | | |
| Telecommunication Services Total | | | 1,871,988 | | |
| Communications Total | | | 3,229,503 | | |
| Consumer Cyclical – 0.6% | |
| Apparel – 0.1% | |
| Levi Strauss & Co. | |
| 9.750% 01/15/15 | | | 110,000 | | | | 99,138 | | |
| Apparel Total | | | 99,138 | | |
| Auto Manufacturers – 0.0% | |
| General Motors Corp. | |
| 8.375% 07/15/33 | | | 125,000 | | | | 61,875 | | |
| Auto Manufacturers Total | | | 61,875 | | |
| Home Builders – 0.0% | |
| KB Home | |
| 5.875% 01/15/15 | | | 60,000 | | | | 49,200 | | |
| Home Builders Total | | | 49,200 | | |
| Lodging – 0.2% | |
| Marriott International, Inc. | |
| 5.625% 02/15/13 | | | 175,000 | | | | 165,499 | | |
| Mashantucket Western Pequot Tribe | |
| 8.500% 11/15/15 (d) | | | 130,000 | | | | 94,900 | | |
| MGM Mirage | |
| 7.500% 06/01/16 | | | 120,000 | | | | 97,800 | | |
| Pinnacle Entertainment, Inc. | |
| 7.500% 06/15/15 | | | 65,000 | | | | 50,375 | | |
| Lodging Total | | | 408,574 | | |
| Retail – 0.3% | |
| CVS Caremark Corp. | |
| 5.750% 06/01/17 | | | 200,000 | | | | 195,818 | | |
| Rite Aid Corp. | |
| 9.375% 12/15/15 | | | 140,000 | | | | 90,300 | | |
| Wal-Mart Stores, Inc. | |
| 5.800% 02/15/18 | | | 300,000 | | | | 313,690 | | |
| Retail Total | | | 599,808 | | |
| Consumer Cyclical Total | | | 1,218,595 | | |
| Consumer Non-Cyclical – 0.9% | |
| Beverages – 0.1% | |
| Diageo Capital PLC | |
| 4.375% 05/03/10 | | | 200,000 | | | | 201,231 | | |
| Beverages Total | | | 201,231 | | |
See Accompanying Notes to Financial Statements.
74
Columbia Balanced Fund
August 31, 2008
| Corporate Fixed-Income Bonds & Notes (continued) | |
| | | Par ($) | | Value ($) | |
| Commercial Services – 0.0% | |
| Iron Mountain, Inc. | |
| 8.000% 06/15/20 | | | 100,000 | | | | 97,250 | | |
| Commercial Services Total | | | 97,250 | | |
| Food – 0.4% | |
| ConAgra Foods, Inc. | |
| 6.750% 09/15/11 | | | 160,000 | | | | 165,864 | | |
| Kraft Foods, Inc. | |
| 6.500% 08/11/17 | | | 245,000 | | | | 247,796 | | |
| Kroger Co. | |
| 6.200% 06/15/12 | | | 200,000 | | | | 206,873 | | |
| Smithfield Foods, Inc. | |
| 7.750% 07/01/17 | | | 90,000 | | | | 80,550 | | |
| Food Total | | | 701,083 | | |
| Healthcare Products – 0.1% | |
Biomet, Inc.
PIK, | | | |
| 10.375% 10/15/17 | | | 110,000 | | | | 115,500 | | |
| Healthcare Products Total | | | 115,500 | | |
| Healthcare Services – 0.1% | |
| Community Health Systems, Inc. | |
| 8.875% 07/15/15 | | | 100,000 | | | | 101,000 | | |
| HCA, Inc. | |
| 9.250% 11/15/16 | | | 25,000 | | | | 25,719 | | |
| PIK, | |
| 9.625% 11/15/16 | | | 75,000 | | | | 75,656 | | |
| Healthcare Services Total | | | 202,375 | | |
| Household Products/Wares – 0.1% | |
| Fortune Brands, Inc. | |
| 5.375% 01/15/16 | | | 175,000 | | | | 159,702 | | |
| Household Products/Wares Total | | | 159,702 | | |
| Pharmaceuticals – 0.1% | |
| Wyeth | |
| 5.500% 02/01/14 | | | 220,000 | | | | 224,463 | | |
| Pharmaceuticals Total | | | 224,463 | | |
| Consumer Non-Cyclical Total | | | 1,701,604 | | |
| Energy – 1.0% | |
| Coal – 0.1% | |
| Arch Western Finance LLC | |
| 6.750% 07/01/13 | | | 105,000 | | | | 104,738 | | |
| Coal Total | | | 104,738 | | |
| Oil & Gas – 0.5% | |
| Canadian Natural Resources Ltd. | |
| 5.700% 05/15/17 | | | 150,000 | | | | 144,766 | | |
| | | Par ($) | | Value ($) | |
| Chesapeake Energy Corp. | |
| 6.375% 06/15/15 | | | 110,000 | | | | 102,300 | | |
| KCS Energy, Inc. | |
| 7.125% 04/01/12 | | | 105,000 | | | | 99,225 | | |
| Nexen, Inc. | |
| 5.875% 03/10/35 | | | 225,000 | | | | 190,681 | | |
| OPTI Canada, Inc. | |
| 8.250% 12/15/14 | | | 100,000 | | | | 99,875 | | |
| Talisman Energy, Inc. | |
| 6.250% 02/01/38 | | | 235,000 | | | | 202,571 | | |
| Valero Energy Corp. | |
| 6.875% 04/15/12 | | | 175,000 | | | | 181,100 | | |
| Oil & Gas Total | | | 1,020,518 | | |
| Oil & Gas Services – 0.1% | |
| Weatherford International Ltd. | |
| 5.150% 03/15/13 | | | 150,000 | | | | 148,271 | | |
| Oil & Gas Services Total | | | 148,271 | | |
| Pipelines – 0.3% | |
| El Paso Corp. | |
| 6.875% 06/15/14 | | | 115,000 | | | | 113,923 | | |
| MarkWest Energy Partners LP | |
| 8.500% 07/15/16 | | | 100,000 | | | | 100,000 | | |
| Plains All American Pipeline LP | |
| 6.650% 01/15/37 | | | 225,000 | | | | 203,359 | | |
| TransCanada Pipelines Ltd. | |
| 6.350% 05/15/67 (c) | | | 245,000 | | | | 204,238 | | |
| Pipelines Total | | | 621,520 | | |
| Energy Total | | | 1,895,047 | | |
| Financials – 3.5% | |
| Banks – 1.2% | |
| Bank of New York Mellon Corp. | |
| 5.125% 08/27/13 | | | 300,000 | | | | 300,851 | | |
| Citigroup, Inc. | |
| 5.000% 09/15/14 | | | 225,000 | | | | 201,329 | | |
| Credit Suisse/New York NY | |
| 6.000% 02/15/18 | | | 275,000 | | | | 263,850 | | |
| Deutsche Bank AG/London | |
| 4.875% 05/20/13 | | | 250,000 | | | | 245,227 | | |
| JPMorgan Chase & Co. | |
| 6.000% 01/15/18 | | | 255,000 | | | | 246,937 | | |
| PNC Funding Corp. | |
| 5.625% 02/01/17 | | | 240,000 | | | | 223,310 | | |
| SunTrust Preferred Capital I | |
| 5.853% 12/15/11 (c) | | | 200,000 | | | | 128,000 | | |
| USB Capital IX | |
| 6.189% 04/15/49 (c) | | | 375,000 | | | | 245,625 | | |
See Accompanying Notes to Financial Statements.
75
Columbia Balanced Fund
August 31, 2008
| Corporate Fixed-Income Bonds & Notes (continued) | |
| | | Par ($) | | Value ($) | |
| Wachovia Corp. | |
| 4.875% 02/15/14 | | | 300,000 | | | | 258,206 | | |
| Wells Fargo & Co. | |
| 5.250% 10/23/12 | | | 260,000 | | | | 259,852 | | |
| Banks Total | | | 2,373,187 | | |
| Diversified Financial Services – 1.7% | |
| AGFC Capital Trust I | |
| 6.000% 01/15/67 (c)(d) | | | 280,000 | | | | 188,779 | | |
| American Express Credit Corp. | |
| 5.875% 05/02/13 | | | 265,000 | | | | 254,812 | | |
| American General Finance Corp. | |
| 5.375% 09/01/09 | | | 375,000 | | | | 367,820 | | |
| Capital One Financial Corp. | |
| 5.500% 06/01/15 | | | 325,000 | | | | 288,626 | | |
| CDX North America High Yield | |
| 8.875% 06/29/13 (d) | | | 300,000 | | | | 277,875 | | |
| Ford Motor Credit Co. | |
| 8.000% 12/15/16 | | | 125,000 | | | | 90,067 | | |
| General Electric Capital Corp. | |
| 5.000% 01/08/16 | | | 295,000 | | | | 288,598 | | |
| GMAC LLC | |
| 8.000% 11/01/31 | | | 140,000 | | | | 75,509 | | |
| Goldman Sachs Group, Inc. | |
| 6.345% 02/15/34 | | | 370,000 | | | | 307,476 | | |
| HSBC Finance Corp. | |
| 5.000% 06/30/15 | | | 300,000 | | | | 285,987 | | |
| Lehman Brothers Holdings, Inc. | |
| 5.750% 07/18/11 (g) | | | 275,000 | | | | 261,287 | | |
| Merrill Lynch & Co., Inc. | |
| 6.050% 08/15/12 | | | 250,000 | | | | 239,644 | | |
| Morgan Stanley | |
| 4.750% 04/01/14 | | | 300,000 | | | | 263,407 | | |
| Nuveen Investments, Inc. | |
| 10.500% 11/15/15 (d) | | | 110,000 | | | | 95,425 | | |
| Diversified Financial Services Total | | | 3,285,312 | | |
| Insurance – 0.4% | |
| Chubb Corp. | |
| 5.750% 05/15/18 | | | 90,000 | | | | 86,353 | | |
| Principal Life Income Funding Trusts | |
| 5.300% 04/24/13 | | | 175,000 | | | | 174,788 | | |
| Prudential Financial, Inc. | |
| 6.000% 12/01/17 | | | 250,000 | | | | 239,791 | | |
| UnitedHealth Group, Inc. | |
| 5.250% 03/15/11 | | | 225,000 | | | | 224,252 | | |
| Insurance Total | | | 725,184 | | |
| Real Estate Investment Trusts (REITs) – 0.2% | |
| Health Care Property Investors, Inc. | |
| 6.450% 06/25/12 | | | 200,000 | | | | 191,968 | | |
| | | Par ($) | | Value ($) | |
| Simon Property Group LP | |
| 5.750% 12/01/15 | | | 250,000 | | | | 246,490 | | |
| Real Estate Investment Trusts (REITs) Total | | | 438,458 | | |
| Financials Total | | | 6,822,141 | | |
| Industrials – 0.9% | |
| Aerospace & Defense – 0.1% | |
| L-3 Communications Corp. | |
| 6.375% 10/15/15 | | | 105,000 | | | | 100,538 | | |
| United Technologies Corp. | |
| 5.375% 12/15/17 | | | 165,000 | | | | 165,799 | | |
| Aerospace & Defense Total | | | 266,337 | | |
| Environmental Control – 0.1% | |
| Allied Waste North America, Inc. | |
| 7.125% 05/15/16 | | | 100,000 | | | | 101,000 | | |
| Environmental Control Total | | | 101,000 | | |
| Machinery – 0.1% | |
| Caterpillar Financial Services Corp. | |
| 5.450% 04/15/18 | | | 225,000 | | | | 223,881 | | |
| Machinery Total | | | 223,881 | | |
| Machinery-Construction & Mining – 0.1% | |
| Terex Corp. | |
| 8.000% 11/15/17 | | | 110,000 | | | | 108,625 | | |
| Machinery-Construction & Mining Total | | | 108,625 | | |
| Miscellaneous Manufacturing – 0.1% | |
| Bombardier, Inc. | |
| 6.300% 05/01/14 (d) | | | 105,000 | | | | 100,800 | | |
| Miscellaneous Manufacturing Total | | | 100,800 | | |
| Packaging & Containers – 0.1% | |
Crown Americas LLC & Crown
Americas Capital Corp. | |
| 7.750% 11/15/15 | | | 100,000 | | | | 102,500 | | |
| Packaging & Containers Total | | | 102,500 | | |
| Transportation – 0.3% | |
| Burlington Northern Santa Fe Corp. | |
| 6.200% 08/15/36 | | | 185,000 | | | | 176,966 | | |
| CHC Helicopter Corp. | |
| 7.375% 05/01/14 | | | 100,000 | | | | 104,000 | | |
| Union Pacific Corp. | |
| 3.875% 02/15/09 | | | 500,000 | | | | 499,469 | | |
| United Parcel Service, Inc. | |
| 4.500% 01/15/13 | | | 145,000 | | | | 146,653 | | |
| Transportation Total | | | 927,088 | | |
| Industrials Total | | | 1,830,231 | | |
See Accompanying Notes to Financial Statements.
76
Columbia Balanced Fund
August 31, 2008
| Corporate Fixed-Income Bonds & Notes (continued) | |
| | | Par ($) | | Value ($) | |
| Technology – 0.3% | |
| Networking & Telecom Equipment – 0.1% | |
| Cisco Systems, Inc. | |
| 5.250% 02/22/11 | | | 225,000 | | | | 232,404 | | |
| Total Networking & Telecom Equipment | | | 232,404 | | |
| Semiconductors – 0.1% | |
Freescale Semiconductor, Inc.
PIK, | | | |
| 9.125% 12/15/14 | | | 125,000 | | | | 97,500 | | |
| Semiconductors Total | | | 97,500 | | |
| Software – 0.1% | |
| Oracle Corp. | |
| 6.500% 04/15/38 | | | 225,000 | | | | 227,350 | | |
| Software Total | | | 227,350 | | |
| Technology Total | | | 557,254 | | |
| Utilities – 1.2% | |
| Electric – 0.9% | |
| AES Corp. | |
| 8.000% 10/15/17 | | | 105,000 | | | | 103,425 | | |
| Commonwealth Edison Co. | |
| 5.950% 08/15/16 | | | 200,000 | | | | 199,567 | | |
Consolidated Edison Co. of
New York, Inc. | |
| 5.850% 04/01/18 | | | 225,000 | | | | 227,221 | | |
| Indiana Michigan Power Co. | |
| 5.650% 12/01/15 | | | 275,000 | | | | 266,035 | | |
| Intergen NV | |
| 9.000% 06/30/17 (d) | | | 105,000 | | | | 107,100 | | |
| NRG Energy, Inc. | |
| 7.250% 02/01/14 | | | 15,000 | | | | 14,794 | | |
| 7.375% 02/01/16 | | | 105,000 | | | | 103,687 | | |
| Pacific Gas & Electric Co. | |
| 5.800% 03/01/37 | | | 170,000 | | | | 158,429 | | |
| Progress Energy, Inc. | |
| 7.750% 03/01/31 | | | 250,000 | | | | 281,286 | | |
| Southern California Edison Co. | |
| 5.000% 01/15/14 | | | 275,000 | | | | 275,445 | | |
| Texas Competitive Electric Holdings Co. | |
| PIK, | |
| 10.500% 11/01/16 (d) | | | 130,000 | | | | 124,475 | | |
| Electric Total | | | 1,861,464 | | |
| Gas – 0.3% | |
| Atmos Energy Corp. | |
| 6.350% 06/15/17 | | | 210,000 | | | | 207,010 | | |
| | | Par ($) | | Value ($) | |
| Sempra Energy | |
| 4.750% 05/15/09 | | | 375,000 | | | | 376,863 | | |
| Gas Total | | | 583,873 | | |
| Utilities Total | | | 2,445,337 | | |
Total Corporate Fixed-Income Bonds & Notes
(cost of $21,773,407) | | | 20,573,692 | | |
| Government & Agency Obligations – 4.6% | |
| Foreign Government Obligations – 0.3% | |
| Province of Ontario | |
| 3.125% 09/08/10 | | | 350,000 | | | | 349,496 | | |
| United Mexican States | |
| 7.500% 04/08/33 | | | 250,000 | | | | 291,250 | | |
| Foreign Government Obligations Total | | | 640,746 | | |
| U.S. Government Agencies – 1.5% | |
| Federal Home Loan Bank | |
| 5.500% 08/13/14 | | | 200,000 | | | | 214,061 | | |
| Federal Home Loan Mortgage Corp. | |
| 6.625% 09/15/09 | | | 2,310,000 | | | | 2,393,541 | | |
| Federal National Mortgage Association | |
| 5.000% 10/15/11 | | | 325,000 | | | | 338,171 | | |
| 5.375% 08/15/09 (e) | | | 65,000 | | | | 66,434 | | |
| Total U.S. Government Agencies | | | 3,012,207 | | |
| U.S. Government Obligations – 2.8% | |
| U.S. Treasury Bonds | |
| 5.375% 02/15/31 | | | 3,037,000 | | | | 3,425,642 | | |
| 7.250% 05/15/16 | | | 130,000 | | | | 161,393 | | |
| U.S. Treasury Inflation Indexed Bond | |
| 3.500% 01/15/11 | | | 703,825 | | | | 749,023 | | |
| U.S. Treasury Notes | |
| 3.875% 02/15/13 | | | 1,070,000 | | | | 1,109,206 | | |
| U.S. Government Obligations Total | | | 5,445,264 | | |
Total Government & Agency Obligations
(cost of $8,883,255) | | | 9,098,217 | | |
| Commercial Mortgage-Backed Securities – 4.3% | |
| Bear Stearns Commercial Mortgage Securities | |
| 5.449% 12/11/40 (c) | | | 630,000 | | | | 572,549 | | |
| 5.623% 03/11/39 (c) | | | 760,000 | | | | 662,152 | | |
| 5.742% 09/11/42 (c) | | | 750,000 | | | | 678,472 | | |
| CS First Boston Mortgage Securities Corp. | |
| 4.577% 04/15/37 | | | 975,000 | | | | 964,054 | | |
| GE Capital Commercial Mortgage Corp. | |
| 4.170% 07/10/37 | | | 525,586 | | | | 519,095 | | |
See Accompanying Notes to Financial Statements.
77
Columbia Balanced Fund
August 31, 2008
| Commercial Mortgage-Backed Securities (continued) | |
| | | Par ($) | | Value ($) | |
| Greenwich Capital Commercial Funding Corp. | |
| 5.117% 04/10/37 | | | 770,000 | | | | 765,787 | | |
| JPMorgan Chase Commercial Mortgage Securities Corp. | |
| 5.447% 06/12/47 | | | 791,000 | | | | 710,573 | | |
| 4.780% 07/15/42 | | | 1,350,000 | | | | 1,191,720 | | |
| 5.857% 10/12/35 | | | 1,500,000 | | | | 1,507,579 | | |
| 5.525% 04/15/43 (c) | | | 1,122,000 | | | | 973,677 | | |
Total Commercial Mortgage-Backed Securities
(cost of $9,093,791) | | | 8,545,658 | | |
| Collateralized Mortgage Obligations – 4.1% | |
| Agency – 2.2% | |
| Federal Home Loan Mortgage Corp. | |
| 4.000% 09/15/15 | | | 1,820,000 | | | | 1,821,312 | | |
| 4.000% 10/15/18 | | | 1,900,000 | | | | 1,792,631 | | |
| 4.500% 08/15/28 | | | 720,000 | | | | 716,128 | | |
| Agency Total | | | 4,330,071 | | |
| Non-Agency – 1.9% | |
| Bear Stearns Adjustable Rate Mortgage Trust | |
| 5.488% 02/25/47 (c) | | | 1,234,437 | | | | 920,680 | | |
| Lehman Mortgage Trust | |
| 6.500% 01/25/38 | | | 658,100 | | | | 545,195 | | |
| SACO I, Inc. | |
| (f) 09/25/24 (c) | | | 8,925 | | | | 8,880 | | |
| Structured Asset Securities Corp. | |
| 5.500% 05/25/33 | | | 580,647 | | | | 544,258 | | |
| 5.500% 07/25/33 | | | 775,804 | | | | 749,135 | | |
| WaMu Mortgage Pass-Through Certificates | |
| 5.713% 02/25/37 (c) | | | 1,263,002 | | | | 927,931 | | |
| Non-Agency Total | | | 3,696,079 | | |
Total Collateralized Mortgage Obligations
(cost of $8,861,430) | | | 8,026,150 | | |
| Asset-Backed Securities – 1.9% | |
| Cityscape Home Equity Loan Trust | |
| 7.410% 05/25/28 | | | 211,674 | | | | 209,512 | | |
| First Alliance Mortgage Loan Trust | |
| 7.340% 06/20/27 | | | 66,842 | | | | 55,205 | | |
| Ford Credit Auto Owner Trust | |
| 5.470% 06/15/12 | | | 611,000 | | | | 600,275 | | |
| Franklin Auto Trust | |
| 5.360% 05/20/16 | | | 761,000 | | | | 750,892 | | |
| IMC Home Equity Loan Trust | |
| 7.310% 11/20/28 | | | 845,837 | | | | 843,890 | | |
| 7.520% 08/20/28 | | | 630,144 | | | | 503,182 | | |
| | | Par ($) | | Value ($) | |
| USAA Auto Owner Trust | |
| 4.500% 10/15/13 | | | 840,000 | | | | 825,709 | | |
Total Asset-Backed Securities
(cost of $3,968,924) | | | 3,788,665 | | |
| Short-Term Obligation – 3.1% | |
Repurchase agreement with
Fixed Income Clearing Corp.,
dated 08/29/08, due on 09/02/08,
at 1.930%, collateralized by a
U.S. Government Agency
Obligation maturing 05/06/10,
market value $6,319,506
(repurchase proceeds
$6,196,377) | | | 6,195,000 | | | | 6,195,000 | | |
Total Short-Term Obligation
(cost of $6,195,000) | | | 6,195,000 | | |
Total Investments – 99.8%
(cost of $182,217,956) (h) | | | 197,171,370 | | |
| Other Assets & Liabilities, Net – 0.2% | | | 413,666 | | |
| Net Assets – 100.0% | | | 197,585,036 | | |
Notes to Investment Portfolio:
(a) Non-income producing security.
(b) Security purchased on a delayed delivery basis.
(c) The interest rate shown on floating rate or variable rate securities reflects the rate at August 31, 2008.
(d) Security exempt from registration pursuant to Rule 144A under the Securities Act of 1933. These securities may be resold in transactions exempt from registration, normally to qualified institutional buyers. At August 31, 2008, these securities, which are not illiquid, amounted to $1,088,354, which represents 0.6% of net assets.
(e) A portion of this security with a market value of $51,103 is pledged as collateral for open futures contracts.
(f) Zero coupon bond.
(g) The issuer filed for bankruptcy protection under Chapter 11 on September 15, 2008. As a result of this bankruptcy filing, income is no longer being accrued on this security.
(h) Cost for federal income tax purposes is $182,571,445.
At August 31, 2008, the asset allocation of the Fund is as follows:
| Asset Allocation (Unaudited) | | % of
Net Assets | |
| Common Stocks | | | 58.9 | | |
| Mortgage-Backed Securities | | | 12.5 | | |
| Corporate Fixed-Income Bonds & Notes | | | 10.4 | | |
| Government & Agency Obligations | | | 4.6 | | |
| Commercial Mortgage-Backed Securities | | | 4.3 | | |
| Collateralized Mortgage Obligations | | | 4.1 | | |
| Asset-Backed Securities | | | 1.9 | | |
| | | | 96.7 | | |
| Short-Term Obligation | | | 3.1 | | |
| Other Assets & Liabilities, Net | | | 0.2 | | |
| | | | 100.0 | | |
See Accompanying Notes to Financial Statements.
78
Columbia Balanced Fund
August 31, 2008
At August 31, 2008, the Fund held the following open long futures contracts:
| Type | | Number of
Contracts | | Value | | Aggregate
Face Value | | Expiration
Date | | Unrealized
Appreciation | |
U.S. Treasury
2 Year Note | | | 25 | | | $ | 5,307,031 | | | $ | 5,306,331 | | | Dec-08 | | $ | 700 | | |
| Acronym | | Name | |
| ADR | | American Depositary Receipt | |
|
| PIK | | Payment-In-Kind | |
|
| TBA | | To Be Announced | |
|
See Accompanying Notes to Financial Statements.
79
Investment Portfolio – Columbia Oregon Intermediate Municipal Bond Fund
August 31, 2008
| Municipal Bonds – 97.3% | |
| | | Par ($) | | Value ($) | |
| Education – 4.9% | |
| Education – 4.9% | |
| OR Facilities Authority | |
Linfield College Project,
Series 2005 A,
5.000% 10/01/20 | | | 1,825,000 | | | | 1,835,731 | | |
| OR Forest Grove Student Housing | |
Oak Tree Foundation,
Series 2007,
5.500% 03/01/37 | | | 3,000,000 | | | | 2,720,730 | | |
| OR Health Sciences University | |
Series 1996 A,
Insured: MBIA:
(a) 07/01/12 | | | 1,315,000 | | | | 1,144,944 | | |
| (a) 07/01/14 | | | 2,550,000 | | | | 2,009,681 | | |
| (a) 07/01/15 | | | 4,325,000 | | | | 3,226,666 | | |
| (a) 07/01/21 | | | 12,515,000 | | | | 6,482,395 | | |
OR Health, Housing, Educational &
Cultural Facilities Authority | |
Linfield College Project,
Series 1998 A:
4.650% 10/01/09 | | | 555,000 | | | | 561,116 | | |
| 5.500% 10/01/18 | | | 1,000,000 | | | | 1,007,780 | | |
Reed College Project,
Series 1995 A,
Insured: MBIA
5.100% 07/01/10 | | | 470,000 | | | | 484,100 | | |
| Education Total | | | 19,473,143 | | |
| Education Total | | | 19,473,143 | | |
| Health Care – 8.0% | |
| Continuing Care Retirement – 0.6% | |
| OR Albany Hospital Facility Authority | |
Mennonite Home Albany,
Series 2004 PJ-A:
4.750% 10/01/11 | | | 660,000 | | | | 657,928 | | |
| 5.000% 10/01/12 | | | 680,000 | | | | 680,469 | | |
OR Multnomah County Hospital
Facilities Authority | |
Terwilliger Plaza, Inc.,
Series 2006 A,
5.250% 12/01/26 | | | 1,400,000 | | | | 1,207,738 | | |
| Continuing Care Retirement Total | | | 2,546,135 | | |
| | | Par ($) | | Value ($) | |
| Hospitals – 7.4% | |
OR Benton County Hospital
Facilities Authority | |
Samaritan Health Services Project,
Series 1998:
4.800% 10/01/11 | | | 245,000 | | | | 247,720 | | |
| 5.200% 10/01/17 | | | 2,255,000 | | | | 2,277,527 | | |
OR Clackamas County Hospital
Facility Authority | |
Legacy Health System, IBC,
Series 1999,
Insured: MBIA
5.500% 02/15/13 | | | 495,000 | | | | 513,468 | | |
Legacy Health System:
Series 1999:
5.000% 02/15/16 | | | 1,010,000 | | | | 1,029,836 | | |
| 5.500% 02/15/13 | | | 5,450,000 | | | | 5,656,500 | | |
| 5.500% 02/15/14 | | | 2,385,000 | | | | 2,475,368 | | |
Series 2001:
4.600% 05/01/10 | | | 885,000 | | | | 910,727 | | |
| 5.250% 05/01/21 | | | 4,890,000 | | | | 4,990,978 | | |
| 5.750% 05/01/12 | | | 2,000,000 | | | | 2,152,020 | | |
| 5.750% 05/01/16 | | | 1,500,000 | | | | 1,581,645 | | |
OR Medford Hospital Facilities
Authority | |
Asante Health System,
Series 1998 A,
Insured: MBIA:
5.250% 08/15/10 | | | 485,000 | | | | 490,927 | | |
| 5.250% 08/15/11 | | | 260,000 | | | | 263,130 | | |
OR Multnomah County Hospital
Facilities Authority | |
Providence Health System,
Series 2004,
5.250% 10/01/16 | | | 2,970,000 | | | | 3,149,834 | | |
| OR Salem Hospital Facility Authority | |
Series 2006 A,
5.000% 08/15/27 | | | 3,500,000 | | | | 3,389,120 | | |
| OR Umatilla County Hospital Facility Authority | |
Catholic Health Initiatives,
Series 2000 A,
5.750% 12/01/20 | | | 285,000 | | | | 296,309 | | |
| Hospitals Total | | | 29,425,109 | | |
| Health Care Total | | | 31,971,244 | | |
See Accompanying Notes to Financial Statements.
80
Columbia Oregon Intermediate Municipal Bond Fund
August 31, 2008
| Municipal Bonds (continued) | |
| | | Par ($) | | Value ($) | |
| Housing – 5.1% | |
| Assisted Living/Senior – 0.5% | |
OR Clackamas County Hospital
Facility Authority | |
Robison Jewish Home Project,
Series 2005:
5.000% 10/01/19 | | | 1,000,000 | | | | 950,930 | | |
| 5.125% 10/01/24 | | | 1,000,000 | | | | 912,430 | | |
| Assisted Living/Senior Total | | | 1,863,360 | | |
| Multi-Family – 1.6% | |
OR Clackamas County Housing
Authority | |
Multi-Family Housing,
Easton Ridge,
Series 1996 A:
5.800% 12/01/16 | | | 2,085,000 | | | | 2,085,229 | | |
| 5.900% 12/01/26 | | | 1,750,000 | | | | 1,711,588 | | |
| PR Housing Finance Authority | |
Series 2008,
5.000% 12/01/13 | | | 2,455,000 | | | | 2,613,151 | | |
| Multi-Family Total | | | 6,409,968 | | |
| Single-Family – 3.0% | |
| OR Housing & Community Services | |
Department Mortgage Single
Family Program:
Series 1991 D,
6.700% 07/01/13 | | | 155,000 | | | | 157,396 | | |
Series 1998 A,
4.850% 07/01/10 | | | 120,000 | | | | 121,376 | | |
Series 1999 E,
5.375% 07/01/21 | | | 2,285,000 | | | | 2,317,470 | | |
Series 1999 M, AMT,
5.800% 07/01/12 | | | 120,000 | | | | 121,501 | | |
Series 2000 E,
Insured: FHA:
5.700% 07/01/12 | | | 355,000 | | | | 364,124 | | |
| 5.800% 07/01/14 | | | 310,000 | | | | 318,271 | | |
| 6.000% 07/01/20 | | | 870,000 | | | | 876,612 | | |
Series 2001 J,
5.150% 07/01/24 | | | 1,330,000 | | | | 1,334,083 | | |
Series 2001 Q:
4.700% 07/01/15 | | | 490,000 | | | | 499,320 | | |
| 4.900% 07/01/17 | | | 475,000 | | | | 482,134 | | |
Series 2008 G,
5.200% 07/01/28 | | | 5,345,000 | | | | 5,344,626 | | |
| Single-Family Total | | | 11,936,913 | | |
| Housing Total | | | 20,210,241 | | |
| | | Par ($) | | Value ($) | |
| Industrial – 0.5% | |
| Oil & Gas – 0.5% | |
| TN Energy Acquisition Corp. | |
Series 2006,
5.250% 09/01/22 | | | 1,900,000 | | | | 1,800,706 | | |
| Oil & Gas Total | | | 1,800,706 | | |
| Industrial Total | | | 1,800,706 | | |
| Other – 25.2% | |
| Other – 1.1% | |
OR Health, Housing, Educational &
Cultural Facilities Authority | |
Goodwill Industries Lane County,
Series 1998 A,
6.650% 11/15/22 (b) | | | 3,385,000 | | | | 3,276,071 | | |
PR Commonwealth of Puerto Rico
Government Development Bank | |
Series 2006 B,
5.000% 12/01/14 | | | 1,200,000 | | | | 1,232,052 | | |
| Other Total | | | 4,508,123 | | |
| Refunded/Escrowed (c) – 24.1% | |
| OR Benton & Linn Counties | |
School District No. 509J, Corvallis,
Series 2003,
Pre-refunded 06/01/13,
Insured: FSA
5.000% 06/01/17 | | | 2,665,000 | | | | 2,920,520 | | |
| OR Board of Higher Education | |
Lottery Education Project,
Series 1999 A,
Pre-refunded 04/01/11,
Insured: FSA
5.000% 04/01/14 | | | 2,705,000 | | | | 2,887,479 | | |
Series 2001 A,
Pre-refunded 08/01/11,
5.250% 08/01/14 | | | 1,225,000 | | | | 1,322,461 | | |
OR Clackamas Community
College District | |
Series 2001,
Pre-refunded 06/15/11,
Insured: FGIC
5.250% 06/15/15 | | | 1,390,000 | | | | 1,498,392 | | |
See Accompanying Notes to Financial Statements.
81
Columbia Oregon Intermediate Municipal Bond Fund
August 31, 2008
| Municipal Bonds (continued) | |
| | | Par ($) | | Value ($) | |
OR Clackamas County Hospital
Facility Authority | |
Kaiser Permanente,
Series 1998 A,
Escrowed to Maturity,
5.375% 04/01/14 | | | 7,135,000 | | | | 7,332,854 | | |
Willamette View, Inc. Project,
Series 1999 A,
Pre-refunded 11/01/09,
6.850% 11/01/15 | | | 1,480,000 | | | | 1,560,793 | | |
| OR Clackamas County | |
School District No. 086,
Series 2000,
Pre-refunded 06/15/10,
6.000% 06/15/16 | | | 2,350,000 | | | | 2,510,106 | | |
School District No. 108,
Series 2001,
Pre-refunded 06/15/11,
Insured: FSA
5.375% 06/15/15 | | | 1,055,000 | | | | 1,140,814 | | |
School District No. 12,
North Clackamas,
Series 1998,
Pre-refunded 06/01/09,
Insured: FGIC
5.250% 06/01/11 | | | 1,000,000 | | | | 1,026,990 | | |
School District No. 7J,
Lake Oswego,
Series 2001,
Pre-refunded 06/01/11:
5.375% 06/01/16 | | | 1,295,000 | | | | 1,399,248 | | |
| 5.375% 06/01/17 | | | 2,535,000 | | | | 2,739,068 | | |
| OR Coos County | |
School District No. 13, North Bend,
Series 2002,
Pre-refunded 06/15/12,
Insured: FSA
5.500% 06/15/15 | | | 1,765,000 | | | | 1,947,730 | | |
| OR Department of Transportation | |
Highway User Tax,
Series 2002 A,
Pre-refunded 11/15/12,
5.500% 11/15/16 | | | 2,500,000 | | | | 2,781,300 | | |
OR Deschutes County Hospital
Facilities Authority | |
Cascade Health Services, Inc.,
Series 2002,
Pre-refunded 01/01/12:
5.500% 01/01/22 | | | 2,000,000 | | | | 2,180,920 | | |
| 5.600% 01/01/27 | | | 5,550,000 | | | | 6,069,646 | | |
| 5.600% 01/01/32 | | | 2,000,000 | | | | 2,187,260 | | |
| | | Par ($) | | Value ($) | |
| OR Deschutes County | |
School District No. 1,
Series 2001 A,
Pre-refunded 06/15/11,
Insured: FSA
5.500% 06/15/18 | | | 1,000,000 | | | | 1,084,710 | | |
| OR Jackson County | |
School District No. 4,
Phoenix-Talent,
Series 2001,
Pre-refunded 06/15/11,
Insured: FSA
5.500% 06/15/16 | | | 1,000,000 | | | | 1,084,710 | | |
School District No. 9, Eagle Point,
Series 2000,
Pre-refunded 06/15/11,
5.625% 06/15/15 | | | 1,920,000 | | | | 2,089,094 | | |
| OR Lebanon Urban Renewal Agency | |
Series 1999,
Pre-refunded 06/01/09,
5.625% 06/01/19 | | | 1,000,000 | | | | 1,028,930 | | |
| OR Linn County Community | |
School District No. 9, Lebanon,
Series 2001,
Pre-refunded 06/15/13,
Insured: FGIC
5.550% 06/15/21 | | | 2,000,000 | | | | 2,242,680 | | |
School District No. 9,
Series 2001,
Pre-refunded 06/15/13,
Insured: FGIC
5.250% 06/15/15 | | | 405,000 | | | | 448,542 | | |
OR Multnomah County Educational
Facilities Authority | |
University of Portland Project,
Series 2000,
Prerefunded 04/01/10:
5.700% 04/01/15 | | | 1,000,000 | | | | 1,054,330 | | |
| 6.000% 04/01/20 | | | 1,000,000 | | | | 1,058,990 | | |
| 6.000% 04/01/25 | | | 500,000 | | | | 529,495 | | |
| OR Multnomah County | |
School District No. 40,
Series 2001,
Pre-refunded 12/01/10,
Insured: FSA
5.000% 12/01/14 | | | 1,790,000 | | | | 1,897,203 | | |
School District No. 7, Reynolds,
Series 2000,
Pre-refunded 06/15/11,
5.625% 06/15/17 | | | 1,000,000 | | | | 1,086,930 | | |
See Accompanying Notes to Financial Statements.
82
Columbia Oregon Intermediate Municipal Bond Fund
August 31, 2008
| Municipal Bonds (continued) | |
| | | Par ($) | | Value ($) | |
| OR Multnomah-Clackamas Counties | |
Centennial School District No. 28-302,
Series 2001,
Pre-refunded 06/15/11,
Insured: FGIC:
5.375% 06/15/16 | | | 2,055,000 | | | | 2,222,154 | | |
| 5.375% 06/15/17 | | | 2,280,000 | | | | 2,465,455 | | |
| 5.375% 06/15/18 | | | 2,490,000 | | | | 2,692,537 | | |
OR North Clackamas Parks &
Recreation District Facilities | |
Series 1993,
Escrowed to Maturity, | | | |
| 5.700% 04/01/13 | | | 1,975,000 | | | | 2,128,635 | | |
| OR Portland Community College District | |
Series 2001 A,
Pre-refunded 06/01/11:
5.375% 06/01/14 | | | 1,925,000 | | | | 2,079,963 | | |
| 5.375% 06/01/16 | | | 2,705,000 | | | | 2,922,752 | | |
| 5.375% 06/01/17 | | | 2,540,000 | | | | 2,744,470 | | |
| OR Powell Valley Water District | |
Series 2000,
Pre-refunded 08/01/09,
6.000% 02/01/15 | | | 620,000 | | | | 644,031 | | |
| OR Salem Water & Sewer | |
Series 2000,
Pre-refunded 06/01/10,
Insured: FSA
5.300% 06/01/15 | | | 1,500,000 | | | | 1,582,260 | | |
OR Umatilla County Hospital
Facility Authority | |
Catholic Health Initiatives,
Series 2000 A,
Escrowed to Maturity:
5.750% 12/01/20 | | | 245,000 | | | | 259,489 | | |
| 6.000% 12/01/30 | | | 4,825,000 | | | | 5,083,909 | | |
| OR Washington & Clackamas Counties | |
School District No. 23J, Tigard,
Series 2002,
Pre-refunded 06/15/12,
Insured: MBIA
5.375% 06/15/17 | | | 1,500,000 | | | | 1,648,560 | | |
| OR Washington County | |
School District No. 48J, Beaverton:
Series 1999,
Pre-refunded 06/01/09,
Insured: FGIC
5.100% 06/01/12 | | | 500,000 | | | | 512,935 | | |
| | | Par ($) | | Value ($) | |
Series 2001,
Pre-refunded 01/01/11:
5.125% 01/01/14 | | | 2,000,000 | | | | 2,130,700 | | |
| 5.125% 01/01/17 | | | 1,820,000 | | | | 1,938,937 | | |
| 5.125% 01/01/18 | | | 2,260,000 | | | | 2,407,691 | | |
Series 2001,
Pre-refunded 06/01/11,
5.500% 06/01/16 | | | 2,785,000 | | | | 3,018,411 | | |
OR Washington, Multnomah &
Yamhill Counties | |
School District No. 1J,
Series 1999,
Pre-refunded 06/01/09,
5.250% 06/01/14 | | | 500,000 | | | | 513,495 | | |
| OR Yamhill County | |
School District No. 029J,
Series 2002,
Pre-refunded 06/15/12,
Insured: MBIA
5.250% 06/15/16 | | | 2,535,000 | | | | 2,774,710 | | |
VI Virgin Islands Public Finance
Authority | |
Series 1989 A,
Escrowed to Maturity,
7.300% 10/01/18 | | | 1,185,000 | | | | 1,450,878 | | |
| Refunded/Escrowed Total | | | 96,333,167 | | |
| Other Total | | | 100,841,290 | | |
| Other Revenue – 2.7% | |
| Recreation – 2.7% | |
| OR Board of Higher Education | |
Lottery Education Project:
Series 1999 B,
Insured: FSA
5.250% 04/01/15 | | | 1,315,000 | | | | 1,355,397 | | |
Series 2003 A,
Insured: FSA:
5.000% 04/01/14 | | | 1,830,000 | | | | 1,997,884 | | |
| 5.250% 04/01/11 | | | 4,000,000 | | | | 4,101,320 | | |
Series 2008,
5.000% 04/01/24 | | | 3,130,000 | | | | 3,303,089 | | |
| Recreation Total | | | 10,757,690 | | |
| Other Revenue Total | | | 10,757,690 | | |
See Accompanying Notes to Financial Statements.
83
Columbia Oregon Intermediate Municipal Bond Fund
August 31, 2008
| Municipal Bonds (continued) | |
| | | Par ($) | | Value ($) | |
| Tax-Backed – 41.4% | |
| Local Appropriated – 0.3% | |
| OR Deschutes & Jefferson County | |
School District No. 02J,
Series 2004 B,
Insured: FGIC
(a) 06/15/22 | | | 2,335,000 | | | | 1,164,114 | | |
| Local Appropriated Total | | | 1,164,114 | | |
| Local General Obligations – 23.6% | |
| OR Aurora | |
Series 1999,
5.600% 06/01/24 | | | 1,205,000 | | | | 1,217,110 | | |
| OR Bend Municipal Airport Project | |
Series 1999 B, AMT,
5.375% 06/01/13 | | | 150,000 | | | | 152,189 | | |
OR Canyonville South Umpqua
Rural Fire District | |
Series 2001,
5.400% 07/01/31 | | | 610,000 | | | | 540,588 | | |
| OR Clackamas & Washington Counties | |
School District No. 003JT,
Series 2003,
Insured: FGIC
(a) 06/15/17 | | | 4,000,000 | | | | 2,690,400 | | |
| OR Clackamas Community College District | |
Series 2001,
Insured: FGIC
5.250% 06/15/15 | | | 110,000 | | | | 116,013 | | |
| OR Clackamas County | |
School District No. 007J,
Lake Oswego,
Series 2005,
Insured: FSA
5.250% 06/01/21 | | | 2,000,000 | | | | 2,209,780 | | |
School District No. 108, Estacada,
Series 2005,
Insured: FSA
5.500% 06/15/25 | | | 2,485,000 | | | | 2,819,680 | | |
School District No. 115,
Series 2006 A,
Insured: MBIA:
(a) 06/15/25 | | | 2,250,000 | | | | 924,008 | | |
| (a) 06/15/26 | | | 2,610,000 | | | | 1,012,654 | | |
School District No. 12,
North Clackamas,
Series 2007 B,
Insured: FSA
(a) 06/15/22 | | | 4,000,000 | | | | 3,652,920 | | |
| | | Par ($) | | Value ($) | |
Series 2007,
Insured: MBIA
4.125% 06/01/27 | | | 2,000,000 | | | | 1,848,160 | | |
| OR Columbia County | |
School District No. 502,
Deferred Interest,
Series 1999,
Insured: FGIC:
(a) 06/01/13 | | | 1,685,000 | | | | 1,411,255 | | |
| (a) 06/01/14 | | | 1,025,000 | | | | 817,222 | | |
| OR Deschutes County | |
Administrative School District No. 1,
Series 2007,
Insured: FGIC
4.500% 06/15/20 | | | 5,000,000 | | | | 5,093,200 | | |
| OR Jackson County | |
School District No. 009,
Series 2005,
Insured: MBIA:
5.500% 06/15/20 | | | 1,000,000 | | | | 1,128,330 | | |
| 5.500% 06/15/21 | | | 1,410,000 | | | | 1,585,446 | | |
School District No. 549C,
Series 2008:
4.625% 06/15/27 | | | 1,500,000 | | | | 1,495,245 | | |
| 4.625% 06/15/28 | | | 1,660,000 | | | | 1,650,306 | | |
| 4.625% 06/15/30 | | | 2,000,000 | | | | 1,968,820 | | |
School District No. 6,
Central Point,
Series 2000,
6.000% 06/15/09 | | | 1,090,000 | | | | 1,126,548 | | |
| OR Jefferson County | |
School District No. 509J,
Madras School District,
Series 2002,
Insured: FGIC
5.250% 06/15/18 | | | 1,075,000 | | | | 1,132,254 | | |
| OR Josephine County | |
Unit School District,
Three Rivers,
Series 2005,
Insured: FGIC:
5.000% 12/15/15 | | | 1,000,000 | | | | 1,093,960 | | |
| 5.000% 12/15/16 | | | 1,000,000 | | | | 1,092,290 | | |
| OR Lane County | |
School District No. 19, Springfield:
Series 1997,
Insured: FGIC:
6.000% 10/15/12 | | | 1,740,000 | | | | 1,932,026 | | |
| 6.000% 10/15/14 | | | 1,310,000 | | | | 1,489,549 | | |
See Accompanying Notes to Financial Statements.
84
Columbia Oregon Intermediate Municipal Bond Fund
August 31, 2008
| Municipal Bonds (continued) | |
| | | Par ($) | | Value ($) | |
Series 2006,
Insured: FSA
(a) 06/15/25 | | | 5,160,000 | | | | 2,208,996 | | |
School District No. 4J, Eugene,
Series 2002:
5.000% 07/01/12 | | | 1,000,000 | | | | 1,083,680 | | |
| 5.250% 07/01/13 | | | 1,000,000 | | | | 1,107,250 | | |
| OR Linn Benton Community College | |
Series 2001,
Insured: FGIC
(a) 06/15/13 | | | 1,000,000 | | | | 854,530 | | |
Series 2002,
Insured: FGIC
(a) 06/15/14 | | | 1,000,000 | | | | 817,080 | | |
| OR Linn County | |
Community School District No. 9,
Lebanon,
Series 2001,
Insured: FGIC
5.250% 06/15/15 | | | 305,000 | | | | 328,955 | | |
| OR Madras Aquatic Center District | |
Series 2005,
5.000% 06/01/22 | | | 1,695,000 | | | | 1,767,715 | | |
| OR Multnomah-Clackamas Counties | |
Centennial School District No. 28JT,
Series 2006,
Insured: AMBAC
(a) 06/01/16 | | | 2,260,000 | | | | 1,589,594 | | |
| OR Portland Limited Tax | |
Series 2001 B:
(a) 06/01/12 | | | 1,750,000 | | | | 1,550,272 | | |
| (a) 06/01/13 | | | 1,500,000 | | | | 1,275,825 | | |
| (a) 06/01/16 | | | 3,500,000 | | | | 2,573,375 | | |
| (a) 06/01/18 | | | 4,000,000 | | | | 2,637,720 | | |
| (a) 06/01/19 | | | 4,000,000 | | | | 2,487,920 | | |
| (a) 06/01/20 | | | 4,000,000 | | | | 2,340,840 | | |
| OR Portland | |
Series 2005,
5.000% 06/01/16 | | | 3,075,000 | | | | 3,384,191 | | |
OR Tri-County Metropolitan
Transportation District | |
Series 2003 A,
5.000% 09/01/15 | | | 1,000,000 | | | | 1,072,580 | | |
Series 2005 A,
Insured: FSA
5.000% 09/01/17 | | | 4,250,000 | | | | 4,602,920 | | |
| | | Par ($) | | Value ($) | |
OR Tualatin Hills Park &
Recreation District | |
Series 1998,
Insured: FGIC
5.750% 03/01/14 | | | 990,000 | | | | 1,107,968 | | |
OR Washington & Clackamas
Counties | |
School District No. 23J, Tigard:
Series 2000,
(a) 06/15/18 | | | 2,700,000 | | | | 1,773,927 | | |
Series 2005,
Insured: MBIA
5.000% 06/15/21 | | | 6,575,000 | | | | 7,070,886 | | |
OR Washington Clackamas &
Yamhill Counties | |
School District No. 88J,
Series 2007 B,
Insured: MBIA
4.500% 06/15/23 | | | 8,125,000 | | | | 8,183,256 | | |
OR Washington Multnomah &
Yamhill Counties | |
School District No. 1J:
Series 1998,
5.000% 11/01/13 | | | 1,100,000 | | | | 1,210,495 | | |
Series 2006,
Insured: MBIA
(a) 06/15/25 | | | 4,065,000 | | | | 1,648,195 | | |
| OR Yamhill County | |
School District No. 029J,
Series 2005,
Insured: FGIC
5.500% 06/15/21 | | | 1,000,000 | | | | 1,108,750 | | |
School District No. 40,
Series 1997,
Insured: FGIC
6.000% 06/01/09 | | | 500,000 | | | | 514,315 | | |
| Local General Obligations Total | | | 94,501,188 | | |
| Special Non-Property Tax – 1.8% | |
| OR Department of Transportation | |
Series 2007 A,
5.000% 11/15/16 | | | 6,305,000 | | | | 7,026,923 | | |
| Special Non-Property Tax Total | | | 7,026,923 | | |
| Special Property Tax – 6.7% | |
| OR Hood River Urban Renewal Agency | |
Series 1996,
6.250% 12/15/11 | | | 690,000 | | | | 690,428 | | |
See Accompanying Notes to Financial Statements.
85
Columbia Oregon Intermediate Municipal Bond Fund
August 31, 2008
| Municipal Bonds (continued) | |
| | | Par ($) | | Value ($) | |
| OR Keizer | |
Series 2008,
5.200% 06/01/31 | | | 2,500,000 | | | | 2,501,675 | | |
| OR Lebanon Urban Renewal Agency | |
Series 2000:
5.750% 06/01/15 | | | 1,120,000 | | | | 1,125,958 | | |
| 6.000% 06/01/20 | | | 1,580,000 | | | | 1,589,148 | | |
| OR Medford Urban Renewal | |
Series 1996,
5.875% 09/01/10 | | | 500,000 | | | | 501,175 | | |
OR Portland Airport Way Urban
Renewal & Redevelopment | |
Convention Center,
Series 2000 A,
Insured: AMBAC:
5.750% 06/15/17 | | | 1,500,000 | | | | 1,560,135 | | |
| 5.750% 06/15/18 | | | 2,050,000 | | | | 2,126,752 | | |
OR Portland River District Urban
Renewal & Redevelopment | |
Series 2003 A,
Insured: AMBAC:
5.000% 06/15/17 | | | 1,500,000 | | | | 1,589,085 | | |
| 5.000% 06/15/18 | | | 3,070,000 | | | | 3,191,695 | | |
| 5.000% 06/15/20 | | | 2,000,000 | | | | 2,053,840 | | |
OR Portland Urban Renewal &
Redevelopment | |
South Park Blocks,
Series 2000 A,
Insured: AMBAC:
5.750% 06/15/17 | | | 2,065,000 | | | | 2,213,102 | | |
| 5.750% 06/15/19 | | | 2,580,000 | | | | 2,765,038 | | |
| OR Redmond Urban Renewal Agency | |
Downtown Area B,
Series 1999:
5.650% 06/01/13 | | | 720,000 | | | | 722,628 | | |
| 5.850% 06/01/19 | | | 785,000 | | | | 786,499 | | |
South Airport Industrial Area A,
Series 1999,
5.700% 06/01/19 | | | 650,000 | | | | 669,162 | | |
| OR Seaside Urban Renewal Agency | |
Greater Seaside Urban Renewal,
Series 2001,
5.250% 06/01/15 | | | 1,000,000 | | | | 1,004,540 | | |
| OR Veneta Urban Renewal Agency | |
Series 2001:
5.375% 02/15/16 | | | 700,000 | | | | 708,848 | | |
| 5.625% 02/15/21 | | | 1,100,000 | | | | 1,104,818 | | |
| Special Property Tax Total | | | 26,904,526 | | |
| | | Par ($) | | Value ($) | |
| State Appropriated – 5.8% | |
| OR Department of Administrative Services | |
Certificates of Participation:
Series 1999 A,
Insured: AMBAC:
5.000% 05/01/13 | | | 4,240,000 | | | | 4,344,855 | | |
| 5.000% 05/01/14 | | | 1,000,000 | | | | 1,024,730 | | |
Series 2002 B,
Insured: MBIA
5.250% 05/01/10 | | | 840,000 | | | | 881,446 | | |
Series 2002 C,
Insured: MBIA:
5.250% 11/01/15 | | | 1,000,000 | | | | 1,060,580 | | |
| 5.250% 11/01/17 | | | 5,000,000 | | | | 5,325,450 | | |
Series 2002 E,
Insured: FSA
5.000% 11/01/13 | | | 1,470,000 | | | | 1,581,029 | | |
Series 2007 A,
Insured FGIC:
5.000% 05/01/24 | | | 2,630,000 | | | | 2,681,732 | | |
| 5.000% 05/01/25 | | | 2,780,000 | | | | 2,822,812 | | |
| 5.000% 05/01/26 | | | 2,800,000 | | | | 2,833,208 | | |
PR Commonwealth of Puerto Rico
Public Finance Corp. | |
Series 2004 A,
5.750% 08/01/27 | | | 750,000 | | | | 769,515 | | |
| State Appropriated Total | | | 23,325,357 | | |
| State General Obligations – 3.2% | |
| OR Board of Higher Education | |
Deferred Interest,
Series 2001 A,
(a) 08/01/17 | | | 1,050,000 | | | | 725,728 | | |
Series 1996 A,
(a) 08/01/14 | | | 490,000 | | | | 395,680 | | |
Series 2001 A:
5.250% 08/01/14 | | | 255,000 | | | | 271,986 | | |
| 5.250% 08/01/16 | | | 780,000 | | | | 830,825 | | |
Series 2004 D,
5.000% 08/01/24 | | | 3,620,000 | | | | 3,743,478 | | |
| OR Elderly & Disabled Housing | |
Series 2001 B,
4.950% 08/01/20 | | | 985,000 | | | | 991,393 | | |
| OR State | |
Series 1980,
9.200% 10/01/08 | | | 385,000 | | | | 387,529 | | |
Series 2002 A,
5.250% 10/15/15 | | | 1,735,000 | | | | 1,881,573 | | |
See Accompanying Notes to Financial Statements.
86
Columbia Oregon Intermediate Municipal Bond Fund
August 31, 2008
| Municipal Bonds (continued) | |
| | | Par ($) | | Value ($) | |
| OR Veterans Welfare | |
Series 2000 80A,
5.700% 10/01/32 | | | 1,375,000 | | | | 1,391,349 | | |
PR Commonwealth of Puerto Rico
Aqueduct and Sewer Authority | |
Series 2004 A,
5.000% 07/01/30 | | | 1,000,000 | | | | 1,011,060 | | |
| PR Commonwealth of Puerto Rico | |
Series 2006 A,
5.250% 07/01/23 | | | 1,000,000 | | | | 996,870 | | |
| State General Obligations Total | | | 12,627,471 | | |
| Tax-Backed Total | | | 165,549,579 | | |
| Transportation – 0.8% | |
| Airports – 0.2% | |
| OR Port of Portland International Airport | |
Series 1998 12B,
Insured: FGIC
5.250% 07/01/12 | | | 1,000,000 | | | | 1,016,140 | | |
| Airports Total | | | 1,016,140 | | |
| Ports – 0.6% | |
| OR Port of Morrow | |
Series 2007:
4.875% 06/01/20 | | | 750,000 | | | | 709,162 | | |
| 5.000% 06/01/25 | | | 1,000,000 | | | | 915,940 | | |
| OR Port of St. Helens | |
Series 1999:
5.600% 08/01/14 | | | 315,000 | | | | 315,287 | | |
| 5.750% 08/01/19 | | | 425,000 | | | | 421,919 | | |
| Ports Total | | | 2,362,308 | | |
| Transportation Total | | | 3,378,448 | | |
| Utilities – 8.7% | |
| Independent Power Producers – 0.8% | |
| OR Western Generation Agency | |
Series 2006 A,
5.000% 01/01/21 | | | 3,000,000 | | | | 2,585,460 | | |
Wauna Cogeneration Project,
Series 2006 A,
5.000% 01/01/20 | | | 1,000,000 | | | | 874,410 | | |
| Independent Power Producers Total | | | 3,459,870 | | |
| Investor Owned – 2.2% | |
| OR Port of St. Helens Pollution Control | |
Portland General Electric Co.:
Series 1985 A,
4.800% 04/01/10 | | | 5,195,000 | | | | 5,211,468 | | |
| | | Par ($) | | Value ($) | |
Series 1985 B,
4.800% 06/01/10 | | | 3,500,000 | | | | 3,512,145 | | |
| Investor Owned Total | | | 8,723,613 | | |
| Municipal Electric – 3.1% | |
| OR Emerald Peoples Utility District | |
Series 1996,
Insured: FGIC:
7.350% 11/01/10 | | | 2,160,000 | | | | 2,353,191 | | |
| 7.350% 11/01/11 | | | 2,000,000 | | | | 2,241,300 | | |
| 7.350% 11/01/12 | | | 2,490,000 | | | | 2,864,695 | | |
| 7.350% 11/01/13 | | | 2,675,000 | | | | 3,138,578 | | |
Series 2003 A,
Insured: FSA
5.250% 11/01/20 | | | 605,000 | | | | 647,719 | | |
| OR Eugene Electric Utilities System | |
Series 2001 B,
Insured: FSA
5.250% 08/01/13 | | | 1,040,000 | | | | 1,103,866 | | |
| Municipal Electric Total | | | 12,349,349 | | |
| Water & Sewer – 2.6% | |
| OR Myrtle Point Water | |
Series 2000,
6.000% 12/01/20 | | | 510,000 | | | | 526,866 | | |
| OR Portland Water Systems Revenue | |
Series 2006 B,
5.000% 10/01/16 | | | 5,330,000 | | | | 5,916,566 | | |
| OR Sheridan Water | |
Series 1998,
5.350% 04/01/18 | | | 300,000 | | | | 300,045 | | |
| Series 2000: | |
| 6.200% 05/01/15 | | | 625,000 | | | | 638,238 | | |
| 6.450% 05/01/20 | | | 520,000 | | | | 529,823 | | |
| OR Washington County Housing Authority | |
Clean Water Services Sewer,
Series 2004 Lien,
Insured: MBIA
5.000% 10/01/13 | | | 2,310,000 | | | | 2,529,334 | | |
| Water & Sewer Total | | | 10,440,872 | | |
| Utilities Total | | | 34,973,704 | | |
Total Municipal Bonds
(cost of $379,576,424) | | | 388,956,045 | | |
See Accompanying Notes to Financial Statements.
87
Columbia Oregon Intermediate Municipal Bond Fund
August 31, 2008
| Investment Company – 1.6% | |
| | | Shares | | Value ($) | |
Dreyfus Tax- Exempt Cash
Management Fund
(7 day yield of 1.690%) | | | 6,338,820 | | | | 6,338,820 | | |
Total Investment Company
(cost of $6,338,820) | | | 6,338,820 | | |
| Short-Term Obligations – 0.1% | |
| | | Par ($) | | | |
| Variable Rate Demand Notes (d) – 0.1% | |
| OK Development Finance Authority | |
Integris Baptist Medical Center,
Series 2007 A-3,
SPA: JPMorgan Chase Bank
2.350% 08/15/33 | | | 400,000 | | | | 400,000 | | |
| WI University Hospitals & Clinics | |
Series 2008 B,
LOC: U.S. Bank N.A.
2.300% 04/01/34 | | | 100,000 | | | | 100,000 | | |
| Total Variable Rate Demand Notes | | | 500,000 | | |
Total Short-Term Obligations
(cost of $500,000) | | | 500,000 | | |
Total Investments – 99.0%
(cost of $386,415,244) (e) | | | 395,794,865 | | |
| Other Assets & Liabilities, Net – 1.0% | | | 3,994,302 | | |
| Net Assets – 100.0% | | | 399,789,167 | | |
Notes to Investment Portfolio:
(a) Zero coupon bond.
(b) Denotes a restricted security, which is subject to restrictions on resale under federal securities laws or in transactions exempt from registration. At August 31, 2008, the value of this security amounted to $3,276,071, which represents 0.8% of net assets.
| Security | | Acquisition
Date | | Acquisition
Cost | |
OR Health, Housing, Educational &
Cultural Facilities Authority, Goodwill
Industries Lane County, Series 1998 A,
6.650% 11/15/22 | | | 06/17/98 | | | $ | 3,635,000 | | |
(c) The Fund has been informed that each issuer has placed direct obligations of the U.S. Government in an irrevocable trust, solely for the payment of principal and interest.
(d) Variable rate demand notes. These securities are payable upon demand and are secured by letters of credit or other credit support agreements from banks. The interest rates change periodically and the interest rates shown reflect the rates as of August 31, 2008.
(e) Cost for federal income tax purposes is $386,264,923.
At August 31, 2008, the composition of the Fund by revenue source is as follows:
| Holdings By Revenue Source (Unaudited) | | % of
Net Assets | |
| Tax-Backed | | | 41.4 | | |
| Refunded/Escrowed | | | 24.1 | | |
| Utilities | | | 8.7 | | |
| Health Care | | | 8.0 | | |
| Housing | | | 5.1 | | |
| Education | | | 4.9 | | |
| Other Revenue | | | 2.7 | | |
| Other | | | 1.1 | | |
| Transportation | | | 0.8 | | |
| Industrial | | | 0.5 | | |
| | | | 97.3 | | |
| Investment Company | | | 1.6 | | |
| Short-Term Obligations | | | 0.1 | | |
| Other Assets & Liabilities, Net | | | 1.0 | | |
| | | | 100.0 | | |
| Acronym | | Name | |
| AMBAC | | Ambac Assurance Corp. | |
|
| AMT | | Alternative Minimum Tax | |
|
| FGIC | | Financial Guaranty Insurance Co. | |
|
| FHA | | Federal Housing Administration | |
|
| FSA | | Financial Security Assurance, Inc. | |
|
| IBC | | Insured Bond Certificates | |
|
| LOC | | Letter of Credit | |
|
| MBIA | | MBIA Insurance Corp. | |
|
| SPA | | Stand-by Purchase Agreement | |
|
See Accompanying Notes to Financial Statements.
88
Investment Portfolio – Columbia Conservative High Yield Fund
August 31, 2008
| Corporate Fixed-Income Bonds & Notes – 93.0% | |
| | | Par ($) | | Value ($) | |
| Basic Materials – 11.1% | |
| Chemicals – 3.4% | |
| Agricultural Chemicals – 1.2% | |
| Mosaic Co. | |
| 7.625% 12/01/16 (a) | | | 4,440,000 | | | | 4,669,242 | | |
| Terra Capital, Inc. | |
| 7.000% 02/01/17 | | | 2,075,000 | | | | 2,017,937 | | |
| | | | 6,687,179 | | |
| Chemicals-Diversified – 1.6% | |
| Huntsman International LLC | |
| 6.875% 11/15/13 (a) | | | 1,975,000 | | | | 2,535,246 | | |
| 7.875% 11/15/14 | | | 3,395,000 | | | | 3,157,350 | | |
| NOVA Chemicals Corp. | |
| 6.500% 01/15/12 | | | 3,610,000 | | | | 3,312,175 | | |
| | | | 9,004,771 | | |
| Chemicals-Specialty – 0.6% | |
| Chemtura Corp. | |
| 6.875% 06/01/16 | | | 4,300,000 | | | | 3,633,500 | | |
| | | | 3,633,500 | | |
| Chemicals Total | | | 19,325,450 | | |
| Forest Products & Paper – 2.0% | |
| Paper & Related Products – 2.0% | |
| Cascades, Inc. | |
| 7.250% 02/15/13 | | | 3,705,000 | | | | 3,130,725 | | |
| Domtar Corp. | |
| 7.125% 08/15/15 | | | 3,840,000 | | | | 3,705,600 | | |
| Georgia-Pacific Corp. | |
| 8.000% 01/15/24 | | | 3,965,000 | | | | 3,627,975 | | |
| NewPage Corp. | |
| 10.000% 05/01/12 | | | 1,210,000 | | | | 1,173,700 | | |
| | | | 11,638,000 | | |
| Forest Products & Paper Total | | | 11,638,000 | | |
| Iron/Steel – 2.9% | |
| Steel-Producers – 2.9% | |
| Russel Metals, Inc. | |
| 6.375% 03/01/14 | | | 6,410,000 | | | | 6,025,400 | | |
| Steel Dynamics, Inc. | |
| 7.750% 04/15/16 (a) | | | 6,535,000 | | | | 6,379,794 | | |
| United States Steel Corp. | |
| 7.000% 02/01/18 | | | 4,185,000 | | | | 4,097,450 | | |
| | | | 16,502,644 | | |
| Iron/Steel Total | | | 16,502,644 | | |
| | | Par ($) | | Value ($) | |
| Metals & Mining – 2.8% | |
| Diversified Minerals – 1.0% | |
| FMG Finance Ltd. | |
| 10.625% 09/01/16 (a) | | | 4,885,000 | | | | 5,471,200 | | |
| | | | 5,471,200 | | |
| Metal-Diversified – 1.8% | |
| Freeport-McMoRan Copper & Gold, Inc. | |
| 8.375% 04/01/17 | | | 9,810,000 | | | | 10,398,600 | | |
| | | | 10,398,600 | | |
| Metals & Mining Total | | | 15,869,800 | | |
| Basic Materials Total | | | 63,335,894 | | |
| Communications – 14.0% | |
| Media – 7.6% | |
| Broadcast Services/Programs – 0.7% | |
| Liberty Media LLC | |
| 8.250% 02/01/30 | | | 4,745,000 | | | | 4,010,175 | | |
| | | | 4,010,175 | | |
| Cable TV – 4.4% | |
| Charter Communications Holdings II LLC | |
| 10.250% 09/15/10 | | | 2,875,000 | | | | 2,760,000 | | |
| CSC Holdings, Inc. | |
| 7.625% 04/01/11 | | | 4,485,000 | | | | 4,507,425 | | |
| DirecTV Holdings LLC | |
| 6.375% 06/15/15 | | | 8,895,000 | | | | 8,383,537 | | |
| EchoStar DBS Corp. | |
| 6.625% 10/01/14 | | | 7,085,000 | | | | 6,518,200 | | |
| 7.000% 10/01/13 | | | 3,000,000 | | | | 2,850,000 | | |
| | | | 25,019,162 | | |
| Multimedia – 1.8% | |
| Lamar Media Corp. | |
| 7.250% 01/01/13 | | | 6,163,000 | | | | 5,854,850 | | |
| Quebecor Media, Inc. | |
| 7.750% 03/15/16 | | | 4,765,000 | | | | 4,479,100 | | |
| | | | 10,333,950 | | |
| Publishing-Periodicals – 0.7% | |
| Idearc, Inc. | |
| 8.000% 11/15/16 | | | 3,190,000 | | | | 1,443,475 | | |
| R.H. Donnelley Corp. | |
| 8.875% 10/15/17 | | | 5,550,000 | | | | 2,858,250 | | |
| | | | 4,301,725 | | |
| Media Total | | | 43,665,012 | | |
See Accompanying Notes to Financial Statements.
89
Columbia Conservative High Yield Fund
August 31, 2008
| Corporate Fixed-Income Bonds & Notes (continued) | |
| | | Par ($) | | Value ($) | |
| Telecommunication Services – 6.4% | |
| Satellite Telecommunications – 0.5% | |
| Intelsat Bermuda Ltd. | |
| 9.250% 06/15/16 (a) | | | 2,820,000 | | | | 2,791,800 | | |
| | | | 2,791,800 | | |
| Telecommunication Equipment – 0.9% | |
| Lucent Technologies, Inc. | |
| 6.450% 03/15/29 | | | 7,325,000 | | | | 5,090,875 | | |
| | | | 5,090,875 | | |
| Telecommunication Services – 0.5% | |
| Time Warner Telecom Holdings, Inc. | |
| 9.250% 02/15/14 | | | 3,090,000 | | | | 3,132,488 | | |
| | | | 3,132,488 | | |
| Telephone-Integrated – 4.5% | |
| Citizens Communications Co. | |
| 7.875% 01/15/27 | | | 6,775,000 | | | | 5,826,500 | | |
| Qwest Communications International, Inc. | |
| 7.500% 02/15/14 | | | 440,000 | | | | 400,400 | | |
| Qwest Corp. | |
| 7.500% 10/01/14 | | | 1,775,000 | | | | 1,646,312 | | |
| 8.875% 03/15/12 | | | 9,620,000 | | | | 9,692,150 | | |
| Windstream Corp. | |
| 7.000% 03/15/19 | | | 5,205,000 | | | | 4,554,375 | | |
| 8.625% 08/01/16 | | | 3,505,000 | | | | 3,469,950 | | |
| | | | 25,589,687 | | |
| Telecommunication Services Total | | | 36,604,850 | | |
| Communications Total | | | 80,269,862 | | |
| Consumer Cyclical – 9.4% | |
| Apparel – 0.6% | |
| Apparel Manufacturers – 0.6% | |
| Levi Strauss & Co. | |
| 9.750% 01/15/15 | | | 3,570,000 | | | | 3,217,462 | | |
| | | | 3,217,462 | | |
| Apparel Total | | | 3,217,462 | | |
| Auto Parts & Equipment – 1.7% | |
| Auto/Truck Parts & Equipment-Original – 0.9% | |
| ArvinMeritor, Inc. | |
| 8.125% 09/15/15 | | | 1,540,000 | | | | 1,278,200 | | |
| TRW Automotive, Inc. | |
| 7.000% 03/15/14 (a) | | | 4,305,000 | | | | 3,788,400 | | |
| | | | 5,066,600 | | |
| | | Par ($) | | Value ($) | |
| Auto/Truck Parts & Equipment-Replacement – 0.2% | |
| Commercial Vehicle Group, Inc. | |
| 8.000% 07/01/13 | | | 1,365,000 | | | | 1,180,725 | | |
| | | | 1,180,725 | | |
| Rubber-Tires – 0.6% | |
| Goodyear Tire & Rubber Co. | |
| 8.625% 12/01/11 | | | 1,055,000 | | | | 1,086,650 | | |
| 9.000% 07/01/15 | | | 2,256,000 | | | | 2,318,040 | | |
| | | | 3,404,690 | | |
| Auto Parts & Equipment Total | | | 9,652,015 | | |
| Entertainment – 0.8% | |
| Music – 0.8% | |
| Steinway Musical Instruments, Inc. | |
| 7.000% 03/01/14 (a) | | | 2,590,000 | | | | 2,318,050 | | |
| WMG Acquisition Corp. | |
| 7.375% 04/15/14 | | | 2,775,000 | | | | 2,192,250 | | |
| | | | 4,510,300 | | |
| Entertainment Total | | | 4,510,300 | | |
| Home Builders – 0.8% | |
| Building-Residential/Commercial – 0.8% | |
| KB Home | |
| 5.875% 01/15/15 | | | 5,425,000 | | | | 4,448,500 | | |
| | | | 4,448,500 | | |
| Home Builders Total | | | 4,448,500 | | |
| Leisure Time – 0.6% | |
| Cruise Lines – 0.6% | |
| Royal Caribbean Cruises Ltd. | |
| 6.875% 12/01/13 | | | 3,610,000 | | | | 3,181,313 | | |
| | | | 3,181,313 | | |
| Leisure Time Total | | | 3,181,313 | | |
| Lodging – 2.6% | |
| Casino Hotels – 1.3% | |
| MGM Mirage | |
| 7.500% 06/01/16 | | | 7,115,000 | | | | 5,798,725 | | |
| Pinnacle Entertainment, Inc. | |
| 7.500% 06/15/15 | | | 2,030,000 | | | | 1,573,250 | | |
| | | | 7,371,975 | | |
| Gambling (Non-Hotel) – 1.3% | |
| Mashantucket Western Pequot Tribe | |
| 8.500% 11/15/15 (a) | | | 5,135,000 | | | | 3,748,550 | | |
| Seminole Indian Tribe of Florida | |
| 7.804% 10/01/20 (a) | | | 4,105,000 | | | | 3,971,259 | | |
| | | | 7,719,809 | | |
| Lodging Total | | | 15,091,784 | | |
See Accompanying Notes to Financial Statements.
90
Columbia Conservative High Yield Fund
August 31, 2008
| Corporate Fixed-Income Bonds & Notes (continued) | |
| | | Par ($) | | Value ($) | |
| Retail – 1.8% | |
| Retail-Apparel/Shoe – 0.6% | |
| Phillips-Van Heusen Corp. | |
| 7.250% 02/15/11 | | | 3,455,000 | | | | 3,455,000 | | |
| | | | 3,455,000 | | |
| Retail-Automobiles – 0.4% | |
| AutoNation, Inc. | |
| 4.791% 04/15/13 (b) | | | 980,000 | | | | 808,500 | | |
| 7.000% 04/15/14 | | | 1,635,000 | | | | 1,414,275 | | |
| | | | 2,222,775 | | |
| Retail-Propane Distributors – 0.8% | |
| AmeriGas Partners LP | |
| 7.125% 05/20/16 | | | 4,380,000 | | | | 4,073,400 | | |
| 7.250% 05/20/15 | | | 835,000 | | | | 791,162 | | |
| | | | 4,864,562 | | |
| Retail Total | | | 10,542,337 | | |
| Textiles – 0.5% | |
| Textile-Products – 0.5% | |
| INVISTA | |
| 9.250% 05/01/12 (a) | | | 2,965,000 | | | | 2,946,469 | | |
| | | | 2,946,469 | | |
| Textiles Total | | | 2,946,469 | | |
| Consumer Cyclical Total | | | 53,590,180 | | |
| Consumer Non-Cyclical – 11.0% | |
| Agriculture – 0.6% | |
| Tobacco – 0.6% | |
| Reynolds American, Inc. | |
| 7.625% 06/01/16 | | | 3,440,000 | | | | 3,567,211 | | |
| | | | 3,567,211 | | |
| Agriculture Total | | | 3,567,211 | | |
| Beverages – 0.8% | |
| Beverages-Non-Alcoholic – 0.0% | |
| Cott Beverages, Inc. | |
| 8.000% 12/15/11 | | | 45,000 | | | | 37,800 | | |
| | | | 37,800 | | |
| Beverages-Wine/Spirits – 0.8% | |
| Constellation Brands, Inc. | |
| 8.125% 01/15/12 | | | 4,595,000 | | | | 4,595,000 | | |
| | | | 4,595,000 | | |
| Beverages Total | | | 4,632,800 | | |
| | | Par ($) | | Value ($) | |
| Biotechnology – 0.7% | |
| Medical-Biomedical/Gene – 0.7% | |
| Bio-Rad Laboratories, Inc. | |
| 7.500% 08/15/13 | | | 3,790,000 | | | | 3,790,000 | | |
| | | | 3,790,000 | | |
| Biotechnology Total | | | 3,790,000 | | |
| Commercial Services – 2.3% | |
| Commercial Services – 0.5% | |
| Iron Mountain, Inc. | |
| 8.000% 06/15/20 | | | 2,860,000 | | | | 2,781,350 | | |
| | | | 2,781,350 | | |
| Funeral Services & Related Items – 0.6% | |
| Service Corp. International | |
| 6.750% 04/01/16 | | | 700,000 | | | | 644,000 | | |
| 7.375% 10/01/14 | | | 2,750,000 | | | | 2,681,250 | | |
| | | | 3,325,250 | | |
| Private Corrections – 1.2% | |
| Corrections Corp. of America | |
| 7.500% 05/01/11 | | | 7,105,000 | | | | 7,158,288 | | |
| | | | 7,158,288 | | |
| Commercial Services Total | | | 13,264,888 | | |
| Food – 1.1% | |
| Food-Dairy Products – 0.3% | |
| Dean Foods Co. | |
| 7.000% 06/01/16 | | | 1,740,000 | | | | 1,609,500 | | |
| | | | 1,609,500 | | |
| Food-Meat Products – 0.4% | |
| Smithfield Foods, Inc. | |
| 7.750% 07/01/17 | | | 2,790,000 | | | | 2,497,050 | | |
| | | | 2,497,050 | | |
| Food-Miscellaneous/Diversified – 0.4% | |
| Del Monte Corp. | |
| 6.750% 02/15/15 | | | 2,135,000 | | | | 2,006,900 | | |
| | | | 2,006,900 | | |
| Food Total | | | 6,113,450 | | |
| Healthcare Products – 0.7% | |
| Medical Products – 0.7% | |
| Biomet, Inc. | |
| PIK, | |
| 10.375% 10/15/17 | | | 3,625,000 | | | | 3,806,250 | | |
| | | | 3,806,250 | | |
| Healthcare Products Total | | | 3,806,250 | | |
See Accompanying Notes to Financial Statements.
91
Columbia Conservative High Yield Fund
August 31, 2008
| Corporate Fixed-Income Bonds & Notes (continued) | |
| | | Par ($) | | Value ($) | |
| Healthcare Services – 3.1% | |
| Medical-Hospitals – 3.1% | |
| Community Health Systems, Inc. | |
| 8.875% 07/15/15 | | | 1,575,000 | | | | 1,590,750 | | |
| HCA, Inc. | |
| 9.250% 11/15/16 | | | 3,850,000 | | | | 3,960,687 | | |
| PIK, | |
| 9.625% 11/15/16 | | | 12,380,000 | | | | 12,488,325 | | |
| | | | 18,039,762 | | |
| Healthcare Services Total | | | 18,039,762 | | |
| Household Products/Wares – 0.5% | |
| Consumer Products-Miscellaneous – 0.5% | |
| American Greetings Corp. | |
| 7.375% 06/01/16 | | | 2,965,000 | | | | 2,816,750 | | |
| | | | 2,816,750 | | |
| Household Products/Wares Total | | | 2,816,750 | | |
| Pharmaceuticals – 1.2% | |
| Medical-Drugs – 0.5% | |
| Elan Finance PLC | |
| 8.875% 12/01/13 | | | 3,285,000 | | | | 2,915,438 | | |
| | | | 2,915,438 | | |
| Pharmacy Services – 0.7% | |
| Omnicare, Inc. | |
| 6.750% 12/15/13 | | | 4,380,000 | | | | 4,106,250 | | |
| | | | 4,106,250 | | |
| Pharmaceuticals Total | | | 7,021,688 | | |
| Consumer Non-Cyclical Total | | | 63,052,799 | | |
| Energy – 15.2% | |
| Coal – 1.5% | |
| Arch Western Finance LLC | |
| 6.750% 07/01/13 | | | 5,850,000 | | | | 5,835,375 | | |
| Massey Energy Co. | |
| 6.875% 12/15/13 | | | 2,690,000 | | | | 2,629,475 | | |
| | | | 8,464,850 | | |
| Coal Total | | | 8,464,850 | | |
| Oil & Gas – 9.3% | |
| Oil & Gas Drilling – 0.9% | |
| Pride International, Inc. | |
| 7.375% 07/15/14 | | | 4,870,000 | | | | 4,943,050 | | |
| | | | 4,943,050 | | |
| | | Par ($) | | Value ($) | |
| Oil Companies-Exploration & Production – 7.8% | |
| Chesapeake Energy Corp. | |
| 6.375% 06/15/15 | | | 9,810,000 | | | | 9,123,300 | | |
| Cimarex Energy Co. | |
| 7.125% 05/01/17 | | | 2,730,000 | | | | 2,661,750 | | |
| Compton Petroleum Corp. | |
| 7.625% 12/01/13 | | | 3,850,000 | | | | 3,614,187 | | |
| KCS Energy, Inc. | |
| 7.125% 04/01/12 | | | 2,755,000 | | | | 2,603,475 | | |
| Newfield Exploration Co. | |
| 6.625% 09/01/14 | | | 6,095,000 | | | | 5,736,919 | | |
| OPTI Canada, Inc. | |
| 8.250% 12/15/14 | | | 6,310,000 | | | | 6,302,112 | | |
| PetroHawk Energy Corp. | |
| 7.875% 06/01/15 (a) | | | 1,860,000 | | | | 1,734,450 | | |
| Pioneer Natural Resources Co. | |
| 5.875% 07/15/16 | | | 3,330,000 | | | | 2,919,944 | | |
| Quicksilver Resources, Inc. | |
| 7.125% 04/01/16 | | | 4,770,000 | | | | 4,149,900 | | |
| Range Resources Corp. | |
| 7.500% 05/15/16 | | | 2,625,000 | | | | 2,598,750 | | |
| Southwestern Energy Co. | |
| 7.500% 02/01/18 (a) | | | 3,180,000 | | | | 3,251,550 | | |
| | | | 44,696,337 | | |
| Oil Refining & Marketing – 0.6% | |
| Tesoro Corp. | |
| 6.625% 11/01/15 | | | 4,350,000 | | | | 3,773,625 | | |
| | | | 3,773,625 | | |
| Oil & Gas Total | | | 53,413,012 | | |
| Pipelines – 4.4% | |
| Atlas Pipeline Partners LP | |
| 8.125% 12/15/15 | | | 3,700,000 | | | | 3,533,500 | | |
| Colorado Interstate Gas Co. | |
| 6.800% 11/15/15 | | | 1,342,000 | | | | 1,355,935 | | |
| El Paso Corp. | |
| 6.875% 06/15/14 | | | 1,750,000 | | | | 1,733,615 | | |
| 7.250% 06/01/18 | | | 2,640,000 | | | | 2,593,800 | | |
| El Paso Performance-Linked Trust | |
| 7.750% 07/15/11 (a) | | | 6,175,000 | | | | 6,242,913 | | |
| Kinder Morgan Finance Co. ULC | |
| 5.700% 01/05/16 | | | 4,200,000 | | | | 3,890,250 | | |
| MarkWest Energy Partners LP | |
| 6.875% 11/01/14 | | | 5,900,000 | | | | 5,546,000 | | |
| | | | 24,896,013 | | |
| Pipelines Total | | | 24,896,013 | | |
| Energy Total | | | 86,773,875 | | |
See Accompanying Notes to Financial Statements.
92
Columbia Conservative High Yield Fund
August 31, 2008
| Corporate Fixed-Income Bonds & Notes (continued) | |
| | | Par ($) | | Value ($) | |
| Financials – 3.7% | |
| Capital Markets – 0.8% | |
| Investment Management/Advisor Service – 0.8% | |
| Nuveen Investments (Term Loan) | |
| 5.469% 11/13/14 (b)(c) | | | 2,591,793 | | | | 2,393,521 | | |
| 5.472% 11/13/14 (b)(c) | | | 2,267,819 | | | | 2,094,330 | | |
| Nuveen Investments (Term Loan II) | |
| 5.469% 11/15/14 (b)(c) | | | 127,889 | | | | 118,105 | | |
| | | | 4,605,956 | | |
| Capital Markets Total | | | 4,605,956 | | |
| Diversified Financial Services – 1.6% | |
| Finance-Auto Loans – 0.7% | |
| GMAC LLC | |
| 8.000% 11/01/31 | | | 7,220,000 | | | | 3,894,100 | | |
| | | | 3,894,100 | | |
| Finance-Investment Banker/Broker – 0.5% | |
| E*Trade Financial Corp. | |
| 7.375% 09/15/13 | | | 3,185,000 | | | | 2,723,175 | | |
| | | | 2,723,175 | | |
| Special Purpose Entity – 0.4% | |
| Goldman Sachs Capital II | |
| 5.793% 12/29/49 (b) | | | 4,060,000 | | | | 2,516,347 | | |
| | | | 2,516,347 | | |
| Diversified Financial Services Total | | | 9,133,622 | | |
| Insurance – 0.5% | |
| Property/Casualty Insurance – 0.5% | |
| Crum & Forster Holdings Corp. | |
| 7.750% 05/01/17 | | | 3,145,000 | | | | 2,885,538 | | |
| | | | 2,885,538 | | |
| Insurance Total | | | 2,885,538 | | |
| Real Estate Investment Trusts (REITs) – 0.8% | |
| REITS-Hotels – 0.8% | |
| Host Marriott LP | |
| 6.375% 03/15/15 | | | 5,485,000 | | | | 4,771,950 | | |
| | | | 4,771,950 | | |
| Real Estate Investment Trusts (REITs) Total | | | 4,771,950 | | |
| Financials Total | | | 21,397,066 | | |
| Industrial – 17.0% | |
| Aerospace & Defense – 2.5% | |
| Aerospace/Defense-Equipment – 1.1% | |
| BE Aerospace, Inc. | |
| 8.500% 07/01/18 | | | 1,745,000 | | | | 1,819,162 | | |
| | | Par ($) | | Value ($) | |
| DRS Technologies, Inc. | |
| 6.625% 02/01/16 | | | 4,385,000 | | | | 4,516,550 | | |
| | | | 6,335,712 | | |
| Electronics-Military – 1.4% | |
| L-3 Communications Corp. | |
| 5.875% 01/15/15 | | | 4,340,000 | | | | 4,090,450 | | |
| 6.375% 10/15/15 | | | 4,190,000 | | | | 4,011,925 | | |
| | | | 8,102,375 | | |
| Aerospace & Defense Total | | | 14,438,087 | | |
| Electrical Components & Equipment – 1.2% | |
| Wire & Cable Products – 1.2% | |
| Belden, Inc. | |
| 7.000% 03/15/17 | | | 3,855,000 | | | | 3,642,975 | | |
| General Cable Corp. | |
| 5.166% 04/01/15 (b) | | | 1,535,000 | | | | 1,327,775 | | |
| 7.125% 04/01/17 | | | 1,870,000 | | | | 1,776,500 | | |
| | | | 6,747,250 | | |
| Electrical Components & Equipment Total | | | 6,747,250 | | |
| Electronics – 0.5% | |
| Electronic Components-Miscellaneous – 0.5% | |
| Flextronics International Ltd. | |
| 5.038% 10/01/14 (b)(c) | | | 43,067 | | | | 39,070 | | |
| 5.041% 10/01/14 (b)(c) | | | 276,088 | | | | 250,464 | | |
| 5.041% 10/01/14 (b)(c) | | | 15,306 | | | | 13,885 | | |
| 5.041% 10/01/14 (b)(c) | | | 902,414 | | | | 818,659 | | |
| 6.250% 11/15/14 | | | 1,260,000 | | | | 1,162,350 | | |
| Flextronics International Ltd. (Term Loan) | |
| 5.038% 10/01/14 (b)(c) | | | 35,307 | | | | 32,030 | | |
| 5.041% 10/01/14 (b)(c) | | | 166,992 | | | | 151,493 | | |
| 5.041% 10/01/14 (b)(c) | | | 545,826 | | | | 495,167 | | |
| | | | 2,963,118 | | |
| Electronics Total | | | 2,963,118 | | |
| Environmental Control – 1.6% | |
| Non-Hazardous Waste Disposal – 1.6% | |
| Allied Waste North America, Inc. | |
| 7.125% 05/15/16 | | | 8,795,000 | | | | 8,882,950 | | |
| | | | 8,882,950 | | |
| Environmental Control Total | | | 8,882,950 | | |
| Machinery-Construction & Mining – 1.1% | |
| Machinery-Construction & Mining – 1.1% | |
| Terex Corp. | |
| 8.000% 11/15/17 | | | 6,285,000 | | | | 6,206,438 | | |
| | | | 6,206,438 | | |
| Machinery-Construction & Mining Total | | | 6,206,438 | | |
See Accompanying Notes to Financial Statements.
93
Columbia Conservative High Yield Fund
August 31, 2008
| Corporate Fixed-Income Bonds & Notes (continued) | |
| | | Par ($) | | Value ($) | |
| Machinery-Diversified – 1.5% | |
| Machinery-General Industry – 1.5% | |
| Manitowoc Co., Inc. | |
| 7.125% 11/01/13 | | | 3,445,000 | | | | 3,221,075 | | |
| Westinghouse Air Brake Technologies Corp. | |
| 6.875% 07/31/13 | | | 5,565,000 | | | | 5,565,000 | | |
| | | | 8,786,075 | | |
| Machinery-Diversified Total | | | 8,786,075 | | |
| Miscellaneous Manufacturing – 2.3% | |
| Diversified Manufacturing Operators – 1.8% | |
| Bombardier, Inc. | |
| 6.300% 05/01/14 (a) | | | 6,415,000 | | | | 6,158,400 | | |
| Koppers Holdings, Inc. | |
| (d) 11/15/14 | |
| (9.875% 11/15/09) | | | 980,000 | | | | 872,200 | | |
| Trinity Industries, Inc. | |
| 6.500% 03/15/14 | | | 3,385,000 | | | | 3,249,600 | | |
| | | | 10,280,200 | | |
| Miscellaneous Manufacturing – 0.5% | |
| American Railcar Industries, Inc. | |
| 7.500% 03/01/14 | | | 3,335,000 | | | | 3,084,875 | | |
| | | | 3,084,875 | | |
| Miscellaneous Manufacturing Total | | | 13,365,075 | | |
| Packaging & Containers – 2.5% | |
| Containers-Metal/Glass – 2.5% | |
| Crown Americas LLC & Crown Americas Capital Corp. | |
| 7.750% 11/15/15 | | | 4,715,000 | | | | 4,832,875 | | |
| Owens-Illinois, Inc. | |
| 7.500% 05/15/10 | | | 4,555,000 | | | | 4,657,488 | | |
| Silgan Holdings, Inc. | |
| 6.750% 11/15/13 | | | 5,050,000 | | | | 4,747,000 | | |
| | | | 14,237,363 | | |
| Packaging & Containers Total | | | 14,237,363 | | |
| Transportation – 3.8% | |
| Transportation-Marine – 2.5% | |
| Navios Maritime Holdings, Inc. | |
| 9.500% 12/15/14 | | | 2,915,000 | | | | 2,783,825 | | |
| Stena AB | |
| 7.500% 11/01/13 | | | 4,930,000 | | | | 4,806,750 | | |
| Teekay Corp. | |
| 8.875% 07/15/11 | | | 6,296,000 | | | | 6,539,970 | | |
| | | | 14,130,545 | | |
| Transportation-Railroad – 0.5% | |
| Kansas City Southern de Mexico SA de CV | |
| 7.375% 06/01/14 | | | 2,780,000 | | | | 2,710,500 | | |
| | | | 2,710,500 | | |
| | | Par ($) | | Value ($) | |
| Transportation-Services – 0.8% | |
| Bristow Group, Inc. | |
| 6.125% 06/15/13 | | | 805,000 | | | | 756,700 | | |
| 7.500% 09/15/17 | | | 3,500,000 | | | | 3,360,000 | | |
| CHC Helicopter Corp. | |
| 7.375% 05/01/14 | | | 695,000 | | | | 722,800 | | |
| | | | 4,839,500 | | |
| Transportation Total | | | 21,680,545 | | |
| Industrial Total | | | 97,306,901 | | |
| Technology – 0.6% | |
| Semiconductors – 0.6% | |
| Electronic Components-Semiconductors – 0.6% | |
| Freescale Semiconductor, Inc. | |
PIK,
9.125% 12/15/14 | | | 4,620,000 | | | | 3,603,600 | | |
| | | | 3,603,600 | | |
| Semiconductors Total | | | 3,603,600 | | |
| Technology Total | | | 3,603,600 | | |
| Utilities – 11.0% | |
| Electric – 11.0% | |
| Electric-Generation – 4.3% | |
| AES Corp. | |
| 7.750% 03/01/14 | | | 3,790,000 | | | | 3,771,050 | | |
| 8.000% 10/15/17 | | | 3,135,000 | | | | 3,087,975 | | |
| Edison Mission Energy | |
| 7.000% 05/15/17 | | | 11,040,000 | | | | 10,570,800 | | |
| Intergen NV | |
| 9.000% 06/30/17 (a) | | | 7,210,000 | | | | 7,354,200 | | |
| | | | 24,784,025 | | |
| Electric-Integrated – 2.4% | |
| CMS Energy Corp. | |
| 6.875% 12/15/15 | | | 2,640,000 | | | | 2,589,600 | | |
| Ipalco Enterprises, Inc. | |
| 7.250% 04/01/16 (a) | | | 3,560,000 | | | | 3,568,900 | | |
| TXU Energy Co. LLC | |
| 5.961% 10/10/14 (b)(c) | | | 482,857 | | | | 449,996 | | |
| 6.234% 10/10/14 (b)(c) | | | 2,925,714 | | | | 2,726,602 | | |
| 6.478% 10/10/14 (b)(c) | | | 1,008,096 | | | | 939,488 | | |
PIK,
6.234% 10/10/ 14 (b)(c) | | | 3,523,333 | | | | 3,276,700 | | |
| | | | 13,551,286 | | |
See Accompanying Notes to Financial Statements.
94
Columbia Conservative High Yield Fund
August 31, 2008
| Corporate Fixed-Income Bonds & Notes (continued) | |
| | | Par ($) | | Value ($) | |
| Independent Power Producer – 4.3% | |
| Dynegy Holdings, Inc. | |
| 7.125% 05/15/18 | | | 5,905,000 | | | | 5,137,350 | | |
| Mirant North America LLC | |
| 7.375% 12/31/13 | | | 6,425,000 | | | | 6,376,812 | | |
| NRG Energy, Inc. | |
| 7.250% 02/01/14 | | | 2,545,000 | | | | 2,510,006 | | |
| 7.375% 02/01/16 | | | 2,750,000 | | | | 2,715,625 | | |
| 7.375% 01/15/17 | | | 1,735,000 | | | | 1,695,963 | | |
| NSG Holdings LLC/NSG Holdings, Inc. | |
| 7.750% 12/15/25 (a) | | | 5,270,000 | | | | 5,059,200 | | |
| Reliant Energy, Inc. | |
| 7.875% 06/15/17 | | | 1,410,000 | | | | 1,360,650 | | |
| | | | 24,855,606 | | |
| Electric Total | | | 63,190,917 | | |
| Utilities Total | | | 63,190,917 | | |
Total Corporate Fixed-Income Bonds & Notes
(cost of $568,166,083) | | | 532,521,094 | | |
| Municipal Bond – 0.5% | |
| Virginia – 0.5% | |
| VA Tobacco Settlement Financing Corp. | |
| Series 2007 A1, | |
| 6.706% 06/01/46 | | | 3,635,000 | | | | 2,863,290 | | |
| Virginia Total | | | 2,863,290 | | |
Total Municipal Bond
(cost of $3,634,639) | | | 2,863,290 | | |
| Short-Term Obligation – 5.1% | |
Repurchase agreement with
Fixed Income Clearing Corp.,
dated 08/29/08, due 09/02/08
at 2.000%, collateralized by a
U.S. Government Agency
Obligation maturing
05/06/10, market value
$29,660,824 (repurchase
pr oceeds $29,085,462) | | | 29,079,000 | | | | 29,079,000 | | |
Total Short-Term Obligation
(cost of $29,079,000) | | | 29,079,000 | | |
Total Investments – 98.6%
(cost of $600,879,722) (e) | | | 564,463,384 | | |
| Other Assets & Liabilities, Net – 1.4% | | | 8,253,756 | | |
| Net Assets – 100.0% | | | 572,717,140 | | |
Notes to Investment Portfolio:
(a) Security exempt from registration pursuant to Rule 144A under the Securities Act of 1933. These securities may be resold in transactions exempt from registration, normally to qualified institutional buyers. At August 31, 2008, these securities, which are not illiquid except for the following, amounted to $71,989,623, which represents 12.6% of net assets.
| Security | | Acquisition
Dates | | Par | | Cost | | Value | |
| Seminole Indian | | | | | | | |
| |
| Tribe of Florida | | 09/26/07– | | | | | |
| |
| 7.804% 10/01/20 | | 10/04/07 | | $ | 4,105,000 | | | $ | 4,167,863 | | | $ | 3,971,259 | | |
(b) The interest rate shown on floating rate or variable rate securities reflects the rate at August 31, 2008.
(c) Loan participation agreement.
(d) Step bond. This security is currently not paying coupon. Shown parenthetically is the next coupon rate to be paid and the date the security will begin accruing at this rate.
(e) Cost for federal income tax purposes is $602,542,679.
At August 31, 2008, the asset allocation of the Fund is as follows:
| Asset Allocation (Unaudited) | | % of
Net Assets | |
| Industrial | | | 17.0 | | |
| Energy | | | 15.2 | | |
| Communications | | | 14.0 | | |
| Basic Materials | | | 11.1 | | |
| Utilities | | | 11.0 | | |
| Consumer Non-Cyclical | | | 11.0 | | |
| Consumer Cyclical | | | 9.4 | | |
| Financials | | | 3.7 | | |
| Technology | | | 0.6 | | |
| Municipal Bond | | | 0.5 | | |
| | | | 93.5 | | |
| Short-Term Obligation | | | 5.1 | | |
| Other Assets & Liabilities, Net | | | 1.4 | | |
| | | | 100.0 | | |
Forward foreign currency exchange contract outstanding on August 31, 2008:
Forward
Currency
Contract
to Sell | | Value | | Aggregate
Face Value | | Settlement
Date | | Unrealized
Depreciation | |
| EUR | $ | | | | 2,475,590 | | | $ | 2,473,315 | | | | 09/29/08 | | | $ | (2,275 | ) | |
| Acronym | | Name | |
| | EUR | | | Euro | |
|
| | PIK | | | Payment-In-Kind | |
|
See Accompanying Notes to Financial Statements.
95
Statements of Assets and Liabilities – Columbia Funds
August 31, 2008
| | | ($) | | ($) | | ($) | | ($) | | ($) | |
| | | Columbia
International
Stock Fund | | Columbia
Mid Cap
Growth Fund | | Columbia
Small Cap
Growth Fund I | | Columbia
Real Estate
Equity Fund | | Columbia
Technology Fund | |
| Assets | |
| Investments, at identified cost | | | 894,288,341 | | | | 1,225,190,132 | | | | 371,669,774 | | | | 258,288,359 | | | | 392,065,103 | | |
| Investments, at value | | | 891,419,964 | | | | 1,399,967,798 | | | | 416,951,025 | | | | 318,214,709 | | | | 413,445,977 | | |
| Cash | | | 591 | | | | 367 | | | | 907 | | | | 505 | | | | 239 | | |
Foreign currency (cost of $506,522, $—, $—, $—, $—,
$522,991, $—, $— and $—, respectively) | | | 506,490 | | | | — | | | | — | | | | — | | | | — | | |
| Unrealized appreciation on forward foreign currency exchange contracts | | | 7,297,653 | | | | — | | | | — | | | | — | | | | — | | |
| Receivable for: | |
| Investments sold | | | 15,741,970 | | | | 7,973,199 | | | | — | | | | — | | | | 1,440,779 | | |
| Capital stock sold | | | 501,403 | | | | 1,527,941 | | | | 3,927,306 | | | | 604,556 | | | | 1,494,805 | | |
| Interest | | | 574 | | | | 2,216 | | | | 4,131 | | | | 1,879 | | | | 3,894 | | |
| Dividends | | | 1,830,449 | | | | 946,736 | | | | 137,549 | | | | 263,237 | | | | 86,706 | | |
| Futures variation margin | | | — | | | | — | | | | — | | | | — | | | | — | | |
| Foreign tax reclaims | | | 1,169,995 | | | | 8,677 | | | | — | | | | — | | | | 4,339 | | |
| Expense reimbursement due from investment advisor | | | — | | | | — | | | | — | | | | — | | | | — | | |
| Trustees' deferred compensation plan | | | 117,225 | | | | 67,392 | | | | 21,010 | | | | 38,802 | | | | 16,350 | | |
| Other assets | | | 8,414 | | | | 9,725 | | | | 1,495 | | | | 6,090 | | | | 1,794 | | |
| Total Assets | | | 918,594,728 | | | | 1,410,504,051 | | | | 421,043,423 | | | | 319,129,778 | | | | 416,494,883 | | |
| Liabilities | |
| Unrealized depreciation on forward foreign currency exchange contracts | | | 12,239,313 | | | | — | | | | — | | | | — | | | | — | | |
Written options at value (premium $153,683, $128,030, $—, $—,
$—, $—, $—, $— and $—, respectively) | | | 16,592 | | | | 107,730 | | | | — | | | | — | | | | — | | |
| Payable for: | |
| Investments purchased | | | 15,555,839 | | | | — | | | | 10,799,669 | | | | — | | | | 14,014,602 | | |
| Investments purchased on a delayed delivery basis | | | — | | | | — | | | | — | | | | — | | | | — | | |
| Capital stock redeemed | | | 526,332 | | | | 725,255 | | | | 178,501 | | | | 264,388 | | | | 553,571 | | |
| Distributions | | | — | | | | — | | | | — | | | | — | | | | — | | |
| Investment advisory fee | | | 654,539 | | | | 912,496 | | | | 291,865 | | | | 201,359 | | | | 291,187 | | |
| Administration fee | | | — | | | | — | | | | — | | | | — | | | | — | | |
| Transfer agent fee | | | 168,728 | | | | 273,173 | | | | 121,036 | | | | 154,978 | | | | 124,855 | | |
| Pricing and bookkeeping fees | | | 13,611 | | | | 12,505 | | | | 8,583 | | | | 7,725 | | | | 8,965 | | |
| Merger costs | | | — | | | | — | | | | — | | | | 48,043 | | | | — | | |
| Trustees' fees | | | 270 | | | | 55,773 | | | | 270 | | | | 270 | | | | 3,620 | | |
| Audit fee | | | 45,656 | | | | 43,695 | | | | 39,647 | | | | 38,137 | | | | 24,174 | | |
| Distribution and service fees | | | 77,207 | | | | 45,646 | | | | 17,628 | | | | 16,093 | | | | 75,365 | | |
| Custody fee | | | 75,985 | | | | 7,270 | | | | 4,050 | | | | 1,900 | | | | 7,184 | | |
| Reports to shareholders | | | 78,097 | | | | 62,497 | | | | 21,998 | | | | 29,998 | | | | 7,379 | | |
| Interest expense | | | 67 | | | | — | | | | — | | | | — | | | | — | | |
| Chief compliance officer expenses | | | 164 | | | | 188 | | | | 121 | | | | 120 | | | | 194 | | |
| Trustees' deferred compensation plan | | | 117,225 | | | | 67,392 | | | | 21,010 | | | | 38,802 | | | | 16,350 | | |
| Other liabilities | | | 22,168 | | | | 25,927 | | | | 15,741 | | | | 128,592 | | | | 24,610 | | |
| Total Liabilities | | | 29,591,793 | | | | 2,339,547 | | | | 11,520,119 | | | | 930,405 | | | | 15,152,056 | | |
| Net Assets | | | 889,002,935 | | | | 1,408,164,504 | | | | 409,523,304 | | | | 318,199,373 | | | | 401,342,827 | | |
| Net Assets Consist of | |
| Paid-in capital | | | 925,121,283 | | | | 1,215,333,222 | | | | 376,677,394 | | | | 240,640,105 | | | | 426,375,923 | | |
| Undistributed (Overdistributed) net investment income | | | 2,368,803 | | | | — | | | | — | | | | 1,348,655 | | | | — | | |
| Accumulated net investment loss | | | — | | | | (63,002 | ) | | | (33,301 | ) | | | — | | | | (18,676 | ) | |
| Accumulated net realized gain (loss) | | | (30,758,246 | ) | | | 18,096,777 | | | | (12,402,040 | ) | | | 16,284,536 | | | | (46,395,064 | ) | |
| Unrealized appreciation (depreciation) on: | |
| Investments | | | (2,868,377 | ) | | | 174,777,666 | | | | 45,281,251 | | | | 59,926,350 | | | | 21,380,874 | | |
| Foreign currency translations | | | (4,997,619 | ) | | | (459 | ) | | | — | | | | (273 | ) | | | (230 | ) | |
| Futures contracts | | | — | | | | — | | | | — | | | | — | | | | — | | |
| Written options | | | 137,091 | | | | 20,300 | | | | — | | | | — | | | | — | | |
| Net Assets | | | 889,002,935 | | | | 1,408,164,504 | | | | 409,523,304 | | | | 318,199,373 | | | | 401,342,827 | | |
See Accompanying Notes to Financial Statements.
96
| | | ($) | | ($) | | ($) | | ($) | |
| | | Columbia
Strategic
Investor Fund | | Columbia
Balanced Fund | | Columbia
Intermediate
Municipal
Bond Fund | | Oregon
Columbia
Conservative
High Yield Fund | |
| Assets | |
| Investments, at identified cost | | | 898,606,775 | | | | 182,217,956 | | | | 386,415,244 | | | | 600,879,722 | | |
| Investments, at value | | | 1,057,701,895 | | | | 197,171,370 | | | | 395,794,865 | | | | 564,463,384 | | |
| Cash | | | 1,071,700 | | | | 745 | | | | 85,470 | | | | 12,380 | | |
Foreign currency (cost of $506,522, $—, $—, $—, $—,
$522,991, $—, $— and $—, respectively) | | | 523,114 | | | | — | | | | — | | | | — | | |
| Unrealized appreciation on forward foreign currency exchange contracts | | | — | | | | — | | | | — | | | | — | | |
| Receivable for: | |
| Investments sold | | | 10,413,408 | | | | 940,783 | | | | — | | | | — | | |
| Capital stock sold | | | 318,222 | | | | 2,960,441 | | | | 378,967 | | | | 145,916 | | |
| Interest | | | 1,104 | | | | 642,264 | | | | 4,553,720 | | | | 11,643,414 | | |
| Dividends | | | 1,347,991 | | | | 166,489 | | | | — | | | | — | | |
| Futures variation margin | | | — | | | | 2,344 | | | | — | | | | — | | |
| Foreign tax reclaims | | | 26,193 | | | | — | | | | — | | | | — | | |
| Expense reimbursement due from investment advisor | | | 73,161 | | | | — | | | | 18,335 | | | | — | | |
| Trustees' deferred compensation plan | | | 84,969 | | | | 22,369 | | | | 27,090 | | | | 62,235 | | |
| Other assets | | | 7,469 | | | | 1,305 | | | | 2,307 | | | | 4,933 | | |
| Total Assets | | | 1,071,569,226 | | | | 201,908,110 | | | | 400,860,754 | | | | 576,332,262 | | |
| Liabilities | |
| Unrealized depreciation on forward foreign currency exchange contracts | | | — | | | | — | | | | — | | | | 2,275 | | |
Written options at value (premium $153,683, $128,030, $—, $—,
$—, $—, $—, $— and $—, respectively) | | | — | | | | — | | | | — | | | | — | | |
| Payable for: | |
| Investments purchased | | | 11,800,463 | | | | 1,333,385 | | | | — | | | | — | | |
| Investments purchased on a delayed delivery basis | | | — | | | | 2,478,080 | | | | — | | | | — | | |
| Capital stock redeemed | | | 1,035,400 | | | | 254,205 | | | | 369,223 | | | | 851,006 | | |
| Distributions | | | — | | | | 9 | | | | 365,217 | | | | 1,896,033 | | |
| Investment advisory fee | | | 512,239 | | | | 84,386 | | | | 167,932 | | | | 301,176 | | |
| Administration fee | | | 133,353 | | | | — | | | | — | | | | — | | |
| Transfer agent fee | | | 352,376 | | | | 35,486 | | | | 48,185 | | | | 199,891 | | |
| Pricing and bookkeeping fees | | | 12,591 | | | | 8,543 | | | | 12,823 | | | | 13,755 | | |
| Merger costs | | | — | | | | — | | | | — | | | | — | | |
| Trustees' fees | | | 270 | | | | 3,853 | | | | 270 | | | | 12,917 | | |
| Audit fee | | | 41,300 | | | | 39,804 | | | | 41,700 | | | | 44,342 | | |
| Distribution and service fees | | | 112,880 | | | | 11,796 | | | | 6,798 | | | | 71,641 | | |
| Custody fee | | | 13,313 | | | | 3,729 | | | | 2,367 | | | | 3,434 | | |
| Reports to shareholders | | | 244,300 | | | | 21,600 | | | | 10,697 | | | | 90,777 | | |
| Interest expense | | | — | | | | — | | | | — | | | | — | | |
| Chief compliance officer expenses | | | 168 | | | | 133 | | | | 123 | | | | 152 | | |
| Trustees' deferred compensation plan | | | 84,969 | | | | 22,369 | | | | 27,090 | | | | 62,235 | | |
| Other liabilities | | | 22,715 | | | | 25,696 | | | | 19,162 | | | | 65,488 | | |
| Total Liabilities | | | 14,366,337 | | | | 4,323,074 | | | | 1,071,587 | | | | 3,615,122 | | |
| Net Assets | | | 1,057,202,889 | | | | 197,585,036 | | | | 399,789,167 | | | | 572,717,140 | | |
| Net Assets Consist of | |
| Paid-in capital | | | 970,366,142 | | | | 182,670,442 | | | | 390,318,469 | | | | 681,995,821 | | |
| Undistributed (Overdistributed) net investment income | | | 2,664,833 | | | | 887,913 | | | | 119,582 | | | | — | | |
| Accumulated net investment loss | | | — | | | | — | | | | — | | | | (1,361,166 | ) | |
| Accumulated net realized gain (loss) | | | (74,917,030 | ) | | | (927,433 | ) | | | (28,505 | ) | | | (71,495,673 | ) | |
| Unrealized appreciation (depreciation) on: | |
| Investments | | | 159,095,120 | | | | 14,953,414 | | | | 9,379,621 | | | | (36,416,338 | ) | |
| Foreign currency translations | | | (6,176 | ) | | | — | | | | — | | | | (5,504 | ) | |
| Futures contracts | | | — | | | | 700 | | | | — | | | | — | | |
| Written options | | | — | | | | — | | | | — | | | | — | | |
| Net Assets | | | 1,057,202,889 | | | | 197,585,036 | | | | 399,789,167 | | | | 572,717,140 | | |
See Accompanying Notes to Financial Statements.
97
Statements of Assets and Liabilities (continued) – Columbia Funds
August 31, 2008
| | | Columbia
International
Stock Fund | | Columbia
Mid Cap
Growth Fund | | Columbia
Small Cap
Growth Fund I | | Columbia
Real Estate
Equity Fund | | Columbia
Technology Fund | |
| Class A | |
| Net assets | | $ | 218,484,379 | | | $ | 63,336,916 | | | $ | 44,184,151 | | | $ | 22,320,968 | | | $ | 137,181,160 | | |
| Shares outstanding | | | 15,587,117 | | | | 2,698,878 | | | | 1,588,315 | | | | 1,611,351 | | | | 14,109,894 | | |
| Net asset value per share (a)(b) | | $ | 14.02 | | | $ | 23.47 | | | $ | 27.82 | | | $ | 13.85 | | | $ | 9.72 | | |
| Maximum sales charge | | | 5.75 | % | | | 5.75 | % | | | 5.75 | % | | | 5.75 | % | | | 5.75 | % | |
| Maximum offering price per share (c) | | $ | 14.88 | | | $ | 24.90 | | | $ | 29.52 | | | $ | 14.69 | | | $ | 10.31 | | |
| Class B | |
| Net assets | | $ | 13,580,072 | | | $ | 15,829,287 | | | $ | 2,812,275 | | | $ | 7,123,301 | | | $ | 10,812,419 | | |
| Shares outstanding | | | 998,131 | | | | 708,278 | | | | 102,674 | | | | 514,165 | | | | 1,152,094 | | |
| Net asset value and offering price per share (a)(b) | | $ | 13.61 | | | $ | 22.35 | | | $ | 27.39 | | | $ | 13.85 | | | $ | 9.39 | | |
| Class C | |
| Net assets | | $ | 19,946,039 | | | $ | 13,540,038 | | | $ | 8,381,702 | | | $ | 6,461,795 | | | $ | 44,465,931 | | |
| Shares outstanding | | | 1,458,572 | | | | 604,175 | | | | 306,210 | | | | 467,426 | | | | 4,724,876 | | |
| Net asset value and offering price per share (a)(b) | | $ | 13.68 | | | $ | 22.41 | | | $ | 27.37 | | | $ | 13.82 | | | $ | 9.41 | | |
| Class R | |
| Net assets | | | — | | | $ | 1,800,401 | | | | — | | | | — | | | | — | | |
| Shares outstanding | | | — | | | | 77,216 | | | | — | | | | — | | | | — | | |
| Net asset value and offering price per share | | | — | | | $ | 23.32 | | | | — | | | | — | | | | — | | |
| Class T | |
| Net assets | | | — | | | $ | 26,801,314 | | | | — | | | | — | | | | — | | |
| Shares outstanding | | | — | | | | 1,141,272 | | | | — | | | | — | | | | — | | |
| Net asset value per share (a) | | | — | | | $ | 23.48 | | | | — | | | | — | | | | — | | |
| Maximum sales charge | | | — | | | | 5.75 | % | | | — | | | | — | | | | — | | |
| Maximum offering price per share (c) | | | — | | | $ | 24.91 | | | | — | | | | — | | | | — | | |
| Class Z | |
| Net assets | | $ | 636,992,445 | | | $ | 1,286,856,548 | | | $ | 354,145,176 | | | $ | 282,293,309 | | | $ | 208,883,317 | | |
| Shares outstanding | | | 45,025,625 | | | | 53,792,659 | | | | 12,654,756 | | | | 20,340,912 | | | | 21,184,051 | | |
| Net asset value and offering price per share (b) | | $ | 14.15 | | | $ | 23.92 | | | $ | 27.99 | | | $ | 13.88 | | | $ | 9.86 | | |
(a) Redemption price per share is equal to net asset value less any applicable contingent deferred sales charge.
(b) Redemption price per share is equal to net asset value less any applicable redemption fees.
(c) On sales of $50,000 or more the offering price is reduced.
See Accompanying Notes to Financial Statements.
98
| | | Columbia
Strategic
Investor Fund | | Columbia
Balanced Fund | | Columbia
Oregon
Intermediate
Municipal
Bond Fund | | Columbia
Conservative
High Yield Fund | |
| Class A | |
| Net assets | | $ | 225,418,046 | | | $ | 10,712,125 | | | $ | 10,210,335 | | | $ | 68,495,971 | | |
| Shares outstanding | | | 12,513,666 | | | | 445,710 | | | | 845,830 | | | | 9,005,555 | | |
| Net asset value per share (a)(b) | | $ | 18.01 | | | $ | 24.03 | | | $ | 12.07 | | | $ | 7.61 | | |
| Maximum sales charge | | | 5.75 | % | | | 5.75 | % | | | 3.25 | % | | | 4.75 | % | |
| Maximum offering price per share (c) | | $ | 19.11 | | | $ | 25.50 | | | $ | 12.48 | | | $ | 7.99 | | |
| Class B | |
| Net assets | | $ | 42,228,748 | | | $ | 7,550,654 | | | $ | 569,691 | | | $ | 38,175,259 | | |
| Shares outstanding | | | 2,419,965 | | | | 314,759 | | | | 47,194 | | | | 5,019,125 | | |
| Net asset value and offering price per share (a)(b) | | $ | 17.45 | | | $ | 23.99 | | | $ | 12.07 | | | $ | 7.61 | | |
| Class C | |
| Net assets | | $ | 34,207,701 | | | $ | 3,209,124 | | | $ | 7,846,650 | | | $ | 23,002,554 | | |
| Shares outstanding | | | 1,959,503 | | | | 133,756 | | | | 650,023 | | | | 3,024,289 | | |
| Net asset value and offering price per share (a)(b) | | $ | 17.46 | | | $ | 23.99 | | | $ | 12.07 | | | $ | 7.61 | | |
| Class R | |
| Net assets | | | — | | | | — | | | | — | | | | — | | |
| Shares outstanding | | | — | | | | — | | | | — | | | | — | | |
| Net asset value and offering price per share | | | — | | | | — | | | | — | | | | — | | |
| Class T | |
| Net assets | | | — | | | | — | | | | — | | | | — | | |
| Shares outstanding | | | — | | | | — | | | | — | | | | — | | |
| Net asset value per share (a) | | | — | | | | — | | | | — | | | | — | | |
| Maximum sales charge | | | — | | | | — | | | | — | | | | — | | |
| Maximum offering price per share (c) | | | — | | | | — | | | | — | | | | — | | |
| Class Z | |
| Net assets | | $ | 755,348,394 | | | $ | 176,113,133 | | | $ | 381,162,491 | | | $ | 443,043,356 | | |
| Shares outstanding | | | 41,820,462 | | | | 7,332,616 | | | | 31,575,800 | | | | 58,249,414 | | |
| Net asset value and offering price per share (b) | | $ | 18.06 | | | $ | 24.02 | | | $ | 12.07 | | | $ | 7.61 | | |
See Accompanying Notes to Financial Statements.
99
Statements of Operations – Columbia Funds
For the Year Ended August 31, 2008
| | | ($) | | ($) | | ($) | | ($) | | ($) | |
| | | Columbia
International
Stock Fund | | Columbia
Mid Cap
Growth Fund | | Columbia
Small Cap
Growth Fund I | | Columbia
Real Estate
Equity Fund | | Columbia
Technology Fund | |
| Investment Income | |
| Dividends | | | 41,792,372 | | | | 9,351,839 | | | | 1,171,330 | | | | 10,423,065 | | | | 2,195,550 | | |
| Interest | | | 288,797 | | | | 1,231,004 | | | | 538,902 | | | | 255,242 | | | | 518,398 | | |
| Foreign taxes withheld | | | (3,259,799 | ) | | | (97,258 | ) | | | (10,018 | ) | | | (33,340 | ) | | | (106,243 | ) | |
| Total Income | | | 38,821,370 | | | | 10,485,585 | | | | 1,700,214 | | | | 10,644,967 | | | | 2,607,705 | | |
| Expenses | |
| Investment advisory fee | | | 9,758,481 | | | | 11,479,270 | | | | 2,697,664 | | | | 2,487,144 | | | | 3,420,420 | | |
| Administration fee | | | — | | | | — | | | | — | | | | — | | | | — | | |
| Distribution fee: | |
| Class B | | | 162,402 | | | | 136,227 | | | | 14,483 | | | | 60,606 | | | | 87,526 | | |
| Class C | | | 190,905 | | | | 85,586 | | | | 35,924 | | | | 52,295 | | | | 365,013 | | |
| Class R | | | — | | | | 6,112 | | | | — | | | | — | | | | — | | |
| Service fee: | |
| Class A | | | 674,364 | | | | 144,006 | | | | 71,263 | | | | 55,648 | | | | 366,273 | | |
| Class B | | | 53,986 | | | | 45,409 | | | | 4,829 | | | | 20,202 | | | | 29,176 | | |
| Class C | | | 63,635 | | | | 28,534 | | | | 11,977 | | | | 17,432 | | | | 121,670 | | |
| Shareholder services fee—Class T | | | — | | | | 86,631 | | | | — | | | | — | | | | — | | |
| Transfer agent fee | | | 1,571,126 | | | | 1,753,170 | | | | 409,809 | | | | 479,105 | | | | 526,821 | | |
| Pricing and bookkeeping fees | | | 155,447 | | | | 148,795 | | | | 92,484 | | | | 91,127 | | | | 105,410 | | |
| Trustees' fees | | | 74,038 | | | | 72,919 | | | | 25,033 | | | | 32,842 | | | | 30,466 | | |
| Custody fee | | | 521,947 | | | | 56,915 | | | | 31,168 | | | | 9,164 | | | | 33,206 | | |
| Merger costs | | | — | | | | — | | | | — | | | | 48,043 | | | | — | | |
| Chief compliance officer expenses | | | 996 | | | | 1,113 | | | | 705 | | | | 702 | | | | 926 | | |
| Other expenses | | | 437,089 | | | | 495,286 | | | | 226,349 | | | | 282,009 | | | | 255,091 | | |
| Expenses before interest expense | | | 13,664,416 | | | | 14,539,973 | | | | 3,621,688 | | | | 3,636,319 | | | | 5,341,998 | | |
| Interest expense | | | 6,239 | | | | 391 | | | | — | | | | 1,427 | | | | — | | |
| Total Expenses | | | 13,670,655 | | | | 14,540,364 | | | | 3,621,688 | | | | 3,637,746 | | | | 5,341,998 | | |
| Fees waived or expenses reimbursed by investment advisor | | | — | | | | — | | | | — | | | | — | | | | — | | |
| Fees waived by distributor—Class C | | | — | | | | — | | | | — | | | | — | | | | — | | |
| Fees waived by transfer agent | | | (1,038,623 | ) | | | — | | | | — | | | | — | | | | — | | |
| Expense reductions | | | (40,679 | ) | | | (20,404 | ) | | | (6,640 | ) | | | (10,411 | ) | | | (5,548 | ) | |
| Net Expenses | | | 12,591,353 | | | | 14,519,960 | | | | 3,615,048 | | | | 3,627,335 | | | | 5,336,450 | | |
| Net Investment Income (Loss) | | | 26,230,017 | | | | (4,034,375 | ) | | | (1,914,834 | ) | | | 7,017,632 | | | | (2,728,745 | ) | |
See Accompanying Notes to Financial Statements.
100
| | | ($) | | ($) | | ($) | | ($) | |
| | | Columbia
Strategic
Investor Fund | | Columbia
Balanced Fund | | Columbia
Oregon
Intermediate
Municipal
Bond Fund | | Columbia
Conservative
High Yield
Fund | |
| Investment Income | |
| Dividends | | | 17,726,061 | | | | 2,009,843 | | | | 35,643 | | | | — | | |
| Interest | | | 284,285 | | | | 4,420,198 | | | | 17,628,772 | | | | 51,133,488 | | |
| Foreign taxes withheld | | | (286,071 | ) | | | (6,714 | ) | | | — | | | | — | | |
| Total Income | | | 17,724,275 | | | | 6,423,327 | | | | 17,664,415 | | | | 51,133,488 | | |
| Expenses | |
| Investment advisory fee | | | 6,613,337 | | | | 1,038,397 | | | | 1,924,124 | | | | 3,989,177 | | |
| Administration fee | | | 1,715,452 | | | | — | | | | — | | | | — | | |
| Distribution fee: | |
| Class B | | | 370,933 | | | | 54,512 | | | | 5,307 | | | | 334,540 | | |
| Class C | | | 301,893 | | | | 18,707 | | | | 36,972 | | | | 204,996 | | |
| Class R | | | — | | | | — | | | | — | | | | — | | |
| Service fee: | |
| Class A | | | 619,012 | | | | 20,973 | | | | 16,172 | | | | 214,277 | | |
| Class B | | | 123,644 | | | | 18,170 | | | | 1,769 | | | | 111,513 | | |
| Class C | | | 100,717 | | | | 6,227 | | | | 12,308 | | | | 68,325 | | |
| Shareholder services fee—Class T | | | — | | | | — | | | | — | | | | — | | |
| Transfer agent fee | | | 2,816,567 | | | | 183,926 | | | | 122,634 | | | | 991,799 | | |
| Pricing and bookkeeping fees | | | 154,562 | | | | 89,757 | | | | 125,502 | | | | 154,627 | | |
| Trustees' fees | | | 68,207 | | | | 25,858 | | | | 30,692 | | | | 58,847 | | |
| Custody fee | | | 98,918 | | | | 19,608 | | | | 15,195 | | | | 24,100 | | |
| Merger costs | | | — | | | | — | | | | — | | | | — | | |
| Chief compliance officer expenses | | | 991 | | | | 684 | | | | 731 | | | | 911 | | |
| Other expenses | | | 659,775 | | | | 185,302 | | | | 185,622 | | | | 380,876 | | |
| Expenses before interest expense | | | 13,644,008 | | | | 1,662,121 | | | | 2,477,028 | | | | 6,533,988 | | |
| Interest expense | | | — | | | | — | | | | — | | | | — | | |
| Total Expenses | | | 13,644,008 | | | | 1,662,121 | | | | 2,477,028 | | | | 6,533,988 | | |
| Fees waived or expenses reimbursed by investment advisor | | | (294,451 | ) | | | — | | | | (393,368 | ) | | | — | | |
| Fees waived by distributor—Class C | | | — | | | | — | | | | (17,278 | ) | | | (40,966 | ) | |
| Fees waived by transfer agent | | | — | | | | — | | | | — | | | | — | | |
| Expense reductions | | | (514,275 | ) | | | (8,175 | ) | | | (3,304 | ) | | | (12,751 | ) | |
| Net Expenses | | | 12,835,282 | | | | 1,653,946 | | | | 2,063,078 | | | | 6,480,271 | | |
| Net Investment Income (Loss) | | | 4,888,993 | | | | 4,769,381 | | | | 15,601,337 | | | | 44,653,217 | | |
See Accompanying Notes to Financial Statements.
101
Statements of Operations (continued) – Columbia Funds
For the Year Ended August 31, 2008
| | | ($) | | ($) | | ($) | | ($) | | ($) | |
| | | Columbia
International
Stock Fund | | Columbia
Mid Cap
Growth Fund | | Columbia
Small Cap
Growth Fund I | | Columbia
Real Estate
Equity Fund | | Columbia
Technology Fund | |
Net Realized and Unrealized Gain (Loss) on Investments,
Foreign Currency, Futures Contracts and Written Options | |
| Net realized gain (loss) on: | |
| Investments | | | 47,580,280 | | | | 76,111,919 | | | | (4,332,816 | ) | | | 49,742,385 | | | | (35,382,191 | ) | |
| Foreign currency transactions | | | (6,429,535 | ) | | | (239,634 | ) | | | (12,072 | ) | | | (5,700 | ) | | | (57,396 | ) | |
| Futures contracts | | | — | | | | — | | | | — | | | | — | | | | — | | |
| Written options | | | 507,298 | | | | (2,218,151 | ) | | | (524,049 | ) | | | — | | | | 51,871 | | |
| Realized loss due to trading error | | | — | | | | — | | | | (12,816 | ) | | | — | | | | — | | |
| Reimbursement of trading loss by investment advisor (See Note 9) | | | — | | | | — | | | | 12,816 | | | | — | | | | — | | |
| Net realized gain (loss) | | | 41,658,043 | | | | 73,654,134 | | | | (4,868,937 | ) | | | 49,736,685 | | | | (35,387,716 | ) | |
| Net change in unrealized appreciation (depreciation) on: | |
| Investments | | | (267,436,181 | ) | | | (86,959,642 | ) | | | 4,244,170 | | | | (74,425,576 | ) | | | (26,425,203 | ) | |
| Foreign currency translations | | | (3,874,167 | ) | | | (556 | ) | | | (331 | ) | | | (273 | ) | | | (230 | ) | |
| Futures contracts | | | — | | | | — | | | | — | | | | — | | | | — | | |
| Written options | | | 100,510 | | | | 20,300 | | | | — | | | | — | | | | — | | |
| Net change in net unrealized appreciation (depreciation) | | | (271,209,838 | ) | | | (86,939,898 | ) | | | 4,243,839 | | | | (74,425,849 | ) | | | (26,425,433 | ) | |
| Net Gain (Loss) | | | (229,551,795 | ) | | | (13,285,764 | ) | | | (625,098 | ) | | | (24,689,164 | ) | | | (61,813,149 | ) | |
| Net Increase (Decrease) Resulting from Operations | | | (203,321,778 | ) | | | (17,320,139 | ) | | | (2,539,932 | ) | | | (17,671,532 | ) | | | (64,541,894 | ) | |
See Accompanying Notes to Financial Statements.
102
| | | ($) | | ($) | | ($) | | ($) | |
| | | Columbia
Strategic
Investor Fund | | Columbia
Balanced Fund | | Columbia
Oregon
Intermediate
Municipal
Bond Fund | | Columbia
Conservative
High Yield
Fund | |
Net Realized and Unrealized Gain (Loss) on Investments,
Foreign Currency, Futures Contracts and Written Options | |
| Net realized gain (loss) on: | |
| Investments | | | (46,588,427 | ) | | | 21,665 | | | | 389,184 | | | | (32,612,149 | ) | |
| Foreign currency transactions | | | (67,467 | ) | | | — | | | | — | | | | (254,305 | ) | |
| Futures contracts | | | — | | | | 126,948 | | | | (386,474 | ) | | | — | | |
| Written options | | | — | | | | — | | | | — | | | | — | | |
| Realized loss due to trading error | | | — | | | | — | | | | — | | | | — | | |
| Reimbursement of trading loss by investment advisor (See Note 9) | | | — | | | | — | | | | — | | | | — | | |
| Net realized gain (loss) | | | (46,655,894 | ) | | | 148,613 | | | | 2,710 | | | | (32,866,454 | ) | |
| Net change in unrealized appreciation (depreciation) on: | |
| Investments | | | (37,417,360 | ) | | | (4,605,372 | ) | | | 1,580,839 | | | | (9,075,497 | ) | |
| Foreign currency translations | | | (9,061 | ) | | | — | | | | — | | | | 37,991 | | |
| Futures contracts | | | — | | | | 700 | | | | — | | | | — | | |
| Written options | | | — | | | | — | | | | — | | | | — | | |
| Net change in net unrealized appreciation (depreciation) | | | (37,426,421 | ) | | | (4,604,672 | ) | | | 1,580,839 | | | | (9,037,506 | ) | |
| Net Gain (Loss) | | | (84,082,315 | ) | | | (4,456,059 | ) | | | 1,583,549 | | | | (41,903,960 | ) | |
| Net Increase (Decrease) Resulting from Operations | | | (79,193,322 | ) | | | 313,322 | | | | 17,184,886 | | | | 2,749,257 | | |
See Accompanying Notes to Financial Statements.
103
Statements of Changes in Net Assets – Columbia Funds
| Increase (Decrease) in Net Assets | | Columbia
International Stock Fund | | Columbia
Mid Cap Growth Fund | |
| | | Year Ended August 31, | | Year Ended August 31, | |
| | | 2008 ($) | | 2007 ($)(a)(b) | | 2008 ($) | | 2007 ($)(a)(b) | |
| Operations | |
| Net investment income (loss) | | | 26,230,017 | | | | 20,267,711 | | | | (4,034,375 | ) | | | 2,629,277 | | |
Net realized gain on investments, foreign currency transactions
and written options | | | 41,658,043 | | | | 185,935,833 | | | | 73,654,134 | | | | 227,507,381 | | |
Net change in unrealized appreciation (depreciation)
on investments, foreign currency translations and written options | | | (271,209,838 | ) | | | 32,098,355 | | | | (86,939,898 | ) | | | 60,530,572 | | |
| Net increase (decrease) resulting from operations | | | (203,321,778 | ) | | | 238,301,899 | | | | (17,320,139 | ) | | | 290,667,230 | | |
| Distributions to Shareholders | |
| From net investment income: | |
| Class A | | | (9,432,860 | ) | | | (4,133,168 | ) | | | — | | | | — | | |
| Class B | | | (671,765 | ) | | | (281,059 | ) | | | — | | | | — | | |
| Class C | | | (704,627 | ) | | | (205,677 | ) | | | — | | | | — | | |
| Class D | | | — | | | | (5,637 | ) | | | — | | | | — | | |
| Class G | | | — | | | | (6,342 | ) | | | — | | | | — | | |
| Class Z | | | (34,647,077 | ) | | | (17,299,002 | ) | | | — | | | | (2,454,592 | ) | |
| From net realized gains: | |
| Class A | | | (32,176,830 | ) | | | (28,240,926 | ) | | | (7,449,915 | ) | | | (2,635,416 | ) | |
| Class B | | | (2,998,328 | ) | | | (3,899,155 | ) | | | (2,671,575 | ) | | | (1,228,935 | ) | |
| Class C | | | (3,138,414 | ) | | | (2,862,620 | ) | | | (1,418,104 | ) | | | (347,303 | ) | |
| Class D | | | — | | | | (78,464 | ) | | | — | | | | (24,153 | ) | |
| Class G | | | — | | | | (82,635 | ) | | | — | | | | (29,379 | ) | |
| Class R | | | — | | | | — | | | | (125,444 | ) | | | (4,303 | ) | |
| Class T | | | — | | | | — | | | | (4,023,387 | ) | | | (1,593,876 | ) | |
| Class Z | | | (109,632,234 | ) | | | (101,049,927 | ) | | | (198,592,083 | ) | | | (78,975,335 | ) | |
| Total distributions to shareholders | | | (193,402,135 | ) | | | (158,144,612 | ) | | | (214,280,508 | ) | | | (87,293,292 | ) | |
| Net Capital Share Transactions | | | (81,735,879 | ) | | | (68,281,430 | ) | | | 79,545,772 | | | | 499,062,394 | | |
| Redemption Fees | | | 32,159 | | | | 9,577 | | | | — | | | | — | | |
| Net increase (decrease) in net assets | | | (478,427,633 | ) | | | 11,885,434 | | | | (152,054,875 | ) | | | 702,436,332 | | |
| Net Assets | |
| Beginning of period | | | 1,367,430,568 | | | | 1,355,545,134 | | | | 1,560,219,379 | | | | 857,783,047 | | |
| End of period | | | 889,002,935 | | | | 1,367,430,568 | | | | 1,408,164,504 | | | | 1,560,219,379 | | |
| Undistributed (Overdistributed) net investment income, at end of period | | | 2,368,803 | | | | 26,558,663 | | | | — | | | | (42,985 | ) | |
| Accumulated net investment loss, at end of period | | | — | | | | — | | | | (63,002 | ) | | | — | | |
(a) Class D shares reflects activity for the period September 1, 2006 through August 8, 2007.
(b) Class G shares reflects activity for the period September 1, 2006 through August 8, 2007.
See Accompanying Notes to Financial Statements.
104
| Increase (Decrease) in Net Assets | | Columbia
Small Cap Growth Fund I | | Columbia
Real Estate Equity Fund | |
| | | Year Ended August 31, | | Year Ended August 31, | |
| | | 2008 ($) | | 2007 ($) | | 2008 ($) | | 2007 ($)(a) | |
| Operations | |
| Net investment income (loss) | | | (1,914,834 | ) | | | (1,348,803 | ) | | | 7,017,632 | | | | 6,385,027 | | |
Net realized gain on investments, foreign currency transactions
and written options | | | (4,868,937 | ) | | | 31,857,429 | | | | 49,736,685 | | | | 239,570,282 | | |
Net change in unrealized appreciation (depreciation)
on investments, foreign currency translations and written options | | | 4,243,839 | | | | 12,844,199 | | | | (74,425,849 | ) | | | (216,587,464 | ) | |
| Net increase (decrease) resulting from operations | | | (2,539,932 | ) | | | 43,352,825 | | | | (17,671,532 | ) | | | 29,367,845 | | |
| Distributions to Shareholders | |
| From net investment income: | |
| Class A | | | — | | | | — | | | | (231,829 | ) | | | (547,791 | ) | |
| Class B | | | — | | | | — | | | | (37,874 | ) | | | (55,195 | ) | |
| Class C | | | — | | | | — | | | | (32,873 | ) | | | (25,792 | ) | |
| Class D | | | — | | | | — | | | | — | | | | (13,665 | ) | |
| Class G | | | — | | | | — | | | | — | | | | — | | |
| Class Z | | | — | | | | (9,836 | ) | | | (3,748,998 | ) | | | (7,967,611 | ) | |
| From net realized gains: | |
| Class A | | | (2,852,442 | ) | | | (1,159,610 | ) | | | (6,859,068 | ) | | | (15,301,339 | ) | |
| Class B | | | (179,710 | ) | | | (95,854 | ) | | | (2,737,380 | ) | | | (4,443,972 | ) | |
| Class C | | | (349,068 | ) | | | (120,634 | ) | | | (2,361,785 | ) | | | (2,158,908 | ) | |
| Class D | | | — | | | | — | | | | — | | | | (1,106,924 | ) | |
| Class G | | | — | | | | — | | | | — | | | | — | | |
| Class R | | | — | | | | — | | | | — | | | | — | | |
| Class T | | | — | | | | — | | | | — | | | | — | | |
| Class Z | | | (28,831,023 | ) | | | (29,494,728 | ) | | | (93,321,186 | ) | | | (189,312,650 | ) | |
| Total distributions to shareholders | | | (32,212,243 | ) | | | (30,880,662 | ) | | | (109,330,993 | ) | | | (220,933,847 | ) | |
| Net Capital Share Transactions | | | 201,401,030 | | | | 33,125,648 | | | | 18,819,376 | | | | (28,060,250 | ) | |
| Redemption Fees | | | — | | | | — | | | | — | | | | — | | |
| Net increase (decrease) in net assets | | | 166,648,855 | | | | 45,597,811 | | | | (108,183,149 | ) | | | (219,626,252 | ) | |
| Net Assets | |
| Beginning of period | | | 242,874,449 | | | | 197,276,638 | | | | 426,382,522 | | | | 646,008,774 | | |
| End of period | | | 409,523,304 | | | | 242,874,449 | | | | 318,199,373 | | | | 426,382,522 | | |
| Undistributed (Overdistributed) net investment income, at end of period | | | — | | | | — | | | | 1,348,655 | | | | (24,881 | ) | |
| Accumulated net investment loss, at end of period | | | (33,301 | ) | | | (17,916 | ) | | | — | | | | — | | |
See Accompanying Notes to Financial Statements.
105
Statements of Changes in Net Assets – Columbia Funds
| Increase (Decrease) in Net Assets | | Columbia
Technology Fund | | Columbia
Strategic Investor Fund | | Columbia
Balanced Fund | |
| | | Year Ended August 31, | | Year Ended August 31, | | Year Ended August 31, | |
| | | 2008 ($) | | 2007 ($)(a) | | 2008 ($) | | 2007 ($)(a) | | 2008 ($) | | 2007 ($)(a) | |
| Operations | |
| Net investment income (loss) | | | (2,728,745 | ) | | | (2,243,079 | ) | | | 4,888,993 | | | | 5,650,893 | | | | 4,769,381 | | | | 4,837,077 | | |
Net realized gain (loss) on investments,
foreign currency transactions, futures
contracts and written options | | | (35,387,716 | ) | | | 19,712,614 | | | | (46,655,894 | ) | | | 144,223,543 | | | | 148,613 | | | | 18,226,159 | | |
Net change in unrealized appreciation
(depreciation) on investments, foreign
currency translations, futures contracts and
written options | | | (26,425,433 | ) | | | 32,381,837 | | | | (37,426,421 | ) | | | 34,086,561 | | | | (4,604,672 | ) | | | 3,989,036 | | |
| Net increase (decrease) resulting from operations | | | (64,541,894 | ) | | | 49,851,372 | | | | (79,193,322 | ) | | | 183,960,997 | | | | 313,322 | | | | 27,052,272 | | |
| Distributions to Shareholders | |
| From net investment income: | |
| Class A | | | — | | | | — | | | | (773,956 | ) | | | (877,469 | ) | | | (181,589 | ) | | | (102,893 | ) | |
| Class B | | | — | | | | — | | | | — | | | | — | | | | (108,589 | ) | | | (90,688 | ) | |
| Class C | | | — | | | | — | | | | — | | | | — | | | | (36,152 | ) | | | (19,483 | ) | |
| Class D | | | — | | | | — | | | | — | | | | — | | | | — | | | | (2,889 | ) | |
| Class Z | | | — | | | | — | | | | (4,698,098 | ) | | | (2,645,242 | ) | | | (4,759,119 | ) | | | (4,784,102 | ) | |
| From net realized gains: | |
| Class A | | | (8,118,379 | ) | | | — | | | | (25,957,054 | ) | | | (21,385,015 | ) | | | (42,359 | ) | | | — | | |
| Class B | | | (570,106 | ) | | | — | | | | (5,475,529 | ) | | | (6,587,216 | ) | | | (41,396 | ) | | | — | | |
| Class C | | | (2,475,187 | ) | | | — | | | | (4,393,348 | ) | | | (5,582,554 | ) | | | (11,431 | ) | | | — | | |
| Class D | | | — | | | | — | | | | — | | | | (55,652 | ) | | | — | | | | — | | |
| Class Z | | | (10,480,382 | ) | | | — | | | | (86,866,170 | ) | | | (23,718,387 | ) | | | (1,153,447 | ) | | | — | | |
| Total distributions to shareholders | | | (21,644,054 | ) | | | — | | | | (128,164,155 | ) | | | (60,851,535 | ) | | | (6,334,082 | ) | | | (5,000,055 | ) | |
| Net Capital Share Transactions | | | 193,663,602 | | | | 68,384,627 | | | | 51,027,510 | | | | 645,437,908 | | | | (8,432,031 | ) | | | (49,788,148 | ) | |
| Net increase (decrease) in net assets | | | 107,477,654 | | | | 118,235,999 | | | | (156,329,967 | ) | | | 768,547,370 | | | | (14,452,791 | ) | | | (27,735,931 | ) | |
| Net Assets | |
| Beginning of period | | | 293,865,173 | | | | 175,629,174 | | | | 1,213,532,856 | | | | 444,985,486 | | | | 212,037,827 | | | | 239,773,758 | | |
| End of period | | | 401,342,827 | | | | 293,865,173 | | | | 1,057,202,889 | | | | 1,213,532,856 | | | | 197,585,036 | | | | 212,037,827 | | |
Undistributed net investment income,
at end of period | | | — | | | | — | | | | 2,664,833 | | | | 3,307,872 | | | | 887,913 | | | | 1,003,266 | | |
| Accumulated net investment loss, at end of period | | | (18,676 | ) | | | (11,776 | ) | | | — | | | | — | | | | — | | | | — | | |
(a) Class D shares reflects activity for the period September 1, 2006 through August 8, 2007.
See Accompanying Notes to Financial Statements.
106
| Increase (Decrease) in Net Assets | | Columbia Oregon Intermediate
Municipal Bond Fund | | Columbia Conservative
High Yield Fund | |
| | | Year Ended August 31, | | Year Ended August 31, | |
| | | 2008 ($) | | 2007 ($)(a) | | 2008 ($) | | 2007 ($)(a) | |
| Operations | |
| Net investment income (loss) | | | 15,601,337 | | | | 15,362,072 | | | | 44,653,217 | | | | 61,177,246 | | |
Net realized gain (loss) on investments,
foreign currency transactions, futures
contracts and written options | | | 2,710 | | | | 785,591 | | | | (32,866,454 | ) | | | (1,470,192 | ) | |
Net change in unrealized appreciation
(depreciation) on investments, foreign
currency translations, futures contracts and
written options | | | 1,580,839 | | | | (7,940,175 | ) | | | (9,037,506 | ) | | | (7,705,474 | ) | |
| Net increase (decrease) resulting from operations | | | 17,184,886 | | | | 8,207,488 | | | | 2,749,257 | | | | 52,001,580 | | |
| Distributions to Shareholders | |
| From net investment income: | |
| Class A | | | (244,762 | ) | | | (228,907 | ) | | | (5,617,372 | ) | | | (8,822,616 | ) | |
| Class B | | | (21,708 | ) | | | (25,930 | ) | | | (2,594,827 | ) | | | (3,440,134 | ) | |
| Class C | | | (165,652 | ) | | | (24,106 | ) | | | (1,633,855 | ) | | | (719,020 | ) | |
| Class D | | | — | | | | (16,764 | ) | | | — | | | | (1,702,096 | ) | |
| Class Z | | | (15,146,964 | ) | | | (15,039,476 | ) | | | (35,546,349 | ) | | | (48,825,293 | ) | |
| From net realized gains: | |
| Class A | | | — | | | | — | | | | — | | | | — | | |
| Class B | | | — | | | | — | | | | — | | | | — | | |
| Class C | | | — | | | | — | | | | — | | | | — | | |
| Class D | | | — | | | | — | | | | — | | | | — | | |
| Class Z | | | — | | | | — | | | | — | | | | — | | |
| Total distributions to shareholders | | | (15,579,086 | ) | | | (15,335,183 | ) | | | (45,392,403 | ) | | | (63,509,159 | ) | |
| Net Capital Share Transactions | | | 22,433,776 | | | | (6,444,965 | ) | | | (186,827,688 | ) | | | (273,578,305 | ) | |
| Net increase (decrease) in net assets | | | 24,039,576 | | | | (13,572,660 | ) | | | (229,470,834 | ) | | | (285,085,884 | ) | |
| Net Assets | |
| Beginning of period | | | 375,749,591 | | | | 389,322,251 | | | | 802,187,974 | | | | 1,087,273,858 | | |
| End of period | | | 399,789,167 | | | | 375,749,591 | | | | 572,717,140 | | | | 802,187,974 | | |
Undistributed net investment income,
at end of period | | | 119,582 | | | | 138,316 | | | | — | | | | — | | |
| Accumulated net investment loss, at end of period | | | — | | | | — | | | | (1,361,166 | ) | | | (2,644,269 | ) | |
See Accompanying Notes to Financial Statements.
107
Statements of Changes in Net Assets – Capital Stock Activity
| | | Columbia International Stock Fund | |
| | | Year Ended
August 31, 2008 | | Year Ended
August 31, 2007(a)(b) | |
| | | Shares | | Dollars ($) | | Shares | | Dollars ($) | |
| Class A | |
| Subscriptions | | | 975,202 | | | | 16,730,687 | | | | 1,204,071 | | | | 23,667,863 | | |
| Proceeds received in connection with merger | | | — | | | | — | | | | — | | | | — | | |
| Distributions reinvested | | | 2,202,887 | | | | 37,096,606 | | | | 1,559,040 | | | | 28,733,119 | | |
| Redemptions | | | (2,503,358 | ) | | | (42,265,055 | ) | | | (2,532,806 | ) | | | (49,784,100 | ) | |
| Net increase | | | 674,731 | | | | 11,562,238 | | | | 230,305 | | | | 2,616,882 | | |
| Class B | |
| Subscriptions | | | 70,938 | | | | 1,181,285 | | | | 132,548 | | | | 2,536,426 | | |
| Proceeds received in connection with merger | | | — | | | | — | | | | — | | | | — | | |
| Distributions reinvested | | | 185,273 | | | | 3,044,038 | | | | 196,840 | | | | 3,550,989 | | |
| Redemptions | | | (800,526 | ) | | | (13,109,714 | ) | | | (1,096,624 | ) | | | (21,048,203 | ) | |
| Net increase (decrease) | | | (544,315 | ) | | | (8,884,391 | ) | | | (767,236 | ) | | | (14,960,788 | ) | |
| Class C | |
| Subscriptions | | | 95,461 | | | | 1,579,479 | | | | 148,773 | | | | 2,873,726 | | |
| Proceeds received in connection with merger | | | — | | | | — | | | | — | | | | — | | |
| Distributions reinvested | | | 179,202 | | | | 2,958,629 | | | | 131,938 | | | | 2,390,724 | | |
| Redemptions | | | (311,754 | ) | | | (5,191,712 | ) | | | (287,397 | ) | | | (5,509,015 | ) | |
| Net increase (decrease) | | | (37,091 | ) | | | (653,604 | ) | | | (6,686 | ) | | | (244,565 | ) | |
| Class D | |
| Subscriptions | | | — | | | | — | | | | 877 | | | | 16,884 | | |
| Distributions reinvested | | | — | | | | — | | | | 4,585 | | | | 83,352 | | |
| Redemptions | | | — | | | | — | | | | (46,660 | ) | | | (934,418 | ) | |
| Net decrease | | | — | | | | — | | | | (41,198 | ) | | | (834,182 | ) | |
| Class G | |
| Subscriptions | | | — | | | | — | | | | 1,934 | | | | 37,101 | | |
| Distributions reinvested | | | — | | | | — | | | | 4,932 | | | | 88,927 | | |
| Redemptions | | | — | | | | — | | | | (72,798 | ) | | | (1,407,621 | ) | |
| Net decrease | | | — | | | | — | | | | (65,932 | ) | | | (1,281,593 | ) | |
| Class R | |
| Subscriptions | | | — | | | | — | | | | — | | | | — | | |
| Distributions reinvested | | | — | | | | — | | | | — | | | | — | | |
| Redemptions | | | — | | | | — | | | | — | | | | — | | |
| Net increase | | | — | | | | — | | | | — | | | | — | | |
| Class T | |
| Subscriptions | | | — | | | | — | | | | — | | | | — | | |
| Distributions reinvested | | | — | | | | — | | | | — | | | | — | | |
| Redemptions | | | — | | | | — | | | | — | | | | — | | |
| Net increase (decrease) | | | — | | | | — | | | | — | | | | — | | |
| Class Z | |
| Subscriptions | | | 3,255,835 | | | | 56,183,125 | | | | 3,018,443 | | | | 59,462,899 | | |
| Proceeds received in connection with merger | | | — | | | | — | | | | — | | | | — | | |
| Distributions reinvested | | | 3,044,744 | | | | 51,669,244 | | | | 2,297,138 | | | | 42,611,910 | | |
| Redemptions | | | (11,607,704 | ) | | | (191,612,491 | ) | | | (7,851,117 | ) | | | (155,651,993 | ) | |
| Net increase (decrease) | | | (5,307,125 | ) | | | (83,760,122 | ) | | | (2,535,536 | ) | | | (53,577,184 | ) | |
(a) Class D shares reflects activity for the period September 1, 2006 through August 8, 2007.
(b) Class G shares reflects activity for the period September 1, 2006 through August 8, 2007.
See Accompanying Notes to Financial Statements.
108
| | | Columbia Mid Cap Growth Fund | |
| | | Year Ended
August 31, 2008 | | Year Ended
August 31, 2007(a)(b) | |
| | | Shares | | Dollars ($) | | Shares | | Dollars ($) | |
| Class A | |
| Subscriptions | | | 1,189,780 | | | | 30,192,118 | | | | 322,756 | | | | 8,472,714 | | |
| Proceeds received in connection with merger | | | — | | | | — | | | | 1,305,055 | | | | 31,735,751 | | |
| Distributions reinvested | | | 263,684 | | | | 6,958,613 | | | | 97,217 | | | | 2,445,994 | | |
| Redemptions | | | (558,061 | ) | | | (13,959,242 | ) | | | (448,578 | ) | | | (11,756,287 | ) | |
| Net increase | | | 895,403 | | | | 23,191,489 | | | | 1,276,450 | | | | 30,898,172 | | |
| Class B | |
| Subscriptions | | | 91,800 | | | | 2,208,736 | | | | 38,357 | | | | 974,624 | | |
| Proceeds received in connection with merger | | | — | | | | — | | | | 583,144 | | | | 13,770,140 | | |
| Distributions reinvested | | | 97,190 | | | | 2,456,004 | | | | 46,417 | | | | 1,130,266 | | |
| Redemptions | | | (216,194 | ) | | | (5,193,517 | ) | | | (251,908 | ) | | | (6,384,625 | ) | |
| Net increase (decrease) | | | (27,204 | ) | | | (528,777 | ) | | | 416,010 | | | | 9,490,405 | | |
| Class C | |
| Subscriptions | | | 390,973 | | | | 9,599,134 | | | | 155,749 | | | | 3,992,578 | | |
| Proceeds received in connection with merger | | | — | | | | — | | | | 106,084 | | | | 2,510,529 | | |
| Distributions reinvested | | | 44,557 | | | | 1,128,627 | | | | 10,692 | | | | 260,879 | | |
| Redemptions | | | (141,809 | ) | | | (3,297,549 | ) | | | (67,108 | ) | | | (1,687,202 | ) | |
| Net increase (decrease) | | | 293,721 | | | | 7,430,212 | | | | 205,417 | | | | 5,076,784 | | |
| Class D | |
| Subscriptions | | | — | | | | — | | | | 1,061 | | | | 27,869 | | |
| Distributions reinvested | | | — | | | | — | | | | 935 | | | | 22,786 | | |
| Redemptions | | | — | | | | — | | | | (18,393 | ) | | | (492,651 | ) | |
| Net decrease | | | — | | | | — | | | | (16,397 | ) | | | (441,996 | ) | |
| Class G | |
| Subscriptions | | | — | | | | — | | | | 327 | | | | 8,222 | | |
| Distributions reinvested | | | — | | | | — | | | | 1,210 | | | | 29,379 | | |
| Redemptions | | | — | | | | — | | | | (27,029 | ) | | | (706,119 | ) | |
| Net decrease | | | — | | | | — | | | | (25,492 | ) | | | (668,518 | ) | |
| Class R | |
| Subscriptions | | | 52,197 | | | | 1,293,922 | | | | 34,368 | | | | 934,032 | | |
| Distributions reinvested | | | 4,120 | | | | 108,221 | | | | 172 | | | | 4,306 | | |
| Redemptions | | | (12,260 | ) | | | (298,056 | ) | | | (3,767 | ) | | | (100,826 | ) | |
| Net increase | | | 44,057 | | | | 1,104,087 | | | | 30,773 | | | | 837,512 | | |
| Class T | |
| Subscriptions | | | 15,680 | | | | 404,273 | | | | 33,118 | | | | 892,561 | | |
| Distributions reinvested | | | 149,423 | | | | 3,947,762 | | | | 62,131 | | | | 1,565,081 | | |
| Redemptions | | | (87,386 | ) | | | (2,241,391 | ) | | | (158,964 | ) | | | (4,125,345 | ) | |
| Net increase (decrease) | | | 77,717 | | | | 2,110,644 | | | | (63,715 | ) | | | (1,667,703 | ) | |
| Class Z | |
| Subscriptions | | | 6,345,510 | | | | 161,605,779 | | | | 4,928,984 | | | | 131,062,300 | | |
| Proceeds received in connection with merger | | | — | | | | — | | | | 21,863,586 | | | | 538,983,176 | | |
| Distributions reinvested | | | 4,848,079 | | | | 130,170,927 | | | | 2,072,444 | | | | 52,847,304 | | |
| Redemptions | | | (9,407,154 | ) | | | (245,538,589 | ) | | | (10,009,473 | ) | | | (267,355,042 | ) | |
| Net increase (decrease) | | | 1,786,435 | | | | 46,238,117 | | | | 18,855,541 | | | | 455,537,738 | | |
See Accompanying Notes to Financial Statements.
109
Statements of Changes in Net Assets – Capital Stock Activity
| | | Columbia Small Cap Growth Fund I | |
| | | Year Ended
August 31, 2008 | | Year Ended
August 31, 2007 | |
| | | Shares | | Dollars ($) | | Shares | | Dollars ($) | |
| Class A | |
| Subscriptions | | | 1,300,483 | | | | 37,263,371 | | | | 533,293 | | | | 16,437,732 | | |
| Distributions reinvested | | | 88,853 | | | | 2,726,015 | | | | 37,391 | | | | 1,067,138 | | |
| Redemptions | | | (382,678 | ) | | | (10,694,676 | ) | | | (82,643 | ) | | | (2,526,761 | ) | |
| Net increase (decrease) | | | 1,006,658 | | | | 29,294,710 | | | | 488,041 | | | | 14,978,109 | | |
| Class B | |
| Subscriptions | | | 74,312 | | | | 2,095,819 | | | | 24,551 | | | | 751,318 | | |
| Distributions reinvested | | | 5,795 | | | | 176,045 | | | | 3,326 | | | | 94,120 | | |
| Redemptions | | | (17,548 | ) | | | (487,833 | ) | | | (5,057 | ) | | | (153,661 | ) | |
| Net increase | | | 62,559 | | | | 1,784,031 | | | | 22,820 | | | | 691,777 | | |
| Class C | |
| Subscriptions | | | 254,182 | | | | 7,075,964 | | | | 65,016 | | | | 1,972,580 | | |
| Distributions reinvested | | | 11,411 | | | | 346,671 | | | | 4,165 | | | | 117,868 | | |
| Redemptions | | | (33,081 | ) | | | (898,404 | ) | | | (9,636 | ) | | | (283,702 | ) | |
| Net increase | | | 232,512 | | | | 6,524,231 | | | | 59,545 | | | | 1,806,746 | | |
| Class D | |
| Subscriptions | | | — | | | | — | | | | — | | | | — | | |
| Distributions reinvested | | | — | | | | — | | | | — | | | | — | | |
| Redemptions | | | — | | | | — | | | | — | | | | — | | |
| Net decrease | | | — | | | | — | | | | — | | | | — | | |
| Class Z | |
| Subscriptions | | | 6,765,958 | | | | 192,384,904 | | | | 1,962,106 | | | | 60,044,663 | | |
| Proceeds received in connection with merger | | | — | | | | — | | | | — | | | | — | | |
| Distributions reinvested | | | 733,603 | | | | 22,602,322 | | | | 889,648 | | | | 25,479,466 | | |
| Redemptions | | | (1,778,786 | ) | | | (51,189,168 | ) | | | (2,290,415 | ) | | | (69,875,113 | ) | |
| Net increase (decrease) | | | 5,720,775 | | | | 163,798,058 | | | | 561,339 | | | | 15,649,016 | | |
(a) Class D shares reflects activity for the period September 1, 2006 through August 8, 2007.
See Accompanying Notes to Financial Statements.
110
| | | Columbia Real Estate Equity Fund | |
| | | Year Ended
August 31, 2008 | | Year Ended
August 31, 2007(a) | |
| | | Shares | | Dollars ($) | | Shares | | Dollars ($) | |
| Class A | |
| Subscriptions | | | 616,079 | | | | 8,565,733 | | | | 463,576 | | | | 12,338,183 | | |
| Distributions reinvested | | | 455,084 | | | | 6,729,883 | | | | 599,605 | | | | 15,050,716 | | |
| Redemptions | | | (959,008 | ) | | | (15,547,187 | ) | | | (1,101,008 | ) | | | (26,256,248 | ) | |
| Net increase (decrease) | | | 112,155 | | | | (251,571 | ) | | | (37,827 | ) | | | 1,132,651 | | |
| Class B | |
| Subscriptions | | | 82,549 | | | | 1,472,374 | | | | 106,638 | | | | 2,792,149 | | |
| Distributions reinvested | | | 164,393 | | | | 2,432,022 | | | | 154,449 | | | | 3,890,251 | | |
| Redemptions | | | (198,348 | ) | | | (3,015,576 | ) | | | (253,009 | ) | | | (6,178,329 | ) | |
| Net increase | | | 48,594 | | | | 888,820 | | | | 8,078 | | | | 504,071 | | |
| Class C | |
| Subscriptions | | | 106,346 | | | | 1,756,270 | | | | 249,185 | | | | 5,802,528 | | |
| Distributions reinvested | | | 151,036 | | | | 2,229,869 | | | | 80,271 | | | | 2,003,135 | | |
| Redemptions | | | (188,638 | ) | | | (2,822,085 | ) | | | (119,556 | ) | | | (2,761,528 | ) | |
| Net increase | | | 68,744 | | | | 1,164,054 | | | | 209,900 | | | | 5,044,135 | | |
| Class D | |
| Subscriptions | | | — | | | | — | | | | 2,762 | | | | 67,636 | | |
| Distributions reinvested | | | — | | | | — | | | | 37,396 | | | | 949,522 | | |
| Redemptions | | | — | | | | — | | | | (164,986 | ) | | | (3,731,933 | ) | |
| Net decrease | | | — | | | | — | | | | (124,828 | ) | | | (2,714,775 | ) | |
| Class Z | |
| Subscriptions | | | 4,334,071 | | | | 58,822,815 | | | | 2,743,632 | | | | 73,846,632 | | |
| Proceeds received in connection with merger | | | 1,924,145 | | | | 25,873,534 | | | | — | | | | — | | |
| Distributions reinvested | | | 4,827,796 | | | | 71,469,590 | | | | 5,814,667 | | | | 146,616,512 | | |
| Redemptions | | | (8,939,020 | ) | | | (139,147,866 | ) | | | (10,259,942 | ) | | | (252,489,476 | ) | |
| Net increase (decrease) | | | 2,146,992 | | | | 17,018,073 | | | | (1,701,643 | ) | | | (32,026,332 | ) | |
See Accompanying Notes to Financial Statements.
111
Statements of Changes in Net Assets – Capital Stock Activity
| | | Columbia Technology Fund | |
| | | Year Ended
August 31, 2008 | | Year Ended
August 31, 2007(a) | |
| | | Shares | | Dollars ($) | | Shares | | Dollars ($) | |
| Class A | |
| Subscriptions | | | 9,909,915 | | | | 113,413,674 | | | | 7,069,432 | | | | 75,031,287 | | |
| Proceeds received in connection with merger | | | — | | | | — | | | | — | | | | — | | |
| Distributions reinvested | | | 524,254 | | | | 6,306,776 | | | | — | | | | — | | |
| Redemptions | | | (5,750,661 | ) | | | (59,634,796 | ) | | | (5,786,054 | ) | | | (60,799,434 | ) | |
| Net increase | | | 4,683,508 | | | | 60,085,654 | | | | 1,283,378 | | | | 14,231,853 | | |
| Class B | |
| Subscriptions | | | 447,305 | | | | 4,894,865 | | | | 361,118 | | | | 3,694,119 | | |
| Proceeds received in connection with merger | | | — | | | | — | | | | — | | | | — | | |
| Distributions reinvested | | | 40,585 | | | | 474,030 | | | | — | | | | — | | |
| Redemptions | | | (276,613 | ) | | | (2,839,009 | ) | | | (280,078 | ) | | | (2,854,306 | ) | |
| Net increase (decrease) | | | 211,277 | | | | 2,529,886 | | | | 81,040 | | | | 839,813 | | |
| Class C | |
| Subscriptions | | | 2,841,735 | | | | 32,444,710 | | | | 1,963,704 | | | | 20,169,153 | | |
| Proceeds received in connection with merger | | | — | | | | — | | | | — | | | | — | | |
| Distributions reinvested | | | 115,830 | | | | 1,356,366 | | | | — | | | | — | | |
| Redemptions | | | (1,455,517 | ) | | | (14,746,150 | ) | | | (1,045,622 | ) | | | (10,773,554 | ) | |
| Net increase (decrease) | | | 1,502,048 | | | | 19,054,926 | | | | 918,082 | | | | 9,395,599 | | |
| Class D | |
| Subscriptions | | | — | | | | — | | | | 21 | | | | 217 | | |
| Distributions reinvested | | | — | | | | — | | | | — | | | | — | | |
| Redemptions | | | | | | | — | | | | (2,809 | ) | | | (31,424 | ) | |
| Net decrease | | | — | | | | — | | | | (2,788 | ) | | | (31,207 | ) | |
| Class Z | |
| Subscriptions | | | 14,754,503 | | | | 165,653,340 | | | | 8,108,585 | | | | 85,781,059 | | |
| Proceeds received in connection with merger | | | — | | | | — | | | | — | | | | — | | |
| Distributions reinvested | | | 795,555 | | | | 9,689,861 | | | | — | | | | — | | |
| Redemptions | | | (6,036,452 | ) | | | (63,350,065 | ) | | | (3,941,346 | ) | | | (41,832,490 | ) | |
| Net increase | | | 9,513,606 | | | | 111,993,136 | | | | 4,167,239 | | | | 43,948,569 | | |
(a) Class D shares reflects activity for the period September 1, 2006 through August 8, 2007.
See Accompanying Notes to Financial Statements.
112
| | | Columbia Strategic Investor Fund | |
| | | Year Ended
August 31, 2008 | | Year Ended
August 31, 2007(a) | |
| | | Shares | | Dollars ($) | | Shares | | Dollars ($) | |
| Class A | |
| Subscriptions | | | 1,770,936 | | | | 34,839,825 | | | | 1,375,556 | | | | 28,280,490 | | |
| Proceeds received in connection with merger | | | — | | | | — | | | | 4,450,342 | | | | 82,357,510 | | |
| Distributions reinvested | | | 1,207,017 | | | | 25,419,789 | | | | 1,124,512 | | | | 21,007,498 | | |
| Redemptions | | | (2,371,293 | ) | | | (46,749,332 | ) | | | (3,064,581 | ) | | | (62,574,912 | ) | |
| Net increase | | | 606,660 | | | | 13,510,282 | | | | 3,885,829 | | | | 69,070,586 | | |
| Class B | |
| Subscriptions | | | 209,919 | | | | 3,963,170 | | | | 176,240 | | | | 3,505,965 | | |
| Proceeds received in connection with merger | | | — | | | | — | | | | 250,517 | | | | 4,551,995 | | |
| Distributions reinvested | | | 246,493 | | | | 5,055,566 | | | | 329,685 | | | | 6,035,882 | | |
| Redemptions | | | (611,433 | ) | | | (11,688,371 | ) | | | (653,349 | ) | | | (13,069,497 | ) | |
| Net increase (decrease) | | | (155,021 | ) | | | (2,669,635 | ) | | | 103,093 | | | | 1,024,345 | | |
| Class C | |
| Subscriptions | | | 218,592 | | | | 4,229,781 | | | | 299,146 | | | | 5,979,580 | | |
| Proceeds received in connection with merger | | | — | | | | — | | | | 50,148 | | | | 911,399 | | |
| Distributions reinvested | | | 190,801 | | | | 3,915,246 | | | | 268,370 | | | | 4,915,740 | | |
| Redemptions | | | (581,094 | ) | | | (11,340,571 | ) | | | (594,217 | ) | | | (11,879,800 | ) | |
| Net increase (decrease) | | | (171,701 | ) | | | (3,195,544 | ) | | | 23,447 | | | | (73,081 | ) | |
| Class D | |
| Subscriptions | | | — | | | | — | | | | 325 | | | | 6,302 | | |
| Distributions reinvested | | | — | | | | — | | | | 2,697 | | | | 49,352 | | |
| Redemptions | | | — | | | | — | | | | (23,738 | ) | | | (501,988 | ) | |
| Net decrease | | | — | | | | — | | | | (20,716 | ) | | | (446,334 | ) | |
| Class Z | |
| Subscriptions | | | 2,899,426 | | | | 57,635,847 | | | | 2,573,463 | | | | 52,576,443 | | |
| Proceeds received in connection with merger | | | — | | | | — | | | | 34,148,204 | | | | 632,523,647 | | |
| Distributions reinvested | | | 4,275,497 | | | | 90,127,466 | | | | 1,364,380 | | | | 25,644,886 | | |
| Redemptions | | | (5,258,470 | ) | | | (104,380,906 | ) | | | (6,593,538 | ) | | | (134,882,584 | ) | |
| Net increase | | | 1,916,453 | | | | 43,382,407 | | | | 31,492,509 | | | | 575,862,392 | | |
See Accompanying Notes to Financial Statements.
113
Statements of Changes in Net Assets – Capital Stock Activity
| | | Columbia Balanced Fund | |
| | | Year Ended
August 31, 2008 | | Year Ended
August 31, 2007(a) | |
| | | Shares | | Dollars ($) | | Shares | | Dollars ($) | |
| Class A | |
| Subscriptions | | | 234,243 | | | | 5,750,552 | | | | 110,270 | | | | 2,681,094 | | |
| Distributions reinvested | | | 7,632 | | | | 190,439 | | | | 3,676 | | | | 88,051 | | |
| Redemptions | | | (61,892 | ) | | | (1,526,712 | ) | | | (32,003 | ) | | | (776,233 | ) | |
| Net increase (decrease) | | | 179,983 | | | | 4,414,279 | | | | 81,943 | | | | 1,992,912 | | |
| Class B | |
| Subscriptions | | | 109,424 | | | | 2,682,377 | | | | 52,608 | | | | 1,272,939 | | |
| Distributions reinvested | | | 5,366 | | | | 134,645 | | | | 3,353 | | | | 79,857 | | |
| Redemptions | | | (81,305 | ) | | | (2,008,400 | ) | | | (95,621 | ) | | | (2,302,938 | ) | |
| Net increase (decrease) | | | 33,485 | | | | 808,622 | | | | (39,660 | ) | | | (950,142 | ) | |
| Class C | |
| Subscriptions | | | 85,196 | | | | 2,081,093 | | | | 32,183 | | | | 779,452 | | |
| Distributions reinvested | | | 1,568 | | | | 39,110 | | | | 652 | | | | 15,544 | | |
| Redemptions | | | (29,299 | ) | | | (722,081 | ) | | | (22,864 | ) | | | (550,355 | ) | |
| Net increase | | | 57,465 | | | | 1,398,122 | | | | 9,971 | | | | 244,641 | | |
| Class D | |
| Subscriptions | | | — | | | | — | | | | 3 | | | | 70 | | |
| Distributions reinvested | | | — | | | | — | | | | 107 | | | | 2,548 | | |
| Redemptions | | | — | | | | — | | | | (10,740 | ) | | | (265,417 | ) | |
| Net decrease | | | — | | | | — | | | | (10,630 | ) | | | (262,799 | ) | |
| Class Z | |
| Subscriptions | | | 575,998 | | | | 14,167,692 | | | | 444,096 | | | | 10,710,536 | | |
| Distributions reinvested | | | 230,027 | | | | 5,759,342 | | | | 196,343 | | | | 4,672,323 | | |
| Redemptions | | | (1,416,000 | ) | | | (34,980,088 | ) | | | (2,775,314 | ) | | | (66,195,619 | ) | |
| Net increase (decrease) | | | (609,975 | ) | | | (15,053,054 | ) | | | (2,134,875 | ) | | | (50,812,760 | ) | |
(a) Class D shares reflects activity for the period September 1, 2006 through August 8, 2007.
See Accompanying Notes to Financial Statements.
114
| | | Columbia Oregon Intermediate Municipal Bond Fund | |
| | | Year Ended
August 31, 2008 | | Year Ended
August 31, 2007(a) | |
| | | Shares | | Dollars ($) | | Shares | | Dollars ($) | |
| Class A | |
| Subscriptions | | | 534,896 | | | | 6,468,236 | | | | 43,446 | | | | 525,544 | | |
| Distributions reinvested | | | 13,577 | | | | 163,573 | | | | 7,435 | | | | 90,639 | | |
| Redemptions | | | (161,887 | ) | | | (1,955,965 | ) | | | (123,096 | ) | | | (1,495,102 | ) | |
| Net increase (decrease) | | | 386,586 | | | | 4,675,844 | | | | (72,215 | ) | | | (878,919 | ) | |
| Class B | |
| Subscriptions | | | 3,769 | | | | 45,316 | | | | 1,921 | | | | 23,528 | | |
| Distributions reinvested | | | 1,199 | | | | 14,466 | | | | 1,382 | | | | 16,844 | | |
| Redemptions | | | (27,814 | ) | | | (334,529 | ) | | | (7,814 | ) | | | (95,751 | ) | |
| Net increase (decrease) | | | (22,846 | ) | | | (274,747 | ) | | | (4,511 | ) | | | (55,379 | ) | |
| Class C | |
| Subscriptions | | | 585,163 | | | | 7,095,783 | | | | 48,928 | | | | 590,399 | | |
| Distributions reinvested | | | 5,168 | | | | 62,225 | | | | 1,504 | | | | 18,314 | | |
| Redemptions | | | (31,559 | ) | | | (380,864 | ) | | | (9,491 | ) | | | (114,092 | ) | |
| Net increase | | | 558,772 | | | | 6,777,144 | | | | 40,941 | | | | 494,621 | | |
| Class D | |
| Subscriptions | | | — | | | | — | | | | — | | | | — | | |
| Distributions reinvested | | | — | | | | — | | | | 758 | | | | 9,260 | | |
| Redemptions | | | — | | | | — | | | | (52,569 | ) | | | (634,043 | ) | |
| Net decrease | | | — | | | | — | | | | (51,811 | ) | | | (624,783 | ) | |
| Class Z | |
| Subscriptions | | | 3,436,233 | | | | 41,557,481 | | | | 2,417,758 | | | | 29,487,660 | | |
| Distributions reinvested | | | 938,095 | | | | 11,317,742 | | | | 913,001 | | | | 11,128,157 | | |
| Redemptions | | | (3,442,463 | ) | | | (41,619,688 | ) | | | (3,778,908 | ) | | | (45,996,322 | ) | |
| Net increase (decrease) | | | 931,865 | | | | 11,255,535 | | | | (448,149 | ) | | | (5,380,505 | ) | |
See Accompanying Notes to Financial Statements.
115
Statements of Changes in Net Assets – Capital Stock Activity
| | | Columbia Conservative High Yield Fund | |
| | | Year Ended
August 31, 2008 | | Year Ended
August 31, 2007(a) | |
| | | Shares | | Dollars ($) | | Shares | | Dollars ($) | |
| Class A | |
| Subscriptions | | | 1,848,022 | | | | 14,702,780 | | | | 1,220,391 | | | | 10,240,281 | | |
| Distributions reinvested | | | 612,446 | | | | 4,859,130 | | | | 927,200 | | | | 7,765,153 | | |
| Redemptions | | | (6,227,566 | ) | | | (49,559,113 | ) | | | (9,989,565 | ) | | | (83,827,891 | ) | |
| Net decrease | | | (3,767,098 | ) | | | (29,997,203 | ) | | | (7,841,974 | ) | | | (65,822,457 | ) | |
| Class B | |
| Subscriptions | | | 122,459 | | | | 967,631 | | | | 168,514 | | | | 1,415,018 | | |
| Distributions reinvested | | | 230,065 | | | | 1,824,137 | | | | 286,174 | | | | 2,395,502 | | |
| Redemptions | | | (1,558,840 | ) | | | (12,351,913 | ) | | | (2,312,398 | ) | | | (19,381,646 | ) | |
| Net decrease | | | (1,206,316 | ) | | | (9,560,145 | ) | | | (1,857,710 | ) | | | (15,571,126 | ) | |
| Class C | |
| Subscriptions | | | 95,162 | | | | 750,825 | | | | 3,187,235 | | | | 25,874,771 | | |
| Distributions reinvested | | | 137,201 | | | | 1,088,045 | | | | 54,238 | | | | 452,036 | | |
| Redemptions | | | (1,352,814 | ) | | | (10,813,809 | ) | | | (505,039 | ) | | | (4,215,649 | ) | |
| Net increase (decrease) | | | (1,120,451 | ) | | | (8,974,939 | ) | | | 2,736,434 | | | | 22,111,158 | | |
| Class D | |
| Subscriptions | | | — | | | | — | | | | 20,719 | | | | 174,982 | | |
| Distributions reinvested | | | — | | | | — | | | | 124,498 | | | | 1,044,851 | | |
| Redemptions | | | — | | | | — | | | | (4,537,960 | ) | | | (37,216,842 | ) | |
| Net decrease | | | — | | | | — | | | | (4,392,743 | ) | | | (35,997,009 | ) | |
| Class Z | |
| Subscriptions | | | 7,934,712 | | | | 63,102,454 | | | | 10,706,285 | | | | 89,841,124 | | |
| Distributions reinvested | | | 1,543,670 | | | | 12,239,087 | | | | 1,881,496 | | | | 15,747,576 | | |
| Redemptions | | | (26,827,150 | ) | | | (213,636,942 | ) | | | (33,893,132 | ) | | | (283,887,571 | ) | |
| Net decrease | | | (17,348,768 | ) | | | (138,295,401 | ) | | | (21,305,351 | ) | | | (178,298,871 | ) | |
(a) Class D shares reflects activity for the period September 1, 2006 through August 8, 2007.
See Accompanying Notes to Financial Statements.
116
Financial Highlights – Columbia International Stock Fund
Selected data for a share outstanding throughout each period is as follows:
| | | Year Ended August 31, | |
| Class A Shares | | 2008 | | 2007 | | 2006 | | 2005 | | 2004 | |
| Net Asset Value, Beginning of Period | | $ | 19.93 | | | $ | 18.89 | | | $ | 15.76 | | | $ | 13.04 | | | $ | 11.34 | | |
| Income from Investment Operations: | |
| Net investment income (a) | | | 0.37 | (h) | | | 0.26 | | | | 0.26 | | | | 0.25 | | | | 0.01 | | |
Net realized and unrealized gain (loss) on investments,
foreign currency, foreign capital gains tax
and written options | | | (3.43 | ) | | | 3.04 | | | | 3.17 | | | | 2.47 | | | | 1.69 | | |
| Total from investment operations | | | (3.06 | ) | | | 3.30 | | | | 3.43 | | | | 2.72 | | | | 1.70 | | |
| Less Distributions to Shareholders: | |
| From net investment income | | | (0.64 | ) | | | (0.29 | ) | | | (0.13 | ) | | | — | (b) | | | — | | |
| From net realized gains | | | (2.21 | ) | | | (1.97 | ) | | | (0.17 | ) | | | — | | | | — | | |
| Total distributions to shareholders | | | (2.85 | ) | | | (2.26 | ) | | | (0.30 | ) | | | — | (b) | | | — | | |
| Redemption Fees: | |
| Redemption fees added to paid-in-capital (a)(b) | | | — | | | | — | | | | — | | | | — | | | | — | | |
| Net Asset Value, End of Period | | $ | 14.02 | | | $ | 19.93 | | | $ | 18.89 | | | $ | 15.76 | | | $ | 13.04 | | |
| Total return (c)(d) | | | (17.74 | )% | | | 18.46 | %(e) | | | 21.98 | % | | | 20.89 | % | | | 14.99 | % | |
| Ratios to Average Net Assets/Supplemental Data: | |
| Net expenses before interest expense (f) | | | 1.23 | % | | | 1.24 | % | | | 1.19 | % | | | 1.25 | % | | | 1.72 | % | |
| Interest expense | | | — | %(g) | | | — | %(g) | | | — | %(g) | | | — | | | | — | | |
| Net expenses (f) | | | 1.23 | % | | | 1.24 | % | | | 1.19 | % | | | 1.25 | % | | | 1.72 | % | |
| Waiver/Reimbursement | | | 0.09 | % | | | 0.10 | % | | | 0.08 | % | | | 0.09 | % | | | 0.09 | % | |
| Net investment income (f) | | | 2.17 | % | | | 1.33 | % | | | 1.49 | % | | | 1.71 | % | | | 0.10 | % | |
| Portfolio turnover rate | | | 63 | % | | | 65 | % | | | 95 | % | | | 66 | % | | | 90 | % | |
| Net assets, end of period (000's) | | $ | 218,484 | | | $ | 297,149 | | | $ | 277,295 | | | $ | 71,270 | | | $ | 24,119 | | |
(a) Per share data was calculated using the average shares outstanding during the period.
(b) Rounds to less than $0.01 per share.
(c) Total return at net asset value assuming all distributions reinvested and no initial sales charge or contingent deferred sales charge.
(d) Had the investment advisor and/or any of its affiliates not waived fees or reimbursed a portion of expenses, total return would have been reduced.
(e) Total return includes a voluntary reimbursement by the investment advisor for a realized investment loss due to a trading error. This reimbursement increased total return and net asset value per share by less than 0.01% and less than $0.01, respectively.
(f) The benefits derived from expense reductions had an impact of less than 0.01%.
(g) Rounds to less than 0.01%.
(h) Net investment income per share reflects a special dividend. The effect of this dividend amounted to $0.04 per share.
See Accompanying Notes to Financial Statements.
117
Financial Highlights – Columbia International Stock Fund
Selected data for a share outstanding throughout each period is as follows:
| | | Year Ended August 31, | |
| Class B Shares | | 2008 | | 2007 | | 2006 | | 2005 | | 2004 | |
| Net Asset Value, Beginning of Period | | $ | 19.40 | | | $ | 18.44 | | | $ | 15.37 | | | $ | 12.81 | | | $ | 11.23 | | |
| Income from Investment Operations: | |
| Net investment income (loss) (a) | | | 0.20 | (h) | | | 0.09 | | | | 0.11 | | | | 0.07 | | | | (0.09 | ) | |
Net realized and unrealized gain (loss) on investments,
foreign currency, foreign capital gains tax
and written options | | | (3.29 | ) | | | 2.99 | | | | 3.14 | | | | 2.49 | | | | 1.67 | | |
| Total from investment operations | | | (3.09 | ) | | | 3.08 | | | | 3.25 | | | | 2.56 | | | | 1.58 | | |
| Less Distributions to Shareholders: | |
| From net investment income | | | (0.49 | ) | | | (0.15 | ) | | | (0.01 | ) | | | — | | | | — | | |
| From net realized gains | | | (2.21 | ) | | | (1.97 | ) | | | (0.17 | ) | | | — | | | | — | | |
| Total distributions to shareholders | | | (2.70 | ) | | | (2.12 | ) | | | (0.18 | ) | | | — | | | | — | | |
| Redemption Fees: | |
| Redemption fees added to paid-in-capital (a)(b) | | | — | | | | — | | | | — | | | | — | | | | — | | |
| Net Asset Value, End of Period | | $ | 13.61 | | | $ | 19.40 | | | $ | 18.44 | | | $ | 15.37 | | | $ | 12.81 | | |
| Total return (c)(d) | | | (18.31 | )% | | | 17.54 | %(e) | | | 21.30 | % | | | 19.98 | % | | | 14.07 | % | |
| Ratios to Average Net Assets/Supplemental Data: | |
| Net expenses before interest expense (f) | | | 1.98 | % | | | 1.99 | % | | | 1.94 | % | | | 2.01 | % | | | 2.50 | % | |
| Interest expense | | | — | %(g) | | | — | %(g) | | | — | %(g) | | | — | | | | — | | |
| Net expenses (f) | | | 1.98 | % | | | 1.99 | % | | | 1.94 | % | | | 2.01 | % | | | 2.50 | % | |
| Waiver/Reimbursement | | | 0.09 | % | | | 0.10 | % | | | 0.08 | % | | | 0.10 | % | | | 0.18 | % | |
| Net investment income (loss) (f) | | | 1.18 | % | | | 0.49 | % | | | 0.62 | % | | | 0.47 | % | | | (0.69 | )% | |
| Portfolio turnover rate | | | 63 | % | | | 65 | % | | | 95 | % | | | 66 | % | | | 90 | % | |
| Net assets, end of period (000's) | | $ | 13,580 | | | $ | 29,925 | | | $ | 42,585 | | | $ | 12,026 | | | $ | 10,221 | | |
(a) Per share data was calculated using the average shares outstanding during the period.
(b) Rounds to less than $0.01 per share.
(c) Total return at net asset value assuming all distributions reinvested and no contingent deferred sales charge.
(d) Had the investment advisor and/or any of its affiliates not waived fees or reimbursed a portion of expenses, total return would have been reduced.
(e) Total return includes a voluntary reimbursement by the investment advisor for a realized investment loss due to a trading error. This reimbursement increased total return and net asset value per share by less than 0.01% and less than $0.01, respectively.
(f) The benefits derived from expense reductions had an impact of less than 0.01%.
(g) Rounds to less than 0.01%.
(h) Net investment income per share reflects a special dividend. The effect of this dividend amounted to $0.04 per share.
See Accompanying Notes to Financial Statements.
118
Financial Highlights – Columbia International Stock Fund
Selected data for a share outstanding throughout each period is as follows:
| | | Year Ended August 31, | | Period Ended
August 31, | |
| Class C Shares | | 2008 | | 2007 | | 2006 | | 2005 | | 2004 (a) | |
| Net Asset Value, Beginning of Period | | $ | 19.49 | | | $ | 18.51 | | | $ | 15.43 | | | $ | 12.86 | | | $ | 12.27 | | |
| Income from Investment Operations: | |
| Net investment income (loss) (b) | | | 0.23 | (k) | | | 0.11 | | | | 0.13 | | | | 0.07 | | | | (0.01 | ) | |
Net realized and unrealized gain (loss) on
investments, foreign currency, foreign
capital gains tax and written options | | | (3.34 | ) | | | 2.99 | | | | 3.13 | | | | 2.50 | | | | 0.60 | | |
| Total from investment operations | | | (3.11 | ) | | | 3.10 | | | | 3.26 | | | | 2.57 | | | | 0.59 | | |
| Less Distributions to Shareholders: | |
| From net investment income | | | (0.49 | ) | | | (0.15 | ) | | | (0.01 | ) | | | — | | | | — | | |
| From net realized gains | | | (2.21 | ) | | | (1.97 | ) | | | (0.17 | ) | | | — | | | | — | | |
| Total distributions to shareholders | | | (2.70 | ) | | | (2.12 | ) | | | (0.18 | ) | | | — | | | | — | | |
| Redemption Fees: | |
| Redemption fees added to paid-in-capital (b)(c) | | | — | | | | — | | | | — | | | | — | | | | — | | |
| Net Asset Value, End of Period | | $ | 13.68 | | | $ | 19.49 | | | $ | 18.51 | | | $ | 15.43 | | | $ | 12.86 | | |
| Total return (d)(e) | | | (18.33 | )% | | | 17.59 | %(f) | | | 21.28 | % | | | 19.98 | % | | | 4.81 | %(g) | |
| Ratios to Average Net Assets/Supplemental Data: | |
| Net expenses before interest expense (h) | | | 1.98 | % | | | 1.99 | % | | | 1.94 | % | | | 2.01 | % | | | 2.11 | %(i) | |
| Interest expense | | | — | %(j) | | | — | %(j) | | | — | %(j) | | | — | | | | — | | |
| Net expenses (h) | | | 1.98 | % | | | 1.99 | % | | | 1.94 | % | | | 2.01 | % | | | 2.11 | %(i) | |
| Waiver/Reimbursement | | | 0.09 | % | | | 0.10 | % | | | 0.08 | % | | | 0.10 | % | | | 0.35 | %(i) | |
| Net investment income (loss) (h) | | | 1.38 | % | | | 0.57 | % | | | 0.75 | % | | | 0.46 | % | | | (0.05 | )%(i) | |
| Portfolio turnover rate | | | 63 | % | | | 65 | % | | | 95 | % | | | 66 | % | | | 90 | % | |
| Net assets, end of period (000's) | | $ | 19,946 | | | $ | 29,144 | | | $ | 27,806 | | | $ | 904 | | | $ | 632 | | |
(a) Class C shares were initially offered on October 13, 2003. Per share data and total return reflect activity from that date.
(b) Per share data was calculated using the average shares outstanding during the period.
(c) Rounds to less than $0.01 per share.
(d) Total return at net asset value assuming all distributions reinvested and no contingent deferred sales charge.
(e) Had the investment advisor and/or any of its affiliates not waived fees or reimbursed a portion of expenses, total return would have been reduced.
(f) Total return includes a voluntary reimbursement by the investment advisor for a realized investment loss due to a trading error. This reimbursement increased total return and net asset value per share by less than 0.01% and less than $0.01, respectively.
(g) Not annualized.
(h) The benefits derived from expense reductions had an impact of less than 0.01%.
(i) Annualized.
(j) Rounds to less than 0.01%.
(k) Net investment income per share reflects a special dividend. The effect of this dividend amounted to $0.04 per share.
See Accompanying Notes to Financial Statements.
119
Financial Highlights – Columbia International Stock Fund
Selected data for a share outstanding throughout each period is as follows:
| | | Year Ended August 31, | |
| Class Z Shares | | 2008 | | 2007 | | 2006 | | 2005 | | 2004 | |
| Net Asset Value, Beginning of Period | | $ | 20.09 | | | $ | 19.03 | | | $ | 15.85 | | | $ | 13.14 | | | $ | 11.40 | | |
| Income from Investment Operations: | |
| Net investment income (a) | | | 0.40 | (h) | | | 0.31 | | | | 0.29 | | | | 0.25 | | | | 0.11 | | |
Net realized and unrealized gain (loss)
on investments, foreign currency,
foreign capital gains tax and written options | | | (3.44 | ) | | | 3.06 | | | | 3.23 | | | | 2.53 | | | | 1.67 | | |
| Total from investment operations | | | (3.04 | ) | | | 3.37 | | | | 3.52 | | | | 2.78 | | | | 1.78 | | |
| Less Distributions to Shareholders: | |
| From net investment income | | | (0.69 | ) | | | (0.34 | ) | | | (0.17 | ) | | | (0.07 | ) | | | (0.04 | ) | |
| From net realized gains | | | (2.21 | ) | | | (1.97 | ) | | | (0.17 | ) | | | — | | | | — | | |
| Total distributions to shareholders | | | (2.90 | ) | | | (2.31 | ) | | | (0.34 | ) | | | (0.07 | ) | | | (0.04 | ) | |
| Redemption Fees: | |
| Redemption fees added to paid-in-capital (a)(b) | | | — | | | | — | | | | — | | | | — | | | | — | | |
| Net Asset Value, End of Period | | $ | 14.15 | | | $ | 20.09 | | | $ | 19.03 | | | $ | 15.85 | | | $ | 13.14 | | |
| Total return (c)(d) | | | (17.52 | )% | | | 18.73 | %(e) | | | 22.45 | % | | | 21.20 | % | | | 15.65 | % | |
Ratios to Average Net Assets/
Supplemental Data: | |
| Net expenses before interest expense (f) | | | 0.98 | % | | | 0.99 | % | | | 0.94 | % | | | 1.00 | % | | | 1.10 | % | |
| Interest expense | | | — | %(g) | | | — | %(g) | | | — | %(g) | | | — | | | | — | | |
| Net expenses (f) | | | 0.98 | % | | | 0.99 | % | | | 0.94 | % | | | 1.00 | % | | | 1.10 | % | |
| Waiver/Reimbursement | | | 0.09 | % | | | 0.10 | % | | | 0.08 | % | | | 0.10 | % | | | 0.18 | % | |
| Net investment income (f) | | | 2.32 | % | | | 1.55 | % | | | 1.63 | % | | | 1.71 | % | | | 0.81 | % | |
| Portfolio turnover rate | | | 63 | % | | | 65 | % | | | 95 | % | | | 66 | % | | | 90 | % | |
| Net assets, end of period (000's) | | $ | 636,992 | | | $ | 1,011,212 | | | $ | 1,005,878 | | | $ | 964,495 | | | $ | 558,082 | | |
(a) Per share data was calculated using the average shares outstanding during the period.
(b) Rounds to less than $0.01 per share.
(c) Total return at net asset value assuming all distributions reinvested.
(d) Had the investment advisor and/or any of its affiliates not waived fees or reimbursed a portion of expenses, total return would have been reduced.
(e) Total return includes a voluntary reimbursement by the investment advisor for a realized investment loss due to a trading error. This reimbursement increased total return and net asset value per share by less than 0.01% and less than $0.01, respectively.
(f) The benefits derived from expense reductions had an impact of less than 0.01%.
(g) Rounds to less than 0.01%.
(h) Net investment income per share reflects a special dividend. The effect of this dividend amounted to $0.04 per share.
See Accompanying Notes to Financial Statements.
120
Financial Highlights – Columbia Mid Cap Growth Fund
Selected data for a share outstanding throughout each period is as follows:
| | | Year Ended August 31, | |
| Class A Shares | | 2008 | | 2007 | | 2006 | | 2005 | | 2004 | |
| Net Asset Value, Beginning of Period | | $ | 27.51 | | | $ | 24.01 | | | $ | 22.16 | | | $ | 16.99 | | | $ | 18.09 | | |
| Income from Investment Operations: | |
| Net investment loss (a) | | | (0.12 | ) | | | (0.01 | )(b) | | | (0.10 | ) | | | (0.15 | ) | | | (0.23 | ) | |
Net realized and unrealized gain (loss)
on investments, foreign currency
and written options | | | (0.06 | ) | | | 4.97 | | | | 2.26 | | | | 5.32 | | | | (0.87 | ) | |
| Total from investment operations | | | (0.18 | ) | | | 4.96 | | | | 2.16 | | | | 5.17 | | | | (1.10 | ) | |
| Less Distributions to Shareholders: | |
| From net realized gains | | | (3.86 | ) | | | (1.46 | ) | | | (0.31 | ) | | | — | | | | — | | |
| Net Asset Value, End of Period | | $ | 23.47 | | | $ | 27.51 | | | $ | 24.01 | | | $ | 22.16 | | | $ | 16.99 | | |
| Total return (c) | | | (2.21 | )% | | | 21.24 | % | | | 9.76 | %(d) | | | 30.43 | %(d) | | | (6.08 | )%(d) | |
| Ratios to Average Net Assets/Supplemental Data: | |
| Net expenses before interest expense (e) | | | 1.18 | % | | | 1.17 | % | | | 1.21 | % | | | 1.23 | % | | | 1.53 | % | |
| Interest expense | | | — | %(f) | | | — | %(f) | | | — | | | | — | %(f) | | | — | | |
| Net expenses (e) | | | 1.18 | % | | | 1.17 | % | | | 1.21 | % | | | 1.23 | % | | | 1.53 | % | |
| Waiver/Reimbursement | | | — | | | | — | | | | 0.01 | % | | | 0.05 | % | | | 0.02 | % | |
| Net investment loss (e) | | | (0.48 | )% | | | (0.05 | )% | | | (0.43 | )% | | | (0.76 | )% | | | (1.21 | )% | |
| Portfolio turnover rate | | | 149 | % | | | 171 | % | | | 67 | % | | | 104 | % | | | 139 | % | |
| Net assets, end of period (000's) | | $ | 63,337 | | | $ | 49,614 | | | $ | 12,654 | | | $ | 6,078 | | | $ | 4,432 | | |
(a) Per share data was calculated using the average shares outstanding during the period.
(b) Net investment income per share reflects special dividends. The effect of these dividends amounted to $0.07 per share.
(c) Total return at net asset value assuming all distributions reinvested and no initial sales charge or contingent deferred sales charge.
(d) Had the investment advisor and/or any of its affiliates not waived fees or reimbursed a portion of expenses, total return would have been reduced.
(e) The benefits derived from expense reductions had an impact of less than 0.01%.
(f) Rounds to less than 0.01%.
See Accompanying Notes to Financial Statements.
121
Financial Highlights – Columbia Mid Cap Growth Fund
Selected data for a share outstanding throughout each period is as follows:
| | | Year Ended August 31, | |
| Class B Shares | | 2008 | | 2007 | | 2006 | | 2005 | | 2004 | |
| Net Asset Value, Beginning of Period | | $ | 26.47 | | | $ | 23.32 | | | $ | 21.69 | | | $ | 16.75 | | | $ | 17.98 | | |
| Income from Investment Operations: | |
| Net investment loss (a) | | | (0.30 | ) | | | (0.20 | )(b) | | | (0.28 | ) | | | (0.30 | ) | | | (0.36 | ) | |
Net realized and unrealized gain (loss)
on investments, foreign currency
and written options | | | (0.04 | ) | | | 4.81 | | | | 2.22 | | | | 5.24 | | | | (0.87 | ) | |
| Total from investment operations | | | (0.34 | ) | | | 4.61 | | | | 1.94 | | | | 4.94 | | | | (1.23 | ) | |
| Less Distributions to Shareholders: | |
| From net realized gains | | | (3.78 | ) | | | (1.46 | ) | | | (0.31 | ) | | | — | | | | — | | |
| Net Asset Value, End of Period | | $ | 22.35 | | | $ | 26.47 | | | $ | 23.32 | | | $ | 21.69 | | | $ | 16.75 | | |
| Total return (c) | | | (2.92 | )% | | | 20.33 | % | | | 8.95 | %(d) | | | 29.49 | %(d) | | | (6.84 | )%(d) | |
| Ratios to Average Net Assets/Supplemental Data: | |
| Net expenses before interest expense (e) | | | 1.93 | % | | | 1.92 | % | | | 1.96 | % | | | 1.98 | % | | | 2.29 | % | |
| Interest expense | | | — | %(f) | | | — | %(f) | | | — | | | | — | %(f) | | | — | | |
| Net expenses (e) | | | 1.93 | % | | | 1.92 | % | | | 1.96 | % | | | 1.98 | % | | | 2.29 | % | |
| Waiver/Reimbursement | | | — | | | | — | | | | 0.01 | % | | | 0.05 | % | | | 0.10 | % | |
| Net investment loss (e) | | | (1.23 | )% | | | (0.79 | )% | | | (1.19 | )% | | | (1.51 | )% | | | (1.97 | )% | |
| Portfolio turnover rate | | | 149 | % | | | 171 | % | | | 67 | % | | | 104 | % | | | 139 | % | |
| Net assets, end of period (in 000's) | | $ | 15,829 | | | $ | 19,472 | | | $ | 7,452 | | | $ | 6,377 | | | $ | 5,079 | | |
(a) Per share data was calculated using the average shares outstanding during the period.
(b) Net investment income per share reflects special dividends. The effect of these dividends amounted to $0.07 per share.
(c) Total return at net asset value assuming all distributions reinvested and no contingent deferred sales charge.
(d) Had the investment advisor and/or any of its affiliates not waived fees or reimbursed a portion of expenses, total return would have been reduced.
(e) The benefits derived from expense reductions had an impact of less than 0.01%.
(f) Rounds to less than 0.01%.
See Accompanying Notes to Financial Statements.
122
Financial Highlights – Columbia Mid Cap Growth Fund
Selected data for a share outstanding throughout each period is as follows:
| | | Year Ended August 31, | | Period Ended
August 31, | |
| Class C Shares | | 2008 | | 2007 | | 2006 | | 2005 | | 2004 (a) | |
| Net Asset Value, Beginning of Period | | $ | 26.53 | | | $ | 23.37 | | | $ | 21.74 | | | $ | 16.79 | | | $ | 17.88 | | |
| Income from Investment Operations: | |
| Net investment loss (b) | | | (0.30 | ) | | | (0.21 | )(c) | | | (0.28 | ) | | | (0.30 | ) | | | (0.30 | ) | |
Net realized and unrealized gain (loss) on investments,
foreign currency and written options | | | (0.04 | ) | | | 4.83 | | | | 2.22 | | | | 5.25 | | | | (0.79 | ) | |
| Total from investment operations | | | (0.34 | ) | | | 4.62 | | | | 1.94 | | | | 4.95 | | | | (1.09 | ) | |
| Less Distributions to Shareholders: | |
| From net realized gains | | | (3.78 | ) | | | (1.46 | ) | | | (0.31 | ) | | | — | | | | — | | |
| Net Asset Value, End of Period | | $ | 22.41 | | | $ | 26.53 | | | $ | 23.37 | | | $ | 21.74 | | | $ | 16.79 | | |
| Total return (d) | | | (2.91 | )% | | | 20.33 | % | | | 8.93 | %(e) | | | 29.48 | %(e) | | | (6.10 | )%(e)(f) | |
| Ratios to Average Net Assets/Supplemental Data: | |
| Net expenses before interest expense (g) | | | 1.93 | % | | | 1.92 | % | | | 1.96 | % | | | 1.98 | % | | | 2.18 | %(h) | |
| Interest expense | | | — | %(i) | | | — | %(i) | | | — | | | | — | %(i) | | | — | | |
| Net expenses (g) | | | 1.93 | % | | | 1.92 | % | | | 1.96 | % | | | 1.98 | % | | | 2.18 | %(h) | |
| Waiver/Reimbursement | | | — | | | | — | | | | 0.01 | % | | | 0.05 | % | | | 0.08 | %(h) | |
| Net investment loss (g) | | | (1.23 | )% | | | (0.81 | )% | | | (1.16 | )% | | | (1.52 | )% | | | (1.83 | )%(h) | |
| Portfolio turnover rate | | | 149 | % | | | 171 | % | | | 67 | % | | | 104 | % | | | 139 | % | |
| Net assets, end of period (000's) | | $ | 13,540 | | | $ | 8,237 | | | $ | 2,454 | | | $ | 674 | | | $ | 501 | | |
(a) Class C shares were initially offered on October 13, 2003. Per share data and total return reflect activity from that date.
(b) Per share data was calculated using the average shares outstanding during the period.
(c) Net investment income per share reflects special dividends. The effect of these dividends amounted to $0.07 per share.
(d) Total return at net asset value assuming all distributions reinvested and no contingent deferred sales charge.
(e) Had the investment advisor and/or any of its affiliates not waived fees or reimbursed a portion of expenses, total return would have been reduced.
(f) Not annualized.
(g) The benefits derived from expense reductions had an impact of less than 0.01%.
(h) Annualized.
(i) Rounds to less than 0.01%.
See Accompanying Notes to Financial Statements.
123
Financial Highlights – Columbia Mid Cap Growth Fund
Selected data for a share outstanding throughout each period is as follows:
| | | Year Ended August 31, | | Period Ended
August 31, | |
| Class R Shares | | 2008 | | 2007 | | 2006 (a) | |
| Net Asset Value, Beginning of Period | | $ | 27.39 | | | $ | 23.97 | | | $ | 24.44 | | |
| Income from Investment Operations: | |
| Net investment loss (b) | | | (0.18 | ) | | | (0.15 | )(c) | | | (0.10 | ) | |
Net realized and unrealized gain (loss) on investments,
foreign currency and written options | | | (0.06 | ) | | | 5.03 | | | | (0.37 | ) | |
| Total from investment operations | | | (0.24 | ) | | | 4.88 | | | | (0.47 | ) | |
| Less Distributions to Shareholders: | |
| From net realized gains | | | (3.83 | ) | | | (1.46 | ) | | | — | | |
| Net Asset Value, End of Period | | $ | 23.32 | | | $ | 27.39 | | | $ | 23.97 | | |
| Total return (d) | | | (2.44 | )% | | | 20.93 | % | | | (1.92 | )%(e) | |
| Ratios to Average Net Assets/Supplemental Data: | |
| Net expenses before interest expense (f) | | | 1.43 | % | | | 1.42 | % | | | 1.47 | %(g) | |
| Interest expense | | | — | %(h) | | | — | %(h) | | | — | | |
| Net expenses (f) | | | 1.43 | % | | | 1.42 | % | | | 1.47 | %(g) | |
| Net investment loss (f) | | | (0.74 | )% | | | (0.57 | )% | | | (0.66 | )%(g) | |
| Portfolio turnover rate | | | 149 | % | | | 171 | % | | | 67 | % | |
| Net assets, end of period (000's) | | $ | 1,800 | | | $ | 908 | | | $ | 57 | | |
(a) Class R shares were initially offered on January 23, 2006. Total return reflects activity from that date.
(b) Per share data was calculated using the average shares outstanding during the period.
(c) Net investment income per share reflects special dividends. The effect of these dividends amounted to $0.07 per share.
(d) Total return at net asset value assuming all distributions reinvested.
(e) Not annualized.
(f) The benefits derived from expense reductions had an impact of less than 0.01%.
(g) Annualized.
(h) Rounds to less than 0.01%.
See Accompanying Notes to Financial Statements.
124
Financial Highlights – Columbia Mid Cap Growth Fund
Selected data for a share outstanding throughout each period is as follows:
| | | Year Ended August 31, | |
| Class T Shares | | 2008 | | 2007 | | 2006 | | 2005 | | 2004 | |
| Net Asset Value, Beginning of Period | | $ | 27.53 | | | $ | 24.04 | | | $ | 22.20 | | | $ | 17.03 | | | $ | 18.12 | | |
| Income from Investment Operations: | |
| Net investment loss (a) | | | (0.14 | ) | | | (0.03 | )(b) | | | (0.12 | ) | | | (0.16 | ) | | | (0.22 | ) | |
Net realized and unrealized gain (loss)
on investments, foreign currency
and written options | | | (0.06 | ) | | | 4.98 | | | | 2.27 | | | | 5.33 | | | | (0.87 | ) | |
| Total from investment operations | | | (0.20 | ) | | | 4.95 | | | | 2.15 | | | | 5.17 | | | | (1.09 | ) | |
| Less Distributions to Shareholders: | |
| From net realized gains | | | (3.85 | ) | | | (1.46 | ) | | | (0.31 | ) | | | — | | | | — | | |
| Net Asset Value, End of Period | | $ | 23.48 | | | $ | 27.53 | | | $ | 24.04 | | | $ | 22.20 | | | $ | 17.03 | | |
| Total return (c) | | | (2.27 | )% | | | 21.17 | % | | | 9.70 | %(d) | | | 30.36 | %(d) | | | (6.02 | )%(d) | |
| Ratios to Average Net Assets/Supplemental Data: | |
| Net expenses before interest expense (e) | | | 1.23 | % | | | 1.22 | % | | | 1.26 | % | | | 1.28 | % | | | 1.50 | % | |
| Interest expense | | | — | %(f) | | | — | %(f) | | | — | | | | — | %(f) | | | — | | |
| Net expenses (e) | | | 1.23 | % | | | 1.22 | % | | | 1.26 | % | | | 1.28 | % | | | 1.50 | % | |
| Waiver/Reimbursement | | | — | | | | — | | | | 0.01 | % | | | 0.05 | % | | | 0.01 | % | |
| Net investment loss (e) | | | (0.53 | )% | | | (0.10 | )% | | | (0.50 | )% | | | (0.82 | )% | | | (1.19 | )% | |
| Portfolio turnover rate | | | 149 | % | | | 171 | % | | | 67 | % | | | 104 | % | | | 139 | % | |
| Net assets, end of period (000's) | | $ | 26,801 | | | $ | 29,282 | | | $ | 27,101 | | | $ | 27,969 | | | $ | 25,236 | | |
(a) Per share data was calculated using the average shares outstanding during the period.
(b) Net investment income per share reflects special dividends. The effect of these dividends amounted to $0.07 per share.
(c) Total return at net asset value assuming all distributions reinvested and no initial sales charge or contingent deferred sales charge.
(d) Had the investment advisor and/or any of its affiliates not waived fees or reimbursed a portion of expenses, total return would have been reduced.
(e) The benefits derived from expense reductions had an impact of less than 0.01%.
(f) Rounds to less than 0.01%.
See Accompanying Notes to Financial Statements.
125
Financial Highlights – Columbia Mid Cap Growth Fund
Selected data for a share outstanding throughout each period is as follows:
| | | Year Ended August 31, | |
| Class Z Shares | | 2008 | | 2007 | | 2006 | | 2005 | | 2004 | |
| Net Asset Value, Beginning of Period | | $ | 27.93 | | | $ | 24.35 | | | $ | 22.41 | | | $ | 17.14 | | | $ | 18.17 | | |
| Income from Investment Operations: | |
| Net investment income (loss) (a) | | | (0.06 | ) | | | 0.05 | (b) | | | (0.05 | ) | | | (0.10 | ) | | | (0.14 | ) | |
Net realized and unrealized gain (loss) on investments,
foreign currency and written options | | | (0.07 | ) | | | 5.04 | | | | 2.30 | | | | 5.37 | | | | (0.89 | ) | |
| Total from investment operations | | | (0.13 | ) | | | 5.09 | | | | 2.25 | | | | 5.27 | | | | (1.03 | ) | |
| Less Distributions to Shareholders: | |
| From net investment income | | | — | | | | (0.05 | ) | | | — | | | | — | | | | — | | |
| From net realized gains | | | (3.88 | ) | | | (1.46 | ) | | | (0.31 | ) | | | — | | | | — | | |
| Total distributions to shareholders | | | (3.88 | ) | | | (1.51 | ) | | | (0.31 | ) | | | — | | | | — | | |
| Net Asset Value, End of Period | | $ | 23.92 | | | $ | 27.93 | | | $ | 24.35 | | | $ | 22.41 | | | $ | 17.14 | | |
| Total return (c) | | | (1.97 | )% | | | 21.49 | % | | | 10.06 | %(d) | | | 30.75 | %(d) | | | (5.67 | )%(d) | |
| Ratios to Average Net Assets/Supplemental Data: | |
| Net expenses before interest expense (e) | | | 0.93 | % | | | 0.92 | % | | | 0.96 | % | | | 0.98 | % | | | 1.07 | % | |
| Interest expense | | | — | %(f) | | | — | %(f) | | | — | | | | — | %(f) | | | — | | |
| Net expenses (e) | | | 0.93 | % | | | 0.92 | % | | | 0.96 | % | | | 0.98 | % | | | 1.07 | % | |
| Waiver/Reimbursement | | | — | | | | — | | | | 0.01 | % | | | 0.05 | % | | | 0.05 | % | |
| Net investment income (loss) (e) | | | (0.23 | )% | | | 0.20 | % | | | (0.20 | )% | | | (0.52 | )% | | | (0.75 | )% | |
| Portfolio turnover rate | | | 149 | % | | | 171 | % | | | 67 | % | | | 104 | % | | | 139 | % | |
| Net assets, end of period (000's) | | $ | 1,286,857 | | | $ | 1,452,707 | | | $ | 807,089 | | | $ | 799,505 | | | $ | 825,988 | | |
(a) Per share data was calculated using the average shares outstanding during the period.
(b) Net investment income per share reflects special dividends. The effect of these dividends amounted to $0.07 per share.
(c) Total return at net asset value assuming all distributions reinvested.
(d) Had the investment advisor and/or any of its affiliates not waived fees or reimbursed a portion of expenses, total return would have been reduced.
(e) The benefits derived from expense reductions had an impact of less than 0.01%.
(f) Rounds to less than 0.01%.
See Accompanying Notes to Financial Statements.
126
Financial Highlights – Columbia Small Cap Growth Fund I
Selected data for a share outstanding throughout each period is as follows:
| | | Year Ended August 31, | | Period Ended
August 31, | |
| Class A Shares | | 2008 | | 2007 | | 2006 (a) | |
| Net Asset Value, Beginning of Period | | $ | 31.69 | | | $ | 30.29 | | | $ | 27.47 | | |
| Income from Investment Operations: | |
| Net investment loss (b) | | | (0.24 | ) | | | (0.25 | ) | | | (0.30 | ) | |
Net realized and unrealized gain on investments,
foreign currency and written options | | | 0.17 | | | | 6.38 | | | | 4.01 | | |
| Total from investment operations | | | (0.07 | ) | | | 6.13 | | | | 3.71 | | |
| Less Distributions to Shareholders: | |
| From net realized gains | | | (3.80 | ) | | | (4.73 | ) | | | (0.89 | ) | |
| Net Asset Value, End of Period | | $ | 27.82 | | | $ | 31.69 | | | $ | 30.29 | | |
| Total return (c) | | | (1.34 | )%(d) | | | 21.96 | % | | | 13.73 | %(e) | |
| Ratios to Average Net Assets/Supplemental Data: | |
| Net expenses before interest expense (f) | | | 1.37 | % | | | 1.40 | % | | | 1.46 | %(g) | |
| Interest expense | | | — | | | | — | %(h) | | | — | %(g)(h) | |
| Net expenses (f) | | | 1.37 | % | | | 1.40 | % | | | 1.46 | %(g) | |
| Net investment loss (f) | | | (0.82 | )% | | | (0.82 | )% | | | (1.15 | )%(g) | |
| Portfolio turnover rate | | | 165 | % | | | 151 | % | | | 109 | % | |
| Net assets, end of period (000's) | | $ | 44,184 | | | $ | 18,430 | | | $ | 2,836 | | |
(a) Class A shares were initially offered November 1, 2005.
(b) Per share data was calculated using the average shares outstanding during the period.
(c) Total return at net asset value assuming all distributions reinvested and no initial sales charge or contingent deferred sales charge.
(d) Total return includes a voluntary reimbursement by the investment advisor for a realized investment loss due to a trading error. This reimbursement increased total return and net asset value per share by less than 0.01% and $0.01, respectively.
(e) Not annualized.
(f) The benefits derived from expense reductions had an impact of less than 0.01%.
(g) Annualized.
(h) Rounds to less than 0.01%.
See Accompanying Notes to Financial Statements.
127
Financial Highlights – Columbia Small Cap Growth Fund I
Selected data for a share outstanding throughout each period is as follows:
| | | Year Ended August 31, | | Period Ended
August 31, | |
| Class B Shares | | 2008 | | 2007 | | 2006 (a) | |
| Net Asset Value, Beginning of Period | | $ | 31.26 | | | $ | 30.14 | | | $ | 27.47 | | |
| Income from Investment Operations: | |
| Net investment loss (b) | | | (0.45 | ) | | | (0.48 | ) | | | (0.50 | ) | |
Net realized and unrealized gain on investments,
foreign currency and written options | | | 0.14 | | | | 6.33 | | | | 4.06 | | |
| Total from investment operations | | | (0.31 | ) | | | 5.85 | | | | 3.56 | | |
| Less Distributions to Shareholders: | |
| From net realized gains | | | (3.56 | ) | | | (4.73 | ) | | | (0.89 | ) | |
| Net Asset Value, End of Period | | $ | 27.39 | | | $ | 31.26 | | | $ | 30.14 | | |
| Total return (c) | | | (2.10 | )%(d) | | | 21.05 | % | | | 13.17 | %(e) | |
| Ratios to Average Net Assets/Supplemental Data: | |
| Net expenses before interest expense (f) | | | 2.12 | % | | | 2.15 | % | | | 2.21 | %(g) | |
| Interest expense | | | — | | | | — | %(h) | | | — | %(g)(h) | |
| Net expenses (f) | | | 2.12 | % | | | 2.15 | % | | | 2.21 | %(g) | |
| Net investment loss (f) | | | (1.57 | )% | | | (1.57 | )% | | | (1.92 | )%(g) | |
| Portfolio turnover rate | | | 165 | % | | | 151 | % | | | 109 | % | |
| Net assets, end of period (000's) | | $ | 2,812 | | | $ | 1,254 | | | $ | 521 | | |
(a) Class B shares were initially offered November 1, 2005.
(b) Per share data was calculated using the average shares outstanding during the period.
(c) Total return at net asset value assuming all distributions reinvested and no contingent deferred sales charge.
(d) Total return includes a voluntary reimbursement by the investment advisor for a realized investment loss due to a trading error. This reimbursement increased total return and net asset value per share by less than 0.01% and $0.01, respectively.
(e) Not annualized.
(f) The benefits derived from expense reductions had an impact of less than 0.01%.
(g) Annualized.
(h) Rounds to less than 0.01%.
See Accompanying Notes to Financial Statements.
128
Financial Highlights – Columbia Small Cap Growth Fund I
Selected data for a share outstanding throughout each period is as follows:
| | | Year Ended August 31, | | Period Ended
August 31, | |
| Class C Shares | | 2008 | | 2007 | | 2006 (a) | |
| Net Asset Value, Beginning of Period | | $ | 31.25 | | | $ | 30.14 | | | $ | 27.47 | | |
| Income from Investment Operations: | |
| Net investment loss (b) | | | (0.44 | ) | | | (0.48 | ) | | | (0.49 | ) | |
Net realized and unrealized gain on investments,
foreign currency and written options | | | 0.12 | | | | 6.32 | | | | 4.05 | | |
| Total from investment operations | | | (0.32 | ) | | | 5.84 | | | | 3.56 | | |
| Less Distributions to Shareholders: | |
| From net realized gains | | | (3.56 | ) | | | (4.73 | ) | | | (0.89 | ) | |
| Net Asset Value, End of Period | | $ | 27.37 | | | $ | 31.25 | | | $ | 30.14 | | |
| Total return (c) | | | (2.14 | )%(d) | | | 21.02 | % | | | 13.17 | %(e) | |
| Ratios to Average Net Assets/Supplemental Data: | |
| Net expenses before interest expense (f) | | | 2.12 | % | | | 2.15 | % | | | 2.21 | %(g) | |
| Interest expense | | | — | | | | — | %(h) | | | — | %(g)(h) | |
| Net expenses (f) | | | 2.12 | % | | | 2.15 | % | | | 2.21 | %(g) | |
| Net investment loss (f) | | | (1.57 | )% | | | (1.56 | )% | | | (1.92 | )%(g) | |
| Portfolio turnover rate | | | 165 | % | | | 151 | % | | | 109 | % | |
| Net assets, end of period (000's) | | $ | 8,382 | | | $ | 2,303 | | | $ | 427 | | |
(a) Class C shares were initially offered November 1, 2005.
(b) Per share data was calculated using average shares outstanding during the period.
(c) Total return at net asset value assuming all distributions reinvested and no contingent deferred sales charge.
(d) Total return includes a voluntary reimbursement by the investment advisor for a realized investment loss due to a trading error. This reimbursement increased total return and net asset value per share by less than 0.01% and $0.01, respectively.
(e) Not annualized.
(f) The benefits derived from expense reductions had an impact of less than 0.01%.
(g) Annualized.
(h) Rounds to less than 0.01%.
See Accompanying Notes to Financial Statements.
129
Financial Highlights – Columbia Small Cap Growth Fund I
Selected data for a share outstanding throughout each period is as follows:
| | | Year Ended August 31, | |
| Class Z Shares | | 2008 | | 2007 | | 2006 | | 2005 | | 2004 | |
| Net Asset Value, Beginning of Period | | $ | 31.86 | | | $ | 30.36 | | | $ | 27.80 | | | $ | 21.32 | | | $ | 21.62 | | |
| Income from Investment Operations: | |
| Net investment loss (a) | | | (0.17 | ) | | | (0.18 | ) | | | (0.29 | ) | | | (0.24 | ) | | | (0.24 | ) | |
Net realized and unrealized gain (loss) on investments,
foreign currency and written options | | | 0.18 | | | | 6.41 | | | | 3.74 | | | | 6.72 | | | | (0.06 | ) | |
| Total from investment operations | | | 0.01 | | | | 6.23 | | | | 3.45 | | | | 6.48 | | | | (0.30 | ) | |
| Less Distributions to Shareholders: | |
| From net investment income | | | — | | | | — | (b) | | | — | | | | — | | | | — | | |
| From net realized gains | | | (3.88 | ) | | | (4.73 | ) | | | (0.89 | ) | | | — | | | | — | | |
| Total distributions to shareholders | | | (3.88 | ) | | | (4.73 | ) | | | (0.89 | ) | | | — | | | | — | | |
| Net Asset Value, End of Period | | $ | 27.99 | | | $ | 31.86 | | | $ | 30.36 | | | $ | 27.80 | | | $ | 21.32 | | |
| Total return (c) | | | (1.09 | )%(d) | | | 22.28 | % | | | 12.64 | %(e) | | | 30.39 | %(f) | | | (1.39 | )% | |
| Ratios to Average Net Assets/Supplemental Data: | |
| Net expenses before interest expense (g) | | | 1.12 | % | | | 1.15 | % | | | 1.20 | % | | | 1.16 | % | | | 1.18 | % | |
| Interest expense | | | — | | | | — | %(h) | | | — | %(h) | | | — | %(h) | | | — | | |
| Net expenses (g) | | | 1.12 | % | | | 1.15 | % | | | 1.20 | % | | | 1.16 | % | | | 1.18 | % | |
| Waiver/Reimbursement | | | — | | | | — | | | | — | %(h) | | | — | | | | — | | |
| Net investment loss (g) | | | (0.57 | )% | | | (0.59 | )% | | | (0.96 | )% | | | (0.99 | )% | | | (1.01 | )% | |
| Portfolio turnover rate | | | 165 | % | | | 151 | % | | | 109 | % | | | 114 | % | | | 118 | % | |
| Net assets, end of period (000's) | | $ | 354,145 | | | $ | 220,887 | | | $ | 193,493 | | | $ | 214,659 | | | $ | 543,016 | | |
(a) Per share data was calculated using the average shares outstanding during the period.
(b) Rounds to less than $0.01 per share.
(c) Total return at net asset value assuming all distributions reinvested.
(d) Total return includes a voluntary reimbursement by the investment advisor for a realized investment loss due to a trading error. This reimbursement increased total return and net asset value per share by less than 0.01% and $0.01, respectively.
(e) Had the investment advisor and/or any of its affiliates not waived fees or reimbursed a portion of its expenses, total return would have been reduced.
(f) Total return includes a reimbursement of loss experienced by the Fund due to compliance violation. This reimbursement had an impact of less than 0.01% on the Fund's total return.
(g) The benefits derived from expense reductions had an impact of less than 0.01%.
(h) Rounds to less than 0.01%.
See Accompanying Notes to Financial Statements.
130
Financial Highlights – Columbia Real Estate Equity Fund
Selected data for a share outstanding throughout each period is as follows:
| | | Year Ended August 31, | |
| Class A Shares | | 2008 | | 2007 | | 2006 | | 2005 | | 2004 | |
| Net Asset Value, Beginning of Period | | $ | 20.72 | | | $ | 29.07 | | | $ | 27.84 | | | $ | 25.59 | | | $ | 21.04 | | |
| Income from Investment Operations: | |
| Net investment income (a) | | | 0.29 | | | | 0.22 | | | | 0.39 | | | | 0.79 | (b) | | | 0.77 | | |
Net realized and unrealized gain (loss) on investments
and foreign currency | | | (1.10 | ) | | | 1.24 | | | | 4.90 | | | | 4.73 | | | | 4.67 | | |
| Total from investment operations | | | (0.81 | ) | | | 1.46 | | | | 5.29 | | | | 5.52 | | | | 5.44 | | |
| Less Distributions to Shareholders: | |
| From net investment income | | | (0.16 | ) | | | (0.33 | ) | | | (0.78 | ) | | | (0.75 | ) | | | (0.70 | ) | |
| From net realized gains | | | (5.90 | ) | | | (9.48 | ) | | | (3.28 | ) | | | (2.52 | ) | | | (0.19 | ) | |
| Total distributions to shareholders | | | (6.06 | ) | | | (9.81 | ) | | | (4.06 | ) | | | (3.27 | ) | | | (0.89 | ) | |
| Net Asset Value, End of Period | | $ | 13.85 | | | $ | 20.72 | | | $ | 29.07 | | | $ | 27.84 | | | $ | 25.59 | | |
| Total return (c) | | | (5.46 | )% | | | 1.72 | % | | | 21.66 | % | | | 22.65 | % | | | 26.42 | % | |
| Ratios to Average Net Assets/Supplemental Data: | |
| Net expenses before interest expense (d) | | | 1.28 | % | | | 1.21 | % | | | 1.19 | % | | | 1.18 | % | | | 1.20 | % | |
| Interest expense | | | — | %(e) | | | — | %(e) | | | — | %(e) | | | — | | | | — | | |
| Net expenses (d) | | | 1.28 | % | | | 1.21 | % | | | 1.19 | % | | | 1.18 | % | | | 1.20 | % | |
| Net investment income (d) | | | 1.93 | % | | | 0.84 | % | | | 1.45 | % | | | 2.98 | % | | | 3.27 | % | |
| Portfolio turnover rate | | | 78 | % | | | 67 | % | | | 10 | % | | | 10 | % | | | 28 | % | |
| Net assets, end of period (000's) | | $ | 22,321 | | | $ | 31,069 | | | $ | 44,685 | | | $ | 45,756 | | | $ | 32,703 | | |
(a) Per share data was calculated using the average shares outstanding during the period.
(b) Net investment income per share reflects a special dividend. The effect of this dividend amounted to $0.24 per share.
(c) Total return at net asset value assuming all distributions reinvested and no initial sales charge or contingent deferred sales charge.
(d) The benefits derived from expense reductions had an impact of less than 0.01%.
(e) Rounds to less than 0.01%.
See Accompanying Notes to Financial Statements.
131
Financial Highlights – Columbia Real Estate Equity Fund
Selected data for a share outstanding throughout each period is as follows:
| | | Year Ended August 31, | |
| Class B Shares | | 2008 | | 2007 | | 2006 | | 2005 | | 2004 | |
| Net Asset Value, Beginning of Period | | $ | 20.76 | | | $ | 29.09 | | | $ | 27.85 | | | $ | 25.60 | | | $ | 21.03 | | |
| Income from Investment Operations: | |
| Net investment income (a) | | | 0.20 | | | | 0.03 | | | | 0.19 | | | | 0.60 | (b) | | | 0.58 | | |
Net realized and unrealized gain (loss) on investments
and foreign currency | | | (1.14 | ) | | | 1.24 | | | | 4.90 | | | | 4.73 | | | | 4.70 | | |
| Total from investment operations | | | (0.94 | ) | | | 1.27 | | | | 5.09 | | | | 5.33 | | | | 5.28 | | |
| Less Distributions to Shareholders: | |
| From net investment income | | | (0.07 | ) | | | (0.12 | ) | | | (0.57 | ) | | | (0.56 | ) | | | (0.52 | ) | |
| From net realized gains | | | (5.90 | ) | | | (9.48 | ) | | | (3.28 | ) | | | (2.52 | ) | | | (0.19 | ) | |
| Total distributions to shareholders | | | (5.97 | ) | | | (9.60 | ) | | | (3.85 | ) | | | (3.08 | ) | | | (0.71 | ) | |
| Net Asset Value, End of Period | | $ | 13.85 | | | $ | 20.76 | | | $ | 29.09 | | | $ | 27.85 | | | $ | 25.60 | | |
| Total return (c) | | | (6.21 | )% | | | 0.99 | % | | | 20.78 | % | | | 21.74 | % | | | 25.53 | % | |
| Ratios to Average Net Assets/Supplemental Data: | |
| Net expenses before interest expense (d) | | | 2.03 | % | | | 1.96 | % | | | 1.94 | % | | | 1.93 | % | | | 1.98 | % | |
| Interest expense | | | — | %(e) | | | — | %(e) | | | — | %(e) | | | — | | | | — | | |
| Net expenses (d) | | | 2.03 | % | | | 1.96 | % | | | 1.94 | % | | | 1.93 | % | | | 1.98 | % | |
| Net investment income (d) | | | 1.30 | % | | | 0.10 | % | | | 0.72 | % | | | 2.26 | % | | | 2.47 | % | |
| Portfolio turnover rate | | | 78 | % | | | 67 | % | | | 10 | % | | | 10 | % | | | 28 | % | |
| Net assets, end of period (000's) | | $ | 7,123 | | | $ | 9,663 | | | $ | 13,309 | | | $ | 14,393 | | | $ | 11,234 | | |
(a) Per share data was calculated using the average shares outstanding during the period.
(b) Net investment income per share reflects a special dividend. The effect of this dividend amounted to $0.24 per share.
(c) Total return at net asset value assuming all distributions reinvested and no contingent deferred sales charge.
(d) The benefits derived from expense reductions had an impact of less than 0.01%.
(e) Rounds to less than 0.01%.
See Accompanying Notes to Financial Statements.
132
Financial Highlights – Columbia Real Estate Equity Fund
Selected data for a share outstanding throughout each period is as follows:
| | | Year Ended August 31, | | Period Ended
August 31, | |
| Class C Shares | | 2008 | | 2007 | | 2006 | | 2005 | | 2004 (a) | |
| Net Asset Value, Beginning of Period | | $ | 20.72 | | | $ | 29.06 | | | $ | 27.83 | | | $ | 25.58 | | | $ | 21.99 | | |
| Income from Investment Operations: | |
| Net investment income (b) | | | 0.19 | | | | 0.03 | | | | 0.18 | | | | 0.55 | (c) | | | 0.41 | | |
Net realized and unrealized gain (loss) on investments
and foreign currency | | | (1.12 | ) | | | 1.23 | | | | 4.90 | | | | 4.78 | | | | 3.72 | | |
| Total from investment operations | | | (0.93 | ) | | | 1.26 | | | | 5.08 | | | | 5.33 | | | | 4.13 | | |
| Less Distributions to Shareholders: | |
| From net investment income | | | (0.07 | ) | | | (0.12 | ) | | | (0.57 | ) | | | (0.56 | ) | | | (0.35 | ) | |
| From net realized gains | | | (5.90 | ) | | | (9.48 | ) | | | (3.28 | ) | | | (2.52 | ) | | | (0.19 | ) | |
| Total distributions to shareholders | | | (5.97 | ) | | | (9.60 | ) | | | (3.85 | ) | | | (3.08 | ) | | | (0.54 | ) | |
| Net Asset Value, End of Period | | $ | 13.82 | | | $ | 20.72 | | | $ | 29.06 | | | $ | 27.83 | | | $ | 25.58 | | |
| Total return (d) | | | (6.18 | )% | | | 0.94 | % | | | 20.75 | % | | | 21.75 | % | | | 18.99 | %(e) | |
| Ratios to Average Net Assets/Supplemental Data: | |
| Net expenses before interest expense (f) | | | 2.03 | % | | | 1.96 | % | | | 1.94 | % | | | 1.93 | % | | | 1.95 | %(g) | |
| Interest expense | | | — | %(h) | | | — | %(h) | | | — | %(h) | | | — | | | | — | | |
| Net expenses (f) | | | 2.03 | % | | | 1.96 | % | | | 1.94 | % | | | 1.93 | % | | | 1.95 | %(g) | |
| Net investment income (f) | | | 1.26 | % | | | 0.11 | % | | | 0.66 | % | | | 2.08 | % | | | 1.93 | %(g) | |
| Portfolio turnover rate | | | 78 | % | | | 67 | % | | | 10 | % | | | 10 | % | | | 28 | % | |
| Net assets, end of period (000's) | | $ | 6,462 | | | $ | 8,263 | | | $ | 5,486 | | | $ | 4,821 | | | $ | 2,404 | | |
(a) Class C shares were initially offered on October 13, 2003. Per share data and total return reflect activity from that date.
(b) Per share data was calculated using the average shares outstanding during the period.
(c) Net investment income per share reflects a special dividend. The effect of this dividend amounted to $0.24 per share.
(d) Total return at net asset value assuming all distributions reinvested and no contingent deferred sales charge.
(e) Not annualized.
(f) The benefits derived from expense reductions had an impact of less than 0.01%.
(g) Annualized.
(h) Rounds to less than 0.01%.
See Accompanying Notes to Financial Statements.
133
Financial Highlights – Columbia Real Estate Equity Fund
Selected data for a share outstanding throughout each period is as follows:
| | | Year Ended August 31, | |
| Class Z Shares | | 2008 | | 2007 | | 2006 | | 2005 | | 2004 | |
| Net Asset Value, Beginning of Period | | $ | 20.74 | | | $ | 29.10 | | | $ | 27.86 | | | $ | 25.60 | | | $ | 21.06 | | |
| Income from Investment Operations: | |
| Net investment income (a) | | | 0.33 | | | | 0.29 | | | | 0.48 | | | | 0.90 | (b) | | | 0.88 | | |
Net realized and unrealized gain (loss) on investments
and foreign currency | | | (1.10 | ) | | | 1.22 | | | | 4.88 | | | | 4.70 | | | | 4.62 | | |
| Total from investment operations | | | (0.77 | ) | | | 1.51 | | | | 5.36 | | | | 5.60 | | | | 5.50 | | |
| Less Distributions to Shareholders: | |
| From net investment income | | | (0.19 | ) | | | (0.39 | ) | | | (0.84 | ) | | | (0.82 | ) | | | (0.77 | ) | |
| From net realized gains | | | (5.90 | ) | | | (9.48 | ) | | | (3.28 | ) | | | (2.52 | ) | | | (0.19 | ) | |
| Total distributions to shareholders | | | (6.09 | ) | | | (9.87 | ) | | | (4.12 | ) | | | (3.34 | ) | | | (0.96 | ) | |
| Net Asset Value, End of Period | | $ | 13.88 | | | $ | 20.74 | | | $ | 29.10 | | | $ | 27.86 | | | $ | 25.60 | | |
| Total return (c) | | | (5.21 | )% | | | 1.95 | % | | | 21.99 | % | | | 22.99 | % | | | 26.72 | % | |
| Ratios to Average Net Assets/Supplemental Data: | |
| Net expenses before interest expense (d) | | | 1.03 | % | | | 0.96 | % | | | 0.94 | % | | | 0.93 | % | | | 0.97 | % | |
| Interest expense | | | — | %(e) | | | — | %(e) | | | — | %(e) | | | — | | | | — | | |
| Net expenses (d) | | | 1.03 | % | | | 0.96 | % | | | 0.94 | % | | | 0.93 | % | | | 0.97 | % | |
| Net investment income (d) | | | 2.17 | % | | | 1.11 | % | | | 1.78 | % | | | 3.40 | % | | | 3.78 | % | |
| Portfolio turnover rate | | | 78 | % | | | 67 | % | | | 10 | % | | | 10 | % | | | 28 | % | |
| Net assets, end of period (000's) | | $ | 282,293 | | | $ | 377,388 | | | $ | 578,899 | | | $ | 758,147 | | | $ | 872,924 | | |
(a) Per share data was calculated using the average shares outstanding during the period.
(b) Net investment income per share reflects a special dividend. The effect of this dividend amounted to $0.24 per share.
(c) Total return at net asset value assuming all distributions reinvested.
(d) The benefits derived from expense reductions had an impact of less than 0.01%.
(e) Rounds to less than 0.01%.
See Accompanying Notes to Financial Statements.
134
Financial Highlights – Columbia Technology Fund
Selected data for a share outstanding throughout each period is as follows:
| | | Year Ended August 31, | |
| Class A Shares | | 2008 | | 2007 | | 2006 | | 2005 | | 2004 | |
| Net Asset Value, Beginning of Period | | $ | 11.62 | | | $ | 9.33 | | | $ | 8.77 | | | $ | 6.50 | | | $ | 5.91 | | |
| Income from Investment Operations: | |
| Net investment loss (a) | | | (0.07 | ) | | | (0.10 | ) | | | (0.09 | ) | | | (0.04 | ) | | | (0.11 | ) | |
Net realized and unrealized gain (loss) on investments,
foreign currency, futures contracts and written options | | | (1.22 | ) | | | 2.39 | | | | 1.21 | | | | 2.31 | | | | 0.70 | | |
| Total from investment operations | | | (1.29 | ) | | | 2.29 | | | | 1.12 | | | | 2.27 | | | | 0.59 | | |
| Less Distributions to Shareholders: | |
| From net realized gains | | | (0.61 | ) | | | — | | | | (0.56 | ) | | | — | | | | — | | |
| Net Asset Value, End of Period | | $ | 9.72 | | | $ | 11.62 | | | $ | 9.33 | | | $ | 8.77 | | | $ | 6.50 | | |
| Total return (b) | | | (12.13 | )% | | | 24.54 | % | | | 12.78 | %(c) | | | 34.92 | %(c) | | | 9.98 | %(c) | |
| Ratios to Average Net Assets/Supplemental Data: | |
| Net expenses before interest expense (d) | | | 1.36 | % | | | 1.46 | % | | | 1.45 | % | | | 1.85 | % | | | 1.90 | % | |
| Interest expense | | | — | | | | — | %(e) | | | — | %(e) | | | — | | | | — | | |
| Net expenses (d) | | | 1.36 | % | | | 1.46 | % | | | 1.45 | % | | | 1.85 | % | | | 1.90 | % | |
| Waiver/Reimbursement | | | — | | | | — | | | | — | %(e) | | | 0.06 | % | | | 0.53 | % | |
| Net investment loss (d) | | �� | (0.69 | )% | | | (0.96 | )% | | | (0.95 | )% | | | (1.47 | )% | | | (1.51 | )% | |
| Portfolio turnover rate | | | 263 | % | | | 210 | % | | | 350 | % | | | 328 | % | | | 488 | % | |
| Net assets, end of period (000's) | | $ | 137,181 | | | $ | 109,541 | | | $ | 75,996 | | | $ | 14,696 | | | $ | 2,818 | | |
(a) Per share data was calculated using the average shares outstanding during the period.
(b) Total return at net asset value assuming all distributions reinvested and no initial sales charge or contingent deferred sales charge.
(c) Had the investment advisor and/or any of its affiliates not waived fees or reimbursed a portion of expenses, total return would have been reduced.
(d) The benefits derived from expense reductions had an impact of less than 0.01%.
(e) Rounds to less than 0.01%.
See Accompanying Notes to Financial Statements.
135
Financial Highlights – Columbia Technology Fund
Selected data for a share outstanding throughout each period is as follows:
| | | Year Ended August 31, | |
| Class B Shares | | 2008 | | 2007 | | 2006 | | 2005 | | 2004 | |
| Net Asset Value, Beginning of Period | | $ | 11.25 | | | $ | 9.10 | | | $ | 8.57 | | | $ | 6.40 | | | $ | 5.86 | | |
| Income from Investment Operations: | |
| Net investment loss (a) | | | (0.15 | ) | | | (0.17 | ) | | | (0.16 | ) | | | (0.17 | ) | | | (0.16 | ) | |
Net realized and unrealized gain (loss) on investments,
foreign currency, futures contracts and written options | | | (1.19 | ) | | | 2.32 | | | | 1.19 | | | | 2.34 | | | | 0.70 | | |
| Total from investment operations | | | (1.34 | ) | | | 2.15 | | | | 1.03 | | | | 2.17 | | | | 0.54 | | |
| Less Distributions to Shareholders: | |
| From net realized gains | | | (0.52 | ) | | | — | | | | (0.50 | ) | | | — | | | | — | | |
| Net Asset Value, End of Period | | $ | 9.39 | | | $ | 11.25 | | | $ | 9.10 | | | $ | 8.57 | | | $ | 6.40 | | |
| Total return (b) | | | (12.80 | )% | | | 23.63 | % | | | 11.98 | %(c) | | | 33.91 | %(c) | | | 9.22 | %(c) | |
| Ratios to Average Net Assets/Supplemental Data: | |
| Net expenses before interest expense (d) | | | 2.11 | % | | | 2.21 | % | | | 2.20 | % | | | 2.60 | % | | | 2.65 | % | |
| Interest expense | | | — | | | | — | %(e) | | | — | %(e) | | | — | | | | — | | |
| Net expenses (d) | | | 2.11 | % | | | 2.21 | % | | | 2.20 | % | | | 2.60 | % | | | 2.65 | % | |
| Waiver/Reimbursement | | | — | | | | — | | | | — | %(e) | | | 0.06 | % | | | 0.48 | % | |
| Net investment loss (d) | | | (1.43 | )% | | | (1.70 | )% | | | (1.70 | )% | | | (2.29 | )% | | | (2.30 | )% | |
| Portfolio turnover rate | | | 263 | % | | | 210 | % | | | 350 | % | | | 328 | % | | | 488 | % | |
| Net assets, end of period (000's) | | $ | 10,812 | | | $ | 10,580 | | | $ | 7,823 | | | $ | 3,183 | | | $ | 2,200 | | |
(a) Per share data was calculated using the average shares outstanding during the period.
(b) Total return at net asset value assuming all distributions reinvested and no contingent deferred sales charge.
(c) Had the investment advisor and/or any of its affiliates not waived fees or reimbursed a portion of expenses, total return would have been reduced.
(d) The benefits derived from expense reductions had an impact of less than 0.01%.
(e) Rounds to less than 0.01%.
See Accompanying Notes to Financial Statements.
136
Financial Highlights – Columbia Technology Fund
Selected data for a share outstanding throughout each period is as follows:
| | | Year Ended August 31, | | Period Ended
August 31, | |
| Class C Shares | | 2008 | | 2007 | | 2006 | | 2005 | | 2004 (a) | |
| Net Asset Value, Beginning of Period | | $ | 11.27 | | | $ | 9.12 | | | $ | 8.59 | | | $ | 6.41 | | | $ | 6.48 | | |
| Income from Investment Operations: | |
| Net investment loss (b) | | | (0.15 | ) | | | (0.17 | ) | | | (0.16 | ) | | | (0.17 | ) | | | (0.14 | ) | |
Net realized and unrealized gain (loss) on investments,
foreign currency, futures contracts and written options | | | (1.19 | ) | | | 2.32 | | | | 1.19 | | | | 2.35 | | | | 0.07 | | |
| Total from investment operations | | | (1.34 | ) | | | 2.15 | | | | 1.03 | | | | 2.18 | | | | (0.07 | ) | |
| Less Distributions to Shareholders: | |
| From net realized gains | | | (0.52 | ) | | | — | | | | (0.50 | ) | | | — | | | | — | | |
| Net Asset Value, End of Period | | $ | 9.41 | | | $ | 11.27 | | | $ | 9.12 | | | $ | 8.59 | | | $ | 6.41 | | |
| Total return (c) | | | (12.78 | )% | | | 23.57 | % | | | 11.95 | %(d) | | | 34.01 | %(d) | | | (1.08 | )%(d)(e) | |
| Ratios to Average Net Assets/Supplemental Data: | |
| Net expenses before interest expense (f) | | | 2.11 | % | | | 2.21 | % | | | 2.20 | % | | | 2.60 | % | | | 2.65 | %(g) | |
| Interest expense | | | — | | | | — | %(h) | | | — | %(h) | | | — | | | | — | | |
| Net expenses (f) | | | 2.11 | % | | | 2.21 | % | | | 2.20 | % | | | 2.60 | % | | | 2.65 | %(g) | |
| Waiver/Reimbursement | | | — | | | | — | | | | — | %(h) | | | 0.06 | % | | | 0.68 | %(g) | |
| Net investment loss (f) | | | (1.45 | )% | | | (1.70 | )% | | | (1.70 | )% | | | (2.23 | )% | | | (2.18 | )%(g) | |
| Portfolio turnover rate | | | 263 | % | | | 210 | % | | | 350 | % | | | 328 | % | | | 488 | % | |
| Net assets, end of period (000's) | | $ | 44,466 | | | $ | 36,325 | | | $ | 21,018 | | | $ | 1,972 | | | $ | 488 | | |
(a) Class C shares were initially offered on October 13, 2003. Per share data and total return reflect activity from that date.
(b) Per share data was calculated using the average shares outstanding during the period.
(c) Total return at net asset value assuming all distributions reinvested and no contingent deferred sales charge.
(d) Had the investment advisor and/or any of its affiliates not waived fees or reimbursed a portion of expenses, total return would have been reduced.
(e) Not annualized.
(f) The benefits derived from expense reductions had an impact of less than 0.01%.
(g) Annualized.
(h) Rounds to less than 0.01%.
See Accompanying Notes to Financial Statements.
137
Financial Highlights – Columbia Technology Fund
Selected data for a share outstanding throughout each period is as follows:
| | | Year Ended August 31, | |
| Class Z Shares | | 2008 | | 2007 | | 2006 | | 2005 | | 2004 | |
| Net Asset Value, Beginning of Period | | $ | 11.78 | | | $ | 9.43 | | | $ | 8.86 | | | $ | 6.55 | | | $ | 5.93 | | |
| Income from Investment Operations: | |
| Net investment loss (a) | | | (0.05 | ) | | | (0.08 | ) | | | (0.07 | ) | | | (0.10 | ) | | | (0.09 | ) | |
Net realized and unrealized gain (loss) on investments,
foreign currency, futures contracts and written options | | | (1.23 | ) | | | 2.43 | | | | 1.22 | | | | 2.41 | | | | 0.71 | | |
| Total from investment o0perations | | | (1.28 | ) | | | 2.35 | | | | 1.15 | | | | 2.31 | | | | 0.62 | | |
| Less Distributions to Shareholders: | |
| From net realized gains | | | (0.64 | ) | | | — | | | | (0.58 | ) | | | — | | | | — | | |
| Net Asset Value, End of Period | | $ | 9.86 | | | $ | 11.78 | | | $ | 9.43 | | | $ | 8.86 | | | $ | 6.55 | | |
| Total return (b) | | | (11.93 | )% | | | 24.92 | % | | | 13.01 | %(c) | | | 35.27 | %(c) | | | 10.46 | %(c) | |
| Ratios to Average Net Assets/Supplemental Data: | |
| Net expenses before interest expense (d) | | | 1.11 | % | | | 1.21 | % | | | 1.20 | % | | | 1.60 | % | | | 1.65 | % | |
| Interest expense | | | — | | | | — | %(e) | | | — | %(e) | | | — | | | | — | | |
| Net expenses (d) | | | 1.11 | % | | | 1.21 | % | | | 1.20 | % | | | 1.60 | % | | | 1.65 | % | |
| Waiver/Reimbursement | | | — | | | | — | | | | — | %(e) | | | 0.06 | % | | | 0.53 | % | |
| Net investment loss (d) | | | (0.45 | )% | | | (0.70 | )% | | | (0.71 | )% | | | (1.29 | )% | | | (1.30 | )% | |
| Portfolio turnover rate | | | 263 | % | | | 210 | % | | | 350 | % | | | 328 | % | | | 488 | % | |
| Net assets, end of period (000's) | | $ | 208,883 | | | $ | 137,420 | | | $ | 70,767 | | | $ | 40,947 | | | $ | 30,268 | | |
(a) Per share data was calculated using the average shares outstanding during the period.
(b) Total return at net asset value assuming all distributions reinvested.
(c) Had the investment advisor and/or any of its affiliates not waived fees or reimbursed a portion of expenses, total return would have been reduced.
(d) The benefits derived from expense reductions had an impact of less than 0.01%.
(e) Rounds to less than 0.01%.
See Accompanying Notes to Financial Statements.
138
Financial Highlights – Columbia Strategic Investor Fund
Selected data for a share outstanding throughout each period is as follows:
| | | Year Ended August 31, | |
| Class A Shares | | 2008 | | 2007 | | 2006 | | 2005 | | 2004 | |
| Net Asset Value, Beginning of Period | | $ | 21.48 | | | $ | 21.22 | | | $ | 21.21 | | | $ | 18.37 | | | $ | 15.95 | | |
| Income from Investment Operations: | |
| Net investment income (a) | | | 0.06 | | | | 0.07 | | | | 0.13 | | | | 0.01 | | | | 0.03 | | |
Net realized and unrealized gain (loss) on investments
and foreign currency | | | (1.25 | ) | | | 2.97 | | | | 1.54 | | | | 3.08 | | | | 2.46 | | |
| Total from investment operations | | | (1.19 | ) | | | 3.04 | | | | 1.67 | | | | 3.09 | | | | 2.49 | | |
| Less Distributions to Shareholders: | |
| From net investment income | | | (0.07 | ) | | | (0.10 | ) | | | (0.14 | ) | | | (0.03 | ) | | | (0.07 | ) | |
| From net realized gains | | | (2.21 | ) | | | (2.68 | ) | | | (1.52 | ) | | | (0.22 | ) | | | — | | |
| Total distributions to shareholders | | | (2.28 | ) | | | (2.78 | ) | | | (1.66 | ) | | | (0.25 | ) | | | (0.07 | ) | |
| Net Asset Value, End of Period | | $ | 18.01 | | | $ | 21.48 | | | $ | 21.22 | | | $ | 21.21 | | | $ | 18.37 | | |
| Total return (b)(c) | | | (7.09 | )% | | | 16.33 | % | | | 8.26 | % | | | 16.88 | % | | | 15.64 | % | |
| Ratios to Average Net Assets/Supplemental Data: | |
| Net expenses | | | 1.22 | %(d) | | | 1.23 | %(e) | | | 1.24 | %(f) | | | 1.24 | %(f) | | | 1.27 | %(f) | |
| Waiver/Reimbursement | | | 0.03 | % | | | 0.02 | % | | | 0.01 | % | | | 0.03 | % | | | 0.01 | % | |
| Net investment income | | | 0.30 | %(d) | | | 0.36 | %(e) | | | 0.65 | %(f) | | | 0.64 | %(f) | | | 0.19 | %(f) | |
| Portfolio turnover rate | | | 88 | % | | | 139 | % | | | 82 | % | | | 80 | % | | | 106 | % | |
| Net assets, end of period (000's) | | $ | 225,418 | | | $ | 255,743 | | | $ | 170,201 | | | $ | 169,340 | | | $ | 99,608 | | |
(a) Per share data was calculated using the average shares outstanding during the period.
(b) Total return at net asset value assuming all distributions reinvested and no initial sales charge or contingent deferred sales charge.
(c) Had the investment advisor and/or any of its affiliates not waived fees or reimbursed a portion of expenses, total return would have been reduced.
(d) The benefits derived from expense reductions had an impact of 0.04%.
(e) The benefits derived from expense reductions had an impact of 0.06%.
(f) The benefits derived from expense reductions had an impact of less than 0.01%.
See Accompanying Notes to Financial Statements.
139
Financial Highlights – Columbia Strategic Investor Fund
Selected data for a share outstanding throughout each period is as follows:
| | | Year Ended August 31, | |
| Class B Shares | | 2008 | | 2007 | | 2006 | | 2005 | | 2004 | |
| Net Asset Value, Beginning of Period | | $ | 20.96 | | | $ | 20.81 | | | $ | 20.84 | | | $ | 18.17 | | | $ | 15.82 | | |
| Income from Investment Operations: | |
| Net investment loss (a) | | | (0.09 | ) | | | (0.08 | ) | | | (0.02 | ) | | | — | (b) | | | (0.10 | ) | |
Net realized and unrealized gain (loss) on investments
and foreign currency | | | (1.21 | ) | | | 2.91 | | | | 1.51 | | | | 2.89 | | | | 2.45 | | |
| Total from investment operations | | | (1.30 | ) | | | 2.83 | | | | 1.49 | | | | 2.89 | | | | 2.35 | | |
| Less Distributions to Shareholders: | |
| From net realized gains | | | (2.21 | ) | | | (2.68 | ) | | | (1.52 | ) | | | (0.22 | ) | | | — | | |
| Net Asset Value, End of Period | | $ | 17.45 | | | $ | 20.96 | | | $ | 20.81 | | | $ | 20.84 | | | $ | 18.17 | | |
| Total return (c)(d) | | | (7.77 | )% | | | 15.50 | % | | | 7.47 | % | | | 15.97 | % | | | 14.85 | % | |
| Ratios to Average Net Assets/Supplemental Data: | |
| Net expenses | | | 1.97 | %(e) | | | 1.98 | %(f) | | | 1.99 | %(g) | | | 1.99 | %(g) | | | 2.02 | %(g) | |
| Waiver/Reimbursement | | | 0.03 | % | | | 0.02 | % | | | 0.01 | % | | | 0.03 | % | | | 0.14 | % | |
| Net investment loss | | | (0.46 | )%(e) | | | (0.39 | )%(f) | | | (0.10 | )%(g) | | | (0.09 | )%(g) | | | (0.57 | )%(g) | |
| Portfolio turnover rate | | | 88 | % | | | 139 | % | | | 82 | % | | | 80 | % | | | 106 | % | |
| Net assets, end of period (000's) | | $ | 42,229 | | | $ | 53,965 | | | $ | 51,446 | | | $ | 49,318 | | | $ | 22,071 | | |
(a) Per share data was calculated using the average shares outstanding during the period.
(b) Rounds to less than $0.01 per share.
(c) Total return at net asset value assuming all distributions reinvested and no contingent deferred sales charge.
(d) Had the investment advisor and/or any of its affiliates not waived fees or reimbursed a portion of expenses, total return would have been reduced.
(e) The benefits derived from expense reductions had an impact of 0.04%.
(f) The benefits derived from expense reductions had an impact of 0.06%.
(g) The benefits derived from expense reductions had an impact of less than 0.01%.
See Accompanying Notes to Financial Statements.
140
Financial Highlights – Columbia Strategic Investor Fund
Selected data for a share outstanding throughout each period is as follows:
| | | Year Ended August 31, | | Period Ended
August 31, | |
| Class C Shares | | 2008 | | 2007 | | 2006 | | 2005 | | 2004 (a) | |
| Net Asset Value, Beginning of Period | | $ | 20.96 | | | $ | 20.82 | | | $ | 20.85 | | | $ | 18.18 | | | $ | 16.42 | | |
| Income from Investment Operations: | |
| Net investment loss (b) | | | (0.09 | ) | | | (0.08 | ) | | | (0.02 | ) | | | — | (c) | | | (0.09 | ) | |
Net realized and unrealized gain (loss) on investments
and foreign currency | | | (1.20 | ) | | | 2.90 | | | | 1.51 | | | | 2.89 | | | | 1.85 | | |
| Total from investment operations | | | (1.29 | ) | | | 2.82 | | | | 1.49 | | | | 2.89 | | | | 1.76 | | |
| Less Distributions to Shareholders: | |
| From net realized gains | | | (2.21 | ) | | | (2.68 | ) | | | (1.52 | ) | | | (0.22 | ) | | | — | | |
| Net Asset Value, End of Period | | $ | 17.46 | | | $ | 20.96 | | | $ | 20.82 | | | $ | 20.85 | | | $ | 18.18 | | |
| Total return (d)(e) | | | (7.72 | )% | | | 15.43 | % | | | 7.46 | % | | | 15.96 | % | | | 10.72 | %(f) | |
| Ratios to Average Net Assets/Supplemental Data: | |
| Net expenses | | | 1.97 | %(g) | | | 1.98 | %(h) | | | 1.99 | %(i) | | | 1.99 | %(i) | | | 2.05 | %(i)(j) | |
| Waiver/Reimbursement | | | 0.03 | % | | | 0.02 | % | | | 0.01 | % | | | 0.03 | % | | | 0.07 | %(j) | |
| Net investment loss | | | (0.46 | )%(g) | | | (0.40 | )%(h) | | | (0.10 | )%(i) | | | (0.09 | )%(i) | | | (0.57 | )%(i)(j) | |
| Portfolio turnover rate | | | 88 | % | | | 139 | % | | | 82 | % | | | 80 | % | | | 106 | % | |
| Net assets, end of period (000's) | | $ | 34,208 | | | $ | 44,682 | | | $ | 43,881 | | | $ | 39,253 | | | $ | 14,821 | | |
(a) Class C shares were initially offered on October 13, 2003. Per share data and total return reflect activity from that date.
(b) Per share data was calculated using the average shares outstanding during the period.
(c) Rounds to less than $0.01 per share.
(d) Total return at net asset value assuming all distributions reinvested and no contingent deferred sales charge.
(e) Had the investment advisor and/or any of its affiliates not waived fees or reimbursed a portion of expenses, total return would have been reduced.
(f) Not annualized.
(g) The benefits derived from expense reductions had an impact of 0.04%.
(h) The benefits derived from expense reductions had an impact of 0.06%.
(i) The benefits derived from expense reductions had an impact of less than 0.01%.
(j) Annualized.
See Accompanying Notes to Financial Statements.
141
Financial Highlights – Columbia Strategic Investor Fund
Selected data for a share outstanding throughout each period is as follows:
| | | Year Ended August 31, | |
| Class Z Shares | | 2008 | | 2007 | | 2006 | | 2005 | | 2004 | |
| Net Asset Value, Beginning of Period | | $ | 21.53 | | | $ | 21.28 | | | $ | 21.27 | | | $ | 18.42 | | | $ | 15.98 | | |
| Income from Investment Operations: | |
| Net investment income (a) | | | 0.11 | | | | 0.13 | | | | 0.18 | | | | 0.01 | | | | 0.08 | | |
Net realized and unrealized gain (loss) on investments
and foreign currency | | | (1.25 | ) | | | 2.96 | | | | 1.54 | | | | 3.13 | | | | 2.47 | | |
| Total from investment operations | | | (1.14 | ) | | | 3.09 | | | | 1.72 | | | | 3.14 | | | | 2.55 | | |
| Less Distributions to Shareholders: | |
| From net investment income | | | (0.12 | ) | | | (0.16 | ) | | | (0.19 | ) | | | (0.07 | ) | | | (0.11 | ) | |
| From net realized gains | | | (2.21 | ) | | | (2.68 | ) | | | (1.52 | ) | | | (0.22 | ) | | | — | | |
| Total distributions to shareholders | | | (2.33 | ) | | | (2.84 | ) | | | (1.71 | ) | | | (0.29 | ) | | | (0.11 | ) | |
| Net Asset Value, End of Period | | $ | 18.06 | | | $ | 21.53 | | | $ | 21.28 | | | $ | 21.27 | | | $ | 18.42 | | |
| Total return (b)(c) | | | (6.85 | )% | | | 16.62 | % | | | 8.50 | % | | | 17.16 | % | | | 15.98 | % | |
| Ratios to Average Net Assets/Supplemental Data: | |
| Net expenses | | | 0.97 | %(d) | | | 0.98 | %(e) | | | 0.99 | %(f) | | | 0.99 | %(f) | | | 1.02 | %(f) | |
| Waiver/Reimbursement | | | 0.03 | % | | | 0.02 | % | | | 0.01 | % | | | 0.03 | % | | | 0.03 | % | |
| Net investment income | | | 0.55 | %(d) | | | 0.63 | %(e) | | | 0.89 | %(f) | | | 0.86 | %(f) | | | 0.44 | %(f) | |
| Portfolio turnover rate | | | 88 | % | | | 139 | % | | | 82 | % | | | 80 | % | | | 106 | % | |
| Net assets, end of period (000's) | | $ | 755,348 | | | $ | 859,142 | | | $ | 179,027 | | | $ | 267,380 | | | $ | 272,178 | | |
(a) Per share data was calculated using the average shares outstanding during the period.
(b) Total return at net asset value assuming all distributions reinvested.
(c) Had the investment advisor and/or any of its affiliates not waived fees or reimbursed a portion of expenses, total return would have been reduced.
(d) The benefits derived from expense reductions had an impact of 0.04%.
(e) The benefits derived from expense reductions had an impact of 0.06%.
(f) The benefits derived from expense reductions had an impact of less than 0.01%.
See Accompanying Notes to Financial Statements.
142
Financial Highlights – Columbia Balanced Fund
Selected data for a share outstanding throughout each period is as follows:
| | | Year Ended August 31, | |
| Class A Shares | | 2008 | | 2007 | | 2006 | | 2005 | | 2004 | |
| Net Asset Value, Beginning of Period | | $ | 24.77 | | | $ | 22.51 | | | $ | 21.75 | | | $ | 19.86 | | | $ | 19.18 | | |
| Income from Investment Operations: | |
| Net investment income (a) | | | 0.53 | | | | 0.48 | | | | 0.38 | | | | 0.02 | (b) | | | 0.29 | | |
Net realized and unrealized gain (loss) on investments
and futures contracts | | | (0.56 | ) | | | 2.26 | | | | 0.78 | | | | 2.28 | | | | 0.67 | | |
| Total from investment operations | | | (0.03 | ) | | | 2.74 | | | | 1.16 | | | | 2.30 | | | | 0.96 | | |
| Less Distributions to Shareholders: | |
| From net investment income | | | (0.56 | ) | | | (0.48 | ) | | | (0.40 | ) | | | (0.41 | ) | | | (0.28 | ) | |
| From net realized gains | | | (0.15 | ) | | | — | | | | — | | | | — | | | | — | | |
| Total distributions to shareholders | | | (0.71 | ) | | | (0.48 | ) | | | (0.40 | ) | | | (0.41 | ) | | | (0.28 | ) | |
| Net Asset Value, End of Period | | $ | 24.03 | | | $ | 24.77 | | | $ | 22.51 | | | $ | 21.75 | | | $ | 19.86 | | |
| Total return (c) | | | (0.22 | )% | | | 12.26 | % | | | 5.40 | %(d) | | | 11.72 | % | | | 4.99 | % | |
| Ratios to Average Net Assets/Supplemental Data: | |
| Net expenses before interest expense (e) | | | 0.99 | % | | | 1.02 | % | | | 0.98 | % | | | 1.02 | % | | | 1.02 | % | |
| Interest expense | | | — | | | | — | | | | — | %(f) | | | — | | | | — | | |
| Net expenses (e) | | | 0.99 | % | | | 1.02 | % | | | 0.98 | % | | | 1.02 | % | | | 1.02 | % | |
| Waiver/Reimbursement | | | — | | | | — | | | | 0.01 | % | | | — | | | | — | | |
| Net investment income (e) | | | 2.14 | % | | | 1.98 | % | | | 1.71 | % | | | 1.80 | % | | | 1.45 | % | |
| Portfolio turnover rate | | | 94 | % | | | 78 | % | | | 59 | % | | | 63 | % | | | 158 | % | |
| Net assets, end of period (000's) | | $ | 10,712 | | | $ | 6,582 | | | $ | 4,137 | | | $ | 3,378 | | | $ | 2,577 | | |
(a) Per share data was calculated using the average shares outstanding during the period.
(b) Net investment income per share reflects a special dividend. The effect of this dividend amounted to $0.06 per share.
(c) Total return at net asset value assuming all distributions reinvested and no initial sales charge or contingent deferred sales charge.
(d) Had the investment advisor and/or any of its affiliates not waived fees or reimbursed a portion of expenses, total return would have been reduced.
(e) The benefits derived from expense reductions had an impact of less than 0.01%.
(f) Rounds to less than 0.01%.
See Accompanying Notes to Financial Statements.
143
Financial Highlights – Columbia Balanced Fund
Selected data for a share outstanding throughout each period is as follows:
| | | Year Ended August 31, | |
| Class B Shares | | 2008 | | 2007 | | 2006 | | 2005 | | 2004 | |
| Net Asset Value, Beginning of Period | | $ | 24.73 | | | $ | 22.47 | | | $ | 21.72 | | | $ | 19.83 | | | $ | 19.16 | | |
| Income from Investment Operations: | |
| Net investment income (a) | | | 0.34 | | | | 0.29 | | | | 0.21 | | | | 0.01 | (b) | | | 0.14 | | |
Net realized and unrealized gain (loss) on investments
and futures contracts | | | (0.56 | ) | | | 2.27 | | | | 0.78 | | | | 2.14 | | | | 0.66 | | |
| Total from investment operations | | | (0.22 | ) | | | 2.56 | | | | 0.99 | | | | 2.15 | | | | 0.80 | | |
| Less Distributions to Shareholders: | |
| From net investment income | | | (0.37 | ) | | | (0.30 | ) | | | (0.24 | ) | | | (0.26 | ) | | | (0.13 | ) | |
| From net realized gains | | | (0.15 | ) | | | — | | | | — | | | | — | | | | — | | |
| Total distributions to shareholders | | | (0.52 | ) | | | (0.30 | ) | | | (0.24 | ) | | | (0.26 | ) | | | (0.13 | ) | |
| Net Asset Value, End of Period | | $ | 23.99 | | | $ | 24.73 | | | $ | 22.47 | | | $ | 21.72 | | | $ | 19.83 | | |
| Total return (c) | | | (0.97 | )% | | | 11.45 | % | | | 4.57 | %(d) | | | 10.91 | % | | | 4.17 | % | |
| Ratios to Average Net Assets/Supplemental Data: | |
| Net expenses before interest expense (e) | | | 1.74 | % | | | 1.77 | % | | | 1.73 | % | | | 1.77 | % | | | 1.77 | % | |
| Interest expense | | | — | | | | — | | | | — | %(f) | | | — | | | | — | | |
| Net expenses (e) | | | 1.74 | % | | | 1.77 | % | | | 1.73 | % | | | 1.77 | % | | | 1.77 | % | |
| Waiver/Reimbursement | | | — | | | | — | | | | 0.01 | % | | | — | | | | — | | |
| Net investment income (e) | | | 1.37 | % | | | 1.20 | % | | | 0.95 | % | | | 1.07 | % | | | 0.71 | % | |
| Portfolio turnover rate | | | 94 | % | | | 78 | % | | | 59 | % | | | 63 | % | | | 158 | % | |
| Net assets, end of period (000's) | | $ | 7,551 | | | $ | 6,955 | | | $ | 7,213 | | | $ | 8,149 | | | $ | 7,286 | | |
(a) Per share data was calculated using the average shares outstanding during the period.
(b) Net investment income per share reflects a special dividend. The effect of this dividend amounted to $0.06 per share.
(c) Total return at net asset value assuming all distributions reinvested and no contingent deferred sales charge.
(d) Had the investment advisor and/or any of its affiliates not waived fees or reimbursed a portion of expenses, total return would have been reduced.
(e) The benefits derived from expense reductions had an impact of less than 0.01%.
(f) Rounds to less than 0.01%.
See Accompanying Notes to Financial Statements.
144
Financial Highlights – Columbia Balanced Fund
Selected data for a share outstanding throughout each period is as follows:
| | | Year Ended August 31, | | Period Ended
August 31, | |
| Class C Shares | | 2008 | | 2007 | | 2006 | | 2005 | | 2004 (a) | |
| Net Asset Value, Beginning of Period | | $ | 24.73 | | | $ | 22.48 | | | $ | 21.72 | | | $ | 19.83 | | | $ | 19.59 | | |
| Income from Investment Operations: | |
| Net investment income (b) | | | 0.34 | | | | 0.29 | | | | 0.21 | | | | 0.01 | (c) | | | 0.13 | | |
Net realized and unrealized gain (loss) on investments
and futures contracts | | | (0.56 | ) | | | 2.26 | | | | 0.79 | | | | 2.14 | | | | 0.23 | | |
| Total from investment operations | | | (0.22 | ) | | | 2.55 | | | | 1.00 | | | | 2.15 | | | | 0.36 | | |
| Less Distributions to Shareholders: | |
| From net investment income | | | (0.37 | ) | | | (0.30 | ) | | | (0.24 | ) | | | (0.26 | ) | | | (0.12 | ) | |
| From net realized gains | | | (0.15 | ) | | | — | | | | — | | | | — | | | | — | | |
| Total distributions to shareholders | | | (0.52 | ) | | | (0.30 | ) | | | (0.24 | ) | | | (0.26 | ) | | | (0.12 | ) | |
| Net Asset Value, End of Period | | $ | 23.99 | | | $ | 24.73 | | | $ | 22.48 | | | $ | 21.72 | | | $ | 19.83 | | |
| Total return (d) | | | (0.97 | )% | | | 11.40 | % | | | 4.62 | %(e) | | | 10.91 | % | | | 1.82 | %(f) | |
| Ratios to Average Net Assets/Supplemental Data: | |
| Net expenses before interest expense (g) | | | 1.74 | % | | | 1.77 | % | | | 1.73 | % | | | 1.77 | % | | | 1.80 | %(h) | |
| Interest expense | | | — | | | | — | | | | — | %(i) | | | — | | | | — | | |
| Net expenses (g) | | | 1.74 | % | | | 1.77 | % | | | 1.73 | % | | | 1.77 | % | | | 1.80 | %(h) | |
| Waiver/Reimbursement | | | — | | | | — | | | | 0.01 | % | | | — | | | | — | | |
| Net investment income (g) | | | 1.39 | % | | | 1.20 | % | | | 0.98 | % | | | 1.06 | % | | | 0.72 | %(h) | |
| Portfolio turnover rate | | | 94 | % | | | 78 | % | | | 59 | % | | | 63 | % | | | 158 | % | |
| Net assets, end of period (000's) | | $ | 3,209 | | | $ | 1,887 | | | $ | 1,491 | | | $ | 952 | | | $ | 730 | | |
(a) Class C shares were initially offered on October 13, 2003. Per share data and total return reflect activity from that date.
(b) Per share data was calculated using the average shares outstanding during the period.
(c) Net investment income per share reflects a special dividend. The effect of this dividend amounted to $0.06 per share.
(d) Total return at net asset value assuming all distributions reinvested and no contingent deferred sales charge.
(e) Had the investment advisor and/or any of its affiliates not waived fees or reimbursed a portion of expenses, total return would have been reduced.
(f) Not annualized.
(g) The benefits derived from expense reductions had an impact of less than 0.01%.
(h) Annualized.
(i) Rounds to less than 0.01%.
See Accompanying Notes to Financial Statements.
145
Financial Highlights – Columbia Balanced Fund
Selected data for a share outstanding throughout each period is as follows:
| | | Year Ended August 31, | |
| Class Z Shares | | 2008 | | 2007 | | 2006 | | 2005 | | 2004 | |
| Net Asset Value, Beginning of Period | | $ | 24.75 | | | $ | 22.50 | | | $ | 21.74 | | | $ | 19.84 | | | $ | 19.19 | | |
| Income from Investment Operations: | |
| Net investment income (a) | | | 0.58 | | | | 0.53 | | | | 0.43 | | | | 0.01 | (b) | | | 0.35 | | |
Net realized and unrealized gain (loss) on investments
and futures contracts | | | (0.54 | ) | | | 2.26 | | | | 0.79 | | | | 2.36 | | | | 0.66 | | |
| Total from investment operations | | | 0.04 | | | | 2.79 | | | | 1.22 | | | | 2.37 | | | | 1.01 | | |
| Less Distributions to Shareholders: | |
| From net investment income | | | (0.62 | ) | | | (0.54 | ) | | | (0.46 | ) | | | (0.47 | ) | | | (0.36 | ) | |
| From net realized gains | | | (0.15 | ) | | | — | | | | — | | | | — | | | | — | | |
| Total distributions to shareholders | | | (0.77 | ) | | | (0.54 | ) | | | (0.46 | ) | | | (0.47 | ) | | | (0.36 | ) | |
| Net Asset Value, End of Period | | $ | 24.02 | | | $ | 24.75 | | | $ | 22.50 | | | $ | 21.74 | | | $ | 19.84 | | |
| Total return (c) | | | 0.07 | % | | | 12.49 | % | | | 5.66 | %(d) | | | 12.06 | % | | | 5.27 | % | |
| Ratios to Average Net Assets/Supplemental Data: | |
| Net expenses before interest expense (e) | | | 0.74 | % | | | 0.77 | % | | | 0.73 | % | | | 0.77 | % | | | 0.77 | % | |
| Interest expense | | | — | | | | — | | | | — | %(f) | | | — | | | | — | | |
| Net expenses (e) | | | 0.74 | % | | | 0.77 | % | | | 0.73 | % | | | 0.77 | % | | | 0.77 | % | |
| Waiver/Reimbursement | | | — | | | | — | | | | 0.01 | % | | | — | | | | — | | |
| Net investment income (e) | | | 2.35 | % | | | 2.19 | % | | | 1.94 | % | | | 2.11 | % | | | 1.73 | % | |
| Portfolio turnover rate | | | 94 | % | | | 78 | % | | | 59 | % | | | 63 | % | | | 158 | % | |
| Net assets, end of period (000's) | | $ | 176,113 | | | $ | 196,615 | | | $ | 226,694 | | | $ | 301,109 | | | $ | 483,746 | | |
(a) Per share data was calculated using the average shares outstanding during the period.
(b) Net investment income per share reflects a special dividend. The effect of this dividend amounted to $0.06 per share.
(c) Total return at net asset value assuming all distributions reinvested.
(d) Had the investment advisor and/or any of its affiliates not waived fees or reimbursed a portion of expenses, total return would have been reduced.
(e) The benefits derived from expense reductions had an impact of less than 0.01%.
(f) Rounds to less than 0.01%.
See Accompanying Notes to Financial Statements.
146
Financial Highlights – Columbia Oregon Intermediate Municipal Bond Fund
Selected data for a share outstanding throughout each period is as follows:
| | | Year Ended August 31, | |
| Class A Shares | | 2008 | | 2007 | | 2006 | | 2005 | | 2004 | |
| Net Asset Value, Beginning of Period | | $ | 12.02 | | | $ | 12.24 | | | $ | 12.45 | | | $ | 12.45 | | | $ | 12.25 | | |
| Income from Investment Operations: | |
| Net investment income (a) | | | 0.46 | | | | 0.46 | | | | 0.45 | | | | 0.46 | | | | 0.46 | | |
Net realized and unrealized gain (loss) on investments
and futures contracts | | | 0.05 | | | | (0.23 | ) | | | (0.20 | ) | | | 0.03 | | | | 0.34 | | |
| Total from investment operations | | | 0.51 | | | | 0.23 | | | | 0.25 | | | | 0.49 | | | | 0.80 | | |
| Less Distributions to Shareholders: | |
| From net investment income | | | (0.46 | ) | | | (0.45 | ) | | | (0.46 | ) | | | (0.45 | ) | | | (0.46 | ) | |
| From net realized gains | | | — | | | | — | | | | — | | | | (0.04 | ) | | | (0.14 | ) | |
| Total distributions to shareholders | | | (0.46 | ) | | | (0.45 | ) | | | (0.46 | ) | | | (0.49 | ) | | | (0.60 | ) | |
| Net Asset Value, End of Period | | $ | 12.07 | | | $ | 12.02 | | | $ | 12.24 | | | $ | 12.45 | | | $ | 12.45 | | |
| Total return (b) | | | 4.31 | %(c) | | | 1.92 | % | | | 2.05 | %(c) | | | 4.05 | % | | | 6.68 | % | |
| Ratios to Average Net Assets/Supplemental Data: | |
| Net expenses (d) | | | 0.77 | % | | | 0.88 | % | | | 0.89 | % | | | 0.89 | % | | | 0.92 | % | |
| Waiver/Reimbursement | | | 0.10 | % | | | — | | | | — | %(e) | | | — | | | | — | | |
| Net investment income (d) | | | 3.78 | % | | | 3.73 | % | | | 3.72 | % | | | 3.71 | % | | | 3.73 | % | |
| Portfolio turnover rate | | | 5 | % | | | 16 | % | | | 2 | % | | | 9 | % | | | 11 | % | |
| Net assets, end of period (000's) | | $ | 10,210 | | | $ | 5,519 | | | $ | 6,507 | | | $ | 4,300 | | | $ | 3,680 | | |
(a) Per share data was calculated using the average shares outstanding during the period.
(b) Total return at net asset value assuming all distributions reinvested and no initial sales charge or contingent deferred sales charge.
(c) Had the investment advisor and/or any of its affiliates not waived fees or reimbursed a portion of expenses, total return would have been reduced.
(d) The benefits derived from expense reductions had an impact of less than 0.01%.
(e) Rounds to less than 0.01%.
See Accompanying Notes to Financial Statements.
147
Financial Highlights – Columbia Oregon Intermediate Municipal Bond Fund
Selected data for a share outstanding throughout each period is as follows:
| | | Year Ended August 31, | |
| Class B Shares | | 2008 | | 2007 | | 2006 | | 2005 | | 2004 | |
| Net Asset Value, Beginning of Period | | $ | 12.02 | | | $ | 12.24 | | | $ | 12.45 | | | $ | 12.45 | | | $ | 12.25 | | |
| Income from Investment Operations: | |
| Net investment income (a) | | | 0.37 | | | | 0.36 | | | | 0.37 | | | | 0.37 | | | | 0.37 | | |
Net realized and unrealized gain (loss) on investments
and futures contracts | | | 0.05 | | | | (0.22 | ) | | | (0.22 | ) | | | 0.03 | | | | 0.34 | | |
| Total from investment operations | | | 0.42 | | | | 0.14 | | | | 0.15 | | | | 0.40 | | | | 0.71 | | |
| Less Distributions to Shareholders: | |
| From net investment income | | | (0.37 | ) | | | (0.36 | ) | | | (0.36 | ) | | | (0.36 | ) | | | (0.37 | ) | |
| From net realized gains | | | — | | | | — | | | | — | | | | (0.04 | ) | | | (0.14 | ) | |
| Total distributions to shareholders | | | (0.37 | ) | | | (0.36 | ) | | | (0.36 | ) | | | (0.40 | ) | | | (0.51 | ) | |
| Net Asset Value, End of Period | | $ | 12.07 | | | $ | 12.02 | | | $ | 12.24 | | | $ | 12.45 | | | $ | 12.45 | | |
| Total return (b) | | | 3.56 | %(c) | | | 1.16 | % | | | 1.29 | %(c) | | | 3.26 | % | | | 5.87 | % | |
| Ratios to Average Net Assets/Supplemental Data: | |
| Net expenses (d) | | | 1.52 | % | | | 1.63 | % | | | 1.64 | % | | | 1.64 | % | | | 1.68 | % | |
| Waiver/Reimbursement | | | 0.10 | % | | | — | | | | — | %(e) | | | — | | | | — | | |
| Net investment income (d) | | | 3.08 | % | | | 2.98 | % | | | 3.00 | % | | | 2.96 | % | | | 2.97 | % | |
| Portfolio turnover rate | | | 5 | % | | | 16 | % | | | 2 | % | | | 9 | % | | | 11 | % | |
| Net assets, end of period (000's) | | $ | 570 | | | $ | 842 | | | $ | 913 | | | $ | 1,226 | | | $ | 1,190 | | |
(a) Per share data was calculated using the average shares outstanding during the period.
(b) Total return at net asset value assuming all distributions reinvested and no contingent deferred sales charge.
(c) Had the investment advisor and/or any of its affiliates not waived fees or reimbursed a portion of expenses, total return would have been reduced.
(d) The benefits derived from expense reductions had an impact of less than 0.01%.
(e) Rounds to less than 0.01%.
See Accompanying Notes to Financial Statements.
148
Financial Highlights – Columbia Oregon Intermediate Municipal Bond Fund
Selected data for a share outstanding throughout each period is as follows:
| | | Year Ended August 31, | | Period Ended
August 31, | |
| Class C Shares | | 2008 | | 2007 | | 2006 | | 2005 | | 2004 (a) | |
| Net Asset Value, Beginning of Period | | $ | 12.02 | | | $ | 12.24 | | | $ | 12.45 | | | $ | 12.45 | | | $ | 12.42 | | |
| Income from Investment Operations: | |
| Net investment income (b) | | | 0.41 | | | | 0.40 | | | | 0.41 | | | | 0.41 | | | | 0.36 | | |
Net realized and unrealized gain (loss) on investments
and futures contracts | | | 0.05 | | | | (0.21 | ) | | | (0.21 | ) | | | 0.03 | | | | 0.18 | | |
| Total from investment operations | | | 0.46 | | | | 0.19 | | | | 0.20 | | | | 0.44 | | | | 0.54 | | |
| Less Distributions to Shareholders: | |
| From net investment income | | | (0.41 | ) | | | (0.41 | ) | | | (0.41 | ) | | | (0.40 | ) | | | (0.37 | ) | |
| From net realized gains | | | — | | | | — | | | | — | | | | (0.04 | ) | | | (0.14 | ) | |
| Total distributions to shareholders | | | (0.41 | ) | | | (0.41 | ) | | | (0.41 | ) | | | (0.44 | ) | | | (0.51 | ) | |
| Net Asset Value, End of Period | | $ | 12.07 | | | $ | 12.02 | | | $ | 12.24 | | | $ | 12.45 | | | $ | 12.45 | | |
| Total return (c)(d) | | | 3.88 | % | | | 1.52 | % | | | 1.64 | % | | | 3.64 | % | | | 4.41 | %(e) | |
| Ratios to Average Net Assets/Supplemental Data: | |
| Net expenses (f) | | | 1.17 | % | | | 1.28 | % | | | 1.29 | % | | | 1.29 | % | | | 1.30 | %(g) | |
| Waiver/Reimbursement | | | 0.45 | % | | | 0.35 | % | | | 0.35 | % | | | 0.35 | % | | | 0.35 | %(g) | |
| Net investment income (f) | | | 3.36 | % | | | 3.33 | % | | | 3.33 | % | | | 3.31 | % | | | 3.28 | %(g) | |
| Portfolio turnover rate | | | 5 | % | | | 16 | % | | | 2 | % | | | 9 | % | | | 11 | %(e) | |
| Net assets, end of period (000's) | | $ | 7,847 | | | $ | 1,097 | | | $ | 616 | | | $ | 601 | | | $ | 278 | | |
(a) Class C shares were initially offered on October 13, 2003. Per share data and total return reflect activity from that date.
(b) Per share data was calculated using the average shares outstanding during the period.
(c) Total return at net asset value assuming all distributions reinvested and no contingent deferred sales charge.
(d) Had the investment advisor and/or any of its affiliates not waived fees or reimbursed a portion of expenses, total return would have been reduced.
(e) Not annualized.
(f) The benefits derived from expense reductions had an impact of less than 0.01%.
(g) Annualized.
See Accompanying Notes to Financial Statements.
149
Financial Highlights – Columbia Oregon Intermediate Municipal Bond Fund
Selected data for a share outstanding throughout each period is as follows:
| | | Year Ended August 31, | |
| Class Z Shares | | 2008 | | 2007 | | 2006 | | 2005 | | 2004 | |
| Net Asset Value, Beginning of Period | | $ | 12.02 | | | $ | 12.24 | | | $ | 12.45 | | | $ | 12.45 | | | $ | 12.25 | | |
| Income from Investment Operations: | |
| Net investment income (a) | | | 0.49 | | | | 0.49 | | | | 0.49 | | | | 0.49 | | | | 0.50 | | |
Net realized and unrealized gain (loss) on investments
and futures contracts | | | 0.05 | | | | (0.23 | ) | | | (0.21 | ) | | | 0.03 | | | | 0.34 | | |
| Total from investment operations | | | 0.54 | | | | 0.26 | | | | 0.28 | | | | 0.52 | | | | 0.84 | | |
| Less Distributions to Shareholders: | |
| From net investment income | | | (0.49 | ) | | | (0.48 | ) | | | (0.49 | ) | | | (0.48 | ) | | | (0.50 | ) | |
| From net realized gains | | | — | | | | — | | | | — | | | | (0.04 | ) | | | (0.14 | ) | |
| Total distributions to shareholders | | | (0.49 | ) | | | (0.48 | ) | | | (0.49 | ) | | | (0.52 | ) | | | (0.64 | ) | |
| Net Asset Value, End of Period | | $ | 12.07 | | | $ | 12.02 | | | $ | 12.24 | | | $ | 12.45 | | | $ | 12.45 | | |
| Total return (b) | | | 4.59 | %(c) | | | 2.18 | % | | | 2.31 | %(c) | | | 4.31 | % | | | 6.97 | % | |
| Ratios to Average Net Assets/Supplemental Data: | |
| Net expenses (d) | | | 0.52 | % | | | 0.63 | % | | | 0.64 | % | | | 0.64 | % | | | 0.65 | % | |
| Waiver/Reimbursement | | | 0.10 | % | | | — | | | | — | %(e) | | | — | | | | — | | |
| Net investment income (d) | | | 4.07 | % | | | 3.98 | % | | | 3.99 | % | | | 3.96 | % | | | 4.03 | % | |
| Portfolio turnover rate | | | 5 | % | | | 16 | % | | | 2 | % | | | 9 | % | | | 11 | % | |
| Net assets, end of period (000's) | | $ | 381,162 | | | $ | 368,292 | | | $ | 380,653 | | | $ | 410,706 | | | $ | 434,509 | | |
(a) Per share data was calculated using the average shares outstanding during the period.
(b) Total return at net asset value assuming all distributions reinvested.
(c) Had the investment advisor and/or any of its affiliates not waived fees or reimbursed a portion of expenses, total return would have been reduced.
(d) The benefits derived from expense reductions had an impact of less than 0.01%.
(e) Rounds to less than 0.01%.
See Accompanying Notes to Financial Statements.
150
Financial Highlights – Columbia Conservative High Yield Fund
Selected data for a share outstanding throughout each period is as follows:
| | | Year Ended August 31, | |
| Class A Shares | | 2008 | | 2007 | | 2006 | | 2005 | | 2004 | |
| Net Asset Value, Beginning of Period | | $ | 8.12 | | | $ | 8.27 | | | $ | 8.62 | | | $ | 8.69 | | | $ | 8.49 | | |
| Income from Investment Operations: | |
| Net investment income (a) | | | 0.51 | | | | 0.52 | | | | 0.50 | | | | 0.48 | | | | 0.50 | | |
Net realized and unrealized gain (loss) on investments
and foreign currency | | | (0.50 | ) | | | (0.13 | ) | | | (0.32 | ) | | | (0.03 | ) | | | 0.24 | | |
| Total from investment operations | | | 0.01 | | | | 0.39 | | | | 0.18 | | | | 0.45 | | | | 0.74 | | |
| Less Distributions to Shareholders: | |
| From net investment income | | | (0.52 | ) | | | (0.54 | ) | | | (0.53 | ) | | | (0.52 | ) | | | (0.54 | ) | |
| Net Asset Value, End of Period | | $ | 7.61 | | | $ | 8.12 | | | $ | 8.27 | | | $ | 8.62 | | | $ | 8.69 | | |
| Total return (b) | | | 0.07 | % | | | 4.75 | % | | | 2.16 | %(c) | | | 5.31 | % | | | 8.90 | % | |
| Ratios to Average Net Assets/Supplemental Data: | |
| Net expenses before interest expense (d) | | | 1.07 | % | | | 1.03 | % | | | 0.97 | % | | | 0.95 | % | | | 1.01 | % | |
| Interest expense | | | — | | | | — | %(e) | | | — | | | | — | | | | — | | |
| Net expenses (d) | | | 1.07 | % | | | 1.03 | % | | | 0.97 | % | | | 0.95 | % | | | 1.01 | % | |
| Waiver/Reimbursement | | | — | | | | — | | | | — | %(e) | | | — | | | | — | | |
| Net investment income (d) | | | 6.46 | % | | | 6.25 | % | | | 5.97 | % | | | 5.55 | % | | | 5.74 | % | |
| Portfolio turnover rate | | | 29 | % | | | 42 | % | | | 31 | % | | | 40 | % | | | 41 | % | |
| Net assets, end of period (000's) | | $ | 68,496 | | | $ | 103,769 | | | $ | 170,575 | | | $ | 321,402 | | | $ | 335,841 | | |
(a) Per share data was calculated using the average shares outstanding during the period.
(b) Total return at net asset value assuming all distributions reinvested and no initial sales charge or contingent deferred sales charge.
(c) Had the investment advisor and/or any of its affiliates not waived fees or reimbursed a portion of expenses, total return would have been reduced.
(d) The benefits derived from expense reductions had an impact of less than 0.01%.
(e) Rounds to less than 0.01%.
See Accompanying Notes to Financial Statements.
151
Financial Highlights – Columbia Conservative High Yield Fund
Selected data for a share outstanding throughout each period is as follows:
| | | Year Ended August 31, | |
| Class B Shares | | 2008 | | 2007 | | 2006 | | 2005 | | 2004 | |
| Net Asset Value, Beginning of Period | | $ | 8.12 | | | $ | 8.27 | | | $ | 8.62 | | | $ | 8.69 | | | $ | 8.49 | | |
| Income from Investment Operations: | |
| Net investment income (a) | | | 0.45 | | | | 0.46 | | | | 0.44 | | | | 0.42 | | | | 0.43 | | |
Net realized and unrealized gain (loss) on investments
and foreign currency | | | (0.50 | ) | | | (0.13 | ) | | | (0.32 | ) | | | (0.03 | ) | | | 0.24 | | |
| Total from investment operations | | | (0.05 | ) | | | 0.33 | | | | 0.12 | | | | 0.39 | | | | 0.67 | | |
| Less Distributions to Shareholders: | |
| From net investment income | | | (0.46 | ) | | | (0.48 | ) | | | (0.47 | ) | | | (0.46 | ) | | | (0.47 | ) | |
| Net Asset Value, End of Period | | $ | 7.61 | | | $ | 8.12 | | | $ | 8.27 | | | $ | 8.62 | | | $ | 8.69 | | |
| Total return (b) | | | (0.67 | )% | | | 3.97 | % | | | 1.40 | %(c) | | | 4.53 | % | | | 8.07 | % | |
| Ratios to Average Net Assets/Supplemental Data: | |
| Net expenses before interest expense (d) | | | 1.82 | % | | | 1.78 | % | | | 1.72 | % | | | 1.70 | % | | | 1.77 | % | |
| Interest expense | | | — | | | | — | %(e) | | | — | | | | — | | | | — | | |
| Net expenses (d) | | | 1.82 | % | | | 1.78 | % | | | 1.72 | % | | | 1.70 | % | | | 1.77 | % | |
| Waiver/Reimbursement | | | — | | | | — | | | | — | %(e) | | | — | | | | — | | |
| Net investment income (d) | | | 5.71 | % | | | 5.50 | % | | | 5.21 | % | | | 4.80 | % | | | 4.97 | % | |
| Portfolio turnover rate | | | 29 | % | | | 42 | % | | | 31 | % | | | 40 | % | | | 41 | % | |
| Net assets, end of period (000's) | | $ | 38,175 | | | $ | 50,577 | | | $ | 66,886 | | | $ | 89,101 | | | $ | 102,038 | | |
(a) Per share data was calculated using the average shares outstanding during the period.
(b) Total return at net asset value assuming all distributions reinvested and no contingent deferred sales charge.
(c) Had the investment advisor and/or any of its affiliates not waived fees or reimbursed a portion of expenses, total return would have been reduced.
(d) The benefits derived from expense reductions had an impact of less than 0.01%.
(e) Rounds to less than 0.01%.
See Accompanying Notes to Financial Statements.
152
Financial Highlights – Columbia Conservative High Yield Fund
Selected data for a share outstanding throughout each period is as follows:
| | | Year Ended August 31, | | Period Ended
August 31, | |
| Class C Shares | | 2008 | | 2007 | | 2006 | | 2005 | | 2004 (a) | |
| Net Asset Value, Beginning of Period | | $ | 8.12 | | | $ | 8.27 | | | $ | 8.62 | | | $ | 8.69 | | | $ | 8.64 | | |
| Income from Investment Operations: | |
| Net investment income (b) | | | 0.47 | | | | 0.47 | | | | 0.45 | | | | 0.43 | | | | 0.39 | | |
Net realized and unrealized gain (loss) on investments
and foreign currency | | | (0.51 | ) | | | (0.13 | ) | | | (0.32 | ) | | | (0.03 | ) | | | 0.09 | | |
| Total from investment operations | | | (0.04 | ) | | | 0.34 | | | | 0.13 | | | | 0.40 | | | | 0.48 | | |
| Less Distributions to Shareholders: | |
| From net investment income | | | (0.47 | ) | | | (0.49 | ) | | | (0.48 | ) | | | (0.47 | ) | | | (0.43 | ) | |
| Net Asset Value, End of Period | | $ | 7.61 | | | $ | 8.12 | | | $ | 8.27 | | | $ | 8.62 | | | $ | 8.69 | | |
| Total return (c)(d) | | | (0.52 | )% | | | 4.13 | % | | | 1.55 | % | | | 4.69 | % | | | 5.65 | %(e) | |
| Ratios to Average Net Assets/Supplemental Data: | |
| Net expenses before interest expense (f) | | | 1.67 | % | | | 1.63 | % | | | 1.57 | % | | | 1.55 | % | | | 1.61 | %(g) | |
| Interest expense | | | — | | | | — | %(h) | | | ��� | | | | — | | | | — | | |
| Net expenses (f) | | | 1.67 | % | | | 1.63 | % | | | 1.57 | % | | | 1.55 | % | | | 1.61 | %(g) | |
| Waiver/Reimbursement | | | 0.15 | % | | | 0.15 | % | | | 0.15 | % | | | 0.15 | % | | | 0.15 | %(g) | |
| Net investment income (f) | | | 5.88 | % | | | 5.69 | % | | | 5.37 | % | | | 4.95 | % | | | 5.03 | %(g) | |
| Portfolio turnover rate | | | 29 | % | | | 42 | % | | | 31 | % | | | 40 | % | | | 41 | %(e) | |
| Net assets, end of period (000's) | | $ | 23,003 | | | $ | 33,673 | | | $ | 11,653 | | | $ | 18,002 | | | $ | 20,126 | | |
(a) Class C shares were initially offered on October 13, 2003. Per share data and total return reflect activity from that date.
(b) Per share data was calculated using the average shares outstanding during the period.
(c) Total return at net asset value assuming all distributions reinvested and no contingent deferred sales charge.
(d) Had the investment advisor and/or any of its affiliates not waived fees or reimbursed a portion of expenses, total return would have been reduced.
(e) Not annualized.
(f) The benefits derived from expense reductions had an impact of less than 0.01%.
(g) Annualized.
(h) Rounds to less than 0.01%.
See Accompanying Notes to Financial Statements.
153
Financial Highlights – Columbia Conservative High Yield Fund
Selected data for a share outstanding throughout each period is as follows:
| | | Year Ended August 31, | |
| Class Z Shares | | 2008 | | 2007 | | 2006 | | 2005 | | 2004 | |
| Net Asset Value, Beginning of Period | | $ | 8.12 | | | $ | 8.27 | | | $ | 8.62 | | | $ | 8.69 | | | $ | 8.49 | | |
| Income from Investment Operations: | |
| Net investment income (a) | | | 0.53 | | | | 0.54 | | | | 0.52 | | | | 0.50 | | | | 0.52 | | |
Net realized and unrealized gain (loss) on investments
and foreign currency | | | (0.50 | ) | | | (0.13 | ) | | | (0.32 | ) | | | (0.03 | ) | | | 0.24 | | |
| Total from investment operations | | | 0.03 | | | | 0.41 | | | | 0.20 | | | | 0.47 | | | | 0.76 | | |
| Less Distributions to Shareholders: | |
| From net investment income | | | (0.54 | ) | | | (0.56 | ) | | | (0.55 | ) | | | (0.54 | ) | | | (0.56 | ) | |
| Net Asset Value, End of Period | | $ | 7.61 | | | $ | 8.12 | | | $ | 8.27 | | | $ | 8.62 | | | $ | 8.69 | | |
| Total return (b) | | | 0.32 | % | | | 5.01 | % | | | 2.42 | %(c) | | | 5.54 | % | | | 9.16 | % | |
| Ratios to Average Net Assets/Supplemental Data: | |
| Net expenses before interest expense (d) | | | 0.82 | % | | | 0.78 | % | | | 0.72 | % | | | 0.70 | % | | | 0.77 | % | |
| Interest expense | | | — | | | | — | %(e) | | | — | | | | — | | | | — | | |
| Net expenses (d) | | | 0.82 | % | | | 0.78 | % | | | 0.72 | % | | | 0.70 | % | | | 0.77 | % | |
| Waiver/Reimbursement | | | — | | | | — | | | | — | %(e) | | | — | | | | — | | |
| Net investment income (d) | | | 6.71 | % | | | 6.49 | % | | | 6.20 | % | | | 5.80 | % | | | 5.97 | % | |
| Portfolio turnover rate | | | 29 | % | | | 42 | % | | | 31 | % | | | 40 | % | | | 41 | % | |
| Net assets, end of period (000's) | | $ | 443,043 | | | $ | 614,168 | | | $ | 801,811 | | | $ | 1,073,894 | | | $ | 1,186,454 | | |
(a) Per share data was calculated using the average shares outstanding during the period.
(b) Total return at net asset value assuming all distributions reinvested.
(c) Had the investment advisor and/or any of its affiliates not waived fees or reimbursed a portion of expenses, total return would have been reduced.
(d) The benefits derived from expense reductions had an impact of less than 0.01%.
(e) Rounds to less than 0.01%.
See Accompanying Notes to Financial Statements.
154
Notes to Financial Statements – Columbia Funds
August 31, 2008
Note 1. Organization
Columbia Funds Series Trust I (the "Trust") is a Massachusetts business trust registered under the Investment Company Act of 1940, as amended, as an open-end management investment company. Information presented in these financial statements pertains to the following series of the Trust (individually referred to as a "Fund", collectively referred to as the "Funds"):
Columbia International Stock Fund
Columbia Mid Cap Growth Fund
Columbia Small Cap Growth Fund I
Columbia Real Estate Equity Fund
Columbia Technology Fund
Columbia Strategic Investor Fund
Columbia Balanced Fund
Columbia Oregon Intermediate Municipal Bond Fund
Columbia Conservative High Yield Fund
Columbia Real Estate Equity Fund is a non-diversified Fund, which allows the Fund to invest more of its assets in the securities of fewer issuers. All other Funds currently operate as diversified funds.
Investment Objectives
Columbia International Stock Fund seeks long-term capital appreciation. Columbia Mid Cap Growth Fund seeks significant capital appreciation by investing, under normal market conditions, at least 80% of its total net assets (plus any borrowings for investment purposes) in stocks of companies with a market capitalization, at the time of initial purchase, equal to or less than the largest stock in the Russell Midcap Index. Columbia Small Cap Growth Fund I seeks capital appreciation by investing, under normal market conditions, at least 80% of its net assets (plus any borrowings for investment purposes) in stocks of companies with a market capitalization, at the time of initial purchase, equal to or less than the largest stock in the Standard & Poor's SmallCap 600 Index. Columbia Real Estate Equity Fund seeks capital appreciation and above-average income by investing, under normal market conditions, at least 80% of its net asset s (plus any borrowings for investment purposes) in stocks of companies principally engaged in the real estate industry, including real estate investment trusts (REITs). Columbia Technology Fund seeks capital appreciation by investing, under normal market conditions, at least 80% of its total net assets (plus any borrowings for investment purposes) in stocks of technology companies that may benefit from technological improvements, advancements or developments. Columbia Strategic Investor Fund seeks long-term growth of capital by using a "value" approach to investing primarily in common stocks. Columbia Balanced Fund seeks high total return by investing in common stocks and debt securities. Columbia Oregon Intermediate Municipal Bond Fund seeks a high level of income exempt from federal and Oregon income tax by investing at least 80% of its net assets (plus any borrowings for investment purposes) in municipal securities issued by the State of Oregon (and its political subdivisions, agencies, authorities and in strumentalities). Columbia Conservative High Yield Fund seeks a high level of income, with capital appreciation as a secondary goal, by investing in non-investment-grade corporate debt securities, commonly referred to as "junk" or "high-yield" bonds.
Fund Shares
The Trust may issue an unlimited number of shares. Each of the Funds, except Columbia Mid Cap Growth Fund, offers four classes of shares: Class A, Class B, Class C and Class Z. Columbia Mid Cap Growth Fund offers six classes of shares: Class A, Class B, Class C, Class R, Class T and Class Z. Each share class has its own expense structure and sales charges, as applicable.
With the exception of Class A shares of Columbia Oregon Intermediate Municipal Bond Fund and Columbia Conservative High Yield Fund, Class A and Class T shares are subject to a front-end sales charge of up to 5.75% based on the amount of initial investment. Class A shares of Columbia Oregon Intermediate Municipal Bond Fund and Columbia Conservative High Yield Fund are subject to a front-end sales charge of up to 3.25% and 4.75%, respectively, based on the amount of initial investment. Class A and Class T shares purchased without an initial sales charge in accounts aggregating $1 million to $50 million at the time of purchase are subject to a 1.00% contingent deferred sales charge ("CDSC") on shares sold within one year after purchase. With the exception of Class B shares of Columbia Oregon Intermediate Municipal Bond Fund, which are subject to a maximum CDSC of 3.00%, Class B shares are subject to a maximum CDSC of 5.00% based up on the holding period after purchase. Class B shares will generally convert to Class A shares eight years after purchase. Class C shares are subject
155
Columbia Funds, August 31, 2008 (continued)
to a 1.00% CDSC on shares sold within one year after purchase. Class R and Class Z shares are offered continuously at net asset value. There are certain restrictions on the purchase of Class R and Class Z shares, as described in the Funds' prospectuses.
Note 2. Significant Accounting Policies
The preparation of financial statements in accordance with accounting principles generally accepted in the United States of America ("GAAP") requires management to make certain estimates and assumptions that affect the reported amounts of assets and liabilities, the disclosure of contingent assets and liabilities at the date of the financial statements and the reported amounts of revenue and expenses during the reporting period. Actual results could differ from those estimates. The following is a summary of significant accounting policies consistently followed by the Funds in the preparation of their financial statements.
Security Valuation
Equity securities, exchange-traded funds and securities of certain investment companies are valued at the last sale price on the principal exchange on which they trade, except for securities traded on the NASDAQ, which are valued at the NASDAQ official close price. Unlisted securities or listed securities for which there were no sales during the day are valued at the closing bid price on such exchanges or over-the-counter markets.
Debt securities generally are valued by pricing services approved by the Trust's Board of Trustees, based upon market transactions for normal, institutional-size trading units of similar securities. The services may use various pricing techniques which take into account appropriate factors such as yield, quality, coupon rate, maturity, type of issue, trading characteristics and other data, as well as broker quotes. Debt securities for which quotations are readily available are valued at an over-the-counter or exchange bid quotation. Certain debt securities, which tend to be more thinly traded and of lesser quality, are priced based on fundamental analysis of the financial condition of the issuer and the estimated value of any collateral. Valuations developed through pricing techniques may vary from the actual amounts realized upon sale of the securities, and the potential variation may be greater for those securities valued usin g fundamental analysis.
Short-term debt obligations maturing within 60 days are valued at amortized cost, which approximates market value.
Investments in other open-end investment companies are valued at net asset value.
Futures contracts are valued at the settlement price established each day by the board of trade or exchange on which they are traded.
Options are valued at the last reported sale price, or in the absence of a sale, the mean between the last quoted bid and ask price.
Forward foreign currency exchange contracts are valued at the prevailing forward exchange rate of the underlying currencies.
Foreign securities are generally valued at the last sale price on the foreign exchange or market on which they trade. If any foreign share prices are not readily available as a result of limited share activity, the securities are valued at the last sale price of the local shares in the principal market in which such securities are normally traded.
Generally, trading in foreign securities is substantially completed each day at various times prior to the close of the New York Stock Exchange ("NYSE"). The values of such securities used in computing the net asset value of the Funds' shares are determined as of such times. Foreign currency exchange rates are generally determined at 4:00 p.m. Eastern (U.S.) time. Occasionally, events affecting the values of such foreign securities and such exchange rates may occur between the times at which they are determined and the close of the customary trading session of the NYSE, which would not be reflected in the computation of the Funds' net asset value. If events materially affecting the values of such foreign securities occur and it is determined that market quotations are not reliable, then these foreign securities will be valued at their fair value using procedures approved by the Board of Trustees. Certain funds may use a systemat ic fair valuation model provided by an independent third party to value securities principally traded in foreign markets in order to adjust for possible stale pricing that may occur between the close of the foreign exchanges and the time for valuation.
Investments for which market quotations are not readily available, or that have quotations which management believes are not reliable, are valued at fair value as determined in good faith under consistently applied procedures established by and
156
Columbia Funds, August 31, 2008 (continued)
under the general supervision of the Board of Trustees. If a security is valued at fair value, such value is likely to be different from the last quoted market price for the security.
In September 2006, Statement of Financial Accounting Standards No. 157, Fair Value Measurements ("SFAS 157"), was issued. SFAS 157 is effective for fiscal years beginning after November 15, 2007. SFAS 157 defines fair value, establishes a framework for measuring fair value and expands disclosures about fair value measurements. Management is evaluating the impact the application of SFAS 157 will have on each Fund's financial statement disclosures.
Security Transactions
Security transactions are accounted for on the trade date. Cost is determined and gains (losses) are based upon the specific identification method for both financial statement and federal income tax purposes.
In March 2008, Statement of Financial Accounting Standards No. 161, Disclosures about Derivative Instruments and Hedging Activities—an amendment of FASB Statement No. 133 ("SFAS 161"), was issued. SFAS 161 is effective for fiscal years and interim periods beginning after November 15, 2008. SFAS 161 requires additional discussion about the reporting entity's derivative instruments and hedging activities, by providing for qualitative disclosures about the objectives and strategies for using derivatives, quantitative data about the fair value of and gains and losses on derivative contracts, and details of credit-risk-related contingent features in their hedged positions. Management is evaluating the impact the application of SFAS 161 will have on the Funds' financial statement d isclosures.
Futures Contracts
The Funds may invest in futures for both hedging and non-hedging purposes, including, for example, to seek to enhance returns or as a substitute for a position in an underlying asset.
The use of futures contracts involves certain risks, which include: (1) imperfect correlation between the price movement of the instruments and the underlying securities, (2) inability to close out positions due to differing trading hours, or the temporary absence of a liquid market, for either the instruments or the underlying securities, or (3) an inaccurate prediction by Columbia Management Advisors, LLC ("Columbia"), the Funds' investment advisor, of the future direction of interest rates. Any of these risks may involve amounts exceeding the variation margin recorded in the Funds' Statements of Assets and Liabilities at any given time.
Upon entering into a futures contract, a Fund pledges cash or securities with the broker in an amount sufficient to meet the initial margin requirement. Subsequent payments are made or received by a Fund equal to the daily change in the contract value and are recorded as variation margin receivable or payable and offset in unrealized gains or losses. A Fund recognizes a realized gain or loss when the contract is closed or expires.
Options
Each Fund may write call and put options on securities it owns or in which it may invest. Writing put options tends to increase a Fund's exposure to the underlying instrument. Writing call options tends to decrease a Fund's exposure to the underlying instrument. When a Fund writes a call or put option, an amount equal to the premium received is recorded as a liability and subsequently marked-to-market to reflect the current value of the option written. Premiums received from writing options which expire are treated as realized gains. Premiums received from writing options which are exercised or closed are added to the proceeds or offset against the amounts paid on the underlying security transaction to determine the realized gain or loss. Each Fund, as a writer of an option, has no control over whether the underlying security may be sold (call) or purchased (put) and as a result bears the market risk of an unfavorable change in the price of the security underlying the written option. There is the risk that the Funds may not be able to enter into a closing transaction because of an illiquid market. The Funds' custodian will set aside cash or liquid portfolio securities equal to the amount of the written options contract commitment in a segregated account.
Each Fund may also purchase put and call options. Purchasing call options tends to increase a Fund's exposure to the underlying instrument. Purchasing put options tends to decrease a Fund's exposure to the underlying instrument. The Funds may pay a premium, which is included in the Funds' Statements of Assets and Liabilities as an investment and subsequently marked-to-market to reflect the current value of the option. The risk associated with purchasing put and call options is limited to the premium paid. Premiums paid for purchasing options which expire are treated as realized
157
Columbia Funds, August 31, 2008 (continued)
losses. Premiums paid for purchasing options which are excercised are added to the amounts paid (call) or offset against the proceeds (put) on the underlying security transaction to determine the realized gain or loss. If a Fund enters into a closing transaction, the Fund will realize a gain or loss, depending on whether the proceeds from the closing transaction are greater or less than the cost of the option.
Forward Foreign Currency Exchange Contracts
Forward foreign currency exchange contracts are agreements to exchange one currency for another at a future date at a specified price. These contracts are used to minimize the exposure to foreign exchange rate fluctuations during the period between trade and settlement date of the contract. Certain Funds may utilize forward foreign currency exchange contracts in connection with the settlement of purchases and sales of securities. Certain Funds may also enter into these contracts to hedge certain other foreign currency denominated assets. Contracts to buy generally are used to acquire exposure to foreign currencies, while contracts to sell are generally used to hedge the Funds' investments against currency fluctuations. Forward foreign currency exchange contracts are valued daily at the current exchange rate of the underlying currency, resulting in unrealized gains (losses) which become realized at the time the forward foreign cu rrency exchange contracts are closed or mature. Realized and unrealized gains (losses) arising from such transactions are included in net realized and unrealized gains (losses) on foreign currency transactions. The use of forward foreign currency exchange contracts does not eliminate fluctuations in the prices of the Funds' portfolio securities. While the maximum potential loss from such contracts is the aggregate face value in U.S. dollars at the time the contract was opened, exposure is typically limited to the change in value of the contract (in U.S. dollars) over the period it remains open. The Funds could also be exposed to risk that counterparties of the contracts may be unable to fulfill the terms of the contracts.
Repurchase Agreements
Each Fund may engage in repurchase agreement transactions with institutions that Columbia, has determined are creditworthy. Each Fund, through its custodian, receives delivery of the underlying securities collateralizing a repurchase agreement. Columbia is responsible for determining that the collateral is at least equal, at all times, to the value of the repurchase obligation including interest. A repurchase agreement transaction involves certain risks in the event of default or insolvency of the counterparty. These risks include possible delays in or restrictions on each Fund's ability to dispose of the underlying securities and a possible decline in the value of the underlying securities during the period while the Funds seek to assert their rights.
Loan Participations and Commitments
The Columbia Conservative High Yield Fund may invest in loan participations. When the Fund purchases a loan participation, the Fund typically enters into a contractual relationship with the lender or third party selling such participation ("Selling Participant"), but not the borrower. However, the Fund assumes the credit risk of the borrower, Selling Participant and any other persons interpositioned between the Fund and the borrower. The Fund may not directly benefit from the collateral supporting the senior loan which it has purchased from the Selling Participant
Delayed Delivery Securities
Each Fund may trade securities on other than normal settlement terms, including securities purchased or sold on a "when-issued" basis. This may increase the risk if the other party to the transaction fails to deliver and causes the Funds to subsequently invest at less advantageous prices. Each Fund holds until the settlement date, in a segregated account, cash or liquid securities in an amount equal to the delayed delivery commitment.
Treasury Inflation Protected Securities
Columbia Balanced Fund may invest in treasury inflation protected securities ("TIPS"). The principal amount of TIPS is adjusted periodically for inflation based on a monthly published index. Interest payments are based on the inflation-adjusted principal at the time the interest is paid. These adjustments are recorded as interest income on the Statements of Operations.
Foreign Currency Transactions
The values of all assets and liabilities quoted in foreign currencies are translated into U.S. dollars at that day's exchange rates. Net realized and unrealized gains (losses) on foreign currency transactions include gains (losses) arising from the fluctuation in exchange rates between trade and settlement dates on securities transactions, gains (losses) arising from the disposition of foreign currency and currency gains (losses) between the accrual and payment dates on dividends, interest income and foreign withholding taxes.
158
Columbia Funds, August 31, 2008 (continued)
For financial statement purposes, the Funds do not distinguish that portion of gains (losses) on investments which is due to changes in foreign exchange rates from that which is due to changes in market prices of the investments. Such fluctuations are included with the net realized and unrealized gains (losses) on investments on the Statements of Operations.
Income Recognition
Interest income is recorded on the accrual basis. Premium and discount are amortized and accreted, respectively, on all debt securities, unless otherwise noted. Original issue discount is accreted to interest income over the life of the security with a corresponding increase in the cost basis. Corporate actions and dividend income are recorded on the ex-date except for certain foreign securities which are recorded as soon after the ex-date as the Funds become aware of such, net of any non-reclaimable tax withholdings. Distributions received from real estate investment trusts (REITs) in excess of their income are recorded as a reduction of the cost of the related investments. If the Funds no longer own the applicable securities, any distributions received in excess of income are recorded as realized gains. Awards from class action litigation are recorded as a reduction of cost if the Funds still own the applicable securities on t he payment date. If the Funds no longer own the applicable securities, the proceeds are recorded as realized gains. The value of additional securities received as an income payment is recorded as income and as the cost basis of such securities.
Expenses
General expenses of the Trust are allocated to the Funds and other series of the Trust based upon relative net assets or other expense allocation methodologies determined by the nature of the expense. Expenses directly attributable to a Fund are charged to such Fund.
Determination of Class Net Asset Value
All income, expenses (other than class-specific expenses, as shown on the Statements of Operations) and realized and unrealized gains (losses) are allocated to each class of a Fund on a daily basis for purposes of determining the net asset value of each class. Income and expenses are allocated to each class based on the settled shares method, while realized and unrealized gains (losses) are allocated based on the relative net assets of each class for Columbia Oregon Intermediate Municipal Bond Fund and Columbia Conservative High Yield Fund. For the remaining Funds, income, expenses (other than class-specific expenses, as shown on the Statements of Operations) and realized and unrealized gains (losses) are allocated to each class of a Fund based on the relative net assets of each class of that Fund.
Federal Income Tax Status
Each Fund intends to qualify each year as a "regulated investment company" under Subchapter M of the Internal Revenue Code, as amended, and will distribute substantially all of its tax-exempt or taxable income, if any, for its tax year, and as such will not be subject to federal income taxes. In addition, each Fund intends to distribute in each calendar year substantially all of its net investment income, capital gains and certain other amounts, if any, such that each Fund should not be subject to federal excise tax. Therefore, no federal income or excise tax provision is recorded.
Foreign Capital Gains Taxes
Realized gains in certain countries may be subject to foreign taxes at the fund level, at rates ranging from approximately 10% to 15%. The Funds accrue for such foreign taxes on net realized and unrealized gains at the appropriate rate for each jurisdiction.
Distributions to Shareholders
Distributions from net investment income of Columbia International Stock Fund, Columbia Mid Cap Growth Fund, Columbia Small Cap Growth Fund I, Columbia Technology Fund and Columbia Strategic Investor Fund, if any, are declared and distributed annually. Distributions from net investment income of Columbia Real Estate Equity Fund and Columbia Balanced Fund, if any, are declared and distributed quarterly. Distributions from net investment income of Columbia Oregon Intermediate Municipal Bond Fund and Columbia Conservative High Yield Fund are declared daily and distributed monthly. Net realized capital gains, if any, are distributed at least annually for all Funds. Income distributions and capital gains distributions are determined in accordance with federal income tax regulations which may differ from GAAP.
Indemnification
In the normal course of business, each Fund enters into contracts that contain a variety of representations and warranties and which provide general indemnities. A Fund's maximum exposure under these arrangements is unknown because this would involve future claims against a Fund. Also, under the Trust's organizational documents and by contract,
159
Columbia Funds, August 31, 2008 (continued)
the Trustees and officers of the Trust are indemnified against certain liabilities that may arise out of actions relating to their duties to the Trust. However, based on experience, the Funds expect the risk of loss due to these representations, warranties and indemnities to be minimal.
Note 3. Federal Tax Information
The timing and character of income and capital gain distributions are determined in accordance with income tax regulations, which may differ from GAAP. Reclassifications are made to each Fund's capital accounts for permanent tax differences to reflect income and gains available for distribution (or available capital loss carryforwards) under income tax regulations.
For the year ended August 31, 2008, permanent book and tax basis differences resulting primarily from differing treatments for net operating loss reclassifications, foreign currency transactions, capital loss carryforwards, paydown reclassifications, distribution reclassifications, Passive Foreign Investment Company adjustments, redemption based payments treated as dividends paid deduction, market discount reclassifications and discount accretion/premium amortization on debt securities were identified and reclassified among the components of each Fund's net assets as follows:
| | | Undistributed
(Overdistributed)
Net Investment
Income or
Accumulated Net
Investment Loss | | Accumulated
Net Realized
Gain (Loss) | | Paid-In Capital | |
| Columbia International Stock Fund | | $ | (4,963,548 | ) | | $ | 4,963,787 | | | $ | (239 | ) | |
| Columbia Mid Cap Growth Fund | | | 4,014,358 | | | | (4,014,359 | ) | | | 1 | | |
| Columbia Small Cap Growth Fund I | | | 1,899,449 | | | | (389,370 | ) | | | (1,510,079 | ) | |
| Columbia Real Estate Equity Fund | | | (1,592,522 | ) | | | (23,520,165 | ) | | | 25,112,687 | | |
| Columbia Technology Fund | | | 2,721,845 | | | | (646,288 | ) | | | (2,075,557 | ) | |
| Columbia Strategic Investor Fund | | | (59,978 | ) | | | 59,978 | | | | — | | |
| Columbia Balanced Fund | | | 200,715 | | | | (200,713 | ) | | | (2 | ) | |
| Columbia Oregon Intermediate Municipal Bond Fund | | | (40,985 | ) | | | 40,984 | | | | 1 | | |
| Columbia Conservative High Yield Fund | | | 2,022,289 | | | | (2,022,289 | ) | | | — | | |
Net investment income and net realized gains (losses), as disclosed on the Statements of Operations, and net assets were not affected by these reclassifications.
The tax character of distributions paid during the years ended August 31, 2008 and August 31, 2007 was as follows:
| | | August 31, 2008 | |
| | | Tax-Exempt
Income | | Ordinary
Income* | | Long-Term
Capital Gains | | Total | |
| Columbia International Stock Fund | | $ | — | | | $ | 72,484,263 | | | $ | 120,917,872 | | | $ | 193,402,135 | | |
| Columbia Mid Cap Growth Fund | | | — | | | | 67,860,029 | | | | 146,420,479 | | | | 214,280,508 | | |
| Columbia Small Cap Growth Fund I | | | — | | | | 7,557,491 | | | | 24,654,752 | | | | 32,212,243 | | |
160
Columbia Funds, August 31, 2008 (continued)
| | | August 31, 2008 | |
| | | Tax-Exempt
Income | | Ordinary
Income* | | Long-Term
Capital Gains | | Total | |
| Columbia Real Estate Equity Fund | | $ | — | | | $ | 4,051,574 | | | $ | 105,279,419 | | | $ | 109,330,993 | | |
| Columbia Technology Fund | | | — | | | | 6,856,684 | | | | 14,787,370 | | | | 21,644,054 | | |
| Columbia Strategic Investor Fund | | | — | | | | 8,110,181 | | | | 120,053,974 | | | | 128,164,155 | | |
| Columbia Balanced Fund | | | — | | | | 5,285,251 | | | | 1,048,831 | | | | 6,334,082 | | |
Columbia Oregon Intermediate
Municipal Bond Fund | | | 15,579,086 | | | | — | | | | — | | | | 15,579,086 | | |
| Columbia Conservative High Yield Fund | | | — | | | | 45,392,403 | | | | — | | | | 45,392,403 | | |
| | | August 31, 2007 | |
| | | Tax-Exempt
Income | | Ordinary
Income* | | Long-Term
Capital Gains | | Total | |
| Columbia International Stock Fund | | $ | — | | | $ | 21,930,885 | | | $ | 136,213,727 | | | $ | 158,144,612 | | |
| Columbia Mid Cap Growth Fund | | | — | | | | 13,102,667 | | | | 74,190,625 | | | | 87,293,292 | | |
| Columbia Small Cap Growth Fund I | | | — | | | | 7,227,574 | | | | 23,653,088 | | | | 30,880,662 | | |
| Columbia Real Estate Equity Fund | | | — | | | | 9,129,456 | | | | 211,804,391 | | | | 220,933,847 | | |
| Columbia Strategic Investor Fund | | | — | | | | 6,325,599 | | | | 54,525,936 | | | | 60,851,535 | | |
| Columbia Balanced Fund | | | — | | | | 5,000,055 | | | | — | | | | 5,000,055 | | |
| Columbia Oregon Intermediate Municipal Bond Fund | | | 15,322,951 | | | | 12,232 | | | | — | | | | 15,335,183 | | �� |
| Columbia Conservative High Yield Fund | | | — | | | | 63,509,159 | | | | — | | | | 63,509,159 | | |
* For tax purposes short-term capital gains distributions, if any, are considered ordinary income distributions.
As of August 31, 2008, the components of distributable earnings on a tax basis were as follows:
| | | Undistributed
Tax-Exempt
Income | | Undistributed
Ordinary
Income | | Undistributed
Long-Term
Capital Gains | | Net Unrealized
Appreciation
(Depreciation)* | |
| Columbia International Stock Fund | | $ | — | | | $ | — | | | $ | 22,727,514 | | | $ | (9,191,247 | ) | |
| Columbia Mid Cap Growth Fund | | | — | | | | — | | | | 28,287,472 | | | | 165,963,813 | | |
| Columbia Small Cap Growth Fund I | | | — | | | | — | | | | — | | | | 42,377,486 | | |
| Columbia Real Estate Equity Fund | | | — | | | | 1,389,865 | | | | 16,935,776 | | | | 59,275,112 | | |
| Columbia Technology Fund | | | — | | | | — | | | | — | | | | 15,641,539 | | |
| Columbia Strategic Investor Fund | | | — | | | | 2,753,121 | | | | — | | | | 158,020,427 | | |
| Columbia Balanced Fund | | | — | | | | 987,694 | | | | — | | | | 14,599,925 | | |
| Columbia Oregon Intermediate Municipal Bond Fund | | | 356,688 | | | | — | | | | — | | | | 9,529,942 | | |
| Columbia Conservative High Yield Fund | | | — | | | | 2,021,372 | | | | — | | | | (38,079,295 | ) | |
* The differences between book-basis and tax-basis net unrealized appreciation/depreciation are primarily due to deferral of losses from wash sales, PFIC adjustments, discount accretion/premium amortization on debt securities and identified straddle loss deferrals.
161
Columbia Funds, August 31, 2008 (continued)
Unrealized appreciation and depreciation at August 31, 2008, based on cost of investments for federal income tax purposes, were:
| | | Unrealized
Appreciation | | Unrealized
Depreciation | | Net
Unrealized
Appreciation
(Depreciation) | |
| Columbia International Stock Fund | | $ | 108,357,678 | | | $ | (117,548,925 | ) | | $ | (9,191,247 | ) | |
| Columbia Mid Cap Growth Fund | | | 232,828,257 | | | | (66,864,444 | ) | | | 165,963,813 | | |
| Columbia Small Cap Growth Fund I | | | 61,737,466 | | | | (19,359,980 | ) | | | 42,377,486 | | |
| Columbia Real Estate Equity Fund | | | 74,963,429 | | | | (15,688,317 | ) | | | 59,275,112 | | |
| Columbia Technology Fund | | | 32,168,339 | | | | (16,526,800 | ) | | | 15,641,539 | | |
| Columbia Strategic Investor Fund | | | 189,428,819 | | | | (31,408,392 | ) | | | 158,020,427 | | |
| Columbia Balanced Fund | | | 19,526,331 | | | | (4,926,406 | ) | | | 14,599,925 | | |
| Columbia Oregon Intermediate Municipal Bond Fund | | | 13,279,883 | | | | (3,749,941 | ) | | | 9,529,942 | | |
| Columbia Conservative High Yield Fund | | | 3,067,698 | | | | (41,146,993 | ) | | | (38,079,295 | ) | |
The following capital loss carryforwards, determined as of August 31, 2008, may be available to reduce taxable income arising from future net realized gains on investments, if any, to the extent permitted by the Internal Revenue Code:
| | | Year of Expiration | |
| | | 2009 | | 2010 | | 2011 | | 2013 | | 2014 | | 2015 | | 2016 | | Total | |
| Columbia International Stock Fund | | $ | 30,059,623 | | | $ | 20,382,060 | | | $ | — | | | $ | — | | | $ | — | | | $ | — | | | $ | — | | | $ | 50,441,683 | | |
| Columbia Mid Cap Growth Fund | | | 1,376,842 | | | | — | | | | — | | | | — | | | | — | | | | — | | | | — | | | | 1,376,842 | | |
| Columbia Strategic Investor Fund | | | 5,290,232 | | | | — | | | | 10,580,464 | | | | — | | | | — | | | | — | | | | — | | | | 15,870,696 | | |
Columbia Oregon Intermediate
Municipal Bond Fund | | | — | | | | — | | | | — | | | | 19,562 | | | | — | | | | — | | | | — | | | | 19,562 | | |
Columbia Conservative
High Yield Fund | | | — | | | | 9,535,110 | | | | — | | | | — | | | | 975,147 | | | | 22,859,341 | | | | 5,603,050 | | | | 38,972,648 | | |
Capital loss carryforwards that were utilized and/or expired during the year ended August 31, 2008 were as follows:
| Columbia International Stock Fund | | $ | 24,094,013 | | |
| Columbia Mid Cap Growth Fund | | | 1,376,842 | | |
| Columbia Strategic Investor Fund | | | 5,290,232 | | |
Columbia Oregon Intermediate
Municipal Bond Fund | | | 43,694 | | |
Of the remaining capital loss carryforwards attributable to Columbia International Stock Fund, $659,591 expiring August 31, 2009 and $49,782,092 ($29,400,032 expiring August 31, 2009 and $20,382,060 expiring August 31, 2010) remain from Columbia International Stock Fund's merger with Stein Roe International Fund and Columbia International Equity Fund, respectively. The availability of the remaining capital loss carryforwards may be limited in a given year.
Of the capital loss carryforwards attributable to Columbia Mid Cap Growth Fund, $1,376,842 expiring August 31, 2009 remains from the Columbia Mid Cap Growth Fund's merger with Liberty Mid Cap Growth Fund.
162
Columbia Funds, August 31, 2008 (continued)
Of the remaining capital loss carryforwards attributable to Columbia Strategic Investor Fund, $5,290,232 expiring August 31, 2009 and $10,580,464 expiring August 31, 2011 remain from the Columbia Strategic Investor Fund merger with the Columbia Young Investor Fund. The availability of a portion of the remaining capital loss carryforward from the Columbia Young Investor Fund may be limited in a given year.
Under current tax rules, certain currency and capital losses realized after October 31 may be deferred and treated as occurring on the first day of the following fiscal year. As of August 31, 2008, post-October currency and capital losses attributed to security transactions were deferred to September 1, 2008, as follows:
| | | Capital
Losses | | Currency
Losses | |
| Columbia Small Cap Growth Fund I | | $ | 9,498,273 | | | $ | 8,595 | | |
| Columbia Technology Fund | | | 40,655,729 | | | | — | | |
| Columbia Strategic Investor Fund | | | 57,971,642 | | | | — | | |
| Columbia Balanced Fund | | | 646,936 | | | | — | | |
Columbia Conservative
High Yield Fund | | | 32,276,784 | | | | — | | |
Under Financial Accounting Standards Board ("FASB") Interpretation No. 48, Accounting for Uncertainty in Income Taxes, an Interpretation of FASB Statement No. 109 ("FIN 48") management determines whether a tax position of the Funds is more likely than not to be sustained upon examination by the applicable taxing authority, including resolution of any related appeals or litigation processes, based on the technical merits of the position. The tax benefit to be recognized is measured as the largest amount of benefit that is greater than fifty percent likely of being realized upon ultimate settlement. Management has evaluated the known implications of FIN 48 on its computation of net assets for each Fund. As a result of this evaluation, management has concluded that FIN 48 did not hav e any effect on the Funds' financial statements. However, management's conclusions regarding FIN 48 may be subject to review and adjustment at a later date based on factors including, but not limited to, further implementation guidance from the FASB, new tax laws, regulations, and administrative interpretations (including relevant court decisions). The Funds' federal tax returns for the prior three fiscal years remain subject to examination by the Internal Revenue Service. The Funds are not aware of any tax positions for which it is reasonably possible that the total amounts of unrecognized tax benefits will significantly change in the next twelve months.
Note 4. Fees and Compensation Paid to Affiliates
Investment Advisory Fee
Columbia, an indirect, wholly owned subsidiary of Bank of America Corporation ("BOA"), provides investment advisory services to the Funds. In rendering investment advisory services to the Funds, Columbia may use the portfolio management and research resources of Columbia Management Pte. Ltd., an affiliate of Columbia. Columbia receives a monthly investment advisory fee based on each Fund's average daily net assets at the following annual rates:
| | | First
$500
Million | | $500 Million
to $1
Billion | | $1 Billion
to $1.5
Billion | | $1.5 Billion
to $3
Billion | | $3 Billion
to $6
Billion | | Over
$6 Billion | |
Columbia International
Stock Fund | | | 0.87 | % | | | 0.82 | % | | | 0.77 | % | | | 0.72 | % | | | 0.70 | % | | | 0.68 | % | |
Columbia Mid Cap
Growth Fund | | | 0.82 | % | | | 0.75 | % | | | 0.72 | % | | | 0.67 | % | | | 0.67 | % | | | 0.67 | % | |
Columbia Small Cap
Growth Fund I | | | 0.87 | % | | | 0.82 | % | | | 0.77 | % | | | 0.77 | % | | | 0.77 | % | | | 0.77 | % | |
Columbia Real Estate
Equity Fund | | | 0.75 | % | | | 0.75 | % | | | 0.75 | % | | | 0.75 | % | | | 0.75 | % | | | 0.75 | % | |
163
Columbia Funds, August 31, 2008 (continued)
| | | First
$500
Million | | $500 Million
to $1
Billion | | $1 Billion
to $1.5
Billion | | $1.5 Billion
to $3
Billion | | $3 Billion
to $6
Billion | | Over
$6 Billion | |
| Columbia Technology Fund | | | 0.87 | % | | | 0.82 | % | | | 0.77 | % | | | 0.77 | % | | | 0.77 | % | | | 0.77 | % | |
Columbia Strategic
Investor Fund | | | 0.60 | % | | | 0.55 | % | | | 0.50 | % | | | 0.50 | % | | | 0.50 | % | | | 0.50 | % | |
| Columbia Balanced Fund | | | 0.50 | % | | | 0.50 | % | | | 0.50 | % | | | 0.50 | % | | | 0.50 | % | | | 0.50 | % | |
Columbia Oregon Intermediate
Municipal Bond Fund | | | 0.50 | % | | | 0.50 | % | | | 0.50 | % | | | 0.50 | % | | | 0.50 | % | | | 0.50 | % | |
Columbia Conservative
High Yield Fund | | | 0.60 | % | | | 0.55 | % | | | 0.52 | % | | | 0.49 | % | | | 0.49 | % | | | 0.49 | % | |
For the year ended August 31, 2008, the effective investment advisory fee rates for the Funds, as a percentage of each Fund's average daily net assets, were as follows:
| | | Effective
Fee Rate | |
| Columbia International Stock Fund | | | 0.83 | % | |
| Columbia Mid Cap Growth Fund | | | 0.76 | % | |
| Columbia Small Cap Growth Fund I | | | 0.87 | % | |
| Columbia Real Estate Equity Fund | | | 0.75 | % | |
| Columbia Technology Fund | | | 0.87 | % | |
| Columbia Strategic Investor Fund | | | 0.56 | % | |
| Columbia Balanced Fund | | | 0.50 | % | |
| Columbia Oregon Intermediate | |
| Municipal Bond Fund | | | 0.50 | % | |
| Columbia Conservative High Yield Fund | | | 0.59 | % | |
Administration Fee
Columbia provides administrative and other services to Columbia Strategic Investor Fund for a monthly administration fee based on the Fund's average daily net assets at the following annual rates:
| Average Daily Net Assets | | Annual Fee Rates | |
| First $1 billion | | | 0.150 | % | |
| Over $1 billion | | | 0.125 | % | |
For the year ended August 31, 2008, the effective administration fee rate was 0.146% of Columbia Strategic Investor Fund's average daily net assets.
Pricing and Bookkeeping Fees
The Funds have entered into a Financial Reporting Services Agreement (the "Financial Reporting Services Agreement") with State Street Bank & Trust Company ("State Street") and Columbia pursuant to which State Street provides financial reporting services to the Funds. The Funds have also entered into an Accounting Services Agreement (collectively with the Financial Reporting Services Agreement, the "State Street Agreements") with State Street and Columbia pursuant to which State Street provides accounting services to the Funds. Under the State Street Agreements, each Fund pays State Street an annual fee of $38,000 paid monthly plus an additional monthly fee based on an annualized percentage rate of average daily net assets of each Fund for the month. The aggregate fee per Fund will not exceed $140,000 per year (exclusive of out-of-pocket expenses and charges). The Funds also reimburse State Street for certain out-of-pocket ex penses and charges.
The Funds have entered into a Pricing and Bookkeeping Oversight and Services Agreement (the "Services Agreement") with Columbia. Under the Services Agreement, Columbia provides services related to Fund expenses and the requirements of the Sarbanes-Oxley Act of 2002, and provides oversight of the accounting and financial reporting services provided by State Street. Under the Services Agreement, the Funds reimburse Columbia for out-of-pocket expenses. Prior to January 1, 2008, the Funds also reimbursed Columbia for accounting oversight services, services related to Fund expenses and the requirements of the Sarbanes-Oxley Act of 2002.
164
Columbia Funds, August 31, 2008 (continued)
For the year ended August 31, 2008, the amounts charged to the Funds by affiliates included in the Statements of Operations under "Pricing and bookkeeping fees" were as follows:
| | | Amounts
Charged
by Affiliates | |
| Columbia International Stock Fund | | $ | 4,673 | | |
| Columbia Mid Cap Growth Fund | | | 4,673 | | |
| Columbia Small Cap Growth Fund I | | | 4,673 | | |
| Columbia Real Estate Equity Fund | | | 4,673 | | |
| Columbia Technology Fund | | | 4,673 | | |
| Columbia Strategic Investor Fund | | | 4,673 | | |
| Columbia Balanced Fund | | | 4,673 | | |
Columbia Oregon Intermediate
Municipal Bond Fund | | | 4,673 | | |
| Columbia Conservative High Yield Fund | | | 4,673 | | |
Transfer Agent Fee
Columbia Management Services, Inc. (the "Transfer Agent"), an affiliate of Columbia and an indirect, wholly owned subsidiary of BOA, provides shareholder services to the Funds and has contracted with Boston Financial Data Services ("BFDS") to serve as sub-transfer agent. The Transfer Agent is entitled to receive a fee for its services, paid monthly, at the annual rate of $17.34 per open account plus reimbursement of certain sub-transfer agent fees paid by the Transfer Agent (exclusive of BFDS fees), calculated based on assets held in omnibus accounts and intended to recover the cost of payments to other parties (including affiliates of BOA) for services to those accounts. Prior to November 1, 2007, the annual rate was $17.00 per open account. The Transfer Agent pays the fees of BFDS for services as sub-transfer agent and is not entitled to reimbursement for such fees from the Funds. The Transfer Agent may also retain, as additio nal compensation for its services, fees for wire, telephone and redemption orders, IRA trustee agent fees and account transcript fees due to the Transfer Agent from shareholders of the Funds and credits (net of bank charges) earned with respect to balances in accounts the Transfer Agent maintains in connection with its services to the Funds. The Transfer Agent also receives reimbursement for certain out-of-pocket expenses.
The Transfer Agent has voluntarily agreed to waive up to 0.10% of Columbia International Stock Fund's average daily net assets. For the year ended August 31, 2008, the Transfer Agent waived transfer agent fees of $1,038,623. The Transfer Agent, at its discretion, may revise or discontinue this arrangement at any time.
An annual minimum account balance fee of up to $20 may apply to certain accounts with a value below each Fund's initial minimum investment requirements to reduce the impact of small accounts on transfer agent fees. These minimum account balance fees are recorded as part of expense reductions on the Statements of Operations. For the year ended August 31, 2008, these minimum account balance fees reduced total expenses as follows:
| | | Minimum
Account
Balance Fees | |
| Columbia International Stock Fund | | $ | 40,580 | | |
| Columbia Mid Cap Growth Fund | | | 16,775 | | |
| Columbia Small Cap Growth Fund I | | | 3,604 | | |
| Columbia Real Estate Equity Fund | | | 7,497 | | |
| Columbia Technology Fund | | | 2,910 | | |
| Columbia Strategic Investor Fund | | | 511,425 | | |
| Columbia Balanced Fund | | | 7,576 | | |
Columbia Oregon Intermediate
Municipal Bond Fund | | | 2,100 | | |
| Columbia Conservative High Yield Fund | | | 3,286 | | |
165
Columbia Funds, August 31, 2008 (continued)
Underwriting Discounts, Service and Distribution Fees
Columbia Management Distributors, Inc. (the "Distributor"), an affiliate of Columbia and an indirect, wholly owned subsidiary of BOA, is the principal underwriter of the Funds' shares. For the year ended August 31, 2008, the Distributor has retained net underwriting discounts on sales of Class A and Class T shares and received net CDSC fees on Class A, Class B, Class C and Class T share redemptions as follows:
| | | Front-End Sales Charge | | CDSC | |
| | | Class A | | Class T | | Class A | | Class B | | Class C | | Class T | |
| Columbia International Stock Fund | | $ | 14,769 | | | $ | — | | | $ | 685 | | | $ | 28,570 | | | $ | 1,477 | | | $ | — | | |
| Columbia Mid Cap Growth Fund | | | 29,465 | | | | 157 | | | | 6,372 | | | | 12,057 | | | | 3,558 | | | | 1 | | |
| Columbia Small Cap Growth Fund I | | | 30,632 | | | | — | | | | 83 | | | | 1,789 | | | | 1,464 | | | | — | | |
| Columbia Real Estate Equity Fund | | | 5,523 | | | | — | | | | 637 | | | | 12,250 | | | | 1,701 | | | | — | | |
| Columbia Technology Fund | | | 143,946 | | | | — | | | | 13,974 | | | | 31,235 | | | | 38,840 | | | | — | | |
| Columbia Strategic Investor Fund | | | 238,114 | | | | — | | | | 3,101 | | | | 83,980 | | | | 4,702 | | | | — | | |
| Columbia Balanced Fund | | | 10,387 | | | | — | | | | 68 | | | | 8,501 | | | | 94 | | | | — | | |
Columbia Oregon Intermediate
Municipal Fund | | | 986 | | | | — | | | | — | | | | 2,802 | | | | — | | | | — | | |
| Columbia Conservative High Yield Fund | | | 1,974 | | | | — | | | | — | | | | 95,860 | | | | 316 | | | | — | | |
The Funds have adopted Rule 12b-1 plans (the "Plans") which require the payment of a monthly service and distribution fee to the Distributor based on the average daily net assets of each Fund at the following annual rates:
| | | Distribution Fee | |
| | | Class A (a) | | Class B | | Class C | | Class R | |
| Columbia International Stock Fund | | | — | | | | 0.75 | % | | | 0.75 | % | | | — | | |
| Columbia Mid Cap Growth Fund | | | 0.10 | % | | | 0.75 | % | | | 0.75 | % | | | 0.50 | % | |
| Columbia Small Cap Growth Fund I | | | 0.10 | % | | | 0.75 | % | | | 0.75 | % | | | — | | |
| Columbia Real Estate Equity Fund | | | 0.10 | % | | | 0.75 | % | | | 0.75 | % | | | — | | |
| Columbia Technology Fund | | | 0.10 | % | | | 0.75 | % | | | 0.75 | % | | | — | | |
| Columbia Strategic Investor Fund | | | — | | | | 0.75 | % | | | 0.75 | % | | | — | | |
| Columbia Balanced Fund | | | 0.10 | % | | | 0.75 | % | | | 0.75 | % | | | — | | |
| Columbia Oregon Intermediate Municipal Bond Fund | | | 0.10 | % | | | 0.75 | % | | | 0.75 | % | | | — | | |
| Columbia Conservative High Yield Fund | | | 0.10 | % | | | 0.75 | % | | | 0.75 | % | | | — | | |
| | | Service Fee | |
| | | Class A (a) | | Class B | | Class C | |
| Columbia International Stock Fund | | | 0.25 | % | | | 0.25 | % | | | 0.25 | % | |
| Columbia Mid Cap Growth Fund | | | 0.25 | % | | | 0.25 | % | | | 0.25 | % | |
| Columbia Small Cap Growth Fund I | | | 0.25 | % | | | 0.25 | % | | | 0.25 | % | |
166
Columbia Funds, August 31, 2008 (continued)
| | | Service Fee | |
| | | Class A (a) | | Class B | | Class C | |
| Columbia Real Estate Equity Fund | | | 0.25 | % | | | 0.25 | % | | | 0.25 | % | |
| Columbia Technology Fund | | | 0.25 | % | | | 0.25 | % | | | 0.25 | % | |
| Columbia Strategic Investor Fund | | | 0.25 | % | | | 0.25 | % | | | 0.25 | % | |
| Columbia Balanced Fund | | | 0.25 | % | | | 0.25 | % | | | 0.25 | % | |
| Columbia Oregon Intermediate Municipal Bond Fund | | | 0.25 | % | | | 0.25 | % | | | 0.25 | % | |
| Columbia Conservative High Yield Fund | | | 0.25 | % | | | 0.25 | % | | | 0.25 | % | |
(a) Except for Columbia International Stock Fund, the Funds may pay distribution and service fees up to a maximum of 0.35% of each Fund's average daily net assets attributable to Class A shares (comprised of up to 0.25% for shareholder liaison services and up to 0.10% for distribution services), but currently limit such fees to an aggregate fee of not more than 0.25% of each Fund's average daily net assets attributable to Class A shares.
The Distributor has voluntarily agreed to waive a portion of the distribution and service fees for Class C shares so that the combined fees do not exceed the annual rate of 0.65% of the average daily net assets of the Class C shares of Columbia Oregon Intermediate Municipal Bond Fund, and 0.85% of the average daily net assets of the Class C shares of Columbia Conservative High Yield Fund. These arrangements may be modified or terminated by the Distributor at any time.
The CDSC and the distribution fees received from the Plans are used principally as repayment to the Distributor for amounts paid by the Distributor to dealers who sold such shares.
Shareholder Services Fees
Columbia Mid Cap Growth Fund has adopted shareholder services plans that permit the Fund to pay for certain services provided to Class T shareholders by its financial advisors. The Fund may pay shareholder service fees up to a maximum of 0.50% of the Fund's average daily net assets attributable to Class T shares (comprised of up to 0.25% for shareholder liaison services and up to 0.25% for administrative support services), but such fees will not exceed the Fund's net investment income attributable to Class T shares and Columbia Mid Cap Growth Fund will limit such fees to an aggregate fee of not more than 0.30% for annual Class T shareholder services fees.
Expense Limits and Fee Reimbursements
Columbia and/or some of the Funds' other service providers have voluntarily agreed to waive fees and/or reimburse Columbia Technology Fund for certain expenses so that total expenses (exclusive of distribution and service fees, brokerage commissions, interest, taxes and extraordinary expenses, but inclusive of custodial charges relating to overdrafts, if any), after giving effect to any balance credits from the Fund's custodian, will not exceed the annual rate of 1.65% of the Fund's average daily net assets. This arrangement may be modified or terminated by Columbia at any time.
Columbia has voluntarily agreed to waive fees and/or reimburse Columbia Strategic Investor Fund for certain expenses so that total expenses (exclusive of distribution and service fees, brokerage commissions, interest, taxes and extraordinary expenses, but inclusive of custodial charges relating to overdrafts, if any), after giving effect to any balance credits from the Fund's custodian, will not exceed 0.98% annually of the Fund's average daily net assets. This arrangement may be modified or terminated by Columbia at any time.
Effective November 1, 2007, Columbia has contractually agreed to waive fees and/or reimburse Columbia Oregon Intermediate Municipal Bond Fund for certain expenses so that total expenses (exclusive of distribution and service fees, brokerage commissions, interest, taxes and extraordinary expenses, but inclusive of custodial charges relating to overdrafts, if any), after giving effect to any balance credits from the Fund's custodian, will not exceed the annual rate of 0.50% of the Fund's average daily net assets through December 31, 2009. There is no guarantee that this arrangement will continue after December 31, 2009.
Fees Paid to Officers and Trustees
All officers of the Funds are employees of Columbia or its affiliates and, with the exception of the Funds'
167
Columbia Funds, August 31, 2008 (continued)
Chief Compliance Officer, receive no compensation from the Funds. The Board of Trustees has appointed a Chief Compliance Officer to the Funds in accordance with federal securities regulations. The Funds, along with other affiliated funds, pay their pro-rata share of the expenses associated with the Chief Compliance Officer. Each Fund's expenses for the Chief Compliance Officer will not exceed $15,000 per year.
The Trust's eligible Trustees may participate in a deferred compensation plan which may be terminated at any time. Obligations of the plan will be paid solely out of the Funds' assets.
As a result of fund mergers, certain funds assumed the liabilities of the deferred compensation plan of the acquired fund, which is included in "Trustees' fees" on the Statements of Assets and Liabilities. The deferred compensation plan of the acquired fund may be terminated at any time. Any payments to plan participants are paid solely out of the Funds' assets.
Note 5. Custody Credits
Each Fund has an agreement with its custodian bank under which custody fees may be reduced by balance credits. These credits are recorded as part of expense reductions on the Statements of Operations. The Funds could have invested a portion of the assets utilized in connection with the expense offset arrangement in an income-producing asset if they had not entered into such an agreement.
For the year ended August 31, 2008, these custody credits reduced total expenses as follows:
| | | Custody
Credits | |
| Columbia International Stock Fund | | $ | 99 | | |
| Columbia Mid Cap Growth Fund | | | 3,629 | | |
| Columbia Small Cap Growth Fund I | | | 3,036 | | |
| Columbia Real Estate Equity Fund | | | 2,914 | | |
| Columbia Technology Fund | | | 2,638 | | |
| Columbia Strategic Investor Fund | | | 2,850 | | |
| Columbia Balanced Fund | | | 599 | | |
Columbia Oregon Intermediate
Municipal Bond Fund | | | 1,204 | | |
| Columbia Conservative High Yield Fund | | | 9,465 | | |
Note 6. Portfolio Information
For the year ended August 31, 2008, the cost of purchases and proceeds from sales of securities, excluding short-term obligations, were as follows:
| | | U.S Government Securities | | Other Investment Securities | |
| | | Purchases | | Sales | | Purchases | | Sales | |
| Columbia International Stock Fund | | $ | — | | | $ | — | | | $ | 737,021,522 | | | $ | 976,013,574 | | |
| Columbia Mid Cap Growth Fund | | | — | | | | — | | | | 2,209,560,580 | | | | 2,364,763,857 | | |
| Columbia Small Cap Growth Fund I | | | — | | | | — | | | | 651,991,162 | | | | 492,319,675 | | |
| Columbia Real Estate Equity Fund | | | — | | | | — | | | | 254,191,563 | | | | 353,283,536 | | |
| Columbia Technology Fund | | | — | | | | — | | | | 1,167,093,520 | | | | 997,765,187 | | |
| Columbia Strategic Investor Fund | | | — | | | | — | | | | 1,022,541,077 | | | | 1,086,818,230 | | |
| Columbia Balanced Fund | | | 33,611,399 | | | | 34,736,963 | | | | 191,093,530 | | | | 199,782,861 | | |
| Columbia Oregon Intermediate Municipal Bond Fund | | | — | | | | — | | | | 35,680,899 | | | | 19,579,522 | | |
| Columbia Conservative High Yield Fund | | | — | | | | — | | | | 185,438,334 | | | | 379,930,313 | | |
168
Columbia Funds, August 31, 2008 (continued)
Note 7. Redemption Fees
Columbia International Stock Fund may impose a 2.00% redemption fee on the proceeds of fund shares that are redeemed within 60 days of purchase. The redemption fee is designed to offset brokerage commissions and other costs associated with short term trading of the portfolio. The redemption fees, which are retained by the Fund, are accounted for as an addition to paid-in capital and are allocated to each class based on the relative net assets at the time of the redemption. For the year ended August 31, 2008, the redemption fees for Class A, Class B, Class C and Class Z shares of Columbia International Stock Fund amounted to $7,545, $568, $704 and $23,342, respectively.
Note 8. Line of Credit
The Funds and other affiliated funds participate in a $350,000,000 committed, unsecured revolving line of credit and a $150,000,000 uncommitted, unsecured line of credit, both provided by State Street. Borrowings are available for short-term liquidity or temporary or emergency purposes.
Interest on the committed line of credit is charged to each participating fund based on the fund's borrowings at a rate per annum equal to the Federal Funds Rate plus 0.50%. In addition, a commitment fee of 0.10% per annum is accrued and apportioned among the participating funds pro rata based on their relative net assets. Effective September 17, 2007, interest on the uncommitted line of credit is charged to each participating fund based on the fund's borrowings at a rate per annum equal to the Federal Funds rate plus 0.375%. Prior to September 17, 2007, interest on the uncommitted line of credit was charged to each participating fund based on the fund's borrowings at a rate per annum equal to the Federal Funds rate plus 0.50%. State Street charges an annual operations agency fee of $40,000 for the committed line of credit and may charge an annual administration fee of $15,000 for the uncommitted line of credit. The commitment f ee, the operations agency fee and the administration fee are accrued and apportioned among the participating funds pro rata based on their relative net assets.
For the year ended August 31, 2008, the average daily loan balance outstanding on days where borrowing existed, and the weighted average interest rate of each Fund were as follows:
| | | Average
Borrowings | | Weighted
Average
Interest
Rate | |
Columbia International
Stock Fund | | $ | 3,944,444 | | | | 3.89 | % | |
| Columbia Mid Cap Growth Fund | | | 3,000,000 | | | | 4.69 | % | |
| Columbia Real Estate Equity Fund | | | 1,666,667 | | | | 5.14 | % | |
Note 9. Other
During the year ended August 31, 2008, Columbia voluntarily reimbursed Columbia Small Cap Growth Fund I $12,816 for a realized investment loss due to a trading error.
Note 10. Shares of Beneficial Interest
As of August 31, 2008, the Funds had shareholders whose shares were beneficially owned by participant accounts over which BOA and/or any of its affiliates had either sole or joint investment discretion. The percentages of shares of beneficial interest outstanding held therein are as follows:
| | | % of Shares
Outstanding
Held | |
Columbia International
Stock Fund | | | 58.5 | | |
Columbia Mid Cap
Growth Fund | | | 37.9 | | |
Columbia Small Cap
Growth Fund I | | | 20.4 | | |
Columbia Real Estate
Equity Fund | | | 20.6 | | |
Columbia Conservative
High Yield Fund | | | 45.0 | | |
169
Columbia Funds, August 31, 2008 (continued)
As of August 31, 2008, the Funds had shareholders that held greater than 5% of the shares outstanding of a Fund, over which BOA and/or any of its affiliates did not have investment discretion. The number of accounts and the percentages of shares of beneficial interest outstanding held therein are as follows:
| | | Number of
Shareholders | | % of Shares
Outstanding
Held | |
Columbia Mid Cap
Growth Fund | | | 1 | | | | 6.7 | | |
Columbia Small Cap
Growth Fund I | | | 1 | | | | 16.9 | | |
Columbia Real Estate
Equity Fund | | | 1 | | | | 22.9 | | |
| Columbia Technology Fund | | | 2 | | | | 30.2 | | |
Columbia Strategic
Investor Fund | | | 1 | | | | 7.5 | | |
| Columbia Balanced Fund | | | 1 | | | | 9.6 | | |
Columbia Oregon Intermediate
Municipal Bond Fund | | | 1 | | | | 12.3 | | |
Columbia Conservative
High Yield Fund | | | 1 | | | | 12.0 | | |
Subscription and redemption activity of these accounts may have a significant effect on the operations of the Funds.
Note 11. Significant Risks and Contingencies
Sector Focus Risk
Certain funds may focus their investments in certain sectors, subjecting them to greater risk than a fund that is less focused.
High-Yield Securities Risk
Investing in high-yield securities may involve greater credit risk and considerations not typically associated with investing in U.S. Government bonds and other higher quality fixed income securities. These securities are non-investment grade securities, often referred to as "junk" bonds. Economic downturns may disrupt the high-yield market and impair the ability of issuers to repay principal and interest. Also, an increase in interest rates would likely have an adverse impact on the value of such obligations. Moreover, high-yield securities may be less liquid to the extent that there is no established secondary market.
Foreign Securities Risk
There are certain additional risks involved when investing in foreign securities. These risks may involve foreign currency exchange rate fluctuations, adverse political and economic developments and the possible prevention of currency exchange or other foreign governmental laws or restrictions. In addition, the liquidity of foreign securities may be more limited than that of domestic securities.
Investments in emerging market countries are subject to additional risk. The risk of foreign investments is typically increased in less developed countries. These countries are also more likely to experience high levels of inflation, deflation or currency devaluation which could hurt their economies and securities markets.
Geographic Concentration Risk
Columbia Oregon Intermediate Municipal Bond Fund had greater than 5% of its total net assets on August 31, 2008, invested in debt obligations issued by the state of Oregon and its political subdivisions, agencies and public authorities. This Fund is more susceptible to economic and political factors adversely affecting issuers of the state's municipal securities than are municipal bond funds that are not concentrated to the same extent in these issuers.
Concentration of Credit Risk
Columbia Oregon Intermediate Municipal Bond Fund holds investments that are insured by private insurers who guarantee the payment of principal and interest in the event of default or that are supported by a letter of credit. At August 31, 2008, private insurers who insured greater than 5% of the total net assets of Columbia Oregon Intermediate Municipal Bond Fund were as follows:
| Insurer | | % of Total
Net Assets | |
| Financial Guaranty Insurance Corp. | | | 14.1 | | |
| MBIA Insurance Corp. | | | 13.2 | | |
| Financial Security Assurance, Inc. | | | 10.4 | | |
| AMBAC Assurance Corp. | | | 5.7 | | |
170
Columbia Funds, August 31, 2008 (continued)
At September 19, 2008 MBIA Insurance Corp., Financial Guaranty Insurance Corp., AMBAC Assurance Corp. and Financial Security Assurance, Inc. were rated by Standard & Poor's AA, BB, AA and AAA, respectively.
Tax Development Risk
Columbia Oregon Intermediate Municipal Bond Fund purchases municipal securities whose interest, in the opinion of bond counsel, is free from federal income tax. There is no assurance that the Internal Revenue Service (IRS) will agree with this opinion. In the event the IRS determines that an issuer does not comply with relevant tax requirements, interest payments from a security could become federally taxable, possibly retroactively to the date the security was issued. As a shareholder of Columbia Oregon Intermediate Municipal Bond Fund, you may be required to file an amended tax return as a result.
Legal Proceedings
On February 9, 2005, Columbia Management Advisors, Inc. (which has since merged into Banc of America Capital Management, LLC (now named Columbia Management Advisors, LLC)) ("Columbia") and Columbia Funds Distributor, Inc. (which has been renamed Columbia Management Distributors, Inc.) (the "Distributor") (collectively, the "Columbia Group") entered into an Assurance of Discontinuance with the New York Attorney General ("NYAG") (the "NYAG Settlement") and consented to the entry of a cease-and-desist order by the Securities and Exchange Commission ("SEC") (the "SEC Order") on matters relating to mutual fund trading.
Under the terms of the SEC Order, the Columbia Group agreed, among other things, to: pay $70 million in disgorgement and $70 million in civil money penalties; cease and desist from violations of the antifraud provisions and certain other provisions of the federal securities laws; maintain certain compliance and ethics oversight structures; retain an independent consultant to review the Columbia Group's applicable supervisory, compliance, control and other policies and procedures; and retain an independent distribution consultant (see below). The Columbia Funds have also voluntarily undertaken to implement certain governance measures designed to maintain the independence of their boards of trustees. The NYAG Settlement also, among other things, requires Columbia and its affiliates to reduce management fees for certain Columbia Funds (including the former Nations Funds) and other mutual funds collectively by $32 million per year f or five years, for a projected total of $160 million in management fee reductions.
Pursuant to the procedures set forth in the SEC Order, the $140 million in settlement amounts described above is being distributed in accordance with a distribution plan that was developed by an independent distribution consultant and approved by the SEC on April 6, 2007. Distributions under the distribution plan began in late June 2007.
A copy of the SEC Order is available on the SEC website at http://www.sec.gov. A copy of the NYAG Settlement is available as part of the Bank of America Corporation Form 8-K filing on February 10, 2005.
In connection with the events described above, various parties have filed suit against certain funds, the Trustees of the Columbia Funds, FleetBoston Financial Corporation and its affiliated entities and/or Bank of America and its affiliated entities.
On February 20, 2004, the Judicial Panel on Multidistrict Litigation transferred these cases and cases against other mutual fund companies based on similar allegations to the United States District Court in Maryland for consolidated or coordinated pretrial proceedings (the "MDL"). Subsequently, additional related cases were transferred to the MDL. On September 29, 2004, the plaintiffs in the MDL filed amended and consolidated complaints. One of these amended complaints is a putative class action that includes claims under the federal securities laws and state common law, and that names Columbia, the Distributor, the Trustees of the Columbia Funds, Bank of America Corporation and others as defendants. Another of the amended complaints is a derivative action purportedly on behalf of the Columbia Funds that asserts claims under federal securities laws and state common law.
On February 25, 2005, Columbia and other defendants filed motions to dismiss the claims in the pending cases. On March 1, 2006, for reasons stated in the court's memoranda dated November 3, 2005, the United States District Court for the District of Maryland granted in part and denied in part the defendants' motions to dismiss. The court dismissed all of the class action claims pending against the Columbia Funds Trusts. As to Columbia and the Distributor, the claims under
171
Columbia Funds, August 31, 2008 (continued)
the Securities Act of 1933, the claims under Sections 34(b) and 36(a) of the Investment Company Act of 1940 ("ICA") and the state law claims were dismissed. The claims under Sections 10(b) and 20(a) of the Securities Exchange Act of 1934 and claims under Section 36(b) of the ICA were not dismissed.
On March 21, 2005, a purported class action was filed in Massachusetts state court alleging that certain conduct, including market timing, entitled Class B shareholders in certain Columbia funds to an exemption from contingent deferred sales charges upon early redemption ("the CDSC Lawsuit"). The CDSC Lawsuit was removed to federal court in Massachusetts and transferred to the MDL.
On September 14, 2007, the plaintiffs and the Columbia defendants named in the MDL, including the Columbia Funds, entered into a stipulation of settlement with respect to all Columbia-related claims in the MDL described above, including the CDSC Lawsuit. The settlement is subject to court approval.
In 2004, the Columbia Funds' adviser and distributor and certain affiliated entities and individuals were named as defendants in certain purported shareholder class and derivative actions making claims, including claims under the Investment Company and the Investment Advisers Acts of 1940 and state law. Certain Columbia Funds were named as nominal defendants. The suits allege, inter alia, that the fees and expenses paid by the funds are excessive and that the advisers and their affiliates inappropriately used fund assets to distribute the funds and for other improper purposes. On March 2, 2005, the actions were consolidated in the Massachusetts federal court as In re Columbia Entities Litigation. The plaintiffs filed a consolidated amended complaint on June 9, 2005. On November 30, 2005, the judge dismissed all claims by plaintiffs and entered final judgment in favor of the defendants. The plaintiffs appealed to the United States Court of Appeals for the First Circuit on December 30, 2005. A stipulation and settlement agreement dated January 19, 2007 was filed in the First Circuit on February 14, 2007, with a joint stipulation of dismissal and motion for remand to obtain district court approval of the settlement. That joint motion was granted and the appeal was dismissed. On March 6, 2007, the case was remanded to the District Court. The settlement, approved by the District Court on September 18, 2007, became effective October 19, 2007. Pursuant to the settlement, the funds' adviser and/ or its affiliates made certain payments, including plaintiffs' attorneys' fees and costs of notice to class members.
Note 12. Business Combinations and Mergers
As of the close of business on September 15, 2006, Columbia Marsico Mid Cap Growth Fund, a series of Columbia Funds Series Trust, merged into Columbia Mid Cap Growth Fund. Columbia Mid Cap Growth Fund received a tax-free transfer of assets from Columbia Marsico Mid Cap Growth Fund as follows:
Shares
Issued | | Net Assets
Received | | Unrealized
Appreciation1 | |
| | 23,857,869 | | | $ | 586,999,596 | | | $ | 69,562,262 | | |
Net Assets
of Columbia
Mid Cap
Growth Fund
Prior to
Combination | | Net Assets
of Columbia
Marsico Mid Cap
Growth Fund
Immediately
Prior to Combination | | Net Assets
of Columbia
Mid Cap
Growth Fund
Immediately
After Combination | |
| $ | 865,801,321 | | | $ | 586,999,596 | | | $ | 1,452,800,917 | | |
1 Unrealized appreciation is included in the Net Assets Received.
As of the close of business on September 22, 2006, Columbia Young Investor Fund, a separate series of Columbia Funds Series Trust I, merged into Columbia Strategic Investor Fund. Columbia Strategic Investor Fund received a tax-free transfer of assets from Columbia Young Investor Fund as follows:
Shares
Issued | | Net Assets
Received | | Unrealized
Appreciation1 | |
| | 38,899,211 | | | $ | 720,344,551 | | | $ | 99,182,704 | | |
Net Assets
of Columbia
Strategic
Investor Fund
Prior to
Combination | | Net Assets
of Columbia
Young Investor
Fund Immediately
Prior to Combination | | Net Assets
of Columbia
Strategic
Investor Fund
Immediately
After Combination | |
| $ | 439,343,046 | | | $ | 720,344,551 | | | $ | 1,159,687,597 | | |
1 Unrealized appreciation is included in the Net Assets Received.
172
Columbia Funds, August 31, 2008 (continued)
As of the close of business on March 20, 2008, Real Estate Fund, a series of Excelsior Funds, Inc., merged into Columbia Real Estate Equity Fund. Columbia Real Estate Equity Fund received a tax-free transfer of assets from Real Estate Fund as follows:
Shares
Issued | | Net Assets
Received | | Unrealized
Depreciation1 | |
| | 1,924,145 | | | $ | 25,873,534 | | | $ | (1,417,264 | ) | |
Net Assets
of Columbia
Real Estate
Equity Fund
Prior to
Combination | | Net Assets
of Real Estate
Fund Immediately
Prior to Combination | | Net Assets
of Columbia
Real Estate
Equity Fund
Immediately
After Combination | |
| $ | 294,500,389 | | | $ | 25,873,534 | | | $ | 320,373,923 | | |
1 Unrealized depreciation is included in the Net Assets Received.
Note 13. Subsequent Event
On October 16, 2008 the uncommitted and committed lines of credit discussed in Note 8 were terminated or amended. The uncommitted line of credit was terminated. The Funds and other affiliated funds participate in a $280,000,000 committed, unsecured revolving line of credit. The maximum amount that may be borrowed by any fund is limited to $200,000,000. Interest is charged to each participating fund based on the fund's borrowings at a rate per annum equal to the greater of the Federal Funds Rate plus 0.50% or the overnight LIBOR Rate plus 0.50%. In addition, an annual operations agency fee of $20,000, an amendment fee of 0.02% and a commitment fee of 0.12% per annum are accrued and apportioned among the participating funds pro rata based on their relative net assets.
173
Report of Independent Registered Public Accounting Firm
To the Board of Trustees and the Shareholders of Columbia Funds Series Trust I
In our opinion, the accompanying statements of assets and liabilities, including the investment portfolios, and the related statements of operations and of changes in net assets and the financial highlights present fairly, in all material respects, the financial position of Columbia International Stock Fund, Columbia Mid Cap Growth Fund, Columbia Small Cap Growth Fund I, Columbia Real Estate Equity Fund, Columbia Technology Fund, Columbia Strategic Investor Fund, Columbia Balanced Fund, Columbia Oregon Intermediate Municipal Bond Fund and Columbia Conservative High Yield Fund (constituting part of Columbia Funds Series Trust I, hereafter collectively referred to as the "Funds") at August 31, 2008, the results of each of their operations for the year then ended, the changes in each of their net assets for each of the two years in the period then ended, and the financial highlights for each of the periods indicated, in conformity with accounting principles generally accepted in the United States of America. These financial statements and financial highlights (hereafter referred to as "financial statements") are the responsibility of the Funds' management. Our responsibility is to express an opinion on these financial statements based on our audits. We conducted our audits of these financial statements in accordance with the standards of the Public Company Accounting Oversight Board (United States). Those standards require that we plan and perform the audit to obtain reasonable assurance about whether the financial statements are free of material misstatement. An audit includes examining, on a test basis, evidence supporting the amounts and disclosures in the financial statements, assessing the accounting principles used and significant estimates made by management, and evaluating the overall financial statement presentation. We believe that our audits, which included confirmation of securities at August 31, 2008 by correspondence wit h the custodian and brokers, provide a reasonable basis for our opinion.
PricewaterhouseCoopers LLP
Boston, Massachusetts
October 22, 2008
174
Federal Income Tax Information (Unaudited)
Columbia International Stock Fund
Foreign taxes paid during the fiscal year ended August 31, 2008, amounting to $3,259,799 ($0.05 per share) are expected to be passed through to shareholders as 100% allowable foreign tax credits on Form 1099-DIV for the year ending December 31, 2008.
Gross income derived from sources within foreign countries amounted to $37,019,234 for the fiscal year ended August 31, 2008.
For the fiscal year ended August 31, 2008, the Fund designates long-term capital gains of $26,393,910.
For non-corporate shareholders 59.86% or the maximum amount allowable under the Jobs and Growth Tax Relief Reconciliation Act of 2003, of the ordinary income distributed by the Fund for the period September 1, 2007 to August 31, 2008 may represent qualified dividend income. Final information will be provided in your 2008 Form 1099-DIV.
Columbia Mid Cap Growth Fund
For the fiscal year ended August 31, 2008, the Fund designates long-term capital gains of $63,516,981.
For non-corporate shareholders 28.35% or the maximum amount allowable under the Jobs and Growth Tax Relief Reconciliation Act of 2003, of the ordinary income distributed by the Fund for the period September 1, 2007 to August 31, 2008 may represent qualified dividend income. Final information will be provided in your 2008 Form 1099-DIV.
27.85% of the ordinary income distributed by the Fund, for the year ended August 31, 2008, qualifies for the corporate dividends received deduction.
Columbia Small Cap Growth Fund I
For the fiscal year ended August 31, 2008, the Fund designates long-term capital gains of $4,886,943.
For non-corporate shareholders 11.88% or the maximum amount allowable under the Jobs and Growth Tax Relief Reconciliation Act of 2003, of the ordinary income distributed by the Fund for the period September 1, 2007 to August 31, 2008 may represent qualified dividend income. Final information will be provided in your 2008 Form 1099-DIV.
9.91% of the ordinary income distributed by the Fund, for the year ended August 31, 2008, qualifies for the corporate dividends received deduction.
Columbia Technology Fund
For the fiscal year ended August 31, 2008, the Fund designates long-term capital gains of $3,093,150.
For non-corporate shareholders 27.57% or the maximum amount allowable under the Jobs and Growth Tax Relief Reconciliation Act of 2003, of the ordinary income distributed by the Fund for the period September 1, 2007 to August 31, 2008 may represent qualified dividend income. Final information will be provided in your 2008 Form 1099-DIV.
22.45% of the ordinary income distributed by the Fund, for the year ended August 31, 2008, qualifies for the corporate dividends received deduction.
Columbia Strategic Investor Fund
For the fiscal year ended August 31, 2008, the Fund designates long-term capital gains of $6,726,672.
For non-corporate shareholders 100.00% or the maximum amount allowable under the Jobs and Growth Tax Relief Reconciliation Act of 2003, of the ordinary income distributed by the Fund for the period September 1, 2007 to August 31, 2008 may represent qualified dividend income. Final information will be provided in your 2008 Form 1099-DIV.
100.00% of the ordinary income distributed by the Fund, for the year ended August 31, 2008, qualifies for the corporate dividends received deduction.
Columbia Balanced Fund
For the fiscal year ended August 31, 2008, the Fund designates long-term capital gains of $445,350.
For non-corporate shareholders 34.62% or the maximum amount allowable under the Jobs and Growth Tax Relief Reconciliation Act of 2003, of the ordinary income distributed by the Fund for the period September 1, 2007 to August 31, 2008 may represent qualified dividend income. Final information will be provided in your 2008 Form 1099-DIV.
33.73% of the ordinary income distributed by the Fund, for the year ended August 31, 2008, qualifies for the corporate dividends received deduction.
Columbia Oregon Intermediate Municipal Bond Fund
100.00% of the distributions from net investment income will be treated as exempt income for federal income tax purposes.
175
Fund Governance
The Trustees serve terms of indefinite duration. The names, addresses and ages of the Trustees and officers of the Funds in Columbia Funds Series Trust I, the year each was first elected or appointed to office, their principal business occupations during at least the last five years, the number of Funds overseen by each Trustee and other directorships they hold are shown below. Each officer listed below serves as an officer of each Fund in the Columbia Funds Complex.
Independent Trustees
Name, Address and Year of Birth,
Position with Funds, Year First
Elected or Appointed to Office | | Principal Occupation(s) During Past Five Years, Number of Funds in Columbia
Funds Complex Overseen by Trustee, Other Directorships Held
| |
| John D. Collins (Born 1938) | |
|
c/o Columbia Management Advisors, LLC
One Financial Center
Boston, MA 02111
Trustee1 (since 2007) | | Retired. Consultant, KPMG, LLP (accounting and tax firm) from July 1999 to June 2000; Partner, KPMG, LLP from March 1962 to June 1999. Oversees 77, Mrs. Fields Famous Brands LLC (consumer products); Suburban Propane Partners, L.P.; and Montpelier Re (underwriting firm) | |
|
| Rodman L. Drake (Born 1943) | |
|
c/o Columbia Management Advisors, LLC
One Financial Center
Boston, MA 02111
Trustee1 (since 2007) | | Co-Founder of Baringo Capital LLC (private equity) since 2002; President, Continuation Investments Group, Inc. from 1997 to 2001. Oversees 77, Jackson Hewitt Tax Service Inc. (tax preparation services); Crystal Capital River Inc. (real estate investment trust); Student Loan Corporation (student loan provider); Celgene Corporation (global biotechnology company); Apex Silver Mines Ltd. (mining); and Hyperion Brookfield Total Return Fund, Inc. and Hyperion Brookfield Strategic Mortgage Income Fund, Inc. (exchange-traded funds) | |
|
| Douglas A. Hacker (Born 1955) | |
|
c/o Columbia Management Advisors, LLC
One Financial Center
Boston, MA 02111
Trustee (since 1996) | | Independent business executive since May 2006; Executive Vice President—Strategy of United Airlines (airline) from December 2002 to May 2006; President of UAL Loyalty Services (airline marketing company) from September 2001 to December 2002; Executive Vice President and Chief Financial Officer of United Airlines from July 1999 to September 2001. Oversees 77, Nash Finch Company (food distributor); Aircastle Limited (aircraft leasing) | |
|
| Janet Langford Kelly (Born 1957) | |
|
c/o Columbia Management Advisors, LLC
One Financial Center
Boston, MA 02111
Trustee (since 1996) | | Senior Vice President, General Counsel and Corporate Secretary, ConocoPhillips (integrated energy company) since September 2007; Deputy General Counsel—Corporate Legal Services, ConocoPhillips from August 2006 to August 2007; Partner, Zelle, Hofmann, Voelbel, Mason & Gette LLP (law firm) from March 2005 to July 2006; Adjunct Professor of Law, Northwestern University, from September 2004 to June 2006; Director, UAL Corporation (airline) from February 2006 to July 2006; Chief Administrative Officer and Senior Vice President, Kmart Holding Corporation (consumer goods), from September 2003 to March 2004; Executive Vice President—Corporate Development and Administration, General Counsel and Secretary, Kellogg Company (food manufacturer), from September 1999 to August 2003. Oversees 77, None | |
|
176
Fund Governance (continued)
Independent Trustees (continued)
Name, Address and Year of Birth,
Position with Funds, Year First
Elected or Appointed to Office | | Principal Occupation(s) During Past Five Years, Number of Funds in Columbia
Funds Complex Overseen by Trustee, Other Directorships Held
| |
| Charles R. Nelson (Born 1942) | |
|
c/o Columbia Management Advisors, LLC
One Financial Center
Boston, MA 02111
Trustee (since 1981) | | Professor of Economics, University of Washington, since January 1976; Ford and Louisa Van Voorhis Professor of Political Economy, University of Washington, since September 1993; Director, Institute for Economic Research, University of Washington from September 2001 to June 2003; Adjunct Professor of Statistics, University of Washington, since September 1980; Associate Editor, Journal of Money Credit and Banking, since September 1993; Consultant on econometric and statistical matters. Oversees 77, None | |
|
| John J. Neuhauser (Born 1943) | |
|
c/o Columbia Management Advisors, LLC
One Financial Center
Boston, MA 02111
Trustee (since 1985) | | President, Saint Michael's College, since August 2007; University Professor, Boston College from November 2005 to August 2007; Academic Vice President and Dean of Faculties, Boston College from August 1999 to October 2005. Oversees 77, Liberty All-Star Equity Fund and Liberty All-Star Growth Fund, Inc. (closed-end funds) | |
|
| Jonathan Piel (Born 1938) | |
|
c/o Columbia Management Advisors, LLC
One Financial Center
Boston, MA 02111
Trustee1 (since 2007) | | Cable television producer and website designer; The Editor, Scientific American from 1984 to 1994; Vice President, Scientific American, Inc., from 1984 to 1994; Member, Advisory Board, Stone Age Institute, Bloomington, Indiana (research institute that explores the effect of technology on human evolution); Member, Board of Directors of the National Institute of Social Sciences, New York City; and Member, Board of Trustees of the William Alanson White Institute, New York City (institution for training psychoanalysts). Oversees 77, None | |
|
| Patrick J. Simpson (Born 1944) | |
|
c/o Columbia Management Advisors, LLC
One Financial Center
Boston, MA 02111
Trustee (since 2000) | | Partner, Perkins Coie LLP (law firm). Oversees 77, None | |
|
| Thomas C. Theobald (Born 1937) | |
|
c/o Columbia Management Advisors, LLC
One Financial Center
Boston, MA 02111
Trustee and
Chairman of the Board (since 1996) | | Partner and Senior Advisor, Chicago Growth Partners (private equity investing) since September 2004; Managing Director, William Blair Capital Partners (private equity investing) from September 1994 to September 2004. Oversees 77, Anixter International (network support equipment distributor); Ventas, Inc. (real estate investment trust); Jones Lang LaSalle (real estate management services); Ambac Financial Group (financial guaranty insurance) | |
|
177
Fund Governance (continued)
Independent Trustees (continued)
Name, Address and Year of Birth,
Position with Funds, Year First
Elected or Appointed to Office | | Principal Occupation(s) During Past Five Years, Number of Funds in Columbia
Funds Complex Overseen by Trustee, Other Directorships Held
| |
| Anne-Lee Verville (Born 1945) | |
|
c/o Columbia Management Advisors, LLC
One Financial Center
Boston, MA 02111
Trustee (since 1998) | | Retired since 1997 (formerly General Manager—Global Education Industry (from 1994 to 1997), President—Application Systems Division (from 1991 to 1994), Chief Financial Officer—US Marketing & Services (from 1988 to 1991), and Chief Information Officer (from 1987 to 1988), IBM Corporation (computer and technology)). Oversees 77, None | |
|
Interested Trustee
| William E. Mayer (Born 1940) | |
|
c/o Columbia Management Advisors, LLC
One Financial Center
Boston, MA 02111
Trustee2 (since 1994) | | Partner, Park Avenue Equity Partners (private equity) since February 1999; Dean and Professor, College of Business, University of Maryland from 1992 to 1997. Oversees 77, Lee Enterprises (print media), WR Hambrecht + Co. (financial service provider); BlackRock Kelso Capital Corporation (investment company) | |
|
1 Messrs. Drake, Piel and Collins have served as directors/trustees of the Excelsior Funds since 1996, 1996 and 2005, respectively. The Excelsior Funds consisted of 27 portfolios managed by affiliates of Columbia Management Advisors, LLC. Effective December 12, 2007, the Board elected Messrs. Drake, Piel and Collins as Trustees of the Trust.
2 Mr. Mayer is an "interested person" (as defined in the Investment Company Act of 1940) by reason of his affiliation with WR Hambrecht + Co., a registered broker/dealer that may execute portfolio transactions for or engage in principal transactions with the Funds or other funds or accounts advised/managed by the Advisor or other Bank of America affiliates.
The Statement of Additional Information includes additional information about the Trustees of the Funds and is available, without charge, upon request by calling 1-800-345-6611.
178
Fund Governance (continued)
Officers
Name, Address and Year of Birth,
Position with Columbia Funds,
Year First Elected or
Appointed to Office | | Principal Occupation(s) During Past Five Years | |
| Christopher L. Wilson (Born 1957) | |
|
One Financial Center
Boston, MA 02111
President (since 2004) | | President—Columbia Funds, since October 2004; Managing Director—Columbia Management Advisors, LLC, since September 2005; Senior Vice President—Columbia Management Distributors, Inc., since January 2005; Director—Columbia Management Services, Inc., since January 2005; Director—Bank of America Global Liquidity Funds, plc and Banc of America Capital Management (Ireland), Limited, since May 2005; Director—FIM Funding, Inc., since January 2005; President and Chief Executive Officer—CDC IXIS AM Services, Inc. (investment management), from September 1998 through August 2004; and a senior officer or director of various other Bank of America affiliated entities, including other registered and unregistered funds. | |
|
| James R. Bordewick, Jr. (Born 1959) | |
|
One Financial Center
Boston, MA 02111
Senior Vice President, Secretary and Chief Legal Officer (since 2006) | | Associate General Counsel, Bank of America since April 2005; Senior Vice President and Associate General Counsel, MFS Investment Management (investment management) prior to April 2005. | |
|
| J. Kevin Connaughton (Born 1964) | |
|
One Financial Center
Boston, MA 02111
Senior Vice President and
Chief Financial Officer (since 2000) | | Managing Director of Columbia Management Advisors, LLC since December 2004; Treasurer—Columbia Funds, from October 2003 to May 2008; Treasurer—the Liberty Funds, Stein Roe Funds and Liberty All-Star Funds, December 2000—December 2006; Senior Vice President—Columbia Management Advisors, LLC, from April 2003 to December 2004; President—Columbia Funds, Liberty Funds and Stein Roe Funds, February 2004 to October 2004; Treasurer—Galaxy Funds, September 2002 to December 2005; Treasurer, December 2002 to December 2004, and President, February 2004 to December 2004-Columbia Management Multi-Strategy Hedge Fund, LLC; and a senior officer of various other Bank of America-affiliated entities, including other registered and unregistered funds. | |
|
| Linda J. Wondrack (Born 1964) | |
|
One Financial Center
Boston, MA 02111
Senior Vice President and
Chief Compliance Officer (since 2007) | | Director (Columbia Management Group LLC and Investment Product Group Compliance), Bank of America since June 2005; Director of Corporate Compliance and Conflicts Officer, MFS Investment Management (investment management), August 2004 to May 2005; Managing Director, Deutsche Asset Management (investment management) prior to August 2004. | |
|
| Michael G. Clarke (Born 1969) | |
|
One Financial Center
Boston, MA 02111
Treasurer (since 2008) | | Director of Fund Administration of the Advisor since January 2006; Managing Director of the Advisor September 2004 to December 2005; Vice President Fund Administration June 2002 to September 2004. | |
|
179
Fund Governance (continued)
Officers (continued)
Name, Address and Year of Birth,
Position with Columbia Funds,
Year First Elected or
Appointed to Office | | Principal Occupation(s) During Past Five Years | |
| Jeffrey R. Coleman (Born 1969) | |
|
One Financial Center
Boston, MA 02111
Deputy Treasurer (since 2006) | | Director of Fund Administration of the Advisor since January 2006; Fund Controller of the Advisor from October 2004 to January 2006; Vice President of CDC IXIS Asset Management Services, Inc. (investment management) from August 2000 to September 2004. | |
|
| Joseph F. DiMaria (Born 1968) | |
|
One Financial Center
Boston, MA 02111
Chief Accounting Officer (since 2008) | | Director of Fund Administration of the Advisor since January 2006; Head of Tax/Compliance and Assistant Treasurer of the Advisor from November 2004 to December 2005; Director of Trustee Administration (Sarbanes-Oxley) of the Advisor from May 2003 to October 2004. | |
|
| Julian Quero (Born 1967) | |
|
One Financial Center
Boston, MA 02111
Deputy Treasurer (since 2008) | | Senior Tax Manager of the Advisor since August 2006; Senior Compliance Manager of the Advisor from April 2002 to August 2006. | |
|
| Barry S. Vallan (Born 1969) | |
|
One Financial Center
Boston, MA 02111
Controller (since 2006) | | Vice President—Fund Treasury of the Advisor since October 2004; Vice President—Trustee Reporting of the Advisor from April 2002 to October 2004. | |
|
180
Important Information About This Report – Columbia Funds
The funds mail one shareholder report to each shareholder address. If you would like more than one report, please call shareholder services at 1-800-345-6611 and additional reports will be sent to you. This report has been prepared for shareholders of the Columbia Funds.
A description of the policies and procedures that each fund uses to determine how to vote proxies and a copy of each fund's voting records are available (i) at www.columbiamanagement.com; (ii) on the Securities and Exchange Commission's website at www.sec.gov; and (iii) without charge, upon request, by calling 1-800-368-0346. Information regarding how each fund voted proxies relating to portfolio securities during the 12-month period ended June 30 is available from the SEC's website. Information regarding how each fund voted proxies relating to portfolio securities is also available from the fund's website, www.columbiamanagement.com.
Each fund files a complete schedule of portfolio holdings with the SEC for the first and third quarters of each fiscal year on Form N-Q. Each fund's Form N-Q is available on the SEC's website at www.sec.gov and may be reviewed and copied at the SEC's Public Reference Room in Washington, D.C. Information on the operation of the Public Reference Room may be obtained by calling 1-800-SEC-0330.
Please read and consider the investment objectives, risks, charges and expenses for any fund carefully before investing. For a prospectus which contains this and other important information about the fund, contact your Columbia Management representative or financial advisor or go to www.columbiafunds.com.
Columbia Management Group, LLC ("Columbia Management") is the investment management division of Bank of America Corporation. Columbia Management entities furnish investment management services and products for institutional and individual investors. Columbia Funds are distributed by Columbia Management Distributors, Inc., member of FINRA, SIPC, part of Columbia Management and an affiliate of Bank of America Corporation.
Transfer Agent
Columbia Management Services, Inc.
P.O. Box 8081
Boston, MA 02266-8081
1-800-345-6611
Distributor
Columbia Management
Distributors, Inc.
One Financial Center
Boston, MA 02111
Investment Advisor
Columbia Management Advisors, LLC
100 Federal Street
Boston, MA 02110
181
Columbia Management®
Columbia Funds
Annual Report, August 31, 2008
PRSRT STD
U.S. Postage
PAID
Holliston, MA
Permit NO. 20
©2008 Columbia Management Distributors, Inc.
One Financial Center, Boston, MA 02111-2621
800-345-6611 www.columbiafunds.com
SHC-42/155848-0808 (10/08) 08/59484

Annual Report
August 31, 2008
Columbia Federal Securities Fund
| | |
| NOT FDIC INSURED | | May Lose Value |
| NOT BANK ISSUED | | No Bank Guarantee |
Table of Contents
The views expressed in this report reflect the current views of the respective parties. These views are not guarantees of future performance and involve certain risks, uncertainties and assumptions that are difficult to predict so actual outcomes and results may differ significantly from the views expressed. These views are subject to change at any time based upon economic, market or other conditions and the respective parties disclaim any responsibility to update such views. These views may not be relied on as investment advice and, because investment decisions for a Columbia Fund are based on numerous factors, may not be relied on as an indication of trading intent on behalf of any particular Columbia Fund. References to specific company securities should not be construed as a recommendation or investment advice.
President’s Message – Columbia Federal Securities Fund

Dear Shareholder:
We are pleased to provide this shareholder report for your Columbia fund and hope you will find the portfolio management details, discussions and performance information helpful in monitoring your investments. As we’ve seen this past year, the financial markets can be quite volatile, with significant short-term price fluctuations. It’s important to keep these ups and downs in perspective, particularly in light of your long-term investment strategy.
Staying the course with your long-term strategy typically involves riding out short-term price fluctuations, though we recognize that at times this can be tough. To support your efforts and give you the information you need to make
prudent decisions, Columbia Management offers several valuable online resources. We encourage you to visit www.columbiamanagement.com/investor, where you can receive the most up-to-date information, including:
| n | | Daily pricing and performance. View pricing and performance from a link in Fund Tracker on the homepage. This listing of funds is updated nightly with the current net asset value and the amount and percentage change from the prior day. |
| n | | News & Commentary. This tab provides links to quarterly fund commentaries and information from our investment strategies group, including trends in the economy and market impact. |
If you would like more details on individual funds, select a fund from the dropdown menu on the top right side of the homepage for access to:
| n | | Monthly and quarterly performance information. |
| n | | Portfolio holdings. Full holdings are updated monthly for money market funds except for Columbia Cash Reserves, Columbia Money Market Reserves and Columbia Daily Cash Reserves which are updated daily, monthly for equity funds and quarterly for most other funds. |
| n | | Quarterly fact sheets. Accessible from the Literature tab in each fund page. |
By registering on the site, you’ll receive secured, 24-hour access to*:
| n | | Mutual fund account details with balances, dividend and transaction information |
| n | | Fund Tracker to customize your homepage with current net asset values for the funds that interest you |
| n | | On-line transactions including purchases, exchanges and redemptions |
| n | | Account maintenance for updating your address and dividend payment options |
| n | | Electronic delivery of prospectuses and shareholder reports |
I encourage you to visit our website for access to the product information and tools described above. These valuable online resources can help you monitor your investments and provide direct access to your account. All of these tools, and more, can be found on www.columbiamanagement.com.
While your financial advisor is a great resource for investment guidance, you can also access our website or call our service representatives at 800.345.6611 for additional assistance. We thank you for investing with Columbia Management and look forward to helping with your ongoing investment needs.
Sincerely,

Christopher L. Wilson
President, Columbia Funds
| * | Some restrictions apply. Shareholders who purchase shares through certain third-party organizations may not have the ability to register for online access. |
Fund Profile – Columbia Federal Securities Fund
Performance data quoted represents past performance and current performance may be lower or higher. Past performance is no guarantee of future results. The investment return and principal value will fluctuate so that shares, when redeemed, may be worth more or less than the original cost. Please visit www.columbiafunds.com for daily and most recent month-end performance updates.
Summary
1 year return as of 08/31/08
| | |
| |
 | | +6.18% Class A shares (without sales charge) |
| |
| | +7.54% Citigroup Government/ Mortgage Index |
Morningstar Style Box
Fixed Income Maturity
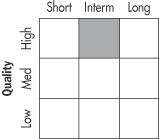
The Morningstar Style Box reveals a fund’s investment strategy. For fixed-income funds the vertical axis shows the average credit quality of the bonds owned, and the horizontal axis shows interest rate sensitivity as measured by a bond’s duration (short, intermediate or long). All of these numbers are drawn from the data most recently provided by the fund and entered into Morningstar’s database as of quarter-end. Although the data gathered is from reliable sources, Morningstar cannot guarantee its completeness and accuracy. Information shown is as of 05/31/08.
Summary
| n | | For the 12-month period that ended August 31, 2008, the fund’s Class A shares returned 6.18% without sales charge. |
| n | | The fund’s return was lower than the return of its benchmark, but higher than the average return of its peer group. |
| n | | In a risk-averse environment, we minimized the fund’s already low exposure to non-government securities. |
Portfolio Management
Jonathan P. Carlson has co-managed the fund since June 2007 and has been with the advisor or its predecessors or affiliate organizations since June 2007.
Michael Zazzarino has co-managed the fund since December 2007 and has been with the advisor or its predecessors or affiliate organizations since July 2007.
1
Economic Update – Columbia Federal Securities Fund
The pace of economic growth slowed during the 12-month period that began September 1, 2007 and ended August 31, 2008, as a multitude of factors weighed on consumers and businesses alike. However, the economy appeared to stay clear of a widely-anticipated recession, with an uptick in growth at the end of the period. The most severe housing downturn in decades continued to take a toll on growth. Inventories of homes for sale rose, home prices declined and tighter credit standards, the result of continued turmoil in the subprime mortgage market, made it more difficult for homebuyers to qualify for loans. Food prices rose, raising concerns about inflation, and energy prices soared to record highs before backing down sharply in the last month of the period. Consumer confidence declined sharply through June, then improved modestly in August according to The Conference Board, which tracks consumer attitudes on a monthly basis.
As growth weakened near the end of 2007, businesses began to pull back on hiring, which further dimmed the outlook for consumers. More than 440,000 job losses were reported in the first eight months of 2008, and the unemployment rate spiked to 6.1%, with the biggest jump coming in August. Manufacturing activity slowed, one of the last major indicators to turn negative. Federal tax rebates, which began to arrive in May, helped bolster consumer spending until the end of the period. However, spending declined in July and August, continuing concerns that the economy is headed for recession.
In an effort to inspire confidence in the capital markets, loosen the reins on credit and shore up economic growth, the Federal Reserve Board (the Fed) brought a key short-term rate — the federal funds rate — down from 5.25% to 2.0% during the 12-month period. After seven rate cuts, the Fed acknowledged that downside risks to growth remained but also that the inflation outlook was a concern and that it would monitor inflation developments carefully. Continued strains on the credit markets present the Fed with some tough choices, but it has held the line on any further rate cuts from April through the end of the period.1
Bonds delivered solid gains
The U.S. bond market seesawed during the 12-month period but delivered a solid gain as investors sought the relative safety of the highest quality sectors. After a weak start, bond prices generally rose and yields declined as economic growth slowed and stock market volatility increased. Although the benchmark 10-year U.S. Treasury yield edged back above 4.0% earlier in 2008, it slipped back to 3.81% at the end of the period, more than one full percentage point below where it was one year ago. In this environment, the Lehman Brothers U.S. Aggregate Bond Index2 returned 5.86%. High-yield bonds took a beating in 2007 but regained some ground thus far in 2008. The Merrill Lynch High Yield Cash Pay Index3 returned negative 1.24%. Municipal bonds generated higher returns than taxable bonds despite industry-specific events, which threatened investor confidence half way through the period. In February, yields on municipal bonds rose above yields on comparable maturity Treasuries — and prices fell — in a difficult month for the municipal market. In this environment, the Lehman Brothers General Obligation Bond Index 4 returned 6.11% for the one-year period.
Past performance is not a guarantee of future results.
Summary
For the 12-month period that ended August 31, 2008
| | n | | Despite volatility in many segments of the bond market, the Lehman Brothers U.S. Aggregate Bond Index delivered a solid return. High-yield bonds lost ground, as measured by the Merrill Lynch High Yield Cash Pay Index. | |
| | |
Lehman Index | | Merrill Lynch Index |
| |

| | 
|
5.86% | | 1.24% |
| | n | | The broad U.S. stock market, as measured by the S&P 500 Index, returned negative 11.14%. Stock markets outside the United States returned negative 14.41%, as measured (in U.S. dollars) by the MSCI EAFE Index. A rising dollar depressed losses in foreign markets. | |
| | |
| S&P Index | | MSCI Index |
| |
| |
|
11.14% | | 14.41% |
2
Economic Update (continued) – Columbia Federal Securities Fund
Stocks retreat as economic storm clouds gather
Against a shifting economic backdrop, the U.S. stock market lost 11.14% for the 12-month period, as measured by the S&P 500 Index.5 Small- and mid- cap stocks held up better than large-cap stocks, as measured by their respective Russell indices.6 Growth stocks also held up better than value stocks by a significant margin. As the dollar rebounded modestly against the euro, investors reaped even lower returns from investments outside the U.S. The MSCI EAFE Index7, a broad gauge of stock market performance in foreign developed markets, lost 14.41% (in U.S. dollars) for the period. Emerging stock markets, which have had a strong run over the past several years, were also caught in the downdraft. The MSCI Emerging Markets Index8 returned negative 9.83% (in U.S. dollars).
Past performance is not a guarantee of future results
1 | On October 8, 2008, the Federal Reserve Board Open Market Committee reduced the federal funds rate to 1.50%. |
2 | The Lehman Brothers U.S. Aggregate Bond Index is a market value-weighted index that tracks the daily price, coupon, pay-downs and total return performance of fixed-rate, publicly placed, dollar-denominated and non-convertible investment grade debt issues with at least $250 million par amount outstanding and with at least one year to final maturity. |
3 | The Merrill Lynch High Yield Cash Pay Index is an unmanaged index that tracks the performance of non-investment-grade corporate bonds. |
4 | The Lehman Brothers General Obligation Bond Index represents average market-weighted performance of general obligation securities that have been issued in the last five years with maturities greater than one year. |
5 | The Standard & Poor’s (S&P) 500 Index tracks the performance of 500 widely held, large capitalization U.S. stocks. |
6 | The Russell 1000® Index measures the performance of 1,000 of the largest U.S. companies, based on market capitalization. The Russell Midcap Index measures the performance of the 800 smallest companies in the Russell 1000 Index, as ranked by total market capitalization. The Russell 2000 Index measures the performance of the 2,000 smallest of the 3,000 largest U.S. companies, based on market capitalization. |
7 | The Morgan Stanley Capital International (MSCI) Europe, Australasia, Far East (EAFE) Index is a free float-adjusted market capitalization index that is designed to measure developed market equity performance, excluding the U.S. and Canada. |
8 | The MSCI Emerging Markets Index is a widely accepted index composed of a sample of companies from 25 countries representing the global emerging stock markets. |
Indices are not investments, do not incur fees or expenses and are not professionally managed. It is not possible to invest directly in an index. Securities in the fund may not match those in an index.
3
Performance Information – Columbia Federal Securities Fund
Performance data quoted represents past performance and current performance may be lower or higher. Past performance is no guarantee of future results. The investment return and principal value will fluctuate so that shares, when redeemed, may be worth more or less than the original cost. Please visit www.columbiafunds.com for daily and most recent month-end performance updates.
| | |
| Annual operating expense ratio (%)* |
| |
Class A | | 0.98 |
Class B | | 1.73 |
Class C | | 1.73 |
Class Z | | 0.73 |
| * | The annual operating expense ratio is as stated in the fund’s prospectus that is current as of the date of this report. Differences in expense ratios disclosed elsewhere in this report may result from including fee waivers and expense reimbursements as well as different time periods used in calculating the ratios. |
| | |
| Net asset value per share |
| |
as of 08/31/08 ($) | | |
Class A | | 10.47 |
Class B | | 10.47 |
Class C | | 10.47 |
Class Z | | 10.47 |
| | |
| Distributions declared per share |
| |
09/01/07 – 08/31/08 ($) | | |
Class A | | 0.46 |
Class B | | 0.38 |
Class C | | 0.40 |
Class Z | | 0.49 |
|
| Growth of a $10,000 investment 09/01/98 – 08/31/08 |

The chart above shows the growth in value of a hypothetical $10,000 investment in Class A shares of Columbia Federal Securities Fund during the stated time period, and does not reflect the deduction of taxes that a shareholder may pay on fund distributions or on the redemption of fund shares. The Citigroup Government/Mortgage Index is a combination of the Citigroup U.S. Government Index and the Citigroup Mortgage Index. The Government Index tracks the performance of the Treasury and government-sponsored indices within the U.S. Broad Investment Grade (BIG) Bond Index. The Mortgage Index tracks the performance of the mortgage component of the BIG Bond Index, comprising 30- and 15-year GNMA, FNMA and FHLMC pass-throughs and FNMA and FHLMC balloon mortgages. Indices are not investments, do not incur fees or expenses and are not professionally managed. It is not possible to invest directly in an index. Securities in the fund may not match those in an index.
| | | | |
| Performance of a $10,000 investment 09/01/98 – 08/31/08 ($) |
| | |
| Sales charge | | without | | with |
Class A | | 15,531 | | 14,793 |
Class B | | 14,418 | | 14,418 |
Class C | | 14,633 | | 14,633 |
Class Z | | 15,908 | | n/a |
| | | | | | | | | | | | | | |
| Average annual total return as of 08/31/08 (%) |
| | | | |
| Share class | | A | | B | | C | | Z |
| Inception | | 03/30/84 | | 06/08/92 | | 08/01/97 | | 01/11/99 |
| Sales charge | | without | | with | | without | | with | | without | | with | | without |
1-year | | 6.18 | | 1.13 | | 5.39 | | 0.39 | | 5.54 | | 4.54 | | 6.45 |
5-year | | 4.06 | | 3.05 | | 3.29 | | 2.94 | | 3.44 | | 3.44 | | 4.32 |
10-year | | 4.50 | | 3.99 | | 3.73 | | 3.73 | | 3.88 | | 3.88 | | 4.75 |
| | | | | | | | | | | | | | |
| Average annual total return as of 09/30/08 (%) |
| | | | |
| Share class | | A | | B | | C | | Z |
| Sales charge | | without | | with | | without | | with | | without | | with | | without |
1-year | | 6.27 | | 1.22 | | 5.48 | | 0.48 | | 5.63 | | 4.63 | | 6.54 |
5-year | | 3.64 | | 2.64 | | 2.87 | | 2.52 | | 3.02 | | 3.02 | | 3.90 |
10-year | | 4.25 | | 3.74 | | 3.48 | | 3.48 | | 3.63 | | 3.63 | | 4.50 |
The “with sales charge” returns include the maximum initial sales charge of 4.75% for Class A shares, applicable contingent deferred sales charge of 5.00% in the first year, declining to 1.00% in the sixth year, and eliminated thereafter for Class B shares and 1.00% for Class C shares for the first year only. The “without sales charge” returns do not include the effect of sales charges. If they had, returns would be lower.
All results shown assume reinvestment of distributions. Class Z shares are sold at net asset value with no distribution and service (Rule 12b-1) fees. Class Z shares have limited eligibility and the investment minimum requirements may vary. Please see the fund’s prospectus for details. Performance for different share classes will vary based on differences in sales charges and fees associated with each class.
Performance results reflect any fee waivers or reimbursements of fund expenses by the investment advisor and/or any of its affiliates. Absent these fee waivers or expense reimbursement arrangements, performance results would have been lower.
The tables do not reflect the deduction of taxes a shareholder may pay on fund distributions or on the redemption of fund shares.
Class Z is a newer class of shares. Class Z share performance information includes returns of the fund’s Class A shares (the oldest existing share class) for periods prior to the inception of the Class Z shares. These returns have not been adjusted to reflect any differences in expenses, such as distribution and service (Rule 12b-1) fees between the predecessor shares and the newer classes of shares. If differences in expenses had been reflected, the returns shown for periods prior to the inception of the newer class of shares would have been different. Class A shares were initially offered on March 30, 1984, Class B shares were initially offered on June 8, 1992, Class C shares were initially offered on August 1, 1997 and Class Z shares were initially offered on January 11, 1999.
4
Understanding Your Expenses – Columbia Federal Securities Fund
Estimating your actual expenses
To estimate the expenses that you paid over the period, first you will need your account balance at the end of the period:
| | n | | For shareholders who receive their account statements from Columbia Management Services, Inc., your account balance is available online at www.columbiafunds.com or by calling Shareholder Services at 800.345.6611. | |
| | n | | For shareholders who receive their account statements from their brokerage firm, contact your brokerage firm to obtain your account balance. | |
| | 1. | Divide your ending account balance by $1,000. For example, if an account balance was $8,600 at the end of the period, the result would be 8.6. | |
| | 2. | In the section of the table below titled “Expenses paid during the period,” locate the amount for your share class. You will find this number in the column labeled “Actual.” Multiply this number by the result from step 1. Your answer is an estimate of the expenses you paid on your account during the period. | |
If the value of your account falls below the minimum initial investment requirement applicable to you, your account generally will be subject to a $20 annual fee. This fee is not included in the accompanying table. If you are subject to the fee, keep it in mind when you are estimating the ongoing expenses of investing in the fund and when comparing the expenses of this fund with other funds.
As a fund shareholder, you incur two types of costs. There are transaction costs, which generally include sales charges on purchases and may include redemption fees or exchange fees. There are also ongoing costs, which generally include investment advisory fees, distribution and service (Rule 12b-1) fees and other fund expenses. The information on this page is intended to help you understand the ongoing costs of investing in the fund and to compare these costs with the ongoing costs of investing in other mutual funds.
Analyzing your fund’s expenses by share class
To illustrate these ongoing costs, we have provided an example and calculated the expenses paid by investors in each share class during the period. The information in the following table is based on an initial investment of $1,000, which is invested at the beginning of the reporting period and held for the entire period. Expense information is calculated two ways and each method provides you with different information. The amount listed in the “actual” column is calculated using the fund’s actual operating expenses and total return for the period. The amount listed in the “hypothetical” column for each share class assumes that the return each year is 5% before expenses and is calculated based on the fund’s actual operating expenses. You should not use the hypothetical account values and expenses to estimate either your actual account balance at the end of the period or the expenses you paid during this reporting period.
Compare with other funds
Since all mutual funds are required to include the same hypothetical calculations about expenses in shareholder reports, you can use this information to compare the ongoing costs of investing in the fund with other funds. To do so, compare the 5% hypothetical example with the 5% hypothetical examples that appear in the shareholder reports of other funds. As you compare hypothetical examples of other funds, it is important to note that hypothetical examples are meant to highlight the ongoing costs of investing in a fund and do not reflect any transaction costs, such as sales charges, redemption fees or exchange fees.
| | | | | | | | | | | | | | |
| 03/01/08 – 08/31/08 |
| | | | |
| | | Account value at the
beginning of the period ($) | | Account value at the
end of the period ($) | | Expenses paid
during the period ($) | | Fund’s annualized
expense ratio (%) |
| | | Actual | | Hypothetical | | Actual | | Hypothetical | | Actual | | Hypothetical | | Actual |
Class A | | 1,000.00 | | 1,000.00 | | 999.30 | | 1,020.36 | | 4.77 | | 4.82 | | 0.95 |
Class B | | 1,000.00 | | 1,000.00 | | 995.58 | | 1,016.59 | | 8.53 | | 8.62 | | 1.70 |
Class C | | 1,000.00 | | 1,000.00 | | 996.28 | | 1,017.34 | | 7.78 | | 7.86 | | 1.55 |
Class Z | | 1,000.00 | | 1,000.00 | | 1,000.60 | | 1,021.62 | | 3.52 | | 3.56 | | 0.70 |
Expenses paid during the period are equal to the annualized expense ratio for the share class, multiplied by the average account value over the period, then multiplied by the number of days in the fund’s most recent fiscal half-year and divided by 366.
Had the distributor not waived fees or reimbursed a portion of Class C expenses, Class C account value at the end of the period would have been reduced.
It is important to note that the expense amounts shown in the table are meant to highlight only ongoing costs of investing in the fund and do not reflect any transaction costs, such as sales charges, redemption fees or exchange fees. Therefore, the hypothetical examples provided may not help you determine the relative total costs of owning shares of different funds. If these transaction costs were included, your costs would have been higher.
5
Portfolio Manager’s Report – Columbia Federal Securities Fund
Performance data quoted represents past performance and current performance may be lower or higher. Past performance is no guarantee of future results. The investment return and principal value will fluctuate so that shares, when redeemed, may be worth more or less than the original cost. Please visit www.columbiafunds.com for daily and most recent month-end performance updates.
| | |
| 30-day SEC yields |
| |
as of 08/31/08 (%) | | |
Class A | | 3.70 |
Class B | | 3.14 |
Class C | | 3.29 |
Class Z | | 4.14 |
The 30-day SEC yields reflect the portfolio’s earning power net of expenses, expressed as an annualized percentage of the public offering price at the end of the period.
| | |
| Average life breakdown |
| |
as of 08/31/08 (%) | | |
0-1 year | | 1.7 |
1-5 years | | 36.4 |
5-10 years | | 49.7 |
10-20 years | | 12.2 |
Average life is the expected maturity of a bond and is calculated as a percentage of senior securities.
| | |
| Top 5 sectors |
| |
as of 08/31/08 (%) | | |
Agency MBS | | 47.3 |
Treasuries | | 38.4 |
Agency | | 8.6 |
Mortgage backed securities | | 5.7 |
Table excludes investments in collateral for securities lending and short-term obligation.
For the 12-month period that ended August 31, 2008, Columbia Federal Securities Fund Class A shares returned 6.18% without sales charge. The fund underperformed the Citigroup Government/Mortgage Index, which returned 7.54%.1 The index consists exclusively of Treasury and government agency securities, which were solid performers in a risk-averse environment. We believe the fund’s return was higher than the average return of its peer group, the Lipper General U.S. Government Funds Classification2, which was 5.13% because it had more exposure to Treasuries.
Flight to quality benefited government securities
Although the past 12 months will be remembered as an extremely difficult period in the financial markets, one of the period’s most powerful trends was a flight to quality that benefited government securities across all maturity levels. The fund was a prime beneficiary of this trend because at least 80% of its assets must be invested in federal government securities at all times. We began the period with approximately 13.5% (out of a maximum of 20%) devoted to the mortgage credit sector, including subprime and “Alt-A” mortgages whose creditworthiness was increasingly called into question. These securities detracted from the fund’s performance during the late summer of 2007, and we responded with a systematic effort to reduce the risk in the portfolio. By the end of the period the fund’s exposure to these riskier securities was limited to just 4.5% of total assets. We believe that this reduction accounted for the fund’s outperformance relative to its peer group during the period.
Fund’s positioning capitalized on declining yields and conventional mortgages
The fund also benefited from our decision to maintain a relatively long maturity profile. This decision was motivated by the belief that the difficulties in the capital markets would spread to the overall economy and bring yields down (and prices up) on longer-term bonds, which was, in fact, the case during the period. Short-term yields came down even more dramatically, the result of short-term rate cuts by the Federal Reserve Board. By selected use of the futures market, we were able to enter into trades that proved profitable to the fund as the differential between short and long-term yields increased, which was the case for most of the period.
It is important to note that not all assets with a slightly higher risk profile than U.S. Treasuries performed poorly during the period. Among the fund’s mortgage holdings, we achieved a modest benefit by focusing on conventional mortgage-backed securities at the expense of the Government National Mortgage Association (“GNMA”) pass-throughs, whose valuations were restrained by an increase in supply triggered by the heightened role of the GNMA in providing relief to distressed homeowners. We also achieved incremental success by concentrating on higher-coupon mortgage pools. At a time when the credit markets were besieged by liquidity concerns, many homeowners did not or could not refinance their mortgages even when they had financial incentive to do so, and this below-average prepayment experience translated into superior performance from the high-coupon sector.
6
Portfolio Manager’s Report (continued) – Columbia Federal Securities Fund
Looking ahead
We are fairly cautious in our outlook going forward, with little sense of urgency in timing our inevitable re-entry into mortgages and other alternative investments. In the absence of a specific catalyst to suggest that riskier assets could return to their prior valuations, we have elected to maintain a conservative risk profile.
1 | The Citigroup Government/Mortgage Index is a combination of the Citigroup U.S. Government Index and the Citigroup Mortgage Index. The Government Index tracks the performance of the Treasury and government-sponsored indices within the U.S. Broad Investment Grade (BIG) Bond Index. The Mortgage Index tracks the performance of the mortgage component of the BIG Bond Index, comprising 30- and 15-year GNMA, FNMA and FHLMC pass throughs and FNMA and FHLMC balloon mortgages. Indices are not investments, do not incur fees or expenses and are not professionally managed. It is not possible to invest directly in an index. Securities in the fund may not match those in an index. |
2 | Lipper Inc., a widely respected data provider in the industry, calculates an average total return (assuming reinvestment of distributions) for mutual funds with investment objectives similar to those of the fund. Lipper makes no adjustment for the effect of sales loads. |
Investing in fixed-income securities may involve certain risks, including the credit quality of individual issuers, possible prepayments, market or economic developments and yield and share price fluctuations due to changes in interest rates. When interest rates go up, bond prices typically drop, and vice versa.
Portfolio characteristics are subject to change periodically and may not be representative of current characteristics.
7
Investment Portfolio – Columbia Federal Securities Fund
August 31, 2008
Government & Agency Obligations – 48.4%
| | | | | | |
| | | | | Par ($) | | Value ($) |
| U.S. Government Agencies – 8.5% | | | | |
| AID-Israel | | 5.500% 04/26/24 | | 10,000,000 | | 10,747,300 |
| | | |
| Federal Home Loan Bank | | 3.875% 06/14/13 (a) | | 1,750,000 | | 1,742,715 |
| | 5.375% 07/17/09 | | 10,000,000 | | 10,204,330 |
| | | |
| Federal Home Loan Mortgage Corp. | | 4.875% 06/13/18 (a) | | 24,750,000 | | 25,308,657 |
| | | |
| Small Business Administration | | 5.360% 11/01/26 | | 8,096,185 | | 7,951,693 |
| | 7.600% 01/01/12 | | 89,767 | | 91,364 |
| | 8.200% 10/01/11 | | 68,704 | | 69,720 |
| | 8.250% 11/01/11 | | 125,035 | | 127,129 |
| | 8.650% 11/01/14 | | 262,655 | | 271,820 |
| | 8.850% 08/01/11 | | 9,451 | | 9,676 |
| | 9.150% 07/01/11 | | 58,186 | | 59,541 |
| | | | | | |
| | U.S. Government Agencies Total | | | | 56,583,945 |
| | | | | | |
| U.S. Government Obligations – 39.9% | | | | |
| U.S. Treasury Bonds | | 5.500% 08/15/28 (a)(b) | | 23,760,000 | | 26,956,457 |
| | 7.125% 02/15/23 (a) | | 11,619,000 | | 15,069,297 |
| | 7.250% 08/15/22 (a) | | 2,596,000 | | 3,387,375 |
| | 8.750% 08/15/20 (a) | | 11,446,000 | | 16,325,750 |
| | | |
| U.S. Treasury Notes | | 4.375% 12/15/10 (a) | | 3,655,000 | | 3,814,336 |
| | 5.000% 02/15/11 (a) | | 78,313,000 | | 83,042,400 |
| | 6.500% 02/15/10 (a) | | 103,768,000 | | 110,237,312 |
| | | |
| U.S. Treasury STRIPS | | (c) 02/15/09 (a) | | 5,500,000 | | 5,458,943 |
| | | | | | |
| | U.S. Government Obligations Total | | | | 264,291,870 |
| | Total Government & Agency Obligations
(cost of $306,888,228) | | | | 320,875,815 |
| | | | | | |
| Mortgage-Backed Securities – 46.8% | | | | |
| Federal Home Loan Mortgage Corp. | | 5.733% 05/01/18 (d) | | 21,573 | | 21,773 |
| | 5.791% 07/01/19 (d) | | 37,080 | | 37,257 |
| | 5.882% 02/01/18 (d) | | 17,980 | | 18,095 |
| | 7.000% 08/01/29 | | 11 | | 12 |
| | 7.500% 10/01/11 | | 6,261 | | 6,470 |
| | 7.500% 03/01/16 | | 5,704 | | 5,944 |
| | 8.000% 06/01/09 | | 177 | | 180 |
| | 8.000% 07/01/09 | | 3,883 | | 3,948 |
| | 8.000% 09/01/09 | | 3,942 | | 4,022 |
| | 8.000% 05/01/10 | | 3,370 | | 3,503 |
| | 8.000% 12/01/11 | | 17,338 | | 17,659 |
| | 8.000% 05/01/16 | | 1,739 | | 1,783 |
| | 8.000% 04/01/17 | | 54,858 | | 58,620 |
| | 8.500% 05/01/09 | | 159 | | 161 |
| | 8.500% 01/01/10 | | 162 | | 169 |
| | 8.500% 03/01/17 | | 5,033 | | 5,457 |
| | 8.500% 06/01/17 | | 312 | | 339 |
| | 8.500% 09/01/17 | | 14,711 | | 15,795 |
See Accompanying Notes to Financial Statements.
8
Columbia Federal Securities Fund
August 31, 2008
Mortgage-Backed Securities (continued)
| | | | | | |
| | | | | Par ($) | | Value ($) |
| | | | | | | |
| Federal Home Loan Mortgage Corp. (continued) | | | | |
| | 8.500% 09/01/20 | | 48,542 | | 52,118 |
| | 8.750% 03/01/09 | | 3,261 | | 3,337 |
| | 9.000% 06/01/09 | | 231 | | 234 |
| | 9.000% 07/01/09 | | 7,103 | | 7,278 |
| | 9.000% 06/01/11 | | 12 | | 13 |
| | 9.000% 12/01/16 | | 3,070 | | 3,351 |
| | 9.000% 12/01/18 | | 7,760 | | 8,306 |
| | 9.000% 01/01/22 | | 67,389 | | 74,499 |
| | 9.250% 10/01/08 | | 2 | | 2 |
| | 9.250% 11/01/08 | | 74 | | 74 |
| | 9.250% 01/01/10 | | 5,424 | | 5,464 |
| | 9.250% 03/01/10 | | 808 | | 844 |
| | 9.250% 07/01/10 | | 290 | | 298 |
| | 9.250% 10/01/10 | | 4,453 | | 4,650 |
| | 9.250% 10/01/19 | | 14,993 | | 16,528 |
| | 9.500% 10/01/08 | | 7 | | 7 |
| | 9.500% 11/01/08 | | 47 | | 48 |
| | 9.500% 02/01/09 | | 292 | | 293 |
| | 9.500% 07/01/09 | | 495 | | 509 |
| | 9.500% 08/01/09 | | 844 | | 867 |
| | 9.500% 04/01/11 | | 2,254 | | 2,393 |
| | 9.500% 05/01/12 | | 4,114 | | 4,420 |
| | 9.500% 04/01/16 | | 967 | | 1,062 |
| | 9.500% 07/01/16 | | 876 | | 972 |
| | 9.500% 09/01/16 | | 966 | | 1,064 |
| | 9.500% 10/01/16 | | 4,398 | | 4,847 |
| | 9.500% 04/01/18 | | 2,481 | | 2,561 |
| | 9.500% 06/01/20 | | 168 | | 187 |
| | 9.500% 09/01/20 | | 331 | | 366 |
| | 9.500% 06/01/21 | | 10,033 | | 11,071 |
| | 9.750% 11/01/08 | | 17 | | 17 |
| | 9.750% 12/01/08 | | 322 | | 325 |
| | 9.750% 04/01/09 | | 470 | | 476 |
| | 9.750% 09/01/16 | | 6,791 | | 7,360 |
| | 10.000% 09/01/18 | | 1,220 | | 1,282 |
| | 10.000% 11/01/19 | | 38,762 | | 44,384 |
| | 10.250% 06/01/09 | | 208 | | 211 |
| | 10.250% 09/01/09 | | 1,109 | | 1,140 |
| | 10.250% 10/01/09 | | 1,755 | | 1,772 |
| | 10.250% 06/01/10 | | 6,934 | | 7,149 |
| | 10.250% 10/01/10 | | 7,128 | | 7,197 |
| | 10.250% 08/01/13 | | 4,753 | | 5,025 |
| | 10.250% 11/01/13 | | 1,542 | | 1,557 |
| | 10.500% 01/01/16 | | 54,748 | | 60,153 |
| | 10.500% 06/01/17 | | 67,763 | | 73,319 |
| | 10.500% 08/01/19 | | 9,061 | | 9,175 |
| | 10.500% 09/01/19 | | 7,419 | | 7,677 |
| | 10.500% 01/01/20 | | 24,724 | | 28,087 |
| | 10.500% 04/01/21 | | 13,751 | | 14,633 |
See Accompanying Notes to Financial Statements.
9
Columbia Federal Securities Fund
August 31, 2008
Mortgage-Backed Securities (continued)
| | | | | | |
| | | | | Par ($) | | Value ($) |
| | | | | | | |
| Federal Home Loan Mortgage Corp. (continued) | | | | |
| | 11.250% 10/01/09 | | 3,082 | | 3,193 |
| | 11.250% 02/01/10 | | 3,160 | | 3,373 |
| | 11.250% 04/01/11 | | 17,418 | | 18,979 |
| | 11.250% 10/01/12 | | 4,472 | | 4,523 |
| | 11.250% 08/01/13 | | 22,748 | | 23,562 |
| | 11.250% 02/01/15 | | 1,428 | | 1,499 |
| | 11.250% 09/01/15 | | 9,958 | | 11,185 |
| | 11.250% 12/01/15 | | 23,693 | | 27,233 |
| | 11.500% 02/01/15 | | 29,650 | | 32,210 |
| | | |
| Federal National Mortgage Association | | 4.367% 07/01/27 (d) | | 19,383 | | 19,293 |
| | 5.000% 11/01/19 (d) | | 2,861 | | 2,877 |
| | 5.000% 02/01/36 | | 27,365,618 | | 26,397,206 |
| | 5.125% 06/01/19 (d) | | 17,053 | | 17,310 |
| | 5.143% 07/01/20 (d) | | 6,552 | | 6,568 |
| | 5.276% 12/01/17 (d) | | 13,762 | | 13,896 |
| | 5.348% 06/01/20 (d) | | 18,705 | | 18,735 |
| | 5.484% 03/01/18 (d) | | 89,691 | | 90,448 |
| | 5.500% 02/01/37 | | 88,708,740 | | 87,694,784 |
| | 5.513% 12/01/31 (d) | | 42,850 | | 43,703 |
| | 5.767% 09/01/37 (d) | | 22,161,643 | | 22,421,747 |
| | 5.937% 08/01/19 (d) | | 23,324 | | 23,362 |
| | 6.000% 12/01/08 | | 48,468 | | 48,591 |
| | 6.000% 01/01/09 | | 62,179 | | 62,337 |
| | 6.000% 01/01/24 | | 207,986 | | 211,422 |
| | 6.000% 02/01/24 | | 116,206 | | 118,374 |
| | 6.000% 03/01/24 | | 819,978 | | 835,275 |
| | 6.000% 04/01/24 | | 634,310 | | 645,916 |
| | 6.000% 05/01/24 | | 242,682 | | 247,210 |
| | 6.000% 08/01/24 | | 66,394 | | 67,633 |
| | 6.000% 01/01/26 | | 3,069 | | 3,127 |
| | 6.000% 03/01/26 | | 63,945 | | 65,185 |
| | 6.000% 04/01/26 | | 1,436 | | 1,464 |
| | 6.000% 05/01/26 | | 6,658 | | 6,787 |
| | 6.000% 11/01/37 | | 30,426,042 | | 30,753,345 |
| | 6.500% 01/01/09 | | 576 | | 578 |
| | 6.500% 02/01/09 | | 252 | | 253 |
| | 6.500% 06/01/09 | | 286 | | 292 |
| | 6.500% 08/01/10 | | 7,490 | | 7,773 |
| | 6.500% 12/01/10 | | 494 | | 513 |
| | 6.500% 04/01/11 | | 8,623 | | 8,952 |
| | 6.500% 10/01/22 | | 23,371 | | 24,121 |
| | 6.500% 09/01/25 | | 40,276 | | 41,867 |
| | 6.500% 11/01/25 | | 102,130 | | 106,166 |
| | 6.500% 05/01/26 | | 178,876 | | 185,944 |
| | 6.500% 09/01/28 | | 10,984 | | 11,411 |
| | 6.500% 12/01/28 | | 12,913 | | 13,415 |
| | 6.500% 01/01/29 | | 119,243 | | 123,881 |
| | 6.500% 06/01/29 | | 115,034 | | 119,435 |
See Accompanying Notes to Financial Statements.
10
Columbia Federal Securities Fund
August 31, 2008
Mortgage-Backed Securities (continued)
| | | | | | |
| | | | | Par ($) | | Value ($) |
| | | | | | | |
| Federal National Mortgage Association (continued) | | | | |
| | 6.500% 11/01/37 | | 46,757,382 | | 48,142,106 |
| | 6.565% 07/01/16 | | 4,598,345 | | 4,879,354 |
| | 7.000% 06/01/09 | | 529 | | 532 |
| | 7.000% 07/01/10 | | 5,388 | | 5,546 |
| | 7.000% 09/01/10 | | 5,111 | | 5,292 |
| | 7.000% 10/01/10 | | 17,830 | | 18,460 |
| | 7.000% 10/01/12 | | 12,055 | | 12,657 |
| | 7.000% 08/01/23 | | 149,147 | | 157,882 |
| | 7.000% 10/01/23 | | 25,853 | | 27,368 |
| | 7.000% 11/01/23 | | 39,698 | | 42,022 |
| | 7.000% 02/01/27 | | 5,527 | | 5,852 |
| | 7.199% 08/01/36 (d) | | 15,157 | | 15,367 |
| | 7.500% 06/01/09 | | 392 | | 394 |
| | 7.500% 12/01/09 | | 5,258 | | 5,386 |
| | 7.500% 02/01/10 | | 399 | | 409 |
| | 7.500% 06/01/10 | | 1,927 | | 1,995 |
| | 7.500% 11/01/11 | | 1,762 | | 1,777 |
| | 7.500% 07/01/13 | | 11,677 | | 12,375 |
| | 7.500% 12/01/14 | | 506 | | 530 |
| | 7.500% 01/01/17 | | 32,587 | | 35,261 |
| | 7.500% 02/01/18 | | 11,028 | | 11,930 |
| | 7.500% 10/01/23 | | 11,909 | | 12,839 |
| | 7.500% 12/01/23 | | 51,707 | | 55,749 |
| | 8.000% 12/01/08 | | 127 | | 128 |
| | 8.000% 04/01/09 | | 1,022 | | 1,027 |
| | 8.000% 03/01/13 | | 1,728 | | 1,875 |
| | 8.000% 11/01/15 | | 887 | | 964 |
| | 8.000% 06/01/25 | | 1,805 | | 1,960 |
| | 8.000% 08/01/27 | | 24,367 | | 26,475 |
| | 8.000% 02/01/30 | | 1,701 | | 1,847 |
| | 8.000% 03/01/30 | | 3,234 | | 3,495 |
| | 8.000% 08/01/30 | | 2,102 | | 2,272 |
| | 8.000% 10/01/30 | | 33,453 | | 36,153 |
| | 8.000% 11/01/30 | | 144,241 | | 155,882 |
| | 8.000% 12/01/30 | | 50,072 | | 54,113 |
| | 8.000% 01/01/31 | | 286,770 | | 311,127 |
| | 8.000% 02/01/31 | | 740 | | 800 |
| | 8.000% 04/01/31 | | 30,336 | | 32,784 |
| | 8.000% 05/01/31 | | 40,247 | | 43,478 |
| | 8.000% 08/01/31 | | 1,488 | | 1,607 |
| | 8.000% 09/01/31 | | 92,822 | | 100,282 |
| | 8.000% 12/01/31 | | 10,148 | | 10,962 |
| | 8.000% 04/01/32 | | 175,187 | | 189,250 |
| | 8.000% 05/01/32 | | 313,951 | | 339,155 |
| | 8.000% 06/01/32 | | 328,789 | | 355,184 |
| | 8.000% 07/01/32 | | 5,440 | | 5,877 |
| | 8.000% 08/01/32 | | 7,023 | | 7,587 |
| | 8.000% 10/01/32 | | 30,148 | | 32,568 |
| | 8.000% 11/01/32 | | 74,938 | | 80,986 |
See Accompanying Notes to Financial Statements.
11
Columbia Federal Securities Fund
August 31, 2008
Mortgage-Backed Securities (continued)
| | | | | | |
| | | | | Par ($) | | Value ($) |
| | | | | | | |
| Federal National Mortgage Association (continued) | | | | |
| | 8.000% 02/01/33 | | 108,742 | | 117,472 |
| | 8.000% 03/01/33 | | 29,291 | | 31,643 |
| | 8.500% 12/01/11 | | 846 | | 865 |
| | 8.500% 02/01/15 | | 257 | | 259 |
| | 8.500% 06/01/15 | | 6,490 | | 6,706 |
| | 8.500% 02/01/17 | | 1,779 | | 1,924 |
| | 8.500% 07/01/17 | | 551 | | 564 |
| | 8.500% 09/01/21 | | 13,305 | | 13,622 |
| | 9.000% 12/01/08 | | 306 | | 309 |
| | 9.000% 05/01/09 | | 9,471 | | 9,594 |
| | 9.000% 09/01/09 | | 3,857 | | 3,891 |
| | 9.000% 12/01/09 | | 1,562 | | 1,577 |
| | 9.000% 04/01/10 | | 550 | | 565 |
| | 9.000% 06/01/10 | | 1,084 | | 1,093 |
| | 9.000% 11/01/10 | | 176 | | 180 |
| | 9.000% 06/01/11 | | 134 | | 135 |
| | 9.000% 09/01/13 | | 699 | | 712 |
| | 9.000% 09/01/14 | | 565 | | 573 |
| | 9.000% 04/01/15 | | 5,441 | | 5,673 |
| | 9.000% 04/01/16 | | 8,605 | | 8,630 |
| | 9.000% 06/01/16 | | 1,761 | | 1,806 |
| | 9.000% 07/01/16 | | 2,553 | | 2,793 |
| | 9.000% 09/01/16 | | 816 | | 837 |
| | 9.000% 12/01/16 | | 333 | | 334 |
| | 9.000% 01/01/17 | | 467 | | 487 |
| | 9.000% 02/01/17 | | 4 | | 4 |
| | 9.000% 05/01/17 | | 18 | | 18 |
| | 9.000% 06/01/17 | | 956 | | 977 |
| | 9.000% 08/01/17 | | 2,982 | | 3,058 |
| | 9.000% 05/01/18 | | 14,169 | | 14,321 |
| | 9.000% 09/01/19 | | 946 | | 970 |
| | 9.000% 10/01/19 | | 202 | | 207 |
| | 9.000% 11/01/19 | | 94 | | 97 |
| | 9.000% 07/01/20 | | 378 | | 381 |
| | 9.000% 08/01/21 | | 79,702 | | 81,754 |
| | 9.000% 06/01/22 | | 2,628 | | 2,740 |
| | 9.000% 09/01/24 | | 15,914 | | 17,470 |
| | 9.500% 12/01/10 | | 1,541 | | 1,556 |
| | 9.500% 03/01/11 | | 16 | | 16 |
| | 9.500% 03/01/16 | | 5,745 | | 5,932 |
| | 9.500% 04/01/16 | | 39 | | 39 |
| | 9.500% 06/01/16 | | 31,155 | | 34,452 |
| | 9.500% 02/01/17 | | 1,738 | | 1,848 |
| | 9.500% 01/01/19 | | 120,156 | | 131,559 |
| | 9.500% 04/01/20 | | 103,260 | | 113,781 |
| | 9.500% 07/15/21 | | 292,949 | | 324,881 |
| | 9.500% 08/01/21 | | 131,732 | | 147,481 |
| | 10.500% 03/01/14 | | 8,352 | | 8,660 |
| | 10.500% 12/01/15 | | 17,574 | | 18,397 |
See Accompanying Notes to Financial Statements.
12
Columbia Federal Securities Fund
August 31, 2008
Mortgage-Backed Securities (continued)
| | | | | | |
| | | | | Par ($) | | Value ($) |
| | | | | | | |
| Federal National Mortgage Association (continued) | | | | |
| | 11.000% 08/01/15 | | 14,581 | | 15,287 |
| | TBA: | | | | |
| | 5.000% 12/01/38 (e) | | 35,300,000 | | 33,932,125 |
| | 5.500% 12/01/38 (e) | | 38,500,000 | | 38,018,750 |
| | | |
| Government National Mortgage Association | | 5.375% 05/20/22 (d) | | 28,738 | | 28,985 |
| | 5.375% 06/20/23 (d) | | 17,836 | | 17,997 |
| | 5.625% 08/20/22 (d) | | 5,362 | | 5,390 |
| | 6.000% 12/15/10 | | 16,665 | | 17,244 |
| | 6.500% 06/15/23 | | 13,788 | | 14,267 |
| | 6.500% 08/15/23 | | 1,451 | | 1,502 |
| | 6.500% 09/15/23 | | 15,935 | | 16,489 |
| | 6.500% 10/15/23 | | 29,492 | | 30,518 |
| | 6.500% 11/15/23 | | 118,613 | | 122,735 |
| | 6.500% 12/15/23 | | 48,660 | | 50,350 |
| | 6.500% 01/15/24 | | 37,205 | | 38,593 |
| | 6.500% 02/15/24 | | 31,534 | | 32,711 |
| | 6.500% 03/15/24 | | 90,261 | | 93,627 |
| | 6.500% 04/15/24 | | 16,407 | | 17,019 |
| | 6.500% 05/15/24 | | 23,076 | | 23,911 |
| | 6.500% 07/15/24 | | 96,649 | | 100,027 |
| | 6.500% 09/15/25 | | 30,111 | | 31,235 |
| | 6.500% 12/15/25 | | 24,316 | | 25,223 |
| | 6.500% 01/15/28 | | 20,254 | | 21,010 |
| | 6.500% 02/15/28 | | 30,753 | | 31,900 |
| | 6.500% 07/15/28 | | 97,353 | | 100,984 |
| | 6.500% 08/15/28 | | 73,155 | | 75,884 |
| | 6.500% 10/15/28 | | 70,571 | | 73,204 |
| | 6.500% 11/15/28 | | 18,985 | | 19,693 |
| | 6.500% 12/15/28 | | 174,559 | | 181,070 |
| | 6.500% 01/15/29 | | 120,759 | | 125,188 |
| | 6.500% 02/15/29 | | 32,042 | | 33,217 |
| | 7.000% 03/15/22 | | 8,265 | | 8,810 |
| | 7.000% 04/15/22 | | 1,235 | | 1,316 |
| | 7.000% 10/15/22 | | 3,081 | | 3,283 |
| | 7.000% 11/15/22 | | 7,893 | | 8,413 |
| | 7.000% 01/15/23 | | 127,606 | | 136,100 |
| | 7.000% 03/15/23 | | 1,667 | | 1,778 |
| | 7.000% 05/15/23 | | 76,639 | | 81,741 |
| | 7.000% 06/15/23 | | 18,311 | | 19,529 |
| | 7.000% 07/15/23 | | 5,091 | | 5,430 |
| | 7.000% 10/15/23 | | 52,196 | | 55,671 |
| | 7.000% 12/15/23 | | 45,726 | | 48,754 |
| | 7.000% 01/15/24 | | 1,858 | | 1,982 |
| | 7.000% 03/15/24 | | 801 | | 854 |
| | 7.000% 10/15/24 | | 37,364 | | 39,849 |
| | 7.000% 09/15/25 | | 3,095 | | 3,302 |
| | 7.000% 10/15/25 | | 99,828 | | 106,479 |
See Accompanying Notes to Financial Statements.
13
Columbia Federal Securities Fund
August 31, 2008
Mortgage-Backed Securities (continued)
| | | | | | |
| | | | | Par ($) | | Value ($) |
| | | | | | | |
| Government National Mortgage Association (continued) | | | | |
| | 7.000% 12/15/25 | | 38,200 | | 40,745 |
| | 7.000% 01/15/26 | | 33,313 | | 35,518 |
| | 7.000% 02/15/26 | | 41,562 | | 44,311 |
| | 7.000% 03/15/26 | | 5,196 | | 5,542 |
| | 7.000% 04/15/26 | | 3,762 | | 4,010 |
| | 7.000% 05/15/26 | | 1,543 | | 1,645 |
| | 7.000% 06/15/26 | | 48,510 | | 51,720 |
| | 7.000% 11/15/26 | | 57,205 | | 61,008 |
| | 7.000% 12/15/26 | | 751 | | 801 |
| | 7.000% 01/15/27 | | 3,319 | | 3,537 |
| | 7.000% 02/15/27 | | 561 | | 598 |
| | 7.000% 04/15/27 | | 3,946 | | 4,206 |
| | 7.000% 08/15/27 | | 926 | | 987 |
| | 7.000% 09/15/27 | | 35,902 | | 38,260 |
| | 7.000% 10/15/27 | | 62,385 | | 66,482 |
| | 7.000% 11/15/27 | | 152,940 | | 162,988 |
| | 7.000% 12/15/27 | | 276,101 | | 294,238 |
| | 7.000% 01/15/28 | | 10,924 | | 11,632 |
| | 7.000% 02/15/28 | | 45,726 | | 48,732 |
| | 7.000% 03/15/28 | | 155,063 | | 165,150 |
| | 7.000% 04/15/28 | | 77,232 | | 82,241 |
| | 7.000% 05/15/28 | | 39,836 | | 42,418 |
| | 7.000% 06/15/28 | | 9,118 | | 9,709 |
| | 7.000% 07/15/28 | | 387,367 | | 412,491 |
| | 7.000% 09/15/28 | | 17,903 | | 19,064 |
| | 7.000% 12/15/28 | | 92,818 | | 98,838 |
| | 7.000% 01/15/29 | | 1,420 | | 1,511 |
| | 7.000% 02/15/29 | | 1,980 | | 2,107 |
| | 7.000% 03/15/29 | | 20,584 | | 21,910 |
| | 7.000% 04/15/29 | | 37,704 | | 40,128 |
| | 7.000% 05/15/29 | | 26,769 | | 28,492 |
| | 7.000% 06/15/29 | | 15,713 | | 16,724 |
| | 7.000% 07/15/29 | | 67,877 | | 72,245 |
| | 7.000% 08/15/29 | | 37,517 | | 39,933 |
| | 7.000% 09/15/29 | | 26,622 | | 28,338 |
| | 7.000% 10/15/29 | | 7,817 | | 8,320 |
| | 7.500% 04/15/22 | | 18,153 | | 19,513 |
| | 7.500% 10/15/23 | | 31,148 | | 33,497 |
| | 7.500% 08/15/25 | | 126,934 | | 136,641 |
| | 7.500% 10/15/25 | | 11,422 | | 12,296 |
| | 7.500% 12/15/25 | | 45,331 | | 48,798 |
| | 8.000% 11/15/14 | | 18,462 | | 19,613 |
| | 8.000% 06/20/17 | | 134,250 | | 145,252 |
| | 8.000% 06/15/22 | | 65,866 | | 71,898 |
| | 8.000% 02/15/23 | | 78,081 | | 85,298 |
| | 8.000% 03/20/23 | | 422 | | 460 |
| | 8.000% 06/15/23 | | 2,113 | | 2,308 |
| | 8.000% 07/15/23 | | 2,887 | | 3,154 |
| | 8.000% 07/15/26 | | 51,208 | | 56,025 |
See Accompanying Notes to Financial Statements.
14
Columbia Federal Securities Fund
August 31, 2008
Mortgage-Backed Securities (continued)
| | | | | | |
| | | | | Par ($) | | Value ($) |
| | | | | | | |
| Government National Mortgage Association (continued) | | | | |
| | 8.000% 07/15/29 | | 2,829 | | 3,096 |
| | 8.500% 10/15/09 | | 2,329 | | 2,401 |
| | 8.500% 12/15/21 | | 4,072 | | 4,480 |
| | 8.500% 01/15/22 | | 65,178 | | 71,786 |
| | 8.500% 09/15/22 | | 3,302 | | 3,637 |
| | 8.500% 11/20/22 | | 40,313 | | 44,239 |
| | 8.500% 12/15/22 | | 3,704 | | 4,074 |
| | 8.750% 12/15/21 | | 106,084 | | 115,285 |
| | 8.850% 01/15/19 | | 38,597 | | 42,080 |
| | 8.850% 05/15/19 | | 63,746 | | 69,497 |
| | 9.000% 10/15/08 | | 103 | | 104 |
| | 9.000% 11/15/08 | | 1,148 | | 1,158 |
| | 9.000% 12/15/08 | | 1,416 | | 1,430 |
| | 9.000% 01/15/09 | | 1,128 | | 1,158 |
| | 9.000% 02/15/09 | | 2,802 | | 2,874 |
| | 9.000% 03/15/09 | | 10,648 | | 10,924 |
| | 9.000% 04/15/09 | | 605 | | 621 |
| | 9.000% 05/15/09 | | 20,726 | | 21,263 |
| | 9.000% 06/15/09 | | 11,150 | | 11,438 |
| | 9.000% 05/15/16 | | 21,092 | | 22,962 |
| | 9.000% 06/15/16 | | 9,754 | | 10,619 |
| | 9.000% 07/15/16 | | 23,551 | | 25,639 |
| | 9.000% 08/15/16 | | 1,124 | | 1,224 |
| | 9.000% 09/15/16 | | 21,737 | | 23,664 |
| | 9.000% 10/15/16 | | 27,263 | | 29,680 |
| | 9.000% 11/15/16 | | 8,227 | | 8,956 |
| | 9.000% 11/20/16 | | 70,600 | | 76,577 |
| | 9.000% 12/15/16 | | 891 | | 968 |
| | 9.000% 01/15/17 | | 71,260 | | 77,818 |
| | 9.000% 02/15/17 | | 1,518 | | 1,657 |
| | 9.000% 03/20/17 | | 30,129 | | 32,781 |
| | 9.000% 05/15/17 | | 2,692 | | 2,940 |
| | 9.000% 06/15/17 | | 25,093 | | 27,401 |
| | 9.000% 06/20/17 | | 98,046 | | 106,675 |
| | 9.000% 07/15/17 | | 497 | | 543 |
| | 9.000% 09/15/17 | | 10,872 | | 11,872 |
| | 9.000% 10/15/17 | | 10,174 | | 11,052 |
| | 9.000% 12/15/17 | | 6,229 | | 6,912 |
| | 9.000% 04/20/18 | | 79,911 | | 87,031 |
| | 9.000% 05/20/18 | | 29,166 | | 31,765 |
| | 9.000% 12/15/19 | | 345 | | 378 |
| | 9.000% 04/15/20 | | 1,027 | | 1,126 |
| | 9.000% 05/20/21 | | 1,876 | | 2,050 |
| | 9.000% 09/15/21 | | 188 | | 206 |
| | 9.000% 02/15/25 | | 103,769 | | 114,064 |
| | 9.250% 10/15/16 | | 70,877 | | 77,277 |
| | 9.250% 05/15/18 | | 15,225 | | 16,703 |
| | 9.250% 07/15/21 | | 35,410 | | 39,220 |
| | 9.250% 09/15/21 | | 32,439 | | 35,929 |
See Accompanying Notes to Financial Statements.
15
Columbia Federal Securities Fund
August 31, 2008
Mortgage-Backed Securities (continued)
| | | | | | |
| | | | | Par ($) | | Value ($) |
| | | | | | | |
| Government National Mortgage Association (continued) | | | | |
| | 9.500% 06/15/09 | | 15,919 | | 16,388 |
| | 9.500% 07/15/09 | | 4,151 | | 4,273 |
| | 9.500% 08/15/09 | | 22,984 | | 23,662 |
| | 9.500% 09/15/09 | | 18,671 | | 19,221 |
| | 9.500% 10/15/09 | | 14,775 | | 15,211 |
| | 9.500% 12/20/24 | | 11,243 | | 12,513 |
| | 9.500% 01/20/25 | | 7,568 | | 8,841 |
| | 10.000% 12/15/17 | | 1,318 | | 1,481 |
| | 10.000% 07/20/18 | | 18,185 | | 20,447 |
| | 10.000% 11/15/18 | | 516 | | 581 |
| | 10.000% 12/15/18 | | 424 | | 479 |
| | 10.000% 03/15/19 | | 383 | | 433 |
| | 10.000% 11/15/20 | | 11,877 | | 13,484 |
| | 10.500% 02/15/10 | | 1,880 | | 1,993 |
| | 10.500% 09/15/10 | | 361 | | 382 |
| | 10.500% 06/15/11 | | 10,058 | | 10,843 |
| | 10.500% 06/15/12 | | 10,986 | | 12,008 |
| | 10.500% 11/15/13 | | 10,793 | | 11,927 |
| | 10.500% 08/15/15 | | 6,554 | | 7,360 |
| | 10.500% 09/15/15 | | 18,386 | | 20,647 |
| | 10.500% 10/15/15 | | 6,464 | | 7,246 |
| | 10.500% 12/15/15 | | 7,125 | | 8,001 |
| | 10.500% 01/15/16 | | 26,014 | | 29,393 |
| | 10.500% 01/20/16 | | 135 | | 150 |
| | 10.500% 02/15/16 | | 10,000 | | 11,299 |
| | 10.500% 03/15/16 | | 4,262 | | 4,815 |
| | 10.500% 07/15/17 | | 12,433 | | 14,120 |
| | 10.500% 10/15/17 | | 1,520 | | 1,726 |
| | 10.500% 11/15/17 | | 41,005 | | 46,566 |
| | 10.500% 12/15/17 | | 49,475 | | 56,186 |
| | 10.500% 01/15/18 | | 8,427 | | 9,594 |
| | 10.500% 02/15/18 | | 22,639 | | 25,821 |
| | 10.500% 03/15/18 | | 25,688 | | 29,297 |
| | 10.500% 04/15/18 | | 40,702 | | 46,421 |
| | 10.500% 06/15/18 | | 7,349 | | 8,352 |
| | 10.500% 07/15/18 | | 45,359 | | 51,732 |
| | 10.500% 09/15/18 | | 5,397 | | 6,155 |
| | 10.500% 10/15/18 | | 7,102 | | 8,099 |
| | 10.500% 12/15/18 | | 9,811 | | 11,207 |
| | 10.500% 02/15/19 | | 7,687 | | 8,799 |
| | 10.500% 03/15/19 | | 2,462 | | 2,818 |
| | 10.500% 04/15/19 | | 41,602 | | 47,610 |
| | 10.500% 05/15/19 | | 34,370 | | 39,338 |
| | 10.500% 06/15/19 | | 44,661 | | 51,041 |
| | 10.500% 06/20/19 | | 8,106 | | 9,246 |
| | 10.500% 07/15/19 | | 85,529 | | 97,892 |
| | 10.500% 07/20/19 | | 5,086 | | 5,801 |
| | 10.500% 08/15/19 | | 21,482 | | 24,588 |
| | 10.500% 08/20/19 | | 11,263 | | 12,743 |
See Accompanying Notes to Financial Statements.
16
Columbia Federal Securities Fund
August 31, 2008
Mortgage-Backed Securities (continued)
| | | | | | |
| | | | | Par ($) | | Value ($) |
| | | | | | | |
| Government National Mortgage Association (continued) | | | | |
| | 10.500% 09/15/19 | | 9,925 | | 11,288 |
| | 10.500% 09/20/19 | | 9,762 | | 11,135 |
| | 10.500% 10/15/19 | | 4,124 | | 4,721 |
| | 10.500% 12/15/19 | | 23,991 | | 27,460 |
| | 10.500% 03/15/20 | | 9,968 | | 11,444 |
| | 10.500% 05/15/20 | | 7,080 | | 8,128 |
| | 10.500% 07/15/20 | | 19,390 | | 22,250 |
| | 10.500% 08/15/20 | | 12,238 | | 14,050 |
| | 10.500% 09/15/20 | | 12,806 | | 14,704 |
| | 10.500% 10/15/20 | | 139 | | 159 |
| | 10.500% 11/15/20 | | 2,006 | | 2,303 |
| | 10.500% 12/15/20 | | 762 | | 872 |
| | 10.500% 01/15/21 | | 2,669 | | 3,072 |
| | 10.500% 08/15/21 | | 107,862 | | 122,587 |
| | 10.625% 05/15/10 | | 2,839 | | 3,013 |
| | 11.000% 12/15/09 | | 2,339 | | 2,426 |
| | 11.000% 01/15/10 | | 92 | | 98 |
| | 11.000% 02/15/10 | | 10,146 | | 10,773 |
| | 11.000% 03/15/10 | | 3,133 | | 3,273 |
| | 11.000% 07/15/10 | | 5,046 | | 5,371 |
| | 11.000% 08/15/10 | | 10,096 | | 10,726 |
| | 11.000% 09/15/10 | | 17,953 | | 19,069 |
| | 11.000% 10/15/10 | | 502 | | 534 |
| | 11.000% 11/15/10 | | 2,359 | | 2,503 |
| | 11.000% 04/15/11 | | 3,460 | | 3,753 |
| | 11.000% 02/15/13 | | 1,081 | | 1,165 |
| | 11.000% 07/15/13 | | 10,831 | | 11,988 |
| | 11.000% 08/15/15 | | 24,170 | | 27,396 |
| | 11.000% 09/15/15 | | 20,651 | | 23,329 |
| | 11.000% 10/15/15 | | 7,713 | | 8,742 |
| | 11.000% 11/15/15 | | 61,070 | | 69,228 |
| | 11.000% 12/15/15 | | 44,681 | | 50,645 |
| | 11.000% 01/15/16 | | 26,471 | | 30,203 |
| | 11.000% 02/15/16 | | 2,677 | | 3,038 |
| | 11.000% 03/15/16 | | 3,459 | | 3,911 |
| | 11.000% 07/15/16 | | 35,973 | | 41,045 |
| | 11.000% 08/15/18 | | 3,302 | | 3,771 |
| | 11.000% 09/15/18 | | 55,318 | | 63,760 |
| | 11.000% 11/15/18 | | 9,172 | | 10,572 |
| | 11.000% 12/15/18 | | 31,896 | | 36,764 |
| | 11.000% 06/20/19 | | 9,497 | | 10,951 |
| | 11.000% 07/20/19 | | 176 | | 201 |
| | 11.000% 09/20/19 | | 3,486 | | 4,001 |
| | 11.000% 12/15/20 | | 11,459 | | 13,304 |
| | 11.000% 02/15/21 | | 6,646 | | 7,794 |
| | 11.500% 03/15/10 | | 907 | | 970 |
| | 11.500% 04/15/10 | | 2,470 | | 2,641 |
| | 11.500% 07/15/10 | | 3,210 | | 3,433 |
| | 11.500% 09/15/10 | | 15,035 | | 16,080 |
See Accompanying Notes to Financial Statements.
17
Columbia Federal Securities Fund
August 31, 2008
Mortgage-Backed Securities (continued)
| | | | | | |
| | | | | Par ($) | | Value ($) |
| | | | | | | |
| Government National Mortgage Association (continued) | | | | |
| | 11.500% 10/15/10 | | 11,007 | | 11,769 |
| | 11.500% 01/15/13 | | 18,328 | | 20,478 |
| | 11.500% 02/15/13 | | 50,308 | | 56,372 |
| | 11.500% 03/15/13 | | 85,885 | | 96,250 |
| | 11.500% 04/15/13 | | 83,864 | | 93,673 |
| | 11.500% 05/15/13 | | 107,947 | | 120,844 |
| | 11.500% 06/15/13 | | 58,934 | | 66,158 |
| | 11.500% 07/15/13 | | 54,007 | | 60,625 |
| | 11.500% 08/15/13 | | 15,786 | | 17,720 |
| | 11.500% 09/15/13 | | 15,656 | | 17,576 |
| | 11.500% 11/15/13 | | 6,625 | | 7,438 |
| | 11.500% 01/15/14 | | 3,523 | | 3,995 |
| | 11.500% 02/15/14 | | 8,755 | | 9,930 |
| | 11.500% 08/15/15 | | 3,065 | | 3,507 |
| | 11.500% 09/15/15 | | 8,991 | | 9,914 |
| | 11.500% 10/15/15 | | 17,314 | | 19,833 |
| | 11.500% 11/15/15 | | 6,415 | | 7,339 |
| | 11.500% 12/15/15 | | 4,813 | | 5,505 |
| | 11.500% 01/15/16 | | 6,593 | | 7,597 |
| | 11.500% 02/15/16 | | 5,614 | | 6,223 |
| | 11.500% 02/20/16 | | 8,712 | | 9,869 |
| | 11.500% 03/15/16 | | 480 | | 553 |
| | 11.500% 11/15/17 | | 7,741 | | 8,972 |
| | 11.500% 12/15/17 | | 3,348 | | 3,880 |
| | 11.500% 01/15/18 | | 3,454 | | 4,023 |
| | 11.500% 02/15/18 | | 3,423 | | 3,988 |
| | 11.500% 02/20/18 | | 918 | | 997 |
| | 11.500% 05/15/18 | | 6,130 | | 7,141 |
| | 11.500% 11/15/19 | | 3,978 | | 4,653 |
| | 11.750% 07/15/13 | | 8,418 | | 9,455 |
| | 11.750% 07/15/15 | | 37,636 | | 43,093 |
| | 12.000% 11/15/12 | | 3,393 | | 3,779 |
| | 12.000% 12/15/12 | | 83,708 | | 93,434 |
| | 12.000% 01/15/13 | | 68,708 | | 77,718 |
| | 12.000% 02/15/13 | | 40,178 | | 45,402 |
| | 12.000% 03/15/13 | | 7,579 | | 8,480 |
| | 12.000% 05/15/13 | | 6,401 | | 7,181 |
| | 12.000% 08/15/13 | | 17,128 | | 19,381 |
| | 12.000% 09/15/13 | | 53,402 | | 60,420 |
| | 12.000% 09/20/13 | | 1,846 | | 2,081 |
| | 12.000% 10/15/13 | | 5,986 | | 6,773 |
| | 12.000% 12/15/13 | | 9,829 | | 11,122 |
| | 12.000% 01/15/14 | | 14,578 | | 16,675 |
| | 12.000% 01/20/14 | | 1,686 | | 1,906 |
| | 12.000% 02/15/14 | | 35,187 | | 40,210 |
| | 12.000% 02/20/14 | | 16,412 | | 18,604 |
| | 12.000% 03/15/14 | | 87,325 | | 99,891 |
| | 12.000% 03/20/14 | | 6,862 | | 7,740 |
| | 12.000% 04/15/14 | | 52,750 | | 60,274 |
See Accompanying Notes to Financial Statements.
18
Columbia Federal Securities Fund
August 31, 2008
Mortgage-Backed Securities (continued)
| | | | | | |
| | | | | Par ($) | | Value ($) |
| | | | | | | |
| Government National Mortgage Association (continued) | | | | |
| | 12.000% 04/20/14 | | 30,449 | | 34,709 |
| | 12.000% 05/15/14 | | 85,305 | | 97,413 |
| | 12.000% 06/15/14 | | 25,845 | | 29,565 |
| | 12.000% 07/15/14 | | 8,832 | | 10,103 |
| | 12.000% 08/20/14 | | 1,839 | | 2,096 |
| | 12.000% 01/15/15 | | 19,016 | | 21,955 |
| | 12.000% 02/15/15 | | 35,995 | | 41,558 |
| | 12.000% 03/15/15 | | 33,103 | | 38,220 |
| | 12.000% 03/20/15 | | 194 | | 221 |
| | 12.000% 04/15/15 | | 31,553 | | 36,385 |
| | 12.000% 05/15/15 | | 16,689 | | 19,268 |
| | 12.000% 06/15/15 | | 18,722 | | 21,595 |
| | 12.000% 07/15/15 | | 19,481 | | 22,485 |
| | 12.000% 09/20/15 | | 9,720 | | 11,184 |
| | 12.000% 10/15/15 | | 7,740 | | 8,804 |
| | 12.000% 11/15/15 | | 7,034 | | 8,121 |
| | 12.000% 12/20/15 | | 1,298 | | 1,474 |
| | 12.000% 01/15/16 | | 4,411 | | 5,131 |
| | 12.000% 02/15/16 | | 5,863 | | 6,820 |
| | 12.000% 02/20/16 | | 1,853 | | 2,149 |
| | 12.250% 02/15/14 | | 40,403 | | 46,252 |
| | 12.250% 03/15/14 | | 5,012 | | 5,737 |
| | 12.250% 04/15/14 | | 16,047 | | 18,370 |
| | 12.500% 04/15/10 | | 23,122 | | 24,816 |
| | 12.500% 05/15/10 | | 32,940 | | 35,494 |
| | 12.500% 06/15/10 | | 42,349 | | 45,685 |
| | 12.500% 07/15/10 | | 20,324 | | 21,937 |
| | 12.500% 08/15/10 | | 6,621 | | 7,146 |
| | 12.500% 09/15/10 | | 666 | | 718 |
| | 12.500% 10/15/10 | | 12,296 | | 13,271 |
| | 12.500% 11/15/10 | | 45,091 | | 48,656 |
| | 12.500% 12/15/10 | | 76,869 | | 82,935 |
| | 12.500% 01/15/11 | | 7,699 | | 8,431 |
| | 12.500% 05/15/11 | | 9,775 | | 10,789 |
| | 12.500% 10/15/13 | | 25,704 | | 29,315 |
| | 12.500% 10/20/13 | | 18,162 | | 20,641 |
| | 12.500% 11/15/13 | | 92,278 | | 105,248 |
| | 12.500% 12/15/13 | | 35,313 | | 40,093 |
| | 12.500% 01/15/14 | | 24,584 | | 28,365 |
| | 12.500% 05/15/14 | | 65,813 | | 75,933 |
| | 12.500% 06/15/14 | | 35,886 | | 41,403 |
| | 12.500% 07/20/14 | | 2,242 | | 2,549 |
| | 12.500% 08/15/14 | | 9,742 | | 11,240 |
| | 12.500% 09/20/14 | | 1,637 | | 1,882 |
| | 12.500% 12/15/14 | | 36,955 | | 42,639 |
| | 12.500% 01/15/15 | | 47,753 | | 55,630 |
| | 12.500% 04/15/15 | | 2,145 | | 2,499 |
| | 12.500% 05/15/15 | | 12,526 | | 14,597 |
| | 12.500% 05/20/15 | | 2,555 | | 2,967 |
See Accompanying Notes to Financial Statements.
19
Columbia Federal Securities Fund
August 31, 2008
Mortgage-Backed Securities (continued)
| | | | | | |
| | | | | Par ($) | | Value ($) |
| | | | | | | |
| Government National Mortgage Association (continued) | | | | |
| | 12.500% 06/15/15 | | 9,995 | | 11,612 |
| | 12.500% 07/15/15 | | 18,048 | | 21,030 |
| | 12.500% 07/20/15 | | 2,692 | | 3,126 |
| | 12.500% 08/15/15 | | 20,573 | | 23,972 |
| | 12.500% 10/15/15 | | 28,761 | | 33,513 |
| | 12.500% 11/20/15 | | 8,000 | | 9,290 |
| | 13.000% 01/15/11 | | 25,914 | | 27,962 |
| | 13.000% 02/15/11 | | 24,441 | | 27,138 |
| | 13.000% 03/15/11 | | 21,784 | | 24,187 |
| | 13.000% 04/15/11 | | 34,997 | | 38,857 |
| | 13.000% 06/15/11 | | 7,912 | | 8,785 |
| | 13.000% 06/15/12 | | 6,672 | | 7,552 |
| | 13.000% 10/15/12 | | 11,028 | | 12,483 |
| | 13.000% 11/15/12 | | 5,636 | | 6,379 |
| | 13.000% 12/15/12 | | 2,067 | | 2,340 |
| | 13.000% 02/15/13 | | 11,183 | | 12,854 |
| | 13.000% 05/15/13 | | 2,984 | | 3,429 |
| | 13.000% 09/15/13 | | 9,843 | | 11,315 |
| | 13.000% 09/20/13 | | 10,036 | | 11,495 |
| | 13.000% 10/15/13 | | 36,033 | | 41,417 |
| | 13.000% 06/15/14 | | 23,422 | | 27,258 |
| | 13.000% 07/15/14 | | 13,879 | | 16,152 |
| | 13.000% 07/20/14 | | 1,643 | | 1,877 |
| | 13.000% 09/15/14 | | 19,291 | | 22,411 |
| | 13.000% 10/15/14 | | 10,206 | | 11,881 |
| | 13.000% 11/15/14 | | 25,255 | | 29,484 |
| | 13.000% 12/15/14 | | 25,345 | | 29,495 |
| | 13.000% 03/15/15 | | 4,615 | | 5,340 |
| | 13.000% 06/15/15 | | 6,168 | | 7,253 |
| | 13.000% 01/15/16 | | 12,348 | | 14,646 |
| | 13.500% 05/15/10 | | 3,999 | | 4,355 |
| | 13.500% 06/15/10 | | 645 | | 702 |
| | 13.500% 07/15/10 | | 890 | | 969 |
| | 13.500% 10/15/10 | | 5,400 | | 5,881 |
| | 13.500% 04/15/11 | | 3,093 | | 3,454 |
| | 13.500% 05/15/11 | | 27,354 | | 30,515 |
| | 13.500% 10/15/12 | | 808 | | 921 |
| | 13.500% 11/15/12 | | 21,964 | | 25,037 |
| | 13.500% 06/15/13 | | 3,448 | | 3,994 |
| | 13.500% 07/15/14 | | 1,676 | | 1,967 |
| | 13.500% 08/15/14 | | 1,380 | | 1,620 |
| | 13.500% 08/20/14 | | 4,923 | | 5,758 |
| | 13.500% 09/15/14 | | 3,509 | | 4,118 |
| | 13.500% 09/20/14 | | 4,385 | | 5,129 |
| | 13.500% 10/15/14 | | 15,342 | | 18,007 |
| | 13.500% 11/15/14 | | 10,344 | | 12,141 |
| | 13.500% 11/20/14 | | 15,733 | | 18,404 |
| | 13.500% 12/15/14 | | 3,412 | | 4,005 |
| | 13.500% 12/20/14 | | 4,563 | | 5,338 |
See Accompanying Notes to Financial Statements.
20
Columbia Federal Securities Fund
August 31, 2008
Mortgage-Backed Securities (continued)
| | | | | | |
| | | | | Par ($) | | Value ($) |
| | | | | | | |
| Government National Mortgage Association (continued) | | | | |
| | 13.500% 01/15/15 | | 5,045 | | 5,987 |
| | 13.500% 02/15/15 | | 20,034 | | 23,774 |
| | 13.500% 02/20/15 | | 7,796 | | 9,221 |
| | 13.500% 04/15/15 | | 3,601 | | 4,273 |
| | 13.500% 06/15/15 | | 4,323 | | 5,130 |
| | 14.000% 06/15/11 | | 2,736 | | 3,093 |
| | 15.000% 09/15/11 | | 26,078 | | 29,640 |
| | 15.000% 07/15/12 | | 1,649 | | 1,919 |
| | | | | | |
| | Total Mortgage-Backed Securities
(cost of $308,459,920) | | | | 310,320,192 |
| | | | | | |
| Asset-Backed Securities – 3.8% | | | | |
| Chase Funding Mortgage Loan | | 5.850% 02/25/32 (d) | | 3,492,070 | | 1,661,393 |
| | 6.899% 03/25/31 (d) | | 1,022,760 | | 520,525 |
| | | |
| First Alliance Mortgage Loan Trust | | 8.225% 09/20/27 | | 166,359 | | 147,277 |
| | | |
| Green Tree Financial Corp. | | 7.850% 08/15/25 (d) | | 9,100,000 | | 8,601,474 |
| | | |
| Harley-Davidson Motorcycle Trust | | 5.540% 04/15/15 | | 1,700,000 | | 1,183,179 |
| | | |
| JPMorgan Mortgage Acquisition Corp. | | 5.784% 01/25/37 | | 5,740,000 | | 3,904,290 |
| | | |
| MBNA Credit Card Master Note Trust | | 4.450% 08/15/16 (f) | | 5,000,000 | | 4,274,522 |
| | | |
| Residential Asset Securities Corp. | | 6.656% 04/25/32 (d) | | 1,838,691 | | 1,599,561 |
| | | |
| Wachovia Auto Loan Owner Trust | | 5.650% 02/20/13 | | 3,800,000 | | 3,571,674 |
| | | | | | |
| | Total Asset-Backed Securities
(cost of $31,871,082) | | | | 25,463,895 |
| | | | | | |
| Collateralized Mortgage Obligations – 2.2% | | | | |
| | | | | | |
| Agency – 1.4% | | | | |
| Federal Home Loan Mortgage Corp. | | 6.000% 05/15/29 | | 8,812,000 | | 9,033,631 |
| | I.O.: | | | | |
| | 5.500% 05/15/27 (g) | | 198,541 | | 10,792 |
| | | |
| Vendee Mortgage Trust | | | | | | |
| | I.O.: | | | | |
| | 0.304% 03/15/29 (d)(g) | | 6,476,562 | | 74,613 |
| | 0.440% 03/15/28 (d)(g) | | 5,287,451 | | 82,860 |
| | | | | | |
| | Agency Total | | | | 9,201,896 |
See Accompanying Notes to Financial Statements.
21
Columbia Federal Securities Fund
August 31, 2008
Collateralized Mortgage Obligations (continued)
| | | | | | | |
| | | | | Par ($) | | Value ($) | |
| Non-Agency – 0.8% | | | | | |
| Countrywide Home Loans, Inc. | | 6.000% 01/25/33 | | 2,120,275 | | 2,005,037 | |
| | | |
| First Horizon Asset Securities, Inc. | | 5.132% 10/25/33 (d) | | 1,723,992 | | 1,194,100 | |
| | | |
| Nomura Asset Acceptance Corp. | | 6.664% 05/25/36 | | 1,220,000 | | 61,549 | |
| | | |
| Residential Funding Mortgage Securities, Inc. | | 6.500% 03/25/32 | | 971,334 | | 861,812 | |
| | 6.500% 03/25/32 | | 728,501 | | 606,166 | |
| | | |
| Tryon Mortgage Funding, Inc. | | 7.500% 02/20/27 | | 24,381 | | 24,393 | |
| | | |
| Washington Mutual Mortgage Loan Trust | | 3.772% 01/25/40 (d) | | 810,057 | | 800,928 | |
| | | | | | | |
| | Non-Agency Total | | | | 5,553,985 | |
| | Total Collateralized Mortgage Obligations
(cost of $16,415,028) | | | | 14,755,881 | |
| | | | | | | |
| Commercial Mortgage-Backed Securities – 0.1% | | | | | |
| Merrill Lynch Mortgage Investors, Inc. | | I.O.: | | | | | |
| | 0.880% 12/15/30 (d)(g) | | 5,058,246 | | 58,071 | |
| | | |
| PNC Mortgage Acceptance Corp. | | | | | | | |
| | 5.910% 03/12/34 | | 713,829 | | 715,971 | |
| | | | | | | |
| | Total Commercial Mortgage-Backed Securities
(cost of $890,607) | | | | 774,042 | |
| | | | | | | |
| | | | | Shares | | | |
| Securities Lending Collateral – 28.1% | |
| | State Street Navigator Securities Lending Prime Portfolio (7 day yield of 2.626%) (h) | | 186,417,645 | | 186,417,645 | |
| | | | | | | |
| | Total Securities Lending Collateral
(cost of $186,417,645) | | | | 186,417,645 | |
| | | | | | | |
| | | | | Par ($) | | | |
| Short-Term Obligation – 9.1% | | | | | |
| | Repurchase agreement with Fixed Income Clearing Corp., dated 08/29/08, due 09/02/08 at 2.000%, collateralized by a U.S. Government Agency Obligation maturing 01/29/13, market value of $61,364,180 (repurchase proceeds $60,171,368) | | 60,158,000 | | 60,158,000 | |
| | | | | | | |
| | Total Short-Term Obligation (cost of $60,158,000) | | 60,158,000 | |
| | | |
| | | | | | | |
| | Total Investments – 138.5% (cost of $911,100,510) (i) | | 918,765,470 | |
| | | |
| | | | | | | |
| | Obligation to Return Collateral for Securities Loaned – (28.1)% | | (186,417,645 | ) |
| | | |
| | | | | | | |
| | Other Assets & Liabilities, Net – (10.4)% | | | | (69,070,041 | ) |
| | | |
| | | | | | | |
| | Net Assets – 100.0% | | | | 663,277,784 | |
See Accompanying Notes to Financial Statements.
22
Columbia Federal Securities Fund
August 31, 2008
Notes to Investment Portfolio:
| | (a) | All or a portion of this security was on loan at August 31, 2008. The total market value of securities on loan at August 31, 2008 is $182,270,290. |
| | (b) | A portion of this security with a market value of $1,701,797 is pledged as collateral for open futures contracts. |
| | (d) | The interest rate shown on floating rate or variable rate securities reflects the rate at August 31, 2008. |
| | (e) | Security purchased on a delayed delivery basis. |
| | (f) | Investment in affiliate during the year ended August 31, 2008: Security name: MBNA Credit Card Master Note Trust, 4.450% 08/15/16 |
| | | |
Par as of 08/31/07: | | $ | 5,000,000 |
Par purchased: | | $ | — |
Par sold: | | $ | — |
Par as of 08/31/08: | | $ | 5,000,000 |
Net realized gain/loss: | | $ | — |
Interest income earned: | | $ | 222,500 |
Value at end of period: | | $ | 4,274,522 |
| | (g) | Accrued interest accumulates in the value of this security and is payable at redemption. |
| | (h) | Investment made with cash collateral received from securities lending activity. |
| | (i) | Cost for federal income tax purposes is $913,671,397. |
At August 31, 2008, the Fund held the following open long futures contracts:
| | | | | | | | | | | | | | |
Type | | Number of Contracts | | Value | | Aggregate Face Value | | Expiration Date | | Unrealized
Depreciation | |
10-Year U.S. Treasury Notes | | 196 | | $ | 22,638,000 | | $ | 22,655,481 | | Dec-08 | | $ | (17,481 | ) |
5-Year U.S. Treasury Notes | | 473 | | | 52,946,438 | | | 52,959,061 | | Dec-08 | | | (12,623 | ) |
2-Year U.S. Treasury Notes | | 23 | | | 4,882,469 | | | 4,885,419 | | Dec-08 | | | (2,950 | ) |
| | | | | | | | | | | | | | |
| | | | | | | | | | | | | $(33,054) | |
| | | | | | | | | | | | | | |
At August 31, 2008, the Fund held the following open short futures contracts:
| | | | | | | | | | |
Type | | Number of
Contracts | | Value | | Aggregate
Face Value | | Expiration
Date | | Unrealized
Appreciation |
U.S. Treasury Bonds | | 267 | | $31,322,438 | | $31,488,445 | | Dec-08 | | $166,007 |
| | | | | | | | | | |
| | | | | | | | | | $166,007 |
| | | | | | | | | | |
At August 31, 2008, the asset allocation of the Fund is as follows:
| | | |
Asset Allocation (Unaudited) | | % of Net Assets | |
Government & Agency Obligations | | 48.4 | |
Mortgage-Backed Securities | | 46.8 | |
Asset-Backed Securities | | 3.8 | |
Collateralized Mortgage Obligations | | 2.2 | |
Commercial Mortgage-Backed Securities | | 0.1 | |
| | | |
| | 101.3 | |
Securities Lending Collateral | | 28.1 | |
Short-Term Obligation | | 9.1 | |
Obligation to Return Collateral for Securities Loaned | | (28.1 | ) |
Other Assets & Liabilities, Net | | (10.4 | ) |
| | | |
| | 100.0 | |
| | | |
| | |
Acronym | | Name |
| I.O. | | Interest Only |
| STRIPS | | Separate Trading of Registered Interest and Principal of Securities |
| TBA | | To Be Announced |
See Accompanying Notes to Financial Statements.
23
Statement of Assets and Liabilities – Columbia Federal Securities Fund
August 31, 2008
| | | | | |
| | | | | ($) | |
| Assets | | Unaffiliated investments, at cost (including repurchase agreement) | | 906,115,510 | |
| | Affiliated investments, at cost | | 4,985,000 | |
| | | | | |
| | Total investments, at cost | | 911,100,510 | |
| | Unaffiliated investments, at value (including securities on loan of $182,270,290) | | 914,490,948 | |
| | Affiliated investments, at value | | 4,274,522 | |
| | | | | |
| | Total investments, at value | | 918,765,470 | |
| | Cash | | 604 | |
| | Receivable for: | | | |
| | Fund shares sold | | 120,910 | |
| | Interest | | 2,904,993 | |
| | Securities lending income | | 85,418 | |
| | Dollar roll income | | 4,215 | |
| | Futures variation margin | | 164,859 | |
| | Trustees’ deferred compensation plan | | 93,336 | |
| | Other assets | | 176,690 | |
| | | |
| | Total Assets | | 922,316,495 | |
| | |
| Liabilities | | Collateral on securities loaned | | 186,417,645 | |
| | Payable for: | | | |
| | Investments purchased on a delayed delivery basis | | 70,451,843 | |
| | Fund shares repurchased | | 432,409 | |
| | Distributions | | 852,366 | |
| | Futures variation margin | | 36,750 | |
| | Investment advisory fee | | 290,306 | |
| | Transfer agent fee | | 101,191 | |
| | Pricing and bookkeeping fees | | 26,131 | |
| | Trustees’ fees | | 53,750 | |
| | Custody fee | | 20,853 | |
| | Distribution and service fees | | 156,368 | |
| | Chief compliance officer expenses | | 111 | |
| | Trustees’ deferred compensation plan | | 93,336 | |
| | Other liabilities | | 105,652 | |
| | | |
| | Total Liabilities | | 259,038,711 | |
| |
| | | |
| | Net Assets | | 663,277,784 | |
| | |
| Net Assets Consist of | | Paid-in capital | | 712,009,716 | |
| | Overdistributed net investment income | | (1,882,825 | ) |
| | Accumulated net realized loss | | (54,647,020 | ) |
| | Net unrealized appreciation on: | | | |
| | Investments | | 7,664,960 | |
| | Futures contracts | | 132,953 | |
| | | |
| | Net Assets | | 663,277,784 | |
See Accompanying Notes to Financial Statements.
24
Statement of Assets and Liabilities (continued) – Columbia Federal Securities Fund
August 31, 2008
| | | | | | |
| | | | | | |
| Class A | | Net assets | | $ | 549,202,974 | |
| | Shares outstanding | | | 52,471,406 | |
| | Net asset value per share | | $ | 10.47 | (a) |
| | Maximum sales charge | | | 4.75 | % |
| | Maximum offering price per share | | $ | 10.99 | (b) |
| | |
| Class B | | Net assets | | $ | 34,716,448 | |
| | Shares outstanding | | | 3,316,863 | |
| | Net asset value and offering price per share | | $ | 10.47 | (a) |
| | |
| Class C | | Net assets | | $ | 8,864,992 | |
| | Shares outstanding | | | 846,983 | |
| | Net asset value and offering price per share | | $ | 10.47 | (a) |
| | |
| Class Z | | Net assets | | $ | 70,493,370 | |
| | Shares outstanding | | | 6,734,992 | |
| | Net asset value, offering and redemption price per share | | $ | 10.47 | |
| (a) | Redemption price per share is equal to net asset value less any applicable contingent deferred sales charge. |
| (b) | On sales of $50,000 or more the offering price is reduced. |
See Accompanying Notes to Financial Statements.
25
Statement of Operations – Columbia Federal Securities Fund
For the Year Ended August 31, 2008
| | | | | |
| | | | | ($) | |
| Investment Income | | Interest | | 34,737,768 | |
| | Interest from affiliates | | 222,500 | |
| | Dollar roll fee income | | 1,143,760 | |
| | Securities lending income | | 1,333,093 | |
| | | |
| | Total Investment Income | | 37,437,121 | |
| | |
| Expenses | | Investment advisory fee | | 3,631,821 | |
| | Distribution fee: | | | |
| | Class B | | 297,368 | |
| | Class C | | 51,524 | |
| | Service fee: | | | |
| | Class A | | 1,432,061 | |
| | Class B | | 99,123 | |
| | Class C | | 34,396 | |
| | Transfer agent fee | | 762,486 | |
| | Pricing and bookkeeping fees | | 246,849 | |
| | Trustees’ fees | | 41,938 | |
| | Custody fee | | 120,909 | |
| | Chief compliance officer expenses | | 712 | |
| | Prepaid insurance | | 22,728 | |
| | Other expenses | | 324,056 | |
| | | |
| | Total Expenses | | 7,065,971 | |
| | |
| | Fees waived by Distributor – Class C | | (12,928 | ) |
| | Expense reductions | | (23,831 | ) |
| | | |
| | Net Expenses | | 7,029,212 | |
| |
| | | |
| | Net Investment Income | | 30,407,909 | |
| | |
| Net Realized and Unrealized Gain (Loss) on Investments and Futures Contracts | | Net realized gain (loss) on: | | | |
| | Investments | | (3,378,384 | ) |
| | Futures contracts | | 11,156,425 | |
| | | |
| | Net realized gain | | 7,778,041 | |
| | |
| | Net change in unrealized appreciation (depreciation) on: | | | |
| | Investments | | 4,661,480 | |
| | Futures contracts | | (426,394 | ) |
| | | |
| | Net change in unrealized appreciation | | 4,235,086 | |
| | | |
| | Net Gain | | 12,013,127 | |
| |
| | | |
| | Net Increase Resulting from Operations | | 42,421,036 | |
See Accompanying Notes to Financial Statements.
26
Statement of Changes in Net Assets – Columbia Federal Securities Fund
| | | | | | |
| Increase (Decrease) in Net Assets | | Year
Ended
August 31,
2008 ($) | | | Year
Ended
August 31,
2007 ($) | |
Operations | | | | | | |
Net investment income | | 30,407,909 | | | 35,188,975 | |
Net realized gain (loss) on investments and futures contracts | | 7,778,041 | | | (1,342,053 | ) |
Net change in unrealized appreciation (depreciation) on investments and futures contracts | | 4,235,086 | | | (3,759,514 | ) |
| | | | | | |
Net Increase Resulting from Operations | | 42,421,036 | | | 30,087,408 | |
| | |
Distributions to Shareholders | | | | | | |
From net investment income: | | | | | | |
Class A | | (25,018,770 | ) | | (27,641,171 | ) |
Class B | | (1,434,983 | ) | | (1,979,571 | ) |
Class C | | (323,241 | ) | | (287,481 | ) |
Class Z | | (3,855,707 | ) | | (5,166,731 | ) |
Return of capital: | | | | | | |
Class A | | — | | | (218,143 | ) |
Class B | | — | | | (23,510 | ) |
Class C | | — | | | (2,668 | ) |
Class Z | | — | | | (31,222 | ) |
| | | | | | |
Total Distributions to Shareholders | | (30,632,701 | ) | | (35,350,497 | ) |
Net Increase (Decrease) from Share Transactions | | (93,534,106 | ) | | (98,311,455 | ) |
Total Decrease in Net Assets | | (81,745,771 | ) | | (103,574,544 | ) |
| | |
Net Assets | | | | | | |
Beginning of period | | 745,023,555 | | | 848,598,099 | |
End of period | | 663,277,784 | | | 745,023,555 | |
Overdistributed net investment income, at end of period | | (1,882,825 | ) | | (2,173,944 | ) |
See Accompanying Notes to Financial Statements.
27
Statement of Changes in Net Assets – Capital Stock Activity
| | | | | | | | | | | | | | |
| | | Columbia Federal Securities Fund | |
| | | Year Ended
August 31, 2008 | | | | | Year Ended
August 31, 2007 | |
| | | Shares | | | Dollars ($) | | | | | Shares | | | Dollars ($) | |
Changes in Shares | | | | | | | | | | | | | | |
Class A | | | | | | | | | | | | | | |
Subscriptions | | 2,227,145 | | | 23,586,061 | | | | | 1,919,059 | | | 19,878,507 | |
Distributions reinvested | | 1,657,646 | | | 17,432,337 | | | | | 1,825,566 | | | 18,946,197 | |
Redemptions | | (8,589,620 | ) | | (90,278,887 | ) | | | | (10,685,537 | ) | | (110,824,949 | ) |
| | | | | | | | | | | | | | |
Net Decrease | | (4,704,829 | ) | | (49,260,489 | ) | | | | (6,940,912 | ) | | (72,000,245 | ) |
| | | | | |
Class B | | | | | | | | | | | | | | |
Subscriptions | | 557,421 | | | 5,926,478 | | | | | 281,351 | | | 2,909,620 | |
Distributions reinvested | | 111,320 | | | 1,170,699 | | | | | 156,713 | | | 1,627,310 | |
Redemptions | | (1,655,664 | ) | | (17,401,449 | ) | | | | (2,485,102 | ) | | (25,760,066 | ) |
| | | | | | | | | | | | | | |
Net Decrease | | (986,923 | ) | | (10,304,272 | ) | | | | (2,047,038 | ) | | (21,223,136 | ) |
| | | | | |
Class C | | | | | | | | | | | | | | |
Subscriptions | | 493,239 | | | 5,221,115 | | | | | 154,096 | | | 1,599,821 | |
Distributions reinvested | | 21,327 | | | 224,441 | | | | | 21,701 | | | 225,265 | |
Redemptions | | (351,910 | ) | | (3,700,058 | ) | | | | (284,752 | ) | | (2,954,789 | ) |
| | | | | | | | | | | | | | |
Net Increase (Decrease) | | 162,656 | | | 1,745,498 | | | | | (108,955 | ) | | (1,129,703 | ) |
| | | | | |
Class Z | | | | | | | | | | | | | | |
Subscriptions | | 1,983,908 | | | 20,660,872 | | | | | 3,009,819 | | | 31,175,281 | |
Distributions reinvested | | 77,044 | | | 805,807 | | | | | 187,530 | | | 1,945,362 | |
Redemptions | | (5,468,486 | ) | | (57,181,522 | ) | | | | (3,577,774 | ) | | (37,079,014 | ) |
| | | | | | | | | | | | | | |
Net Decrease | | (3,407,534 | ) | | (35,714,843 | ) | | | | (380,425 | ) | | (3,958,371 | ) |
See Accompanying Notes to Financial Statements.
28
Financial Highlights – Columbia Federal Securities Fund
Selected data for a share outstanding throughout each period is as follows:
| | | | | | | | | | | | | | | | | | | | |
| Class A Shares | | | | | | | | | | | | | | | |
| | | Year Ended August 31, | |
| | | 2008 | | | 2007 | | | 2006 | | | 2005 | | | 2004 | |
Net Asset Value, Beginning of Period | | $ | 10.30 | | | $ | 10.38 | | | $ | 10.73 | | | $ | 10.75 | | | $ | 10.60 | |
| | | | | |
Income from Investment Operations: | | | | | | | | | | | | | | | | | | | | |
Net investment income (a) | | | 0.46 | | | | 0.46 | | | | 0.44 | | | | 0.41 | | | | 0.44 | |
Net realized and unrealized gain (loss) on investments and futures contracts | | | 0.17 | | | | (0.08 | ) | | | (0.32 | ) | | | — | (b) | | | 0.13 | |
| | | | | | | | | | | | | | | | | | | | |
Total from Investment Operations | | | 0.63 | | | | 0.38 | | | | 0.12 | | | | 0.41 | | | | 0.57 | |
| | | | | |
Less Distributions to Shareholders: | | | | | | | | | | | | | | | | | | | | |
From net investment income | | | (0.46 | ) | | | (0.46 | ) | | | (0.46 | ) | | | (0.43 | ) | | | (0.42 | ) |
From return of capital | | | — | | | | — | (b) | | | (0.01 | ) | | | — | | | | — | |
| | | | | | | | | | | | | | | | | | | | |
Total Distributions to Shareholders | | | (0.46 | ) | | | (0.46 | ) | | | (0.47 | ) | | | (0.43 | ) | | | (0.42 | ) |
| | | | | |
Net Asset Value, End of Period | | $ | 10.47 | | | $ | 10.30 | | | $ | 10.38 | | | $ | 10.73 | | | $ | 10.75 | |
Total return (c) | | | 6.18 | % | | | 3.73 | %(d) | | | 1.07 | %(d) | | | 3.91 | % | | | 5.49 | % |
| | | | | |
Ratios to Average Net Assets/Supplemental Data: | | | | | | | | | | | | | | | | | | | | |
Net expenses (e) | | | 0.98 | % | | | 0.95 | % | | | 0.97 | % | | | 1.08 | % | | | 1.16 | % |
Waiver/Reimbursement | | | — | | | | 0.02 | % | | | 0.01 | % | | | — | | | | — | |
Net investment income (e) | | | 4.33 | % | | | 4.43 | % | | | 4.24 | % | | | 3.87 | % | | | 4.11 | % |
Portfolio turnover rate (f) | | | 135 | % | | | 121 | % | | | 92 | % | | | 80 | % | | | 93 | % |
Net assets, end of period (000’s) | | $ | 549,203 | | | $ | 589,124 | | | $ | 665,283 | | | $ | 754,026 | | | $ | 853,801 | |
| (a) | Per share data was calculated using the average shares outstanding during the period. |
| (b) | Rounds to less than $0.01 per share. |
| (c) | Total return at net asset value assuming all distributions reinvested and no initial sales charge or contingent deferred sales charge. |
| (d) | Had the investment advisor and/or any of its affiliates not waived fees or reimbursed a portion of its expenses, total return would have been reduced. |
| (e) | The benefits derived from expense reductions had an impact of less than 0.01% except for the year ended August 31, 2007 which had a 0.01% impact. |
| (f) | Portfolio turnover excludes dollar roll transactions. |
See Accompanying Notes to Financial Statements.
29
Financial Highlights – Columbia Federal Securities Fund
Selected data for a share outstanding throughout each period is as follows:
| | | | | | | | | | | | | | | | | | | | |
| Class B Shares | | | | | | | | | | | | | | | |
| | | Year Ended August 31, | |
| | | 2008 | | | 2007 | | | 2006 | | | 2005 | | | 2004 | |
Net Asset Value, Beginning of Period | | $ | 10.30 | | | $ | 10.38 | | | $ | 10.73 | | | $ | 10.75 | | | $ | 10.60 | |
| | | | | |
Income from Investment Operations: | | | | | | | | | | | | | | | | | | | | |
Net investment income (a) | | | 0.38 | | | | 0.38 | | | | 0.36 | | | | 0.33 | | | | 0.36 | |
Net realized and unrealized gain (loss) on investments and futures contracts | | | 0.17 | | | | (0.08 | ) | | | (0.32 | ) | | | — | (b) | | | 0.13 | |
| | | | | | | | | | | | | | | | | | | | |
Total from Investment Operations | | | 0.55 | | | | 0.30 | | | | 0.04 | | | | 0.33 | | | | 0.49 | |
| | | | | |
Less Distributions to Shareholders: | | | | | | | | | | | | | | | | | | | | |
From net investment income | | | (0.38 | ) | | | (0.38 | ) | | | (0.38 | ) | | | (0.35 | ) | | | (0.34 | ) |
From return of capital | | | — | | | | — | (b) | | | (0.01 | ) | | | — | | | | — | |
| | | | | | | | | | | | | | | | | | | | |
Total Distributions to Shareholders | | | (0.38 | ) | | | (0.38 | ) | | | (0.39 | ) | | | (0.35 | ) | | | (0.34 | ) |
| | | | | |
Net Asset Value, End of Period | | $ | 10.47 | | | $ | 10.30 | | | $ | 10.38 | | | $ | 10.73 | | | $ | 10.75 | |
Total return (c) | | | 5.39 | % | | | 2.96 | %(d) | | | 0.32 | %(d) | | | 3.13 | % | | | 4.71 | % |
| | | | | |
Ratios to Average Net Assets/Supplemental Data: | | | | | | | | | | | | | | | | | | | | |
Net expenses (e) | | | 1.73 | % | | | 1.70 | % | | | 1.72 | % | | | 1.83 | % | | | 1.91 | % |
Waiver/Reimbursement | | | — | | | | 0.02 | % | | | 0.01 | % | | | — | | | | — | |
Net investment income (e) | | | 3.59 | % | | | 3.68 | % | | | 3.49 | % | | | 3.12 | % | | | 3.41 | % |
Portfolio turnover rate (f) | | | 135 | % | | | 121 | % | | | 92 | % | | | 80 | % | | | 93 | % |
Net assets, end of period (000’s) | | $ | 34,716 | | | $ | 44,345 | | | $ | 65,896 | | | $ | 69,452 | | | $ | 96,527 | |
| (a) | Per share data was calculated using the average shares outstanding during the period. |
| (b) | Rounds to less than $0.01 per share. |
| (c) | Total return at net asset value assuming all distributions reinvested and no contingent deferred sales charge. |
| (d) | Had the investment advisor and/or any of its affiliates not waived fees or reimbursed a portion of its expenses, total return would have been reduced. |
| (e) | The benefits derived from expense reductions had an impact of less than 0.01% except for the year ended August 31, 2007 which had a 0.01% impact. |
| (f) | Portfolio turnover excludes dollar roll transactions. |
See Accompanying Notes to Financial Statements.
30
Financial Highlights – Columbia Federal Securities Fund
Selected data for a share outstanding throughout each period is as follows:
| | | | | | | | | | | | | | | | | | | | |
| Class C Shares | | | | | | | | | | | | | | | |
| | | Year Ended August 31, | |
| | | 2008 | | | 2007 | | | 2006 | | | 2005 | | | 2004 | |
Net Asset Value, Beginning of Period | | $ | 10.30 | | | $ | 10.38 | | | $ | 10.73 | | | $ | 10.75 | | | $ | 10.60 | |
| | | | | |
Income from Investment Operations: | | | | | | | | | | | | | | | | | | | | |
Net investment income (a) | | | 0.39 | | | | 0.40 | | | | 0.38 | | | | 0.35 | | | | 0.38 | |
Net realized and unrealized gain (loss) on investments and futures contracts | | | 0.18 | | | | (0.08 | ) | | | (0.33 | ) | | | — | (b) | | | 0.13 | |
| | | | | | | | | | | | | | | | | | | | |
Total from Investment Operations | | | 0.57 | | | | 0.32 | | | | 0.05 | | | | 0.35 | | | | 0.51 | |
| | | | | |
Less Distributions to Shareholders: | | | | | | | | | | | | | | | | | | | | |
From net investment income | | | (0.40 | ) | | | (0.40 | ) | | | (0.39 | ) | | | (0.37 | ) | | | (0.36 | ) |
From return of capital | | | — | | | | — | (b) | | | (0.01 | ) | | | — | | | | — | |
| | | | | | | | | | | | | | | | | | | | |
Total Distributions to Shareholders | | | (0.40 | ) | | | (0.40 | ) | | | (0.40 | ) | | | (0.37 | ) | | | (0.36 | ) |
| | | | | |
Net Asset Value, End of Period | | $ | 10.47 | | | $ | 10.30 | | | $ | 10.38 | | | $ | 10.73 | | | $ | 10.75 | |
Total return (c)(d) | | | 5.54 | % | | | 3.11 | % | | | 0.47 | % | | | 3.29 | % | | | 4.86 | % |
| | | | | |
Ratios to Average Net Assets/Supplemental Data: | | | | | | | | | | | | | | | | | | | | |
Net expenses (e) | | | 1.58 | % | | | 1.55 | % | | | 1.57 | % | | | 1.68 | % | | | 1.76 | % |
Waiver/Reimbursement | | | 0.15 | % | | | 0.17 | % | | | 0.16 | % | | | 0.15 | % | | | 0.15 | % |
Net investment income (e) | | | 3.73 | % | | | 3.83 | % | | | 3.65 | % | | | 3.27 | % | | | 3.60 | % |
Portfolio turnover rate (f) | | | 135 | % | | | 121 | % | | | 92 | % | | | 80 | % | | | 93 | % |
Net assets, end of period (000’s) | | $ | 8,865 | | | $ | 7,051 | | | $ | 8,231 | | | $ | 8,547 | | | $ | 10,630 | |
| (a) | Per share data was calculated using the average shares outstanding during the period. |
| (b) | Rounds to less than $0.01 per share. |
| (c) | Total return at net asset value assuming all distributions reinvested and no contingent deferred sales charge. |
| (d) | Had the investment advisor and/or any of its affiliates not waived fees or reimbursed a portion of its expenses, total return would have been reduced. |
| (e) | The benefits derived from expense reductions had an impact of less than 0.01% except for the year ended August 31, 2007 which had a 0.01% impact. |
| (f) | Portfolio turnover excludes dollar roll transactions. |
See Accompanying Notes to Financial Statements.
31
Financial Highlights – Columbia Federal Securities Fund
Selected data for a share outstanding throughout each period is as follows:
| | | | | | | | | | | | | | | | | | | | |
| Class Z Shares | | | | | | | | | | | | | | | |
| | | Year Ended August 31, | |
| | | 2008 | | | 2007 | | | 2006 | | | 2005 | | | 2004 | |
Net Asset Value, Beginning of Period | | $ | 10.30 | | | $ | 10.38 | | | $ | 10.73 | | | $ | 10.75 | | | $ | 10.60 | |
| | | | | |
Income from Investment Operations: | | | | | | | | | | | | | | | | | | | | |
Net investment income (a) | | | 0.48 | | | | 0.48 | | | | 0.46 | | | | 0.44 | | | | 0.46 | |
Net realized and unrealized gain (loss) on investments and futures contracts | | | 0.18 | | | | (0.07 | ) | | | (0.32 | ) | | | — | (b) | | | 0.14 | |
| | | | | | | | | | | | | | | | | | | | |
Total from Investment Operations | | | 0.66 | | | | 0.41 | | | | 0.14 | | | | 0.44 | | | | 0.60 | |
| | | | | |
Less Distributions to Shareholders: | | | | | | | | | | | | | | | | | | | | |
From net investment income | | | (0.49 | ) | | | (0.49 | ) | | | (0.48 | ) | | | (0.46 | ) | | | (0.45 | ) |
From return of capital | | | — | | | | — | (b) | | | (0.01 | ) | | | — | | | | — | |
| | | | | | | | | | | | | | | | | | | | |
Total Distributions to Shareholders | | | (0.49 | ) | | | (0.49 | ) | | | (0.49 | ) | | | (0.46 | ) | | | (0.45 | ) |
| | | | | |
Net Asset Value, End of Period | | $ | 10.47 | | | $ | 10.30 | | | $ | 10.38 | | | $ | 10.73 | | | $ | 10.75 | |
Total return (c) | | | 6.45 | % | | | 3.99 | %(d) | | | 1.33 | %(d) | | | 4.16 | % | | | 5.75 | % |
| | | | | |
Ratios to Average Net Assets/Supplemental Data: | | | | | | | | | | | | | | | | | | | | |
Net expenses (e) | | | 0.73 | % | | | 0.70 | % | | | 0.72 | % | | | 0.83 | % | | | 0.91 | % |
Waiver/Reimbursement | | | — | | | | 0.02 | % | | | 0.01 | % | | | — | | | | — | |
Net investment income (e) | | | 4.58 | % | | | 4.68 | % | | | 4.51 | % | | | 4.12 | % | | | 4.30 | % |
Portfolio turnover rate (f) | | | 135 | % | | | 121 | % | | | 92 | % | | | 80 | % | | | 93 | % |
Net assets, end of period (000’s) | | $ | 70,493 | | | $ | 104,504 | | | $ | 109,187 | | | $ | 39,680 | | | $ | 29,848 | |
| (a) | Per share data was calculated using the average shares outstanding during the period. |
| (b) | Rounds to less than $0.01 per share. |
| (c) | Total return at net asset value assuming all distributions reinvested. |
| (d) | Had the investment advisor and/or any of its affiliates not waived fees or reimbursed a portion of its expenses, total return would have been reduced. |
| (e) | The benefits derived from expense reductions had an impact of less than 0.01% except for the year ended August 31, 2007 which had a 0.01% impact. |
| (f) | Portfolio turnover excludes dollar roll transactions. |
See Accompanying Notes to Financial Statements.
32
Notes to Financial Statements – Columbia Federal Securities Fund
August 31, 2008
Note 1. Organization
Columbia Federal Securities Fund (the “Fund”), a series of Columbia Funds Series Trust I (the “Trust”), is a diversified portfolio. The Trust is a Massachusetts business trust registered under the Investment Company Act of 1940, as amended, as an open-end management investment company.
Investment Objective
The Fund seeks total return, consisting of current income and capital appreciation.
Fund Shares
The Trust may issue an unlimited number of shares, and the Fund offers four classes of shares: Class A, Class B, Class C and Class Z. Each share class has its own expense structure and sales charges, as applicable.
Class A shares are subject to a maximum front-end sales charge of 4.75% based on the amount of initial investment. Class A shares purchased without an initial sales charge in accounts aggregating $1 million to $50 million at the time of purchase are subject to a 1.00% contingent deferred sales charge (“CDSC”) if the shares are sold within one year after purchase. Class B shares are subject to a maximum CDSC of 5.00% based upon the holding period after purchase. Class B shares will convert to Class A shares eight years after purchase. Class C shares are subject to a 1.00% CDSC on shares sold within one year after purchase. Class Z shares are offered continuously at net asset value. There are certain restrictions on the purchase of Class Z shares, as described in the Fund’s prospectus.
Note 2. Significant Accounting Policies
The preparation of financial statements in accordance with accounting principles generally accepted in the United States of America (“GAAP”) requires management to make certain estimates and assumptions that affect the reported amounts of assets and liabilities, the disclosure of contingent assets and liabilities at the date of the financial statements and the reported amounts of revenue and expenses during the reporting period. Actual results could differ from those estimates. The following is a summary of significant accounting policies consistently followed by the Fund in the preparation of its financial statements.
Security Valuation
Debt securities generally are valued by pricing services approved by the Trust’s Board of Trustees, based upon market transactions for normal, institutional-size trading units of similar securities. The services may use various pricing techniques which take into account appropriate factors such as yield, quality, coupon rate, maturity, type of issue, trading characteristics and other data, as well as broker quotes. Debt securities for which quotations are readily available are valued at an over-the-counter or exchange bid quotation. Certain debt securities, which tend to be more thinly traded and of lesser quality, are priced based on fundamental analysis of the financial condition of the issuer and the estimated value of any collateral. Valuations developed through pricing techniques may vary from the actual amounts realized upon sale of the securities, and the potential variation may be greater for those securities valued using fundamental analysis.
Short-term debt obligations maturing within 60 days are valued at amortized cost, which approximates market value.
Futures contracts are valued at the settlement price established each day by the board of trade or exchange on which they are traded.
Investments for which market quotations are not readily available, or that have quotations which Columbia believes are not reliable, are valued at fair value as determined in good faith under consistently applied procedures established by and under the general supervision of the Board of Trustees. If a security is valued at fair value, such value is likely to be different from the last quoted market price for the security.
In September 2006, Statement of Financial Accounting Standards No. 157, Fair Value Measurements (“SFAS 157”), was issued. SFAS 157 is effective for fiscal years beginning after November 15, 2007. SFAS 157 defines fair value, establishes a framework for measuring fair value and expands disclosures about fair value measurements. Management is evaluating the impact the application of SFAS 157 will have on the Fund’s financial statement disclosures.
Security Transactions
Security transactions are accounted for on the trade date. Cost is determined and gains (losses) are based upon the specific identification method for both financial statement and federal income tax purposes.
33
Columbia Federal Securities Fund
August 31, 2008
In March 2008, Statement of Financial Accounting Standards No. 161, (“SFAS 161”), Disclosures about Derivative Instruments and Hedging Activities-an amendment of FASB Statement No. 133, was issued. SFAS 161 is effective for fiscal years and interim periods beginning after November 15, 2008. SFAS 161 requires additional discussion about the reporting entity’s derivative instruments and hedging activities, by providing for qualitative disclosures about the objectives and strategies for using derivatives, quantitative data about the fair value of and gains and losses on derivative contracts, and details of credit-risk-related contingent features in their hedged positions. Management is evaluating the impact the application of SFAS 161 will have on the Fund’s financial statement disclosures.
Futures Contracts
The Fund may invest in futures for both hedging and non-hedging purposes, including, for example, to seek to enhance returns or as a substitute for a position in an underlying asset.
The use of futures contracts involves certain risks, which include: (1) imperfect correlation between the price movement of the instruments and the underlying securities, (2) inability to close out positions due to differing trading hours, or the temporary absence of a liquid market, for either the instruments or the underlying securities, or (3) an inaccurate prediction by Columbia Management Advisors, LLC (“Columbia”), the Fund’s investment advisor, of the future direction of interest rates. Any of these risks may involve amounts exceeding the variation margin recorded in the Fund’s Statement of Assets and Liabilities at any given time.
Upon entering into a futures contract, the Fund pledges cash or securities with the broker in an amount sufficient to meet the initial margin requirement. Subsequent payments are made or received by the Fund equal to the daily change in the contract value and are recorded as variation margin receivable or payable and offset in unrealized gains or losses. The Fund recognizes a realized gain or loss when the contract is closed or expires.
Repurchase Agreements
The Fund may engage in repurchase agreement transactions with institutions that Columbia has determined are creditworthy. The Fund, through its custodian, receives delivery of the underlying securities collateralizing a repurchase agreement. Columbia is responsible for determining that the collateral is at least equal, at all times, to the value of the repurchase obligation including interest. A repurchase agreement transaction involves certain risks in the event of default or insolvency of the counterparty. These risks include possible delays or restrictions on the Fund’s ability to dispose of the underlying securities and a possible decline in the value of the underlying securities during the period while the Fund seeks to assert its rights.
Mortgage Dollar Roll Transactions
The Fund may enter into mortgage “dollar rolls” in which the Fund sells securities for delivery in the current month and simultaneously contracts with the same counterparty to repurchase similar (same type, coupon and maturity) but not identical securities on a specified future date not exceeding 120 days. During the roll period, the Fund loses the right to receive principal and interest paid on the securities sold. However, the Fund would benefit to the extent of any difference between the price received for the securities sold and the lower forward price for the future purchase (often referred to as the “drop”) or fee income plus the interest earned on the cash proceeds of the securities sold until the settlement date of the forward purchase. Unless such benefits exceed the income, capital appreciation and gain or loss due to mortgage prepayments that would have been realized on the securities sold as part of the mortgage dollar roll, the use of this technique will diminish the investment performance of the Fund compared with what such performance would have been without the use of mortgage dollar rolls. All cash proceeds will be invested in instruments that are permissible investments for the Fund. The Fund will hold and maintain in a segregated account until the settlement date, cash or liquid securities in an amount equal to the forward purchase price.
The Fund’s policy is to record the components of mortgage dollar rolls using “to be announced” mortgage-backed securities. For financial reporting and tax purposes, the Fund treats mortgage dollar rolls as two separate transactions, one involving the purchase of a security and a separate transaction involving a sale. The Fund does not currently enter into mortgage dollar rolls that are accounted for as financing transactions.
34
Columbia Federal Securities Fund
August 31, 2008
Mortgage dollar rolls involve certain risks. If the broker-dealer to whom the Fund sells the securities becomes insolvent, the Fund’s right to purchase or repurchase the mortgage-related securities may be restricted and the instruments which the Fund is required to repurchase may be worth less than instruments which the Fund originally held. Successful use of mortgage dollar rolls may depend upon the investment advisor’s ability to predict correctly interest rates and mortgage prepayments. For these reasons, there is no assurance that mortgage dollar rolls can be successfully employed.
Delayed Delivery Securities
The Fund may trade securities on other than normal settlement terms, including securities purchased or sold on a “when-issued” basis. This may increase the risk if the other party to the transaction fails to deliver and causes the Fund to subsequently invest at less advantageous prices. The Fund holds until the settlement date, in a segregated account, cash or liquid securities in an amount equal to the delayed delivery commitment.
Income Recognition
Interest income is recorded on an accrual basis and includes accretion of discounts, amortization of premiums and paydown gains and losses. Fee income attributable to mortgage dollar roll transactions is recorded on the accrual basis over the term of the transaction. The value of additional securities received as an income payment is recorded as income and as the cost basis of such securities.
Expenses
General expenses of the Trust are allocated to the Fund and the other series of the Trust based upon relative net assets or other expense allocation methodologies determined by the nature of the expense. Expenses directly attributable to the Fund are charged to the Fund.
Determination of Class Net Asset Value
All income, expenses (other than class-specific expenses, as shown on the Statement of Operations) and realized and unrealized gains (losses) are allocated to each class of the Fund on a daily basis for purposes of determining the net asset value of each class. Income and expenses are allocated to each class based on the settled shares method, while realized and unrealized gains (losses) are allocated based on the relative net assets of each class.
Federal Income Tax Status
The Fund intends to qualify each year as a “regulated investment company” under Subchapter M of the Internal Revenue Code, as amended, and will distribute substantially all of its taxable income, if any, for its tax year, and as such will not be subject to federal income taxes. In addition, the Fund intends to distribute in each calendar year substantially all of its net investment income, capital gains and certain other amounts, if any, such that the Fund should not be subject to federal excise tax. Therefore, no federal income or excise tax provision is recorded.
Distributions to Shareholders
Distributions of net investment income are declared daily and distributed monthly. Net realized capital gains, if any, are distributed at least annually. Income distributions and capital gain distributions are determined in accordance with federal income tax regulations which may differ from GAAP.
Indemnification
In the normal course of business, the Fund enters into contracts that contain a variety of representations and warranties and which provide general indemnities. The Fund’s maximum exposure under these arrangements is unknown because this would involve future claims against the Fund. Also, under the Trust’s organizational documents and by contract, the Trustees and officers of the Trust are indemnified against certain liabilities that may arise out of actions relating to their duties to the Trust. However, based on experience, the Fund expects the risk of loss due to these representations, warranties and indemnities to be minimal.
Note 3. Federal Tax Information
The timing and character of income and capital gain distributions are determined in accordance with income tax regulations, which may differ from GAAP. Reclassifications are made to the Fund’s capital accounts for permanent tax differences to reflect income and gains available for distribution (or available capital loss carryforwards) under income tax regulations.
For the year ended August 31, 2008, permanent book and tax basis differences resulting primarily from differing
35
Columbia Federal Securities Fund
August 31, 2008
treatments for amortization/accretion adjustments and paydown reclassifications were identified and reclassified among the components of the Fund’s net assets as follows:
| | | | |
| |
Overdistributed
Net Investment
Income | | Accumulated Net Realized Loss | | Paid-In Capital |
| $515,911 | | $31,668,026 | | $(32,183,937) |
Net investment income and net realized gains (losses), as disclosed on the Statement of Operations, and net assets were not affected by this reclassification.
The tax character of distributions paid during the years ended August 31, 2008 and August 31, 2007 was as follows:
| | | | | | |
| | | August 31, 2008 | | August 31, 2007 |
Ordinary Income* | | $ | 30,632,701 | | $ | 35,074,954 |
Return of Capital | | | — | | | 275,543 |
| * | For tax purposes short-term capital gains distributions, if any, are considered ordinary income distributions. |
As of August 31, 2008, the components of distributable earnings on a tax basis were as follows:
| | |
| | | |
| | | Net Unrealized
Appreciation* |
| | $5,094,073 |
| * | The differences between book-basis and tax-basis net unrealized appreciation are primarily due to deferral of losses from wash sales and amortization/accretion adjustments. |
Unrealized appreciation and depreciation at August 31, 2008, based on cost of investments for federal income tax purposes were:
| | | | |
| | | | |
Unrealized appreciation | | $ | 14,677,626 | |
Unrealized depreciation | | | (9,583,553 | ) |
Net unrealized appreciation | | $ | 5,094,073 | |
The following capital loss carryforwards may be available to reduce taxable income arising from future net realized gains on investments, if any, to the extent permitted by the Internal Revenue Code:
| | | |
| | | |
| Year of Expiration | | Capital Loss Carryforwards |
| 2009 | | $ | 29,849,094 |
| 2012 | | | 24,359 |
| 2014 | | | 10,286,822 |
| 2015 | | | 7,609,058 |
| Total | | $ | 47,769,333 |
Capital loss carryforwards of $8,098,805 were utilized during the year ended August 31, 2008.
Capital loss carryforwards of $31,784,259 expired during the year ended August 31, 2008. Expired capital loss carryforwards are recorded as a reduction of paid-in-capital.
Of the capital loss carry forwards attributable to the Fund, $24,359 (expiring on 08/31/12) remains from Nations Government Securities Fund’s merger with the Fund.
The Fund adopted Financial Accounting Standards Board (“FASB”) Interpretation No. 48, Accounting for Uncertainty in Income Taxes – an Interpretation of FASB Statement No. 109 (“FIN 48”) effective February 29, 2008. FIN 48 requires management to determine whether a tax position of the Fund is more likely than not to be sustained upon examination by the applicable taxing authority, including resolution of any related appeals or litigation processes, based on the technical merits of the position. The tax benefit to be recognized is measured as the largest amount of benefit that is greater than fifty percent likely of being realized upon ultimate settlement. Management has evaluated the known implications of FIN 48 on its computation of net assets for the Fund. As a result of this evaluation, management has concluded that FIN 48 did not have any effect on the Fund’s financial statements. However, management’s conclusions regarding FIN 48 may be subject to review and adjustment at a later date based on factors including, but not limited to, further implementation guidance from the FASB, new tax laws, regulations, and administrative interpretations (including relevant court decisions). The Fund’s federal tax returns for the prior three fiscal years remain subject to examination by the Internal Revenue Service. The Fund is not
36
Columbia Federal Securities Fund
August 31, 2008
aware of any tax positions for which it is reasonably possible that the total amounts of unrecognized tax benefits will significantly change in the next twelve months.
Note 4. Fees and Compensation Paid to Affiliates
Investment Advisory Fee
Columbia, an indirect, wholly owned subsidiary of Bank of America Corporation (“BOA”), provides investment advisory, administrative and other services to the Fund. Columbia receives a monthly investment advisory fee based on the Fund’s average daily net assets at the following annual rates:
| | | |
| | | | |
| Average Daily Net Assets | | Annual Fee Rate | |
First $500 million | | 0.53 | % |
$500 million to $1 billion | | 0.48 | % |
$1 billion to $1.5 billion | | 0.45 | % |
$1.5 billion to $3 billion | | 0.42 | % |
$3 billion to $6 billion | | 0.41 | % |
Over $6 billion | | 0.40 | % |
For the year ended August 31, 2008, the Fund’s effective investment advisory fee rate was 0.52% of the Fund’s average daily net assets.
Pricing and Bookkeeping Fees
The Fund has entered into a Financial Reporting Services Agreement (the “Financial Reporting Services Agreement”) with State Street Bank & Trust Company (“State Street”) and Columbia pursuant to which State Street provides financial reporting services to the Fund. The Fund has also entered into an Accounting Services Agreement (collectively with the Financial Reporting Services Agreement, the “State Street Agreements”) with State Street and Columbia pursuant to which State Street provides accounting services to the Fund. Under the State Street Agreements, the Fund pays State Street an annual fee of $38,000 paid monthly plus an additional monthly fee based on an annualized percentage rate of average daily net assets of the Fund for the month. The aggregate fee will not exceed $140,000 per year (exclusive of out-of-pocket expenses and charges). The Fund also reimburses State Street for certain out-of-pocket expenses and charges.
The Fund has entered into a Pricing and Bookkeeping Oversight and Services Agreement (the “Services Agreement”) with Columbia. Under the Services Agreement, Columbia provides services related to Fund expenses and the requirements of the Sarbanes-Oxley Act of 2002, and provides oversight of the accounting and financial reporting services provided by State Street. Under the Services Agreement, the Fund reimburses Columbia for out-of-pocket expenses. Prior to January 1, 2008, the Fund also reimbursed Columbia for accounting oversight services, services related to Fund expenses and the requirements of the Sarbanes-Oxley Act of 2002.
For the year ended August 31, 2008, the amount charged to the Fund by affiliates included on the Statement of Operations under “Pricing and bookkeeping fees” aggregated to $4,673.
Transfer Agent Fee
Columbia Management Services, Inc. (the “Transfer Agent”), an affiliate of Columbia and an indirect, wholly owned subsidiary of BOA, provides shareholder services to the Fund and has contracted with Boston Financial Data Services (“BFDS”) to serve as sub-transfer agent. The Transfer Agent is entitled to receive a fee for its services, paid monthly, at the annual rate of $17.34 per open account plus reimbursement of certain sub-transfer agent fees paid by the Transfer Agent (exclusive of BFDS fees), calculated based on assets held in omnibus accounts and intended to recover the cost of payments to other parties (including affiliates of BOA) for services to those accounts. Prior to November 1, 2007, the annual rate was $17.00 per open account. The Transfer Agent pays the fees of BFDS for services as sub-transfer agent and is not entitled to reimbursement for such fees from the Fund. The Transfer Agent may also retain, as additional compensation for its services, fees for wire, telephone and redemption orders, IRA trustee agent fees and account transcript fees due to the Transfer Agent from shareholders of the Fund and credits (net of bank charges) earned with respect to balances in accounts the Transfer Agent maintains in connection with its services to the Fund. The Transfer Agent also receives reimbursement for certain out-of-pocket expenses.
An annual minimum account balance fee of up to $20 may apply to certain accounts with a value below the Fund’s initial minimum investment requirements to reduce the impact of small accounts on transfer agent fees. These minimum account balance fees are recorded as part of expense
37
Columbia Federal Securities Fund
August 31, 2008
reductions on the Statement of Operations. For the year ended August 31, 2008, these minimum account balance fees reduced total expenses by $22,241.
Underwriting Discounts, Service and Distribution Fees
Columbia Management Distributors, Inc. (the “Distributor”), an affiliate of Columbia and an indirect, wholly owned subsidiary of BOA, is the principal underwriter of the Fund’s shares. For the year ended August 31, 2008, the Distributor has retained net underwriting discounts of $12,113 on sales of the Fund’s Class A shares and received net CDSC fees of $785, $50,442 and $2,593 on Class A, Class B and Class C share redemptions, respectively.
The Fund has adopted a Rule 12b-1 plan (the “Plan”) which requires the payment of a monthly service fee to the Distributor at the maximum annual rate of 0.25% of the average daily net assets attributable to Class A, Class B and Class C shares of the Fund. The Plan also requires the payment of a monthly distribution fee to the Distributor at the maximum annual rate of 0.75% of the average daily net assets attributable to Class B and Class C shares. The Distributor has voluntarily agreed to waive a portion of the distribution fee for Class C shares so that it will not exceed 0.60% annually of the average daily net assets attributable to the Class C shares. This agreement may be modified or terminated by the Distributor at any time.
The CDSC and the distribution fees received from the Plan are used principally as repayment to the Distributor for amounts paid by the Distributor to dealers who sold such shares.
Fees Paid to Officers and Trustees
All officers of the Fund are employees of Columbia or its affiliates and, with the exception of the Fund’s Chief Compliance Officer, receive no compensation from the Fund. The Board of Trustees has appointed a Chief Compliance Officer to the Fund in accordance with federal securities regulations. The Fund, along with other affiliated funds, pays its pro-rata share of the expenses associated with the Chief Compliance Officer. The Fund’s expenses for the Chief Compliance Officer will not exceed $15,000 per year.
The Fund’s eligible Trustees may participate in a deferred compensation plan which may be terminated at any time. Obligations of the plan will be paid solely out of the Fund’s assets.
As a result of a fund merger, the Fund assumed the liabilities of the deferred compensation plan of the acquired fund, which is included in “Trustees’ fees” in the Statement of Assets and Liabilities. The deferred compensation plan of the acquired fund may be terminated at any time. Any payments to plan participants are paid solely out of the Fund’s assets.
Note 5. Custody Credits
The Fund has an agreement with its custodian bank under which custody fees may be reduced by balance credits. These credits are recorded as part of expense reductions on the Statement of Operations. The Fund could have invested a portion of the assets utilized in connection with the expense offset arrangement in an income-producing asset if it had not entered into such an agreement.
For the year ended August 31, 2008, these custody credits reduced total expenses by $1,590 for the Fund.
Note 6. Portfolio Information
For the year ended August 31, 2008, the cost of purchases and proceeds from sales of securities, excluding short-term obligations, were $838,561,244 and $885,811,985, respectively, of which $838,561,244 and $835,581,492, respectively, were U.S. Government securities.
Note 7. Line of Credit
The Fund and other affiliated funds participate in a $350,000,000 committed, unsecured revolving line of credit and a $150,000,000 uncommitted, unsecured line of credit, both provided by State Street. Borrowings are available for short-term liquidity or temporary or emergency purposes.
Interest on the committed line of credit is charged to each participating fund based on the fund’s borrowings at a rate per annum equal to the Federal Funds Rate plus 0.50%. In addition, a commitment fee of 0.10% per annum is accrued and apportioned among the participating funds pro-rata based on their relative net assets. Effective September 17, 2007, interest on the uncommitted line of credit is charged to each participating fund based on the fund’s borrowings at a rate per annum equal to the Federal Funds Rate plus 0.375%. Prior to September 17, 2007, interest on the uncommitted line of credit was charged to each participating fund based on the fund’s borrowings at a rate per annum equal to the Federal Funds Rate plus 0.50%. State Street charges an annual operations agency fee of $40,000 for the committed line of credit and may charge an annual administration fee of $15,000 for the uncommitted line of credit. State Street waived
38
Columbia Federal Securities Fund
August 31, 2008
the administration fee effective September 17, 2007. The commitment fee, the operations agency fee and the administration fee are accrued and apportioned among the participating funds pro rata based on their relative net assets.
For the year ended August 31, 2008, the Fund did not borrow under these arrangements.
Note 8. Securities Lending
The Fund may lend its securities to certain approved brokers, dealers and other financial institutions. Each loan is collateralized by cash, in an amount at least equal to the market value of the securities loaned plus accrued income from the investment of collateral. The market value of the loaned securities is determined at the close of business of the Fund and any additional required collateral is delivered to the Fund on the next business day. The collateral received is invested and the income generated by the investment of the collateral, net of any fees remitted to State Street as the lending agent and borrower rebates, is paid to the Fund. Generally, in the event of borrower default, the Fund has the right to use the collateral to offset any losses incurred. In the event the Fund is delayed or prevented from exercising its right to dispose of the collateral, there may be a potential loss to the Fund. The Fund bears the risk of loss with respect to the investment of collateral.
Note 9. Shares of Beneficial Interest
As of August 31, 2008, 9.0% of the Fund’s shares outstanding were beneficially owned by one participant account over which BOA and/or any of its affiliates had either sole or joint investment discretion. Subscription and redemption activity of this account may have a significant effect on the operations of the Fund.
Note 10. Significant Risks and Contingencies
Asset-Backed Securities Risk
The value of asset-backed securities may be affected by changes in interest rates, the quality of underlying assets or the market’s assessment thereof, the creditworthiness of the servicer for the underlying assets, information concerning the originator of the underlying assets, or the creditworthiness or rating of the entities that provide any supporting letters of credit, surety bonds, derivative instruments, or other credit enhancement.
Mortgage-Backed securities risk
The value of the mortgage-backed securities may be affected by, changes in interest rates, factors concerning the interests in and structure of the issuer or the originator of the mortgages, the creditworthiness of the entities that provide any supporting letters of credit, surety bonds or other credit enhancements or the quality of underlying assets or the market’s assessment thereof. Mortgage-backed securities are subject to prepayment risk, which is the possibility that the underlying mortgage may be refinanced or prepaid prior to maturity during periods of declining or low interest rates, causing the Funds to have to reinvest the money received in securities that have lower yields. In addition, the impact of prepayments on the value of mortgage-backed securities may be difficult to predict and may result in greater volatility.
Legal Proceedings
On February 9, 2005, Columbia Management Advisors, Inc. (which has since merged into Banc of America Capital Management, LLC (now named Columbia Management Advisors, LLC)) (“Columbia”) and Columbia Funds Distributor, Inc. (which has been renamed Columbia Management Distributors, Inc.) (the “Distributor”) (collectively, the “Columbia Group”) entered into an Assurance of Discontinuance with the New York Attorney General (“NYAG”) (the “NYAG Settlement”) and consented to the entry of a cease-and-desist order by the Securities and Exchange Commission (“SEC”) (the “SEC Order”) on matters relating to mutual fund trading.
Under the terms of the SEC Order, the Columbia Group agreed, among other things, to: pay $70 million in disgorgement and $70 million in civil money penalties; cease and desist from violations of the antifraud provisions and certain other provisions of the federal securities laws; maintain certain compliance and ethics oversight structures; retain an independent consultant to review the Columbia Group’s applicable supervisory, compliance, control and other policies and procedures; and retain an independent distribution consultant (see below). The Columbia Funds have also voluntarily undertaken to implement certain governance measures designed to maintain the independence of their boards of trustees. The NYAG Settlement also, among other things, requires Columbia and its affiliates to reduce management fees for certain Columbia Funds (including the former Nations Funds) and other
39
Columbia Federal Securities Fund
August 31, 2008
mutual funds collectively by $32 million per year for five years, for a projected total of $160 million in management fee reductions.
Pursuant to the procedures set forth in the SEC Order, the $140 million in settlement amounts described above is being distributed in accordance with a distribution plan that was developed by an independent distribution consultant and approved by the SEC on April 6, 2007. Distributions under the distribution plan began in late June 2007.
A copy of the SEC Order is available on the SEC website at http://www.sec.gov. A copy of the NYAG Settlement is available as part of the Bank of America Corporation Form 8-K filing on February 10, 2005.
In connection with the events described above, various parties have filed suit against certain funds, the Trustees of the Columbia Funds, FleetBoston Financial Corporation and its affiliated entities and/or Bank of America and its affiliated entities.
On February 20, 2004, the Judicial Panel on Multidistrict Litigation transferred these cases and cases against other mutual fund companies based on similar allegations to the United States District Court in Maryland for consolidated or coordinated pretrial proceedings (the “MDL”). Subsequently, additional related cases were transferred to the MDL. On September 29, 2004, the plaintiffs in the MDL filed amended and consolidated complaints. One of these amended complaints is a putative class action that includes claims under the federal securities laws and state common law, and that names Columbia, the Distributor, the Trustees of the Columbia Funds, Bank of America Corporation and others as defendants. Another of the amended complaints is a derivative action purportedly on behalf of the Columbia Funds that asserts claims under federal securities laws and state common law.
On February 25, 2005, Columbia and other defendants filed motions to dismiss the claims in the pending cases. On March 1, 2006, for reasons stated in the court’s memoranda dated November 3, 2005, the U.S. District Court for the District of Maryland granted in part and denied in part the defendants’ motions to dismiss. The court dismissed all of the class action claims pending against the Columbia Funds Trusts. As to Columbia and the Distributor, the claims under the Securities Act of 1933, the claims under Sections 34(b) and 36(a) of the Investment Company Act of 1940 (“ICA”) and the state law claims were dismissed. The claims under Sections 10(b) and 20(a) of the Securities Exchange Act of 1934 and claims under Section 36(b) of the ICA were not dismissed.
On March 21, 2005, a purported class action was filed in Massachusetts state court alleging that certain conduct, including market timing, entitled Class B shareholders in certain Columbia funds to an exemption from contingent deferred sales charges upon early redemption (“the CDSC Lawsuit”). The CDSC Lawsuit was removed to federal court in Massachusetts and transferred to the MDL.
On September 14, 2007, the plaintiffs and the Columbia defendants named in the MDL, including the Columbia Funds, entered into a stipulation of settlement with respect to all Columbia-related claims in the MDL described above, including the CDSC Lawsuit. The settlement is subject to court approval.
In 2004, the Columbia Funds’ adviser and distributor and certain affiliated entities and individuals were named as defendants in certain purported shareholder class and derivative actions making claims, including claims under the Investment Company and the Investment Advisers Acts of 1940 and state law. Certain Columbia Funds were named as nominal defendants. The suits allege, inter alia, that the fees and expenses paid by the funds are excessive and that the advisers and their affiliates inappropriately used fund assets to distribute the funds and for other improper purposes. On March 2, 2005, the actions were consolidated in the Massachusetts federal court as In re Columbia Entities Litigation. The plaintiffs filed a consolidated amended complaint on June 9, 2005. On November 30, 2005, the judge dismissed all claims by plaintiffs and entered final judgment in favor of the defendants. The plaintiffs appealed to the United States Court of Appeals for the First Circuit on December 30, 2005. A stipulation and settlement agreement dated January 19, 2007 was filed in the First Circuit on February 14, 2007, with a joint stipulation of dismissal and motion for remand to obtain district court approval of the settlement. That joint motion was granted and the appeal was dismissed. On March 6, 2007, the case was remanded to the District Court. The settlement, approved by the District Court on September 18, 2007, became effective October 19, 2007. Pursuant to the settlement, the funds’ adviser and/or its affiliates made certain payments, including plaintiffs’ attorneys’ fees and costs of notice to class members.
40
Columbia Federal Securities Fund
August 31, 2008
Note 11. Subsequent Event
On October 16, 2008 the uncommitted and committed lines of credit discussed in Note 7 were terminated or amended. The uncommitted line of credit was terminated. The Fund and other affiliated funds participate in a $280,000,000 committed, unsecured revolving line of credit. The maximum amount that may be borrowed by any fund is limited to $200,000,000. Interest is charged to each participating fund based on the fund’s borrowings at a rate per annum equal to the greater of the Federal Funds Rate plus 0.50% or the overnight LIBOR Rate plus 0.50%. In addition, an annual operations agency fee of $20,000, an amendment fee of 0.02% and a commitment fee of 0.12% per annum are accrued and apportioned among the participating funds pro rata based on their relative net assets.
41
Report of Independent Registered Public Accounting Firm
To the Trustees of Columbia Funds Series Trust I and the Shareholders of Columbia Federal Securities Fund
In our opinion, the accompanying statement of assets and liabilities, including the investment portfolio, and the related statements of operations and of changes in net assets and the financial highlights present fairly, in all material respects, the financial position of Columbia Federal Securities Fund (the “Fund”) (a series of Columbia Funds Series Trust I) at August 31, 2008, the results of its operations for the year then ended, and the changes in its net assets for each of the two years in the period then ended and the financial highlights for each of the five years in the period then ended, in conformity with accounting principles generally accepted in the United States of America. These financial statements and financial highlights (hereafter referred to as “financial statements”) are the responsibility of the Fund’s management. Our responsibility is to express an opinion on these financial statements based on our audits. We conducted our audits of these financial statements in accordance with the standards of the Public Company Accounting Oversight Board (United States). Those standards require that we plan and perform the audit to obtain reasonable assurance about whether the financial statements are free of material misstatement. An audit includes examining, on a test basis, evidence supporting the amounts and disclosures in the financial statements, assessing the accounting principles used and significant estimates made by management, and evaluating the overall financial statement presentation. We believe that our audits, which included confirmation of securities at August 31, 2008 by correspondence with the custodian and brokers, provide a reasonable basis for our opinion.
PricewaterhouseCoopers LLP
Boston, Massachusetts
October 22, 2008
42
Fund Governance
The Trustees serve terms of indefinite duration. The names, addresses and ages of the Trustees and officers of the Funds in Columbia Funds Series Trust I, the year each was first elected or appointed to office, their principal business occupations during at least the last five years, the number of Funds overseen by each Trustee and other directorships they hold are shown below. Each officer listed below serves as an officer of each Fund in the Columbia Funds Complex.
Independent Trustees
| | |
Name, address and year of birth,
Position with funds, Year first
elected or appointed to office | | Principal occupation(s) during past five years, Number of funds in Columbia Funds
Complex overseen by trustee, Other directorships held |
| |
| John D. Collins (Born 1938) | | |
c/o Columbia Management Advisors, LLC
One Financial Center
Boston, MA 02111
Trustee1 (since 2007) | | Retired. Consultant, KPMG, LLP (accounting and tax firm) from July 1999 to June 2000; Partner, KPMG, LLP from March 1962 to June 1999. Oversees 77, Mrs. Fields Famous Brands LLC (consumer products); Suburban Propane Partners, L.P.; and Montpelier Re (underwriting firm) |
| |
| Rodman L. Drake (Born 1943) | | |
c/o Columbia Management
Advisors, LLC
One Financial Center
Boston, MA 02111
Trustee1 (since 2007) | | Co-Founder of Baringo Capital LLC (private equity) since 2002; President, Continuation Investments Group, Inc. from 1997 to 2001. Oversees 77, Jackson Hewitt Tax Service Inc. (tax preparation services); Crystal Capital River Inc. (real estate investment trust); Student Loan Corporation (student loan provider); Celgene Corporation (global biotechnology company); Apex Silver Mines Ltd. (mining); and Hyperion Brookfield Total Return Fund, Inc. and Hyperion Brookfield Strategic Mortgage Income Fund, Inc. (exchange-traded funds) |
| |
| Douglas A. Hacker (Born 1955) | | |
c/o Columbia Management
Advisors, LLC
One Financial Center
Boston, MA 02111
Trustee (since 1996) | | Independent business executive since May 2006; Executive Vice President–Strategy of United Airlines (airline) from December 2002 to May 2006; President of UAL Loyalty Services (airline marketing company) from September 2001 to December 2002; Executive Vice President and Chief Financial Officer of United Airlines from July 1999 to September 2001. Oversees 77, Nash Finch Company (food distributor); Aircastle Limited (aircraft leasing) |
| |
| Janet Langford Kelly (Born 1957) | | |
c/o Columbia Management
Advisors, LLC
One Financial Center
Boston, MA 02111
Trustee (since 1996) | | Senior Vice President, General Counsel and Corporate Secretary, ConocoPhillips (integrated energy company) since September 2007; Deputy General Counsel– Corporate Legal Services, ConocoPhillips from August 2006 to August 2007; Partner, Zelle, Hofmann, Voelbel, Mason & Gette LLP (law firm) from March 2005 to July 2006; Adjunct Professor of Law, Northwestern University, from September 2004 to June 2006; Director, UAL Corporation (airline) from February 2006 to July 2006; Chief Administrative Officer and Senior Vice President, Kmart Holding Corporation (consumer goods), from September 2003 to March 2004; Executive Vice President– Corporate Development and Administration, General Counsel and Secretary, Kellogg Company (food manufacturer), from September 1999 to August 2003. Oversees 77, None |
| |
| Charles R. Nelson (Born 1942) | | |
c/o Columbia Management
Advisors, LLC
One Financial Center
Boston, MA 02111
Trustee (since 1981) | | Professor of Economics, University of Washington, since January 1976; Ford and Louisa Van Voorhis Professor of Political Economy, University of Washington, since September 1993; Director, Institute for Economic Research, University of Washington from September 2001 to June 2003; Adjunct Professor of Statistics, University of Washington, since September 1980; Associate Editor, Journal of Money Credit and Banking, since September 1993; Consultant on econometric and statistical matters. Oversees 77, None |
43
Fund Governance (continued)
Independent Trustees (continued)
| | |
Name, address and year of birth,
Position with funds, Year first
elected or appointed to office | | Principal occupation(s) during past five years, Number of funds in Columbia Funds
Complex overseen by trustee, Other directorships held |
| |
| John J. Neuhauser (Born 1943) | | |
c/o Columbia Management Advisors, LLC One Financial Center Boston, MA 02111 Trustee (since 1985) | | President, Saint Michael’s College, since August 2007; University Professor, Boston College from November 2005 to August 2007; Academic Vice President and Dean of Faculties, Boston College from August 1999 to October 2005. Oversees 77, Liberty All-Star Equity Fund and Liberty All-Star Growth Fund, Inc. (closed-end funds) |
| |
| Jonathan Piel (Born 1938) | | |
c/o Columbia Management Advisors, LLC One Financial Center Boston, MA 02111 Trustee1 (since 2007) | | Cable television producer and website designer; The Editor, Scientific American from 1984 to 1994; Vice President, Scientific American, Inc., from 1984 to 1994; Member, Advisory Board, Stone Age Institute, Bloomington, Indiana (research institute that explores the effect of technology on human evolution); Member, Board of Directors of the National Institute of Social Sciences, New York City; and Member, Board of Trustees of the William Alanson White Institute, New York City (institution for training psychoanalysts). Oversees 77, None |
| |
| Patrick J. Simpson (Born 1944) | | |
c/o Columbia Management Advisors, LLC One Financial Center Boston, MA 02111 Trustee (since 2000) | | Partner, Perkins Coie LLP (law firm). Oversees 77, None |
| |
| Thomas C. Theobald (Born 1937) | | |
c/o Columbia Management Advisors, LLC One Financial Center Boston, MA 02111 Trustee and Chairman of the Board (since 1996) | | Partner and Senior Advisor, Chicago Growth Partners (private equity investing) since September 2004; Managing Director, William Blair Capital Partners (private equity investing) from September 1994 to September 2004. Oversees 77, Anixter International (network support equipment distributor); Ventas, Inc. (real estate investment trust); Jones Lang LaSalle (real estate management services); Ambac Financial Group (financial guaranty insurance) |
| |
| Anne-Lee Verville (Born 1945) | | |
c/o Columbia Management Advisors, LLC One Financial Center Boston, MA 02111 Trustee (since 1998) | | Retired since 1997 (formerly General Manager–Global Education Industry (from 1994 to 1997), President–Application Systems Division (from 1991 to 1994), Chief Financial Officer–US Marketing & Services (from 1988 to 1991), and Chief Information Officer (from 1987 to 1988), IBM Corporation (computer and technology)). Oversees 77, None |
Interested Trustee
| | |
| |
| William E. Mayer (Born 1940) | | |
c/o Columbia Management Advisors, LLC One Financial Center Boston, MA 02111 Trustee2 (since 1994) | | Partner, Park Avenue Equity Partners (private equity) since February 1999; Dean and Professor, College of Business, University of Maryland from 1992 to 1997. Oversees 77, Lee Enterprises (print media), WR Hambrecht + Co. (financial service provider); BlackRock Kelso Capital Corporation (investment company) |
1 | Messrs. Drake, Piel and Collins have served as directors/trustees of the Excelsior Funds since 1996, 1996 and 2005, respectively. The Excelsior Funds consisted of 27 portfolios managed by affiliates of Columbia Management Advisors, LLC. Effective December 12, 2007, the Board elected Messrs. Drake, Piel and Collins as Trustees of the Trust. |
2 | Mr. Mayer is an “interested person” (as defined in the Investment Company Act of 1940) by reason of his affiliation with WR Hambrecht + Co., a registered broker/dealer that may execute portfolio transactions for or engage in principal transactions with the Funds or other funds or accounts advised/managed by the Advisor or other Bank of America affiliates. |
The Statement of Additional Information includes additional information about the Trustees of the Funds and is available, without charge, upon request by calling 1-800-345-6611.
44
Fund Governance (continued)
Officers
| | |
Name, address and year of birth,
Position with Columbia Funds, Year
first elected or appointed to office | | Principal occupation(s) during past five years |
|
| Christopher L. Wilson (Born 1957) |
One Financial Center
Boston, MA 02111
President (since 2004) | | President–Columbia Funds, since October 2004; Managing Director–Columbia Management Advisors, LLC, since September 2005; Senior Vice President–Columbia Management Distributors, Inc., since January 2005; Director–Columbia Management Services, Inc., since January 2005; Director–Bank of America Global Liquidity Funds, plc and Banc of America Capital Management (Ireland), Limited, since May 2005; Director–FIM Funding, Inc., since January 2005; President and Chief Executive Officer–CDC IXIS AM Services, Inc. (investment management), from September 1998 through August 2004; and a senior officer or director of various other Bank of America affiliated entities, including other registered and unregistered funds. |
|
| James R. Bordewick, Jr. (Born 1959) |
One Financial Center
Boston, MA 02111
Senior Vice President, Secretary
and Chief Legal Officer (since 2006) | | Associate General Counsel, Bank of America since April 2005; Senior Vice President and Associate General Counsel, MFS Investment Management (investment management) prior to April 2005. |
|
| J. Kevin Connaughton (Born 1964) |
One Financial Center
Boston, MA 02111
Senior Vice President and
Chief Financial Officer
(since 2000) | | Managing Director of Columbia Management Advisors, LLC since December 2004; Treasurer–Columbia Funds, from October 2003 to May 2008; Treasurer–the Liberty Funds, Stein Roe Funds and Liberty All-Star Funds, December 2000–December 2006; Senior Vice President–Columbia Management Advisors, LLC, from April 2003 to December 2004; President–Columbia Funds, Liberty Funds and Stein Roe Funds, February 2004 to October 2004; Treasurer–Galaxy Funds, September 2002 to December 2005; Treasurer, December 2002 to December 2004, and President, February 2004 to December 2004–Columbia Management Multi-Strategy Hedge Fund, LLC; and a senior officer of various other Bank of America-affiliated entities, including other registered and unregistered funds. |
| |
| Linda J. Wondrack (Born 1964) | | |
One Financial Center
Boston, MA 02111
Senior Vice President and
Chief Compliance Officer
(since 2007) | | Director (Columbia Management Group LLC and Investment Product Group Compliance), Bank of America since June 2005; Director of Corporate Compliance and Conflicts Officer, MFS Investment Management (investment management), August 2004 to May 2005; Managing Director, Deutsche Asset Management (investment management) prior to August 2004. |
| |
| Michael G. Clarke (Born 1969) | | |
One Financial Center
Boston, MA 02111
Treasurer (since 2008) | | Director of Fund Administration of the Advisor since January 2006; Managing Director of the Advisor September 2004 to December 2005; Vice President Fund Administration June 2002 to September 2004. |
| |
| Jeffrey R. Coleman (Born 1969) | | |
One Financial Center
Boston, MA 02111
Deputy Treasurer (since 2006) | | Director of Fund Administration of the Advisor since January 2006; Fund Controller of the Advisor from October 2004 to January 2006; Vice President of CDC IXIS Asset Management Services, Inc. (investment management) from August 2000 to September 2004 |
45
Fund Governance (continued)
Officers (continued)
| | |
Name, address and year of birth,
Position with Columbia Funds, Year
first elected or appointed to office | | Principal occupation(s) during past five years |
| |
| Joseph F. DiMaria (Born 1968) | | |
One Financial Center
Boston, MA 02111
Chief Accounting Officer
(since 2008) | | Director of Fund Administration of the Advisor since January 2006; Head of Tax/Compliance and Assistant Treasurer of the Advisor from November 2004 to December 2005; Director of Trustee Administration (Sarbanes-Oxley) of the Advisor from May 2003 to October 2004. |
| |
| Julian Quero (Born 1967) | | |
One Financial Center
Boston, MA 02111
Deputy Treasurer (since 2008) | | Senior Tax Manager of the Advisor since August 2006; Senior Compliance Manager of the Advisor from April 2002 to August 2006. |
| |
| Barry S. Vallan (Born 1969) | | |
One Financial Center
Boston, MA 02111
Controller (since 2006) | | Vice President–Fund Treasury of the Advisor since October 2004; Vice President–Trustee Reporting of the Advisor from April 2002 to October 2004. |
46
[THIS PAGE INTENTIONALLY LEFT BLANK]
47
[THIS PAGE INTENTIONALLY LEFT BLANK]
48
Important Information About This Report
Transfer Agent
Columbia Management Services, Inc.
P.O. Box 8081
Boston, MA 02266-8081
1-800-345-6611
Distributor
Columbia Management
Distributors, Inc.
One Financial Center
Boston, MA 02111
Investment Advisor
Columbia Management Advisors, LLC
100 Federal Street
Boston, MA 02110
The fund mails one shareholder report to each shareholder address. If you would like more than one report, please call shareholder services at 1-800-345-6611 and additional reports will be sent to you. This report has been prepared for shareholders of Columbia Federal Securities Fund.
A description of the policies and procedures that the fund uses to determine how to vote proxies and a copy of the fund’s voting records are available (i) at www.columbiamanagement.com; (ii) on the Securities and Exchange Commission’s website at www.sec.gov; and (iii) without charge, upon request, by calling 1-800-368-0346. Information regarding how the fund voted proxies relating to portfolio securities during the 12-month period ended June 30 is available from the SEC’s website. Information regarding how the fund voted proxies relating to portfolio securities is also available from the fund’s website.
The fund files a complete schedule of portfolio holdings with the SEC for the first and third quarters of each fiscal year on Form N-Q. The fund’s Form N-Q is available on the SEC’s website at www.sec.gov and may be reviewed and copied at the SEC’s Public Reference Room in Washington, D.C. Information on the operation of the Public Reference Room may be obtained by calling 1-800-SEC-0330.
Please read and consider the investment objectives, risks, charges and expenses for any fund carefully before investing. For a prospectus which contains this and other important information about the fund, contact your Columbia Management representative or financial advisor or go to www.columbiamanagement.com.
Columbia Management Group, LLC (“Columbia Management”) is the investment management division of Bank of America Corporation. Columbia Management entities furnish investment management services and products for institutional and individual investors. Columbia Funds are distributed by Columbia Management Distributors, Inc., member of FINRA, SIPC, part of Columbia Management and an affiliate of Bank of America Corporation.
49

Columbia Federal Securities Fund
Annual Report, August 31, 2008
©2008 Columbia Management Distributors, Inc.
One Financial Center, Boston, MA 02111-2621
800.345.6611 www.columbiafunds.com
SHC-42/156029-0808 (10/08) 08/59487

Annual Report
August 31, 2008
Columbia Greater China Fund
| | |
| NOT FDIC INSURED | | May Lose Value |
| NOT BANK ISSUED | | No Bank Guarantee |
Table of contents
The views expressed in this report reflect the current views of the respective parties. These views are not guarantees of future performance and involve certain risks, uncertainties and assumptions that are difficult to predict so actual outcomes and results may differ significantly from the views expressed. These views are subject to change at any time based upon economic, market or other conditions and the respective parties disclaim any responsibility to update such views. These views may not be relied on as investment advice and, because investment decisions for a Columbia Fund are based on numerous factors, may not be relied on as an indication of trading intent on behalf of any particular Columbia Fund. References to specific company securities should not be construed as a recommendation or investment advice.
President’s Message – Columbia Greater China Fund

Dear Shareholder:
We are pleased to provide this shareholder report for your Columbia fund and hope you will find the portfolio management details, discussions and performance information helpful in monitoring your investments. As we’ve seen this past year, the financial markets can be quite volatile, with significant short-term price fluctuations. It’s important to keep these ups and downs in perspective, particularly in light of your long-term investment strategy.
Staying the course with your long-term strategy typically involves riding out short-term price fluctuations, though we recognize that at times this can be tough. To support your
efforts and give you the information you need to make prudent decisions, Columbia Management offers several valuable online resources. We encourage you to visit www.columbiamanagement.com/investor, where you can receive the most up-to-date information, including:
| n | | Daily pricing and performance. View pricing and performance from a link in Fund Tracker on the homepage. This listing of funds is updated nightly with the current net asset value and the amount and percentage change from the prior day. |
| n | | News & Commentary. This tab provides links to quarterly fund commentaries and information from our investment strategies group, including trends in the economy and market impact. |
If you would like more details on individual funds, select a fund from the dropdown menu on the top right side of the homepage for access to:
| n | | Monthly and quarterly performance information. |
| n | | Portfolio holdings. Full holdings are updated monthly for money market funds except for Columbia Cash Reserves, Columbia Money Market Reserves and Columbia Daily Cash Reserves which are updated daily, monthly for equity funds and quarterly for most other funds. |
By registering on the site, you’ll receive secured, 24-hour access to*:
| n | | Mutual fund account details with balances, dividend and transaction information |
| n | | Fund Tracker to customize your homepage with current net asset values for the funds that interest you |
| n | | On-line transactions including purchases, exchanges and redemptions |
| n | | Account maintenance for updating your address and dividend payment options |
| n | | Electronic delivery of prospectuses and shareholder reports |
I encourage you to visit our website for access to the product information and tools described above. These valuable online resources can help you monitor your investments and provide direct access to your account. All of these tools, and more, can be found on www.columbiamanagement.com.
While your financial advisor is a great resource for investment guidance, you can also access our website or call our service representatives at 800.345.6611 for additional assistance. We thank you for investing with Columbia Management and look forward to helping with your ongoing investment needs.
Sincerely,

Christopher L. Wilson
President, Columbia Funds
| * | Some restrictions apply. Shareholders who purchase shares through certain third-party organizations may not have the ability to register for online access. |
Fund Profile – Columbia Greater China Fund
Performance data quoted represents past performance and current performance may be lower or higher. Past performance is no guarantee of future results. The investment return and principal value will fluctuate so that shares, when redeemed, may be worth more or less than the original cost. Please visit www.columbiafunds.com for daily and most recent month-end performance updates.
Summary
1 year return as of 08/31/08
| | |
| |
 | | –20.24% Class A shares |
| | (without sales charge) |
| |
| | –20.02% MSCI China Index |
| |
| | –13.09% Hang Seng Index |
Morningstar Style Box
Equity Style
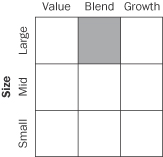
The Morningstar Style Box reveals a fund’s investment strategy. For equity funds the vertical axis shows the market capitalization of the stocks owned and the horizontal axis shows investment style (value, blend or growth). All of these numbers are drawn from the data most recently provided by the fund and entered into Morningstar’s database as of month-end. Although the data are gathered from reliable sources. Morningstar cannot guarantee completeness and accuracy. Information shown is as of 07/31/08.
Summary
| n | | For the 12-month period that ended August 31, 2008, the fund’s Class A shares returned negative 20.24% without sales charge. |
n | | The fund’s performance was slightly less than the MSCI China Index. Stock selection in Hong Kong accounted for its underperformance relative to the Hang Seng Index1. |
n | | In a difficult period for stock markets around the world, the fund held up better than the average fund in its peer group, the Lipper China Region Funds Classification2. |
Portfolio Management
Jasmine Huang has co-managed the fund since May 2005 and has been associated with the advisor or its predecessors or affiliate organizations since September 2003.
Fred Copper has co-managed the fund since October 2005 and has been associated with the advisor or its predecessors or affiliate organizations since September 2005.
1 | The Morgan Stanley Capital International (MSCI) China Index is designed to broadly and fairly represent the full diversity of business activities in China. This index aims to capture 85% of the free float adjusted market capitalization in each industry group. The Hang Seng Index tracks the performance of approximately 70% of the total market capitalization of the stock exchange of Hong Kong. Indices are not investments, do not incur fees or expenses and are not professionally managed. It is not possible to invest directly in an index. Securities in the fund may not match those in an index. |
2 | Lipper Inc., a widely respected data provider in the industry, calculates an average total return (assuming reinvestment of distributions) for mutual funds with investment objectives similar to those of the fund. Lipper makes no adjustment for the effect of sales loads. |
1
Economic Update – Columbia Greater China Fund
Summary
For the 12-month period that ended August 31, 2008
| | n | | China’s stock market posted a sharp decline, as measured by the MSCI China Index. The Hong Kong market held up somewhat better, as measured by the Hang Seng Stock Index. | |
| | |
| MSCI China Index | | Hang Seng Index |
| |

| |
|
-20.02% | | -13.09% |
The Morgan Stanley Capital International (MSCI) China Index is designed to broadly and fairly represent the full diversity of business activities in China. This index aims to capture 85% of the free float adjusted market capitalization in each industry group.
The Hang Seng Index tracks the performance of approximately 70% of the total market capitalization of the stock exchange of Hong Kong.
Indices are not investments, do not incur fees or expenses and are not professionally managed. It is not possible to invest directly in an index. Securities in the fund may not match those in an index.
During the 12-month period from September 1, 2007 through August 31, 2008, the pace of economic growth slowed in China, the result of monetary and regulatory policies aimed at curbing excessive growth and quickened by a slowdown in economic growth around the world. A slowdown in export growth, which accounts for just under 20% of China’s economy, is likely to put pressure on industrial activity as well as export-related private sector investment. Housing-related investment could decelerate and property transactions have already slowed. Against this backdrop, China’s stock market declined sharply. For the 12-month period that ended August 31, 2008, the MSCI China Index returned negative 20.02% and the Hang Seng Index, which tracks the performance of Hong Kong stocks, declined 13.09% over the same period. After years of stellar performance, the correction came as no surprise.
China’s leaders address slowing growth
China’s policymakers are well aware of mounting weakness on the global economic front we expect them to step up spending on public infrastructure projects, to take steps to boost domestic consumption and to pursue monetary policies that are supportive of steady growth. In fact, consumption appears to be a bright spot in the Chinese economy. Retail sales, adjusted for inflation, were reported rising at double-digit rates. Rapidly rising rural and urban wages also contributed to strength in the consumer sector. Fixed asset investment growth was also resilient in 2008. We expect both to drive China’s gross domestic product (GDP) growth into 2009.
Against this backdrop, China’s growth appears to be on track to slow from 12% in 2007 to a slightly lower pace in 2009. Inflation, which has jumped to 6.3% in China in 2008, is expected to moderate in 2009 in the wake of falling global commodity prices. Slower export growth in mainland China is likely to affect growth in Taiwan and Hong Kong, where growth has decelerated from a year ago.
2
Performance Information – Columbia Greater China Fund
|
| Growth of a $10,000 investment 09/01/98 – 08/31/08 |
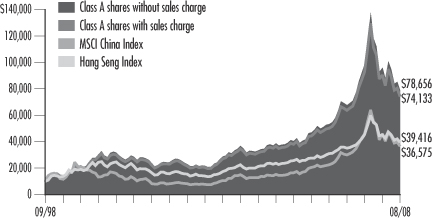
The chart above shows the growth in value of a hypothetical $10,000 investment in Class A shares of Columbia Greater China Fund during the stated time, and does not reflect the deduction of taxes that a shareholder may pay on fund distributions or on the redemption of fund shares. The Morgan Stanley Capital International (MSCI) China Index is designed to broadly and fairly represent the full diversity of business activities in China. This index aims to capture 85% of the free float adjusted market capitalization in each industry group. The Hang Seng Index tracks the performance of approximately 70% of the total market capitalization of the stock exchange of Hong Kong. Indices are not investments, do not incur fees or expenses and are not professionally managed. It is not possible to invest directly in an index. Securities in the fund may not match those in an index.
| | | | |
| Performance of a $10,000 investment 09/01/98 – 08/31/08 ($) |
| | |
| Sales charge: | | without | | with |
Class A | | 78,656 | | 74,133 |
Class B | | 72,698 | | 72,698 |
Class C | | 73,877 | | 73,877 |
Class Z | | 82,558 | | n/a |
| | | | | | | | | | | | | | |
| Average annual total return as of 08/31/08 (%) | | | | |
| | | | |
| Share class | | A | | B | | C | | Z |
| Inception | | 05/16/97 | | 05/16/97 | | 05/16/97 | | 05/16/97 |
| Sales charge | | without | | with | | without | | with | | without | | with | | without |
1-year | | –20.24 | | –24.83 | | –20.83 | | –24.79 | | –20.84 | | –21.63 | | –20.04 |
5-year | | 22.20 | | 20.76 | | 21.30 | | 21.11 | | 21.27 | | 21.27 | | 22.52 |
10-year | | 22.91 | | 22.18 | | 21.94 | | 21.94 | | 22.14 | | 22.14 | | 23.50 |
| | | | | | | | | | | | | | |
| Average annual total return as of 09/30/08 (%) |
| Share class | | A | | B | | C | | Z |
| Sales charge | | without | | with | | without | | with | | without | | with | | without |
1-year | | –45.34 | | –48.48 | | –45.75 | | –48.45 | | –45.75 | | –46.29 | | –45.20 |
5-year | | 16.44 | | 15.07 | | 15.58 | | 15.35 | | 15.56 | | 15.56 | | 16.74 |
10-year | | 17.01 | | 16.32 | | 16.14 | | 16.14 | | 16.11 | | 16.11 | | 17.59 |
Performance data quoted represents past performance and current performance may be lower or higher. Past performance is no guarantee of future results. The investment return and principal value will fluctuate so that shares, when redeemed, may be worth more or less than the original cost. Please visit www.columbiafunds.com for daily and most recent month-end performance updates.
| | |
| Annual operating expense ratio (%)* |
| |
Class A | | 1.61 |
Class B | | 2.36 |
Class C | | 2.36 |
Class Z | | 1.36 |
| * | The annual operating expense ratio is as stated in the fund’s prospectus that is current as of the date of this report. Differences in expense ratios disclosed elsewhere in this report may result from including fee waivers and expense reimbursements as well as different time periods used in calculating the ratios. |
| | |
| Net asset value per share |
| |
as of 08/31/08 ($) | | |
Class A | | 46.54 |
Class B | | 45.29 |
Class C | | 45.89 |
Class Z | | 48.38 |
| | |
| Distributions declared per share |
| |
09/01/07 – 08/31/08 ($) | | |
Class A | | 0.49 |
Class B | | 0.09 |
Class C | | 0.09 |
Class Z | | 0.63 |
The “with sales charge” returns include the maximum initial sales charge of 5.75% for Class A shares, the applicable contingent deferred sales charge of 5.00% in the first year, declining to 1.00% in the sixth year and eliminated thereafter for Class B shares and 1.00% for Class C shares for the first year only. The “without sales charge” returns do not include the effect of sales charges. If they had, returns would be lower.
All results shown assume reinvestment of distributions. Class Z shares are sold at net asset value with no distribution and service (Rule 12b-1) fees. Class Z shares have limited eligibility and the investment minimum requirements may vary. Please see the fund’s prospectus for details. Performance for different share classes will vary based on differences in sales charges and fees associated with each class.
Performance results reflect any fee waivers or reimbursements of fund expenses by the investment advisor and/or any of its affiliates. Absent these fee waivers or expense reimbursement arrangements, performance results would have been lower.
The tables do not reflect the deduction of taxes that a shareholder may pay on fund distributions or on the redemption of fund shares.
3
Understanding Your Expenses – Columbia Greater China Fund
Estimating your actual expenses
To estimate the expenses that you paid over the period, first you will need your account balance at the end of the period:
| | n | | For shareholders who receive their account statements from Columbia Management Services, Inc., your account balance is available online at www.columbiafunds.com or by calling Shareholder Services at 800.345.6611. | |
| | n | | For shareholders who receive their account statements from their brokerage firm, contact your brokerage firm to obtain your account balance. | |
| | 1. | Divide your ending account balance by $1,000. For example, if an account balance was $8,600 at the end of the period, the result would be 8.6. | |
| | 2. | In the section of the table below titled “Expenses paid during the period,” locate the amount for your share class. You will find this number in the column labeled “Actual.” Multiply this number by the result from step 1. Your answer is an estimate of the expenses you paid on your account during the period. | |
If the value of your account falls below the minimum initial investment requirement applicable to you, your account generally will be subject to a $20 annual fee. This fee is not included in the accompanying table. If you are subject to the fee, keep it in mind when you are estimating the ongoing expenses of investing in the fund and when comparing the expenses of this fund with other funds.
As a fund shareholder, you incur two types of costs. There are transaction costs, which generally include sales charges on purchases and may include redemption fees or exchange fees. There are also ongoing costs, which generally include investment advisory fees, distribution and service (Rule 12b-1) fees and other fund expenses. The information on this page is intended to help you understand the ongoing costs of investing in the fund and to compare these costs with the ongoing costs of investing in other mutual funds.
Analyzing your fund’s expenses by share class
To illustrate these ongoing costs, we have provided an example and calculated the expenses paid by investors in each share class during the period. The information in the following table is based on an initial investment of $1,000, which is invested at the beginning of the reporting period and held for the entire period. Expense information is calculated two ways and each method provides you with different information. The amount listed in the “actual” column is calculated using the fund’s actual operating expenses and total return for the period. The amount listed in the “hypothetical” column for each share class assumes that the return each year is 5% before expenses and is calculated based on the fund’s actual operating expenses. You should not use the hypothetical account values and expenses to estimate either your actual account balance at the end of the period or the expenses you paid during this reporting period.
Compare with other funds
Since all mutual funds are required to include the same hypothetical calculations about expenses in shareholder reports, you can use this information to compare the ongoing costs of investing in the fund with other funds. To do so, compare the 5% hypothetical example with the 5% hypothetical examples that appear in the shareholder reports of other funds. As you compare hypothetical examples of other funds, it is important to note that hypothetical examples are meant to highlight the ongoing costs of investing in a fund and do not reflect any transaction costs, such as sales charges, redemption fees or exchange fees.
| | | | | | | | | | | | | | |
| 03/01/08 – 08/31/08 Columbia Greater China Fund |
| | | | |
| | | Account value at the
beginning of the period ($) | | Account value at the
end of the period ($) | | Expenses paid
during the period ($) | | Fund’s annualized
expense ratio (%) |
| | | Actual | | Hypothetical | | Actual | | Hypothetical | | Actual | | Hypothetical | | Actual |
Class A | | 1,000.00 | | 1,000.00 | | 818.92 | | 1,016.74 | | 7.64 | | 8.47 | | 1.67 |
Class B | | 1,000.00 | | 1,000.00 | | 803.73 | | 1,012.97 | | 10.97 | | 12.25 | | 2.42 |
Class C | | 1,000.00 | | 1,000.00 | | 816.00 | | 1,012.97 | | 11.05 | | 12.25 | | 2.42 |
Class Z | | 1,000.00 | | 1,000.00 | | 820.12 | | 1,018.00 | | 6.50 | | 7.20 | | 1.42 |
Expenses paid during the period are equal to the annualized expense ratio for the share class, multiplied by the average account value over the period, then multiplied by the number of days in the fund’s most recent fiscal half-year and divided by 366.
It is important to note that the expense amounts shown in the table are meant to highlight only ongoing costs of investing in the fund and do not reflect any transaction costs, such as sales charges, redemption fees or exchange fees. Therefore, the hypothetical examples provided may not help you determine the relative total costs of owning shares of different funds. If these transaction costs were included, your costs would have been higher.
4
Portfolio Manager’s Report – Columbia Greater China Fund
Performance data quoted represents past performance and current performance may be lower or higher. Past performance is no guarantee of future results. The investment return and principal value will fluctuate so that shares, when redeemed, may be worth more or less than the original cost. Please visit www.columbiafunds.com for daily and most recent month-end performance updates.
| | |
Top 10 holdings as of 08/31/08 (%) |
| |
China Mobile | | 16.2 |
China Life Insurance | | 7.4 |
CNOOC | | 6.9 |
PetroChina | | 6.8 |
Industrial & Commercial Bank of China | | 6.2 |
China Merchants Bank | | 6.1 |
China Petroleum & Chemical | | 3.4 |
China Shenhua Energy | | 2.7 |
Bank of China | | 2.6 |
Yanzhou Coal Mining | | 2.5 |
For the 12-month period that ended August 31, 2008, Columbia Greater China Fund Class A shares returned negative 20.24% without sales charge. This was slightly less than the negative 20.02% return of the MSCI China Index1 for the same period. Stock selection in Hong Kong accounted for the fund’s underperformance relative to the Hang Seng Index, which returned negative 13.09%.1 In a difficult environment for stock markets around the world, the fund held up better than the average fund in its peer group, the Lipper China Region Funds Classification, which returned negative 22.95%.2 An overweight in the consumer discretionary sector and investments in real estate dampened results. Investments in energy and consumer staples stocks and an underweight in materials and certain utilities were positive for performance.
A defensive portfolio
When it became clear that China would take steps to slow its rapid economic growth, we positioned the portfolio defensively, trimming investments in sectors and stocks that are tied to the economic cycle. As a result, the portfolio benefited from an underweight in the materials and utilities sectors, two of the poorest performing areas of the market. Toward the end of the period, we added to utilities when commodity prices declined and the Chinese government’s policies began to favor utility companies. Our late-period utilities investments produced positive results, with Datang International Power Generation Co. Ltd. and China Resources Power Holdings Co. Ltd. doing well relative to the market. As part of our defensive strategy, the fund was overweight in health care and also consumer staples. While the portfolio’s energy stocks declined when oil prices fell, exposure to the sector was positive.
Rising inflation hurt consumer stocks
Rising prices in staple foods and commodities contributed to China’s rising inflation rate at the beginning of 2008. Rising inflation, coupled with an earthquake in May, had a negative impact on consumer spending. While the consumer staples sector benefited from higher prices, and the position in Want Want China Holdings Ltd., the leading rice cracker and snack-food producer, aided return, an overweight in consumer discretionary stocks held back return. Dongfeng Motor Group Co. Ltd., China’s largest auto maker, produced disappointing results. We trimmed the position. However, we believe that the stock may be an attractive long-term holding. Hong Kong-based Esprit Holdings also did poorly. Esprit’s products are sold throughout Europe where the prospects for an economic slowdown weighed on the stock, which we sold.
1 | The Morgan Stanley Capital International (MSCI) China Index is designed to broadly and fairly represent the full diversity of business activities in China. This index aims to capture 85% of the free float adjusted market capitalization in each industry group. The Hang Seng Stock Index tracks the performance of approximately 70% of the total market capitalization of the stock exchange of Hong Kong. Indices are not investments, do not incur fees or expenses and are not professionally managed. It is not possible to invest directly in an index. Securities in the fund may not match those in an index. |
2 | Lipper Inc., a widely respected data provider in the industry, calculates an average total return (assuming reinvestment of distributions) for mutual funds with investment objectives similar to those of the fund. Lipper makes no adjustment for the effect of sales loads. |
5
Portfolio Manager’s Report (continued) – Columbia Greater China Fund
| | |
| Holdings discussed in this report |
|
as of 8/31/08 (%) |
Datang International Power Generation Co. Ltd. | | 0.9 |
China Resources Power Holdings Co. Ltd. | | 0.4 |
Want Want China Holdings Ltd. | | 0.9 |
Dongfeng Motor Group Co. Ltd. | | 1.1 |
Guangzhou R&F Properties Co. Ltd. | | 2.1 |
President Chain Store Corp. | | 0.5 |
Your fund is actively managed and the composition of its portfolio will change over time. Information provided is calculated as a percentage of net assets.
Real estate sector cooled
As real estate prices reached unsustainable levels and demand for property declined, property stocks fell more than 50% from their peak and several fund holdings had a negative impact on return. Both China Merchants Property and Guangzhou R&F Properties Co. Ltd. were off significantly for the period. We sold China Merchants but maintained the position in Guangzhou R&F Properties. Overall, the fund had an underweight position in Chinese real estate stocks. The fund held some Hong Kong real estate stocks, which outperformed the MSCI China real estate sector. Over the long term, we are optimistic about the real estate sector but believe it will take time for it to recover from the supply/demand imbalance.
A positive long-term outlook for the greater China region
We believe that China’s economic growth may decline to high single digits from a peak annual rate of 12%. However, the Chinese government has already changed its emphasis from curtailing growth to sustaining stable growth. The government has budgeted substantial funds for infrastructure development and is expected to take steps to support consumer spending as well.
Although China’s stock market declined 20% over the period, it is down about 35% from its peak. In this environment, we hope to continue to find long-term growth stocks that we believe are attractively valued and have substantial upside potential. We are also attracted to Taiwan, a market that did not participate in the strong emerging market performance of the past years. In March, Taiwan elected a new president who is willing to improve relations with China and, if successful, this could open up investment opportunities in Taiwan. While we have not invested heavily in Taiwan, because it is dominated by technology companies that may struggle in the current global slow-growth environment, we added President Chain Store Corp., a consumer staples stock. We also plan to maintain our investments in Hong Kong, which is linked to China’s growth and where stock valuations have become more attractive.
Equity securities are affected by stock market fluctuations that occur in response to economic and business developments.
Economic and market conditions frequently change. There is no assurance that the trends described here will continue or commence. The opinions expressed here are strictly those of Columbia Management and are subject to change without notice. Other divisions of Bank of America and/or affiliates of Columbia Management may have opinions that are inconsistent with these opinions.
International investing may involve certain risks, including foreign taxation, currency risks, risks associated with possible differences in financial standards and other risks associated with future political and economic developments. A portfolio of stocks from a single region poses additional risks due to limited diversification.
Investing in emerging markets may involve greater risks than investing in more developed countries. In addition, concentration of investments in a single region may result in greater volatility.
6
Investment Portfolio – Columbia Greater China Fund
August 31, 2008
Common Stocks – 97.3%
| | | | | | |
| | | | | Shares | | Value ($) |
| Consumer Discretionary – 5.3% | | | | | | |
| Automobiles – 1.4% | | Dongfeng Motor Group Co., Ltd., Class H | | 6,588,000 | | 2,782,630 |
| | Great Wall Motor Co., Ltd., Class H | | 1,760,682 | | 835,421 |
| | | | | | |
| | Automobiles Total | | | | 3,618,051 |
| | | |
| Distributors – 1.7% | | China Resources Enterprise Ltd. | | 1,140,000 | | 3,095,649 |
| | Li & Fung Ltd. | | 481,600 | | 1,473,685 |
| | | | | | |
| | Distributors Total | | | | 4,569,334 |
| | | |
Hotels, Restaurants &
Leisure – 0.1% | | Home Inns & Hotels Management, Inc., ADR (a) | | 15,005 | | 238,729 |
| | | | | | |
| | Hotels, Restaurants & Leisure Total | | | | 238,729 |
| | | |
| Media – 1.2% | | VisionChina Media, Inc., ADR (a) | | 161,942 | | 3,060,704 |
| | | | | | |
| | Media Total | | | | 3,060,704 |
| | | |
| Multiline Retail – 0.9% | | New World Department Store China Ltd. (a) | | 3,138,000 | | 2,359,333 |
| | | | | | |
| | Multiline Retail Total | | | | 2,359,333 |
| | | | | | |
| Consumer Discretionary Total | | | | | | 13,846,151 |
| | | | | | |
| Consumer Staples – 3.4% | | | | | | |
| Beverages – 0.3% | | Yantai Changyu Pioneer Wine Co., Class B | | 148,310 | | 851,474 |
| | | | | | |
| | Beverages Total | | | | 851,474 |
| | | |
| Food & Staples Retailing – 0.5% | | President Chain Store Corp. | | 406,000 | | 1,193,323 |
| | | | | | |
| | Food & Staples Retailing Total | | | | 1,193,323 |
| | | |
| Food Products – 2.6% | | China Mengniu Dairy Co., Ltd. | | 1,468,000 | | 4,434,470 |
| | Want Want China Holdings Ltd. | | 5,444,000 | | 2,424,042 |
| | | | | | |
| | Food Products Total | | | | 6,858,512 |
| | | | | | |
| Consumer Staples Total | | | | | | 8,903,309 |
| | | | | | |
| Energy – 22.7% | | | | | | |
Oil, Gas & Consumable
Fuels – 22.7% | | China Coal Energy Co., Class H | | 512,000 | | 860,204 |
| | China Petroleum & Chemical Corp., Class H | | 9,112,000 | | 8,847,828 |
| | China Shenhua Energy Co., Ltd., Class H | | 2,036,500 | | 6,972,688 |
| | CNOOC Ltd. | | 11,522,500 | | 17,940,732 |
| | PetroChina Co., Ltd., Class H | | 13,708,000 | | 17,695,606 |
| | Yanzhou Coal Mining Co., Ltd., Class H | | 3,736,000 | | 6,479,944 |
| | | | | | |
| | Oil, Gas & Consumable Fuels Total | | | | 58,797,002 |
| | | | | | |
| Energy Total | | | | | | 58,797,002 |
| | | | | | |
| Financials – 30.1% | | | | | | |
| Commercial Banks – 14.9% | | Bank of China Ltd., Class H | | 15,436,000 | | 6,655,502 |
| | China Merchants Bank Co., Ltd., Class H | | 4,718,300 | | 15,777,090 |
| | Industrial & Commercial Bank of China, Class H | | 23,412,000 | | 16,080,405 |
| | | | | | |
| | Commercial Banks Total | | | | 38,512,997 |
See Accompanying Notes to Financial Statements.
7
Columbia Greater China Fund
August 31, 2008
Common Stocks (continued)
| | | | | | |
| | | | | Shares | | Value ($) |
| Financials (continued) | | | | | | |
| Insurance – 8.6% | | China Life Insurance Co., Ltd., Class H | | 5,010,000 | | 19,164,113 |
| | Ping An Insurance Group Co., Ltd., Class H | | 424,500 | | 3,143,043 |
| | | | | | |
| | Insurance Total | | | | 22,307,156 |
| | | |
| Real Estate Management & Development – 6.6% | | Cheung Kong Holdings Ltd. | | 97,000 | | 1,384,268 |
| | China Vanke Co., Ltd., Class B | | 2,202,610 | | 1,973,510 |
| | Guangzhou R&F Properties Co. Ltd., Class H | | 3,114,000 | | 5,404,622 |
| | Shui On Land Ltd. | | 1,931,500 | | 1,470,631 |
| | Sun Hung Kai Properties Ltd. | | 139,000 | | 1,901,634 |
| | Swire Pacific Ltd., Class A | | 334,500 | | 3,338,232 |
| | Yanlord Land Group Ltd. | | 1,497,000 | | 1,671,758 |
| | | | | | |
| | Real Estate Management & Development Total | | | | 17,144,655 |
| | | | | | |
| Financials Total | | | | | | 77,964,808 |
| | | | | | |
| Health Care – 1.3% | | | | | | |
Health Care Equipment &
Supplies – 0.8% | | Mindray Medical International Ltd., ADR | | 52,577 | | 2,044,720 |
| | |
| | Health Care Equipment & Supplies Total | | | | 2,044,720 |
| | | |
| Pharmaceuticals – 0.5% | | China Shineway Pharmaceutical Group Ltd. | | 1,741,000 | | 1,248,451 |
| | | | | | |
| | Pharmaceuticals Total | | | | 1,248,451 |
| | | | | | |
| Health Care Total | | | | | | 3,293,171 |
| | | | | | |
| Industrials – 9.4% | | | | | | |
| Construction & Engineering – 1.6% | | China Communications Construction Co., Ltd., Class H | | 2,236,425 | | 3,791,167 |
| | China Railway Construction Corp., Class H (a) | | 295,500 | | 406,471 |
| | | | | | |
| | Construction & Engineering Total | | | | 4,197,638 |
| | | |
| Electrical Equipment – 2.1% | | China High Speed Transmission Equipment Group Co. Ltd. | | 74,000 | | 144,789 |
| | Harbin Power Equipment Co., Ltd., Class H | | 2,640,000 | | 3,265,238 |
| | Shanghai Electric Group Co., Ltd., Class H (a) | | 4,910,000 | | 2,022,862 |
| | | | | | |
| | Electrical Equipment Total | | | | 5,432,889 |
| | | |
| Machinery – 1.9% | | China National Material Co., Ltd., Class H (a) | | 2,380,000 | | 1,581,758 |
| | China South Locomotive and Rolling Stock Corp.,
Class H (a) | | 7,450,707 | | 2,988,073 |
| | Enric Energy Equipment Holdings Ltd. (a) | | 1,078,000 | | 451,970 |
| | | | | | |
| | Machinery Total | | | | 5,021,801 |
| | | |
| Marine – 1.6% | | China Shipping Development Co., Ltd., Class H | | 1,694,000 | | 3,994,316 |
| | | | | | |
| | Marine Total | | | | 3,994,316 |
See Accompanying Notes to Financial Statements.
8
Columbia Greater China Fund
August 31, 2008
Common Stocks (continued)
| | | | | | |
| | | | | Shares | | Value ($) |
| Industrials (continued) | | | | | | |
| Transportation Infrastructure – 2.2% | | China Merchants Holdings International Co., Ltd. | | 588,000 | | 2,173,275 |
| | Jiangsu Expressway Co., Ltd., Class H | | 1,662,000 | | 1,273,812 |
| | Sichuan Expressway Co., Ltd., Class H | | 3,908,000 | | 886,537 |
| | Zhejiang Expressway Co., Ltd., Class H | | 1,986,000 | | 1,331,383 |
| | | | | | |
| | Transportation Infrastructure Total | | | | 5,665,007 |
| | | | | | |
| Industrials Total | | | | | | 24,311,651 |
| | | | | | |
| Information Technology – 3.3% | | | | | | |
| Electronic Equipment & Instruments – 0.4% | | Wasion Meters Group Ltd. | | 3,342,000 | | 1,063,714 |
| | |
| | Electronic Equipment & Instruments Total | | | | 1,063,714 |
| | | |
Internet Software &
Services – 0.5% | | Tencent Holdings Ltd. | | 144,800 | | 1,233,106 |
| | |
| | Internet Software & Services Total | | | | 1,233,106 |
| | | |
| Software – 2.4% | | Kingdee International Software Group Co., Ltd. | | 5,876,000 | | 1,349,743 |
| | Perfect World Co., Ltd., ADR (a) | | 199,849 | | 5,016,210 |
| | | | | | |
| | Software Total | | | | 6,365,953 |
| | | | | | |
| Information Technology Total | | | | | | 8,662,773 |
| | | | | | |
| Materials – 2.5% | | | | | | |
| Metals & Mining – 2.5% | | Aluminum Corp. of China Ltd., Class H | | 5,198,000 | | 4,606,437 |
| | Hidili Industry International Development Ltd. | | 136,000 | | 158,418 |
| | Zijin Mining Group Co., Ltd., Class H | | 2,368,000 | | 1,609,619 |
| | | | | | |
| | Metals & Mining Total | | | | 6,374,474 |
| | | | | | |
| Materials Total | | | | | | 6,374,474 |
| | | | | | |
| Telecommunication Services – 18.0% | | | | |
| Diversified Telecommunication Services – 1.8% | | China Telecom Corp., Ltd., Class H | | 8,892,000 | | 4,542,496 |
| | |
| | Diversified Telecommunication Services Total | | | | 4,542,496 |
| | | |
| Wireless Telecommunication Services – 16.2% | | China Mobile Ltd. | | 3,690,500 | | 41,957,729 |
| | |
| | Wireless Telecommunication Services Total | | | | 41,957,729 |
| | | | | | |
| Telecommunication Services Total | | | | | | 46,500,225 |
| | | | | | |
| Utilities – 1.3% | | | | | | |
| Independent Power Producers & Energy Traders – 1.3% | | China Resources Power Holdings Co., Ltd. | | 392,000 | | 968,705 |
| | Datang International Power Generation Co., Ltd., Class H | | 3,532,000 | | 2,329,570 |
| | |
| | Independent Power Producers & Energy Traders Total | | 3,298,275 |
| | | | | | |
| Utilities Total | | | | | | 3,298,275 |
| | Total Common Stocks
(Cost of $166,259,184) | | | | 251,951,839 |
See Accompanying Notes to Financial Statements.
9
Columbia Greater China Fund
August 31, 2008
Short-Term Obligation – 2.0%
| | | | | | |
| | | | | Par ($) | | Value ($) |
| | | | | | | |
| | Repurchase agreement with Fixed Income Clearing Corp., dated 08/29/08, due 09/02/08 at 1.930%, collateralized by a U.S. Treasury Obligation maturing 05/15/09, market value of $5,308,013 (repurchase proceeds $5,201,115) | | 5,200,000 | | 5,200,000 |
| | |
| | Total Short-Term Obligation (Cost of $5,200,000) | | | | 5,200,000 |
| |
| | |
| | Total Investments – 99.3% (Cost of $171,459,184) (b) | | 257,151,839 |
| |
| | |
| | Other Assets & Liabilities, Net – 0.7% | | | | 1,929,970 |
| |
| | |
| | Net Assets – 100.0% | | | | 259,081,809 |
Notes to Investment Portfolio:
| | (a) | Non-income producing security. |
| | (b) | Cost for federal income tax purposes is $172,527,000. |
The Fund was invested in the following countries at August 31, 2008:
| | | | | | |
Country (Unaudited) | | Value | | % of Total Investments | |
China | | $ | 176,326,534 | | 68.5 | % |
Hong Kong | | | 72,760,224 | | 28.3 | |
United States* | | | 5,200,000 | | 2.0 | |
Singapore | | | 1,671,758 | | 0.7 | |
Taiwan | | | 1,193,323 | | 0.5 | |
| | | | | | |
| | $ | 257,151,839 | | 100.0 | |
| | | | | | |
* Represents short-term obligation.
Certain securities are listed by country of underlying exposure but may trade predominantly on other exchanges.
At August 31, 2008, the Fund held investments in the following sectors:
| | | |
Sector (Unaudited) | | % of Net Assets | |
Financials | | 30.1 | % |
Energy | | 22.7 | |
Telecommunication Services | | 18.0 | |
Industrials | | 9.4 | |
Consumer Discretionary | | 5.3 | |
Consumer Staples | | 3.4 | |
Information Technology | | 3.3 | |
Materials | | 2.5 | |
Health Care | | 1.3 | |
Utilities | | 1.3 | |
| | | |
| | 97.3 | |
Short-Term Obligation | | 2.0 | |
Other Assets & Liabilities, Net | | 0.7 | |
| | | |
| | 100.0 | % |
| | | |
| | |
Acronym | | Name |
| ADR | | American Depositary Receipt |
See Accompanying Notes to Financial Statements.
10
Statement of Assets and Liabilities – Columbia Greater China Fund
August 31, 2008
| | | | | |
| | | | | ($) | |
| Assets | | Investments, at cost | | 171,459,184 | |
| | | | | |
| | Investments, at value | | 257,151,839 | |
| | Cash | | 616 | |
| | Foreign currency (cost of $104,575) | | 104,423 | |
| | Receivable for: | | | |
| | Investments sold | | 2,173,618 | |
| | Fund shares sold | | 447,664 | |
| | Interest | | 836 | |
| | Dividends | | 20,340 | |
| | Trustees’ deferred compensation plan | | 20,046 | |
| | Other assets | | 1,958 | |
| | | |
| | Total Assets | | 259,921,340 | |
| | |
| Liabilities | | Payable for: | | | |
| | Fund shares repurchased | | 312,693 | |
| | Investment advisory fee | | 207,521 | |
| | Transfer agent fee | | 89,334 | |
| | Pricing and bookkeeping fees | | 8,719 | |
| | Trustees’ fees | | 310 | |
| | Custody fee | | 45,014 | |
| | Distribution and service fees | | 85,286 | |
| | Chief compliance officer expenses | | 120 | |
| | Trustees’ deferred compensation plan | | 20,046 | |
| | Other liabilities | | 70,488 | |
| | | |
| | Total Liabilities | | 839,531 | |
| |
| | | |
| | Net Assets | | 259,081,809 | |
| | |
| Net Assets Consist of | | Paid-in capital | | 171,961,401 | |
| | Overdistributed net investment income | | (1,091,745 | ) |
| | Accumulated net realized gain | | 2,519,791 | |
| | Net unrealized appreciation (depreciation) on: | | | |
| | Investments | | 85,692,655 | |
| | Foreign currency translations | | (293 | ) |
| | | |
| | Net Assets | | 259,081,809 | |
See Accompanying Notes to Financial Statements.
11
Statement of Assets and Liabilities (continued) – Columbia Greater China Fund
August 31, 2008
| | | | | | |
| | | | | | |
| Class A | | Net assets | | $ | 154,413,088 | |
| | Shares outstanding | | | 3,317,938 | |
| | Net asset value per share | | $ | 46.54 | (a) |
| | Maximum sales charge | | | 5.75 | % |
| | Maximum offering price per share | | $ | 49.38 | (b) |
| | |
| Class B | | | | | | |
| | Net assets | | $ | 21,879,702 | |
| | Shares outstanding | | | 483,104 | |
| | Net asset value and offering price per share | | $ | 45.29 | (a) |
| | |
| Class C | | | | | | |
| | Net assets | | $ | 39,619,507 | |
| | Shares outstanding | | | 863,420 | |
| | Net asset value and offering price per share | | $ | 45.89 | (a) |
| | |
| Class Z | | | | | | |
| | Net assets | | $ | 43,169,512 | |
| | Shares outstanding | | | 892,290 | |
| | Net asset value, offering and redemption price per share | | $ | 48.38 | (a) |
| (a) | Redemption price per share is equal to net asset value less any applicable contingent deferred sales charge and / or any applicable redemption fees. |
| (b) | On sales of $50,000 or more the offering price is reduced. |
See Accompanying Notes to Financial Statements.
12
Statement of Operations – Columbia Greater China Fund
For the Year Ended August 31, 2008
| | | | | |
| | | | | ($) | |
| Investment Income | | Dividends | | 6,080,440 | |
| | Interest | | 291,279 | |
| | Foreign tax withheld | | (11,188 | ) |
| | | |
| | Total Investment Income | | 6,360,531 | |
| | |
| Expenses | | Investment advisory fee | | 3,149,033 | |
| | Distribution fee: | | | |
| | Class B | | 237,241 | |
| | Class C | | 408,904 | |
| | Service fee: | �� | | |
| | Class A | | 476,281 | |
| | Class B | | 79,080 | |
| | Class C | | 136,301 | |
| | Transfer agent fee | | 470,316 | |
| | Pricing and bookkeeping fees | | 103,082 | |
| | Trustees’ fees | | 26,017 | |
| | Custody fee | | 310,201 | |
| | Chief compliance officer expenses | | 687 | |
| | Other expenses | | 253,270 | |
| | | |
| | Expenses before interest expense | | 5,650,413 | |
| | |
| | Interest expense | | 391 | |
| | | |
| | Total Expenses | | 5,650,804 | |
| | |
| | Expense reductions | | (1,755 | ) |
| | | |
| | Net Expenses | | 5,649,049 | |
| |
| | | |
| | Net Investment Income | | 711,482 | |
| | |
| Net Realized and Unrealized Gain (Loss) on Investments and Foreign Currency | | Net realized gain (loss) on: | | | |
| | Investments | | 3,477,292 | |
| | Foreign currency transactions | | (22,070 | ) |
| | | |
| | Net realized gain | | 3,455,222 | |
| | |
| | Net change in unrealized depreciation on: | | | |
| | Investments | | (77,323,576 | ) |
| | Foreign currency translations | | (531 | ) |
| | | |
| | Net change in unrealized depreciation | | (77,324,107 | ) |
| | | |
| | Net Loss | | (73,868,885 | ) |
| |
| | | |
| | Net Decrease Resulting from Operations | | (73,157,403 | ) |
See Accompanying Notes to Financial Statements.
13
Statement of Changes in Net Assets – Columbia Greater China Fund
| | | | | | | | |
| | | Year Ended August 31, | |
| Increase (Decrease) in Net Assets | | | | 2008 ($) | | | 2007 ($) | |
| Operations | | Net investment income | | 711,482 | | | 995,475 | |
| | Net realized gain on investments and foreign currency transactions | | 3,455,222 | | | 23,371,483 | |
| | Net change in unrealized appreciation
(depreciation) on investments and foreign currency translations | | (77,324,107 | ) | | 117,684,130 | |
| | | |
| | Net Increase (Decrease) Resulting from Operations | | (73,157,403 | ) | | 142,051,088 | |
| | | |
| Distributions to Shareholders | | From net investment income: | | | | | | |
| | Class A | | (1,533,100 | ) | | (768,683 | ) |
| | Class B | | (37,622 | ) | | (4,865 | ) |
| | Class C | | (60,761 | ) | | (6,946 | ) |
| | Class Z | | (558,619 | ) | | (232,689 | ) |
| | From net realized gains: | | | | | | |
| | Class A | | (110,894 | ) | | — | |
| | Class B | | (18,405 | ) | | — | |
| | Class C | | (31,737 | ) | | — | |
| | Class Z | | (31,891 | ) | | — | |
| | | |
| | Total Distributions to Shareholders | | (2,383,029 | ) | | (1,013,183 | ) |
| | | |
| | Net Increase from Share Transactions | | 16,096,246 | | | 33,343,346 | |
| | Redemption fees | | 281,680 | | | 145,677 | |
| |
| | | |
| | Total Increase (Decrease) in Net Assets | | (59,162,506 | ) | | 174,526,928 | |
| | | |
| Net Assets | | Beginning of period | | 318,244,315 | | | 143,717,387 | |
| | End of period | | 259,081,809 | | | 318,244,315 | |
| | Undistributed (overdistributed) net investment income, at end of period | | (1,091,745 | ) | | 408,943 | |
See Accompanying Notes to Financial Statements.
14
Statement of Changes in Net Assets – Capital Stock Activity
| | | | | | | | | | | | | | |
| | | Year Ended August 31, | |
| | | 2008 | | | | | 2007 | |
| | | Shares | | | Dollars ($) | | | | | Shares | | | Dollars ($) | |
Changes in Shares | | | | | | | | | | | | | | |
Class A | | | | | | | | | | | | | | |
Subscriptions | | 1,730,069 | | | 104,544,490 | | | | | 1,598,093 | | | 66,437,292 | |
Distributions reinvested | | 19,701 | | | 1,325,719 | | | | | 14,734 | | | 586,557 | |
Redemptions | | (1,492,314 | ) | | (87,305,080 | ) | | | | (1,200,888 | ) | | (53,775,840 | ) |
| | | | | | | | | | | | | | |
Net increase | | 257,456 | | | 18,565,129 | | | | | 411,939 | | | 13,248,009 | |
| | | | | |
Class B | | | | | | | | | | | | | | |
Subscriptions | | 131,288 | | | 8,339,012 | | | | | 201,821 | | | 8,367,025 | |
Distributions reinvested | | 622 | | | 40,941 | | | | | 91 | | | 3,540 | |
Redemptions | | (233,622 | ) | | (13,754,705 | ) | | | | (168,647 | ) | | (7,077,338 | ) |
| | | | | | | | | | | | | | |
Net increase (decrease) | | (101,712 | ) | | (5,374,752 | ) | | | | 33,265 | | | 1,293,227 | |
| | | | | |
Class C | | | | | | | | | | | | | | |
Subscriptions | | 413,269 | | | 26,697,199 | | | | | 527,396 | | | 21,967,604 | |
Distributions reinvested | | 1,022 | | | 68,125 | | | | | 123 | | | 4,881 | |
Redemptions | | (445,649 | ) | | (26,526,154 | ) | | | | (337,174 | ) | | (14,578,840 | ) |
| | | | | | | | | | | | | | |
Net increase (decrease) | | (31,358 | ) | | 239,170 | | | | | 190,345 | | | 7,393,645 | |
| | | | | |
Class Z | | | | | | | | | | | | | | |
Subscriptions | | 529,511 | | | 33,769,297 | | | | | 625,073 | | | 27,795,899 | |
Distributions reinvested | | 5,749 | | | 401,400 | | | | | 3,492 | | | 144,105 | |
Redemptions | | (509,570 | ) | | (31,503,998 | ) | | | | (360,691 | ) | | (16,531,539 | ) |
| | | | | | | | | | | | | | |
Net increase | | 25,690 | | | 2,666,699 | | | | | 267,874 | | | 11,408,465 | |
See Accompanying Notes to Financial Statements.
15
Financial Highlights – Columbia Greater China Fund
Selected data for a share outstanding throughout each period is as follows:
| | | | | | | | | | | | | | | | | | | | |
| | | Year Ended August 31, | |
| Class A Shares | | 2008 | | | 2007 | | | 2006 | | | 2005 | | | 2004 | |
Net Asset Value, Beginning of Period | | $ | 58.78 | | | $ | 31.90 | | | $ | 24.68 | | | $ | 20.64 | | | $ | 17.88 | |
| | | | | |
Income from Investment Operations: | | | | | | | | | | | | | | | | | | | | |
Net investment income (a) | | | 0.22 | | | | 0.26 | | | | 0.26 | | | | 0.31 | | | | 0.17 | |
Net realized and unrealized gain (loss) on investments and foreign currency | | | (12.02 | ) | | | 26.86 | | | | 7.41 | | | | 3.94 | | | | 2.70 | |
| | | | | | | | | | | | | | | | | | | | |
Total from Investment Operations | | | (11.80 | ) | | | 27.12 | | | | 7.67 | | | | 4.25 | | | | 2.87 | |
| | | | | |
Less Distributions to Shareholders: | | | | | | | | | | | | | | | | | | | | |
From net investment income | | | (0.46 | ) | | | (0.24 | ) | | | (0.45 | ) | | | (0.21 | ) | | | (0.11 | ) |
From net realized gains | | | (0.03 | ) | | | — | | | | — | | | | — | | | | — | |
| | | | | | | | | | | | | | | | | | | | |
Total Distributions to Shareholders | | | (0.49 | ) | | | (0.24 | ) | | | (0.45 | ) | | | (0.21 | ) | | | (0.11 | ) |
| | | | | |
Redemption fees: | | | | | | | | | | | | | | | | | | | | |
Redemption fees added to paid-in-capital (a) | | | 0.05 | | | | — | (b) | | | — | (b) | | | — | (b) | | | — | (b) |
| | | | | |
Net Asset Value, End of Period | | $ | 46.54 | | | $ | 58.78 | | | $ | 31.90 | | | $ | 24.68 | | | $ | 20.64 | |
Total return (c) | | | (20.24 | )% | | | 85.39 | % | | | 31.55 | %(d)(e) | | | 20.66 | % | | | 16.11 | % |
| | | | | |
Ratios to Average Net Assets/Supplemental Data: | | | | | | | | | | | | | | | | | | | | |
Net expenses before interest expense (f) | | | 1.55 | % | | | 1.59 | % | | | 1.73 | % | | | 1.76 | % | | | 1.89 | % |
Interest expense | | | — | %(g) | | | — | %(g) | | | — | | | | — | | | | — | |
Net expenses (f) | | | 1.55 | % | | | 1.59 | % | | | 1.73 | % | | | 1.76 | % | | | 1.89 | % |
Waiver/Reimbursement | | | — | | | | — | | | | 0.01 | % | | | — | | | | — | |
Net investment income (f) | | | 0.37 | % | | | 0.61 | % | | | 0.93 | % | | | 1.35 | % | | | 0.84 | % |
Portfolio turnover rate | | | 16 | % | | | 36 | % | | | 32 | % | | | 24 | % | | | 25 | % |
Net assets, end of period (000’s) | | $ | 154,413 | | | $ | 179,902 | | | $ | 84,492 | | | $ | 53,975 | | | $ | 47,282 | |
| (a) | Per share data was calculated using the average shares outstanding during the period. |
| (b) | Rounds to less than $0.01 per share. |
| (c) | Total return at net asset value assuming all distributions reinvested and no initial sales charge or contingent deferred sales charge. |
| (d) | Had the investment advisor and/or any of its affiliates not waived fees or reimbursed a portion of expenses, total return would have been reduced. |
| (e) | Includes a voluntary reimbursement by the investment advisor for a realized investment loss due to a trading error. |
| | This reimbursement increased total return and net asset value per share by 0.03% and $0.01, respectively. |
| (f) | The benefits derived from expense reductions had an impact of less than 0.01%. |
| (g) | Rounds to less than 0.01%. |
See Accompanying Notes to Financial Statements.
16
Financial Highlights – Columbia Greater China Fund
Selected data for a share outstanding throughout each period is as follows:
| | | | | | | | | | | | | | | | | | | | |
| | | Year Ended August 31, | |
| Class B Shares | | 2008 | | | 2007 | | | 2006 | | | 2005 | | | 2004 | |
Net Asset Value, Beginning of Period | | $ | 57.29 | | | $ | 31.14 | | | $ | 24.11 | | | $ | 20.18 | | | $ | 17.51 | |
| | | | | |
Income from Investment Operations: | | | | | | | | | | | | | | | | | | | | |
Net investment income (loss) (a) | | | (0.23 | ) | | | (0.06 | ) | | | 0.05 | | | | 0.14 | | | | 0.05 | |
Net realized and unrealized gain (loss) on investments and foreign currency | | | (11.73 | ) | | | 26.22 | | | | 7.25 | | | | 3.85 | | | | 2.62 | |
| | | | | | | | | | | | | | | | | | | | |
Total from Investment Operations | | | (11.96 | ) | | | 26.16 | | | | 7.30 | | | | 3.99 | | | | 2.67 | |
| | | | | |
Less Distributions to Shareholders: | | | | | | | | | | | | | | | | | | | | |
From net investment income | | | (0.06 | ) | | | (0.01 | ) | | | (0.27 | ) | | | (0.06 | ) | | | — | |
From net realized gains | | | (0.03 | ) | | | — | | | | — | | | | — | | | | — | |
| | | | | | | | | | | | | | | | | | | | |
Total Distributions to Shareholders | | | (0.09 | ) | | | (0.01 | ) | | | (0.27 | ) | | | (0.06 | ) | | | — | |
| | | | | |
Redemption fees: | | | | | | | | | | | | | | | | | | | | |
Redemption fees added to paid-in-capital (a) | | | 0.05 | | | | — | (b) | | | — | (b) | | | — | (b) | | | — | (b) |
| | | | | |
Net Asset Value, End of Period | | $ | 45.29 | | | $ | 57.29 | | | $ | 31.14 | | | $ | 24.11 | | | $ | 20.18 | |
Total return (c) | | | (20.83 | )% | | | 84.01 | % | | | 30.57 | %(d)(e) | | | 19.77 | % | | | 15.25 | % |
| | | | | |
Ratios to Average Net Assets/Supplemental Data: | | | | | | | | | | | | | | | | | | | | |
Net expenses before interest expense (f) | | | 2.30 | % | | | 2.34 | % | | | 2.48 | % | | | 2.51 | % | | | 2.64 | % |
Interest expense | | | — | %(g) | | | — | %(g) | | | — | | | | — | | | | — | |
Net expenses (f) | | | 2.30 | % | | | 2.34 | % | | | 2.48 | % | | | 2.51 | % | | | 2.64 | % |
Waiver/Reimbursement | | | — | | | | — | | | | 0.01 | % | | | — | | | | — | |
Net investment income (loss) (f) | | | (0.40 | )% | | | (0.14 | )% | | | 0.19 | % | | | 0.60 | % | | | 0.23 | % |
Portfolio turnover rate | | | 16 | % | | | 36 | % | | | 32 | % | | | 24 | % | | | 25 | % |
Net assets, end of period (000’s) | | $ | 21,880 | | | $ | 33,502 | | | $ | 17,176 | | | $ | 12,680 | | | $ | 10,471 | |
| (a) | Per share data was calculated using the average shares outstanding during the period. |
| (b) | Rounds to less than $0.01 per share. |
| (c) | Total return at net asset value assuming all distributions reinvested and no contingent deferred sales charge. |
| (d) | Had the investment advisor and/or any of its affiliates not waived fees or reimbursed a portion of expenses, total return would have been reduced. |
| (e) | Includes a voluntary reimbursement by the investment advisor for a realized investment loss due to a trading error. |
| | This reimbursement increased total return and net asset value per share by 0.03% and $0.01, respectively. |
| (f) | The benefits derived from expense reductions had an impact of less than 0.01%. |
| (g) | Rounds to less than 0.01%. |
See Accompanying Notes to Financial Statements.
17
Financial Highlights – Columbia Greater China Fund
Selected data for a share outstanding throughout each period is as follows:
| | | | | | | | | | | | | | | | | | | | |
| | | Year Ended August 31, | |
| Class C Shares | | 2008 | | | 2007 | | | 2006 | | | 2005 | | | 2004 | |
Net Asset Value, Beginning of Period | | $ | 58.05 | | | $ | 31.56 | | | $ | 24.43 | | | $ | 20.45 | | | $ | 17.76 | |
| | | | | |
Income from Investment Operations: | | | | | | | | | | | | | | | | | | | | |
Net investment income (loss) (a) | | | (0.22 | ) | | | (0.07 | ) | | | 0.05 | | | | 0.14 | | | | 0.04 | |
Net realized and unrealized gain (loss) on investments and foreign currency | | | (11.90 | ) | | | 26.57 | | | | 7.35 | | | | 3.90 | | | | 2.65 | |
| | | | | | | | | | | | | | | | | | | | |
Total from Investment Operations | | | (12.12 | ) | | | 26.50 | | | | 7.40 | | | | 4.04 | | | | 2.69 | |
| | | | | |
Less Distributions to Shareholders: | | | | | | | | | | | | | | | | | | | | |
From net investment income | | | (0.06 | ) | | | (0.01 | ) | | | (0.27 | ) | | | (0.06 | ) | | | — | |
From net realized gains | | | (0.03 | ) | | | — | | | | — | | | | — | | | | — | |
| | | | | | | | | | | | | | | | | | | | |
Total Distributions to Shareholders | | | (0.09 | ) | | | (0.01 | ) | | | (0.27 | ) | | | (0.06 | ) | | | — | |
| | | | | |
Redemption fees: | | | | | | | | | | | | | | | | | | | | |
Redemption fees added to paid-in-capital (a) | | | 0.05 | | | | — | (b) | | | — | (b) | | | — | (b) | | | — | (b) |
| | | | | |
Net Asset Value, End of Period | | $ | 45.89 | | | $ | 58.05 | | | $ | 31.56 | | | $ | 24.43 | | | $ | 20.45 | |
Total return (c) | | | (20.84 | )% | | | 83.97 | % | | | 30.58 | %(d)(e) | | | 19.75 | % | | | 15.15 | % |
| | | | | |
Ratios to Average Net Assets/Supplemental Data: | | | | | | | | | | | | | | | | | | | | |
Net expenses before interest expense (f) | | | 2.30 | % | | | 2.34 | % | | | 2.48 | % | | | 2.51 | % | | | 2.64 | % |
Interest expense | | | — | %(g) | | | — | %(g) | | | — | | | | — | | | | — | |
Net expenses (f) | | | 2.30 | % | | | 2.34 | % | | | 2.48 | % | | | 2.51 | % | | | 2.64 | % |
Waiver/Reimbursement | | | — | | | | — | | | | 0.01 | % | | | — | | | | — | |
Net investment income (loss) (f) | | | (0.38 | )% | | | (0.17 | )% | | | 0.20 | % | | | 0.60 | % | | | 0.20 | % |
Portfolio turnover rate | | | 16 | % | | | 36 | % | | | 32 | % | | | 24 | % | | | 25 | % |
Net assets, end of period (000’s) | | $ | 39,620 | | | $ | 51,938 | | | $ | 22,229 | | | $ | 13,853 | | | $ | 9,436 | |
| (a) | Per share data was calculated using the average shares outstanding during the period. |
| (b) | Rounds to less than $0.01 per share. |
| (c) | Total return at net asset value assuming all distributions reinvested and no contingent deferred sales charge. |
| (d) | Had the investment advisor and/or any of its affiliates not waived fees or reimbursed a portion of expenses, total return would have been reduced. |
| (e) | Includes a voluntary reimbursement by the investment advisor for a realized investment loss due to a trading error. |
| | This reimbursement increased total return and net asset value per share by 0.03% and $0.01, respectively. |
| (f) | The benefits derived from expense reductions had an impact of less than 0.01%. |
| (g) | Rounds to less than 0.01%. |
See Accompanying Notes to Financial Statements.
18
Financial Highlights – Columbia Greater China Fund
Selected data for a share outstanding throughout each period is as follows:
| | | | | | | | | | | | | | | | | | | | |
| | | Year Ended August 31, | |
| Class Z Shares | | 2008 | | | 2007 | | | 2006 | | | 2005 | | | 2004 | |
Net Asset Value, Beginning of Period | | $ | 61.05 | | | $ | 33.10 | | | $ | 25.59 | | | $ | 21.38 | | | $ | 18.51 | |
| | | | | |
Income from Investment Operations: | | | | | | | | | | | | | | | | | | | | |
Net investment income (a) | | | 0.38 | | | | 0.37 | | | | 0.37 | | | | 0.40 | | | | 0.22 | |
Net realized and unrealized gain (loss) on investments and foreign currency | | | (12.47 | ) | | | 27.90 | | | | 7.65 | | | | 4.07 | | | | 2.81 | |
| | | | | | | | | | | | | | | | | | | | |
Total from Investment Operations | | | (12.09 | ) | | | 28.27 | | | | 8.02 | | | | 4.47 | | | | 3.03 | |
| | | | | |
Less Distributions to Shareholders: | | | | | | | | | | | | | | | | | | | | |
From net investment income | | | (0.60 | ) | | | (0.32 | ) | | | (0.51 | ) | | | (0.26 | ) | | | (0.16 | ) |
From net realized gains | | | (0.03 | ) | | | — | | | | — | | | | — | | | | — | |
| | | | | | | | | | | | | | | | | | | | |
Total Distributions to Shareholders | | | (0.63 | ) | | | (0.32 | ) | | | (0.51 | ) | | | (0.26 | ) | | | (0.16 | ) |
| | | | | |
Redemption fees: | | | | | | | | | | | | | | | | | | | | |
Redemption fees added to paid-in-capital (a) | | | 0.05 | | | | — | (b) | | | — | (b) | | | — | (b) | | | — | (b) |
| | | | | |
Net Asset Value, End of Period | | $ | 48.38 | | | $ | 61.05 | | | $ | 33.10 | | | $ | 25.59 | | | $ | 21.38 | |
Total return (c) | | | (20.04 | )% | | | 85.88 | % | | | 31.86 | %(d)(e) | | | 21.00 | % | | | 16.44 | % |
| | | | | |
Ratios to Average Net Assets/Supplemental Data: | | | | | | | | | | | | | | | | | | | | |
Net expenses before interest expense (f) | | | 1.30 | % | | | 1.34 | % | | | 1.48 | % | | | 1.51 | % | | | 1.64 | % |
Interest expense | | | — | %(g) | | | — | %(g) | | | — | | | | — | | | | — | |
Net expenses (f) | | | 1.30 | % | | | 1.34 | % | | | 1.48 | % | | | 1.51 | % | | | 1.64 | % |
Waiver/Reimbursement | | | — | | | | — | | | | 0.01 | % | | | — | | | | — | |
Net investment income (f) | | | 0.62 | % | | | 0.82 | % | | | 1.25 | % | | | 1.60 | % | | | 1.06 | % |
Portfolio turnover rate | | | 16 | % | | | 36 | % | | | 32 | % | | | 24 | % | | | 25 | % |
Net assets, end of period (000’s) | | $ | 43,170 | | | $ | 52,903 | | | $ | 19,821 | | | $ | 9,012 | | | $ | 5,182 | |
| (a) | Per share data was calculated using the average shares outstanding during the period. |
| (b) | Rounds to less than $0.01 per share. |
| (c) | Total return at net asset value assuming all distributions reinvested. |
| (d) | Had the investment advisor and/or any of its affiliates not waived fees or reimbursed a portion of expenses, total return would have been reduced. |
| (e) | Includes a voluntary reimbursement by the investment advisor for a realized investment loss due to a trading error. |
| | This reimbursement increased total return and net asset value per share by 0.03% and $0.01, respectively. |
| (f) | The benefits derived from expense reductions had an impact of less than 0.01%. |
| (g) | Rounds to less than 0.01%. |
See Accompanying Notes to Financial Statements.
19
Notes to Financial Statements – Columbia Greater China Fund
August 31, 2008
Note 1. Organization
Columbia Greater China Fund (the “Fund”), a series of Columbia Funds Series Trust I (the “Trust”), is a non-diversified fund. The Trust is a Massachusetts business trust registered under the Investment Company Act of 1940, as amended, as an open-end management investment company.
Investment Objective
The Fund seeks long-term capital appreciation.
Fund Shares
The Trust may issue an unlimited number of shares, and the Fund offers four classes of shares: Class A, Class B, Class C and Class Z. Each share class has its own expense structure and sales charges, as applicable.
Class A shares are subject to a maximum front-end sales charge of 5.75% based on the amount of initial investment. Class A shares purchased without an initial sales charge in accounts aggregating $1 million to $50 million at the time of purchase are subject to a 1.00% contingent deferred sales charge (“CDSC”) if the shares are sold within one year after purchase. Class B shares are subject to a maximum CDSC of 5.00% based upon the holding period after purchase. Class B shares will convert to Class A shares eight years after purchase. Class C shares are subject to a 1.00% CDSC on shares sold within one year after purchase. Class Z shares are offered continuously at net asset value. There are certain restrictions on the purchase of Class Z shares, as described in the Fund’s prospectus.
Note 2. Significant Accounting Policies
The preparation of financial statements in accordance with accounting principles generally accepted in the United States of America (“GAAP”) requires management to make certain estimates and assumptions that affect the reported amounts of assets and liabilities, the disclosure of contingent assets and liabilities at the date of the financial statements and the reported amounts of revenue and expenses during the reporting period. Actual results could differ from those estimates. The following is a summary of significant accounting policies consistently followed by the Fund in the preparation of its financial statements.
Security Valuation
Equity securities are valued at the last sale price on the principal exchange on which they trade, except for securities traded on the NASDAQ, which are valued at the NASDAQ official close price. Unlisted securities or listed securities for which there were no sales during the day are valued at the closing bid price on such exchanges or over-the-counter markets.
Short-term debt obligations maturing within 60 days are valued at amortized cost, which approximates market value.
Foreign securities are generally valued at the last sale price on the foreign exchange or market on which they trade. If any foreign share prices are not readily available as a result of limited share activity, the securities are valued at the last sale price of the local shares in the principal market in which such securities are normally traded.
Generally, trading in foreign securities is substantially completed each day at various times prior to the close of the New York Stock Exchange (“NYSE”). The values of such securities used in computing the net asset value of the Fund’s shares are determined as of such times. Foreign currency exchange rates are generally determined at 4:00 p.m. Eastern (U.S.) time. Events affecting the values of such foreign securities and such exchange rates may occur between the times at which they are determined and the close of the customary trading session of the NYSE, which would not be reflected in the computation of the Fund’s net asset value. If events materially affecting the values of such foreign securities occur and it is determined that market quotations are not reliable, then these foreign securities will be valued at their fair value using procedures approved by the Board of Trustees.
The Fund may use a systematic fair valuation model provided by an independent third party to value securities principally traded in foreign markets in order to adjust for possible stale pricing that may occur between the close of the foreign exchanges and the time for valuation.
Investments for which market quotations are not readily available, or that have quotations which Columbia believes are not reliable, are valued at fair value as determined in good faith under consistently applied procedures established by and under the general supervision of the Board of Trustees. If
20
Columbia Greater China Fund
August 31, 2008
a security is valued at fair value, such value is likely to be different from the last quoted market price for the security.
In September 2006, Statement of Financial Accounting Standards No. 157, Fair Value Measurements (“SFAS 157”), was issued. SFAS 157 is effective for fiscal years beginning after November 15, 2007. SFAS 157 defines fair value, establishes a framework for measuring fair value and expands disclosures about fair value measurements. Management is evaluating the impact the application of SFAS 157 will have on the Fund’s financial statement disclosures.
Security Transactions
Security transactions are accounted for on the trade date. Cost is determined and gains (losses) are based upon the specific identification method for both financial statement and federal income tax purposes.
In March 2008, Statement of Financial Accounting Standards No. 161 (“SFAS 161”), Disclosures about Derivative Instruments and Hedging Activities-an amendment of FASB Statement No. 133, was issued. SFAS 161 is effective for fiscal years beginning after November 15, 2008. SFAS 161 requires additional discussion about the reporting entity’s derivative instruments and hedging activities, by providing for qualitative disclosures about the objectives and strategies for using derivatives, quantitative data about the fair value of and gains and losses on derivative contracts, and details of credit-risk-related contingent features in their hedged positions. Management is evaluating the impact the application of SFAS 161 will have on the Fund’s financial statement disclosures.
Repurchase Agreements
The Fund may engage in repurchase agreement transactions with institutions that Columbia Management Advisors, LLC (“Columbia”), the Fund’s investment advisor, has determined are creditworthy. The Fund, through its custodian, receives delivery of the underlying securities collateralizing a repurchase agreement. Columbia is responsible for determining that the collateral is at least equal, at all times, to the value of the repurchase obligation including interest. A repurchase agreement transaction involves certain risks in the event of default or insolvency of the counterparty. These risks include possible delays or restrictions on the Fund’s ability to dispose of the underlying securities and a possible decline in the value of the underlying securities during the period while the Fund seeks to assert its rights.
Foreign Currency Transactions
The values of all assets and liabilities quoted in foreign currencies are translated into U.S. dollars at that day’s exchange rates. Net realized and unrealized gains (losses) on foreign currency transactions include gains (losses) arising from the fluctuation in exchange rates between trade and settlement dates on securities transactions, gains (losses) arising from the disposition of foreign currency and currency gains (losses) between the accrual and payment dates on dividends, interest income and foreign withholding taxes.
For financial statement purposes, the Fund does not distinguish that portion of gains (losses) on investments which is due to changes in foreign exchange rates from that which is due to changes in market prices of the investments. Such fluctuations are included with the net realized and unrealized gains (losses) on investments on the Statement of Operations.
Income Recognition
Interest income is recorded on the accrual basis.Corporate actions and dividend income are recorded on the ex-date except for certain foreign securities which are recorded as soon after the ex-date as the Fund becomes aware of such, net of any non-reclaimable tax withholdings.
Expenses
General expenses of the Trust are allocated to the Fund and the other series of the Trust based upon relative net assets or other expense allocation methodologies determined by the nature of the expense. Expenses directly attributable to the Fund are charged to the Fund.
Determination of Class Net Asset Value
All income, expenses (other than class-specific expenses, as shown on the Statement of Operations) and realized and unrealized gains (losses) are allocated to each class of the Fund on a daily basis, based on the relative net assets of each class, for purposes of determining the net asset value of each class.
21
Columbia Greater China Fund
August 31, 2008
Federal Income Tax Status
The Fund intends to qualify each year as a “regulated investment company” under Subchapter M of the Internal Revenue Code, as amended, and will distribute substantially all of its tax exempt or taxable income, if any, for its tax year, and as such will not be subject to federal income taxes. In addition, the Fund intends to distribute in each calendar year substantially all of its net investment income, capital gains and certain other amounts, if any, such that the Fund should not be subject to federal excise tax. Therefore, no federal income or excise tax provision is recorded.
Distributions to Shareholders
Normally, distributions of net investment income, if any, are declared and distributed annually. Net realized capital gains, if any, are distributed at least annually. Income distributions and capital gain distributions are determined in accordance with federal income tax regulations which may differ from GAAP.
Indemnification
In the normal course of business, the Fund enters into contracts that contain a variety of representations and warranties and which provide general indemnities. The Fund’s maximum exposure under these arrangements is unknown because this would involve future claims against the Fund. Also, under the Trust’s organizational documents and by contract, the Trustees and officers of the Trust are indemnified against certain liabilities that may arise out of actions relating to their duties to the Trust. However, based on experience, the Fund expects the risk of loss due to these representations, warranties and indemnities to be minimal.
Note 3. Federal Tax Information
The timing and character of income and capital gain distributions are determined in accordance with income tax regulations, which may differ from GAAP. Reclassifications are made to the Fund’s capital accounts for permanent tax differences to reflect income and gains available for distribution (or available capital loss carryforwards) under income tax regulations.
For the year ended August 31, 2008, permanent book and tax basis differences resulting primarily from differing treatments for foreign currency transactions were identified and reclassified among the components of the Fund’s net assets as follows:
| | | | |
| | | | | |
Overdistributed Net Investment
Income | | Accumulated Net Realized
Gain | | Paid-In Capital |
| $(22,068) | | $22,070 | | $(2) |
Net investment income and net realized gains (losses), as disclosed on the Statement of Operations, and net assets were not affected by this reclassification.
The tax character of distributions paid during the years ended August 31, 2008 and August 31, 2007 was as follows:
| | | | | | |
| | | August 31, 2008 | | August 31, 2007 |
| Distributions paid from: | | |
Ordinary Income* | | $ | 2,190,102 | | $ | 1,013,183 |
Long-Term Capital Gains | | | 192,927 | | | — |
| * | For tax purposes short-term capital gains distributions, if any, are considered ordinary income distributions. |
As of August 31, 2008, the components of distributable earnings on a tax basis were as follows:
| | |
| | | |
Undistributed Long-term Capital Gains | | Net Unrealized Appreciation |
| $2,519,791 | | $84,624,839 |
| * | The differences between book-basis and tax-basis net unrealized appreciation are primarily due to deferral of losses from wash sales. |
Unrealized appreciation and depreciation at August 31, 2008, based on cost of investments for federal income tax purposes and excluding any unrealized appreciation and depreciation from changes in the value of other assets and liabilities resulting from changes in exchange rates, were:
| | | | |
| | | | |
Unrealized appreciation | | $ | 101,884,996 | |
| Unrealized depreciation | | | (17,260,157 | ) |
Net unrealized appreciation | | $ | 84,624,839 | |
Capital loss carryforwards of $764,574 were utilized during the year ended August 31, 2008.
The Fund adopted Financial Accounting Standards Board (“FASB”) Interpretation No. 48, Accounting for Uncertainty in
22
Columbia Greater China Fund
August 31, 2008
Income Taxes—an Interpretation of FASB Statement No. 109 (“FIN 48”) effective February 29, 2008. FIN 48 requires management to determine whether a tax position of the Fund is more likely than not to be sustained upon examination by the applicable taxing authority, including resolution of any related appeals or litigation processes, based on the technical merits of the position. The tax benefit to be recognized is measured as the largest amount of benefit that is greater than fifty percent likely of being realized upon ultimate settlement. Management has evaluated the known implications of FIN 48 on its computation of net assets for the Fund. As a result of this evaluation, management has concluded that FIN 48 did not have any effect on the Fund’s financial statements. However, management’s conclusions regarding FIN 48 may be subject to review and adjustment at a later date based on factors including, but not limited to, further implementation guidance from the FASB, new tax laws, regulations, and administrative interpretations (including relevant court decisions). The Fund’s federal tax returns for the prior three fiscal years remain subject to examination by the Internal Revenue Service. The Fund is not aware of any tax positions for which it is reasonably possible that the total amounts of unrecognized tax benefits will significantly change in the next twelve months.
Note 4. Fees and Compensation Paid to Affiliates
Investment Advisory Fee
Columbia, an indirect, wholly owned subsidiary of Bank of America Corporation (“BOA”) provides investment advisory, administrative and other services to the Fund. In rendering investment advisory services to the Funds, Columbia may use the portfolio management and research resources of Columbia Management Pte. Ltd, an affiliate of Columbia. Columbia receives a monthly investment advisory fee based on the Fund’s average daily net assets at the following annual rates:
| | | |
| | | | |
| Average Daily Net Assets | | Annual Fee Rate | |
First $1 billion | | 0.95 | % |
$1 billion to $1.5 billion | | 0.87 | % |
$1.5 billion to $3 billion | | 0.82 | % |
$3 billion to $6 billion | | 0.77 | % |
Over $6 billion | | 0.72 | % |
For the year ended August 31, 2008, the Fund’s effective investment advisory fee rate was 0.95% of the Fund’s average daily net assets.
Pricing and Bookkeeping Fees
The Fund has entered into a Financial Reporting Services Agreement (the “Financial Reporting Services Agreement”) with State Street Bank & Trust Company (“State Street”) and Columbia pursuant to which State Street provides financial reporting services to the Fund. The Fund has also entered into an Accounting Services Agreement (collectively with the Financial Reporting Services Agreement, the “State Street Agreements”) with State Street and Columbia pursuant to which State Street provides accounting services to the Fund. Under the State Street Agreements, the Fund pays State Street an annual fee of $38,000 paid monthly plus an additional monthly fee based on an annualized percentage rate of average daily net assets of the Fund for the month. The aggregate fee will not exceed $140,000 per year (exclusive of out-of-pocket expenses and charges). The Fund also reimburses State Street for certain out-of-pocket expenses and charges.
The Fund has entered into a Pricing and Bookkeeping Oversight and Services Agreement (the “Services Agreement”) with Columbia. Under the Services Agreement, Columbia provides services related to Fund expenses and the requirements of the Sarbanes-Oxley Act of 2002, and provides oversight of the accounting and financial reporting services provided by State Street. Under the Services Agreement, the Fund reimburses Columbia for out-of-pocket expenses. Prior to January 1, 2008, the Fund also reimbursed Columbia for accounting oversight services, services related to Fund expenses and the requirements of the Sarbanes-Oxley Act of 2002.
For the year ended August 31, 2008, the amount charged to the Fund by affiliates included on the Statement of Operations under “Pricing and bookkeeping fees” aggregated to $4,673.
Transfer Agent Fee
Columbia Management Services, Inc. (the “Transfer Agent”), an affiliate of Columbia and an indirect, wholly owned subsidiary of BOA, provides shareholder services to the Fund and has contracted with Boston Financial Data Services (“BFDS”) to serve as sub-transfer agent. The Transfer Agent
23
Columbia Greater China Fund
August 31, 2008
is entitled to receive a fee for its services, paid monthly, at the annual rate of $17.34 per open account plus reimbursement of certain sub-transfer agent fees paid by the Transfer Agent (exclusive of BFDS fees), calculated based on assets held in omnibus accounts and intended to recover the cost of payments to other parties (including affiliates of BOA) for services to those accounts. Prior to November 1, 2007, the annual rate was $17.00 per open account. The Transfer Agent pays the fees of BFDS for services as sub-transfer agent and is not entitled to reimbursement for such fees from the Fund. The Transfer Agent may also retain, as additional compensation for its services, fees for wire, telephone and redemption orders, IRA trustee agent fees and account transcript fees due to the Transfer Agent from shareholders of the Fund and credits (net of bank charges) earned with respect to balances in accounts the Transfer Agent maintains in connection with its services to the Fund. The Transfer Agent also receives reimbursement for certain out-of-pocket expenses.
An annual minimum account balance fee of up to $20 may apply to certain accounts with a value below the Fund’s initial minimum investment requirements to reduce the impact of small accounts on transfer agent fees. These minimum account balance fees are recorded as part of expense reductions on the Statement of Operations. For the year ended August 31, 2008, these minimum account balance fees reduced total expenses by $1,655.
Underwriting Discounts, Service and Distribution Fees
Columbia Management Distributors, Inc. (the “Distributor”), an affiliate of Columbia and an indirect, wholly owned subsidiary of BOA, is the principal underwriter of the Fund’s shares. For the year ended August 31, 2008, the Distributor has retained net underwriting discounts of $181,292 on sales of the Fund’s Class A shares and received net CDSC fees of $14,135, $90,822 and $85,348 on Class A, Class B and Class C share redemptions, respectively.
The Fund has adopted a Rule 12b-1 plan (the “Plan”) which requires the payment of a monthly service fee to the Distributor at the maximum annual rate of 0.25% of the average daily net assets attributable to Class A, Class B and Class C shares of the Fund. The Plan also requires the payment of a monthly distribution fee to the Distributor at the maximum annual rate of 0.75% of the average daily net assets attributable to Class B and Class C shares only.
The CDSC and the distribution fees received from the Plan are used principally as repayment to the Distributor for amounts paid by the Distributor to dealers who sold such shares.
Fees Paid to Officers and Trustees
All officers of the Fund are employees of Columbia or its affiliates and, with the exception of the Fund’s Chief Compliance Officer, receive no compensation from the Fund. The Board of Trustees has appointed a Chief Compliance Officer to the Fund in accordance with federal securities regulations. The Fund, along with other affiliated funds, pays its pro-rata share of the expenses associated with the Chief Compliance Officer. The Fund’s expenses for the Chief Compliance Officer will not exceed $15,000 per year.
The Fund’s eligible Trustees may participate in a deferred compensation plan which may be terminated at any time. Obligations of the plan will be paid solely out of the Fund’s assets.
Note 5. Custody Credits
The Fund has an agreement with its custodian bank under which custody fees may be reduced by balance credits. These credits are recorded as part of expense reductions on the Statement of Operations. The Fund could have invested a portion of the assets utilized in connection with the expense offset arrangement in an income-producing asset if it had not entered into such an agreement.
For the year ended August 31, 2008, these custody credits reduced total expenses by $100 for the Fund.
Note 6. Portfolio Information
For the year ended August 31, 2008, the cost of purchases and proceeds from sales of securities, excluding short-term obligations, were $64,405,059 and $50,908,000, respectively.
Note 7. Redemption Fees
The Fund may impose a 2.00% redemption fee on the proceeds of fund shares that are redeemed within 60 days of purchase. The redemption fee is designed to offset brokerage commissions and other costs associated with short term
24
Columbia Greater China Fund
August 31, 2008
trading of the portfolio. The redemption fees, which are retained by the Fund, are accounted for as an addition to paid-in capital and are allocated to each class based on the relative net assets at the time of the redemption. For the year ended August 31, 2008, the Fund received redemption fees of $161,055 for Class A, $27,306 for Class B, $46,420 for Class C and $46,899 for Class Z.
Note 8. Line of Credit
The Fund and other affiliated funds participate in a $350,000,000 committed, unsecured revolving line of credit and a $150,000,000 uncommitted, unsecured line of credit, both provided by State Street. Borrowings are available for short-term liquidity or temporary or emergency purposes.
Interest on the committed line of credit is charged to each participating fund based on the fund’s borrowings at a rate per annum equal to the Federal Funds Rate plus 0.50%. In addition, a commitment fee of 0.10% per annum is accrued and apportioned among the participating funds. Effective September 17, 2007, interest on the uncommitted line of credit is charged to each participating fund based on the fund’s borrowings at a rate per annum equal to the Federal Funds Rate plus 0.375%. Prior to September 17, 2007, interest on the uncommitted line of credit was charged to each participating fund based on the fund’s borrowings at a rate per annum equal to the Federal Funds Rate plus 0.50%. State Street charges an annual operations agency fee of $40,000 for the committed line of credit and may charge an annual administration fee of $15,000 for the uncommitted line of credit. State Street waived the administration fee effective September 17, 2007. The commitment fee, the operations agency fee and the administration fee are accrued and apportioned among the participating funds pro rata based on their relative net assets.
For the year ended August 31, 2008, the Fund did not borrow under these arrangements.
Note 9. Shares of Beneficial Interest
As of August 31, 2008, the Fund had one shareholder that held 9.6% of the outstanding shares, over which BOA and/or any of its affiliates did not have investment discretion. Subscription and redemption activity of this account may have a significant effect on the operations of the Fund.
Note 10. Significant Risks and Contingencies
Sector Focus Risk
The Fund may focus its investments in certain sectors, subjecting it to greater risk than a fund that is less focused.
Issuer Focus Risk
As a non-diversified mutual fund, the Fund is permitted to invest a greater percentage of its total assets in the securities of fewer issuers than a diversified fund. The Fund may, therefore, have a greater risk of loss from a few issuers than a similar fund that invests more broadly.
Foreign Securities Risk
There are certain additional risks involved when investing in foreign securities. These risks may involve foreign currency exchange rate fluctuations, adverse political and economic developments and the possible prevention of currency exchange or other foreign governmental laws or restrictions. In addition, the liquidity of foreign securities may be more limited than that of domestic securities.
Investments in emerging market countries are subject to additional risk. The risk of foreign investments is typically increased in less developed countries. These countries are also more likely to experience high levels of inflation, deflation or currency devaluation which could hurt their economies and securities markets.
Geographic Concentration Risk
Because the Fund’s investments are concentrated in the Greater China region, events within the region will have a greater effect on the Fund that if the Fund were more geographically diversified. In addition, events in any one country within the region may impact the other countries or the region as a whole. Markets in the region can experience significant volatility due to social, regulatory and political uncertainties.
Legal Proceedings
On February 9, 2005, Columbia Management Advisors, Inc. (which has since merged into Banc of America Capital Management, LLC (now named Columbia Management Advisors, LLC)) (“Columbia”) and Columbia Funds Distributor, Inc. (which has been renamed Columbia
25
Columbia Greater China Fund
August 31, 2008
Management Distributors, Inc.) (the “Distributor”) (collectively, the “Columbia Group”) entered into an Assurance of Discontinuance with the New York Attorney General (“NYAG”) (the “NYAG Settlement”) and consented to the entry of a cease-and-desist order by the Securities and Exchange Commission (“SEC”) (the “SEC Order”) on matters relating to mutual fund trading.
Under the terms of the SEC Order, the Columbia Group agreed, among other things, to: pay $70 million in disgorgement and $70 million in civil money penalties; cease and desist from violations of the antifraud provisions and certain other provisions of the federal securities laws; maintain certain compliance and ethics oversight structures; retain an independent consultant to review the Columbia Group’s applicable supervisory, compliance, control and other policies and procedures; and retain an independent distribution consultant (see below). The Columbia Funds have also voluntarily undertaken to implement certain governance measures designed to maintain the independence of their boards of trustees. The NYAG Settlement also, among other things, requires Columbia and its affiliates to reduce management fees for certain Columbia Funds (including the former Nations Funds) and other mutual funds collectively by $32 million per year for five years, for a projected total of $160 million in management fee reductions.
Pursuant to the procedures set forth in the SEC Order, the $140 million in settlement amounts described above is being distributed in accordance with a distribution plan that was developed by an independent distribution consultant and approved by the SEC on April 6, 2007. Distributions under the distribution plan began in late June 2007.
A copy of the SEC Order is available on the SEC website at http://www.sec.gov. A copy of the NYAG Settlement is available as part of the Bank of America Corporation Form 8-K filing on February 10, 2005.
In connection with the events described above, various parties have filed suit against certain funds, the Trustees of the Columbia Funds, FleetBoston Financial Corporation and its affiliated entities and/or Bank of America and its affiliated entities.
On February 20, 2004, the Judicial Panel on Multidistrict Litigation transferred these cases and cases against other mutual fund companies based on similar allegations to the United States District Court in Maryland for consolidated or coordinated pretrial proceedings (the “MDL”). Subsequently, additional related cases were transferred to the MDL. On September 29, 2004, the plaintiffs in the MDL filed amended and consolidated complaints. One of these amended complaints is a putative class action that includes claims under the federal securities laws and state common law, and that names Columbia, the Distributor, the Trustees of the Columbia Funds, Bank of America Corporation and others as defendants. Another of the amended complaints is a derivative action purportedly on behalf of the Columbia Funds that asserts claims under federal securities laws and state common law.
On February 25, 2005, Columbia and other defendants filed motions to dismiss the claims in the pending cases. On March 1, 2006, for reasons stated in the court’s memoranda dated November 3, 2005, the U.S. District Court for the District of Maryland granted in part and denied in part the defendants’ motions to dismiss. The court dismissed all of the class action claims pending against the Columbia Funds Trusts. As to Columbia and the Distributor, the claims under the Securities Act of 1933, the claims under Sections 34(b) and 36(a) of the Investment Company Act of 1940 (“ICA”) and the state law claims were dismissed. The claims under Sections 10(b) and 20(a) of the Securities Exchange Act of 1934 and claims under Section 36(b) of the ICA were not dismissed.
On March 21, 2005, a purported class action was filed in Massachusetts state court alleging that certain conduct, including market timing, entitled Class B shareholders in certain Columbia funds to an exemption from contingent deferred sales charges upon early redemption (“the CDSC Lawsuit”). The CDSC Lawsuit was removed to federal court in Massachusetts and transferred to the MDL.
On September 14, 2007, the plaintiffs and the Columbia defendants named in the MDL, including the Columbia Funds, entered into a stipulation of settlement with respect to all Columbia-related claims in the MDL described above, including the CDSC Lawsuit. The settlement is subject to court approval.
In 2004, the Columbia Funds’ adviser and distributor and certain affiliated entities and individuals were named as defendants in certain purported shareholder class and
26
Columbia Greater China Fund
August 31, 2008
derivative actions making claims, including claims under the Investment Company and the Investment Advisers Acts of 1940 and state law. Certain Columbia Funds were named as nominal defendants. The suits allege, inter alia, that the fees and expenses paid by the funds are excessive and that the advisers and their affiliates inappropriately used fund assets to distribute the funds and for other improper purposes. On March 2, 2005, the actions were consolidated in the Massachusetts federal court as In re Columbia Entities Litigation. The plaintiffs filed a consolidated amended complaint on June 9, 2005. On November 30, 2005, the judge dismissed all claims by plaintiffs and entered final judgment in favor of the defendants. The plaintiffs appealed to the United States Court of Appeals for the First Circuit on December 30, 2005. A stipulation and settlement agreement dated January 19, 2007 was filed in the First Circuit on February 14, 2007, with a joint stipulation of dismissal and motion for remand to obtain district court approval of the settlement. That joint motion was granted and the appeal was dismissed. On March 6, 2007, the case was remanded to the District Court. The settlement, approved by the District Court on September 18, 2007, became effective October 19, 2007. Pursuant to the settlement, the funds’ adviser and/or its affiliates made certain payments, including plaintiffs’ attorneys’ fees and costs of notice to class members.
Note 11. Subsequent Event
On October 16, 2008 the uncommitted and committed lines of credit discussed in Note 8 were terminated or amended. The uncommitted line of credit was terminated. The Fund and other affiliated funds participate in a $280,000,000 committed, unsecured revolving line of credit. The maximum amount that may be borrowed by any fund is limited to $200,000,000. Interest is charged to each participating fund based on the fund’s borrowings at a rate per annum equal to the greater of the Federal Funds Rate plus 0.50% or the overnight LIBOR Rate plus 0.50%. In addition, an annual operations agency fee of $20,000, an amendment fee of 0.02% and a commitment fee of 0.12% per annum are accrued and apportioned among the participating funds pro rata based on their relative net assets.
27
Report of Independent Registered Public Accounting Firm
To the Trustees of the Columbia Funds Series Trust I and the Shareholders of Columbia Greater China Fund
In our opinion, the accompanying statement of assets and liabilities, including the investment portfolio, and the related statements of operations and of changes in net assets and the financial highlights present fairly, in all material respects, the financial position of Columbia Greater China Fund (the “Fund”) (a series of Columbia Funds Series Trust I), at August 31, 2008, the results of its operations for the year then ended, the changes in its net assets for each of the two years in the period then ended and the financial highlights for each of the five years in the period then ended, in conformity with accounting principles generally accepted in the United States of America. These financial statements and financial highlights (hereafter referred to as “financial statements”) are the responsibility of the Fund’s management. Our responsibility is to express an opinion on these financial statements based on our audits. We conducted our audits of these financial statements in accordance with the standards of the Public Company Accounting Oversight Board (United States). Those standards require that we plan and perform the audit to obtain reasonable assurance about whether the financial statements are free of material misstatement. An audit includes examining, on a test basis, evidence supporting the amounts and disclosures in the financial statements, assessing the accounting principles used and significant estimates made by management, and evaluating the overall financial statement presentation. We believe that our audits, which included confirmation of securities at August 31, 2008 by correspondence with the custodian and brokers, provide a reasonable basis for our opinion.
PricewaterhouseCoopers LLP
Boston, Massachusetts
October 22, 2008
28
Federal Income Tax Information (Unaudited)
For the fiscal year ended August 31, 2008, the Fund designates long-term capital gains of $2,848,354.
Foreign taxes paid during the fiscal year ended August 31, 2008, amounting to $11,188 ($0.00 per share) are expected to be passed through to shareholders as 100% allowable foreign tax credits on Form 1099-DIV for the year ending August 31, 2008.
Gross income derived from sources within foreign countries amounted to $5,979,843 ($1.08 per share) for the fiscal year ended August 31, 2008.
For non-corporate shareholders, 83.33%, or the maximum amount allowable under the Jobs and Growth Tax Relief Reconciliation Act of 2003, of income earned by the Fund for the period September 1, 2007 to August 31, 2008 may represent qualified dividend income. Final information will be provided in your 2008 Form 1099-DIV.
29
Fund Governance
The Trustees serve terms of indefinite duration. The names, addresses and ages of the Trustees and officers of the Funds in Columbia Funds Series Trust I, the year each was first elected or appointed to office, their principal business occupations during at least the last five years, the number of Funds overseen by each Trustee and other directorships they hold are shown below. Each officer listed below serves as an officer of each Fund in the Columbia Funds Complex.
Independent Trustees
| | |
Name, address and year of birth,
Position with funds, Year first
elected or appointed to office | | Principal occupation(s) during past five years, Number of Funds in Columbia Funds
Complex overseen by trustee, Other directorships held |
| |
| John D. Collins (Born 1938) | | |
c/o Columbia Management Advisors, LLC One Financial Center Boston, MA 02111 Trustee1 (since 2007) | | Retired. Consultant, KPMG, LLP (accounting and tax firm) from July 1999 to June 2000; Partner, KPMG, LLP from March 1962 to June 1999. Oversees 77, Mrs. Fields Famous Brands LLC (consumer products); Suburban Propane Partners, L.P.; and Montpelier Re (underwriting firm) |
| |
| Rodman L. Drake (Born 1943) | | |
c/o Columbia Management Advisors, LLC One Financial Center Boston, MA 02111 Trustee1 (since 2007) | | Co-Founder of Baringo Capital LLC (private equity) since 2002; President, Continuation Investments Group, Inc. from 1997 to 2001. Oversees 77, Jackson Hewitt Tax Service Inc. (tax preparation services); Crystal Capital River Inc. (real estate investment trust); Student Loan Corporation (student loan provider); Celgene Corporation (global biotechnology company); Apex Silver Mines Ltd. (mining); and Hyperion Brookfield Total Return Fund, Inc. and Hyperion Brookfield Strategic Mortgage Income Fund, Inc. (exchange-traded funds) |
| |
| Douglas A. Hacker (Born 1955) | | |
c/o Columbia Management Advisors, LLC One Financial Center Boston, MA 02111 Trustee (since 1996) | | Independent business executive since May 2006; Executive Vice President–Strategy of United Airlines (airline) from December 2002 to May 2006; President of UAL Loyalty Services (airline marketing company) from September 2001 to December 2002; Executive Vice President and Chief Financial Officer of United Airlines from July 1999 to September 2001. Oversees 77, Nash Finch Company (food distributor); Aircastle Limited (aircraft leasing) |
| |
| Janet Langford Kelly (Born 1957) | | |
c/o Columbia Management Advisors, LLC One Financial Center Boston, MA 02111 Trustee (since 1996) | | Senior Vice President, General Counsel and Corporate Secretary, ConocoPhillips (integrated energy company) since September 2007; Deputy General Counsel–Corporate Legal Services, ConocoPhillips from August 2006 to August 2007; Partner, Zelle, Hofmann, Voelbel, Mason & Gette LLP (law firm) from March 2005 to July 2006; Adjunct Professor of Law, Northwestern University, from September 2004 to June 2006; Director, UAL Corporation (airline) from February 2006 to July 2006; Chief Administrative Officer and Senior Vice President, Kmart Holding Corporation (consumer goods), from September 2003 to March 2004; Executive Vice President–Corporate Development and Administration, General Counsel and Secretary, Kellogg Company (food manufacturer), from September 1999 to August 2003. Oversees 77, None |
30
Fund Governance (continued)
Independent Trustees (continued)
| | |
Name, Address and Year of Birth,
Position with Funds, Year First
Elected or Appointed to Office | | Principal Occupation(s) During Past Five Years, Number of Funds in Columbia Funds
Complex Overseen by Trustee, Other Directorships Held |
| |
| Charles R. Nelson (Born 1942) | | |
c/o Columbia Management Advisors, LLC One Financial Center Boston, MA 02111 Trustee (since 1981) | | Professor of Economics, University of Washington, since January 1976; Ford and Louisa Van Voorhis Professor of Political Economy, University of Washington, since September 1993; Director, Institute for Economic Research, University of Washington from September 2001 to June 2003; Adjunct Professor of Statistics, University of Washington, since September 1980; Associate Editor, Journal of Money Credit and Banking, since September 1993; Consultant on econometric and statistical matters. Oversees 77, None |
| |
| John J. Neuhauser (Born 1943) | | |
c/o Columbia Management Advisors, LLC One Financial Center Boston, MA 02111 Trustee (since 1985) | | President, Saint Michael’s College, since August 2007; University Professor, Boston College from November 2005 to August 2007; Academic Vice President and Dean of Faculties, Boston College from August 1999 to October 2005. Oversees 77, Liberty All-Star Equity Fund and Liberty All-Star Growth Fund, Inc. (closed-end funds) |
| |
| Jonathan Piel (Born 1938) | | |
c/o Columbia Management Advisors, LLC One Financial Center Boston, MA 02111 Trustee1 (since 2007) | | Cable television producer and website designer; The Editor, Scientific American from 1984 to 1994; Vice President, Scientific American, Inc., from 1984 to 1994; Member, Advisory Board, Stone Age Institute, Bloomington, Indiana (research institute that explores the effect of technology on human evolution); Member, Board of Directors of the National Institute of Social Sciences, New York City; and Member, Board of Trustees of the William Alanson White Institute, New York City (institution for training psychoanalysts). Oversees 77, None |
| |
| Patrick J. Simpson (Born 1944) | | |
c/o Columbia Management Advisors, LLC One Financial Center Boston, MA 02111 Trustee (since 2000) | | Partner, Perkins Coie LLP (law firm). Oversees 77, None |
| |
| Thomas C. Theobald (Born 1937) | | |
c/o Columbia Management Advisors, LLC One Financial Center Boston, MA 02111 Trustee and Chairman of the Board (since 1996) | | Partner and Senior Advisor, Chicago Growth Partners (private equity investing) since September 2004; Managing Director, William Blair Capital Partners (private equity investing) from September 1994 to September 2004. Oversees 77, Anixter International (network support equipment distributor); Ventas, Inc. (real estate investment trust); Jones Lang LaSalle (real estate management services); Ambac Financial Group (financial guaranty insurance) |
| |
| Anne-Lee Verville (Born 1945) | | |
c/o Columbia Management Advisors, LLC One Financial Center Boston, MA 02111 Trustee (since 1998) | | Retired since 1997 (formerly General Manager–Global Education Industry (from 1994 to 1997), President–Application Systems Division (from 1991 to 1994), Chief Financial Officer–US Marketing & Services (from 1988 to 1991), and Chief Information Officer (from 1987 to 1988), IBM Corporation (computer and technology)). Oversees 77, None |
31
Fund Governance (continued)
Interested Trustee
| | |
Name, address and year of birth,
Position with funds, Year first
elected or appointed to office | | Principal occupation(s) during past five years, Number of Funds in Columbia Funds
Complex overseen by trustee, Other directorships held |
| |
| William E. Mayer (Born 1940) | | |
c/o Columbia Management Advisors, LLC One Financial Center Boston, MA 02111 Trustee2 (since 1994) | | Partner, Park Avenue Equity Partners (private equity) since February 1999; Dean and Professor, College of Business, University of Maryland from 1992 to 1997. Oversees 77, Lee Enterprises (print media), WR Hambrecht + Co. (financial service provider); BlackRock Kelso Capital Corporation (investment company) |
1 | Messrs. Drake, Piel and Collins have served as directors/trustees of the Excelsior Funds since 1996, 1996 and 2005, respectively. The Excelsior Funds consisted of 27 portfolios managed by affiliates of Columbia Management Advisors, LLC. Effective December 12, 2007, the Board elected Messrs. Drake, Piel and Collins as Trustees of the Trust. |
2 | Mr. Mayer is an “interested person” (as defined in the Investment Company Act of 1940) by reason of his affiliation with WR Hambrecht + Co., a registered broker/dealer that may execute portfolio transactions for or engage in principal transactions with the Funds or other funds or accounts advised/managed by the Advisor or other Bank of America affiliates. |
The Statement of Additional Information includes additional information about the Trustees of the Funds and is available, without charge, upon request by calling 1-800-345-6611.
32
Fund Governance (continued)
Officers
| | |
Name, address and year of birth,
Position with Columbia Funds, Year
first elected or appointed to office | | Principal occupation(s) during past five years |
| |
| Christopher L. Wilson (Born 1957) | | |
One Financial Center Boston, MA 02111 President (since 2004) | | President–Columbia Funds, since October 2004; Managing Director–Columbia Management Advisors, LLC, since September 2005; Senior Vice President–Columbia Management Distributors, Inc., since January 2005; Director–Columbia Management Services, Inc., since January 2005; Director–Bank of America Global Liquidity Funds, plc and Banc of America Capital Management (Ireland), Limited, since May 2005; Director–FIM Funding, Inc., since January 2005; President and Chief Executive Officer–CDC IXIS AM Services, Inc. (investment management), from September 1998 through August 2004; and a senior officer or director of various other Bank of America affiliated entities, including other registered and unregistered funds. |
| |
| James R. Bordewick, Jr. (Born 1959) | | |
One Financial Center Boston, MA 02111 Senior Vice President, Secretary and Chief Legal Officer (since 2006) | | Associate General Counsel, Bank of America since April 2005; Senior Vice President and Associate General Counsel, MFS Investment Management (investment management) prior to April 2005. |
| |
| J. Kevin Connaughton (Born 1964) | | |
One Financial Center Boston, MA 02111 Senior Vice President and Chief Financial Officer (since 2000) | | Managing Director of Columbia Management Advisors, LLC since December 2004; Treasurer–Columbia Funds, from October 2003 to May 2008; Treasurer–the Liberty Funds, Stein Roe Funds and Liberty All-Star Funds, December 2000–December 2006; Senior Vice President–Columbia Management Advisors, LLC, from April 2003 to December 2004; President–Columbia Funds, Liberty Funds and Stein Roe Funds, February 2004 to October 2004; Treasurer–Galaxy Funds, September 2002 to December 2005; Treasurer, December 2002 to December 2004, and President, February 2004 to December 2004–Columbia Management Multi-Strategy Hedge Fund, LLC; and a senior officer of various other Bank of America-affiliated entities, including other registered and unregistered funds. |
| |
| Linda J. Wondrack (Born 1964) | | |
One Financial Center Boston, MA 02111 Senior Vice President and Chief Compliance Officer (since 2007) | | Director (Columbia Management Group LLC and Investment Product Group Compliance), Bank of America since June 2005; Director of Corporate Compliance and Conflicts Officer, MFS Investment Management (investment management), August 2004 to May 2005; Managing Director, Deutsche Asset Management (investment management) prior to August 2004. |
33
Fund Governance (continued)
Officers (continued)
| | |
Name, address and year of birth,
Position with Columbia Funds, Year
first elected or appointed to office | | Principal occupation(s) during past five years |
| |
| Michael G. Clarke (Born 1969) | | |
One Financial Center Boston, MA 02111 Treasurer (since 2008) | | Director of Fund Administration of the Advisor since January 2006; Managing Director of the Advisor September 2004 to December 2005; Vice President Fund Administration June 2002 to September 2004. |
| |
| Jeffrey R. Coleman (Born 1969) | | |
One Financial Center Boston, MA 02111 Deputy Treasurer (since 2006) | | Director of Fund Administration of the Advisor since January 2006; Fund Controller of the Advisor from October 2004 to January 2006; Vice President of CDC IXIS Asset Management Services, Inc. (investment management) from August 2000 to September 2004. |
| |
| Joseph F. DiMaria (Born 1968) | | |
One Financial Center Boston, MA 02111 Chief Accounting Officer (since 2008) | | Director of Fund Administration of the Advisor since January 2006; Head of Tax/Compliance and Assistant Treasurer of the Advisor from November 2004 to December 2005; Director of Trustee Administration (Sarbanes-Oxley) of the Advisor from May 2003 to October 2004. |
| |
| Julian Quero (Born 1967) | | |
One Financial Center Boston, MA 02111 Deputy Treasurer (since 2008) | | Senior Tax Manager of the Advisor since August 2006; Senior Compliance Manager of the Advisor from April 2002 to August 2006. |
| |
| Barry S. Vallan (Born 1969) | | |
One Financial Center Boston, MA 02111 Controller (since 2006) | | Vice President–Fund Treasury of the Advisor since October 2004; Vice President–Trustee Reporting of the Advisor from April 2002 to October 2004 |
34
[THIS PAGE INTENTIONALLY LEFT BLANK]
35
[THIS PAGE INTENTIONALLY LEFT BLANK]
36
Important Information About This Report
Transfer Agent
Columbia Management Services, Inc.
P.O. Box 8081
Boston, MA 02266-8081
1-800-345-6611
Distributor
Columbia Management
Distributors, Inc.
One Financial Center
Boston, MA 02111
Investment Advisor
Columbia Management Advisors, LLC
100 Federal Street
Boston, MA 02110
The fund mails one shareholder report to each shareholder address. If you would like more than one report, please call shareholder services at 1-800-345-6611 and additional reports will be sent to you. This report has been prepared for shareholders of Columbia Greater China Fund.
A description of the policies and procedures that the fund uses to determine how to vote proxies and a copy of the fund’s voting records are available (i) at www.columbiamanagement.com; (ii) on the Securities and Exchange Commission’s website at www.sec.gov; and (iii) without charge, upon request, by calling 1-800-368-0346. Information regarding how the fund voted proxies relating to portfolio securities during the 12-month period ended June 30 is available from the SEC’s website. Information regarding how the fund voted proxies relating to portfolio securities is also available from the fund’s website.
The fund files a complete schedule of portfolio holdings with the SEC for the first and third quarters of each fiscal year on Form N-Q. The fund’s Form N-Q is available on the SEC’s website at www.sec.gov and may be reviewed and copied at the SEC’s Public Reference Room in Washington, D.C. Information on the operation of the Public Reference Room may be obtained by calling 1-800-SEC-0330.
Please read and consider the investment objectives, risks, charges and expenses for any fund carefully before investing. For a prospectus which contains this and other important information about the fund, contact your Columbia Management representative or financial advisor or go to www.columbiamanagement.com.
Columbia Management Group, LLC (“Columbia Management”) is the investment management division of Bank of America Corporation. Columbia Management entities furnish investment management services and products for institutional and individual investors. Columbia Funds are distributed by Columbia Management Distributors, Inc., member of FINRA, SIPC, part of Columbia Management and an affiliate of Bank of America Corporation.
37

Columbia Greater China Fund
Annual Report, August 31, 2008
©2008 Columbia Management Distributors, Inc.
One Financial Center, Boston, MA 02111-2621
800.345.6611 www.columbiafunds.com
SHC-42/155938-0808 (10/08) 08/59486
Item 2. Code of Ethics.
(a) The registrant has, as of the end of the period covered by this report, adopted a code of ethics that applies to the registrant’s principal executive officer, principal financial officer, principal accounting officer or controller, or persons performing similar functions, regardless of whether these individuals are employed by the registrant or a third party.
(b) During the period covered by this report, there were not any amendments to a provision of the code of ethics adopted in 2(a) above.
(c) During the period covered by this report, there were no waivers, including any implicit waivers, from a provision of the code of ethics described in 2(a) above that relates to one or more of the items set forth in paragraph (b) of this item’s instructions.
Item 3. Audit Committee Financial Expert.
The registrant’s Board of Trustees has determined that Douglas A. Hacker, John D. Collins and Anne-Lee Verville, each of whom are members of the registrant’s Board of Trustees and Audit Committee, each qualify as an audit committee financial expert. Mr. Hacker, Mr. Collins and Ms. Verville are each independent trustees, as defined in paragraph (a)(2) of this item’s instructions.
Item 4. Principal Accountant Fees and Services.
Fee information below is disclosed for the eleven series of the registrant whose reports to stockholders are included in this annual filing. Fee information for fiscal year ended August 31, 2008 also includes fees for one series that was merged into the registrant during the period. Comparative fee information for fiscal year ended August 31, 2007 also includes fees for two series that were merged into the registrant.
(a) Audit Fees. Aggregate Audit Fees billed by the principal accountant for professional services rendered during the fiscal years ended August 31, 2008 and August 31, 2007 are approximately as follows:
2008 | | 2007 | |
$ | 410,800 | | $ | 383,300 | |
| | | | | |
Audit Fees include amounts related to the audit of the registrant’s annual financial statements or services that are normally provided by the accountant in connection with statutory and regulatory filings or engagements for those fiscal years.
(b) Audit-Related Fees. Aggregate Audit-Related Fees billed to the registrant by the principal accountant for professional services rendered during the fiscal years ended August 31, 2008 and August 31, 2007 are approximately as follows:
2008 | | 2007 | |
$ | 60,200 | | $ | 45,100 | |
| | | | | |
Audit-Related Fees include amounts for assurance and related services by the principal accountant that are reasonably related to the performance of the audit of the registrant’s financial statements and are not reported in Audit Fees above. In both fiscal years 2008 and 2007, Audit-Related Fees consist of agreed-upon procedures performed for semi-annual shareholder reports. Fiscal year 2008 also includes Audit-Related Fees for agreed-upon procedures related to a fund merger and a fund accounting and custody conversion.
During the fiscal years ended August 31, 2008 and August 31, 2007, there were no Audit-Related Fees billed by the registrant’s principal accountant to the registrant’s investment adviser (not including any sub-adviser whose role is primarily portfolio management and is subcontracted with or overseen by another investment adviser) and any entity controlling, controlled by, or under common control with the adviser that provides ongoing services to the registrant for an engagement that related directly to the operations and financial reporting of the registrant.
(c) Tax Fees. Aggregate Tax Fees billed by the principal accountant to the registrant for professional services rendered during the fiscal years ended August 31, 2008 and August 31, 2007 are approximately as follows:
2008 | | 2007 | |
$ | 92,600 | | $ | 94,900 | |
| | | | | |
Tax Fees include amounts for the review of annual tax returns, the review of required shareholder distribution calculations and typically include amounts for professional services by the principal accountant for tax compliance, tax advice and tax planning. Both fiscal years 2008 and 2007 also include tax fees for agreed-upon procedures related to fund mergers and the review of final tax returns and for assistance with foreign tax filings.
During the fiscal years ended August 31, 2008 and August 31, 2007, there were no Tax Fees billed by the registrant’s principal accountant to the registrant’s investment adviser (not including any sub-adviser whose role is primarily portfolio management and is subcontracted with or overseen by another investment adviser) and any entity controlling, controlled by, or under common control with the adviser that provides ongoing services
to the registrant for an engagement that related directly to the operations and financial reporting of the registrant.
(d) All Other Fees. Aggregate All Other Fees billed by the principal accountant to the registrant for professional services rendered during the fiscal years ended August 31, 2008 and August 31, 2007 are approximately as follows:
All Other Fees include amounts for products and services provided by the principal accountant, other than the services reported in paragraphs (a) through (c) above. In fiscal year 2007, All Other Fees consist of fees billed for agreed-upon procedures related to the review of the registrant’s anti-money laundering program.
Aggregate All Other Fees billed by the registrant’s principal accountant to the registrant’s investment adviser (not including any sub-adviser whose role is primarily portfolio management and is subcontracted with or overseen by another investment adviser) and any entity controlling, controlled by, or under common control with the adviser that provides ongoing services to the registrant for an engagement that related directly to the operations and financial reporting of the registrant during the fiscal years ended August 31, 2008 and August 31, 2007 are approximately as follows:
2008 | | 2007 | |
$ | 1,460,800 | | $ | 849,100 | |
| | | | | |
In both fiscal years 2008 and 2007, All Other Fees consist of fees billed for internal control examinations of the registrant’s transfer agent and investment advisor.
(e)(1) Audit Committee Pre-Approval Policies and Procedures
The registrant’s Audit Committee is required to pre-approve the engagement of the registrant’s independent accountants to provide audit and non-audit services to the registrant and non-audit services to its investment adviser (not including any sub-adviser whose role is primarily portfolio management and is subcontracted with or overseen by another investment adviser) or any entity controlling, controlled by or under common control with such investment adviser that provides ongoing services to the registrant (“Adviser Affiliates”), if the engagement relates directly to the operations and financial reporting of the registrant.
The Audit Committee has adop ted a Policy for Engagement of Independent Accountants for Audit and Non-Audit Services (“Policy”). The Policy sets forth the understanding of the Audit Committee regarding the engagement of the registrant’s independent accountants to provide (i) audit and permissible audit-related, tax and other services to the registrant (collectively “Fund Services”); (ii) non-audit services to the registrant’s investment adviser (not including any sub-adviser whose role is primarily
portfolio management and is subcontracted with or overseen by another investment adviser) and Adviser Affiliates, if the engagement relates directly to the operations or financial reporting of a Fund (collectively “Fund-related Adviser Services”); and (iii) certain other audit and non-audit services to the registrant’s investment adviser (not including any sub-adviser whose role is primarily portfolio management and is subcontracted with or overseen by another investment adviser) and Adviser Affiliates. Unless a type of service receives general pre-approval under the Policy, it requires specific pre-approval by the Audit Committee if it is to be provided by the independent accountants. Pre-approval of non-audit services to the registrant, the registrant’s investment adviser (not including any sub-adviser whose role is primarily portfolio management and is subcontracted with or ove rseen by another investment adviser) and Adviser Affiliates may be waived provided that the “de minimis” requirements set forth under paragraph (c)(7)(i)(C) of Rule 2-01 of Regulation S-X are met.
Under the Policy, the Audit Committee may delegate pre-approval authority to any pre-designated member or members who are Independent Trustees/Directors. The member(s) to whom such authority is delegated must report, for informational purposes only, any pre-approval decisions to the Audit Committee at its next regular meeting. The Audit Committee’s responsibilities with respect to the pre-approval of services performed by the independent accountants may not be delegated to management.
The Policy requires the Fund Treasurer and/or Director of Board Administration to submit to the Audit Committee, on an annual basis, a schedule of the types of services that are subject to general pre-approval. The schedule(s) provide a description of each type of service that is subject to general pre-approval and, where possible, will provide estimated fee caps for each instance of providing each service. The Audit Committees will review and approve the types of services and review the projected fees for the next fiscal year and may add to, or subtract from, the list of general pre-approved services from time to time based on subsequent determinations. That approval acknowledges that the Audit Committee is in agreement with the specific types of services that the independent accountants will be permitted to perform.
The Fund Treasurer and/or Director of Board Administration shall report to the Audit Committee at each of its regular meetings regarding all Fund Services or Fund-related Adviser Services initiated since the last such report was rendered, including a general description of the services, actual billed and projected fees, and the means by which such Fund Services or Fund-related Adviser Services were pre-approved by the Audit Committee.
*****
(e)(2) The percentage of services described in paragraphs (b) through (d) of this Item approved pursuant to the “de minimis” exception under paragraph (c)(7)(i)(C) of Rule 2-01 of Regulation S-X during both fiscal years ended August 31, 2008 and August 31, 2007 was zero.
(f) Not applicable.
(g) The aggregate non-audit fees billed by the registrant’s accountant for services rendered to the registrant, and rendered to the registrant’s investment adviser (not including any sub-adviser whose role is primarily portfolio management and is subcontracted with or overseen by another investment adviser), and any entity controlling, controlled by, or under common control with the adviser that provides ongoing services to the registrant for the fiscal years ended August 31, 2008 and August 31, 2007 are approximately as follows:
2008 | | 2007 | |
$ | 1,613,600 | | $ | 989,600 | |
| | | | | |
(h) The registrant’s Audit Committee of the Board of Directors has considered whether the provision of non-audit services that were rendered to the registrant’s adviser (not including any sub-adviser whose role is primarily portfolio management and is subcontracted with or overseen by another investment adviser), and any entity controlling, controlled by, or under common control with the investment adviser that provides ongoing services to the registrant that were not pre-approved pursuant to paragraph (c)(7)(ii) of Rule 2-01 of Regulation S-X, is compatible with maintaining the principal accountant’s independence.
Item 5. Audit Committee of Listed Registrants.
Not applicable.
Item 6. Investments
(a) The registrant’s “Schedule I – Investments in securities of unaffiliated issuers” (as set forth in 17 CFR 210.12-12) is included in Item 1 of this Form N-CSR.
(b) Not applicable.
Item 7. Disclosure of Proxy Voting Policies and Procedures for Closed-End Management Investment Companies.
Not applicable.
Item 8. Portfolio Managers of Closed-End Management Investment Companies.
Not applicable.
Item 9. Purchases of Equity Securities by Closed-End Management Investment Company and Affiliated Purchasers.
Not applicable.
Item 10. Submission of Matters to a Vote of Security Holders.
There have not been any material changes to the procedures by which shareholders may recommend nominees to the registrant’s board of directors, since those procedures were last disclosed in response to requirements of Item 407(c)(2)(iv) of Regulation S-K (as required by Item 22(b)(15) of Schedule 14A) or this Item.
Item 11. Controls and Procedures.
(a) The registrant’s principal executive officer and principal financial officers, based on their evaluation of the registrant’s disclosure controls and procedures as of a date within 90 days of the filing of this report, have concluded that such controls and procedures are adequately designed to ensure that information required to be disclosed by the registrant in Form N-CSR is accumulated and communicated to the registrant’s management, including the principal executive officer and principal financial officer, or persons performing similar functions, as appropriate to allow timely decisions regarding required disclosure.
(b) There was no change in the registrant’s internal control over financial reporting that occurred during the registrant’s second fiscal quarter of the period covered by this report that has materially affected, or is reasonably likely to materially affect, the registrant’s internal control over financial reporting.
Item 12. Exhibits.
(a)(1) Code of ethics required to be disclosed under Item 2 of Form N-CSR attached hereto as Exhibit 99.CODE ETH.
(a)(2) Certifications pursuant to Rule 30a-2(a) under the Investment Company Act of 1940 (17 CFR 270.30a-2(a)) attached hereto as Exhibit 99.CERT.
(a)(3) Not applicable.
(b) Certification pursuant to Rule 30a-2(b) under the Investment Company Act of 1940 (17 CFR 270.30a-2(b)) attached hereto as Exhibit 99.906CERT.
SIGNATURES
Pursuant to the requirements of the Securities Exchange Act of 1934 and the Investment Company Act of 1940, the registrant has duly caused this report to be signed on its behalf by the undersigned, thereunto duly authorized.
(registrant) | Columbia Funds Series Trust I |
| |
| |
By (Signature and Title) | | /s/ Christopher L. Wilson |
| | Christopher L. Wilson, President |
| |
| |
Date | | October 22, 2008 |
| | | | | | |
Pursuant to the requirements of the Securities Exchange Act of 1934 and the Investment Company Act of 1940, this report has been signed below by the following persons on behalf of the registrant and in the capacities and on the dates indicated.
By (Signature and Title) | | /s/ Christopher L. Wilson |
| Christopher L. Wilson, President |
|
|
Date | | October 22, 2008 |
| |
| |
By (Signature and Title) | | /s/ J. Kevin Connaughton |
| J. Kevin Connaughton, Chief Financial Officer |
|
|
Date | | October 22, 2008 |
| | | | | | | |