UNITED STATES
SECURITIES AND EXCHANGE COMMISSION
Washington, D.C. 20549
FORM N-CSR
CERTIFIED SHAREHOLDER REPORT OF REGISTERED
MANAGEMENT INVESTMENT COMPANIES
Investment Company Act file number | 811-04367 |
|
Columbia Funds Series Trust I |
(Exact name of registrant as specified in charter) |
|
225 Franklin Street, Boston, Massachusetts | | 02110 |
(Address of principal executive offices) | | (Zip code) |
|
Ryan Larrenaga c/o Columbia Management Investment Advisers, LLC 225 Franklin Street Boston, MA 02110 |
(Name and address of agent for service) |
|
Registrant’s telephone number, including area code: | (800) 345-6611 | |
|
Date of fiscal year end: | August 31 | |
|
Date of reporting period: | August 31, 2016 | |
| | | | | | | | |
Form N-CSR is to be used by management investment companies to file reports with the Commission not later than 10 days after the transmission to stockholders of any report that is required to be transmitted to stockholders under Rule 30e-1 under the Investment Company Act of 1940 (17 CFR 270.30e-1). The Commission may use the information provided on Form N-CSR in its regulatory, disclosure review, inspection, and policymaking roles.
A registrant is required to disclose the information specified by Form N-CSR, and the Commission will make this information public. A registrant is not required to respond to the collection of information contained in Form N-CSR unless the Form displays a currently valid Office of Management and Budget (“OMB”) control number. Please direct comments concerning the accuracy of the information collection burden estimate and any suggestions for reducing the burden to Secretary, Securities and Exchange Commission, 450 Fifth Street, NW, Washington, DC 20549-0609. The OMB has reviewed this collection of information under the clearance requirements of 44 U.S.C. § 3507.
Item 1. Reports to Stockholders.

ANNUAL REPORT
August 31, 2016

COLUMBIA DISCIPLINED SMALL CORE FUND


ABOUT COLUMBIA THREADNEEDLE INVESTMENTS
Columbia Threadneedle Investments is a leading global asset management group that provides a broad range of investment strategies and solutions for individual, institutional and corporate clients around the world.
With more than 2,000 people, including over 450 investment professionals based in North America, Europe and Asia, we manage $460 billion* of assets across developed and emerging market equities, fixed income, asset allocation solutions and alternatives. We are the 13th largest manager of long-term mutual fund assets in the U.S.** and the 4th largest manager of retail funds in the U.K.***
Our priority is the investment success of our clients. We aim to deliver the investment outcomes they expect through an investment approach that is team-based, performance-driven and risk-aware. Our culture is dynamic and interactive. By sharing our insights across asset classes and geographies, we generate richer perspectives on global, regional and local investment landscapes. The ability to exchange and debate investment ideas in a collaborative environment enriches our teams' investment processes. More importantly, it results in better informed investment decisions for our clients.
Columbia funds are distributed by Columbia Management Investment Distributors, Inc., member FINRA, and managed by Columbia Management Investment Advisers, LLC.
Columbia Threadneedle Investments (Columbia Threadneedle) is the global brand name of the Columbia and Threadneedle group of companies.
* In U.S. dollars as of June 30, 2016. Source: Ameriprise Q2 Earnings Release. Includes all assets managed by entities in the Columbia and Threadneedle group of companies. Contact us for more current data.
** Source: ICI as of June 30, 2016 for Columbia Management Investment Advisers, LLC.
*** Source: Investment Association as of March 2016 for Threadneedle Asset Management Limited.
© 2016 Columbia Management Investment Advisers, LLC. All rights reserved.
Not part of the shareholder report
 Dear Shareholders,
Volatility comes with the territory for long-term investors. Some investors instinctively want to pull out of the market or sell underperforming investments at the first sign of increased volatility or perhaps even as soon as they perceive it on the horizon. But taking yourself out of the market could mean losing out on potential opportunities, and putting your longer term investment goals at risk.
Cumulative return is not just about achieving high returns when markets are going up; it's also about remaining invested and minimizing losses during weak or volatile markets so that you can participate on the upside. Developing a deeper understanding of the various risks your portfolio is subject to can help you balance these risks.
Diversification is critical in seeking to achieve that balance. We believe that most portfolios could be more effectively diversified either by introducing holdings with performance profiles unrelated to existing holdings (like alternative products) or by rebalancing existing holdings with an eye toward risk allocation. Over time, distributing risk more evenly may produce a more pronounced diversification benefit and may improve portfolio efficiency. We believe market volatility can create significant opportunities and, in fact, these periods may be some of the very best times to invest.
With this in mind, I thought it important to highlight excerpts from a piece written by Colin Moore, Global Chief Investment Officer, in which he touches on some of these issues emphasizing the importance of a properly constructed portfolio in seeking to effectively manage volatility and to achieve consistency of returns. I encourage you to read the article in its entirety. To access the full article and for other insights on current market, please visit blog.columbiathreadneedleus.com/latest-perspectives.
You need investments that are designed to help you ease the impact of volatile market environments and keep the savings you have worked tirelessly to amass. Columbia Threadneedle Investments provides investment solutions to help you tackle financial challenges and achieve your desired outcome.
Best regards,

Christopher O. Petersen
President, Columbia Funds
Excerpts from:
Taking the scare out of the volatility bogeyman
By Colin Moore, Global Chief Investment Officer
Colin Moore is the global chief investment officer for Columbia Threadneedle Investments. His responsibilities include ensuring that a disciplined investment process is in place across all asset classes, including equity and fixed income. Mr. Moore joined one of the Columbia Threadneedle Investments legacy firms in 2002 as head of equity and was also head of fixed income and liquidity strategies from 2009 – 2010.

n In today's low growth, higher volatility world, the emphasis is shifting from maximization of returns to consistency of returns.
PRESIDENT'S MESSAGE (continued)
n Portfolios should represent the behavioral risk-return tradeoff of investors, remembering that they won't stay invested to realize the return if we get the risk tolerance wrong.
n Holding long-term savings in cash to avoid volatility (the financial equivalent of hiding under the sheets) is detrimental to achieving long-term goals.
According to Wikipedia, "The bogeyman is a common allusion to a mythical creature in many cultures used to control behavior. This monster has no specific appearance, and conceptions about it can vary drastically from household to household within the same community; in many cases he has no set appearance in the mind of an adult or child, but is simply a non-specific embodiment of terror." Different cultures have different names and physical representations for the bogeyman, and investors are no different. We have terrible monsters that we fear may destroy our portfolios, and we call one of the scariest of them volatility.
While the bogeyman is mythical (I hope!), volatility is real and can cause serious damage. To understand why investors have such a hard time coping with volatility, we first need to define three cognitive biases at work in today's investment environment:
1) Recency bias — something that has recently come to the forefront of our attention, regardless of how long established it is, suddenly seems to appear with improbable frequency.
2) Negativity bias — we tend to have a greater recall of unpleasant memories than positive memories.
3) Loss aversion — our dissatisfaction with losing money tends to be greater than our satisfaction with making money.
The level of volatility varies dramatically, and so does investor fear and panic selling — waxing when volatility rises, waning when it falls. Recent studies have pointed to demographics as an important driver of panic selling. The theory is that as people get closer to retirement, the prospects of a large (20% – 30%) loss in financial assets can have a much more pronounced effect on their sense of well-being. Wealth preservation instincts kick in much more quickly than for younger (and typically less wealthy) savers.
The reality is that there is little opportunity for return without volatility. Therefore, the bogeyman effect of holding long-term savings in cash to avoid volatility (the financial equivalent of hiding under the sheets) is detrimental to achieving long-term goals. This effect tends to be more pronounced during the episodic spikes in volatility. The significant spike in volatility in 2008 and 2009 led to significant withdrawals from long-term investment funds over the same period. Less pronounced effects can also be seen when comparing 2001 – 2003 and 2011 – 2012. Conversely, flows picked up when volatility returned to "normal" levels. Investor behavior of this type is consistent with the three behavioral biases.
I believe average volatility will be higher over the next 10 years than the last 10 years and episodic spikes will increase in frequency because sustainable economic growth will be structurally lower and geopolitical risk higher than any time since World War II. Low growth creates uncertainty while loss aversion will make investors fear that we are one economic mishap or geopolitical event away from no growth or recession. The result will be higher volatility on average. Negativity bias will tend to exacerbate "spike" reactions to event-driven geopolitical news, and the volatility bogeyman will appear more often. Assuming the behavioral biases continue, investor returns are likely to be very disappointing regardless of the total return generated by financial markets due to the bogeyman effect.
To mitigate this effect, we need to focus on portfolio construction and an improved understanding of diversification. I accept that equities are likely to offer the highest return over the next 10 years, but they also offer the highest volatility. Many portfolio construction optimization tools use historical average volatility, which is likely to underestimate the volatility investors will face. The bogeyman emerges when individual asset class volatility spikes and cross correlations rise, the combination of which increases overall portfolio volatility far beyond expectation. Diversification is meant to protect investors against volatility, but what's the point of owning lots of investments if the volatility bogeyman has not been properly estimated?
Most importantly, portfolios should be constructed to properly represent the behavioral risk-return trade off of investors, remembering that they won't stay invested to realize the return if we get the risk tolerance wrong. In a low growth, higher volatility world, the emphasis is shifting to return consistency rather than return maximization,
PRESIDENT'S MESSAGE (continued)
and investors are best served through investment approaches that appreciate that distinction. Even though it's a permanent feature of financial markets, volatility is less likely to be the bogeyman we all fear if portfolios are constructed with this understanding.
Please visit blog.columbiathreadneedleus.com/latest-perspectives to read the entire article.
Investors should consider the investment objectives, risks, charges and expenses of a mutual fund carefully before investing. For a free prospectus and summary prospectus, which contains this and other important information about a fund, visit investor.columbiathreadneedleus.com. The prospectus should be read carefully before investing.
The views expressed are as of April 2016, may change as market or other conditions change, and may differ from views expressed by other Columbia Management Investment Advisers, LLC (CMIA) associates or affiliates. Actual investments or investment decisions made by CMIA and its affiliates, whether for its own account or on behalf of clients, will not necessarily reflect the views expressed. This information is not intended to provide investment advice and does not account for individual investor circumstances. Investment decisions should always be made based on an investor's specific financial needs, objectives, goals, time horizon and risk tolerance. Asset classes described may not be suitable for all investors.
Past performance does not guarantee future results, and no forecast should be considered a guarantee either. Since economic and market conditions change frequently, there can be no assurance that the trends described here will continue or that the forecasts are accurate.
Diversification does not guarantee a profit or protect against loss.
Columbia Funds are distributed by Columbia Management Investment Distributors, Inc., member FINRA, and managed by Columbia Management Investment Advisers, LLC.
© 2016 Columbia Management Investment Advisers, LLC. All rights reserved.
COLUMBIA DISCIPLINED SMALL CORE FUND
Fund Investment Manager
Columbia Management Investment
Advisers, LLC
225 Franklin Street
Boston, MA 02110
Fund Distributor
Columbia Management Investment
Distributors, Inc.
225 Franklin Street
Boston, MA 02110
Fund Transfer Agent
Columbia Management Investment
Services Corp.
P.O. Box 8081
Boston, MA 02266-8081
For more information about any of the funds, please visit investor.columbiathreadneedleus.com or call 800.345.6611. Customer Service Representatives are available to answer your questions Monday through Friday from 8 a.m. to 7 p.m. Eastern time.
The views expressed in this report reflect the current views of the respective parties. These views are not guarantees of future performance and involve certain risks, uncertainties and assumptions that are difficult to predict, so actual outcomes and results may differ significantly from the views expressed. These views are subject to change at any time based upon economic, market or other conditions and the respective parties disclaim any responsibility to update such views. These views may not be relied on as investment advice and, because investment decisions for a Columbia fund are based on numerous factors, may not be relied on as an indication of trading intent on behalf of any particular Columbia fund. References to specific securities should not be construed as a recommendation or investment advice.
Performance Overview | | | 3 | | |
Manager Discussion of Fund Performance | | | 5 | | |
Understanding Your Fund's Expenses | | | 7 | | |
Portfolio of Investments | | | 8 | | |
Statement of Assets and Liabilities | | | 15 | | |
Statement of Operations | | | 17 | | |
Statement of Changes in Net Assets | | | 18 | | |
Financial Highlights | | | 21 | | |
Notes to Financial Statements | | | 31 | | |
Report of Independent Registered Public Accounting Firm | | | 40 | | |
Federal Income Tax Information | | | 41 | | |
Trustees and Officers | | | 42 | | |
Board Consideration and Approval of Management Agreement | | | 47 | | |
Important Information About This Report | | | 51 | | |
COLUMBIA DISCIPLINED SMALL CORE FUND
Performance Summary
n Columbia Disciplined Small Core Fund (the Fund) Class A shares returned 4.32% excluding sales charges for the 12-month period that ended August 31, 2016.
n The Fund underperformed its benchmarks, the Russell 2000 Index and the S&P SmallCap 600 Index, which returned 8.59% and 13.26%, respectively, for the same 12-month period.
n Security selection in the information technology and consumer discretionary sectors detracted from the Fund's results relative to its Russell benchmark.
Average Annual Total Returns (%) (for period ended August 31, 2016)
| | | Inception | | 1 Year | | 5 Years | | 10 Years | |
Class A | | 11/01/98 | | | | | | | | | | | | | |
Excluding sales charges | | | | | | | 4.32 | | | | 8.79 | | | | 5.93 | | |
Including sales charges | | | | | | | -1.68 | | | | 7.52 | | | | 5.31 | | |
Class B | | 11/01/98 | | | | | | | | | | | | | |
Excluding sales charges | | | | | | | 3.63 | | | | 7.99 | | | | 5.15 | | |
Including sales charges | | | | | | | 0.46 | | | | 7.79 | | | | 5.15 | | |
Class C | | 11/18/02 | | | | | | | | | | | | | |
Excluding sales charges | | | | | | | 3.62 | | | | 7.99 | | | | 5.15 | | |
Including sales charges | | | | | | | 2.99 | | | | 7.99 | | | | 5.15 | | |
Class I* | | 09/27/10 | | | 4.80 | | | | 9.30 | | | | 6.33 | | |
Class R4* | | 11/08/12 | | | 4.64 | | | | 9.07 | | | | 6.20 | | |
Class R5* | | 11/08/12 | | | 4.76 | | | | 9.21 | | | | 6.27 | | |
Class T | | 02/12/93 | | | | | | | | | | | | | |
Excluding sales charges | | | | | | | 4.35 | | | | 8.75 | | | | 5.89 | | |
Including sales charges | | | | | | | -1.67 | | | | 7.47 | | | | 5.26 | | |
Class W* | | 09/27/10 | | | 4.32 | | | | 8.79 | | | | 5.94 | | |
Class Y* | | 11/08/12 | | | 4.83 | | | | 9.24 | | | | 6.28 | | |
Class Z | | 12/14/92 | | | 4.64 | | | | 9.07 | | | | 6.20 | | |
Russell 2000 Index | | | | | | | 8.59 | | | | 12.85 | | | | 7.04 | | |
S&P SmallCap 600 Index | | | | | | | 13.26 | | | | 15.18 | | | | 8.73 | | |
Returns for Class A and Class T are shown with and without the maximum initial sales charge of 5.75%. Returns for Class B are shown with and without the applicable contingent deferred sales charge (CDSC) of 5.00% in the first year, declining to 1.00% in the sixth year and eliminated thereafter. Returns for Class C are shown with and without the 1.00% CDSC for the first year only. The Fund's other classes are not subject to sales charges and have limited eligibility. Please see the Fund's prospectus for details. Performance for different share classes will vary based on differences in sales charges and fees associated with each class. All results shown assume reinvestment of distributions during the period. Returns do not reflect the deduction of taxes that a shareholder may pay on Fund distributions or on the redemption of Fund shares. Performance results reflect the effect of any fee waivers or reimbursements of Fund expenses by Columbia Management Investment Advisers, LLC and/or any of its affiliates. Absent these fee waivers or expense reimbursement arrangements, performance results would have been lower.
The performance information shown represents past performance and is not a guarantee of future results. The investment return and principal value of your investment will fluctuate so that your shares, when redeemed, may be worth more or less than their original cost. Current performance may be lower or higher than the performance information shown. You may obtain performance information current to the most recent month-end by contacting your financial intermediary, visiting investor.columbiathreadneedleus.com or calling 800.345.6611.
*The returns shown for periods prior to the share class inception date (including returns for the Life of the Fund, if shown, which are since Fund inception) include the returns of the Fund's oldest share class. These returns are adjusted to reflect any higher class-related operating expenses of the newer share classes, as applicable. Please visit investor.columbiathreadneedleus.com/investment-products/mutual-funds/ appended-performance for more information.
The Russell 2000 Index measures the performance of the small-cap segment of the U.S. equity universe. The Russell 2000 is a subset of the Russell 3000 Index representing approximately 10% of the total market capitalization of that index. It includes the securities of approximately 2,000 of the smallest companies in the Russell 3000 Index based on a combination of their market capitalization and current index membership.
The S&P SmallCap 600 Index tracks the performance of 600 domestic companies traded on major stock exchanges. The S&P SmallCap 600 is heavily weighted with the stocks of companies with small market capitalizations.
Indices are not available for investment, are not professionally managed and do not reflect sales charges, fees, brokerage commissions, taxes or other expenses of investing. Securities in the Fund may not match those in an index.
Annual Report 2016
3
COLUMBIA DISCIPLINED SMALL CORE FUND
PERFORMANCE OVERVIEW (continued)
Performance of a Hypothetical $10,000 Investment (September 1, 2006 – August 31, 2016)
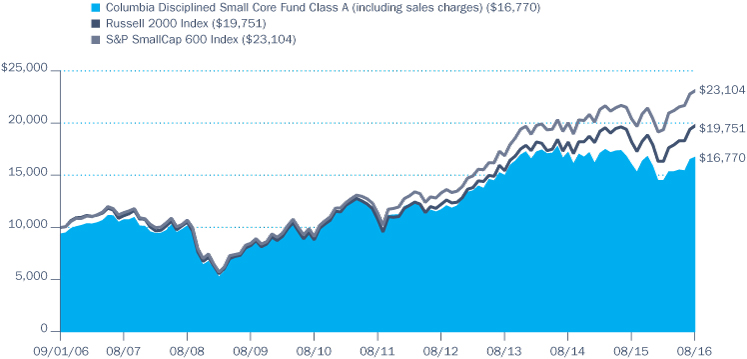
The chart above shows the change in value of a hypothetical $10,000 investment in Class A shares of Columbia Disciplined Small Core Fund during the stated time period, and does not reflect the deduction of taxes that a shareholder may pay on Fund distributions or on the redemption of Fund shares.
Annual Report 2016
4
COLUMBIA DISCIPLINED SMALL CORE FUND
MANAGER DISCUSSION OF FUND PERFORMANCE
For the 12-month period that ended August 31, 2016, the Fund's Class A shares returned 4.32% excluding sales charges. By comparison, the Fund's benchmarks, the Russell 2000 Index and the S&P SmallCap 600 Index, posted returns of 8.59% and 13.26%, respectively. Stocks with a high degree of market sensitivity and higher volatility stocks underperformed during the period, which worked against the Fund's portfolio. Security selection in the information technology and consumer discretionary sectors detracted from the Fund's results relative to its Russell benchmark.
Stocks Logged Gains in Volatile Market
Lackluster economic growth, contentious geopolitical conflicts and expectations of a shift in U.S. monetary policy weighed on investors in the first half of the 12-month period. In December 2015, the Federal Reserve (the Fed) raised the target range of its benchmark interest rate by a quarter of a point. But the Fed took no further action as subpar global economic growth continued and mixed economic data undermined confidence at home.
The U.S. economy, however, continued to expand modestly throughout the period, and economic growth in Europe picked up, if ever so slightly. After an earlier slump, the U.S. manufacturing sector regained some traction in the spring, and the U.S. labor markets recovered to full employment for the first time since the Great Recession, despite occasional weaker reports on new job growth. The vote by the United Kingdom to exit the European Union gave markets a jolt in mid-June, but that downdraft was short lived.
Against this backdrop, stocks pulled back three times during the 12-month period. The S&P 500 Index, a broad measure of U.S. stock market performance, rose 12.55% despite these downdrafts. Large-cap stocks outperformed mid- and small-cap stocks. Value stocks outperformed growth stocks, with an especially big advantage for mid-cap and small-cap value stocks versus their growth counterparts.
Contributors and Detractors
We divide the metrics for our stock selection model into three broad categories: 1) valuation — fundamental measures such as earnings and cash flow relative to market values, 2) catalyst — price momentum and business momentum and 3) quality — quality of earnings and financial strength. We then rank the securities within a sector/industry from one (most attractive) to five (least attractive) based upon the metrics within these categories. The period was largely defined by the performance of lower volatility and higher dividend yielding stocks, and these factors aided the portfolio most. Value and quality were both modestly positive for the portfolio. Catalyst results were largely mixed.
On a sector basis, stock selection in the health care and industrials sectors aided performance relative to the Russell benchmark. Quad/Graphics, which provides a diverse range of print and media solutions and logistics services did well after announcing stronger-than-expected earnings and a new streamlined global brand management solution to enhance delivery times and product quality. The market
Portfolio Management
Alfred Alley III, CFA
Brian Condon, CFA
Morningstar Style BoxTM

The Morningstar Style BoxTM is based on a fund's portfolio holdings. For equity funds, the vertical axis shows the market capitalization of the stocks owned, and the horizontal axis shows investment style (value, blend, or growth). Information shown is based on the most recent data provided by Morningstar.
© 2016 Morningstar, Inc. All rights reserved. The Morningstar information contained herein: (1) is proprietary to Morningstar and/or its content providers; (2) may not be copied or distributed; and (3) is not warranted to be accurate, complete or timely. Neither Morningstar nor its content providers are responsible for any damages or losses arising from any use of this information.
Top Ten Holdings (%)
(at August 31, 2016) | |
Aspen Technology, Inc. | | | 1.0 | | |
Universal Insurance
Holdings, Inc. | | | 0.9 | | |
Washington Prime Group, Inc. | | | 0.9 | | |
EnerSys | | | 0.9 | | |
SYNNEX Corp. | | | 0.9 | | |
Trinseo SA | | | 0.9 | | |
REX American Resources Corp. | | | 0.9 | | |
Universal Forest Products, Inc. | | | 0.9 | | |
Radian Group, Inc. | | | 0.9 | | |
Washington Federal, Inc. | | | 0.9 | | |
Percentages indicated are based upon total investments (excluding Money Market Funds).
For further detail about these holdings, please refer to the section entitled "Portfolio of Investments."
Fund holdings are as of the date given, are subject to change at any time, and are not recommendations to buy or sell any security.
Annual Report 2016
5
COLUMBIA DISCIPLINED SMALL CORE FUND
MANAGER DISCUSSION OF FUND PERFORMANCE (continued)
Portfolio Breakdown (%)
(at August 31, 2016) | |
Common Stocks | | | 98.2 | | |
Money Market Funds | | | 1.8 | | |
Total | | | 100.0 | | |
Percentages indicated are based upon total investments. The Fund's portfolio composition is subject to change.
Equity Sector Breakdown (%)
(at August 31, 2016) | |
Consumer Discretionary | | | 13.1 | | |
Consumer Staples | | | 3.5 | | |
Energy | | | 3.3 | | |
Financials | | | 26.8 | | |
Health Care | | | 13.5 | | |
Industrials | | | 13.9 | | |
Information Technology | | | 16.6 | | |
Materials | | | 4.6 | | |
Telecommunication Services | | | 1.0 | | |
Utilities | | | 3.7 | | |
Total | | | 100.0 | | |
Percentages indicated are based upon total equity investments. The Fund's portfolio composition is subject to change.
Investment Risks
Market risk may affect a single issuer, sector of the economy, industry or the market as a whole. Foreign investments subject the Fund to risks, including political, economic, market, social and others within a particular country, as well as to currency instabilities and less stringent financial and accounting standards generally applicable to U.S. issuers. Investments in small-cap companies involve risks and volatility greater than investments in larger, more established companies. The Fund may invest significantly in issuers within a particular sector, which may be negatively affected by market, economic or other conditions, making the Fund more vulnerable to unfavorable developments in the sector. See the Fund's prospectus for more information on these and other risks.
responded favorably to LSI Industries, which provides corporate visual image solutions through the combination of digital and screen graphics capabilities. LSI Industries began a corporate overhaul at the end of 2014, which included a new CEO and renewed focus on sales and operational efficiency. This push has yielded strong results for the firm's financials and outlook. Spire, a public natural gas utility, was a strong performer, the result of increased net income, the announcement of a new 60 mile pipeline and the acquisition of EnergySouth. We sold the Fund's positions in LSI Industries and Spire during the period.
Stock selection within the information technology and consumer discretionary sectors lagged the Russell benchmark. InvenSense is a major provider of micro electromechanical gyroscopes for motion-tracking devices in consumer electronics, Apple iPhones in particular. An increase in inventory at Apple and the loss of market share to Samsung provided a major headwind to the company's revenue and brought its share price down for the period. We sold the Fund's position in InvenSense during the period. Synaptics, which develops and supplies intuitive human interface solutions for a range of electronic devices and products worldwide, was the discussion of buyout talks, but a disappointing earnings announcement made the deal unattractive and shares tumbled. In the financials sector, Heritage Insurance Holdings, a property and casualty insurance company, lost ground. Heritage posted a 75% decline in net income in the first quarter of 2016 due to an increase in weather-related claims due to severe weather. Litigation concerns also weighed on Heritage shares.
The Fund also invested in futures contracts during the period. The stand-alone impact of these contracts had a positive impact on fund performance.
Fund Strategy
We assumed the day-to-day portfolio management of the Fund in January 2016. The transition of the portfolio to our quantitative model resulted in a portfolio turnover of 112%, which is higher than previous reporting periods. Our strategy is based on individual quantitative stock selection. Consequently, we do not rely on macroeconomic scenarios or market outlooks to make security selections. We do not try to predict when equities, as an asset class, may perform well or when they may perform poorly. Instead, we keep the fund substantially invested at all times. Regardless of economic environment, we seek to identify stocks that we believe have the potential to outperform within each market sector. We also seek to minimize sector weight differences between the Fund and its Russell benchmark. We favor stocks of companies we believe have attractive valuations relative to their peers, strong business and market momentum and good quality of earnings and financial strength.
Annual Report 2016
6
COLUMBIA DISCIPLINED SMALL CORE FUND
UNDERSTANDING YOUR FUND'S EXPENSES
(Unaudited)
As an investor, you incur two types of costs. There are transaction costs, which generally include sales charges on purchases and may include redemption fees. There are also ongoing costs, which generally include management fees, distribution and/or service fees, and other fund expenses. The following information is intended to help you understand your ongoing costs (in dollars) of investing in the Fund and to help you compare these costs with the ongoing costs of investing in other mutual funds.
Analyzing Your Fund's Expenses
To illustrate these ongoing costs, we have provided examples and calculated the expenses paid by investors in each share class of the Fund during the period. The actual and hypothetical information in the table is based on an initial investment of $1,000 at the beginning of the period indicated and held for the entire period. Expense information is calculated two ways and each method provides you with different information. The amount listed in the "Actual" column is calculated using the Fund's actual operating expenses and total return for the period. You may use the Actual information, together with the amount invested, to estimate the expenses that you paid over the period. Simply divide your account value by $1,000 (for example, an $8,600 account value divided by $1,000 = 8.6), then multiply the results by the expenses paid during the period under the "Actual" column. The amount listed in the "Hypothetical" column assumes a 5% annual rate of return before expenses (which is not the Fund's actual return) and then applies the Fund's actual expense ratio for the period to the hypothetical return. You should not use the hypothetical account values and expenses to estimate either your actual account balance at the end of the period or the expenses you paid during the period. See "Compare With Other Funds" below for details on how to use the hypothetical data.
Compare With Other Funds
Since all mutual funds are required to include the same hypothetical calculations about expenses in shareholder reports, you can use this information to compare the ongoing cost of investing in the Fund with other funds. To do so, compare the hypothetical example with the 5% hypothetical examples that appear in the shareholder reports of other funds. As you compare hypothetical examples of other funds, it is important to note that hypothetical examples are meant to highlight the ongoing costs of investing in a fund only and do not reflect any transaction costs, such as sales charges, or redemption or exchange fees. Therefore, the hypothetical calculations are useful in comparing ongoing costs only, and will not help you determine the relative total costs of owning different funds. If transaction costs were included in these calculations, your costs would be higher.
March 1, 2016 – August 31, 2016
| | | Account Value at the Beginning
of the Period ($) | | Account Value at the End of the
Period ($) | | Expenses Paid During the
Period ($) | | Fund's Annualized
Expense Ratio (%) | |
| | | Actual | | Hypothetical | | Actual | | Hypothetical | | Actual | | Hypothetical | | Actual | |
Class A | | | 1,000.00 | | | | 1,000.00 | | | | 1,153.30 | | | | 1,018.20 | | | | 7.47 | | | | 7.00 | | | | 1.38 | | |
Class B | | | 1,000.00 | | | | 1,000.00 | | | | 1,149.90 | | | | 1,014.43 | | | | 11.51 | | | | 10.79 | | | | 2.13 | | |
Class C | | | 1,000.00 | | | | 1,000.00 | | | | 1,149.50 | | | | 1,014.43 | | | | 11.51 | | | | 10.79 | | | | 2.13 | | |
Class I | | | 1,000.00 | | | | 1,000.00 | | | | 1,155.90 | | | | 1,020.36 | | | | 5.15 | | | | 4.82 | | | | 0.95 | | |
Class R4 | | | 1,000.00 | | | | 1,000.00 | | | | 1,155.40 | | | | 1,019.46 | | | | 6.12 | | | | 5.74 | | | | 1.13 | | |
Class R5 | | | 1,000.00 | | | | 1,000.00 | | | | 1,155.60 | | | | 1,020.11 | | | | 5.42 | | | | 5.08 | | | | 1.00 | | |
Class T | | | 1,000.00 | | | | 1,000.00 | | | | 1,153.70 | | | | 1,018.20 | | | | 7.47 | | | | 7.00 | | | | 1.38 | | |
Class W | | | 1,000.00 | | | | 1,000.00 | | | | 1,153.30 | | | | 1,018.20 | | | | 7.47 | | | | 7.00 | | | | 1.38 | | |
Class Y | | | 1,000.00 | | | | 1,000.00 | | | | 1,156.40 | | | | 1,020.36 | | | | 5.15 | | | | 4.82 | | | | 0.95 | | |
Class Z | | | 1,000.00 | | | | 1,000.00 | | | | 1,155.80 | | | | 1,019.46 | | | | 6.12 | | | | 5.74 | | | | 1.13 | | |
Expenses paid during the period are equal to the annualized expense ratio for each class as indicated above, multiplied by the average account value over the period and then multiplied by the number of days in the Fund's most recent fiscal half year and divided by 366.
Expenses do not include fees and expenses incurred indirectly by the Fund from its investment in underlying funds, including affiliated and non-affiliated pooled investment vehicles, such as mutual funds and exchange-traded funds.
Had Columbia Management Investment Advisers, LLC and/or certain of its affiliates not waived/reimbursed certain fees and expenses, account value at the end of the period would have been reduced.
Annual Report 2016
7
COLUMBIA DISCIPLINED SMALL CORE FUND
PORTFOLIO OF INVESTMENTS
August 31, 2016
(Percentages represent value of investments compared to net assets)
Common Stocks 95.7%
Issuer | | Shares | | Value ($) | |
CONSUMER DISCRETIONARY 12.6% | |
Auto Components 3.1% | |
Cooper Tire & Rubber Co. | | | 47,400 | | | | 1,611,126 | | |
Cooper-Standard Holding, Inc.(a) | | | 11,200 | | | | 1,109,360 | | |
Dana, Inc. | | | 151,400 | | | | 2,183,188 | | |
Drew Industries, Inc. | | | 15,500 | | | | 1,578,675 | | |
Superior Industries International, Inc. | | | 56,600 | | | | 1,647,626 | | |
Tenneco, Inc.(a) | | | 4,925 | | | | 274,963 | | |
Total | | | | | 8,404,938 | | |
Diversified Consumer Services 0.6% | |
Capella Education Co. | | | 28,725 | | | | 1,692,477 | | |
Hotels, Restaurants & Leisure 2.7% | |
Bloomin' Brands, Inc. | | | 34,600 | | | | 676,084 | | |
Bob Evans Farms, Inc. | | | 16,150 | | | | 662,150 | | |
Cracker Barrel Old Country Store, Inc. | | | 8,770 | | | | 1,334,005 | | |
Denny's Corp.(a) | | | 100,473 | | | | 1,049,943 | | |
Diamond Resorts International, Inc.(a) | | | 22,450 | | | | 678,214 | | |
Isle of Capri Casinos, Inc.(a) | | | 86,000 | | | | 1,492,100 | | |
Ruth's Hospitality Group, Inc. | | | 99,500 | | | | 1,488,520 | | |
Total | | | | | 7,381,016 | | |
Household Durables 0.1% | |
La-Z-Boy, Inc. | | | 10,800 | | | | 288,036 | | |
Internet & Catalog Retail 0.2% | |
PetMed Express, Inc. | | | 19,485 | | | | 392,818 | | |
Leisure Products 0.1% | |
Sturm Ruger & Co., Inc. | | | 2,200 | | | | 134,838 | | |
Media 1.4% | |
Gannett Co., Inc. | | | 156,700 | | | | 1,869,431 | | |
New York Times Co. (The), Class A | | | 109,300 | | | | 1,414,342 | | |
Nexstar Broadcasting Group, Inc., Class A | | | 9,900 | | | | 521,928 | | |
Total | | | | | 3,805,701 | | |
Multiline Retail 0.6% | |
Big Lots, Inc. | | | 32,500 | | | | 1,602,900 | | |
Specialty Retail 3.2% | |
Abercrombie & Fitch Co., Class A | | | 95,650 | | | | 1,696,831 | | |
American Eagle Outfitters, Inc. | | | 54,200 | | | | 1,004,868 | | |
Cato Corp. (The), Class A | | | 53,300 | | | | 1,827,124 | | |
Children's Place, Inc. (The) | | | 25,525 | | | | 2,077,735 | | |
GNC Holdings, Inc., Class A | | | 24,000 | | | | 504,720 | | |
Pier 1 Imports, Inc. | | | 361,800 | | | | 1,667,898 | | |
Total | | | | | 8,779,176 | | |
Common Stocks (continued)
Issuer | | Shares | | Value ($) | |
Textiles, Apparel & Luxury Goods 0.6% | |
Movado Group, Inc. | | | 76,500 | | | | 1,736,550 | | |
Total Consumer Discretionary | | | | | 34,218,450 | | |
CONSUMER STAPLES 3.3% | |
Food & Staples Retailing 1.0% | |
SpartanNash Co. | | | 36,700 | | | | 1,175,134 | | |
SUPERVALU, Inc.(a) | | | 276,800 | | | | 1,516,864 | | |
Total | | | | | 2,691,998 | | |
Food Products 2.1% | |
Cal-Maine Foods, Inc. | | | 39,225 | | | | 1,801,996 | | |
Dean Foods Co. | | | 100,600 | | | | 1,731,326 | | |
Sanderson Farms, Inc. | | | 23,000 | | | | 2,213,290 | | |
Total | | | | | 5,746,612 | | |
Personal Products 0.2% | |
Usana Health Sciences, Inc.(a) | | | 4,790 | | | | 654,985 | | |
Total Consumer Staples | | | | | 9,093,595 | | |
ENERGY 3.2% | |
Energy Equipment & Services 0.8% | |
Archrock, Inc. | | | 52,200 | | | | 575,244 | | |
Atwood Oceanics, Inc. | | | 188,300 | | | | 1,487,570 | | |
Total | | | | | 2,062,814 | | |
Oil, Gas & Consumable Fuels 2.4% | |
PDC Energy, Inc.(a) | | | 32,050 | | | | 2,128,120 | | |
REX American Resources Corp.(a) | | | 29,100 | | | | 2,340,804 | | |
Western Refining, Inc. | | | 86,350 | | | | 2,172,566 | | |
Total | | | | | 6,641,490 | | |
Total Energy | | | | | 8,704,304 | | |
FINANCIALS 25.7% | |
Banks 5.1% | |
Banc of California, Inc. | | | 101,000 | | | | 2,254,320 | | |
Banco Latinoamericano de
Comercio Exterior SA, Class E | | | 55,900 | | | | 1,614,951 | | |
Central Pacific Financial Corp. | | | 83,350 | | | | 2,132,927 | | |
Chemical Financial Corp. | | | 11,000 | | | | 508,530 | | |
Customers Bancorp, Inc.(a) | | | 66,750 | | | | 1,784,895 | | |
FCB Financial Holdings, Inc., Class A(a) | | | 9,800 | | | | 375,340 | | |
First BanCorp(a) | | | 93,600 | | | | 458,640 | | |
First NBC Bank Holding Co.(a) | | | 56,750 | | | | 741,155 | | |
The accompanying Notes to Financial Statements are an integral part of this statement.
Annual Report 2016
8
COLUMBIA DISCIPLINED SMALL CORE FUND
PORTFOLIO OF INVESTMENTS (continued)
August 31, 2016
Common Stocks (continued)
Issuer | | Shares | | Value ($) | |
Fulton Financial Corp. | | | 72,500 | | | | 1,048,350 | | |
Great Western Bancorp, Inc. | | | 12,100 | | | | 414,304 | | |
Hope Bancorp, Inc. | | | 45,200 | | | | 777,440 | | |
International Bancshares Corp. | | | 61,400 | | | | 1,820,510 | | |
Total | | | | | 13,931,362 | | |
Capital Markets 1.4% | |
Arlington Asset Investment Corp., Class A | | | 91,200 | | | | 1,357,056 | | |
Cowen Group, Inc., Class A(a) | | | 90,300 | | | | 338,625 | | |
KCG Holdings, Inc., Class A(a) | | | 122,200 | | | | 1,765,790 | | |
Piper Jaffray Companies(a) | | | 6,500 | | | | 288,470 | | |
Total | | | | | 3,749,941 | | |
Consumer Finance 0.6% | |
Nelnet, Inc., Class A | | | 48,250 | | | | 1,708,050 | | |
Diversified Financial Services 0.7% | |
Cardtronics PLC, Class A(a) | | | 41,400 | | | | 1,859,274 | | |
Insurance 3.0% | |
American Equity Investment Life
Holding Co. | | | 88,400 | | | | 1,557,608 | | |
Heritage Insurance Holdings, Inc. | | | 91,400 | | | | 1,254,008 | | |
Maiden Holdings Ltd. | | | 143,500 | | | | 1,981,735 | | |
National General Holdings Corp. | | | 36,900 | | | | 840,951 | | |
Universal Insurance Holdings, Inc. | | | 97,400 | | | | 2,413,572 | | |
Total | | | | | 8,047,874 | | |
Real Estate Investment Trusts (REITs) 9.3% | |
Apollo Commercial Real Estate
Finance, Inc. | | | 12,300 | | | | 200,490 | | |
Armada Hoffler Properties, Inc. | | | 34,000 | | | | 468,520 | | |
Ashford Hospitality Prime, Inc. | | | 29,400 | | | | 455,994 | | |
CBL & Associates Properties, Inc. | | | 160,800 | | | | 2,294,616 | | |
Chesapeake Lodging Trust | | | 21,100 | | | | 537,628 | | |
Coresite Realty Corp. | | | 27,100 | | | | 2,114,342 | | |
CYS Investments, Inc. | | | 239,500 | | | | 2,109,995 | | |
DuPont Fabros Technology, Inc. | | | 47,900 | | | | 2,030,960 | | |
Invesco Mortgage Capital, Inc. | | | 75,700 | | | | 1,191,518 | | |
Lexington Realty Trust | | | 67,000 | | | | 722,930 | | |
Mack-Cali Realty Corp. | | | 81,950 | | | | 2,274,932 | | |
National Storage Affiliates Trust | | | 25,100 | | | | 509,781 | | |
PS Business Parks, Inc. | | | 18,230 | | | | 2,019,519 | | |
RLJ Lodging Trust | | | 49,800 | | | | 1,162,332 | | |
Ryman Hospitality Properties, Inc. | | | 16,400 | | | | 884,944 | | |
Common Stocks (continued)
Issuer | | Shares | | Value ($) | |
Select Income REIT | | | 40,700 | | | | 1,110,703 | | |
Summit Hotel Properties, Inc. | | | 151,457 | | | | 2,165,835 | | |
Sunstone Hotel Investors, Inc. | | | 56,000 | | | | 777,840 | | |
Washington Prime Group, Inc. | | | 174,400 | | | | 2,396,256 | | |
Total | | | | | 25,429,135 | | |
Thrifts & Mortgage Finance 5.6% | |
BofI Holding, Inc.(a) | | | 99,600 | | | | 2,141,400 | | |
Essent Group Ltd.(a) | | | 46,900 | | | | 1,246,602 | | |
Flagstar Bancorp, Inc.(a) | | | 73,650 | | | | 2,068,092 | | |
HomeStreet, Inc.(a) | | | 43,150 | | | | 1,124,489 | | |
MGIC Investment Corp.(a) | | | 276,800 | | | | 2,239,312 | | |
Radian Group, Inc. | | | 169,500 | | | | 2,323,845 | | |
Walker & Dunlop, Inc.(a) | | | 63,700 | | | | 1,688,050 | | |
Washington Federal, Inc. | | | 87,300 | | | | 2,313,450 | | |
Total | | | | | 15,145,240 | | |
Total Financials | | | | | 69,870,876 | | |
HEALTH CARE 12.9% | |
Biotechnology 4.2% | |
ACADIA Pharmaceuticals, Inc.(a) | | | 20,550 | | | | 660,271 | | |
Alder Biopharmaceuticals, Inc.(a) | | | 29,635 | | | | 977,066 | | |
Arrowhead Pharmaceuticals, Inc.(a) | | | 138,945 | | | | 962,889 | | |
bluebird bio, Inc.(a) | | | 9,920 | | | | 489,453 | | |
Dynavax Technologies Corp.(a) | | | 48,300 | | | | 756,378 | | |
Insys Therapeutics, Inc.(a) | | | 61,755 | | | | 881,244 | | |
Keryx Biopharmaceuticals, Inc.(a) | | | 189,055 | | | | 775,125 | | |
Kite Pharma, Inc.(a) | | | 11,405 | | | | 657,156 | | |
Ligand Pharmaceuticals, Inc.(a) | | | 11,920 | | | | 1,231,455 | | |
Novavax, Inc.(a) | | | 105,470 | | | | 721,415 | | |
Sage Therapeutics, Inc.(a) | | | 11,405 | | | | 423,924 | | |
Spark Therapeutics, Inc.(a) | | | 18,570 | | | | 1,050,691 | | |
TESARO, Inc.(a) | | | 12,160 | | | | 1,029,830 | | |
Ultragenyx Pharmaceutical, Inc.(a) | | | 12,540 | | | | 826,637 | | |
Total | | | | | 11,443,534 | | |
Health Care Equipment & Supplies 3.3% | |
Analogic Corp. | | | 22,315 | | | | 1,986,035 | | |
Globus Medical, Inc., Class A(a) | | | 36,900 | | | | 857,187 | | |
Halyard Health, Inc.(a) | | | 31,800 | | | | 1,159,110 | | |
Masimo Corp.(a) | | | 21,450 | | | | 1,268,553 | | |
Merit Medical Systems, Inc.(a) | | | 32,200 | | | | 780,528 | | |
The accompanying Notes to Financial Statements are an integral part of this statement.
Annual Report 2016
9
COLUMBIA DISCIPLINED SMALL CORE FUND
PORTFOLIO OF INVESTMENTS (continued)
August 31, 2016
Common Stocks (continued)
Issuer | | Shares | | Value ($) | |
OraSure Technologies, Inc.(a) | | | 124,700 | | | | 1,068,679 | | |
Orthofix International NV(a) | | | 40,750 | | | | 1,838,232 | | |
Total | | | | | 8,958,324 | | |
Health Care Providers & Services 2.4% | |
Chemed Corp. | | | 3,700 | | | | 499,241 | | |
Kindred Healthcare, Inc. | | | 23,600 | | | | 260,544 | | |
Magellan Health, Inc.(a) | | | 26,948 | | | | 1,539,270 | | |
Molina Healthcare, Inc.(a) | | | 35,275 | | | | 1,898,148 | | |
Owens & Minor, Inc. | | | 22,450 | | | | 771,607 | | |
Triple-S Management Corp., Class B(a) | | | 68,550 | | | | 1,500,559 | | |
Total | | | | | 6,469,369 | | |
Life Sciences Tools & Services 1.6% | |
Cambrex Corp.(a) | | | 11,675 | | | | 500,040 | | |
INC Research Holdings, Inc. Class A(a) | | | 44,125 | | | | 1,925,174 | | |
Pra Health Sciences, Inc.(a) | | | 39,050 | | | | 1,973,978 | | |
Total | | | | | 4,399,192 | | |
Pharmaceuticals 1.4% | |
Aerie Pharmaceuticals, Inc.(a) | | | 50,815 | | | | 983,778 | | |
Impax Laboratories, Inc.(a) | | | 67,000 | | | | 1,620,730 | | |
Supernus Pharmaceuticals, Inc.(a) | | | 62,255 | | | | 1,331,012 | | |
Total | | | | | 3,935,520 | | |
Total Health Care | | | | | 35,205,939 | | |
INDUSTRIALS 13.3% | |
Airlines 0.9% | |
Hawaiian Holdings, Inc.(a) | | | 49,200 | | | | 2,311,416 | | |
Building Products 2.6% | |
Continental Building Product(a) | | | 83,000 | | | | 1,843,430 | | |
Gibraltar Industries, Inc.(a) | | | 34,400 | | | | 1,312,704 | | |
NCI Building Systems, Inc.(a) | | | 102,500 | | | | 1,551,850 | | |
Universal Forest Products, Inc. | | | 21,420 | | | | 2,337,993 | | |
Total | | | | | 7,045,977 | | |
Commercial Services & Supplies 1.7% | |
Brady Corp., Class A | | | 45,300 | | | | 1,517,097 | | |
Knoll, Inc. | | | 15,400 | | | | 407,484 | | |
Quad/Graphics, Inc. | | | 76,300 | | | | 2,066,967 | | |
Tetra Tech, Inc. | | | 18,610 | | | | 656,933 | | |
Total | | | | | 4,648,481 | | |
Construction & Engineering 0.8% | |
Comfort Systems U.S.A., Inc. | | | 3,900 | | | | 110,721 | | |
EMCOR Group, Inc. | | | 37,555 | | | | 2,150,399 | | |
Total | | | | | 2,261,120 | | |
Common Stocks (continued)
Issuer | | Shares | | Value ($) | |
Electrical Equipment 0.9% | |
EnerSys | | | 34,020 | | | | 2,394,328 | | |
Machinery 3.2% | |
Briggs & Stratton Corp. | | | 44,900 | | | | 853,549 | | |
Energy Recovery, Inc.(a) | | | 121,000 | | | | 1,461,680 | | |
Global Brass & Copper Holdings, Inc. | | | 53,100 | | | | 1,490,517 | | |
Greenbrier Companies, Inc. (The) | | | 59,500 | | | | 2,016,455 | | |
Mueller Industries, Inc. | | | 27,950 | | | | 965,952 | | |
Wabash National Corp.(a) | | | 141,621 | | | | 1,975,613 | | |
Total | | | | | 8,763,766 | | |
Marine 0.1% | |
Matson, Inc. | | | 8,150 | | | | 314,508 | | |
Professional Services 1.3% | |
Huron Consulting Group, Inc.(a) | | | 29,900 | | | | 1,879,514 | | |
RPX Corp.(a) | | | 164,000 | | | | 1,717,080 | | |
Total | | | | | 3,596,594 | | |
Road & Rail 0.4% | |
ArcBest Corp. | | | 52,900 | | | | 968,599 | | |
Trading Companies & Distributors 1.4% | |
Applied Industrial Technologies, Inc. | | | 41,730 | | | | 1,983,010 | | |
MRC Global, Inc.(a) | | | 133,600 | | | | 1,959,912 | | |
Total | | | | | 3,942,922 | | |
Total Industrials | | | | | 36,247,711 | | |
INFORMATION TECHNOLOGY 15.9% | |
Communications Equipment 0.8% | |
NETGEAR, Inc.(a) | | | 40,100 | | | | 2,285,700 | | |
Electronic Equipment, Instruments & Components 3.9% | |
Benchmark Electronics, Inc.(a) | | | 88,401 | | | | 2,132,232 | | |
Insight Enterprises, Inc.(a) | | | 34,250 | | | | 1,048,050 | | |
MTS Systems Corp. | | | 20,200 | | | | 1,004,950 | | |
Sanmina Corp.(a) | | | 76,785 | | | | 2,017,910 | | |
SYNNEX Corp. | | | 22,400 | | | | 2,378,208 | | |
Tech Data Corp.(a) | | | 28,025 | | | | 2,080,576 | | |
Total | | | | | 10,661,926 | | |
Internet Software & Services 2.6% | |
EarthLink Holdings Corp. | | | 290,300 | | | | 1,849,211 | | |
j2 Global, Inc. | | | 28,925 | | | | 1,971,817 | | |
LogMeIn, Inc. | | | 15,650 | | | | 1,306,775 | | |
RetailMeNot, Inc.(a) | | | 172,145 | | | | 1,946,960 | | |
Total | | | | | 7,074,763 | | |
The accompanying Notes to Financial Statements are an integral part of this statement.
Annual Report 2016
10
COLUMBIA DISCIPLINED SMALL CORE FUND
PORTFOLIO OF INVESTMENTS (continued)
August 31, 2016
Common Stocks (continued)
Issuer | | Shares | | Value ($) | |
IT Services 2.6% | |
CSG Systems International, Inc. | | | 31,225 | | | | 1,365,157 | | |
EVERTEC, Inc. | | | 105,200 | | | | 1,794,712 | | |
NeuStar, Inc., Class A(a) | | | 77,000 | | | | 1,956,570 | | |
Sykes Enterprises, Inc.(a) | | | 45,950 | | | | 1,343,119 | | |
Syntel, Inc.(a) | | | 12,500 | | | | 577,125 | | |
Total | | | | | 7,036,683 | | |
Semiconductors & Semiconductor Equipment 3.1% | |
Amkor Technology, Inc.(a) | | | 240,500 | | | | 2,188,550 | | |
Diodes, Inc.(a) | | | 25,500 | | | | 525,045 | | |
Entegris, Inc.(a) | | | 119,000 | | | | 2,027,760 | | |
Silicon Laboratories, Inc.(a) | | | 7,375 | | | | 422,588 | | |
Synaptics, Inc.(a) | | | 39,430 | | | | 2,246,327 | | |
Xcerra Corp.(a) | | | 152,442 | | | | 893,310 | | |
Total | | | | | 8,303,580 | | |
Software 2.9% | |
Aspen Technology, Inc.(a) | | | 58,350 | | | | 2,652,591 | | |
AVG Technologies NV(a) | | | 28,700 | | | | 713,482 | | |
Mentor Graphics Corp. | | | 89,840 | | | | 2,157,058 | | |
MicroStrategy, Inc., Class A(a) | | | 3,800 | | | | 633,802 | | |
Qualys, Inc.(a) | | | 32,800 | | | | 1,128,320 | | |
VASCO Data Security International, Inc.(a) | | | 37,700 | | | | 687,271 | | |
Total | | | | | 7,972,524 | | |
Total Information Technology | | | | | 43,335,176 | | |
MATERIALS 4.4% | |
Chemicals 3.1% | |
Chemtura Corp.(a) | | | 39,150 | | | | 1,174,108 | | |
Ferro Corp.(a) | | | 47,400 | | | | 632,316 | | |
Innophos Holdings, Inc. | | | 7,172 | | | | 302,802 | | |
Innospec, Inc. | | | 36,275 | | | | 2,150,382 | | |
Rayonier Advanced Materials, Inc. | | | 141,800 | | | | 1,744,140 | | |
Trinseo SA | | | 40,850 | | | | 2,363,581 | | |
Total | | | | | 8,367,329 | | |
Construction Materials 0.2% | |
US Concrete, Inc.(a) | | | 8,300 | | | | 440,066 | | |
Metals & Mining 1.1% | |
Carpenter Technology Corp. | | | 23,950 | | | | 868,906 | | |
Commercial Metals Co. | | | 16,900 | | | | 262,288 | | |
Materion Corp. | | | 15,150 | | | | 444,501 | | |
Common Stocks (continued)
Issuer | | Shares | | Value ($) | |
Schnitzer Steel Industries, Inc., Class A | | | 80,500 | | | | 1,511,790 | | |
Total | | | | | 3,087,485 | | |
Total Materials | | | | | 11,894,880 | | |
TELECOMMUNICATION SERVICES 0.9% | |
Diversified Telecommunication Services 0.6% | |
General Communication, Inc., Class A(a) | | | 93,460 | | | | 1,299,094 | | |
Windstream Holdings, Inc. | | | 36,100 | | | | 307,211 | | |
Total | | | | | 1,606,305 | | |
Wireless Telecommunication Services 0.3% | |
Shenandoah Telecommunications Co. | | | 38,050 | | | | 978,646 | | |
Total Telecommunication Services | | | | | 2,584,951 | | |
UTILITIES 3.5% | |
Electric Utilities 1.0% | |
IDACORP, Inc. | | | 26,200 | | | | 1,993,034 | | |
Portland General Electric Co. | | | 16,650 | | | | 701,131 | | |
Total | | | | | 2,694,165 | | |
Gas Utilities 1.7% | |
Chesapeake Utilities Corp. | | | 26,075 | | | | 1,659,674 | | |
Northwest Natural Gas Co. | | | 11,650 | | | | 695,855 | | |
Southwest Gas Corp. | | | 32,075 | | | | 2,239,476 | | |
Total | | | | | 4,595,005 | | |
Independent Power and Renewable Electricity Producers 0.1% | |
Ormat Technologies, Inc. | | | 6,700 | | | | 324,280 | | |
Water Utilities 0.7% | |
SJW Corp. | | | 43,900 | | | | 1,874,091 | | |
Total Utilities | | | | | 9,487,541 | | |
Total Common Stocks
(Cost: $219,446,601) | | | | | 260,643,423 | | |
Money Market Funds 1.8%
| | | Shares | | Value ($) | |
Columbia Short-Term Cash Fund,
0.415%(b)(c) | | | 4,822,294 | | | | 4,822,294 | | |
Total Money Market Funds
(Cost: $4,822,294) | | | | | 4,822,294 | | |
Total Investments
(Cost: $224,268,895) | | | | | 265,465,717 | | |
Other Assets & Liabilities, Net | | | | | 6,941,193 | | |
Net Assets | | | | | 272,406,910 | | |
The accompanying Notes to Financial Statements are an integral part of this statement.
Annual Report 2016
11
COLUMBIA DISCIPLINED SMALL CORE FUND
PORTFOLIO OF INVESTMENTS (continued)
August 31, 2016
At August 31, 2016, cash totaling $572,000 was pledged as collateral.
Investments in Derivatives
Futures Contracts Outstanding at August 31, 2016
Long Futures Contracts Outstanding
Contract Description | | Number of
Contracts | | Trading
Currency | | Notional
Market
Value ($) | | Expiration
Date | | Unrealized
Appreciation ($) | | Unrealized
(Depreciation) ($) | |
Russell 2000 Mini | | | 102 | | | USD | | | | | 12,635,760 | | | 09/2016 | | | 288,884 | | | | — | | |
Notes to Portfolio of Investments
(a) Non-income producing investment.
(b) The rate shown is the seven-day current annualized yield at August 31, 2016.
(c) As defined in the Investment Company Act of 1940, an affiliated company is one in which the Fund owns 5% or more of the company's outstanding voting securities, or a company which is under common ownership or control with the Fund. Holdings and transactions in these affiliated companies during the year ended August 31, 2016 are as follows:
Issuer | | Beginning
Cost ($) | | Purchase
Cost ($) | | Proceeds
From Sales ($) | | Realized
Gain (Loss) ($) | | Ending
Cost ($) | | Dividends —
Affiliated
Issuers ($) | | Value ($) | |
Columbia
Short-Term
Cash Fund | | | 2,287,779 | | | | 225,929,608 | | | | (223,395,093 | ) | | | — | | | | 4,822,294 | | | | 22,985 | | | | 4,822,294 | | |
Rand Logistics,
Inc.* | | | 5,662,943 | | | | — | | | | (761,844 | ) | | | (4,901,099 | ) | | | — | | | | — | | | | — | | |
Total | | | 7,950,722 | | | | 225,929,608 | | | | (224,156,937 | ) | | | (4,901,099 | ) | | | 4,822,294 | | | | 22,985 | | | | 4,822,294 | | |
*Issuer was not an affiliate for the entire period ended August 31, 2016.
Currency Legend
USD US Dollar
Fair Value Measurements
The Fund categorizes its fair value measurements according to a three-level hierarchy that maximizes the use of observable inputs and minimizes the use of unobservable inputs by prioritizing that the most observable input be used when available. Observable inputs are those that market participants would use in pricing an investment based on market data obtained from sources independent of the reporting entity. Unobservable inputs are those that reflect the Fund's assumptions about the information market participants would use in pricing an investment. An investment's level within the fair value hierarchy is based on the lowest level of any input that is deemed significant to the asset's or liability's fair value measurement. The input levels are not necessarily an indication of the risk or liquidity associated with investments at that level. For example, certain U.S. government securities are generally high quality and liquid, however, they are reflected as Level 2 because the inputs used to determine fair value may not always be quoted prices in an active market.
Fair value inputs are summarized in the three broad levels listed below:
> Level 1 — Valuations based on quoted prices for investments in active markets that the Fund has the ability to access at the measurement date (including NAV for open-end mutual funds). Valuation adjustments are not applied to Level 1 investments.
> Level 2 — Valuations based on other significant observable inputs (including quoted prices for similar securities, interest rates, prepayment speeds, credit risks, etc.).
> Level 3 — Valuations based on significant unobservable inputs (including the Fund's own assumptions and judgment in determining the fair value of investments).
The accompanying Notes to Financial Statements are an integral part of this statement.
Annual Report 2016
12
COLUMBIA DISCIPLINED SMALL CORE FUND
PORTFOLIO OF INVESTMENTS (continued)
August 31, 2016
Fair Value Measurements (continued)
Inputs that are used in determining fair value of an investment may include price information, credit data, volatility statistics, and other factors. These inputs can be either observable or unobservable. The availability of observable inputs can vary between investments, and is affected by various factors such as the type of investment, and the volume and level of activity for that investment or similar investments in the marketplace. The inputs will be considered by the Investment Manager, along with any other relevant factors in the calculation of an investment's fair value. The Fund uses prices and inputs that are current as of the measurement date, which may include periods of market dislocations. During these periods, the availability of prices and inputs may be reduced for many investments. This condition could cause an investment to be reclassified between the various levels within the hierarchy.
Certain investments that have been measured at fair value using the net asset value per share (or its equivalent) are not categorized in the fair value hierarchy. The fair value amounts presented in the table are intended to reconcile the fair value hierarchy to the amounts presented in the Portfolio of Investments. The Columbia Short-Term Cash Fund seeks to provide shareholders with maximum current income consistent with liquidity and stability of principal. Investments in Columbia Short-Term Cash Fund may be redeemed on a daily basis without restriction.
Investments falling into the Level 3 category are primarily supported by quoted prices from brokers and dealers participating in the market for those investments. However, these may be classified as Level 3 investments due to lack of market transparency and corroboration to support these quoted prices. Additionally, valuation models may be used as the pricing source for any remaining investments classified as Level 3. These models may rely on one or more significant unobservable inputs and/or significant assumptions by the Investment Manager. Inputs used in valuations may include, but are not limited to, financial statement analysis, capital account balances, discount rates and estimated cash flows, and comparable company data.
Under the direction of the Fund's Board of Trustees (the Board), the Investment Manager's Valuation Committee (the Committee) is responsible for overseeing the valuation procedures approved by the Board. The Committee consists of voting and non-voting members from various groups within the Investment Manager's organization, including operations and accounting, trading and investments, compliance, risk management and legal.
The Committee meets at least monthly to review and approve valuation matters, which may include a description of specific valuation determinations, data regarding pricing information received from approved pricing vendors and brokers and the results of Board-approved valuation control policies and procedures (the Policies). The Policies address, among other things, instances when market quotations are or are not readily available, including recommendations of third party pricing vendors and a determination of appropriate pricing methodologies; events that require specific valuation determinations and assessment of fair value techniques; securities with a potential for stale pricing, including those that are illiquid, restricted, or in default; and the effectiveness of third party pricing vendors, including periodic reviews of vendors. The Committee meets more frequently, as needed, to discuss additional valuation matters, which may include the need to review back-testing results, review time-sensitive information or approve related valuation actions. The Committee reports to the Board, with members of the Committee meeting with the Board at each of its regularly scheduled meetings to discuss valuation matters and actions during the period, similar to those described earlier.
For investments categorized as Level 3, the Committee monitors information similar to that described above, which may include: (i) data specific to the issuer or comparable issuers, (ii) general market or specific sector news and (iii) quoted prices and specific or similar security transactions. The Committee considers this data and any changes from prior periods in order to assess the reasonableness of observable and unobservable inputs, any assumptions or internal models used to value those securities and changes in fair value. This data is also used to corroborate, when available, information received from approved pricing vendors and brokers. Various factors impact the frequency of monitoring this information (which may occur as often as daily). However, the Committee may determine that changes to inputs, assumptions and models are not required as a result of the monitoring procedures performed.
The accompanying Notes to Financial Statements are an integral part of this statement.
Annual Report 2016
13
COLUMBIA DISCIPLINED SMALL CORE FUND
PORTFOLIO OF INVESTMENTS (continued)
August 31, 2016
Fair Value Measurements (continued)
The following table is a summary of the inputs used to value the Fund's investments at August 31, 2016:
| | | Level 1
Quoted Prices in Active
Markets for Identical
Assets ($) | |
Level 2
Other Significant
Observable Inputs ($) | |
Level 3
Significant
Unobservable Inputs ($) | |
Total ($) | |
Investments | |
Common Stocks | |
Consumer Discretionary | | | 34,218,450 | | | | — | | | | — | | | | 34,218,450 | | |
Consumer Staples | | | 9,093,595 | | | | — | | | | — | | | | 9,093,595 | | |
Energy | | | 8,704,304 | | | | — | | | | — | | | | 8,704,304 | | |
Financials | | | 69,870,876 | | | | — | | | | — | | | | 69,870,876 | | |
Health Care | | | 35,205,939 | | | | — | | | | — | | | | 35,205,939 | | |
Industrials | | | 36,247,711 | | | | — | | | | — | | | | 36,247,711 | | |
Information Technology | | | 43,335,176 | | | | — | | | | — | | | | 43,335,176 | | |
Materials | | | 11,894,880 | | | | — | | | | — | | | | 11,894,880 | | |
Telecommunication Services | | | 2,584,951 | | | | — | | | | — | | | | 2,584,951 | | |
Utilities | | | 9,487,541 | | | | — | | | | — | | | | 9,487,541 | | |
Total Common Stocks | | | 260,643,423 | | | | — | | | | — | | | | 260,643,423 | | |
Investments measured at net asset value | |
Money Market Funds | | | — | | | | — | | | | — | | | | 4,822,294 | | |
Total Investments | | | 260,643,423 | | | | — | | | | — | | | | 265,465,717 | | |
Derivatives | |
Assets | |
Futures Contracts | | | 288,884 | | | | — | | | | — | | | | 288,884 | | |
Total | | | 260,932,307 | | | | — | | | | — | | | | 265,754,601 | | |
See the Portfolio of Investments for all investment classifications not indicated in the table.
Derivative instruments are valued at unrealized appreciation (depreciation).
There were no transfers of financial assets between levels during the period.
The accompanying Notes to Financial Statements are an integral part of this statement.
Annual Report 2016
14
COLUMBIA DISCIPLINED SMALL CORE FUND
STATEMENT OF ASSETS AND LIABILITIES
August 31, 2016
Assets | |
Investments, at value | |
Unaffiliated issuers (identified cost $219,446,601) | | $ | 260,643,423 | | |
Affiliated issuers (identified cost $4,822,294) | | | 4,822,294 | | |
Total investments (identified cost $224,268,895) | | | 265,465,717 | | |
Cash | | | 1,540 | | |
Margin deposits | | | 572,000 | | |
Receivable for: | |
Investments sold | | | 6,843,014 | | |
Capital shares sold | | | 45,869 | | |
Dividends | | | 163,310 | | |
Variation margin | | | 1,015 | | |
Prepaid expenses | | | 2,564 | | |
Trustees' deferred compensation plan | | | 82,368 | | |
Total assets | | | 273,177,397 | | |
Liabilities | |
Payable for: | |
Capital shares purchased | | | 524,320 | | |
Variation margin | | | 73,840 | | |
Management services fees | | | 6,535 | | |
Distribution and/or service fees | | | 1,367 | | |
Transfer agent fees | | | 38,915 | | |
Compensation of board members | | | 498 | | |
Chief compliance officer expenses | | | 23 | | |
Other expenses | | | 42,621 | | |
Trustees' deferred compensation plan | | | 82,368 | | |
Total liabilities | | | 770,487 | | |
Net assets applicable to outstanding capital stock | | $ | 272,406,910 | | |
Represented by | |
Paid-in capital | | $ | 142,288,479 | | |
Undistributed net investment income | | | 34,621 | | |
Accumulated net realized gain | | | 88,598,104 | | |
Unrealized appreciation (depreciation) on: | |
Investments | | | 41,196,822 | | |
Futures contracts | | | 288,884 | | |
Total — representing net assets applicable to outstanding capital stock | | $ | 272,406,910 | | |
The accompanying Notes to Financial Statements are an integral part of this statement.
Annual Report 2016
15
COLUMBIA DISCIPLINED SMALL CORE FUND
STATEMENT OF ASSETS AND LIABILITIES (continued)
August 31, 2016
Class A | |
Net assets | | $ | 74,434,459 | | |
Shares outstanding | | | 6,301,008 | | |
Net asset value per share | | $ | 11.81 | | |
Maximum offering price per share(a) | | $ | 12.53 | | |
Class B | |
Net assets | | $ | 187,114 | | |
Shares outstanding | | | 21,217 | | |
Net asset value per share | | $ | 8.82 | | |
Class C | |
Net assets | | $ | 15,653,841 | | |
Shares outstanding | | | 1,770,923 | | |
Net asset value per share | | $ | 8.84 | | |
Class I | |
Net assets | | $ | 50,390,376 | | |
Shares outstanding | | | 3,952,656 | | |
Net asset value per share | | $ | 12.75 | | |
Class R4 | |
Net assets | | $ | 2,925,669 | | |
Shares outstanding | | | 228,794 | | |
Net asset value per share | | $ | 12.79 | | |
Class R5 | |
Net assets | | $ | 2,875,720 | | |
Shares outstanding | | | 223,823 | | |
Net asset value per share | | $ | 12.85 | | |
Class T | |
Net assets | | $ | 60,070,535 | | |
Shares outstanding | | | 5,262,910 | | |
Net asset value per share | | $ | 11.41 | | |
Maximum offering price per share(a) | | $ | 12.11 | | |
Class W | |
Net assets | | $ | 222,510 | | |
Shares outstanding | | | 18,837 | | |
Net asset value per share | | $ | 11.81 | | |
Class Y | |
Net assets | | $ | 6,735,763 | | |
Shares outstanding | | | 520,491 | | |
Net asset value per share | | $ | 12.94 | | |
Class Z | |
Net assets | | $ | 58,910,923 | | |
Shares outstanding | | | 4,672,776 | | |
Net asset value per share | | $ | 12.61 | | |
(a) The maximum offering price per share is calculated by dividing the net asset value per share by 1.0 minus the maximum sales charge of 5.75%.
The accompanying Notes to Financial Statements are an integral part of this statement.
Annual Report 2016
16
COLUMBIA DISCIPLINED SMALL CORE FUND
STATEMENT OF OPERATIONS
Year Ended August 31, 2016
Net investment income | |
Income: | |
Dividends — unaffiliated issuers | | $ | 5,061,923 | | |
Dividends — affiliated issuers | | | 22,985 | | |
Foreign taxes withheld | | | (8,045 | ) | |
Total income | | | 5,076,863 | | |
Expenses: | |
Management services fees | | | 3,199,793 | | |
Distribution and/or service fees | |
Class A | | | 250,214 | | |
Class B | | | 2,399 | | |
Class C | | | 179,472 | | |
Class T | | | 148,334 | | |
Class W | | | 617 | | |
Transfer agent fees | |
Class A | | | 202,427 | | |
Class B | | | 485 | | |
Class C | | | 36,159 | | |
Class R4 | | | 9,042 | | |
Class R5 | | | 2,626 | | |
Class T | | | 118,945 | | |
Class W | | | 496 | | |
Class Z | | | 249,894 | | |
Compensation of board members | | | 24,489 | | |
Custodian fees | | | 20,876 | | |
Printing and postage fees | | | 16,800 | | |
Registration fees | | | 131,285 | | |
Audit fees | | | 30,402 | | |
Legal fees | | | 8,364 | | |
Chief compliance officer expenses | | | 161 | | |
Other | | | 23,186 | | |
Total expenses | | | 4,656,466 | | |
Fees waived or expenses reimbursed by Investment Manager and its affiliates | | | (38,331 | ) | |
Expense reductions | | | (1,791 | ) | |
Total net expenses | | | 4,616,344 | | |
Net investment income | | | 460,519 | | |
Realized and unrealized gain (loss) — net | |
Net realized gain (loss) on: | |
Investments — unaffiliated issuers | | | 105,089,393 | | |
Investments — affiliated issuers | | | (4,901,099 | ) | |
Futures contracts | | | 1,455,035 | | |
Net realized gain | | | 101,643,329 | | |
Net change in unrealized appreciation (depreciation) on: | |
Investments — unaffiliated issuers | | | (100,474,723 | ) | |
Investments — affiliated issuers | | | 5,631,660 | | |
Futures contracts | | | 288,884 | | |
Net change in unrealized depreciation | | | (94,554,179 | ) | |
Net realized and unrealized gain | | | 7,089,150 | | |
Net increase in net assets resulting from operations | | $ | 7,549,669 | | |
The accompanying Notes to Financial Statements are an integral part of this statement.
Annual Report 2016
17
COLUMBIA DISCIPLINED SMALL CORE FUND
STATEMENT OF CHANGES IN NET ASSETS
| | | Year Ended
August 31,
2016 | | Year Ended
August 31,
2015 | |
Operations | |
Net investment income (loss) | | $ | 460,519 | | | $ | (2,070,151 | ) | |
Net realized gain | | | 101,643,329 | | | | 162,872,105 | | |
Net change in unrealized depreciation | | | (94,554,179 | ) | | | (202,868,866 | ) | |
Net increase (decrease) in net assets resulting from operations | | | 7,549,669 | | | | (42,066,912 | ) | |
Distributions to shareholders | |
Net investment income | |
Class A | | | (42,433 | ) | | | (321,649 | ) | |
Class I | | | (97,723 | ) | | | (143,812 | ) | |
Class R4 | | | (6,447 | ) | | | (12,379 | ) | |
Class R5 | | | (16,055 | ) | | | (60,601 | ) | |
Class T | | | (22,349 | ) | | | (49,306 | ) | |
Class W | | | (98 | ) | | | (404 | ) | |
Class Y | | | (8,228 | ) | | | (44,683 | ) | |
Class Z | | | (197,294 | ) | | | (677,669 | ) | |
Net realized gains | |
Class A | | | (41,007,362 | ) | | | (32,612,168 | ) | |
Class B | | | (117,350 | ) | | | (47,871 | ) | |
Class C | | | (8,161,786 | ) | | | (2,818,598 | ) | |
Class I | | | (17,649,677 | ) | | | (4,823,973 | ) | |
Class R4 | | | (1,795,378 | ) | | | (617,780 | ) | |
Class R5 | | | (3,070,456 | ) | | | (2,214,144 | ) | |
Class T | | | (21,646,956 | ) | | | (6,294,308 | ) | |
Class W | | | (95,357 | ) | | | (39,342 | ) | |
Class Y | | | (1,486,132 | ) | | | (1,519,612 | ) | |
Class Z | | | (54,942,603 | ) | | | (33,818,753 | ) | |
Total distributions to shareholders | | | (150,363,684 | ) | | | (86,117,052 | ) | |
Decrease in net assets from capital stock activity | | | (127,856,394 | ) | | | (505,558,338 | ) | |
Total decrease in net assets | | | (270,670,409 | ) | | | (633,742,302 | ) | |
Net assets at beginning of year | | | 543,077,319 | | | | 1,176,819,621 | | |
Net assets at end of year | | $ | 272,406,910 | | | $ | 543,077,319 | | |
Undistributed (excess of distributions over) net investment income | | $ | 34,621 | | | $ | (83,090 | ) | |
The accompanying Notes to Financial Statements are an integral part of this statement.
Annual Report 2016
18
COLUMBIA DISCIPLINED SMALL CORE FUND
STATEMENT OF CHANGES IN NET ASSETS (continued)
| | | Year Ended August 31, 2016 | | Year Ended August 31, 2015 | |
| | | Shares | | Dollars ($) | | Shares | | Dollars ($) | |
Capital stock activity | |
Class A shares | |
Subscriptions(a) | | | 1,934,628 | | | | 25,392,156 | | | | 6,038,108 | | | | 109,877,216 | | |
Distributions reinvested | | | 2,803,173 | | | | 32,656,967 | | | | 1,663,833 | | | | 29,050,518 | | |
Redemptions | | | (6,661,023 | ) | | | (81,658,515 | ) | | | (20,876,804 | ) | | | (377,368,984 | ) | |
Net decrease | | | (1,923,222 | ) | | | (23,609,392 | ) | | | (13,174,863 | ) | | | (238,441,250 | ) | |
Class B shares | |
Subscriptions | | | 1,204 | | | | 10,534 | | | | 2,626 | | | | 39,372 | | |
Distributions reinvested | | | 12,117 | | | | 106,020 | | | | 2,943 | | | | 42,992 | | |
Redemptions(a) | | | (14,753 | ) | | | (128,703 | ) | | | (18,255 | ) | | | (276,946 | ) | |
Net decrease | | | (1,432 | ) | | | (12,149 | ) | | | (12,686 | ) | | | (194,582 | ) | |
Class C shares | |
Subscriptions | | | 326,960 | | | | 2,898,107 | | | | 218,882 | | | | 3,280,446 | | |
Distributions reinvested | | | 766,645 | | | | 6,723,479 | | | | 155,737 | | | | 2,278,432 | | |
Redemptions | | | (946,397 | ) | | | (8,788,360 | ) | | | (611,233 | ) | | | (9,163,129 | ) | |
Net increase (decrease) | | | 147,208 | | | | 833,226 | | | | (236,614 | ) | | | (3,604,251 | ) | |
Class I shares | |
Subscriptions | | | 128,810 | | | | 1,611,892 | | | | 42,500 | | | | 799,236 | | |
Distributions reinvested | | | 1,415,208 | | | | 17,746,703 | | | | 271,601 | | | | 4,967,583 | | |
Redemptions | | | (766,234 | ) | | | (9,005,922 | ) | | | (206,136 | ) | | | (3,928,603 | ) | |
Net increase | | | 777,784 | | | | 10,352,673 | | | | 107,965 | | | | 1,838,216 | | |
Class R4 shares | |
Subscriptions | | | 64,675 | | | | 865,322 | | | | 227,971 | | | | 4,281,902 | | |
Distributions reinvested | | | 123,477 | | | | 1,554,576 | | | | 30,985 | | | | 569,195 | | |
Redemptions | | | (306,694 | ) | | | (3,972,825 | ) | | | (258,894 | ) | | | (4,808,877 | ) | |
Net increase (decrease) | | | (118,542 | ) | | | (1,552,927 | ) | | | 62 | | | | 42,220 | | |
Class R5 shares | |
Subscriptions | | | 103,468 | | | | 1,514,306 | | | | 633,457 | | | | 12,298,079 | | |
Distributions reinvested | | | 244,186 | | | | 3,086,511 | | | | 123,627 | | | | 2,274,745 | | |
Redemptions | | | (856,763 | ) | | | (11,712,420 | ) | | | (1,373,626 | ) | | | (26,305,125 | ) | |
Net decrease | | | (509,109 | ) | | | (7,111,603 | ) | | | (616,542 | ) | | | (11,732,301 | ) | |
Class T shares | |
Subscriptions | | | 481,678 | | | | 5,434,670 | | | | 119,277 | | | | 2,054,946 | | |
Distributions reinvested | | | 1,347,343 | | | | 15,171,084 | | | | 258,803 | | | | 4,412,598 | | |
Redemptions | | | (557,218 | ) | | | (6,439,026 | ) | | | (503,703 | ) | | | (8,865,381 | ) | |
Net increase (decrease) | | | 1,271,803 | | | | 14,166,728 | | | | (125,623 | ) | | | (2,397,837 | ) | |
The accompanying Notes to Financial Statements are an integral part of this statement.
Annual Report 2016
19
COLUMBIA DISCIPLINED SMALL CORE FUND
STATEMENT OF CHANGES IN NET ASSETS (continued)
| | | Year Ended August 31, 2016 | | Year Ended August 31, 2015 | |
| | | Shares | | Dollars ($) | | Shares | | Dollars ($) | |
Capital stock activity (continued) | |
Class W shares | |
Subscriptions | | | — | | | | — | | | | 72,730 | | | | 1,351,975 | | |
Distributions reinvested | | | 8,133 | | | | 94,747 | | | | 2,266 | | | | 39,543 | | |
Redemptions | | | (7,581 | ) | | | (88,866 | ) | | | (3,583,872 | ) | | | (69,287,149 | ) | |
Net increase (decrease) | | | 552 | | | | 5,881 | | | | (3,508,876 | ) | | | (67,895,631 | ) | |
Class Y shares | |
Subscriptions | | | 451,574 | | | | 6,356,601 | | | | 515,623 | | | | 9,829,785 | | |
Distributions reinvested | | | 117,428 | | | | 1,493,679 | | | | 84,637 | | | | 1,564,098 | | |
Redemptions | | | (218,761 | ) | | | (2,941,917 | ) | | | (1,137,822 | ) | | | (21,822,720 | ) | |
Net increase (decrease) | | | 350,241 | | | | 4,908,363 | | | | (537,562 | ) | | | (10,428,837 | ) | |
Class Z shares | |
Subscriptions | | | 1,531,872 | | | | 19,340,619 | | | | 1,889,258 | | | | 35,638,739 | | |
Distributions reinvested | | | 1,858,542 | | | | 23,064,501 | | | | 956,789 | | | | 17,403,988 | | |
Redemptions | | | (12,422,033 | ) | | | (168,242,314 | ) | | | (12,078,763 | ) | | | (225,786,812 | ) | |
Net decrease | | | (9,031,619 | ) | | | (125,837,194 | ) | | | (9,232,716 | ) | | | (172,744,085 | ) | |
Total net decrease | | | (9,036,336 | ) | | | (127,856,394 | ) | | | (27,337,455 | ) | | | (505,558,338 | ) | |
(a) Includes conversions of Class B shares to Class A shares, if any.
The accompanying Notes to Financial Statements are an integral part of this statement.
Annual Report 2016
20
COLUMBIA DISCIPLINED SMALL CORE FUND
The following tables are intended to help you understand the Fund's financial performance. Certain information reflects financial results for a single share of a class held for the periods shown. Per share net investment income (loss) amounts are calculated based on average shares outstanding during the period. Total return assumes reinvestment of all dividends and distributions, if any. Total return does not reflect payment of sales charges, if any. Total return and portfolio turnover are not annualized for periods of less than one year. The portfolio turnover rate is calculated without regard to purchase and sales transactions of short-term instruments and certain derivatives, if any. If such transactions were included, the Fund's portfolio turnover rate may be higher.
| | | Year Ended August 31, | | Year Ended
September 30, | |
Class A | | 2016 | | 2015 | | 2014 | | 2013 | | 2012(a) | | 2011 | |
Per share data | |
Net asset value, beginning of period | | $ | 16.72 | | | $ | 19.57 | | | $ | 18.57 | | | $ | 15.05 | | | $ | 12.98 | | | $ | 13.33 | | |
Income from investment operations: | |
Net investment income (loss) | | | 0.00 | (b) | | | (0.06 | ) | | | (0.06 | ) | | | (0.01 | ) | | | (0.04 | ) | | | (0.07 | ) | |
Net realized and unrealized gain (loss) | | | 0.65 | | | | (1.21 | ) | | | 2.73 | | | | 4.08 | | | | 2.68 | | | | (0.28 | ) | |
Total from investment operations | | | 0.65 | | | | (1.27 | ) | | | 2.67 | | | | 4.07 | | | | 2.64 | | | | (0.35 | ) | |
Less distributions to shareholders: | |
Net investment income | | | (0.01 | ) | | | (0.01 | ) | | | (0.01 | ) | | | (0.06 | ) | | | — | | | | — | | |
Net realized gains | | | (5.55 | ) | | | (1.57 | ) | | | (1.66 | ) | | | (0.49 | ) | | | (0.57 | ) | | | — | | |
Total distributions to shareholders | | | (5.56 | ) | | | (1.58 | ) | | | (1.67 | ) | | | (0.55 | ) | | | (0.57 | ) | | | — | | |
Proceeds from regulatory settlements | | | — | | | | — | | | | — | | | | — | | | | — | | | | 0.00 | (b) | |
Net asset value, end of period | | $ | 11.81 | | | $ | 16.72 | | | $ | 19.57 | | | $ | 18.57 | | | $ | 15.05 | | | $ | 12.98 | | |
Total return | | | 4.32 | % | | | (6.81 | %) | | | 14.73 | % | | | 27.93 | % | | | 20.46 | % | | | (2.63 | %) | |
Ratios to average net assets(c) | |
Total gross expenses | | | 1.39 | % | | | 1.36 | % | | | 1.35 | %(d) | | | 1.37 | %(d) | | | 1.37 | %(e) | | | 1.32 | % | |
Total net expenses(f) | | | 1.38 | %(g) | | | 1.36 | %(g) | | | 1.35 | %(d)(g) | | | 1.36 | %(d)(g) | | | 1.36 | %(e)(g) | | | 1.29 | %(g) | |
Net investment income (loss) | | | 0.01 | % | | | (0.35 | %) | | | (0.32 | %) | | | (0.07 | %) | | | (0.28 | %)(e) | | | (0.48 | %) | |
Supplemental data | |
Net assets, end of period (in thousands) | | $ | 74,434 | | | $ | 137,486 | | | $ | 418,814 | | | $ | 399,232 | | | $ | 228,303 | | | $ | 162,502 | | |
Portfolio turnover | | | 112 | % | | | 23 | % | | | 19 | % | | | 34 | % | | | 26 | % | | | 33 | % | |
Notes to Financial Highlights
(a) For the period from October 1, 2011 to August 31, 2012. During the period, the Fund's fiscal year end was changed from September 30 to August 31.
(b) Rounds to zero.
(c) In addition to the fees and expenses that the Fund bears directly, the Fund indirectly bears a pro rata share of the fees and expenses of any other funds in which it invests. Such indirect expenses are not included in the Fund's reported expense ratios.
(d) Ratios include line of credit interest expense which is less than 0.01%.
(e) Annualized.
(f) Total net expenses include the impact of certain fee waivers/expense reimbursements made by the Investment Manager and certain of its affiliates, if applicable.
(g) The benefits derived from expense reductions had an impact of less than 0.01%.
The accompanying Notes to Financial Statements are an integral part of this statement.
Annual Report 2016
21
COLUMBIA DISCIPLINED SMALL CORE FUND
FINANCIAL HIGHLIGHTS (continued)
| | | Year Ended August 31, | | Year Ended
September 30, | |
Class B | | 2016 | | 2015 | | 2014 | | 2013 | | 2012(a) | | 2011 | |
Per share data | |
Net asset value, beginning of period | | $ | 13.91 | | | $ | 16.66 | | | $ | 16.13 | | | $ | 13.19 | | | $ | 11.50 | | | $ | 11.90 | | |
Income from investment operations: | |
Net investment loss | | | (0.07 | ) | | | (0.17 | ) | | | (0.18 | ) | | | (0.09 | ) | | | (0.12 | ) | | | (0.17 | ) | |
Net realized and unrealized gain (loss) | | | 0.53 | | | | (1.01 | ) | | | 2.37 | | | | 3.52 | | | | 2.38 | | | | (0.23 | ) | |
Total from investment operations | | | 0.46 | | | | (1.18 | ) | | | 2.19 | | | | 3.43 | | | | 2.26 | | | | (0.40 | ) | |
Less distributions to shareholders: | |
Net realized gains | | | (5.55 | ) | | | (1.57 | ) | | | (1.66 | ) | | | (0.49 | ) | | | (0.57 | ) | | | — | | |
Total distributions to shareholders | | | (5.55 | ) | | | (1.57 | ) | | | (1.66 | ) | | | (0.49 | ) | | | (0.57 | ) | | | — | | |
Proceeds from regulatory settlements | | | — | | | | — | | | | — | | | | — | | | | — | | | | 0.00 | (b) | |
Net asset value, end of period | | $ | 8.82 | | | $ | 13.91 | | | $ | 16.66 | | | $ | 16.13 | | | $ | 13.19 | | | $ | 11.50 | | |
Total return | | | 3.63 | % | | | (7.54 | %) | | | 13.92 | % | | | 26.90 | % | | | 19.77 | % | | | (3.36 | %) | |
Ratios to average net assets(c) | |
Total gross expenses | | | 2.14 | % | | | 2.11 | % | | | 2.10 | %(d) | | | 2.11 | %(d) | | | 2.20 | %(e) | | | 2.08 | % | |
Total net expenses(f) | | | 2.13 | %(g) | | | 2.11 | %(g) | | | 2.10 | %(d)(g) | | | 2.11 | %(d)(g) | | | 2.11 | %(e)(g) | | | 2.04 | %(g) | |
Net investment loss | | | (0.74 | %) | | | (1.09 | %) | | | (1.05 | %) | | | (0.61 | %) | | | (1.00 | %)(e) | | | (1.26 | %) | |
Supplemental data | |
Net assets, end of period (in thousands) | | $ | 187 | | | $ | 315 | | | $ | 589 | | | $ | 878 | | | $ | 1,497 | | | $ | 9,244 | | |
Portfolio turnover | | | 112 | % | | | 23 | % | | | 19 | % | | | 34 | % | | | 26 | % | | | 33 | % | |
Notes to Financial Highlights
(a) For the period from October 1, 2011 to August 31, 2012. During the period, the Fund's fiscal year end was changed from September 30 to August 31.
(b) Rounds to zero.
(c) In addition to the fees and expenses that the Fund bears directly, the Fund indirectly bears a pro rata share of the fees and expenses of any other funds in which it invests. Such indirect expenses are not included in the Fund's reported expense ratios.
(d) Ratios include line of credit interest expense which is less than 0.01%.
(e) Annualized.
(f) Total net expenses include the impact of certain fee waivers/expense reimbursements made by the Investment Manager and certain of its affiliates, if applicable.
(g) The benefits derived from expense reductions had an impact of less than 0.01%.
The accompanying Notes to Financial Statements are an integral part of this statement.
Annual Report 2016
22
COLUMBIA DISCIPLINED SMALL CORE FUND
FINANCIAL HIGHLIGHTS (continued)
| | | Year Ended August 31, | | Year Ended
September 30, | |
Class C | | 2016 | | 2015 | | 2014 | | 2013 | | 2012(a) | | 2011 | |
Per share data | |
Net asset value, beginning of period | | $ | 13.93 | | | $ | 16.68 | | | $ | 16.15 | | | $ | 13.20 | | | $ | 11.52 | | | $ | 11.92 | | |
Income from investment operations: | |
Net investment loss | | | (0.07 | ) | | | (0.17 | ) | | | (0.18 | ) | | | (0.10 | ) | | | (0.12 | ) | | | (0.17 | ) | |
Net realized and unrealized gain (loss) | | | 0.53 | | | | (1.01 | ) | | | 2.37 | | | | 3.54 | | | | 2.37 | | | | (0.23 | ) | |
Total from investment operations | | | 0.46 | | | | (1.18 | ) | | | 2.19 | | | | 3.44 | | | | 2.25 | | | | (0.40 | ) | |
Less distributions to shareholders: | |
Net realized gains | | | (5.55 | ) | | | (1.57 | ) | | | (1.66 | ) | | | (0.49 | ) | | | (0.57 | ) | | | — | | |
Total distributions to shareholders | | | (5.55 | ) | | | (1.57 | ) | | | (1.66 | ) | | | (0.49 | ) | | | (0.57 | ) | | | — | | |
Proceeds from regulatory settlements | | | — | | | | — | | | | — | | | | — | | | | — | | | | 0.00 | (b) | |
Net asset value, end of period | | $ | 8.84 | | | $ | 13.93 | | | $ | 16.68 | | | $ | 16.15 | | | $ | 13.20 | | | $ | 11.52 | | |
Total return | | | 3.62 | % | | | (7.53 | %) | | | 13.90 | % | | | 26.95 | % | | | 19.65 | % | | | (3.36 | %) | |
Ratios to average net assets(c) | |
Total gross expenses | | | 2.14 | % | | | 2.11 | % | | | 2.10 | %(d) | | | 2.11 | %(d) | | | 2.12 | %(e) | | | 2.07 | % | |
Total net expenses(f) | | | 2.13 | %(g) | | | 2.11 | %(g) | | | 2.10 | %(d)(g) | | | 2.11 | %(d)(g) | | | 2.11 | %(e)(g) | | | 2.04 | %(g) | |
Net investment loss | | | (0.73 | %) | | | (1.09 | %) | | | (1.06 | %) | | | (0.71 | %) | | | (1.03 | %)(e) | | | (1.23 | %) | |
Supplemental data | |
Net assets, end of period (in thousands) | | $ | 15,654 | | | $ | 22,625 | | | $ | 31,035 | | | $ | 29,769 | | | $ | 26,077 | | | $ | 22,535 | | |
Portfolio turnover | | | 112 | % | | | 23 | % | | | 19 | % | | | 34 | % | | | 26 | % | | | 33 | % | |
Notes to Financial Highlights
(a) For the period from October 1, 2011 to August 31, 2012. During the period, the Fund's fiscal year end was changed from September 30 to August 31.
(b) Rounds to zero.
(c) In addition to the fees and expenses that the Fund bears directly, the Fund indirectly bears a pro rata share of the fees and expenses of any other funds in which it invests. Such indirect expenses are not included in the Fund's reported expense ratios.
(d) Ratios include line of credit interest expense which is less than 0.01%.
(e) Annualized.
(f) Total net expenses include the impact of certain fee waivers/expense reimbursements made by the Investment Manager and certain of its affiliates, if applicable.
(g) The benefits derived from expense reductions had an impact of less than 0.01%.
The accompanying Notes to Financial Statements are an integral part of this statement.
Annual Report 2016
23
COLUMBIA DISCIPLINED SMALL CORE FUND
FINANCIAL HIGHLIGHTS (continued)
| | | Year Ended August 31, | | Year Ended
September 30, | |
Class I | | 2016 | | 2015 | | 2014 | | 2013 | | 2012(a) | | 2011 | |
Per share data | |
Net asset value, beginning of period | | $ | 17.58 | | | $ | 20.43 | | | $ | 19.28 | | | $ | 15.61 | | | $ | 13.38 | | | $ | 13.69 | | |
Income from investment operations: | |
Net investment income (loss) | | | 0.06 | | | | 0.02 | | | | 0.03 | | | | 0.09 | | | | 0.03 | | | | (0.01 | ) | |
Net realized and unrealized gain (loss) | | | 0.69 | | | | (1.25 | ) | | | 2.85 | | | | 4.21 | | | | 2.77 | | | | (0.30 | ) | |
Total from investment operations | | | 0.75 | | | | (1.23 | ) | | | 2.88 | | | | 4.30 | | | | 2.80 | | | | (0.31 | ) | |
Less distributions to shareholders: | |
Net investment income | | | (0.03 | ) | | | (0.05 | ) | | | (0.07 | ) | | | (0.14 | ) | | | — | | | | — | | |
Net realized gains | | | (5.55 | ) | | | (1.57 | ) | | | (1.66 | ) | | | (0.49 | ) | | | (0.57 | ) | | | — | | |
Total distributions to shareholders | | | (5.58 | ) | | | (1.62 | ) | | | (1.73 | ) | | | (0.63 | ) | | | (0.57 | ) | | | — | | |
Proceeds from regulatory settlements | | | — | | | | — | | | | — | | | | — | | | | — | | | | 0.00 | (b) | |
Net asset value, end of period | | $ | 12.75 | | | $ | 17.58 | | | $ | 20.43 | | | $ | 19.28 | | | $ | 15.61 | | | $ | 13.38 | | |
Total return | | | 4.80 | % | | | (6.35 | %) | | | 15.31 | % | | | 28.49 | % | | | 21.06 | % | | | (2.26 | %) | |
Ratios to average net assets(c) | |
Total gross expenses | | | 0.94 | % | | | 0.89 | % | | | 0.87 | %(d) | | | 0.88 | %(d) | | | 0.91 | %(e) | | | 0.88 | % | |
Total net expenses(f) | | | 0.94 | % | | | 0.89 | % | | | 0.87 | %(d) | | | 0.88 | %(d) | | | 0.91 | %(e) | | | 0.88 | %(g) | |
Net investment income (loss) | | | 0.47 | % | | | 0.13 | % | | | 0.17 | % | | | 0.52 | % | | | 0.19 | %(e) | | | (0.04 | %) | |
Supplemental data | |
Net assets, end of period (in thousands) | | $ | 50,390 | | | $ | 55,804 | | | $ | 62,663 | | | $ | 59,098 | | | $ | 55,276 | | | $ | 3,765 | | |
Portfolio turnover | | | 112 | % | | | 23 | % | | | 19 | % | | | 34 | % | | | 26 | % | | | 33 | % | |
Notes to Financial Highlights
(a) For the period from October 1, 2011 to August 31, 2012. During the period, the Fund's fiscal year end was changed from September 30 to August 31.
(b) Rounds to zero.
(c) In addition to the fees and expenses that the Fund bears directly, the Fund indirectly bears a pro rata share of the fees and expenses of any other funds in which it invests. Such indirect expenses are not included in the Fund's reported expense ratios.
(d) Ratios include line of credit interest expense which is less than 0.01%.
(e) Annualized.
(f) Total net expenses include the impact of certain fee waivers/expense reimbursements made by the Investment Manager and certain of its affiliates, if applicable.
(g) The benefits derived from expense reductions had an impact of less than 0.01%.
The accompanying Notes to Financial Statements are an integral part of this statement.
Annual Report 2016
24
COLUMBIA DISCIPLINED SMALL CORE FUND
FINANCIAL HIGHLIGHTS (continued)
| | | Year Ended August 31, | |
Class R4 | | 2016 | | 2015 | | 2014 | | 2013(a) | |
Per share data | |
Net asset value, beginning of period | | $ | 17.63 | | | $ | 20.51 | | | $ | 19.37 | | | $ | 15.57 | | |
Income from investment operations: | |
Net investment income (loss) | | | 0.03 | | | | (0.02 | ) | | | (0.02 | ) | | | (0.05 | ) | |
Net realized and unrealized gain (loss) | | | 0.70 | | | | (1.26 | ) | | | 2.86 | | | | 4.45 | | |
Total from investment operations | | | 0.73 | | | | (1.28 | ) | | | 2.84 | | | | 4.40 | | |
Less distributions to shareholders: | |
Net investment income | | | (0.02 | ) | | | (0.03 | ) | | | (0.04 | ) | | | (0.11 | ) | |
Net realized gains | | | (5.55 | ) | | | (1.57 | ) | | | (1.66 | ) | | | (0.49 | ) | |
Total distributions to shareholders | | | (5.57 | ) | | | (1.60 | ) | | | (1.70 | ) | | | (0.60 | ) | |
Net asset value, end of period | | $ | 12.79 | | | $ | 17.63 | | | $ | 20.51 | | | $ | 19.37 | | |
Total return | | | 4.64 | % | | | (6.56 | %) | | | 15.02 | % | | | 29.18 | % | |
Ratios to average net assets(b) | |
Total gross expenses | | | 1.14 | % | | | 1.11 | % | | | 1.10 | %(c) | | | 1.12 | %(c)(d) | |
Total net expenses(e) | | | 1.13 | %(f) | | | 1.11 | %(f) | | | 1.10 | %(c)(f) | | | 1.12 | %(c)(d)(f) | |
Net investment income (loss) | | | 0.26 | % | | | (0.09 | %) | | | (0.09 | %) | | | (0.31 | %)(d) | |
Supplemental data | |
Net assets, end of period (in thousands) | | $ | 2,926 | | | $ | 6,123 | | | $ | 7,124 | | | $ | 903 | | |
Portfolio turnover | | | 112 | % | | | 23 | % | | | 19 | % | | | 34 | % | |
Notes to Financial Highlights
(a) Based on operations from November 8, 2012 (commencement of operations) through the stated period end.
(b) In addition to the fees and expenses that the Fund bears directly, the Fund indirectly bears a pro rata share of the fees and expenses of any other funds in which it invests. Such indirect expenses are not included in the Fund's reported expense ratios.
(c) Ratios include line of credit interest expense which is less than 0.01%.
(d) Annualized.
(e) Total net expenses include the impact of certain fee waivers/expense reimbursements made by the Investment Manager and certain of its affiliates, if applicable.
(f) The benefits derived from expense reductions had an impact of less than 0.01%.
The accompanying Notes to Financial Statements are an integral part of this statement.
Annual Report 2016
25
COLUMBIA DISCIPLINED SMALL CORE FUND
FINANCIAL HIGHLIGHTS (continued)
| | | Year Ended August 31, | |
Class R5 | | 2016 | | 2015 | | 2014 | | 2013(a) | |
Per share data | |
Net asset value, beginning of period | | $ | 17.68 | | | $ | 20.55 | | | $ | 19.38 | | | $ | 15.57 | | |
Income from investment operations: | |
Net investment income (loss) | | | 0.05 | | | | 0.02 | | | | 0.02 | | | | (0.05 | ) | |
Net realized and unrealized gain (loss) | | | 0.70 | | | | (1.28 | ) | | | 2.87 | | | | 4.47 | | |
Total from investment operations | | | 0.75 | | | | (1.26 | ) | | | 2.89 | | | | 4.42 | | |
Less distributions to shareholders: | |
Net investment income | | | (0.03 | ) | | | (0.04 | ) | | | (0.06 | ) | | | (0.12 | ) | |
Net realized gains | | | (5.55 | ) | | | (1.57 | ) | | | (1.66 | ) | | | (0.49 | ) | |
Total distributions to shareholders | | | (5.58 | ) | | | (1.61 | ) | | | (1.72 | ) | | | (0.61 | ) | |
Net asset value, end of period | | $ | 12.85 | | | $ | 17.68 | | | $ | 20.55 | | | $ | 19.38 | | |
Total return | | | 4.76 | % | | | (6.43 | %) | | | 15.30 | % | | | 29.36 | % | |
Ratios to average net assets(b) | |
Total gross expenses | | | 0.98 | % | | | 0.93 | % | | | 0.90 | %(c) | | | 0.94 | %(c)(d) | |
Total net expenses(e) | | | 0.98 | % | | | 0.93 | % | | | 0.90 | %(c) | | | 0.94 | %(c)(d) | |
Net investment income (loss) | | | 0.35 | % | | | 0.10 | % | | | 0.11 | % | | | (0.32 | %)(d) | |
Supplemental data | |
Net assets, end of period (in thousands) | | $ | 2,876 | | | $ | 12,955 | | | $ | 27,726 | | | $ | 16,704 | | |
Portfolio turnover | | | 112 | % | | | 23 | % | | | 19 | % | | | 34 | % | |
Notes to Financial Highlights
(a) Based on operations from November 8, 2012 (commencement of operations) through the stated period end.
(b) In addition to the fees and expenses that the Fund bears directly, the Fund indirectly bears a pro rata share of the fees and expenses of any other funds in which it invests. Such indirect expenses are not included in the Fund's reported expense ratios.
(c) Ratios include line of credit interest expense which is less than 0.01%.
(d) Annualized.
(e) Total net expenses include the impact of certain fee waivers/expense reimbursements made by the Investment Manager and certain of its affiliates, if applicable.
The accompanying Notes to Financial Statements are an integral part of this statement.
Annual Report 2016
26
COLUMBIA DISCIPLINED SMALL CORE FUND
FINANCIAL HIGHLIGHTS (continued)
| | | Year Ended August 31, | | Year Ended
September 30, | |
Class T | | 2016 | | 2015 | | 2014 | | 2013 | | 2012(a) | | 2011 | |
Per share data | |
Net asset value, beginning of period | | $ | 16.33 | | | $ | 19.16 | | | $ | 18.21 | | | $ | 14.77 | | | $ | 12.75 | | | $ | 13.10 | | |
Income from investment operations: | |
Net investment income (loss) | | | 0.00 | (b) | | | (0.06 | ) | | | (0.07 | ) | | | (0.00 | )(b) | | | (0.04 | ) | | | (0.08 | ) | |
Net realized and unrealized gain (loss) | | | 0.64 | | | | (1.19 | ) | | | 2.68 | | | | 3.99 | | | | 2.63 | | | | (0.27 | ) | |
Total from investment operations | | | 0.64 | | | | (1.25 | ) | | | 2.61 | | | | 3.99 | | | | 2.59 | | | | (0.35 | ) | |
Less distributions to shareholders: | |
Net investment income | | | (0.01 | ) | | | (0.01 | ) | | | (0.00 | )(b) | | | (0.06 | ) | | | — | | | | — | | |
Net realized gains | | | (5.55 | ) | | | (1.57 | ) | | | (1.66 | ) | | | (0.49 | ) | | | (0.57 | ) | | | — | | |
Total distributions to shareholders | | | (5.56 | ) | | | (1.58 | ) | | | (1.66 | ) | | | (0.55 | ) | | | (0.57 | ) | | | — | | |
Proceeds from regulatory settlements | | | — | | | | — | | | | — | | | | — | | | | — | | | | 0.00 | (b) | |
Net asset value, end of period | | $ | 11.41 | | | $ | 16.33 | | | $ | 19.16 | | | $ | 18.21 | | | $ | 14.77 | | | $ | 12.75 | | |
Total return | | | 4.35 | % | | | (6.87 | %) | | | 14.71 | % | | | 27.86 | % | | | 20.44 | % | | | (2.67 | %) | |
Ratios to average net assets(c) | |
Total gross expenses | | | 1.39 | % | | | 1.38 | % | | | 1.40 | %(d) | | | 1.41 | %(d) | | | 1.42 | %(e) | | | 1.38 | % | |
Total net expenses(f) | | | 1.38 | %(g) | | | 1.38 | %(g) | | | 1.40 | %(d)(g) | | | 1.41 | %(d)(g) | | | 1.41 | %(e)(g) | | | 1.35 | %(g) | |
Net investment income | | | 0.03 | % | | | (0.36 | %) | | | (0.36 | %) | | | (0.01 | %) | | | (0.33 | %)(e) | | | (0.56 | %) | |
Supplemental data | |
Net assets, end of period (in thousands) | | $ | 60,071 | | | $ | 65,184 | | | $ | 78,860 | | | $ | 76,011 | | | $ | 68,074 | | | $ | 63,595 | | |
Portfolio turnover | | | 112 | % | | | 23 | % | | | 19 | % | | | 34 | % | | | 26 | % | | | 33 | % | |
Notes to Financial Highlights
(a) For the period from October 1, 2011 to August 31, 2012. During the period, the Fund's fiscal year end was changed from September 30 to August 31.
(b) Rounds to zero.
(c) In addition to the fees and expenses that the Fund bears directly, the Fund indirectly bears a pro rata share of the fees and expenses of any other funds in which it invests. Such indirect expenses are not included in the Fund's reported expense ratios.
(d) Ratios include line of credit interest expense which is less than 0.01%.
(e) Annualized.
(f) Total net expenses include the impact of certain fee waivers/expense reimbursements made by the Investment Manager and certain of its affiliates, if applicable.
(g) The benefits derived from expense reductions had an impact of less than 0.01%.
The accompanying Notes to Financial Statements are an integral part of this statement.
Annual Report 2016
27
COLUMBIA DISCIPLINED SMALL CORE FUND
FINANCIAL HIGHLIGHTS (continued)
| | | Year Ended August 31, | | Year Ended
September 30, | |
Class W | | 2016 | | 2015 | | 2014 | | 2013 | | 2012(a) | | 2011 | |
Per share data | |
Net asset value, beginning of period | | $ | 16.72 | | | $ | 19.57 | | | $ | 18.57 | | | $ | 15.05 | | | $ | 12.98 | | | $ | 13.32 | | |
Income from investment operations: | |
Net investment income (loss) | | | 0.00 | (b) | | | (0.09 | ) | | | (0.06 | ) | | | 0.01 | | | | (0.04 | ) | | | (0.07 | ) | |
Net realized and unrealized gain (loss) | | | 0.65 | | | | (1.18 | ) | | | 2.73 | | | | 4.06 | | | | 2.68 | | | | (0.27 | ) | |
Total from investment operations | | | 0.65 | | | | (1.27 | ) | | | 2.67 | | | | 4.07 | | | | 2.64 | | | | (0.34 | ) | |
Less distributions to shareholders: | |
Net investment income | | | (0.01 | ) | | | (0.01 | ) | | | (0.01 | ) | | | (0.06 | ) | | | — | | | | — | | |
Net realized gains | | | (5.55 | ) | | | (1.57 | ) | | | (1.66 | ) | | | (0.49 | ) | | | (0.57 | ) | | | — | | |
Total distributions to shareholders | | | (5.56 | ) | | | (1.58 | ) | | | (1.67 | ) | | | (0.55 | ) | | | (0.57 | ) | | | — | | |
Proceeds from regulatory settlements | | | — | | | | — | | | | — | | | | — | | | | — | | | | 0.00 | (b) | |
Net asset value, end of period | | $ | 11.81 | | | $ | 16.72 | | | $ | 19.57 | | | $ | 18.57 | | | $ | 15.05 | | | $ | 12.98 | | |
Total return | | | 4.32 | % | | | (6.80 | %) | | | 14.73 | % | | | 27.93 | % | | | 20.46 | % | | | (2.55 | %) | |
Ratios to average net assets(c) | |
Total gross expenses | | | 1.39 | % | | | 1.30 | % | | | 1.35 | %(d) | | | 1.36 | %(d) | | | 1.38 | %(e) | | | 1.32 | % | |
Total net expenses(f) | | | 1.38 | %(g) | | | 1.30 | %(g) | | | 1.35 | %(d)(g) | | | 1.36 | %(d)(g) | | | 1.36 | %(e)(g) | | | 1.29 | %(g) | |
Net investment income (loss) | | | 0.02 | % | | | (0.44 | %) | | | (0.32 | %) | | | 0.05 | % | | | (0.27 | %)(e) | | | (0.47 | %) | |
Supplemental data | |
Net assets, end of period (in thousands) | | $ | 223 | | | $ | 306 | | | $ | 69,033 | | | $ | 60,353 | | | $ | 60,112 | | | $ | 41,634 | | |
Portfolio turnover | | | 112 | % | | | 23 | % | | | 19 | % | | | 34 | % | | | 26 | % | | | 33 | % | |
Notes to Financial Highlights
(a) For the period from October 1, 2011 to August 31, 2012. During the period, the Fund's fiscal year end was changed from September 30 to August 31.
(b) Rounds to zero.
(c) In addition to the fees and expenses that the Fund bears directly, the Fund indirectly bears a pro rata share of the fees and expenses of any other funds in which it invests. Such indirect expenses are not included in the Fund's reported expense ratios.
(d) Ratios include line of credit interest expense which is less than 0.01%.
(e) Annualized.
(f) Total net expenses include the impact of certain fee waivers/expense reimbursements made by the Investment Manager and certain of its affiliates, if applicable.
(g) The benefits derived from expense reductions had an impact of less than 0.01%.
The accompanying Notes to Financial Statements are an integral part of this statement.
Annual Report 2016
28
COLUMBIA DISCIPLINED SMALL CORE FUND
FINANCIAL HIGHLIGHTS (continued)
| | | Year Ended August 31, | |
Class Y | | 2016 | | 2015 | | 2014 | | 2013(a) | |
Per share data | |
Net asset value, beginning of period | | $ | 17.76 | | | $ | 20.63 | | | $ | 19.45 | | | $ | 15.63 | | |
Income from investment operations: | |
Net investment income | | | 0.06 | | | | 0.03 | | | | 0.03 | | | | 0.02 | | |
Net realized and unrealized gain (loss) | | | 0.70 | | | | (1.29 | ) | | | 2.88 | | | | 4.42 | | |
Total from investment operations | | | 0.76 | | | | (1.26 | ) | | | 2.91 | | | | 4.44 | | |
Less distributions to shareholders: | |
Net investment income | | | (0.03 | ) | | | (0.04 | ) | | | (0.07 | ) | | | (0.13 | ) | |
Net realized gains | | | (5.55 | ) | | | (1.57 | ) | | | (1.66 | ) | | | (0.49 | ) | |
Total distributions to shareholders | | | (5.58 | ) | | | (1.61 | ) | | | (1.73 | ) | | | (0.62 | ) | |
Net asset value, end of period | | $ | 12.94 | | | $ | 17.76 | | | $ | 20.63 | | | $ | 19.45 | | |
Total return | | | 4.83 | % | | | (6.39 | %) | | | 15.33 | % | | | 29.37 | % | |
Ratios to average net assets(b) | |
Total gross expenses | | | 0.94 | % | | | 0.88 | % | | | 0.87 | %(c) | | | 0.88 | %(c)(d) | |
Total net expenses(e) | | | 0.94 | % | | | 0.88 | % | | | 0.87 | %(c) | | | 0.88 | %(c)(d) | |
Net investment income | | | 0.49 | % | | | 0.17 | % | | | 0.16 | % | | | 0.07 | %(d) | |
Supplemental data | |
Net assets, end of period (in thousands) | | $ | 6,736 | | | $ | 3,024 | | | $ | 14,600 | | | $ | 11,301 | | |
Portfolio turnover | | | 112 | % | | | 23 | % | | | 19 | % | | | 34 | % | |
Notes to Financial Highlights
(a) Based on operations from November 8, 2012 (commencement of operations) through the stated period end.
(b) In addition to the fees and expenses that the Fund bears directly, the Fund indirectly bears a pro rata share of the fees and expenses of any other funds in which it invests. Such indirect expenses are not included in the Fund's reported expense ratios.
(c) Ratios include line of credit interest expense which is less than 0.01%.
(d) Annualized.
(e) Total net expenses include the impact of certain fee waivers/expense reimbursements made by the Investment Manager and certain of its affiliates, if applicable.
The accompanying Notes to Financial Statements are an integral part of this statement.
Annual Report 2016
29
COLUMBIA DISCIPLINED SMALL CORE FUND
FINANCIAL HIGHLIGHTS (continued)
| | | Year Ended August 31, | | Year Ended
September 30, | |
Class Z | | 2016 | | 2015 | | 2014 | | 2013 | | 2012(a) | | 2011 | |
Per share data | |
Net asset value, beginning of period | | $ | 17.46 | | | $ | 20.33 | | | $ | 19.21 | | | $ | 15.56 | | | $ | 13.36 | | | $ | 13.69 | | |
Income from investment operations: | |
Net investment income (loss) | | | 0.03 | | | | (0.02 | ) | | | (0.01 | ) | | | 0.05 | | | | (0.00 | )(b) | | | (0.04 | ) | |
Net realized and unrealized gain (loss) | | | 0.69 | | | | (1.25 | ) | | | 2.83 | | | | 4.19 | | | | 2.77 | | | | (0.29 | ) | |
Total from investment operations | | | 0.72 | | | | (1.27 | ) | | | 2.82 | | | | 4.24 | | | | 2.77 | | | | (0.33 | ) | |
Less distributions to shareholders: | |
Net investment income | | | (0.02 | ) | | | (0.03 | ) | | | (0.04 | ) | | | (0.10 | ) | | | — | | | | — | | |
Net realized gains | | | (5.55 | ) | | | (1.57 | ) | | | (1.66 | ) | | | (0.49 | ) | | | (0.57 | ) | | | — | | |
Total distributions to shareholders | | | (5.57 | ) | | | (1.60 | ) | | | (1.70 | ) | | | (0.59 | ) | | | (0.57 | ) | | | — | | |
Proceeds from regulatory settlements | | | — | | | | — | | | | — | | | | — | | | | — | | | | 0.00 | (b) | |
Net asset value, end of period | | $ | 12.61 | | | $ | 17.46 | | | $ | 20.33 | | | $ | 19.21 | | | $ | 15.56 | | | $ | 13.36 | | |
Total return | | | 4.64 | % | | | (6.56 | %) | | | 15.04 | % | | | 28.17 | % | | | 20.86 | % | | | (2.41 | %) | |
Ratios to average net assets(c) | |
Total gross expenses | | | 1.14 | % | | | 1.11 | % | | | 1.10 | %(d) | | | 1.11 | %(d) | | | 1.12 | %(e) | | | 1.07 | % | |
Total net expenses(f) | | | 1.13 | %(g) | | | 1.11 | %(g) | | | 1.10 | %(d)(g) | | | 1.11 | %(d)(g) | | | 1.11 | %(e)(g) | | | 1.05 | %(g) | |
Net investment income (loss) | | | 0.22 | % | | | (0.09 | %) | | | (0.06 | %) | | | 0.30 | % | | | (0.03 | %)(e) | | | (0.26 | %) | |
Supplemental data | |
Net assets, end of period (in thousands) | | $ | 58,911 | | | $ | 239,255 | | | $ | 466,376 | | | $ | 481,061 | | | $ | 442,000 | | | $ | 369,903 | | |
Portfolio turnover | | | 112 | % | | | 23 | % | | | 19 | % | | | 34 | % | | | 26 | % | | | 33 | % | |
Notes to Financial Highlights
(a) For the period from October 1, 2011 to August 31, 2012. During the period, the Fund's fiscal year end was changed from September 30 to August 31.
(b) Rounds to zero.
(c) In addition to the fees and expenses that the Fund bears directly, the Fund indirectly bears a pro rata share of the fees and expenses of any other funds in which it invests. Such indirect expenses are not included in the Fund's reported expense ratios.
(d) Ratios include line of credit interest expense which is less than 0.01%.
(e) Annualized.
(f) Total net expenses include the impact of certain fee waivers/expense reimbursements made by the Investment Manager and certain of its affiliates, if applicable.
(g) The benefits derived from expense reductions had an impact of less than 0.01%.
The accompanying Notes to Financial Statements are an integral part of this statement.
Annual Report 2016
30
COLUMBIA DISCIPLINED SMALL CORE FUND
NOTES TO FINANCIAL STATEMENTS
August 31, 2016
Note 1. Organization
Columbia Disciplined Small Core Fund (formerly known as Columbia Small Cap Core Fund) (the Fund), a series of Columbia Funds Series Trust I (the Trust), is a diversified fund. The Trust is registered under the Investment Company Act of 1940, as amended (the 1940 Act), as an open-end management investment company organized as a Massachusetts business trust. Effective April 18, 2016, Columbia Small Cap Core Fund was renamed Columbia Disciplined Small Core Fund.
Fund Shares
The Trust may issue an unlimited number of shares (without par value). The Fund offers Class A, Class B, Class C, Class I, Class R4, Class R5, Class T, Class W, Class Y and Class Z shares. Although all share classes generally have identical voting, dividend and liquidation rights, each share class votes separately when required by the Trust's organizational documents or by law. Different share classes pay different distribution amounts to the extent the expenses of such share classes differ, and distributions in liquidation will be proportional to the net asset value of each share class. Each share class has its own expense and sales charge structure.
Class A shares are subject to a maximum front-end sales charge of 5.75% based on the initial investment amount. Class A shares purchased without an initial sales charge in accounts aggregating $1 million to $50 million at the time of purchase are subject to a contingent deferred sales charge (CDSC) if the shares are sold within 18 months after purchase, charged as follows: 1.00% CDSC if redeemed within 12 months after purchase, and 0.50% CDSC if redeemed more than 12, but less than 18, months after purchase.
Class B shares may be subject to a maximum CDSC of 5.00% based upon the holding period after purchase. Class B shares will generally convert to Class A shares eight years after purchase. The Fund no longer accepts investments by new or existing investors in the Fund's Class B shares, except in connection with the reinvestment of any dividend and/or capital gain distributions in Class B shares of the Fund and exchanges by existing Class B shareholders of certain other funds within the Columbia Family of Funds.
Class C shares are subject to a 1.00% CDSC on shares redeemed within 12 months after purchase.
Class I shares are not subject to sales charges and are available only to the Columbia Family of Funds.
Class R4 shares are not subject to sales charges and are generally available only to omnibus retirement plans and certain investors as described in the Fund's prospectus.
Class R5 shares are not subject to sales charges and are generally available only to investors purchasing through authorized investment professionals and omnibus retirement plans.
Class T shares are subject to a maximum front-end sales charge of 5.75% based on the investment amount. Class T shares purchased without an initial sales charge in accounts aggregating $1 million to $50 million at the time of purchase are subject to a CDSC if the shares are sold within 18 months after purchase, charged as follows: 1.00% CDSC if redeemed within 12 months after purchase, and 0.50% CDSC if redeemed more than 12, but less than 18, months after purchase, with certain limitations. Class T shares are available only to investors who received (and who have continuously held) Class T shares in connection with previous fund reorganizations.
Class W shares are not subject to sales charges and are generally available only to investors purchasing through authorized investment programs managed by investment professionals, including discretionary managed account programs.
Class Y shares are not subject to sales charges and are generally available only to certain retirement plans as described in the Fund's prospectus.
Class Z shares are not subject to sales charges and are generally available only to eligible investors, which are subject to different investment minimums as described in the Fund's prospectus.
Note 2. Summary of Significant Accounting Policies
Basis of Preparation
The Fund is an investment company that applies the accounting and reporting guidance in the Financial Accounting Standards Board (FASB) Accounting Standards Codification Topic 946, Financial Services — Investment Companies (ASC 946). The financial statements are prepared in accordance with U.S. generally accepted accounting principles (GAAP), which requires management to make certain estimates and assumptions that affect the reported amounts of assets and liabilities, the disclosure of contingent assets and liabilities at the date of the financial statements and the reported amounts of income and expenses during the
Annual Report 2016
31
COLUMBIA DISCIPLINED SMALL CORE FUND
NOTES TO FINANCIAL STATEMENTS (continued)
August 31, 2016
reporting period. Actual results could differ from those estimates.
The following is a summary of significant accounting policies followed by the Fund in the preparation of its financial statements.
Security Valuation
All equity securities are valued at the close of business of the New York Stock Exchange (NYSE). Equity securities are valued at the last quoted sales price on the principal exchange or market on which they trade, except for securities traded on the NASDAQ Stock Market, which are valued at the NASDAQ official close price. Unlisted securities or listed securities for which there were no sales during the day are valued at the mean of the latest quoted bid and ask prices on such exchanges or markets.
Foreign equity securities are valued based on the closing price on the foreign exchange in which such securities are primarily traded. If any foreign equity security closing prices are not readily available, the securities are valued at the mean of the latest quoted bid and ask prices on such exchanges or markets. Foreign currency exchange rates are generally determined at 4:00 p.m. Eastern (U.S.) time. Many securities markets and exchanges outside the U.S. close prior to the close of the NYSE; therefore, the closing prices for securities in such markets or on such exchanges may not fully reflect events that occur after such close but before the close of the NYSE. In those situations, foreign securities will be fair valued pursuant to a policy adopted by the Board of Trustees (the Board), including, if available, utilizing a third party pricing service to determine these fair values. The third party pricing service takes into account multiple factors, including, but not limited to, movements in the U.S. securities markets, certain depositary receipts, futures contracts and foreign exchange rates that have occurred subsequent to the close of the foreign exchange or market, to determine a good faith estimate that reasonably reflects the current market conditions as of the close of the NYSE. The fair value of a security is likely to be different from the quoted or published price, if available.
Investments in open-end investment companies, including money market funds, are valued at their latest net asset value.
Investments for which market quotations are not readily available, or that have quotations which management believes are not reflective of market value or reliable, are
valued at fair value as determined in good faith under procedures approved by and under the general supervision of the Board. If a security or class of securities (such as foreign securities) is valued at fair value, such value is likely to be different from the quoted or published price for the security.
The determination of fair value often requires significant judgment. To determine fair value, management may use assumptions including but not limited to future cash flows and estimated risk premiums. Multiple inputs from various sources may be used to determine fair value.
GAAP requires disclosure regarding the inputs and valuation techniques used to measure fair value and any changes in valuation inputs or techniques. In addition, investments shall be disclosed by major category. This information is disclosed following the Fund's Portfolio of Investments.
Derivative Instruments
The Fund invests in certain derivative instruments, as detailed below, to meet its investment objectives. Derivatives are instruments whose values depend on, or are derived from, in whole or in part, the value of one or more securities, currencies, commodities, indices, or other assets or instruments. Derivatives may be used to increase investment flexibility (including to maintain cash reserves while maintaining desired exposure to certain assets), for risk management (hedging) purposes, to facilitate trading, to reduce transaction costs and to pursue higher investment returns. The Fund may also use derivative instruments to mitigate certain investment risks, such as foreign currency exchange rate risk, interest rate risk and credit risk. Derivatives may involve various risks, including the potential inability of the counterparty to fulfill its obligations under the terms of the contract, the potential for an illiquid secondary market (making it difficult for the Fund to sell or terminate, including at favorable prices) and the potential for market movements which may expose the Fund to gains or losses in excess of the amount shown in the Statement of Assets and Liabilities. The notional amounts of derivative instruments, if applicable, are not recorded in the financial statements.
A derivative instrument may suffer a marked-to-market loss if the value of the contract decreases due to an unfavorable change in the market rates or values of the underlying instrument. Losses can also occur if the counterparty does not perform its obligations under the contract. The Fund's risk of loss from counterparty credit risk on over-the-counter derivatives is generally limited to
Annual Report 2016
32
COLUMBIA DISCIPLINED SMALL CORE FUND
NOTES TO FINANCIAL STATEMENTS (continued)
August 31, 2016
the aggregate unrealized gain netted against any collateral held by the Fund and the amount of any variation margin held by the counterparty, plus any replacement costs or related amounts. With exchange-traded or centrally cleared derivatives, there is reduced counterparty credit risk to the Fund since the clearinghouse or central counterparty (CCP) provides some protection in the case of clearing member default. The clearinghouse or CCP stands between the buyer and the seller of the contract; therefore, additional counterparty credit risk is failure of the clearinghouse or CCP. However, credit risk still exists in exchange-traded or centrally cleared derivatives with respect to initial and variation margin that is held in a broker's customer account. While brokers are required to segregate customer margin from their own assets, in the event that a broker becomes insolvent or goes into bankruptcy and at that time there is a shortfall in the aggregate amount of margin held by the broker for all its clients, U.S. bankruptcy laws will typically allocate that shortfall on a pro-rata basis across all the broker's customers (including the Fund), potentially resulting in losses to the Fund.
In order to better define its contractual rights and to secure rights that will help the Fund mitigate its counterparty risk, the Fund may enter into an International Swaps and Derivatives Association, Inc. Master Agreement (ISDA Master Agreement) or similar agreement with its derivatives contract counterparties. An ISDA Master Agreement is an agreement between the Fund and a counterparty that governs over-the-counter derivatives and typically contains, among other things, collateral posting terms and netting provisions in the event of a default and/or termination event. Under an ISDA Master Agreement, the Fund may, under certain circumstances, offset with the counterparty certain derivative instrument's payables and/or receivables with collateral held and/or posted and create one single net payment. The provisions of the ISDA Master Agreement typically permit a single net payment in the event of default (close-out netting), including the bankruptcy or insolvency of the counterparty. Note, however, that bankruptcy or insolvency laws of a particular jurisdiction may impose restrictions on or prohibitions against the right of offset or netting in bankruptcy, insolvency or other events.
Collateral (margin) requirements differ by type of derivative. Margin requirements are established by the clearinghouse or CCP for exchange-traded and centrally cleared derivatives. Brokers can ask for margin in excess of the minimum in certain circumstances. Collateral
terms are contract specific for over-the-counter derivatives. For over-the-counter derivatives traded under an ISDA Master Agreement, the collateral requirements are typically calculated by netting the marked-to-market amount for each transaction under such agreement and comparing that amount to the value of any variation margin currently pledged by the Fund and/or the counterparty. Generally, the amount of collateral due from or to a party has to exceed a minimum transfer amount threshold (e.g., $250,000) before a transfer has to be made. To the extent amounts due to the Fund from its counterparties are not fully collateralized, contractually or otherwise, the Fund bears the risk of loss from counterparty nonperformance. The Fund attempts to mitigate counterparty risk by only entering into agreements with counterparties that it believes have the financial resources to honor their obligations and by monitoring the financial stability of those counterparties.
Certain ISDA Master Agreements allow counterparties to over-the-counter derivatives transactions to terminate derivatives contracts prior to maturity in the event the Fund's net asset value declines by a stated percentage over a specified time period or if the Fund fails to meet certain terms of the ISDA Master Agreement, which would cause the Fund to accelerate payment of any net liability owed to the counterparty. The Fund also has termination rights if the counterparty fails to meet certain terms of the ISDA Master Agreement. In addition to considering counterparty credit risk, the Fund would consider terminating the derivatives contracts based on whether termination would result in a net liability owed from the counterparty.
For financial reporting purposes, the Fund does not offset derivative assets and derivative liabilities that are subject to netting arrangements in the Statement of Assets and Liabilities.
Futures Contracts
Futures contracts are exchange-traded and represent commitments for the future purchase or sale of an asset at a specified price on a specified date. The Fund bought and sold futures contracts to maintain appropriate equity market exposure while keeping sufficient cash to accommodate daily redemptions. These instruments may be used for other purposes in future periods. Upon entering into futures contracts, the Fund bears risks that it may not achieve the anticipated benefits of the futures contracts and may realize a loss. Additional risks include counterparty credit risk, the possibility of an illiquid market, and that a change in the value of the contract or
Annual Report 2016
33
COLUMBIA DISCIPLINED SMALL CORE FUND
NOTES TO FINANCIAL STATEMENTS (continued)
August 31, 2016
option may not correlate with changes in the value of the underlying asset.
Upon entering into a futures contract, the Fund deposits cash or securities with the broker, known as a futures commissions merchant (FCM), in an amount sufficient to meet the initial margin requirement. The initial margin deposit must be maintained at an established level over the life of the contract. Cash deposited as initial margin is recorded in the Statement of Assets and Liabilities as margin deposits. Securities deposited as initial margin are designated in the Portfolio of Investments. Subsequent payments (variation margin) are made or received by the Fund each day. The variation margin payments are equal to the daily change in the contract value and are recorded as variation margin receivable or payable and are offset in unrealized gains or losses. The Fund recognizes a realized gain or loss when the contract is closed or expires. Futures contracts involve, to varying degrees, risk of loss in excess of the variation margin disclosed in the Statement of Assets and Liabilities.
Effects of Derivative Transactions in the Financial Statements
The following tables are intended to provide additional information about the effect of derivatives on the financial statements of the Fund, including: the fair value of derivatives by risk category and the location of those fair values in the Statement of Assets and Liabilities; and the impact of derivative transactions over the period in the Statement of Operations, including realized and unrealized gains (losses). The derivative instrument schedules following the Portfolio of Investments present additional information regarding derivative instruments outstanding at the end of the period, if any.
The following table is a summary of the fair value of derivative instruments (not considered to be hedging instruments for accounting disclosure purposes) at August 31, 2016:
Asset Derivatives | |
Risk Exposure
Category | | Statement of Assets and
Liabilities Location | | Fair Value ($) | |
Equity risk
| | Net assets — unrealized
appreciation on futures
contracts | | | 288,884
| * | |
*Includes cumulative appreciation (depreciation) as reported in the tables following the Portfolio of Investments. Only the current day's variation margin is reported in receivables or payables in the Statement of Assets and Liabilities.
The following table indicates the effect of derivative instruments (not considered to be hedging instruments
for accounting disclosure purposes) in the Statement of Operations for the year ended August 31, 2016:
Amount of Realized Gain (Loss) on Derivatives Recognized in Income | |
Risk Exposure Category | | Futures Contracts ($) | |
Equity risk | | | 1,455,035 | | |
Change in Unrealized Appreciation (Depreciation) on
Derivatives Recognized in Income | |
Risk Exposure Category | | Futures Contracts ($) | |
Equity risk | | | 288,884 | | |
The following table provides a summary of the average outstanding volume by derivative instrument for the year ended August 31, 2016:
Derivative Instrument | | Average Notional
Amounts ($)* | |
Futures contracts — Long | | | 8,580,410 | | |
*Based on the ending quarterly outstanding amounts for the year ended August 31, 2016.
Security Transactions
Security transactions are accounted for on the trade date. Cost is determined and gains (losses) are based upon the specific identification method for both financial statement and federal income tax purposes.
Income Recognition
Corporate actions and dividend income are generally recorded net of any non-reclaimable tax withholdings, on the ex-dividend date or upon receipt of ex-dividend notification in the case of certain foreign securities.
The Fund may receive distributions from holdings in equity securities, business development companies (BDCs), exchange-traded funds, other regulated investment companies (RICs), and real estate investment trusts (REITs), which report information on the tax character of their distributions annually. These distributions are allocated to dividend income, capital gain and return of capital based on actual information reported. Return of capital is recorded as a reduction of the cost basis of securities held. If the Fund no longer owns the applicable securities, return of capital is recorded as a realized gain. With respect to REITs, to the extent actual information has not yet been reported, estimates for return of capital are made by the Fund's management. Management's estimates are subsequently adjusted when the actual character of the distributions is disclosed by the REITs, which could result in a proportionate change in return of capital to shareholders.
Annual Report 2016
34
COLUMBIA DISCIPLINED SMALL CORE FUND
NOTES TO FINANCIAL STATEMENTS (continued)
August 31, 2016
Awards from class action litigation are recorded as a reduction of cost basis if the Fund still owns the applicable securities on the payment date. If the Fund no longer owns the applicable securities, the proceeds are recorded as realized gains.
Expenses
General expenses of the Trust are allocated to the Fund and other funds of the Trust based upon relative net assets or other expense allocation methodologies determined by the nature of the expense. Expenses directly attributable to the Fund are charged to the Fund. Expenses directly attributable to a specific class of shares are charged to that share class.
Determination of Class Net Asset Value
All income, expenses (other than class-specific expenses, which are charged to that share class, as shown in the Statement of Operations) and realized and unrealized gains (losses) are allocated to each class of the Fund on a daily basis, based on the relative net assets of each class, for purposes of determining the net asset value of each class.
Federal Income Tax Status
The Fund intends to qualify each year as a regulated investment company under Subchapter M of the Internal Revenue Code, as amended, and will distribute substantially all of its taxable income (including net short-term capital gains), if any, for its tax year, and as such will not be subject to federal income taxes. In addition, the Fund intends to distribute in each calendar year substantially all of its net investment income, capital gains and certain other amounts, if any, such that the Fund should not be subject to federal excise tax. Therefore, no federal income or excise tax provision is recorded.
Foreign Taxes
The Fund may be subject to foreign taxes on income, gains on investments or currency repatriation, a portion of which may be recoverable. The Fund will accrue such taxes and recoveries, as applicable, based upon its current interpretation of tax rules and regulations that exist in the markets in which it invests.
Realized gains in certain countries may be subject to foreign taxes at the Fund level, based on statutory rates. The Fund accrues for such foreign taxes on realized and unrealized gains at the appropriate rate for each jurisdiction, as applicable. The amount, if any, is
disclosed as a liability on the Statement of Assets and Liabilities.
Distributions to Shareholders
Distributions from net investment income, if any, are declared and paid annually. Net realized capital gains, if any, are distributed along with the income distribution. Income distributions and capital gain distributions are determined in accordance with federal income tax regulations, which may differ from GAAP.
Guarantees and Indemnifications
Under the Trust's organizational documents and, in some cases, by contract, its officers and trustees are indemnified against certain liabilities arising out of the performance of their duties to the Trust or its funds. In addition, certain of the Fund's contracts with its service providers contain general indemnification clauses. The Fund's maximum exposure under these arrangements is unknown since the amount of any future claims that may be made against the Fund cannot be determined, and the Fund has no historical basis for predicting the likelihood of any such claims.
Note 3. Fees and Other Transactions with Affiliates
Management Services Fees
Effective January 1, 2016, the Fund entered into a Management Agreement with Columbia Management Investment Advisers, LLC (the Investment Manager), a wholly-owned subsidiary of Ameriprise Financial, Inc. (Ameriprise Financial). Under the Management Agreement, the Investment Manager provides the Fund with investment research and advice, as well as administrative and accounting services. The management services fee is an annual fee that is equal to a percentage of the Fund's average daily net assets that declines from 0.87% to 0.75% as the Fund's net assets increase. Prior to January 1, 2016, the Fund paid the Investment Manager an annual fee for advisory services under an Investment Management Services Agreement and a separate annual fee for administrative and accounting services under an Administrative Services Agreement. The effective management services fee rate for the year ended August 31, 2016 (reflecting all advisory and administrative services fees paid to the Investment Manager) was 0.87% of the Fund's average daily net assets. For the period from September 1, 2015 through December 31, 2015, the investment advisory services fee paid to the Investment Manager was
Annual Report 2016
35
COLUMBIA DISCIPLINED SMALL CORE FUND
NOTES TO FINANCIAL STATEMENTS (continued)
August 31, 2016
$1,296,456 and the administrative services fee paid to the Investment Manager was $131,266.
Compensation of Board Members
Board members, who are not officers or employees of the Investment Manager or Ameriprise Financial, are compensated for their services to the Fund as disclosed in the Statement of Operations. These Board members may participate in a Deferred Compensation Plan (the Plan) which may be terminated at any time. Obligations of the Plan will be paid solely out of the Fund's assets, and all amounts payable under the Plan constitute a general unsecured obligation of the Fund.
Compensation of Chief Compliance Officer
The Board has appointed a Chief Compliance Officer to the Fund in accordance with federal securities regulations. The Fund is allocated a portion of the expenses associated with the Chief Compliance Officer based on relative net assets of the Trust.
Transfer Agency Fees
Under a Transfer and Dividend Disbursing Agent Agreement, Columbia Management Investment Services Corp. (the Transfer Agent), an affiliate of the Investment Manager and a wholly-owned subsidiary of Ameriprise Financial, is responsible for providing transfer agency services to the Fund. The Transfer Agent has contracted with Boston Financial Data Services (BFDS) to serve as sub-transfer agent. The Transfer Agent pays the fees of BFDS for services as sub-transfer agent and BFDS is not entitled to reimbursement for such fees from the Fund (with the exception of out-of-pocket fees).
The Fund pays the Transfer Agent a monthly transfer agency fee based on the number or the average value of accounts, depending on the type of account. In addition, prior to October 1, 2016, the Transfer Agent also received sub-transfer agency fees based on a percentage of the average aggregate value of the Fund's shares maintained in omnibus accounts (other than omnibus accounts for which American Enterprise Investment Services Inc. is the broker of record or accounts where the beneficial shareholder is a customer of Ameriprise Financial Services, Inc., for which the Transfer Agent receives a per account fee). Effective October 1, 2016, the Fund pays the Transfer Agent a fee for shareholder services based on the number of accounts or on a percentage of the average aggregate value of the Fund's shares maintained in omnibus accounts up to the lesser of the amount charged by the servicing agent or a cap established by the Board from time to time.
The Transfer Agent also receives compensation from the Fund for various shareholder services and reimbursements for certain out-of-pocket fees. Total transfer agency fees for Class R5 shares are subject to an annual limitation of not more than 0.05% of the average daily net assets attributable to Class R5 shares. Class I and Class Y shares do not pay transfer agency fees.
For the year ended August 31, 2016, the Fund's effective transfer agency fee rates as a percentage of average daily net assets of each class were as follows:
Class A | | | 0.20 | % | |
Class B | | | 0.20 | | |
Class C | | | 0.20 | | |
Class R4 | | | 0.20 | | |
Class R5 | | | 0.05 | | |
Class T | | | 0.20 | | |
Class W | | | 0.20 | | |
Class Z | | | 0.20 | | |
An annual minimum account balance fee of $20 may apply to certain accounts with a value below the applicable share class's initial minimum investment requirements to reduce the impact of small accounts on transfer agency fees. These minimum account balance fees are remitted to the Fund and recorded as part of expense reductions in the Statement of Operations. For the year ended August 31, 2016, these minimum account balance fees reduced total expenses of the Fund by $1,791.
Distribution and Service Fees
The Fund has an agreement with Columbia Management Investment Distributors, Inc. (the Distributor), an affiliate of the Investment Manager and a wholly-owned subsidiary of Ameriprise Financial, for distribution and shareholder services. The Board has approved, and the Fund has adopted, distribution and shareholder service plans (the Plans) applicable to certain share classes, which set the distribution and service fees for the Fund. These fees are calculated daily and are intended to compensate the Distributor and/or eligible selling and/or servicing agents for selling shares of the Fund and providing services to investors.
Under the Plans, the Fund pays a monthly service fee to the Distributor at the maximum annual rate of 0.25% of the average daily net assets attributable to Class A, Class B, Class C and Class W shares of the Fund. Also under the Plans, the Fund pays a monthly distribution fee
Annual Report 2016
36
COLUMBIA DISCIPLINED SMALL CORE FUND
NOTES TO FINANCIAL STATEMENTS (continued)
August 31, 2016
to the Distributor at the maximum annual rates of 0.10%, 0.75%, 0.75% and 0.25% of the average daily net assets attributable to Class A, Class B, Class C and Class W shares of the Fund, respectively.
Although the Fund may pay distribution and service fees up to a maximum annual rate of 0.35% of the Fund's average daily net assets attributable to Class A shares (comprised of up to 0.10% for distribution services and up to 0.25% for shareholder liaison services), the Fund currently limits such fees to an aggregate fee of not more than 0.25% of the Fund's average daily net assets attributable to Class A shares.
Although the Fund may pay a distribution fee up to 0.25% of the Fund's average daily net assets attributable to Class W shares and a service fee of up to 0.25% of the Fund's average daily net assets attributable to Class W shares, the aggregate fee shall not exceed 0.25% of the Fund's average daily net assets attributable to Class W shares.
Shareholder Services Fees
The Fund has adopted a shareholder services plan that permits it to pay for certain services provided to Class T shareholders by their selling and/or servicing agents. The Fund may pay shareholder servicing fees up to an aggregate annual rate of 0.50% of the Fund's average daily net assets attributable to Class T shares (comprised of up to 0.25% for shareholder liaison services and up to 0.25% for administrative support services). These fees are currently limited to an aggregate annual rate of not more than 0.25% of the Fund's average daily net assets attributable to Class T shares.
Sales Charges
Sales charges, including front-end charges and CDSCs, received by the Distributor for distributing Fund shares were $20,998 for Class A, $2 for Class B, $792 for Class C and $2,659 for Class T shares for the year ended August 31, 2016.
Expenses Waived/Reimbursed by the Investment Manager and its Affiliates
The Fund's expense ratio is subject to an expense reimbursement arrangement pursuant to which fees will be waived and/or expenses reimbursed (excluding certain fees and expenses described below), so that the Fund's net operating expenses, after giving effect to fees waived/expenses reimbursed and any balance credits
and/or overdraft charges from the Fund's custodian, do not exceed the annual rates of:
| | Contractual
Expense Cap
January 1, 2016
Through
December 31, 2016 | | Voluntary
Expense Cap
Prior to
January 1, 2016 | |
Class A | | | 1.38 | % | | | 1.38 | % | |
Class B | | | 2.13 | | | | 2.13 | | |
Class C | | | 2.13 | | | | 2.13 | | |
Class I | | | 0.98 | | | | 0.94 | | |
Class R4 | | | 1.13 | | | | 1.13 | | |
Class R5 | | | 1.03 | | | | 0.99 | | |
Class T | | | 1.38 | | | | 1.38 | | |
Class W | | | 1.38 | | | | 1.38 | | |
Class Y | | | 0.98 | | | | 0.94 | | |
Class Z | | | 1.13 | | | | 1.13 | | |
The contractual agreement may be modified or amended only with approval from the Investment Manager, certain of its affiliates and the Fund. Under the arrangements, the following fees and expenses are excluded from the waiver/reimbursement commitment, and therefore will be paid by the Fund, if applicable: taxes (including foreign transaction taxes), expenses associated with investments in affiliated and non-affiliated pooled investment vehicles (including mutual funds and exchange-traded funds), transaction costs and brokerage commissions, costs related to any securities lending program, dividend and interest expenses associated with securities sold short, inverse floater program fees and expenses, transaction charges and interest on borrowed money, interest and infrequent and/or unusual expenses. Any fees waived and/or expenses reimbursed under the expense reimbursement arrangements described above are not recoverable by the Investment Manager or its affiliates in future periods.
Note 4. Federal Tax Information
The timing and character of income and capital gain distributions are determined in accordance with income tax regulations, which may differ from GAAP because of temporary or permanent book to tax differences.
At August 31, 2016, these differences are primarily due to differing treatment for deferral/reversal of wash sale losses, Trustees' deferred compensation, distribution reclassifications, re-characterization of distributions for investments and derivative investments. To the extent these differences are permanent, reclassifications are
Annual Report 2016
37
COLUMBIA DISCIPLINED SMALL CORE FUND
NOTES TO FINANCIAL STATEMENTS (continued)
August 31, 2016
made among the components of the Fund's net assets in the Statement of Assets and Liabilities. Temporary differences do not require reclassifications.
In the Statement of Assets and Liabilities the following reclassifications were made:
Undistributed net investment income | | $ | 47,819 | | |
Accumulated net realized gain | | | (47,820 | ) | |
Paid-in capital | | | 1 | | |
Net investment income (loss) and net realized gains (losses), as disclosed in the Statement of Operations, and net assets were not affected by this reclassification.
The tax character of distributions paid during the years indicated was as follows:
Year Ended August 31, | | 2016 | | 2015 | |
Ordinary income | | $ | 598,422 | | | $ | 4,474,055 | | |
Long-term capital gains | | | 149,765,262 | | | | 81,642,997 | | |
Total | | $ | 150,363,684 | | | $ | 86,117,052 | | |
Short-term capital gain distributions, if any, are considered ordinary income distributions for tax purposes.
At August 31, 2016, the components of distributable earnings on a tax basis were as follows:
Undistributed ordinary income | | $ | 3,736,238 | | |
Undistributed long-term capital gains | | | 85,634,964 | | |
Net unrealized appreciation | | | 40,829,597 | | |
At August 31, 2016, the cost of investments for federal income tax purposes was $224,636,120 and the aggregate gross unrealized appreciation and depreciation based on that cost was:
Unrealized appreciation | | $ | 47,442,807 | | |
Unrealized depreciation | | | (6,613,210 | ) | |
Net unrealized appreciation | | $ | 40,829,597 | | |
Management of the Fund has concluded that there are no significant uncertain tax positions in the Fund that would require recognition in the financial statements. However, management's conclusion may be subject to review and adjustment at a later date based on factors including, but not limited to, new tax laws, regulations, and administrative interpretations (including relevant court decisions). Generally, the Fund's federal tax returns for the prior three fiscal years remain subject to examination by the Internal Revenue Service.
Note 5. Portfolio Information
The cost of purchases and proceeds from sales of securities, excluding short-term investments and derivatives, if any, aggregated to $409,128,881 and $686,578,584, respectively, for the year ended August 31, 2016. The amount of purchase and sale activity impacts the portfolio turnover rate reported in the Financial Highlights.
Note 6. Affiliated Money Market Fund
The Fund invests in Columbia Short-Term Cash Fund, an affiliated money market fund established for the exclusive use by the Fund and other affiliated funds (the Affiliated MMF). The income earned by the Fund from such investments is included as Dividends — affiliated issuers in the Statement of Operations. As an investing fund, the Fund indirectly bears its proportionate share of the expenses of the Affiliated MMF. Effective October 1, 2016, the Affiliated MMF prices its shares with a floating net asset value (NAV) and no longer seeks to maintain a stable NAV. In addition, the Board of the Affiliated MMF may impose a fee on redemptions (sometimes referred to as a liquidity fee) or temporarily suspend redemptions (sometimes referred to as imposing a redemption gate) in the event its liquidity falls below regulatory limits.
Note 7. Line of Credit
The Fund has access to a revolving credit facility whereby the Fund may borrow for the temporary funding of shareholder redemptions or for other temporary or emergency purposes. Effective December 8, 2015, Citibank, N.A. and HSBC Bank USA, N.A. joined JPMorgan Chase Bank, N.A. (JPMorgan) as lead of a syndicate of banks under the credit facility, which is a collective agreement between the Fund and certain other funds managed by the Investment Manager, severally and not jointly, that permits collective borrowings up to $1 billion. Interest is charged to each participating fund based on its borrowings at a rate equal to the higher of (i) the overnight federal funds rate plus 1.00% or (ii) the one-month LIBOR rate plus 1.00%. Each borrowing under the credit facility matures no later than 60 days after the date of borrowing. The Fund also pays a commitment fee equal to its pro rata share of the amount of the credit facility at a rate of 0.15% per annum. The commitment fee is included in other expenses in the Statement of Operations. Prior to December 8, 2015, JPMorgan was the sole lead bank under the credit facility agreement that permitted borrowings up to $550 million under the same terms and interest rates as described above with
Annual Report 2016
38
COLUMBIA DISCIPLINED SMALL CORE FUND
NOTES TO FINANCIAL STATEMENTS (continued)
August 31, 2016
the exception of the commitment fee which was charged at a rate of 0.075% per annum.
The Fund had no borrowings during the year ended August 31, 2016.
Note 8. Significant Risks
Shareholder Concentration Risk
At August 31, 2016, one unaffiliated shareholder of record owned 19.9% of the outstanding shares of the Fund in one or more accounts. The Fund has no knowledge about whether any portion of those shares was owned beneficially. Affiliated shareholders of record owned 27.3% of the outstanding shares of the Fund in one or more accounts. Subscription and redemption activity by concentrated accounts may have a significant effect on the operations of the Fund. In the case of a large redemption, the Fund may be forced to sell investments at inopportune times, including its liquid or more liquid positions, resulting in Fund losses and the Fund holding a higher percentage of less liquid or illiquid securities. Large redemptions could result in decreased economies of scale and increased operating expenses for non-redeeming Fund shareholders.
Financial Sector Risk
The Fund may be more susceptible to the particular risks that may affect companies in the financial services sector than if it were invested in a wider variety of companies in unrelated sectors. Companies in the financial services sector are subject to certain risks, including the risk of regulatory change, decreased liquidity in credit markets and unstable interest rates. Such companies may have concentrated portfolios, such as a high level of loans to real estate developers, which makes them vulnerable to economic conditions that affect that industry. Performance of such companies may be affected by competitive pressures and exposure to investments or agreements that, under certain circumstances, may lead to losses (e.g., subprime loans). Companies in the financial services sector are subject to extensive governmental regulation that may limit the amount and types of loans and other financial commitments they can make, and interest rates and fees that they may charge. In addition, profitability of such companies is largely dependent upon the availability and the cost of capital.
Note 9. Subsequent Events
Management has evaluated the events and transactions that have occurred through the date the financial
statements were issued and noted no items requiring adjustment of the financial statements or additional disclosure.
Note 10. Information Regarding Pending and Settled Legal Proceedings
Ameriprise Financial and certain of its affiliates have historically been involved in a number of legal, arbitration and regulatory proceedings, including routine litigation, class actions, and governmental actions, concerning matters arising in connection with the conduct of their business activities. Ameriprise Financial believes that the Funds are not currently the subject of, and that neither Ameriprise Financial nor any of its affiliates are the subject of, any pending legal, arbitration or regulatory proceedings that are likely to have a material adverse effect on the Funds or the ability of Ameriprise Financial or its affiliates to perform under their contracts with the Funds. Ameriprise Financial is required to make quarterly (10-Q), annual (10-K) and, as necessary, 8-K filings with the Securities and Exchange Commission (SEC) on legal and regulatory matters that relate to Ameriprise Financial and its affiliates. Copies of these filings may be obtained by accessing the SEC website at www.sec.gov.
There can be no assurance that these matters, or the adverse publicity associated with them, will not result in increased fund redemptions, reduced sale of fund shares or other adverse consequences to the Funds. Further, although we believe proceedings are not likely to have a material adverse effect on the Funds or the ability of Ameriprise Financial or its affiliates to perform under their contracts with the Funds, these proceedings are subject to uncertainties and, as such, we are unable to estimate the possible loss or range of loss that may result. An adverse outcome in one or more of these proceedings could result in adverse judgments, settlements, fines, penalties or other relief that could have a material adverse effect on the consolidated financial condition or results of operations of Ameriprise Financial.
Annual Report 2016
39
COLUMBIA DISCIPLINED SMALL CORE FUND
REPORT OF INDEPENDENT REGISTERED PUBLIC ACCOUNTING FIRM
To the Trustees of Columbia Funds Series Trust I and the Shareholders of
Columbia Disciplined Small Core Fund (formerly known as Columbia Small Cap Core Fund)
In our opinion, the accompanying statement of assets and liabilities, including the portfolio of investments, and the related statements of operations and of changes in net assets and the financial highlights present fairly, in all material respects, the financial position of Columbia Disciplined Small Core Fund (formerly known as Columbia Small Cap Core Fund) (the "Fund," a series of Columbia Funds Series Trust I) at August 31, 2016, and the results of its operations, the changes in its net assets and the financial highlights for each of the periods indicated, in conformity with accounting principles generally accepted in the United States of America. These financial statements and financial highlights (hereafter referred to as "financial statements") are the responsibility of the Fund's management. Our responsibility is to express an opinion on these financial statements based on our audits. We conducted our audits of these financial statements in accordance with the standards of the Public Company Accounting Oversight Board (United States). Those standards require that we plan and perform the audit to obtain reasonable assurance about whether the financial statements are free of material misstatement. An audit includes examining, on a test basis, evidence supporting the amounts and disclosures in the financial statements, assessing the accounting principles used and significant estimates made by management, and evaluating the overall financial statement presentation. We believe that our audits, which included confirmation of securities at August 31, 2016 by correspondence with the custodian, brokers and transfer agent, provide a reasonable basis for our opinion.
PricewaterhouseCoopers LLP
Minneapolis, MN
October 21, 2016
Annual Report 2016
40
COLUMBIA DISCIPLINED SMALL CORE FUND
FEDERAL INCOME TAX INFORMATION
(Unaudited)
The Fund hereby designates the following tax attributes for the fiscal year ended August 31, 2016. Shareholders will be notified in early 2017 of the amounts for use in preparing 2016 income tax returns.
Tax Designations
Qualified Dividend Income | | | 91.77 | % | |
Dividends Received Deduction | | | 91.06 | % | |
Capital Gain Dividend | | $ | 99,341,956 | | |
Qualified Dividend Income. For taxable, non-corporate shareholders, the percentage of ordinary income distributed during the fiscal year that represents qualified dividend income subject to reduced tax rates.
Dividends Received Deduction. The percentage of ordinary income distributed during the fiscal year that qualifies for the corporate dividends received deduction.
Capital Gain Dividend. The Fund designates as a capital gain dividend the amount reflected above, or if subsequently determined to be different, the net capital gain of such fiscal period.
Annual Report 2016
41
COLUMBIA DISCIPLINED SMALL CORE FUND
Shareholders elect the Board that oversees the Fund's operations. The Board appoints officers who are responsible for day-to-day business decisions based on policies set by the Board. The following table provides basic biographical information about the Fund's Trustees, including their principal occupations during the past five years, although specific titles for individuals may have varied over the period. The year set forth beneath Length of Service in the table below is the year in which the Trustee was first appointed or elected as Trustee to any Fund currently in the Columbia Funds Complex or a predecessor thereof. Under current Board policy, members serve terms of indefinite duration.
Trustees
Independent Trustees
Name,
Address,
Year of Birth | | Position Held With
the Trust and Length of
Service | | Principal Occupation(s)
During the Past Five Years
and Other Relevant
Professional Experience | | Number of
Funds in the
Columbia Funds
Complex
Overseen | | Other Directorships
Held by Trustee During
the Past Five Years | |
Janet Langford Carrig
c/o Columbia
Management Investment Advisers, LLC,
225 Franklin Street
Mail Drop BX32 05228,
Boston, MA 02110
1957 | | Trustee 1996 | | Senior Vice President, General Counsel and Corporate Secretary, ConocoPhillips (integrated energy company) since September 2007 | | | 56 | | | None | |
Douglas A. Hacker
c/o Columbia Management Investment Advisers, LLC,
225 Franklin Street
Mail Drop BX32 05228,
Boston, MA 02110
1955 | | Trustee and Chairman of the Board 1996 | | Independent business executive since May 2006; Executive Vice President — Strategy of United Airlines from December 2002 to May 2006; President of UAL Loyalty Services (airline marketing company) from September 2001 to December 2002; Executive Vice President and Chief Financial Officer of United Airlines from July 1999 to September 2001 | | | 56 | | | Spartan Nash Company (food distributor); Nash Finch Company (food distributor) from 2005 to 2013; Aircastle Limited (aircraft leasing); SeaCube Container Leasing Ltd. (container leasing) from 2010 to 2013; and Travelport Worldwide Limited (travel information technology) | |
Nancy T. Lukitsh
c/o Columbia Management Investment Advisers, LLC,
225 Franklin Street
Mail Drop BX32 05228,
Boston, MA 02110
1956 | | Trustee 2011 | | Senior Vice President, Partner and Director of Marketing, Wellington Management Company, LLP (investment adviser) from 1997 to 2010; Chair, Wellington Management Portfolios (commingled non-U.S. investment pools) from 2007 to 2010; Director, Wellington Trust Company, NA and other Wellington affiliates from 1997 to 2010 | | | 56 | | | None | |
Annual Report 2016
42
COLUMBIA DISCIPLINED SMALL CORE FUND
TRUSTEES AND OFFICERS (continued)
Independent Trustees (continued)
Name,
Address,
Year of Birth | | Position Held With
the Trust and Length of
Service | | Principal Occupation(s)
During the Past Five Years
and Other Relevant
Professional Experience | | Number of
Funds in the
Columbia Funds
Complex
Overseen | | Other Directorships
Held by Trustee During
the Past Five Years | |
William E. Mayer
c/o Columbia Management Investment Advisers, LLC,
225 Franklin Street
Mail Drop BX32 05228,
Boston, MA 02110
1940 | | Trustee 1991 | | Partner, Park Avenue Equity Partners (private equity) since February 1999 | | | 56 | | | DynaVox Inc. (speech creation); Lee Enterprises (print media); WR Hambrecht + Co. (financial service provider) from 2000 to 2012; BlackRock Capital Investment Corporation (investment company); and Premier, Inc. (healthcare) | |
David M. Moffett
c/o Columbia Management Investment Advisers, LLC,
225 Franklin Street
Mail Drop BX32 05228,
Boston, MA 02110
1952 | | Trustee 2011 | | Retired. Consultant to Bridgewater and Associates | | | 56 | | | Director of CIT Bank, CIT Group Inc. (commercial and consumer finance); eBay Inc. (online trading community); Genworth Financial, Inc. (financial and insurance products and services); Paypal Holdings Inc. (payment and data processing services); and Trustee University of Oklahoma Foundation | |
Charles R. Nelson
c/o Columbia Management Investment Advisers, LLC,
225 Franklin Street
Mail Drop BX32 05228,
Boston, MA 02110
1942 | | Trustee 1981 | | Retired. Professor Emeritus, University of Washington since 2011; Professor of Economics, University of Washington from 1976 to 2011; Ford and Louisa Van Voorhis Professor of Political Economy, University of Washington from 1993 to 2011; Adjunct Professor of Statistics, University of Washington from 1980 to 2011; Associate Editor, Journal of Money, Credit and Banking from September 1993 to 2008; consultant on econometric and statistical matters | | | 56 | | | None | |
John J. Neuhauser
c/o Columbia Management Investment Advisers, LLC,
225 Franklin Street
Mail Drop BX32 05228,
Boston, MA 02110
1943 | | Trustee 1984 | | President, Saint Michael's College since August 2007; Director or Trustee of several non-profit organizations, including University of Vermont Medical Center; Academic Vice President and Dean of Faculties, Boston College from August 1999 to October 2005; University Professor, Boston College from November 2005 to August 2007 | | | 56 | | | Liberty All-Star Equity Fund and Liberty All-Star Growth Fund (closed-end funds) | |
Annual Report 2016
43
COLUMBIA DISCIPLINED SMALL CORE FUND
TRUSTEES AND OFFICERS (continued)
Independent Trustees (continued)
Name,
Address,
Year of Birth | | Position Held With
the Trust and Length of
Service | | Principal Occupation(s)
During the Past Five Years
and Other Relevant
Professional Experience | | Number of
Funds in the
Columbia Funds
Complex
Overseen | | Other Directorships
Held by Trustee During
the Past Five Years | |
Patrick J. Simpson
c/o Columbia Management Investment Advisers, LLC,
225 Franklin Street
Mail Drop BX32 05228,
Boston, MA 02110
1944 | | Trustee 2000 | | Of Counsel, Perkins Coie LLP (law firm) since 2015; Partner, Perkins Coie LLP from 1988 to 2014 | | | 56 | | | None | |
Anne-Lee Verville
c/o Columbia Management Investment Advisers, LLC,
225 Franklin Street
Mail Drop BX32 05228,
Boston, MA 02110
1945 | | Trustee 1998 | | Retired. General Manager, Global Education Industry from 1994 to 1997, President — Application Systems Division from 1991 to 1994, Chief Financial Officer — US Marketing & Services from 1988 to 1991, and Chief Information Officer from 1987 to 1988, IBM Corporation (computer and technology) | | | 56 | | | Enesco Group, Inc. (producer of giftware and home and garden decor products) from 2001 to 2006 | |
Consultant to the Trustees*
Name,
Address,
Year of Birth | | Position Held With
the Trust and Length of
Service | | Principal Occupation(s)
During the Past Five Years
and Other Relevant
Professional Experience | | Number of
Funds in the
Columbia Funds
Complex
Overseen | | Other Directorships
Held by Trustee During
the Past Five Years | |
J. Kevin Connaughton
c/o Columbia
Management Investment Advisers, LLC,
225 Franklin Street
Mail Drop BX32 05228,
Boston, MA 02110
1964 | | Trustee Consultant 2016 | | Trustee Consultant, Columbia Funds since March 2016; Managing Director and General Manager of Mutual Fund Products, Columbia Management Investment Advisers, LLC from May 2010 to February 2015; President, Columbia Funds from 2009 to 2015; and senior officer of Columbia Funds and affiliated funds from 2003 to 2015 | | | 56 | | | Board of Governors, Gateway Healthcare since January 2016; Trustee, New Century Portfolios since March 2015; and Director, The Autism Project since March 2015 | |
* J. Kevin Connaughton was appointed consultant to the Trustees effective March 1, 2016. Shareholders of the Funds are expected to be asked to elect Mr. Connaughton as a Trustee at a future shareholder meeting.
Annual Report 2016
44
COLUMBIA DISCIPLINED SMALL CORE FUND
TRUSTEES AND OFFICERS (continued)
Interested Trustee Affiliated with Investment Manager*
Name,
Address,
Year of Birth | | Position Held With
the Trust and Length of
Service | | Principal Occupation(s)
During the Past Five Years
and Other Relevant
Professional Experience | | Number of
Funds in the
Columbia Funds
Complex
Overseen | | Other Directorships
Held by Trustee During
the Past Five Years | |
William F. Truscott
c/o Columbia Management Investment Advisers, LLC,
225 Franklin Street
Boston, MA 02110
1960 | | Trustee 2012 | | Chairman of the Board and President, Columbia Management Investment Advisers, LLC since May 2010 and February 2012, respectively; Chief Executive Officer, Global Asset Management, Ameriprise Financial, Inc. since September 2012 (previously Chief Executive Officer, U.S. Asset Management & President, Annuities, May 2010- September 2012); Director and Chief Executive Officer, Columbia Management Investment Distributors, Inc. since May 2010 and February 2012, respectively; Chairman of the Board and Chief Executive Officer, RiverSource Distributors, Inc. since 2006; Director, Threadneedle Asset Management Holdings, SARL since 2014; President and Chief Executive Officer, Ameriprise Certificate Company, 2006-August 2012. | | | 184 | | | Trustee to other Columbia Funds since 2001; Chairman of the Board, Columbia Management Investment Advisers, LLC since May 2010; Director, Columbia Management Investment Distributors, Inc. since May 2010; Former Director, Ameriprise Certificate Company, 2006-January 2013 | |
* Interested person (as defined under the 1940 Act) by reason of being an officer, director, security holder and/or employee of the Investment Manager or Ameriprise Financial.
The Statement of Additional Information has additional information about the Fund's Board members and is available, without charge, upon request by calling 800.345.6611; contacting your financial intermediary; or visiting investor.columbiathreadneedleus.com.
Annual Report 2016
45
COLUMBIA DISCIPLINED SMALL CORE FUND
TRUSTEES AND OFFICERS (continued)
The Board has appointed officers who are responsible for day-to-day business decisions based on policies it has established. The officers serve at the pleasure of the Board. The following table provides basic information about the Officers of the Fund, including principal occupations during the past five years, although their specific titles may have varied over the period. In addition to Mr. Truscott, who is Senior Vice President, the Fund's other officers are:
Fund Officers
Name,
Address and
Year of Birth | | Position and Year
First Appointed to
Position for any Fund
in the Columbia
Funds Complex or a
Predecessor Thereof | |
Principal Occupation(s) During Past Five Years | |
Christopher O. Petersen
5228 Ameriprise Financial Center
Minneapolis, MN 55474
Born 1970 | | President and Principal Executive Officer (2015) | | Vice President and Lead Chief Counsel, Ameriprise Financial, Inc. since January 2015 (previously, Vice President and Chief Counsel January 2010-December 2014; officer of Columbia Funds and affiliated funds since 2007. | |
Michael G. Clarke
225 Franklin Street
Boston, MA 02110
Born 1969 | | Treasurer (2011), Chief Financial Officer (2009) and Chief Accounting Officer (2015) | | Vice President — Mutual Fund Administration, Columbia Management Investment Advisers, LLC, since May 2010; senior officer of Columbia Funds and affiliated funds since 2002. | |
Paul B. Goucher
100 Park Avenue
New York, NY 10017
Born 1968 | | Senior Vice President (2011), Chief Legal Officer (2015) and Assistant Secretary (2008) | | Vice President and Lead Chief Counsel, Ameriprise Financial, Inc. since November 2008 and January 2013, respectively (previously Chief Counsel, January 2010-January 2013); Vice President, Chief Legal Officer and Assistant Secretary, Columbia Management Investment Advisers, LLC since May 2010. | |
Thomas P. McGuire
225 Franklin Street
Boston, MA 02110
Born 1972 | | Senior Vice President and Chief Compliance Officer (2012) | | Vice President — Asset Management Compliance, Ameriprise Financial, Inc., since May 2010; Chief Compliance Officer, Ameriprise Certificate Company since September 2010. | |
Colin Moore
225 Franklin Street
Boston, MA 02110
Born 1958 | | Senior Vice President (2010) | | Executive Vice President and Global Chief Investment Officer, Ameriprise Financial, Inc., since July 2013; Executive Vice President and Global Chief Investment Officer, Columbia Management Investment Advisers, LLC since July 2013 (previously Director and Global Chief Investment Officer, 2010-2013). | |
Michael E. DeFao
225 Franklin Street
Boston, MA 02110
Born 1968 | | Vice President (2011) and Assistant Secretary (2010) | | Vice President and Chief Counsel, Ameriprise Financial, Inc. since May 2010. | |
Amy Johnson
5228 Ameriprise Financial Center
Minneapolis, MN 55474
Born 1965 | | Vice President (2006) | | Managing Director and Global Head of Operations, Columbia Management Investment Advisers, LLC since April 2016 (previously Managing Director and Chief Operating Officer, 2010-2016). | |
Lyn Kephart-Strong
5228 Ameriprise
Financial Center
Minneapolis, MN 55474
Born 1960 | | Vice President (2015) | | President, Columbia Management Investment Services Corp. since October 2014; Vice President & Resolution Officer, Ameriprise Trust Company since August 2009. | |
Ryan C. Larrenaga
225 Franklin Street
Boston, MA 02110
Born 1970 | | Vice President and Secretary (2015) | | Vice President and Group Counsel, Ameriprise Financial, Inc. since August 2011; officer of Columbia Funds and affiliated funds since 2005. | |
Annual Report 2016
46
COLUMBIA DISCIPLINED SMALL CORE FUND
BOARD CONSIDERATION AND APPROVAL OF MANAGEMENT
AGREEMENT
On June 10, 2016, the Board of Trustees (the Board) and the Trustees who are not interested persons (as defined in the Investment Company Act of 1940) (the Independent Trustees) of Columbia Funds Series Trust I (the Trust) unanimously approved the continuation of the Management Agreement (the Management Agreement) with Columbia Management Investment Advisers, LLC (the Investment Manager) with respect to Columbia Disciplined Small Core Fund (the Fund), a series of the Trust. As detailed below, the Board's Advisory Fees and Expenses Committee (the Committee) and the Board met on multiple occasions to review and discuss, both among themselves and with the management team of the Investment Manager, materials provided by the Investment Manager and others before determining to approve the continuation of the Management Agreement.
In connection with their deliberations regarding the continuation of the Management Agreement, the Committee and the Board evaluated materials requested from the Investment Manager regarding the Fund and the Management Agreement, and discussed these materials with representatives of the Investment Manager at Committee meetings held on March 8, 2016, April 27, 2016 and June 9, 2016 and at Board meetings held on March 9, 2016 and June 10, 2016. In addition, the Board considers matters bearing on the Management Agreement at most of its other meetings throughout the year and meets regularly with senior management of the Trust and the Investment Manager. Through the Board's Investment Oversight Committees, Trustees also meet with selected portfolio managers of the funds the Trustees oversee and other investment personnel at various times throughout the year. The Committee and the Board also consulted with its independent fee consultant, Fund counsel and with the Independent Trustees' independent legal counsel, who advised on various matters with respect to the Committee's and the Board's considerations and otherwise assisted the Committee and the Board in their deliberations. On June 9, 2016, the Committee recommended that the Board approve the continuation of the Management Agreement. On June 10, 2016, the Board, including the Independent Trustees, voting separately, unanimously approved the continuation of the Management Agreement for the Fund.
The Committee and the Board considered all information that they, their legal counsel or the Investment Manager believed reasonably necessary to evaluate and to determine whether to recommend for approval or approve the continuation of the Management Agreement. The information and factors considered by the Committee and the Board in recommending for approval or approving the continuation of the Management Agreement for the Fund included the following:
• Information on the investment performance of the Fund relative to the performance of a group of mutual funds determined to be comparable to the Fund by an independent third-party data provider, as well as performance relative to benchmarks;
• Information on the Fund's management fees and total expenses, including information comparing the Fund's expenses to those of a group of comparable mutual funds, as determined by the independent third-party data provider;
• The Investment Manager's agreement to contractually limit or cap total operating expenses for the Fund through December 31, 2017 so that total operating expenses (excluding certain fees and expenses, such as transaction costs and certain other investment related expenses, interest, taxes, acquired fund fees and expenses, and infrequent and/or unusual expenses) would not exceed a specified annual rate, as a percentage of the Fund's net assets;
• The terms and conditions of the Management Agreement;
• The current and proposed terms and conditions of other agreements and arrangements with affiliates of the Investment Manager relating to the operations of the Fund, including agreements with respect to the provision of distribution and transfer agency services to the Fund;
• Descriptions of various functions performed by the Investment Manager under the Management Agreement, including portfolio management and portfolio trading practices;
• Information regarding the management fees of similarly-managed portfolios of other clients of the Investment Manager, including institutional separate accounts;
Annual Report 2016
47
COLUMBIA DISCIPLINED SMALL CORE FUND
BOARD CONSIDERATION AND APPROVAL OF MANAGEMENT
AGREEMENT (continued)
• Information regarding the reputation, regulatory history and resources of the Investment Manager, including information regarding senior management, portfolio managers and other personnel;
• Information regarding the capabilities of the Investment Manager with respect to compliance monitoring services, including an assessment of the Investment Manager's compliance system by the Fund's Chief Compliance Officer; and
• The profitability to the Investment Manager and its affiliates from their relationships with the Fund.
Nature, Extent and Quality of Services Provided under the Management Agreement
The Committee and the Board considered the nature, extent and quality of services provided to the Fund by the Investment Manager and its affiliates under the Management Agreement and under separate agreements for the provision of transfer agency services, and the resources dedicated to the Fund and the other Columbia Funds by the Investment Manager and its affiliates. The Committee and the Board considered, among other things, the Investment Manager's ability to attract, motivate and retain highly qualified research, advisory and supervisory investment professionals (including personnel and other resources, compensation programs for personnel involved in fund management, reputation and other attributes), the portfolio management services provided by those investment professionals, and the quality of the Investment Manager's investment research capabilities and trade execution services. The Committee and the Board also considered the potential benefits to shareholders of investing in a mutual fund that is part of a fund complex offering exposure to a variety of asset classes and investment disciplines and providing a variety of fund and shareholder services.
The Committee and the Board also considered the professional experience and qualifications of the senior personnel of the Investment Manager, which included consideration of the Investment Manager's experience with similarly-structured funds. The Committee and the Board noted the compliance programs of and the compliance-related resources provided to the Fund by the Investment Manager and its affiliates, and considered the Investment Manager's ability to provide administrative services to the Fund and coordinate the activities of the Fund's other service providers. After reviewing these and related factors, the Committee and the Board concluded, within the context of their overall conclusions, that the nature, extent and quality of the services provided to the Fund under the Management Agreement supported the continuation of the Management Agreement.
Investment Performance
The Committee and the Board reviewed information about the performance of the Fund over various time periods, including performance information relative to benchmarks and information based on reports of the independent third-party data provider that compared the performance of the Fund to the performance of a group of comparable mutual funds, and data provided by the independent fee consultant. The Committee and the Board also reviewed a description of the third party's methodology for identifying the Fund's peer groups for purposes of performance and expense comparisons. Although the Fund's performance lagged that of a relevant peer group for certain (although not necessarily all) periods, the Committee and the Board concluded that other factors relevant to performance were sufficient, in light of other considerations, to warrant continuation of the Management Agreement. Those factors included one or more of the following: (i) that the Fund's performance, although lagging in certain recent periods, was stronger over the longer term; (ii) that the underperformance was attributable, to a significant extent, to investment decisions that were reasonable and consistent with the Fund's investment strategy and policies and that the Fund was performing within a reasonable range of expectations, given those investment decisions, market conditions and the Fund's investment strategy; (iii) that the Fund's performance was competitive when compared to other relevant performance benchmarks or peer groups; and (iv) that the Investment Manager had taken or was taking steps designed to help improve the Fund's investment performance, including, but not limited to, replacing portfolio managers, enhancing the resources supporting the portfolio managers, or modifying investment strategies.
The Committee and the Board noted that, through December 31, 2015, the Fund's performance was in the seventy-ninth, eighty-fifth and eighty-third percentile (where the best performance would be in the first percentile)
Annual Report 2016
48
COLUMBIA DISCIPLINED SMALL CORE FUND
BOARD CONSIDERATION AND APPROVAL OF MANAGEMENT
AGREEMENT (continued)
of its category selected by the independent third-party data provider for the purposes of performance comparisons for the one-, three- and five-year periods, respectively.
The Committee and the Board also considered the Investment Manager's performance and reputation generally, the Investment Manager's historical responsiveness to Board concerns about performance, and the Investment Manager's willingness to take steps intended to improve performance. After reviewing these and related factors, the Committee and the Board concluded, within the context of their overall conclusions, that the performance of the Fund and the Investment Manager was sufficient, in light of other considerations, to warrant the continuation of the Management Agreement.
Investment Management Fee Rates and Other Expenses
The Committee and the Board considered the management fees charged to the Fund under the Management Agreement as well as the total expenses incurred by the Fund. In assessing the reasonableness of the fees under the Management Agreement, the Committee and the Board considered, among other information, the Fund's management fee and its total expense ratio as a percentage of average daily net assets. The Committee and the Board considered data provided by the independent fee consultant. The Committee and the Board noted that, as of December 31, 2015, the Fund's actual management fee and net total expense ratio are both ranked in the third quintile (where the lowest fees and expenses would be in the first quintile) against the Fund's expense universe as determined by the independent third-party data provider for purposes of expense comparison. The Committee and the Board also took into account the fee waiver and expense limitation arrangements agreed to by the Investment Manager, as noted above.
The Committee and the Board also received and considered information about the management fees charged by the Investment Manager to institutional separate accounts. In considering the fees charged to those accounts, the Committee and the Board took into account, among other things, the Investment Manager's representations about the differences between managing mutual funds as compared to other types of accounts, including differences in the services provided, differences in the risk profile of such business for the Investment Manager and the additional resources required to manage mutual funds effectively. The Committee and the Board also received and considered information about the fees charged by the Investment Manager for sub-advisory services provided to comparable unaffiliated funds. In evaluating the Fund's management fees, the Committee and the Board also took into account the demands, complexity and quality of the investment management of the Fund.
After reviewing these and related factors, the Committee and the Board concluded, within the context of their overall conclusions, that the management fee rates and expenses of the Fund were sufficient, in light of other considerations, to warrant the continuation of the Management Agreement.
Costs of Services Provided and Profitability
The Committee and the Board also took note of the costs the Investment Manager and its affiliates incur in connection with the services provided (both on an absolute and relative basis) and the profitability to the Investment Manager and its affiliates in connection with their relationships with the Fund.
The Committee and the Board also considered the compensation directly or indirectly received by the Investment Manager's affiliates in connection with their relationships with the Fund. The Committee and the Board reviewed information provided by management as to the profitability to the Investment Manager and its affiliates of their relationships with the Fund, information about the allocation of expenses used to calculate profitability, and comparisons of profitability levels realized in 2015 to profitability levels realized in 2014. When reviewing profitability, the Committee and the Board also considered court cases in which adviser profitability was an issue in whole or in part, the performance of similarly managed funds, the performance of the Fund, and the expense ratio of the Fund. In addition, the Committee and the Board considered information provided by the Investment Manager regarding the Investment Manager's financial condition and comparing its profitability to that of other asset management firms that are, or are subsidiaries of, publicly traded companies. In this regard, the Committee and the Board also considered data provided by the independent fee consultant.
Annual Report 2016
49
COLUMBIA DISCIPLINED SMALL CORE FUND
BOARD CONSIDERATION AND APPROVAL OF MANAGEMENT
AGREEMENT (continued)
After reviewing these and related factors, the Committee and the Board concluded, within the context of their overall conclusions, that the costs of services provided and the profitability to the Investment Manager and its affiliates from their relationships with the Fund supported the continuation of the Management Agreement.
Economies of Scale
The Committee and the Board considered the potential existence of economies of scale in the provision by the Investment Manager of services to the Fund, to groups of related funds, and to the Investment Manager's investment advisory clients as a whole, and whether those economies of scale were shared with the Fund through breakpoints in investment management fees or other means, such as expense limitation arrangements and additional investments by the Investment Manager in investment, trading and compliance resources. The Committee and the Board noted that the management fee schedules for the Fund contained breakpoints that would reduce the fee rate on assets above specified threshold levels.
In considering these matters, the Committee and the Board also considered the costs of the services provided and the profitability to the Investment Manager and its affiliates from their relationships with the Fund, as discussed above. After reviewing these and related factors, the Committee and the Board concluded, within the context of their overall conclusions, that the extent to which any economies of scale were expected to be shared with the Fund supported the continuation of the Management Agreement.
Other Benefits to the Investment Manager
The Committee and the Board received and considered information regarding "fall-out" or ancillary benefits received by the Investment Manager and its affiliates as a result of their relationships with the Fund, such as the engagement of the Investment Manager's affiliates to provide distribution, transfer agency and shareholder services to the Fund. In this regard, among other matters, the Committee and the Board considered that the Fund's distributor retains a portion of the distribution fees from the Fund and receives a portion of the sales charges on sales or redemptions of certain classes of shares of the Fund. The Committee and the Board also considered the benefits of research made available to the Investment Manager by reason of brokerage commissions generated by the Fund's securities transactions, and reviewed information about the Investment Manager's practices with respect to allocating portfolio transactions for brokerage and research services. The Committee and the Board considered the possible conflicts of interest associated with certain fall-out or other ancillary benefits and the reporting, disclosure and other processes that are in place to address such possible conflicts of interest. The Committee and the Board recognized that the Investment Manager's profitability would be somewhat lower without these benefits.
Conclusion
The Committee and the Board reviewed all of the above considerations in reaching their decisions to recommend or approve the continuation of the Management Agreement. In their deliberations, the Trustees did not identify any particular information that was all-important or controlling, and individual Trustees may have attributed different weights to the various factors. Based on their evaluation of all factors that they deemed to be material, including those factors described above, and assisted by the advice of independent legal counsel, the Board, including the Independent Trustees, voting separately, unanimously approved the continuation of the Management Agreement.
Annual Report 2016
50
COLUMBIA DISCIPLINED SMALL CORE FUND
IMPORTANT INFORMATION ABOUT THIS REPORT
Each fund mails one shareholder report to each shareholder address. If you would like more than one report, please call shareholder services at 800.345.6611 and additional reports will be sent to you.
The policy of the Board is to vote the proxies of the companies in which each fund holds investments consistent with the procedures as stated in the Statement of Additional Information (SAI). You may obtain a copy of the SAI without charge by calling 800.345.6611; contacting your financial intermediary; visiting investor.columbiathreadneedleus.com; or searching the website of the Securities and Exchange Commission (SEC) at sec.gov. Information regarding how each fund voted proxies relating to portfolio securities is filed with the SEC by August 31st for the most recent 12-month period ending June 30th of that year, and is available without charge by visiting investor.columbiathreadneedleus.com, or searching the website of the SEC at sec.gov.
Each fund files a complete schedule of portfolio holdings with the SEC for the first and third quarters of each fiscal year on Form N-Q. Each fund's Form N-Q is available on the SEC's website at sec.gov and may be reviewed and copied at the SEC's Public Reference Room in Washington, D.C. Information on the operation of the Public Reference Room may be obtained by calling 800.SEC.0330. Each fund's complete schedule of portfolio holdings, as filed on Form N-Q, can also be obtained without charge, upon request, by calling 800.345.6611.
Annual Report 2016
51
Columbia Disciplined Small Core Fund
P.O. Box 8081
Boston, MA 02266-8081

Please read and consider the investment objectives, risks, charges and expenses for any fund carefully before investing. For a prospectus and summary prospectus, which contains this and other important information about the Fund, go to investor.columbiathreadneedleus.com. The Fund is distributed by Columbia Management Investment Distributors, Inc., member FINRA, and managed by Columbia Management Investment Advisers, LLC.
Columbia Threadneedle Investments (Columbia Threadneedle) is the global brand name of the Columbia and Threadneedle group of companies.
All rights reserved. Columbia Management Investment Distributors, Inc., 225 Franklin Street, Boston, MA 02110-2804
© 2016 Columbia Management Investment Advisers, LLC.
investor.columbiathreadneedleus.com
ANN225_08_F01_(10/16)

ANNUAL REPORT
August 31, 2016

COLUMBIA GLOBAL DIVIDEND OPPORTUNITY FUND

 Dear Shareholders,
Volatility comes with the territory for long-term investors. Some investors instinctively want to pull out of the market or sell underperforming investments at the first sign of increased volatility or perhaps even as soon as they perceive it on the horizon. But taking yourself out of the market could mean losing out on potential opportunities, and putting your longer term investment goals at risk.
Cumulative return is not just about achieving high returns when markets are going up; it's also about remaining invested and minimizing losses during weak or volatile markets so that you can participate on the upside. Developing a deeper understanding of the various risks your portfolio is subject to can help you balance these risks.
Diversification is critical in seeking to achieve that balance. We believe that most portfolios could be more effectively diversified either by introducing holdings with performance profiles unrelated to existing holdings (like alternative products) or by rebalancing existing holdings with an eye toward risk allocation. Over time, distributing risk more evenly may produce a more pronounced diversification benefit and may improve portfolio efficiency. We believe market volatility can create significant opportunities and, in fact, these periods may be some of the very best times to invest.
With this in mind, I thought it important to highlight excerpts from a piece written by Colin Moore, Global Chief Investment Officer, in which he touches on some of these issues emphasizing the importance of a properly constructed portfolio in seeking to effectively manage volatility and to achieve consistency of returns. I encourage you to read the article in its entirety. To access the full article and for other insights on current market, please visit blog.columbiathreadneedleus.com/latest-perspectives.
You need investments that are designed to help you ease the impact of volatile market environments and keep the savings you have worked tirelessly to amass. Columbia Threadneedle Investments provides investment solutions to help you tackle financial challenges and achieve your desired outcome.
Best regards,

Christopher O. Petersen
President, Columbia Funds
Excerpts from:
Taking the scare out of the volatility bogeyman
By Colin Moore, Global Chief Investment Officer
Colin Moore is the global chief investment officer for Columbia Threadneedle Investments. His responsibilities include ensuring that a disciplined investment process is in place across all asset classes, including equity and fixed income. Mr. Moore joined one of the Columbia Threadneedle Investments legacy firms in 2002 as head of equity and was also head of fixed income and liquidity strategies from 2009 – 2010.

n In today's low growth, higher volatility world, the emphasis is shifting from maximization of returns to consistency of returns.
PRESIDENT'S MESSAGE (continued)
n Portfolios should represent the behavioral risk-return tradeoff of investors, remembering that they won't stay invested to realize the return if we get the risk tolerance wrong.
n Holding long-term savings in cash to avoid volatility (the financial equivalent of hiding under the sheets) is detrimental to achieving long-term goals.
According to Wikipedia, "The bogeyman is a common allusion to a mythical creature in many cultures used to control behavior. This monster has no specific appearance, and conceptions about it can vary drastically from household to household within the same community; in many cases he has no set appearance in the mind of an adult or child, but is simply a non-specific embodiment of terror." Different cultures have different names and physical representations for the bogeyman, and investors are no different. We have terrible monsters that we fear may destroy our portfolios, and we call one of the scariest of them volatility.
While the bogeyman is mythical (I hope!), volatility is real and can cause serious damage. To understand why investors have such a hard time coping with volatility, we first need to define three cognitive biases at work in today's investment environment:
1) Recency bias — something that has recently come to the forefront of our attention, regardless of how long established it is, suddenly seems to appear with improbable frequency.
2) Negativity bias — we tend to have a greater recall of unpleasant memories than positive memories.
3) Loss aversion — our dissatisfaction with losing money tends to be greater than our satisfaction with making money.
The level of volatility varies dramatically, and so does investor fear and panic selling — waxing when volatility rises, waning when it falls. Recent studies have pointed to demographics as an important driver of panic selling. The theory is that as people get closer to retirement, the prospects of a large (20% – 30%) loss in financial assets can have a much more pronounced effect on their sense of well-being. Wealth preservation instincts kick in much more quickly than for younger (and typically less wealthy) savers.
The reality is that there is little opportunity for return without volatility. Therefore, the bogeyman effect of holding long-term savings in cash to avoid volatility (the financial equivalent of hiding under the sheets) is detrimental to achieving long-term goals. This effect tends to be more pronounced during the episodic spikes in volatility. The significant spike in volatility in 2008 and 2009 led to significant withdrawals from long-term investment funds over the same period. Less pronounced effects can also be seen when comparing 2001 – 2003 and 2011 – 2012. Conversely, flows picked up when volatility returned to "normal" levels. Investor behavior of this type is consistent with the three behavioral biases.
I believe average volatility will be higher over the next 10 years than the last 10 years and episodic spikes will increase in frequency because sustainable economic growth will be structurally lower and geopolitical risk higher than any time since World War II. Low growth creates uncertainty while loss aversion will make investors fear that we are one economic mishap or geopolitical event away from no growth or recession. The result will be higher volatility on average. Negativity bias will tend to exacerbate "spike" reactions to event-driven geopolitical news, and the volatility bogeyman will appear more often. Assuming the behavioral biases continue, investor returns are likely to be very disappointing regardless of the total return generated by financial markets due to the bogeyman effect.
To mitigate this effect, we need to focus on portfolio construction and an improved understanding of diversification. I accept that equities are likely to offer the highest return over the next 10 years, but they also offer the highest volatility. Many portfolio construction optimization tools use historical average volatility, which is likely to underestimate the volatility investors will face. The bogeyman emerges when individual asset class volatility spikes and cross correlations rise, the combination of which increases overall portfolio volatility far beyond expectation. Diversification is meant to protect investors against volatility, but what's the point of owning lots of investments if the volatility bogeyman has not been properly estimated?
Most importantly, portfolios should be constructed to properly represent the behavioral risk-return trade off of investors, remembering that they won't stay invested to realize the return if we get the risk tolerance wrong. In a low growth, higher volatility world, the emphasis is shifting to return consistency rather than return maximization,
PRESIDENT'S MESSAGE (continued)
and investors are best served through investment approaches that appreciate that distinction. Even though it's a permanent feature of financial markets, volatility is less likely to be the bogeyman we all fear if portfolios are constructed with this understanding.
Please visit blog.columbiathreadneedleus.com/latest-perspectives to read the entire article.
Investors should consider the investment objectives, risks, charges and expenses of a mutual fund carefully before investing. For a free prospectus and summary prospectus, which contains this and other important information about a fund, visit investor.columbiathreadneedleus.com. The prospectus should be read carefully before investing.
The views expressed are as of April 2016, may change as market or other conditions change, and may differ from views expressed by other Columbia Management Investment Advisers, LLC (CMIA) associates or affiliates. Actual investments or investment decisions made by CMIA and its affiliates, whether for its own account or on behalf of clients, will not necessarily reflect the views expressed. This information is not intended to provide investment advice and does not account for individual investor circumstances. Investment decisions should always be made based on an investor's specific financial needs, objectives, goals, time horizon and risk tolerance. Asset classes described may not be suitable for all investors.
Past performance does not guarantee future results, and no forecast should be considered a guarantee either. Since economic and market conditions change frequently, there can be no assurance that the trends described here will continue or that the forecasts are accurate.
Diversification does not guarantee a profit or protect against loss.
Columbia Funds are distributed by Columbia Management Investment Distributors, Inc., member FINRA, and managed by Columbia Management Investment Advisers, LLC.
© 2016 Columbia Management Investment Advisers, LLC. All rights reserved.
COLUMBIA GLOBAL DIVIDEND OPPORTUNITY FUND
Performance Overview | | | 2 | | |
Manager Discussion of Fund Performance | | | 4 | | |
Understanding Your Fund's Expenses | | | 7 | | |
Portfolio of Investments | | | 8 | | |
Statement of Assets and Liabilities | | | 12 | | |
Statement of Operations | | | 14 | | |
Statement of Changes in Net Assets | | | 15 | | |
Financial Highlights | | | 18 | | |
Notes to Financial Statements | | | 28 | | |
Report of Independent Registered Public Accounting Firm | | | 36 | | |
Federal Income Tax Information | | | 37 | | |
Trustees and Officers | | | 38 | | |
Board Consideration and Approval of Management Agreement | | | 43 | | |
Important Information About This Report | | | 47 | | |
Fund Investment Manager
Columbia Management Investment
Advisers, LLC
225 Franklin Street
Boston, MA 02110
Fund Distributor
Columbia Management Investment
Distributors, Inc.
225 Franklin Street
Boston, MA 02110
Fund Transfer Agent
Columbia Management Investment
Services Corp.
P.O. Box 8081
Boston, MA 02266-8081
For more information about any of the funds, please visit investor.columbiathreadneedleus.com or call 800.345.6611. Customer Service Representatives are available to answer your questions Monday through Friday from 8 a.m. to 7 p.m. Eastern time.
The views expressed in this report reflect the current views of the respective parties. These views are not guarantees of future performance and involve certain risks, uncertainties and assumptions that are difficult to predict, so actual outcomes and results may differ significantly from the views expressed. These views are subject to change at any time based upon economic, market or other conditions and the respective parties disclaim any responsibility to update such views. These views may not be relied on as investment advice and, because investment decisions for a Columbia fund are based on numerous factors, may not be relied on as an indication of trading intent on behalf of any particular Columbia fund. References to specific securities should not be construed as a recommendation or investment advice.
COLUMBIA GLOBAL DIVIDEND OPPORTUNITY FUND
Performance Summary
n Columbia Global Dividend Opportunity Fund (the Fund) Class A shares returned 5.51% excluding sales charges for the 12-month period that ended August 31, 2016.
n During the same time period, the Fund underperformed its benchmark, the MSCI ACWI High Dividend Yield Index (Net), which returned 10.31%, and the broader-based MSCI ACWI (Net), which returned 7.24%, for the same period.
n While generating solid absolute returns, the Fund's results relative to the MSCI ACWI High Dividend Yield Index (Net) were hurt by stock selection and sector allocation overall. During the period, country allocation had a modestly positive effect.
Average Annual Total Returns (%) (for period ended August 31, 2016)
| | | Inception | | 1 Year | | 5 Years | | 10 Years | |
Class A | | 11/01/02 | | | | | | | | | | | | | |
Excluding sales charges | | | | | | | 5.51 | | | | 6.28 | | | | 3.82 | | |
Including sales charges | | | | | | | -0.55 | | | | 5.03 | | | | 3.21 | | |
Class B | | 11/01/02 | | | | | | | | | | | | | |
Excluding sales charges | | | | | | | 4.76 | | | | 5.48 | | | | 3.05 | | |
Including sales charges | | | | | | | -0.24 | | | | 5.17 | | | | 3.05 | | |
Class C | | 10/13/03 | | | | | | | | | | | | | |
Excluding sales charges | | | | | | | 4.82 | | | | 5.50 | | | | 3.05 | | |
Including sales charges | | | | | | | 3.82 | | | | 5.50 | | | | 3.05 | | |
Class I* | | 09/27/10 | | | 6.08 | | | | 6.76 | | | | 4.21 | | |
Class R* | | 09/27/10 | | | 5.32 | | | | 6.02 | | | | 3.56 | | |
Class R4* | | 03/19/13 | | | 5.80 | | | | 6.56 | | | | 4.09 | | |
Class R5* | | 01/08/14 | | | 5.96 | | | | 6.66 | | | | 4.13 | | |
Class W* | | 09/27/10 | | | 5.59 | | | | 6.32 | | | | 3.89 | | |
Class Y* | | 07/15/09 | | | 6.07 | | | | 6.77 | | | | 4.23 | | |
Class Z | | 11/09/00 | | | 5.82 | | | | 6.56 | | | | 4.09 | | |
MSCI ACWI High Dividend Yield Index (Net) | | | | | | | 10.31 | | | | 7.00 | | | | 3.97 | | |
MSCI ACWI (Net) | | | | | | | 7.24 | | | | 8.32 | | | | 4.40 | | |
Returns for Class A are shown with and without the maximum initial sales charge of 5.75%. Returns for Class B are shown with and without the applicable contingent deferred sales charge (CDSC) of 5.00% in the first year, declining to 1.00% in the sixth year and eliminated thereafter. Returns for Class C are shown with and without the 1.00% CDSC for the first year only. The Fund's other classes are not subject to sales charges and have limited eligibility. Please see the Fund's prospectus for details. Performance for different share classes will vary based on differences in sales charges and fees associated with each class. All results shown assume reinvestment of distributions during the period. Returns do not reflect the deduction of taxes that a shareholder may pay on Fund distributions or on the redemption of Fund shares. Performance results reflect the effect of any fee waivers or reimbursements of Fund expenses by Columbia Management Investment Advisers, LLC and/or any of its affiliates. Absent these fee waivers or expense reimbursement arrangements, performance results would have been lower.
The performance information shown represents past performance and is not a guarantee of future results. The investment return and principal value of your investment will fluctuate so that your shares, when redeemed, may be worth more or less than their original cost. Current performance may be lower or higher than the performance information shown. You may obtain performance information current to the most recent month-end by contacting your financial intermediary, visiting investor.columbiathreadneedleus.com or calling 800.345.6611.
*The returns shown for periods prior to the share class inception date (including returns for the Life of the Fund, if shown, which are since Fund inception) include the returns of the Fund's oldest share class. These returns are adjusted to reflect any higher class-related operating expenses of the newer share classes, as applicable. Please visit investor.columbiathreadneedleus.com/investment-products/mutual-funds/appended-performance for more information.
The MSCI ACWI High Dividend Yield (Net) includes large and mid-cap stocks across 23 developed market countries. The index is designed to reflect the performance of equities selected from the MSCI World Index with higher than average dividend yields that are both sustainable and persistent.
The MSCI ACWI (Net) is a free float-adjusted market capitalization weighted index that is designed to measure the equity market performance of developed and emerging markets. The index consists of 45 country indices comprising 24 developed and 21 emerging market country indices.
Indices are not available for investment, are not professionally managed and do not reflect sales charges, fees, brokerage commissions, taxes (except the MSCI ACWI High Dividend Yield (Net) and the MSCI ACWI (Net) which reflects reinvested dividends net of withholding taxes) or other expenses of investing. Securities in the Fund may not match those in an index.
Annual Report 2016
2
COLUMBIA GLOBAL DIVIDEND OPPORTUNITY FUND
PERFORMANCE OVERVIEW (continued)
Performance of a Hypothetical $10,000 Investment (September 1, 2006 – August 31, 2016)
The chart above shows the change in value of a hypothetical $10,000 investment in Class A shares of Columbia Global Dividend Opportunity Fund during the stated time period, and does not reflect the deduction of taxes that a shareholder may pay on Fund distributions or on the redemption of Fund shares.
Annual Report 2016
3
COLUMBIA GLOBAL DIVIDEND OPPORTUNITY FUND
MANAGER DISCUSSION OF FUND PERFORMANCE
Portfolio Management
Stephen Thornber, CFA
Jonathan Crown
Morningstar Style BoxTM
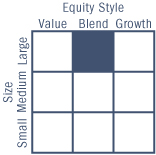
The Morningstar Style BoxTM is based on a fund's portfolio holdings. For equity funds, the vertical axis shows the market capitalization of the stocks owned, and the horizontal axis shows investment style (value, blend, or growth). Information shown is based on the most recent data provided by Morningstar.
© 2016 Morningstar, Inc. All rights reserved. The Morningstar information contained herein: (1) is proprietary to Morningstar and/or its content providers; (2) may not be copied or distributed; and (3) is not warranted to be accurate, complete or timely. Neither Morningstar nor its content providers are responsible for any damages or losses arising from any use of this information.
For the 12-month period that ended August 31, 2016, the Fund's Class A shares returned 5.51% excluding sales charges. During the same time period, the Fund underperformed its benchmark, the MSCI ACWI High Dividend Yield Index (Net), which returned 10.31%, as well as the broader-based MSCI ACWI (Net), which returned 7.24%. While generating solid absolute returns, the Fund's results relative to the MSCI ACWI High Dividend Yield Index (Net) were hurt by stock selection and sector allocation overall. During the period, country allocation had a modestly positive effect.
Global Equity Markets Gained Despite Softening Economic Expectations
Global equity markets moved higher during the period, as valuation multiples rose despite softening corporate earnings and economic growth expectations. However, this gradual climb was punctuated by a number of pullbacks in the market. For example, in September 2015, the global equity markets sold off, as the U.S. Federal Reserve (the Fed) opted to not raise interest rates given weakness in China. China had revised its currency peg, driving market concerns about the health of its economy and any potential deflationary pulse this could unleash. At the start of 2016, the sharp downturn in stocks stemmed from concerns about slowing economic growth in China, weakness in energy prices and uncertainty regarding U.S. economic growth and the direction of the Fed's interest rate policy. In late June 2016, the global equity market sold off temporarily after the United Kingdom's vote about membership in the European Union resulted in a surprise "leave" vote, popularly known as Brexit.
Within the MSCI ACWI High Dividend Yield Index (Net), we believe the U.S. was the best performing major market during the period, with some emerging markets, such as Indonesia and Taiwan, also outperforming. The MSCI ACWI High Dividend Yield Index (Net) constituents from the major European countries struggled during the period, as economic growth fears were elevated. Japan also underperformed the MSCI ACWI High Dividend Yield Index (Net), amid a negative interest rate policy environment. From a sector perspective, information technology and consumer staples were the best performers in the MSCI ACWI High Dividend Yield Index (Net) during the period, as investors focused on secular and defensive growth in a low economic growth world. Conversely, the more macro-sensitive sectors of consumer discretionary and financials lagged. Toward the end of the period, the more cyclical sectors began to perform better, as relative valuations were stretched and the market gained greater confidence in the global economic outlook.
Energy Sector Hampered Results Most
Having an underweight allocation to and weak stock selection in the energy sector, which outpaced the MSCI ACWI High Dividend Yield Index (Net) during the period, detracted most from the Fund's results. In particular, having a position in the integrated energy company Suncor Energy hurt. The Fund's results were also hurt by having an overweight allocation to and weak stock selection in consumer staples. From a
Annual Report 2016
4
COLUMBIA GLOBAL DIVIDEND OPPORTUNITY FUND
MANAGER DISCUSSION OF FUND PERFORMANCE (continued)
country perspective, stock selection in the United States and the U.K. detracted most.
Since the new team assumed portfolio management responsibilities in mid-January 2016, underweights and weak stock selection in energy and industrials detracted most. Having an overweight to the consumer discretionary sector also dampened returns, with holdings in German tourism service provider Tui and U.S. specialty apparel retailer L Brands as particular disappointments. Tui's shares declined on concerns that heightened geopolitical tensions and terrorist activities might result in fewer tourist bookings. L Brands' shares fell as the market reacted negatively to news that Victoria's Secret, one of the company's primary business lines, planned to exit swimwear and reduce promotions. U.K. telecommunications provider BT Group also detracted, as the company suffered from heightened regulatory concerns over the future of its Openreach subsidiary and an increased pension burden post-Brexit, as U.K. government bond yields fell sharply. Stock selection in Canada, Mexico and the U.K. detracted most from a country perspective.
Utilities and Health Care Positioning Aided Fund Results
Both effective stock selection and positioning in the utilities and health care sectors aided the Fund's results most during the period. Since the new team assumed portfolio management responsibilities, stock selection in utilities and health care contributed most positively to the Fund's relative performance. From a country perspective, positioning in Switzerland, France and Brazil was most beneficial to Fund results both for the period as a whole and for the period from mid-January 2016 to the end of August 2016.
During the 12-month period, communications equipment manufacturer Cisco Systems was one of the biggest contributors to Fund results. The company delivered several good quarters of top-line growth and increasing gross margins. Another position that performed particularly well since the new team assumed management was Kroton, a Brazilian for-profit education provider, which benefited from a recovery in sentiment on the Brazilian market, better-than-expected student enrollment and a well-received takeover offer.
New Portfolio Management Team Drove Country and Sector Weighting Changes
Having assumed management of the Fund in mid-January 2016, we focused on what we call our "quality income" stock selection strategy, seeking companies that pay a high dividend yield, where that dividend stream is growing and sustainable. We looked for companies with what we consider to be a good business model and allocate capital well. We also strove to invest across a broadly diversified spectrum of sectors and stock type so that "quality income" characteristics drive performance rather than any short-lived bias of investor sentiment. In implementing this strategy, the Fund's allocations to consumer discretionary and materials increased, while its exposures to energy, utilities and telecommunication services decreased relative to the MSCI ACWI High Dividend Yield Index (Net). Among the most significant purchases for the
Top Ten Holdings (%)
(at August 31, 2016) | |
Reynolds American, Inc.
(United States) | | | 2.8 | | |
Cisco Systems, Inc.
(United States) | | | 2.7 | | |
Pfizer, Inc. (United States) | | | 2.6 | | |
Royal Dutch Shell PLC,
Class A (United Kingdom) | | | 2.3 | | |
CME Group, Inc. (United States) | | | 2.2 | | |
Novartis AG, ADR (Switzerland) | | | 2.2 | | |
JPMorgan Chase & Co.
(United States) | | | 2.2 | | |
L Brands, Inc. (United States) | | | 2.1 | | |
Unilever NV-CVA (Netherlands) | | | 2.1 | | |
Enterprise Products
Partners LP (United States) | | | 1.8 | | |
Percentages indicated are based upon total investments (excluding Money Market Funds).
For further detail about these holdings, please refer to the section entitled "Portfolio of Investments."
Fund holdings are as of the date given, are subject to change at any time, and are not recommendations to buy or sell any security.
Country Breakdown (%)
(at August 31, 2016) | |
Australia | | | 6.1 | | |
Brazil | | | 2.2 | | |
Canada | | | 5.2 | | |
Finland | | | 0.7 | | |
Germany | | | 4.6 | | |
Hong Kong | | | 1.3 | | |
Japan | | | 3.8 | | |
Mexico | | | 2.8 | | |
Netherlands | | | 3.4 | | |
Norway | | | 1.0 | | |
South Africa | | | 0.4 | | |
Spain | | | 0.8 | | |
Switzerland | | | 3.1 | | |
Taiwan | | | 3.1 | | |
United Kingdom | | | 14.9 | | |
United States(a) | | | 46.6 | | |
Total | | | 100.0 | | |
Country Breakdown is based primarily on issuer's place of organization/incorporation. Percentages indicated are based upon total investments. The Fund's portfolio composition is subject to change.
(a) Includes investments in Money Market Funds.
Annual Report 2016
5
COLUMBIA GLOBAL DIVIDEND OPPORTUNITY FUND
MANAGER DISCUSSION OF FUND PERFORMANCE (continued)
Equity Sector Breakdown (%)
(at August 31, 2016) | |
Consumer Discretionary | | | 11.4 | | |
Consumer Staples | | | 14.9 | | |
Energy | | | 8.1 | | |
Financials | | | 23.6 | | |
Health Care | | | 10.6 | | |
Industrials | | | 5.8 | | |
Information Technology | | | 9.3 | | |
Materials | | | 8.0 | | |
Telecommunication Services | | | 5.0 | | |
Utilities | | | 3.3 | | |
Total | | | 100.0 | | |
Percentages indicated are based upon total equity investments. The Fund's portfolio composition is subject to change.
Investment Risks
Market risk may affect a single issuer, sector of the economy, industry or the market as a whole. International investing involves certain risks and volatility due to potential political, economic or currency instabilities and different financial and accounting standards. Risks are enhanced for emerging market issuers. Value securities may be unprofitable if the market fails to recognize their intrinsic worth or the portfolio manager misgauged that worth. Investing in derivatives is a specialized activity that involves special risks, which may result in significant losses or limited gains. See the Fund's prospectus for information on these and other risks.
Fund were Taiwanese integrated circuit manufacturer Taiwan Semiconductor, U.S. bank BB&T and U.K. financial services holding company St. James Place. Among the most significant sales for the Fund were U.K. consumer goods company Imperial Brands, U.S. oil pipeline transportation company Plains All American Pipeline and U.S. home and office furnishings engineer Leggett & Platt. From a country perspective, we increased the Fund's exposure to Japan, Mexico, Australia, Brazil, Taiwan and the U.K. and reduced its exposure to the U.S., France and Switzerland relative to the MSCI ACWI High Dividend Yield Index (Net). The transition of the Fund's portfolio during the period to our "quality income" stock selection strategy resulted in a higher portfolio turnover (115%) than previous reporting periods.
At the end of the period, the Fund was most overweight in the financials, materials and consumer discretionary sectors and most underweight the energy, information technology, utilities, industrials, health care and consumer staples sectors relative to the benchmark. By country, the Fund was most overweight the U.K., Australia, Mexico and the U.S. and was most underweight Switzerland, France and Hong Kong relative to the MSCI ACWI High Dividend Yield Index (Net).
Annual Report 2016
6
COLUMBIA GLOBAL DIVIDEND OPPORTUNITY FUND
UNDERSTANDING YOUR FUND'S EXPENSES
(Unaudited)
As an investor, you incur two types of costs. There are transaction costs, which generally include sales charges on purchases and may include redemption fees. There are also ongoing costs, which generally include management fees, distribution and/or service fees, and other fund expenses. The following information is intended to help you understand your ongoing costs (in dollars) of investing in the Fund and to help you compare these costs with the ongoing costs of investing in other mutual funds.
Analyzing Your Fund's Expenses
To illustrate these ongoing costs, we have provided examples and calculated the expenses paid by investors in each share class of the Fund during the period. The actual and hypothetical information in the table is based on an initial investment of $1,000 at the beginning of the period indicated and held for the entire period. Expense information is calculated two ways and each method provides you with different information. The amount listed in the "Actual" column is calculated using the Fund's actual operating expenses and total return for the period. You may use the Actual information, together with the amount invested, to estimate the expenses that you paid over the period. Simply divide your account value by $1,000 (for example, an $8,600 account value divided by $1,000 = 8.6), then multiply the results by the expenses paid during the period under the "Actual" column. The amount listed in the "Hypothetical" column assumes a 5% annual rate of return before expenses (which is not the Fund's actual return) and then applies the Fund's actual expense ratio for the period to the hypothetical return. You should not use the hypothetical account values and expenses to estimate either your actual account balance at the end of the period or the expenses you paid during the period. See "Compare With Other Funds" below for details on how to use the hypothetical data.
Compare With Other Funds
Since all mutual funds are required to include the same hypothetical calculations about expenses in shareholder reports, you can use this information to compare the ongoing cost of investing in the Fund with other funds. To do so, compare the hypothetical example with the 5% hypothetical examples that appear in the shareholder reports of other funds. As you compare hypothetical examples of other funds, it is important to note that hypothetical examples are meant to highlight the ongoing costs of investing in a fund only and do not reflect any transaction costs, such as sales charges, or redemption or exchange fees. Therefore, the hypothetical calculations are useful in comparing ongoing costs only, and will not help you determine the relative total costs of owning different funds. If transaction costs were included in these calculations, your costs would be higher.
March 1, 2016 – August 31, 2016
| | | Account Value at the Beginning
of the Period ($) | | Account Value at the End of the
Period ($) | | Expenses Paid During the
Period ($) | | Fund's Annualized
Expense Ratio (%) | |
| | | Actual | | Hypothetical | | Actual | | Hypothetical | | Actual | | Hypothetical | | Actual | |
Class A | | | 1,000.00 | | | | 1,000.00 | | | | 1,105.00 | | | | 1,018.60 | | | | 6.88 | | | | 6.60 | | | | 1.30 | | |
Class B | | | 1,000.00 | | | | 1,000.00 | | | | 1,101.50 | | | | 1,014.83 | | | | 10.83 | | | | 10.38 | | | | 2.05 | | |
Class C | | | 1,000.00 | | | | 1,000.00 | | | | 1,101.40 | | | | 1,014.83 | | | | 10.83 | | | | 10.38 | | | | 2.05 | | |
Class I | | | 1,000.00 | | | | 1,000.00 | | | | 1,108.80 | | | | 1,020.96 | | | | 4.40 | | | | 4.22 | | | | 0.83 | | |
Class R | | | 1,000.00 | | | | 1,000.00 | | | | 1,103.80 | | | | 1,017.34 | | | | 8.20 | | | | 7.86 | | | | 1.55 | | |
Class R4 | | | 1,000.00 | | | | 1,000.00 | | | | 1,106.80 | | | | 1,019.86 | | | | 5.56 | | | | 5.33 | | | | 1.05 | | |
Class R5 | | | 1,000.00 | | | | 1,000.00 | | | | 1,107.80 | | | | 1,020.71 | | | | 4.66 | | | | 4.47 | | | | 0.88 | | |
Class W | | | 1,000.00 | | | | 1,000.00 | | | | 1,105.10 | | | | 1,018.60 | | | | 6.88 | | | | 6.60 | | | | 1.30 | | |
Class Y | | | 1,000.00 | | | | 1,000.00 | | | | 1,107.90 | | | | 1,020.96 | | | | 4.40 | | | | 4.22 | | | | 0.83 | | |
Class Z | | | 1,000.00 | | | | 1,000.00 | | | | 1,106.70 | | | | 1,019.86 | | | | 5.56 | | | | 5.33 | | | | 1.05 | | |
Expenses paid during the period are equal to the annualized expense ratio for each class as indicated above, multiplied by the average account value over the period and then multiplied by the number of days in the Fund's most recent fiscal half year and divided by 366.
Expenses do not include fees and expenses incurred indirectly by the Fund from its investment in underlying funds, including affiliated and non-affiliated pooled investment vehicles, such as mutual funds and exchange-traded funds.
Had Columbia Management Investment Advisers, LLC and/or certain of its affiliates not waived/reimbursed certain fees and expenses, account value at the end of the period would have been reduced.
Annual Report 2016
7
COLUMBIA GLOBAL DIVIDEND OPPORTUNITY FUND
PORTFOLIO OF INVESTMENTS
August 31, 2016
(Percentages represent value of investments compared to net assets)
Common Stocks 95.8%
Issuer | | Shares | | Value ($) | |
AUSTRALIA 6.0% | |
Amcor Ltd. | | | 660,003 | | | | 7,925,509 | | |
AMP Ltd. | | | 1,450,766 | | | | 5,726,805 | | |
DuluxGroup Ltd. | | | 1,351,293 | | | | 6,500,858 | | |
Goodman Group | | | 1,572,976 | | | | 8,956,534 | | |
Sydney Airport | | | 1,414,259 | | | | 7,728,653 | | |
Total | | | | | 36,838,359 | | |
BRAZIL 2.2% | |
Ambev SA | | | 1,319,300 | | | | 7,803,366 | | |
Kroton Educacional SA | | | 1,254,100 | | | | 5,336,100 | | |
Total | | | | | 13,139,466 | | |
CANADA 5.1% | |
Agrium, Inc. | | | 70,231 | | | | 6,767,459 | | |
DH Corp. | | | 147,551 | | | | 3,340,544 | | |
National Bank of Canada | | | 194,182 | | | | 6,824,652 | | |
Suncor Energy, Inc. | | | 252,671 | | | | 6,851,442 | | |
TransCanada Corp. | | | 167,620 | | | | 7,601,312 | | |
Total | | | | | 31,385,409 | | |
FINLAND 0.7% | |
Sampo OYJ, Class A | | | 102,001 | | | | 4,379,278 | | |
GERMANY 4.6% | |
BASF SE | | | 100,134 | | | | 8,142,528 | | |
Daimler AG, Registered Shares | | | 79,437 | | | | 5,500,786 | | |
Deutsche Telekom AG, Registered Shares | | | 462,095 | | | | 7,716,196 | | |
ProSiebenSat.1 Media AG | | | 157,108 | | | | 6,757,492 | | |
Total | | | | | 28,117,002 | | |
HONG KONG 1.2% | |
HKT Trust & HKT Ltd. | | | 5,447,000 | | | | 7,513,055 | | |
JAPAN 3.8% | |
Aozora Bank Ltd. | | | 1,825,000 | | | | 6,463,723 | | |
Canon, Inc. | | | 164,900 | | | | 4,728,620 | | |
ITOCHU Techno-Solutions Corp. | | | 62,100 | | | | 1,517,589 | | |
Japan Hotel REIT Investment Corp. | | | 5,524 | | | | 4,751,033 | | |
Japan Retail Fund Investment Corp. | | | 2,572 | | | | 5,782,574 | | |
Total | | | | | 23,243,539 | | |
Common Stocks (continued)
Issuer | | Shares | | Value ($) | |
MEXICO 2.8% | |
Kimberly-Clark de Mexico SAB de CV | | | 3,937,000 | | | | 9,416,151 | | |
Wal-Mart de Mexico SAB de CV, Class V | | | 3,304,900 | | | | 7,549,378 | | |
Total | | | | | 16,965,529 | | |
NETHERLANDS 3.4% | |
LyondellBasell Industries NV, Class A | | | 104,674 | | | | 8,257,732 | | |
Unilever NV-CVA | | | 269,851 | | | | 12,375,835 | | |
Total | | | | | 20,633,567 | | |
NORWAY 1.0% | |
Telenor ASA | | | 353,086 | | | | 6,165,313 | | |
SOUTH AFRICA 0.4% | |
SPAR Group Ltd. (The) | | | 201,295 | | | | 2,628,801 | | |
SPAIN 0.8% | |
Ferrovial SA | | | 245,727 | | | | 4,841,910 | | |
SWITZERLAND 3.1% | |
Novartis AG, ADR | | | 165,569 | | | | 13,041,870 | | |
UBS AG | | | 388,880 | | | | 5,622,362 | | |
Total | | | | | 18,664,232 | | |
TAIWAN 3.1% | |
Pegatron Corp. | | | 3,407,000 | | | | 8,220,337 | | |
Taiwan Semiconductor Manufacturing
Co., Ltd. | | | 1,935,000 | | | | 10,745,792 | | |
Total | | | | | 18,966,129 | | |
UNITED KINGDOM 14.8% | |
AstraZeneca PLC | | | 162,962 | | | | 10,504,938 | | |
BAE Systems PLC | | | 1,270,905 | | | | 8,986,962 | | |
British American Tobacco PLC | | | 169,770 | | | | 10,533,601 | | |
BT Group PLC | | | 1,701,561 | | | | 8,632,619 | | |
GlaxoSmithKline PLC | | | 329,110 | | | | 7,083,276 | | |
HSBC Holdings PLC, ADR | | | 203,519 | | | | 7,570,907 | | |
Intermediate Capital Group PLC | | | 518,566 | | | | 4,051,680 | | |
Legal & General Group PLC | | | 1,164,062 | | | | 3,214,619 | | |
National Grid PLC | | | 430,275 | | | | 5,912,885 | | |
Rio Tinto PLC | | | 120,336 | | | | 3,636,020 | | |
Royal Dutch Shell PLC, Class A | | | 558,300 | | | | 13,639,908 | | |
St. James's Place PLC | | | 508,474 | | | | 6,556,837 | | |
Total | | | | | 90,324,252 | | |
The accompanying Notes to Financial Statements are an integral part of this statement.
Annual Report 2016
8
COLUMBIA GLOBAL DIVIDEND OPPORTUNITY FUND
PORTFOLIO OF INVESTMENTS (continued)
August 31, 2016
Common Stocks (continued)
Issuer | | Shares | | Value ($) | |
UNITED STATES 42.8% | |
AbbVie, Inc. | | | 105,727 | | | | 6,777,101 | | |
AES Corp. (The) | | | 673,494 | | | | 8,129,073 | | |
Altria Group, Inc. | | | 95,016 | | | | 6,279,607 | | |
Ares Capital Corp. | | | 423,976 | | | | 6,851,452 | | |
BB&T Corp. | | | 273,163 | | | | 10,516,776 | | |
Cisco Systems, Inc. | | | 521,020 | | | | 16,380,869 | | |
CME Group, Inc. | | | 121,693 | | | | 13,185,437 | | |
Coca-Cola Co. (The) | | | 204,601 | | | | 8,885,821 | | |
Crown Castle International Corp. | | | 110,271 | | | | 10,450,383 | | |
Cypress Semiconductor Corp. | | | 399,829 | | | | 4,769,960 | | |
Dow Chemical Co. (The) | | | 129,530 | | | | 6,947,989 | | |
General Electric Co. | | | 258,412 | | | | 8,072,791 | | |
General Motors Co. | | | 327,932 | | | | 10,467,589 | | |
JPMorgan Chase & Co. | | | 192,423 | | | | 12,988,552 | | |
L Brands, Inc. | | | 168,426 | | | | 12,835,745 | | |
Las Vegas Sands Corp. | | | 201,466 | | | | 10,115,608 | | |
Maxim Integrated Products, Inc. | | | 150,489 | | | | 6,127,912 | | |
Merck & Co., Inc. | | | 165,729 | | | | 10,406,124 | | |
Occidental Petroleum Corp. | | | 131,280 | | | | 10,088,868 | | |
Outfront Media, Inc. | | | 130,881 | | | | 2,921,264 | | |
Pattern Energy Group, Inc. | | | 250,805 | | | | 5,969,159 | | |
Pfizer, Inc. | | | 457,019 | | | | 15,904,261 | | |
Philip Morris International, Inc. | | | 75,518 | | | | 7,546,514 | | |
Regal Entertainment Group, Class A | | | 403,587 | | | | 8,628,690 | | |
Reynolds American, Inc. | | | 339,489 | | | | 16,828,470 | | |
Common Stocks (continued)
Issuer | | Shares | | Value ($) | |
Six Flags Entertainment Corp. | | | 184,658 | | | | 9,005,771 | | |
Starwood Property Trust, Inc. | | | 418,856 | | | | 9,591,802 | | |
United Parcel Service, Inc., Class B | | | 46,788 | | | | 5,110,185 | | |
Total | | | | | 261,783,773 | | |
Total Common Stocks
(Cost: $542,802,462) | | | | | 585,589,614 | | |
Limited Partnerships 2.7%
UNITED STATES 2.7% | |
Blackstone Group LP (The) | | | 220,908 | | | | 6,057,298 | | |
Enterprise Products Partners LP | | | 410,208 | | | | 10,829,491 | | |
Total | | | | | 16,886,789 | | |
Total Limited Partnerships
(Cost: $14,539,956) | | | | | 16,886,789 | | |
Money Market Funds 0.6%
| | | Shares | | Value ($) | |
Columbia Short-Term Cash Fund,
0.415%(a)(b) | | | 3,530,146 | | | | 3,530,146 | | |
Total Money Market Funds
(Cost: $3,530,146) | | | | | 3,530,146 | | |
Total Investments
(Cost: $560,872,564) | | | | | 606,006,549 | | |
Other Assets & Liabilities, Net | | | | | 5,474,490 | | |
Net Assets | | | | | 611,481,039 | | |
Notes to Portfolio of Investments
(a) The rate shown is the seven-day current annualized yield at August 31, 2016.
(b) As defined in the Investment Company Act of 1940, an affiliated company is one in which the Fund owns 5% or more of the company's outstanding voting securities, or a company which is under common ownership or control with the Fund. Holdings and transactions in these affiliated companies during the year ended August 31, 2016 are as follows:
Issuer | | Beginning
Cost ($) | | Purchase
Cost ($) | | Proceeds
From Sales ($) | | Ending
Cost ($) | | Dividends —
Affiliated
Issuers ($) | | Value ($) | |
Columbia Short-Term Cash Fund | | | 18,360,107 | | | | 212,860,214 | | | | (227,690,175 | ) | | | 3,530,146 | | | | 30,814 | | | | 3,530,146 | | |
Abbreviation Legend
ADR American Depositary Receipt
The accompanying Notes to Financial Statements are an integral part of this statement.
Annual Report 2016
9
COLUMBIA GLOBAL DIVIDEND OPPORTUNITY FUND
PORTFOLIO OF INVESTMENTS (continued)
August 31, 2016
Fair Value Measurements
The Fund categorizes its fair value measurements according to a three-level hierarchy that maximizes the use of observable inputs and minimizes the use of unobservable inputs by prioritizing that the most observable input be used when available. Observable inputs are those that market participants would use in pricing an investment based on market data obtained from sources independent of the reporting entity. Unobservable inputs are those that reflect the Fund's assumptions about the information market participants would use in pricing an investment. An investment's level within the fair value hierarchy is based on the lowest level of any input that is deemed significant to the asset's or liability's fair value measurement. The input levels are not necessarily an indication of the risk or liquidity associated with investments at that level. For example, certain U.S. government securities are generally high quality and liquid, however, they are reflected as Level 2 because the inputs used to determine fair value may not always be quoted prices in an active market.
Fair value inputs are summarized in the three broad levels listed below:
> Level 1 — Valuations based on quoted prices for investments in active markets that the Fund has the ability to access at the measurement date (including NAV for open-end mutual funds). Valuation adjustments are not applied to Level 1 investments.
> Level 2 — Valuations based on other significant observable inputs (including quoted prices for similar securities, interest rates, prepayment speeds, credit risks, etc.).
> Level 3 — Valuations based on significant unobservable inputs (including the Fund's own assumptions and judgment in determining the fair value of investments).
Inputs that are used in determining fair value of an investment may include price information, credit data, volatility statistics, and other factors. These inputs can be either observable or unobservable. The availability of observable inputs can vary between investments, and is affected by various factors such as the type of investment, and the volume and level of activity for that investment or similar investments in the marketplace. The inputs will be considered by the Investment Manager, along with any other relevant factors in the calculation of an investment's fair value. The Fund uses prices and inputs that are current as of the measurement date, which may include periods of market dislocations. During these periods, the availability of prices and inputs may be reduced for many investments. This condition could cause an investment to be reclassified between the various levels within the hierarchy.
Foreign equity securities actively traded in markets where there is a significant delay in the local close relative to the New York Stock Exchange (NYSE) are classified as Level 2. The values of these securities may include an adjustment to reflect the impact of significant market movements following the close of local trading, as described in Note 2 to the financial statements — Security Valuation.
Certain investments that have been measured at fair value using the net asset value per share (or its equivalent) are not categorized in the fair value hierarchy. The fair value amounts presented in the table are intended to reconcile the fair value hierarchy to the amounts presented in the Portfolio of Investments. The Columbia Short-Term Cash Fund seeks to provide shareholders with maximum current income consistent with liquidity and stability of principal. Investments in Columbia Short-Term Cash Fund may be redeemed on a daily basis without restriction.
Investments falling into the Level 3 category are primarily supported by quoted prices from brokers and dealers participating in the market for those investments. However, these may be classified as Level 3 investments due to lack of market transparency and corroboration to support these quoted prices. Additionally, valuation models may be used as the pricing source for any remaining investments classified as Level 3. These models may rely on one or more significant unobservable inputs and/or significant assumptions by the Investment Manager. Inputs used in valuations may include, but are not limited to, financial statement analysis, capital account balances, discount rates and estimated cash flows, and comparable company data.
Under the direction of the Fund's Board of Trustees (the Board), the Investment Manager's Valuation Committee (the Committee) is responsible for overseeing the valuation procedures approved by the Board. The Committee consists of voting and non-voting members from various groups within the Investment Manager's organization, including operations and accounting, trading and investments, compliance, risk management and legal.
The Committee meets at least monthly to review and approve valuation matters, which may include a description of specific valuation determinations, data regarding pricing information received from approved pricing vendors and brokers and the results of Board-approved valuation control policies and procedures (the Policies). The Policies address, among other things, instances when market quotations are or are not readily available, including recommendations of third party pricing vendors and a determination of appropriate pricing methodologies; events that require specific valuation determinations and assessment of fair value techniques; securities with a potential for stale pricing, including those that are illiquid, restricted, or in default; and the effectiveness of third party pricing vendors, including periodic reviews of vendors. The Committee meets more frequently, as needed, to discuss additional valuation matters, which may include the need to review back-testing results, review time-sensitive information or approve related valuation actions. The Committee reports to the Board, with members of the Committee meeting with the Board at each of its regularly scheduled meetings to discuss valuation matters and actions during the period, similar to those described earlier.
For investments categorized as Level 3, the Committee monitors information similar to that described above, which may include: (i) data specific to the issuer or comparable issuers, (ii) general market or specific sector news and (iii) quoted prices and specific or similar security transactions. The Committee considers this data and any changes from prior periods in order to assess the reasonableness of observable and unobservable inputs, any assumptions or internal models used to value those securities and changes in fair value. This data is also used to corroborate, when available, information received from approved pricing vendors and brokers. Various factors impact the frequency of monitoring this information (which may occur as often as daily). However, the Committee may determine that changes to inputs, assumptions and models are not required as a result of the monitoring procedures performed.
The accompanying Notes to Financial Statements are an integral part of this statement.
Annual Report 2016
10
COLUMBIA GLOBAL DIVIDEND OPPORTUNITY FUND
PORTFOLIO OF INVESTMENTS (continued)
August 31, 2016
Fair Value Measurements (continued)
The following table is a summary of the inputs used to value the Fund's investments at August 31, 2016:
| | | Level 1
Quoted Prices in Active
Markets for Identical
Assets ($) | | Level 2
Other Significant
Observable Inputs ($) | | Level 3
Significant
Unobservable Inputs ($) | | Total ($) | |
Investments | |
Common Stocks | |
Australia | | | — | | | | 36,838,359 | | | | — | | | | 36,838,359 | | |
Brazil | | | 13,139,466 | | | | — | | | | — | | | | 13,139,466 | | |
Canada | | | 31,385,409 | | | | — | | | | — | | | | 31,385,409 | | |
Finland | | | — | | | | 4,379,278 | | | | — | | | | 4,379,278 | | |
Germany | | | — | | | | 28,117,002 | | | | — | | | | 28,117,002 | | |
Hong Kong | | | — | | | | 7,513,055 | | | | — | | | | 7,513,055 | | |
Japan | | | — | | | | 23,243,539 | | | | — | | | | 23,243,539 | | |
Mexico | | | 16,965,529 | | | | — | | | | — | | | | 16,965,529 | | |
Netherlands | | | 8,257,732 | | | | 12,375,835 | | | | — | | | | 20,633,567 | | |
Norway | | | — | | | | 6,165,313 | | | | — | | | | 6,165,313 | | |
South Africa | | | — | | | | 2,628,801 | | | | — | | | | 2,628,801 | | |
Spain | | | — | | | | 4,841,910 | | | | — | | | | 4,841,910 | | |
Switzerland | | | 13,041,870 | | | | 5,622,362 | | | | — | | | | 18,664,232 | | |
Taiwan | | | — | | | | 18,966,129 | | | | — | | | | 18,966,129 | | |
United Kingdom | | | 7,570,907 | | | | 82,753,345 | | | | — | | | | 90,324,252 | | |
United States | | | 261,783,773 | | | | — | | | | — | | | | 261,783,773 | | |
Total Common Stocks | | | 352,144,686 | | | | 233,444,928 | | | | — | | | | 585,589,614 | | |
Limited Partnerships | |
United States | | | 16,886,789 | | | | — | | | | — | | | | 16,886,789 | | |
Investments measured at net asset value | |
Money Market Funds | | | — | | | | | | | | — | | | | 3,530,146 | | |
Total Investments | | | 369,031,475 | | | | 233,444,928 | | | | — | | | | 606,006,549 | | |
See the Portfolio of Investments for all investment classifications not indicated in the table.
The Fund's assets assigned to the Level 2 input category are generally valued using the market approach, in which a security's value is determined through reference to prices and information from market transactions for similar or identical assets. These assets include certain foreign securities for which a third party statistical pricing service may be employed for purposes of fair market valuation. The model utilized by such third party statistical pricing service takes into account a security's correlation to available market data including, but not limited to, intraday index, ADR, and exchange-traded fund movements.
There were no transfers of financial assets between levels during the period.
The accompanying Notes to Financial Statements are an integral part of this statement.
Annual Report 2016
11
COLUMBIA GLOBAL DIVIDEND OPPORTUNITY FUND
STATEMENT OF ASSETS AND LIABILITIES
August 31, 2016
Assets | |
Investments, at value | |
Unaffiliated issuers (identified cost $557,342,418) | | $ | 602,476,403 | | |
Affiliated issuers (identified cost $3,530,146) | | | 3,530,146 | | |
Total investments (identified cost $560,872,564) | | | 606,006,549 | | |
Receivable for: | |
Investments sold | | | 2,926,507 | | |
Capital shares sold | | | 82,322 | | |
Dividends | | | 2,266,322 | | |
Foreign tax reclaims | | | 1,215,332 | | |
Expense reimbursement due from Investment Manager | | | 2,051 | | |
Prepaid expenses | | | 5,767 | | |
Trustees' deferred compensation plan | | | 125,499 | | |
Total assets | | | 612,630,349 | | |
Liabilities | |
Foreign currency (cost $15,923) | | | 15,799 | | |
Payable for: | |
Investments purchased | | | 106,836 | | |
Capital shares purchased | | | 684,107 | | |
Management services fees | | | 12,764 | | |
Distribution and/or service fees | | | 1,060 | | |
Transfer agent fees | | | 45,340 | | |
Compensation of board members | | | 206 | | |
Chief compliance officer expenses | | | 50 | | |
Other expenses | | | 100,538 | | |
Trustees' deferred compensation plan | | | 125,499 | | |
Other liabilities | | | 57,111 | | |
Total liabilities | | | 1,149,310 | | |
Net assets applicable to outstanding capital stock | | $ | 611,481,039 | | |
Represented by | |
Paid-in capital | | $ | 619,138,665 | | |
Undistributed net investment income | | | 6,818,024 | | |
Accumulated net realized loss | | | (59,539,406 | ) | |
Unrealized appreciation (depreciation) on: | |
Investments | | | 45,133,985 | | |
Foreign currency translations | | | (70,229 | ) | |
Total — representing net assets applicable to outstanding capital stock | | $ | 611,481,039 | | |
The accompanying Notes to Financial Statements are an integral part of this statement.
Annual Report 2016
12
COLUMBIA GLOBAL DIVIDEND OPPORTUNITY FUND
STATEMENT OF ASSETS AND LIABILITIES (continued)
August 31, 2016
Class A | |
Net assets | | $ | 108,977,887 | | |
Shares outstanding | | | 6,389,963 | | |
Net asset value per share | | $ | 17.05 | | |
Maximum offering price per share(a) | | $ | 18.09 | | |
Class B | |
Net assets | | $ | 416,139 | | |
Shares outstanding | | | 26,006 | | |
Net asset value per share | | $ | 16.00 | | |
Class C | |
Net assets | | $ | 10,164,255 | | |
Shares outstanding | | | 634,529 | | |
Net asset value per share | | $ | 16.02 | | |
Class I | |
Net assets | | $ | 63,845,316 | | |
Shares outstanding | | | 3,739,105 | | |
Net asset value per share | | $ | 17.08 | | |
Class R | |
Net assets | | $ | 1,533,195 | | |
Shares outstanding | | | 90,020 | | |
Net asset value per share | | $ | 17.03 | | |
Class R4 | |
Net assets | | $ | 853,257 | | |
Shares outstanding | | | 49,639 | | |
Net asset value per share | | $ | 17.19 | | |
Class R5 | |
Net assets | | $ | 174,692 | | |
Shares outstanding | | | 10,231 | | |
Net asset value per share | | $ | 17.07 | | |
Class W | |
Net assets | | $ | 2,026 | | |
Shares outstanding | | | 119 | | |
Net asset value per share(b) | | $ | 17.05 | | |
Class Y | |
Net assets | | $ | 790,401 | | |
Shares outstanding | | | 46,214 | | |
Net asset value per share | | $ | 17.10 | | |
Class Z | |
Net assets | | $ | 424,723,871 | | |
Shares outstanding | | | 24,820,947 | | |
Net asset value per share | | $ | 17.11 | | |
(a) The maximum offering price per share is calculated by dividing the net asset value per share by 1.0 minus the maximum sales charge of 5.75%.
(b) Net asset value per share rounds to this amount due to fractional shares outstanding.
The accompanying Notes to Financial Statements are an integral part of this statement.
Annual Report 2016
13
COLUMBIA GLOBAL DIVIDEND OPPORTUNITY FUND
STATEMENT OF OPERATIONS
Year Ended August 31, 2016
Net investment income | |
Income: | |
Dividends — unaffiliated issuers | | $ | 28,845,937 | | |
Dividends — affiliated issuers | | | 30,814 | | |
Foreign taxes withheld | | | (1,588,179 | ) | |
Total income | | | 27,288,572 | | |
Expenses: | |
Management services fees | | | 5,015,188 | | |
Distribution and/or service fees | |
Class A | | | 280,065 | | |
Class B | | | 6,799 | | |
Class C | | | 111,887 | | |
Class R | | | 4,313 | | |
Class W | | | 5 | | |
Transfer agent fees | |
Class A | | | 415,310 | | |
Class B | | | 2,526 | | |
Class C | | | 41,499 | | |
Class R | | | 3,183 | | |
Class R4 | | | 3,129 | | |
Class R5 | | | 88 | | |
Class W | | | 6 | | |
Class Z | | | 1,616,850 | | |
Compensation of board members | | | 28,401 | | |
Custodian fees | | | 74,819 | | |
Printing and postage fees | | | 126,305 | | |
Registration fees | | | 116,007 | | |
Audit fees | | | 70,930 | | |
Legal fees | | | 17,620 | | |
Chief compliance officer expenses | | | 317 | | |
Other | | | 35,360 | | |
Total expenses | | | 7,970,607 | | |
Fees waived or expenses reimbursed by Investment Manager and its affiliates | | | (767,205 | ) | |
Expense reductions | | | (81,323 | ) | |
Total net expenses | | | 7,122,079 | | |
Net investment income | | | 20,166,493 | | |
Realized and unrealized gain (loss) — net | |
Net realized gain (loss) on: | |
Investments | | | (47,722,533 | ) | |
Foreign currency translations | | | (47,482 | ) | |
Net realized loss | | | (47,770,015 | ) | |
Net change in unrealized appreciation (depreciation) on: | |
Investments | | | 61,694,334 | | |
Foreign currency translations | | | 4,183 | | |
Net change in unrealized appreciation | | | 61,698,517 | | |
Net realized and unrealized gain | | | 13,928,502 | | |
Net increase in net assets resulting from operations | | $ | 34,094,995 | | |
The accompanying Notes to Financial Statements are an integral part of this statement.
Annual Report 2016
14
COLUMBIA GLOBAL DIVIDEND OPPORTUNITY FUND
STATEMENT OF CHANGES IN NET ASSETS
| | | Year Ended
August 31,
2016 | | Year Ended
August 31,
2015 | |
Operations | |
Net investment income | | $ | 20,166,493 | | | $ | 27,782,320 | | |
Net realized gain (loss) | | | (47,770,015 | ) | | | 1,901,795 | | |
Net change in unrealized appreciation (depreciation) | | | 61,698,517 | | | | (126,520,607 | ) | |
Net increase (decrease) in net assets resulting from operations | | | 34,094,995 | | | | (96,836,492 | ) | |
Distributions to shareholders | |
Net investment income | |
Class A | | | (2,760,277 | ) | | | (4,970,271 | ) | |
Class B | | | (12,616 | ) | | | (46,350 | ) | |
Class C | | | (203,081 | ) | | | (439,323 | ) | |
Class I | | | (3,087,123 | ) | | | (6,139,751 | ) | |
Class R | | | (15,886 | ) | | | (28,417 | ) | |
Class R4 | | | (22,308 | ) | | | (15,946 | ) | |
Class R5 | | | (5,088 | ) | | | (2,668 | ) | |
Class W | | | (49 | ) | | | (84 | ) | |
Class Y | | | (27,920 | ) | | | (11,182 | ) | |
Class Z | | | (11,794,283 | ) | | | (20,648,708 | ) | |
Net realized gains | |
Class A | | | — | | | | (14,020,410 | ) | |
Class B | | | — | | | | (177,028 | ) | |
Class C | | | — | | | | (1,575,567 | ) | |
Class I | | | — | | | | (16,210,226 | ) | |
Class R | | | — | | | | (75,626 | ) | |
Class R4 | | | — | | | | (7,552 | ) | |
Class R5 | | | — | | | | (3,124 | ) | |
Class W | | | — | | | | (240 | ) | |
Class Y | | | — | | | | (246 | ) | |
Class Z | | | — | | | | (54,231,843 | ) | |
Total distributions to shareholders | | | (17,928,631 | ) | | | (118,604,562 | ) | |
Decrease in net assets from capital stock activity | | | (121,113,055 | ) | | | (1,875,084 | ) | |
Total decrease in net assets | | | (104,946,691 | ) | | | (217,316,138 | ) | |
Net assets at beginning of year | | | 716,427,730 | | | | 933,743,868 | | |
Net assets at end of year | | $ | 611,481,039 | | | $ | 716,427,730 | | |
Undistributed net investment income | | $ | 6,818,024 | | | $ | 3,421,335 | | |
The accompanying Notes to Financial Statements are an integral part of this statement.
Annual Report 2016
15
COLUMBIA GLOBAL DIVIDEND OPPORTUNITY FUND
STATEMENT OF CHANGES IN NET ASSETS (continued)
| | | Year Ended August 31, 2016 | | Year Ended August 31, 2015 | |
| | | Shares | | Dollars ($) | | Shares | | Dollars ($) | |
Capital stock activity | |
Class A shares | |
Subscriptions(a) | | | 359,723 | | | | 5,838,796 | | | | 464,348 | | | | 8,635,490 | | |
Distributions reinvested | | | 153,513 | | | | 2,516,352 | | | | 968,224 | | | | 17,213,076 | | |
Redemptions | | | (1,266,643 | ) | | | (20,848,210 | ) | | | (1,347,088 | ) | | | (24,990,323 | ) | |
Net increase (decrease) | | | (753,407 | ) | | | (12,493,062 | ) | | | 85,484 | | | | 858,243 | | |
Class B shares | |
Subscriptions | | | 1,197 | | | | 18,578 | | | | 3,097 | | | | 54,554 | | |
Distributions reinvested | | | 660 | | | | 10,128 | | | | 11,316 | | | | 188,932 | | |
Redemptions(a) | | | (33,747 | ) | | | (518,894 | ) | | | (59,941 | ) | | | (1,058,850 | ) | |
Net decrease | | | (31,890 | ) | | | (490,188 | ) | | | (45,528 | ) | | | (815,364 | ) | |
Class C shares | |
Subscriptions | | | 53,046 | | | | 829,648 | | | | 140,737 | | | | 2,450,212 | | |
Distributions reinvested | | | 11,479 | | | | 177,024 | | | | 100,662 | | | | 1,681,724 | | |
Redemptions | | | (229,311 | ) | | | (3,552,260 | ) | | | (229,437 | ) | | | (4,000,425 | ) | |
Net increase (decrease) | | | (164,786 | ) | | | (2,545,588 | ) | | | 11,962 | | | | 131,511 | | |
Class I shares | |
Subscriptions | | | 344,892 | | | | 5,843,327 | | | | 1,229,832 | | | | 22,339,321 | | |
Distributions reinvested | | | 188,823 | | | | 3,087,064 | | | | 1,255,258 | | | | 22,349,630 | | |
Redemptions | | | (4,297,960 | ) | | | (69,696,516 | ) | | | (2,760,638 | ) | | | (49,916,676 | ) | |
Net decrease | | | (3,764,245 | ) | | | (60,766,125 | ) | | | (275,548 | ) | | | (5,227,725 | ) | |
Class R shares | |
Subscriptions | | | 66,643 | | | | 1,108,036 | | | | 6,735 | | | | 124,365 | | |
Distributions reinvested | | | 969 | | | | 15,886 | | | | 5,833 | | | | 104,043 | | |
Redemptions | | | (18,189 | ) | | | (301,460 | ) | | | (31,234 | ) | | | (607,989 | ) | |
Net increase (decrease) | | | 49,423 | | | | 822,462 | | | | (18,666 | ) | | | (379,581 | ) | |
Class R4 shares | |
Subscriptions | | | 9,258 | | | | 151,589 | | | | 45,499 | | | | 845,204 | | |
Distributions reinvested | | | 1,347 | | | | 22,253 | | | | 1,276 | | | | 23,159 | | |
Redemptions | | | (7,810 | ) | | | (130,760 | ) | | | (5,098 | ) | | | (97,298 | ) | |
Net increase | | | 2,795 | | | | 43,082 | | | | 41,677 | | | | 771,065 | | |
Class R5 shares | |
Subscriptions | | | 1,093 | | | | 17,773 | | | | 19,789 | | | | 354,536 | | |
Distributions reinvested | | | 307 | | | | 5,030 | | | | 304 | | | | 5,451 | | |
Redemptions | | | (1,911 | ) | | | (31,000 | ) | | | (10,885 | ) | | | (198,661 | ) | |
Net increase (decrease) | | | (511 | ) | | | (8,197 | ) | | | 9,208 | | | | 161,326 | | |
The accompanying Notes to Financial Statements are an integral part of this statement.
Annual Report 2016
16
COLUMBIA GLOBAL DIVIDEND OPPORTUNITY FUND
STATEMENT OF CHANGES IN NET ASSETS (continued)
| | | Year Ended August 31, 2016 | | Year Ended August 31, 2015 | |
| | | Shares | | Dollars ($) | | Shares | | Dollars ($) | |
Capital stock activity (continued) | |
Class Y shares | |
Subscriptions | | | 9,073 | | | | 147,843 | | | | 72,656 | | | | 1,299,683 | | |
Distributions reinvested | | | 1,701 | | | | 27,861 | | | | 608 | | | | 11,085 | | |
Redemptions | | | (33,741 | ) | | | (542,217 | ) | | | (4,204 | ) | | | (77,235 | ) | |
Net increase (decrease) | | | (22,967 | ) | | | (366,513 | ) | | | 69,060 | | | | 1,233,533 | | |
Class Z shares | |
Subscriptions | | | 544,371 | | | | 8,986,622 | | | | 595,168 | | | | 11,272,270 | | |
Distributions reinvested | | | 698,717 | | | | 11,483,331 | | | | 4,086,912 | | | | 72,932,488 | | |
Redemptions | | | (3,972,622 | ) | | | (65,778,879 | ) | | | (4,462,744 | ) | | | (82,812,850 | ) | |
Net increase (decrease) | | | (2,729,534 | ) | | | (45,308,926 | ) | | | 219,336 | | | | 1,391,908 | | |
Total net increase (decrease) | | | (7,415,122 | ) | | | (121,113,055 | ) | | | 96,985 | | | | (1,875,084 | ) | |
(a) Includes conversions of Class B shares to Class A shares, if any.
The accompanying Notes to Financial Statements are an integral part of this statement.
Annual Report 2016
17
COLUMBIA GLOBAL DIVIDEND OPPORTUNITY FUND
The following tables are intended to help you understand the Fund's financial performance. Certain information reflects financial results for a single share of a class held for the periods shown. Per share net investment income (loss) amounts are calculated based on average shares outstanding during the period. Total return assumes reinvestment of all dividends and distributions, if any. Total return does not reflect payment of sales charges, if any. Total return and portfolio turnover are not annualized for periods of less than one year. The portfolio turnover rate is calculated without regard to purchase and sales transactions of short-term instruments and certain derivatives, if any. If such transactions were included, the Fund's portfolio turnover rate may be higher.
| | | Year Ended August 31, | |
Class A | | 2016 | | 2015 | | 2014 | | 2013 | | 2012 | |
Per share data | |
Net asset value, beginning of period | | $ | 16.56 | | | $ | 21.63 | | | $ | 19.85 | | | $ | 19.59 | | | $ | 17.72 | | |
Income from investment operations: | |
Net investment income | | | 0.47 | | | | 0.58 | | | | 0.61 | | | | 0.51 | | | | 0.27 | | |
Net realized and unrealized gain (loss) | | | 0.42 | | | | (2.93 | ) | | | 2.53 | | | | 1.74 | | | | 1.65 | | |
Total from investment operations | | | 0.89 | | | | (2.35 | ) | | | 3.14 | | | | 2.25 | | | | 1.92 | | |
Less distributions to shareholders: | |
Net investment income | | | (0.40 | ) | | | (0.70 | ) | | | (0.54 | ) | | | (0.68 | ) | | | (0.05 | ) | |
Net realized gains | | | — | | | | (2.02 | ) | | | (0.82 | ) | | | (1.31 | ) | | | — | | |
Total distributions to shareholders | | | (0.40 | ) | | | (2.72 | ) | | | (1.36 | ) | | | (1.99 | ) | | | (0.05 | ) | |
Proceeds from regulatory settlements | | | — | | | | — | | | | — | | | | — | | | | 0.00 | (a) | |
Net asset value, end of period | | $ | 17.05 | | | $ | 16.56 | | | $ | 21.63 | | | $ | 19.85 | | | $ | 19.59 | | |
Total return | | | 5.51 | % | | | (11.49 | %) | | | 16.40 | % | | | 12.48 | % | | | 10.88 | % | |
Ratios to average net assets(b) | |
Total gross expenses | | | 1.45 | % | | | 1.38 | % | | | 1.27 | % | | | 1.34 | % | | | 1.28 | % | |
Total net expenses(c) | | | 1.30 | %(d) | | | 1.31 | %(d) | | | 1.25 | %(d) | | | 1.26 | %(d) | | | 1.21 | %(d) | |
Net investment income | | | 2.85 | % | | | 3.05 | % | | | 2.92 | % | | | 2.59 | % | | | 1.49 | % | |
Supplemental data | |
Net assets, end of period (in thousands) | | $ | 108,978 | | | $ | 118,275 | | | $ | 152,674 | | | $ | 140,796 | | | $ | 133,541 | | |
Portfolio turnover | | | 115 | % | | | 63 | % | | | 75 | % | | | 60 | % | | | 97 | % | |
Notes to Financial Highlights
(a) Rounds to zero.
(b) In addition to the fees and expenses that the Fund bears directly, the Fund indirectly bears a pro rata share of the fees and expenses of any other funds in which it invests. Such indirect expenses are not included in the Fund's reported expense ratios.
(c) Total net expenses include the impact of certain fee waivers/expense reimbursements made by the Investment Manager and certain of its affiliates, if applicable.
(d) The benefits derived from expense reductions had an impact of 0.01%, 0.01%, 0.02%, 0.03% and 0.07% for the years ended 2016, 2015, 2014, 2013 and 2012, respectively.
The accompanying Notes to Financial Statements are an integral part of this statement.
Annual Report 2016
18
COLUMBIA GLOBAL DIVIDEND OPPORTUNITY FUND
FINANCIAL HIGHLIGHTS (continued)
| | | Year Ended August 31, | |
Class B | | 2016 | | 2015 | | 2014 | | 2013 | | 2012 | |
Per share data | |
Net asset value, beginning of period | | $ | 15.55 | | | $ | 20.48 | | | $ | 18.85 | | | $ | 18.63 | | | $ | 16.93 | | |
Income from investment operations: | |
Net investment income | | | 0.31 | | | | 0.41 | | | | 0.40 | | | | 0.34 | | | | 0.10 | | |
Net realized and unrealized gain (loss) | | | 0.42 | | | | (2.77 | ) | | | 2.44 | | | | 1.66 | | | | 1.60 | | |
Total from investment operations | | | 0.73 | | | | (2.36 | ) | | | 2.84 | | | | 2.00 | | | | 1.70 | | |
Less distributions to shareholders: | |
Net investment income | | | (0.28 | ) | | | (0.55 | ) | | | (0.39 | ) | | | (0.47 | ) | | | — | | |
Net realized gains | | | — | | | | (2.02 | ) | | | (0.82 | ) | | | (1.31 | ) | | | — | | |
Total distributions to shareholders | | | (0.28 | ) | | | (2.57 | ) | | | (1.21 | ) | | | (1.78 | ) | | | — | | |
Proceeds from regulatory settlements | | | — | | | | — | | | | — | | | | — | | | | 0.00 | (a) | |
Net asset value, end of period | | $ | 16.00 | | | $ | 15.55 | | | $ | 20.48 | | | $ | 18.85 | | | $ | 18.63 | | |
Total return | | | 4.76 | % | | | (12.18 | %) | | | 15.56 | % | | | 11.61 | % | | | 10.04 | % | |
Ratios to average net assets(b) | |
Total gross expenses | | | 2.20 | % | | | 2.13 | % | | | 2.02 | % | | | 2.09 | % | | | 2.03 | % | |
Total net expenses(c) | | | 2.05 | %(d) | | | 2.06 | %(d) | | | 2.00 | %(d) | | | 2.01 | %(d) | | | 1.95 | %(d) | |
Net investment income | | | 1.99 | % | | | 2.28 | % | | | 2.03 | % | | | 1.83 | % | | | 0.59 | % | |
Supplemental data | |
Net assets, end of period (in thousands) | | $ | 416 | | | $ | 900 | | | $ | 2,118 | | | $ | 3,968 | | | $ | 9,414 | | |
Portfolio turnover | | | 115 | % | | | 63 | % | | | 75 | % | | | 60 | % | | | 97 | % | |
Notes to Financial Highlights
(a) Rounds to zero.
(b) In addition to the fees and expenses that the Fund bears directly, the Fund indirectly bears a pro rata share of the fees and expenses of any other funds in which it invests. Such indirect expenses are not included in the Fund's reported expense ratios.
(c) Total net expenses include the impact of certain fee waivers/expense reimbursements made by the Investment Manager and certain of its affiliates, if applicable.
(d) The benefits derived from expense reductions had an impact of 0.01%, 0.01%, 0.01%, 0.02% and 0.08% for the years ended 2016, 2015, 2014, 2013 and 2012, respectively.
The accompanying Notes to Financial Statements are an integral part of this statement.
Annual Report 2016
19
COLUMBIA GLOBAL DIVIDEND OPPORTUNITY FUND
FINANCIAL HIGHLIGHTS (continued)
| | | Year Ended August 31, | |
Class C | | 2016 | | 2015 | | 2014 | | 2013 | | 2012 | |
Per share data | |
Net asset value, beginning of period | | $ | 15.56 | | | $ | 20.49 | | | $ | 18.86 | | | $ | 18.63 | | | $ | 16.93 | | |
Income from investment operations: | |
Net investment income | | | 0.32 | | | | 0.41 | | | | 0.43 | | | | 0.35 | | | | 0.12 | | |
Net realized and unrealized gain (loss) | | | 0.42 | | | | (2.77 | ) | | | 2.41 | | | | 1.66 | | | | 1.58 | | |
Total from investment operations | | | 0.74 | | | | (2.36 | ) | | | 2.84 | | | | 2.01 | | | | 1.70 | | |
Less distributions to shareholders: | |
Net investment income | | | (0.28 | ) | | | (0.55 | ) | | | (0.39 | ) | | | (0.47 | ) | | | — | | |
Net realized gains | | | — | | | | (2.02 | ) | | | (0.82 | ) | | | (1.31 | ) | | | — | | |
Total distributions to shareholders | | | (0.28 | ) | | | (2.57 | ) | | | (1.21 | ) | | | (1.78 | ) | | | — | | |
Proceeds from regulatory settlements | | | — | | | | — | | | | — | | | | — | | | | 0.00 | (a) | |
Net asset value, end of period | | $ | 16.02 | | | $ | 15.56 | | | $ | 20.49 | | | $ | 18.86 | | | $ | 18.63 | | |
Total return | | | 4.82 | % | | | (12.18 | %) | | | 15.55 | % | | | 11.66 | % | | | 10.04 | % | |
Ratios to average net assets(b) | |
Total gross expenses | | | 2.20 | % | | | 2.13 | % | | | 2.02 | % | | | 2.09 | % | | | 2.04 | % | |
Total net expenses(c) | | | 2.05 | %(d) | | | 2.06 | %(d) | | | 2.00 | %(d) | | | 2.01 | %(d) | | | 1.95 | %(d) | |
Net investment income | | | 2.07 | % | | | 2.30 | % | | | 2.17 | % | | | 1.84 | % | | | 0.72 | % | |
Supplemental data | |
Net assets, end of period (in thousands) | | $ | 10,164 | | | $ | 12,440 | | | $ | 16,136 | | | $ | 13,439 | | | $ | 13,319 | | |
Portfolio turnover | | | 115 | % | | | 63 | % | | | 75 | % | | | 60 | % | | | 97 | % | |
Notes to Financial Highlights
(a) Rounds to zero.
(b) In addition to the fees and expenses that the Fund bears directly, the Fund indirectly bears a pro rata share of the fees and expenses of any other funds in which it invests. Such indirect expenses are not included in the Fund's reported expense ratios.
(c) Total net expenses include the impact of certain fee waivers/expense reimbursements made by the Investment Manager and certain of its affiliates, if applicable.
(d) The benefits derived from expense reductions had an impact of 0.01%, 0.01%, 0.02%, 0.03% and 0.09% for the years ended 2016, 2015, 2014, 2013 and 2012, respectively.
The accompanying Notes to Financial Statements are an integral part of this statement.
Annual Report 2016
20
COLUMBIA GLOBAL DIVIDEND OPPORTUNITY FUND
FINANCIAL HIGHLIGHTS (continued)
| | | Year Ended August 31, | |
Class I | | 2016 | | 2015 | | 2014 | | 2013 | | 2012 | |
Per share data | |
Net asset value, beginning of period | | $ | 16.58 | | | $ | 21.66 | | | $ | 19.87 | | | $ | 19.64 | | | $ | 17.80 | | |
Income from investment operations: | |
Net investment income | | | 0.53 | | | | 0.67 | | | | 0.72 | | | | 0.58 | | | | 0.35 | | |
Net realized and unrealized gain (loss) | | | 0.45 | | | | (2.94 | ) | | | 2.53 | | | | 1.76 | | | | 1.64 | | |
Total from investment operations | | | 0.98 | | | | (2.27 | ) | | | 3.25 | | | | 2.34 | | | | 1.99 | | |
Less distributions to shareholders: | |
Net investment income | | | (0.48 | ) | | | (0.79 | ) | | | (0.64 | ) | | | (0.80 | ) | | | (0.15 | ) | |
Net realized gains | | | — | | | | (2.02 | ) | | | (0.82 | ) | | | (1.31 | ) | | | — | | |
Total distributions to shareholders | | | (0.48 | ) | | | (2.81 | ) | | | (1.46 | ) | | | (2.11 | ) | | | (0.15 | ) | |
Proceeds from regulatory settlements | | | — | | | | — | | | | — | | | | — | | | | 0.00 | (a) | |
Net asset value, end of period | | $ | 17.08 | | | $ | 16.58 | | | $ | 21.66 | | | $ | 19.87 | | | $ | 19.64 | | |
Total return | | | 6.08 | % | | | (11.08 | %) | | | 16.95 | % | | | 12.98 | % | | | 11.27 | % | |
Ratios to average net assets(b) | |
Total gross expenses | | | 0.83 | % | | | 0.82 | % | | | 0.81 | % | | | 0.84 | % | | | 0.85 | % | |
Total net expenses(c) | | | 0.83 | % | | | 0.82 | % | | | 0.81 | % | | | 0.83 | % | | | 0.83 | % | |
Net investment income | | | 3.20 | % | | | 3.55 | % | | | 3.45 | % | | | 2.94 | % | | | 1.91 | % | |
Supplemental data | |
Net assets, end of period (in thousands) | | $ | 63,845 | | | $ | 124,390 | | | $ | 168,474 | | | $ | 127,949 | | | $ | 3 | | |
Portfolio turnover | | | 115 | % | | | 63 | % | | | 75 | % | | | 60 | % | | | 97 | % | |
Notes to Financial Highlights
(a) Rounds to zero.
(b) In addition to the fees and expenses that the Fund bears directly, the Fund indirectly bears a pro rata share of the fees and expenses of any other funds in which it invests. Such indirect expenses are not included in the Fund's reported expense ratios.
(c) Total net expenses include the impact of certain fee waivers/expense reimbursements made by the Investment Manager and certain of its affiliates, if applicable.
The accompanying Notes to Financial Statements are an integral part of this statement.
Annual Report 2016
21
COLUMBIA GLOBAL DIVIDEND OPPORTUNITY FUND
FINANCIAL HIGHLIGHTS (continued)
| | | Year Ended August 31, | |
Class R | | 2016 | | 2015 | | 2014 | | 2013 | | 2012 | |
Per share data | |
Net asset value, beginning of period | | $ | 16.53 | | | $ | 21.61 | | | $ | 19.83 | | | $ | 19.54 | | | $ | 17.67 | | |
Income from investment operations: | |
Net investment income | | | 0.42 | | | | 0.53 | | | | 0.57 | | | | 0.46 | | | | 0.23 | | |
Net realized and unrealized gain (loss) | | | 0.44 | | | | (2.94 | ) | | | 2.52 | | | | 1.75 | | | | 1.64 | | |
Total from investment operations | | | 0.86 | | | | (2.41 | ) | | | 3.09 | | | | 2.21 | | | | 1.87 | | |
Less distributions to shareholders: | |
Net investment income | | | (0.36 | ) | | | (0.65 | ) | | | (0.49 | ) | | | (0.61 | ) | | | (0.00 | )(a) | |
Net realized gains | | | — | | | | (2.02 | ) | | | (0.82 | ) | | | (1.31 | ) | | | — | | |
Total distributions to shareholders | | | (0.36 | ) | | | (2.67 | ) | | | (1.31 | ) | | | (1.92 | ) | | | (0.00 | )(a) | |
Proceeds from regulatory settlements | | | — | | | | — | | | | — | | | | — | | | | 0.00 | (a) | |
Net asset value, end of period | | $ | 17.03 | | | $ | 16.53 | | | $ | 21.61 | | | $ | 19.83 | | | $ | 19.54 | | |
Total return | | | 5.32 | % | | | (11.78 | %) | | | 16.13 | % | | | 12.25 | % | | | 10.61 | % | |
Ratios to average net assets(b) | |
Total gross expenses | | | 1.70 | % | | | 1.62 | % | | | 1.52 | % | | | 1.59 | % | | | 1.53 | % | |
Total net expenses(c) | | | 1.55 | %(d) | | | 1.55 | %(d) | | | 1.50 | %(d) | | | 1.51 | %(d) | | | 1.46 | %(d) | |
Net investment income | | | 2.57 | % | | | 2.77 | % | | | 2.72 | % | | | 2.33 | % | | | 1.24 | % | |
Supplemental data | |
Net assets, end of period (in thousands) | | $ | 1,533 | | | $ | 671 | | | $ | 1,280 | | | $ | 1,297 | | | $ | 1,082 | | |
Portfolio turnover | | | 115 | % | | | 63 | % | | | 75 | % | | | 60 | % | | | 97 | % | |
Notes to Financial Highlights
(a) Rounds to zero.
(b) In addition to the fees and expenses that the Fund bears directly, the Fund indirectly bears a pro rata share of the fees and expenses of any other funds in which it invests. Such indirect expenses are not included in the Fund's reported expense ratios.
(c) Total net expenses include the impact of certain fee waivers/expense reimbursements made by the Investment Manager and certain of its affiliates, if applicable.
(d) The benefits derived from expense reductions had an impact of 0.01%, 0.01%, 0.02%, 0.03% and 0.07% for the years ended 2016, 2015, 2014, 2013 and 2012, respectively.
The accompanying Notes to Financial Statements are an integral part of this statement.
Annual Report 2016
22
COLUMBIA GLOBAL DIVIDEND OPPORTUNITY FUND
FINANCIAL HIGHLIGHTS (continued)
| | | Year Ended August 31, | |
Class R4 | | 2016 | | 2015 | | 2014 | | 2013(a) | |
Per share data | |
Net asset value, beginning of period | | $ | 16.69 | | | $ | 21.78 | | | $ | 19.97 | | | $ | 19.69 | | |
Income from investment operations: | |
Net investment income | | | 0.52 | | | | 0.67 | | | | 0.76 | | | | 0.25 | | |
Net realized and unrealized gain (loss) | | | 0.43 | | | | (2.99 | ) | | | 2.46 | | | | 0.33 | | |
Total from investment operations | | | 0.95 | | | | (2.32 | ) | | | 3.22 | | | | 0.58 | | |
Less distributions to shareholders: | |
Net investment income | | | (0.45 | ) | | | (0.75 | ) | | | (0.59 | ) | | | (0.30 | ) | |
Net realized gains | | | — | | | | (2.02 | ) | | | (0.82 | ) | | | — | | |
Total distributions to shareholders | | | (0.45 | ) | | | (2.77 | ) | | | (1.41 | ) | | | (0.30 | ) | |
Net asset value, end of period | | $ | 17.19 | | | $ | 16.69 | | | $ | 21.78 | | | $ | 19.97 | | |
Total return | | | 5.80 | % | | | (11.27 | %) | | | 16.74 | % | | | 3.02 | % | |
Ratios to average net assets(b) | |
Total gross expenses | | | 1.20 | % | | | 1.16 | % | | | 1.03 | % | | | 1.07 | %(c) | |
Total net expenses(d) | | | 1.05 | %(e) | | | 1.04 | %(e) | | | 0.99 | %(e) | | | 1.01 | %(c)(e) | |
Net investment income | | | 3.12 | % | | | 3.68 | % | | | 3.56 | % | | | 2.78 | %(c) | |
Supplemental data | |
Net assets, end of period (in thousands) | | $ | 853 | | | $ | 782 | | | $ | 113 | | | $ | 29 | | |
Portfolio turnover | | | 115 | % | | | 63 | % | | | 75 | % | | | 60 | % | |
Notes to Financial Highlights
(a) Based on operations from March 19, 2013 (commencement of operations) through the stated period end.
(b) In addition to the fees and expenses that the Fund bears directly, the Fund indirectly bears a pro rata share of the fees and expenses of any other funds in which it invests. Such indirect expenses are not included in the Fund's reported expense ratios.
(c) Annualized.
(d) Total net expenses include the impact of certain fee waivers/expense reimbursements made by the Investment Manager and certain of its affiliates, if applicable.
(e) The benefits derived from expense reductions had an impact of 0.01%, 0.02%, 0.03% and 0.05% for the years ended 2016, 2015, 2014 and 2013, respectively.
The accompanying Notes to Financial Statements are an integral part of this statement.
Annual Report 2016
23
COLUMBIA GLOBAL DIVIDEND OPPORTUNITY FUND
FINANCIAL HIGHLIGHTS (continued)
| | | Year Ended August 31, | |
Class R5 | | 2016 | | 2015 | | 2014(a) | |
Per share data | |
Net asset value, beginning of period | | $ | 16.58 | | | $ | 21.66 | | | $ | 20.57 | | |
Income from investment operations: | |
Net investment income | | | 0.54 | | | | 0.64 | | | | 0.39 | | |
Net realized and unrealized gain (loss) | | | 0.42 | | | | (2.92 | ) | | | 1.01 | | |
Total from investment operations | | | 0.96 | | | | (2.28 | ) | | | 1.40 | | |
Less distributions to shareholders: | |
Net investment income | | | (0.47 | ) | | | (0.78 | ) | | | (0.31 | ) | |
Net realized gains | | | — | | | | (2.02 | ) | | | — | | |
Total distributions to shareholders | | | (0.47 | ) | | | (2.80 | ) | | | (0.31 | ) | |
Net asset value, end of period | | $ | 17.07 | | | $ | 16.58 | | | $ | 21.66 | | |
Total return | | | 5.96 | % | | | (11.13 | %) | | | 6.85 | % | |
Ratios to average net assets(b) | |
Total gross expenses | | | 0.88 | % | | | 0.87 | % | | | 0.88 | %(c) | |
Total net expenses(d) | | | 0.88 | % | | | 0.87 | % | | | 0.88 | %(c) | |
Net investment income | | | 3.26 | % | | | 3.52 | % | | | 2.98 | %(c) | |
Supplemental data | |
Net assets, end of period (in thousands) | | $ | 175 | | | $ | 178 | | | $ | 33 | | |
Portfolio turnover | | | 115 | % | | | 63 | % | | | 75 | % | |
Notes to Financial Highlights
(a) Based on operations from January 8, 2014 (commencement of operations) through the stated period end.
(b) In addition to the fees and expenses that the Fund bears directly, the Fund indirectly bears a pro rata share of the fees and expenses of any other funds in which it invests. Such indirect expenses are not included in the Fund's reported expense ratios.
(c) Annualized.
(d) Total net expenses include the impact of certain fee waivers/expense reimbursements made by the Investment Manager and certain of its affiliates, if applicable.
The accompanying Notes to Financial Statements are an integral part of this statement.
Annual Report 2016
24
COLUMBIA GLOBAL DIVIDEND OPPORTUNITY FUND
FINANCIAL HIGHLIGHTS (continued)
| | | Year Ended August 31, | |
Class W | | 2016 | | 2015 | | 2014 | | 2013 | | 2012 | |
Per share data | |
Net asset value, beginning of period | | $ | 16.56 | | | $ | 21.62 | | | $ | 19.83 | | | $ | 19.57 | | | $ | 17.73 | | |
Income from investment operations: | |
Net investment income | | | 0.47 | | | | 0.60 | | | | 0.61 | | | | 0.51 | | | | 0.28 | | |
Net realized and unrealized gain (loss) | | | 0.43 | | | | (2.93 | ) | | | 2.55 | | | | 1.74 | | | | 1.64 | | |
Total from investment operations | | | 0.90 | | | | (2.33 | ) | | | 3.16 | | | | 2.25 | | | | 1.92 | | |
Less distributions to shareholders: | |
Net investment income | | | (0.41 | ) | | | (0.71 | ) | | | (0.55 | ) | | | (0.68 | ) | | | (0.08 | ) | |
Net realized gains | | | — | | | | (2.02 | ) | | | (0.82 | ) | | | (1.31 | ) | | | — | | |
Total distributions to shareholders | | | (0.41 | ) | | | (2.73 | ) | | | (1.37 | ) | | | (1.99 | ) | | | (0.08 | ) | |
Proceeds from regulatory settlements | | | — | | | | — | | | | — | | | | — | | | | 0.00 | (a) | |
Net asset value, end of period | | $ | 17.05 | | | $ | 16.56 | | | $ | 21.62 | | | $ | 19.83 | | | $ | 19.57 | | |
Total return | | | 5.59 | % | | | (11.41 | %) | | | 16.50 | % | | | 12.48 | % | | | 10.86 | % | |
Ratios to average net assets(b) | |
Total gross expenses | | | 1.45 | % | | | 1.38 | % | | | 1.28 | % | | | 1.33 | % | | | 1.33 | % | |
Total net expenses(c) | | | 1.30 | %(d) | | | 1.31 | %(d) | | | 1.26 | %(d) | | | 1.26 | %(d) | | | 1.23 | %(d) | |
Net investment income | | | 2.86 | % | | | 3.04 | % | | | 2.85 | % | | | 2.60 | % | | | 1.51 | % | |
Supplemental data | |
Net assets, end of period (in thousands) | | $ | 2 | | | $ | 2 | | | $ | 3 | | | $ | 3 | | | $ | 3 | | |
Portfolio turnover | | | 115 | % | | | 63 | % | | | 75 | % | | | 60 | % | | | 97 | % | |
Notes to Financial Highlights
(a) Rounds to zero.
(b) In addition to the fees and expenses that the Fund bears directly, the Fund indirectly bears a pro rata share of the fees and expenses of any other funds in which it invests. Such indirect expenses are not included in the Fund's reported expense ratios.
(c) Total net expenses include the impact of certain fee waivers/expense reimbursements made by the Investment Manager and certain of its affiliates, if applicable.
(d) The benefits derived from expense reductions had an impact 0.01%, 0.01%, 0.02%, 0.03% and 0.08% for the years ended 2016, 2015, 2014, 2013 and 2012, respectively.
The accompanying Notes to Financial Statements are an integral part of this statement.
Annual Report 2016
25
COLUMBIA GLOBAL DIVIDEND OPPORTUNITY FUND
FINANCIAL HIGHLIGHTS (continued)
| | | Year Ended August 31, | |
Class Y | | 2016 | | 2015 | | 2014 | | 2013 | | 2012 | |
Per share data | |
Net asset value, beginning of period | | $ | 16.60 | | | $ | 21.68 | | | $ | 19.89 | | | $ | 19.65 | | | $ | 17.79 | | |
Income from investment operations: | |
Net investment income | | | 0.53 | | | | 0.70 | | | | 0.72 | | | | 0.59 | | | | 0.31 | | |
Net realized and unrealized gain (loss) | | | 0.45 | | | | (2.96 | ) | | | 2.54 | | | | 1.74 | | | | 1.68 | | |
Total from investment operations | | | 0.98 | | | | (2.26 | ) | | | 3.26 | | | | 2.33 | | | | 1.99 | | |
Less distributions to shareholders: | |
Net investment income | | | (0.48 | ) | | | (0.80 | ) | | | (0.65 | ) | | | (0.78 | ) | | | (0.13 | ) | |
Net realized gains | | | — | | | | (2.02 | ) | | | (0.82 | ) | | | (1.31 | ) | | | — | | |
Total distributions to shareholders | | | (0.48 | ) | | | (2.82 | ) | | | (1.47 | ) | | | (2.09 | ) | | | (0.13 | ) | |
Proceeds from regulatory settlements | | | — | | | | — | | | | — | | | | — | | | | 0.00 | (a) | |
Net asset value, end of period | | $ | 17.10 | | | $ | 16.60 | | | $ | 21.68 | | | $ | 19.89 | | | $ | 19.65 | | |
Total return | | | 6.07 | % | | | (11.04 | %) | | | 17.00 | % | | | 12.93 | % | | | 11.28 | % | |
Ratios to average net assets(b) | |
Total gross expenses | | | 0.83 | % | | | 0.82 | % | | | 0.81 | % | | | 0.96 | % | | | 0.82 | % | |
Total net expenses(c) | | | 0.83 | % | | | 0.82 | % | | | 0.81 | % | | | 0.88 | % | | | 0.82 | % | |
Net investment income | | | 3.23 | % | | | 3.89 | % | | | 3.33 | % | | | 2.97 | % | | | 1.70 | % | |
Supplemental data | |
Net assets, end of period (in thousands) | | $ | 790 | | | $ | 1,149 | | | $ | 3 | | | $ | 3 | | | $ | 2 | | |
Portfolio turnover | | | 115 | % | | | 63 | % | | | 75 | % | | | 60 | % | | | 97 | % | |
Notes to Financial Highlights
(a) Rounds to zero.
(b) In addition to the fees and expenses that the Fund bears directly, the Fund indirectly bears a pro rata share of the fees and expenses of any other funds in which it invests. Such indirect expenses are not included in the Fund's reported expense ratios.
(c) Total net expenses include the impact of certain fee waivers/expense reimbursements made by the Investment Manager and certain of its affiliates, if applicable.
The accompanying Notes to Financial Statements are an integral part of this statement.
Annual Report 2016
26
COLUMBIA GLOBAL DIVIDEND OPPORTUNITY FUND
FINANCIAL HIGHLIGHTS (continued)
| | | Year Ended August 31, | |
Class Z | | 2016 | | 2015 | | 2014 | | 2013 | | 2012 | |
Per share data | |
Net asset value, beginning of period | | $ | 16.61 | | | $ | 21.69 | | | $ | 19.90 | | | $ | 19.66 | | | $ | 17.78 | | |
Income from investment operations: | |
Net investment income | | | 0.51 | | | | 0.63 | | | | 0.67 | | | | 0.56 | | | | 0.31 | | |
Net realized and unrealized gain (loss) | | | 0.43 | | | | (2.94 | ) | | | 2.53 | | | | 1.75 | | | | 1.67 | | |
Total from investment operations | | | 0.94 | | | | (2.31 | ) | | | 3.20 | | | | 2.31 | | | | 1.98 | | |
Less distributions to shareholders: | |
Net investment income | | | (0.44 | ) | | | (0.75 | ) | | | (0.59 | ) | | | (0.76 | ) | | | (0.10 | ) | |
Net realized gains | | | — | | | | (2.02 | ) | | | (0.82 | ) | | | (1.31 | ) | | | — | | |
Total distributions to shareholders | | | (0.44 | ) | | | (2.77 | ) | | | (1.41 | ) | | | (2.07 | ) | | | (0.10 | ) | |
Proceeds from regulatory settlements | | | — | | | | — | | | | — | | | | — | | | | 0.00 | (a) | |
Net asset value, end of period | | $ | 17.11 | | | $ | 16.61 | | | $ | 21.69 | | | $ | 19.90 | | | $ | 19.66 | | |
Total return | | | 5.82 | % | | | (11.28 | %) | | | 16.70 | % | | | 12.76 | % | | | 11.20 | % | |
Ratios to average net assets(b) | |
Total gross expenses | | | 1.20 | % | | | 1.13 | % | | | 1.02 | % | | | 1.09 | % | | | 1.03 | % | |
Total net expenses(c) | | | 1.05 | %(d) | | | 1.06 | %(d) | | | 1.00 | %(d) | | | 1.01 | %(d) | | | 0.95 | %(d) | |
Net investment income | | | 3.10 | % | | | 3.30 | % | | | 3.16 | % | | | 2.84 | % | | | 1.72 | % | |
Supplemental data | |
Net assets, end of period (in thousands) | | $ | 424,724 | | | $ | 457,640 | | | $ | 592,910 | | | $ | 562,394 | | | $ | 585,285 | | |
Portfolio turnover | | | 115 | % | | | 63 | % | | | 75 | % | | | 60 | % | | | 97 | % | |
Notes to Financial Highlights
(a) Rounds to zero.
(b) In addition to the fees and expenses that the Fund bears directly, the Fund indirectly bears a pro rata share of the fees and expenses of any other funds in which it invests. Such indirect expenses are not included in the Fund's reported expense ratios.
(c) Total net expenses include the impact of certain fee waivers/expense reimbursements made by the Investment Manager and certain of its affiliates, if applicable.
(d) The benefits derived from expense reductions had an impact of 0.01%, 0.01%, 0.02%, 0.03% and 0.08% for the years ended 2016, 2015, 2014, 2013 and 2012, respectively.
The accompanying Notes to Financial Statements are an integral part of this statement.
Annual Report 2016
27
COLUMBIA GLOBAL DIVIDEND OPPORTUNITY FUND
NOTES TO FINANCIAL STATEMENTS
August 31, 2016
Note 1. Organization
Columbia Global Dividend Opportunity Fund (the Fund), a series of Columbia Funds Series Trust I (the Trust), is a diversified fund. The Trust is registered under the Investment Company Act of 1940, as amended (the 1940 Act), as an open-end management investment company organized as a Massachusetts business trust.
Fund Shares
The Trust may issue an unlimited number of shares (without par value). The Fund offers Class A, Class B, Class C, Class I, Class R, Class R4, Class R5, Class W, Class Y and Class Z shares. Although all share classes generally have identical voting, dividend and liquidation rights, each share class votes separately when required by the Trust's organizational documents or by law. Different share classes pay different distribution amounts to the extent the expenses of such share classes differ, and distributions in liquidation will be proportional to the net asset value of each share class. Each share class has its own expense and sales charge structure.
Class A shares are subject to a maximum front-end sales charge of 5.75% based on the initial investment amount. Class A shares purchased without an initial sales charge in accounts aggregating $1 million to $50 million at the time of purchase are subject to a contingent deferred sales charge (CDSC) if the shares are sold within 18 months after purchase, charged as follows: 1.00% CDSC if redeemed within 12 months after purchase, and 0.50% CDSC if redeemed more than 12, but less than 18, months after purchase.
Class B shares may be subject to a maximum CDSC of 5.00% based upon the holding period after purchase. Class B shares will generally convert to Class A shares eight years after purchase. The Fund no longer accepts investments by new or existing investors in the Fund's Class B shares, except in connection with the reinvestment of any dividend and/or capital gain distributions in Class B shares of the Fund and exchanges by existing Class B shareholders of certain other funds within the Columbia Family of Funds.
Class C shares are subject to a 1.00% CDSC on shares redeemed within 12 months after purchase.
Class I shares are not subject to sales charges and are available only to the Columbia Family of Funds.
Class R shares are not subject to sales charges and are generally available only to certain retirement plans and other investors as described in the Fund's prospectus.
Class R4 shares are not subject to sales charges and are generally available only to omnibus retirement plans and certain investors as described in the Fund's prospectus.
Class R5 shares are not subject to sales charges and are generally available only to investors purchasing through authorized investment professionals and omnibus retirement plans.
Class W shares are not subject to sales charges and are generally available only to investors purchasing through authorized investment programs managed by investment professionals, including discretionary managed account programs.
Class Y shares are not subject to sales charges and are generally available only to certain retirement plans as described in the Fund's prospectus.
Class Z shares are not subject to sales charges and are generally available only to eligible investors, which are subject to different investment minimums as described in the Fund's prospectus.
Note 2. Summary of Significant Accounting Policies
Basis of Preparation
The Fund is an investment company that applies the accounting and reporting guidance in the Financial Accounting Standards Board (FASB) Accounting Standards Codification Topic 946, Financial Services — Investment Companies (ASC 946). The financial statements are prepared in accordance with U.S. generally accepted accounting principles (GAAP), which requires management to make certain estimates and assumptions that affect the reported amounts of assets and liabilities, the disclosure of contingent assets and liabilities at the date of the financial statements and the reported amounts of income and expenses during the reporting period. Actual results could differ from those estimates.
The following is a summary of significant accounting policies followed by the Fund in the preparation of its financial statements.
Security Valuation
All equity securities are valued at the close of business of the New York Stock Exchange (NYSE). Equity securities are valued at the last quoted sales price on the principal exchange or market on which they trade, except for securities traded on the NASDAQ Stock Market, which are valued at the NASDAQ official close price. Unlisted
Annual Report 2016
28
COLUMBIA GLOBAL DIVIDEND OPPORTUNITY FUND
NOTES TO FINANCIAL STATEMENTS (continued)
August 31, 2016
securities or listed securities for which there were no sales during the day are valued at the mean of the latest quoted bid and ask prices on such exchanges or markets.
Foreign equity securities are valued based on the closing price on the foreign exchange in which such securities are primarily traded. If any foreign equity security closing prices are not readily available, the securities are valued at the mean of the latest quoted bid and ask prices on such exchanges or markets. Foreign currency exchange rates are generally determined at 4:00 p.m. Eastern (U.S.) time. Many securities markets and exchanges outside the U.S. close prior to the close of the NYSE; therefore, the closing prices for securities in such markets or on such exchanges may not fully reflect events that occur after such close but before the close of the NYSE. In those situations, foreign securities will be fair valued pursuant to a policy adopted by Board of Trustees (the Board), including, if available, utilizing a third party pricing service to determine these fair values. The third party pricing service takes into account multiple factors, including, but not limited to, movements in the U.S. securities markets, certain depositary receipts, futures contracts and foreign exchange rates that have occurred subsequent to the close of the foreign exchange or market, to determine a good faith estimate that reasonably reflects the current market conditions as of the close of the NYSE. The fair value of a security is likely to be different from the quoted or published price, if available.
Investments in open-end investment companies, including money market funds, are valued at their latest net asset value.
Investments for which market quotations are not readily available, or that have quotations which management believes are not reflective of market value or reliable, are valued at fair value as determined in good faith under procedures approved by and under the general supervision of the Board. If a security or class of securities (such as foreign securities) is valued at fair value, such value is likely to be different from the quoted or published price for the security.
The determination of fair value often requires significant judgment. To determine fair value, management may use assumptions including but not limited to future cash flows and estimated risk premiums. Multiple inputs from various sources may be used to determine fair value.
GAAP requires disclosure regarding the inputs and valuation techniques used to measure fair value and any changes in valuation inputs or techniques. In addition, investments shall be disclosed by major category. This information is disclosed following the Fund's Portfolio of Investments.
Foreign Currency Transactions and Translations
The values of all assets and liabilities denominated in foreign currencies are generally translated into U.S. dollars at exchange rates determined at the close of the NYSE on any given day. Net realized and unrealized gains (losses) on foreign currency transactions and translations include gains (losses) arising from the fluctuation in exchange rates between trade and settlement dates on securities transactions, gains (losses) arising from the disposition of foreign currency and currency gains (losses) between the accrual and payment dates on dividends, interest income and foreign withholding taxes.
For financial statement purposes, the Fund does not distinguish that portion of gains (losses) on investments which is due to changes in foreign exchange rates from that which is due to changes in market prices of the investments. Such fluctuations are included with the net realized and unrealized gains (losses) on investments in the Statement of Operations.
Security Transactions
Security transactions are accounted for on the trade date. Cost is determined and gains (losses) are based upon the specific identification method for both financial statement and federal income tax purposes.
Income Recognition
Corporate actions and dividend income are generally recorded net of any non-reclaimable tax withholdings, on the ex-dividend date or upon receipt of ex-dividend notification in the case of certain foreign securities.
The Fund may receive distributions from holdings in equity securities, business development companies (BDCs), exchange-traded funds, other regulated investment companies (RICs), and real estate investment trusts (REITs), which report information on the tax character of their distributions annually. These distributions are allocated to dividend income, capital gain and return of capital based on actual information reported. Return of capital is recorded as a reduction of the cost basis of securities held. If the Fund no longer
Annual Report 2016
29
COLUMBIA GLOBAL DIVIDEND OPPORTUNITY FUND
NOTES TO FINANCIAL STATEMENTS (continued)
August 31, 2016
owns the applicable securities, return of capital is recorded as a realized gain. With respect to REITs, to the extent actual information has not yet been reported, estimates for return of capital are made by the Fund's management. Management's estimates are subsequently adjusted when the actual character of the distributions is disclosed by the REITs, which could result in a proportionate change in return of capital to shareholders.
Awards from class action litigation are recorded as a reduction of cost basis if the Fund still owns the applicable securities on the payment date. If the Fund no longer owns the applicable securities, the proceeds are recorded as realized gains.
Expenses
General expenses of the Trust are allocated to the Fund and other funds of the Trust based upon relative net assets or other expense allocation methodologies determined by the nature of the expense. Expenses directly attributable to the Fund are charged to the Fund. Expenses directly attributable to a specific class of shares are charged to that share class.
Determination of Class Net Asset Value
All income, expenses (other than class-specific expenses, which are charged to that share class, as shown in the Statement of Operations) and realized and unrealized gains (losses) are allocated to each class of the Fund on a daily basis, based on the relative net assets of each class, for purposes of determining the net asset value of each class.
Federal Income Tax Status
The Fund intends to qualify each year as a regulated investment company under Subchapter M of the Internal Revenue Code, as amended, and will distribute substantially all of its taxable income (including net short-term capital gains), if any, for its tax year, and as such will not be subject to federal income taxes. In addition, the Fund intends to distribute in each calendar year substantially all of its net investment income, capital gains and certain other amounts, if any, such that the Fund should not be subject to federal excise tax. Therefore, no federal income or excise tax provision is recorded.
Foreign Taxes
The Fund may be subject to foreign taxes on income, gains on investments or currency repatriation, a portion
of which may be recoverable. The Fund will accrue such taxes and recoveries, as applicable, based upon its current interpretation of tax rules and regulations that exist in the markets in which it invests.
Realized gains in certain countries may be subject to foreign taxes at the Fund level, based on statutory rates. The Fund accrues for such foreign taxes on realized and unrealized gains at the appropriate rate for each jurisdiction, as applicable. The amount, if any, is disclosed as a liability on the Statement of Assets and Liabilities.
Distributions to Shareholders
Distributions from net investment income, if any, are declared and paid each calendar quarter. Net realized capital gains, if any, are distributed at least annually. Income distributions and capital gain distributions are determined in accordance with federal income tax regulations, which may differ from GAAP.
Guarantees and Indemnifications
Under the Trust's organizational documents and, in some cases, by contract, its officers and trustees are indemnified against certain liabilities arising out of the performance of their duties to the Trust or its funds. In addition, certain of the Fund's contracts with its service providers contain general indemnification clauses. The Fund's maximum exposure under these arrangements is unknown since the amount of any future claims that may be made against the Fund cannot be determined, and the Fund has no historical basis for predicting the likelihood of any such claims.
Note 3. Fees and Other Transactions with Affiliates
Management Services Fees
Effective January 1, 2016, the Fund entered into a Management Agreement with Columbia Management Investment Advisers, LLC (the Investment Manager), a wholly-owned subsidiary of Ameriprise Financial, Inc. (Ameriprise Financial). Under the Management Agreement, the Investment Manager provides the Fund with investment research and advice, as well as administrative and accounting services. The management services fee is an annual fee that is equal to a percentage of the Fund's average daily net assets that declines from 0.77% to 0.57% as the Fund's net assets increase. Prior to January 1, 2016, the Fund paid the Investment Manager an annual fee for advisory
Annual Report 2016
30
COLUMBIA GLOBAL DIVIDEND OPPORTUNITY FUND
NOTES TO FINANCIAL STATEMENTS (continued)
August 31, 2016
services under an Investment Management Services Agreement and a separate annual fee for administrative and accounting services under an Administrative Services Agreement. The effective management services fee rate for the year ended August 31, 2016 (reflecting all advisory and administrative services fees paid to the Investment Manager) was 0.76% of the Fund's average daily net assets. For the period from September 1, 2015 through December 31, 2015, the investment advisory services fee paid to the Investment Manager was $1,654,873, and the administrative services fee paid to the Investment Manager was $139,005.
Participating Affiliates
The Investment Manager and its investment advisory affiliates (Participating Affiliates) around the world may coordinate in providing services to their clients. From time to time the Investment Manager (or any affiliated investment subadviser to the Fund, as the case may be) may engage its Participating Affiliates to provide a variety of services such as investment research, investment monitoring, trading and discretionary investment management (including portfolio management) to certain accounts managed by the Investment Manager, including the Fund. These Participating Affiliates will provide services to the Investment Manager (or any affiliated investment subadviser to the Fund as the case may be) either pursuant to subadvisory agreements, personnel-sharing agreements or similar inter-company arrangements and the Fund will pay no additional fees and expenses as a result of any such arrangements.
These Participating Affiliates, like the Investment Manager, are direct or indirect subsidiaries of Ameriprise Financial and are registered with appropriate respective regulators in their home jurisdictions and, where required, the Securities and Exchange Commission and the Commodity Futures Trading Commission in the United States.
Pursuant to some of these arrangements, certain employees of these Participating Affiliates may serve as "associated persons" of the Investment Manager and, in this capacity, subject to the oversight and supervision of the Investment Manager and consistent with the investment objectives, policies and limitations set forth in the Fund's prospectus and Statement of Additional Information (SAI), may provide such services to the Fund on behalf of the Investment Manager.
Compensation of Board Members
Board members, who are not officers or employees of the Investment Manager or Ameriprise Financial, are compensated for their services to the Fund as disclosed in the Statement of Operations. These Board members may participate in a Deferred Compensation Plan (the Plan) which may be terminated at any time. Obligations of the Plan will be paid solely out of the Fund's assets, and all amounts payable under the Plan constitute a general unsecured obligation of the Fund.
Compensation of Chief Compliance Officer
The Board has appointed a Chief Compliance Officer to the Fund in accordance with federal securities regulations. The Fund is allocated a portion of the expenses associated with the Chief Compliance Officer based on relative net assets of the Trust.
Transfer Agency Fees
Under a Transfer and Dividend Disbursing Agent Agreement, Columbia Management Investment Services Corp. (the Transfer Agent), an affiliate of the Investment Manager and a wholly-owned subsidiary of Ameriprise Financial, is responsible for providing transfer agency services to the Fund. The Transfer Agent has contracted with Boston Financial Data Services (BFDS) to serve as sub-transfer agent. The Transfer Agent pays the fees of BFDS for services as sub-transfer agent and BFDS is not entitled to reimbursement for such fees from the Fund (with the exception of out-of-pocket fees).
The Fund pays the Transfer Agent a monthly transfer agency fee based on the number or the average value of accounts, depending on the type of account. In addition, prior to October 1, 2016, the Transfer Agent also received sub-transfer agency fees based on a percentage of the average aggregate value of the Fund's shares maintained in omnibus accounts (other than omnibus accounts for which American Enterprise Investment Services Inc. is the broker of record or accounts where the beneficial shareholder is a customer of Ameriprise Financial Services, Inc., for which the Transfer Agent receives a per account fee). Effective October 1, 2016, the Fund pays the Transfer Agent a fee for shareholder services based on the number of accounts or on a percentage of the average aggregate value of the Fund's shares maintained in omnibus accounts up to the lesser of the amount charged by the servicing agent or a cap established by the Board from time to time.
The Transfer Agent also receives compensation from the Fund for various shareholder services and
Annual Report 2016
31
COLUMBIA GLOBAL DIVIDEND OPPORTUNITY FUND
NOTES TO FINANCIAL STATEMENTS (continued)
August 31, 2016
reimbursements for certain out-of-pocket fees. Total transfer agency fees for Class R5 shares are subject to an annual limitation of not more than 0.05% of the average daily net assets attributable to Class R5 shares. Class I and Class Y shares do not pay transfer agency fees.
For the year ended August 31, 2016, the Fund's effective transfer agency fee rates as a percentage of average daily net assets of each class were as follows:
Class A | | | 0.37 | % | |
Class B | | | 0.37 | | |
Class C | | | 0.37 | | |
Class R | | | 0.37 | | |
Class R4 | | | 0.37 | | |
Class R5 | | | 0.05 | | |
Class W | | | 0.37 | | |
Class Z | | | 0.37 | | |
An annual minimum account balance fee of $20 may apply to certain accounts with a value below the applicable share class's initial minimum investment requirements to reduce the impact of small accounts on transfer agency fees. These minimum account balance fees are remitted to the Fund and recorded as part of expense reductions in the Statement of Operations. For the year ended August 31, 2016, these minimum account balance fees reduced total expenses of the Fund by $81,323.
Distribution and Service Fees
The Fund has an agreement with Columbia Management Investment Distributors, Inc. (the Distributor), an affiliate of the Investment Manager and a wholly-owned subsidiary of Ameriprise Financial, for distribution and shareholder services. The Board has approved, and the Fund has adopted, distribution and shareholder service plans (the Plans) applicable to certain share classes, which set the distribution and service fees for the Fund. These fees are calculated daily and are intended to compensate the Distributor and/or eligible selling and/or servicing agents for selling shares of the Fund and providing services to investors.
Under the Plans, the Fund pays a monthly service fee to the Distributor at the maximum annual rate of 0.25% of the average daily net assets attributable to Class A, Class B, Class C and Class W shares of the Fund. Also under the Plans, the Fund pays a monthly distribution fee to the Distributor at the maximum annual rates of 0.75%, 0.75%, 0.50% and 0.25% of the average daily net assets attributable to Class B, Class C, Class R and Class W shares of the Fund, respectively.
Although the Fund may pay a distribution fee up to 0.25% of the Fund's average daily net assets attributable to Class W shares and a service fee of up to 0.25% of the Fund's average daily net assets attributable to Class W shares, the aggregate fee shall not exceed 0.25% of the Fund's average daily net assets attributable to Class W shares.
Sales Charges
Sales charges, including front-end charges and CDSCs, received by the Distributor for distributing Fund shares were $42,848 for Class A, $0 for Class B and $1,049 for Class C shares for the year ended August 31, 2016.
Expenses Waived/Reimbursed by the Investment Manager and its Affiliates
The Fund's expense ratio is subject to an expense reimbursement arrangement pursuant to which fees will be waived and/or expenses reimbursed (excluding certain fees and expenses described below), so that the Fund's net operating expenses, after giving effect to fees waived/expenses reimbursed and any balance credits and/or overdraft charges from the Fund's custodian, do not exceed the annual rates of:
| | | Contractual
Expense Cap
January 1, 2016
through
December 31, 2016 | | Voluntary
Expense Cap
Prior to
January 1, 2016 | |
Class A | | | 1.30 | % | | | 1.30 | % | |
Class B | | | 2.05 | | | | 2.05 | | |
Class C | | | 2.05 | | | | 2.05 | | |
Class I | | | 0.85 | | | | 0.85 | | |
Class R | | | 1.55 | | | | 1.55 | | |
Class R4 | | | 1.05 | | | | 1.05 | | |
Class R5 | | | 0.90 | | | | 0.90 | | |
Class W | | | 1.30 | | | | 1.30 | | |
Class Y | | | 0.85 | | | | 0.85 | | |
Class Z | | | 1.05 | | | | 1.05 | | |
The contractual agreement may be modified or amended only with approval from the Investment Manager, certain of its affiliates and the Fund. Under the arrangements, the following fees and expenses are excluded from the waiver/reimbursement commitment, and therefore will be paid by the Fund, if applicable: taxes (including foreign transaction taxes), expenses associated with investments in affiliated and non-affiliated pooled investment vehicles (including mutual funds and exchange-traded funds), transaction costs and brokerage commissions, costs related to any securities lending
Annual Report 2016
32
COLUMBIA GLOBAL DIVIDEND OPPORTUNITY FUND
NOTES TO FINANCIAL STATEMENTS (continued)
August 31, 2016
program, dividend and interest expenses associated with securities sold short, inverse floater program fees and expenses, transaction charges and interest on borrowed money, interest and infrequent and/or unusual expenses. Any fees waived and/or expenses reimbursed under the expense reimbursement arrangements described above are not recoverable by the Investment Manager or its affiliates in future periods.
Note 4. Federal Tax Information
The timing and character of income and capital gain distributions are determined in accordance with income tax regulations, which may differ from GAAP because of temporary or permanent book to tax differences.
At August 31, 2016, these differences are primarily due to differing treatment for capital loss carryforwards, deferral/reversal of wash sale losses, Trustees' deferred compensation, foreign currency transactions, investments in partnerships, passive foreign investment company (PFIC) holdings, post-October capital losses and proceeds from regulatory settlements. To the extent these differences are permanent, reclassifications are made among the components of the Fund's net assets in the Statement of Assets and Liabilities. Temporary differences do not require reclassifications.
In the Statement of Assets and Liabilities the following reclassifications were made:
Undistributed net investment income | | $ | 1,158,827 | | |
Accumulated net realized loss | | | (1,091,468 | ) | |
Paid-in capital | | | (67,359 | ) | |
Net investment income (loss) and net realized gains (losses), as disclosed in the Statement of Operations, and net assets were not affected by this reclassification.
The tax character of distributions paid during the years indicated was as follows:
Year Ended August 31, | | 2016 | | 2015 | |
Ordinary income | | $ | 17,928,631 | | | $ | 32,302,700 | | |
Long-term capital gains | | | — | | | | 86,301,862 | | |
Total | | $ | 17,928,631 | | | $ | 118,604,562 | | |
Short-term capital gain distributions, if any, are considered ordinary income distributions for tax purposes.
At August 31, 2016, the components of distributable earnings on a tax basis were as follows:
Undistributed ordinary income | | $ | 9,719,540 | | |
Capital loss carryforwards | | | (12,431,340 | ) | |
Net unrealized appreciation | | | 40,919,908 | | |
At August 31, 2016, the cost of investments for federal income tax purposes was $565,086,641 and the aggregate gross unrealized appreciation and depreciation based on that cost was:
Unrealized appreciation | | $ | 57,467,313 | | |
Unrealized depreciation | | | (16,547,405 | ) | |
Net unrealized appreciation | | $ | 40,919,908 | | |
The following capital loss carryforwards, determined at August 31, 2016, may be available to reduce taxable income arising from future net realized gains on investments, if any, to the extent permitted by the Internal Revenue Code:
Year of Expiration | | Amount ($) | |
2017 | | | 8,531,694 | | |
No expiration — short-term | | | 3,798,463 | | |
No expiration — long-term | | | 101,183 | | |
Total | | | 12,431,340 | | |
Capital loss carryforwards with no expiration are required to be utilized prior to any capital losses which carry an expiration date. As a result of this ordering rule, capital loss carryforwards which carry an expiration date may be more likely to expire unused.
Under current tax rules, regulated investment companies can elect to treat certain late-year ordinary losses incurred and post-October capital losses (capital losses realized after October 31) as arising on the first day of the following taxable year. As of August 31, 2016, the Fund will elect to treat post-October capital losses of $45,670,005 as arising on September 1, 2016.
Management of the Fund has concluded that there are no significant uncertain tax positions in the Fund that would require recognition in the financial statements. However, management's conclusion may be subject to review and adjustment at a later date based on factors including, but not limited to, new tax laws, regulations, and administrative interpretations (including relevant court decisions). Generally, the Fund's federal tax returns for the prior three fiscal years remain subject to examination by the Internal Revenue Service.
Note 5. Portfolio Information
The cost of purchases and proceeds from sales of securities, excluding short-term investments and derivatives, if any, aggregated to $745,564,176 and $850,121,760, respectively, for the year ended August 31, 2016. The amount of purchase and sale activity impacts the portfolio turnover rate reported in the Financial Highlights.
Annual Report 2016
33
COLUMBIA GLOBAL DIVIDEND OPPORTUNITY FUND
NOTES TO FINANCIAL STATEMENTS (continued)
August 31, 2016
Note 6. Affiliated Money Market Fund
The Fund invests in Columbia Short-Term Cash Fund, an affiliated money market fund established for the exclusive use by the Fund and other affiliated funds (the Affiliated MMF). The income earned by the Fund from such investments is included as Dividends — affiliated issuers in the Statement of Operations. As an investing fund, the Fund indirectly bears its proportionate share of the expenses of the Affiliated MMF. Effective October 1, 2016, the Affiliated MMF prices its shares with a floating net asset value (NAV) and no longer seeks to maintain a stable NAV. In addition, the Board of the Affiliated MMF may impose a fee on redemptions (sometimes referred to as a liquidity fee) or temporarily suspend redemptions (sometimes referred to as imposing a redemption gate) in the event its liquidity falls below regulatory limits.
Note 7. Line of Credit
The Fund has access to a revolving credit facility whereby the Fund may borrow for the temporary funding of shareholder redemptions or for other temporary or emergency purposes. Effective December 8, 2015, Citibank, N.A. and HSBC Bank USA, N.A. joined JPMorgan Chase Bank, N.A. (JPMorgan) as lead of a syndicate of banks under the credit facility, which is a collective agreement between the Fund and certain other funds managed by the Investment Manager, severally and not jointly, that permits collective borrowings up to $1 billion. Interest is charged to each participating fund based on its borrowings at a rate equal to the higher of (i) the overnight federal funds rate plus 1.00% or (ii) the one-month LIBOR rate plus 1.00%. Each borrowing under the credit facility matures no later than 60 days after the date of borrowing. The Fund also pays a commitment fee equal to its pro rata share of the amount of the credit facility at a rate of 0.15% per annum. The commitment fee is included in other expenses in the Statement of Operations. Prior to December 8, 2015, JPMorgan was the sole lead bank under the credit facility agreement that permitted borrowings up to $550 million under the same terms and interest rates as described above with the exception of the commitment fee which was charged at a rate of 0.075% per annum.
The Fund had no borrowings during the year ended August 31, 2016.
Note 8. Significant Risks
Shareholder Concentration Risk
At August 31, 2016 Affiliated shareholders of record owned 12.7% of the outstanding shares of the Fund in one or more accounts. Subscription and redemption activity by concentrated accounts may have a significant effect on the operations of the Fund. In the case of a large redemption, the Fund may be forced to sell investments at inopportune times, including its liquid or more liquid positions, resulting in Fund losses and the Fund holding a higher percentage of less liquid or illiquid securities. Large redemptions could result in decreased economies of scale and increased operating expenses for non-redeeming Fund shareholders.
Foreign Securities and Emerging Market Countries Risk
Investing in foreign securities may include certain risks and considerations not typically associated with investing in U.S. securities, such as fluctuating currency values and changing local and regional economic, political and social conditions, which may result in greater market volatility. In addition, certain foreign securities may not be as liquid as U.S. securities. Investing in emerging markets may accentuate these risks. These countries are also more likely to experience high levels of inflation, deflation or currency devaluation which could hurt their economies and securities markets. To the extent that the Fund concentrates its investment exposure to any one or a few specific countries, the Fund will be particularly susceptible to the various conditions, events or other factors impacting those countries and may, therefore, have a greater risk than that of a fund which is more geographically diversified.
Financial Sector Risk
The Fund may be more susceptible to the particular risks that may affect companies in the financial services sector than if it were invested in a wider variety of companies in unrelated sectors. Companies in the financial services sector are subject to certain risks, including the risk of regulatory change, decreased liquidity in credit markets and unstable interest rates. Such companies may have concentrated portfolios, such as a high level of loans to real estate developers, which makes them vulnerable to economic conditions that affect that industry. Performance of such companies may be affected by competitive pressures and exposure to investments or agreements that, under certain
Annual Report 2016
34
COLUMBIA GLOBAL DIVIDEND OPPORTUNITY FUND
NOTES TO FINANCIAL STATEMENTS (continued)
August 31, 2016
circumstances, may lead to losses (e.g., subprime loans). Companies in the financial services sector are subject to extensive governmental regulation that may limit the amount and types of loans and other financial commitments they can make, and interest rates and fees that they may charge. In addition, profitability of such companies is largely dependent upon the availability and the cost of capital.
Note 9. Subsequent Events
Management has evaluated the events and transactions that have occurred through the date the financial statements were issued and noted no items requiring adjustment of the financial statements or additional disclosure.
Note 10. Information Regarding Pending and Settled Legal Proceedings
Ameriprise Financial and certain of its affiliates have historically been involved in a number of legal, arbitration and regulatory proceedings, including routine litigation, class actions, and governmental actions, concerning matters arising in connection with the conduct of their business activities. Ameriprise Financial believes that the Funds are not currently the subject of, and that neither Ameriprise Financial nor any of its affiliates are the subject of, any pending legal, arbitration or regulatory proceedings that are likely to have a material adverse effect on the Funds or the ability of Ameriprise Financial or its affiliates to perform under their contracts with the Funds. Ameriprise Financial is required to make quarterly (10-Q), annual (10-K) and, as necessary, 8-K filings with the Securities and Exchange Commission (SEC) on legal and regulatory matters that relate to Ameriprise Financial and its affiliates. Copies of these filings may be obtained by accessing the SEC website at www.sec.gov.
There can be no assurance that these matters, or the adverse publicity associated with them, will not result in increased fund redemptions, reduced sale of fund shares or other adverse consequences to the Funds. Further, although we believe proceedings are not likely to have a material adverse effect on the Funds or the ability of Ameriprise Financial or its affiliates to perform under their contracts with the Funds, these proceedings are subject to uncertainties and, as such, we are unable to estimate the possible loss or range of loss that may result. An adverse outcome in one or more of these proceedings could result in adverse judgments,
settlements, fines, penalties or other relief that could have a material adverse effect on the consolidated financial condition or results of operations of Ameriprise Financial.
Annual Report 2016
35
COLUMBIA GLOBAL DIVIDEND OPPORTUNITY FUND
REPORT OF INDEPENDENT REGISTERED PUBLIC ACCOUNTING FIRM
To the Trustees of Columbia Funds Series Trust I and the Shareholders of
Columbia Global Dividend Opportunity Fund
In our opinion, the accompanying statement of assets and liabilities, including the portfolio of investments, and the related statements of operations and of changes in net assets and the financial highlights present fairly, in all material respects, the financial position of Columbia Global Dividend Opportunity Fund (the "Fund," a series of Columbia Funds Series Trust I) at August 31, 2016, and the results of its operations, the changes in its net assets and the financial highlights for each of the periods indicated, in conformity with accounting principles generally accepted in the United States of America. These financial statements and financial highlights (hereafter referred to as "financial statements") are the responsibility of the Fund's management. Our responsibility is to express an opinion on these financial statements based on our audits. We conducted our audits of these financial statements in accordance with the standards of the Public Company Accounting Oversight Board (United States). Those standards require that we plan and perform the audit to obtain reasonable assurance about whether the financial statements are free of material misstatement. An audit includes examining, on a test basis, evidence supporting the amounts and disclosures in the financial statements, assessing the accounting principles used and significant estimates made by management, and evaluating the overall financial statement presentation. We believe that our audits, which included confirmation of securities at August 31, 2016 by correspondence with the custodian, brokers and transfer agent, provide a reasonable basis for our opinion.
PricewaterhouseCoopers LLP
Minneapolis, MN
October 21, 2016
Annual Report 2016
36
COLUMBIA GLOBAL DIVIDEND OPPORTUNITY FUND
FEDERAL INCOME TAX INFORMATION
(Unaudited)
The Fund hereby designates the following tax attributes for the fiscal year ended August 31, 2016. Shareholders will be notified in early 2017 of the amounts for use in preparing 2016 income tax returns.
Tax Designations
Qualified Dividend Income | | | 96.54 | % | |
Dividends Received Deduction | | | 38.37 | % | |
Foreign Taxes Paid | | $ | 1,282,914 | | |
Foreign Taxes Paid Per Share | | $ | 0.04 | | |
Foreign Source Income | | $ | 16,971,514 | | |
Foreign Source Income Per Share | | $ | 0.47 | | |
Qualified Dividend Income. For taxable, non-corporate shareholders, the percentage of ordinary income distributed during the fiscal year that represents qualified dividend income subject to reduced tax rates.
Dividends Received Deduction. The percentage of ordinary income distributed during the fiscal year that qualifies for the corporate dividends received deduction.
Foreign Taxes. The Fund makes the election to pass through to shareholders the foreign taxes paid. Eligible shareholders may claim a foreign tax credit. These taxes, and the corresponding foreign source income, are provided.
Annual Report 2016
37
COLUMBIA GLOBAL DIVIDEND OPPORTUNITY FUND
Shareholders elect the Board that oversees the Fund's operations. The Board appoints officers who are responsible for day-to-day business decisions based on policies set by the Board. The following table provides basic biographical information about the Fund's Trustees, including their principal occupations during the past five years, although specific titles for individuals may have varied over the period. The year set forth beneath Length of Service in the table below is the year in which the Trustee was first appointed or elected as Trustee to any Fund currently in the Columbia Funds Complex or a predecessor thereof. Under current Board policy, members serve terms of indefinite duration.
Trustees
Independent Trustees
Name,
Address,
Year of Birth | | Position Held With
the Trust and Length of
Service | | Principal Occupation(s)
During the Past Five Years
and Other Relevant
Professional Experience | | Number of
Funds in the
Columbia Funds
Complex
Overseen | | Other Directorships
Held by Trustee During
the Past Five Years | |
Janet Langford Carrig
c/o Columbia
Management Investment Advisers, LLC,
225 Franklin Street
Mail Drop BX32 05228,
Boston, MA 02110
1957 | | Trustee 1996 | | Senior Vice President, General Counsel and Corporate Secretary, ConocoPhillips (integrated energy company) since September 2007 | | | 56 | | | None | |
Douglas A. Hacker
c/o Columbia Management Investment Advisers, LLC,
225 Franklin Street
Mail Drop BX32 05228,
Boston, MA 02110
1955 | | Trustee and Chairman of the Board 1996 | | Independent business executive since May 2006; Executive Vice President — Strategy of United Airlines from December 2002 to May 2006; President of UAL Loyalty Services (airline marketing company) from September 2001 to December 2002; Executive Vice President and Chief Financial Officer of United Airlines from July 1999 to September 2001 | | | 56 | | | Spartan Nash Company (food distributor); Nash Finch Company (food distributor) from 2005 to 2013; Aircastle Limited (aircraft leasing); SeaCube Container Leasing Ltd. (container leasing) from 2010 to 2013; and Travelport Worldwide Limited (travel information technology) | |
Nancy T. Lukitsh
c/o Columbia Management Investment Advisers, LLC,
225 Franklin Street
Mail Drop BX32 05228,
Boston, MA 02110
1956 | | Trustee 2011 | | Senior Vice President, Partner and Director of Marketing, Wellington Management Company, LLP (investment adviser) from 1997 to 2010; Chair, Wellington Management Portfolios (commingled non-U.S. investment pools) from 2007 to 2010; Director, Wellington Trust Company, NA and other Wellington affiliates from 1997 to 2010 | | | 56 | | | None | |
Annual Report 2016
38
COLUMBIA GLOBAL DIVIDEND OPPORTUNITY FUND
TRUSTEES AND OFFICERS (continued)
Independent Trustees (continued)
Name,
Address,
Year of Birth | | Position Held With
the Trust and Length of
Service | | Principal Occupation(s)
During the Past Five Years
and Other Relevant
Professional Experience | | Number of
Funds in the
Columbia Funds
Complex
Overseen | | Other Directorships
Held by Trustee During
the Past Five Years | |
William E. Mayer
c/o Columbia Management Investment Advisers, LLC,
225 Franklin Street
Mail Drop BX32 05228,
Boston, MA 02110
1940 | | Trustee 1991 | | Partner, Park Avenue Equity Partners (private equity) since February 1999 | | | 56 | | | DynaVox Inc. (speech creation); Lee Enterprises (print media); WR Hambrecht + Co. (financial service provider) from 2000 to 2012; BlackRock Capital Investment Corporation (investment company); and Premier, Inc. (healthcare) | |
David M. Moffett
c/o Columbia Management Investment Advisers, LLC,
225 Franklin Street
Mail Drop BX32 05228,
Boston, MA 02110
1952 | | Trustee 2011 | | Retired. Consultant to Bridgewater and Associates | | | 56 | | | Director of CIT Bank, CIT Group Inc. (commercial and consumer finance); eBay Inc. (online trading community); Genworth Financial, Inc. (financial and insurance products and services); Paypal Holdings Inc. (payment and data processing services); and Trustee University of Oklahoma Foundation | |
Charles R. Nelson
c/o Columbia Management Investment Advisers, LLC,
225 Franklin Street
Mail Drop BX32 05228,
Boston, MA 02110
1942 | | Trustee 1981 | | Retired. Professor Emeritus, University of Washington since 2011; Professor of Economics, University of Washington from 1976 to 2011; Ford and Louisa Van Voorhis Professor of Political Economy, University of Washington from 1993 to 2011; Adjunct Professor of Statistics, University of Washington from 1980 to 2011; Associate Editor, Journal of Money, Credit and Banking from September 1993 to 2008; consultant on econometric and statistical matters | | | 56 | | | None | |
John J. Neuhauser
c/o Columbia Management Investment Advisers, LLC,
225 Franklin Street
Mail Drop BX32 05228,
Boston, MA 02110
1943 | | Trustee 1984 | | President, Saint Michael's College since August 2007; Director or Trustee of several non-profit organizations, including University of Vermont Medical Center; Academic Vice President and Dean of Faculties, Boston College from August 1999 to October 2005; University Professor, Boston College from November 2005 to August 2007 | | | 56 | | | Liberty All-Star Equity Fund and Liberty All-Star Growth Fund (closed-end funds) | |
Annual Report 2016
39
COLUMBIA GLOBAL DIVIDEND OPPORTUNITY FUND
TRUSTEES AND OFFICERS (continued)
Independent Trustees (continued)
Name,
Address,
Year of Birth | | Position Held With
the Trust and Length of
Service | | Principal Occupation(s)
During the Past Five Years
and Other Relevant
Professional Experience | | Number of
Funds in the
Columbia Funds
Complex
Overseen | | Other Directorships
Held by Trustee During
the Past Five Years | |
Patrick J. Simpson
c/o Columbia Management Investment Advisers, LLC,
225 Franklin Street
Mail Drop BX32 05228,
Boston, MA 02110
1944 | | Trustee 2000 | | Of Counsel, Perkins Coie LLP (law firm) since 2015; Partner, Perkins Coie LLP from 1988 to 2014 | | | 56 | | | None | |
Anne-Lee Verville
c/o Columbia Management Investment Advisers, LLC,
225 Franklin Street
Mail Drop BX32 05228,
Boston, MA 02110
1945 | | Trustee 1998 | | Retired. General Manager, Global Education Industry from 1994 to 1997, President — Application Systems Division from 1991 to 1994, Chief Financial Officer — US Marketing & Services from 1988 to 1991, and Chief Information Officer from 1987 to 1988, IBM Corporation (computer and technology) | | | 56 | | | Enesco Group, Inc. (producer of giftware and home and garden decor products) from 2001 to 2006 | |
Consultant to the Trustees*
Name,
Address,
Year of Birth | | Position Held With
the Trust and Length of
Service | | Principal Occupation(s)
During the Past Five Years
and Other Relevant
Professional Experience | | Number of
Funds in the
Columbia Funds
Complex
Overseen | | Other Directorships
Held by Trustee During
the Past Five Years | |
J. Kevin Connaughton
c/o Columbia
Management Investment Advisers, LLC,
225 Franklin Street
Mail Drop BX32 05228,
Boston, MA 02110
1964 | | Trustee Consultant 2016 | | Trustee Consultant, Columbia Funds since March 2016; Managing Director and General Manager of Mutual Fund Products, Columbia Management Investment Advisers, LLC from May 2010 to February 2015; President, Columbia Funds from 2009 to 2015; and senior officer of Columbia Funds and affiliated funds from 2003 to 2015 | | | 56 | | | Board of Governors, Gateway Healthcare since January 2016; Trustee, New Century Portfolios since March 2015; and Director, The Autism Project since March 2015 | |
* J. Kevin Connaughton was appointed consultant to the Trustees effective March 1, 2016. Shareholders of the Funds are expected to be asked to elect Mr. Connaughton as a Trustee at a future shareholder meeting.
Annual Report 2016
40
COLUMBIA GLOBAL DIVIDEND OPPORTUNITY FUND
TRUSTEES AND OFFICERS (continued)
Interested Trustee Affiliated with Investment Manager*
Name,
Address,
Year of Birth | | Position Held With
the Trust and Length of
Service | | Principal Occupation(s)
During the Past Five Years
and Other Relevant
Professional Experience | | Number of
Funds in the
Columbia Funds
Complex
Overseen | | Other Directorships
Held by Trustee During
the Past Five Years | |
William F. Truscott
c/o Columbia Management Investment Advisers, LLC,
225 Franklin Street
Boston, MA 02110
1960 | | Trustee 2012 | | Chairman of the Board and President, Columbia Management Investment Advisers, LLC since May 2010 and February 2012, respectively; Chief Executive Officer, Global Asset Management, Ameriprise Financial, Inc. since September 2012 (previously Chief Executive Officer, U.S. Asset Management & President, Annuities, May 2010- September 2012); Director and Chief Executive Officer, Columbia Management Investment Distributors, Inc. since May 2010 and February 2012, respectively; Chairman of the Board and Chief Executive Officer, RiverSource Distributors, Inc. since 2006; Director, Threadneedle Asset Management Holdings, SARL since 2014; President and Chief Executive Officer, Ameriprise Certificate Company, 2006-August 2012. | | | 184 | | | Trustee to other Columbia Funds since 2001; Chairman of the Board, Columbia Management Investment Advisers, LLC since May 2010; Director, Columbia Management Investment Distributors, Inc. since May 2010; Former Director, Ameriprise Certificate Company, 2006-January 2013 | |
* Interested person (as defined under the 1940 Act) by reason of being an officer, director, security holder and/or employee of the Investment Manager or Ameriprise Financial.
The Statement of Additional Information has additional information about the Fund's Board members and is available, without charge, upon request by calling 800.345.6611; contacting your financial intermediary; or visiting investor.columbiathreadneedleus.com.
Annual Report 2016
41
COLUMBIA GLOBAL DIVIDEND OPPORTUNITY FUND
TRUSTEES AND OFFICERS (continued)
The Board has appointed officers who are responsible for day-to-day business decisions based on policies it has established. The officers serve at the pleasure of the Board. The following table provides basic information about the Officers of the Fund, including principal occupations during the past five years, although their specific titles may have varied over the period. In addition to Mr. Truscott, who is Senior Vice President, the Fund's other officers are:
Fund Officers
Name,
Address and
Year of Birth | | Position and Year
First Appointed to
Position for any Fund
in the Columbia
Funds Complex or a
Predecessor Thereof | |
Principal Occupation(s) During Past Five Years | |
Christopher O. Petersen
5228 Ameriprise Financial Center
Minneapolis, MN 55474
Born 1970 | | President and Principal Executive Officer (2015) | | Vice President and Lead Chief Counsel, Ameriprise Financial, Inc. since January 2015 (previously, Vice President and Chief Counsel January 2010-December 2014; officer of Columbia Funds and affiliated funds since 2007. | |
Michael G. Clarke
225 Franklin Street
Boston, MA 02110
Born 1969 | | Treasurer (2011), Chief Financial Officer (2009) and Chief Accounting Officer (2015) | | Vice President — Mutual Fund Administration, Columbia Management Investment Advisers, LLC, since May 2010; senior officer of Columbia Funds and affiliated funds since 2002. | |
Paul B. Goucher
100 Park Avenue
New York, NY 10017
Born 1968 | | Senior Vice President (2011), Chief Legal Officer (2015) and Assistant Secretary (2008) | | Vice President and Lead Chief Counsel, Ameriprise Financial, Inc. since November 2008 and January 2013, respectively (previously Chief Counsel, January 2010-January 2013); Vice President, Chief Legal Officer and Assistant Secretary, Columbia Management Investment Advisers, LLC since May 2010. | |
Thomas P. McGuire
225 Franklin Street
Boston, MA 02110
Born 1972 | | Senior Vice President and Chief Compliance Officer (2012) | | Vice President — Asset Management Compliance, Ameriprise Financial, Inc., since May 2010; Chief Compliance Officer, Ameriprise Certificate Company since September 2010. | |
Colin Moore
225 Franklin Street
Boston, MA 02110
Born 1958 | | Senior Vice President (2010) | | Executive Vice President and Global Chief Investment Officer, Ameriprise Financial, Inc., since July 2013; Executive Vice President and Global Chief Investment Officer, Columbia Management Investment Advisers, LLC since July 2013 (previously Director and Global Chief Investment Officer, 2010-2013). | |
Michael E. DeFao
225 Franklin Street
Boston, MA 02110
Born 1968 | | Vice President (2011) and Assistant Secretary (2010) | | Vice President and Chief Counsel, Ameriprise Financial, Inc. since May 2010. | |
Amy Johnson
5228 Ameriprise Financial Center
Minneapolis, MN 55474
Born 1965 | | Vice President (2006) | | Managing Director and Global Head of Operations, Columbia Management Investment Advisers, LLC since April 2016 (previously Managing Director and Chief Operating Officer, 2010-2016). | |
Lyn Kephart-Strong
5228 Ameriprise
Financial Center
Minneapolis, MN 55474
Born 1960 | | Vice President (2015) | | President, Columbia Management Investment Services Corp. since October 2014; Vice President & Resolution Officer, Ameriprise Trust Company since August 2009. | |
Ryan C. Larrenaga
225 Franklin Street
Boston, MA 02110
Born 1970 | | Vice President and Secretary (2015) | | Vice President and Group Counsel, Ameriprise Financial, Inc. since August 2011; officer of Columbia Funds and affiliated funds since 2005. | |
Annual Report 2016
42
COLUMBIA GLOBAL DIVIDEND OPPORTUNITY FUND
BOARD CONSIDERATION AND APPROVAL OF MANAGEMENT AGREEMENT
On June 10, 2016, the Board of Trustees (the Board) and the Trustees who are not interested persons (as defined in the Investment Company Act of 1940) (the Independent Trustees) of Columbia Funds Series Trust I (the Trust) unanimously approved the continuation of the Management Agreement (the Management Agreement) with Columbia Management Investment Advisers, LLC (the Investment Manager) with respect to Columbia Global Dividend Opportunity Fund (the Fund), a series of the Trust. As detailed below, the Board's Advisory Fees and Expenses Committee (the Committee) and the Board met on multiple occasions to review and discuss, both among themselves and with the management team of the Investment Manager, materials provided by the Investment Manager and others before determining to approve the continuation of the Management Agreement.
In connection with their deliberations regarding the continuation of the Management Agreement, the Committee and the Board evaluated materials requested from the Investment Manager regarding the Fund and the Management Agreement, and discussed these materials with representatives of the Investment Manager at Committee meetings held on March 8, 2016, April 27, 2016 and June 9, 2016 and at Board meetings held on March 9, 2016 and June 10, 2016. In addition, the Board considers matters bearing on the Management Agreement at most of its other meetings throughout the year and meets regularly with senior management of the Trust and the Investment Manager. Through the Board's Investment Oversight Committees, Trustees also meet with selected portfolio managers of the funds the Trustees oversee and other investment personnel at various times throughout the year. The Committee and the Board also consulted with its independent fee consultant, Fund counsel and with the Independent Trustees' independent legal counsel, who advised on various matters with respect to the Committee's and the Board's considerations and otherwise assisted the Committee and the Board in their deliberations. On June 9, 2016, the Committee recommended that the Board approve the continuation of the Management Agreement. On June 10, 2016, the Board, including the Independent Trustees, voting separately, unanimously approved the continuation of the Management Agreement for the Fund.
The Committee and the Board considered all information that they, their legal counsel or the Investment Manager believed reasonably necessary to evaluate and to determine whether to recommend for approval or approve the continuation of the Management Agreement. The information and factors considered by the Committee and the Board in recommending for approval or approving the continuation of the Management Agreement for the Fund included the following:
• Information on the investment performance of the Fund relative to the performance of a group of mutual funds determined to be comparable to the Fund by an independent third-party data provider, as well as performance relative to benchmarks;
• Information on the Fund's management fees and total expenses, including information comparing the Fund's expenses to those of a group of comparable mutual funds, as determined by the independent third-party data provider;
• The Investment Manager's agreement to contractually limit or cap total operating expenses for the Fund through December 31, 2017 so that total operating expenses (excluding certain fees and expenses, such as transaction costs and certain other investment related expenses, interest, taxes, acquired fund fees and expenses, and infrequent and/or unusual expenses) would not exceed a specified annual rate, as a percentage of the Fund's net assets;
• The terms and conditions of the Management Agreement;
• The current and proposed terms and conditions of other agreements and arrangements with affiliates of the Investment Manager relating to the operations of the Fund, including agreements with respect to the provision of distribution and transfer agency services to the Fund;
• Descriptions of various functions performed by the Investment Manager under the Management Agreement, including portfolio management and portfolio trading practices;
• Information regarding the management fees of similarly-managed portfolios of other clients of the Investment Manager, including institutional separate accounts;
Annual Report 2016
43
COLUMBIA GLOBAL DIVIDEND OPPORTUNITY FUND
BOARD CONSIDERATION AND APPROVAL OF MANAGEMENT AGREEMENT (continued)
• Information regarding the reputation, regulatory history and resources of the Investment Manager, including information regarding senior management, portfolio managers and other personnel;
• Information regarding the capabilities of the Investment Manager with respect to compliance monitoring services, including an assessment of the Investment Manager's compliance system by the Fund's Chief Compliance Officer; and
• The profitability to the Investment Manager and its affiliates from their relationships with the Fund.
Nature, Extent and Quality of Services Provided under the Management Agreement
The Committee and the Board considered the nature, extent and quality of services provided to the Fund by the Investment Manager and its affiliates under the Management Agreement and under separate agreements for the provision of transfer agency services, and the resources dedicated to the Fund and the other Columbia Funds by the Investment Manager and its affiliates. The Committee and the Board considered, among other things, the Investment Manager's ability to attract, motivate and retain highly qualified research, advisory and supervisory investment professionals (including personnel and other resources, compensation programs for personnel involved in fund management, reputation and other attributes), the portfolio management services provided by those investment professionals, and the quality of the Investment Manager's investment research capabilities and trade execution services. The Committee and the Board also considered the potential benefits to shareholders of investing in a mutual fund that is part of a fund complex offering exposure to a variety of asset classes and investment disciplines and providing a variety of fund and shareholder services.
The Committee and the Board also considered the professional experience and qualifications of the senior personnel of the Investment Manager, which included consideration of the Investment Manager's experience with similarly-structured funds. The Committee and the Board noted the compliance programs of and the compliance-related resources provided to the Fund by the Investment Manager and its affiliates, and considered the Investment Manager's ability to provide administrative services to the Fund and coordinate the activities of the Fund's other service providers. After reviewing these and related factors, the Committee and the Board concluded, within the context of their overall conclusions, that the nature, extent and quality of the services provided to the Fund under the Management Agreement supported the continuation of the Management Agreement.
Investment Performance
The Committee and the Board reviewed information about the performance of the Fund over various time periods, including performance information relative to benchmarks and information based on reports of the independent third-party data provider that compared the performance of the Fund to the performance of a group of comparable mutual funds, and data provided by the independent fee consultant. The Committee and the Board also reviewed a description of the third party's methodology for identifying the Fund's peer groups for purposes of performance and expense comparisons. Although the Fund's performance lagged that of a relevant peer group for certain (although not necessarily all) periods, the Committee and the Board concluded that other factors relevant to performance were sufficient, in light of other considerations, to warrant continuation of the Management Agreement. Those factors included one or more of the following: (i) that the Fund's performance, although lagging in certain recent periods, was stronger over the longer term; (ii) that the underperformance was attributable, to a significant extent, to investment decisions that were reasonable and consistent with the Fund's investment strategy and policies and that the Fund was performing within a reasonable range of expectations, given those investment decisions, market conditions and the Fund's investment strategy; (iii) that the Fund's performance was competitive when compared to other relevant performance benchmarks or peer groups; and (iv) that the Investment Manager had taken or was taking steps designed to help improve the Fund's investment performance, including, but not limited to, replacing portfolio managers, enhancing the resources supporting the portfolio managers, or modifying investment strategies.
The Committee and the Board noted that, through December 31, 2015, the Fund's performance was in the seventy-ninth, seventy-seventh and ninety-fourth percentile (where the best performance would be in the first
Annual Report 2016
44
COLUMBIA GLOBAL DIVIDEND OPPORTUNITY FUND
BOARD CONSIDERATION AND APPROVAL OF MANAGEMENT AGREEMENT (continued)
percentile) of its category selected by the independent third-party data provider for the purposes of performance comparisons for the one-, three- and five- year periods, respectively.
The Committee and the Board also considered the Investment Manager's performance and reputation generally, the Investment Manager's historical responsiveness to Board concerns about performance, and the Investment Manager's willingness to take steps intended to improve performance. After reviewing these and related factors, the Committee and the Board concluded, within the context of their overall conclusions, that the performance of the Fund and the Investment Manager was sufficient, in light of other considerations, to warrant the continuation of the Management Agreement.
Investment Management Fee Rates and Other Expenses
The Committee and the Board considered the management fees charged to the Fund under the Management Agreement as well as the total expenses incurred by the Fund. In assessing the reasonableness of the fees under the Management Agreement, the Committee and the Board considered, among other information, the Fund's management fee and its total expense ratio as a percentage of average daily net assets. The Committee and the Board considered data provided by the independent fee consultant. The Committee and the Board noted that, as of December 31, 2015, the Fund's actual management fee and net total expense ratio are both ranked in the third quintile (where the lowest fees and expenses would be in the first quintile) against the Fund's expense universe as determined by the independent third-party data provider for purposes of expense comparison. The Committee and the Board also took into account the fee waiver and expense limitation arrangements agreed to by the Investment Manager, as noted above.
The Committee and the Board also received and considered information about the management fees charged by the Investment Manager to institutional separate accounts. In considering the fees charged to those accounts, the Committee and the Board took into account, among other things, the Investment Manager's representations about the differences between managing mutual funds as compared to other types of accounts, including differences in the services provided, differences in the risk profile of such business for the Investment Manager and the additional resources required to manage mutual funds effectively. The Committee and the Board also received and considered information about the fees charged by the Investment Manager for sub-advisory services provided to comparable unaffiliated funds. In evaluating the Fund's management fees, the Committee and the Board also took into account the demands, complexity and quality of the investment management of the Fund.
After reviewing these and related factors, the Committee and the Board concluded, within the context of their overall conclusions, that the management fee rates and expenses of the Fund were sufficient, in light of other considerations, to warrant the continuation of the Management Agreement.
Costs of Services Provided and Profitability
The Committee and the Board also took note of the costs the Investment Manager and its affiliates incur in connection with the services provided (both on an absolute and relative basis) and the profitability to the Investment Manager and its affiliates in connection with their relationships with the Fund.
The Committee and the Board also considered the compensation directly or indirectly received by the Investment Manager's affiliates in connection with their relationships with the Fund. The Committee and the Board reviewed information provided by management as to the profitability to the Investment Manager and its affiliates of their relationships with the Fund, information about the allocation of expenses used to calculate profitability, and comparisons of profitability levels realized in 2015 to profitability levels realized in 2014. When reviewing profitability, the Committee and the Board also considered court cases in which adviser profitability was an issue in whole or in part, the performance of similarly managed funds, the performance of the Fund, and the expense ratio of the Fund. In addition, the Committee and the Board considered information provided by the Investment Manager regarding the Investment Manager's financial condition and comparing its profitability to that of other asset management firms that are, or are subsidiaries of, publicly traded companies. In this regard, the Committee and the Board also considered data provided by the independent fee consultant.
Annual Report 2016
45
COLUMBIA GLOBAL DIVIDEND OPPORTUNITY FUND
BOARD CONSIDERATION AND APPROVAL OF MANAGEMENT AGREEMENT (continued)
After reviewing these and related factors, the Committee and the Board concluded, within the context of their overall conclusions, that the costs of services provided and the profitability to the Investment Manager and its affiliates from their relationships with the Fund supported the continuation of the Management Agreement.
Economies of Scale
The Committee and the Board considered the potential existence of economies of scale in the provision by the Investment Manager of services to the Fund, to groups of related funds, and to the Investment Manager's investment advisory clients as a whole, and whether those economies of scale were shared with the Fund through breakpoints in investment management fees or other means, such as expense limitation arrangements and additional investments by the Investment Manager in investment, trading and compliance resources. The Committee and the Board noted that the management fee schedules for the Fund contained breakpoints that would reduce the fee rate on assets above specified threshold levels.
In considering these matters, the Committee and the Board also considered the costs of the services provided and the profitability to the Investment Manager and its affiliates from their relationships with the Fund, as discussed above. After reviewing these and related factors, the Committee and the Board concluded, within the context of their overall conclusions, that the extent to which any economies of scale were expected to be shared with the Fund supported the continuation of the Management Agreement.
Other Benefits to the Investment Manager
The Committee and the Board received and considered information regarding "fall-out" or ancillary benefits received by the Investment Manager and its affiliates as a result of their relationships with the Fund, such as the engagement of the Investment Manager's affiliates to provide distribution and transfer agency services to the Fund. In this regard, among other matters, the Committee and the Board considered that the Fund's distributor retains a portion of the distribution fees from the Fund and receives a portion of the sales charges on sales or redemptions of certain classes of shares of the Fund. The Committee and the Board also considered the benefits of research made available to the Investment Manager by reason of brokerage commissions generated by the Fund's securities transactions, and reviewed information about the Investment Manager's practices with respect to allocating portfolio transactions for brokerage and research services. The Committee and the Board considered the possible conflicts of interest associated with certain fall-out or other ancillary benefits and the reporting, disclosure and other processes that are in place to address such possible conflicts of interest. The Committee and the Board recognized that the Investment Manager's profitability would be somewhat lower without these benefits.
Conclusion
The Committee and the Board reviewed all of the above considerations in reaching their decisions to recommend or approve the continuation of the Management Agreement. In their deliberations, the Trustees did not identify any particular information that was all-important or controlling, and individual Trustees may have attributed different weights to the various factors. Based on their evaluation of all factors that they deemed to be material, including those factors described above, and assisted by the advice of independent legal counsel, the Board, including the Independent Trustees, voting separately, unanimously approved the continuation of the Management Agreement.
Annual Report 2016
46
COLUMBIA GLOBAL DIVIDEND OPPORTUNITY FUND
IMPORTANT INFORMATION ABOUT THIS REPORT
Each fund mails one shareholder report to each shareholder address. If you would like more than one report, please call shareholder services at 800.345.6611 and additional reports will be sent to you.
The policy of the Board is to vote the proxies of the companies in which each fund holds investments consistent with the procedures as stated in the Statement of Additional Information (SAI). You may obtain a copy of the SAI without charge by calling 800.345.6611; contacting your financial intermediary; visiting investor.columbiathreadneedleus.com; or searching the website of the Securities and Exchange Commission (SEC) at sec.gov. Information regarding how each fund voted proxies relating to portfolio securities is filed with the SEC by August 31st for the most recent 12-month period ending June 30th of that year, and is available without charge by visiting investor.columbiathreadneedleus.com, or searching the website of the SEC at sec.gov.
Each fund files a complete schedule of portfolio holdings with the SEC for the first and third quarters of each fiscal year on Form N-Q. Each fund's Form N-Q is available on the SEC's website at sec.gov and may be reviewed and copied at the SEC's Public Reference Room in Washington, D.C. Information on the operation of the Public Reference Room may be obtained by calling 800.SEC.0330. Each fund's complete schedule of portfolio holdings, as filed on Form N-Q, can also be obtained without charge, upon request, by calling 800.345.6611.
Annual Report 2016
47
Columbia Global Dividend Opportunity Fund
P.O. Box 8081
Boston, MA 02266-8081

Please read and consider the investment objectives, risks, charges and expenses for any fund carefully before investing. For a prospectus and summary prospectus, which contains this and other important information about the Fund, go to investor.columbiathreadneedleus.com. The Fund is distributed by Columbia Management Investment Distributors, Inc., member FINRA, and managed by Columbia Management Investment Advisers, LLC.
Columbia Threadneedle Investments (Columbia Threadneedle) is the global brand name of the Columbia and Threadneedle group of companies.
All rights reserved. Columbia Management Investment Distributors, Inc., 225 Franklin Street, Boston, MA 02110-2804
© 2016 Columbia Management Investment Advisers, LLC.
investor.columbiathreadneedleus.com
ANN154_08_F01_(10/16)

ANNUAL REPORT
August 31, 2016

COLUMBIA GREATER CHINA FUND

 Dear Shareholders,
Volatility comes with the territory for long-term investors. Some investors instinctively want to pull out of the market or sell underperforming investments at the first sign of increased volatility or perhaps even as soon as they perceive it on the horizon. But taking yourself out of the market could mean losing out on potential opportunities, and putting your longer term investment goals at risk.
Cumulative return is not just about achieving high returns when markets are going up; it's also about remaining invested and minimizing losses during weak or volatile markets so that you can participate on the upside. Developing a deeper understanding of the various risks your portfolio is subject to can help you balance these risks.
Diversification is critical in seeking to achieve that balance. We believe that most portfolios could be more effectively diversified either by introducing holdings with performance profiles unrelated to existing holdings (like alternative products) or by rebalancing existing holdings with an eye toward risk allocation. Over time, distributing risk more evenly may produce a more pronounced diversification benefit and may improve portfolio efficiency. We believe market volatility can create significant opportunities and, in fact, these periods may be some of the very best times to invest.
With this in mind, I thought it important to highlight excerpts from a piece written by Colin Moore, Global Chief Investment Officer, in which he touches on some of these issues emphasizing the importance of a properly constructed portfolio in seeking to effectively manage volatility and to achieve consistency of returns. I encourage you to read the article in its entirety. To access the full article and for other insights on current market, please visit blog.columbiathreadneedleus.com/latest-perspectives.
You need investments that are designed to help you ease the impact of volatile market environments and keep the savings you have worked tirelessly to amass. Columbia Threadneedle Investments provides investment solutions to help you tackle financial challenges and achieve your desired outcome.
Best regards,

Christopher O. Petersen
President, Columbia Funds
Excerpts from:
Taking the scare out of the volatility bogeyman
By Colin Moore, Global Chief Investment Officer
Colin Moore is the global chief investment officer for Columbia Threadneedle Investments. His responsibilities include ensuring that a disciplined investment process is in place across all asset classes, including equity and fixed income. Mr. Moore joined one of the Columbia Threadneedle Investments legacy firms in 2002 as head of equity and was also head of fixed income and liquidity strategies from 2009 – 2010.

n In today's low growth, higher volatility world, the emphasis is shifting from maximization of returns to consistency of returns.
PRESIDENT'S MESSAGE (continued)
n Portfolios should represent the behavioral risk-return tradeoff of investors, remembering that they won't stay invested to realize the return if we get the risk tolerance wrong.
n Holding long-term savings in cash to avoid volatility (the financial equivalent of hiding under the sheets) is detrimental to achieving long-term goals.
According to Wikipedia, "The bogeyman is a common allusion to a mythical creature in many cultures used to control behavior. This monster has no specific appearance, and conceptions about it can vary drastically from household to household within the same community; in many cases he has no set appearance in the mind of an adult or child, but is simply a non-specific embodiment of terror." Different cultures have different names and physical representations for the bogeyman, and investors are no different. We have terrible monsters that we fear may destroy our portfolios, and we call one of the scariest of them volatility.
While the bogeyman is mythical (I hope!), volatility is real and can cause serious damage. To understand why investors have such a hard time coping with volatility, we first need to define three cognitive biases at work in today's investment environment:
1) Recency bias — something that has recently come to the forefront of our attention, regardless of how long established it is, suddenly seems to appear with improbable frequency.
2) Negativity bias — we tend to have a greater recall of unpleasant memories than positive memories.
3) Loss aversion — our dissatisfaction with losing money tends to be greater than our satisfaction with making money.
The level of volatility varies dramatically, and so does investor fear and panic selling — waxing when volatility rises, waning when it falls. Recent studies have pointed to demographics as an important driver of panic selling. The theory is that as people get closer to retirement, the prospects of a large (20% – 30%) loss in financial assets can have a much more pronounced effect on their sense of well-being. Wealth preservation instincts kick in much more quickly than for younger (and typically less wealthy) savers.
The reality is that there is little opportunity for return without volatility. Therefore, the bogeyman effect of holding long-term savings in cash to avoid volatility (the financial equivalent of hiding under the sheets) is detrimental to achieving long-term goals. This effect tends to be more pronounced during the episodic spikes in volatility. The significant spike in volatility in 2008 and 2009 led to significant withdrawals from long-term investment funds over the same period. Less pronounced effects can also be seen when comparing 2001 – 2003 and 2011 – 2012. Conversely, flows picked up when volatility returned to "normal" levels. Investor behavior of this type is consistent with the three behavioral biases.
I believe average volatility will be higher over the next 10 years than the last 10 years and episodic spikes will increase in frequency because sustainable economic growth will be structurally lower and geopolitical risk higher than any time since World War II. Low growth creates uncertainty while loss aversion will make investors fear that we are one economic mishap or geopolitical event away from no growth or recession. The result will be higher volatility on average. Negativity bias will tend to exacerbate "spike" reactions to event-driven geopolitical news, and the volatility bogeyman will appear more often. Assuming the behavioral biases continue, investor returns are likely to be very disappointing regardless of the total return generated by financial markets due to the bogeyman effect.
To mitigate this effect, we need to focus on portfolio construction and an improved understanding of diversification. I accept that equities are likely to offer the highest return over the next 10 years, but they also offer the highest volatility. Many portfolio construction optimization tools use historical average volatility, which is likely to underestimate the volatility investors will face. The bogeyman emerges when individual asset class volatility spikes and cross correlations rise, the combination of which increases overall portfolio volatility far beyond expectation. Diversification is meant to protect investors against volatility, but what's the point of owning lots of investments if the volatility bogeyman has not been properly estimated?
Most importantly, portfolios should be constructed to properly represent the behavioral risk-return trade off of investors, remembering that they won't stay invested to realize the return if we get the risk tolerance wrong. In a low growth, higher volatility world, the emphasis is shifting to return consistency rather than return maximization,
PRESIDENT'S MESSAGE (continued)
and investors are best served through investment approaches that appreciate that distinction. Even though it's a permanent feature of financial markets, volatility is less likely to be the bogeyman we all fear if portfolios are constructed with this understanding.
Please visit blog.columbiathreadneedleus.com/latest-perspectives to read the entire article.
Investors should consider the investment objectives, risks, charges and expenses of a mutual fund carefully before investing. For a free prospectus and summary prospectus, which contains this and other important information about a fund, visit investor.columbiathreadneedleus.com. The prospectus should be read carefully before investing.
The views expressed are as of April 2016, may change as market or other conditions change, and may differ from views expressed by other Columbia Management Investment Advisers, LLC (CMIA) associates or affiliates. Actual investments or investment decisions made by CMIA and its affiliates, whether for its own account or on behalf of clients, will not necessarily reflect the views expressed. This information is not intended to provide investment advice and does not account for individual investor circumstances. Investment decisions should always be made based on an investor's specific financial needs, objectives, goals, time horizon and risk tolerance. Asset classes described may not be suitable for all investors.
Past performance does not guarantee future results, and no forecast should be considered a guarantee either. Since economic and market conditions change frequently, there can be no assurance that the trends described here will continue or that the forecasts are accurate.
Diversification does not guarantee a profit or protect against loss.
Columbia Funds are distributed by Columbia Management Investment Distributors, Inc., member FINRA, and managed by Columbia Management Investment Advisers, LLC.
© 2016 Columbia Management Investment Advisers, LLC. All rights reserved.
COLUMBIA GREATER CHINA FUND
Performance Overview | | | 2 | | |
Manager Discussion of Fund Performance | | | 4 | | |
Understanding Your Fund's Expenses | | | 7 | | |
Portfolio of Investments | | | 8 | | |
Statement of Assets and Liabilities | | | 12 | | |
Statement of Operations | | | 14 | | |
Statement of Changes in Net Assets | | | 15 | | |
Financial Highlights | | | 17 | | |
Notes to Financial Statements | | | 25 | | |
Report of Independent Registered Public Accounting Firm | | | 32 | | |
Federal Income Tax Information | | | 33 | | |
Trustees and Officers | | | 34 | | |
Board Consideration and Approval of Management Agreement | | | 39 | | |
Important Information About This Report | | | 43 | | |
Fund Investment Manager
Columbia Management Investment
Advisers, LLC
225 Franklin Street
Boston, MA 02110
Fund Distributor
Columbia Management Investment
Distributors, Inc.
225 Franklin Street
Boston, MA 02110
Fund Transfer Agent
Columbia Management Investment
Services Corp.
P.O. Box 8081
Boston, MA 02266-8081
For more information about any of the funds, please visit investor.columbiathreadneedleus.com or call 800.345.6611. Customer Service Representatives are available to answer your questions Monday through Friday from 8 a.m. to 7 p.m. Eastern time.
The views expressed in this report reflect the current views of the respective parties. These views are not guarantees of future performance and involve certain risks, uncertainties and assumptions that are difficult to predict, so actual outcomes and results may differ significantly from the views expressed. These views are subject to change at any time based upon economic, market or other conditions and the respective parties disclaim any responsibility to update such views. These views may not be relied on as investment advice and, because investment decisions for a Columbia fund are based on numerous factors, may not be relied on as an indication of trading intent on behalf of any particular Columbia fund. References to specific securities should not be construed as a recommendation or investment advice.
COLUMBIA GREATER CHINA FUND
Performance Summary
n Columbia Greater China Fund (the Fund) Class A shares returned 10.97% excluding sales charges for the 12-month period that ended August 31, 2016.
n During the same time period, the Fund outperformed both the 8.04% return of the MSCI China Index (Net) benchmark and the 5.94% return of the Hang Seng Index.
n Overweight exposure to the information technology sector was the biggest positive contributor to the Fund's performance versus the MSCI China Index (Net), while underweights to industrials, energy and financials also contributed. Stock selection within the consumer discretionary sector was the largest detractor.
Average Annual Total Returns (%) (for period ended August 31, 2016)
| | | Inception | | 1 Year | | 5 Years | | 10 Years | |
Class A | | 05/16/97 | | | | | | | | | | | | | |
Excluding sales charges | | | | | | | 10.97 | | | | 4.62 | | | | 7.85 | | |
Including sales charges | | | | | | | 4.60 | | | | 3.39 | | | | 7.21 | | |
Class B | | 05/16/97 | | | | | | | | | | | | | |
Excluding sales charges | | | | | | | 10.15 | | | | 3.83 | | | | 7.04 | | |
Including sales charges | | | | | | | 5.15 | | | | 3.61 | | | | 7.04 | | |
Class C | | 05/16/97 | | | | | | | | | | | | | |
Excluding sales charges | | | | | | | 10.15 | | | | 3.84 | | | | 7.05 | | |
Including sales charges | | | | | | | 9.15 | | | | 3.84 | | | | 7.05 | | |
Class I* | | 08/02/11 | | | 11.45 | | | | 5.09 | | | | 8.10 | | |
Class R4* | | 03/19/13 | | | 11.27 | | | | 4.80 | | | | 7.94 | | |
Class R5* | | 11/08/12 | | | 11.44 | | | | 4.94 | | | | 8.01 | | |
Class W* | | 06/18/12 | | | 10.97 | | | | 4.65 | | | | 7.86 | | |
Class Z | | 05/16/97 | | | 11.24 | | | | 4.88 | | | | 8.12 | | |
MSCI China Index (Net) | | | | | | �� | 8.04 | | | | 3.80 | | | | 7.90 | | |
Hang Seng Index | | | | | | | 5.94 | | | | 2.36 | | | | 2.85 | | |
Returns for Class A are shown with and without the maximum initial sales charge of 5.75%. Returns for Class B are shown with and without the applicable contingent deferred sales charge (CDSC) of 5.00% in the first year, declining to 1.00% in the sixth year and eliminated thereafter. Returns for Class C are shown with and without the 1.00% CDSC for the first year only. The Fund's other classes are not subject to sales charges and have limited eligibility. Please see the Fund's prospectus for details. Performance for different share classes will vary based on differences in sales charges and fees associated with each class. All results shown assume reinvestment of distributions during the period. Returns do not reflect the deduction of taxes that a shareholder may pay on Fund distributions or on the redemption of Fund shares. Performance results reflect the effect of any fee waivers or reimbursements of Fund expenses by Columbia Management Investment Advisers, LLC and/or any of its affiliates. Absent these fee waivers or expense reimbursement arrangements, performance results would have been lower.
The performance information shown represents past performance and is not a guarantee of future results. The investment return and principal value of your investment will fluctuate so that your shares, when redeemed, may be worth more or less than their original cost. Current performance may be lower or higher than the performance information shown. You may obtain performance information current to the most recent month-end by contacting your financial intermediary, visiting investor.columbiathreadneedleus.com or calling 800.345.6611.
*The returns shown for periods prior to the share class inception date (including returns for the Life of the Fund, if shown, which are since Fund inception) include the returns of the Fund's oldest share class. Since the Fund launched more than one share class at its inception, Class A shares were used. These returns are adjusted to reflect any higher class-related operating expenses of the newer share classes, as applicable. Please visit investor.columbiathreadneedleus.com/investment-products/mutual-funds/appended-performance for more information.
The MSCI China Index (Net) is designed to broadly and fairly represent the full diversity of business activities in China. This index aims to capture 85% of the free float adjusted market capitalization in each industry group.
The Hang Seng Index tracks the performance of approximately 70% of the total market capitalization of the stock exchange of Hong Kong.
Indices are not available for investment, are not professionally managed and do not reflect sales charges, fees, brokerage commissions, taxes (except the MSCI China Index (Net) which reflects reinvested dividends net of withholding taxes) or other expenses of investing. Securities in the Fund may not match those in an index.
Annual Report 2016
2
COLUMBIA GREATER CHINA FUND
PERFORMANCE OVERVIEW (continued)
Performance of a Hypothetical $10,000 Investment (September 1, 2006 – August 31, 2016)
The chart above shows the change in value of a hypothetical $10,000 investment in Class A shares of Columbia Greater China Fund during the stated time period, and does not reflect the deduction of taxes that a shareholder may pay on Fund distributions or on the redemption of Fund shares.
Annual Report 2016
3
COLUMBIA GREATER CHINA FUND
MANAGER DISCUSSION OF FUND PERFORMANCE
Portfolio Management
Jasmine (Weili) Huang, CFA,
CPA (U.S. and China), CFM
Morningstar Style BoxTM
The Morningstar Style BoxTM is based on a fund's portfolio holdings. For equity funds, the vertical axis shows the market capitalization of the stocks owned, and the horizontal axis shows investment style (value, blend, or growth). Information shown is based on the most recent data provided by Morningstar.
© 2016 Morningstar, Inc. All rights reserved. The Morningstar information contained herein: (1) is proprietary to Morningstar and/or its content providers; (2) may not be copied or distributed; and (3) is not warranted to be accurate, complete or timely. Neither Morningstar nor its content providers are responsible for any damages or losses arising from any use of this information.
For the 12-month period that ended August 31, 2016, the Fund's Class A shares returned 10.97% excluding sales charges. During the same time period, the Fund outperformed both the MSCI China Index (Net), which returned 8.04%, and the Hang Seng Index, which returned 5.94%. Overweight exposure to the information technology sector was the biggest positive contributor to the Fund's performance versus the MSCI China Index (Net), while underweights to industrials, energy and financials also contributed. Stock selection within the consumer discretionary sector was the largest detractor.
Chinese Equities Ended Higher After Volatile 12 Months
The 12 months ended August 31, 2016 unfolded in three distinct phases. The early part of the period saw Chinese equities rebound off of the lows experienced following the devaluation of its currency, the renminbi, in August 2015. However, devaluation fears resurfaced, leading to another downward leg that began in November of 2015 and continued into February of 2016. Of particular note, January opened with declines in Chinese equities that triggered circuit breakers and led panicked investors to sell down shares, roiling the overall global markets. Around mid-February, global sentiment stabilized, based on a more encouraging macroeconomic backdrop supported by stimulus efforts from leading central banks and signified by rising oil prices. In addition, investors gained confidence that the stimulus measures forwarded by the Chinese government and the People's Bank of China would be successful in stabilizing Chinese growth at moderate levels. Chinese equities experienced substantial gains over the last several months of the period, resulting in a positive return for the full 12 months.
Information Technology Holdings Led Fund Returns
Stock selection decisions in aggregate made the most significant positive contribution to the Fund's returns versus the MSCI benchmark. In particular, selection within information technology, utilities and health care added to relative performance, while selection was negative within the consumer discretionary sector. The Fund's sector weights are driven by our long-term focus on areas of China's economy that we believe are positioned to benefit from secular, as opposed to cyclical, growth trends. In sector terms, overweight exposure to information technology was the biggest positive contributor to the Fund's performance, while underweights to industrials, energy and financials also contributed.
With respect to individual stocks, leading contributors included Tencent Holdings, an internet company that continued to post stronger-than-expected earnings growth over the first half of 2016. Also within information technology, an underweight to Baidu, China's leading search engine, and overweight to Alibaba, China's leading e-commerce company, both added to performance. NetEase, an internet company providing online gaming services, rallied due to strong new game launches. Within health care, holdings of China Medical System, a pharmaceutical distributor, contributed positively as the market gained confidence in the company following a recent acquisition. China Biologic Products, a blood plasma-based pharmaceutical company, has seen its results and share price
Annual Report 2016
4
COLUMBIA GREATER CHINA FUND
MANAGER DISCUSSION OF FUND PERFORMANCE (continued)
benefit from being in a high barrier-to-entry niche within the expanding Chinese health care market. Shenzhou International Group Holdings, a supplier for global clothing and shoe brands including Nike and Adidas, was another top performer.
On the downside, shares of pharmaceutical company China Traditional Chinese Medicine Co. suffered in the period as earnings came in below market expectations and the process of integrating a newly acquired business was slower than hoped for. Shares of Zhuzhou CSR Times Electric, a manufacturer of components for high-speed trains and subways, declined as concerns over a potential slowdown in growth of railway spending in China led investors to overlook the company's opportunity to gain market share through industry consolidation. 3SBio Inc, a biotechnology company, saw its shares decline due to the withdrawal of a new drug application with the China Food and Drug Administration. The implementation of a new drug application process has resulted in widespread application withdrawals by Chinese pharmaceutical companies, and we believe the market overreacted with respect to 3SBio. Finally, JD.com, the second largest e-commerce company in China, corrected due to slower-than-expected revenue growth as a result of restructuring its platform and increasing competitive pressure from China's largest e-commerce player, Alibaba.
Efforts to Internationalize Markets and Currency Support Long Term Outlook
China continues to engineer a transition to a more balanced economy, moving away from investment in areas with excess capacity and towards service industries. In this vein, the government is implementing reforms on the supply side of the economy, directing the consolidation of top players in overbuilt sectors and imposing production constraints. At the same time, the government is seeking to maintain annual growth in the 6.5% to 7% range. We see signs that the government's efforts to stabilize growth while implementing reforms are meeting with at least some temporary success. In particular, there has been a recent strengthening of producer prices following a prolonged contraction, which may help bolster industrial profits.
Challenges remain, including the disposition of a substantial volume of non-performing bank loans, the result of past misdirected investments. In addition, while the government has stepped up spending on needed infrastructure projects, private investment has slowed. Reviving private investment will be necessary to maintain growth, as the government will at some point in the not-too-distant future need to begin reducing leverage from current levels, in our view.
While the macroeconomic backdrop remains challenging, we continue to invest in China on the basis of long-term, secular growth ideas. This means that we are overweighting areas of the Chinese economy that we believe have substantial room for further penetration, such as information technology and the internet. We also have exposure to export-driven companies positioned to benefit from a weaker currency and, more
Top Ten Holdings (%)
(at August 31, 2016) | |
Tencent Holdings Ltd. | | | 17.5 | | |
China Mobile Ltd. | | | 10.2 | | |
Alibaba Group Holding
Ltd., ADR | | | 7.9 | | |
Ping An Insurance Group Co.
of China Ltd., Class H | | | 4.6 | | |
China Medical System
Holdings Ltd. | | | 4.1 | | |
Shenzhou International Group
Holdings Ltd. | | | 3.5 | | |
NetEase, Inc., ADR | | | 2.8 | | |
Ctrip.com International
Ltd., ADR | | | 2.8 | | |
Zhuzhou CRRC Times Electric
Co., Ltd., Class H | | | 2.7 | | |
China Overseas Land &
Investment Ltd. | | | 2.5 | | |
Percentages indicated are based upon total investments (excluding Money Market Funds).
For further detail about these holdings, please refer to the section entitled "Portfolio of Investments."
Fund holdings are as of the date given, are subject to change at any time, and are not recommendations to buy or sell any security.
Country Breakdown (%)
(at August 31, 2016) | |
China | | | 91.6 | | |
Hong Kong | | | 3.4 | | |
Taiwan | | | 3.6 | | |
United States(a) | | | 1.4 | | |
Total | | | 100.0 | | |
Country Breakdown is based primarily on issuer's place of organization/incorporation. Percentages indicated are based upon total investments. The Fund's portfolio composition is subject to change.
(a) Includes investments in Money Market Funds.
Annual Report 2016
5
COLUMBIA GREATER CHINA FUND
MANAGER DISCUSSION OF FUND PERFORMANCE (continued)
Equity Sector Breakdown (%)
(at August 31, 2016) | |
Consumer Discretionary | | | 17.1 | | |
Consumer Staples | | | 1.2 | | |
Energy | | | 1.6 | | |
Financials | | | 15.7 | | |
Health Care | | | 12.7 | | |
Industrials | | | 3.8 | | |
Information Technology | | | 34.2 | | |
Materials | | | 0.8 | | |
Telecommunication Services | | | 10.2 | | |
Utilities | | | 2.7 | | |
Total | | | 100.0 | | |
Percentages indicated are based upon total equity investments. The Fund's portfolio composition is subject to change.
Investment Risks
Market risk may affect a single issuer, sector of the economy, industry or the market as a whole. International investing involves certain risks and volatility due to potential political, economic or currency instabilities and different financial and accounting standards. Risks are enhanced for emerging market issuers. Concentration in the Greater China region, where issuers tend to be less developed than U.S. issuers, presents increased risk of loss than a fund that does not concentrate its investments. Investments in small- and mid-cap companies involve risks and volatility greater than investments in larger, more established companies. As a non-diversified fund, fewer investments could have a greater affect on performance. See the Fund's prospectus for information on these and other risks.
fundamentally, from the shift towards higher value-added manufacturing. By contrast, we remain underweight financials, energy and materials.
We believe that the long-term backdrop for Chinese equities has been helped by the government's efforts to open up Chinese financial markets and internationalize the renminbi. In this vein, the Shanghai-Hong Kong Stock Connect program allows mutual access to both onshore and offshore equity markets by both foreign and domestic investors. Further expansion of the Stock Connect program scope is planned, and we believe that such measures can only have a positive long-term impact on demand in China's investment universe. On balance, despite near-term challenges, we remain constructive on the Chinese economy and the investment opportunities it presents.
Annual Report 2016
6
COLUMBIA GREATER CHINA FUND
UNDERSTANDING YOUR FUND'S EXPENSES
(Unaudited)
As an investor, you incur two types of costs. There are transaction costs, which generally include sales charges on purchases and may include redemption fees. There are also ongoing costs, which generally include management fees, distribution and/or service fees, and other fund expenses. The following information is intended to help you understand your ongoing costs (in dollars) of investing in the Fund and to help you compare these costs with the ongoing costs of investing in other mutual funds.
Analyzing Your Fund's Expenses
To illustrate these ongoing costs, we have provided examples and calculated the expenses paid by investors in each share class of the Fund during the period. The actual and hypothetical information in the table is based on an initial investment of $1,000 at the beginning of the period indicated and held for the entire period. Expense information is calculated two ways and each method provides you with different information. The amount listed in the "Actual" column is calculated using the Fund's actual operating expenses and total return for the period. You may use the Actual information, together with the amount invested, to estimate the expenses that you paid over the period. Simply divide your account value by $1,000 (for example, an $8,600 account value divided by $1,000 = 8.6), then multiply the results by the expenses paid during the period under the "Actual" column. The amount listed in the "Hypothetical" column assumes a 5% annual rate of return before expenses (which is not the Fund's actual return) and then applies the Fund's actual expense ratio for the period to the hypothetical return. You should not use the hypothetical account values and expenses to estimate either your actual account balance at the end of the period or the expenses you paid during the period. See "Compare With Other Funds" below for details on how to use the hypothetical data.
Compare With Other Funds
Since all mutual funds are required to include the same hypothetical calculations about expenses in shareholder reports, you can use this information to compare the ongoing cost of investing in the Fund with other funds. To do so, compare the hypothetical example with the 5% hypothetical examples that appear in the shareholder reports of other funds. As you compare hypothetical examples of other funds, it is important to note that hypothetical examples are meant to highlight the ongoing costs of investing in a fund only and do not reflect any transaction costs, such as sales charges, or redemption or exchange fees. Therefore, the hypothetical calculations are useful in comparing ongoing costs only, and will not help you determine the relative total costs of owning different funds. If transaction costs were included in these calculations, your costs would be higher.
March 1, 2016 – August 31, 2016
| | | Account Value at the Beginning of
the Period ($) | | Account Value at the End of
the Period ($) | | Expenses Paid During the
Period ($) | | Fund's Annualized
Expense Ratio (%) | |
| | | Actual | | Hypothetical | | Actual | | Hypothetical | | Actual | | Hypothetical | | Actual | |
Class A | | | 1,000.00 | | | | 1,000.00 | | | | 1,181.20 | | | | 1,017.04 | | | | 8.83 | | | | 8.16 | | | | 1.61 | | |
Class B | | | 1,000.00 | | | | 1,000.00 | | | | 1,176.70 | | | | 1,013.27 | | | | 12.91 | | | | 11.94 | | | | 2.36 | | |
Class C | | | 1,000.00 | | | | 1,000.00 | | | | 1,176.80 | | | | 1,013.27 | | | | 12.91 | | | | 11.94 | | | | 2.36 | | |
Class I | | | 1,000.00 | | | | 1,000.00 | | | | 1,183.80 | | | | 1,019.30 | | | | 6.37 | | | | 5.89 | | | | 1.16 | | |
Class R4 | | | 1,000.00 | | | | 1,000.00 | | | | 1,182.90 | | | | 1,018.30 | | | | 7.46 | | | | 6.90 | | | | 1.36 | | |
Class R5 | | | 1,000.00 | | | | 1,000.00 | | | | 1,183.60 | | | | 1,019.00 | | | | 6.70 | | | | 6.19 | | | | 1.22 | | |
Class W | | | 1,000.00 | | | | 1,000.00 | | | | 1,181.20 | | | | 1,017.04 | | | | 8.83 | | | | 8.16 | | | | 1.61 | | |
Class Z | | | 1,000.00 | | | | 1,000.00 | | | | 1,182.80 | | | | 1,018.30 | | | | 7.46 | | | | 6.90 | | | | 1.36 | | |
Expenses paid during the period are equal to the annualized expense ratio for each class as indicated above, multiplied by the average account value over the period and then multiplied by the number of days in the Fund's most recent fiscal half year and divided by 366.
Expenses do not include fees and expenses incurred indirectly by the Fund from its investment in underlying funds, including affiliated and non-affiliated pooled investment vehicles, such as mutual funds and exchange-traded funds.
Annual Report 2016
7
COLUMBIA GREATER CHINA FUND
PORTFOLIO OF INVESTMENTS
August 31, 2016
(Percentages represent value of investments compared to net assets)
Common Stocks 97.6%
Issuer | | Shares | | Value ($) | |
CONSUMER DISCRETIONARY 16.7% | |
Auto Components 3.5% | |
Fuyao Glass Industry Group Co., Ltd.
Class H | | | 408,400 | | | | 1,072,016 | | |
Minth Group Ltd. | | | 292,000 | | | | 1,103,237 | | |
Nexteer Automotive Group Ltd. | | | 959,000 | | | | 1,316,187 | | |
Tung Thih Electronic Co., Ltd. | | | 33,000 | | | | 502,327 | | |
Total | | | | | 3,993,767 | | |
Diversified Consumer Services 1.8% | |
New Oriental Education & Technology
Group, Inc., ADR(a) | | | 51,549 | | | | 2,035,155 | | |
Household Durables 1.6% | |
Techtronic Industries Co., Ltd. | | | 466,500 | | | | 1,889,667 | | |
Internet & Catalog Retail 3.3% | |
Ctrip.com International Ltd., ADR(a) | | | 65,918 | | | | 3,121,217 | | |
JD.com, Inc., ADR(a) | | | 24,850 | | | | 631,439 | | |
Total | | | | | 3,752,656 | | |
Leisure Products 0.8% | |
Goodbaby International Holdings, Ltd. | | | 1,809,000 | | | | 882,757 | | |
Textiles, Apparel & Luxury Goods 5.7% | |
ANTA Sports Products Ltd. | | | 510,000 | | | | 1,377,242 | | |
Shenzhou International Group
Holdings Ltd. | | | 597,000 | | | | 3,915,976 | | |
Taiwan Paiho., Ltd. | | | 438,000 | | | | 1,258,426 | | |
Total | | | | | 6,551,644 | | |
Total Consumer Discretionary | | | | | 19,105,646 | | |
CONSUMER STAPLES 1.2% | |
Beverages 0.7% | |
China Resources Beer Holdings Co., Ltd. | | | 344,000 | | | | 792,808 | | |
Food Products 0.5% | |
WH Group Ltd. | | | 694,000 | | | | 544,852 | | |
Total Consumer Staples | | | | | 1,337,660 | | |
ENERGY 1.6% | |
Oil, Gas & Consumable Fuels 1.6% | |
CNOOC Ltd. | | | 860,500 | | | | 1,038,127 | | |
PetroChina Co., Ltd., Class H | | | 1,132,000 | | | | 750,610 | | |
Total | | | | | 1,788,737 | | |
Total Energy | | | | | 1,788,737 | | |
Common Stocks (continued)
Issuer | | Shares | | Value ($) | |
FINANCIALS 15.3% | |
Banks 6.3% | |
Bank of China Ltd., Class H | | | 5,619,000 | | | | 2,521,207 | | |
China Construction Bank Corp., Class H | | | 2,707,340 | | | | 2,024,523 | | |
Industrial & Commercial Bank of
China Ltd., Class H | | | 4,136,000 | | | | 2,630,829 | | |
Total | | | | | 7,176,559 | | |
Insurance 6.6% | |
AIA Group Ltd. | | | 310,600 | | | | 1,956,212 | | |
PICC Property & Casualty Co., Ltd.,
Class H | | | 278,000 | | | | 457,533 | | |
Ping An Insurance Group Co. of
China Ltd., Class H | | | 990,000 | | | | 5,102,818 | | |
Total | | | | | 7,516,563 | | |
Real Estate Management & Development 2.4% | |
China Overseas Land & Investment Ltd. | | | 854,320 | | | | 2,813,775 | | |
Total Financials | | | | | 17,506,897 | | |
HEALTH CARE 12.4% | |
Biotechnology 4.2% | |
3SBio, Inc.(a) | | | 2,138,500 | | | | 2,180,362 | | |
China Biologic Products, Inc.(a) | | | 23,518 | | | | 2,587,921 | | |
Total | | | | | 4,768,283 | | |
Pharmaceuticals 8.2% | |
China Animal Healthcare Ltd.(a)(b) | | | 1,050,000 | | | | 70,383 | | |
China Medical System Holdings Ltd. | | | 2,713,000 | | | | 4,535,579 | | |
China Traditional Chinese Medicine
Holdings Co., Ltd.(a) | | | 2,010,000 | | | | 1,024,900 | | |
CSPC Pharmaceutical Group Ltd. | | | 2,572,000 | | | | 2,494,436 | | |
Sino Biopharmaceutical Ltd. | | | 2,035,000 | | | | 1,303,399 | | |
Total | | | | | 9,428,697 | | |
Total Health Care | | | | | 14,196,980 | | |
INDUSTRIALS 3.7% | |
Airlines 0.5% | |
Spring Airlines Co., Ltd., Class A | | | 79,852 | | | | 560,976 | | |
Electrical Equipment 3.2% | |
Voltronic Power Technology Corp. | | | 45,150 | | | | 698,475 | | |
Zhuzhou CRRC Times Electric Co., Ltd.,
Class H | | | 567,500 | | | | 3,010,233 | | |
Total | | | | | 3,708,708 | | |
Total Industrials | | | | | 4,269,684 | | |
The accompanying Notes to Financial Statements are an integral part of this statement.
Annual Report 2016
8
COLUMBIA GREATER CHINA FUND
PORTFOLIO OF INVESTMENTS (continued)
August 31, 2016
Common Stocks (continued)
Issuer | | Shares | | Value ($) | |
INFORMATION TECHNOLOGY 33.4% | |
Electronic Equipment, Instruments & Components 0.9% | |
AAC Technologies Holdings, Inc. | | | 86,000 | | | | 979,479 | | |
Internet Software & Services 31.9% | |
58.Com, Inc., ADR(a) | | | 57,386 | | | | 2,611,063 | | |
Alibaba Group Holding Ltd., ADR(a) | | | 90,530 | | | | 8,798,611 | | |
Baidu, Inc., ADR(a) | | | 13,992 | | | | 2,393,611 | | |
NetEase, Inc., ADR | | | 14,867 | | | | 3,151,358 | | |
Tencent Holdings Ltd. | | | 753,400 | | | | 19,524,273 | | |
Total | | | | | 36,478,916 | | |
Semiconductors & Semiconductor Equipment 0.6% | |
Land Mark Optoelectronics Corp. | | | 67,600 | | | | 734,660 | | |
Total Information Technology | | | | | 38,193,055 | | |
MATERIALS 0.7% | |
Construction Materials 0.7% | |
China Resources Cement Holdings Ltd. | | | 2,096,000 | | | | 819,759 | | |
Total Materials | | | | | 819,759 | | |
TELECOMMUNICATION SERVICES 9.9% | |
Wireless Telecommunication Services 9.9% | |
China Mobile Ltd. | | | 920,500 | | | | 11,339,661 | | |
Total Telecommunication Services | | | | | 11,339,661 | | |
Common Stocks (continued)
Issuer | | Shares | | Value ($) | |
UTILITIES 2.7% | |
Gas Utilities 1.7% | |
ENN Energy Holdings Ltd. | | | 344,000 | | | | 1,923,580 | | |
Water Utilities 1.0% | |
CT Environmental Group Ltd. | | | 3,594,360 | | | | 1,105,111 | | |
Total Utilities | | | | | 3,028,691 | | |
Total Common Stocks
(Cost: $74,076,687) | | | | | 111,586,770 | | |
Money Market Funds 1.4%
| | | Shares | | Value ($) | |
Columbia Short-Term Cash Fund,
0.415%(c)(d) | | | 1,608,809 | | | | 1,608,809 | | |
Total Money Market Funds
(Cost: $1,608,809) | | | | | 1,608,809 | | |
Total Investments
(Cost: $75,685,496) | | | | | 113,195,579 | | |
Other Assets & Liabilities, Net | | | | | 1,169,696 | | |
Net Assets | | | | | 114,365,275 | | |
Notes to Portfolio of Investments
(a) Non-income producing investment.
(b) Represents fair value as determined in good faith under procedures approved by the Board of Trustees. At August 31, 2016, the value of these securities amounted to $70,383, which represents 0.06% of net assets.
(c) The rate shown is the seven-day current annualized yield at August 31, 2016.
(d) As defined in the Investment Company Act of 1940, an affiliated company is one in which the Fund owns 5% or more of the company's outstanding voting securities, or a company which is under common ownership or control with the Fund. Holdings and transactions in these affiliated companies during the year ended August 31, 2016 are as follows:
Issuer | | Beginning
Cost ($) | | Purchase
Cost ($) | | Proceeds
From Sales ($) | | Ending
Cost ($) | | Dividends —
Affiliated
Issuers ($) | | Value ($) | |
Columbia Short-Term Cash Fund | | | — | | | | 71,293,370 | | | | (69,684,561 | ) | | | 1,608,809 | | | | 9,645 | | | | 1,608,809 | | |
Abbreviation Legend
ADR American Depositary Receipt
The accompanying Notes to Financial Statements are an integral part of this statement.
Annual Report 2016
9
COLUMBIA GREATER CHINA FUND
PORTFOLIO OF INVESTMENTS (continued)
August 31, 2016
The Fund categorizes its fair value measurements according to a three-level hierarchy that maximizes the use of observable inputs and minimizes the use of unobservable inputs by prioritizing that the most observable input be used when available. Observable inputs are those that market participants would use in pricing an investment based on market data obtained from sources independent of the reporting entity. Unobservable inputs are those that reflect the Fund's assumptions about the information market participants would use in pricing an investment. An investment's level within the fair value hierarchy is based on the lowest level of any input that is deemed significant to the asset's or liability's fair value measurement. The input levels are not necessarily an indication of the risk or liquidity associated with investments at that level. For example, certain U.S. government securities are generally high quality and liquid, however, they are reflected as Level 2 because the inputs used to determine fair value may not always be quoted prices in an active market.
Fair value inputs are summarized in the three broad levels listed below:
> Level 1 — Valuations based on quoted prices for investments in active markets that the Fund has the ability to access at the measurement date (including NAV for open-end mutual funds). Valuation adjustments are not applied to Level 1 investments.
> Level 2 — Valuations based on other significant observable inputs (including quoted prices for similar securities, interest rates, prepayment speeds, credit risks, etc.).
> Level 3 — Valuations based on significant unobservable inputs (including the Fund's own assumptions and judgment in determining the fair value of investments).
Inputs that are used in determining fair value of an investment may include price information, credit data, volatility statistics, and other factors. These inputs can be either observable or unobservable. The availability of observable inputs can vary between investments, and is affected by various factors such as the type of investment, and the volume and level of activity for that investment or similar investments in the marketplace. The inputs will be considered by the Investment Manager, along with any other relevant factors in the calculation of an investment's fair value. The Fund uses prices and inputs that are current as of the measurement date, which may include periods of market dislocations. During these periods, the availability of prices and inputs may be reduced for many investments. This condition could cause an investment to be reclassified between the various levels within the hierarchy.
Foreign equity securities actively traded in markets where there is a significant delay in the local close relative to the New York Stock Exchange (NYSE) are classified as Level 2. The values of these securities may include an adjustment to reflect the impact of significant market movements following the close of local trading, as described in Note 2 to the financial statements — Security Valuation.
Certain investments that have been measured at fair value using the net asset value per share (or its equivalent) are not categorized in the fair value hierarchy. The fair value amounts presented in the table are intended to reconcile the fair value hierarchy to the amounts presented in the Portfolio of Investments. The Columbia Short-Term Cash Fund seeks to provide shareholders with maximum current income consistent with liquidity and stability of principal. Investments in Columbia Short-Term Cash Fund may be redeemed on a daily basis without restriction.
Investments falling into the Level 3 category are primarily supported by quoted prices from brokers and dealers participating in the market for those investments. However, these may be classified as Level 3 investments due to lack of market transparency and corroboration to support these quoted prices. Additionally, valuation models may be used as the pricing source for any remaining investments classified as Level 3. These models may rely on one or more significant unobservable inputs and/or significant assumptions by the Investment Manager. Inputs used in valuations may include, but are not limited to, financial statement analysis, capital account balances, discount rates and estimated cash flows, and comparable company data.
Under the direction of the Fund's Board of Trustees (the Board), the Investment Manager's Valuation Committee (the Committee) is responsible for overseeing the valuation procedures approved by the Board. The Committee consists of voting and non-voting members from various groups within the Investment Manager's organization, including operations and accounting, trading and investments, compliance, risk management and legal.
The Committee meets at least monthly to review and approve valuation matters, which may include a description of specific valuation determinations, data regarding pricing information received from approved pricing vendors and brokers and the results of Board-approved valuation control policies and procedures (the Policies). The Policies address, among other things, instances when market quotations are or are not readily available, including recommendations of third party pricing vendors and a determination of appropriate pricing methodologies; events that require specific valuation determinations and assessment of fair value techniques; securities with a potential for stale pricing, including those that are illiquid, restricted, or in default; and the effectiveness of third party pricing vendors, including periodic reviews of vendors. The Committee meets more frequently, as needed, to discuss additional valuation matters, which may include the need to review back-testing results, review time-sensitive information or approve related valuation actions. The Committee reports to the Board, with members of the Committee meeting with the Board at each of its regularly scheduled meetings to discuss valuation matters and actions during the period, similar to those described earlier.
For investments categorized as Level 3, the Committee monitors information similar to that described above, which may include: (i) data specific to the issuer or comparable issuers, (ii) general market or specific sector news and (iii) quoted prices and specific or similar security transactions. The Committee considers this data and any changes from prior periods in order to assess the reasonableness of observable and unobservable inputs, any assumptions or internal models used to value those securities and changes in fair value. This data is also used to corroborate, when available, information received from approved pricing vendors and brokers. Various factors impact the frequency of
The accompanying Notes to Financial Statements are an integral part of this statement.
Annual Report 2016
10
COLUMBIA GREATER CHINA FUND
PORTFOLIO OF INVESTMENTS (continued)
August 31, 2016
Fair Value Measurements (continued)
monitoring this information (which may occur as often as daily). However, the Committee may determine that changes to inputs, assumptions and models are not required as a result of the monitoring procedures performed.
The following table is a summary of the inputs used to value the Fund's investments at August 31, 2016:
| | | Level 1
Quoted Prices in Active
Markets for Identical
Assets ($) | | Level 2
Other Significant
Observable Inputs ($) | | Level 3
Significant
Unobservable Inputs ($) | | Total ($) | |
Investments | |
Common Stocks | |
Consumer Discretionary | | | 5,787,811 | | | | 13,317,835 | | | | — | | | | 19,105,646 | | |
Consumer Staples | | | — | | | | 1,337,660 | | | | — | | | | 1,337,660 | | |
Energy | | | — | | | | 1,788,737 | | | | — | | | | 1,788,737 | | |
Financials | | | — | | | | 17,506,897 | | | | — | | | | 17,506,897 | | |
Health Care | | | 2,587,921 | | | | 11,538,676 | | | | 70,383 | | | | 14,196,980 | | |
Industrials | | | — | | | | 4,269,684 | | | | — | | | | 4,269,684 | | |
Information Technology | | | 16,954,643 | | | | 21,238,412 | | | | — | | | | 38,193,055 | | |
Materials | | | — | | | | 819,759 | | | | — | | | | 819,759 | | |
Telecommunication Services | | | — | | | | 11,339,661 | | | | — | | | | 11,339,661 | | |
Utilities | | | — | | | | 3,028,691 | | | | — | | | | 3,028,691 | | |
Total Common Stocks | | | 25,330,375 | | | | 86,186,012 | | | | 70,383 | | | | 111,586,770 | | |
Investments measured at net asset value | |
Money Market Funds | | | — | | | | — | | | | — | | | | 1,608,809 | | |
Total Investments | | | 25,330,375 | | | | 86,186,012 | | | | 70,383 | | | | 113,195,579 | | |
See the Portfolio of Investments for all investment classifications not indicated in the table.
The Fund's assets assigned to the Level 2 input category are generally valued using the market approach, in which a security's value is determined through reference to prices and information from market transactions for similar or identical assets. These assets include certain foreign securities for which a third party statistical pricing service may be employed for purposes of fair market valuation. The model utilized by such third party statistical pricing service takes into account a security's correlation to available market data including, but not limited to, intraday index, ADR, and exchange-traded fund movements.
There were no transfers of financial assets between levels during the period.
The Fund does not hold any significant investments (greater than one percent of net assets) categorized as Level 3.
The Fund's assets assigned to the Level 3 category are valued utilizing the valuation technique deemed the most appropriate in the circumstances. Certain common stock classified as Level 3 securities are valued using the market approach. To determine fair value for these securities, management considered various factors which may have included, but were not limited to, the halt price of the security, discount rates observed in the market for similar assets as well as the movement in certain foreign or domestic market indices. Significant increases (decreases) to any of these inputs would result in a significantly lower (higher) fair value measurement. Generally, a change in observable yields on comparable securities would result in a directionally similar change to discount rates.
The accompanying Notes to Financial Statements are an integral part of this statement.
Annual Report 2016
11
COLUMBIA GREATER CHINA FUND
STATEMENT OF ASSETS AND LIABILITIES
August 31, 2016
Assets | |
Investments, at value | |
Unaffiliated issuers (identified cost $74,076,687) | | $ | 111,586,770 | | |
Affiliated issuers (identified cost $1,608,809) | | | 1,608,809 | | |
Total investments (identified cost $75,685,496) | | | 113,195,579 | | |
Cash | | | 979 | | |
Receivable for: | |
Investments sold | | | 1,297,976 | | |
Capital shares sold | | | 8,657 | | |
Dividends | | | 32,863 | | |
Prepaid expenses | | | 958 | | |
Trustees' deferred compensation plan | | | 38,120 | | |
Total assets | | | 114,575,132 | | |
Liabilities | |
Payable for: | |
Capital shares purchased | | | 103,113 | | |
Management services fees | | | 2,994 | | |
Distribution and/or service fees | | | 713 | | |
Transfer agent fees | | | 17,904 | | |
Compensation of board members | | | 121 | | |
Chief compliance officer expenses | | | 9 | | |
Audit fees | | | 31,843 | | |
Other expenses | | | 15,040 | | |
Trustees' deferred compensation plan | | | 38,120 | | |
Total liabilities | | | 209,857 | | |
Net assets applicable to outstanding capital stock | | $ | 114,365,275 | | |
Represented by | |
Paid-in capital | | $ | 84,334,386 | | |
Excess of distributions over net investment income | | | (38,122 | ) | |
Accumulated net realized loss | | | (7,441,238 | ) | |
Unrealized appreciation (depreciation) on: | |
Investments | | | 37,510,083 | | |
Foreign currency translations | | | 166 | | |
Total — representing net assets applicable to outstanding capital stock | | $ | 114,365,275 | | |
The accompanying Notes to Financial Statements are an integral part of this statement.
Annual Report 2016
12
COLUMBIA GREATER CHINA FUND
STATEMENT OF ASSETS AND LIABILITIES (continued)
August 31, 2016
Class A | |
Net assets | | $ | 58,384,594 | | |
Shares outstanding | | | 1,658,529 | | |
Net asset value per share | | $ | 35.20 | | |
Maximum offering price per share(a) | | $ | 37.35 | | |
Class B | |
Net assets | | $ | 320,829 | | |
Shares outstanding | | | 10,038 | | |
Net asset value per share | | $ | 31.96 | | |
Class C | |
Net assets | | $ | 10,951,715 | | |
Shares outstanding | | | 333,806 | | |
Net asset value per share | | $ | 32.81 | | |
Class I | |
Net assets | | $ | 2,075 | | |
Shares outstanding | | | 54 | | |
Net asset value per share(b) | | $ | 38.19 | | |
Class R4 | |
Net assets | | $ | 3,531,857 | | |
Shares outstanding | | | 91,168 | | |
Net asset value per share | | $ | 38.74 | | |
Class R5 | |
Net assets | | $ | 878,818 | | |
Shares outstanding | | | 22,649 | | |
Net asset value per share | | $ | 38.80 | | |
Class W | |
Net assets | | $ | 2,019 | | |
Shares outstanding | | | 57 | | |
Net asset value per share(b) | | $ | 35.20 | | |
Class Z | |
Net assets | | $ | 40,293,368 | | |
Shares outstanding | | | 1,058,847 | | |
Net asset value per share | | $ | 38.05 | | |
(a) The maximum offering price per share is calculated by dividing the net asset value per share by 1.0 minus the maximum sales charge of 5.75%.
(b) Net asset value per share rounds to this amount due to fractional shares outstanding.
The accompanying Notes to Financial Statements are an integral part of this statement.
Annual Report 2016
13
COLUMBIA GREATER CHINA FUND
STATEMENT OF OPERATIONS
Year Ended August 31, 2016
Net investment income | |
Income: | |
Dividends — unaffiliated issuers | | $ | 2,053,971 | | |
Dividends — affiliated issuers | | | 9,645 | | |
Foreign taxes withheld | | | (119,204 | ) | |
Total income | | | 1,944,412 | | |
Expenses: | |
Management services fees | | | 1,170,371 | | |
Distribution and/or service fees | |
Class A | | | 167,517 | | |
Class B | | | 5,754 | | |
Class C | | | 112,133 | | |
Class W | | | 5 | | |
Transfer agent fees | |
Class A | | | 137,977 | | |
Class B | | | 1,201 | | |
Class C | | | 23,023 | | |
Class R4 | | | 5,977 | | |
Class R5 | | | 280 | | |
Class W | | | 4 | | |
Class Z | | | 84,153 | | |
Compensation of board members | | | 18,173 | | |
Custodian fees | | | 25,569 | | |
Printing and postage fees | | | 33,294 | | |
Registration fees | | | 104,592 | | |
Audit fees | | | 38,578 | | |
Legal fees | | | 3,591 | | |
Line of credit interest expense | | | 2,298 | | |
Chief compliance officer expenses | | | 59 | | |
Other | | | 16,791 | | |
Total expenses | | | 1,951,340 | | |
Expense reductions | | | (560 | ) | |
Total net expenses | | | 1,950,780 | | |
Net investment loss | | | (6,368 | ) | |
Realized and unrealized gain (loss) — net | |
Net realized gain (loss) on: | |
Investments | | | (6,778,513 | ) | |
Foreign currency translations | | | 4,362 | | |
Net realized loss | | | (6,774,151 | ) | |
Net change in unrealized appreciation (depreciation) on: | |
Investments | | | 17,962,530 | | |
Foreign currency translations | | | 173 | | |
Net change in unrealized appreciation | | | 17,962,703 | | |
Net realized and unrealized gain | | | 11,188,552 | | |
Net increase in net assets resulting from operations | | $ | 11,182,184 | | |
The accompanying Notes to Financial Statements are an integral part of this statement.
Annual Report 2016
14
COLUMBIA GREATER CHINA FUND
STATEMENT OF CHANGES IN NET ASSETS
| | | Year Ended
August 31,
2016 | | Year Ended
August 31,
2015 | |
Operations | |
Net investment income (loss) | | $ | (6,368 | ) | | $ | 320,357 | | |
Net realized gain (loss) | | | (6,774,151 | ) | | | 8,397,584 | | |
Net change in unrealized appreciation (depreciation) | | | 17,962,703 | | | | (28,430,921 | ) | |
Net increase (decrease) in net assets resulting from operations | | | 11,182,184 | | | | (19,712,980 | ) | |
Distributions to shareholders | |
Net investment income | |
Class A | | | (129,280 | ) | | | (511,016 | ) | |
Class I | | | (13 | ) | | | (29 | ) | |
Class R4 | | | (12,734 | ) | | | (499 | ) | |
Class R5 | | | (2,445 | ) | | | (1,461 | ) | |
Class W | | | (3 | ) | | | (19 | ) | |
Class Z | | | (179,057 | ) | | | (243,129 | ) | |
Net realized gains | |
Class A | | | (4,109,275 | ) | | | (14,411,020 | ) | |
Class B | | | (33,820 | ) | | | (474,688 | ) | |
Class C | | | (619,852 | ) | | | (2,999,146 | ) | |
Class I | | | (92 | ) | | | (467 | ) | |
Class R4 | | | (129,155 | ) | | | (10,321 | ) | |
Class R5 | | | (18,676 | ) | | | (26,161 | ) | |
Class W | | | (97 | ) | | | (493 | ) | |
Class Z | | | (1,912,576 | ) | | | (4,974,533 | ) | |
Total distributions to shareholders | | | (7,147,075 | ) | | | (23,652,982 | ) | |
Increase (decrease) in net assets from capital stock activity | | | (18,042,120 | ) | | | 25,769,645 | | |
Total decrease in net assets | | | (14,007,011 | ) | | | (17,596,317 | ) | |
Net assets at beginning of year | | | 128,372,286 | | | | 145,968,603 | | |
Net assets at end of year | | $ | 114,365,275 | | | $ | 128,372,286 | | |
Undistributed (excess of distributions over) net investment income | | $ | (38,122 | ) | | $ | 270,962 | | |
The accompanying Notes to Financial Statements are an integral part of this statement.
Annual Report 2016
15
COLUMBIA GREATER CHINA FUND
STATEMENT OF CHANGES IN NET ASSETS (continued)
| | | Year Ended August 31, 2016 | | Year Ended August 31, 2015 | |
| | | Shares | | Dollars ($) | | Shares | | Dollars ($) | |
Capital stock activity | |
Class A shares | |
Subscriptions(a) | | | 1,162,940 | | | | 40,055,708 | | | | 620,550 | | | | 25,619,588 | | |
Distributions reinvested | | | 113,880 | | | | 3,924,304 | | | | 370,206 | | | | 13,323,734 | | |
Redemptions | | | (1,516,992 | ) | | | (48,801,828 | ) | | | (1,210,769 | ) | | | (51,029,538 | ) | |
Net decrease | | | (240,172 | ) | | | (4,821,816 | ) | | | (220,013 | ) | | | (12,086,216 | ) | |
Class B shares | |
Subscriptions | | | 118 | | | | 3,723 | | | | 2,591 | | | | 89,731 | | |
Distributions reinvested | | | 951 | | | | 29,925 | | | | 11,974 | | | | 397,537 | | |
Redemptions(a) | | | (24,495 | ) | | | (755,480 | ) | | | (50,053 | ) | | | (1,892,567 | ) | |
Net decrease | | | (23,426 | ) | | | (721,832 | ) | | | (35,488 | ) | | | (1,405,299 | ) | |
Class C shares | |
Subscriptions | | | 20,453 | | | | 658,210 | | | | 60,142 | | | | 2,258,476 | | |
Distributions reinvested | | | 14,385 | | | | 464,493 | | | | 65,744 | | | | 2,237,255 | | |
Redemptions | | | (87,101 | ) | | | (2,680,999 | ) | | | (102,497 | ) | | | (3,840,272 | ) | |
Net increase (decrease) | | | (52,263 | ) | | | (1,558,296 | ) | | | 23,389 | | | | 655,459 | | |
Class R4 shares | |
Subscriptions | | | 38,371 | | | | 1,396,288 | | | | 71,116 | | | | 3,376,084 | | |
Distributions reinvested | | | 3,738 | | | | 141,536 | | | | 263 | | | | 10,342 | | |
Redemptions | | | (18,634 | ) | | | (666,692 | ) | | | (3,846 | ) | | | (169,626 | ) | |
Net increase | | | 23,475 | | | | 871,132 | | | | 67,533 | | | | 3,216,800 | | |
Class R5 shares | |
Subscriptions | | | 15,229 | | | | 527,355 | | | | 13,392 | | | | 600,758 | | |
Distributions reinvested | | | 555 | | | | 21,018 | | | | 689 | | | | 27,138 | | |
Redemptions | | | (5,110 | ) | | | (180,424 | ) | | | (4,463 | ) | | | (204,421 | ) | |
Net increase | | | 10,674 | | | | 367,949 | | | | 9,618 | | | | 423,475 | | |
Class Z shares | |
Subscriptions | | | 329,125 | | | | 11,375,179 | | | | 1,340,915 | | | | 60,775,022 | | |
Distributions reinvested | | | 22,368 | | | | 831,859 | | | | 102,646 | | | | 3,973,418 | | |
Redemptions | | | (658,591 | ) | | | (24,386,295 | ) | | | (687,067 | ) | | | (29,783,014 | ) | |
Net increase (decrease) | | | (307,098 | ) | | | (12,179,257 | ) | | | 756,494 | | | | 34,965,426 | | |
Total net increase (decrease) | | | (588,810 | ) | | | (18,042,120 | ) | | | 601,533 | | | | 25,769,645 | | |
(a) Includes conversions of Class B shares to Class A shares, if any.
The accompanying Notes to Financial Statements are an integral part of this statement.
Annual Report 2016
16
COLUMBIA GREATER CHINA FUND
The following tables are intended to help you understand the Fund's financial performance. Certain information reflects financial results for a single share of a class held for the periods shown. Per share net investment income (loss) amounts are calculated based on average shares outstanding during the period. Total return assumes reinvestment of all dividends and distributions, if any. Total return does not reflect payment of sales charges, if any. Total return and portfolio turnover are not annualized for periods of less than one year. The portfolio turnover rate is calculated without regard to purchase and sales transactions of short-term instruments and certain derivatives, if any. If such transactions were included, the Fund's portfolio turnover rate may be higher.
| | | Year Ended August 31, | |
Class A | | 2016 | | 2015 | | 2014 | | 2013 | | 2012 | |
Per share data | |
Net asset value, beginning of period | | $ | 33.33 | | | $ | 45.93 | | | $ | 48.80 | | | $ | 42.08 | | | $ | 51.02 | | |
Income from investment operations: | |
Net investment income (loss) | | | (0.04 | ) | | | 0.02 | | | | 0.33 | | | | 0.44 | | | | 0.50 | | |
Net realized and unrealized gain (loss) | | | 3.66 | | | | (3.87 | ) | | | 8.97 | | | | 6.81 | | | | (6.83 | ) | |
Increase from payment by affiliate | | | — | | | | 0.15 | | | | — | | | | — | | | | — | | |
Total from investment operations | | | 3.62 | | | | (3.70 | ) | | | 9.30 | | | | 7.25 | | | | (6.33 | ) | |
Less distributions to shareholders: | |
Net investment income | | | (0.05 | ) | | | (0.30 | ) | | | (0.81 | ) | | | (0.53 | ) | | | (0.05 | ) | |
Net realized gains | | | (1.70 | ) | | | (8.60 | ) | | | (11.36 | ) | | | — | | | | (2.56 | ) | |
Total distributions to shareholders | | | (1.75 | ) | | | (8.90 | ) | | | (12.17 | ) | | | (0.53 | ) | | | (2.61 | ) | |
Net asset value, end of period | | $ | 35.20 | | | $ | 33.33 | | | $ | 45.93 | | | $ | 48.80 | | | $ | 42.08 | | |
Total return | | | 10.97 | % | | | (9.49 | %)(a) | | | 21.22 | % | | | 17.24 | % | | | (12.20 | %) | |
Ratios to average net assets(b) | |
Total gross expenses | | | 1.60 | %(c) | | | 1.56 | %(c) | | | 1.57 | %(c) | | | 1.54 | % | | | 1.53 | % | |
Total net expenses(d) | | | 1.60 | %(c)(e) | | | 1.56 | %(c)(e) | | | 1.57 | %(c)(e) | | | 1.54 | %(e) | | | 1.53 | %(e) | |
Net investment income (loss) | | | (0.11 | %) | | | 0.04 | % | | | 0.73 | % | | | 0.94 | % | | | 1.11 | % | |
Supplemental data | |
Net assets, end of period (in thousands) | | $ | 58,385 | | | $ | 63,284 | | | $ | 97,302 | | | $ | 78,119 | | | $ | 76,683 | | |
Portfolio turnover | | | 39 | % | | | 74 | % | | | 61 | % | | | 39 | % | | | 38 | % | |
Notes to Financial Highlights
(a) The Fund received a payment from an affiliate. Had the Fund not received this payment, the total return would have been lower by 0.33%.
(b) In addition to the fees and expenses that the Fund bears directly, the Fund indirectly bears a pro rata share of the fees and expenses of any other funds in which it invests. Such indirect expenses are not included in the Fund's reported expense ratios.
(c) Ratios include line of credit interest expense which is less than 0.01%.
(d) Total net expenses include the impact of certain fee waivers/expense reimbursements made by the Investment Manager and certain of its affiliates, if applicable.
(e) The benefits derived from expense reductions had an impact of less than 0.01%.
The accompanying Notes to Financial Statements are an integral part of this statement.
Annual Report 2016
17
COLUMBIA GREATER CHINA FUND
FINANCIAL HIGHLIGHTS (continued)
| | | Year Ended August 31, | |
Class B | | 2016 | | 2015 | | 2014 | | 2013 | | 2012 | |
Per share data | |
Net asset value, beginning of period | | $ | 30.58 | | | $ | 42.85 | | | $ | 46.24 | | | $ | 39.90 | | | $ | 48.83 | | |
Income from investment operations: | |
Net investment income (loss) | | | (0.20 | ) | | | (0.40 | ) | | | (0.09 | ) | | | 0.04 | | | | 0.10 | | |
Net realized and unrealized gain (loss) | | | 3.28 | | | | (3.41 | ) | | | 8.51 | | | | 6.49 | | | | (6.47 | ) | |
Increase from payment by affiliate | | | — | | | | 0.14 | | | | — | | | | — | | | | — | | |
Total from investment operations | | | 3.08 | | | | (3.67 | ) | | | 8.42 | | | | 6.53 | | | | (6.37 | ) | |
Less distributions to shareholders: | |
Net investment income | | | — | | | | — | | | | (0.45 | ) | | | (0.19 | ) | | | — | | |
Net realized gains | | | (1.70 | ) | | | (8.60 | ) | | | (11.36 | ) | | | — | | | | (2.56 | ) | |
Total distributions to shareholders | | | (1.70 | ) | | | (8.60 | ) | | | (11.81 | ) | | | (0.19 | ) | | | (2.56 | ) | |
Net asset value, end of period | | $ | 31.96 | | | $ | 30.58 | | | $ | 42.85 | | | $ | 46.24 | | | $ | 39.90 | | |
Total return | | | 10.15 | % | | | (10.16 | %)(a) | | | 20.28 | % | | | 16.36 | % | | | (12.86 | %) | |
Ratios to average net assets(b) | |
Total gross expenses | | | 2.35 | %(c) | | | 2.32 | %(c) | | | 2.32 | %(c) | | | 2.29 | % | | | 2.28 | % | |
Total net expenses(d) | | | 2.35 | %(c)(e) | | | 2.32 | %(c)(e) | | | 2.32 | %(c)(e) | | | 2.29 | %(e) | | | 2.28 | %(e) | |
Net investment income (loss) | | | (0.65 | %) | | | (1.02 | %) | | | (0.22 | %) | | | 0.09 | % | | | 0.22 | % | |
Supplemental data | |
Net assets, end of period (in thousands) | | $ | 321 | | | $ | 1,023 | | | $ | 2,955 | | | $ | 4,265 | | | $ | 5,769 | | |
Portfolio turnover | | | 39 | % | | | 74 | % | | | 61 | % | | | 39 | % | | | 38 | % | |
Notes to Financial Highlights
(a) The Fund received a payment from an affiliate. Had the Fund not received this payment, the total return would have been lower by 0.33%.
(b) In addition to the fees and expenses that the Fund bears directly, the Fund indirectly bears a pro rata share of the fees and expenses of any other funds in which it invests. Such indirect expenses are not included in the Fund's reported expense ratios.
(c) Ratios include line of credit interest expense which is less than 0.01%.
(d) Total net expenses include the impact of certain fee waivers/expense reimbursements made by the Investment Manager and certain of its affiliates, if applicable.
(e) The benefits derived from expense reductions had an impact of less than 0.01%.
The accompanying Notes to Financial Statements are an integral part of this statement.
Annual Report 2016
18
COLUMBIA GREATER CHINA FUND
FINANCIAL HIGHLIGHTS (continued)
| | | Year Ended August 31, | |
Class C | | 2016 | | 2015 | | 2014 | | 2013 | | 2012 | |
Per share data | |
Net asset value, beginning of period | | $ | 31.35 | | | $ | 43.71 | | | $ | 46.94 | | | $ | 40.51 | | | $ | 49.52 | | |
Income from investment operations: | |
Net investment income (loss) | | | (0.22 | ) | | | (0.28 | ) | | | (0.02 | ) | | | 0.07 | | | | 0.14 | | |
Net realized and unrealized gain (loss) | | | 3.38 | | | | (3.62 | ) | | | 8.60 | | | | 6.55 | | | | (6.59 | ) | |
Increase from payment by affiliate | | | — | | | | 0.14 | | | | — | | | | — | | | | — | | |
Total from investment operations | | | 3.16 | | | | (3.76 | ) | | | 8.58 | | | | 6.62 | | | | (6.45 | ) | |
Less distributions to shareholders: | |
Net investment income | | | — | | | | — | | | | (0.45 | ) | | | (0.19 | ) | | | — | | |
Net realized gains | | | (1.70 | ) | | | (8.60 | ) | | | (11.36 | ) | | | — | | | | (2.56 | ) | |
Total distributions to shareholders | | | (1.70 | ) | | | (8.60 | ) | | | (11.81 | ) | | | (0.19 | ) | | | (2.56 | ) | |
Net asset value, end of period | | $ | 32.81 | | | $ | 31.35 | | | $ | 43.71 | | | $ | 46.94 | | | $ | 40.51 | | |
Total return | | | 10.15 | % | | | (10.16 | %)(a) | | | 20.32 | % | | | 16.33 | % | | | (12.84 | %) | |
Ratios to average net assets(b) | |
Total gross expenses | | | 2.36 | %(c) | | | 2.32 | %(c) | | | 2.32 | %(c) | | | 2.29 | % | | | 2.28 | % | |
Total net expenses(d) | | | 2.36 | %(c)(e) | | | 2.32 | %(c)(e) | | | 2.32 | %(c)(e) | | | 2.29 | %(e) | | | 2.28 | %(e) | |
Net investment income (loss) | | | (0.71 | %) | | | (0.71 | %) | | | (0.05 | %) | | | 0.15 | % | | | 0.33 | % | |
Supplemental data | |
Net assets, end of period (in thousands) | | $ | 10,952 | | | $ | 12,103 | | | $ | 15,851 | | | $ | 17,056 | | | $ | 20,401 | | |
Portfolio turnover | | | 39 | % | | | 74 | % | | | 61 | % | | | 39 | % | | | 38 | % | |
Notes to Financial Highlights
(a) The Fund received a payment from an affiliate. Had the Fund not received this payment, the total return would have been lower by 0.33%.
(b) In addition to the fees and expenses that the Fund bears directly, the Fund indirectly bears a pro rata share of the fees and expenses of any other funds in which it invests. Such indirect expenses are not included in the Fund's reported expense ratios.
(c) Ratios include line of credit interest expense which is less than 0.01%.
(d) Total net expenses include the impact of certain fee waivers/expense reimbursements made by the Investment Manager and certain of its affiliates, if applicable.
(e) The benefits derived from expense reductions had an impact of less than 0.01%.
The accompanying Notes to Financial Statements are an integral part of this statement.
Annual Report 2016
19
COLUMBIA GREATER CHINA FUND
FINANCIAL HIGHLIGHTS (continued)
| | | Year Ended August 31, | |
Class I | | 2016 | | 2015 | | 2014 | | 2013 | | 2012 | |
Per share data | |
Net asset value, beginning of period | | $ | 36.04 | | | $ | 48.96 | | | $ | 51.30 | | | $ | 44.20 | | | $ | 53.36 | | |
Income from investment operations: | |
Net investment income | | | 0.18 | | | | 0.20 | | | | 0.90 | | | | 0.70 | | | | 0.73 | | |
Net realized and unrealized gain (loss) | | | 3.90 | | | | (4.15 | ) | | | 9.14 | | | | 7.13 | | | | (7.14 | ) | |
Increase from payment by affiliate | | | — | | | | 0.16 | | | | — | | | | — | | | | — | | |
Total from investment operations | | | 4.08 | | | | (3.79 | ) | | | 10.04 | | | | 7.83 | | | | (6.41 | ) | |
Less distributions to shareholders: | |
Net investment income | | | (0.23 | ) | | | (0.53 | ) | | | (1.02 | ) | | | (0.73 | ) | | | (0.19 | ) | |
Net realized gains | | | (1.70 | ) | | | (8.60 | ) | | | (11.36 | ) | | | — | | | | (2.56 | ) | |
Total distributions to shareholders | | | (1.93 | ) | | | (9.13 | ) | | | (12.38 | ) | | | (0.73 | ) | | | (2.75 | ) | |
Net asset value, end of period | | $ | 38.19 | | | $ | 36.04 | | | $ | 48.96 | | | $ | 51.30 | | | $ | 44.20 | | |
Total return | | | 11.45 | % | | | (9.07 | %)(a) | | | 21.75 | % | | | 17.75 | % | | | (11.78 | %) | |
Ratios to average net assets(b) | |
Total gross expenses | | | 1.16 | %(c) | | | 1.13 | %(c) | | | 1.08 | %(c) | | | 1.09 | % | | | 1.08 | % | |
Total net expenses(d) | | | 1.16 | %(c) | | | 1.13 | %(c) | | | 1.08 | %(c) | | | 1.09 | % | | | 1.08 | %(e) | |
Net investment income | | | 0.50 | % | | | 0.45 | % | | | 1.61 | % | | | 1.41 | % | | | 1.57 | % | |
Supplemental data | |
Net assets, end of period (in thousands) | | $ | 2 | | | $ | 2 | | | $ | 3 | | | $ | 52,946 | | | $ | 69,532 | | |
Portfolio turnover | | | 39 | % | | | 74 | % | | | 61 | % | | | 39 | % | | | 38 | % | |
Notes to Financial Highlights
(a) The Fund received a payment from an affiliate. Had the Fund not received this payment, the total return would have been lower by 0.33%.
(b) In addition to the fees and expenses that the Fund bears directly, the Fund indirectly bears a pro rata share of the fees and expenses of any other funds in which it invests. Such indirect expenses are not included in the Fund's reported expense ratios.
(c) Ratios include line of credit interest expense which is less than 0.01%.
(d) Total net expenses include the impact of certain fee waivers/expense reimbursements made by the Investment Manager and certain of its affiliates, if applicable.
(e) The benefits derived from expense reductions had an impact of less than 0.01%.
The accompanying Notes to Financial Statements are an integral part of this statement.
Annual Report 2016
20
COLUMBIA GREATER CHINA FUND
FINANCIAL HIGHLIGHTS (continued)
| | | Year Ended August 31, | |
Class R4 | | 2016 | | 2015 | | 2014 | | 2013(a) | |
Per share data | |
Net asset value, beginning of period | | $ | 36.53 | | | $ | 49.47 | | | $ | 51.71 | | | $ | 49.17 | | |
Income from investment operations: | |
Net investment income (loss) | | | 0.11 | | | | 1.09 | | | | (0.01 | ) | | | 0.88 | | |
Net realized and unrealized gain (loss) | | | 3.96 | | | | (5.18 | ) | | | 10.04 | | | | 1.66 | | |
Increase from payment by affiliate | | | — | | | | 0.16 | | | | — | | | | — | | |
Total from investment operations | | | 4.07 | | | | (3.93 | ) | | | 10.03 | | | | 2.54 | | |
Less distributions to shareholders: | |
Net investment income | | | (0.16 | ) | | | (0.41 | ) | | | (0.91 | ) | | | — | | |
Net realized gains | | | (1.70 | ) | | | (8.60 | ) | | | (11.36 | ) | | | — | | |
Total distributions to shareholders | | | (1.86 | ) | | | (9.01 | ) | | | (12.27 | ) | | | — | | |
Net asset value, end of period | | $ | 38.74 | | | $ | 36.53 | | | $ | 49.47 | | | $ | 51.71 | | |
Total return | | | 11.27 | % | | | (9.26 | %)(b) | | | 21.50 | % | | | 5.17 | % | |
Ratios to average net assets(c) | |
Total gross expenses | | | 1.36 | %(d) | | | 1.29 | %(d) | | | 1.33 | %(d) | | | 1.32 | %(e) | |
Total net expenses(f) | | | 1.36 | %(d)(g) | | | 1.29 | %(d)(g) | | | 1.33 | %(d)(g) | | | 1.32 | %(e)(g) | |
Net investment income (loss) | | | 0.30 | % | | | 2.47 | % | | | (0.03 | %) | | | 4.00 | %(e) | |
Supplemental data | |
Net assets, end of period (in thousands) | | $ | 3,532 | | | $ | 2,473 | | | $ | 8 | | | $ | 12 | | |
Portfolio turnover | | | 39 | % | | | 74 | % | | | 61 | % | | | 39 | % | |
Notes to Financial Highlights
(a) Based on operations from March 19, 2013 (commencement of operations) through the stated period end.
(b) The Fund received a payment from an affiliate. Had the Fund not received this payment, the total return would have been lower by 0.33%.
(c) In addition to the fees and expenses that the Fund bears directly, the Fund indirectly bears a pro rata share of the fees and expenses of any other funds in which it invests. Such indirect expenses are not included in the Fund's reported expense ratios.
(d) Ratios include line of credit interest expense which is less than 0.01%.
(e) Annualized.
(f) Total net expenses include the impact of certain fee waivers/expense reimbursements made by the Investment Manager and certain of its affiliates, if applicable.
(g) The benefits derived from expense reductions had an impact of less than 0.01%.
The accompanying Notes to Financial Statements are an integral part of this statement.
Annual Report 2016
21
COLUMBIA GREATER CHINA FUND
FINANCIAL HIGHLIGHTS (continued)
| | | Year Ended August 31, | |
Class R5 | | 2016 | | 2015 | | 2014 | | 2013(a) | |
Per share data | |
Net asset value, beginning of period | | $ | 36.58 | | | $ | 49.52 | | | $ | 51.76 | | | $ | 48.84 | | |
Income from investment operations: | |
Net investment income | | | 0.24 | | | | 0.52 | | | | 0.73 | | | | 0.63 | | |
Net realized and unrealized gain (loss) | | | 3.90 | | | | (4.54 | ) | | | 9.38 | | | | 2.97 | | |
Increase from payment by affiliate | | | — | | | | 0.16 | | | | — | | | | — | | |
Total from investment operations | | | 4.14 | | | | (3.86 | ) | | | 10.11 | | | | 3.60 | | |
Less distributions to shareholders: | |
Net investment income | | | (0.22 | ) | | | (0.48 | ) | | | (0.99 | ) | | | (0.68 | ) | |
Net realized gains | | | (1.70 | ) | | | (8.60 | ) | | | (11.36 | ) | | | — | | |
Total distributions to shareholders | | | (1.92 | ) | | | (9.08 | ) | | | (12.35 | ) | | | (0.68 | ) | |
Net asset value, end of period | | $ | 38.80 | | | $ | 36.58 | | | $ | 49.52 | | | $ | 51.76 | | |
Total return | | | 11.44 | % | | | (9.11 | %)(b) | | | 21.67 | % | | | 7.40 | % | |
Ratios to average net assets(c) | |
Total gross expenses | | | 1.21 | %(d) | | | 1.16 | %(d) | | | 1.19 | %(d) | | | 1.16 | %(e) | |
Total net expenses(f) | | | 1.21 | %(d) | | | 1.16 | %(d) | | | 1.19 | %(d) | | | 1.16 | %(e) | |
Net investment income | | | 0.66 | % | | | 1.17 | % | | | 1.58 | % | | | 1.53 | %(e) | |
Supplemental data | |
Net assets, end of period (in thousands) | | $ | 879 | | | $ | 438 | | | $ | 117 | | | $ | 3 | | |
Portfolio turnover | | | 39 | % | | | 74 | % | | | 61 | % | | | 39 | % | |
Notes to Financial Highlights
(a) Based on operations from November 8, 2012 (commencement of operations) through the stated period end.
(b) The Fund received a payment from an affiliate. Had the Fund not received this payment, the total return would have been lower by 0.33%.
(c) In addition to the fees and expenses that the Fund bears directly, the Fund indirectly bears a pro rata share of the fees and expenses of any other funds in which it invests. Such indirect expenses are not included in the Fund's reported expense ratios.
(d) Ratios include line of credit interest expense which is less than 0.01%.
(e) Annualized.
(f) Total net expenses include the impact of certain fee waivers/expense reimbursements made by the Investment Manager and certain of its affiliates, if applicable.
The accompanying Notes to Financial Statements are an integral part of this statement.
Annual Report 2016
22
COLUMBIA GREATER CHINA FUND
FINANCIAL HIGHLIGHTS (continued)
| | | Year Ended August 31, | |
Class W | | 2016 | | 2015 | | 2014 | | 2013 | | 2012(a) | |
Per share data | |
Net asset value, beginning of period | | $ | 33.33 | | | $ | 45.95 | | | $ | 48.82 | | | $ | 42.10 | | | $ | 43.58 | | |
Income from investment operations: | |
Net investment income (loss) | | | 0.01 | | | | 0.01 | | | | 0.36 | | | | 0.51 | | | | (0.05 | ) | |
Net realized and unrealized gain (loss) | | | 3.61 | | | | (3.86 | ) | | | 8.96 | | | | 6.77 | | | | (1.43 | ) | |
Increase from payment by affiliate | | | — | | | | 0.15 | | | | — | | | | — | | | | — | | |
Total from investment operations | | | 3.62 | | | | (3.70 | ) | | | 9.32 | | | | 7.28 | | | | (1.48 | ) | |
Less distributions to shareholders: | |
Net investment income | | | (0.05 | ) | | | (0.32 | ) | | | (0.83 | ) | | | (0.56 | ) | | | — | | |
Net realized gains | | | (1.70 | ) | | | (8.60 | ) | | | (11.36 | ) | | | — | | | | — | | |
Total distributions to shareholders | | | (1.75 | ) | | | (8.92 | ) | | | (12.19 | ) | | | (0.56 | ) | | | — | | |
Net asset value, end of period | | $ | 35.20 | | | $ | 33.33 | | | $ | 45.95 | | | $ | 48.82 | | | $ | 42.10 | | |
Total return | | | 10.97 | % | | | (9.48 | %)(b) | | | 21.27 | % | | | 17.30 | % | | | (3.40 | %) | |
Ratios to average net assets(c) | |
Total gross expenses | | | 1.60 | %(d) | | | 1.56 | %(d) | | | 1.52 | %(d) | | | 1.49 | % | | | 1.47 | %(e) | |
Total net expenses(f) | | | 1.60 | %(d)(g) | | | 1.56 | %(d)(g) | | | 1.52 | %(d)(g) | | | 1.49 | %(g) | | | 1.47 | %(e) | |
Net investment income (loss) | | | 0.06 | % | | | 0.01 | % | | | 0.78 | % | | | 1.07 | % | | | (0.55 | %)(e) | |
Supplemental data | |
Net assets, end of period (in thousands) | | $ | 2 | | | $ | 2 | | | $ | 3 | | | $ | 3 | | | $ | 2 | | |
Portfolio turnover | | | 39 | % | | | 74 | % | | | 61 | % | | | 39 | % | | | 38 | % | |
Notes to Financial Highlights
(a) Based on operations from June 18, 2012 (commencement of operations) through the stated period end.
(b) The Fund received a payment from an affiliate. Had the Fund not received this payment, the total return would have been lower by 0.33%.
(c) In addition to the fees and expenses that the Fund bears directly, the Fund indirectly bears a pro rata share of the fees and expenses of any other funds in which it invests. Such indirect expenses are not included in the Fund's reported expense ratios.
(d) Ratios include line of credit interest expense which is less than 0.01%.
(e) Annualized.
(f) Total net expenses include the impact of certain fee waivers/expense reimbursements made by the Investment Manager and certain of its affiliates, if applicable.
(g) The benefits derived from expense reductions had an impact of less than 0.01%.
The accompanying Notes to Financial Statements are an integral part of this statement.
Annual Report 2016
23
COLUMBIA GREATER CHINA FUND
FINANCIAL HIGHLIGHTS (continued)
| | | Year Ended August 31, | |
Class Z | | 2016 | | 2015 | | 2014 | | 2013 | | 2012 | |
Per share data | |
Net asset value, beginning of period | | $ | 35.91 | | | $ | 48.78 | | | $ | 51.16 | | | $ | 44.08 | | | $ | 53.35 | | |
Income from investment operations: | |
Net investment income | | | 0.12 | | | | 0.38 | | | | 0.46 | | | | 0.59 | | | | 0.63 | | |
Net realized and unrealized gain (loss) | | | 3.87 | | | | (4.39 | ) | | | 9.45 | | | | 7.13 | | | | (7.14 | ) | |
Increase from payment by affiliate | | | — | | | | 0.16 | | | | — | | | | — | | | | — | | |
Total from investment operations | | | 3.99 | | | | (3.85 | ) | | | 9.91 | | | | 7.72 | | | | (6.51 | ) | |
Less distributions to shareholders: | |
Net investment income | | | (0.15 | ) | | | (0.42 | ) | | | (0.93 | ) | | | (0.64 | ) | | | (0.20 | ) | |
Net realized gains | | | (1.70 | ) | | | (8.60 | ) | | | (11.36 | ) | | | — | | | | (2.56 | ) | |
Total distributions to shareholders | | | (1.85 | ) | | | (9.02 | ) | | | (12.29 | ) | | | (0.64 | ) | | | (2.76 | ) | |
Net asset value, end of period | | $ | 38.05 | | | $ | 35.91 | | | $ | 48.78 | | | $ | 51.16 | | | $ | 44.08 | | |
Total return | | | 11.24 | % | | | (9.24 | %)(a) | | | 21.49 | % | | | 17.54 | % | | | (11.98 | %) | |
Ratios to average net assets(b) | |
Total gross expenses | | | 1.35 | %(c) | | | 1.31 | %(c) | | | 1.32 | %(c) | | | 1.29 | % | | | 1.28 | % | |
Total net expenses(d) | | | 1.35 | %(c)(e) | | | 1.31 | %(c)(e) | | | 1.32 | %(c)(e) | | | 1.29 | %(e) | | | 1.28 | %(e) | |
Net investment income | | | 0.34 | % | | | 0.86 | % | | | 0.96 | % | | | 1.18 | % | | | 1.34 | % | |
Supplemental data | |
Net assets, end of period (in thousands) | | $ | 40,293 | | | $ | 49,047 | | | $ | 29,730 | | | $ | 28,948 | | | $ | 29,165 | | |
Portfolio turnover | | | 39 | % | | | 74 | % | | | 61 | % | | | 39 | % | | | 38 | % | |
Notes to Financial Highlights
(a) The Fund received a payment from an affiliate. Had the Fund not received this payment, the total return would have been lower by 0.33%.
(b) In addition to the fees and expenses that the Fund bears directly, the Fund indirectly bears a pro rata share of the fees and expenses of any other funds in which it invests. Such indirect expenses are not included in the Fund's reported expense ratios.
(c) Ratios include line of credit interest expense which is less than 0.01%.
(d) Total net expenses include the impact of certain fee waivers/expense reimbursements made by the Investment Manager and certain of its affiliates, if applicable.
(e) The benefits derived from expense reductions had an impact of less than 0.01%.
The accompanying Notes to Financial Statements are an integral part of this statement.
Annual Report 2016
24
COLUMBIA GREATER CHINA FUND
NOTES TO FINANCIAL STATEMENTS
August 31, 2016
Note 1. Organization
Columbia Greater China Fund (the Fund), a series of Columbia Funds Series Trust I (the Trust), is a non-diversified fund. The Trust is registered under the Investment Company Act of 1940, as amended (the 1940 Act), as an open-end management investment company organized as a Massachusetts business trust.
Fund Shares
The Trust may issue an unlimited number of shares (without par value). The Fund offers Class A, Class B, Class C, Class I, Class R4, Class R5, Class W and Class Z shares. Although all share classes generally have identical voting, dividend and liquidation rights, each share class votes separately when required by the Trust's organizational documents or by law. Different share classes pay different distribution amounts to the extent the expenses of such share classes differ, and distributions in liquidation will be proportional to the net asset value of each share class. Each share class has its own expense and sales charge structure.
Class A shares are subject to a maximum front-end sales charge of 5.75% based on the initial investment amount. Class A shares purchased without an initial sales charge in accounts aggregating $1 million to $50 million at the time of purchase are subject to a contingent deferred sales charge (CDSC) if the shares are sold within 18 months after purchase, charged as follows: 1.00% CDSC if redeemed within 12 months after purchase, and 0.50% CDSC if redeemed more than 12, but less than 18, months after purchase.
Class B shares may be subject to a maximum CDSC of 5.00% based upon the holding period after purchase. Class B shares will generally convert to Class A shares eight years after purchase. The Fund no longer accepts investments by new or existing investors in the Fund's Class B shares, except in connection with the reinvestment of any dividend and/or capital gain distributions in Class B shares of the Fund and exchanges by existing Class B shareholders of certain other funds within the Columbia Family of Funds.
Class C shares are subject to a 1.00% CDSC on shares redeemed within 12 months after purchase.
Class I shares are not subject to sales charges and are available only to the Columbia Family of Funds.
Class R4 shares are not subject to sales charges and are generally available only to omnibus retirement plans and certain investors as described in the Fund's prospectus.
Class R5 shares are not subject to sales charges and are generally available only to investors purchasing through authorized investment professionals and omnibus retirement plans.
Class W shares are not subject to sales charges and are generally available only to investors purchasing through authorized investment programs managed by investment professionals, including discretionary managed account programs.
Class Z shares are not subject to sales charges and are generally available only to eligible investors, which are subject to different investment minimums as described in the Fund's prospectus.
Note 2. Summary of Significant Accounting Policies
Basis of Preparation
The Fund is an investment company that applies the accounting and reporting guidance in the Financial Accounting Standards Board (FASB) Accounting Standards Codification Topic 946, Financial Services — Investment Companies (ASC 946). The financial statements are prepared in accordance with U.S. generally accepted accounting principles (GAAP), which requires management to make certain estimates and assumptions that affect the reported amounts of assets and liabilities, the disclosure of contingent assets and liabilities at the date of the financial statements and the reported amounts of income and expenses during the reporting period. Actual results could differ from those estimates.
The following is a summary of significant accounting policies followed by the Fund in the preparation of its financial statements.
Security Valuation
All equity securities are valued at the close of business of the New York Stock Exchange (NYSE). Equity securities are valued at the last quoted sales price on the principal exchange or market on which they trade, except for securities traded on the NASDAQ Stock Market, which are valued at the NASDAQ official close price. Unlisted securities or listed securities for which there were no sales during the day are valued at the mean of the latest quoted bid and ask prices on such exchanges or markets.
Foreign equity securities are valued based on the closing price on the foreign exchange in which such securities are primarily traded. If any foreign equity security closing
Annual Report 2016
25
COLUMBIA GREATER CHINA FUND
NOTES TO FINANCIAL STATEMENTS (continued)
August 31, 2016
prices are not readily available, the securities are valued at the mean of the latest quoted bid and ask prices on such exchanges or markets. Foreign currency exchange rates are generally determined at 4:00 p.m. Eastern (U.S.) time. Many securities markets and exchanges outside the U.S. close prior to the close of the NYSE; therefore, the closing prices for securities in such markets or on such exchanges may not fully reflect events that occur after such close but before the close of the NYSE. In those situations, foreign securities will be fair valued pursuant to a policy adopted by the Board of Trustees (the Board), including, if available, utilizing a third party pricing service to determine these fair values. The third party pricing service takes into account multiple factors, including, but not limited to, movements in the U.S. securities markets, certain depositary receipts, futures contracts and foreign exchange rates that have occurred subsequent to the close of the foreign exchange or market, to determine a good faith estimate that reasonably reflects the current market conditions as of the close of the NYSE. The fair value of a security is likely to be different from the quoted or published price, if available.
Investments in open-end investment companies, including money market funds, are valued at their latest net asset value.
Investments for which market quotations are not readily available, or that have quotations which management believes are not reflective of market value or reliable, are valued at fair value as determined in good faith under procedures approved by and under the general supervision of the Board. If a security or class of securities (such as foreign securities) is valued at fair value, such value is likely to be different from the quoted or published price for the security.
The determination of fair value often requires significant judgment. To determine fair value, management may use assumptions including but not limited to future cash flows and estimated risk premiums. Multiple inputs from various sources may be used to determine fair value.
GAAP requires disclosure regarding the inputs and valuation techniques used to measure fair value and any changes in valuation inputs or techniques. In addition, investments shall be disclosed by major category. This information is disclosed following the Fund's Portfolio of Investments.
Foreign Currency Transactions and Translations
The values of all assets and liabilities denominated in foreign currencies are generally translated into U.S. dollars
at exchange rates determined at the close of the NYSE on any given day. Net realized and unrealized gains (losses) on foreign currency transactions and translations include gains (losses) arising from the fluctuation in exchange rates between trade and settlement dates on securities transactions, gains (losses) arising from the disposition of foreign currency and currency gains (losses) between the accrual and payment dates on dividends, interest income and foreign withholding taxes.
For financial statement purposes, the Fund does not distinguish that portion of gains (losses) on investments which is due to changes in foreign exchange rates from that which is due to changes in market prices of the investments. Such fluctuations are included with the net realized and unrealized gains (losses) on investments in the Statement of Operations.
Security Transactions
Security transactions are accounted for on the trade date. Cost is determined and gains (losses) are based upon the specific identification method for both financial statement and federal income tax purposes.
Income Recognition
Corporate actions and dividend income are generally recorded net of any non-reclaimable tax withholdings, on the ex-dividend date or upon receipt of ex-dividend notification in the case of certain foreign securities.
Awards from class action litigation are recorded as a reduction of cost basis if the Fund still owns the applicable securities on the payment date. If the Fund no longer owns the applicable securities, the proceeds are recorded as realized gains.
Expenses
General expenses of the Trust are allocated to the Fund and other funds of the Trust based upon relative net assets or other expense allocation methodologies determined by the nature of the expense. Expenses directly attributable to the Fund are charged to the Fund. Expenses directly attributable to a specific class of shares are charged to that share class.
Determination of Class Net Asset Value
All income, expenses (other than class-specific expenses, which are charged to that share class, as shown in the Statement of Operations) and realized and unrealized gains (losses) are allocated to each class of the Fund on a daily basis, based on the relative net
Annual Report 2016
26
COLUMBIA GREATER CHINA FUND
NOTES TO FINANCIAL STATEMENTS (continued)
August 31, 2016
assets of each class, for purposes of determining the net asset value of each class.
Federal Income Tax Status
The Fund intends to qualify each year as a regulated investment company under Subchapter M of the Internal Revenue Code, as amended, and will distribute substantially all of its taxable income (including net short-term capital gains), if any, for its tax year, and as such will not be subject to federal income taxes. In addition, the Fund intends to distribute in each calendar year substantially all of its net investment income, capital gains and certain other amounts, if any, such that the Fund should not be subject to federal excise tax. Therefore, no federal income or excise tax provision is recorded.
Foreign Taxes
The Fund may be subject to foreign taxes on income, gains on investments or currency repatriation, a portion of which may be recoverable. The Fund will accrue such taxes and recoveries, as applicable, based upon its current interpretation of tax rules and regulations that exist in the markets in which it invests.
Realized gains in certain countries may be subject to foreign taxes at the Fund level, based on statutory rates. The Fund accrues for such foreign taxes on realized and unrealized gains at the appropriate rate for each jurisdiction, as applicable. The amount, if any, is disclosed as a liability on the Statement of Assets and Liabilities.
Distributions to Shareholders
Distributions from net investment income, if any, are declared and paid annually. Net realized capital gains, if any, are distributed along with the income distribution. Income distributions and capital gain distributions are determined in accordance with federal income tax regulations, which may differ from GAAP.
Guarantees and Indemnifications
Under the Trust's organizational documents and, in some cases, by contract, its officers and trustees are indemnified against certain liabilities arising out of the performance of their duties to the Trust or its funds. In addition, certain of the Fund's contracts with its service providers contain general indemnification clauses. The Fund's maximum exposure under these arrangements is unknown since the amount of any future claims that may be made against the Fund cannot be determined, and
the Fund has no historical basis for predicting the likelihood of any such claims.
Note 3. Fees and Other Transactions with Affiliates
Management Services Fees
Effective January 1, 2016, the Fund entered into a Management Agreement with Columbia Management Investment Advisers, LLC (the Investment Manager), a wholly-owned subsidiary of Ameriprise Financial, Inc. (Ameriprise Financial). Under the Management Agreement, the Investment Manager provides the Fund with investment research and advice, as well as administrative and accounting services. The management services fee is an annual fee that is equal to a percentage of the Fund's average daily net assets that declines from 0.95% to 0.72% as the Fund's net assets increase. Prior to January 1, 2016, the Fund paid the Investment Manager an annual fee for advisory services under an Investment Management Services Agreement and a separate annual fee for administrative and accounting services under an Administrative Services Agreement. The effective management services fee rate for the year ended August 31, 2016 (reflecting all advisory and administrative services fees paid to the Investment Manager) was 0.95% of the Fund's average daily net assets. For the period from September 1, 2015 through December 31, 2015, the investment advisory services fee paid to the Investment Manager was $405,805, and the administrative services fee paid to the Investment Manager was $37,315.
Compensation of Board Members
Board members, who are not officers or employees of the Investment Manager or Ameriprise Financial, are compensated for their services to the Fund as disclosed in the Statement of Operations. These Board members may participate in a Deferred Compensation Plan (the Plan) which may be terminated at any time. Obligations of the Plan will be paid solely out of the Fund's assets, and all amounts payable under the Plan constitute a general unsecured obligation of the Fund.
Compensation of Chief Compliance Officer
The Board has appointed a Chief Compliance Officer to the Fund in accordance with federal securities regulations. The Fund is allocated a portion of the expenses associated with the Chief Compliance Officer based on relative net assets of the Trust.
Annual Report 2016
27
COLUMBIA GREATER CHINA FUND
NOTES TO FINANCIAL STATEMENTS (continued)
August 31, 2016
Transfer Agency Fees
Under a Transfer and Dividend Disbursing Agent Agreement, Columbia Management Investment Services Corp. (the Transfer Agent), an affiliate of the Investment Manager and a wholly-owned subsidiary of Ameriprise Financial, is responsible for providing transfer agency services to the Fund. The Transfer Agent has contracted with Boston Financial Data Services (BFDS) to serve as sub-transfer agent. The Transfer Agent pays the fees of BFDS for services as sub-transfer agent and BFDS is not entitled to reimbursement for such fees from the Fund (with the exception of out-of-pocket fees).
The Fund pays the Transfer Agent a monthly transfer agency fee based on the number or the average value of accounts, depending on the type of account. In addition, prior to October 1, 2016, the Transfer Agent also received sub-transfer agency fees based on a percentage of the average aggregate value of the Fund's shares maintained in omnibus accounts (other than omnibus accounts for which American Enterprise Investment Services Inc. is the broker of record or accounts where the beneficial shareholder is a customer of Ameriprise Financial Services, Inc., for which the Transfer Agent receives a per account fee). Effective October 1, 2016, the Fund pays the Transfer Agent a fee for shareholder services based on the number of accounts or on a percentage of the average aggregate value of the Fund's shares maintained in omnibus accounts up to the lesser of the amount charged by the servicing agent or a cap established by the Board from time to time.
The Transfer Agent also receives compensation from the Fund for various shareholder services and reimbursements for certain out-of-pocket fees. Total transfer agency fees for Class R5 shares are subject to an annual limitation of not more than 0.05% of the average daily net assets attributable to Class R5 shares. Class I shares do not pay transfer agency fees.
For the year ended August 31, 2016, the Fund's effective transfer agency fee rates as a percentage of average daily net assets of each class were as follows:
Class A | | | 0.21 | % | |
Class B | | | 0.21 | | |
Class C | | | 0.21 | | |
Class R4 | | | 0.20 | | |
Class R5 | | | 0.05 | | |
Class W | | | 0.21 | | |
Class Z | | | 0.21 | | |
An annual minimum account balance fee of $20 may apply to certain accounts with a value below the applicable share class's initial minimum investment requirements to reduce the impact of small accounts on transfer agency fees. These minimum account balance fees are remitted to the Fund and recorded as part of expense reductions in the Statement of Operations. For the year ended August 31, 2016, these minimum account balance fees reduced total expenses of the Fund by $560.
Distribution and Service Fees
The Fund has an agreement with Columbia Management Investment Distributors, Inc. (the Distributor), an affiliate of the Investment Manager and a wholly-owned subsidiary of Ameriprise Financial, for distribution and shareholder services. The Board has approved, and the Fund has adopted, distribution and shareholder service plans (the Plans) applicable to certain share classes, which set the distribution and service fees for the Fund. These fees are calculated daily and are intended to compensate the Distributor and/or eligible selling and/or servicing agents for selling shares of the Fund and providing services to investors.
Under the Plans, the Fund pays a monthly service fee to the Distributor at the maximum annual rate of 0.25% of the average daily net assets attributable to Class A, Class B, Class C and Class W shares of the Fund. Also under the Plans, the Fund pays a monthly distribution fee to the Distributor at the maximum annual rates of 0.75%, 0.75% and 0.25% of the average daily net assets attributable to Class B, Class C and Class W shares of the Fund, respectively.
Although the Fund may pay a distribution fee up to 0.25% of the Fund's average daily net assets attributable to Class W shares and a service fee of up to 0.25% of the Fund's average daily net assets attributable to Class W shares, the aggregate fee shall not exceed 0.25% of the Fund's average daily net assets attributable to Class W shares.
Sales Charges
Sales charges, including front-end charges and CDSCs, received by the Distributor for distributing Fund shares were $25,505 for Class A, $0 for Class B, and $1,817 for Class C shares for the year ended August 31, 2016.
Expenses Waived/Reimbursed by the Investment Manager and its Affiliates
The Fund's expense ratio is subject to an expense reimbursement arrangement pursuant to which fees will
Annual Report 2016
28
COLUMBIA GREATER CHINA FUND
NOTES TO FINANCIAL STATEMENTS (continued)
August 31, 2016
be waived and/or expenses reimbursed (excluding certain fees and expenses described below), so that the Fund's net operating expenses, after giving effect to fees waived/expenses reimbursed and any balance credits and/or overdraft charges from the Fund's custodian, do not exceed the annual rates of:
| | | Contractual
Expense Cap
January 1, 2016
through
December 31, 2016 | | Voluntary
Expense Cap
Prior to
January 1, 2016 | |
Class A | | | 1.78 | % | | | 1.80 | % | |
Class B | | | 2.53 | | | | 2.55 | | |
Class C | | | 2.53 | | | | 2.55 | | |
Class I | | | 1.37 | | | | 1.39 | | |
Class R4 | | | 1.53 | | | | 1.55 | | |
Class R5 | | | 1.42 | | | | 1.44 | | |
Class W | | | 1.78 | | | | 1.80 | | |
Class Z | | | 1.53 | | | | 1.55 | | |
The contractual agreement may be modified or amended only with approval from the Investment Manager, certain of its affiliates and the Fund. Under the arrangements, the following fees and expenses are excluded from the waiver/reimbursement commitment, and therefore will be paid by the Fund, if applicable: taxes (including foreign transaction taxes), expenses associated with investments in affiliated and non-affiliated pooled investment vehicles (including mutual funds and exchange-traded funds), transaction costs and brokerage commissions, costs related to any securities lending program, dividend and interest expenses associated with securities sold short, inverse floater program fees and expenses, transaction charges and interest on borrowed money, interest and infrequent and/or unusual expenses. Any fees waived and/or expenses reimbursed under the expense reimbursement arrangements described above are not recoverable by the Investment Manager or its affiliates in future periods.
Note 4. Federal Tax Information
The timing and character of income and capital gain distributions are determined in accordance with income tax regulations, which may differ from GAAP because of temporary or permanent book to tax differences.
At August 31, 2016, these differences are primarily due to differing treatment for capital loss carryforwards, deferral/reversal of wash sale losses, Trustees' deferred compensation, foreign currency transactions and post-October capital losses. To the extent these differences are permanent, reclassifications are made among the
components of the Fund's net assets in the Statement of Assets and Liabilities. Temporary differences do not require reclassifications.
In the Statement of Assets and Liabilities the following reclassifications were made:
Excess of distributions over net investment income | | $ | 20,816 | | |
Accumulated net realized loss | | | 11,617 | | |
Paid-in capital | | | (32,433 | ) | |
Net investment income (loss) and net realized gains (losses), as disclosed in the Statement of Operations, and net assets were not affected by this reclassification.
The tax character of distributions paid during the years indicated was as follows:
Year Ended August 31, | | 2016 | | 2015 | |
Ordinary income | | $ | 339,510 | | | $ | 3,814,858 | | |
Long-term capital gains | | | 6,807,565 | | | | 19,838,124 | | |
Total | | $ | 7,147,075 | | | $ | 23,652,982 | | |
Short-term capital gain distributions, if any, are considered ordinary income distributions for tax purposes.
At August 31, 2016, the components of distributable earnings on a tax basis were as follows:
Capital loss carryforwards | | $ | (2,853,948 | ) | |
Net unrealized appreciation | | | 37,225,301 | | |
At August 31, 2016, the cost of investments for federal income tax purposes was $75,970,278 and the aggregate gross unrealized appreciation and depreciation based on that cost was:
Unrealized appreciation | | $ | 39,870,588 | | |
Unrealized depreciation | | | (2,645,287 | ) | |
Net unrealized appreciation | | $ | 37,225,301 | | |
The following capital loss carryforwards, determined at August 31, 2016, may be available to reduce taxable income arising from future net realized gains on investments, if any, to the extent permitted by the Internal Revenue Code:
Year of Expiration | | Amount ($) | |
No expiration — short-term | | | 2,402,148 | | |
No expiration — long-term | | | 451,800 | | |
Total | | | 2,853,948 | | |
Capital loss carryforwards with no expiration are required to be utilized prior to any capital losses which carry an
Annual Report 2016
29
COLUMBIA GREATER CHINA FUND
NOTES TO FINANCIAL STATEMENTS (continued)
August 31, 2016
expiration date. As a result of this ordering rule, capital loss carryforwards which carry an expiration date may be more likely to expire unused.
Under current tax rules, regulated investment companies can elect to treat certain late-year ordinary losses incurred and post-October capital losses (capital losses realized after October 31) as arising on the first day of the following taxable year. As of August 31, 2016, the Fund will elect to treat post-October capital losses of $4,302,510 as arising on September 1, 2016.
Management of the Fund has concluded that there are no significant uncertain tax positions in the Fund that would require recognition in the financial statements. However, management's conclusion may be subject to review and adjustment at a later date based on factors including, but not limited to, new tax laws, regulations, and administrative interpretations (including relevant court decisions). Generally, the Fund's federal tax returns for the prior three fiscal years remain subject to examination by the Internal Revenue Service.
Note 5. Portfolio Information
The cost of purchases and proceeds from sales of securities, excluding short-term investments and derivatives, if any, aggregated to $46,540,234 and $74,792,904, respectively, for the year ended August 31, 2016. The amount of purchase and sale activity impacts the portfolio turnover rate reported in the Financial Highlights.
Note 6. Affiliated Money Market Fund
The Fund invests in Columbia Short-Term Cash Fund, an affiliated money market fund established for the exclusive use by the Fund and other affiliated funds (the Affiliated MMF). The income earned by the Fund from such investments is included as Dividends — affiliated issuers in the Statement of Operations. As an investing fund, the Fund indirectly bears its proportionate share of the expenses of the Affiliated MMF. Effective October 1, 2016, the Affiliated MMF prices its shares with a floating net asset value (NAV) and no longer seeks to maintain a stable NAV. In addition, the Board of the Affiliated MMF may impose a fee on redemptions (sometimes referred to as a liquidity fee) or temporarily suspend redemptions (sometimes referred to as imposing a redemption gate) in the event its liquidity falls below regulatory limits.
Note 7. Line of Credit
The Fund has access to a revolving credit facility whereby the Fund may borrow for the temporary funding of shareholder redemptions or for other temporary or
emergency purposes. Effective December 8, 2015, Citibank, N.A. and HSBC Bank USA, N.A. joined JPMorgan Chase Bank, N.A. (JPMorgan) as lead of a syndicate of banks under the credit facility, which is a collective agreement between the Fund and certain other funds managed by the Investment Manager, severally and not jointly, that permits collective borrowings up to $1 billion. Interest is charged to each participating fund based on its borrowings at a rate equal to the higher of (i) the overnight federal funds rate plus 1.00% or (ii) the one-month LIBOR rate plus 1.00%. Each borrowing under the credit facility matures no later than 60 days after the date of borrowing. The Fund also pays a commitment fee equal to its pro rata share of the amount of the credit facility at a rate of 0.15% per annum. The commitment fee is included in other expenses in the Statement of Operations. Prior to December 8, 2015, JPMorgan was the sole lead bank under the credit facility agreement that permitted borrowings up to $550 million under the same terms and interest rates as described above with the exception of the commitment fee which was charged at a rate of 0.075% per annum.
For the year ended August 31, 2016, the average daily loan balance outstanding on days when borrowing existed was $7,237,500 at a weighted average interest rate of 1.43%. Interest expense incurred by the Fund is recorded as a line of credit interest expense in the Statement of Operations. The Fund had no outstanding borrowings at August 31, 2016.
Note 8. Significant Risks
Shareholder Concentration Risk
At August 31, 2016, one unaffiliated shareholder of record owned 18.0% of the outstanding shares of the Fund in one or more accounts. The Fund has no knowledge about whether any portion of those shares was owned beneficially. Subscription and redemption activity by concentrated accounts may have a significant effect on the operations of the Fund. In the case of a large redemption, the Fund may be forced to sell investments at inopportune times, including its liquid or more liquid positions, resulting in Fund losses and the Fund holding a higher percentage of less liquid or illiquid securities. Large redemptions could result in decreased economies of scale and increased operating expenses for non-redeeming Fund shareholders.
Foreign Securities and Emerging Market Countries Risk
Investing in foreign securities may include certain risks and considerations not typically associated with investing
Annual Report 2016
30
COLUMBIA GREATER CHINA FUND
NOTES TO FINANCIAL STATEMENTS (continued)
August 31, 2016
in U.S. securities, such as fluctuating currency values and changing local and regional economic, political and social conditions, which may result in greater market volatility. In addition, certain foreign securities may not be as liquid as U.S. securities. Investing in emerging markets may accentuate these risks. These countries are also more likely to experience high levels of inflation, deflation or currency devaluation which could hurt their economies and securities markets. To the extent that the Fund concentrates its investment exposure to any one or a few specific countries, the Fund will be particularly susceptible to the various conditions, events or other factors impacting those countries and may, therefore, have a greater risk than that of a fund which is more geographically diversified.
Geographic Concentration Risk
The Fund may be particularly susceptible to economic, political, regulatory or other events or conditions affecting issuers and countries within the specific geographic regions in which the Fund invests. Currency devaluations could occur in countries that have not yet experienced currency devaluation to date, or could continue to occur in countries that have already experienced such devaluations. The Fund's NAV may be more volatile than the NAV of a more geographically diversified fund.
Technology and Technology-related Investment Risk
The Fund may be more susceptible to the particular risks that may affect companies in the information technology sector, as well as other technology-related sectors (collectively, the technology sectors) than if it were invested in a wider variety of companies in unrelated sectors. Companies in the technology sectors are subject to certain risks, including the risk that new services, equipment or technologies will not be accepted by consumers and businesses or will become rapidly obsolete. Performance of such companies may be affected by factors including obtaining and protecting patents (or the failure to do so) and significant competitive pressures, including aggressive pricing of their products or services, new market entrants, competition for market share and short product cycles due to an accelerated rate of technological developments. Such competitive pressures may lead to limited earnings and/or falling profit margins. As a result, the value of their securities may fall or fail to rise. In addition, many technology sector companies have limited operating histories and prices of these companies' securities historically have been more volatile than other securities, especially over the short term.
Non-Diversification Risk
A non-diversified fund is permitted to invest a greater percentage of its total assets in fewer issuers than a diversified fund. The Fund may, therefore, have a greater risk of loss from a few issuers than a similar fund that invests more broadly.
Note 9. Subsequent Events
Management has evaluated the events and transactions that have occurred through the date the financial statements were issued and noted no items requiring adjustment of the financial statements or additional disclosure.
Note 10. Information Regarding Pending and Settled Legal Proceedings
Ameriprise Financial and certain of its affiliates have historically been involved in a number of legal, arbitration and regulatory proceedings, including routine litigation, class actions, and governmental actions, concerning matters arising in connection with the conduct of their business activities. Ameriprise Financial believes that the Funds are not currently the subject of, and that neither Ameriprise Financial nor any of its affiliates are the subject of, any pending legal, arbitration or regulatory proceedings that are likely to have a material adverse effect on the Funds or the ability of Ameriprise Financial or its affiliates to perform under their contracts with the Funds. Ameriprise Financial is required to make quarterly (10-Q), annual (10-K) and, as necessary, 8-K filings with the Securities and Exchange Commission (SEC) on legal and regulatory matters that relate to Ameriprise Financial and its affiliates. Copies of these filings may be obtained by accessing the SEC website at www.sec.gov.
There can be no assurance that these matters, or the adverse publicity associated with them, will not result in increased fund redemptions, reduced sale of fund shares or other adverse consequences to the Funds. Further, although we believe proceedings are not likely to have a material adverse effect on the Funds or the ability of Ameriprise Financial or its affiliates to perform under their contracts with the Funds, these proceedings are subject to uncertainties and, as such, we are unable to estimate the possible loss or range of loss that may result. An adverse outcome in one or more of these proceedings could result in adverse judgments, settlements, fines, penalties or other relief that could have a material adverse effect on the consolidated financial condition or results of operations of Ameriprise Financial.
Annual Report 2016
31
COLUMBIA GREATER CHINA FUND
REPORT OF INDEPENDENT REGISTERED PUBLIC ACCOUNTING FIRM
To the Trustees of Columbia Funds Series Trust I and the Shareholders of
Columbia Greater China Fund
In our opinion, the accompanying statement of assets and liabilities, including the portfolio of investments, and the related statements of operations and of changes in net assets and the financial highlights present fairly, in all material respects, the financial position of Columbia Greater China Fund (the "Fund," a series of Columbia Funds Series Trust I) at August 31, 2016, and the results of its operations, the changes in its net assets and the financial highlights for each of the periods indicated, in conformity with accounting principles generally accepted in the United States of America. These financial statements and financial highlights (hereafter referred to as "financial statements") are the responsibility of the Fund's management. Our responsibility is to express an opinion on these financial statements based on our audits. We conducted our audits of these financial statements in accordance with the standards of the Public Company Accounting Oversight Board (United States). Those standards require that we plan and perform the audit to obtain reasonable assurance about whether the financial statements are free of material misstatement. An audit includes examining, on a test basis, evidence supporting the amounts and disclosures in the financial statements, assessing the accounting principles used and significant estimates made by management, and evaluating the overall financial statement presentation. We believe that our audits, which included confirmation of securities at August 31, 2016 by correspondence with the custodian, brokers and transfer agent, provide a reasonable basis for our opinion.
PricewaterhouseCoopers LLP
Minneapolis, MN
October 21, 2016
Annual Report 2016
32
COLUMBIA GREATER CHINA FUND
FEDERAL INCOME TAX INFORMATION
(Unaudited)
The Fund hereby designates the following tax attributes for the fiscal year ended August 31, 2016. Shareholders will be notified in early 2017 of the amounts for use in preparing 2016 income tax returns.
Tax Designations
Qualified Dividend Income | | | 100.00 | % | |
Foreign Taxes Paid | | $ | 119,204 | | |
Foreign Taxes Paid Per Share | | $ | 0.04 | | |
Foreign Source Income | | $ | 2,053,884 | | |
Foreign Source Income Per Share | | $ | 0.65 | | |
Qualified Dividend Income. For taxable, non-corporate shareholders, the percentage of ordinary income distributed during the fiscal year that represents qualified dividend income subject to reduced tax rates.
Foreign Taxes. The Fund makes the election to pass through to shareholders the foreign taxes paid. Eligible shareholders may claim a foreign tax credit. These taxes, and the corresponding foreign source income, are provided.
Annual Report 2016
33
COLUMBIA GREATER CHINA FUND
Shareholders elect the Board that oversees the Fund's operations. The Board appoints officers who are responsible for day-to-day business decisions based on policies set by the Board. The following table provides basic biographical information about the Fund's Trustees, including their principal occupations during the past five years, although specific titles for individuals may have varied over the period. The year set forth beneath Length of Service in the table below is the year in which the Trustee was first appointed or elected as Trustee to any Fund currently in the Columbia Funds Complex or a predecessor thereof. Under current Board policy, members serve terms of indefinite duration.
Trustees
Independent Trustees
Name,
Address,
Year of Birth | | Position Held With
the Trust and Length of
Service | | Principal Occupation(s)
During the Past Five Years
and Other Relevant
Professional Experience | | Number of
Funds in the
Columbia Funds
Complex
Overseen | | Other Directorships
Held by Trustee During
the Past Five Years | |
Janet Langford Carrig
c/o Columbia
Management Investment Advisers, LLC,
225 Franklin Street
Mail Drop BX32 05228,
Boston, MA 02110
1957 | | Trustee 1996 | | Senior Vice President, General Counsel and Corporate Secretary, ConocoPhillips (integrated energy company) since September 2007 | | | 56 | | | None | |
Douglas A. Hacker
c/o Columbia Management Investment Advisers, LLC,
225 Franklin Street
Mail Drop BX32 05228,
Boston, MA 02110
1955 | | Trustee and Chairman of the Board 1996 | | Independent business executive since May 2006; Executive Vice President — Strategy of United Airlines from December 2002 to May 2006; President of UAL Loyalty Services (airline marketing company) from September 2001 to December 2002; Executive Vice President and Chief Financial Officer of United Airlines from July 1999 to September 2001 | | | 56 | | | Spartan Nash Company (food distributor); Nash Finch Company (food distributor) from 2005 to 2013; Aircastle Limited (aircraft leasing); SeaCube Container Leasing Ltd. (container leasing) from 2010 to 2013; and Travelport Worldwide Limited (travel information technology) | |
Nancy T. Lukitsh
c/o Columbia Management Investment Advisers, LLC,
225 Franklin Street
Mail Drop BX32 05228,
Boston, MA 02110
1956 | | Trustee 2011 | | Senior Vice President, Partner and Director of Marketing, Wellington Management Company, LLP (investment adviser) from 1997 to 2010; Chair, Wellington Management Portfolios (commingled non-U.S. investment pools) from 2007 to 2010; Director, Wellington Trust Company, NA and other Wellington affiliates from 1997 to 2010 | | | 56 | | | None | |
Annual Report 2016
34
COLUMBIA GREATER CHINA FUND
TRUSTEES AND OFFICERS (continued)
Independent Trustees (continued)
Name,
Address,
Year of Birth | | Position Held With
the Trust and Length of
Service | | Principal Occupation(s)
During the Past Five Years
and Other Relevant
Professional Experience | | Number of
Funds in the
Columbia Funds
Complex
Overseen | | Other Directorships
Held by Trustee During
the Past Five Years | |
William E. Mayer
c/o Columbia Management Investment Advisers, LLC,
225 Franklin Street
Mail Drop BX32 05228,
Boston, MA 02110
1940 | | Trustee 1991 | | Partner, Park Avenue Equity Partners (private equity) since February 1999 | | | 56 | | | DynaVox Inc. (speech creation); Lee Enterprises (print media); WR Hambrecht + Co. (financial service provider) from 2000 to 2012; BlackRock Capital Investment Corporation (investment company); and Premier, Inc. (healthcare) | |
David M. Moffett
c/o Columbia Management Investment Advisers, LLC,
225 Franklin Street
Mail Drop BX32 05228,
Boston, MA 02110
1952 | | Trustee 2011 | | Retired. Consultant to Bridgewater and Associates | | | 56 | | | Director of CIT Bank, CIT Group Inc. (commercial and consumer finance); eBay Inc. (online trading community); Genworth Financial, Inc. (financial and insurance products and services); Paypal Holdings Inc. (payment and data processing services); and Trustee University of Oklahoma Foundation | |
Charles R. Nelson
c/o Columbia Management Investment Advisers, LLC,
225 Franklin Street
Mail Drop BX32 05228,
Boston, MA 02110
1942 | | Trustee 1981 | | Retired. Professor Emeritus, University of Washington since 2011; Professor of Economics, University of Washington from 1976 to 2011; Ford and Louisa Van Voorhis Professor of Political Economy, University of Washington from 1993 to 2011; Adjunct Professor of Statistics, University of Washington from 1980 to 2011; Associate Editor, Journal of Money, Credit and Banking from September 1993 to 2008; consultant on econometric and statistical matters | | | 56 | | | None | |
John J. Neuhauser
c/o Columbia Management Investment Advisers, LLC,
225 Franklin Street
Mail Drop BX32 05228,
Boston, MA 02110
1943 | | Trustee 1984 | | President, Saint Michael's College since August 2007; Director or Trustee of several non-profit organizations, including University of Vermont Medical Center; Academic Vice President and Dean of Faculties, Boston College from August 1999 to October 2005; University Professor, Boston College from November 2005 to August 2007 | | | 56 | | | Liberty All-Star Equity Fund and Liberty All-Star Growth Fund (closed-end funds) | |
Annual Report 2016
35
COLUMBIA GREATER CHINA FUND
TRUSTEES AND OFFICERS (continued)
Independent Trustees (continued)
Name,
Address,
Year of Birth | | Position Held With
the Trust and Length of
Service | | Principal Occupation(s)
During the Past Five Years
and Other Relevant
Professional Experience | | Number of
Funds in the
Columbia Funds
Complex
Overseen | | Other Directorships
Held by Trustee During
the Past Five Years | |
Patrick J. Simpson
c/o Columbia Management Investment Advisers, LLC,
225 Franklin Street
Mail Drop BX32 05228,
Boston, MA 02110
1944 | | Trustee 2000 | | Of Counsel, Perkins Coie LLP (law firm) since 2015; Partner, Perkins Coie LLP from 1988 to 2014 | | | 56 | | | None | |
Anne-Lee Verville
c/o Columbia Management Investment Advisers, LLC,
225 Franklin Street
Mail Drop BX32 05228,
Boston, MA 02110
1945 | | Trustee 1998 | | Retired. General Manager, Global Education Industry from 1994 to 1997, President — Application Systems Division from 1991 to 1994, Chief Financial Officer — US Marketing & Services from 1988 to 1991, and Chief Information Officer from 1987 to 1988, IBM Corporation (computer and technology) | | | 56 | | | Enesco Group, Inc. (producer of giftware and home and garden decor products) from 2001 to 2006 | |
Consultant to the Trustees*
Name,
Address,
Year of Birth | | Position Held With
the Trust and Length of
Service | | Principal Occupation(s)
During the Past Five Years
and Other Relevant
Professional Experience | | Number of
Funds in the
Columbia Funds
Complex
Overseen | | Other Directorships
Held by Trustee During
the Past Five Years | |
J. Kevin Connaughton
c/o Columbia
Management Investment Advisers, LLC,
225 Franklin Street
Mail Drop BX32 05228,
Boston, MA 02110
1964 | | Trustee Consultant 2016 | | Trustee Consultant, Columbia Funds since March 2016; Managing Director and General Manager of Mutual Fund Products, Columbia Management Investment Advisers, LLC from May 2010 to February 2015; President, Columbia Funds from 2009 to 2015; and senior officer of Columbia Funds and affiliated funds from 2003 to 2015 | | | 56 | | | Board of Governors, Gateway Healthcare since January 2016; Trustee, New Century Portfolios since March 2015; and Director, The Autism Project since March 2015 | |
* J. Kevin Connaughton was appointed consultant to the Trustees effective March 1, 2016. Shareholders of the Funds are expected to be asked to elect Mr. Connaughton as a Trustee at a future shareholder meeting.
Annual Report 2016
36
COLUMBIA GREATER CHINA FUND
TRUSTEES AND OFFICERS (continued)
Interested Trustee Affiliated with Investment Manager*
Name,
Address,
Year of Birth | | Position Held With
the Trust and Length of
Service | | Principal Occupation(s)
During the Past Five Years
and Other Relevant
Professional Experience | | Number of
Funds in the
Columbia Funds
Complex
Overseen | | Other Directorships
Held by Trustee During
the Past Five Years | |
William F. Truscott
c/o Columbia Management Investment Advisers, LLC,
225 Franklin Street
Boston, MA 02110
1960 | | Trustee 2012 | | Chairman of the Board and President, Columbia Management Investment Advisers, LLC since May 2010 and February 2012, respectively; Chief Executive Officer, Global Asset Management, Ameriprise Financial, Inc. since September 2012 (previously Chief Executive Officer, U.S. Asset Management & President, Annuities, May 2010- September 2012); Director and Chief Executive Officer, Columbia Management Investment Distributors, Inc. since May 2010 and February 2012, respectively; Chairman of the Board and Chief Executive Officer, RiverSource Distributors, Inc. since 2006; Director, Threadneedle Asset Management Holdings, SARL since 2014; President and Chief Executive Officer, Ameriprise Certificate Company, 2006-August 2012. | | | 184 | | | Trustee to other Columbia Funds since 2001; Chairman of the Board, Columbia Management Investment Advisers, LLC since May 2010; Director, Columbia Management Investment Distributors, Inc. since May 2010; Former Director, Ameriprise Certificate Company, 2006-January 2013 | |
* Interested person (as defined under the 1940 Act) by reason of being an officer, director, security holder and/or employee of the Investment Manager or Ameriprise Financial.
The Statement of Additional Information has additional information about the Fund's Board members and is available, without charge, upon request by calling 800.345.6611; contacting your financial intermediary; or visiting investor.columbiathreadneedleus.com.
Annual Report 2016
37
COLUMBIA GREATER CHINA FUND
TRUSTEES AND OFFICERS (continued)
The Board has appointed officers who are responsible for day-to-day business decisions based on policies it has established. The officers serve at the pleasure of the Board. The following table provides basic information about the Officers of the Fund, including principal occupations during the past five years, although their specific titles may have varied over the period. In addition to Mr. Truscott, who is Senior Vice President, the Fund's other officers are:
Fund Officers
Name,
Address and
Year of Birth | | Position and Year
First Appointed to
Position for any Fund
in the Columbia
Funds Complex or a
Predecessor Thereof | |
Principal Occupation(s) During Past Five Years | |
Christopher O. Petersen
5228 Ameriprise Financial Center
Minneapolis, MN 55474
Born 1970 | | President and Principal Executive Officer (2015) | | Vice President and Lead Chief Counsel, Ameriprise Financial, Inc. since January 2015 (previously, Vice President and Chief Counsel January 2010-December 2014; officer of Columbia Funds and affiliated funds since 2007. | |
Michael G. Clarke
225 Franklin Street
Boston, MA 02110
Born 1969 | | Treasurer (2011), Chief Financial Officer (2009) and Chief Accounting Officer (2015) | | Vice President — Mutual Fund Administration, Columbia Management Investment Advisers, LLC, since May 2010; senior officer of Columbia Funds and affiliated funds since 2002. | |
Paul B. Goucher
100 Park Avenue
New York, NY 10017
Born 1968 | | Senior Vice President (2011), Chief Legal Officer (2015) and Assistant Secretary (2008) | | Vice President and Lead Chief Counsel, Ameriprise Financial, Inc. since November 2008 and January 2013, respectively (previously Chief Counsel, January 2010-January 2013); Vice President, Chief Legal Officer and Assistant Secretary, Columbia Management Investment Advisers, LLC since May 2010. | |
Thomas P. McGuire
225 Franklin Street
Boston, MA 02110
Born 1972 | | Senior Vice President and Chief Compliance Officer (2012) | | Vice President — Asset Management Compliance, Ameriprise Financial, Inc., since May 2010; Chief Compliance Officer, Ameriprise Certificate Company since September 2010. | |
Colin Moore
225 Franklin Street
Boston, MA 02110
Born 1958 | | Senior Vice President (2010) | | Executive Vice President and Global Chief Investment Officer, Ameriprise Financial, Inc., since July 2013; Executive Vice President and Global Chief Investment Officer, Columbia Management Investment Advisers, LLC since July 2013 (previously Director and Global Chief Investment Officer, 2010-2013). | |
Michael E. DeFao
225 Franklin Street
Boston, MA 02110
Born 1968 | | Vice President (2011) and Assistant Secretary (2010) | | Vice President and Chief Counsel, Ameriprise Financial, Inc. since May 2010. | |
Amy Johnson
5228 Ameriprise Financial Center
Minneapolis, MN 55474
Born 1965 | | Vice President (2006) | | Managing Director and Global Head of Operations, Columbia Management Investment Advisers, LLC since April 2016 (previously Managing Director and Chief Operating Officer, 2010-2016). | |
Lyn Kephart-Strong
5228 Ameriprise
Financial Center
Minneapolis, MN 55474
Born 1960 | | Vice President (2015) | | President, Columbia Management Investment Services Corp. since October 2014; Vice President & Resolution Officer, Ameriprise Trust Company since August 2009. | |
Ryan C. Larrenaga
225 Franklin Street
Boston, MA 02110
Born 1970 | | Vice President and Secretary (2015) | | Vice President and Group Counsel, Ameriprise Financial, Inc. since August 2011; officer of Columbia Funds and affiliated funds since 2005. | |
Annual Report 2016
38
COLUMBIA GREATER CHINA FUND
BOARD CONSIDERATION AND APPROVAL OF MANAGEMENT
AGREEMENT
On June 10, 2016, the Board of Trustees (the Board) and the Trustees who are not interested persons (as defined in the Investment Company Act of 1940) (the Independent Trustees) of Columbia Funds Series Trust I (the Trust) unanimously approved the continuation of the Management Agreement (the Management Agreement) with Columbia Management Investment Advisers, LLC (the Investment Manager) with respect to Columbia Greater China Fund (the Fund), a series of the Trust. As detailed below, the Board's Advisory Fees and Expenses Committee (the Committee) and the Board met on multiple occasions to review and discuss, both among themselves and with the management team of the Investment Manager, materials provided by the Investment Manager and others before determining to approve the continuation of the Management Agreement.
In connection with their deliberations regarding the continuation of the Management Agreement, the Committee and the Board evaluated materials requested from the Investment Manager regarding the Fund and the Management Agreement, and discussed these materials with representatives of the Investment Manager at Committee meetings held on March 8, 2016, April 27, 2016 and June 9, 2016 and at Board meetings held on March 9, 2016 and June 10, 2016. In addition, the Board considers matters bearing on the Management Agreement at most of its other meetings throughout the year and meets regularly with senior management of the Trust and the Investment Manager. Through the Board's Investment Oversight Committees, Trustees also meet with selected portfolio managers of the funds the Trustees oversee and other investment personnel at various times throughout the year. The Committee and the Board also consulted with its independent fee consultant, Fund counsel and with the Independent Trustees' independent legal counsel, who advised on various matters with respect to the Committee's and the Board's considerations and otherwise assisted the Committee and the Board in their deliberations. On June 9, 2016, the Committee recommended that the Board approve the continuation of the Management Agreement. On June 10, 2016, the Board, including the Independent Trustees, voting separately, unanimously approved the continuation of the Management Agreement for the Fund.
The Committee and the Board considered all information that they, their legal counsel or the Investment Manager believed reasonably necessary to evaluate and to determine whether to recommend for approval or approve the continuation of the Management Agreement. The information and factors considered by the Committee and the Board in recommending for approval or approving the continuation of the Management Agreement for the Fund included the following:
• Information on the investment performance of the Fund relative to the performance of a group of mutual funds determined to be comparable to the Fund by an independent third-party data provider, as well as performance relative to benchmarks;
• Information on the Fund's management fees and total expenses, including information comparing the Fund's expenses to those of a group of comparable mutual funds, as determined by the independent third-party data provider;
• The Investment Manager's agreement to contractually limit or cap total operating expenses for the Fund through December 31, 2017 so that total operating expenses (excluding certain fees and expenses, such as transaction costs and certain other investment related expenses, interest, taxes, acquired fund fees and expenses, and infrequent and/or unusual expenses) would not exceed a specified annual rate, as a percentage of the Fund's net assets;
• The terms and conditions of the Management Agreement;
• The current and proposed terms and conditions of other agreements and arrangements with affiliates of the Investment Manager relating to the operations of the Fund, including agreements with respect to the provision of distribution and transfer agency services to the Fund;
• Descriptions of various functions performed by the Investment Manager under the Management Agreement, including portfolio management and portfolio trading practices;
• Information regarding the management fees of similarly-managed portfolios of other clients of the Investment Manager, including institutional separate accounts;
Annual Report 2016
39
COLUMBIA GREATER CHINA FUND
BOARD CONSIDERATION AND APPROVAL OF MANAGEMENT
AGREEMENT (continued)
• Information regarding the reputation, regulatory history and resources of the Investment Manager, including information regarding senior management, portfolio managers and other personnel;
• Information regarding the capabilities of the Investment Manager with respect to compliance monitoring services, including an assessment of the Investment Manager's compliance system by the Fund's Chief Compliance Officer; and
• The profitability to the Investment Manager and its affiliates from their relationships with the Fund.
Nature, Extent and Quality of Services Provided under the Management Agreement
The Committee and the Board considered the nature, extent and quality of services provided to the Fund by the Investment Manager and its affiliates under the Management Agreement and under separate agreements for the provision of transfer agency services, and the resources dedicated to the Fund and the other Columbia Funds by the Investment Manager and its affiliates. The Committee and the Board considered, among other things, the Investment Manager's ability to attract, motivate and retain highly qualified research, advisory and supervisory investment professionals (including personnel and other resources, compensation programs for personnel involved in fund management, reputation and other attributes), the portfolio management services provided by those investment professionals, and the quality of the Investment Manager's investment research capabilities and trade execution services. The Committee and the Board also considered the potential benefits to shareholders of investing in a mutual fund that is part of a fund complex offering exposure to a variety of asset classes and investment disciplines and providing a variety of fund and shareholder services.
The Committee and the Board also considered the professional experience and qualifications of the senior personnel of the Investment Manager, which included consideration of the Investment Manager's experience with similarly-structured funds. The Committee and the Board noted the compliance programs of and the compliance-related resources provided to the Fund by the Investment Manager and its affiliates, and considered the Investment Manager's ability to provide administrative services to the Fund and coordinate the activities of the Fund's other service providers. After reviewing these and related factors, the Committee and the Board concluded, within the context of their overall conclusions, that the nature, extent and quality of the services provided to the Fund under the Management Agreement supported the continuation of the Management Agreement.
Investment Performance
The Committee and the Board reviewed information about the performance of the Fund over various time periods, including performance information relative to benchmarks and information based on reports of the independent third-party data provider that compared the performance of the Fund to the performance of a group of comparable mutual funds, and data provided by the independent fee consultant. The Committee and the Board also reviewed a description of the third party's methodology for identifying the Fund's peer groups for purposes of performance and expense comparisons.
The Committee and the Board noted that, through December 31, 2015, the Fund's performance was in the twentieth, twenty-second and twenty-fifth percentile (where the best performance would be in the first percentile) of its category selected by the independent third-party data provider for the purposes of performance comparisons for the one-, three- and five- year periods, respectively.
The Committee and the Board also considered the Investment Manager's performance and reputation generally, the Investment Manager's historical responsiveness to Board concerns about performance, and the Investment Manager's willingness to take steps intended to improve performance. After reviewing these and related factors, the Committee and the Board concluded, within the context of their overall conclusions, that the performance of the Fund and the Investment Manager was sufficient, in light of other considerations, to warrant the continuation of the Management Agreement.
Investment Management Fee Rates and Other Expenses
The Committee and the Board considered the management fees charged to the Fund under the Management Agreement as well as the total expenses incurred by the Fund. In assessing the reasonableness of the fees
Annual Report 2016
40
COLUMBIA GREATER CHINA FUND
BOARD CONSIDERATION AND APPROVAL OF MANAGEMENT
AGREEMENT (continued)
under the Management Agreement, the Committee and the Board considered, among other information, the Fund's management fee and its total expense ratio as a percentage of average daily net assets. The Committee and the Board considered data provided by the independent fee consultant. The Committee and the Board noted that, as of December 31, 2015, the Fund's actual management fee and net total expense ratio are ranked in the third and first quintiles, respectively, (where the lowest fees and expenses would be in the first quintile) against the Fund's expense universe as determined by the independent third-party data provider for purposes of expense comparison. The Committee and the Board also took into account the fee waiver and expense limitation arrangements agreed to by the Investment Manager, as noted above.
The Committee and the Board also received and considered information about the management fees charged by the Investment Manager to institutional separate accounts. In considering the fees charged to those accounts, the Committee and the Board took into account, among other things, the Investment Manager's representations about the differences between managing mutual funds as compared to other types of accounts, including differences in the services provided, differences in the risk profile of such business for the Investment Manager and the additional resources required to manage mutual funds effectively. The Committee and the Board also received and considered information about the fees charged by the Investment Manager for sub-advisory services provided to comparable unaffiliated funds. In evaluating the Fund's management fees, the Committee and the Board also took into account the demands, complexity and quality of the investment management of the Fund.
After reviewing these and related factors, the Committee and the Board concluded, within the context of their overall conclusions, that the management fee rates and expenses of the Fund were sufficient, in light of other considerations, to warrant the continuation of the Management Agreement.
Costs of Services Provided and Profitability
The Committee and the Board also took note of the costs the Investment Manager and its affiliates incur in connection with the services provided (both on an absolute and relative basis) and the profitability to the Investment Manager and its affiliates in connection with their relationships with the Fund.
The Committee and the Board also considered the compensation directly or indirectly received by the Investment Manager's affiliates in connection with their relationships with the Fund. The Committee and the Board reviewed information provided by management as to the profitability to the Investment Manager and its affiliates of their relationships with the Fund, information about the allocation of expenses used to calculate profitability, and comparisons of profitability levels realized in 2015 to profitability levels realized in 2014. When reviewing profitability, the Committee and the Board also considered court cases in which adviser profitability was an issue in whole or in part, the performance of similarly managed funds, the performance of the Fund, and the expense ratio of the Fund. In addition, the Committee and the Board considered information provided by the Investment Manager regarding the Investment Manager's financial condition and comparing its profitability to that of other asset management firms that are, or are subsidiaries of, publicly traded companies. In this regard, the Committee and the Board also considered data provided by the independent fee consultant.
After reviewing these and related factors, the Committee and the Board concluded, within the context of their overall conclusions, that the costs of services provided and the profitability to the Investment Manager and its affiliates from their relationships with the Fund supported the continuation of the Management Agreement.
Economies of Scale
The Committee and the Board considered the potential existence of economies of scale in the provision by the Investment Manager of services to the Fund, to groups of related funds, and to the Investment Manager's investment advisory clients as a whole, and whether those economies of scale were shared with the Fund through breakpoints in investment management fees or other means, such as expense limitation arrangements and additional investments by the Investment Manager in investment, trading and compliance resources. The Committee and the Board noted that the management fee schedules for the Fund contained breakpoints that would reduce the fee rate on assets above specified threshold levels.
Annual Report 2016
41
COLUMBIA GREATER CHINA FUND
BOARD CONSIDERATION AND APPROVAL OF MANAGEMENT
AGREEMENT (continued)
In considering these matters, the Committee and the Board also considered the costs of the services provided and the profitability to the Investment Manager and its affiliates from their relationships with the Fund, as discussed above. After reviewing these and related factors, the Committee and the Board concluded, within the context of their overall conclusions, that the extent to which any economies of scale were expected to be shared with the Fund supported the continuation of the Management Agreement.
Other Benefits to the Investment Manager
The Committee and the Board received and considered information regarding "fall-out" or ancillary benefits received by the Investment Manager and its affiliates as a result of their relationships with the Fund, such as the engagement of the Investment Manager's affiliates to provide distribution and transfer agency services to the Fund. In this regard, among other matters, the Committee and the Board considered that the Fund's distributor retains a portion of the distribution fees from the Fund and receives a portion of the sales charges on sales or redemptions of certain classes of shares of the Fund. The Committee and the Board also considered the benefits of research made available to the Investment Manager by reason of brokerage commissions generated by the Fund's securities transactions, and reviewed information about the Investment Manager's practices with respect to allocating portfolio transactions for brokerage and research services. The Committee and the Board considered the possible conflicts of interest associated with certain fall-out or other ancillary benefits and the reporting, disclosure and other processes that are in place to address such possible conflicts of interest. The Committee and the Board recognized that the Investment Manager's profitability would be somewhat lower without these benefits.
Conclusion
The Committee and the Board reviewed all of the above considerations in reaching their decisions to recommend or approve the continuation of the Management Agreement. In their deliberations, the Trustees did not identify any particular information that was all-important or controlling, and individual Trustees may have attributed different weights to the various factors. Based on their evaluation of all factors that they deemed to be material, including those factors described above, and assisted by the advice of independent legal counsel, the Board, including the Independent Trustees, voting separately, unanimously approved the continuation of the Management Agreement.
Annual Report 2016
42
COLUMBIA GREATER CHINA FUND
IMPORTANT INFORMATION ABOUT THIS REPORT
Each fund mails one shareholder report to each shareholder address. If you would like more than one report, please call shareholder services at 800.345.6611 and additional reports will be sent to you.
The policy of the Board is to vote the proxies of the companies in which each fund holds investments consistent with the procedures as stated in the Statement of Additional Information (SAI). You may obtain a copy of the SAI without charge by calling 800.345.6611; contacting your financial intermediary; visiting investor.columbiathreadneedleus.com; or searching the website of the Securities and Exchange Commission (SEC) at sec.gov. Information regarding how each fund voted proxies relating to portfolio securities is filed with the SEC by August 31st for the most recent 12-month period ending June 30th of that year, and is available without charge by visiting investor.columbiathreadneedleus.com, or searching the website of the SEC at sec.gov.
Each fund files a complete schedule of portfolio holdings with the SEC for the first and third quarters of each fiscal year on Form N-Q. Each fund's Form N-Q is available on the SEC's website at sec.gov and may be reviewed and copied at the SEC's Public Reference Room in Washington, D.C. Information on the operation of the Public Reference Room may be obtained by calling 800.SEC.0330. Each fund's complete schedule of portfolio holdings, as filed on Form N-Q, can also be obtained without charge, upon request, by calling 800.345.6611.
Annual Report 2016
43
Columbia Greater China Fund
P.O. Box 8081
Boston, MA 02266-8081

Please read and consider the investment objectives, risks, charges and expenses for any fund carefully before investing. For a prospectus and summary prospectus, which contains this and other important information about the Fund, go to investor.columbiathreadneedleus.com. The Fund is distributed by Columbia Management Investment Distributors, Inc., member FINRA, and managed by Columbia Management Investment Advisers, LLC.
Columbia Threadneedle Investments (Columbia Threadneedle) is the global brand name of the Columbia and Threadneedle group of companies.
All rights reserved. Columbia Management Investment Distributors, Inc., 225 Franklin Street, Boston, MA 02110-2804
© 2016 Columbia Management Investment Advisers, LLC.
investor.columbiathreadneedleus.com
ANN158_08_F01_(10/16)

ANNUAL REPORT
August 31, 2016

COLUMBIA MID CAP GROWTH FUND

ABOUT COLUMBIA THREADNEEDLE INVESTMENTS
Columbia Threadneedle Investments is a leading global asset management group that provides a broad range of investment strategies and solutions for individual, institutional and corporate clients around the world.
With more than 2,000 people, including over 450 investment professionals based in North America, Europe and Asia, we manage $460 billion* of assets across developed and emerging market equities, fixed income, asset allocation solutions and alternatives. We are the 13th largest manager of long-term mutual fund assets in the U.S.** and the 4th largest manager of retail funds in the U.K.***
Our priority is the investment success of our clients. We aim to deliver the investment outcomes they expect through an investment approach that is team-based, performance-driven and risk-aware. Our culture is dynamic and interactive. By sharing our insights across asset classes and geographies, we generate richer perspectives on global, regional and local investment landscapes. The ability to exchange and debate investment ideas in a collaborative environment enriches our teams' investment processes. More importantly, it results in better informed investment decisions for our clients.
Columbia funds are distributed by Columbia Management Investment Distributors, Inc., member FINRA, and managed by Columbia Management Investment Advisers, LLC.
Columbia Threadneedle Investments (Columbia Threadneedle) is the global brand name of the Columbia and Threadneedle group of companies.
* In U.S. dollars as of June 30, 2016. Source: Ameriprise Q2 Earnings Release. Includes all assets managed by entities in the Columbia and Threadneedle group of companies. Contact us for more current data.
** Source: ICI as of June 30, 2016 for Columbia Management Investment Advisers, LLC.
*** Source: Investment Association as of March 2016 for Threadneedle Asset Management Limited.
© 2016 Columbia Management Investment Advisers, LLC. All rights reserved.
Not part of the shareholder report
 Dear Shareholders,
Volatility comes with the territory for long-term investors. Some investors instinctively want to pull out of the market or sell underperforming investments at the first sign of increased volatility or perhaps even as soon as they perceive it on the horizon. But taking yourself out of the market could mean losing out on potential opportunities, and putting your longer term investment goals at risk.
Cumulative return is not just about achieving high returns when markets are going up; it's also about remaining invested and minimizing losses during weak or volatile markets so that you can participate on the upside. Developing a deeper understanding of the various risks your portfolio is subject to can help you balance these risks.
Diversification is critical in seeking to achieve that balance. We believe that most portfolios could be more effectively diversified either by introducing holdings with performance profiles unrelated to existing holdings (like alternative products) or by rebalancing existing holdings with an eye toward risk allocation. Over time, distributing risk more evenly may produce a more pronounced diversification benefit and may improve portfolio efficiency. We believe market volatility can create significant opportunities and, in fact, these periods may be some of the very best times to invest.
With this in mind, I thought it important to highlight excerpts from a piece written by Colin Moore, Global Chief Investment Officer, in which he touches on some of these issues emphasizing the importance of a properly constructed portfolio in seeking to effectively manage volatility and to achieve consistency of returns. I encourage you to read the article in its entirety. To access the full article and for other insights on current market, please visit blog.columbiathreadneedleus.com/latest-perspectives.
You need investments that are designed to help you ease the impact of volatile market environments and keep the savings you have worked tirelessly to amass. Columbia Threadneedle Investments provides investment solutions to help you tackle financial challenges and achieve your desired outcome.
Best regards,

Christopher O. Petersen
President, Columbia Funds
Excerpts from:
Taking the scare out of the volatility bogeyman
By Colin Moore, Global Chief Investment Officer
Colin Moore is the global chief investment officer for Columbia Threadneedle Investments. His responsibilities include ensuring that a disciplined investment process is in place across all asset classes, including equity and fixed income. Mr. Moore joined one of the Columbia Threadneedle Investments legacy firms in 2002 as head of equity and was also head of fixed income and liquidity strategies from 2009 – 2010.

n In today's low growth, higher volatility world, the emphasis is shifting from maximization of returns to consistency of returns.
PRESIDENT'S MESSAGE (continued)
n Portfolios should represent the behavioral risk-return tradeoff of investors, remembering that they won't stay invested to realize the return if we get the risk tolerance wrong.
n Holding long-term savings in cash to avoid volatility (the financial equivalent of hiding under the sheets) is detrimental to achieving long-term goals.
According to Wikipedia, "The bogeyman is a common allusion to a mythical creature in many cultures used to control behavior. This monster has no specific appearance, and conceptions about it can vary drastically from household to household within the same community; in many cases he has no set appearance in the mind of an adult or child, but is simply a non-specific embodiment of terror." Different cultures have different names and physical representations for the bogeyman, and investors are no different. We have terrible monsters that we fear may destroy our portfolios, and we call one of the scariest of them volatility.
While the bogeyman is mythical (I hope!), volatility is real and can cause serious damage. To understand why investors have such a hard time coping with volatility, we first need to define three cognitive biases at work in today's investment environment:
1) Recency bias — something that has recently come to the forefront of our attention, regardless of how long established it is, suddenly seems to appear with improbable frequency.
2) Negativity bias — we tend to have a greater recall of unpleasant memories than positive memories.
3) Loss aversion — our dissatisfaction with losing money tends to be greater than our satisfaction with making money.
The level of volatility varies dramatically, and so does investor fear and panic selling — waxing when volatility rises, waning when it falls. Recent studies have pointed to demographics as an important driver of panic selling. The theory is that as people get closer to retirement, the prospects of a large (20% – 30%) loss in financial assets can have a much more pronounced effect on their sense of well-being. Wealth preservation instincts kick in much more quickly than for younger (and typically less wealthy) savers.
The reality is that there is little opportunity for return without volatility. Therefore, the bogeyman effect of holding long-term savings in cash to avoid volatility (the financial equivalent of hiding under the sheets) is detrimental to achieving long-term goals. This effect tends to be more pronounced during the episodic spikes in volatility. The significant spike in volatility in 2008 and 2009 led to significant withdrawals from long-term investment funds over the same period. Less pronounced effects can also be seen when comparing 2001 – 2003 and 2011 – 2012. Conversely, flows picked up when volatility returned to "normal" levels. Investor behavior of this type is consistent with the three behavioral biases.
I believe average volatility will be higher over the next 10 years than the last 10 years and episodic spikes will increase in frequency because sustainable economic growth will be structurally lower and geopolitical risk higher than any time since World War II. Low growth creates uncertainty while loss aversion will make investors fear that we are one economic mishap or geopolitical event away from no growth or recession. The result will be higher volatility on average. Negativity bias will tend to exacerbate "spike" reactions to event-driven geopolitical news, and the volatility bogeyman will appear more often. Assuming the behavioral biases continue, investor returns are likely to be very disappointing regardless of the total return generated by financial markets due to the bogeyman effect.
To mitigate this effect, we need to focus on portfolio construction and an improved understanding of diversification. I accept that equities are likely to offer the highest return over the next 10 years, but they also offer the highest volatility. Many portfolio construction optimization tools use historical average volatility, which is likely to underestimate the volatility investors will face. The bogeyman emerges when individual asset class volatility spikes and cross correlations rise, the combination of which increases overall portfolio volatility far beyond expectation. Diversification is meant to protect investors against volatility, but what's the point of owning lots of investments if the volatility bogeyman has not been properly estimated?
Most importantly, portfolios should be constructed to properly represent the behavioral risk-return trade off of investors, remembering that they won't stay invested to realize the return if we get the risk tolerance wrong. In a low growth, higher volatility world, the emphasis is shifting to return consistency rather than return maximization,
PRESIDENT'S MESSAGE (continued)
and investors are best served through investment approaches that appreciate that distinction. Even though it's a permanent feature of financial markets, volatility is less likely to be the bogeyman we all fear if portfolios are constructed with this understanding.
Please visit blog.columbiathreadneedleus.com/latest-perspectives to read the entire article.
Investors should consider the investment objectives, risks, charges and expenses of a mutual fund carefully before investing. For a free prospectus and summary prospectus, which contains this and other important information about a fund, visit investor.columbiathreadneedleus.com. The prospectus should be read carefully before investing.
The views expressed are as of April 2016, may change as market or other conditions change, and may differ from views expressed by other Columbia Management Investment Advisers, LLC (CMIA) associates or affiliates. Actual investments or investment decisions made by CMIA and its affiliates, whether for its own account or on behalf of clients, will not necessarily reflect the views expressed. This information is not intended to provide investment advice and does not account for individual investor circumstances. Investment decisions should always be made based on an investor's specific financial needs, objectives, goals, time horizon and risk tolerance. Asset classes described may not be suitable for all investors.
Past performance does not guarantee future results, and no forecast should be considered a guarantee either. Since economic and market conditions change frequently, there can be no assurance that the trends described here will continue or that the forecasts are accurate.
Diversification does not guarantee a profit or protect against loss.
Columbia Funds are distributed by Columbia Management Investment Distributors, Inc., member FINRA, and managed by Columbia Management Investment Advisers, LLC.
© 2016 Columbia Management Investment Advisers, LLC. All rights reserved.
COLUMBIA MID CAP GROWTH FUND
Fund Investment Manager
Columbia Management Investment
Advisers, LLC
225 Franklin Street
Boston, MA 02110
Fund Distributor
Columbia Management Investment
Distributors, Inc.
225 Franklin Street
Boston, MA 02110
Fund Transfer Agent
Columbia Management Investment
Services Corp.
P.O. Box 8081
Boston, MA 02266-8081
For more information about any of the funds, please visit investor.columbiathreadneedleus.com or call 800.345.6611. Customer Service Representatives are available to answer your questions Monday through Friday from 8 a.m. to 7 p.m. Eastern time.
The views expressed in this report reflect the current views of the respective parties. These views are not guarantees of future performance and involve certain risks, uncertainties and assumptions that are difficult to predict, so actual outcomes and results may differ significantly from the views expressed. These views are subject to change at any time based upon economic, market or other conditions and the respective parties disclaim any responsibility to update such views. These views may not be relied on as investment advice and, because investment decisions for a Columbia fund are based on numerous factors, may not be relied on as an indication of trading intent on behalf of any particular Columbia fund. References to specific securities should not be construed as a recommendation or investment advice.
Performance Overview | | | 3 | | |
Manager Discussion of Fund Performance | | | 5 | | |
Understanding Your Fund's Expenses | | | 7 | | |
Portfolio of Investments | | | 8 | | |
Statement of Assets and Liabilities | | | 13 | | |
Statement of Operations | | | 16 | | |
Statement of Changes in Net Assets | | | 17 | | |
Financial Highlights | | | 20 | | |
Notes to Financial Statements | | | 32 | | |
Report of Independent Registered Public Accounting Firm | | | 40 | | |
Federal Income Tax Information | | | 41 | | |
Trustees and Officers | | | 42 | | |
Board Consideration and Approval of Management Agreement | | | 47 | | |
Important Information About This Report | | | 51 | | |
COLUMBIA MID CAP GROWTH FUND
Performance Summary
n Columbia Mid Cap Growth Fund (the Fund) Class A shares returned 2.83% excluding sales charges for the 12-month period that ended August 31, 2016.
n During the same time period, the Fund underperformed both the Russell Midcap Growth Index, which returned 7.00%, and the Russell Midcap Index, which returned 9.91%.
n Stock selection in the information technology, financials and health care sectors detracted from results relative to the Russell Midcap Growth Index.
Average Annual Total Returns (%) (for period ended August 31, 2016)
| | | Inception | | 1 Year | | 5 Years | | 10 Years | |
Class A | | 11/01/02 | | | | | | | | | | | | | |
Excluding sales charges | | | | | | | 2.83 | | | | 9.71 | | | | 7.92 | | |
Including sales charges | | | | | | | -3.08 | | | | 8.42 | | | | 7.28 | | |
Class B | | 11/01/02 | | | | | | | | | | | | | |
Excluding sales charges | | | | | | | 2.06 | | | | 8.88 | | | | 7.11 | | |
Including sales charges | | | | | | | -2.22 | | | | 8.63 | | | | 7.11 | | |
Class C | | 10/13/03 | | | | | | | | | | | | | |
Excluding sales charges | | | | | | | 2.05 | | | | 8.89 | | | | 7.11 | | |
Including sales charges | | | | | | | 1.19 | | | | 8.89 | | | | 7.11 | | |
Class I* | | 09/27/10 | | | 3.26 | | | | 10.21 | | | | 8.31 | | |
Class K* | | 02/28/13 | | | 2.95 | | | | 9.86 | | | | 8.06 | | |
Class R | | 01/23/06 | | | 2.58 | | | | 9.43 | | | | 7.65 | | |
Class R4* | | 11/08/12 | | | 3.10 | | | | 9.97 | | | | 8.18 | | |
Class R5* | | 03/07/11 | | | 3.21 | | | | 10.13 | | | | 8.26 | | |
Class T | | 11/01/02 | | | | | | | | | | | | | |
Excluding sales charges | | | | | | | 2.83 | | | | 9.67 | | | | 7.87 | | |
Including sales charges | | | | | | | -3.10 | | | | 8.38 | | | | 7.23 | | |
Class W* | | 09/27/10 | | | 2.83 | | | | 9.71 | | | | 7.92 | | |
Class Y* | | 07/15/09 | | | 3.27 | | | | 10.17 | | | | 8.29 | | |
Class Z | | 11/20/85 | | | 3.09 | | | | 9.98 | | | | 8.18 | | |
Russell Midcap Growth Index | | | | | | | 7.00 | | | | 13.43 | | | | 8.76 | | |
Russell Midcap Index | | | | | | | 9.91 | | | | 14.29 | | | | 8.49 | | |
Returns for Class A and T are shown with and without the maximum initial sales charge of 5.75%. Returns for Class B are shown with and without the applicable contingent deferred sales charge (CDSC) of 5.00% in the first year, declining to 1.00% in the sixth year and eliminated thereafter. Returns for Class C are shown with and without the 1.00% CDSC for the first year only. The Fund's other classes are not subject to sales charges and have limited eligibility. Please see the Fund's prospectus for details. Performance for different share classes will vary based on differences in sales charges and fees associated with each class. All results shown assume reinvestment of distributions during the period. Returns do not reflect the deduction of taxes that a shareholder may pay on Fund distributions or on the redemption of Fund shares. Performance results reflect the effect of any fee waivers or reimbursements of Fund expenses by Columbia Management Investment Advisers, LLC and/or any of its affiliates. Absent these fee waivers or expense reimbursement arrangements, performance results would have been lower.
The performance information shown represents past performance and is not a guarantee of future results. The investment return and principal value of your investment will fluctuate so that your shares, when redeemed, may be worth more or less than their original cost. Current performance may be lower or higher than the performance information shown. You may obtain performance information current to the most recent month-end by contacting your financial intermediary, visiting investor.columbiathreadneedleus.com or calling 800.345.6611.
*The returns shown for periods prior to the share class inception date (including returns for the Life of the Fund, if shown, which are since Fund inception) include the returns of the Fund's oldest share class. These returns are adjusted to reflect any higher class-related operating expenses of the newer share classes, as applicable. Please visit investor.columbiathreadneedleus.com/investment-products/mutual-funds/appended-performance for more information.
The Russell Midcap Growth Index, an unmanaged index, measures the performance of those Russell Midcap Index companies with higher price-to-book ratios and forecasted growth values.
The Russell Midcap Index, an unmanaged index, measures the performance of the 800 smallest companies in the Russell 1000 Index, which represents approximately 25% of the total market capitalization or the Russell 1000 Index.
Indices are not available for investment, are not professionally managed and do not reflect sales charges, fees, brokerage commissions, taxes or other expenses of investing. Securities in the Fund may not match those in an index.
Annual Report 2016
3
COLUMBIA MID CAP GROWTH FUND
PERFORMANCE OVERVIEW (continued)
Performance of a Hypothetical $10,000 Investment (September 1, 2006 – August 31, 2016)
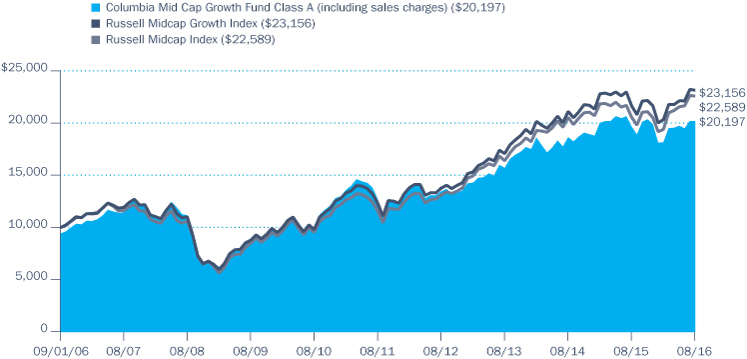
The chart above shows the change in value of a hypothetical $10,000 investment in Class A shares of Columbia Mid Cap Growth Fund during the stated time period, and does not reflect the deduction of taxes that a shareholder may pay on Fund distributions or on the redemption of Fund shares.
Annual Report 2016
4
COLUMBIA MID CAP GROWTH FUND
MANAGER DISCUSSION OF FUND PERFORMANCE
For the 12-month period that ended August 31, 2016, the Fund's Class A shares returned 2.83% excluding sales charges. During the same time period, the Fund underperformed both the Russell Midcap Growth Index, which returned 7.00%, and the Russell Midcap Index, which returned 9.91%. Stock selection in the information technology, financials and health care sectors detracted from results relative to the Russell Midcap Growth Index.
Stocks Logged Gains in Volatile Market
Lackluster economic growth, contentious geopolitical conflicts and expectations of a shift in U.S. monetary policy weighed on investors in the first half of the 12-month period that ended August 31, 2016. In December 2015, the Federal Reserve (the Fed) raised the target range of its benchmark interest rate by a quarter of a point. But the Fed took no further action as subpar global economic growth continued and mixed economic data undermined confidence at home.
The U.S. economy, however, continued to expand modestly throughout the period, and economic growth in Europe picked up, if ever so slightly. After an earlier slump, the U.S. manufacturing sector regained some traction in the spring of 2016, and the U.S. labor markets recovered to full employment for the first time since the Great Recession, despite occasional weaker reports on new job growth. The vote by the United Kingdom to exit the European Union gave markets a jolt in mid-June 2016, but that downdraft was short lived.
Against this backdrop, stocks pulled back three times during the 12-month period. The S&P 500 Index, a broad measure of U.S. stock market performance, rose 12.55% despite these downdrafts. Large-cap stocks outperformed mid- and small-cap stocks. Value stocks outperformed growth stocks, with an especially big advantage for mid-cap and small-cap value stocks versus their growth counterparts. As all but the very shortest rates declined during the period, interest-rate sensitive telecommunications services and utilities, with their attractive yields, were the strongest performing sectors for the period, along with information technology. Health care, energy and financials lagged, with modest single-digit returns.
Contributors and Detractors
Stock selection in the consumer discretionary and consumer staples sectors contributed most to the Fund's performance relative to its growth benchmark. Within the consumer discretionary sector, Ross Stores was a top performer. The company's retail stores offer branded and designer apparel, accessories, footwear and home fashions. Ross Stores has benefited from the consumer trend toward off-price retailers, and a string of recent store closings for major retailers provided a market-share opportunity for the company.
In the consumer staples sector, Tyson Foods benefited from the acquisition and integration of Hillshire Foods as well as a global shift in consumer preference for protein-heavy food. Elsewhere in the portfolio, a position in Activision Blizzard aided Fund results. The company engages in the development and publication of interactive entertainment. During the period, Activision Blizzard added to its strong line-up of proven franchises
Portfolio Management
George Myers, CFA
Brian Neigut
James King
William Chamberlain, CFA
Morningstar Style BoxTM
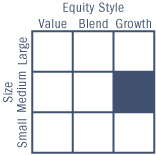
The Morningstar Style BoxTM is based on a fund's portfolio holdings. For equity funds, the vertical axis shows the market capitalization of the stocks owned, and the horizontal axis shows investment style (value, blend, or growth). Information shown is based on the most recent data provided by Morningstar.
© 2016 Morningstar, Inc. All rights reserved. The Morningstar information contained herein: (1) is proprietary to Morningstar and/or its content providers; (2) may not be copied or distributed; and (3) is not warranted to be accurate, complete or timely. Neither Morningstar nor its content providers are responsible for any damages or losses arising from any use of this information.
Top Ten Holdings (%)
(at August 31, 2016) | |
Electronic Arts, Inc. | | | 2.0 | | |
O'Reilly Automotive, Inc. | | | 1.6 | | |
Skyworks Solutions, Inc. | | | 1.6 | | |
Delphi Automotive PLC | | | 1.6 | | |
Constellation Brands, Inc.,
Class A | | | 1.6 | | |
Edwards Lifesciences Corp. | | | 1.6 | | |
Dollar General Corp. | | | 1.5 | | |
Roper Technologies, Inc. | | | 1.4 | | |
Foot Locker, Inc. | | | 1.4 | | |
Interpublic Group of
Companies, Inc. (The) | | | 1.4 | | |
Percentages indicated are based upon total investments (excluding Money Market Funds).
For further detail about these holdings, please refer to the section entitled "Portfolio of Investments."
Fund holdings are as of the date given, are subject to change at any time, and are not recommendations to buy or sell any security.
Annual Report 2016
5
COLUMBIA MID CAP GROWTH FUND
MANAGER DISCUSSION OF FUND PERFORMANCE (continued)
Portfolio Breakdown (%)
(at August 31, 2016) | |
Common Stocks | | | 95.7 | | |
Exchange-Traded Funds | | | 0.7 | | |
Money Market Funds | | | 3.6 | | |
Warrants | | | 0.0 | (a) | |
Total | | | 100.0 | | |
Percentages indicated are based upon total investments. The Fund's portfolio composition is subject to change.
(a) Rounds to zero.
Equity Sector Breakdown (%)
(at August 31, 2016) | |
Consumer Discretionary | | | 21.4 | | |
Consumer Staples | | | 7.7 | | |
Energy | | | 2.0 | | |
Financials | | | 9.9 | | |
Health Care | | | 15.2 | | |
Industrials | | | 14.5 | | |
Information Technology | | | 24.2 | | |
Materials | | | 5.1 | | |
Total | | | 100.0 | | |
Percentages indicated are based upon total equity investments. The Fund's portfolio composition is subject to change.
Investment Risks
Market risk may affect a single issuer, sector of the economy, industry or the market as a whole. Growth securities, at times, may not perform as well as value securities or the stock market in general and may be out of favor with investors. Foreign investments subject the Fund to risks, including political, economic, market, social and others within a particular country, as well as to currency instabilities and less stringent financial and accounting standards generally applicable to U.S. issuers. Investments in mid-cap companies involve risks and volatility greater than investments in larger, more established companies. The Fund may invest significantly in issuers within a particular sector, which may be negatively affected by market, economic or other conditions, making the Fund more vulnerable to unfavorable developments in the sector. See the Fund's prospectus for more information on these and other risks.
with the successful launch of Overwatch, a team-based multiplayer video game, and the acquisition of King Digital Entertainment, which makes it a leader in the mobile gaming market.
Stock selection in information technology, financials and health care detracted from positive results elsewhere in the portfolio. Within information technology, shares of Palo Alto Networks, which provides network security solutions, fell as the company's revenue projections fell short of expectations and a shift to existing customers as the major source of revenues disappointed investors. In health care, pharmaceutical company Endo International lost ground as mounting political pressure on U.S. drug prices was a headwind for the pharmaceutical industry as a whole. Additional concerns about Endo International's debt and its return on equity further hampered performance for the company. We sold the Fund's shares of Endo International during the reporting period. Elsewhere in the portfolio, Norwegian Cruise Line Holdings, a global cruise line operator, was hurt by recent global events, including terrorism in Europe and the sharp drop in the value of the British pound.
Fund Strategy
Our fundamental research process tends to favor higher quality companies with favorable growth prospects and strong management teams. We seek to identify stocks with networking effects, high switching costs, strong brands, disruptive innovation and/or a digital "first-to-scale" advantage. Our general strategy is to keep the Fund's sector weights in line with those of the Russell Midcap Growth Index. Typically, any sector overweights or underweights are more of a reflection of our bottom-up analysis rather than a top-down call on one sector versus another. As a result, Fund performance is largely driven by individual stock selection.
Annual Report 2016
6
COLUMBIA MID CAP GROWTH FUND
UNDERSTANDING YOUR FUND'S EXPENSES
(Unaudited)
As an investor, you incur two types of costs. There are transaction costs, which generally include sales charges on purchases and may include redemption fees. There are also ongoing costs, which generally include management fees, distribution and/or service fees, and other fund expenses. The following information is intended to help you understand your ongoing costs (in dollars) of investing in the Fund and to help you compare these costs with the ongoing costs of investing in other mutual funds.
Analyzing Your Fund's Expenses
To illustrate these ongoing costs, we have provided examples and calculated the expenses paid by investors in each share class of the Fund during the period. The actual and hypothetical information in the table is based on an initial investment of $1,000 at the beginning of the period indicated and held for the entire period. Expense information is calculated two ways and each method provides you with different information. The amount listed in the "Actual" column is calculated using the Fund's actual operating expenses and total return for the period. You may use the Actual information, together with the amount invested, to estimate the expenses that you paid over the period. Simply divide your account value by $1,000 (for example, an $8,600 account value divided by $1,000 = 8.6), then multiply the results by the expenses paid during the period under the "Actual" column. The amount listed in the "Hypothetical" column assumes a 5% annual rate of return before expenses (which is not the Fund's actual return) and then applies the Fund's actual expense ratio for the period to the hypothetical return. You should not use the hypothetical account values and expenses to estimate either your actual account balance at the end of the period or the expenses you paid during the period. See "Compare With Other Funds" below for details on how to use the hypothetical data.
Compare With Other Funds
Since all mutual funds are required to include the same hypothetical calculations about expenses in shareholder reports, you can use this information to compare the ongoing cost of investing in the Fund with other funds. To do so, compare the hypothetical example with the 5% hypothetical examples that appear in the shareholder reports of other funds. As you compare hypothetical examples of other funds, it is important to note that hypothetical examples are meant to highlight the ongoing costs of investing in a fund only and do not reflect any transaction costs, such as sales charges, or redemption or exchange fees. Therefore, the hypothetical calculations are useful in comparing ongoing costs only, and will not help you determine the relative total costs of owning different funds. If transaction costs were included in these calculations, your costs would be higher.
March 1, 2016 – August 31, 2016
| | | Account Value at the Beginning
of the Period ($) | | Account Value at the End of the
Period ($) | | Expenses Paid During the
Period ($) | | Fund's Annualized
Expense Ratio (%) | |
| | | Actual | | Hypothetical | | Actual | | Hypothetical | | Actual | | Hypothetical | | Actual | |
Class A | | | 1,000.00 | | | | 1,000.00 | | | | 1,112.10 | | | | 1,019.15 | | | | 6.32 | | | | 6.04 | | | | 1.19 | | |
Class B | | | 1,000.00 | | | | 1,000.00 | | | | 1,107.80 | | | | 1,015.38 | | | | 10.28 | | | | 9.83 | | | | 1.94 | | |
Class C | | | 1,000.00 | | | | 1,000.00 | | | | 1,107.70 | | | | 1,015.38 | | | | 10.28 | | | | 9.83 | | | | 1.94 | | |
Class I | | | 1,000.00 | | | | 1,000.00 | | | | 1,114.60 | | | | 1,021.22 | | | | 4.15 | | | | 3.96 | | | | 0.78 | | |
Class K | | | 1,000.00 | | | | 1,000.00 | | | | 1,112.50 | | | | 1,019.71 | | | | 5.73 | | | | 5.48 | | | | 1.08 | | |
Class R | | | 1,000.00 | | | | 1,000.00 | | | | 1,110.20 | | | | 1,017.90 | | | | 7.64 | | | | 7.30 | | | | 1.44 | | |
Class R4 | | | 1,000.00 | | | | 1,000.00 | | | | 1,113.30 | | | | 1,020.41 | | | | 4.99 | | | | 4.77 | | | | 0.94 | | |
Class R5 | | | 1,000.00 | | | | 1,000.00 | | | | 1,114.20 | | | | 1,020.96 | | | | 4.41 | | | | 4.22 | | | | 0.83 | | |
Class T | | | 1,000.00 | | | | 1,000.00 | | | | 1,112.00 | | | | 1,019.15 | | | | 6.32 | | | | 6.04 | | | | 1.19 | | |
Class W | | | 1,000.00 | | | | 1,000.00 | | | | 1,111.70 | | | | 1,019.15 | | | | 6.32 | | | | 6.04 | | | | 1.19 | | |
Class Y | | | 1,000.00 | | | | 1,000.00 | | | | 1,114.20 | | | | 1,021.17 | | | | 4.20 | | | | 4.01 | | | | 0.79 | | |
Class Z | | | 1,000.00 | | | | 1,000.00 | | | | 1,113.20 | | | | 1,020.41 | | | | 4.99 | | | | 4.77 | | | | 0.94 | | |
Expenses paid during the period are equal to the annualized expense ratio for each class as indicated above, multiplied by the average account value over the period and then multiplied by the number of days in the Fund's most recent fiscal half year and divided by 366.
Expenses do not include fees and expenses incurred indirectly by the Fund from its investment in underlying funds, including affiliated and non-affiliated pooled investment vehicles, such as mutual funds and exchange-traded funds.
Annual Report 2016
7
COLUMBIA MID CAP GROWTH FUND
PORTFOLIO OF INVESTMENTS
August 31, 2016
(Percentages represent value of investments compared to net assets)
Common Stocks 95.9%
Issuer | | Shares | | Value ($) | |
CONSUMER DISCRETIONARY 20.5% | |
Auto Components 1.5% | |
Delphi Automotive PLC | | | 407,203 | | | | 28,772,964 | | |
Hotels, Restaurants & Leisure 3.4% | |
Aramark | | | 338,350 | | | | 12,833,615 | | |
Chipotle Mexican Grill, Inc.(a) | | | 42,610 | | | | 17,629,035 | | |
Norwegian Cruise Line Holdings Ltd.(a) | | | 429,266 | | | | 15,406,357 | | |
Six Flags Entertainment Corp. | | | 150,944 | | | | 7,361,539 | | |
Starwood Hotels & Resorts
Worldwide, Inc. | | | 119,650 | | | | 9,268,089 | | |
Total | | | | | 62,498,635 | | |
Household Durables 2.8% | |
Mohawk Industries, Inc.(a) | | | 103,700 | | | | 22,065,286 | | |
Newell Brands, Inc. | | | 269,166 | | | | 14,287,332 | | |
Toll Brothers, Inc.(a) | | | 471,580 | | | | 14,661,422 | | |
Total | | | | | 51,014,040 | | |
Internet & Catalog Retail 0.8% | |
Expedia, Inc. | | | 134,260 | | | | 14,650,451 | | |
Media 1.7% | |
AMC Networks, Inc., Class A(a) | | | 143,840 | | | | 7,816,265 | | |
Interpublic Group of Companies,
Inc. (The) | | | 1,065,920 | | | | 24,665,389 | | |
Total | | | | | 32,481,654 | | |
Multiline Retail 1.5% | |
Dollar General Corp. | | | 373,760 | | | | 27,437,722 | | |
Specialty Retail 6.6% | |
Burlington Stores, Inc.(a) | | | 100,740 | | | | 8,182,103 | | |
Foot Locker, Inc. | | | 376,315 | | | | 24,701,316 | | |
Michaels Companies, Inc. (The)(a) | | | 356,460 | | | | 8,540,782 | | |
O'Reilly Automotive, Inc.(a) | | | 103,800 | | | | 29,058,810 | | |
Ross Stores, Inc. | | | 325,130 | | | | 20,236,091 | | |
Tractor Supply Co. | | | 145,520 | | | | 12,216,404 | | |
Ulta Salon Cosmetics & Fragrance, Inc.(a) | | | 46,460 | | | | 11,485,377 | | |
Williams-Sonoma, Inc. | | | 163,700 | | | | 8,617,168 | | |
Total | | | | | 123,038,051 | | |
Textiles, Apparel & Luxury Goods 2.2% | |
Carter's, Inc. | | | 125,180 | | | | 11,928,402 | | |
PVH Corp. | | | 102,900 | | | | 11,088,504 | | |
Skechers U.S.A., Inc., Class A(a) | | | 715,350 | | | | 17,390,159 | | |
Total | | | | | 40,407,065 | | |
Total Consumer Discretionary | | | | | 380,300,582 | | |
Common Stocks (continued)
Issuer | | Shares | | Value ($) | |
CONSUMER STAPLES 7.4% | |
Beverages 3.3% | |
Coca-Cola European Partners PLC | | | 286,740 | | | | 11,025,153 | | |
Constellation Brands, Inc., Class A | | | 172,100 | | | | 28,233,005 | | |
Dr. Pepper Snapple Group, Inc. | | | 221,050 | | | | 20,712,385 | | |
Total | | | | | 59,970,543 | | |
Food & Staples Retailing 1.6% | |
Rite Aid Corp.(a) | | | 2,456,550 | | | | 18,497,822 | | |
SYSCO Corp. | | | 228,120 | | | | 11,830,303 | | |
Total | | | | | 30,328,125 | | |
Food Products 2.5% | |
Blue Buffalo Pet Products, Inc.(a) | | | 399,029 | | | | 10,286,967 | | |
Hormel Foods Corp. | | | 402,550 | | | | 15,401,563 | | |
Tyson Foods, Inc., Class A | | | 276,340 | | | | 20,883,014 | | |
Total | | | | | 46,571,544 | | |
Total Consumer Staples | | | | | 136,870,212 | | |
ENERGY 1.9% | |
Oil, Gas & Consumable Fuels 1.9% | |
Cabot Oil & Gas Corp. | | | 548,670 | | | | 13,513,742 | | |
Concho Resources, Inc.(a) | | | 92,987 | | | | 12,013,921 | | |
Whiting Petroleum Corp.(a) | | | 1,244,080 | | | | 9,069,343 | | |
Total | | | | | 34,597,006 | | |
Total Energy | | | | | 34,597,006 | | |
FINANCIALS 9.5% | |
Banks 2.1% | |
Bank of the Ozarks, Inc. | | | 209,530 | | | | 8,209,385 | | |
First Republic Bank | | | 81,160 | | | | 6,246,074 | | |
Signature Bank(a) | | | 201,284 | | | | 24,558,661 | | |
Total | | | | | 39,014,120 | | |
Capital Markets 1.0% | |
Invesco Ltd. | | | 198,114 | | | | 6,179,176 | | |
T. Rowe Price Group, Inc. | | | 178,870 | | | | 12,438,620 | | |
Total | | | | | 18,617,796 | | |
Diversified Financial Services 1.7% | |
CBOE Holdings, Inc. | | | 148,360 | | | | 10,190,848 | | |
S&P Global, Inc. | | | 172,250 | | | | 21,279,765 | | |
Total | | | | | 31,470,613 | | |
The accompanying Notes to Financial Statements are an integral part of this statement.
Annual Report 2016
8
COLUMBIA MID CAP GROWTH FUND
PORTFOLIO OF INVESTMENTS (continued)
August 31, 2016
Common Stocks (continued)
Issuer | | Shares | | Value ($) | |
Real Estate Investment Trusts (REITs) 3.9% | |
Alexandria Real Estate Equities, Inc. | | | 84,580 | | | | 9,311,412 | | |
Crown Castle International Corp. | | | 246,050 | | | | 23,318,158 | | |
Equinix, Inc. | | | 39,130 | | | | 14,425,275 | | |
Extra Space Storage, Inc. | | | 299,720 | | | | 24,142,446 | | |
Total | | | | | 71,197,291 | | |
Real Estate Management & Development 0.8% | |
CBRE Group, Inc., Class A(a) | | | 510,680 | | | | 15,264,225 | | |
Total Financials | | | | | 175,564,045 | | |
HEALTH CARE 14.6% | |
Biotechnology 2.1% | |
BioMarin Pharmaceutical, Inc.(a) | | | 218,186 | | | | 20,485,484 | | |
Incyte Corp.(a) | | | 218,083 | | | | 17,686,531 | | |
Total | | | | | 38,172,015 | | |
Health Care Equipment & Supplies 6.0% | |
Align Technology, Inc.(a) | | | 99,170 | | | | 9,212,893 | | |
CR Bard, Inc. | | | 102,860 | | | | 22,715,603 | | |
DENTSPLY SIRONA, Inc. | | | 122,320 | | | | 7,517,787 | | |
Edwards Lifesciences Corp.(a) | | | 242,760 | | | | 27,956,242 | | |
Hologic, Inc.(a) | | | 339,060 | | | | 13,026,685 | | |
IDEXX Laboratories, Inc.(a) | | | 83,630 | | | | 9,423,428 | | |
Intuitive Surgical, Inc.(a) | | | 13,660 | | | | 9,376,497 | | |
Zimmer Biomet Holdings, Inc. | | | 87,700 | | | | 11,366,797 | | |
Total | | | | | 110,595,932 | | |
Health Care Providers & Services 2.4% | |
AmerisourceBergen Corp. | | | 129,900 | | | | 11,297,403 | | |
Henry Schein, Inc.(a) | | | 113,708 | | | | 18,624,233 | | |
Laboratory Corp. of America Holdings(a) | | | 102,560 | | | | 14,043,541 | | |
Total | | | | | 43,965,177 | | |
Health Care Technology 0.9% | |
Cerner Corp.(a) | | | 270,045 | | | | 17,428,704 | | |
Life Sciences Tools & Services 1.9% | |
ICON PLC(a) | | | 180,780 | | | | 13,882,096 | | |
Illumina, Inc.(a) | | | 50,240 | | | | 8,457,402 | | |
Mettler-Toledo International, Inc.(a) | | | 11,850 | | | | 4,776,380 | | |
Waters Corp.(a) | | | 50,340 | | | | 7,918,985 | | |
Total | | | | | 35,034,863 | | |
Common Stocks (continued)
Issuer | | Shares | | Value ($) | |
Pharmaceuticals 1.3% | |
Jazz Pharmaceuticals PLC(a) | | | 66,440 | | | | 8,227,265 | | |
Mallinckrodt PLC(a) | | | 72,100 | | | | 5,374,334 | | |
Zoetis, Inc. | | | 224,040 | | | | 11,448,444 | | |
Total | | | | | 25,050,043 | | |
Total Health Care | | | | | 270,246,734 | | |
INDUSTRIALS 13.9% | |
Aerospace & Defense 1.1% | |
Spirit AeroSystems Holdings, Inc.,
Class A(a) | | | 450,000 | | | | 20,619,000 | | |
Airlines 1.5% | |
Alaska Air Group, Inc. | | | 287,580 | | | | 19,420,277 | | |
Southwest Airlines Co. | | | 239,050 | | | | 8,816,164 | | |
Total | | | | | 28,236,441 | | |
Building Products 1.1% | |
AO Smith Corp. | | | 214,260 | | | | 20,671,805 | | |
Commercial Services & Supplies 1.0% | |
KAR Auction Services, Inc. | | | 249,950 | | | | 10,567,886 | | |
Stericycle, Inc.(a) | | | 80,220 | | | | 6,897,316 | | |
Total | | | | | 17,465,202 | | |
Electrical Equipment 2.8% | |
Acuity Brands, Inc. | | | 59,790 | | | | 16,449,425 | | |
AMETEK, Inc. | | | 488,393 | | | | 23,809,159 | | |
Rockwell Automation, Inc. | | | 99,423 | | | | 11,526,108 | | |
Total | | | | | 51,784,692 | | |
Industrial Conglomerates 1.3% | |
Roper Technologies, Inc. | | | 139,630 | | | | 24,791,307 | | |
Machinery 2.1% | |
Ingersoll-Rand PLC | | | 129,780 | | | | 8,823,742 | | |
Middleby Corp. (The)(a) | | | 118,160 | | | | 15,142,204 | | |
Snap-On, Inc. | | | 98,180 | | | | 15,050,012 | | |
Total | | | | | 39,015,958 | | |
Professional Services 2.4% | |
Equifax, Inc. | | | 102,400 | | | | 13,506,560 | | |
Nielsen Holdings PLC | | | 397,070 | | | | 21,155,890 | | |
Verisk Analytics, Inc.(a) | | | 115,120 | | | | 9,560,716 | | |
Total | | | | | 44,223,166 | | |
Road & Rail 0.6% | |
JB Hunt Transport Services, Inc. | | | 132,870 | | | | 10,548,549 | | |
Total Industrials | | | | | 257,356,120 | | |
The accompanying Notes to Financial Statements are an integral part of this statement.
Annual Report 2016
9
COLUMBIA MID CAP GROWTH FUND
PORTFOLIO OF INVESTMENTS (continued)
August 31, 2016
Common Stocks (continued)
Issuer | | Shares | | Value ($) | |
INFORMATION TECHNOLOGY 23.2% | |
Communications Equipment 1.3% | |
Palo Alto Networks, Inc.(a) | | | 183,180 | | | | 24,394,081 | | |
Electronic Equipment, Instruments & Components 0.7% | |
Amphenol Corp., Class A | | | 218,750 | | | | 13,630,312 | | |
Internet Software & Services 2.4% | |
Akamai Technologies, Inc.(a) | | | 299,870 | | | | 16,462,863 | | |
CoStar Group, Inc.(a) | | | 54,279 | | | | 11,249,323 | | |
LinkedIn Corp., Class A(a) | | | 87,350 | | | | 16,836,712 | | |
Total | | | | | 44,548,898 | | |
IT Services 5.9% | |
Fidelity National Information Services, Inc. | | | 301,234 | | | | 23,896,893 | | |
Fiserv, Inc.(a) | | | 191,000 | | | | 19,682,550 | | |
FleetCor Technologies, Inc.(a) | | | 135,810 | | | | 22,300,002 | | |
Gartner, Inc.(a) | | | 110,880 | | | | 10,090,080 | | |
MAXIMUS, Inc. | | | 162,737 | | | | 9,572,190 | | |
Vantiv, Inc., Class A(a) | | | 237,590 | | | | 12,768,087 | | |
WEX, Inc.(a) | | | 102,370 | | | | 10,166,365 | | |
Total | | | | | 108,476,167 | | |
Semiconductors & Semiconductor Equipment 5.0% | |
Lam Research Corp. | | | 240,890 | | | | 22,479,855 | | |
Maxim Integrated Products, Inc. | | | 184,350 | | | | 7,506,732 | | |
Microchip Technology, Inc. | | | 259,207 | | | | 16,047,505 | | |
NVIDIA Corp. | | | 303,290 | | | | 18,603,809 | | |
Skyworks Solutions, Inc. | | | 385,841 | | | | 28,884,057 | | |
Total | | | | | 93,521,958 | | |
Software 7.9% | |
Activision Blizzard, Inc. | | | 293,966 | | | | 12,161,374 | | |
Citrix Systems, Inc.(a) | | | 94,890 | | | | 8,274,408 | | |
Electronic Arts, Inc.(a) | | | 432,220 | | | | 35,109,231 | | |
Fortinet, Inc.(a) | | | 231,160 | | | | 8,354,122 | | |
Intuit, Inc. | | | 132,085 | | | | 14,720,873 | | |
Red Hat, Inc.(a) | | | 198,462 | | | | 14,483,757 | | |
ServiceNow, Inc.(a) | | | 281,608 | | | | 20,464,453 | | |
Splunk, Inc.(a) | | | 161,560 | | | | 9,409,254 | | |
Tyler Technologies, Inc.(a) | | | 22,300 | | | | 3,656,085 | | |
Ultimate Software Group, Inc. (The)(a) | | | 66,310 | | | | 13,854,811 | | |
Workday, Inc., Class A(a) | | | 58,040 | | | | 4,921,212 | | |
Total | | | | | 145,409,580 | | |
Total Information Technology | | | | | 429,980,996 | | |
Common Stocks (continued)
Issuer | | Shares | | Value ($) | |
MATERIALS 4.9% | |
Chemicals 3.1% | |
Eastman Chemical Co. | | | 159,043 | | | | 10,797,429 | | |
Sherwin-Williams Co. (The) | | | 84,045 | | | | 23,844,407 | | |
Westlake Chemical Corp. | | | 431,479 | | | | 22,359,242 | | |
Total | | | | | 57,001,078 | | |
Construction Materials 0.6% | |
Vulcan Materials Co. | | | 99,330 | | | | 11,310,707 | | |
Containers & Packaging 1.2% | |
Sealed Air Corp. | | | 267,910 | | | | 12,626,598 | | |
Westrock Co. | | | 218,512 | | | | 10,466,725 | | |
Total | | | | | 23,093,323 | | |
Total Materials | | | | | 91,405,108 | | |
Total Common Stocks
(Cost: $1,417,838,154) | | | | | 1,776,320,803 | | |
Warrants —%
HEALTH CARE —% | |
Health Care Providers & Services —% | |
HealthSouth Corp.(a) | | | 4,246 | | | | 10,615 | | |
Total Health Care | | | | | 10,615 | | |
Total Warrants
(Cost: $—) | | | | | 10,615 | | |
Exchange-Traded Funds 0.7%
| | | Shares | | Value ($) | |
SPDR S&P Biotech ETF | | | 217,470 | | | | 13,065,597 | | |
Total Exchange-Traded Funds
(Cost: $13,437,507) | | | | | 13,065,597 | | |
Money Market Funds 3.6%
Columbia Short-Term Cash Fund,
0.415%(b)(c) | | | 66,357,000 | | | | 66,357,000 | | |
Total Money Market Funds
(Cost: $66,357,000) | | | | | 66,357,000 | | |
Total Investments
(Cost: $1,497,632,661) | | | | | 1,855,754,015 | | |
Other Assets & Liabilities, Net | | | | | (3,487,941 | ) | |
Net Assets | | | | | 1,852,266,074 | | |
The accompanying Notes to Financial Statements are an integral part of this statement.
Annual Report 2016
10
COLUMBIA MID CAP GROWTH FUND
PORTFOLIO OF INVESTMENTS (continued)
August 31, 2016
Notes to Portfolio of Investments
(a) Non-income producing investment.
(b) The rate shown is the seven-day current annualized yield at August 31, 2016.
(c) As defined in the Investment Company Act of 1940, an affiliated company is one in which the Fund owns 5% or more of the company's outstanding voting securities, or a company which is under common ownership or control with the Fund. Holdings and transactions in these affiliated companies during the year ended August 31, 2016 are as follows:
Issuer | | Beginning
Cost ($) | | Purchase
Cost ($) | | Proceeds
From Sales ($) | | Ending
Cost ($) | | Dividends —
Affiliated
Issuers ($) | | Value ($) | |
Columbia Short-Term Cash Fund | | | 90,396,048 | | | | 775,791,669 | | | | (799,830,717 | ) | | | 66,357,000 | | | | 249,139 | | | | 66,357,000 | | |
Fair Value Measurements
The Fund categorizes its fair value measurements according to a three-level hierarchy that maximizes the use of observable inputs and minimizes the use of unobservable inputs by prioritizing that the most observable input be used when available. Observable inputs are those that market participants would use in pricing an investment based on market data obtained from sources independent of the reporting entity. Unobservable inputs are those that reflect the Fund's assumptions about the information market participants would use in pricing an investment. An investment's level within the fair value hierarchy is based on the lowest level of any input that is deemed significant to the asset's or liability's fair value measurement. The input levels are not necessarily an indication of the risk or liquidity associated with investments at that level. For example, certain U.S. government securities are generally high quality and liquid, however, they are reflected as Level 2 because the inputs used to determine fair value may not always be quoted prices in an active market.
Fair value inputs are summarized in the three broad levels listed below:
> Level 1 — Valuations based on quoted prices for investments in active markets that the Fund has the ability to access at the measurement date (including NAV for open-end mutual funds). Valuation adjustments are not applied to Level 1 investments.
> Level 2 — Valuations based on other significant observable inputs (including quoted prices for similar securities, interest rates, prepayment speeds, credit risks, etc.).
> Level 3 — Valuations based on significant unobservable inputs (including the Fund's own assumptions and judgment in determining the fair value of investments).
Inputs that are used in determining fair value of an investment may include price information, credit data, volatility statistics, and other factors. These inputs can be either observable or unobservable. The availability of observable inputs can vary between investments, and is affected by various factors such as the type of investment, and the volume and level of activity for that investment or similar investments in the marketplace. The inputs will be considered by the Investment Manager, along with any other relevant factors in the calculation of an investment's fair value. The Fund uses prices and inputs that are current as of the measurement date, which may include periods of market dislocations. During these periods, the availability of prices and inputs may be reduced for many investments. This condition could cause an investment to be reclassified between the various levels within the hierarchy.
Certain investments that have been measured at fair value using the net asset value per share (or its equivalent) are not categorized in the fair value hierarchy. The fair value amounts presented in the table are intended to reconcile the fair value hierarchy to the amounts presented in the Portfolio of Investments. The Columbia Short-Term Cash Fund seeks to provide shareholders with maximum current income consistent with liquidity and stability of principal. Investments in Columbia Short-Term Cash Fund may be redeemed on a daily basis without restriction.
Investments falling into the Level 3 category are primarily supported by quoted prices from brokers and dealers participating in the market for those investments. However, these may be classified as Level 3 investments due to lack of market transparency and corroboration to support these quoted prices. Additionally, valuation models may be used as the pricing source for any remaining investments classified as Level 3. These models may rely on one or more significant unobservable inputs and/or significant assumptions by the Investment Manager. Inputs used in valuations may include, but are not limited to, financial statement analysis, capital account balances, discount rates and estimated cash flows, and comparable company data.
Under the direction of the Fund's Board of Trustees (the Board), the Investment Manager's Valuation Committee (the Committee) is responsible for overseeing the valuation procedures approved by the Board. The Committee consists of voting and non-voting members from various groups within the Investment Manager's organization, including operations and accounting, trading and investments, compliance, risk management and legal.
The Committee meets at least monthly to review and approve valuation matters, which may include a description of specific valuation determinations, data regarding pricing information received from approved pricing vendors and brokers and the results of Board-approved valuation control policies and procedures (the Policies). The Policies address, among other things, instances when market quotations are or are not readily available, including recommendations of third party pricing vendors and a determination of appropriate pricing methodologies; events that require specific valuation determinations and assessment of fair value techniques; securities with a potential for stale pricing, including those that are illiquid, restricted, or in default; and the effectiveness of third party pricing vendors, including periodic reviews of
The accompanying Notes to Financial Statements are an integral part of this statement.
Annual Report 2016
11
COLUMBIA MID CAP GROWTH FUND
PORTFOLIO OF INVESTMENTS (continued)
August 31, 2016
Fair Value Measurements (continued)
vendors. The Committee meets more frequently, as needed, to discuss additional valuation matters, which may include the need to review back-testing results, review time-sensitive information or approve related valuation actions. The Committee reports to the Board, with members of the Committee meeting with the Board at each of its regularly scheduled meetings to discuss valuation matters and actions during the period, similar to those described earlier.
For investments categorized as Level 3, the Committee monitors information similar to that described above, which may include: (i) data specific to the issuer or comparable issuers, (ii) general market or specific sector news and (iii) quoted prices and specific or similar security transactions. The Committee considers this data and any changes from prior periods in order to assess the reasonableness of observable and unobservable inputs, any assumptions or internal models used to value those securities and changes in fair value. This data is also used to corroborate, when available, information received from approved pricing vendors and brokers. Various factors impact the frequency of monitoring this information (which may occur as often as daily). However, the Committee may determine that changes to inputs, assumptions and models are not required as a result of the monitoring procedures performed.
The following table is a summary of the inputs used to value the Fund's investments at August 31, 2016:
| | | Level 1
Quoted Prices in Active
Markets for Identical
Assets ($) | | Level 2
Other Significant
Observable Inputs ($) | | Level 3
Significant
Unobservable Inputs ($) | | Total ($) | |
Investments | |
Common Stocks | |
Consumer Discretionary | | | 380,300,582 | | | | — | | | | — | | | | 380,300,582 | | |
Consumer Staples | | | 136,870,212 | | | | — | | | | — | | | | 136,870,212 | | |
Energy | | | 34,597,006 | | | | — | | | | — | | | | 34,597,006 | | |
Financials | | | 175,564,045 | | | | — | | | | — | | | | 175,564,045 | | |
Health Care | | | 270,246,734 | | | | — | | | | — | | | | 270,246,734 | | |
Industrials | | | 257,356,120 | | | | — | | | | — | | | | 257,356,120 | | |
Information Technology | | | 429,980,996 | | | | — | | | | — | | | | 429,980,996 | | |
Materials | | | 91,405,108 | | | | — | | | | — | | | | 91,405,108 | | |
Total Common Stocks | | | 1,776,320,803 | | | | — | | | | — | | | | 1,776,320,803 | | |
Warrants | |
Health Care | | | 10,615 | | | | — | | | | — | | | | 10,615 | | |
Exchange-Traded Funds | | | 13,065,597 | | | | — | | | | — | | | | 13,065,597 | | |
Investments measured at net asset value | |
Money Market Funds | | | — | | | | — | | | | — | | | | 66,357,000 | | |
Total Investments | | | 1,789,397,015 | | | | — | | | | — | | | | 1,855,754,015 | | |
See the Portfolio of Investments for all investment classifications not indicated in the table.
There were no transfers of financial assets between levels during the period.
The accompanying Notes to Financial Statements are an integral part of this statement.
Annual Report 2016
12
COLUMBIA MID CAP GROWTH FUND
STATEMENT OF ASSETS AND LIABILITIES
August 31, 2016
Assets | |
Investments, at value | |
Unaffiliated issuers (identified cost $1,431,275,661) | | $ | 1,789,397,015 | | |
Affiliated issuers (identified cost $66,357,000) | | | 66,357,000 | | |
Total investments (identified cost $1,497,632,661) | | | 1,855,754,015 | | |
Receivable for: | |
Capital shares sold | | | 314,037 | | |
Dividends | | | 1,499,734 | | |
Prepaid expenses | | | 16,723 | | |
Trustees' deferred compensation plan | | | 110,444 | | |
Other assets | | | 2,199 | | |
Total assets | | | 1,857,697,152 | | |
Liabilities | |
Payable for: | |
Investments purchased | | | 1,796,330 | | |
Capital shares purchased | | | 3,028,454 | | |
Management services fees | | | 38,190 | | |
Distribution and/or service fees | | | 7,811 | | |
Transfer agent fees | | | 218,914 | | |
Plan administration fees | | | 111 | | |
Compensation of board members | | | 58,780 | | |
Chief compliance officer expenses | | | 147 | | |
Other expenses | | | 171,897 | | |
Trustees' deferred compensation plan | | | 110,444 | | |
Total liabilities | | | 5,431,078 | | |
Net assets applicable to outstanding capital stock | | $ | 1,852,266,074 | | |
Represented by | |
Paid-in capital | | $ | 1,449,490,771 | | |
Excess of distributions over net investment income | | | (846,361 | ) | |
Accumulated net realized gain | | | 45,500,310 | | |
Unrealized appreciation (depreciation) on: | |
Investments | | | 358,121,354 | | |
Total — representing net assets applicable to outstanding capital stock | | $ | 1,852,266,074 | | |
The accompanying Notes to Financial Statements are an integral part of this statement.
Annual Report 2016
13
COLUMBIA MID CAP GROWTH FUND
STATEMENT OF ASSETS AND LIABILITIES (continued)
August 31, 2016
Class A | |
Net assets | | $ | 880,154,611 | | |
Shares outstanding | | | 35,077,175 | | |
Net asset value per share | | $ | 25.09 | | |
Maximum offering price per share(a) | | $ | 26.62 | | |
Class B | |
Net assets | | $ | 4,200,850 | | |
Shares outstanding | | | 194,653 | | |
Net asset value per share | | $ | 21.58 | | |
Class C | |
Net assets | | $ | 46,355,099 | | |
Shares outstanding | | | 2,135,972 | | |
Net asset value per share | | $ | 21.70 | | |
Class I | |
Net assets | | $ | 2,412 | | |
Shares outstanding | | | 90 | | |
Net asset value per share(b) | | $ | 26.75 | | |
Class K | |
Net assets | | $ | 478,979 | | |
Shares outstanding | | | 18,140 | | |
Net asset value per share | | $ | 26.40 | | |
Class R | |
Net assets | | $ | 16,795,671 | | |
Shares outstanding | | | 691,980 | | |
Net asset value per share | | $ | 24.27 | | |
Class R4 | |
Net assets | | $ | 26,944,688 | | |
Shares outstanding | | | 993,660 | | |
Net asset value per share | | $ | 27.12 | | |
Class R5 | |
Net assets | | $ | 36,963,773 | | |
Shares outstanding | | | 1,388,080 | | |
Net asset value per share | | $ | 26.63 | | |
Class T | |
Net assets | | $ | 21,346,293 | | |
Shares outstanding | | | 853,492 | | |
Net asset value per share | | $ | 25.01 | | |
Maximum offering price per share(a) | | $ | 26.54 | | |
Class W | |
Net assets | | $ | 146,091 | | |
Shares outstanding | | | 5,822 | | |
Net asset value per share | | $ | 25.09 | | |
The accompanying Notes to Financial Statements are an integral part of this statement.
Annual Report 2016
14
COLUMBIA MID CAP GROWTH FUND
STATEMENT OF ASSETS AND LIABILITIES (continued)
August 31, 2016
Class Y | |
Net assets | | $ | 5,869,030 | | |
Shares outstanding | | | 220,391 | | |
Net asset value per share | | $ | 26.63 | | |
Class Z | |
Net assets | | $ | 813,008,577 | | |
Shares outstanding | | | 30,720,669 | | |
Net asset value per share | | $ | 26.46 | | |
(a) The maximum offering price per share is calculated by dividing the net asset value per share by 1.0 minus the maximum sales charge of 5.75%.
(b) Net asset value per share rounds to this amount due to fractional shares outstanding.
The accompanying Notes to Financial Statements are an integral part of this statement.
Annual Report 2016
15
COLUMBIA MID CAP GROWTH FUND
STATEMENT OF OPERATIONS
Year Ended August 31, 2016
Net investment income | |
Income: | |
Dividends — unaffiliated issuers | | $ | 18,155,887 | | |
Dividends — affiliated issuers | | | 249,139 | | |
Total income | | | 18,405,026 | | |
Expenses: | |
Management services fees | | | 14,329,025 | | |
Distribution and/or service fees | |
Class A | | | 2,253,655 | | |
Class B | | | 57,021 | | |
Class C | | | 488,241 | | |
Class R | | | 86,554 | | |
Class T | | | 53,974 | | |
Class W | | | 417 | | |
Transfer agent fees | |
Class A | | | 1,462,027 | | |
Class B | | | 9,255 | | |
Class C | | | 79,197 | | |
Class K | | | 224 | | |
Class R | | | 28,064 | | |
Class R4 | | | 42,875 | | |
Class R5 | | | 18,386 | | |
Class T | | | 35,009 | | |
Class W | | | 271 | | |
Class Z | | | 1,384,573 | | |
Plan administration fees | |
Class K | | | 1,123 | | |
Compensation of board members | | | 54,212 | | |
Custodian fees | | | 27,791 | | |
Printing and postage fees | | | 195,770 | | |
Registration fees | | | 149,735 | | |
Audit fees | | | 33,453 | | |
Legal fees | | | 52,159 | | |
Chief compliance officer expenses | | | 921 | | |
Other | | | 67,250 | | |
Total expenses | | | 20,911,182 | | |
Expense reductions | | | (5,685 | ) | |
Total net expenses | | | 20,905,497 | | |
Net investment loss | | | (2,500,471 | ) | |
Realized and unrealized gain (loss) — net | |
Net realized gain (loss) on: | |
Investments | | | 94,407,333 | | |
Net realized gain | | | 94,407,333 | | |
Net change in unrealized appreciation (depreciation) on: | |
Investments | | | (39,380,404 | ) | |
Net change in unrealized depreciation | | | (39,380,404 | ) | |
Net realized and unrealized gain | | | 55,026,929 | | |
Net increase in net assets resulting from operations | | $ | 52,526,458 | | |
The accompanying Notes to Financial Statements are an integral part of this statement.
Annual Report 2016
16
COLUMBIA MID CAP GROWTH FUND
STATEMENT OF CHANGES IN NET ASSETS
| | | Year Ended
August 31,
2016 | | Year Ended
August 31,
2015 | |
Operations | |
Net investment income (loss) | | $ | (2,500,471 | ) | | $ | 20,042,069 | | |
Net realized gain | | | 94,407,333 | | | | 319,648,959 | | |
Net change in unrealized depreciation | | | (39,380,404 | ) | | | (218,187,874 | ) | |
Net increase in net assets resulting from operations | | | 52,526,458 | | | | 121,503,154 | | |
Distributions to shareholders | |
Net investment income | |
Class A | | | (8,258,128 | ) | | | — | | |
Class B | | | (7,102 | ) | | | — | | |
Class C | | | (52,349 | ) | | | — | | |
Class I | | | (35 | ) | | | — | | |
Class K | | | (4,691 | ) | | | — | | |
Class R | | | (118,953 | ) | | | — | | |
Class R4 | | | (301,659 | ) | | | — | | |
Class R5 | | | (446,456 | ) | | | — | | |
Class T | | | (195,429 | ) | | | — | | |
Class W | | | (1,679 | ) | | | — | | |
Class Y | | | (33 | ) | | | — | | |
Class Z | | | (10,100,198 | ) | | | — | | |
Net realized gains | |
Class A | | | (134,277,745 | ) | | | (148,818,366 | ) | |
Class B | | | (1,121,198 | ) | | | (1,954,906 | ) | |
Class C | | | (8,264,319 | ) | | | (8,485,326 | ) | |
Class I | | | (372 | ) | | | (7,528,333 | ) | |
Class K | | | (66,547 | ) | | | (57,329 | ) | |
Class R | | | (2,752,903 | ) | | | (3,548,457 | ) | |
Class R4 | | | (3,732,458 | ) | | | (105,003 | ) | |
Class R5 | | | (5,020,124 | ) | | | (5,182,347 | ) | |
Class T | | | (3,208,605 | ) | | | (3,670,320 | ) | |
Class W | | | (27,238 | ) | | | (38,026 | ) | |
Class Y | | | (350 | ) | | | (431 | ) | |
Class Z | | | (126,068,524 | ) | | | (159,524,590 | ) | |
Total distributions to shareholders | | | (304,027,095 | ) | | | (338,913,434 | ) | |
Increase (decrease) in net assets from capital stock activity | | | 49,797,626 | | | | (220,893,183 | ) | |
Total decrease in net assets | | | (201,703,011 | ) | | | (438,303,463 | ) | |
Net assets at beginning of year | | | 2,053,969,085 | | | | 2,492,272,548 | | |
Net assets at end of year | | $ | 1,852,266,074 | | | $ | 2,053,969,085 | | |
Undistributed (excess of distributions over) net investment income | | $ | (846,361 | ) | | $ | 19,150,872 | | |
The accompanying Notes to Financial Statements are an integral part of this statement.
Annual Report 2016
17
COLUMBIA MID CAP GROWTH FUND
STATEMENT OF CHANGES IN NET ASSETS (continued)
| | | Year Ended August 31, 2016 | | Year Ended August 31, 2015 | |
| | | Shares | | Dollars ($) | | Shares | | Dollars ($) | |
Capital stock activity | |
Class A shares | |
Subscriptions(a) | | | 2,269,018 | | | | 56,974,135 | | | | 2,316,713 | | | | 68,516,197 | | |
Distributions reinvested | | | 5,398,498 | | | | 134,314,628 | | | | 5,058,499 | | | | 140,221,584 | | |
Redemptions | | | (5,661,350 | ) | | | (141,817,080 | ) | | | (5,287,673 | ) | | | (157,813,159 | ) | |
Net increase | | | 2,006,166 | | | | 49,471,683 | | | | 2,087,539 | | | | 50,924,622 | | |
Class B shares | |
Subscriptions | | | 7,908 | | | | 186,059 | | | | 9,836 | | | | 253,912 | | |
Distributions reinvested | | | 50,234 | | | | 1,081,033 | | | | 76,220 | | | | 1,868,145 | | |
Redemptions(a) | | | (172,161 | ) | | | (3,718,483 | ) | | | (236,661 | ) | | | (6,215,032 | ) | |
Net decrease | | | (114,019 | ) | | | (2,451,391 | ) | | | (150,605 | ) | | | (4,092,975 | ) | |
Class C shares | |
Subscriptions | | | 310,462 | | | | 6,814,802 | | | | 268,540 | | | | 6,974,565 | | |
Distributions reinvested | | | 343,555 | | | | 7,434,524 | | | | 297,080 | | | | 7,314,114 | | |
Redemptions | | | (564,728 | ) | | | (12,322,494 | ) | | | (341,673 | ) | | | (8,997,212 | ) | |
Net increase | | | 89,289 | | | | 1,926,832 | | | | 223,947 | | | | 5,291,467 | | |
Class I shares | |
Subscriptions | | | — | | | | — | | | | 494,672 | | | | 16,334,466 | | |
Distributions reinvested | | | — | | | | — | | | | 257,981 | | | | 7,527,875 | | |
Redemptions | | | — | | | | — | | | | (6,696,099 | ) | | | (221,663,215 | ) | |
Net increase (decrease) | | | — | | | | — | | | | (5,943,446 | ) | | | (197,800,874 | ) | |
Class K shares | |
Subscriptions | | | 3,390 | | | | 93,306 | | | | 2,324 | | | | 70,306 | | |
Distributions reinvested | | | 2,709 | | | | 70,871 | | | | 1,966 | | | | 56,912 | | |
Redemptions | | | (3,143 | ) | | | (79,452 | ) | | | (605 | ) | | | (19,259 | ) | |
Net increase | | | 2,956 | | | | 84,725 | | | | 3,685 | | | | 107,959 | | |
Class R shares | |
Subscriptions | | | 236,600 | | | | 5,771,044 | | | | 199,493 | | | | 5,763,107 | | |
Distributions reinvested | | | 82,209 | | | | 1,982,060 | | | | 96,740 | | | | 2,611,023 | | |
Redemptions | | | (307,036 | ) | | | (7,533,492 | ) | | | (411,370 | ) | | | (11,808,786 | ) | |
Net increase (decrease) | | | 11,773 | | | | 219,612 | | | | (115,137 | ) | | | (3,434,656 | ) | |
Class R4 shares | |
Subscriptions | | | 275,809 | | | | 7,720,675 | | | | 898,802 | | | | 28,857,053 | | |
Distributions reinvested | | | 150,289 | | | | 4,033,752 | | | | 3,477 | | | | 102,854 | | |
Redemptions | | | (309,946 | ) | | | (8,228,638 | ) | | | (35,739 | ) | | | (1,139,034 | ) | |
Net increase | | | 116,152 | | | | 3,525,789 | | | | 866,540 | | | | 27,820,873 | | |
The accompanying Notes to Financial Statements are an integral part of this statement.
Annual Report 2016
18
COLUMBIA MID CAP GROWTH FUND
STATEMENT OF CHANGES IN NET ASSETS (continued)
| | | Year Ended August 31, 2016 | | Year Ended August 31, 2015 | |
| | | Shares | | Dollars ($) | | Shares | | Dollars ($) | |
Capital stock activity (continued) | |
Class R5 shares | |
Subscriptions | | | 300,745 | | | | 7,737,711 | | | | 452,364 | | | | 14,094,437 | | |
Distributions reinvested | | | 207,604 | | | | 5,466,222 | | | | 178,074 | | | | 5,181,943 | | |
Redemptions | | | (364,944 | ) | | | (9,649,821 | ) | | | (319,238 | ) | | | (9,882,628 | ) | |
Net increase | | | 143,405 | | | | 3,554,112 | | | | 311,200 | | | | 9,393,752 | | |
Class T shares | |
Subscriptions | | | 18,522 | | | | 457,861 | | | | 17,670 | | | | 496,409 | | |
Distributions reinvested | | | 116,269 | | | | 2,883,462 | | | | 110,863 | | | | 3,065,366 | | |
Redemptions | | | (70,902 | ) | | | (1,793,042 | ) | | | (86,131 | ) | | | (2,545,667 | ) | |
Net increase | | | 63,889 | | | | 1,548,281 | | | | 42,402 | | | | 1,016,108 | | |
Class W shares | |
Distributions reinvested | | | 1,148 | | | | 28,562 | | | | 1,357 | | | | 37,620 | | |
Redemptions | | | (2,333 | ) | | | (57,883 | ) | | | (3,195 | ) | | | (95,530 | ) | |
Net decrease | | | (1,185 | ) | | | (29,321 | ) | | | (1,838 | ) | | | (57,910 | ) | |
Class Y shares | |
Subscriptions | | | 233,023 | | | | 6,019,422 | | | | 66 | | | | 2,219 | | |
Redemptions | | | (12,717 | ) | | | (333,740 | ) | | | (7,446 | ) | | | (245,773 | ) | |
Net increase (decrease) | | | 220,306 | | | | 5,685,682 | | | | (7,380 | ) | | | (243,554 | ) | |
Class Z shares | |
Subscriptions | | | 1,719,278 | | | | 45,182,224 | | | | 1,815,074 | | | | 55,869,162 | | |
Distributions reinvested | | | 3,643,504 | | | | 95,423,366 | | | | 3,690,742 | | | | 106,920,783 | | |
Redemptions | | | (5,899,479 | ) | | | (154,343,968 | ) | | | (8,664,812 | ) | | | (272,607,940 | ) | |
Net decrease | | | (536,697 | ) | | | (13,738,378 | ) | | | (3,158,996 | ) | | | (109,817,995 | ) | |
Total net increase (decrease) | | | 2,002,035 | | | | 49,797,626 | | | | (5,842,089 | ) | | | (220,893,183 | ) | |
(a) Includes conversions of Class B shares to Class A shares, if any.
The accompanying Notes to Financial Statements are an integral part of this statement.
Annual Report 2016
19
COLUMBIA MID CAP GROWTH FUND
The following tables are intended to help you understand the Fund's financial performance. Certain information reflects financial results for a single share of a class held for the periods shown. Per share net investment income (loss) amounts are calculated based on average shares outstanding during the period. Total return assumes reinvestment of all dividends and distributions, if any. Total return does not reflect payment of sales charges, if any. Total return and portfolio turnover are not annualized for periods of less than one year. The portfolio turnover rate is calculated without regard to purchase and sales transactions of short-term instruments and certain derivatives, if any. If such transactions were included, the Fund's portfolio turnover rate may be higher.
| | | Year Ended August 31, | |
Class A | | 2016 | | 2015 | | 2014 | | 2013 | | 2012 | |
Per share data | |
Net asset value, beginning of period | | $ | 28.69 | | | $ | 32.14 | | | $ | 29.89 | | | $ | 26.41 | | | $ | 25.75 | | |
Income from investment operations: | |
Net investment income (loss) | | | (0.06 | ) | | | 0.25 | (a) | | | (0.13 | ) | | | (0.11 | ) | | | (0.06 | ) | |
Net realized and unrealized gain | | | 0.84 | | | | 1.29 | | | | 5.45 | | | | 4.36 | | | | 1.55 | | |
Total from investment operations | | | 0.78 | | | | 1.54 | | | | 5.32 | | | | 4.25 | | | | 1.49 | | |
Less distributions to shareholders: | |
Net investment income | | | (0.26 | ) | | | — | | | | — | | | | — | | | | — | | |
Net realized gains | | | (4.12 | ) | | | (4.99 | ) | | | (3.07 | ) | | | (0.77 | ) | | | (0.83 | ) | |
Total distributions to shareholders | | | (4.38 | ) | | | (4.99 | ) | | | (3.07 | ) | | | (0.77 | ) | | | (0.83 | ) | |
Proceeds from regulatory settlements | | | — | | | | — | | | | — | | | | — | | | | 0.00 | (b) | |
Net asset value, end of period | | $ | 25.09 | | | $ | 28.69 | | | $ | 32.14 | | | $ | 29.89 | | | $ | 26.41 | | |
Total return | | | 2.83 | % | | | 5.33 | % | | | 18.77 | % | | | 16.60 | % | | | 5.97 | % | |
Ratios to average net assets(c) | |
Total gross expenses | | | 1.19 | % | | | 1.19 | % | | | 1.19 | % | | | 1.20 | % | | | 1.22 | % | |
Total net expenses(d) | | | 1.19 | %(e) | | | 1.19 | %(e) | | | 1.19 | %(e) | | | 1.20 | %(e) | | | 1.22 | %(e) | |
Net investment income (loss) | | | (0.23 | %) | | | 0.83 | % | | | (0.42 | %) | | | (0.40 | %) | | | (0.22 | %) | |
Supplemental data | |
Net assets, end of period (in thousands) | | $ | 880,155 | | | $ | 948,826 | | | $ | 995,730 | | | $ | 986,482 | | | $ | 330,302 | | |
Portfolio turnover | | | 130 | % | | | 101 | % | | | 100 | % | | | 109 | % | | | 141 | % | |
Notes to Financial Highlights
(a) Net investment income per share includes special dividends. The effect of these dividends amounted to $0.35 per share.
(b) Rounds to zero.
(c) In addition to the fees and expenses that the Fund bears directly, the Fund indirectly bears a pro rata share of the fees and expenses of any other funds in which it invests. Such indirect expenses are not included in the Fund's reported expense ratios.
(d) Total net expenses include the impact of certain fee waivers/expense reimbursements made by the Investment Manager and certain of its affiliates, if applicable.
(e) The benefits derived from expense reductions had an impact of less than 0.01%.
The accompanying Notes to Financial Statements are an integral part of this statement.
Annual Report 2016
20
COLUMBIA MID CAP GROWTH FUND
FINANCIAL HIGHLIGHTS (continued)
| | | Year Ended August 31, | |
Class B | | 2016 | | 2015 | | 2014 | | 2013 | | 2012 | |
Per share data | |
Net asset value, beginning of period | | $ | 25.22 | | | $ | 28.88 | | | $ | 27.20 | | | $ | 24.29 | | | $ | 23.92 | | |
Income from investment operations: | |
Net investment loss | | | (0.22 | ) | | | (0.05 | )(a) | | | (0.33 | ) | | | (0.31 | ) | | | (0.23 | ) | |
Net realized and unrealized gain | | | 0.73 | | | | 1.22 | | | | 4.94 | | | | 3.99 | | | | 1.43 | | |
Total from investment operations | | | 0.51 | | | | 1.17 | | | | 4.61 | | | | 3.68 | | | | 1.20 | | |
Less distributions to shareholders: | |
Net investment income | | | (0.03 | ) | | | — | | | | — | | | | — | | | | — | | |
Net realized gains | | | (4.12 | ) | | | (4.83 | ) | | | (2.93 | ) | | | (0.77 | ) | | | (0.83 | ) | |
Total distributions to shareholders | | | (4.15 | ) | | | (4.83 | ) | | | (2.93 | ) | | | (0.77 | ) | | | (0.83 | ) | |
Proceeds from regulatory settlements | | | — | | | | — | | | | — | | | | — | | | | 0.00 | (b) | |
Net asset value, end of period | | $ | 21.58 | | | $ | 25.22 | | | $ | 28.88 | | | $ | 27.20 | | | $ | 24.29 | | |
Total return | | | 2.06 | % | | | 4.54 | % | | | 17.88 | % | | | 15.68 | % | | | 5.19 | % | |
Ratios to average net assets(c) | |
Total gross expenses | | | 1.94 | % | | | 1.94 | % | | | 1.94 | % | | | 1.95 | % | | | 1.99 | % | |
Total net expenses(d) | | | 1.94 | %(e) | | | 1.94 | %(e) | | | 1.94 | %(e) | | | 1.95 | %(e) | | | 1.99 | %(e) | |
Net investment loss | | | (0.99 | %) | | | (0.18 | %) | | | (1.18 | %) | | | (1.20 | %) | | | (0.99 | %) | |
Supplemental data | |
Net assets, end of period (in thousands) | | $ | 4,201 | | | $ | 7,785 | | | $ | 13,264 | | | $ | 17,994 | | | $ | 5,140 | | |
Portfolio turnover | | | 130 | % | | | 101 | % | | | 100 | % | | | 109 | % | | | 141 | % | |
Notes to Financial Highlights
(a) Net investment loss per share includes special dividends. The effect of these dividends amounted to $0.24 per share.
(b) Rounds to zero.
(c) In addition to the fees and expenses that the Fund bears directly, the Fund indirectly bears a pro rata share of the fees and expenses of any other funds in which it invests. Such indirect expenses are not included in the Fund's reported expense ratios.
(d) Total net expenses include the impact of certain fee waivers/expense reimbursements made by the Investment Manager and certain of its affiliates, if applicable.
(e) The benefits derived from expense reductions had an impact of less than 0.01%.
The accompanying Notes to Financial Statements are an integral part of this statement.
Annual Report 2016
21
COLUMBIA MID CAP GROWTH FUND
FINANCIAL HIGHLIGHTS (continued)
| | | Year Ended August 31, | |
Class C | | 2016 | | 2015 | | 2014 | | 2013 | | 2012 | |
Per share data | |
Net asset value, beginning of period | | $ | 25.34 | | | $ | 28.99 | | | $ | 27.30 | | | $ | 24.37 | | | $ | 23.99 | | |
Income from investment operations: | |
Net investment income (loss) | | | (0.21 | ) | | | 0.03 | (a) | | | (0.33 | ) | | | (0.26 | ) | | | (0.23 | ) | |
Net realized and unrealized gain | | | 0.72 | | | | 1.15 | | | | 4.95 | | | | 3.96 | | | | 1.44 | | |
Total from investment operations | | | 0.51 | | | | 1.18 | | | | 4.62 | | | | 3.70 | | | | 1.21 | | |
Less distributions to shareholders: | |
Net investment income | | | (0.03 | ) | | | — | | | | — | | | | — | | | | — | | |
Net realized gains | | | (4.12 | ) | | | (4.83 | ) | | | (2.93 | ) | | | (0.77 | ) | | | (0.83 | ) | |
Total distributions to shareholders | | | (4.15 | ) | | | (4.83 | ) | | | (2.93 | ) | | | (0.77 | ) | | | (0.83 | ) | |
Proceeds from regulatory settlements | | | — | | | | — | | | | — | | | | — | | | | 0.00 | (b) | |
Net asset value, end of period | | $ | 21.70 | | | $ | 25.34 | | | $ | 28.99 | | | $ | 27.30 | | | $ | 24.37 | | |
Total return | | | 2.05 | % | | | 4.56 | % | | | 17.84 | % | | | 15.71 | % | | | 5.22 | % | |
Ratios to average net assets(c) | |
Total gross expenses | | | 1.94 | % | | | 1.94 | % | | | 1.94 | % | | | 1.96 | % | | | 1.98 | % | |
Total net expenses(d) | | | 1.94 | %(e) | | | 1.94 | %(e) | | | 1.94 | %(e) | | | 1.96 | %(e) | | | 1.98 | %(e) | |
Net investment income (loss) | | | (0.98 | %) | | | 0.11 | % | | | (1.17 | %) | | | (1.04 | %) | | | (0.98 | %) | |
Supplemental data | |
Net assets, end of period (in thousands) | | $ | 46,355 | | | $ | 51,859 | | | $ | 52,845 | | | $ | 52,284 | | | $ | 45,236 | | |
Portfolio turnover | | | 130 | % | | | 101 | % | | | 100 | % | | | 109 | % | | | 141 | % | |
Notes to Financial Highlights
(a) Net investment income per share includes special dividends. The effect of these dividends amounted to $0.32 per share.
(b) Rounds to zero.
(c) In addition to the fees and expenses that the Fund bears directly, the Fund indirectly bears a pro rata share of the fees and expenses of any other funds in which it invests. Such indirect expenses are not included in the Fund's reported expense ratios.
(d) Total net expenses include the impact of certain fee waivers/expense reimbursements made by the Investment Manager and certain of its affiliates, if applicable.
(e) The benefits derived from expense reductions had an impact of less than 0.01%.
The accompanying Notes to Financial Statements are an integral part of this statement.
Annual Report 2016
22
COLUMBIA MID CAP GROWTH FUND
FINANCIAL HIGHLIGHTS (continued)
| | | Year Ended August 31, | |
Class I | | 2016 | | 2015 | | 2014 | | 2013 | | 2012 | |
Per share data | |
Net asset value, beginning of period | | $ | 30.32 | | | $ | 33.62 | | | $ | 31.09 | | | $ | 27.33 | | | $ | 26.49 | | |
Income from investment operations: | |
Net investment income | | | 0.05 | | | | 0.00 | (a)(b) | | | (0.00 | )(a) | | | 0.05 | | | | 0.06 | | |
Net realized and unrealized gain | | | 0.89 | | | | 1.78 | | | | 5.69 | | | | 4.48 | | | | 1.61 | | |
Total from investment operations | | | 0.94 | | | | 1.78 | | | | 5.69 | | | | 4.53 | | | | 1.67 | | |
Less distributions to shareholders: | |
Net investment income | | | (0.39 | ) | | | — | | | | — | | | | — | | | | — | | |
Net realized gains | | | (4.12 | ) | | | (5.08 | ) | | | (3.16 | ) | | | (0.77 | ) | | | (0.83 | ) | |
Total distributions to shareholders | | | (4.51 | ) | | | (5.08 | ) | | | (3.16 | ) | | | (0.77 | ) | | | (0.83 | ) | |
Proceeds from regulatory settlements | | | — | | | | — | | | | — | | | | — | | | | 0.00 | (a) | |
Net asset value, end of period | | $ | 26.75 | | | $ | 30.32 | | | $ | 33.62 | | | $ | 31.09 | | | $ | 27.33 | | |
Total return | | | 3.26 | % | | | 5.88 | % | | | 19.27 | % | | | 17.08 | % | | | 6.49 | % | |
Ratios to average net assets(c) | |
Total gross expenses | | | 0.77 | % | | | 0.76 | % | | | 0.75 | % | | | 0.77 | % | | | 0.78 | % | |
Total net expenses(d) | | | 0.77 | % | | | 0.76 | % | | | 0.75 | % | | | 0.77 | % | | | 0.78 | % | |
Net investment income | | | 0.18 | % | | | 0.01 | % | | | (0.00 | %)(a) | | | 0.17 | % | | | 0.23 | % | |
Supplemental data | |
Net assets, end of period (in thousands) | | $ | 2 | | | $ | 3 | | | $ | 199,823 | | | $ | 240,974 | | | $ | 268,601 | | |
Portfolio turnover | | | 130 | % | | | 101 | % | | | 100 | % | | | 109 | % | | | 141 | % | |
Notes to Financial Highlights
(a) Rounds to zero.
(b) Net investment income per share includes special dividends. The effect of these dividends amounted to less than $0.01 per share.
(c) In addition to the fees and expenses that the Fund bears directly, the Fund indirectly bears a pro rata share of the fees and expenses of any other funds in which it invests. Such indirect expenses are not included in the Fund's reported expense ratios.
(d) Total net expenses include the impact of certain fee waivers/expense reimbursements made by the Investment Manager and certain of its affiliates, if applicable.
The accompanying Notes to Financial Statements are an integral part of this statement.
Annual Report 2016
23
COLUMBIA MID CAP GROWTH FUND
FINANCIAL HIGHLIGHTS (continued)
| | | Year Ended August 31, | |
Class K | | 2016 | | 2015 | | 2014 | | 2013(a) | |
Per share data | |
Net asset value, beginning of period | | $ | 29.97 | | | $ | 33.35 | | | $ | 30.89 | | | $ | 28.08 | | |
Income from investment operations: | |
Net investment income (loss) | | | (0.03 | ) | | | 0.33 | (b) | | | (0.08 | ) | | | (0.06 | ) | |
Net realized and unrealized gain | | | 0.87 | | | | 1.31 | | | | 5.64 | | | | 2.87 | | |
Total from investment operations | | | 0.84 | | | | 1.64 | | | | 5.56 | | | | 2.81 | | |
Less distributions to shareholders: | |
Net investment income | | | (0.29 | ) | | | — | | | | — | | | | — | | |
Net realized gains | | | (4.12 | ) | | | (5.02 | ) | | | (3.10 | ) | | | — | | |
Total distributions to shareholders | | | (4.41 | ) | | | (5.02 | ) | | | (3.10 | ) | | | — | | |
Net asset value, end of period | | $ | 26.40 | | | $ | 29.97 | | | $ | 33.35 | | | $ | 30.89 | | |
Total return | | | 2.95 | % | | | 5.45 | % | | | 18.95 | % | | | 10.01 | % | |
Ratios to average net assets(c) | |
Total gross expenses | | | 1.08 | % | | | 1.07 | % | | | 1.05 | % | | | 1.05 | %(d) | |
Total net expenses(e) | | | 1.08 | % | | | 1.07 | % | | | 1.05 | % | | | 1.05 | %(d) | |
Net investment income (loss) | | | (0.12 | %) | | | 1.07 | % | | | (0.26 | %) | | | (0.42 | %)(d) | |
Supplemental data | |
Net assets, end of period (in thousands) | | $ | 479 | | | $ | 455 | | | $ | 383 | | | $ | 396 | | |
Portfolio turnover | | | 130 | % | | | 101 | % | | | 100 | % | | | 109 | % | |
Notes to Financial Highlights
(a) Based on operations from February 28, 2013 (commencement of operations) through the stated period end.
(b) Net investment income per share includes special dividends. The effect of these dividends amounted to $0.40 per share.
(c) In addition to the fees and expenses that the Fund bears directly, the Fund indirectly bears a pro rata share of the fees and expenses of any other funds in which it invests. Such indirect expenses are not included in the Fund's reported expense ratios.
(d) Annualized.
(e) Total net expenses include the impact of certain fee waivers/expense reimbursements made by the Investment Manager and certain of its affiliates, if applicable.
The accompanying Notes to Financial Statements are an integral part of this statement.
Annual Report 2016
24
COLUMBIA MID CAP GROWTH FUND
FINANCIAL HIGHLIGHTS (continued)
| | | Year Ended August 31, | |
Class R | | 2016 | | 2015 | | 2014 | | 2013 | | 2012 | |
Per share data | |
Net asset value, beginning of period | | $ | 27.88 | | | $ | 31.39 | | | $ | 29.28 | | | $ | 25.96 | | | $ | 25.38 | | |
Income from investment operations: | |
Net investment income (loss) | | | (0.12 | ) | | | 0.15 | (a) | | | (0.20 | ) | | | (0.14 | ) | | | (0.12 | ) | |
Net realized and unrealized gain | | | 0.81 | | | | 1.28 | | | | 5.33 | | | | 4.23 | | | | 1.53 | | |
Total from investment operations | | | 0.69 | | | | 1.43 | | | | 5.13 | | | | 4.09 | | | | 1.41 | | |
Less distributions to shareholders: | |
Net investment income | | | (0.18 | ) | | | — | | | | — | | | | — | | | | — | | |
Net realized gains | | | (4.12 | ) | | | (4.94 | ) | | | (3.02 | ) | | | (0.77 | ) | | | (0.83 | ) | |
Total distributions to shareholders | | | (4.30 | ) | | | (4.94 | ) | | | (3.02 | ) | | | (0.77 | ) | | | (0.83 | ) | |
Proceeds from regulatory settlements | | | — | | | | — | | | | — | | | | — | | | | 0.00 | (b) | |
Net asset value, end of period | | $ | 24.27 | | | $ | 27.88 | | | $ | 31.39 | | | $ | 29.28 | | | $ | 25.96 | | |
Total return | | | 2.58 | % | | | 5.06 | % | | | 18.47 | % | | | 16.27 | % | | | 5.73 | % | |
Ratios to average net assets(c) | |
Total gross expenses | | | 1.44 | % | | | 1.44 | % | | | 1.44 | % | | | 1.46 | % | | | 1.48 | % | |
Total net expenses(d) | | | 1.44 | %(e) | | | 1.44 | %(e) | | | 1.44 | %(e) | | | 1.46 | %(e) | | | 1.48 | %(e) | |
Net investment income (loss) | | | (0.48 | %) | | | 0.52 | % | | | (0.67 | %) | | | (0.53 | %) | | | (0.48 | %) | |
Supplemental data | |
Net assets, end of period (in thousands) | | $ | 16,796 | | | $ | 18,965 | | | $ | 24,965 | | | $ | 27,574 | | | $ | 25,613 | | |
Portfolio turnover | | | 130 | % | | | 101 | % | | | 100 | % | | | 109 | % | | | 141 | % | |
Notes to Financial Highlights
(a) Net investment income per share includes special dividends. The effect of these dividends amounted to $0.32 per share.
(b) Rounds to zero.
(c) In addition to the fees and expenses that the Fund bears directly, the Fund indirectly bears a pro rata share of the fees and expenses of any other funds in which it invests. Such indirect expenses are not included in the Fund's reported expense ratios.
(d) Total net expenses include the impact of certain fee waivers/expense reimbursements made by the Investment Manager and certain of its affiliates, if applicable.
(e) The benefits derived from expense reductions had an impact of less than 0.01%.
The accompanying Notes to Financial Statements are an integral part of this statement.
Annual Report 2016
25
COLUMBIA MID CAP GROWTH FUND
FINANCIAL HIGHLIGHTS (continued)
| | | Year Ended August 31, | |
Class R4 | | 2016 | | 2015 | | 2014 | | 2013(a) | |
Per share data | |
Net asset value, beginning of period | | $ | 30.67 | | | $ | 33.99 | | | $ | 31.42 | | | $ | 26.58 | | |
Income from investment operations: | |
Net investment income (loss) | | | 0.00 | (b) | | | 1.93 | (c) | | | (0.03 | ) | | | (0.09 | ) | |
Net realized and unrealized gain (loss) | | | 0.91 | | | | (0.21 | )(d) | | | 5.72 | | | | 5.70 | | |
Total from investment operations | | | 0.91 | | | | 1.72 | | | | 5.69 | | | | 5.61 | | |
Less distributions to shareholders: | |
Net investment income | | | (0.34 | ) | | | — | | | | — | | | | — | | |
Net realized gains | | | (4.12 | ) | | | (5.04 | ) | | | (3.12 | ) | | | (0.77 | ) | |
Total distributions to shareholders | | | (4.46 | ) | | | (5.04 | ) | | | (3.12 | ) | | | (0.77 | ) | |
Net asset value, end of period | | $ | 27.12 | | | $ | 30.67 | | | $ | 33.99 | | | $ | 31.42 | | |
Total return | | | 3.10 | % | | | 5.61 | % | | | 19.05 | % | | | 21.61 | % | |
Ratios to average net assets(e) | |
Total gross expenses | | | 0.94 | % | | | 0.93 | % | | | 0.94 | % | | | 1.08 | %(f) | |
Total net expenses(g) | | | 0.94 | %(h) | | | 0.93 | %(h) | | | 0.94 | %(h) | | | 0.96 | %(f)(h) | |
Net investment income (loss) | | | 0.02 | % | | | 6.10 | % | | | (0.08 | %) | | | (0.41 | %)(f) | |
Supplemental data | |
Net assets, end of period (in thousands) | | $ | 26,945 | | | $ | 26,912 | | | $ | 373 | | | $ | 30 | | |
Portfolio turnover | | | 130 | % | | | 101 | % | | | 100 | % | | | 109 | % | |
Notes to Financial Highlights
(a) Based on operations from November 8, 2012 (commencement of operations) through the stated period end.
(b) Rounds to zero.
(c) Net investment income per share includes special dividends. The effect of these dividends amounted to $2.00 per share.
(d) Calculation of the net gain (loss) per share (both realized and unrealized) does not correlate to the aggregate realized and unrealized gain (loss) presented in the Statement of Operations due to the timing of subscriptions and redemptions of Fund shares in relation to fluctuations in the market value of the portfolio.
(e) In addition to the fees and expenses that the Fund bears directly, the Fund indirectly bears a pro rata share of the fees and expenses of any other funds in which it invests. Such indirect expenses are not included in the Fund's reported expense ratios.
(f) Annualized.
(g) Total net expenses include the impact of certain fee waivers/expense reimbursements made by the Investment Manager and certain of its affiliates, if applicable.
(h) The benefits derived from expense reductions had an impact of less than 0.01%.
The accompanying Notes to Financial Statements are an integral part of this statement.
Annual Report 2016
26
COLUMBIA MID CAP GROWTH FUND
FINANCIAL HIGHLIGHTS (continued)
| | | Year Ended August 31, | |
Class R5 | | 2016 | | 2015 | | 2014 | | 2013 | | 2012 | |
Per share data | |
Net asset value, beginning of period | | $ | 30.20 | | | $ | 33.54 | | | $ | 31.03 | | | $ | 27.31 | | | $ | 26.47 | | |
Income from investment operations: | |
Net investment income (loss) | | | 0.04 | | | | 0.40 | (a) | | | 0.03 | | | | (0.04 | ) | | | 0.06 | | |
Net realized and unrealized gain | | | 0.88 | | | | 1.33 | | | | 5.63 | | | | 4.53 | | | | 1.61 | | |
Total from investment operations | | | 0.92 | | | | 1.73 | | | | 5.66 | | | | 4.49 | | | | 1.67 | | |
Less distributions to shareholders: | |
Net investment income | | | (0.37 | ) | | | — | | | | — | | | | — | | | | — | | |
Net realized gains | | | (4.12 | ) | | | (5.07 | ) | | | (3.15 | ) | | | (0.77 | ) | | | (0.83 | ) | |
Total distributions to shareholders | | | (4.49 | ) | | | (5.07 | ) | | | (3.15 | ) | | | (0.77 | ) | | | (0.83 | ) | |
Proceeds from regulatory settlements | | | — | | | | — | | | | — | | | | — | | | | 0.00 | (b) | |
Net asset value, end of period | | $ | 26.63 | | | $ | 30.20 | | | $ | 33.54 | | | $ | 31.03 | | | $ | 27.31 | | |
Total return | | | 3.21 | % | | | 5.72 | % | | | 19.21 | % | | | 16.94 | % | | | 6.50 | % | |
Ratios to average net assets(c) | |
Total gross expenses | | | 0.83 | % | | | 0.82 | % | | | 0.81 | % | | | 0.81 | % | | | 0.78 | % | |
Total net expenses(d) | | | 0.83 | % | | | 0.82 | % | | | 0.81 | % | | | 0.81 | % | | | 0.78 | % | |
Net investment income (loss) | | | 0.14 | % | | | 1.28 | % | | | 0.09 | % | | | (0.14 | %) | | | 0.22 | % | |
Supplemental data | |
Net assets, end of period (in thousands) | | $ | 36,964 | | | $ | 37,589 | | | $ | 31,305 | | | $ | 3,847 | | | $ | 2,336 | | |
Portfolio turnover | | | 130 | % | | | 101 | % | | | 100 | % | | | 109 | % | | | 141 | % | |
Notes to Financial Highlights
(a) Net investment income per share includes special dividends. The effect of these dividends amounted to $0.39 per share.
(b) Rounds to zero.
(c) In addition to the fees and expenses that the Fund bears directly, the Fund indirectly bears a pro rata share of the fees and expenses of any other funds in which it invests. Such indirect expenses are not included in the Fund's reported expense ratios.
(d) Total net expenses include the impact of certain fee waivers/expense reimbursements made by the Investment Manager and certain of its affiliates, if applicable.
The accompanying Notes to Financial Statements are an integral part of this statement.
Annual Report 2016
27
COLUMBIA MID CAP GROWTH FUND
FINANCIAL HIGHLIGHTS (continued)
| | | Year Ended August 31, | |
Class T | | 2016 | | 2015 | | 2014 | | 2013 | | 2012 | |
Per share data | |
Net asset value, beginning of period | | $ | 28.61 | | | $ | 32.05 | | | $ | 29.82 | | | $ | 26.37 | | | $ | 25.72 | | |
Income from investment operations: | |
Net investment income (loss) | | | (0.06 | ) | | | 0.24 | (a) | | | (0.14 | ) | | | (0.09 | ) | | | (0.07 | ) | |
Net realized and unrealized gain | | | 0.83 | | | | 1.30 | | | | 5.43 | | | | 4.31 | | | | 1.55 | | |
Total from investment operations | | | 0.77 | | | | 1.54 | | | | 5.29 | | | | 4.22 | | | | 1.48 | | |
Less distributions to shareholders: | |
Net investment income | | | (0.25 | ) | | | — | | | | — | | | | — | | | | — | | |
Net realized gains | | | (4.12 | ) | | | (4.98 | ) | | | (3.06 | ) | | | (0.77 | ) | | | (0.83 | ) | |
Total distributions to shareholders | | | (4.37 | ) | | | (4.98 | ) | | | (3.06 | ) | | | (0.77 | ) | | | (0.83 | ) | |
Proceeds from regulatory settlements | | | — | | | | — | | | | — | | | | — | | | | 0.00 | (b) | |
Net asset value, end of period | | $ | 25.01 | | | $ | 28.61 | | | $ | 32.05 | | | $ | 29.82 | | | $ | 26.37 | | |
Total return | | | 2.83 | % | | | 5.34 | % | | | 18.69 | % | | | 16.51 | % | | | 5.94 | % | |
Ratios to average net assets(c) | |
Total gross expenses | | | 1.19 | % | | | 1.20 | % | | | 1.24 | % | | | 1.26 | % | | | 1.28 | % | |
Total net expenses(d) | | | 1.19 | %(e) | | | 1.20 | %(e) | | | 1.24 | %(e) | | | 1.26 | %(e) | | | 1.28 | %(e) | |
Net investment income | | | (0.23 | %) | | | 0.80 | % | | | (0.47 | %) | | | (0.32 | %) | | | (0.28 | %) | |
Supplemental data | |
Net assets, end of period (in thousands) | | $ | 21,346 | | | $ | 22,590 | | | $ | 23,951 | | | $ | 22,027 | | | $ | 20,965 | | |
Portfolio turnover | | | 130 | % | | | 101 | % | | | 100 | % | | | 109 | % | | | 141 | % | |
Notes to Financial Highlights
(a) Net investment income per share includes special dividends. The effect of these dividends amounted to $0.34 per share.
(b) Rounds to zero.
(c) In addition to the fees and expenses that the Fund bears directly, the Fund indirectly bears a pro rata share of the fees and expenses of any other funds in which it invests. Such indirect expenses are not included in the Fund's reported expense ratios.
(d) Total net expenses include the impact of certain fee waivers/expense reimbursements made by the Investment Manager and certain of its affiliates, if applicable.
(e) The benefits derived from expense reductions had an impact of less than 0.01%.
The accompanying Notes to Financial Statements are an integral part of this statement.
Annual Report 2016
28
COLUMBIA MID CAP GROWTH FUND
FINANCIAL HIGHLIGHTS (continued)
| | | Year Ended August 31, | |
Class W | | 2016 | | 2015 | | 2014 | | 2013 | | 2012 | |
Per share data | |
Net asset value, beginning of period | | $ | 28.69 | | | $ | 32.15 | | | $ | 29.91 | | | $ | 26.43 | | | $ | 25.76 | | |
Income from investment operations: | |
Net investment income (loss) | | | (0.06 | ) | | | 0.21 | (a) | | | (0.23 | ) | | | (0.08 | ) | | | (0.05 | ) | |
Net realized and unrealized gain | | | 0.84 | | | | 1.33 | | | | 5.54 | | | | 4.33 | | | | 1.55 | | |
Total from investment operations | | | 0.78 | | | | 1.54 | | | | 5.31 | | | | 4.25 | | | | 1.50 | | |
Less distributions to shareholders: | |
Net investment income | | | (0.26 | ) | | | — | | | | — | | | | — | | | | — | | |
Net realized gains | | | (4.12 | ) | | | (5.00 | ) | | | (3.07 | ) | | | (0.77 | ) | | | (0.83 | ) | |
Total distributions to shareholders | | | (4.38 | ) | | | (5.00 | ) | | | (3.07 | ) | | | (0.77 | ) | | | (0.83 | ) | |
Proceeds from regulatory settlements | | | — | | | | — | | | | — | | | | — | | | | 0.00 | (b) | |
Net asset value, end of period | | $ | 25.09 | | | $ | 28.69 | | | $ | 32.15 | | | $ | 29.91 | | | $ | 26.43 | | |
Total return | | | 2.83 | % | | | 5.32 | % | | | 18.71 | % | | | 16.59 | % | | | 6.01 | % | |
Ratios to average net assets(c) | |
Total gross expenses | | | 1.19 | % | | | 1.19 | % | | | 1.14 | % | | | 1.21 | % | | | 1.22 | % | |
Total net expenses(d) | | | 1.19 | %(e) | | | 1.19 | %(e) | | | 1.14 | %(e) | | | 1.21 | %(e) | | | 1.22 | %(e) | |
Net investment income (loss) | | | (0.24 | %) | | | 0.71 | % | | | (0.69 | %) | | | (0.28 | %) | | | (0.21 | %) | |
Supplemental data | |
Net assets, end of period (in thousands) | | $ | 146 | | | $ | 201 | | | $ | 284 | | | $ | 104,752 | | | $ | 66,704 | | |
Portfolio turnover | | | 130 | % | | | 101 | % | | | 100 | % | | | 109 | % | | | 141 | % | |
Notes to Financial Highlights
(a) Net investment income per share includes special dividends. The effect of these dividends amounted to $0.31 per share.
(b) Rounds to zero.
(c) In addition to the fees and expenses that the Fund bears directly, the Fund indirectly bears a pro rata share of the fees and expenses of any other funds in which it invests. Such indirect expenses are not included in the Fund's reported expense ratios.
(d) Total net expenses include the impact of certain fee waivers/expense reimbursements made by the Investment Manager and certain of its affiliates, if applicable.
(e) The benefits derived from expense reductions had an impact of less than 0.01%.
The accompanying Notes to Financial Statements are an integral part of this statement.
Annual Report 2016
29
COLUMBIA MID CAP GROWTH FUND
FINANCIAL HIGHLIGHTS (continued)
| | | Year Ended August 31, | |
Class Y | | 2016 | | 2015 | | 2014 | | 2013 | | 2012 | |
Per share data | |
Net asset value, beginning of period | | $ | 30.21 | | | $ | 33.53 | | | $ | 31.01 | | | $ | 27.26 | | | $ | 26.46 | | |
Income from investment operations: | |
Net investment income | | | 0.03 | | | | 0.05 | (a) | | | 0.01 | | | | 0.07 | | | | 0.03 | | |
Net realized and unrealized gain | | | 0.91 | | | | 1.71 | | | | 5.66 | | | | 4.45 | | | | 1.60 | | |
Total from investment operations | | | 0.94 | | | | 1.76 | | | | 5.67 | | | | 4.52 | | | | 1.63 | | |
Less distributions to shareholders: | |
Net investment income | | | (0.40 | ) | | | — | | | | — | | | | — | | | | — | | |
Net realized gains | | | (4.12 | ) | | | (5.08 | ) | | | (3.15 | ) | | | (0.77 | ) | | | (0.83 | ) | |
Total distributions to shareholders | | | (4.52 | ) | | | (5.08 | ) | | | (3.15 | ) | | | (0.77 | ) | | | (0.83 | ) | |
Proceeds from regulatory settlements | | | — | | | | — | | | | — | | | | — | | | | 0.00 | (b) | |
Net asset value, end of period | | $ | 26.63 | | | $ | 30.21 | | | $ | 33.53 | | | $ | 31.01 | | | $ | 27.26 | | |
Total return | | | 3.27 | % | | | 5.83 | % | | | 19.24 | % | | | 17.09 | % | | | 6.35 | % | |
Ratios to average net assets(c) | |
Total gross expenses | | | 0.79 | % | | | 0.73 | % | | | 0.75 | % | | | 0.83 | % | | | 0.88 | % | |
Total net expenses(d) | | | 0.79 | % | | | 0.73 | % | | | 0.75 | % | | | 0.83 | % | | | 0.88 | % | |
Net investment income | | | 0.13 | % | | | 0.15 | % | | | 0.02 | % | | | 0.26 | % | | | 0.10 | % | |
Supplemental data | |
Net assets, end of period (in thousands) | | $ | 5,869 | | | $ | 3 | | | $ | 250 | | | $ | 229 | | | $ | 16 | | |
Portfolio turnover | | | 130 | % | | | 101 | % | | | 100 | % | | | 109 | % | | | 141 | % | |
Notes to Financial Highlights
(a) Net investment income per share includes special dividends. The effect of these dividends amounted to $0.04 per share.
(b) Rounds to zero.
(c) In addition to the fees and expenses that the Fund bears directly, the Fund indirectly bears a pro rata share of the fees and expenses of any other funds in which it invests. Such indirect expenses are not included in the Fund's reported expense ratios.
(d) Total net expenses include the impact of certain fee waivers/expense reimbursements made by the Investment Manager and certain of its affiliates, if applicable.
The accompanying Notes to Financial Statements are an integral part of this statement.
Annual Report 2016
30
COLUMBIA MID CAP GROWTH FUND
FINANCIAL HIGHLIGHTS (continued)
| | | Year Ended August 31, | |
Class Z | | 2016 | | 2015 | | 2014 | | 2013 | | 2012 | |
Per share data | |
Net asset value, beginning of period | | $ | 30.03 | | | $ | 33.39 | | | $ | 30.91 | | | $ | 27.23 | | | $ | 26.45 | | |
Income from investment operations: | |
Net investment income (loss) | | | 0.01 | | | | 0.32 | (a) | | | (0.06 | ) | | | (0.00 | )(b) | | | 0.01 | | |
Net realized and unrealized gain | | | 0.87 | | | | 1.36 | | | | 5.66 | | | | 4.45 | | | | 1.60 | | |
Total from investment operations | | | 0.88 | | | | 1.68 | | | | 5.60 | | | | 4.45 | | | | 1.61 | | |
Less distributions to shareholders: | |
Net investment income | | | (0.33 | ) | | | — | | | | — | | | | — | | | | — | | |
Net realized gains | | | (4.12 | ) | | | (5.04 | ) | | | (3.12 | ) | | | (0.77 | ) | | | (0.83 | ) | |
Total distributions to shareholders | | | (4.45 | ) | | | (5.04 | ) | | | (3.12 | ) | | | (0.77 | ) | | | (0.83 | ) | |
Proceeds from regulatory settlements | | | — | | | | — | | | | — | | | | — | | | | 0.00 | (b) | |
Net asset value, end of period | | $ | 26.46 | | | $ | 30.03 | | | $ | 33.39 | | | $ | 30.91 | | | $ | 27.23 | | |
Total return | | | 3.09 | % | | | 5.58 | % | | | 19.07 | % | | | 16.84 | % | | | 6.27 | % | |
Ratios to average net assets(c) | |
Total gross expenses | | | 0.94 | % | | | 0.94 | % | | | 0.94 | % | | | 0.96 | % | | | 0.97 | % | |
Total net expenses(d) | | | 0.94 | %(e) | | | 0.94 | %(e) | | | 0.94 | %(e) | | | 0.96 | %(e) | | | 0.97 | %(e) | |
Net investment income (loss) | | | 0.02 | % | | | 1.01 | % | | | (0.17 | %) | | | (0.01 | %) | | | 0.03 | % | |
Supplemental data | |
Net assets, end of period (in thousands) | | $ | 813,009 | | | $ | 938,781 | | | $ | 1,149,098 | | | $ | 1,196,953 | | | $ | 1,274,026 | | |
Portfolio turnover | | | 130 | % | | | 101 | % | | | 100 | % | | | 109 | % | | | 141 | % | |
Notes to Financial Highlights
(a) Net investment income per share includes special dividends. The effect of these dividends amounted to $0.34 per share.
(b) Rounds to zero.
(c) In addition to the fees and expenses that the Fund bears directly, the Fund indirectly bears a pro rata share of the fees and expenses of any other funds in which it invests. Such indirect expenses are not included in the Fund's reported expense ratios.
(d) Total net expenses include the impact of certain fee waivers/expense reimbursements made by the Investment Manager and certain of its affiliates, if applicable.
(e) The benefits derived from expense reductions had an impact of less than 0.01%.
The accompanying Notes to Financial Statements are an integral part of this statement.
Annual Report 2016
31
COLUMBIA MID CAP GROWTH FUND
NOTES TO FINANCIAL STATEMENTS
August 31, 2016
Note 1. Organization
Columbia Mid Cap Growth Fund (the Fund), a series of Columbia Funds Series Trust I (the Trust), is a diversified fund. The Trust is registered under the Investment Company Act of 1940, as amended (the 1940 Act), as an open-end management investment company organized as a Massachusetts business trust.
Fund Shares
The Trust may issue an unlimited number of shares (without par value). The Fund offers Class A, Class B, Class C, Class I, Class K, Class R, Class R4, Class R5, Class T, Class W, Class Y and Class Z shares. Although all share classes generally have identical voting, dividend and liquidation rights, each share class votes separately when required by the Trust's organizational documents or by law. Different share classes pay different distribution amounts to the extent the expenses of such share classes differ, and distributions in liquidation will be proportional to the net asset value of each share class. Each share class has its own expense and sales charge structure.
Class A shares are subject to a maximum front-end sales charge of 5.75% based on the initial investment amount. Class A shares purchased without an initial sales charge in accounts aggregating $1 million to $50 million at the time of purchase are subject to a contingent deferred sales charge (CDSC) if the shares are sold within 18 months after purchase, charged as follows: 1.00% CDSC if redeemed within 12 months after purchase, and 0.50% CDSC if redeemed more than 12, but less than 18, months after purchase.
Class B shares may be subject to a maximum CDSC of 5.00% based upon the holding period after purchase. Class B shares will generally convert to Class A shares eight years after purchase. The Fund no longer accepts investments by new or existing investors in the Fund's Class B shares, except in connection with the reinvestment of any dividend and/or capital gain distributions in Class B shares of the Fund and exchanges by existing Class B shareholders of certain other funds within the Columbia Family of Funds.
Class C shares are subject to a 1.00% CDSC on shares redeemed within 12 months after purchase.
Class I shares are not subject to sales charges and are available only to the Columbia Family of Funds.
Class K shares are not subject to sales charges, however this share class is closed to new investors.
Class R shares are not subject to sales charges and are generally available only to certain retirement plans and other investors as described in the Fund's prospectus.
Class R4 shares are not subject to sales charges and are generally available only to omnibus retirement plans and certain investors as described in the Fund's prospectus.
Class R5 shares are not subject to sales charges and are generally available only to investors purchasing through authorized investment professionals and omnibus retirement plans.
Class T shares are subject to a maximum front-end sales charge of 5.75% based on the investment amount. Class T shares purchased without an initial sales charge in accounts aggregating $1 million to $50 million at the time of purchase are subject to a CDSC if the shares are sold within 18 months after purchase, charged as follows: 1.00% CDSC if redeemed within 12 months after purchase, and 0.50% CDSC if redeemed more than 12, but less than 18, months after purchase, with certain limitations. Class T shares are available only to investors who received (and who have continuously held) Class T shares in connection with previous fund reorganizations.
Class W shares are not subject to sales charges and are generally available only to investors purchasing through authorized investment programs managed by investment professionals, including discretionary managed account programs.
Class Y shares are not subject to sales charges and are generally available only to certain retirement plans as described in the Fund's prospectus.
Class Z shares are not subject to sales charges and are generally available only to eligible investors, which are subject to different investment minimums as described in the Fund's prospectus.
Note 2. Summary of Significant Accounting Policies
Basis of Preparation
The Fund is an investment company that applies the accounting and reporting guidance in the Financial Accounting Standards Board (FASB) Accounting Standards Codification Topic 946, Financial Services — Investment Companies (ASC 946). The financial statements are prepared in accordance with U.S. generally accepted accounting principles (GAAP), which requires management to make certain estimates and
Annual Report 2016
32
COLUMBIA MID CAP GROWTH FUND
NOTES TO FINANCIAL STATEMENTS (continued)
August 31, 2016
assumptions that affect the reported amounts of assets and liabilities, the disclosure of contingent assets and liabilities at the date of the financial statements and the reported amounts of income and expenses during the reporting period. Actual results could differ from those estimates.
The following is a summary of significant accounting policies followed by the Fund in the preparation of its financial statements.
Security Valuation
All equity securities and exchange-traded funds are valued at the close of business of the New York Stock Exchange (NYSE). Equity securities and exchange-traded funds are valued at the last quoted sales price on the principal exchange or market on which they trade, except for securities traded on the NASDAQ Stock Market, which are valued at the NASDAQ official close price. Unlisted securities or listed securities for which there were no sales during the day are valued at the mean of the latest quoted bid and ask prices on such exchanges or markets.
Foreign equity securities are valued based on the closing price on the foreign exchange in which such securities are primarily traded. If any foreign equity security closing prices are not readily available, the securities are valued at the mean of the latest quoted bid and ask prices on such exchanges or markets. Foreign currency exchange rates are generally determined at 4:00 p.m. Eastern (U.S.) time. Many securities markets and exchanges outside the U.S. close prior to the close of the NYSE; therefore, the closing prices for securities in such markets or on such exchanges may not fully reflect events that occur after such close but before the close of the NYSE. In those situations, foreign securities will be fair valued pursuant to a policy adopted by the Board of Trustees (the Board), including, if available, utilizing a third party pricing service to determine these fair values. The third party pricing service takes into account multiple factors, including, but not limited to, movements in the U.S. securities markets, certain depositary receipts, futures contracts and foreign exchange rates that have occurred subsequent to the close of the foreign exchange or market, to determine a good faith estimate that reasonably reflects the current market conditions as of the close of the NYSE. The fair value of a security is likely to be different from the quoted or published price, if available.
Investments in open-end investment companies, including money market funds, are valued at their latest net asset value.
Investments for which market quotations are not readily available, or that have quotations which management believes are not reflective of market value or reliable, are valued at fair value as determined in good faith under procedures approved by and under the general supervision of the Board. If a security or class of securities (such as foreign securities) is valued at fair value, such value is likely to be different from the quoted or published price for the security.
The determination of fair value often requires significant judgment. To determine fair value, management may use assumptions including but not limited to future cash flows and estimated risk premiums. Multiple inputs from various sources may be used to determine fair value.
GAAP requires disclosure regarding the inputs and valuation techniques used to measure fair value and any changes in valuation inputs or techniques. In addition, investments shall be disclosed by major category. This information is disclosed following the Fund's Portfolio of Investments.
Security Transactions
Security transactions are accounted for on the trade date. Cost is determined and gains (losses) are based upon the specific identification method for both financial statement and federal income tax purposes.
Income Recognition
Corporate actions and dividend income are generally recorded net of any non-reclaimable tax withholdings, on the ex-dividend date or upon receipt of ex-dividend notification in the case of certain foreign securities.
The Fund may receive distributions from holdings in equity securities, business development companies (BDCs), exchange-traded funds, other regulated investment companies (RICs), and real estate investment trusts (REITs), which report information on the tax character of their distributions annually. These distributions are allocated to dividend income, capital gain and return of capital based on actual information reported. Return of capital is recorded as a reduction of the cost basis of securities held. If the Fund no longer owns the applicable securities, return of capital is recorded as a realized gain. With respect to REITs, to the extent actual information has not yet been reported,
Annual Report 2016
33
COLUMBIA MID CAP GROWTH FUND
NOTES TO FINANCIAL STATEMENTS (continued)
August 31, 2016
estimates for return of capital are made by the Fund's management. Management's estimates are subsequently adjusted when the actual character of the distributions is disclosed by the REITs, which could result in a proportionate change in return of capital to shareholders.
Awards from class action litigation are recorded as a reduction of cost basis if the Fund still owns the applicable securities on the payment date. If the Fund no longer owns the applicable securities, the proceeds are recorded as realized gains.
Expenses
General expenses of the Trust are allocated to the Fund and other funds of the Trust based upon relative net assets or other expense allocation methodologies determined by the nature of the expense. Expenses directly attributable to the Fund are charged to the Fund. Expenses directly attributable to a specific class of shares are charged to that share class.
Determination of Class Net Asset Value
All income, expenses (other than class-specific expenses, which are charged to that share class, as shown in the Statement of Operations) and realized and unrealized gains (losses) are allocated to each class of the Fund on a daily basis, based on the relative net assets of each class, for purposes of determining the net asset value of each class.
Federal Income Tax Status
The Fund intends to qualify each year as a regulated investment company under Subchapter M of the Internal Revenue Code, as amended, and will distribute substantially all of its taxable income (including net short-term capital gains), if any, for its tax year, and as such will not be subject to federal income taxes. In addition, the Fund intends to distribute in each calendar year substantially all of its net investment income, capital gains and certain other amounts, if any, such that the Fund should not be subject to federal excise tax. Therefore, no federal income or excise tax provision is recorded.
Distributions to Shareholders
Distributions from net investment income, if any, are declared and paid annually. Net realized capital gains, if any, are distributed along with the income distribution. Income distributions and capital gain distributions are
determined in accordance with federal income tax regulations, which may differ from GAAP.
Guarantees and Indemnifications
Under the Trust's organizational documents and, in some cases, by contract, its officers and trustees are indemnified against certain liabilities arising out of the performance of their duties to the Trust or its funds. In addition, certain of the Fund's contracts with its service providers contain general indemnification clauses. The Fund's maximum exposure under these arrangements is unknown since the amount of any future claims that may be made against the Fund cannot be determined, and the Fund has no historical basis for predicting the likelihood of any such claims.
Note 3. Fees and Other Transactions with Affiliates
Management Services Fees
Effective January 1, 2016, the Fund entered into a Management Agreement with Columbia Management Investment Advisers, LLC (the Investment Manager), a wholly-owned subsidiary of Ameriprise Financial, Inc. (Ameriprise Financial). Under the Management Agreement, the Investment Manager provides the Fund with investment research and advice, as well as administrative and accounting services. The management services fee is an annual fee that is equal to a percentage of the Fund's average daily net assets that declines from 0.82% to 0.65% as the Fund's net assets increase. Prior to January 1, 2016, the Fund paid the Investment Manager an annual fee for advisory services under an Investment Management Services Agreement and a separate annual fee for administrative and accounting services under an Administrative Services Agreement. The effective management services fee rate for the year ended August 31, 2016 (reflecting all advisory and administrative services fees paid to the Investment Manager) was 0.75% of the Fund's average daily net assets. For the period from September 1, 2015 through December 31, 2015, the investment advisory services fee paid to the Investment Manager was $4,700,583, and the administrative services fee paid to the Investment Manager was $365,736.
Compensation of Board Members
Board members, who are not officers or employees of the Investment Manager or Ameriprise Financial, are compensated for their services to the Fund as disclosed in the Statement of Operations. These Board members
Annual Report 2016
34
COLUMBIA MID CAP GROWTH FUND
NOTES TO FINANCIAL STATEMENTS (continued)
August 31, 2016
may participate in a Deferred Compensation Plan (the Plan) which may be terminated at any time. Obligations of the Plan will be paid solely out of the Fund's assets, and all amounts payable under the Plan constitute a general unsecured obligation of the Fund.
Compensation of Chief Compliance Officer
The Board has appointed a Chief Compliance Officer to the Fund in accordance with federal securities regulations. The Fund is allocated a portion of the expenses associated with the Chief Compliance Officer based on relative net assets of the Trust.
Transfer Agency Fees
Under a Transfer and Dividend Disbursing Agent Agreement, Columbia Management Investment Services Corp. (the Transfer Agent), an affiliate of the Investment Manager and a wholly-owned subsidiary of Ameriprise Financial, is responsible for providing transfer agency services to the Fund. The Transfer Agent has contracted with Boston Financial Data Services (BFDS) to serve as sub-transfer agent. The Transfer Agent pays the fees of BFDS for services as sub-transfer agent and BFDS is not entitled to reimbursement for such fees from the Fund (with the exception of out-of-pocket fees).
The Fund pays the Transfer Agent a monthly transfer agency fee based on the number or the average value of accounts, depending on the type of account. In addition, prior to October 1, 2016, the Transfer Agent also received sub-transfer agency fees based on a percentage of the average aggregate value of the Fund's shares maintained in omnibus accounts (other than omnibus accounts for which American Enterprise Investment Services Inc. is the broker of record or accounts where the beneficial shareholder is a customer of Ameriprise Financial Services, Inc., for which the Transfer Agent receives a per account fee). Effective October 1, 2016, the Fund pays the Transfer Agent a fee for shareholder services based on the number of accounts or on a percentage of the average aggregate value of the Fund's shares maintained in omnibus accounts up to the lesser of the amount charged by the servicing agent or a cap established by the Board from time to time.
The Transfer Agent also receives compensation from the Fund for various shareholder services and reimbursements for certain out-of-pocket fees. Total transfer agency fees for Class K and Class R5 shares are subject to an annual limitation of not more than 0.05% of the average daily net assets attributable to
each share class. Class I and Class Y shares do not pay transfer agency fees.
For the year ended August 31, 2016, the Fund's effective transfer agency fee rates as a percentage of average daily net assets of each class were as follows:
Class A | | | 0.16 | % | |
Class B | | | 0.16 | | |
Class C | | | 0.16 | | |
Class K | | | 0.05 | | |
Class R | | | 0.16 | | |
Class R4 | | | 0.16 | | |
Class R5 | | | 0.05 | | |
Class T | | | 0.16 | | |
Class W | | | 0.16 | | |
Class Z | | | 0.16 | | |
The Fund and certain other associated investment companies have severally, but not jointly, guaranteed the performance and observance of all the terms and conditions of a lease entered into by Seligman Data Corp. (SDC), the former transfer agent, including the payment of rent by SDC (the Guaranty). SDC was the legacy Seligman funds' former transfer agent.
The lease and the Guaranty expire in January 2019. At August 31, 2016, the Fund's total potential future obligation over the life of the Guaranty is $94,620. The liability remaining at August 31, 2016 for non-recurring charges associated with the lease amounted to $53,784 and is recorded as a part of the payable for other expenses in the Statement of Assets and Liabilities. SDC is owned by six associated investment companies, including the Fund. The Fund's ownership interest in SDC at August 31, 2016 is recorded as a part of other assets in the Statement of Assets and Liabilities at a cost of $2,199, which approximates the fair value of the ownership interest.
An annual minimum account balance fee of $20 may apply to certain accounts with a value below the applicable share class's initial minimum investment requirements to reduce the impact of small accounts on transfer agency fees. These minimum account balance fees are remitted to the Fund and recorded as part of expense reductions in the Statement of Operations. For the year ended August 31, 2016, these minimum account balance fees reduced total expenses of the Fund by $5,685.
Annual Report 2016
35
COLUMBIA MID CAP GROWTH FUND
NOTES TO FINANCIAL STATEMENTS (continued)
August 31, 2016
Plan Administration Fees
Under a Plan Administration Services Agreement with the Transfer Agent, the Fund pays an annual fee at a rate of 0.25% of the Fund's average daily net assets attributable to Class K shares for the provision of various administrative, recordkeeping, communication and educational services.
Distribution and Service Fees
The Fund has an agreement with Columbia Management Investment Distributors, Inc. (the Distributor), an affiliate of the Investment Manager and a wholly-owned subsidiary of Ameriprise Financial, for distribution and shareholder services. The Board has approved, and the Fund has adopted, distribution and shareholder service plans (the Plans) applicable to certain share classes, which set the distribution and service fees for the Fund. These fees are calculated daily and are intended to compensate the Distributor and/or eligible selling and/or servicing agents for selling shares of the Fund and providing services to investors.
Under the Plans, the Fund pays a monthly service fee to the Distributor at the maximum annual rate of 0.25% of the average daily net assets attributable to Class A, Class B, Class C and Class W shares of the Fund. Also under the Plans, the Fund pays a monthly distribution fee to the Distributor at the maximum annual rates of 0.10%, 0.75%, 0.75%, 0.50% and 0.25% of the average daily net assets attributable to Class A, Class B, Class C, Class R and Class W shares of the Fund, respectively.
Although the Fund may pay distribution and service fees up to a maximum annual rate of 0.35% of the Fund's average daily net assets attributable to Class A shares (comprised of up to 0.10% for distribution services and up to 0.25% for shareholder liaison services), the Fund currently limits such fees to an aggregate fee of not more than 0.25% of the Fund's average daily net assets attributable to Class A shares.
Although the Fund may pay a distribution fee up to 0.25% of the Fund's average daily net assets attributable to Class W shares and a service fee of up to 0.25% of the Fund's average daily net assets attributable to Class W shares, the aggregate fee shall not exceed 0.25% of the Fund's average daily net assets attributable to Class W shares.
Shareholder Services Fees
The Fund has adopted a shareholder services plan that permits it to pay for certain services provided to Class T shareholders by their selling and/or servicing agents.
The Fund may pay shareholder servicing fees up to an aggregate annual rate of 0.50% of the Fund's average daily net assets attributable to Class T shares (comprised of up to 0.25% for shareholder liaison services and up to 0.25% for administrative support services). These fees are currently limited to an aggregate annual rate of not more than 0.25% of the Fund's average daily net assets attributable to Class T shares.
Sales Charges
Sales charges, including front-end charges and CDSCs, received by the Distributor for distributing Fund shares were $355,184 for Class A, $728 for Class B, $2,110 for Class C, and $736 for Class T shares for the year ended August 31, 2016.
Expenses Waived/Reimbursed by the Investment Manager and its Affiliates
The Fund's expense ratio is subject to an expense reimbursement arrangement pursuant to which fees will be waived and/or expenses reimbursed (excluding certain fees and expenses described below), so that the Fund's net operating expenses, after giving effect to fees waived/expenses reimbursed and any balance credits and/or overdraft charges from the Fund's custodian, do not exceed the annual rates of:
| | | Contractual
Expense Cap
January 1, 2016
Through
December 31, 2016 | | Voluntary
Expense Cap
Prior to
January 1, 2016 | |
Class A | | | 1.25 | % | | | 1.30 | % | |
Class B | | | 2.00 | | | | 2.05 | | |
Class C | | | 2.00 | | | | 2.05 | | |
Class I | | | 0.88 | | | | 0.92 | | |
Class K | | | 1.18 | | | | 1.22 | | |
Class R | | | 1.50 | | | | 1.55 | | |
Class R4 | | | 1.00 | | | | 1.05 | | |
Class R5 | | | 0.93 | | | | 0.97 | | |
Class T | | | 1.25 | | | | 1.30 | | |
Class W | | | 1.25 | | | | 1.30 | | |
Class Y | | | 0.88 | | | | 0.92 | | |
Class Z | | | 1.00 | | | | 1.05 | | |
The contractual agreement may be modified or amended only with approval from the Investment Manager, certain of its affiliates and the Fund. Under the arrangements, the following fees and expenses are excluded from the waiver/reimbursement commitment, and therefore will be paid by the Fund, if applicable: taxes (including foreign
Annual Report 2016
36
COLUMBIA MID CAP GROWTH FUND
NOTES TO FINANCIAL STATEMENTS (continued)
August 31, 2016
transaction taxes), expenses associated with investments in affiliated and non-affiliated pooled investment vehicles (including mutual funds and exchange-traded funds), transaction costs and brokerage commissions, costs related to any securities lending program, dividend and interest expenses associated with securities sold short, inverse floater program fees and expenses, transaction charges and interest on borrowed money, interest and infrequent and/or unusual expenses. Any fees waived and/or expenses reimbursed under the expense reimbursement arrangements described above are not recoverable by the Investment Manager or its affiliates in future periods.
Note 4. Federal Tax Information
The timing and character of income and capital gain distributions are determined in accordance with income tax regulations, which may differ from GAAP because of temporary or permanent book to tax differences.
At August 31, 2016, these differences are primarily due to differing treatment for capital loss carryforwards, deferral/reversal of wash sale losses, Trustees' deferred compensation, distribution reclassifications, net operating loss reclassification, late-year ordinary losses and re-characterization of distributions for investments. To the extent these differences are permanent, reclassifications are made among the components of the Fund's net assets in the Statement of Assets and Liabilities. Temporary differences do not require reclassifications.
In the Statement of Assets and Liabilities the following reclassifications were made:
Excess of distributions over net investment income | | $ | 1,989,950 | | |
Accumulated net realized gain | | | 314,049 | | |
Paid-in capital | | | (2,303,999 | ) | |
Net investment income (loss) and net realized gains (losses), as disclosed in the Statement of Operations, and net assets were not affected by this reclassification.
The tax character of distributions paid during the years indicated was as follows:
Year Ended August 31, | | 2016 | | 2015 | |
Ordinary income | | $ | 19,042,210 | | | $ | 26,626,338 | | |
Long-term capital gains | | | 284,984,885 | | | | 312,287,096 | | |
Total | | $ | 304,027,095 | | | $ | 338,913,434 | | |
Short-term capital gain distributions, if any, are considered ordinary income distributions for tax purposes.
At August 31, 2016, the components of distributable earnings on a tax basis were as follows:
Undistributed long-term capital gains | | $ | 67,621,699 | | |
Net unrealized appreciation | | | 335,999,965 | | |
At August 31, 2016, the cost of investments for federal income tax purposes was $1,519,754,050 and the aggregate gross unrealized appreciation and depreciation based on that cost was:
Unrealized appreciation | | $ | 352,969,143 | | |
Unrealized depreciation | | | (16,969,178 | ) | |
Net unrealized appreciation | | $ | 335,999,965 | | |
For the year ended August 31, 2016, $27,342,442 of capital loss carryforward was utilized and $317,512 was permanently lost.
Under current tax rules, regulated investment companies can elect to treat certain late-year ordinary losses incurred and post-October capital losses (capital losses realized after October 31) as arising on the first day of the following taxable year. As of August 31, 2016, the Fund will elect to treat late-year ordinary losses of $677,606 as arising on September 1, 2016.
Management of the Fund has concluded that there are no significant uncertain tax positions in the Fund that would require recognition in the financial statements. However, management's conclusion may be subject to review and adjustment at a later date based on factors including, but not limited to, new tax laws, regulations, and administrative interpretations (including relevant court decisions). Generally, the Fund's federal tax returns for the prior three fiscal years remain subject to examination by the Internal Revenue Service.
Note 5. Portfolio Information
The cost of purchases and proceeds from sales of securities, excluding short-term investments and derivatives, if any, aggregated to $2,391,417,788 and $2,603,336,969, respectively, for the year ended August 31, 2016. The amount of purchase and sale activity impacts the portfolio turnover rate reported in the Financial Highlights.
Note 6. Affiliated Money Market Fund
The Fund invests in Columbia Short-Term Cash Fund, an affiliated money market fund established for the exclusive use by the Fund and other affiliated funds (the Affiliated MMF). The income earned by the Fund from such investments is included as Dividends — affiliated issuers in the Statement of Operations. As an investing fund, the Fund indirectly bears its proportionate share of
Annual Report 2016
37
COLUMBIA MID CAP GROWTH FUND
NOTES TO FINANCIAL STATEMENTS (continued)
August 31, 2016
the expenses of the Affiliated MMF. Effective October 1, 2016, the Affiliated MMF prices its shares with a floating net asset value (NAV) and no longer seeks to maintain a stable NAV. In addition, the Board of the Affiliated MMF may impose a fee on redemptions (sometimes referred to as a liquidity fee) or temporarily suspend redemptions (sometimes referred to as imposing a redemption gate) in the event its liquidity falls below regulatory limits.
Note 7. Line of Credit
The Fund has access to a revolving credit facility whereby the Fund may borrow for the temporary funding of shareholder redemptions or for other temporary or emergency purposes. Effective December 8, 2015, Citibank, N.A. and HSBC Bank USA, N.A. joined JPMorgan Chase Bank, N.A. (JPMorgan) as lead of a syndicate of banks under the credit facility, which is a collective agreement between the Fund and certain other funds managed by the Investment Manager, severally and not jointly, that permits collective borrowings up to $1 billion. Interest is charged to each participating fund based on its borrowings at a rate equal to the higher of (i) the overnight federal funds rate plus 1.00% or (ii) the one-month LIBOR rate plus 1.00%. Each borrowing under the credit facility matures no later than 60 days after the date of borrowing. The Fund also pays a commitment fee equal to its pro rata share of the amount of the credit facility at a rate of 0.15% per annum. The commitment fee is included in other expenses in the Statement of Operations. Prior to December 8, 2015, JPMorgan was the sole lead bank under the credit facility agreement that permitted borrowings up to $550 million under the same terms and interest rates as described above with the exception of the commitment fee which was charged at a rate of 0.075% per annum.
The Fund had no borrowings during the year ended August 31, 2016.
Note 8. Significant Risks
Shareholder Concentration Risk
At August 31, 2016, one unaffiliated shareholder of record owned 11.4% of the outstanding shares of the Fund in one or more accounts. The Fund has no knowledge about whether any portion of those shares was owned beneficially. Affiliated shareholders of record owned 33.1% of the outstanding shares of the Fund in one or more accounts. Subscription and redemption activity by concentrated accounts may have a significant effect on the operations of the Fund. In the case of a large redemption, the Fund may be forced to sell investments at inopportune times, including its liquid or
more liquid positions, resulting in Fund losses and the Fund holding a higher percentage of less liquid or illiquid securities. Large redemptions could result in decreased economies of scale and increased operating expenses for non-redeeming Fund shareholders.
Consumer Discretionary Sector Risk
The Fund may be more susceptible to the particular risks that may affect companies in the consumer discretionary sector than if it were invested in a wider variety of companies in unrelated sectors. Companies in the consumer discretionary sector are subject to certain risks, including fluctuations in the performance of the overall domestic and international economy, interest rate changes, increased competition and consumer confidence. Performance of such companies may be affected by factors including reduced disposable household income, reduced consumer spending, changing demographics and consumer tastes.
Technology and Technology-related Investment Risk
The Fund may be more susceptible to the particular risks that may affect companies in the information technology sector, as well as other technology-related sectors (collectively, the technology sectors) than if it were invested in a wider variety of companies in unrelated sectors. Companies in the technology sectors are subject to certain risks, including the risk that new services, equipment or technologies will not be accepted by consumers and businesses or will become rapidly obsolete. Performance of such companies may be affected by factors including obtaining and protecting patents (or the failure to do so) and significant competitive pressures, including aggressive pricing of their products or services, new market entrants, competition for market share and short product cycles due to an accelerated rate of technological developments. Such competitive pressures may lead to limited earnings and/or falling profit margins. As a result, the value of their securities may fall. In addition, many technology sector companies have limited operating histories and prices of these companies' securities historically have been more volatile than other securities, especially over the short term.
Note 9. Subsequent Events
Management has evaluated the events and transactions that have occurred through the date the financial statements were issued and noted no items requiring adjustment of the financial statements or additional disclosure.
Annual Report 2016
38
COLUMBIA MID CAP GROWTH FUND
NOTES TO FINANCIAL STATEMENTS (continued)
August 31, 2016
Note 10. Information Regarding Pending and Settled Legal Proceedings
Ameriprise Financial and certain of its affiliates have historically been involved in a number of legal, arbitration and regulatory proceedings, including routine litigation, class actions, and governmental actions, concerning matters arising in connection with the conduct of their business activities. Ameriprise Financial believes that the Funds are not currently the subject of, and that neither Ameriprise Financial nor any of its affiliates are the subject of, any pending legal, arbitration or regulatory proceedings that are likely to have a material adverse effect on the Funds or the ability of Ameriprise Financial or its affiliates to perform under their contracts with the Funds. Ameriprise Financial is required to make quarterly (10-Q), annual (10-K) and, as necessary, 8-K filings with the Securities and Exchange Commission (SEC) on legal and regulatory matters that relate to Ameriprise Financial and its affiliates. Copies of these filings may be obtained by accessing the SEC website at www.sec.gov.
There can be no assurance that these matters, or the adverse publicity associated with them, will not result in increased fund redemptions, reduced sale of fund shares or other adverse consequences to the Funds. Further, although we believe proceedings are not likely to have a material adverse effect on the Funds or the ability of Ameriprise Financial or its affiliates to perform under their contracts with the Funds, these proceedings are subject to uncertainties and, as such, we are unable to estimate the possible loss or range of loss that may result. An adverse outcome in one or more of these proceedings could result in adverse judgments, settlements, fines, penalties or other relief that could have a material adverse effect on the consolidated financial condition or results of operations of Ameriprise Financial.
Annual Report 2016
39
COLUMBIA MID CAP GROWTH FUND
REPORT OF INDEPENDENT REGISTERED PUBLIC ACCOUNTING FIRM
To the Trustees of Columbia Funds Series Trust I and the Shareholders of
Columbia Mid Cap Growth Fund
In our opinion, the accompanying statement of assets and liabilities, including the portfolio of investments, and the related statements of operations and of changes in net assets and the financial highlights present fairly, in all material respects, the financial position of Columbia Mid Cap Growth Fund (the "Fund," a series of Columbia Funds Series Trust I) at August 31, 2016, and the results of its operations, the changes in its net assets and the financial highlights for each of the periods indicated, in conformity with accounting principles generally accepted in the United States of America. These financial statements and financial highlights (hereafter referred to as "financial statements") are the responsibility of the Fund's management. Our responsibility is to express an opinion on these financial statements based on our audits. We conducted our audits of these financial statements in accordance with the standards of the Public Company Accounting Oversight Board (United States). Those standards require that we plan and perform the audit to obtain reasonable assurance about whether the financial statements are free of material misstatement. An audit includes examining, on a test basis, evidence supporting the amounts and disclosures in the financial statements, assessing the accounting principles used and significant estimates made by management, and evaluating the overall financial statement presentation. We believe that our audits, which included confirmation of securities at August 31, 2016 by correspondence with the custodian, brokers and transfer agent, provide a reasonable basis for our opinion.
PricewaterhouseCoopers LLP
Minneapolis, MN
October 21, 2016
Annual Report 2016
40
COLUMBIA MID CAP GROWTH FUND
FEDERAL INCOME TAX INFORMATION
(Unaudited)
The Fund hereby designates the following tax attributes for the fiscal year ended August 31, 2016. Shareholders will be notified in early 2017 of the amounts for use in preparing 2016 income tax returns.
Tax Designations
| Qualified Dividend Income | | | 100.00 | % | |
| Dividends Received Deduction | | | 100.00 | % | |
Capital Gain Dividend | | $ | 82,350,417 | | |
Qualified Dividend Income. For taxable, non-corporate shareholders, the percentage of ordinary income distributed during the fiscal year that represents qualified dividend income subject to reduced tax rates.
Dividends Received Deduction. The percentage of ordinary income distributed during the fiscal year that qualifies for the corporate dividends received deduction.
Capital Gain Dividend. The Fund designates as a capital gain dividend the amount reflected above, or if subsequently determined to be different, the net capital gain of such fiscal period.
Annual Report 2016
41
COLUMBIA MID CAP GROWTH FUND
Shareholders elect the Board that oversees the Fund's operations. The Board appoints officers who are responsible for day-to-day business decisions based on policies set by the Board. The following table provides basic biographical information about the Fund's Trustees, including their principal occupations during the past five years, although specific titles for individuals may have varied over the period. The year set forth beneath Length of Service in the table below is the year in which the Trustee was first appointed or elected as Trustee to any Fund currently in the Columbia Funds Complex or a predecessor thereof. Under current Board policy, members serve terms of indefinite duration.
Trustees
Independent Trustees
Name,
Address,
Year of Birth | | Position Held With
the Trust and Length of
Service | | Principal Occupation(s)
During the Past Five Years
and Other Relevant
Professional Experience | | Number of
Funds in the
Columbia Funds
Complex
Overseen | | Other Directorships
Held by Trustee During
the Past Five Years | |
Janet Langford Carrig
c/o Columbia
Management Investment Advisers, LLC,
225 Franklin Street
Mail Drop BX32 05228,
Boston, MA 02110
1957 | | Trustee 1996 | | Senior Vice President, General Counsel and Corporate Secretary, ConocoPhillips (integrated energy company) since September 2007 | | 56 | | None | |
Douglas A. Hacker
c/o Columbia Management Investment Advisers, LLC,
225 Franklin Street
Mail Drop BX32 05228,
Boston, MA 02110
1955 | | Trustee and Chairman of the Board 1996 | | Independent business executive since May 2006; Executive Vice President — Strategy of United Airlines from December 2002 to May 2006; President of UAL Loyalty Services (airline marketing company) from September 2001 to December 2002; Executive Vice President and Chief Financial Officer of United Airlines from July 1999 to September 2001 | | 56 | | Spartan Nash Company (food distributor); Nash Finch Company (food distributor) from 2005 to 2013; Aircastle Limited (aircraft leasing); SeaCube Container Leasing Ltd. (container leasing) from 2010 to 2013; and Travelport Worldwide Limited (travel information technology) | |
Nancy T. Lukitsh
c/o Columbia Management Investment Advisers, LLC,
225 Franklin Street
Mail Drop BX32 05228,
Boston, MA 02110
1956 | | Trustee 2011 | | Senior Vice President, Partner and Director of Marketing, Wellington Management Company, LLP (investment adviser) from 1997 to 2010; Chair, Wellington Management Portfolios (commingled non-U.S. investment pools) from 2007 to 2010; Director, Wellington Trust Company, NA and other Wellington affiliates from 1997 to 2010 | | 56 | | None | |
Annual Report 2016
42
COLUMBIA MID CAP GROWTH FUND
TRUSTEES AND OFFICERS (continued)
Independent Trustees (continued)
Name,
Address,
Year of Birth | | Position Held With
the Trust and Length of
Service | | Principal Occupation(s)
During the Past Five Years
and Other Relevant
Professional Experience | | Number of
Funds in the
Columbia Funds
Complex
Overseen | | Other Directorships
Held by Trustee During
the Past Five Years | |
William E. Mayer
c/o Columbia Management Investment Advisers, LLC,
225 Franklin Street
Mail Drop BX32 05228,
Boston, MA 02110
1940 | | Trustee 1991 | | Partner, Park Avenue Equity Partners (private equity) since February 1999 | | 56 | | DynaVox Inc. (speech creation); Lee Enterprises (print media); WR Hambrecht + Co. (financial service provider) from 2000 to 2012; BlackRock Capital Investment Corporation (investment company); and Premier, Inc. (healthcare) | |
David M. Moffett
c/o Columbia Management Investment Advisers, LLC,
225 Franklin Street
Mail Drop BX32 05228,
Boston, MA 02110
1952 | | Trustee 2011 | | Retired. Consultant to Bridgewater and Associates | | 56 | | Director of CIT Bank, CIT Group Inc. (commercial and consumer finance); eBay Inc. (online trading community); Genworth Financial, Inc. (financial and insurance products and services); Paypal Holdings Inc. (payment and data processing services); and Trustee University of Oklahoma Foundation | |
Charles R. Nelson
c/o Columbia Management Investment Advisers, LLC,
225 Franklin Street
Mail Drop BX32 05228,
Boston, MA 02110
1942 | | Trustee 1981 | | Retired. Professor Emeritus, University of Washington since 2011; Professor of Economics, University of Washington from 1976 to 2011; Ford and Louisa Van Voorhis Professor of Political Economy, University of Washington from 1993 to 2011; Adjunct Professor of Statistics, University of Washington from 1980 to 2011; Associate Editor, Journal of Money, Credit and Banking from September 1993 to 2008; consultant on econometric and statistical matters | | 56 | | None | |
John J. Neuhauser
c/o Columbia Management Investment Advisers, LLC,
225 Franklin Street
Mail Drop BX32 05228,
Boston, MA 02110
1943 | | Trustee 1984 | | President, Saint Michael's College since August 2007; Director or Trustee of several non-profit organizations, including University of Vermont Medical Center; Academic Vice President and Dean of Faculties, Boston College from August 1999 to October 2005; University Professor, Boston College from November 2005 to August 2007 | | 56 | | Liberty All-Star Equity Fund and Liberty All-Star Growth Fund (closed-end funds) | |
Annual Report 2016
43
COLUMBIA MID CAP GROWTH FUND
TRUSTEES AND OFFICERS (continued)
Independent Trustees (continued)
Name,
Address,
Year of Birth | | Position Held With
the Trust and Length of
Service | | Principal Occupation(s)
During the Past Five Years
and Other Relevant
Professional Experience | | Number of
Funds in the
Columbia Funds
Complex
Overseen | | Other Directorships
Held by Trustee During
the Past Five Years | |
Patrick J. Simpson
c/o Columbia Management Investment Advisers, LLC,
225 Franklin Street
Mail Drop BX32 05228,
Boston, MA 02110
1944 | | Trustee 2000 | | Of Counsel, Perkins Coie LLP (law firm) since 2015; Partner, Perkins Coie LLP from 1988 to 2014 | | 56 | | None | |
Anne-Lee Verville
c/o Columbia Management Investment Advisers, LLC,
225 Franklin Street
Mail Drop BX32 05228,
Boston, MA 02110
1945 | | Trustee 1998 | | Retired. General Manager, Global Education Industry from 1994 to 1997, President — Application Systems Division from 1991 to 1994, Chief Financial Officer — US Marketing & Services from 1988 to 1991, and Chief Information Officer from 1987 to 1988, IBM Corporation (computer and technology) | | 56 | | Enesco Group, Inc. (producer of giftware and home and garden decor products) from 2001 to 2006 | |
Consultant to the Trustees*
Name,
Address,
Year of Birth | | Position Held With
the Trust and Length of
Service | | Principal Occupation(s)
During the Past Five Years
and Other Relevant
Professional Experience | | Number of
Funds in the
Columbia Funds
Complex
Overseen | | Other Directorships
Held by Trustee During
the Past Five Years | |
J. Kevin Connaughton
c/o Columbia
Management Investment Advisers, LLC,
225 Franklin Street
Mail Drop BX32 05228,
Boston, MA 02110
1964 | | Trustee Consultant 2016 | | Trustee Consultant, Columbia Funds since March 2016; Managing Director and General Manager of Mutual Fund Products, Columbia Management Investment Advisers, LLC from May 2010 to February 2015; President, Columbia Funds from 2009 to 2015; and senior officer of Columbia Funds and affiliated funds from 2003 to 2015 | | 56 | | Board of Governors, Gateway Healthcare since January 2016; Trustee, New Century Portfolios since March 2015; and Director, The Autism Project since March 2015 | |
* J. Kevin Connaughton was appointed consultant to the Trustees effective March 1, 2016. Shareholders of the Funds are expected to be asked to elect Mr. Connaughton as a Trustee at a future shareholder meeting.
Annual Report 2016
44
COLUMBIA MID CAP GROWTH FUND
TRUSTEES AND OFFICERS (continued)
Interested Trustee Affiliated with Investment Manager*
Name,
Address,
Year of Birth | | Position Held With
the Trust and Length of
Service | | Principal Occupation(s)
During the Past Five Years
and Other Relevant
Professional Experience | | Number of
Funds in the
Columbia Funds
Complex
Overseen | | Other Directorships
Held by Trustee During
the Past Five Years | |
William F. Truscott
c/o Columbia Management Investment Advisers, LLC,
225 Franklin Street
Boston, MA 02110
1960 | | Trustee 2012 | | Chairman of the Board and President, Columbia Management Investment Advisers, LLC since May 2010 and February 2012, respectively; Chief Executive Officer, Global Asset Management, Ameriprise Financial, Inc. since September 2012 (previously Chief Executive Officer, U.S. Asset Management & President, Annuities, May 2010- September 2012); Director and Chief Executive Officer, Columbia Management Investment Distributors, Inc. since May 2010 and February 2012, respectively; Chairman of the Board and Chief Executive Officer, RiverSource Distributors, Inc. since 2006; Director, Threadneedle Asset Management Holdings, SARL since 2014; President and Chief Executive Officer, Ameriprise Certificate Company, 2006-August 2012. | | 184 | | Trustee to other Columbia Funds since 2001; Chairman of the Board, Columbia Management Investment Advisers, LLC since May 2010; Director, Columbia Management Investment Distributors, Inc. since May 2010; Former Director, Ameriprise Certificate Company, 2006-January 2013 | |
* Interested person (as defined under the 1940 Act) by reason of being an officer, director, security holder and/or employee of the Investment Manager or Ameriprise Financial.
The Statement of Additional Information has additional information about the Fund's Board members and is available, without charge, upon request by calling 800.345.6611; contacting your financial intermediary; or visiting investor.columbiathreadneedleus.com.
Annual Report 2016
45
COLUMBIA MID CAP GROWTH FUND
TRUSTEES AND OFFICERS (continued)
The Board has appointed officers who are responsible for day-to-day business decisions based on policies it has established. The officers serve at the pleasure of the Board. The following table provides basic information about the Officers of the Fund, including principal occupations during the past five years, although their specific titles may have varied over the period. In addition to Mr. Truscott, who is Senior Vice President, the Fund's other officers are:
Fund Officers
Name,
Address and
Year of Birth | | Position and Year
First Appointed to
Position for any Fund
in the Columbia
Funds Complex or a
Predecessor Thereof | |
Principal Occupation(s) During Past Five Years | |
Christopher O. Petersen
5228 Ameriprise Financial Center
Minneapolis, MN 55474
Born 1970 | | President and Principal Executive Officer (2015) | | Vice President and Lead Chief Counsel, Ameriprise Financial, Inc. since January 2015 (previously, Vice President and Chief Counsel January 2010-December 2014; officer of Columbia Funds and affiliated funds since 2007. | |
Michael G. Clarke
225 Franklin Street
Boston, MA 02110
Born 1969 | | Treasurer (2011), Chief Financial Officer (2009) and Chief Accounting Officer (2015) | | Vice President — Mutual Fund Administration, Columbia Management Investment Advisers, LLC, since May 2010; senior officer of Columbia Funds and affiliated funds since 2002. | |
Paul B. Goucher
100 Park Avenue
New York, NY 10017
Born 1968 | | Senior Vice President (2011), Chief Legal Officer (2015) and Assistant Secretary (2008) | | Vice President and Lead Chief Counsel, Ameriprise Financial, Inc. since November 2008 and January 2013, respectively (previously Chief Counsel, January 2010-January 2013); Vice President, Chief Legal Officer and Assistant Secretary, Columbia Management Investment Advisers, LLC since May 2010. | |
Thomas P. McGuire
225 Franklin Street
Boston, MA 02110
Born 1972 | | Senior Vice President and Chief Compliance Officer (2012) | | Vice President — Asset Management Compliance, Ameriprise Financial, Inc., since May 2010; Chief Compliance Officer, Ameriprise Certificate Company since September 2010. | |
Colin Moore
225 Franklin Street
Boston, MA 02110
Born 1958 | | Senior Vice President (2010) | | Executive Vice President and Global Chief Investment Officer, Ameriprise Financial, Inc., since July 2013; Executive Vice President and Global Chief Investment Officer, Columbia Management Investment Advisers, LLC since July 2013 (previously Director and Global Chief Investment Officer, 2010-2013). | |
Michael E. DeFao
225 Franklin Street
Boston, MA 02110
Born 1968 | | Vice President (2011) and Assistant Secretary (2010) | | Vice President and Chief Counsel, Ameriprise Financial, Inc. since May 2010. | |
Amy Johnson
5228 Ameriprise Financial Center
Minneapolis, MN 55474
Born 1965 | | Vice President (2006) | | Managing Director and Global Head of Operations, Columbia Management Investment Advisers, LLC since April 2016 (previously Managing Director and Chief Operating Officer, 2010-2016). | |
Lyn Kephart-Strong
5228 Ameriprise
Financial Center
Minneapolis, MN 55474
Born 1960 | | Vice President (2015) | | President, Columbia Management Investment Services Corp. since October 2014; Vice President & Resolution Officer, Ameriprise Trust Company since August 2009. | |
Ryan C. Larrenaga
225 Franklin Street
Boston, MA 02110
Born 1970 | | Vice President and Secretary (2015) | | Vice President and Group Counsel, Ameriprise Financial, Inc. since August 2011; officer of Columbia Funds and affiliated funds since 2005. | |
Annual Report 2016
46
COLUMBIA MID CAP GROWTH FUND
BOARD CONSIDERATION AND APPROVAL OF MANAGEMENT
AGREEMENT
On June 10, 2016, the Board of Trustees (the Board) and the Trustees who are not interested persons (as defined in the Investment Company Act of 1940) (the Independent Trustees) of Columbia Funds Series Trust I (the Trust) unanimously approved the continuation of the Management Agreement (the Management Agreement) with Columbia Management Investment Advisers, LLC (the Investment Manager) with respect to Columbia Mid Cap Growth Fund (the Fund), a series of the Trust. As detailed below, the Board's Advisory Fees and Expenses Committee (the Committee) and the Board met on multiple occasions to review and discuss, both among themselves and with the management team of the Investment Manager, materials provided by the Investment Manager and others before determining to approve the continuation of the Management Agreement.
In connection with their deliberations regarding the continuation of the Management Agreement, the Committee and the Board evaluated materials requested from the Investment Manager regarding the Fund and the Management Agreement, and discussed these materials with representatives of the Investment Manager at Committee meetings held on March 8, 2016, April 27, 2016 and June 9, 2016 and at Board meetings held on March 9, 2016 and June 10, 2016. In addition, the Board considers matters bearing on the Management Agreement at most of its other meetings throughout the year and meets regularly with senior management of the Trust and the Investment Manager. Through the Board's Investment Oversight Committees, Trustees also meet with selected portfolio managers of the funds the Trustees oversee and other investment personnel at various times throughout the year. The Committee and the Board also consulted with its independent fee consultant, Fund counsel and with the Independent Trustees' independent legal counsel, who advised on various matters with respect to the Committee's and the Board's considerations and otherwise assisted the Committee and the Board in their deliberations. On June 9, 2016, the Committee recommended that the Board approve the continuation of the Management Agreement. On June 10, 2016, the Board, including the Independent Trustees, voting separately, unanimously approved the continuation of the Management Agreement for the Fund.
The Committee and the Board considered all information that they, their legal counsel or the Investment Manager believed reasonably necessary to evaluate and to determine whether to recommend for approval or approve the continuation of the Management Agreement. The information and factors considered by the Committee and the Board in recommending for approval or approving the continuation of the Management Agreement for the Fund included the following:
• Information on the investment performance of the Fund relative to the performance of a group of mutual funds determined to be comparable to the Fund by an independent third-party data provider, as well as performance relative to benchmarks;
• Information on the Fund's management fees and total expenses, including information comparing the Fund's expenses to those of a group of comparable mutual funds, as determined by the independent third-party data provider;
• The Investment Manager's agreement to contractually limit or cap total operating expenses for the Fund through December 31, 2017 so that total operating expenses (excluding certain fees and expenses, such as transaction costs and certain other investment related expenses, interest, taxes, acquired fund fees and expenses, and infrequent and/or unusual expenses) would not exceed a specified annual rate, as a percentage of the Fund's net assets;
• The terms and conditions of the Management Agreement;
• The current and proposed terms and conditions of other agreements and arrangements with affiliates of the Investment Manager relating to the operations of the Fund, including agreements with respect to the provision of distribution and transfer agency services to the Fund;
• Descriptions of various functions performed by the Investment Manager under the Management Agreement, including portfolio management and portfolio trading practices;
• Information regarding the management fees of similarly-managed portfolios of other clients of the Investment Manager, including institutional separate accounts;
Annual Report 2016
47
COLUMBIA MID CAP GROWTH FUND
BOARD CONSIDERATION AND APPROVAL OF MANAGEMENT
AGREEMENT (continued)
• Information regarding the reputation, regulatory history and resources of the Investment Manager, including information regarding senior management, portfolio managers and other personnel;
• Information regarding the capabilities of the Investment Manager with respect to compliance monitoring services, including an assessment of the Investment Manager's compliance system by the Fund's Chief Compliance Officer; and
• The profitability to the Investment Manager and its affiliates from their relationships with the Fund.
Nature, Extent and Quality of Services Provided under the Management Agreement
The Committee and the Board considered the nature, extent and quality of services provided to the Fund by the Investment Manager and its affiliates under the Management Agreement and under separate agreements for the provision of transfer agency services, and the resources dedicated to the Fund and the other Columbia Funds by the Investment Manager and its affiliates. The Committee and the Board considered, among other things, the Investment Manager's ability to attract, motivate and retain highly qualified research, advisory and supervisory investment professionals (including personnel and other resources, compensation programs for personnel involved in fund management, reputation and other attributes), the portfolio management services provided by those investment professionals, and the quality of the Investment Manager's investment research capabilities and trade execution services. The Committee and the Board also considered the potential benefits to shareholders of investing in a mutual fund that is part of a fund complex offering exposure to a variety of asset classes and investment disciplines and providing a variety of fund and shareholder services.
The Committee and the Board also considered the professional experience and qualifications of the senior personnel of the Investment Manager, which included consideration of the Investment Manager's experience with similarly-structured funds. The Committee and the Board noted the compliance programs of and the compliance-related resources provided to the Fund by the Investment Manager and its affiliates, and considered the Investment Manager's ability to provide administrative services to the Fund and coordinate the activities of the Fund's other service providers. After reviewing these and related factors, the Committee and the Board concluded, within the context of their overall conclusions, that the nature, extent and quality of the services provided to the Fund under the Management Agreement supported the continuation of the Management Agreement.
Investment Performance
The Committee and the Board reviewed information about the performance of the Fund over various time periods, including performance information relative to benchmarks and information based on reports of the independent third-party data provider that compared the performance of the Fund to the performance of a group of comparable mutual funds, and data provided by the independent fee consultant. The Committee and the Board also reviewed a description of the third party's methodology for identifying the Fund's peer groups for purposes of performance and expense comparisons. Although the Fund's performance lagged that of a relevant peer group for certain (although not necessarily all) periods, the Committee and the Board concluded that other factors relevant to performance were sufficient, in light of other considerations, to warrant continuation of the Management Agreement. Those factors included one or more of the following: (i) that the Fund's performance, although lagging in certain recent periods, was stronger over the longer term; (ii) that the underperformance was attributable, to a significant extent, to investment decisions that were reasonable and consistent with the Fund's investment strategy and policies and that the Fund was performing within a reasonable range of expectations, given those investment decisions, market conditions and the Fund's investment strategy; (iii) that the Fund's performance was competitive when compared to other relevant performance benchmarks or peer groups; and (iv) that the Investment Manager had taken or was taking steps designed to help improve the Fund's investment performance, including, but not limited to, replacing portfolio managers, enhancing the resources supporting the portfolio managers, or modifying investment strategies.
The Committee and the Board noted that, through December 31, 2015, the Fund's performance was in the seventh, thirty-eighth and sixty-fifth percentile (where the best performance would be in the first percentile) of its
Annual Report 2016
48
COLUMBIA MID CAP GROWTH FUND
BOARD CONSIDERATION AND APPROVAL OF MANAGEMENT
AGREEMENT (continued)
category selected by the independent third-party data provider for the purposes of performance comparisons for the one-, three- and five-year periods, respectively.
The Committee and the Board also considered the Investment Manager's performance and reputation generally, the Investment Manager's historical responsiveness to Board concerns about performance, and the Investment Manager's willingness to take steps intended to improve performance. After reviewing these and related factors, the Committee and the Board concluded, within the context of their overall conclusions, that the performance of the Fund and the Investment Manager was sufficient, in light of other considerations, to warrant the continuation of the Management Agreement.
Investment Management Fee Rates and Other Expenses
The Committee and the Board considered the management fees charged to the Fund under the Management Agreement as well as the total expenses incurred by the Fund. In assessing the reasonableness of the fees under the Management Agreement, the Committee and the Board considered, among other information, the Fund's management fee and its total expense ratio as a percentage of average daily net assets. The Committee and the Board considered data provided by the independent fee consultant. The Committee and the Board noted that, as of December 31, 2015, the Fund's actual management fee and net total expense ratio are both ranked in the second quintile (where the lowest fees and expenses would be in the first quintile) against the Fund's expense universe as determined by the independent third-party data provider for purposes of expense comparison. The Committee and the Board also took into account the fee waiver and expense limitation arrangements agreed to by the Investment Manager, as noted above.
The Committee and the Board also received and considered information about the management fees charged by the Investment Manager to institutional separate accounts. In considering the fees charged to those accounts, the Committee and the Board took into account, among other things, the Investment Manager's representations about the differences between managing mutual funds as compared to other types of accounts, including differences in the services provided, differences in the risk profile of such business for the Investment Manager and the additional resources required to manage mutual funds effectively. The Committee and the Board also received and considered information about the fees charged by the Investment Manager for sub-advisory services provided to comparable unaffiliated funds. In evaluating the Fund's management fees, the Committee and the Board also took into account the demands, complexity and quality of the investment management of the Fund.
After reviewing these and related factors, the Committee and the Board concluded, within the context of their overall conclusions, that the management fee rates and expenses of the Fund were sufficient, in light of other considerations, to warrant the continuation of the Management Agreement.
Costs of Services Provided and Profitability
The Committee and the Board also took note of the costs the Investment Manager and its affiliates incur in connection with the services provided (both on an absolute and relative basis) and the profitability to the Investment Manager and its affiliates in connection with their relationships with the Fund.
The Committee and the Board also considered the compensation directly or indirectly received by the Investment Manager's affiliates in connection with their relationships with the Fund. The Committee and the Board reviewed information provided by management as to the profitability to the Investment Manager and its affiliates of their relationships with the Fund, information about the allocation of expenses used to calculate profitability, and comparisons of profitability levels realized in 2015 to profitability levels realized in 2014. When reviewing profitability, the Committee and the Board also considered court cases in which adviser profitability was an issue in whole or in part, the performance of similarly managed funds, the performance of the Fund, and the expense ratio of the Fund. In addition, the Committee and the Board considered information provided by the Investment Manager regarding the Investment Manager's financial condition and comparing its profitability to that of other asset management firms that are, or are subsidiaries of, publicly traded companies. In this regard, the Committee and the Board also considered data provided by the independent fee consultant.
Annual Report 2016
49
COLUMBIA MID CAP GROWTH FUND
BOARD CONSIDERATION AND APPROVAL OF MANAGEMENT
AGREEMENT (continued)
After reviewing these and related factors, the Committee and the Board concluded, within the context of their overall conclusions, that the costs of services provided and the profitability to the Investment Manager and its affiliates from their relationships with the Fund supported the continuation of the Management Agreement.
Economies of Scale
The Committee and the Board considered the potential existence of economies of scale in the provision by the Investment Manager of services to the Fund, to groups of related funds, and to the Investment Manager's investment advisory clients as a whole, and whether those economies of scale were shared with the Fund through breakpoints in investment management fees or other means, such as expense limitation arrangements and additional investments by the Investment Manager in investment, trading and compliance resources. The Committee and the Board noted that the management fee schedules for the Fund contained breakpoints that would reduce the fee rate on assets above specified threshold levels.
In considering these matters, the Committee and the Board also considered the costs of the services provided and the profitability to the Investment Manager and its affiliates from their relationships with the Fund, as discussed above. After reviewing these and related factors, the Committee and the Board concluded, within the context of their overall conclusions, that the extent to which any economies of scale were expected to be shared with the Fund supported the continuation of the Management Agreement.
Other Benefits to the Investment Manager
The Committee and the Board received and considered information regarding "fall-out" or ancillary benefits received by the Investment Manager and its affiliates as a result of their relationships with the Fund, such as the engagement of the Investment Manager's affiliates to provide distribution, transfer agency and shareholder services to the Fund. In this regard, among other matters, the Committee and the Board considered that the Fund's distributor retains a portion of the distribution fees from the Fund and receives a portion of the sales charges on sales or redemptions of certain classes of shares of the Fund. The Committee and the Board also considered the benefits of research made available to the Investment Manager by reason of brokerage commissions generated by the Fund's securities transactions, and reviewed information about the Investment Manager's practices with respect to allocating portfolio transactions for brokerage and research services. The Committee and the Board considered the possible conflicts of interest associated with certain fall-out or other ancillary benefits and the reporting, disclosure and other processes that are in place to address such possible conflicts of interest. The Committee and the Board recognized that the Investment Manager's profitability would be somewhat lower without these benefits.
Conclusion
The Committee and the Board reviewed all of the above considerations in reaching their decisions to recommend or approve the continuation of the Management Agreement. In their deliberations, the Trustees did not identify any particular information that was all-important or controlling, and individual Trustees may have attributed different weights to the various factors. Based on their evaluation of all factors that they deemed to be material, including those factors described above, and assisted by the advice of independent legal counsel, the Board, including the Independent Trustees, voting separately, unanimously approved the continuation of the Management Agreement.
Annual Report 2016
50
COLUMBIA MID CAP GROWTH FUND
IMPORTANT INFORMATION ABOUT THIS REPORT
Each fund mails one shareholder report to each shareholder address. If you would like more than one report, please call shareholder services at 800.345.6611 and additional reports will be sent to you.
The policy of the Board is to vote the proxies of the companies in which each fund holds investments consistent with the procedures as stated in the Statement of Additional Information (SAI). You may obtain a copy of the SAI without charge by calling 800.345.6611; contacting your financial intermediary; visiting investor.columbiathreadneedleus.com; or searching the website of the Securities and Exchange Commission (SEC) at sec.gov. Information regarding how each fund voted proxies relating to portfolio securities is filed with the SEC by August 31st for the most recent 12-month period ending June 30th of that year, and is available without charge by visiting investor.columbiathreadneedleus.com, or searching the website of the SEC at sec.gov.
Each fund files a complete schedule of portfolio holdings with the SEC for the first and third quarters of each fiscal year on Form N-Q. Each fund's Form N-Q is available on the SEC's website at sec.gov and may be reviewed and copied at the SEC's Public Reference Room in Washington, D.C. Information on the operation of the Public Reference Room may be obtained by calling 800.SEC.0330. Each fund's complete schedule of portfolio holdings, as filed on Form N-Q, can also be obtained without charge, upon request, by calling 800.345.6611.
Annual Report 2016
51
Columbia Mid Cap Growth Fund
P.O. Box 8081
Boston, MA 02266-8081

Please read and consider the investment objectives, risks, charges and expenses for any fund carefully before investing. For a prospectus and summary prospectus, which contains this and other important information about the Fund, go to investor.columbiathreadneedleus.com. The Fund is distributed by Columbia Management Investment Distributors, Inc., member FINRA, and managed by Columbia Management Investment Advisers, LLC.
Columbia Threadneedle Investments (Columbia Threadneedle) is the global brand name of the Columbia and Threadneedle group of companies.
All rights reserved. Columbia Management Investment Distributors, Inc., 225 Franklin Street, Boston, MA 02110-2804
© 2016 Columbia Management Investment Advisers, LLC.
investor.columbiathreadneedleus.com
ANN194_08_F01_(10/16)

ANNUAL REPORT
August 31, 2016

COLUMBIA SMALL CAP GROWTH FUND I

 Dear Shareholders,
Volatility comes with the territory for long-term investors. Some investors instinctively want to pull out of the market or sell underperforming investments at the first sign of increased volatility or perhaps even as soon as they perceive it on the horizon. But taking yourself out of the market could mean losing out on potential opportunities, and putting your longer term investment goals at risk.
Cumulative return is not just about achieving high returns when markets are going up; it's also about remaining invested and minimizing losses during weak or volatile markets so that you can participate on the upside. Developing a deeper understanding of the various risks your portfolio is subject to can help you balance these risks.
Diversification is critical in seeking to achieve that balance. We believe that most portfolios could be more effectively diversified either by introducing holdings with performance profiles unrelated to existing holdings (like alternative products) or by rebalancing existing holdings with an eye toward risk allocation. Over time, distributing risk more evenly may produce a more pronounced diversification benefit and may improve portfolio efficiency. We believe market volatility can create significant opportunities and, in fact, these periods may be some of the very best times to invest.
With this in mind, I thought it important to highlight excerpts from a piece written by Colin Moore, Global Chief Investment Officer, in which he touches on some of these issues emphasizing the importance of a properly constructed portfolio in seeking to effectively manage volatility and to achieve consistency of returns. I encourage you to read the article in its entirety. To access the full article and for other insights on current market, please visit blog.columbiathreadneedleus.com/latest-perspectives.
You need investments that are designed to help you ease the impact of volatile market environments and keep the savings you have worked tirelessly to amass. Columbia Threadneedle Investments provides investment solutions to help you tackle financial challenges and achieve your desired outcome.
Best regards,

Christopher O. Petersen
President, Columbia Funds
Excerpts from:
Taking the scare out of the volatility bogeyman
By Colin Moore, Global Chief Investment Officer
Colin Moore is the global chief investment officer for Columbia Threadneedle Investments. His responsibilities include ensuring that a disciplined investment process is in place across all asset classes, including equity and fixed income. Mr. Moore joined one of the Columbia Threadneedle Investments legacy firms in 2002 as head of equity and was also head of fixed income and liquidity strategies from 2009 – 2010.

n In today's low growth, higher volatility world, the emphasis is shifting from maximization of returns to consistency of returns.
PRESIDENT'S MESSAGE (continued)
n Portfolios should represent the behavioral risk-return tradeoff of investors, remembering that they won't stay invested to realize the return if we get the risk tolerance wrong.
n Holding long-term savings in cash to avoid volatility (the financial equivalent of hiding under the sheets) is detrimental to achieving long-term goals.
According to Wikipedia, "The bogeyman is a common allusion to a mythical creature in many cultures used to control behavior. This monster has no specific appearance, and conceptions about it can vary drastically from household to household within the same community; in many cases he has no set appearance in the mind of an adult or child, but is simply a non-specific embodiment of terror." Different cultures have different names and physical representations for the bogeyman, and investors are no different. We have terrible monsters that we fear may destroy our portfolios, and we call one of the scariest of them volatility.
While the bogeyman is mythical (I hope!), volatility is real and can cause serious damage. To understand why investors have such a hard time coping with volatility, we first need to define three cognitive biases at work in today's investment environment:
1) Recency bias — something that has recently come to the forefront of our attention, regardless of how long established it is, suddenly seems to appear with improbable frequency.
2) Negativity bias — we tend to have a greater recall of unpleasant memories than positive memories.
3) Loss aversion — our dissatisfaction with losing money tends to be greater than our satisfaction with making money.
The level of volatility varies dramatically, and so does investor fear and panic selling — waxing when volatility rises, waning when it falls. Recent studies have pointed to demographics as an important driver of panic selling. The theory is that as people get closer to retirement, the prospects of a large (20% – 30%) loss in financial assets can have a much more pronounced effect on their sense of well-being. Wealth preservation instincts kick in much more quickly than for younger (and typically less wealthy) savers.
The reality is that there is little opportunity for return without volatility. Therefore, the bogeyman effect of holding long-term savings in cash to avoid volatility (the financial equivalent of hiding under the sheets) is detrimental to achieving long-term goals. This effect tends to be more pronounced during the episodic spikes in volatility. The significant spike in volatility in 2008 and 2009 led to significant withdrawals from long-term investment funds over the same period. Less pronounced effects can also be seen when comparing 2001 – 2003 and 2011 – 2012. Conversely, flows picked up when volatility returned to "normal" levels. Investor behavior of this type is consistent with the three behavioral biases.
I believe average volatility will be higher over the next 10 years than the last 10 years and episodic spikes will increase in frequency because sustainable economic growth will be structurally lower and geopolitical risk higher than any time since World War II. Low growth creates uncertainty while loss aversion will make investors fear that we are one economic mishap or geopolitical event away from no growth or recession. The result will be higher volatility on average. Negativity bias will tend to exacerbate "spike" reactions to event-driven geopolitical news, and the volatility bogeyman will appear more often. Assuming the behavioral biases continue, investor returns are likely to be very disappointing regardless of the total return generated by financial markets due to the bogeyman effect.
To mitigate this effect, we need to focus on portfolio construction and an improved understanding of diversification. I accept that equities are likely to offer the highest return over the next 10 years, but they also offer the highest volatility. Many portfolio construction optimization tools use historical average volatility, which is likely to underestimate the volatility investors will face. The bogeyman emerges when individual asset class volatility spikes and cross correlations rise, the combination of which increases overall portfolio volatility far beyond expectation. Diversification is meant to protect investors against volatility, but what's the point of owning lots of investments if the volatility bogeyman has not been properly estimated?
Most importantly, portfolios should be constructed to properly represent the behavioral risk-return trade off of investors, remembering that they won't stay invested to realize the return if we get the risk tolerance wrong. In a low growth, higher volatility world, the emphasis is shifting to return consistency rather than return maximization,
PRESIDENT'S MESSAGE (continued)
and investors are best served through investment approaches that appreciate that distinction. Even though it's a permanent feature of financial markets, volatility is less likely to be the bogeyman we all fear if portfolios are constructed with this understanding.
Please visit blog.columbiathreadneedleus.com/latest-perspectives to read the entire article.
Investors should consider the investment objectives, risks, charges and expenses of a mutual fund carefully before investing. For a free prospectus and summary prospectus, which contains this and other important information about a fund, visit investor.columbiathreadneedleus.com. The prospectus should be read carefully before investing.
The views expressed are as of April 2016, may change as market or other conditions change, and may differ from views expressed by other Columbia Management Investment Advisers, LLC (CMIA) associates or affiliates. Actual investments or investment decisions made by CMIA and its affiliates, whether for its own account or on behalf of clients, will not necessarily reflect the views expressed. This information is not intended to provide investment advice and does not account for individual investor circumstances. Investment decisions should always be made based on an investor's specific financial needs, objectives, goals, time horizon and risk tolerance. Asset classes described may not be suitable for all investors.
Past performance does not guarantee future results, and no forecast should be considered a guarantee either. Since economic and market conditions change frequently, there can be no assurance that the trends described here will continue or that the forecasts are accurate.
Diversification does not guarantee a profit or protect against loss.
Columbia Funds are distributed by Columbia Management Investment Distributors, Inc., member FINRA, and managed by Columbia Management Investment Advisers, LLC.
© 2016 Columbia Management Investment Advisers, LLC. All rights reserved.
COLUMBIA SMALL CAP GROWTH FUND I
Performance Overview | | | 2 | | |
Manager Discussion of Fund Performance | | | 4 | | |
Understanding Your Fund's Expenses | | | 6 | | |
Portfolio of Investments | | | 7 | | |
Statement of Assets and Liabilities | | | 12 | | |
Statement of Operations | | | 14 | | |
Statement of Changes in Net Assets | | | 15 | | |
Financial Highlights | | | 18 | | |
Notes to Financial Statements | | | 28 | | |
Report of Independent Registered Public Accounting Firm | | | 36 | | |
Federal Income Tax Information | | | 37 | | |
Trustees and Officers | | | 38 | | |
Board Consideration and Approval of Management Agreement | | | 43 | | |
Important Information About This Report | | | 47 | | |
Fund Investment Manager
Columbia Management Investment
Advisers, LLC
225 Franklin Street
Boston, MA 02110
Fund Distributor
Columbia Management Investment
Distributors, Inc.
225 Franklin Street
Boston, MA 02110
Fund Transfer Agent
Columbia Management Investment
Services Corp.
P.O. Box 8081
Boston, MA 02266-8081
For more information about any of the funds, please visit investor.columbiathreadneedleus.com or call 800.345.6611. Customer Service Representatives are available to answer your questions Monday through Friday from 8 a.m. to 7 p.m. Eastern time.
The views expressed in this report reflect the current views of the respective parties. These views are not guarantees of future performance and involve certain risks, uncertainties and assumptions that are difficult to predict, so actual outcomes and results may differ significantly from the views expressed. These views are subject to change at any time based upon economic, market or other conditions and the respective parties disclaim any responsibility to update such views. These views may not be relied on as investment advice and, because investment decisions for a Columbia fund are based on numerous factors, may not be relied on as an indication of trading intent on behalf of any particular Columbia fund. References to specific securities should not be construed as a recommendation or investment advice.
COLUMBIA SMALL CAP GROWTH FUND I
Performance Summary
n Columbia Small Cap Growth Fund I (the Fund) Class A shares returned 2.88% excluding sales charges for the 12 months that ended August 31, 2016.
n During the same time period, the Fund underperformed its growth benchmark, the Russell 2000 Growth Index, which returned 3.55%, and its broader-based benchmark, the Russell 2000 Index, which returned 8.59%.
n Stock selection in information technology and industrials generally accounted for the Fund's underperformance relative to its growth benchmark. An underweight in telecommunication services also detracted from relative results.
Average Annual Total Returns (%) (for period ended August 31, 2016)
| | | Inception | | 1 Year | | 5 Years | | 10 Years | |
Class A | | 11/01/05 | | | | | | | | | |
Excluding sales charges | | | | | 2.88 | | | | 10.12 | | | | 7.69 | | |
Including sales charges | | | | | -3.04 | | | | 8.82 | | | | 7.05 | | |
Class B | | 11/01/05 | | | | | | | | | |
Excluding sales charges | | | | | 2.10 | | | | 9.29 | | | | 6.88 | | |
Including sales charges | | | | | -0.87 | | | | 9.15 | | | | 6.88 | | |
Class C | | 11/01/05 | | | | | | | | | |
Excluding sales charges | | | | | 2.12 | | | | 9.31 | | | | 6.88 | | |
Including sales charges | | | | | 1.53 | | | | 9.31 | | | | 6.88 | | |
Class I* | | 09/27/10 | | | 3.29 | | | | 10.61 | | | | 8.08 | | |
Class K* | | 02/28/13 | | | 3.02 | | | | 10.28 | | | | 7.84 | | |
Class R* | | 09/27/10 | | | 2.61 | | | | 9.84 | | | | 7.43 | | |
Class R4* | | 11/08/12 | | | 3.15 | | | | 10.41 | | | | 7.97 | | |
Class R5* | | 02/28/13 | | | 3.24 | | | | 10.57 | | | | 8.04 | | |
Class Y* | | 07/15/09 | | | 3.30 | | | | 10.60 | | | | 8.09 | | |
Class Z | | 10/01/96 | | | 3.15 | | | | 10.40 | | | | 7.96 | | |
Russell 2000 Growth Index | | | | | 3.55 | | | | 13.02 | | | | 8.20 | | |
Russell 2000 Index | | | | | 8.59 | | | | 12.85 | | | | 7.04 | | |
Returns for Class A are shown with and without the maximum initial sales charge of 5.75%. Returns for Class B are shown with and without the applicable contingent deferred sales charge (CDSC) of 5.00% in the first year, declining to 1.00% in the sixth year and eliminated thereafter. Returns for Class C are shown with and without the 1.00% CDSC for the first year only. The Fund's other classes are not subject to sales charges and have limited eligibility. Please see the Fund's prospectus for details. Performance for different share classes will vary based on differences in sales charges and fees associated with each class. All results shown assume reinvestment of distributions during the period. Returns do not reflect the deduction of taxes that a shareholder may pay on Fund distributions or on the redemption of Fund shares. Performance results reflect the effect of any fee waivers or reimbursements of Fund expenses by Columbia Management Investment Advisers, LLC and/or any of its affiliates. Absent these fee waivers or expense reimbursement arrangements, performance results would have been lower.
The performance information shown represents past performance and is not a guarantee of future results. The investment return and principal value of your investment will fluctuate so that your shares, when redeemed, may be worth more or less than their original cost. Current performance may be lower or higher than the performance information shown. You may obtain performance information current to the most recent month-end by contacting your financial intermediary, visiting investor.columbiathreadneedleus.com or calling 800.345.6611.
*The returns shown for periods prior to the share class inception date (including returns for the Life of the Fund, if shown, which are since Fund inception) include the returns of the Fund's oldest share class. These returns are adjusted to reflect any higher class-related operating expenses of the newer share classes, as applicable. Please visit investor.columbiathreadneedleus.com/investment-products/mutual-funds/appended-performance for more information.
The Russell 2000 Growth Index, an unmanaged index, measures the performance of those Russell 2000 Index companies with higher price-to-book ratios and higher forecasted growth values.
The Russell 2000 Index measures the performance of the small-cap segment of the U.S. equity universe. The Russell 2000 is a subset of the Russell 3000 Index representing approximately 10% of the total market capitalization of that index. It includes approximately 2000 of the smallest securities based on a combination of their market cap and current index membership.
Indices are not available for investment, are not professionally managed and do not reflect sales charges, fees, brokerage commissions, taxes or other expenses of investing. Securities in the Fund may not match those in an index.
Annual Report 2016
2
COLUMBIA SMALL CAP GROWTH FUND I
PERFORMANCE OVERVIEW (continued)
Performance of a Hypothetical $10,000 Investment (September 1, 2006 – August 31, 2016)

The chart above shows the change in value of a hypothetical $10,000 investment in Class A shares of Columbia Small Cap Growth Fund I during the stated time period, and does not reflect the deduction of taxes that a shareholder may pay on Fund distributions or on the redemption of Fund shares.
Annual Report 2016
3
COLUMBIA SMALL CAP GROWTH FUND I
MANAGER DISCUSSION OF FUND PERFORMANCE
Portfolio Management
Daniel Cole, CFA
Wayne Collette, CFA
Lawrence Lin, CFA
Rahul Narang
Morningstar Style BoxTM
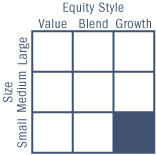
The Morningstar Style BoxTM is based on a fund's portfolio holdings. For equity funds, the vertical axis shows the market capitalization of the stocks owned, and the horizontal axis shows investment style (value, blend, or growth). Information shown is based on the most recent data provided by Morningstar.
© 2016 Morningstar, Inc. All rights reserved. The Morningstar information contained herein: (1) is proprietary to Morningstar and/or its content providers; (2) may not be copied or distributed; and (3) is not warranted to be accurate, complete or timely. Neither Morningstar nor its content providers are responsible for any damages or losses arising from any use of this information.
Top Ten Holdings (%)
(at August 31, 2016) | |
Starz, Class A | | | 2.3 | | |
Euronet Worldwide, Inc. | | | 1.7 | | |
Sonic Corp. | | | 1.6 | | |
Amsurg Corp. | | | 1.6 | | |
Liberty TripAdvisor
Holdings, Inc., Class A | | | 1.5 | | |
NuVasive, Inc. | | | 1.5 | | |
Sprouts Farmers Market, Inc. | | | 1.5 | | |
Beacon Roofing Supply, Inc. | | | 1.4 | | |
CyrusOne, Inc. | | | 1.4 | | |
BroadSoft, Inc. | | | 1.3 | | |
Percentages indicated are based upon total investments (excluding Money Market Funds).
For further detail about these holdings, please refer to the section entitled "Portfolio of Investments."
For the 12-month period that ended August 31, 2016, the Fund's Class A shares returned 2.88% excluding sales charges. During the same time period, the Fund underperformed its growth benchmark, the Russell 2000 Growth Index, which returned 3.55%, and its broader-based benchmark, the Russell 2000 Index, which returned 8.59%. Stock selection in information technology and industrials generally accounted for the Fund's underperformance relative to its growth benchmark. An underweight in telecommunication services also detracted from relative results.
Stocks Logged Gains in Volatile Market
Lackluster economic growth, contentious geopolitical conflicts and expectations of a shift in U.S. monetary policy weighed on investors in the first half of the 12-month period. In December 2015, the Federal Reserve (the Fed) raised the target range of its benchmark interest rate by a quarter of a point. But the Fed took no further action as subpar global economic growth continued and mixed economic data undermined confidence at home.
The U.S. economy, however, continued to expand modestly throughout the period, and economic growth in Europe picked up, if ever so slightly. After an earlier slump, the U.S. manufacturing sector regained some traction in the spring, and the U.S. labor markets recovered to full employment for the first time since the Great Recession, despite occasional weaker reports on new job growth. The vote by the United Kingdom to exit the European Union gave markets a jolt in mid-June, but that downdraft was short lived.
Against this backdrop, stocks pulled back three times during the 12-month period. The S&P 500 Index, a broad measure of U.S. stock market performance, rose 12.55% despite these downdrafts. Large-cap stocks outperformed mid- and small-cap stocks. Value stocks outperformed growth stocks, with an especially big advantage for mid-cap and small-cap value stocks versus their growth counterparts.
Contributors and Detractors
Stock selection was strong in the energy and financials sectors relative to the Fund's growth benchmark. Within energy, Oasis Petroleum, an exploration and production company that focuses on the acquisition and development of unconventional oil and natural gas resources, benefited from a rebound in oil prices during the second half of the period. The company also beat earnings expectations, which it attributed to improved operational and capital efficiency. We sold the Fund's shares in Oasis Petroleum before the close of the reporting period. In the financials sector, MarketAxess Holdings posted strong market share gains in the United States and European markets. The company operates as an electronic trading platform that allows investment professionals to trade corporate bonds and other fixed-income securities. It also provides data and analytical tools that help clients make trading decisions and facilitate the trading process. STORE Capital, a net-lease real estate investment trust, also logged a solid gain. The company posted positive sales and earnings growth and increased its dividend payment.
Annual Report 2016
4
COLUMBIA SMALL CAP GROWTH FUND I
MANAGER DISCUSSION OF FUND PERFORMANCE (continued)
Stock selection in the information technology and industrials sectors detracted from Fund performance. Shares of Barracuda Networks, which provides security, networking and storage products based on network appliances and cloud services, were dragged down on concerns that the company has been slow to make the transition from hardware to cloud-based solutions. We sold the Fund's shares in Barracuda Networks during the first half of the reporting period. Elsewhere in the portfolio, Allegiant Travel, which focuses on travel services to residents of small, underserved U.S. cities, was hurt by declining air travel. In the health care sector, clinical stage biotech company bluebird bio was dragged down by a wide sell-off in biotechnology. Shares of bluebird fell further out of favor on news that a competitor had completed successful trials for a therapy treating sickle cell disease. Further, bluebird posted a second-quarter net loss of $58.8 million — more than Wall Street had expected.
Fund Strategy
Our fundamental research process favors higher quality companies with a history of generating returns on capital that exceed their cost of capital, sustainable growth prospects and strong management teams. We seek to identify stocks with one or more of the key types of competitive advantage that we have categorized. We closely monitor the overall risk characteristics of the strategy versus the growth benchmark and seek to manage the risk profile within predefined limits around sector over/underweights and other key risk exposures relative to the growth benchmark. Typically, any sector over- or underweights are more of a reflection of our bottom-up analysis rather than a top-down call on one sector versus another. As a result, Fund performance is largely driven by individual stock selection. However, we do occasionally take over/underweight positions in a sub-sector or industry group, which we believe has the potential to aid performance.
Fund holdings are as of the date given, are subject to change at any time, and are not recommendations to buy or sell any security.
Portfolio Breakdown (%)
(at August 31, 2016) | |
Common Stocks | | | 96.2 | | |
Money Market Funds | | | 3.8 | | |
Total | | | 100.0 | | |
Percentages indicated are based upon total investments. The Fund's portfolio composition is subject to change.
Equity Sector Breakdown (%)
(at August 31, 2016) | |
Consumer Discretionary | | | 20.7 | | |
Consumer Staples | | | 1.6 | | |
Energy | | | 2.1 | | |
Financials | | | 9.6 | | |
Health Care | | | 22.6 | | |
Industrials | | | 11.3 | | |
Information Technology | | | 28.1 | | |
Materials | | | 3.3 | | |
Telecommunication Services | | | 0.7 | | |
Total | | | 100.0 | | |
Percentages indicated are based upon total equity investments. The Fund's portfolio composition is subject to change.
INVESTMENT RISKS
Market risk may affect a single issuer, sector of the economy, industry or the market as a whole. Foreign investments subject the Fund to risks, including political, economic, market, social and others within a particular country, as well as to currency instabilities and less stringent financial and accounting standards generally applicable to U.S. issuers. Investments in small-cap companies involve risks and volatility greater than investments in larger, more established companies. Growth securities, at times, may not perform as well as value securities or the stock market in general and may be out of favor with investors. The Fund may invest significantly in issuers within a particular sector, which may be negatively affected by market, economic or other conditions, making the Fund more vulnerable to unfavorable developments in the sector. See the Fund's prospectus for more information on these and other risks.
Annual Report 2016
5
COLUMBIA SMALL CAP GROWTH FUND I
UNDERSTANDING YOUR FUND'S EXPENSES
(Unaudited)
As an investor, you incur two types of costs. There are transaction costs, which generally include sales charges on purchases and may include redemption fees. There are also ongoing costs, which generally include management fees, distribution and/or service fees, and other fund expenses. The following information is intended to help you understand your ongoing costs (in dollars) of investing in the Fund and to help you compare these costs with the ongoing costs of investing in other mutual funds.
Analyzing Your Fund's Expenses
To illustrate these ongoing costs, we have provided examples and calculated the expenses paid by investors in each share class of the Fund during the period. The actual and hypothetical information in the table is based on an initial investment of $1,000 at the beginning of the period indicated and held for the entire period. Expense information is calculated two ways and each method provides you with different information. The amount listed in the "Actual" column is calculated using the Fund's actual operating expenses and total return for the period. You may use the Actual information, together with the amount invested, to estimate the expenses that you paid over the period. Simply divide your account value by $1,000 (for example, an $8,600 account value divided by $1,000 = 8.6), then multiply the results by the expenses paid during the period under the "Actual" column. The amount listed in the "Hypothetical" column assumes a 5% annual rate of return before expenses (which is not the Fund's actual return) and then applies the Fund's actual expense ratio for the period to the hypothetical return. You should not use the hypothetical account values and expenses to estimate either your actual account balance at the end of the period or the expenses you paid during the period. See "Compare With Other Funds" below for details on how to use the hypothetical data.
Compare With Other Funds
Since all mutual funds are required to include the same hypothetical calculations about expenses in shareholder reports, you can use this information to compare the ongoing cost of investing in the Fund with other funds. To do so, compare the hypothetical example with the 5% hypothetical examples that appear in the shareholder reports of other funds. As you compare hypothetical examples of other funds, it is important to note that hypothetical examples are meant to highlight the ongoing costs of investing in a fund only and do not reflect any transaction costs, such as sales charges, or redemption or exchange fees. Therefore, the hypothetical calculations are useful in comparing ongoing costs only, and will not help you determine the relative total costs of owning different funds. If transaction costs were included in these calculations, your costs would be higher.
March 1, 2016 – August 31, 2016
| | | Account Value at the Beginning
of the Period ($) | | Account Value at the End of the
Period ($) | | Expenses Paid During the
Period ($) | | Fund's Annualized
Expense Ratio (%) | |
| | | Actual | | Hypothetical | | Actual | | Hypothetical | | Actual | | Hypothetical | | Actual | |
Class A | | | 1,000.00 | | | | 1,000.00 | | | | 1,187.50 | | | | 1,018.35 | | | | 7.42 | | | | 6.85 | | | | 1.35 | | |
Class B | | | 1,000.00 | | | | 1,000.00 | | | | 1,183.10 | | | | 1,014.58 | | | | 11.52 | | | | 10.63 | | | | 2.10 | | |
Class C | | | 1,000.00 | | | | 1,000.00 | | | | 1,183.90 | | | | 1,014.58 | | | | 11.53 | | | | 10.63 | | | | 2.10 | | |
Class I | | | 1,000.00 | | | | 1,000.00 | | | | 1,189.40 | | | | 1,020.41 | | | | 5.17 | | | | 4.77 | | | | 0.94 | | |
Class K | | | 1,000.00 | | | | 1,000.00 | | | | 1,188.80 | | | | 1,018.90 | | | | 6.82 | | | | 6.29 | | | | 1.24 | | |
Class R | | | 1,000.00 | | | | 1,000.00 | | | | 1,186.30 | | | | 1,017.09 | | | | 8.79 | | | | 8.11 | | | | 1.60 | | |
Class R4 | | | 1,000.00 | | | | 1,000.00 | | | | 1,189.20 | | | | 1,019.61 | | | | 6.05 | | | | 5.58 | | | | 1.10 | | |
Class R5 | | | 1,000.00 | | | | 1,000.00 | | | | 1,189.30 | | | | 1,020.16 | | | | 5.45 | | | | 5.03 | | | | 0.99 | | |
Class Y | | | 1,000.00 | | | | 1,000.00 | | | | 1,189.80 | | | | 1,020.41 | | | | 5.17 | | | | 4.77 | | | | 0.94 | | |
Class Z | | | 1,000.00 | | | | 1,000.00 | | | | 1,188.90 | | | | 1,019.61 | | | | 6.05 | | | | 5.58 | | | | 1.10 | | |
Expenses paid during the period are equal to the annualized expense ratio for each class as indicated above, multiplied by the average account value over the period and then multiplied by the number of days in the Fund's most recent fiscal half year and divided by 366.
Expenses do not include fees and expenses incurred indirectly by the Fund from its investment in underlying funds, including affiliated and non-affiliated pooled investment vehicles, such as mutual funds and exchange-traded funds.
Had Columbia Management Investment Advisers, LLC and/or certain of its affiliates not waived/reimbursed certain fees and expenses, account value at the end of the period would have been reduced.
Annual Report 2016
6
COLUMBIA SMALL CAP GROWTH FUND I
PORTFOLIO OF INVESTMENTS
August 31, 2016
(Percentages represent value of investments compared to net assets)
Common Stocks 97.1%
Issuer | | Shares | | Value ($) | |
CONSUMER DISCRETIONARY 20.1% | |
Distributors 0.5% | |
Core-Mark Holding Co., Inc. | | | 50,980 | | | | 1,944,887 | | |
Diversified Consumer Services 0.5% | |
Houghton Mifflin Harcourt Co.(a) | | | 121,100 | | | | 1,931,545 | | |
Hotels, Restaurants & Leisure 8.6% | |
Bojangles', Inc.(a) | | | 95,000 | | | | 1,534,250 | | |
Chuy's Holdings, Inc.(a) | | | 60,241 | | | | 1,824,097 | | |
Extended Stay America, Inc. | | | 317,137 | | | | 4,487,489 | | |
Habit Restaurants, Inc. (The), Class A(a) | | | 90,800 | | | | 1,391,056 | | |
Papa John's International, Inc. | | | 62,796 | | | | 4,699,025 | | |
Planet Fitness, Inc., Class A(a) | | | 157,041 | | | | 3,399,938 | | |
Red Rock Resorts, Inc., Class A | | | 128,913 | | | | 2,905,699 | | |
Six Flags Entertainment Corp. | | | 76,238 | | | | 3,718,127 | | |
Sonic Corp. | | | 223,276 | | | | 6,405,788 | | |
Wingstop, Inc. | | | 84,409 | | | | 2,556,749 | | |
Zoe's Kitchen, Inc.(a) | | | 65,400 | | | | 1,780,842 | | |
Total | | | | | 34,703,060 | | |
Household Durables 1.1% | |
SodaStream International Ltd.(a) | | | 94,200 | | | | 2,672,454 | | |
TopBuild Corp.(a) | | | 59,986 | | | | 2,046,722 | | |
Total | | | | | 4,719,176 | | |
Internet & Catalog Retail 1.5% | |
Liberty TripAdvisor Holdings, Inc.,
Class A(a) | | | 286,529 | | | | 5,962,668 | | |
Leisure Products 0.8% | |
Smith & Wesson Holding Corp.(a) | | | 110,693 | | | | 3,116,008 | | |
Media 4.2% | |
Gray Television, Inc.(a) | | | 211,608 | | | | 2,376,358 | | |
IMAX Corp.(a) | | | 118,500 | | | | 3,613,065 | | |
Nexstar Broadcasting Group, Inc., Class A | | | 42,090 | | | | 2,218,985 | | |
Starz, Class A(a) | | | 287,348 | | | | 8,962,384 | | |
Total | | | | | 17,170,792 | | |
Specialty Retail 2.4% | |
Burlington Stores, Inc.(a) | | | 29,185 | | | | 2,370,406 | | |
Lithia Motors, Inc., Class A | | | 51,900 | | | | 4,295,763 | | |
Sportsman's Warehouse Holdings, Inc.(a) | | | 300,466 | | | | 3,079,776 | | |
Total | | | | | 9,745,945 | | |
Common Stocks (continued)
Issuer | | Shares | | Value ($) | |
Textiles, Apparel & Luxury Goods 0.5% | |
Skechers U.S.A., Inc., Class A(a) | | | 87,329 | | | | 2,122,968 | | |
Total Consumer Discretionary | | | | | 81,417,049 | | |
CONSUMER STAPLES 1.5% | |
Food & Staples Retailing 1.4% | |
Sprouts Farmers Market, Inc.(a) | | | 254,680 | | | | 5,737,940 | | |
Food Products 0.1% | |
Snyders-Lance, Inc. | | | 9,882 | | | | 349,230 | | |
Total Consumer Staples | | | | | 6,087,170 | | |
ENERGY 2.0% | |
Oil, Gas & Consumable Fuels 2.0% | |
Carrizo Oil & Gas, Inc.(a) | | | 90,962 | | | | 3,482,935 | | |
Parsley Energy, Inc., Class A(a) | | | 50,000 | | | | 1,692,500 | | |
WPX Energy, Inc.(a) | | | 261,800 | | | | 3,141,600 | | |
Total | | | | | 8,317,035 | | |
Total Energy | | | | | 8,317,035 | | |
FINANCIALS 9.3% | |
Banks 0.8% | |
Western Alliance Bancorp(a) | | | 91,000 | | | | 3,478,020 | | |
Capital Markets 0.4% | |
Pzena Investment Management, Inc.,
Class A | | | 188,600 | | | | 1,463,536 | | |
Diversified Financial Services 1.2% | |
MarketAxess Holdings, Inc. | | | 29,000 | | | | 4,887,660 | | |
Real Estate Investment Trusts (REITs) 4.4% | |
Care Capital Properties, Inc. | | | 34,000 | | | | 1,019,660 | | |
CyrusOne, Inc. | | | 104,683 | | | | 5,322,084 | | |
Life Storage, Inc. | | | 33,693 | | | | 3,032,370 | | |
National Storage Affiliates Trust | | | 178,000 | | | | 3,615,180 | | |
Potlatch Corp. | | | 41,700 | | | | 1,579,179 | | |
STORE Capital Corp. | | | 113,604 | | | | 3,366,086 | | |
Total | | | | | 17,934,559 | | |
Thrifts & Mortgage Finance 2.5% | |
BofI Holding, Inc.(a) | | | 139,769 | | | | 3,005,034 | | |
LendingTree, Inc.(a) | | | 25,400 | | | | 2,463,800 | | |
MGIC Investment Corp.(a) | | | 556,900 | | | | 4,505,321 | | |
Total | | | | | 9,974,155 | | |
Total Financials | | | | | 37,737,930 | | |
The accompanying Notes to Financial Statements are an integral part of this statement.
Annual Report 2016
7
COLUMBIA SMALL CAP GROWTH FUND I
PORTFOLIO OF INVESTMENTS (continued)
August 31, 2016
Common Stocks (continued)
Issuer | | Shares | | Value ($) | |
HEALTH CARE 22.0% | |
Biotechnology 8.1% | |
ACADIA Pharmaceuticals, Inc.(a) | | | 27,386 | | | | 879,912 | | |
Alder Biopharmaceuticals, Inc.(a) | | | 82,035 | | | | 2,704,694 | | |
Alnylam Pharmaceuticals, Inc.(a) | | | 17,100 | | | | 1,194,435 | | |
ARIAD Pharmaceuticals, Inc.(a) | | | 85,700 | | | | 886,138 | | |
Axovant Sciences Ltd.(a) | | | 56,748 | | | | 931,235 | | |
bluebird bio, Inc.(a) | | | 37,322 | | | | 1,841,467 | | |
Curis, Inc.(a) | | | 398,018 | | | | 700,512 | | |
Dynavax Technologies Corp.(a) | | | 90,577 | | | | 1,418,436 | | |
Exact Sciences Corp.(a) | | | 57,800 | | | | 1,067,566 | | |
Insys Therapeutics, Inc.(a) | | | 81,886 | | | | 1,168,513 | | |
Keryx Biopharmaceuticals, Inc.(a) | | | 393,371 | | | | 1,612,821 | | |
Kite Pharma, Inc.(a) | | | 30,700 | | | | 1,768,934 | | |
Neurocrine Biosciences, Inc.(a) | | | 38,035 | | | | 1,843,176 | | |
Novavax, Inc.(a) | | | 221,952 | | | | 1,518,152 | | |
Ophthotech Corp.(a) | | | 31,662 | | | | 1,672,070 | | |
Puma Biotechnology, Inc.(a) | | | 12,200 | | | | 721,630 | | |
Raptor Pharmaceutical Corp.(a) | | | 118,055 | | | | 879,510 | | |
Sage Therapeutics, Inc.(a) | | | 17,900 | | | | 665,343 | | |
Spark Therapeutics, Inc.(a) | | | 36,361 | | | | 2,057,305 | | |
TESARO, Inc.(a) | | | 30,148 | | | | 2,553,234 | | |
Ultragenyx Pharmaceutical, Inc.(a) | | | 54,959 | | | | 3,622,897 | | |
vTv Therapeutics, Inc., Class A(a) | | | 151,623 | | | | 856,670 | | |
Total | | | | | 32,564,650 | | |
Health Care Equipment & Supplies 4.8% | |
ABIOMED, Inc.(a) | | | 35,061 | | | | 4,135,094 | | |
ICU Medical, Inc.(a) | | | 32,785 | | | | 4,090,585 | | |
Natus Medical, Inc.(a) | | | 77,162 | | | | 3,002,373 | | |
NuVasive, Inc.(a) | | | 90,100 | | | | 5,898,847 | | |
NxStage Medical, Inc.(a) | | | 104,239 | | | | 2,382,904 | | |
Total | | | | | 19,509,803 | | |
Health Care Providers & Services 4.7% | |
Acadia Healthcare Co., Inc.(a) | | | 39,200 | | | | 2,006,648 | | |
Amsurg Corp.(a) | | | 94,196 | | | | 6,115,205 | | |
Chemed Corp. | | | 37,783 | | | | 5,098,060 | | |
LHC Group, Inc.(a) | | | 90,063 | | | | 3,202,640 | | |
Molina Healthcare, Inc.(a) | | | 47,762 | | | | 2,570,073 | | |
Total | | | | | 18,992,626 | | |
Common Stocks (continued)
Issuer | | Shares | | Value ($) | |
Health Care Technology 1.6% | |
HealthStream, Inc.(a) | | | 119,907 | | | | 3,188,327 | | |
Veeva Systems Inc., Class A(a) | | | 80,800 | | | | 3,306,336 | | |
Total | | | | | 6,494,663 | | |
Life Sciences Tools & Services 1.3% | |
ICON PLC(a) | | | 29,748 | | | | 2,284,349 | | |
INC Research Holdings, Inc. Class A(a) | | | 66,700 | | | | 2,910,121 | | |
Total | | | | | 5,194,470 | | |
Pharmaceuticals 1.5% | |
Aerie Pharmaceuticals, Inc.(a) | | | 70,846 | | | | 1,371,579 | | |
GW Pharmaceuticals PLC ADR(a) | | | 10,622 | | | | 868,348 | | |
Pacira Pharmaceuticals, Inc.(a) | | | 44,690 | | | | 1,771,065 | | |
Supernus Pharmaceuticals, Inc.(a) | | | 104,418 | | | | 2,232,457 | | |
Total | | | | | 6,243,449 | | |
Total Health Care | | | | | 88,999,661 | | |
INDUSTRIALS 11.0% | |
Aerospace & Defense 0.9% | |
Teledyne Technologies, Inc.(a) | | | 34,222 | | | | 3,666,545 | | |
Airlines 0.5% | |
Allegiant Travel Co. | | | 14,884 | | | | 2,057,564 | | |
Building Products 1.3% | |
Gibraltar Industries, Inc.(a) | | | 52,828 | | | | 2,015,916 | | |
Masonite International Corp.(a) | | | 48,100 | | | | 3,209,713 | | |
Total | | | | | 5,225,629 | | |
Commercial Services & Supplies 1.6% | |
ARC Document Solutions, Inc.(a) | | | 537,597 | | | | 1,817,078 | | |
Casella Waste Systems, Inc., Class A(a) | | | 279,700 | | | | 2,542,473 | | |
Heritage-Crystal Clean, Inc.(a) | | | 143,600 | | | | 1,983,116 | | |
Total | | | | | 6,342,667 | | |
Electrical Equipment 1.2% | |
Generac Holdings, Inc.(a) | | | 129,076 | | | | 4,814,535 | | |
Machinery 1.6% | |
Mueller Water Products, Inc., Class A | | | 163,290 | | | | 1,974,176 | | |
Rexnord Corp.(a) | | | 209,799 | | | | 4,638,656 | | |
Total | | | | | 6,612,832 | | |
Professional Services 0.7% | |
CEB, Inc. | | | 46,000 | | | | 2,769,200 | | |
Road & Rail 1.4% | |
Saia, Inc.(a) | | | 87,302 | | | | 2,656,600 | | |
Swift Transportation Co.(a) | | | 160,200 | | | | 2,981,322 | | |
Total | | | | | 5,637,922 | | |
The accompanying Notes to Financial Statements are an integral part of this statement.
Annual Report 2016
8
COLUMBIA SMALL CAP GROWTH FUND I
PORTFOLIO OF INVESTMENTS (continued)
August 31, 2016
Common Stocks (continued)
Issuer | | Shares | | Value ($) | |
Trading Companies & Distributors 1.8% | |
Beacon Roofing Supply, Inc.(a) | | | 118,551 | | | | 5,450,975 | | |
DXP Enterprises, Inc.(a) | | | 68,408 | | | | 1,921,581 | | |
Total | | | | | 7,372,556 | | |
Total Industrials | | | | | 44,499,450 | | |
INFORMATION TECHNOLOGY 27.3% | |
Communications Equipment 0.9% | |
Ciena Corp.(a) | | | 177,200 | | | | 3,800,940 | | |
Internet Software & Services 6.3% | |
Cvent, Inc.(a) | | | 66,300 | | | | 2,166,684 | | |
j2 Global, Inc. | | | 62,218 | | | | 4,241,401 | | |
Match Group, Inc.(a) | | | 282,562 | | | | 4,574,679 | | |
Mimecast Ltd.(a) | | | 136,900 | | | | 2,250,636 | | |
Shopify, Inc., Class A(a) | | | 96,500 | | | | 3,991,240 | | |
SPS Commerce, Inc.(a) | | | 65,918 | | | | 4,303,127 | | |
Stamps.com, Inc.(a) | | | 39,584 | | | | 3,828,564 | | |
Total | | | | | 25,356,331 | | |
IT Services 4.9% | |
CoreLogic, Inc.(a) | | | 75,723 | | | | 3,106,158 | | |
EPAM Systems, Inc.(a) | | | 32,329 | | | | 2,205,161 | | |
Euronet Worldwide, Inc.(a) | | | 88,502 | | | | 6,868,640 | | |
Leidos Holdings, Inc. | | | 67,800 | | | | 2,746,578 | | |
Luxoft Holding, Inc.(a) | | | 16,752 | | | | 859,545 | | |
WEX, Inc.(a) | | | 42,135 | | | | 4,184,427 | | |
Total | | | | | 19,970,509 | | |
Semiconductors & Semiconductor Equipment 3.9% | |
Cavium, Inc.(a) | | | 49,800 | | | | 2,772,864 | | |
Cirrus Logic, Inc.(a) | | | 57,725 | | | | 2,929,544 | | |
Integrated Device Technology, Inc.(a) | | | 91,600 | | | | 1,840,244 | | |
Mellanox Technologies Ltd.(a) | | | 65,151 | | | | 2,856,220 | | |
Microsemi Corp.(a) | | | 64,080 | | | | 2,560,637 | | |
Nanometrics, Inc.(a) | | | 140,500 | | | | 2,857,770 | | |
Total | | | | | 15,817,279 | | |
Software 11.3% | |
ACI Worldwide, Inc.(a) | | | 177,200 | | | | 3,384,520 | | |
Blackbaud, Inc. | | | 42,500 | | | | 2,863,225 | | |
BroadSoft, Inc.(a) | | | 111,531 | | | | 5,098,082 | | |
CyberArk Software Ltd.(a) | | | 93,658 | | | | 4,945,142 | | |
Ellie Mae, Inc.(a) | | | 31,651 | | | | 3,097,683 | | |
Common Stocks (continued)
Issuer | | Shares | | Value ($) | |
Fair Isaac Corp. | | | 28,600 | | | | 3,659,084 | | |
Fortinet, Inc.(a) | | | 138,639 | | | | 5,010,414 | | |
HubSpot, Inc.(a) | | | 36,000 | | | | 2,006,640 | | |
Paycom Software, Inc.(a) | | | 71,113 | | | | 3,650,941 | | |
Pegasystems, Inc. | | | 120,256 | | | | 3,096,592 | | |
PROS Holdings, Inc.(a) | | | 78,100 | | | | 1,537,008 | | |
RealPage, Inc.(a) | | | 191,940 | | | | 4,940,536 | | |
Take-Two Interactive Software, Inc.(a) | | | 52,800 | | | | 2,295,216 | | |
Total | | | | | 45,585,083 | | |
Total Information Technology | | | | | 110,530,142 | | |
MATERIALS 3.2% | |
Chemicals 0.4% | |
PolyOne Corp. | | | 45,700 | | | | 1,575,279 | | |
Construction Materials 0.4% | |
Headwaters, Inc.(a) | | | 98,386 | | | | 1,783,738 | | |
Containers & Packaging 1.4% | |
Bemis Co., Inc. | | | 48,000 | | | | 2,524,800 | | |
Berry Plastics Group, Inc.(a) | | | 65,400 | | | | 2,968,506 | | |
Total | | | | | 5,493,306 | | |
Paper & Forest Products 1.0% | |
KapStone Paper and Packaging Corp. | | | 225,300 | | | | 3,945,003 | | |
Total Materials | | | | | 12,797,326 | | |
TELECOMMUNICATION SERVICES 0.7% | |
Diversified Telecommunication Services 0.7% | |
Cogent Communications Holdings, Inc. | | | 74,622 | | | | 2,652,066 | | |
Total Telecommunication Services | | | | | 2,652,066 | | |
Total Common Stocks
(Cost: $356,631,433) | | | | | 393,037,829 | | |
Money Market Funds 3.9%
| | | Shares | | Value ($) | |
Columbia Short-Term Cash Fund,
0.415%(b)(c) | | | 15,636,168 | | | | 15,636,168 | | |
Total Money Market Funds
(Cost: $15,636,168) | | | | | 15,636,168 | | |
Total Investments
(Cost: $372,267,601) | | | | | 408,673,997 | | |
Other Assets & Liabilities, Net | | | | | (3,976,150 | ) | |
Net Assets | | | | | 404,697,847 | | |
The accompanying Notes to Financial Statements are an integral part of this statement.
Annual Report 2016
9
COLUMBIA SMALL CAP GROWTH FUND I
PORTFOLIO OF INVESTMENTS (continued)
August 31, 2016
Notes to Portfolio of Investments
(a) Non-income producing investment.
(b) The rate shown is the seven-day current annualized yield at August 31, 2016.
(c) As defined in the Investment Company Act of 1940, an affiliated company is one in which the Fund owns 5% or more of the company's outstanding voting securities, or a company which is under common ownership or control with the Fund. Holdings and transactions in these affiliated companies during the year ended August 31, 2016 are as follows:
Issuer | | Beginning
Cost ($) | | Purchase
Cost ($) | | Proceeds
From Sales ($) | | Ending
Cost ($) | | Dividends —
Affiliated
Issuers ($) | | Value ($) | |
Columbia Short-Term Cash Fund | | | 11,368,067 | | | | 244,357,561 | | | | (240,089,460 | ) | | | 15,636,168 | | | | 37,022 | | | | 15,636,168 | | |
Abbreviation Legend
ADR American Depositary Receipt
Fair Value Measurements
The Fund categorizes its fair value measurements according to a three-level hierarchy that maximizes the use of observable inputs and minimizes the use of unobservable inputs by prioritizing that the most observable input be used when available. Observable inputs are those that market participants would use in pricing an investment based on market data obtained from sources independent of the reporting entity. Unobservable inputs are those that reflect the Fund's assumptions about the information market participants would use in pricing an investment. An investment's level within the fair value hierarchy is based on the lowest level of any input that is deemed significant to the asset's or liability's fair value measurement. The input levels are not necessarily an indication of the risk or liquidity associated with investments at that level. For example, certain U.S. government securities are generally high quality and liquid, however, they are reflected as Level 2 because the inputs used to determine fair value may not always be quoted prices in an active market.
Fair value inputs are summarized in the three broad levels listed below:
> Level 1 — Valuations based on quoted prices for investments in active markets that the Fund has the ability to access at the measurement date (including NAV for open-end mutual funds). Valuation adjustments are not applied to Level 1 investments.
> Level 2 — Valuations based on other significant observable inputs (including quoted prices for similar securities, interest rates, prepayment speeds, credit risks, etc.).
> Level 3 — Valuations based on significant unobservable inputs (including the Fund's own assumptions and judgment in determining the fair value of investments).
Inputs that are used in determining fair value of an investment may include price information, credit data, volatility statistics, and other factors. These inputs can be either observable or unobservable. The availability of observable inputs can vary between investments, and is affected by various factors such as the type of investment, and the volume and level of activity for that investment or similar investments in the marketplace. The inputs will be considered by the Investment Manager, along with any other relevant factors in the calculation of an investment's fair value. The Fund uses prices and inputs that are current as of the measurement date, which may include periods of market dislocations. During these periods, the availability of prices and inputs may be reduced for many investments. This condition could cause an investment to be reclassified between the various levels within the hierarchy.
Certain investments that have been measured at fair value using the net asset value per share (or its equivalent) are not categorized in the fair value hierarchy. The fair value amounts presented in the table are intended to reconcile the fair value hierarchy to the amounts presented in the Portfolio of Investments. The Columbia Short-Term Cash Fund seeks to provide shareholders with maximum current income consistent with liquidity and stability of principal. Investments in Columbia Short-Term Cash Fund may be redeemed on a daily basis without restriction.
Investments falling into the Level 3 category are primarily supported by quoted prices from brokers and dealers participating in the market for those investments. However, these may be classified as Level 3 investments due to lack of market transparency and corroboration to support these quoted prices. Additionally, valuation models may be used as the pricing source for any remaining investments classified as Level 3. These models may rely on one or more significant unobservable inputs and/or significant assumptions by the Investment Manager. Inputs used in valuations may include, but are not limited to, financial statement analysis, capital account balances, discount rates and estimated cash flows, and comparable company data.
Under the direction of the Fund's Board of Trustees (the Board), the Investment Manager's Valuation Committee (the Committee) is responsible for overseeing the valuation procedures approved by the Board. The Committee consists of voting and non-voting members from various groups within the Investment Manager's organization, including operations and accounting, trading and investments, compliance, risk management and legal.
The accompanying Notes to Financial Statements are an integral part of this statement.
Annual Report 2016
10
COLUMBIA SMALL CAP GROWTH FUND I
PORTFOLIO OF INVESTMENTS (continued)
August 31, 2016
Fair Value Measurements (continued)
The Committee meets at least monthly to review and approve valuation matters, which may include a description of specific valuation determinations, data regarding pricing information received from approved pricing vendors and brokers and the results of Board-approved valuation control policies and procedures (the Policies). The Policies address, among other things, instances when market quotations are or are not readily available, including recommendations of third party pricing vendors and a determination of appropriate pricing methodologies; events that require specific valuation determinations and assessment of fair value techniques; securities with a potential for stale pricing, including those that are illiquid, restricted, or in default; and the effectiveness of third party pricing vendors, including periodic reviews of vendors. The Committee meets more frequently, as needed, to discuss additional valuation matters, which may include the need to review back-testing results, review time-sensitive information or approve related valuation actions. The Committee reports to the Board, with members of the Committee meeting with the Board at each of its regularly scheduled meetings to discuss valuation matters and actions during the period, similar to those described earlier.
For investments categorized as Level 3, the Committee monitors information similar to that described above, which may include: (i) data specific to the issuer or comparable issuers, (ii) general market or specific sector news and (iii) quoted prices and specific or similar security transactions. The Committee considers this data and any changes from prior periods in order to assess the reasonableness of observable and unobservable inputs, any assumptions or internal models used to value those securities and changes in fair value. This data is also used to corroborate, when available, information received from approved pricing vendors and brokers. Various factors impact the frequency of monitoring this information (which may occur as often as daily). However, the Committee may determine that changes to inputs, assumptions and models are not required as a result of the monitoring procedures performed.
The following table is a summary of the inputs used to value the Fund's investments at August 31, 2016:
| | | Level 1
Quoted Prices in Active
Markets for Identical
Assets ($) | | Level 2
Other Significant
Observable Inputs ($) | | Level 3
Significant
Unobservable Inputs ($) | | Total ($) | |
Investments | |
Common Stocks | |
Consumer Discretionary | | | 81,417,049 | | | | — | | | | — | | | | 81,417,049 | | |
Consumer Staples | | | 6,087,170 | | | | — | | | | — | | | | 6,087,170 | | |
Energy | | | 8,317,035 | | | | — | | | | — | | | | 8,317,035 | | |
Financials | | | 37,737,930 | | | | — | | | | — | | | | 37,737,930 | | |
Health Care | | | 88,999,661 | | | | — | | | | — | | | | 88,999,661 | | |
Industrials | | | 44,499,450 | | | | — | | | | — | | | | 44,499,450 | | |
Information Technology | | | 110,530,142 | | | | — | | | | — | | | | 110,530,142 | | |
Materials | | | 12,797,326 | | | | — | | | | — | | | | 12,797,326 | | |
Telecommunication Services | | | 2,652,066 | | | | — | | | | — | | | | 2,652,066 | | |
Total Common Stocks | | | 393,037,829 | | | | — | | | | — | | | | 393,037,829 | | |
Investments measured at net asset value | |
Money Market Funds | | | — | | | | — | | | | — | | | | 15,636,168 | | |
Total Investments | | | 393,037,829 | | | | — | | | | — | | | | 408,673,997 | | |
See the Portfolio of Investments for all investment classifications not indicated in the table.
There were no transfers of financial assets between levels during the period.
The accompanying Notes to Financial Statements are an integral part of this statement.
Annual Report 2016
11
COLUMBIA SMALL CAP GROWTH FUND I
STATEMENT OF ASSETS AND LIABILITIES
August 31, 2016
Assets | |
Investments, at value | |
Unaffiliated issuers (identified cost $356,631,433) | | $ | 393,037,829 | | |
Affiliated issuers (identified cost $15,636,168) | | | 15,636,168 | | |
Total investments (identified cost $372,267,601) | | | 408,673,997 | | |
Cash | | | 1,581 | | |
Receivable for: | |
Capital shares sold | | | 2,268,701 | | |
Dividends | | | 98,186 | | |
Expense reimbursement due from Investment Manager | | | 82 | | |
Prepaid expenses | | | 3,560 | | |
Trustees' deferred compensation plan | | | 80,524 | | |
Total assets | | | 411,126,631 | | |
Liabilities | |
Payable for: | |
Investments purchased | | | 5,820,993 | | |
Capital shares purchased | | | 368,135 | | |
Management services fees | | | 9,685 | | |
Distribution and/or service fees | | | 1,596 | | |
Transfer agent fees | | | 47,032 | | |
Plan administration fees | | | 9 | | |
Compensation of board members | | | 36,997 | | |
Chief compliance officer expenses | | | 32 | | |
Other expenses | | | 63,781 | | |
Trustees' deferred compensation plan | | | 80,524 | | |
Total liabilities | | | 6,428,784 | | |
Net assets applicable to outstanding capital stock | | $ | 404,697,847 | | |
Represented by | |
Paid-in capital | | $ | 344,429,461 | | |
Excess of distributions over net investment income | | | (269,002 | ) | |
Accumulated net realized gain | | | 24,130,992 | | |
Unrealized appreciation (depreciation) on: | |
Investments | | | 36,406,396 | | |
Total — representing net assets applicable to outstanding capital stock | | $ | 404,697,847 | | |
The accompanying Notes to Financial Statements are an integral part of this statement.
Annual Report 2016
12
COLUMBIA SMALL CAP GROWTH FUND I
STATEMENT OF ASSETS AND LIABILITIES (continued)
August 31, 2016
Class A | |
Net assets | | $ | 174,183,322 | | |
Shares outstanding | | | 10,072,883 | | |
Net asset value per share | | $ | 17.29 | | |
Maximum offering price per share(a) | | $ | 18.34 | | |
Class B | |
Net assets | | $ | 587,198 | | |
Shares outstanding | | | 39,851 | | |
Net asset value per share | | $ | 14.73 | | |
Class C | |
Net assets | | $ | 13,186,636 | | |
Shares outstanding | | | 894,839 | | |
Net asset value per share | | $ | 14.74 | | |
Class I | |
Net assets | | $ | 37,970,031 | | |
Shares outstanding | | | 2,056,554 | | |
Net asset value per share | | $ | 18.46 | | |
Class K | |
Net assets | | $ | 39,937 | | |
Shares outstanding | | | 2,218 | | |
Net asset value per share | | $ | 18.01 | | |
Class R | |
Net assets | | $ | 1,356,019 | | |
Shares outstanding | | | 79,775 | | |
Net asset value per share | | $ | 17.00 | | |
Class R4 | |
Net assets | | $ | 1,283,028 | | |
Shares outstanding | | | 68,042 | | |
Net asset value per share | | $ | 18.86 | | |
Class R5 | |
Net assets | | $ | 11,704,074 | | |
Shares outstanding | | | 640,209 | | |
Net asset value per share | | $ | 18.28 | | |
Class Y | |
Net assets | | $ | 6,561,770 | | |
Shares outstanding | | | 355,983 | | |
Net asset value per share | | $ | 18.43 | | |
Class Z | |
Net assets | | $ | 157,825,832 | | |
Shares outstanding | | | 8,705,702 | | |
Net asset value per share | | $ | 18.13 | | |
(a) The maximum offering price per share is calculated by dividing the net asset value per share by 1.0 minus the maximum sales charge of 5.75%.
The accompanying Notes to Financial Statements are an integral part of this statement.
Annual Report 2016
13
COLUMBIA SMALL CAP GROWTH FUND I
STATEMENT OF OPERATIONS
Year Ended August 31, 2016
Net investment income | |
Income: | |
Dividends — unaffiliated issuers | | $ | 3,107,264 | | |
Dividends — affiliated issuers | | | 37,022 | | |
Foreign taxes withheld | | | (13,061 | ) | |
Total income | | | 3,131,225 | | |
Expenses: | |
Management services fees | | | 3,689,779 | | |
Distribution and/or service fees | |
Class A | | | 440,204 | | |
Class B | | | 9,779 | | |
Class C | | | 136,468 | | |
Class R | | | 7,188 | | |
Transfer agent fees | |
Class A | | | 378,096 | | |
Class B | | | 2,109 | | |
Class C | | | 29,303 | | |
Class K | | | 19 | | |
Class R | | | 3,090 | | |
Class R4 | | | 1,583 | | |
Class R5 | | | 5,652 | | |
Class Z | | | 362,648 | | |
Plan administration fees | |
Class K | | | 96 | | |
Compensation of board members | | | 24,840 | | |
Custodian fees | | | 18,897 | | |
Printing and postage fees | | | 58,927 | | |
Registration fees | | | 115,785 | | |
Audit fees | | | 32,452 | | |
Legal fees | | | 10,728 | | |
Line of credit interest expense | | | 1,257 | | |
Chief compliance officer expenses | | | 203 | | |
Other | | | 30,262 | | |
Total expenses | | | 5,359,365 | | |
Fees waived or expenses reimbursed by Investment Manager and its affiliates | | | (135,594 | ) | |
Expense reductions | | | (8,076 | ) | |
Total net expenses | | | 5,215,695 | | |
Net investment loss | | | (2,084,470 | ) | |
Realized and unrealized gain (loss) — net | |
Net realized gain (loss) on: | |
Investments | | | 42,104,386 | | |
Net realized gain | | | 42,104,386 | | |
Net change in unrealized appreciation (depreciation) on: | | | |
Investments | | | (30,307,187 | ) | |
Net change in unrealized depreciation | | | (30,307,187 | ) | |
Net realized and unrealized gain | | | 11,797,199 | | |
Net increase in net assets resulting from operations | | $ | 9,712,729 | | |
The accompanying Notes to Financial Statements are an integral part of this statement.
Annual Report 2016
14
COLUMBIA SMALL CAP GROWTH FUND I
STATEMENT OF CHANGES IN NET ASSETS
| | | Year Ended
August 31,
2016 | | Year Ended
August 31,
2015 | |
Operations | |
Net investment loss | | $ | (2,084,470 | ) | | $ | (5,454,904 | ) | |
Net realized gain | | | 42,104,386 | | | | 187,012,944 | | |
Net change in unrealized depreciation | | | (30,307,187 | ) | | | (107,098,517 | ) | |
Net increase in net assets resulting from operations | | | 9,712,729 | | | | 74,459,523 | | |
Distributions to shareholders | |
Net realized gains | |
Class A | | | (72,930,525 | ) | | | (35,687,202 | ) | |
Class B | | | (535,408 | ) | | | (447,283 | ) | |
Class C | | | (6,640,363 | ) | | | (3,197,524 | ) | |
Class I | | | (17,350,522 | ) | | | (8,892,749 | ) | |
Class K | | | (15,137 | ) | | | (6,356 | ) | |
Class R | | | (633,899 | ) | | | (347,538 | ) | |
Class R4 | | | (24,586 | ) | | | (18,284 | ) | |
Class R5 | | | (4,433,879 | ) | | | (1,395,590 | ) | |
Class Y | | | (1,637,722 | ) | | | (760,513 | ) | |
Class Z | | | (72,031,076 | ) | | | (93,625,792 | ) | |
Total distributions to shareholders | | | (176,233,117 | ) | | | (144,378,831 | ) | |
Increase (decrease) in net assets from capital stock activity | | | 67,977,819 | | | | (462,207,963 | ) | |
Proceeds from regulatory settlements (Note 6) | | | — | | | | 2,181,933 | | |
Total decrease in net assets | | | (98,542,569 | ) | | | (529,945,338 | ) | |
Net assets at beginning of year | | | 503,240,416 | | | | 1,033,185,754 | | |
Net assets at end of year | | $ | 404,697,847 | | | $ | 503,240,416 | | |
Excess of distributions over net investment income | | $ | (269,002 | ) | | $ | (1,336,691 | ) | |
The accompanying Notes to Financial Statements are an integral part of this statement.
Annual Report 2016
15
COLUMBIA SMALL CAP GROWTH FUND I
STATEMENT OF CHANGES IN NET ASSETS (continued)
| | | Year Ended August 31, 2016 | | Year Ended August 31, 2015 | |
| | | Shares | | Dollars ($) | | Shares | | Dollars ($) | |
Capital stock activity | |
Class A shares | |
Subscriptions(a) | | | 925,241 | | | | 16,390,137 | | | | 362,024 | | | | 9,427,704 | | |
Distributions reinvested | | | 3,749,664 | | | | 61,831,964 | | | | 1,240,559 | | | | 30,455,715 | | |
Redemptions | | | (2,043,290 | ) | | | (37,190,673 | ) | | | (1,531,621 | ) | | | (41,545,932 | ) | |
Net increase (decrease) | | | 2,631,615 | | | | 41,031,428 | | | | 70,962 | | | | (1,662,513 | ) | |
Class B shares | |
Subscriptions | | | 994 | | | | 14,049 | | | | 1,782 | | | | 41,107 | | |
Distributions reinvested | | | 36,088 | | | | 509,928 | | | | 17,537 | | | | 395,459 | | |
Redemptions(a) | | | (58,247 | ) | | | (877,652 | ) | | | (55,350 | ) | | | (1,388,961 | ) | |
Net decrease | | | (21,165 | ) | | | (353,675 | ) | | | (36,031 | ) | | | (952,395 | ) | |
Class C shares | |
Subscriptions | | | 122,960 | | | | 1,757,444 | | | | 36,712 | | | | 870,747 | | |
Distributions reinvested | | | 388,145 | | | | 5,484,490 | | | | 115,796 | | | | 2,611,190 | | |
Redemptions | | | (292,268 | ) | | | (4,333,207 | ) | | | (159,493 | ) | | | (4,035,891 | ) | |
Net increase (decrease) | | | 218,837 | | | | 2,908,727 | | | | (6,985 | ) | | | (553,954 | ) | |
Class I shares | |
Subscriptions | | | 878,398 | | | | 12,836,923 | | | | 200,109 | | | | 5,941,104 | | |
Distributions reinvested | | | 988,033 | | | | 17,349,866 | | | | 350,095 | | | | 8,892,421 | | |
Redemptions | | | (1,535,272 | ) | | | (26,500,342 | ) | | | (1,927,577 | ) | | | (57,525,171 | ) | |
Net increase (decrease) | | | 331,159 | | | | 3,686,447 | | | | (1,377,373 | ) | | | (42,691,646 | ) | |
Class K shares | |
Distributions reinvested | | | 840 | | | | 14,414 | | | | 239 | | | | 5,994 | | |
Redemptions | | | (104 | ) | | | (1,727 | ) | | | — | | | | — | | |
Net increase | | | 736 | | | | 12,687 | | | | 239 | | | | 5,994 | | |
Class R shares | |
Subscriptions | | | 17,461 | | | | 294,244 | | | | 12,190 | | | | 336,675 | | |
Distributions reinvested | | | 38,002 | | | | 617,158 | | | | 13,623 | | | | 332,117 | | |
Redemptions | | | (38,889 | ) | | | (648,742 | ) | | | (48,090 | ) | | | (1,336,240 | ) | |
Net increase (decrease) | | | 16,574 | | | | 262,660 | | | | (22,277 | ) | | | (667,448 | ) | |
Class R4 shares | |
Subscriptions | | | 74,301 | | | | 1,321,381 | | | | 1,118 | | | | 34,221 | | |
Distributions reinvested | | | 1,328 | | | | 23,840 | | | | 694 | | | | 17,911 | | |
Redemptions | | | (9,993 | ) | | | (168,286 | ) | | | (4,843 | ) | | | (136,597 | ) | |
Net increase (decrease) | | | 65,636 | | | | 1,176,935 | | | | (3,031 | ) | | | (84,465 | ) | |
Class R5 shares | |
Subscriptions | | | 106,776 | | | | 2,080,423 | | | | 428,294 | | | | 12,667,330 | | |
Distributions reinvested | | | 254,923 | | | | 4,433,117 | | | | 55,212 | | | | 1,395,209 | | |
Redemptions | | | (148,110 | ) | | | (2,712,836 | ) | | | (80,834 | ) | | | (2,232,192 | ) | |
Net increase | | | 213,589 | | | | 3,800,704 | | | | 402,672 | | | | 11,830,347 | | |
The accompanying Notes to Financial Statements are an integral part of this statement.
Annual Report 2016
16
COLUMBIA SMALL CAP GROWTH FUND I
STATEMENT OF CHANGES IN NET ASSETS (continued)
| | | Year Ended August 31, 2016 | | Year Ended August 31, 2015 | |
| | | Shares | | Dollars ($) | | Shares | | Dollars ($) | |
Capital stock activity (continued) | |
Class Y shares | |
Subscriptions | | | 218,139 | | | | 4,024,602 | | | | 162,599 | | | | 4,739,379 | | |
Distributions reinvested | | | 93,379 | | | | 1,636,936 | | | | 29,938 | | | | 760,120 | | |
Redemptions | | | (90,892 | ) | | | (1,509,786 | ) | | | (205,912 | ) | | | (5,532,176 | ) | |
Net increase (decrease) | | | 220,626 | | | | 4,151,752 | | | | (13,375 | ) | | | (32,677 | ) | |
Class Z shares | |
Subscriptions | | | 763,065 | | | | 14,208,749 | | | | 1,039,444 | | | | 28,864,010 | | |
Distributions reinvested | | | 3,817,872 | | | | 65,896,476 | | | | 2,585,855 | | | | 65,137,683 | | |
Redemptions | | | (3,592,004 | ) | | | (68,805,071 | ) | | | (19,013,407 | ) | | | (521,400,899 | ) | |
Net increase (decrease) | | | 988,933 | | | | 11,300,154 | | | | (15,388,108 | ) | | | (427,399,206 | ) | |
Total net increase (decrease) | | | 4,666,540 | | | | 67,977,819 | | | | (16,373,307 | ) | | | (462,207,963 | ) | |
(a) Includes conversions of Class B shares to Class A shares, if any.
The accompanying Notes to Financial Statements are an integral part of this statement.
Annual Report 2016
17
COLUMBIA SMALL CAP GROWTH FUND I
The following tables are intended to help you understand the Fund's financial performance. Certain information reflects financial results for a single share of a class held for the periods shown. Per share net investment income (loss) amounts are calculated based on average shares outstanding during the period. Total return assumes reinvestment of all dividends and distributions, if any. Total return does not reflect payment of sales charges, if any. Total return and portfolio turnover are not annualized for periods of less than one year. The portfolio turnover rate is calculated without regard to purchase and sales transactions of short-term instruments and certain derivatives, if any. If such transactions were included, the Fund's portfolio turnover rate may be higher.
| | | Year Ended August 31, | |
Class A | | 2016 | | 2015 | | 2014 | | 2013 | | 2012 | |
Per share data | |
Net asset value, beginning of period | | $ | 27.22 | | | $ | 29.40 | | | $ | 33.32 | | | $ | 29.55 | | | $ | 29.94 | | |
Income from investment operations: | |
Net investment loss | | | (0.11 | )(f) | | | (0.27 | ) | | | (0.28 | ) | | | (0.23 | ) | | | (0.15 | ) | |
Net realized and unrealized gain | | | 0.40 | | | | 3.09 | | | | 1.71 | | | | 6.90 | | | | 2.56 | | |
Total from investment operations | | | 0.29 | | | | 2.82 | | | | 1.43 | | | | 6.67 | | | | 2.41 | | |
Less distributions to shareholders: | |
Net realized gains | | | (10.22 | ) | | | (5.11 | ) | | | (5.35 | ) | | | (2.90 | ) | | | (2.80 | ) | |
Total distributions to shareholders | | | (10.22 | ) | | | (5.11 | ) | | | (5.35 | ) | | | (2.90 | ) | | | (2.80 | ) | |
Proceeds from regulatory settlements | | | — | | | | 0.11 | | | | — | | | | — | | | | — | | |
Net asset value, end of period | | $ | 17.29 | | | $ | 27.22 | | | $ | 29.40 | | | $ | 33.32 | | | $ | 29.55 | | |
Total return | | | 2.88 | % | | | 11.87 | %(a) | | | 3.35 | % | | | 25.12 | % | | | 8.81 | % | |
Ratios to average net assets(b) | |
Total gross expenses | | | 1.41 | %(c) | | | 1.36 | % | | | 1.30 | %(c) | | | 1.31 | % | | | 1.33 | % | |
Total net expenses(d) | | | 1.36 | %(c)(e) | | | 1.36 | %(e) | | | 1.30 | %(c)(e) | | | 1.31 | %(e) | | | 1.31 | %(e) | |
Net investment loss | | | (0.62 | %) | | | (0.98 | %) | | | (0.88 | %) | | | (0.74 | %) | | | (0.53 | %) | |
Supplemental data | |
Net assets, end of period (in thousands) | | $ | 174,183 | | | $ | 202,566 | | | $ | 216,670 | | | $ | 254,055 | | | $ | 61,032 | | |
Portfolio turnover | | | 142 | % | | | 117 | % | | | 148 | % | | | 104 | % | | | 113 | % | |
Notes to Financial Highlights
(a) The Fund received proceeds from regulatory settlements. Had the Fund not received these proceeds, the total return would have been lower by 0.39%.
(b) In addition to the fees and expenses that the Fund bears directly, the Fund indirectly bears a pro rata share of the fees and expenses of any other funds in which it invests. Such indirect expenses are not included in the Fund's reported expense ratios.
(c) Ratios include line of credit interest expense which is less than 0.01%.
(d) Total net expenses include the impact of certain fee waivers/expense reimbursements made by the Investment Manager and certain of its affiliates, if applicable.
(e) The benefits derived from expense reductions had an impact of less than 0.01%.
(f) Net investment income per share includes special dividends. The effect of these dividends amounted to $0.04 per share.
The accompanying Notes to Financial Statements are an integral part of this statement.
Annual Report 2016
18
COLUMBIA SMALL CAP GROWTH FUND I
FINANCIAL HIGHLIGHTS (continued)
| | | Year Ended August 31, | |
Class B | | 2016 | | 2015 | | 2014 | | 2013 | | 2012 | |
Per share data | |
Net asset value, beginning of period | | $ | 24.86 | | | $ | 27.47 | | | $ | 31.44 | | | $ | 28.19 | | | $ | 28.82 | | |
Income from investment operations: | |
Net investment loss | | | (0.23 | )(f) | | | (0.43 | ) | | | (0.49 | ) | | | (0.42 | ) | | | (0.35 | ) | |
Net realized and unrealized gain | | | 0.32 | | | | 2.83 | | | | 1.62 | | | | 6.52 | | | | 2.45 | | |
Total from investment operations | | | 0.09 | | | | 2.40 | | | | 1.13 | | | | 6.10 | | | | 2.10 | | |
Less distributions to shareholders: | |
Net realized gains | | | (10.22 | ) | | | (5.11 | ) | | | (5.10 | ) | | | (2.85 | ) | | | (2.73 | ) | |
Total distributions to shareholders | | | (10.22 | ) | | | (5.11 | ) | | | (5.10 | ) | | | (2.85 | ) | | | (2.73 | ) | |
Proceeds from regulatory settlements | | | — | | | | 0.10 | | | | — | | | | — | | | | — | | |
Net asset value, end of period | | $ | 14.73 | | | $ | 24.86 | | | $ | 27.47 | | | $ | 31.44 | | | $ | 28.19 | | |
Total return | | | 2.10 | % | | | 11.02 | %(a) | | | 2.57 | % | | | 24.20 | % | | | 7.99 | % | |
Ratios to average net assets(b) | |
Total gross expenses | | | 2.16 | %(c) | | | 2.11 | % | | | 2.05 | %(c) | | | 2.06 | % | | | 2.08 | % | |
Total net expenses(d) | | | 2.12 | %(c)(e) | | | 2.11 | %(e) | | | 2.05 | %(c)(e) | | | 2.06 | %(e) | | | 2.06 | %(e) | |
Net investment loss | | | (1.46 | %) | | | (1.71 | %) | | | (1.64 | %) | | | (1.46 | %) | | | (1.27 | %) | |
Supplemental data | |
Net assets, end of period (in thousands) | | $ | 587 | | | $ | 1,517 | | | $ | 2,666 | | | $ | 3,874 | | | $ | 1,428 | | |
Portfolio turnover | | | 142 | % | | | 117 | % | | | 148 | % | | | 104 | % | | | 113 | % | |
Notes to Financial Highlights
(a) The Fund received proceeds from regulatory settlements. Had the Fund not received these proceeds, the total return would have been lower by 0.39%.
(b) In addition to the fees and expenses that the Fund bears directly, the Fund indirectly bears a pro rata share of the fees and expenses of any other funds in which it invests. Such indirect expenses are not included in the Fund's reported expense ratios.
(c) Ratios include line of credit interest expense which is less than 0.01%.
(d) Total net expenses include the impact of certain fee waivers/expense reimbursements made by the Investment Manager and certain of its affiliates, if applicable.
(e) The benefits derived from expense reductions had an impact of less than 0.01%.
(f) Net investment income per share includes special dividends. The effect of these dividends amounted to $0.02 per share.
The accompanying Notes to Financial Statements are an integral part of this statement.
Annual Report 2016
19
COLUMBIA SMALL CAP GROWTH FUND I
FINANCIAL HIGHLIGHTS (continued)
| | | Year Ended August 31, | |
Class C | | 2016 | | 2015 | | 2014 | | 2013 | | 2012 | |
Per share data | |
Net asset value, beginning of period | | $ | 24.87 | | | $ | 27.47 | | | $ | 31.44 | | | $ | 28.19 | | | $ | 28.82 | | |
Income from investment operations: | |
Net investment loss | | | (0.21 | )(f) | | | (0.44 | ) | | | (0.49 | ) | | | (0.41 | ) | | | (0.35 | ) | |
Net realized and unrealized gain | | | 0.30 | | | | 2.85 | | | | 1.62 | | | | 6.51 | | | | 2.45 | | |
Total from investment operations | | | 0.09 | | | | 2.41 | | | | 1.13 | | | | 6.10 | | | | 2.10 | | |
Less distributions to shareholders: | |
Net realized gains | | | (10.22 | ) | | | (5.11 | ) | | | (5.10 | ) | | | (2.85 | ) | | | (2.73 | ) | |
Total distributions to shareholders | | | (10.22 | ) | | | (5.11 | ) | | | (5.10 | ) | | | (2.85 | ) | | | (2.73 | ) | |
Proceeds from regulatory settlements | | | — | | | | 0.10 | | | | — | | | | — | | | | — | | |
Net asset value, end of period | | $ | 14.74 | | | $ | 24.87 | | | $ | 27.47 | | | $ | 31.44 | | | $ | 28.19 | | |
Total return | | | 2.12 | % | | | 11.07 | %(a) | | | 2.57 | % | | | 24.20 | % | | | 7.99 | % | |
Ratios to average net assets(b) | |
Total gross expenses | | | 2.16 | %(c) | | | 2.11 | % | | | 2.05 | %(c) | | | 2.06 | % | | | 2.07 | % | |
Total net expenses(d) | | | 2.12 | %(c)(e) | | | 2.11 | %(e) | | | 2.05 | %(c)(e) | | | 2.06 | %(e) | | | 2.06 | %(e) | |
Net investment loss | | | (1.37 | %) | | | (1.72 | %) | | | (1.63 | %) | | | (1.42 | %) | | | (1.27 | %) | |
Supplemental data | |
Net assets, end of period (in thousands) | | $ | 13,187 | | | $ | 16,810 | | | $ | 18,762 | | | $ | 22,685 | | | $ | 11,287 | | |
Portfolio turnover | | | 142 | % | | | 117 | % | | | 148 | % | | | 104 | % | | | 113 | % | |
Notes to Financial Highlights
(a) The Fund received proceeds from regulatory settlements. Had the Fund not received these proceeds, the total return would have been lower by 0.39%.
(b) In addition to the fees and expenses that the Fund bears directly, the Fund indirectly bears a pro rata share of the fees and expenses of any other funds in which it invests. Such indirect expenses are not included in the Fund's reported expense ratios.
(c) Ratios include line of credit interest expense which is less than 0.01%.
(d) Total net expenses include the impact of certain fee waivers/expense reimbursements made by the Investment Manager and certain of its affiliates, if applicable.
(e) The benefits derived from expense reductions had an impact of less than 0.01%.
(f) Net investment income per share includes special dividends. The effect of these dividends amounted to $0.03 per share.
The accompanying Notes to Financial Statements are an integral part of this statement.
Annual Report 2016
20
COLUMBIA SMALL CAP GROWTH FUND I
FINANCIAL HIGHLIGHTS (continued)
| | | Year Ended August 31, | |
Class I | | 2016 | | 2015 | | 2014 | | 2013 | | 2012 | |
Per share data | |
Net asset value, beginning of period | | $ | 28.27 | | | $ | 30.21 | | | $ | 34.10 | | | $ | 30.09 | | | $ | 30.45 | | |
Income from investment operations: | |
Net investment loss | | | (0.04 | )(f) | | | (0.15 | ) | | | (0.14 | ) | | | (0.04 | ) | | | (0.02 | ) | |
Net realized and unrealized gain | | | 0.45 | | | | 3.19 | | | | 1.73 | | | | 6.99 | | | | 2.59 | | |
Total from investment operations | | | 0.41 | | | | 3.04 | | | | 1.59 | | | | 6.95 | | | | 2.57 | | |
Less distributions to shareholders: | |
Net realized gains | | | (10.22 | ) | | | (5.11 | ) | | | (5.49 | ) | | | (2.94 | ) | | | (2.93 | ) | |
Total distributions to shareholders | | | (10.22 | ) | | | (5.11 | ) | | | (5.49 | ) | | | (2.94 | ) | | | (2.93 | ) | |
Proceeds from regulatory settlements | | | — | | | | 0.13 | | | | — | | | | — | | | | — | | |
Increase from payment by affiliate | | | — | | | | — | | | | 0.01 | | | | — | | | | — | | |
Net asset value, end of period | | $ | 18.46 | | | $ | 28.27 | | | $ | 30.21 | | | $ | 34.10 | | | $ | 30.09 | | |
Total return | | | 3.29 | % | | | 12.42 | %(a) | | | 3.82 | %(b) | | | 25.69 | % | | | 9.27 | % | |
Ratios to average net assets(c) | |
Total gross expenses | | | 0.94 | %(d) | | | 0.91 | % | | | 0.86 | %(d) | | | 0.87 | % | | | 0.88 | % | |
Total net expenses(e) | | | 0.94 | %(d) | | | 0.91 | % | | | 0.86 | %(d) | | | 0.87 | % | | | 0.88 | % | |
Net investment loss | | | (0.23 | %) | | | (0.52 | %) | | | (0.42 | %) | | | (0.12 | %) | | | (0.06 | %) | |
Supplemental data | |
Net assets, end of period (in thousands) | | $ | 37,970 | | | $ | 48,780 | | | $ | 93,740 | | | $ | 77,983 | | | $ | 90,936 | | |
Portfolio turnover | | | 142 | % | | | 117 | % | | | 148 | % | | | 104 | % | | | 113 | % | |
Notes to Financial Highlights
(a) The Fund received proceeds from regulatory settlements. Had the Fund not received these proceeds, the total return would have been lower by 0.39%.
(b) The Fund received a payment from an affiliate. Had the Fund not received this payment, the total return would have been lower by 0.02%.
(c) In addition to the fees and expenses that the Fund bears directly, the Fund indirectly bears a pro rata share of the fees and expenses of any other funds in which it invests. Such indirect expenses are not included in the Fund's reported expense ratios.
(d) Ratios include line of credit interest expense which is less than 0.01%.
(e) Total net expenses include the impact of certain fee waivers/expense reimbursements made by the Investment Manager and certain of its affiliates, if applicable.
(f) Net investment income per share includes special dividends. The effect of these dividends amounted to $0.04 per share.
The accompanying Notes to Financial Statements are an integral part of this statement.
Annual Report 2016
21
COLUMBIA SMALL CAP GROWTH FUND I
FINANCIAL HIGHLIGHTS (continued)
| | | Year Ended August 31, | |
Class K | | 2016 | | 2015 | | 2014 | | 2013(a) | |
Per share data | |
Net asset value, beginning of period | | $ | 27.89 | | | $ | 29.95 | | | $ | 33.85 | | | $ | 29.28 | | |
Income from investment operations: | |
Net investment loss | | | (0.09 | )(g) | | | (0.23 | ) | | | (0.24 | ) | | | (0.11 | ) | |
Net realized and unrealized gain | | | 0.43 | | | | 3.16 | | | | 1.74 | | | | 4.68 | | |
Total from investment operations | | | 0.34 | | | | 2.93 | | | | 1.50 | | | | 4.57 | | |
Less distributions to shareholders: | |
Net realized gains | | | (10.22 | ) | | | (5.11 | ) | | | (5.40 | ) | | | — | | |
Total distributions to shareholders | | | (10.22 | ) | | | (5.11 | ) | | | (5.40 | ) | | | — | | |
Proceeds from regulatory settlements | | | — | | | | 0.12 | | | | — | | | | — | | |
Net asset value, end of period | | $ | 18.01 | | | $ | 27.89 | | | $ | 29.95 | | | $ | 33.85 | | |
Total return | | | 3.02 | % | | | 12.08 | %(b) | | | 3.51 | % | | | 15.61 | % | |
Ratios to average net assets(c) | |
Total gross expenses | | | 1.24 | %(d) | | | 1.21 | % | | | 1.16 | %(d) | | | 1.16 | %(e) | |
Total net expenses(f) | | | 1.24 | %(d) | | | 1.21 | % | | | 1.16 | %(d) | | | 1.16 | %(e) | |
Net investment loss | | | (0.48 | %) | | | (0.83 | %) | | | (0.74 | %) | | | (0.68 | %)(e) | |
Supplemental data | |
Net assets, end of period (in thousands) | | $ | 40 | | | $ | 41 | | | $ | 37 | | | $ | 48 | | |
Portfolio turnover | | | 142 | % | | | 117 | % | | | 148 | % | | | 104 | % | |
Notes to Financial Highlights
(a) Based on operations from February 28, 2013 (commencement of operations) through the stated period end.
(b) The Fund received proceeds from regulatory settlements. Had the Fund not received these proceeds, the total return would have been lower by 0.39%.
(c) In addition to the fees and expenses that the Fund bears directly, the Fund indirectly bears a pro rata share of the fees and expenses of any other funds in which it invests. Such indirect expenses are not included in the Fund's reported expense ratios.
(d) Ratios include line of credit interest expense which is less than 0.01%.
(e) Annualized.
(f) Total net expenses include the impact of certain fee waivers/expense reimbursements made by the Investment Manager and certain of its affiliates, if applicable.
(g) Net investment income per share includes special dividends. The effect of these dividends amounted to $0.04 per share.
The accompanying Notes to Financial Statements are an integral part of this statement.
Annual Report 2016
22
COLUMBIA SMALL CAP GROWTH FUND I
FINANCIAL HIGHLIGHTS (continued)
| | | Year Ended August 31, | |
Class R | | 2016 | | 2015 | | 2014 | | 2013 | | 2012 | |
Per share data | |
Net asset value, beginning of period | | $ | 26.99 | | | $ | 29.25 | | | $ | 33.18 | | | $ | 29.47 | | | $ | 29.88 | | |
Income from investment operations: | |
Net investment loss | | | (0.16 | )(f) | | | (0.33 | ) | | | (0.36 | ) | | | (0.35 | ) | | | (0.21 | ) | |
Net realized and unrealized gain | | | 0.39 | | | | 3.07 | | | | 1.70 | | | | 6.93 | | | | 2.53 | | |
Total from investment operations | | | 0.23 | | | | 2.74 | | | | 1.34 | | | | 6.58 | | | | 2.32 | | |
Less distributions to shareholders: | |
Net realized gains | | | (10.22 | ) | | | (5.11 | ) | | | (5.27 | ) | | | (2.87 | ) | | | (2.73 | ) | |
Total distributions to shareholders | | | (10.22 | ) | | | (5.11 | ) | | | (5.27 | ) | | | (2.87 | ) | | | (2.73 | ) | |
Proceeds from regulatory settlements | | | — | | | | 0.11 | | | | — | | | | — | | | | — | | |
Net asset value, end of period | | $ | 17.00 | | | $ | 26.99 | | | $ | 29.25 | | | $ | 33.18 | | | $ | 29.47 | | |
Total return | | | 2.61 | % | | | 11.63 | %(a) | | | 3.08 | % | | | 24.85 | % | | | 8.48 | % | |
Ratios to average net assets(b) | |
Total gross expenses | | | 1.66 | %(c) | | | 1.61 | % | | | 1.55 | %(c) | | | 1.56 | % | | | 1.57 | % | |
Total net expenses(d) | | | 1.62 | %(c)(e) | | | 1.61 | %(e) | | | 1.55 | %(c)(e) | | | 1.56 | %(e) | | | 1.56 | %(e) | |
Net investment loss | | | (0.88 | %) | | | (1.22 | %) | | | (1.13 | %) | | | (1.11 | %) | | | (0.74 | %) | |
Supplemental data | |
Net assets, end of period (in thousands) | | $ | 1,356 | | | $ | 1,706 | | | $ | 2,500 | | | $ | 3,650 | | | $ | 54 | | |
Portfolio turnover | | | 142 | % | | | 117 | % | | | 148 | % | | | 104 | % | | | 113 | % | |
Notes to Financial Highlights
(a) The Fund received proceeds from regulatory settlements. Had the Fund not received these proceeds, the total return would have been lower by 0.39%.
(b) In addition to the fees and expenses that the Fund bears directly, the Fund indirectly bears a pro rata share of the fees and expenses of any other funds in which it invests. Such indirect expenses are not included in the Fund's reported expense ratios.
(c) Ratios include line of credit interest expense which is less than 0.01%.
(d) Total net expenses include the impact of certain fee waivers/expense reimbursements made by the Investment Manager and certain of its affiliates, if applicable.
(e) The benefits derived from expense reductions had an impact of less than 0.01%.
(f) Net investment income per share includes special dividends. The effect of these dividends amounted to $0.04 per share.
The accompanying Notes to Financial Statements are an integral part of this statement.
Annual Report 2016
23
COLUMBIA SMALL CAP GROWTH FUND I
FINANCIAL HIGHLIGHTS (continued)
| | | Year Ended August 31, | |
Class R4 | | 2016 | | 2015 | | 2014 | | 2013(a) | |
Per share data | |
Net asset value, beginning of period | | $ | 28.69 | | | $ | 30.64 | | | $ | 34.52 | | | $ | 29.37 | | |
Income from investment operations: | |
Net investment loss | | | (0.03 | )(h) | | | (0.20 | ) | | | (0.23 | ) | | | (0.18 | ) | |
Net realized and unrealized gain | | | 0.42 | | | | 3.24 | | | | 1.78 | | | | 8.25 | | |
Total from investment operations | | | 0.39 | | | | 3.04 | | | | 1.55 | | | | 8.07 | | |
Less distributions to shareholders: | |
Net realized gains | | | (10.22 | ) | | | (5.11 | ) | | | (5.43 | ) | | | (2.92 | ) | |
Total distributions to shareholders | | | (10.22 | ) | | | (5.11 | ) | | | (5.43 | ) | | | (2.92 | ) | |
Proceeds from regulatory settlements | | | — | | | | 0.12 | | | | — | | | | — | | |
Net asset value, end of period | | $ | 18.86 | | | $ | 28.69 | | | $ | 30.64 | | | $ | 34.52 | | |
Total return | | | 3.15 | % | | | 12.18 | %(b) | | | 3.59 | % | | | 30.11 | % | |
Ratios to average net assets(c) | |
Total gross expenses | | | 1.16 | %(d) | | | 1.10 | % | | | 1.04 | %(d) | | | 1.09 | %(e) | |
Total net expenses(f) | | | 1.10 | %(d)(g) | | | 1.10 | %(g) | | | 1.04 | %(d)(g) | | | 1.09 | %(e)(g) | |
Net investment loss | | | (0.16 | %) | | | (0.68 | %) | | | (0.67 | %) | | | (0.67 | %)(e) | |
Supplemental data | |
Net assets, end of period (in thousands) | | $ | 1,283 | | | $ | 69 | | | $ | 167 | | | $ | 818 | | |
Portfolio turnover | | | 142 | % | | | 117 | % | | | 148 | % | | | 104 | % | |
Notes to Financial Highlights
(a) Based on operations from November 8, 2012 (commencement of operations) through the stated period end.
(b) The Fund received proceeds from regulatory settlements. Had the Fund not received these proceeds, the total return would have been lower by 0.39%.
(c) In addition to the fees and expenses that the Fund bears directly, the Fund indirectly bears a pro rata share of the fees and expenses of any other funds in which it invests. Such indirect expenses are not included in the Fund's reported expense ratios.
(d) Ratios include line of credit interest expense which is less than 0.01%.
(e) Annualized.
(f) Total net expenses include the impact of certain fee waivers/expense reimbursements made by the Investment Manager and certain of its affiliates, if applicable.
(g) The benefits derived from expense reductions had an impact of less than 0.01%.
(h) Net investment income per share includes special dividends. The effect of these dividends amounted to $0.07 per share.
The accompanying Notes to Financial Statements are an integral part of this statement.
Annual Report 2016
24
COLUMBIA SMALL CAP GROWTH FUND I
FINANCIAL HIGHLIGHTS (continued)
| | | Year Ended August 31, | |
Class R5 | | 2016 | | 2015 | | 2014 | | 2013(a) | |
Per share data | |
Net asset value, beginning of period | | $ | 28.11 | | | $ | 30.09 | | | $ | 33.90 | | | $ | 29.28 | | |
Income from investment operations: | |
Net investment loss | | | (0.04 | )(h) | | | (0.16 | ) | | | (0.14 | ) | | | (0.07 | ) | |
Net realized and unrealized gain | | | 0.43 | | | | 3.17 | | | | 1.80 | | | | 4.69 | | |
Total from investment operations | | | 0.39 | | | | 3.01 | | | | 1.66 | | | | 4.62 | | |
Less distributions to shareholders: | |
Net realized gains | | | (10.22 | ) | | | (5.11 | ) | | | (5.48 | ) | | | — | | |
Total distributions to shareholders | | | (10.22 | ) | | | (5.11 | ) | | | (5.48 | ) | | | — | | |
Proceeds from regulatory settlements | | | — | | | | 0.12 | | | | — | | | | — | | |
Increase from payment by affiliate | | | — | | | | — | | | | 0.01 | | | | — | | |
Net asset value, end of period | | $ | 18.28 | | | $ | 28.11 | | | $ | 30.09 | | | $ | 33.90 | | |
Total return | | | 3.24 | % | | | 12.33 | %(b) | | | 4.07 | %(c) | | | 15.78 | % | |
Ratios to average net assets(d) | |
Total gross expenses | | | 0.99 | %(e) | | | 0.96 | % | | | 0.91 | %(e) | | | 0.93 | %(f) | |
Total net expenses(g) | | | 0.99 | %(e) | | | 0.96 | % | | | 0.91 | %(e) | | | 0.93 | %(f) | |
Net investment loss | | | (0.23 | %) | | | (0.58 | %) | | | (0.46 | %) | | | (0.41 | %)(f) | |
Supplemental data | |
Net assets, end of period (in thousands) | | $ | 11,704 | | | $ | 11,990 | | | $ | 721 | | | $ | 1,145 | | |
Portfolio turnover | | | 142 | % | | | 117 | % | | | 148 | % | | | 104 | % | |
Notes to Financial Highlights
(a) Based on operations from February 28, 2013 (commencement of operations) through the stated period end.
(b) The Fund received proceeds from regulatory settlements. Had the Fund not received these proceeds, the total return would have been lower by 0.39%.
(c) The Fund received a payment from an affiliate. Had the Fund not received this payment, the total return would have been lower by 0.05%.
(d) In addition to the fees and expenses that the Fund bears directly, the Fund indirectly bears a pro rata share of the fees and expenses of any other funds in which it invests. Such indirect expenses are not included in the Fund's reported expense ratios.
(e) Ratios include line of credit interest expense which is less than 0.01%.
(f) Annualized.
(g) Total net expenses include the impact of certain fee waivers/expense reimbursements made by the Investment Manager and certain of its affiliates, if applicable.
(h) Net investment income per share includes special dividends. The effect of these dividends amounted to $0.05 per share.
The accompanying Notes to Financial Statements are an integral part of this statement.
Annual Report 2016
25
COLUMBIA SMALL CAP GROWTH FUND I
FINANCIAL HIGHLIGHTS (continued)
| | | Year Ended August 31, | |
Class Y | | 2016 | | 2015 | | 2014 | | 2013 | | 2012 | |
Per share data | |
Net asset value, beginning of period | | $ | 28.24 | | | $ | 30.19 | | | $ | 34.09 | | | $ | 30.08 | | | $ | 30.44 | | |
Income from investment operations: | |
Net investment income (loss) | | | (0.03 | )(a) | | | (0.14 | ) | | | (0.14 | ) | | | (0.04 | ) | | | (0.02 | ) | |
Net realized and unrealized gain | | | 0.44 | | | | 3.18 | | | | 1.73 | | | | 6.99 | | | | 2.59 | | |
Total from investment operations | | | 0.41 | | | | 3.04 | | | | 1.59 | | | | 6.95 | | | | 2.57 | | |
Less distributions to shareholders: | |
Net realized gains | | | (10.22 | ) | | | (5.11 | ) | | | (5.49 | ) | | | (2.94 | ) | | | (2.93 | ) | |
Total distributions to shareholders | | | (10.22 | ) | | | (5.11 | ) | | | (5.49 | ) | | | (2.94 | ) | | | (2.93 | ) | |
Proceeds from regulatory settlements | | | — | | | | 0.12 | | | | — | | | | — | | | | — | | |
Net asset value, end of period | | $ | 18.43 | | | $ | 28.24 | | | $ | 30.19 | | | $ | 34.09 | | | $ | 30.08 | | |
Total return | | | 3.30 | % | | | 12.38 | %(b) | | | 3.78 | % | | | 25.70 | % | | | 9.27 | % | |
Ratios to average net assets(c) | |
Total gross expenses | | | 0.94 | %(d) | | | 0.90 | % | | | 0.86 | %(d) | | | 0.87 | % | | | 0.88 | % | |
Total net expenses(e) | | | 0.94 | %(d) | | | 0.90 | % | | | 0.86 | %(d) | | | 0.87 | % | | | 0.88 | % | |
Net investment loss | | | (0.14 | %) | | | (0.50 | %) | | | (0.43 | %) | | | (0.14 | %) | | | (0.07 | %) | |
Supplemental data | |
Net assets, end of period (in thousands) | | $ | 6,562 | | | $ | 3,823 | | | $ | 4,491 | | | $ | 14,817 | | | $ | 12,496 | | |
Portfolio turnover | | | 142 | % | | | 117 | % | | | 148 | % | | | 104 | % | | | 113 | % | |
Notes to Financial Highlights
(a) Net investment income per share includes special dividends. The effect of these dividends amounted to $0.05 per share.
(b) The Fund received proceeds from regulatory settlements. Had the Fund not received these proceeds, the total return would have been lower by 0.39%.
(c) In addition to the fees and expenses that the Fund bears directly, the Fund indirectly bears a pro rata share of the fees and expenses of any other funds in which it invests. Such indirect expenses are not included in the Fund's reported expense ratios.
(d) Ratios include line of credit interest expense which is less than 0.01%.
(e) Total net expenses include the impact of certain fee waivers/expense reimbursements made by the Investment Manager and certain of its affiliates, if applicable.
The accompanying Notes to Financial Statements are an integral part of this statement.
Annual Report 2016
26
COLUMBIA SMALL CAP GROWTH FUND I
FINANCIAL HIGHLIGHTS (continued)
| | | Year Ended August 31, | |
Class Z | | 2016 | | 2015 | | 2014 | | 2013 | | 2012 | |
Per share data | |
Net asset value, beginning of period | | $ | 27.98 | | | $ | 30.01 | | | $ | 33.91 | | | $ | 29.98 | | | $ | 30.35 | | |
Income from investment operations: | |
Net investment loss | | | (0.07 | )(f) | | | (0.20 | ) | | | (0.21 | ) | | | (0.10 | ) | | | (0.08 | ) | |
Net realized and unrealized gain | | | 0.44 | | | | 3.16 | | | | 1.74 | | | | 6.95 | | | | 2.59 | | |
Total from investment operations | | | 0.37 | | | | 2.96 | | | | 1.53 | | | | 6.85 | | | | 2.51 | | |
Less distributions to shareholders: | |
Net realized gains | | | (10.22 | ) | | | (5.11 | ) | | | (5.43 | ) | | | (2.92 | ) | | | (2.88 | ) | |
Total distributions to shareholders | | | (10.22 | ) | | | (5.11 | ) | | | (5.43 | ) | | | (2.92 | ) | | | (2.88 | ) | |
Proceeds from regulatory settlements | | | — | | | | 0.12 | | | | — | | | | — | | | | — | | |
Net asset value, end of period | | $ | 18.13 | | | $ | 27.98 | | | $ | 30.01 | | | $ | 33.91 | | | $ | 29.98 | | |
Total return | | | 3.15 | % | | | 12.16 | %(a) | | | 3.61 | % | | | 25.42 | % | | | 9.06 | % | |
Ratios to average net assets(b) | |
Total gross expenses | | | 1.15 | %(c) | | | 1.11 | % | | | 1.05 | %(c) | | | 1.07 | % | | | 1.07 | % | |
Total net expenses(d) | | | 1.12 | %(c)(e) | | | 1.11 | %(e) | | | 1.05 | %(c)(e) | | | 1.06 | %(e) | | | 1.06 | %(e) | |
Net investment loss | | | (0.38 | %) | | | (0.69 | %) | | | (0.64 | %) | | | (0.34 | %) | | | (0.26 | %) | |
Supplemental data | |
Net assets, end of period (in thousands) | | $ | 157,826 | | | $ | 215,938 | | | $ | 693,432 | | | $ | 1,002,689 | | | $ | 839,982 | | |
Portfolio turnover | | | 142 | % | | | 117 | % | | | 148 | % | | | 104 | % | | | 113 | % | |
Notes to Financial Highlights
(a) The Fund received proceeds from regulatory settlements. Had the Fund not received these proceeds, the total return would have been lower by 0.39%.
(b) In addition to the fees and expenses that the Fund bears directly, the Fund indirectly bears a pro rata share of the fees and expenses of any other funds in which it invests. Such indirect expenses are not included in the Fund's reported expense ratios.
(c) Ratios include line of credit interest expense which is less than 0.01%.
(d) Total net expenses include the impact of certain fee waivers/expense reimbursements made by the Investment Manager and certain of its affiliates, if applicable.
(e) The benefits derived from expense reductions had an impact of less than 0.01%.
(f) Net investment income per share includes special dividends. The effect of these dividends amounted to $0.04 per share.
The accompanying Notes to Financial Statements are an integral part of this statement.
Annual Report 2016
27
COLUMBIA SMALL CAP GROWTH FUND I
NOTES TO FINANCIAL STATEMENTS
August 31, 2016
Note 1. Organization
Columbia Small Cap Growth Fund I (the Fund), a series of Columbia Funds Series Trust I (the Trust), is a diversified fund. The Trust is registered under the Investment Company Act of 1940, as amended (the 1940 Act), as an open-end management investment company organized as a Massachusetts business trust.
Fund Shares
The Trust may issue an unlimited number of shares (without par value). The Fund offers Class A, Class B, Class C, Class I, Class K, Class R, Class R4, Class R5, Class Y and Class Z shares. Although all share classes generally have identical voting, dividend and liquidation rights, each share class votes separately when required by the Trust's organizational documents or by law. Different share classes pay different distribution amounts to the extent the expenses of such share classes differ, and distributions in liquidation will be proportional to the net asset value of each share class. Each share class has its own expense and sales charge structure.
Effective February 1, 2016, the Fund re-opened to permit new investors and new accounts by existing investors. Prior to February 1, 2016, the Fund was closed to new investors and new accounts, subject to certain limited exceptions.
Class A shares are subject to a maximum front-end sales charge of 5.75% based on the initial investment amount. Class A shares purchased without an initial sales charge in accounts aggregating $1 million to $50 million at the time of purchase are subject to a contingent deferred sales charge (CDSC) if the shares are sold within 18 months after purchase, charged as follows: 1.00% CDSC if redeemed within 12 months after purchase, and 0.50% CDSC if redeemed more than 12, but less than 18, months after purchase.
Class B shares may be subject to a maximum CDSC of 5.00% based upon the holding period after purchase. Class B shares will generally convert to Class A shares eight years after purchase. Class B shares are generally closed to new and existing investors.
Class C shares are subject to a 1.00% CDSC on shares redeemed within 12 months after purchase.
Class I shares are not subject to sales charges and are available only to the Columbia Family of Funds.
Class K shares are not subject to sales charges, however this share class is closed to new investors.
Class R shares are not subject to sales charges and are generally available only to certain retirement plans and other investors as described in the Fund's prospectus.
Class R4 shares are not subject to sales charges and are generally available only to omnibus retirement plans and certain investors as described in the Fund's prospectus.
Class R5 shares are not subject to sales charges and are generally available only to investors purchasing through authorized investment professionals and omnibus retirement plans.
Class Y shares are not subject to sales charges and are generally available only to certain retirement plans as described in the Fund's prospectus.
Class Z shares are not subject to sales charges and are generally available only to eligible investors, which are subject to different investment minimums as described in the Fund's prospectus.
Note 2. Summary of Significant Accounting Policies
Basis of Preparation
The Fund is an investment company that applies the accounting and reporting guidance in the Financial Accounting Standards Board (FASB) Accounting Standards Codification Topic 946, Financial Services — Investment Companies (ASC 946). The financial statements are prepared in accordance with U.S. generally accepted accounting principles (GAAP), which requires management to make certain estimates and assumptions that affect the reported amounts of assets and liabilities, the disclosure of contingent assets and liabilities at the date of the financial statements and the reported amounts of income and expenses during the reporting period. Actual results could differ from those estimates.
The following is a summary of significant accounting policies followed by the Fund in the preparation of its financial statements.
Security Valuation
All equity securities are valued at the close of business of the New York Stock Exchange (NYSE). Equity securities are valued at the last quoted sales price on the principal exchange or market on which they trade, except for securities traded on the NASDAQ Stock Market, which are valued at the NASDAQ official close price. Unlisted securities or listed securities for which there were no sales during the day are valued at the mean of the latest quoted bid and ask prices on such exchanges or markets.
Annual Report 2016
28
COLUMBIA SMALL CAP GROWTH FUND I
NOTES TO FINANCIAL STATEMENTS (continued)
August 31, 2016
Foreign equity securities are valued based on the closing price on the foreign exchange in which such securities are primarily traded. If any foreign equity security closing prices are not readily available, the securities are valued at the mean of the latest quoted bid and ask prices on such exchanges or markets. Foreign currency exchange rates are generally determined at 4:00 p.m. Eastern (U.S.) time. Many securities markets and exchanges outside the U.S. close prior to the close of the NYSE; therefore, the closing prices for securities in such markets or on such exchanges may not fully reflect events that occur after such close but before the close of the NYSE. In those situations, foreign securities will be fair valued pursuant to a policy adopted by the Board of Trustees (the Board), including, if available, utilizing a third party pricing service to determine these fair values. The third party pricing service takes into account multiple factors, including, but not limited to, movements in the U.S. securities markets, certain depositary receipts, futures contracts and foreign exchange rates that have occurred subsequent to the close of the foreign exchange or market, to determine a good faith estimate that reasonably reflects the current market conditions as of the close of the NYSE. The fair value of a security is likely to be different from the quoted or published price, if available.
Investments in open-end investment companies, including money market funds, are valued at their latest net asset value.
Investments for which market quotations are not readily available, or that have quotations which management believes are not reflective of market value or reliable, are valued at fair value as determined in good faith under procedures approved by and under the general supervision of the Board. If a security or class of securities (such as foreign securities) is valued at fair value, such value is likely to be different from the quoted or published price for the security.
The determination of fair value often requires significant judgment. To determine fair value, management may use assumptions including but not limited to future cash flows and estimated risk premiums. Multiple inputs from various sources may be used to determine fair value.
GAAP requires disclosure regarding the inputs and valuation techniques used to measure fair value and any changes in valuation inputs or techniques. In addition, investments shall be disclosed by major category. This information is disclosed following the Fund's Portfolio of Investments.
Security Transactions
Security transactions are accounted for on the trade date. Cost is determined and gains (losses) are based upon the specific identification method for both financial statement and federal income tax purposes.
Income Recognition
Corporate actions and dividend income are generally recorded net of any non-reclaimable tax withholdings, on the ex-dividend date or upon receipt of ex-dividend notification in the case of certain foreign securities.
The Fund may receive distributions from holdings in equity securities, business development companies (BDCs), exchange-traded funds, other regulated investment companies (RICs), and real estate investment trusts (REITs), which report information on the tax character of their distributions annually. These distributions are allocated to dividend income, capital gain and return of capital based on actual information reported. Return of capital is recorded as a reduction of the cost basis of securities held. If the Fund no longer owns the applicable securities, return of capital is recorded as a realized gain. With respect to REITs, to the extent actual information has not yet been reported, estimates for return of capital are made by the Fund's management. Management's estimates are subsequently adjusted when the actual character of the distributions is disclosed by the REITs, which could result in a proportionate change in return of capital to shareholders.
Awards from class action litigation are recorded as a reduction of cost basis if the Fund still owns the applicable securities on the payment date. If the Fund no longer owns the applicable securities, the proceeds are recorded as realized gains.
Expenses
General expenses of the Trust are allocated to the Fund and other funds of the Trust based upon relative net assets or other expense allocation methodologies determined by the nature of the expense. Expenses directly attributable to the Fund are charged to the Fund. Expenses directly attributable to a specific class of shares are charged to that share class.
Determination of Class Net Asset Value
All income, expenses (other than class-specific expenses, which are charged to that share class, as shown in the Statement of Operations) and realized and unrealized gains (losses) are allocated to each class of
Annual Report 2016
29
COLUMBIA SMALL CAP GROWTH FUND I
NOTES TO FINANCIAL STATEMENTS (continued)
August 31, 2016
the Fund on a daily basis, based on the relative net assets of each class, for purposes of determining the net asset value of each class.
Federal Income Tax Status
The Fund intends to qualify each year as a regulated investment company under Subchapter M of the Internal Revenue Code, as amended, and will distribute substantially all of its taxable income (including net short-term capital gains), if any, for its tax year, and as such will not be subject to federal income taxes. In addition, the Fund intends to distribute in each calendar year substantially all of its net investment income, capital gains and certain other amounts, if any, such that the Fund should not be subject to federal excise tax. Therefore, no federal income or excise tax provision is recorded.
Foreign Taxes
The Fund may be subject to foreign taxes on income, gains on investments or currency repatriation, a portion of which may be recoverable. The Fund will accrue such taxes and recoveries, as applicable, based upon its current interpretation of tax rules and regulations that exist in the markets in which it invests.
Realized gains in certain countries may be subject to foreign taxes at the Fund level, based on statutory rates. The Fund accrues for such foreign taxes on realized and unrealized gains at the appropriate rate for each jurisdiction, as applicable. The amount, if any, is disclosed as a liability on the Statement of Assets and Liabilities.
Distributions to Shareholders
Distributions from net investment income, if any, are declared and paid annually. Net realized capital gains, if any, are distributed along with the income distribution. Income distributions and capital gain distributions are determined in accordance with federal income tax regulations, which may differ from GAAP.
Guarantees and Indemnifications
Under the Trust's organizational documents and, in some cases, by contract, its officers and trustees are indemnified against certain liabilities arising out of the performance of their duties to the Trust or its funds. In addition, certain of the Fund's contracts with its service providers contain general indemnification clauses. The Fund's maximum exposure under these arrangements is unknown since the amount of any future claims that may be made against the Fund cannot be determined, and
the Fund has no historical basis for predicting the likelihood of any such claims.
Note 3. Fees and Other Transactions with Affiliates
Management Services Fees
Effective January 1, 2016, the Fund entered into a Management Agreement with Columbia Management Investment Advisers, LLC (the Investment Manager), a wholly-owned subsidiary of Ameriprise Financial, Inc. (Ameriprise Financial). Under the Management Agreement, the Investment Manager provides the Fund with investment research and advice, as well as administrative and accounting services. The management services fee is an annual fee that is equal to a percentage of the Fund's average daily net assets that declines from 0.87% to 0.75% as the Fund's net assets increase. Prior to January 1, 2016, the Fund paid the Investment Manager an annual fee for advisory services under an Investment Management Services Agreement and a separate annual fee for administrative and accounting services under an Administrative Services Agreement. The effective management services fee rate for the year ended August 31, 2016 (reflecting all advisory and administrative services fees paid to the Investment Manager) was 0.87% of the Fund's average daily net assets. For the period from September 1, 2015 through December 31, 2015, the investment advisory services fee paid to the Investment Manager was $1,248,693, and the administrative services fee paid to the Investment Manager was $126,449.
Compensation of Board Members
Board members, who are not officers or employees of the Investment Manager or Ameriprise Financial, are compensated for their services to the Fund as disclosed in the Statement of Operations. These Board members may participate in a Deferred Compensation Plan (the Plan) which may be terminated at any time. Obligations of the Plan will be paid solely out of the Fund's assets, and all amounts payable under the Plan constitute a general unsecured obligation of the Fund.
Compensation of Chief Compliance Officer
The Board has appointed a Chief Compliance Officer to the Fund in accordance with federal securities regulations. The Fund is allocated a portion of the expenses associated with the Chief Compliance Officer based on relative net assets of the Trust.
Annual Report 2016
30
COLUMBIA SMALL CAP GROWTH FUND I
NOTES TO FINANCIAL STATEMENTS (continued)
August 31, 2016
Transfer Agency Fees
Under a Transfer and Dividend Disbursing Agent Agreement, Columbia Management Investment Services Corp. (the Transfer Agent), an affiliate of the Investment Manager and a wholly-owned subsidiary of Ameriprise Financial, is responsible for providing transfer agency services to the Fund. The Transfer Agent has contracted with Boston Financial Data Services (BFDS) to serve as sub-transfer agent. The Transfer Agent pays the fees of BFDS for services as sub-transfer agent and BFDS is not entitled to reimbursement for such fees from the Fund (with the exception of out-of-pocket fees).
The Fund pays the Transfer Agent a monthly transfer agency fee based on the number or the average value of accounts, depending on the type of account. In addition, prior to October 1, 2016, the Transfer Agent also received sub-transfer agency fees based on a percentage of the average aggregate value of the Fund's shares maintained in omnibus accounts (other than omnibus accounts for which American Enterprise Investment Services Inc. is the broker of record or accounts where the beneficial shareholder is a customer of Ameriprise Financial Services, Inc., for which the Transfer Agent receives a per account fee). Effective October 1, 2016, the Fund pays the Transfer Agent a fee for shareholder services based on the number of accounts or on a percentage of the average aggregate value of the Fund's shares maintained in omnibus accounts up to the lesser of the amount charged by the servicing agent or a cap established by the Board from time to time.
The Transfer Agent also receives compensation from the Fund for various shareholder services and reimbursements for certain out-of-pocket fees. Total transfer agency fees for Class K and Class R5 shares are subject to an annual limitation of not more than 0.05% of the average daily net assets attributable to each share class. Class I and Class Y shares do not pay transfer agency fees.
For the year ended August 31, 2016, the Fund's effective transfer agency fee rates as a percentage of average daily net assets of each class were as follows:
Class A | | | 0.21 | % | |
Class B | | | 0.22 | | |
Class C | | | 0.21 | | |
Class K | | | 0.05 | | |
Class R | | | 0.22 | | |
Class R4 | | | 0.21 | | |
Class R5 | | | 0.05 | | |
Class Z | | | 0.22 | | |
The Fund and certain other associated investment companies have severally, but not jointly, guaranteed the performance and observance of all the terms and conditions of a lease entered into by Seligman Data Corp. (SDC), the former transfer agent, including the payment of rent by SDC (the Guaranty). SDC was the legacy Seligman funds' former transfer agent.
The lease and the Guaranty expire in January 2019. At August 31, 2016, the Fund's total potential future obligation over the life of the Guaranty is $15,567. The liability remaining at August 31, 2016 for non-recurring charges associated with the lease amounted to $10,432 and is recorded as a part of the payable for other expenses in the Statement of Assets and Liabilities.
An annual minimum account balance fee of $20 may apply to certain accounts with a value below the applicable share class's initial minimum investment requirements to reduce the impact of small accounts on transfer agency fees. These minimum account balance fees are remitted to the Fund and recorded as part of expense reductions in the Statement of Operations. For the year ended August 31, 2016, these minimum account balance fees reduced total expenses of the Fund by $8,076.
Plan Administration Fees
Under a Plan Administration Services Agreement with the Transfer Agent, the Fund pays an annual fee at a rate of 0.25% of the Fund's average daily net assets attributable to Class K shares for the provision of various administrative, recordkeeping, communication and educational services.
Distribution and Service Fees
The Fund has an agreement with Columbia Management Investment Distributors, Inc. (the Distributor), an affiliate of the Investment Manager and a wholly-owned subsidiary of Ameriprise Financial, for distribution and shareholder services. The Board has approved, and the Fund has adopted, distribution and shareholder service plans (the Plans) applicable to certain share classes, which set the distribution and service fees for the Fund. These fees are calculated daily and are intended to compensate the Distributor and/or eligible selling and/or servicing agents for selling shares of the Fund and providing services to investors.
Under the Plans, the Fund pays a monthly service fee to the Distributor at the maximum annual rate of 0.25% of the average daily net assets attributable to Class A, Class B and Class C shares of the Fund. Also under the Plans, the Fund pays a monthly distribution fee to the
Annual Report 2016
31
COLUMBIA SMALL CAP GROWTH FUND I
NOTES TO FINANCIAL STATEMENTS (continued)
August 31, 2016
Distributor at the maximum annual rates of 0.10%, 0.75%, 0.75% and 0.50% of the average daily net assets attributable to Class A, Class B, Class C and Class R shares of the Fund, respectively.
Although the Fund may pay distribution and service fees up to a maximum annual rate of 0.35% of the Fund's average daily net assets attributable to Class A shares (comprised of up to 0.10% for distribution services and up to 0.25% for shareholder liaison services), the Fund currently limits such fees to an aggregate fee of not more than 0.25% of the Fund's average daily net assets attributable to Class A shares.
Sales Charges
Sales charges, including front-end charges and CDSCs, received by the Distributor for distributing Fund shares were $36,515 for Class A, $88 for Class B and $101 for Class C shares for the year ended August 31, 2016.
Expenses Waived/Reimbursed by the Investment Manager and its Affiliates
The Fund's expense ratio is subject to an expense reimbursement arrangement pursuant to which fees will be waived and/or expenses reimbursed (excluding certain fees and expenses described below), so that the Fund's net operating expenses, after giving effect to fees waived/expenses reimbursed and any balance credits and/or overdraft charges from the Fund's custodian, do not exceed the annual rates of:
| | | Contractual
Expense Cap
January 1, 2016
through
December 31, 2016 | | Voluntary
Expense Cap
Prior to
January 1, 2016 | |
Class A | | | 1.35 | % | | | 1.39 | % | |
Class B | | | 2.10 | | | | 2.14 | | |
Class C | | | 2.10 | | | | 2.14 | | |
Class I | | | 0.94 | | | | 0.98 | | |
Class K | | | 1.24 | | | | 1.28 | | |
Class R | | | 1.60 | | | | 1.64 | | |
Class R4 | | | 1.10 | | | | 1.14 | | |
Class R5 | | | 0.99 | | | | 1.03 | | |
Class Y | | | 0.94 | | | | 0.98 | | |
Class Z | | | 1.10 | | | | 1.14 | | |
The contractual agreement may be modified or amended only with approval from the Investment Manager, certain of its affiliates and the Fund. Under the arrangements, the following fees and expenses are excluded from the
waiver/reimbursement commitment, and therefore will be paid by the Fund, if applicable: taxes (including foreign transaction taxes), expenses associated with investments in affiliated and non-affiliated pooled investment vehicles (including mutual funds and exchange-traded funds), transaction costs and brokerage commissions, costs related to any securities lending program, dividend and interest expenses associated with securities sold short, inverse floater program fees and expenses, transaction charges and interest on borrowed money, interest and infrequent and/or unusual expenses. Any fees waived and/or expenses reimbursed under the expense reimbursement arrangements described above are not recoverable by the Investment Manager or its affiliates in future periods.
Note 4. Federal Tax Information
The timing and character of income and capital gain distributions are determined in accordance with income tax regulations, which may differ from GAAP because of temporary or permanent book to tax differences.
At August 31, 2016, these differences are primarily due to differing treatment for deferral/reversal of wash sale losses, Trustees' deferred compensation, investments in partnerships, net operating loss reclassification and passive foreign investment company (PFIC) holdings. To the extent these differences are permanent, reclassifications are made among the components of the Fund's net assets in the Statement of Assets and Liabilities. Temporary differences do not require reclassifications.
In the Statement of Assets and Liabilities the following reclassifications were made:
Excess of distributions over net investment income | | $ | 3,152,159 | | |
Accumulated net realized gain | | | (3,152,159 | ) | |
Net investment income (loss) and net realized gains (losses), as disclosed in the Statement of Operations, and net assets were not affected by this reclassification.
The tax character of distributions paid during the years indicated was as follows:
Year Ended August 31, | | 2016 | | 2015 | |
Ordinary income | | $ | 27,509,416 | | | $ | — | | |
Long-term capital gains | | | 148,723,701 | | | | 144,378,831 | | |
Total | | $ | 176,233,117 | | | $ | 144,378,831 | | |
Annual Report 2016
32
COLUMBIA SMALL CAP GROWTH FUND I
NOTES TO FINANCIAL STATEMENTS (continued)
August 31, 2016
Short-term capital gain distributions, if any, are considered ordinary income distributions for tax purposes.
At August 31, 2016, the components of distributable earnings on a tax basis were as follows:
Undistributed ordinary income | | $ | 3,088,490 | | |
Undistributed long-term capital gains | | | 22,720,164 | | |
Net unrealized appreciation | | | 34,576,986 | | |
At August 31, 2016, the cost of investments for federal income tax purposes was $374,097,011 and the aggregate gross unrealized appreciation and depreciation based on that cost was:
Unrealized appreciation | | $ | 53,075,857 | | |
Unrealized depreciation | | | (18,498,871 | ) | |
Net unrealized appreciation | | $ | 34,576,986 | | |
For the year ended August 31, 2016, $2,033,760 of capital loss carryforward was utilized.
Management of the Fund has concluded that there are no significant uncertain tax positions in the Fund that would require recognition in the financial statements. However, management's conclusion may be subject to review and adjustment at a later date based on factors including, but not limited to, new tax laws, regulations, and administrative interpretations (including relevant court decisions). Generally, the Fund's federal tax returns for the prior three fiscal years remain subject to examination by the Internal Revenue Service.
Note 5. Portfolio Information
The cost of purchases and proceeds from sales of securities, excluding short-term investments and derivatives, if any, aggregated to $591,115,735 and $700,653,159, respectively, for the year ended August 31, 2016. The amount of purchase and sale activity impacts the portfolio turnover rate reported in the Financial Highlights.
Note 6. Regulatory Settlements
During the year ended August 31, 2015, the Fund recorded a receivable of $2,181,933 as a result of a regulatory settlement proceeding brought by the Securities and Exchange Commission against an unaffiliated third party relating to market timing and/or late trading of mutual funds. This amount represented the Fund's portion of the proceeds from the settlement
(neither the Fund nor the Investment Manager were a party to the proceeding). The payments have been included in Proceeds from regulatory settlements in the Statement of Changes in Net Assets.
Note 7. Affiliated Money Market Fund
The Fund invests in Columbia Short-Term Cash Fund, an affiliated money market fund established for the exclusive use by the Fund and other affiliated funds. The income earned by the Fund from such investments is included as Dividends — affiliated issuers in the Statement of Operations. As an investing fund, the Fund indirectly bears its proportionate share of the expenses of Columbia Short-Term Cash Fund.
Note 8. Line of Credit
The Fund has access to a revolving credit facility whereby the Fund may borrow for the temporary funding of shareholder redemptions or for other temporary or emergency purposes. Effective December 8, 2015, Citibank, N.A. and HSBC Bank USA, N.A. joined JPMorgan Chase Bank, N.A. (JPMorgan) as lead of a syndicate of banks under the credit facility, which is a collective agreement between the Fund and certain other funds managed by the Investment Manager, severally and not jointly, that permits collective borrowings up to $1 billion. Interest is charged to each participating fund based on its borrowings at a rate equal to the higher of (i) the overnight federal funds rate plus 1.00% or (ii) the one-month LIBOR rate plus 1.00%. Each borrowing under the credit facility matures no later than 60 days after the date of borrowing. The Fund also pays a commitment fee equal to its pro rata share of the amount of the credit facility at a rate of 0.15% per annum. The commitment fee is included in other expenses in the Statement of Operations. Prior to December 8, 2015, JPMorgan was the sole lead bank under the credit facility agreement that permitted borrowings up to $550 million under the same terms and interest rates as described above with the exception of the commitment fee which was charged at a rate of 0.075% per annum.
For the year ended August 31, 2016, the average daily loan balance outstanding on days when borrowing existed was $8,850,000 at a weighted average interest rate of 1.28%. Interest expense incurred by the Fund is recorded as a line of credit interest expense in the Statement of Operations. The Fund had no outstanding borrowings at August 31, 2016.
Annual Report 2016
33
COLUMBIA SMALL CAP GROWTH FUND I
NOTES TO FINANCIAL STATEMENTS (continued)
August 31, 2016
Note 9. Significant Risks
Shareholder Concentration Risk
At August 31, 2016, affiliated shareholders of record owned 19.3% of the outstanding shares of the Fund in one or more accounts. Subscription and redemption activity by concentrated accounts may have a significant effect on the operations of the Fund. In the case of a large redemption, the Fund may be forced to sell investments at inopportune times, including its liquid or more liquid positions, resulting in Fund losses and the Fund holding a higher percentage of less liquid or illiquid securities. Large redemptions could result in decreased economies of scale and increased operating expenses for non-redeeming Fund shareholders.
Consumer Discretionary Sector Risk
The Fund may be more susceptible to the particular risks that may affect companies in the consumer discretionary sector than if it were invested in a wider variety of companies in unrelated sectors. Companies in the consumer discretionary sector are subject to certain risks, including fluctuations in the performance of the overall domestic and international economy, interest rate changes, increased competition and consumer confidence. Performance of such companies may be affected by factors including reduced disposable household income, reduced consumer spending, changing demographics and consumer tastes.
Health Care Sector Risk
The Fund may be more susceptible to the particular risks that may affect companies in the health care sector than if it were invested in a wider variety of companies in unrelated sectors. Companies in the health care sector are subject to certain risks, including restrictions on government reimbursement for medical expenses, government approval of medical products and services, competitive pricing pressures, and the rising cost of medical products and services (especially for companies dependent upon a relatively limited number of products or services). Performance of such companies may be affected by factors including, government regulation, obtaining and protecting patents (or the failure to do so), product liability and other similar litigation as well as product obsolescence.
Technology and Technology-related Investment Risk
The Fund may be more susceptible to the particular risks that may affect companies in the information technology sector, as well as other technology-related sectors
(collectively, the technology sectors) than if it were invested in a wider variety of companies in unrelated sectors. Companies in the technology sectors are subject to certain risks, including the risk that new services, equipment or technologies will not be accepted by consumers and businesses or will become rapidly obsolete. Performance of such companies may be affected by factors including obtaining and protecting patents (or the failure to do so) and significant competitive pressures, including aggressive pricing of their products or services, new market entrants, competition for market share and short product cycles due to an accelerated rate of technological developments. Such competitive pressures may lead to limited earnings and/or falling profit margins. As a result, the value of their securities may fall or fail to rise. In addition, many technology sector companies have limited operating histories and prices of these companies' securities historically have been more volatile than other securities, especially over the short term.
Note 10. Subsequent Events
Management has evaluated the events and transactions that have occurred through the date the financial statements were issued and noted no items requiring adjustment of the financial statements or additional disclosure.
Note 11. Information Regarding Pending and Settled Legal Proceedings
Ameriprise Financial and certain of its affiliates have historically been involved in a number of legal, arbitration and regulatory proceedings, including routine litigation, class actions, and governmental actions, concerning matters arising in connection with the conduct of their business activities. Ameriprise Financial believes that the Funds are not currently the subject of, and that neither Ameriprise Financial nor any of its affiliates are the subject of, any pending legal, arbitration or regulatory proceedings that are likely to have a material adverse effect on the Funds or the ability of Ameriprise Financial or its affiliates to perform under their contracts with the Funds. Ameriprise Financial is required to make quarterly (10-Q), annual (10-K) and, as necessary, 8-K filings with the Securities and Exchange Commission (SEC) on legal and regulatory matters that relate to Ameriprise Financial and its affiliates. Copies of these filings may be obtained by accessing the SEC website at www.sec.gov.
There can be no assurance that these matters, or the adverse publicity associated with them, will not result in
Annual Report 2016
34
COLUMBIA SMALL CAP GROWTH FUND I
NOTES TO FINANCIAL STATEMENTS (continued)
August 31, 2016
increased fund redemptions, reduced sale of fund shares or other adverse consequences to the Funds. Further, although we believe proceedings are not likely to have a material adverse effect on the Funds or the ability of Ameriprise Financial or its affiliates to perform under their contracts with the Funds, these proceedings are subject to uncertainties and, as such, we are unable to estimate the possible loss or range of loss that may result. An adverse outcome in one or more of these proceedings could result in adverse judgments, settlements, fines, penalties or other relief that could have a material adverse effect on the consolidated financial condition or results of operations of Ameriprise Financial.
Annual Report 2016
35
COLUMBIA SMALL CAP GROWTH FUND I
REPORT OF INDEPENDENT REGISTERED PUBLIC ACCOUNTING FIRM
To the Trustees of Columbia Funds Series Trust I and the Shareholders of
Columbia Small Cap Growth Fund I
In our opinion, the accompanying statement of assets and liabilities, including the portfolio of investments, and the related statements of operations and of changes in net assets and the financial highlights present fairly, in all material respects, the financial position of Columbia Small Cap Growth Fund I (the "Fund," a series of Columbia Funds Series Trust I) at August 31, 2016, and the results of its operations, the changes in its net assets and the financial highlights for each of the periods indicated, in conformity with accounting principles generally accepted in the United States of America. These financial statements and financial highlights (hereafter referred to as "financial statements") are the responsibility of the Fund's management. Our responsibility is to express an opinion on these financial statements based on our audits. We conducted our audits of these financial statements in accordance with the standards of the Public Company Accounting Oversight Board (United States). Those standards require that we plan and perform the audit to obtain reasonable assurance about whether the financial statements are free of material misstatement. An audit includes examining, on a test basis, evidence supporting the amounts and disclosures in the financial statements, assessing the accounting principles used and significant estimates made by management, and evaluating the overall financial statement presentation. We believe that our audits, which included confirmation of securities at August 31, 2016 by correspondence with the custodian, brokers and transfer agent, and the application of alternative auditing procedures where such confirmations had not been received, provide a reasonable basis for our opinion.
PricewaterhouseCoopers LLP
Minneapolis, MN
October 21, 2016
Annual Report 2016
36
COLUMBIA SMALL CAP GROWTH FUND I
FEDERAL INCOME TAX INFORMATION
(Unaudited)
The Fund hereby designates the following tax attributes for the fiscal year ended August 31, 2016. Shareholders will be notified in early 2017 of the amounts for use in preparing 2016 income tax returns.
Tax Designations
Qualified Dividend Income | | | 0.23 | % | |
Dividends Received Deduction | | | 0.23 | % | |
Capital Gain Dividend | | $ | 34,527,813 | | |
Qualified Dividend Income. For taxable, non-corporate shareholders, the percentage of ordinary income distributed during the fiscal year that represents qualified dividend income subject to reduced tax rates.
Dividends Received Deduction. The percentage of ordinary income distributed during the fiscal year that qualifies for the corporate dividends received deduction.
Capital Gain Dividend. The Fund designates as a capital gain dividend the amount reflected above, or if subsequently determined to be different, the net capital gain of such fiscal period.
Annual Report 2016
37
COLUMBIA SMALL CAP GROWTH FUND I
Shareholders elect the Board that oversees the Fund's operations. The Board appoints officers who are responsible for day-to-day business decisions based on policies set by the Board. The following table provides basic biographical information about the Fund's Trustees, including their principal occupations during the past five years, although specific titles for individuals may have varied over the period. The year set forth beneath Length of Service in the table below is the year in which the Trustee was first appointed or elected as Trustee to any Fund currently in the Columbia Funds Complex or a predecessor thereof. Under current Board policy, members serve terms of indefinite duration.
Trustees
Independent Trustees
Name,
Address,
Year of Birth | | Position Held With
the Trust and Length of
Service | | Principal Occupation(s)
During the Past Five Years
and Other Relevant
Professional Experience | | Number of
Funds in the
Columbia Funds
Complex
Overseen | | Other Directorships
Held by Trustee During
the Past Five Years | |
Janet Langford Carrig
c/o Columbia
Management Investment Advisers, LLC,
225 Franklin Street
Mail Drop BX32 05228,
Boston, MA 02110
1957 | | Trustee 1996 | | Senior Vice President, General Counsel and Corporate Secretary, ConocoPhillips (integrated energy company) since September 2007 | | | 56 | | | None | |
Douglas A. Hacker
c/o Columbia Management Investment Advisers, LLC,
225 Franklin Street
Mail Drop BX32 05228,
Boston, MA 02110
1955 | | Trustee and Chairman of the Board 1996 | | Independent business executive since May 2006; Executive Vice President — Strategy of United Airlines from December 2002 to May 2006; President of UAL Loyalty Services (airline marketing company) from September 2001 to December 2002; Executive Vice President and Chief Financial Officer of United Airlines from July 1999 to September 2001 | | | 56 | | | Spartan Nash Company (food distributor); Nash Finch Company (food distributor) from 2005 to 2013; Aircastle Limited (aircraft leasing); SeaCube Container Leasing Ltd. (container leasing) from 2010 to 2013; and Travelport Worldwide Limited (travel information technology) | |
Nancy T. Lukitsh
c/o Columbia Management Investment Advisers, LLC,
225 Franklin Street
Mail Drop BX32 05228,
Boston, MA 02110
1956 | | Trustee 2011 | | Senior Vice President, Partner and Director of Marketing, Wellington Management Company, LLP (investment adviser) from 1997 to 2010; Chair, Wellington Management Portfolios (commingled non-U.S. investment pools) from 2007 to 2010; Director, Wellington Trust Company, NA and other Wellington affiliates from 1997 to 2010 | | | 56 | | | None | |
Annual Report 2016
38
COLUMBIA SMALL CAP GROWTH FUND I
TRUSTEES AND OFFICERS (continued)
Independent Trustees (continued)
Name,
Address,
Year of Birth | | Position Held With
the Trust and Length of
Service | | Principal Occupation(s)
During the Past Five Years
and Other Relevant
Professional Experience | | Number of
Funds in the
Columbia Funds
Complex
Overseen | | Other Directorships
Held by Trustee During
the Past Five Years | |
William E. Mayer
c/o Columbia Management Investment Advisers, LLC,
225 Franklin Street
Mail Drop BX32 05228,
Boston, MA 02110
1940 | | Trustee 1991 | | Partner, Park Avenue Equity Partners (private equity) since February 1999 | | | 56 | | | DynaVox Inc. (speech creation); Lee Enterprises (print media); WR Hambrecht + Co. (financial service provider) from 2000 to 2012; BlackRock Capital Investment Corporation (investment company); and Premier, Inc. (healthcare) | |
David M. Moffett
c/o Columbia Management Investment Advisers, LLC,
225 Franklin Street
Mail Drop BX32 05228,
Boston, MA 02110
1952 | | Trustee 2011 | | Retired. Consultant to Bridgewater and Associates | | | 56 | | | Director of CIT Bank, CIT Group Inc. (commercial and consumer finance); eBay Inc. (online trading community); Genworth Financial, Inc. (financial and insurance products and services); Paypal Holdings Inc. (payment and data processing services); and Trustee University of Oklahoma Foundation | |
Charles R. Nelson
c/o Columbia Management Investment Advisers, LLC,
225 Franklin Street
Mail Drop BX32 05228,
Boston, MA 02110
1942 | | Trustee 1981 | | Retired. Professor Emeritus, University of Washington since 2011; Professor of Economics, University of Washington from 1976 to 2011; Ford and Louisa Van Voorhis Professor of Political Economy, University of Washington from 1993 to 2011; Adjunct Professor of Statistics, University of Washington from 1980 to 2011; Associate Editor, Journal of Money, Credit and Banking from September 1993 to 2008; consultant on econometric and statistical matters | | | 56 | | | None | |
John J. Neuhauser
c/o Columbia Management Investment Advisers, LLC,
225 Franklin Street
Mail Drop BX32 05228,
Boston, MA 02110
1943 | | Trustee 1984 | | President, Saint Michael's College since August 2007; Director or Trustee of several non-profit organizations, including University of Vermont Medical Center; Academic Vice President and Dean of Faculties, Boston College from August 1999 to October 2005; University Professor, Boston College from November 2005 to August 2007 | | | 56 | | | Liberty All-Star Equity Fund and Liberty All-Star Growth Fund (closed-end funds) | |
Annual Report 2016
39
COLUMBIA SMALL CAP GROWTH FUND I
TRUSTEES AND OFFICERS (continued)
Independent Trustees (continued)
Name,
Address,
Year of Birth | | Position Held With
the Trust and Length of
Service | | Principal Occupation(s)
During the Past Five Years
and Other Relevant
Professional Experience | | Number of
Funds in the
Columbia Funds
Complex
Overseen | | Other Directorships
Held by Trustee During
the Past Five Years | |
Patrick J. Simpson
c/o Columbia Management Investment Advisers, LLC,
225 Franklin Street
Mail Drop BX32 05228,
Boston, MA 02110
1944 | | Trustee 2000 | | Of Counsel, Perkins Coie LLP (law firm) since 2015; Partner, Perkins Coie LLP from 1988 to 2014 | | | 56 | | | None | |
Anne-Lee Verville
c/o Columbia Management Investment Advisers, LLC,
225 Franklin Street
Mail Drop BX32 05228,
Boston, MA 02110
1945 | | Trustee 1998 | | Retired. General Manager, Global Education Industry from 1994 to 1997, President — Application Systems Division from 1991 to 1994, Chief Financial Officer — US Marketing & Services from 1988 to 1991, and Chief Information Officer from 1987 to 1988, IBM Corporation (computer and technology) | | | 56 | | | Enesco Group, Inc. (producer of giftware and home and garden decor products) from 2001 to 2006 | |
Consultant to the Trustees*
Name,
Address,
Year of Birth | | Position Held With
the Trust and Length of
Service | | Principal Occupation(s)
During the Past Five Years
and Other Relevant
Professional Experience | | Number of
Funds in the
Columbia Funds
Complex
Overseen | | Other Directorships
Held by Trustee During
the Past Five Years | |
J. Kevin Connaughton
c/o Columbia
Management Investment Advisers, LLC,
225 Franklin Street
Mail Drop BX32 05228,
Boston, MA 02110
1964 | | Trustee Consultant 2016 | | Trustee Consultant, Columbia Funds since March 2016; Managing Director and General Manager of Mutual Fund Products, Columbia Management Investment Advisers, LLC from May 2010 to February 2015; President, Columbia Funds from 2009 to 2015; and senior officer of Columbia Funds and affiliated funds from 2003 to 2015 | | | 56 | | | Board of Governors, Gateway Healthcare since January 2016; Trustee, New Century Portfolios since March 2015; and Director, The Autism Project since March 2015 | |
* J. Kevin Connaughton was appointed consultant to the Trustees effective March 1, 2016. Shareholders of the Funds are expected to be asked to elect Mr. Connaughton as a Trustee at a future shareholder meeting.
Annual Report 2016
40
COLUMBIA SMALL CAP GROWTH FUND I
TRUSTEES AND OFFICERS (continued)
Interested Trustee Affiliated with Investment Manager*
Name,
Address,
Year of Birth | | Position Held With
the Trust and Length of
Service | | Principal Occupation(s)
During the Past Five Years
and Other Relevant
Professional Experience | | Number of
Funds in the
Columbia Funds
Complex
Overseen | | Other Directorships
Held by Trustee During
the Past Five Years | |
William F. Truscott
c/o Columbia Management Investment Advisers, LLC,
225 Franklin Street
Boston, MA 02110
1960 | | Trustee 2012 | | Chairman of the Board and President, Columbia Management Investment Advisers, LLC since May 2010 and February 2012, respectively; Chief Executive Officer, Global Asset Management, Ameriprise Financial, Inc. since September 2012 (previously Chief Executive Officer, U.S. Asset Management & President, Annuities, May 2010- September 2012); Director and Chief Executive Officer, Columbia Management Investment Distributors, Inc. since May 2010 and February 2012, respectively; Chairman of the Board and Chief Executive Officer, RiverSource Distributors, Inc. since 2006; Director, Threadneedle Asset Management Holdings, SARL since 2014; President and Chief Executive Officer, Ameriprise Certificate Company, 2006-August 2012. | | | 184 | | | Trustee to other Columbia Funds since 2001; Chairman of the Board, Columbia Management Investment Advisers, LLC since May 2010; Director, Columbia Management Investment Distributors, Inc. since May 2010; Former Director, Ameriprise Certificate Company, 2006-January 2013 | |
* Interested person (as defined under the 1940 Act) by reason of being an officer, director, security holder and/or employee of the Investment Manager or Ameriprise Financial.
The Statement of Additional Information has additional information about the Fund's Board members and is available, without charge, upon request by calling 800.345.6611; contacting your financial intermediary; or visiting investor.columbiathreadneedleus.com.
Annual Report 2016
41
COLUMBIA SMALL CAP GROWTH FUND I
TRUSTEES AND OFFICERS (continued)
The Board has appointed officers who are responsible for day-to-day business decisions based on policies it has established. The officers serve at the pleasure of the Board. The following table provides basic information about the Officers of the Fund, including principal occupations during the past five years, although their specific titles may have varied over the period. In addition to Mr. Truscott, who is Senior Vice President, the Fund's other officers are:
Fund Officers
Name,
Address and
Year of Birth | | Position and Year
First Appointed to
Position for any Fund
in the Columbia
Funds Complex or a
Predecessor Thereof | |
Principal Occupation(s) During Past Five Years | |
Christopher O. Petersen
5228 Ameriprise Financial Center
Minneapolis, MN 55474
Born 1970 | | President and Principal Executive Officer (2015) | | Vice President and Lead Chief Counsel, Ameriprise Financial, Inc. since January 2015 (previously, Vice President and Chief Counsel January 2010-December 2014; officer of Columbia Funds and affiliated funds since 2007. | |
Michael G. Clarke
225 Franklin Street
Boston, MA 02110
Born 1969 | | Treasurer (2011), Chief Financial Officer (2009) and Chief Accounting Officer (2015) | | Vice President — Mutual Fund Administration, Columbia Management Investment Advisers, LLC, since May 2010; senior officer of Columbia Funds and affiliated funds since 2002. | |
Paul B. Goucher
100 Park Avenue
New York, NY 10017
Born 1968 | | Senior Vice President (2011), Chief Legal Officer (2015) and Assistant Secretary (2008) | | Vice President and Lead Chief Counsel, Ameriprise Financial, Inc. since November 2008 and January 2013, respectively (previously Chief Counsel, January 2010-January 2013); Vice President, Chief Legal Officer and Assistant Secretary, Columbia Management Investment Advisers, LLC since May 2010. | |
Thomas P. McGuire
225 Franklin Street
Boston, MA 02110
Born 1972 | | Senior Vice President and Chief Compliance Officer (2012) | | Vice President — Asset Management Compliance, Ameriprise Financial, Inc., since May 2010; Chief Compliance Officer, Ameriprise Certificate Company since September 2010. | |
Colin Moore
225 Franklin Street
Boston, MA 02110
Born 1958 | | Senior Vice President (2010) | | Executive Vice President and Global Chief Investment Officer, Ameriprise Financial, Inc., since July 2013; Executive Vice President and Global Chief Investment Officer, Columbia Management Investment Advisers, LLC since July 2013 (previously Director and Global Chief Investment Officer, 2010-2013). | |
Michael E. DeFao
225 Franklin Street
Boston, MA 02110
Born 1968 | | Vice President (2011) and Assistant Secretary (2010) | | Vice President and Chief Counsel, Ameriprise Financial, Inc. since May 2010. | |
Amy Johnson
5228 Ameriprise Financial Center
Minneapolis, MN 55474
Born 1965 | | Vice President (2006) | | Managing Director and Global Head of Operations, Columbia Management Investment Advisers, LLC since April 2016 (previously Managing Director and Chief Operating Officer, 2010-2016). | |
Lyn Kephart-Strong
5228 Ameriprise
Financial Center
Minneapolis, MN 55474
Born 1960 | | Vice President (2015) | | President, Columbia Management Investment Services Corp. since October 2014; Vice President & Resolution Officer, Ameriprise Trust Company since August 2009. | |
Ryan C. Larrenaga
225 Franklin Street
Boston, MA 02110
Born 1970 | | Vice President and Secretary (2015) | | Vice President and Group Counsel, Ameriprise Financial, Inc. since August 2011; officer of Columbia Funds and affiliated funds since 2005. | |
Annual Report 2016
42
COLUMBIA SMALL CAP GROWTH FUND I
BOARD CONSIDERATION AND APPROVAL OF MANAGEMENT
AGREEMENT
On June 10, 2016, the Board of Trustees (the Board) and the Trustees who are not interested persons (as defined in the Investment Company Act of 1940) (the Independent Trustees) of Columbia Funds Series Trust I (the Trust) unanimously approved the continuation of the Management Agreement (the Management Agreement) with Columbia Management Investment Advisers, LLC (the Investment Manager) with respect to Columbia Small Cap Growth Fund I (the Fund), a series of the Trust. As detailed below, the Board's Advisory Fees and Expenses Committee (the Committee) and the Board met on multiple occasions to review and discuss, both among themselves and with the management team of the Investment Manager, materials provided by the Investment Manager and others before determining to approve the continuation of the Management Agreement.
In connection with their deliberations regarding the continuation of the Management Agreement, the Committee and the Board evaluated materials requested from the Investment Manager regarding the Fund and the Management Agreement, and discussed these materials with representatives of the Investment Manager at Committee meetings held on March 8, 2016, April 27, 2016 and June 9, 2016 and at Board meetings held on March 9, 2016 and June 10, 2016. In addition, the Board considers matters bearing on the Management Agreement at most of its other meetings throughout the year and meets regularly with senior management of the Trust and the Investment Manager. Through the Board's Investment Oversight Committees, Trustees also meet with selected portfolio managers of the funds the Trustees oversee and other investment personnel at various times throughout the year. The Committee and the Board also consulted with its independent fee consultant, Fund counsel and with the Independent Trustees' independent legal counsel, who advised on various matters with respect to the Committee's and the Board's considerations and otherwise assisted the Committee and the Board in their deliberations. On June 9, 2016, the Committee recommended that the Board approve the continuation of the Management Agreement. On June 10, 2016, the Board, including the Independent Trustees, voting separately, unanimously approved the continuation of the Management Agreement for the Fund.
The Committee and the Board considered all information that they, their legal counsel or the Investment Manager believed reasonably necessary to evaluate and to determine whether to recommend for approval or approve the continuation of the Management Agreement. The information and factors considered by the Committee and the Board in recommending for approval or approving the continuation of the Management Agreement for the Fund included the following:
• Information on the investment performance of the Fund relative to the performance of a group of mutual funds determined to be comparable to the Fund by an independent third-party data provider, as well as performance relative to benchmarks;
• Information on the Fund's management fees and total expenses, including information comparing the Fund's expenses to those of a group of comparable mutual funds, as determined by the independent third-party data provider;
• The Investment Manager's agreement to contractually limit or cap total operating expenses for the Fund through December 31, 2017 so that total operating expenses (excluding certain fees and expenses, such as transaction costs and certain other investment related expenses, interest, taxes, acquired fund fees and expenses, and infrequent and/or unusual expenses) would not exceed a specified annual rate, as a percentage of the Fund's net assets;
• The terms and conditions of the Management Agreement;
• The current and proposed terms and conditions of other agreements and arrangements with affiliates of the Investment Manager relating to the operations of the Fund, including agreements with respect to the provision of distribution and transfer agency services to the Fund;
• Descriptions of various functions performed by the Investment Manager under the Management Agreement, including portfolio management and portfolio trading practices;
• Information regarding the management fees of similarly-managed portfolios of other clients of the Investment Manager, including institutional separate accounts;
Annual Report 2016
43
COLUMBIA SMALL CAP GROWTH FUND I
BOARD CONSIDERATION AND APPROVAL OF MANAGEMENT
AGREEMENT (continued)
• Information regarding the reputation, regulatory history and resources of the Investment Manager, including information regarding senior management, portfolio managers and other personnel;
• Information regarding the capabilities of the Investment Manager with respect to compliance monitoring services, including an assessment of the Investment Manager's compliance system by the Fund's Chief Compliance Officer; and
• The profitability to the Investment Manager and its affiliates from their relationships with the Fund.
Nature, Extent and Quality of Services Provided under the Management Agreement
The Committee and the Board considered the nature, extent and quality of services provided to the Fund by the Investment Manager and its affiliates under the Management Agreement and under separate agreements for the provision of transfer agency services, and the resources dedicated to the Fund and the other Columbia Funds by the Investment Manager and its affiliates. The Committee and the Board considered, among other things, the Investment Manager's ability to attract, motivate and retain highly qualified research, advisory and supervisory investment professionals (including personnel and other resources, compensation programs for personnel involved in fund management, reputation and other attributes), the portfolio management services provided by those investment professionals, and the quality of the Investment Manager's investment research capabilities and trade execution services. The Committee and the Board also considered the potential benefits to shareholders of investing in a mutual fund that is part of a fund complex offering exposure to a variety of asset classes and investment disciplines and providing a variety of fund and shareholder services.
The Committee and the Board also considered the professional experience and qualifications of the senior personnel of the Investment Manager, which included consideration of the Investment Manager's experience with similarly-structured funds. The Committee and the Board noted the compliance programs of and the compliance-related resources provided to the Fund by the Investment Manager and its affiliates, and considered the Investment Manager's ability to provide administrative services to the Fund and coordinate the activities of the Fund's other service providers. After reviewing these and related factors, the Committee and the Board concluded, within the context of their overall conclusions, that the nature, extent and quality of the services provided to the Fund under the Management Agreement supported the continuation of the Management Agreement.
Investment Performance
The Committee and the Board reviewed information about the performance of the Fund over various time periods, including performance information relative to benchmarks and information based on reports of the independent third-party data provider that compared the performance of the Fund to the performance of a group of comparable mutual funds, and data provided by the independent fee consultant. The Committee and the Board also reviewed a description of the third party's methodology for identifying the Fund's peer groups for purposes of performance and expense comparisons. Although the Fund's performance lagged that of a relevant peer group for certain (although not necessarily all) periods, the Committee and the Board concluded that other factors relevant to performance were sufficient, in light of other considerations, to warrant continuation of the Management Agreement. Those factors included one or more of the following: (i) that the Fund's performance, although lagging in certain recent periods, was stronger over the longer term; (ii) that the underperformance was attributable, to a significant extent, to investment decisions that were reasonable and consistent with the Fund's investment strategy and policies and that the Fund was performing within a reasonable range of expectations, given those investment decisions, market conditions and the Fund's investment strategy; (iii) that the Fund's performance was competitive when compared to other relevant performance benchmarks or peer groups; and (iv) that the Investment Manager had taken or was taking steps designed to help improve the Fund's investment performance, including, but not limited to, replacing portfolio managers, enhancing the resources supporting the portfolio managers, or modifying investment strategies.
The Committee and the Board noted that, through December 31, 2015, the Fund's performance was in the thirteenth, seventy-fifth and eighty-fourth percentile (where the best performance would be in the first percentile)
Annual Report 2016
44
COLUMBIA SMALL CAP GROWTH FUND I
BOARD CONSIDERATION AND APPROVAL OF MANAGEMENT
AGREEMENT (continued)
of its category selected by the independent third-party data provider for the purposes of performance comparisons for the one-, three- and five- year periods, respectively.
The Committee and the Board also considered the Investment Manager's performance and reputation generally, the Investment Manager's historical responsiveness to Board concerns about performance, and the Investment Manager's willingness to take steps intended to improve performance. After reviewing these and related factors, the Committee and the Board concluded, within the context of their overall conclusions, that the performance of the Fund and the Investment Manager was sufficient, in light of other considerations, to warrant the continuation of the Management Agreement.
Investment Management Fee Rates and Other Expenses
The Committee and the Board considered the management fees charged to the Fund under the Management Agreement as well as the total expenses incurred by the Fund. In assessing the reasonableness of the fees under the Management Agreement, the Committee and the Board considered, among other information, the Fund's management fee and its total expense ratio as a percentage of average daily net assets. The Committee and the Board considered data provided by the independent fee consultant. The Committee and the Board noted that, as of December 31, 2015, the Fund's actual management fee and net total expense ratio are ranked in the fourth and third quintile, respectively, (where the lowest fees and expenses would be in the first quintile) against the Fund's expense universe as determined by the independent third-party data provider for purposes of expense comparison. The Committee and the Board also took into account the fee waiver and expense limitation arrangements agreed to by the Investment Manager, as noted above.
The Committee and the Board also received and considered information about the management fees charged by the Investment Manager to institutional separate accounts. In considering the fees charged to those accounts, the Committee and the Board took into account, among other things, the Investment Manager's representations about the differences between managing mutual funds as compared to other types of accounts, including differences in the services provided, differences in the risk profile of such business for the Investment Manager and the additional resources required to manage mutual funds effectively. The Committee and the Board also received and considered information about the fees charged by the Investment Manager for sub-advisory services provided to comparable unaffiliated funds. In evaluating the Fund's management fees, the Committee and the Board also took into account the demands, complexity and quality of the investment management of the Fund.
After reviewing these and related factors, the Committee and the Board concluded, within the context of their overall conclusions, that the management fee rates and expenses of the Fund were sufficient, in light of other considerations, to warrant the continuation of the Management Agreement.
Costs of Services Provided and Profitability
The Committee and the Board also took note of the costs the Investment Manager and its affiliates incur in connection with the services provided (both on an absolute and relative basis) and the profitability to the Investment Manager and its affiliates in connection with their relationships with the Fund.
The Committee and the Board also considered the compensation directly or indirectly received by the Investment Manager's affiliates in connection with their relationships with the Fund. The Committee and the Board reviewed information provided by management as to the profitability to the Investment Manager and its affiliates of their relationships with the Fund, information about the allocation of expenses used to calculate profitability, and comparisons of profitability levels realized in 2015 to profitability levels realized in 2014. When reviewing profitability, the Committee and the Board also considered court cases in which adviser profitability was an issue in whole or in part, the performance of similarly managed funds, the performance of the Fund, and the expense ratio of the Fund. In addition, the Committee and the Board considered information provided by the Investment Manager regarding the Investment Manager's financial condition and comparing its profitability to that of other asset management firms that are, or are subsidiaries of, publicly traded companies. In this regard, the Committee and the Board also considered data provided by the independent fee consultant.
Annual Report 2016
45
COLUMBIA SMALL CAP GROWTH FUND I
BOARD CONSIDERATION AND APPROVAL OF MANAGEMENT
AGREEMENT (continued)
After reviewing these and related factors, the Committee and the Board concluded, within the context of their overall conclusions, that the costs of services provided and the profitability to the Investment Manager and its affiliates from their relationships with the Fund supported the continuation of the Management Agreement.
Economies of Scale
The Committee and the Board considered the potential existence of economies of scale in the provision by the Investment Manager of services to the Fund, to groups of related funds, and to the Investment Manager's investment advisory clients as a whole, and whether those economies of scale were shared with the Fund through breakpoints in investment management fees or other means, such as expense limitation arrangements and additional investments by the Investment Manager in investment, trading and compliance resources. The Committee and the Board noted that the management fee schedules for the Fund contained breakpoints that would reduce the fee rate on assets above specified threshold levels.
In considering these matters, the Committee and the Board also considered the costs of the services provided and the profitability to the Investment Manager and its affiliates from their relationships with the Fund, as discussed above. After reviewing these and related factors, the Committee and the Board concluded, within the context of their overall conclusions, that the extent to which any economies of scale were expected to be shared with the Fund supported the continuation of the Management Agreement.
Other Benefits to the Investment Manager
The Committee and the Board received and considered information regarding "fall-out" or ancillary benefits received by the Investment Manager and its affiliates as a result of their relationships with the Fund, such as the engagement of the Investment Manager's affiliates to provide distribution and transfer agency services to the Fund. In this regard, among other matters, the Committee and the Board considered that the Fund's distributor retains a portion of the distribution fees from the Fund and receives a portion of the sales charges on sales or redemptions of certain classes of shares of the Fund. The Committee and the Board also considered the benefits of research made available to the Investment Manager by reason of brokerage commissions generated by the Fund's securities transactions, and reviewed information about the Investment Manager's practices with respect to allocating portfolio transactions for brokerage and research services. The Committee and the Board considered the possible conflicts of interest associated with certain fall-out or other ancillary benefits and the reporting, disclosure and other processes that are in place to address such possible conflicts of interest. The Committee and the Board recognized that the Investment Manager's profitability would be somewhat lower without these benefits.
Conclusion
The Committee and the Board reviewed all of the above considerations in reaching their decisions to recommend or approve the continuation of the Management Agreement. In their deliberations, the Trustees did not identify any particular information that was all-important or controlling, and individual Trustees may have attributed different weights to the various factors. Based on their evaluation of all factors that they deemed to be material, including those factors described above, and assisted by the advice of independent legal counsel, the Board, including the Independent Trustees, voting separately, unanimously approved the continuation of the Management Agreement.
Annual Report 2016
46
COLUMBIA SMALL CAP GROWTH FUND I
IMPORTANT INFORMATION ABOUT THIS REPORT
Each fund mails one shareholder report to each shareholder address. If you would like more than one report, please call shareholder services at 800.345.6611 and additional reports will be sent to you.
The policy of the Board is to vote the proxies of the companies in which each fund holds investments consistent with the procedures as stated in the Statement of Additional Information (SAI). You may obtain a copy of the SAI without charge by calling 800.345.6611; contacting your financial intermediary; visiting investor.columbiathreadneedleus.com; or searching the website of the Securities and Exchange Commission (SEC) at sec.gov. Information regarding how each fund voted proxies relating to portfolio securities is filed with the SEC by August 31st for the most recent 12-month period ending June 30th of that year, and is available without charge by visiting investor.columbiathreadneedleus.com, or searching the website of the SEC at sec.gov.
Each fund files a complete schedule of portfolio holdings with the SEC for the first and third quarters of each fiscal year on Form N-Q. Each fund's Form N-Q is available on the SEC's website at sec.gov and may be reviewed and copied at the SEC's Public Reference Room in Washington, D.C. Information on the operation of the Public Reference Room may be obtained by calling 800.SEC.0330. Each fund's complete schedule of portfolio holdings, as filed on Form N-Q, can also be obtained without charge, upon request, by calling 800.345.6611.
Annual Report 2016
47
Columbia Small Cap Growth Fund I
P.O. Box 8081
Boston, MA 02266-8081

Please read and consider the investment objectives, risks, charges and expenses for any fund carefully before investing. For a prospectus and summary prospectus, which contains this and other important information about the Fund, go to investor.columbiathreadneedleus.com. The Fund is distributed by Columbia Management Investment Distributors, Inc., member FINRA, and managed by Columbia Management Investment Advisers, LLC.
Columbia Threadneedle Investments (Columbia Threadneedle) is the global brand name of the Columbia and Threadneedle group of companies.
All rights reserved. Columbia Management Investment Distributors, Inc., 225 Franklin Street, Boston, MA 02110-2804
© 2016 Columbia Management Investment Advisers, LLC.
investor.columbiathreadneedleus.com
ANN226_08_F01_(10/16)

ANNUAL REPORT
August 31, 2016

COLUMBIA EMERGING MARKETS FUND

ABOUT COLUMBIA THREADNEEDLE INVESTMENTS
Columbia Threadneedle Investments is a leading global asset management group that provides a broad range of investment strategies and solutions for individual, institutional and corporate clients around the world.
With more than 2,000 people, including over 450 investment professionals based in North America, Europe and Asia, we manage $460 billion* of assets across developed and emerging market equities, fixed income, asset allocation solutions and alternatives. We are the 13th largest manager of long-term mutual fund assets in the U.S.** and the 4th largest manager of retail funds in the U.K.***
Our priority is the investment success of our clients. We aim to deliver the investment outcomes they expect through an investment approach that is team-based, performance-driven and risk-aware. Our culture is dynamic and interactive. By sharing our insights across asset classes and geographies, we generate richer perspectives on global, regional and local investment landscapes. The ability to exchange and debate investment ideas in a collaborative environment enriches our teams' investment processes. More importantly, it results in better informed investment decisions for our clients.
Columbia funds are distributed by Columbia Management Investment Distributors, Inc., member FINRA, and managed by Columbia Management Investment Advisers, LLC.
Columbia Threadneedle Investments (Columbia Threadneedle) is the global brand name of the Columbia and Threadneedle group of companies.
* In U.S. dollars as of June 30, 2016. Source: Ameriprise Q2 Earnings Release. Includes all assets managed by entities in the Columbia and Threadneedle group of companies. Contact us for more current data.
** Source: ICI as of June 30, 2016 for Columbia Management Investment Advisers, LLC.
*** Source: Investment Association as of March 2016 for Threadneedle Asset Management Limited.
© 2016 Columbia Management Investment Advisers, LLC. All rights reserved.
Not part of the shareholder report
 Dear Shareholders,
Volatility comes with the territory for long-term investors. Some investors instinctively want to pull out of the market or sell underperforming investments at the first sign of increased volatility or perhaps even as soon as they perceive it on the horizon. But taking yourself out of the market could mean losing out on potential opportunities, and putting your longer term investment goals at risk.
Cumulative return is not just about achieving high returns when markets are going up; it's also about remaining invested and minimizing losses during weak or volatile markets so that you can participate on the upside. Developing a deeper understanding of the various risks your portfolio is subject to can help you balance these risks.
Diversification is critical in seeking to achieve that balance. We believe that most portfolios could be more effectively diversified either by introducing holdings with performance profiles unrelated to existing holdings (like alternative products) or by rebalancing existing holdings with an eye toward risk allocation. Over time, distributing risk more evenly may produce a more pronounced diversification benefit and may improve portfolio efficiency. We believe market volatility can create significant opportunities and, in fact, these periods may be some of the very best times to invest.
With this in mind, I thought it important to highlight excerpts from a piece written by Colin Moore, Global Chief Investment Officer, in which he touches on some of these issues emphasizing the importance of a properly constructed portfolio in seeking to effectively manage volatility and to achieve consistency of returns. I encourage you to read the article in its entirety. To access the full article and for other insights on current market, please visit blog.columbiathreadneedleus.com/latest-perspectives.
You need investments that are designed to help you ease the impact of volatile market environments and keep the savings you have worked tirelessly to amass. Columbia Threadneedle Investments provides investment solutions to help you tackle financial challenges and achieve your desired outcome.
Best regards,

Christopher O. Petersen
President, Columbia Funds
Excerpts from:
Taking the scare out of the volatility bogeyman
By Colin Moore, Global Chief Investment Officer
Colin Moore is the global chief investment officer for Columbia Threadneedle Investments. His responsibilities include ensuring that a disciplined investment process is in place across all asset classes, including equity and fixed income. Mr. Moore joined one of the Columbia Threadneedle Investments legacy firms in 2002 as head of equity and was also head of fixed income and liquidity strategies from 2009 – 2010.

n In today's low growth, higher volatility world, the emphasis is shifting from maximization of returns to consistency of returns.
PRESIDENT'S MESSAGE (continued)
n Portfolios should represent the behavioral risk-return tradeoff of investors, remembering that they won't stay invested to realize the return if we get the risk tolerance wrong.
n Holding long-term savings in cash to avoid volatility (the financial equivalent of hiding under the sheets) is detrimental to achieving long-term goals.
According to Wikipedia, "The bogeyman is a common allusion to a mythical creature in many cultures used to control behavior. This monster has no specific appearance, and conceptions about it can vary drastically from household to household within the same community; in many cases he has no set appearance in the mind of an adult or child, but is simply a non-specific embodiment of terror." Different cultures have different names and physical representations for the bogeyman, and investors are no different. We have terrible monsters that we fear may destroy our portfolios, and we call one of the scariest of them volatility.
While the bogeyman is mythical (I hope!), volatility is real and can cause serious damage. To understand why investors have such a hard time coping with volatility, we first need to define three cognitive biases at work in today's investment environment:
1) Recency bias — something that has recently come to the forefront of our attention, regardless of how long established it is, suddenly seems to appear with improbable frequency.
2) Negativity bias — we tend to have a greater recall of unpleasant memories than positive memories.
3) Loss aversion — our dissatisfaction with losing money tends to be greater than our satisfaction with making money.
The level of volatility varies dramatically, and so does investor fear and panic selling — waxing when volatility rises, waning when it falls. Recent studies have pointed to demographics as an important driver of panic selling. The theory is that as people get closer to retirement, the prospects of a large (20% – 30%) loss in financial assets can have a much more pronounced effect on their sense of well-being. Wealth preservation instincts kick in much more quickly than for younger (and typically less wealthy) savers.
The reality is that there is little opportunity for return without volatility. Therefore, the bogeyman effect of holding long-term savings in cash to avoid volatility (the financial equivalent of hiding under the sheets) is detrimental to achieving long-term goals. This effect tends to be more pronounced during the episodic spikes in volatility. The significant spike in volatility in 2008 and 2009 led to significant withdrawals from long-term investment funds over the same period. Less pronounced effects can also be seen when comparing 2001 – 2003 and 2011 – 2012. Conversely, flows picked up when volatility returned to "normal" levels. Investor behavior of this type is consistent with the three behavioral biases.
I believe average volatility will be higher over the next 10 years than the last 10 years and episodic spikes will increase in frequency because sustainable economic growth will be structurally lower and geopolitical risk higher than any time since World War II. Low growth creates uncertainty while loss aversion will make investors fear that we are one economic mishap or geopolitical event away from no growth or recession. The result will be higher volatility on average. Negativity bias will tend to exacerbate "spike" reactions to event-driven geopolitical news, and the volatility bogeyman will appear more often. Assuming the behavioral biases continue, investor returns are likely to be very disappointing regardless of the total return generated by financial markets due to the bogeyman effect.
To mitigate this effect, we need to focus on portfolio construction and an improved understanding of diversification. I accept that equities are likely to offer the highest return over the next 10 years, but they also offer the highest volatility. Many portfolio construction optimization tools use historical average volatility, which is likely to underestimate the volatility investors will face. The bogeyman emerges when individual asset class volatility spikes and cross correlations rise, the combination of which increases overall portfolio volatility far beyond expectation. Diversification is meant to protect investors against volatility, but what's the point of owning lots of investments if the volatility bogeyman has not been properly estimated?
Most importantly, portfolios should be constructed to properly represent the behavioral risk-return trade off of investors, remembering that they won't stay invested to realize the return if we get the risk tolerance wrong. In a low growth, higher volatility world, the emphasis is shifting to return consistency rather than return maximization,
PRESIDENT'S MESSAGE (continued)
and investors are best served through investment approaches that appreciate that distinction. Even though it's a permanent feature of financial markets, volatility is less likely to be the bogeyman we all fear if portfolios are constructed with this understanding.
Please visit blog.columbiathreadneedleus.com/latest-perspectives to read the entire article.
Investors should consider the investment objectives, risks, charges and expenses of a mutual fund carefully before investing. For a free prospectus and summary prospectus, which contains this and other important information about a fund, visit investor.columbiathreadneedleus.com. The prospectus should be read carefully before investing.
The views expressed are as of April 2016, may change as market or other conditions change, and may differ from views expressed by other Columbia Management Investment Advisers, LLC (CMIA) associates or affiliates. Actual investments or investment decisions made by CMIA and its affiliates, whether for its own account or on behalf of clients, will not necessarily reflect the views expressed. This information is not intended to provide investment advice and does not account for individual investor circumstances. Investment decisions should always be made based on an investor's specific financial needs, objectives, goals, time horizon and risk tolerance. Asset classes described may not be suitable for all investors.
Past performance does not guarantee future results, and no forecast should be considered a guarantee either. Since economic and market conditions change frequently, there can be no assurance that the trends described here will continue or that the forecasts are accurate.
Diversification does not guarantee a profit or protect against loss.
Columbia Funds are distributed by Columbia Management Investment Distributors, Inc., member FINRA, and managed by Columbia Management Investment Advisers, LLC.
© 2016 Columbia Management Investment Advisers, LLC. All rights reserved.
COLUMBIA EMERGING MARKETS FUND
Fund Investment Manager
Columbia Management Investment
Advisers, LLC
225 Franklin Street
Boston, MA 02110
Fund Distributor
Columbia Management Investment
Distributors, Inc.
225 Franklin Street
Boston, MA 02110
Fund Transfer Agent
Columbia Management Investment
Services Corp.
P.O. Box 8081
Boston, MA 02266-8081
For more information about any of the funds, please visit investor.columbiathreadneedleus.com or call 800.345.6611. Customer Service Representatives are available to answer your questions Monday through Friday from 8 a.m. to 7 p.m. Eastern time.
The views expressed in this report reflect the current views of the respective parties. These views are not guarantees of future performance and involve certain risks, uncertainties and assumptions that are difficult to predict, so actual outcomes and results may differ significantly from the views expressed. These views are subject to change at any time based upon economic, market or other conditions and the respective parties disclaim any responsibility to update such views. These views may not be relied on as investment advice and, because investment decisions for a Columbia fund are based on numerous factors, may not be relied on as an indication of trading intent on behalf of any particular Columbia fund. References to specific securities should not be construed as a recommendation or investment advice.
Performance Overview | | | 3 | | |
Manager Discussion of Fund Performance | | | 5 | | |
Understanding Your Fund's Expenses | | | 8 | | |
Portfolio of Investments | | | 9 | | |
Statement of Assets and Liabilities | | | 15 | | |
Statement of Operations | | | 17 | | |
Statement of Changes in Net Assets | | | 18 | | |
Financial Highlights | | | 21 | | |
Notes to Financial Statements | | | 32 | | |
Report of Independent Registered Public Accounting Firm | | | 40 | | |
Federal Income Tax Information | | | 41 | | |
Trustees and Officers | | | 42 | | |
Board Consideration and Approval of Management Agreement | | | 47 | | |
Important Information About This Report | | | 51 | | |
COLUMBIA EMERGING MARKETS FUND
Performance Summary
n Columbia Emerging Markets Fund (the Fund) Class A shares returned 13.65% excluding sales charges for the 12-month period that ended August 31, 2016.
n During the same time period, the Fund outperformed both the MSCI Emerging Markets Index (Net), which returned 11.83%, and the MSCI EAFE Index (Net), a measure of more developed foreign markets, which returned -0.12%.
n The Fund's relative performance was helped by the strength of its individual stock selection, particularly within the consumer staples and financial sectors.
Average Annual Total Returns (%) (for period ended August 31, 2016)
| | | Inception | | 1 Year | | 5 Years | | 10 Years | |
Class A* | | 09/28/07 | | | | | | | | | | | | | |
Excluding sales charges | | | | | 13.65 | | | | 1.15 | | | | 3.27 | | |
Including sales charges | | | | | 7.07 | | | | -0.04 | | | | 2.67 | | |
Class B* | | 02/28/13 | | | | | | | | | | | | | |
Excluding sales charges | | | | | 12.80 | | | | 0.39 | | | | 2.48 | | |
Including sales charges | | | | | 7.80 | | | | 0.00 | | | | 2.48 | | |
Class C* | | 09/28/07 | | | | | | | | | | | | | |
Excluding sales charges | | | | | 12.90 | | | | 0.40 | | | | 2.50 | | |
Including sales charges | | | | | 11.90 | | | | 0.40 | | | | 2.50 | | |
Class I* | | 09/27/10 | | | 14.22 | | | | 1.62 | | | | 3.62 | | |
Class K* | | 02/28/13 | | | 13.83 | | | | 1.33 | | | | 3.42 | | |
Class R* | | 09/27/10 | | | 13.42 | | | | 0.92 | | | | 3.00 | | |
Class R4* | | 03/19/13 | | | 13.93 | | | | 1.41 | | | | 3.51 | | |
Class R5* | | 11/08/12 | | | 14.09 | | | | 1.52 | | | | 3.57 | | |
Class W* | | 09/27/10 | | | 13.78 | | | | 1.15 | | | | 3.25 | | |
Class Y* | | 11/08/12 | | | 14.27 | | | | 1.59 | | | | 3.60 | | |
Class Z | | 01/02/98 | | | 13.91 | | | | 1.41 | | | | 3.51 | | |
MSCI Emerging Markets Index (Net) | | | | | | | 11.83 | | | | -0.42 | | | | 3.90 | | |
MSCI EAFE Index (Net) | | | | | | | -0.12 | | | | 5.00 | | | | 1.71 | | |
Returns for Class A are shown with and without the maximum initial sales charge of 5.75%. Returns for Class B are shown with and without the applicable contingent deferred sales charge (CDSC) of 5.00% in the first year, declining to 1.00% in the sixth year and eliminated thereafter. Returns for Class C are shown with and without the 1.00% CDSC for the first year only. The Fund's other classes are not subject to sales charges and have limited eligibility. Please see the Fund's prospectus for details. Performance for different share classes will vary based on differences in sales charges and fees associated with each class. All results shown assume reinvestment of distributions during the period. Returns do not reflect the deduction of taxes that a shareholder may pay on Fund distributions or on the redemption of Fund shares. Performance results reflect the effect of any fee waivers or reimbursements of Fund expenses by Columbia Management Investment Advisers, LLC and/or any of its affiliates. Absent these fee waivers or expense reimbursement arrangements, performance results would have been lower.
The performance information shown represents past performance and is not a guarantee of future results. The investment return and principal value of your investment will fluctuate so that your shares, when redeemed, may be worth more or less than their original cost. Current performance may be lower or higher than the performance information shown. You may obtain performance information current to the most recent month-end by contacting your financial intermediary, visiting investor.columbiathreadneedleus.com or calling 800.345.6611.
*The returns shown for periods prior to the share class inception date (including returns for the Life of the Fund, if shown, which are since Fund inception) include the returns of the Fund's oldest share class. These returns are adjusted to reflect any higher class-related operating expenses of the newer share classes, as applicable. Please visit investor.columbiathreadneedleus.com/investment-products/mutual-funds/
appended-performance for more information.
The MSCI Emerging Markets Index (Net) is a free float-adjusted market capitalization index that is designed to measure equity market performance of emerging markets.
The MSCI EAFE Index (Net) is a free float-adjusted market capitalization index that is designed to measure the equity market performance of developed markets, excluding the U.S. and Canada. The index is compiled from a composite of securities markets of Europe, Australasia and the Far East and is widely recognized by investors in foreign markets as the measurement index for portfolios of non-North American securities.
Indices are not available for investment, are not professionally managed and do not reflect sales charges, fees, brokerage commissions, taxes (except the MSCI Emerging Markets Index (Net) and the MSCI EAFE Index (Net), which reflect reinvested dividends net of withholding taxes) or other expenses of investing. Securities in the Fund may not match those in an index.
Annual Report 2016
3
COLUMBIA EMERGING MARKETS FUND
PERFORMANCE OVERVIEW (continued)
Performance of a Hypothetical $10,000 Investment (September 1, 2006 – August 31, 2016)
The chart above shows the change in value of a hypothetical $10,000 investment in Class A shares of Columbia Emerging Markets Fund during the stated time period, and does not reflect the deduction of taxes that a shareholder may pay on Fund distributions or on the redemption of Fund shares.
Annual Report 2016
4
COLUMBIA EMERGING MARKETS FUND
MANAGER DISCUSSION OF FUND PERFORMANCE
During the 12-month period that ended August 31, 2016, the Fund's Class A shares returned 13.65% excluding sales charges. The Fund outperformed its benchmark, the MSCI Emerging Markets Index (Net), which returned 11.83% for the same time period. The MSCI EAFE Index (Net), a measure of more developed foreign markets, returned -0.12% for the 12-month period. The Fund's relative performance was helped by the strength of its individual stock selection, particularly within the consumer staples and financial sectors.
Market Overview
While the benchmark finished the reporting period with a double-digit gain, the final number belies the elevated volatility that characterized the 12-month period. In the early part of the period, emerging market stocks came under significant pressure from the combination of slowing growth in China, plunging commodity prices and concerns that the U.S. Federal Reserve (Fed) would begin hiking interest rates aggressively in 2016. The resulting sell-off gained steam through the fourth calendar quarter of 2015 and ultimately reached a crescendo on January 21, at which time the benchmark was down 12.60% from the beginning of the reporting period.
This sell-off set the stage for an equally remarkable rally once the news flow began to improve mid-way through the first quarter. Global central banks provided the primary catalyst for the shift, as the Bank of Japan and European Central Bank both cut interest rates into negative territory. In addition, Fed officials made a series of statements indicating that the central bank would maintain its gradual approach to raising interest rates. In conjunction with signs of stabilizing global growth, these developments fueled a resurgence in investor risk appetites and led to a substantial rally in emerging market equities from mid-January 2016 onward.
Contributors and Detractors
In this potentially challenging environment, the Fund outpaced its benchmark on the strength of its individual stock selection. Our stock picks performed particularly well in the consumer staples sector, led by the Russian company X5 Retail Group NV. Russia's economy has begun to recover and currently appears on track for positive growth in 2017, which has provided a boost to consumer spending. Positions in the snack food producers Nippon Indosari (Indonesia) and Britannia Industries (India) also produced returns in excess of the overall sector.
Financials were an additional area of outperformance for the Fund, led by the Indian companies Yes Bank and IndusInd Bank. Falling interest rates have fueled rising demand for loans in India, which has led to an improving earnings outlook for many stocks in the financial sector. We took advantage of the rally to pare back on both positions. Another Indian stock — the microlender Bharat Financial Inclusion — was an additional beneficiary of rising loan demand, and we sold the stock once it reached our valuation target. Outside of India, shares of the Philippines-based mall and retail operator SM Prime Holdings rose on the strength of the improving outlook for the country's economy, and we capitalized on the gain to take profits in the position.
Portfolio Management
Dara White, CFA
Jasmine Weili Huang, CFA, CPA (U.S. and China), CFM
Robert Cameron
Young Kim
Morningstar Style BoxTM

The Morningstar Style BoxTM is based on a fund's portfolio holdings. For equity funds, the vertical axis shows the market capitalization of the stocks owned, and the horizontal axis shows investment style (value, blend, or growth). Information shown is based on the most recent data provided by Morningstar.
© 2016 Morningstar, Inc. All rights reserved. The Morningstar information contained herein: (1) is proprietary to Morningstar and/or its content providers; (2) may not be copied or distributed; and (3) is not warranted to be accurate, complete or timely. Neither Morningstar nor its content providers are responsible for any damages or losses arising from any use of this information.
Top Ten Holdings (%)
(at August 31, 2016) | |
Tencent Holdings Ltd. (China) | | | 5.7 | | |
Alibaba Group Holding Ltd.,
ADR (China) | | | 3.6 | | |
China Mobile Ltd. (China) | | | 3.5 | | |
Samsung Electronics Co., Ltd.
(South Korea) | | | 3.3 | | |
Naspers Ltd., Class N
(South Africa) | | | 3.2 | | |
Taiwan Semiconductor
Manufacturing Co., Ltd. (Taiwan) | | | 3.1 | | |
Ping An Insurance Group Co.
of China Ltd., Class H (China) | | | 2.5 | | |
X5 Retail Group NV GDR,
Registered Shares (Russian
Federation) | | | 1.8 | | |
PT Telekomunikasi Indonesia
Persero Tbk (Indonesia) | | | 1.6 | | |
AmBev SA, ADR (Brazil) | | | 1.6 | | |
Annual Report 2016
5
COLUMBIA EMERGING MARKETS FUND
MANAGER DISCUSSION OF FUND PERFORMANCE (continued)
Percentages indicated are based upon total investments (excluding Money Market Funds).
For further detail about these holdings, please refer to the section entitled "Portfolio of Investments."
Fund holdings are as of the date given, are subject to change at any time, and are not recommendations to buy or sell any security.
Country Breakdown (%)
(at August 31, 2016) | |
Argentina | | | 0.8 | | |
Brazil | | | 4.8 | | |
China | | | 22.1 | | |
Czech Republic | | | 0.3 | | |
Hong Kong | | | 2.4 | | |
India | | | 13.2 | | |
Indonesia | | | 7.0 | | |
Kenya | | | 0.3 | | |
Malaysia | | | 1.1 | | |
Mexico | | | 2.4 | | |
Peru | | | 1.0 | | |
Philippines | | | 1.9 | | |
Russian Federation | | | 7.6 | | |
South Africa | | | 5.9 | | |
South Korea | | | 12.6 | | |
Taiwan | | | 8.6 | | |
Thailand | | | 3.9 | | |
Turkey | | | 1.1 | | |
United Kingdom | | | 0.2 | | |
United States(a) | | | 2.8 | | |
Total | | | 100.0 | | |
Country Breakdown is based primarily on issuer's place of organization/incorporation. Percentages indicated are based upon total investments. The Fund's portfolio composition is subject to change.
(a) Includes investments in Money Market Funds.
The information technology sector was an additional source of strength for the Fund, highlighted by its positions in the Chinese internet giants Tencent Holdings and Alibaba Group Holding. Both companies began to demonstrate the ability to monetize their business models effectively, and their stocks reacted in kind.
On the other side of the ledger, we lost some relative performance from our positioning in the health care sector. The Indian companies Lupin and Sun Pharmaceuticals Industries were pressured by the prospect of increased scrutiny from the U.S. Food & Drug Administration. Believing this would lead to increased costs for both, we chose to sell the positions. The Chinese company Sihuan Pharmaceutical Holdings Group also performed poorly due to concerns about inadequate corporate governance, and we eliminated the stock from the portfolio. Outside of health care, Valid Solucoes e Servicos de Seguranca em Meios de Pagamento e Identificacao SA (Brazil), Cuckoo Electronics Co. (South Korea) and Cathay Financial Holding Co. (Taiwan) were the leading detractors from performance.
While we employ a bottom-up approach to investing, certain aspects of our broader sector and country allocations can have an impact on performance as well. During the 12 months ended August 31, 2016, for example, the Fund was adversely impacted by its underweight position in Brazil. Although this was a positive when the country was lagging early in the period, it became a headwind once the market began to rally on news of President Dilma Rousseff's impeachment. We remained on the lookout to reduce the extent of this underweight, as we believed the key members of this country's new government are technocrats with strong economic credentials.
Portfolio Positioning
We maintained our bottom-up approach to investing, highlighted by our preference for companies that we believed could control their own destinies rather than be dependent on broader macroeconomic trends to succeed. We looked for companies with good balance sheets, high returns on capital and steadily rising market share, which led the portfolio to have a higher quality bias than the asset class as a whole. This approach held the Fund in good stead when stock prices were falling in the interval from September 2015 through the January 2016 low, during which we outpaced the benchmark by a meaningful margin.
We continued to find a wealth of interesting investment ideas across the emerging markets, which reflects the reasonable valuations many companies offer in relation to their earnings prospects. At a time of sluggish economic conditions worldwide, the emerging markets are home to a high representation of companies that we believe are delivering robust organic growth. We identified many of the best opportunities in India, Indonesia and Russia, while finding fewer ideas in Korea, Thailand and Malaysia. We believe this disciplined, bottom-up approach — rather than employing a strategy that seeks to assess transitory economic factors or short-term market movements — is the most effective way to add value over time.
Annual Report 2016
6
COLUMBIA EMERGING MARKETS FUND
MANAGER DISCUSSION OF FUND PERFORMANCE (continued)
Equity Sector Breakdown (%)
(at August 31, 2016) | |
Consumer Discretionary | | | 16.8 | | |
Consumer Staples | | | 11.3 | | |
Energy | | | 4.4 | | |
Financials | | | 19.0 | | |
Health Care | | | 4.4 | | |
Industrials | | | 5.5 | | |
Information Technology | | | 26.9 | | |
Materials | | | 2.0 | | |
Telecommunication Services | | | 6.8 | | |
Utilities | | | 2.9 | | |
Total | | | 100.0 | | |
Percentages indicated are based upon total equity investments. The Fund's portfolio composition is subject to change.
Investment Risks
Market risk may affect a single issuer, sector of the economy, industry or the market as a whole. International investing involves certain risks and volatility due to potential political, economic or currency instabilities and different financial and accounting standards. Risks are enhanced for emerging market issuers. Investments in small- and mid-cap companies involve risks and volatility greater than investments in larger, more established companies. Value securities may be unprofitable if the market fails to recognize their intrinsic worth or the portfolio manager misgauged that worth. Growth securities, at times, may not perform as well as value securities or the stock market in general and may be out of favor with investors. Certain issuer events, including initial public offerings, business consolidation or restructuring, may present heightened risks to securities from the high degree of uncertainty associated with such events. See the Fund's prospectus for more information on these and other risks.
Annual Report 2016
7
COLUMBIA EMERGING MARKETS FUND
UNDERSTANDING YOUR FUND'S EXPENSES
(Unaudited)
As an investor, you incur two types of costs. There are transaction costs, which generally include sales charges on purchases and may include redemption fees. There are also ongoing costs, which generally include management fees, distribution and/or service fees, and other fund expenses. The following information is intended to help you understand your ongoing costs (in dollars) of investing in the Fund and to help you compare these costs with the ongoing costs of investing in other mutual funds.
Analyzing Your Fund's Expenses
To illustrate these ongoing costs, we have provided examples and calculated the expenses paid by investors in each share class of the Fund during the period. The actual and hypothetical information in the table is based on an initial investment of $1,000 at the beginning of the period indicated and held for the entire period. Expense information is calculated two ways and each method provides you with different information. The amount listed in the "Actual" column is calculated using the Fund's actual operating expenses and total return for the period. You may use the Actual information, together with the amount invested, to estimate the expenses that you paid over the period. Simply divide your account value by $1,000 (for example, an $8,600 account value divided by $1,000 = 8.6), then multiply the results by the expenses paid during the period under the "Actual" column. The amount listed in the "Hypothetical" column assumes a 5% annual rate of return before expenses (which is not the Fund's actual return) and then applies the Fund's actual expense ratio for the period to the hypothetical return. You should not use the hypothetical account values and expenses to estimate either your actual account balance at the end of the period or the expenses you paid during the period. See "Compare With Other Funds" below for details on how to use the hypothetical data.
Compare With Other Funds
Since all mutual funds are required to include the same hypothetical calculations about expenses in shareholder reports, you can use this information to compare the ongoing cost of investing in the Fund with other funds. To do so, compare the hypothetical example with the 5% hypothetical examples that appear in the shareholder reports of other funds. As you compare hypothetical examples of other funds, it is important to note that hypothetical examples are meant to highlight the ongoing costs of investing in a fund only and do not reflect any transaction costs, such as sales charges, or redemption or exchange fees. Therefore, the hypothetical calculations are useful in comparing ongoing costs only, and will not help you determine the relative total costs of owning different funds. If transaction costs were included in these calculations, your costs would be higher.
March 1, 2016 – August 31, 2016
| | | Account Value at the Beginning
of the Period ($) | | Account Value at the End of the
Period ($) | | Expenses Paid During the
Period ($) | | Fund's Annualized
Expense Ratio (%) | |
| | | Actual | | Hypothetical | | Actual | | Hypothetical | | Actual | | Hypothetical | | Actual | |
Class A | | | 1,000.00 | | | | 1,000.00 | | | | 1,210.90 | | | | 1,016.99 | | | | 9.00 | | | | 8.21 | | | | 1.62 | | |
Class B | | | 1,000.00 | | | | 1,000.00 | | | | 1,206.60 | | | | 1,013.22 | | | | 13.15 | | | | 11.99 | | | | 2.37 | | |
Class C | | | 1,000.00 | | | | 1,000.00 | | | | 1,207.60 | | | | 1,013.22 | | | | 13.15 | | | | 11.99 | | | | 2.37 | | |
Class I | | | 1,000.00 | | | | 1,000.00 | | | | 1,213.40 | | | | 1,019.20 | | | | 6.57 | | | | 5.99 | | | | 1.18 | | |
Class K | | | 1,000.00 | | | | 1,000.00 | | | | 1,212.60 | | | | 1,017.70 | | | | 8.23 | | | | 7.51 | | | | 1.48 | | |
Class R | | | 1,000.00 | | | | 1,000.00 | | | | 1,210.50 | | | | 1,015.74 | | | | 10.39 | | | | 9.48 | | | | 1.87 | | |
Class R4 | | | 1,000.00 | | | | 1,000.00 | | | | 1,212.90 | | | | 1,018.25 | | | | 7.62 | | | | 6.95 | | | | 1.37 | | |
Class R5 | | | 1,000.00 | | | | 1,000.00 | | | | 1,213.40 | | | | 1,018.95 | | | | 6.84 | | | | 6.24 | | | | 1.23 | | |
Class W | | | 1,000.00 | | | | 1,000.00 | | | | 1,212.40 | | | | 1,017.04 | | | | 8.95 | | | | 8.16 | | | | 1.61 | | |
Class Y | | | 1,000.00 | | | | 1,000.00 | | | | 1,215.10 | | | | 1,019.20 | | | | 6.57 | | | | 5.99 | | | | 1.18 | | |
Class Z | | | 1,000.00 | | | | 1,000.00 | | | | 1,213.30 | | | | 1,018.25 | | | | 7.62 | | | | 6.95 | | | | 1.37 | | |
Expenses paid during the period are equal to the annualized expense ratio for each class as indicated above, multiplied by the average account value over the period and then multiplied by the number of days in the Fund's most recent fiscal half year and divided by 366.
Expenses do not include fees and expenses incurred indirectly by the Fund from its investment in underlying funds, including affiliated and non-affiliated pooled investment vehicles, such as mutual funds and exchange-traded funds.
Annual Report 2016
8
COLUMBIA EMERGING MARKETS FUND
PORTFOLIO OF INVESTMENTS
August 31, 2016
(Percentages represent value of investments compared to net assets)
Common Stocks 98.1%
Issuer | | Shares | | Value ($) | |
ARGENTINA 0.8% | |
Banco Macro SA, ADR | | | 54,718 | | | | 4,286,608 | | |
Globant SA(a) | | | 94,903 | | | | 3,705,962 | | |
Pampa Energia SA, ADR(a) | | | 107,944 | | | | 2,705,077 | | |
Total | | | | | 10,697,647 | | |
BRAZIL 4.8% | |
AmBev SA, ADR | | | 3,430,305 | | | | 20,341,709 | | |
BB Seguridade Participacoes SA | | | 587,700 | | | | 5,303,350 | | |
Fleury SA | | | 371,300 | | | | 4,409,561 | | |
Itaú Unibanco Holding SA, ADR | | | 629,255 | | | | 6,972,145 | | |
Multiplus SA | | | 671,200 | | | | 8,792,196 | | |
Telefonica Brasil SA, ADR | | | 444,643 | | | | 6,642,967 | | |
Ultrapar Participacoes SA | | | 464,300 | | | | 10,644,162 | | |
Total | | | | | 63,106,090 | | |
CHINA 22.2% | |
58.Com, Inc., ADR(a) | | | 213,524 | | | | 9,715,342 | | |
AAC Technologies Holdings, Inc. | | | 668,000 | | | | 7,608,047 | | |
Alibaba Group Holding Ltd., ADR(a) | | | 485,763 | | | | 47,211,306 | | |
ANTA Sports Products Ltd. | | | 4,296,000 | | | | 11,601,236 | | |
Baidu, Inc., ADR(a) | | | 25,778 | | | | 4,409,842 | | |
China Animal Healthcare Ltd.(a)(b) | | | 6,354,000 | | | | 425,918 | | |
China Biologic Products, Inc.(a) | | | 67,404 | | | | 7,417,136 | | |
China Mobile Ltd. | | | 3,693,000 | | | | 45,494,155 | | |
Ctrip.com International Ltd., ADR(a) | | | 276,976 | | | | 13,114,814 | | |
ENN Energy Holdings Ltd. | | | 1,802,000 | | | | 10,076,429 | | |
Nexteer Automotive Group Ltd. | | | 2,459,000 | | | | 3,374,874 | | |
Ping An Insurance Group Co. of
China Ltd., Class H | | | 6,387,500 | | | | 32,923,483 | | |
Shenzhou International Group
Holdings Ltd. | | | 2,425,000 | | | | 15,906,601 | | |
Spring Airlines Co., Ltd., Class A | | | 577,278 | | | | 4,055,490 | | |
Tencent Holdings Ltd. | | | 2,865,100 | | | | 74,248,733 | | |
Zhuzhou CRRC Times Electric Co.,
Ltd., Class H | | | 928,500 | | | | 4,925,113 | | |
Total | | | | | 292,508,519 | | |
CZECH REPUBLIC 0.3% | |
Komercni Banka AS | | | 134,645 | | | | 4,556,590 | | |
HONG KONG 2.4% | |
AIA Group Ltd. | | | 2,540,200 | | | | 15,998,614 | | |
Common Stocks (continued)
Issuer | | Shares | | Value ($) | |
Techtronic Industries Co., Ltd. | | | 4,112,500 | | | | 16,658,643 | | |
Total | | | | | 32,657,257 | | |
INDIA 13.3% | |
Asian Paints Ltd. | | | 262,237 | | | | 4,532,196 | | |
Bharat Petroleum Corp., Ltd. | | | 1,343,626 | | | | 12,090,952 | | |
Bharti Infratel Ltd. | | | 1,017,292 | | | | 5,322,640 | | |
Britannia Industries Ltd. | | | 167,536 | | | | 8,648,199 | | |
Dish TV India Ltd.(a) | | | 8,136,637 | | | | 11,976,961 | | |
Dr. Reddy's Laboratories Ltd. | | | 148,516 | | | | 6,817,048 | | |
Eicher Motors Ltd. | | | 32,807 | | | | 11,137,283 | | |
Havells India Ltd | | | 1,076,425 | | | | 6,706,132 | | |
HCL Technologies Ltd. | | | 893,205 | | | | 10,377,371 | | |
HDFC Bank Ltd., ADR | | | 259,329 | | | | 18,580,923 | | |
Hindustan Petroleum Corp., Ltd. | | | 178,716 | | | | 3,251,779 | | |
Indraprastha Gas Ltd. | | | 682,098 | | | | 8,157,613 | | |
IndusInd Bank Ltd. | | | 375,844 | | | | 6,650,069 | | |
InterGlobe Aviation Ltd.(a) | | | 293,919 | | | | 3,869,440 | | |
ITC Ltd. | | | 3,739,947 | | | | 14,518,152 | | |
Jubilant Foodworks Ltd. | | | 142,842 | | | | 2,502,641 | | |
Natco Pharma Ltd. | | | 463,049 | | | | 4,759,841 | | |
Petronet LNG Ltd. | | | 1,431,289 | | | | 7,516,886 | | |
Syngene International Ltd. | | | 708,911 | | | | 5,000,045 | | |
UPL Ltd. | | | 1,131,556 | | | | 10,786,321 | | |
Yes Bank Ltd. | | | 175,531 | | | | 3,576,729 | | |
Zee Entertainment Enterprises Ltd. | | | 1,045,458 | | | | 8,414,409 | | |
Total | | | | | 175,193,630 | | |
INDONESIA 7.1% | |
PT Ace Hardware Indonesia Tbk | | | 109,399,000 | | | | 8,239,000 | | |
PT Astra International Tbk | | | 7,910,700 | | | | 4,852,788 | | |
PT Bank Central Asia Tbk | | | 4,661,400 | | | | 5,282,783 | | |
PT Bank Rakyat Indonesia Persero Tbk | | | 19,172,600 | | | | 16,805,312 | | |
PT Matahari Department Store Tbk | | | 5,937,700 | | | | 8,933,268 | | |
PT Mitra Keluarga Karyasehat Tbk | | | 19,847,000 | | | | 4,185,008 | | |
PT Nippon Indosari Corpindo Tbk | | | 60,910,900 | | | | 7,413,495 | | |
PT Pakuwon Jati Tbk | | | 165,424,500 | | | | 7,404,072 | | |
PT Sumber Alfaria Trijaya Tbk | | | 77,727,500 | | | | 3,310,670 | | |
PT Surya Citra Media Tbk | | | 24,972,100 | | | | 5,692,398 | | |
PT Telekomunikasi Indonesia
Persero Tbk | | | 67,330,900 | | | | 21,276,851 | | |
Total | | | | | 93,395,645 | | |
The accompanying Notes to Financial Statements are an integral part of this statement.
Annual Report 2016
9
COLUMBIA EMERGING MARKETS FUND
PORTFOLIO OF INVESTMENTS (continued)
August 31, 2016
Common Stocks (continued)
Issuer | | Shares | | Value ($) | |
KENYA 0.2% | |
Safaricom Ltd. | | | 16,918,200 | | | | 3,341,867 | | |
MALAYSIA 1.1% | |
MyEg Services Bhd | | | 6,822,000 | | | | 3,681,281 | | |
Tenaga Nasional Bhd | | | 2,941,600 | | | | 10,691,452 | | |
Total | | | | | 14,372,733 | | |
MEXICO 2.4% | |
Alfa SAB de CV, Class A | | | 5,142,300 | | | | 8,366,954 | | |
Controladora Vuela Cia de Aviacion
SAB de CV, ADR(a) | | | 291,381 | | | | 5,183,668 | | |
Grupo Aeroportuario del Centro
Norte Sab de CV | | | 927,900 | | | | 5,711,968 | | |
Grupo Financiero Banorte SAB de CV,
Class O | | | 2,210,100 | | | | 11,910,342 | | |
Total | | | | | 31,172,932 | | |
PERU 1.0% | |
Credicorp Ltd. | | | 81,952 | | | | 12,840,239 | | |
PHILIPPINES 1.9% | |
GT Capital Holdings, Inc. | | | 218,225 | | | | 7,177,471 | | |
Jollibee Foods Corp. | | | 1,128,160 | | | | 5,925,855 | | |
Metropolitan Bank & Trust Co. | | | 4,661,856 | | | | 8,351,581 | | |
Robinsons Retail Holdings, Inc. | | | 2,053,270 | | | | 3,699,354 | | |
Total | | | | | 25,154,261 | | |
RUSSIAN FEDERATION 7.6% | |
Lukoil PJSC, ADR | | | 384,897 | | | | 17,202,972 | | |
Magnit PJSC | | | 89,355 | | | | 14,024,563 | | |
Mail.ru Group Ltd., GDR(a)(c) | | | 276,021 | | | | 4,637,153 | | |
Moscow Exchange MICEX-Rights PJSC | | | 5,948,430 | | | | 11,560,693 | | |
Sberbank of Russia PJSC, ADR | | | 1,690,552 | | | | 15,502,362 | | |
X5 Retail Group NV GDR, Registered
Shares(a)(c) | | | 866,845 | | | | 22,928,050 | | |
Yandex NV, Class A(a) | | | 681,395 | | | | 15,017,946 | | |
Total | | | | | 100,873,739 | | |
SOUTH AFRICA 5.9% | |
Aspen Pharmacare Holdings Ltd. | | | 203,336 | | | | 4,868,336 | | |
AVI Ltd. | | | 1,460,080 | | | | 8,838,738 | | |
Clicks Group Ltd. | | | 492,611 | | | | 4,057,624 | | |
Discovery Ltd. | | | 703,573 | | | | 5,735,015 | | |
EOH Holdings Ltd. | | | 367,564 | | | | 3,593,887 | | |
Mr. Price Group Ltd. | | | 242,763 | | | | 3,046,013 | | |
Common Stocks (continued)
Issuer | | Shares | | Value ($) | |
Naspers Ltd., Class N | | | 251,923 | | | | 41,227,502 | | |
SPAR Group Ltd. (The) | | | 501,663 | | | | 6,551,442 | | |
Total | | | | | 77,918,557 | | |
SOUTH KOREA 11.9% | |
AMOREPACIFIC Corp. | | | 26,728 | | | | 9,237,384 | | |
Caregen Co., Ltd. | | | 34,949 | | | | 3,745,765 | | |
Coway Co., Ltd. | | | 79,009 | | | | 5,901,197 | | |
Cuckoo Electronics Co., Ltd. | | | 39,195 | | | | 4,907,871 | | |
Duk San Neolux Co., Ltd.(a) | | | 87,657 | | | | 2,210,567 | | |
EO Technics Co., Ltd. | | | 38,077 | | | | 2,974,111 | | |
Hugel, Inc.(a) | | | 14,968 | | | | 5,605,982 | | |
Hyundai Steel Co. | | | 149,569 | | | | 6,862,612 | | |
I-SENS, Inc.(a) | | | 77,052 | | | | 2,355,737 | | |
Korea Electric Power Corp. | | | 127,676 | | | | 6,631,590 | | |
KT&G Corp. | | | 77,982 | | | | 8,175,613 | | |
LG Uplus Corp. | | | 630,072 | | | | 6,573,117 | | |
LIG Nex1 Co., Ltd. | | | 115,801 | | | | 9,498,642 | | |
Macquarie Korea Infrastructure Fund | | | 455,585 | | | | 3,590,883 | | |
Osstem Implant Co., Ltd.(a) | | | 68,307 | | | | 3,481,314 | | |
Samchuly Bicycle Co., Ltd. | | | 234,753 | | | | 3,259,145 | | |
Samsung Electronics Co., Ltd. | | | 29,527 | | | | 42,827,993 | | |
Samsung SDI Co., Ltd. | | | 71,420 | | | | 7,386,807 | | |
SK Hynix, Inc. | | | 493,011 | | | | 16,074,952 | | |
SK Innovation Co., Ltd. | | | 48,828 | | | | 6,337,604 | | |
Total | | | | | 157,638,886 | | |
TAIWAN 8.7% | |
Advanced Semiconductor
Engineering, Inc. | | | 5,417,000 | | | | 6,591,324 | | |
Cub Elecparts, Inc. | | | 515,024 | | | | 6,137,837 | | |
Eclat Textile Co., Ltd. | | | 316,917 | | | | 3,998,910 | | |
eMemory Technology, Inc. | | | 731,000 | | | | 7,591,637 | | |
Feng TAY Enterprise Co., Ltd. | | | 1,140,160 | | | | 5,412,679 | | |
Hota Industrial Manufacturing Co., Ltd. | | | 1,150,000 | | | | 5,956,974 | | |
Land Mark Optoelectronics Corp. | | | 696,400 | | | | 7,568,299 | | |
Largan Precision Co., Ltd. | | | 113,000 | | | | 12,635,815 | | |
Taiwan Paiho., Ltd. | | | 2,678,000 | | | | 7,694,213 | | |
Taiwan Semiconductor Manufacturing
Co., Ltd. | | | 7,305,048 | | | | 40,567,714 | | |
Tung Thih Electronic Co., Ltd. | | | 387,000 | | | | 5,890,924 | | |
Voltronic Power Technology Corp. | | | 297,153 | | | | 4,596,984 | | |
Total | | | | | 114,643,310 | | |
The accompanying Notes to Financial Statements are an integral part of this statement.
Annual Report 2016
10
COLUMBIA EMERGING MARKETS FUND
PORTFOLIO OF INVESTMENTS (continued)
August 31, 2016
Common Stocks (continued)
Issuer | | Shares | | Value ($) | |
THAILAND 3.9% | |
Kasikornbank PCL, Foreign
Registered Shares | | | 2,832,800 | | | | 16,189,029 | | |
Krungthai Card PCL | | | 1,253,800 | | | | 5,029,301 | | |
Mega Lifesciences PCL, Foreign
Registered Shares | | | 7,727,000 | | | | 4,397,507 | | |
Muangthai Leasing PCL | | | 9,778,000 | | | | 5,420,659 | | |
Siam Commercial Bank PCL (The),
Foreign Registered Shares | | | 2,353,600 | | | | 10,863,146 | | |
Srisawad Power 1979 PCL | | | 4,720,125 | | | | 5,381,388 | | |
Thai Union Group PCL | | | 7,616,400 | | | | 4,724,642 | | |
Total | | | | | 52,005,672 | | |
TURKEY 1.1% | |
Coca-Cola Icecek AS | | | 240,047 | | | | 2,999,928 | | |
Turk Traktor ve Ziraat Makineleri AS | | | 135,722 | | | | 3,962,736 | | |
Ulker Biskuvi Sanayi AS | | | 1,075,895 | | | | 7,574,138 | | |
Total | | | | | 14,536,802 | | |
UNITED KINGDOM 0.2% | |
Randgold Resources Ltd. | | | 21,790 | | | | 2,045,867 | | |
UNITED STATES 1.3% | |
Atento SA(a) | | | 363,731 | | | | 3,673,683 | | |
Luxoft Holding, Inc.(a) | | | 110,604 | | | | 5,675,091 | | |
Common Stocks (continued)
Issuer | | Shares | | Value ($) | |
Universal Display Corp.(a) | | | 128,933 | | | | 7,425,252 | | |
Total | | | | | 16,774,026 | | |
Total Common Stocks
(Cost: $1,049,034,659) | | | | | 1,295,434,269 | | |
Preferred Stocks 0.6%
SOUTH KOREA 0.6% | |
Samsung Electronics Co., Ltd. | | | 7,453 | | | | 8,839,033 | | |
Total Preferred Stocks
(Cost: $7,643,864) | | | | | 8,839,033 | | |
Money Market Funds 1.6%
| | | Shares | | Value ($) | |
Columbia Short-Term Cash Fund,
0.415%(d)(e) | | | 20,788,666 | | | | 20,788,666 | | |
Total Money Market Funds
(Cost: $20,788,666) | | | | | 20,788,666 | | |
Total Investments
(Cost: $1,077,467,189) | | | | | 1,325,061,968 | | |
Other Assets & Liabilities, Net | | | | | (4,559,998 | ) | |
Net Assets | | | | | 1,320,501,970 | | |
Notes to Portfolio of Investments
(a) Non-income producing investment.
(b) Represents fair value as determined in good faith under procedures approved by the Board of Trustees. At August 31, 2016, the value of these securities amounted to $425,918, which represents 0.03% of net assets.
(c) Represents privately placed and other securities and instruments exempt from SEC registration (collectively, private placements), such as Section 4(a)(2) and Rule 144A eligible securities, which are often sold only to qualified institutional buyers. The Fund may invest in private placements determined to be liquid as well as those determined to be illiquid. Private placements may be determined to be liquid under guidelines established by the Fund's Board of Trustees. At August 31, 2016, the value of these securities amounted to $27,565,203 or 2.09% of net assets.
(d) The rate shown is the seven-day current annualized yield at August 31, 2016.
(e) As defined in the Investment Company Act of 1940, an affiliated company is one in which the Fund owns 5% or more of the company's outstanding voting securities, or a company which is under common ownership or control with the Fund. Holdings and transactions in these affiliated companies during the year ended August 31, 2016 are as follows:
Issuer | | Beginning
Cost ($) | | Purchase
Cost ($) | | Proceeds
From Sales ($) | | Ending
Cost ($) | | Dividends —
Affiliated
Issuers ($) | | Value ($) | |
Columbia Short-Term Cash Fund | | | 12,058,111 | | | | 504,537,896 | | | | (495,807,341 | ) | | | 20,788,666 | | | | 89,195 | | | | 20,788,666 | | |
The accompanying Notes to Financial Statements are an integral part of this statement.
Annual Report 2016
11
COLUMBIA EMERGING MARKETS FUND
PORTFOLIO OF INVESTMENTS (continued)
August 31, 2016
Abbreviation Legend
ADR American Depositary Receipt
GDR Global Depositary Receipt
Fair Value Measurements
The Fund categorizes its fair value measurements according to a three-level hierarchy that maximizes the use of observable inputs and minimizes the use of unobservable inputs by prioritizing that the most observable input be used when available. Observable inputs are those that market participants would use in pricing an investment based on market data obtained from sources independent of the reporting entity. Unobservable inputs are those that reflect the Fund's assumptions about the information market participants would use in pricing an investment. An investment's level within the fair value hierarchy is based on the lowest level of any input that is deemed significant to the asset's or liability's fair value measurement. The input levels are not necessarily an indication of the risk or liquidity associated with investments at that level. For example, certain U.S. government securities are generally high quality and liquid, however, they are reflected as Level 2 because the inputs used to determine fair value may not always be quoted prices in an active market.
Fair value inputs are summarized in the three broad levels listed below:
> Level 1 — Valuations based on quoted prices for investments in active markets that the Fund has the ability to access at the measurement date (including NAV for open-end mutual funds). Valuation adjustments are not applied to Level 1 investments.
> Level 2 — Valuations based on other significant observable inputs (including quoted prices for similar securities, interest rates, prepayment speeds, credit risks, etc.).
> Level 3 — Valuations based on significant unobservable inputs (including the Fund's own assumptions and judgment in determining the fair value of investments).
Inputs that are used in determining fair value of an investment may include price information, credit data, volatility statistics, and other factors. These inputs can be either observable or unobservable. The availability of observable inputs can vary between investments, and is affected by various factors such as the type of investment, and the volume and level of activity for that investment or similar investments in the marketplace. The inputs will be considered by the Investment Manager, along with any other relevant factors in the calculation of an investment's fair value. The Fund uses prices and inputs that are current as of the measurement date, which may include periods of market dislocations. During these periods, the availability of prices and inputs may be reduced for many investments. This condition could cause an investment to be reclassified between the various levels within the hierarchy.
Foreign equity securities actively traded in markets where there is a significant delay in the local close relative to the New York Stock Exchange (NYSE) are classified as Level 2. The values of these securities may include an adjustment to reflect the impact of significant market movements following the close of local trading, as described in Note 2 to the financial statements — Security Valuation.
Certain investments that have been measured at fair value using the net asset value per share (or its equivalent) are not categorized in the fair value hierarchy. The fair value amounts presented in the table are intended to reconcile the fair value hierarchy to the amounts presented in the Portfolio of Investments. The Columbia Short-Term Cash Fund seeks to provide shareholders with maximum current income consistent with liquidity and stability of principal. Investments in Columbia Short-Term Cash Fund may be redeemed on a daily basis without restriction.
Investments falling into the Level 3 category are primarily supported by quoted prices from brokers and dealers participating in the market for those investments. However, these may be classified as Level 3 investments due to lack of market transparency and corroboration to support these quoted prices. Additionally, valuation models may be used as the pricing source for any remaining investments classified as Level 3. These models may rely on one or more significant unobservable inputs and/or significant assumptions by the Investment Manager. Inputs used in valuations may include, but are not limited to, financial statement analysis, capital account balances, discount rates and estimated cash flows, and comparable company data.
Under the direction of the Fund's Board of Trustees (the Board), the Investment Manager's Valuation Committee (the Committee) is responsible for overseeing the valuation procedures approved by the Board. The Committee consists of voting and non-voting members from various groups within the Investment Manager's organization, including operations and accounting, trading and investments, compliance, risk management and legal.
The Committee meets at least monthly to review and approve valuation matters, which may include a description of specific valuation determinations, data regarding pricing information received from approved pricing vendors and brokers and the results of Board-approved valuation control policies and procedures (the Policies). The Policies address, among other things, instances when market quotations are or are not readily available, including recommendations of third party pricing vendors and a determination of appropriate pricing methodologies; events that require specific valuation determinations and assessment of fair value techniques; securities with a potential for stale pricing, including those that are illiquid, restricted, or in default; and the effectiveness of third party pricing vendors, including periodic reviews of vendors. The Committee meets more frequently, as needed, to discuss additional valuation matters, which may include the need to review back-testing results, review time-sensitive information or approve related valuation actions. The Committee reports to the Board, with members of the Committee meeting with the Board at each of its regularly scheduled meetings to discuss valuation matters and actions during the period, similar to those described earlier.
The accompanying Notes to Financial Statements are an integral part of this statement.
Annual Report 2016
12
COLUMBIA EMERGING MARKETS FUND
PORTFOLIO OF INVESTMENTS (continued)
August 31, 2016
Fair Value Measurements (continued)
For investments categorized as Level 3, the Committee monitors information similar to that described above, which may include: (i) data specific to the issuer or comparable issuers, (ii) general market or specific sector news and (iii) quoted prices and specific or similar security transactions. The Committee considers this data and any changes from prior periods in order to assess the reasonableness of observable and unobservable inputs, any assumptions or internal models used to value those securities and changes in fair value. This data is also used to corroborate, when available, information received from approved pricing vendors and brokers. Various factors impact the frequency of monitoring this information (which may occur as often as daily). However, the Committee may determine that changes to inputs, assumptions and models are not required as a result of the monitoring procedures performed.
The following table is a summary of the inputs used to value the Fund's investments at August 31, 2016:
| | | Level 1
Quoted Prices in Active
Markets for Identical
Assets ($) | | Level 2
Other Significant
Observable Inputs ($) | | Level 3
Significant
Unobservable Inputs ($) | | Total ($) | |
Investments | |
Common Stocks | |
Argentina | | | 10,697,647 | | | | — | | | | — | | | | 10,697,647 | | |
Brazil | | | 63,106,090 | | | | — | | | | — | | | | 63,106,090 | | |
China | | | 81,868,440 | | | | 210,214,161 | | | | 425,918 | | | | 292,508,519 | | |
Czech Republic | | | — | | | | 4,556,590 | | | | — | | | | 4,556,590 | | |
Hong Kong | | | — | | | | 32,657,257 | | | | — | | | | 32,657,257 | | |
India | | | 18,580,923 | | | | 156,612,707 | | | | — | | | | 175,193,630 | | |
Indonesia | | | — | | | | 93,395,645 | | | | — | | | | 93,395,645 | | |
Kenya | | | — | | | | 3,341,867 | | | | — | | | | 3,341,867 | | |
Malaysia | | | — | | | | 14,372,733 | | | | — | | | | 14,372,733 | | |
Mexico | | | 31,172,932 | | | | — | | | | — | | | | 31,172,932 | | |
Peru | | | 12,840,239 | | | | — | | | | — | | | | 12,840,239 | | |
Philippines | | | — | | | | 25,154,261 | | | | — | | | | 25,154,261 | | |
Russian Federation | | | 32,220,918 | | | | 68,652,821 | | | | — | | | | 100,873,739 | | |
South Africa | | | — | | | | 77,918,557 | | | | — | | | | 77,918,557 | | |
South Korea | | | — | | | | 157,638,886 | | | | — | | | | 157,638,886 | | |
Taiwan | | | — | | | | 114,643,310 | | | | — | | | | 114,643,310 | | |
Thailand | | | — | | | | 52,005,672 | | | | — | | | | 52,005,672 | | |
Turkey | | | — | | | | 14,536,802 | | | | — | | | | 14,536,802 | | |
United Kingdom | | | — | | | | 2,045,867 | | | | — | | | | 2,045,867 | | |
United States | | | 16,774,026 | | | | — | | | | — | | | | 16,774,026 | | |
Total Common Stocks | | | 267,261,215 | | | | 1,027,747,136 | | | | 425,918 | | | | 1,295,434,269 | | |
Preferred Stocks | |
South Korea | | | — | | | | 8,839,033 | | | | — | | | | 8,839,033 | | |
Investments measured at net asset value | |
Money Market Funds | | | — | | | | — | | | | — | | | | 20,788,666 | | |
Total Investments | | | 267,261,215 | | | | 1,036,586,169 | | | | 425,918 | | | | 1,325,061,968 | | |
See the Portfolio of Investments for all investment classifications not indicated in the table.
The Fund's assets assigned to the Level 2 input category are generally valued using the market approach, in which a security's value is determined through reference to prices and information from market transactions for similar or identical assets. These assets include certain
The accompanying Notes to Financial Statements are an integral part of this statement.
Annual Report 2016
13
COLUMBIA EMERGING MARKETS FUND
PORTFOLIO OF INVESTMENTS (continued)
August 31, 2016
Fair Value Measurements (continued)
foreign securities for which a third party statistical pricing service may be employed for purposes of fair market valuation. The model utilized by such third party statistical pricing service takes into account a security's correlation to available market data including, but not limited to, intraday index, ADR, and exchange-traded fund movements.
There were no transfers of financial assets between Levels 1 and 2 during the period.
The Fund does not hold any significant investments (greater than one percent of net assets) categorized as Level 3.
The Fund's assets assigned to the Level 3 category are valued utilizing the valuation technique deemed the most appropriate in the circumstances. Certain common stocks classified as Level 3 securities are valued using the market approach. To determine fair value for these securities, management considered various factors which may have included, but were not limited to, the halt price of the security, discount rates observed in the market for similar assets as well as the movement in certain foreign or domestic market indices. Significant increases (decreases) to any of these inputs would result in a significantly lower (higher) fair value measurement. Generally, a change in observable yields on comparable securities would result in a directionally similar change to discount rates.
Financial assets were transferred from Level 3 to Level 2 as observable market inputs were utilized and management determined that there was sufficient, reliable and observable market data to value these assets as of period end.
| Transfers In | | Transfers Out | |
| Level 2 ($) | | Level 3 ($) | | Level 2 ($) | | Level 3 ($) | |
| | 5,214,233 | | | | — | | | | — | | | | 5,214,233 | | |
Transfers into and/or out of Level 3 are determined based on the fair value at the beginning of the period for security positions held throughout the period.
The accompanying Notes to Financial Statements are an integral part of this statement.
Annual Report 2016
14
COLUMBIA EMERGING MARKETS FUND
STATEMENT OF ASSETS AND LIABILITIES
August 31, 2016
Assets | |
Investments, at value | |
Unaffiliated issuers (identified cost $1,056,678,523) | | $ | 1,304,273,302 | | |
Affiliated issuers (identified cost $20,788,666) | | | 20,788,666 | | |
Total investments (identified cost $1,077,467,189) | | | 1,325,061,968 | | |
Cash | | | 9,943 | | |
Foreign currency (identified cost $2,221,374) | | | 2,221,374 | | |
Receivable for: | |
Investments sold | | | 1,434,857 | | |
Capital shares sold | | | 1,472,972 | | |
Dividends | | | 914,665 | | |
Prepaid expenses | | | 10,503 | | |
Trustees' deferred compensation plan | | | 48,426 | | |
Total assets | | | 1,331,174,708 | | |
Liabilities | |
Payable for: | |
Investments purchased | | | 7,015,282 | | |
Capital shares purchased | | | 963,659 | | |
Foreign capital gains taxes deferred | | | 2,246,682 | | |
Management services fees | | | 39,116 | | |
Distribution and/or service fees | | | 2,752 | | |
Transfer agent fees | | | 115,914 | | |
Plan administration fees | | | 18 | | |
Compensation of board members | | | 7,772 | | |
Chief compliance officer expenses | | | 89 | | |
Other expenses | | | 233,028 | | |
Trustees' deferred compensation plan | | | 48,426 | | |
Total liabilities | | | 10,672,738 | | |
Net assets applicable to outstanding capital stock | | $ | 1,320,501,970 | | |
Represented by | |
Paid-in capital | | $ | 1,223,190,024 | | |
Excess of distributions over net investment income | | | (683,147 | ) | |
Accumulated net realized loss | | | (147,344,275 | ) | |
Unrealized appreciation (depreciation) on: | |
Investments | | | 247,594,779 | | |
Foreign currency translations | | | (8,729 | ) | |
Foreign capital gains tax | | | (2,246,682 | ) | |
Total — representing net assets applicable to outstanding capital stock | | $ | 1,320,501,970 | | |
The accompanying Notes to Financial Statements are an integral part of this statement.
Annual Report 2016
15
COLUMBIA EMERGING MARKETS FUND
STATEMENT OF ASSETS AND LIABILITIES (continued)
August 31, 2016
Class A | |
Net assets | | $ | 244,190,382 | | |
Shares outstanding | | | 24,436,389 | | |
Net asset value per share | | $ | 9.99 | | |
Maximum offering price per share(a) | | $ | 10.60 | | |
Class B | |
Net assets | | $ | 1,408,135 | | |
Shares outstanding | | | 147,849 | | |
Net asset value per share | | $ | 9.52 | | |
Class C | |
Net assets | | $ | 19,418,736 | | |
Shares outstanding | | | 2,035,556 | | |
Net asset value per share | | $ | 9.54 | | |
Class I | |
Net assets | | $ | 206,575,450 | | |
Shares outstanding | | | 20,405,109 | | |
Net asset value per share | | $ | 10.12 | | |
Class K | |
Net assets | | $ | 78,878 | | |
Shares outstanding | | | 7,859 | | |
Net asset value per share | | $ | 10.04 | | |
Class R | |
Net assets | | $ | 9,683,464 | | |
Shares outstanding | | | 978,853 | | |
Net asset value per share | | $ | 9.89 | | |
Class R4 | |
Net assets | | $ | 2,205,374 | | |
Shares outstanding | | | 217,465 | | |
Net asset value per share | | $ | 10.14 | | |
Class R5 | |
Net assets | | $ | 113,041,253 | | |
Shares outstanding | | | 11,166,176 | | |
Net asset value per share | | $ | 10.12 | | |
Class W | |
Net assets | | $ | 54,785,391 | | |
Shares outstanding | | | 5,485,060 | | |
Net asset value per share | | $ | 9.99 | | |
Class Y | |
Net assets | | $ | 22,103,990 | | |
Shares outstanding | | | 2,173,927 | | |
Net asset value per share | | $ | 10.17 | | |
Class Z | |
Net assets | | $ | 647,010,917 | | |
Shares outstanding | | | 64,234,301 | | |
Net asset value per share | | $ | 10.07 | | |
(a) The maximum offering price per share is calculated by dividing the net asset value per share by 1.0 minus the maximum sales charge of 5.75%.
The accompanying Notes to Financial Statements are an integral part of this statement.
Annual Report 2016
16
COLUMBIA EMERGING MARKETS FUND
STATEMENT OF OPERATIONS
Year Ended August 31, 2016
Net investment income | |
Income: | |
Dividends — unaffiliated issuers | | $ | 19,503,822 | | |
Dividends — affiliated issuers | | | 89,195 | | |
Interest | | | 59 | | |
Foreign taxes withheld | | | (2,326,516 | ) | |
Total income | | | 17,266,560 | | |
Expenses: | |
Management services fees | | | 12,557,771 | | |
Distribution and/or service fees | |
Class A | | | 580,051 | | |
Class B | | | 18,344 | | |
Class C | | | 190,994 | | |
Class R | | | 40,367 | | |
Class W | | | 20,750 | | |
Transfer agent fees | |
Class A | | | 476,858 | | |
Class B | | | 3,841 | | |
Class C | | | 39,336 | | |
Class K | | | 42 | | |
Class R | | | 16,472 | | |
Class R4 | | | 3,645 | | |
Class R5 | | | 38,833 | | |
Class W | | | 14,039 | | |
Class Z | | | 1,252,913 | | |
Plan administration fees | |
Class K | | | 209 | | |
Compensation of board members | | | 36,980 | | |
Custodian fees | | | 474,912 | | |
Printing and postage fees | | | 138,453 | | |
Registration fees | | | 159,610 | | |
Audit fees | | | 63,453 | | |
Legal fees | | | 29,520 | | |
Line of credit interest expense | | | 1,357 | | |
Chief compliance officer expenses | | | 516 | | |
Other | | | 199,671 | | |
Total expenses | | | 16,358,937 | | |
Expense reductions | | | (1,812 | ) | |
Total net expenses | | | 16,357,125 | | |
Net investment income | | | 909,435 | | |
Realized and unrealized gain (loss) — net | |
Net realized gain (loss) on: | |
Investments | | | (71,020,191 | ) | |
Foreign currency translations | | | (944,430 | ) | |
Net realized loss | | | (71,964,621 | ) | |
Net change in unrealized appreciation (depreciation) on: | |
Investments | | | 233,130,998 | | |
Foreign currency translations | | | 18,697 | | |
Foreign capital gains tax | | | (2,246,682 | ) | |
Net change in unrealized appreciation | | | 230,903,013 | | |
Net realized and unrealized gain | | | 158,938,392 | | |
Net increase in net assets resulting from operations | | $ | 159,847,827 | | |
The accompanying Notes to Financial Statements are an integral part of this statement.
Annual Report 2016
17
COLUMBIA EMERGING MARKETS FUND
STATEMENT OF CHANGES IN NET ASSETS
| | | Year Ended
August 31,
2016 | | Year Ended
August 31,
2015 | |
Operations | |
Net investment income | | $ | 909,435 | | | $ | 2,078,799 | | |
Net realized loss | | | (71,964,621 | ) | | | (71,138,936 | ) | |
Net change in unrealized appreciation (depreciation) | | | 230,903,013 | | | | (235,621,986 | ) | |
Net increase (decrease) in net assets resulting from operations | | | 159,847,827 | | | | (304,682,123 | ) | |
Distributions to shareholders | |
Net investment income | |
Class A | | | — | | | | (10,564 | ) | |
Class I | | | — | | | | (711,105 | ) | |
Class K | | | — | | | | (370 | ) | |
Class R4 | | | — | | | | (836 | ) | |
Class R5 | | | — | | | | (15,205 | ) | |
Class W | | | — | | | | (4 | ) | |
Class Y | | | — | | | | (18,877 | ) | |
Class Z | | | — | | | | (2,847,786 | ) | |
Total distributions to shareholders | | | — | | | | (3,604,747 | ) | |
Decrease in net assets from capital stock activity | | | (23,495,888 | ) | | | (82,410,927 | ) | |
Total increase (decrease) in net assets | | | 136,351,939 | | | | (390,697,797 | ) | |
Net assets at beginning of year | | | 1,184,150,031 | | | | 1,574,847,828 | | |
Net assets at end of year | | $ | 1,320,501,970 | | | $ | 1,184,150,031 | | |
Excess of distributions over net investment income | | $ | (683,147 | ) | | $ | (945,045 | ) | |
The accompanying Notes to Financial Statements are an integral part of this statement.
Annual Report 2016
18
COLUMBIA EMERGING MARKETS FUND
STATEMENT OF CHANGES IN NET ASSETS (continued)
| | | Year Ended August 31, 2016 | | Year Ended August 31, 2015 | |
| | | Shares | | Dollars ($) | | Shares | | Dollars ($) | |
Capital stock activity | |
Class A shares | |
Subscriptions(a) | | | 3,327,630 | | | | 29,799,138 | | | | 3,874,794 | | | | 39,633,768 | | |
Distributions reinvested | | | — | | | | — | | | | 1,055 | | | | 10,310 | | |
Redemptions | | | (6,077,207 | ) | | | (54,460,832 | ) | | | (5,404,992 | ) | | | (54,656,539 | ) | |
Net decrease | | | (2,749,577 | ) | | | (24,661,694 | ) | | | (1,529,143 | ) | | | (15,012,461 | ) | |
Class B shares | |
Subscriptions | | | 5,032 | | | | 44,437 | | | | 7,828 | | | | 77,258 | | |
Redemptions(a) | | | (165,213 | ) | | | (1,395,472 | ) | | | (269,797 | ) | | | (2,655,593 | ) | |
Net decrease | | | (160,181 | ) | | | (1,351,035 | ) | | | (261,969 | ) | | | (2,578,335 | ) | |
Class C shares | |
Subscriptions | | | 347,938 | | | | 3,012,329 | | | | 539,018 | | | | 5,292,880 | | |
Redemptions | | | (733,050 | ) | | | (6,243,801 | ) | | | (676,372 | ) | | | (6,633,044 | ) | |
Net decrease | | | (385,112 | ) | | | (3,231,472 | ) | | | (137,354 | ) | | | (1,340,164 | ) | |
Class I shares | |
Subscriptions | | | 8,846,505 | | | | 81,000,588 | | | | 2,050,692 | | | | 20,687,009 | | |
Distributions reinvested | | | — | | | | — | | | | 72,413 | | | | 711,091 | | |
Redemptions | | | (3,042,209 | ) | | | (27,612,401 | ) | | | (1,198,281 | ) | | | (12,438,393 | ) | |
Net increase | | | 5,804,296 | | | | 53,388,187 | | | | 924,824 | | | | 8,959,707 | | |
Class K shares | |
Subscriptions | | | — | | | | — | | | | 10 | | | | 101 | | |
Distributions reinvested | | | — | | | | — | | | | 37 | | | | 365 | | |
Redemptions | | | (2,985 | ) | | | (25,916 | ) | | | (8,008 | ) | | | (82,348 | ) | |
Net decrease | | | (2,985 | ) | | | (25,916 | ) | | | (7,961 | ) | | | (81,882 | ) | |
Class R shares | |
Subscriptions | | | 481,326 | | | | 4,262,363 | | | | 296,050 | | | | 2,998,912 | | |
Redemptions | | | (304,670 | ) | | | (2,682,379 | ) | | | (250,445 | ) | | | (2,529,410 | ) | |
Net increase | | | 176,656 | | | | 1,579,984 | | | | 45,605 | | | | 469,502 | | |
Class R4 shares | |
Subscriptions | | | 86,478 | | | | 794,913 | | | | 205,002 | | | | 2,201,092 | | |
Distributions reinvested | | | — | | | | — | | | | 84 | | | | 829 | | |
Redemptions | | | (74,407 | ) | | | (686,169 | ) | | | (26,824 | ) | | | (271,603 | ) | |
Net increase | | | 12,071 | | | | 108,744 | | | | 178,262 | | | | 1,930,318 | | |
Class R5 shares | |
Subscriptions | | | 11,363,469 | | | | 101,539,595 | | | | 1,876,656 | | | | 19,546,076 | | |
Distributions reinvested | | | — | | | | — | | | | 1,547 | | | | 15,205 | | |
Redemptions | | | (2,177,212 | ) | | | (19,945,951 | ) | | | (177,693 | ) | | | (1,777,242 | ) | |
Net increase | | | 9,186,257 | | | | 81,593,644 | | | | 1,700,510 | | | | 17,784,039 | | |
The accompanying Notes to Financial Statements are an integral part of this statement.
Annual Report 2016
19
COLUMBIA EMERGING MARKETS FUND
STATEMENT OF CHANGES IN NET ASSETS (continued)
| | | Year Ended August 31, 2016 | | Year Ended August 31, 2015 | |
| | | Shares | | Dollars ($) | | Shares | | Dollars ($) | |
Capital stock activity (continued) | |
Class W shares | |
Subscriptions | | | 5,749,024 | | | | 53,044,085 | | | | — | | | | — | | |
Distributions reinvested | | | — | | | | — | | | | — | | | | 4 | | |
Redemptions | | | (270,509 | ) | | | (2,678,741 | ) | | | (5,654 | ) | | | (54,765 | ) | |
Net increase (decrease) | | | 5,478,515 | | | | 50,365,344 | | | | (5,654 | ) | | | (54,761 | ) | |
Class Y shares | |
Subscriptions | | | 2,219,755 | | | | 19,740,788 | | | | 318,963 | | | | 3,269,168 | | |
Distributions reinvested | | | — | | | | — | | | | 1,913 | | | | 18,865 | | |
Redemptions | | | (646,966 | ) | | | (5,849,048 | ) | | | (93,927 | ) | | | (940,649 | ) | |
Net increase | | | 1,572,789 | | | | 13,891,740 | | | | 226,949 | | | | 2,347,384 | | |
Class Z shares | |
Subscriptions | | | 19,741,973 | | | | 177,835,783 | | | | 43,726,071 | | | | 446,533,740 | | |
Distributions reinvested | | | — | | | | — | | | | 22,101 | | | | 216,800 | | |
Redemptions | | | (41,608,748 | ) | | | (372,989,197 | ) | | | (53,999,466 | ) | | | (541,584,814 | ) | |
Net decrease | | | (21,866,775 | ) | | | (195,153,414 | ) | | | (10,251,294 | ) | | | (94,834,274 | ) | |
Total net decrease | | | (2,934,046 | ) | | | (23,495,888 | ) | | | (9,117,225 | ) | | | (82,410,927 | ) | |
(a) Includes conversions of Class B shares to Class A shares, if any.
The accompanying Notes to Financial Statements are an integral part of this statement.
Annual Report 2016
20
COLUMBIA EMERGING MARKETS FUND
The following tables are intended to help you understand the Fund's financial performance. Certain information reflects financial results for a single share of a class held for the periods shown. Per share net investment income (loss) amounts are calculated based on average shares outstanding during the period. Total return assumes reinvestment of all dividends and distributions, if any. Total return does not reflect payment of sales charges, if any. Total return and portfolio turnover are not annualized for periods of less than one year. The portfolio turnover rate is calculated without regard to purchase and sales transactions of short-term instruments and certain derivatives, if any. If such transactions were included, the Fund's portfolio turnover rate may be higher.
| | | Year Ended August 31, | | Year Ended
March 31, | |
Class A | | 2016 | | 2015 | | 2014 | | 2013 | | 2012(a) | | 2012 | |
Per share data | |
Net asset value, beginning of period | | $ | 8.79 | | | $ | 10.94 | | | $ | 9.13 | | | $ | 9.08 | | | $ | 10.01 | | | $ | 11.48 | | |
Income from investment operations: | |
Net investment income (loss) | | | (0.01 | ) | | | (0.01 | ) | | | (0.01 | ) | | | 0.14 | | | | 0.05 | | | | 0.05 | | |
Net realized and unrealized gain (loss) | | | 1.21 | | | | (2.14 | ) | | | 1.84 | | | | (0.05 | ) | | | (0.55 | ) | | | (0.95 | ) | |
Total from investment operations | | | 1.20 | | | | (2.15 | ) | | | 1.83 | | | | 0.09 | | | | (0.50 | ) | | | (0.90 | ) | |
Less distributions to shareholders: | |
Net investment income | | | — | | | | (0.00 | )(b) | | | (0.02 | ) | | | (0.04 | ) | | | — | | | | — | | |
Net realized gains | | | — | | | | — | | | | — | | | | — | | | | (0.43 | ) | | | (0.57 | ) | |
Total distributions to shareholders | | | — | | | | (0.00 | )(b) | | | (0.02 | ) | | | (0.04 | ) | | | (0.43 | ) | | | (0.57 | ) | |
Redemption fees: | |
Net asset value, end of period | | $ | 9.99 | | | $ | 8.79 | | | $ | 10.94 | | | $ | 9.13 | | | $ | 9.08 | | | $ | 10.01 | | |
Total return | | | 13.65 | % | | | (19.65 | %) | | | 20.01 | % | | | 0.98 | % | | | (4.80 | %) | | | (8.06 | %) | |
Ratios to average net assets(c) | |
Total gross expenses | | | 1.67 | %(d) | | | 1.62 | %(d) | | | 1.67 | %(d) | | | 1.76 | % | | | 2.08 | %(e) | | | 2.08 | %(d) | |
Total net expenses(f) | | | 1.67 | %(d)(g) | | | 1.62 | %(d)(g) | | | 1.67 | %(d)(g) | | | 1.75 | %(g) | | | 1.92 | %(e)(g) | | | 1.87 | %(d)(g) | |
Net investment income (loss) | | | (0.16 | %) | | | (0.07 | %) | | | (0.07 | %) | | | 1.42 | % | | | 1.41 | %(e) | | | 0.54 | % | |
Supplemental data | |
Net assets, end of period (in thousands) | | $ | 244,190 | | | $ | 238,932 | | | $ | 314,231 | | | $ | 300,601 | | | $ | 11,177 | | | $ | 12,260 | | |
Portfolio turnover | | | 81 | % | | | 76 | % | | | 80 | % | | | 81 | % | | | 35 | % | | | 117 | % | |
Notes to Financial Highlights
(a) For the period from April 1, 2012 to August 31, 2012. During the period, the Fund's fiscal year end was changed from March 31 to August 31.
(b) Rounds to zero.
(c) In addition to the fees and expenses that the Fund bears directly, the Fund indirectly bears a pro rata share of the fees and expenses of any other funds in which it invests. Such indirect expenses are not included in the Fund's reported expense ratios.
(d) Ratios include line of credit interest expense which is less than 0.01%.
(e) Annualized.
(f) Total net expenses include the impact of certain fee waivers/expense reimbursements made by the Investment Manager and certain of its affiliates, if applicable.
(g) The benefits derived from expense reductions had an impact of less than 0.01%.
The accompanying Notes to Financial Statements are an integral part of this statement.
Annual Report 2016
21
COLUMBIA EMERGING MARKETS FUND
FINANCIAL HIGHLIGHTS (continued)
| | | Year Ended August 31, | |
Class B | | 2016 | | 2015 | | 2014 | | 2013(a) | |
Per share data | |
Net asset value, beginning of period | | $ | 8.44 | | | $ | 10.59 | | | $ | 8.89 | | | $ | 10.17 | | |
Income from investment operations: | |
Net investment income (loss) | | | (0.09 | ) | | | (0.10 | ) | | | (0.09 | ) | | | 0.04 | | |
Net realized and unrealized gain (loss) | | | 1.17 | | | | (2.05 | ) | | | 1.79 | | | | (1.32 | ) | |
Total from investment operations | | | 1.08 | | | | (2.15 | ) | | | 1.70 | | | | (1.28 | ) | |
Net asset value, end of period | | $ | 9.52 | | | $ | 8.44 | | | $ | 10.59 | | | $ | 8.89 | | |
Total return | | | 12.80 | % | | | (20.30 | %) | | | 19.12 | % | | | (12.59 | %) | |
Ratios to average net assets(b) | |
Total gross expenses | | | 2.43 | %(c) | | | 2.37 | %(c) | | | 2.42 | %(c) | | | 2.49 | %(d) | |
Total net expenses(e) | | | 2.43 | %(c)(f) | | | 2.37 | %(c)(f) | | | 2.42 | %(c)(f) | | | 2.49 | %(d)(f) | |
Net investment income (loss) | | | (1.03 | %) | | | (0.96 | %) | | | (0.89 | %) | | | 0.81 | %(d) | |
Supplemental data | |
Net assets, end of period (in thousands) | | $ | 1,408 | | | $ | 2,600 | | | $ | 6,035 | | | $ | 8,713 | | |
Portfolio turnover | | | 81 | % | | | 76 | % | | | 80 | % | | | 81 | % | |
Notes to Financial Highlights
(a) Based on operations from February 28, 2013 (commencement of operations) through the stated period end.
(b) In addition to the fees and expenses that the Fund bears directly, the Fund indirectly bears a pro rata share of the fees and expenses of any other funds in which it invests. Such indirect expenses are not included in the Fund's reported expense ratios.
(c) Ratios include line of credit interest expense which is less than 0.01%.
(d) Annualized.
(e) Total net expenses include the impact of certain fee waivers/expense reimbursements made by the Investment Manager and certain of its affiliates, if applicable.
(f) The benefits derived from expense reductions had an impact of less than 0.01%.
The accompanying Notes to Financial Statements are an integral part of this statement.
Annual Report 2016
22
COLUMBIA EMERGING MARKETS FUND
FINANCIAL HIGHLIGHTS (continued)
| | | Year Ended August 31, | | Year Ended
March 31, | |
Class C | | 2016 | | 2015 | | 2014 | | 2013 | | 2012(a) | | 2012 | |
Per share data | |
Net asset value, beginning of period | | $ | 8.45 | | | $ | 10.60 | | | $ | 8.90 | | | $ | 8.89 | | | $ | 9.84 | | | $ | 11.39 | | |
Income from investment operations: | |
Net investment income (loss) | | | (0.08 | ) | | | (0.08 | ) | | | (0.08 | ) | | | 0.05 | | | | 0.02 | | | | (0.03 | ) | |
Net realized and unrealized gain (loss) | | | 1.17 | | | | (2.07 | ) | | | 1.78 | | | | (0.03 | ) | | | (0.54 | ) | | | (0.95 | ) | |
Total from investment operations | | | 1.09 | | | | (2.15 | ) | | | 1.70 | | | | 0.02 | | | | (0.52 | ) | | | (0.98 | ) | |
Less distributions to shareholders: | |
Net investment income | | | — | | | | — | | | | — | | | | (0.01 | ) | | | — | | | | — | | |
Net realized gains | | | — | | | | — | | | | — | | | | — | | | | (0.43 | ) | | | (0.57 | ) | |
Total distributions to shareholders | | | — | | | | — | | | | — | | | | (0.01 | ) | | | (0.43 | ) | | | (0.57 | ) | |
Redemption fees: | |
Net asset value, end of period | | $ | 9.54 | | | $ | 8.45 | | | $ | 10.60 | | | $ | 8.90 | | | $ | 8.89 | | | $ | 9.84 | | |
Total return | | | 12.90 | % | | | (20.28 | %) | | | 19.10 | % | | | 0.26 | % | | | (5.09 | %) | | | (8.86 | %) | |
Ratios to average net assets(b) | |
Total gross expenses | | | 2.42 | %(c) | | | 2.37 | %(c) | | | 2.42 | %(c) | | | 2.53 | % | | | 2.83 | %(d) | | | 2.83 | %(c) | |
Total net expenses(e) | | | 2.42 | %(c)(f) | | | 2.37 | %(c)(f) | | | 2.42 | %(c)(f) | | | 2.50 | %(f) | | | 2.67 | %(d)(f) | | | 2.62 | %(c)(f) | |
Net investment income (loss) | | | (0.92 | %) | | | (0.83 | %) | | | (0.81 | %) | | | 0.49 | % | | | 0.65 | %(d) | | | (0.27 | %) | |
Supplemental data | |
Net assets, end of period (in thousands) | | $ | 19,419 | | | $ | 20,462 | | | $ | 27,126 | | | $ | 23,756 | | | $ | 2,820 | | | $ | 2,879 | | |
Portfolio turnover | | | 81 | % | | | 76 | % | | | 80 | % | | | 81 | % | | | 35 | % | | | 117 | % | |
Notes to Financial Highlights
(a) For the period from April 1, 2012 to August 31, 2012. During the period, the Fund's fiscal year end was changed from March 31 to August 31.
(b) In addition to the fees and expenses that the Fund bears directly, the Fund indirectly bears a pro rata share of the fees and expenses of any other funds in which it invests. Such indirect expenses are not included in the Fund's reported expense ratios.
(c) Ratios include line of credit interest expense which is less than 0.01%.
(d) Annualized.
(e) Total net expenses include the impact of certain fee waivers/expense reimbursements made by the Investment Manager and certain of its affiliates, if applicable.
(f) The benefits derived from expense reductions had an impact of less than 0.01%.
The accompanying Notes to Financial Statements are an integral part of this statement.
Annual Report 2016
23
COLUMBIA EMERGING MARKETS FUND
FINANCIAL HIGHLIGHTS (continued)
| | | Year Ended August 31, | | Year Ended
March 31, | |
Class I | | 2016 | | 2015 | | 2014 | | 2013 | | 2012(a) | | 2012 | |
Per share data | |
Net asset value, beginning of period | | $ | 8.86 | | | $ | 11.04 | | | $ | 9.21 | | | $ | 9.13 | | | $ | 10.04 | | | $ | 11.48 | | |
Income from investment operations: | |
Net investment income | | | 0.04 | | | | 0.04 | | | | 0.03 | | | | 0.08 | | | | 0.07 | | | | 0.06 | | |
Net realized and unrealized gain (loss) | | | 1.22 | | | | (2.17 | ) | | | 1.86 | | | | 0.06 | (b) | | | (0.55 | ) | | | (0.93 | ) | |
Total from investment operations | | | 1.26 | | | | (2.13 | ) | | | 1.89 | | | | 0.14 | | | | (0.48 | ) | | | (0.87 | ) | |
Less distributions to shareholders: | |
Net investment income | | | — | | | | (0.05 | ) | | | (0.06 | ) | | | (0.06 | ) | | | — | | | | — | | |
Net realized gains | | | — | | | | — | | | | — | | | | — | | | | (0.43 | ) | | | (0.57 | ) | |
Total distributions to shareholders | | | — | | | | (0.05 | ) | | | (0.06 | ) | | | (0.06 | ) | | | (0.43 | ) | | | (0.57 | ) | |
Net asset value, end of period | | $ | 10.12 | | | $ | 8.86 | | | $ | 11.04 | | | $ | 9.21 | | | $ | 9.13 | | | $ | 10.04 | | |
Total return | | | 14.22 | % | | | (19.33 | %) | | | 20.60 | % | | | 1.47 | % | | | (4.58 | %) | | | (7.79 | %) | |
Ratios to average net assets(c) | |
Total gross expenses | | | 1.21 | %(d) | | | 1.15 | %(d) | | | 1.18 | %(d) | | | 1.37 | % | | | 1.53 | %(e) | | | 1.56 | %(d) | |
Total net expenses(f) | | | 1.21 | %(d) | | | 1.15 | %(d) | | | 1.18 | %(d) | | | 1.29 | % | | | 1.48 | %(e) | | | 1.51 | %(d) | |
Net investment income | | | 0.40 | % | | | 0.42 | % | | | 0.34 | % | | | 0.75 | % | | | 1.86 | %(e) | | | 0.65 | % | |
Supplemental data | |
Net assets, end of period (in thousands) | | $ | 206,575 | | | $ | 129,430 | | | $ | 151,003 | | | $ | 184,937 | | | $ | 239,618 | | | $ | 214,524 | | |
Portfolio turnover | | | 81 | % | | | 76 | % | | | 80 | % | | | 81 | % | | | 35 | % | | | 117 | % | |
Notes to Financial Highlights
(a) For the period from April 1, 2012 to August 31, 2012. During the period, the Fund's fiscal year end was changed from March 31 to August 31.
(b) Calculation of the net gain (loss) per share (both realized and unrealized) does not correlate to the aggregate realized and unrealized gain (loss) presented in the Statement of Operations due to the timing of subscriptions and redemptions of Fund shares in relation to fluctuations in the market value of the portfolio.
(c) In addition to the fees and expenses that the Fund bears directly, the Fund indirectly bears a pro rata share of the fees and expenses of any other funds in which it invests. Such indirect expenses are not included in the Fund's reported expense ratios.
(d) Ratios include line of credit interest expense which is less than 0.01%.
(e) Annualized.
(f) Total net expenses include the impact of certain fee waivers/expense reimbursements made by the Investment Manager and certain of its affiliates, if applicable.
The accompanying Notes to Financial Statements are an integral part of this statement.
Annual Report 2016
24
COLUMBIA EMERGING MARKETS FUND
FINANCIAL HIGHLIGHTS (continued)
| | | Year Ended August 31, | |
Class K | | 2016 | | 2015 | | 2014 | | 2013(a) | |
Per share data | |
Net asset value, beginning of period | | $ | 8.82 | | | $ | 10.98 | | | $ | 9.17 | | | $ | 10.44 | | |
Income from investment operations: | |
Net investment income (loss) | | | (0.01 | ) | | | (0.01 | ) | | | (0.00 | )(b) | | | 0.11 | | |
Net realized and unrealized gain (loss) | | | 1.23 | | | | (2.13 | ) | | | 1.85 | | | | (1.38 | ) | |
Total from investment operations | | | 1.22 | | | | (2.14 | ) | | | 1.85 | | | | (1.27 | ) | |
Less distributions to shareholders: | |
Net investment income | | | — | | | | (0.02 | ) | | | (0.04 | ) | | | — | | |
Total distributions to shareholders | | | — | | | | (0.02 | ) | | | (0.04 | ) | | | — | | |
Net asset value, end of period | | $ | 10.04 | | | $ | 8.82 | | | $ | 10.98 | | | $ | 9.17 | | |
Total return | | | 13.83 | % | | | (19.50 | %) | | | 20.21 | % | | | (12.16 | %) | |
Ratios to average net assets(c) | |
Total gross expenses | | | 1.52 | %(d) | | | 1.44 | %(d) | | | 1.47 | %(d) | | | 1.51 | %(e) | |
Total net expenses(f) | | | 1.52 | %(d) | | | 1.44 | %(d) | | | 1.47 | %(d) | | | 1.51 | %(e) | |
Net investment income (loss) | | | (0.07 | %) | | | (0.06 | %) | | | (0.04 | %) | | | 2.21 | %(e) | |
Supplemental data | |
Net assets, end of period (in thousands) | | $ | 79 | | | $ | 96 | | | $ | 206 | | | $ | 506 | | |
Portfolio turnover | | | 81 | % | | | 76 | % | | | 80 | % | | | 81 | % | |
Notes to Financial Highlights
(a) Based on operations from February 28, 2013 (commencement of operations) through the stated period end.
(b) Rounds to zero.
(c) In addition to the fees and expenses that the Fund bears directly, the Fund indirectly bears a pro rata share of the fees and expenses of any other funds in which it invests. Such indirect expenses are not included in the Fund's reported expense ratios.
(d) Ratios include line of credit interest expense which is less than 0.01%.
(e) Annualized.
(f) Total net expenses include the impact of certain fee waivers/expense reimbursements made by the Investment Manager and certain of its affiliates, if applicable.
The accompanying Notes to Financial Statements are an integral part of this statement.
Annual Report 2016
25
COLUMBIA EMERGING MARKETS FUND
FINANCIAL HIGHLIGHTS (continued)
| | | Year Ended August 31, | | Year Ended
March 31, | |
Class R | | 2016 | | 2015 | | 2014 | | 2013 | | 2012(a) | | 2012 | |
Per share data | |
Net asset value, beginning of period | | $ | 8.72 | | | $ | 10.89 | | | $ | 9.09 | | | $ | 9.06 | | | $ | 9.99 | | | $ | 11.49 | | |
Income from investment operations: | |
Net investment income (loss) | | | (0.03 | ) | | | (0.03 | ) | | | (0.03 | ) | | | 0.11 | | | | 0.04 | | | | (0.06 | ) | |
Net realized and unrealized gain (loss) | | | 1.20 | | | | (2.14 | ) | | | 1.83 | | | | (0.05 | ) | | | (0.54 | ) | | | (0.87 | ) | |
Total from investment operations | | | 1.17 | | | | (2.17 | ) | | | 1.80 | | | | 0.06 | | | | (0.50 | ) | | | (0.93 | ) | |
Less distributions to shareholders: | |
Net investment income | | | — | | | | — | | | | — | | | | (0.03 | ) | | | — | | | | — | | |
Net realized gains | | | — | | | | — | | | | — | | | | — | | | | (0.43 | ) | | | (0.57 | ) | |
Total distributions to shareholders | | | — | | | | — | | | | — | | | | (0.03 | ) | | | (0.43 | ) | | | (0.57 | ) | |
Net asset value, end of period | | $ | 9.89 | | | $ | 8.72 | | | $ | 10.89 | | | $ | 9.09 | | | $ | 9.06 | | | $ | 9.99 | | |
Total return | | | 13.42 | % | | | (19.93 | %) | | | 19.80 | % | | | 0.67 | % | | | (4.81 | %) | | | (8.32 | %) | |
Ratios to average net assets(b) | |
Total gross expenses | | | 1.92 | %(c) | | | 1.87 | %(c) | | | 1.91 | %(c) | | | 2.02 | % | | | 2.33 | %(d) | | | 2.37 | %(c) | |
Total net expenses(e) | | | 1.92 | %(c)(f) | | | 1.87 | %(c)(f) | | | 1.91 | %(c)(f) | | | 2.00 | %(f) | | | 2.17 | %(d)(f) | | | 2.20 | %(c)(f) | |
Net investment income (loss) | | | (0.37 | %) | | | (0.30 | %) | | | (0.26 | %) | | | 1.09 | % | | | 1.15 | %(d) | | | (0.58 | %) | |
Supplemental data | |
Net assets, end of period (in thousands) | | $ | 9,683 | | | $ | 6,997 | | | $ | 8,237 | | | $ | 5,863 | | | $ | 491 | | | $ | 514 | | |
Portfolio turnover | | | 81 | % | | | 76 | % | | | 80 | % | | | 81 | % | | | 35 | % | | | 117 | % | |
Notes to Financial Highlights
(a) For the period from April 1, 2012 to August 31, 2012. During the period, the Fund's fiscal year end was changed from March 31 to August 31.
(b) In addition to the fees and expenses that the Fund bears directly, the Fund indirectly bears a pro rata share of the fees and expenses of any other funds in which it invests. Such indirect expenses are not included in the Fund's reported expense ratios.
(c) Ratios include line of credit interest expense which is less than 0.01%.
(d) Annualized.
(e) Total net expenses include the impact of certain fee waivers/expense reimbursements made by the Investment Manager and certain of its affiliates, if applicable.
(f) The benefits derived from expense reductions had an impact of less than 0.01%.
The accompanying Notes to Financial Statements are an integral part of this statement.
Annual Report 2016
26
COLUMBIA EMERGING MARKETS FUND
FINANCIAL HIGHLIGHTS (continued)
| | | Year Ended August 31, | |
Class R4 | | 2016 | | 2015 | | 2014 | | 2013(a) | |
Per share data | |
Net asset value, beginning of period | | $ | 8.90 | | | $ | 11.08 | | | $ | 9.24 | | | $ | 10.42 | | |
Income from investment operations: | |
Net investment income | | | 0.01 | | | | 0.09 | | | | 0.04 | | | | 0.06 | | |
Net realized and unrealized gain (loss) | | | 1.23 | | | | (2.24 | ) | | | 1.84 | | | | (1.24 | ) | |
Total from investment operations | | | 1.24 | | | | (2.15 | ) | | | 1.88 | | | | (1.18 | ) | |
Less distributions to shareholders: | |
Net investment income | | | — | | | | (0.03 | ) | | | (0.04 | ) | | | — | | |
Total distributions to shareholders | | | — | | | | (0.03 | ) | | | (0.04 | ) | | | — | | |
Net asset value, end of period | | $ | 10.14 | | | $ | 8.90 | | | $ | 11.08 | | | $ | 9.24 | | |
Total return | | | 13.93 | % | | | (19.45 | %) | | | 20.36 | % | | | (11.32 | %) | |
Ratios to average net assets(b) | |
Total gross expenses | | | 1.42 | %(c) | | | 1.39 | %(c) | | | 1.41 | %(c) | | | 1.54 | %(d) | |
Total net expenses(e) | | | 1.42 | %(c)(f) | | | 1.39 | %(c)(f) | | | 1.41 | %(c)(f) | | | 1.53 | %(d)(f) | |
Net investment income | | | 0.13 | % | | | 0.91 | % | | | 0.35 | % | | | 1.31 | %(d) | |
Supplemental data | |
Net assets, end of period (in thousands) | | $ | 2,205 | | | $ | 1,827 | | | $ | 301 | | | $ | 37 | | |
Portfolio turnover | | | 81 | % | | | 76 | % | | | 80 | % | | | 81 | % | |
Notes to Financial Highlights
(a) Based on operations from March 19, 2013 (commencement of operations) through the stated period end.
(b) In addition to the fees and expenses that the Fund bears directly, the Fund indirectly bears a pro rata share of the fees and expenses of any other funds in which it invests. Such indirect expenses are not included in the Fund's reported expense ratios.
(c) Ratios include line of credit interest expense which is less than 0.01%.
(d) Annualized.
(e) Total net expenses include the impact of certain fee waivers/expense reimbursements made by the Investment Manager and certain of its affiliates, if applicable.
(f) The benefits derived from expense reductions had an impact of less than 0.01%.
The accompanying Notes to Financial Statements are an integral part of this statement.
Annual Report 2016
27
COLUMBIA EMERGING MARKETS FUND
FINANCIAL HIGHLIGHTS (continued)
| | | Year Ended August 31, | |
Class R5 | | 2016 | | 2015 | | 2014 | | 2013(a) | |
Per share data | |
Net asset value, beginning of period | | $ | 8.87 | | | $ | 11.05 | | | $ | 9.22 | | | $ | 9.72 | | |
Income from investment operations: | |
Net investment income | | | 0.05 | | | | 0.11 | | | | 0.05 | | | | 0.13 | | |
Net realized and unrealized gain (loss) | | | 1.20 | | | | (2.24 | ) | | | 1.84 | | | | (0.57 | ) | |
Total from investment operations | | | 1.25 | | | | (2.13 | ) | | | 1.89 | | | | (0.44 | ) | |
Less distributions to shareholders: | |
Net investment income | | | — | | | | (0.05 | ) | | | (0.06 | ) | | | (0.06 | ) | |
Total distributions to shareholders | | | — | | | | (0.05 | ) | | | (0.06 | ) | | | (0.06 | ) | |
Net asset value, end of period | | $ | 10.12 | | | $ | 8.87 | | | $ | 11.05 | | | $ | 9.22 | | |
Total return | | | 14.09 | % | | | (19.35 | %) | | | 20.58 | % | | | (4.60 | %) | |
Ratios to average net assets(b) | |
Total gross expenses | | | 1.26 | %(c) | | | 1.21 | %(c) | | | 1.22 | %(c) | | | 1.32 | %(d) | |
Total net expenses(e) | | | 1.26 | %(c) | | | 1.21 | %(c) | | | 1.22 | %(c) | | | 1.29 | %(d) | |
Net investment income | | | 0.54 | % | | | 1.08 | % | | | 0.46 | % | | | 1.65 | %(d) | |
Supplemental data | |
Net assets, end of period (in thousands) | | $ | 113,041 | | | $ | 17,559 | | | $ | 3,087 | | | $ | 1,381 | | |
Portfolio turnover | | | 81 | % | | | 76 | % | | | 80 | % | | | 81 | % | |
Notes to Financial Highlights
(a) Based on operations from November 8, 2012 (commencement of operations) through the stated period end.
(b) In addition to the fees and expenses that the Fund bears directly, the Fund indirectly bears a pro rata share of the fees and expenses of any other funds in which it invests. Such indirect expenses are not included in the Fund's reported expense ratios.
(c) Ratios include line of credit interest expense which is less than 0.01%.
(d) Annualized.
(e) Total net expenses include the impact of certain fee waivers/expense reimbursements made by the Investment Manager and certain of its affiliates, if applicable.
The accompanying Notes to Financial Statements are an integral part of this statement.
Annual Report 2016
28
COLUMBIA EMERGING MARKETS FUND
FINANCIAL HIGHLIGHTS (continued)
| | | Year Ended August 31, | | Year Ended
March 31, | |
Class W | | 2016 | | 2015 | | 2014 | | 2013 | | 2012(a) | | 2012 | |
Per share data | |
Net asset value, beginning of period | | $ | 8.78 | | | $ | 10.94 | | | $ | 9.13 | | | $ | 9.07 | | | $ | 10.00 | | | $ | 11.48 | | |
Income from investment operations: | |
Net investment income (loss) | | | (0.02 | ) | | | (0.02 | ) | | | (0.07 | ) | | | 0.02 | | | | 0.05 | | | | 0.07 | | |
Net realized and unrealized gain (loss) | | | 1.23 | | | | (2.14 | ) | | | 1.89 | | | | 0.08 | (b) | | | (0.55 | ) | | | (0.98 | ) | |
Total from investment operations | | | 1.21 | | | | (2.16 | ) | | | 1.82 | | | | 0.10 | | | | (0.50 | ) | | | (0.91 | ) | |
Less distributions to shareholders: | |
Net investment income | | | — | | | | (0.00 | )(c) | | | (0.01 | ) | | | (0.04 | ) | | | — | | | | — | | |
Net realized gains | | | — | | | | — | | | | — | | | | — | | | | (0.43 | ) | | | (0.57 | ) | |
Total distributions to shareholders | | | — | | | | (0.00 | )(c) | | | (0.01 | ) | | | (0.04 | ) | | | (0.43 | ) | | | (0.57 | ) | |
Net asset value, end of period | | $ | 9.99 | | | $ | 8.78 | | | $ | 10.94 | | | $ | 9.13 | | | $ | 9.07 | | | $ | 10.00 | | |
Total return | | | 13.78 | % | | | (19.74 | %) | | | 19.98 | % | | | 1.09 | % | | | (4.81 | %) | | | (8.15 | %) | |
Ratios to average net assets(d) | |
Total gross expenses | | | 1.67 | %(e) | | | 1.62 | %(e) | | | 1.67 | %(e) | | | 1.91 | % | | | 2.09 | %(f) | | | 2.09 | %(e) | |
Total net expenses(g) | | | 1.67 | %(e)(h) | | | 1.62 | %(e)(h) | | | 1.67 | %(e)(h) | | | 1.77 | %(h) | | | 1.92 | %(f)(h) | | | 1.85 | %(e)(h) | |
Net investment income (loss) | | | (0.24 | %) | | | (0.15 | %) | | | (0.68 | %) | | | 0.25 | % | | | 1.41 | %(f) | | | 0.73 | % | |
Supplemental data | |
Net assets, end of period (in thousands) | | $ | 54,785 | | | $ | 57 | | | $ | 133 | | | $ | 31,426 | | | $ | 31,470 | | | $ | 30,863 | | |
Portfolio turnover | | | 81 | % | | | 76 | % | | | 80 | % | | | 81 | % | | | 35 | % | | | 117 | % | |
Notes to Financial Highlights
(a) For the period from April 1, 2012 to August 31, 2012. During the period, the Fund's fiscal year end was changed from March 31 to August 31.
(b) Calculation of the net gain (loss) per share (both realized and unrealized) does not correlate to the aggregate realized and unrealized gain (loss) presented in the Statement of Operations due to the timing of subscriptions and redemptions of Fund shares in relation to fluctuations in the market value of the portfolio.
(c) Rounds to zero.
(d) In addition to the fees and expenses that the Fund bears directly, the Fund indirectly bears a pro rata share of the fees and expenses of any other funds in which it invests. Such indirect expenses are not included in the Fund's reported expense ratios.
(e) Ratios include line of credit interest expense which is less than 0.01%.
(f) Annualized.
(g) Total net expenses include the impact of certain fee waivers/expense reimbursements made by the Investment Manager and certain of its affiliates, if applicable.
(h) The benefits derived from expense reductions had an impact of less than 0.01%.
The accompanying Notes to Financial Statements are an integral part of this statement.
Annual Report 2016
29
COLUMBIA EMERGING MARKETS FUND
FINANCIAL HIGHLIGHTS (continued)
| | | Year Ended August 31, | |
Class Y | | 2016 | | 2015 | | 2014 | | 2013(a) | |
Per share data | |
Net asset value, beginning of period | | $ | 8.90 | | | $ | 11.09 | | | $ | 9.24 | | | $ | 9.74 | | |
Income from investment operations: | |
Net investment income | | | 0.05 | | | | 0.05 | | | | 0.06 | | | | 0.09 | | |
Net realized and unrealized gain (loss) | | | 1.22 | | | | (2.19 | ) | | | 1.85 | | | | (0.53 | ) | |
Total from investment operations | | | 1.27 | | | | (2.14 | ) | | | 1.91 | | | | (0.44 | ) | |
Less distributions to shareholders: | |
Net investment income | | | — | | | | (0.05 | ) | | | (0.06 | ) | | | (0.06 | ) | |
Total distributions to shareholders | | | — | | | | (0.05 | ) | | | (0.06 | ) | | | (0.06 | ) | |
Net asset value, end of period | | $ | 10.17 | | | $ | 8.90 | | | $ | 11.09 | | | $ | 9.24 | | |
Total return | | | 14.27 | % | | | (19.34 | %) | | | 20.73 | % | | | (4.57 | %) | |
Ratios to average net assets(b) | |
Total gross expenses | | | 1.20 | %(c) | | | 1.15 | %(c) | | | 1.19 | %(c) | | | 1.31 | %(d) | |
Total net expenses(e) | | | 1.20 | %(c) | | | 1.15 | %(c) | | | 1.19 | %(c) | | | 1.31 | %(d) | |
Net investment income | | | 0.58 | % | | | 0.46 | % | | | 0.56 | % | | | 1.16 | %(d) | |
Supplemental data | |
Net assets, end of period (in thousands) | | $ | 22,104 | | | $ | 5,351 | | | $ | 4,148 | | | $ | 465 | | |
Portfolio turnover | | | 81 | % | | | 76 | % | | | 80 | % | | | 81 | % | |
Notes to Financial Highlights
(a) Based on operations from November 8, 2012 (commencement of operations) through the stated period end.
(b) In addition to the fees and expenses that the Fund bears directly, the Fund indirectly bears a pro rata share of the fees and expenses of any other funds in which it invests. Such indirect expenses are not included in the Fund's reported expense ratios.
(c) Ratios include line of credit interest expense which is less than 0.01%.
(d) Annualized.
(e) Total net expenses include the impact of certain fee waivers/expense reimbursements made by the Investment Manager and certain of its affiliates, if applicable.
The accompanying Notes to Financial Statements are an integral part of this statement.
Annual Report 2016
30
COLUMBIA EMERGING MARKETS FUND
FINANCIAL HIGHLIGHTS (continued)
| | | Year Ended August 31, | | Year Ended
March 31, | |
Class Z | | 2016 | | 2015 | | 2014 | | 2013 | | 2012(a) | | 2012 | |
Per share data | |
Net asset value, beginning of period | | $ | 8.84 | | | $ | 11.00 | | | $ | 9.18 | | | $ | 9.11 | | | $ | 10.03 | | | $ | 11.49 | | |
Income from investment operations: | |
Net investment income | | | 0.01 | | | | 0.02 | | | | 0.03 | | | | 0.09 | | | | 0.06 | | | | 0.09 | | |
Net realized and unrealized gain (loss) | | | 1.22 | | | | (2.15 | ) | | | 1.83 | | | | 0.03 | (b) | | | (0.55 | ) | | | (0.98 | ) | |
Total from investment operations | | | 1.23 | | | | (2.13 | ) | | | 1.86 | | | | 0.12 | | | | (0.49 | ) | | | (0.89 | ) | |
Less distributions to shareholders: | |
Net investment income | | | — | | | | (0.03 | ) | | | (0.04 | ) | | | (0.05 | ) | | | — | | | | — | | |
Net realized gains | | | — | | | | — | | | | — | | | | — | | | | (0.43 | ) | | | (0.57 | ) | |
Total distributions to shareholders | | | — | | | | (0.03 | ) | | | (0.04 | ) | | | (0.05 | ) | | | (0.43 | ) | | | (0.57 | ) | |
Redemption fees: | |
Net asset value, end of period | | $ | 10.07 | | | $ | 8.84 | | | $ | 11.00 | | | $ | 9.18 | | | $ | 9.11 | | | $ | 10.03 | | |
Total return | | | 13.91 | % | | | (19.41 | %) | | | 20.28 | % | | | 1.29 | % | | | (4.69 | %) | | | (7.96 | %) | |
Ratios to average net assets(c) | |
Total gross expenses | | | 1.42 | %(d) | | | 1.37 | %(d) | | | 1.41 | %(d) | | | 1.60 | % | | | 1.83 | %(e) | | | 1.83 | %(d) | |
Total net expenses(f) | | | 1.42 | %(d)(g) | | | 1.37 | %(d)(g) | | | 1.41 | %(d)(g) | | | 1.52 | %(g) | | | 1.67 | %(e)(g) | | | 1.61 | %(d)(g) | |
Net investment income | | | 0.07 | % | | | 0.18 | % | | | 0.25 | % | | | 0.94 | % | | | 1.65 | %(e) | | | 0.87 | % | |
Supplemental data | |
Net assets, end of period (in thousands) | | $ | 647,011 | | | $ | 760,839 | | | $ | 1,060,340 | | | $ | 646,228 | | | $ | 174,554 | | | $ | 206,451 | | |
Portfolio turnover | | | 81 | % | | | 76 | % | | | 80 | % | | | 81 | % | | | 35 | % | | | 117 | % | |
Notes to Financial Highlights
(a) For the period from April 1, 2012 to August 31, 2012. During the period, the Fund's fiscal year end was changed from March 31 to August 31.
(b) Calculation of the net gain (loss) per share (both realized and unrealized) does not correlate to the aggregate realized and unrealized gain (loss) presented in the Statement of Operations due to the timing of subscriptions and redemptions of Fund shares in relation to fluctuations in the market value of the portfolio.
(c) In addition to the fees and expenses that the Fund bears directly, the Fund indirectly bears a pro rata share of the fees and expenses of any other funds in which it invests. Such indirect expenses are not included in the Fund's reported expense ratios.
(d) Ratios include line of credit interest expense which is less than 0.01%.
(e) Annualized.
(f) Total net expenses include the impact of certain fee waivers/expense reimbursements made by the Investment Manager and certain of its affiliates, if applicable.
(g) The benefits derived from expense reductions had an impact of less than 0.01%.
The accompanying Notes to Financial Statements are an integral part of this statement.
Annual Report 2016
31
COLUMBIA EMERGING MARKETS FUND
NOTES TO FINANCIAL STATEMENTS
August 31, 2016
Note 1. Organization
Columbia Emerging Markets Fund (the Fund), a series of Columbia Funds Series Trust I (the Trust), is a diversified fund. The Trust is registered under the Investment Company Act of 1940, as amended (the 1940 Act), as an open-end management investment company organized as a Massachusetts business trust.
Fund Shares
The Trust may issue an unlimited number of shares (without par value). The Fund offers Class A, Class B, Class C, Class I, Class K, Class R, Class R4, Class R5, Class W, Class Y and Class Z shares. Although all share classes generally have identical voting, dividend and liquidation rights, each share class votes separately when required by the Trust's organizational documents or by law. Different share classes pay different distribution amounts to the extent the expenses of such share classes differ, and distributions in liquidation will be proportional to the net asset value of each share class. Each share class has its own expense and sales charge structure.
Class A shares are subject to a maximum front-end sales charge of 5.75% based on the initial investment amount. Class A shares purchased without an initial sales charge in accounts aggregating $1 million to $50 million at the time of purchase are subject to a contingent deferred sales charge (CDSC) if the shares are sold within 18 months after purchase, charged as follows: 1.00% CDSC if redeemed within 12 months after purchase, and 0.50% CDSC if redeemed more than 12, but less than 18, months after purchase.
Class B shares may be subject to a maximum CDSC of 5.00% based upon the holding period after purchase. Class B shares will generally convert to Class A shares eight years after purchase. The Fund no longer accepts investments by new or existing investors in the Fund's Class B shares, except in connection with the reinvestment of any dividend and/or capital gain distributions in Class B shares of the Fund and exchanges by existing Class B shareholders of certain other funds within the Columbia Family of Funds.
Class C shares are subject to a 1.00% CDSC on shares redeemed within 12 months after purchase.
Class I shares are not subject to sales charges and are available only to the Columbia Family of Funds.
Class K shares are not subject to sales charges, however this share class is closed to new investors.
Class R shares are not subject to sales charges and are generally available only to certain retirement plans and other investors as described in the Fund's prospectus.
Class R4 shares are not subject to sales charges and are generally available only to omnibus retirement plans and certain investors as described in the Fund's prospectus.
Class R5 shares are not subject to sales charges and are generally available only to investors purchasing through authorized investment professionals and omnibus retirement plans.
Class W shares are not subject to sales charges and are generally available only to investors purchasing through authorized investment programs managed by investment professionals, including discretionary managed account programs.
Class Y shares are not subject to sales charges and are generally available only to certain retirement plans as described in the Fund's prospectus.
Class Z shares are not subject to sales charges and are generally available only to eligible investors, which are subject to different investment minimums as described in the Fund's prospectus.
Note 2. Summary of Significant Accounting Policies
Basis of Preparation
The Fund is an investment company that applies the accounting and reporting guidance in the Financial Accounting Standards Board (FASB) Accounting Standards Codification Topic 946, Financial Services — Investment Companies (ASC 946). The financial statements are prepared in accordance with U.S. generally accepted accounting principles (GAAP), which requires management to make certain estimates and assumptions that affect the reported amounts of assets and liabilities, the disclosure of contingent assets and liabilities at the date of the financial statements and the reported amounts of income and expenses during the reporting period. Actual results could differ from those estimates.
The following is a summary of significant accounting policies followed by the Fund in the preparation of its financial statements.
Security Valuation
All equity securities are valued at the close of business of the New York Stock Exchange (NYSE). Equity securities are valued at the last quoted sales price on the principal
Annual Report 2016
32
COLUMBIA EMERGING MARKETS FUND
NOTES TO FINANCIAL STATEMENTS (continued)
August 31, 2016
exchange or market on which they trade, except for securities traded on the NASDAQ Stock Market, which are valued at the NASDAQ official close price. Unlisted securities or listed securities for which there were no sales during the day are valued at the mean of the latest quoted bid and ask prices on such exchanges or markets.
Foreign equity securities are valued based on the closing price on the foreign exchange in which such securities are primarily traded. If any foreign equity security closing prices are not readily available, the securities are valued at the mean of the latest quoted bid and ask prices on such exchanges or markets. Foreign currency exchange rates are generally determined at 4:00 p.m. Eastern (U.S.) time. Many securities markets and exchanges outside the U.S. close prior to the close of the NYSE; therefore, the closing prices for securities in such markets or on such exchanges may not fully reflect events that occur after such close but before the close of the NYSE. In those situations, foreign securities will be fair valued pursuant to a policy adopted by the Board of Trustees (the Board), including, if available, utilizing a third party pricing service to determine these fair values. The third party pricing service takes into account multiple factors, including, but not limited to, movements in the U.S. securities markets, certain depositary receipts, futures contracts and foreign exchange rates that have occurred subsequent to the close of the foreign exchange or market, to determine a good faith estimate that reasonably reflects the current market conditions as of the close of the NYSE. The fair value of a security is likely to be different from the quoted or published price, if available.
Investments in open-end investment companies, including money market funds, are valued at their latest net asset value.
Investments for which market quotations are not readily available, or that have quotations which management believes are not reflective of market value or reliable, are valued at fair value as determined in good faith under procedures approved by and under the general supervision of the Board. If a security or class of securities (such as foreign securities) is valued at fair value, such value is likely to be different from the quoted or published price for the security.
The determination of fair value often requires significant judgment. To determine fair value, management may use assumptions including but not limited to future cash flows and estimated risk premiums. Multiple inputs from various sources may be used to determine fair value.
GAAP requires disclosure regarding the inputs and valuation techniques used to measure fair value and any changes in valuation inputs or techniques. In addition, investments shall be disclosed by major category. This information is disclosed following the Fund's Portfolio of Investments.
Foreign Currency Transactions and Translations
The values of all assets and liabilities denominated in foreign currencies are generally translated into U.S. dollars at exchange rates determined at the close of the NYSE on any given day. Net realized and unrealized gains (losses) on foreign currency transactions and translations include gains (losses) arising from the fluctuation in exchange rates between trade and settlement dates on securities transactions, gains (losses) arising from the disposition of foreign currency and currency gains (losses) between the accrual and payment dates on dividends, interest income and foreign withholding taxes.
For financial statement purposes, the Fund does not distinguish that portion of gains (losses) on investments which is due to changes in foreign exchange rates from that which is due to changes in market prices of the investments. Such fluctuations are included with the net realized and unrealized gains (losses) on investments in the Statement of Operations.
Security Transactions
Security transactions are accounted for on the trade date. Cost is determined and gains (losses) are based upon the specific identification method for both financial statement and federal income tax purposes.
Income Recognition
Corporate actions and dividend income are generally recorded net of any non-reclaimable tax withholdings, on the ex-dividend date or upon receipt of ex-dividend notification in the case of certain foreign securities.
The Fund may receive distributions from holdings in equity securities, business development companies (BDCs), exchange-traded funds, other regulated investment companies (RICs), and real estate investment trusts (REITs), which report information on the tax character of their distributions annually. These distributions are allocated to dividend income, capital gain and return of capital based on actual information reported. Return of capital is recorded as a reduction of the cost basis of securities held. If the Fund no longer owns the applicable securities, return of capital is recorded as a realized gain. With respect to REITs, to the
Annual Report 2016
33
COLUMBIA EMERGING MARKETS FUND
NOTES TO FINANCIAL STATEMENTS (continued)
August 31, 2016
extent actual information has not yet been reported, estimates for return of capital are made by the Fund's management. Management's estimates are subsequently adjusted when the actual character of the distributions is disclosed by the REITs, which could result in a proportionate change in return of capital to shareholders.
Awards from class action litigation are recorded as a reduction of cost basis if the Fund still owns the applicable securities on the payment date. If the Fund no longer owns the applicable securities, the proceeds are recorded as realized gains.
Expenses
General expenses of the Trust are allocated to the Fund and other funds of the Trust based upon relative net assets or other expense allocation methodologies determined by the nature of the expense. Expenses directly attributable to the Fund are charged to the Fund. Expenses directly attributable to a specific class of shares are charged to that share class.
Determination of Class Net Asset Value
All income, expenses (other than class-specific expenses, which are charged to that share class, as shown in the Statement of Operations) and realized and unrealized gains (losses) are allocated to each class of the Fund on a daily basis, based on the relative net assets of each class, for purposes of determining the net asset value of each class.
Federal Income Tax Status
The Fund intends to qualify each year as a regulated investment company under Subchapter M of the Internal Revenue Code, as amended, and will distribute substantially all of its taxable income (including net short-term capital gains), if any, for its tax year, and as such will not be subject to federal income taxes. In addition, the Fund intends to distribute in each calendar year substantially all of its net investment income, capital gains and certain other amounts, if any, such that the Fund should not be subject to federal excise tax. Therefore, no federal income or excise tax provision is recorded.
Foreign Taxes
The Fund may be subject to foreign taxes on income, gains on investments or currency repatriation, a portion of which may be recoverable. The Fund will accrue such taxes and recoveries, as applicable, based upon its
current interpretation of tax rules and regulations that exist in the markets in which it invests.
Realized gains in certain countries may be subject to foreign taxes at the Fund level, based on statutory rates. The Fund accrues for such foreign taxes on realized and unrealized gains at the appropriate rate for each jurisdiction, as applicable. The amount, if any, is disclosed as a liability on the Statement of Assets and Liabilities.
Distributions to Shareholders
Distributions from net investment income, if any, are declared and paid annually. Net realized capital gains, if any, are distributed along with the income distribution. Income distributions and capital gain distributions are determined in accordance with federal income tax regulations, which may differ from GAAP.
Guarantees and Indemnifications
Under the Trust's organizational documents and, in some cases, by contract, its officers and trustees are indemnified against certain liabilities arising out of the performance of their duties to the Trust or its funds. In addition, certain of the Fund's contracts with its service providers contain general indemnification clauses. The Fund's maximum exposure under these arrangements is unknown since the amount of any future claims that may be made against the Fund cannot be determined, and the Fund has no historical basis for predicting the likelihood of any such claims.
Note 3. Fees and Other Transactions with Affiliates
Management Services Fees
Effective January 1, 2016, the Fund entered into a Management Agreement with Columbia Management Investment Advisers, LLC (the Investment Manager), a wholly-owned subsidiary of Ameriprise Financial, Inc. (Ameriprise Financial). Under the Management Agreement, the Investment Manager provides the Fund with investment research and advice, as well as administrative and accounting services. The management services fee is an annual fee that is equal to a percentage of the Fund's average daily net assets that declines from 1.18% to 0.72% as the Fund's net assets increase. Prior to January 1, 2016, the Fund paid the Investment Manager an annual fee for advisory services under an Investment Management Services Agreement and a separate annual fee for administrative and accounting services under an Administrative
Annual Report 2016
34
COLUMBIA EMERGING MARKETS FUND
NOTES TO FINANCIAL STATEMENTS (continued)
August 31, 2016
Services Agreement. The effective management services fee rate for the year ended August 31, 2016 (reflecting all advisory and administrative services fees paid to the Investment Manager) was 1.12% of the Fund's average daily net assets. For the period from September 1, 2015 through December 31, 2015, the investment advisory services fee paid to the Investment Manager was $3,910,352, and the administrative services fee paid to the Investment Manager was $292,437.
Compensation of Board Members
Board members, who are not officers or employees of the Investment Manager or Ameriprise Financial, are compensated for their services to the Fund as disclosed in the Statement of Operations. These Board members may participate in a Deferred Compensation Plan (the Plan) which may be terminated at any time. Obligations of the Plan will be paid solely out of the Fund's assets, and all amounts payable under the Plan constitute a general unsecured obligation of the Fund.
Compensation of Chief Compliance Officer
The Board has appointed a Chief Compliance Officer to the Fund in accordance with federal securities regulations. The Fund is allocated a portion of the expenses associated with the Chief Compliance Officer based on relative net assets of the Trust.
Transfer Agency Fees
Under a Transfer and Dividend Disbursing Agent Agreement, Columbia Management Investment Services Corp. (the Transfer Agent), an affiliate of the Investment Manager and a wholly-owned subsidiary of Ameriprise Financial, is responsible for providing transfer agency services to the Fund. The Transfer Agent has contracted with Boston Financial Data Services (BFDS) to serve as sub-transfer agent. The Transfer Agent pays the fees of BFDS for services as sub-transfer agent and BFDS is not entitled to reimbursement for such fees from the Fund (with the exception of out-of-pocket fees).
The Fund pays the Transfer Agent a monthly transfer agency fee based on the number or the average value of accounts, depending on the type of account. In addition, prior to October 1, 2016 the Transfer Agent also received sub-transfer agency fees based on a percentage of the average aggregate value of the Fund's shares maintained in omnibus accounts (other than omnibus accounts for which American Enterprise Investment Services Inc. is the broker of record or accounts where the beneficial shareholder is a customer of Ameriprise Financial Services, Inc., for which the Transfer Agent receives a per
account fee). Effective October 1, 2016, the Fund pays the Transfer Agent a fee for shareholder services based on the number of accounts or on a percentage of the average aggregate value of the Fund's shares maintained in omnibus accounts up to the lesser of the amount charged by the servicing agent or a cap established by the Board from time to time.
The Transfer Agent also receives compensation from the Fund for various shareholder services and reimbursements for certain out-of-pocket fees. Total transfer agency fees for Class K and Class R5 shares are subject to an annual limitation of not more than 0.05% of the average daily net assets attributable to each share class. Class I and Class Y shares do not pay transfer agency fees.
For the year ended August 31, 2016, the Fund's effective transfer agency fee rates as a percentage of average daily net assets of each class were as follows:
Class A | | | 0.21 | % | |
Class B | | | 0.21 | | |
Class C | | | 0.21 | | |
Class K | | | 0.05 | | |
Class R | | | 0.20 | | |
Class R4 | | | 0.20 | | |
Class R5 | | | 0.05 | | |
Class W | | | 0.21 | | |
Class Z | | | 0.21 | | |
The Fund and certain other associated investment companies have severally, but not jointly, guaranteed the performance and observance of all the terms and conditions of a lease entered into by Seligman Data Corp. (SDC), the former transfer agent, including the payment of rent by SDC (the Guaranty). SDC was the legacy Seligman funds' former transfer agent.
The lease and the Guaranty expire in January 2019. At August 31, 2016, the Fund's total potential future obligation over the life of the Guaranty is $36,397. The liability remaining at August 31, 2016 for non-recurring charges associated with the lease amounted to $20,692 and is recorded as a part of the payable for other expenses in the Statement of Assets and Liabilities.
An annual minimum account balance fee of $20 may apply to certain accounts with a value below the applicable share class's initial minimum investment requirements to reduce the impact of small accounts on transfer agency fees. These minimum account balance fees are remitted to the Fund and recorded as part of
Annual Report 2016
35
COLUMBIA EMERGING MARKETS FUND
NOTES TO FINANCIAL STATEMENTS (continued)
August 31, 2016
expense reductions in the Statement of Operations. For the year ended August 31, 2016, these minimum account balance fees reduced total expenses of the Fund by $1,812.
Plan Administration Fees
Under a Plan Administration Services Agreement with the Transfer Agent, the Fund pays an annual fee at a rate of 0.25% of the Fund's average daily net assets attributable to Class K shares for the provision of various administrative, recordkeeping, communication and educational services.
Distribution and Service Fees
The Fund has an agreement with Columbia Management Investment Distributors, Inc. (the Distributor), an affiliate of the Investment Manager and a wholly-owned subsidiary of Ameriprise Financial, for distribution and shareholder services. The Board has approved, and the Fund has adopted, distribution and shareholder service plans (the Plans) applicable to certain share classes, which set the distribution and service fees for the Fund. These fees are calculated daily and are intended to compensate the Distributor and/or eligible selling and/or servicing agents for selling shares of the Fund and providing services to investors.
Under the Plans, the Fund pays a monthly service fee to the Distributor at the maximum annual rate of 0.25% of the average daily net assets attributable to Class A, Class B, Class C and Class W shares of the Fund. Also under the Plans, the Fund pays a monthly distribution fee to the Distributor at the maximum annual rates of 0.75%, 0.75%, 0.50% and 0.25% of the average daily net assets attributable to Class B, Class C, Class R and Class W shares of the Fund, respectively.
Although the Fund may pay a distribution fee up to 0.25% of the Fund's average daily net assets attributable to Class W shares and a service fee of up to 0.25% of the Fund's average daily net assets attributable to Class W shares, the aggregate fee shall not exceed 0.25% of the Fund's average daily net assets attributable to Class W shares.
Sales Charges
Sales charges, including front-end charges and CDSCs, received by the Distributor for distributing Fund shares were $145,083 for Class A, $94 for Class B and $846 for Class C shares for the year ended August 31, 2016.
Expenses Waived/Reimbursed by the Investment Manager and its Affiliates
The Fund's expense ratio is subject to an expense reimbursement arrangement pursuant to which fees will be waived and/or expenses reimbursed (excluding certain fees and expenses described below), so that the Fund's net operating expenses, after giving effect to fees waived/expenses reimbursed and any balance credits and/or overdraft charges from the Fund's custodian, do not exceed the annual rates of:
| | | Contractual
Expense Cap
January 1, 2016
through
December 31, 2016 | | Voluntary
Expense Cap
Prior to
January 1, 2016 | |
Class A | | | 1.75 | % | | | 1.74 | % | |
Class B | | | 2.50 | | | | 2.49 | | |
Class C | | | 2.50 | | | | 2.49 | | |
Class I | | | 1.32 | | | | 1.33 | | |
Class K | | | 1.62 | | | | 1.63 | | |
Class R | | | 2.00 | | | | 1.99 | | |
Class R4 | | | 1.50 | | | | 1.49 | | |
Class R5 | | | 1.37 | | | | 1.38 | | |
Class W | | | 1.75 | | | | 1.74 | | |
Class Y | | | 1.32 | | | | 1.33 | | |
Class Z | | | 1.50 | | | | 1.49 | | |
The contractual agreement may be modified or amended only with approval from the Investment Manager, certain of its affiliates and the Fund. Under the arrangements, the following fees and expenses are excluded from the waiver/reimbursement commitment, and therefore will be paid by the Fund, if applicable: taxes (including foreign transaction taxes), expenses associated with investments in affiliated and non-affiliated pooled investment vehicles (including mutual funds and exchange-traded funds), transaction costs and brokerage commissions, costs related to any securities lending program, dividend and interest expenses associated with securities sold short, inverse floater program fees and expenses, transaction charges and interest on borrowed money, interest and infrequent and/or unusual expenses. Any fees waived and/or expenses reimbursed under the expense reimbursement arrangements described above are not recoverable by the Investment Manager or its affiliates in future periods.
Note 4. Federal Tax Information
The timing and character of income and capital gain distributions are determined in accordance with income
Annual Report 2016
36
COLUMBIA EMERGING MARKETS FUND
NOTES TO FINANCIAL STATEMENTS (continued)
August 31, 2016
tax regulations, which may differ from GAAP because of temporary or permanent book to tax differences.
At August 31, 2016, these differences are primarily due to differing treatment for capital loss carryforwards, deferral/reversal of wash sale losses, Trustees' deferred compensation, foreign capital gains tax, foreign currency transactions, passive foreign investment company (PFIC) holdings, excess distributions and late-year ordinary losses. To the extent these differences are permanent, reclassifications are made among the components of the Fund's net assets in the Statement of Assets and Liabilities. Temporary differences do not require reclassifications.
In the Statement of Assets and Liabilities the following reclassifications were made:
Excess of distributions over net investment income | | $ | (647,537 | ) | |
Accumulated net realized loss | | | 1,914,317 | | |
Paid-in capital | | | (1,266,780 | ) | |
Net investment income (loss) and net realized gains (losses), as disclosed in the Statement of Operations, and net assets were not affected by this reclassification.
The tax character of distributions paid during the years indicated was as follows:
Year Ended August 31, | | 2016 | | 2015 | |
Ordinary income | | $ | — | | | $ | 3,319,253 | | |
Long-term capital gains | | | — | | | | 285,494 | | |
Total | | $ | — | | | $ | 3,604,747 | | |
Short-term capital gain distributions, if any, are considered ordinary income distributions for tax purposes.
At August 31, 2016, the components of distributable earnings on a tax basis were as follows:
Capital loss carryforwards | | $ | (146,153,490 | ) | |
Net unrealized appreciation | | | 245,947,080 | | |
At August 31, 2016, the cost of investments for federal income tax purposes was $1,079,114,888 and the aggregate gross unrealized appreciation and depreciation based on that cost was:
Unrealized appreciation | | $ | 269,670,081 | | |
Unrealized depreciation | | | (23,723,001 | ) | |
Net unrealized appreciation | | $ | 245,947,080 | | |
The following capital loss carryforwards, determined at August 31, 2016, may be available to reduce taxable
income arising from future net realized gains on investments, if any, to the extent permitted by the Internal Revenue Code:
Year of Expiration | | Amount ($) | |
No expiration — short-term | | | 113,253,752 | | |
No expiration — long-term | | | 32,899,738 | | |
Total | | | 146,153,490 | | |
Under current tax rules, regulated investment companies can elect to treat certain late-year ordinary losses incurred and post-October capital losses (capital losses realized after October 31) as arising on the first day of the following taxable year. As of August 31, 2016, the Fund will elect to treat late-year ordinary losses of $170,257 as arising on September 1, 2016.
Management of the Fund has concluded that there are no significant uncertain tax positions in the Fund that would require recognition in the financial statements. However, management's conclusion may be subject to review and adjustment at a later date based on factors including, but not limited to, new tax laws, regulations, and administrative interpretations (including relevant court decisions). Generally, the Fund's federal tax returns for the prior three fiscal years remain subject to examination by the Internal Revenue Service.
Note 5. Portfolio Information
The cost of purchases and proceeds from sales of securities, excluding short-term investments and derivatives, if any, aggregated to $898,417,334 and $938,409,216, respectively, for the year ended August 31, 2016. The amount of purchase and sale activity impacts the portfolio turnover rate reported in the Financial Highlights.
Note 6. Affiliated Money Market Fund
The Fund invests in Columbia Short-Term Cash Fund, an affiliated money market fund established for the exclusive use by the Fund and other affiliated funds (the Affiliated MMF). The income earned by the Fund from such investments is included as Dividends — affiliated issuers in the Statement of Operations. As an investing fund, the Fund indirectly bears its proportionate share of the expenses of the Affiliated MMF. Effective October 1, 2016, the Affiliated MMF prices its shares with a floating net asset value (NAV) and no longer seeks to maintain a stable NAV. In addition, the Board of the Affiliated MMF may impose a fee on redemptions (sometimes referred to as a liquidity fee) or temporarily suspend redemptions
Annual Report 2016
37
COLUMBIA EMERGING MARKETS FUND
NOTES TO FINANCIAL STATEMENTS (continued)
August 31, 2016
(sometimes referred to as imposing a redemption gate) in the event its liquidity falls below regulatory limits.
Note 7. Line of Credit
The Fund has access to a revolving credit facility whereby the Fund may borrow for the temporary funding of shareholder redemptions or for other temporary or emergency purposes. Effective December 8, 2015, Citibank, N.A. and HSBC Bank USA, N.A. joined JPMorgan Chase Bank, N.A. (JPMorgan) as lead of a syndicate of banks under the credit facility, which is a collective agreement between the Fund and certain other funds managed by the Investment Manager, severally and not jointly, that permits collective borrowings up to $1 billion. Interest is charged to each participating fund based on its borrowings at a rate equal to the higher of (i) the overnight federal funds rate plus 1.00% or (ii) the one-month LIBOR rate plus 1.00%. Each borrowing under the credit facility matures no later than 60 days after the date of borrowing. The Fund also pays a commitment fee equal to its pro rata share of the amount of the credit facility at a rate of 0.15% per annum. The commitment fee is included in other expenses in the Statement of Operations. Prior to December 8, 2015, JPMorgan was the sole lead bank under the credit facility agreement that permitted borrowings up to $550 million under the same terms and interest rates as described above with the exception of the commitment fee which was charged at a rate of 0.075% per annum.
For the year ended August 31, 2016, the average daily loan balance outstanding on days when borrowing existed was $3,780,000 at a weighted average interest rate of 1.34%. Interest expense incurred by the Fund is recorded as a line of credit interest expense in the Statement of Operations. The Fund had no outstanding borrowings at August 31, 2016.
Note 8. Significant Risks
Shareholder Concentration Risk
At August 31, 2016, one unaffiliated shareholder of record owned 41.2% of the outstanding shares of the Fund in one or more accounts. The Fund has no knowledge about whether any portion of those shares was owned beneficially. Affiliated shareholders of record owned 34.9% of the outstanding shares of the Fund in one or more accounts. Subscription and redemption activity by concentrated accounts may have a significant effect on the operations of the Fund. In the case of a large redemption, the Fund may be forced to sell investments at inopportune times, including its liquid or
more liquid positions, resulting in Fund losses and the Fund holding a higher percentage of less liquid or illiquid securities. Large redemptions could result in decreased economies of scale and increased operating expenses for non-redeeming Fund shareholders.
Foreign Securities and Emerging Market Countries Risk
Investing in foreign securities may include certain risks and considerations not typically associated with investing in U.S. securities, such as fluctuating currency values and changing local and regional economic, political and social conditions, which may result in greater market volatility. In addition, certain foreign securities may not be as liquid as U.S. securities. Investing in emerging markets may accentuate these risks. These countries are also more likely to experience high levels of inflation, deflation or currency devaluation which could hurt their economies and securities markets. To the extent that the Fund concentrates its investment exposure to any one or a few specific countries, the Fund will be particularly susceptible to the various conditions, events or other factors impacting those countries and may, therefore, have a greater risk than that of a fund which is more geographically diversified.
Technology and Technology-related Investment Risk
The Fund may be more susceptible to the particular risks that may affect companies in the information technology sector, as well as other technology-related sectors (collectively, the technology sectors) than if it were invested in a wider variety of companies in unrelated sectors. Companies in the technology sectors are subject to certain risks, including the risk that new services, equipment or technologies will not be accepted by consumers and businesses or will become rapidly obsolete. Performance of such companies may be affected by factors including obtaining and protecting patents (or the failure to do so) and significant competitive pressures, including aggressive pricing of their products or services, new market entrants, competition for market share and short product cycles due to an accelerated rate of technological developments. Such competitive pressures may lead to limited earnings and/or falling profit margins. As a result, the value of their securities may fall or fail to rise. In addition, many technology sector companies have limited operating histories and prices of these companies' securities historically have been more volatile than other securities, especially over the short term.
Annual Report 2016
38
COLUMBIA EMERGING MARKETS FUND
NOTES TO FINANCIAL STATEMENTS (continued)
August 31, 2016
Note 9. Subsequent Events
Management has evaluated the events and transactions that have occurred through the date the financial statements were issued and noted no items requiring adjustment of the financial statements or additional disclosure.
Note 10. Information Regarding Pending and Settled Legal Proceedings
Ameriprise Financial and certain of its affiliates have historically been involved in a number of legal, arbitration and regulatory proceedings, including routine litigation, class actions, and governmental actions, concerning matters arising in connection with the conduct of their business activities. Ameriprise Financial believes that the Funds are not currently the subject of, and that neither Ameriprise Financial nor any of its affiliates are the subject of, any pending legal, arbitration or regulatory proceedings that are likely to have a material adverse effect on the Funds or the ability of Ameriprise Financial or its affiliates to perform under their contracts with the Funds. Ameriprise Financial is required to make quarterly (10-Q), annual (10-K) and, as necessary, 8-K filings with the Securities and Exchange Commission (SEC) on legal and regulatory matters that relate to Ameriprise Financial and its affiliates. Copies of these filings may be obtained by accessing the SEC website at www.sec.gov.
There can be no assurance that these matters, or the adverse publicity associated with them, will not result in increased fund redemptions, reduced sale of fund shares or other adverse consequences to the Funds. Further, although we believe proceedings are not likely to have a material adverse effect on the Funds or the ability of Ameriprise Financial or its affiliates to perform under their contracts with the Funds, these proceedings are subject to uncertainties and, as such, we are unable to estimate the possible loss or range of loss that may result. An adverse outcome in one or more of these proceedings could result in adverse judgments, settlements, fines, penalties or other relief that could have a material adverse effect on the consolidated financial condition or results of operations of Ameriprise Financial.
Annual Report 2016
39
COLUMBIA EMERGING MARKETS FUND
REPORT OF INDEPENDENT REGISTERED PUBLIC ACCOUNTING FIRM
To the Trustees of Columbia Funds Series Trust I and the Shareholders of
Columbia Emerging Markets Fund
In our opinion, the accompanying statement of assets and liabilities, including the portfolio of investments, and the related statements of operations and of changes in net assets and the financial highlights present fairly, in all material respects, the financial position of Columbia Emerging Markets Fund (the "Fund," a series of Columbia Funds Series Trust I) at August 31, 2016, and the results of its operations, the changes in its net assets and the financial highlights for each of the periods indicated, in conformity with accounting principles generally accepted in the United States of America. These financial statements and financial highlights (hereafter referred to as "financial statements") are the responsibility of the Fund's management. Our responsibility is to express an opinion on these financial statements based on our audits. We conducted our audits of these financial statements in accordance with the standards of the Public Company Accounting Oversight Board (United States). Those standards require that we plan and perform the audit to obtain reasonable assurance about whether the financial statements are free of material misstatement. An audit includes examining, on a test basis, evidence supporting the amounts and disclosures in the financial statements, assessing the accounting principles used and significant estimates made by management, and evaluating the overall financial statement presentation. We believe that our audits, which included confirmation of securities at August 31, 2016 by correspondence with the custodian, brokers and transfer agent, provide a reasonable basis for our opinion.
PricewaterhouseCoopers LLP
Minneapolis, MN
October 21, 2016
Annual Report 2016
40
COLUMBIA EMERGING MARKETS FUND
FEDERAL INCOME TAX INFORMATION
(Unaudited)
The Fund hereby designates the following tax attributes for the fiscal year ended August 31, 2016. Shareholders will be notified in early 2017 of the amounts for use in preparing 2016 income tax returns.
Tax Designations
Foreign Taxes Paid | | $ | 3,296,198 | | |
Foreign Taxes Paid Per Share | | $ | 0.03 | | |
Foreign Source Income | | $ | 19,503,882 | | |
Foreign Source Income Per Share | | $ | 0.15 | | |
Foreign Taxes. The Fund makes the election to pass through to shareholders the foreign taxes paid. Eligible shareholders may claim a foreign tax credit. These taxes, and the corresponding foreign source income, are provided.
Annual Report 2016
41
COLUMBIA EMERGING MARKETS FUND
Shareholders elect the Board that oversees the Fund's operations. The Board appoints officers who are responsible for day-to-day business decisions based on policies set by the Board. The following table provides basic biographical information about the Fund's Trustees, including their principal occupations during the past five years, although specific titles for individuals may have varied over the period. The year set forth beneath Length of Service in the table below is the year in which the Trustee was first appointed or elected as Trustee to any Fund currently in the Columbia Funds Complex or a predecessor thereof. Under current Board policy, members serve terms of indefinite duration.
Trustees
Independent Trustees
Name,
Address,
Year of Birth | | Position Held With
the Trust and Length of
Service | | Principal Occupation(s)
During the Past Five Years
and Other Relevant
Professional Experience | | Number of
Funds in the
Columbia Funds
Complex
Overseen | | Other Directorships
Held by Trustee During
the Past Five Years | |
Janet Langford Carrig
c/o Columbia
Management Investment Advisers, LLC,
225 Franklin Street
Mail Drop BX32 05228,
Boston, MA 02110
1957 | | Trustee 1996 | | Senior Vice President, General Counsel and Corporate Secretary, ConocoPhillips (integrated energy company) since September 2007 | | 56 | | None | |
Douglas A. Hacker
c/o Columbia Management Investment Advisers, LLC,
225 Franklin Street
Mail Drop BX32 05228,
Boston, MA 02110
1955 | | Trustee and Chairman of the Board 1996 | | Independent business executive since May 2006; Executive Vice President — Strategy of United Airlines from December 2002 to May 2006; President of UAL Loyalty Services (airline marketing company) from September 2001 to December 2002; Executive Vice President and Chief Financial Officer of United Airlines from July 1999 to September 2001 | | 56 | | Spartan Nash Company (food distributor); Nash Finch Company (food distributor) from 2005 to 2013; Aircastle Limited (aircraft leasing); SeaCube Container Leasing Ltd. (container leasing) from 2010 to 2013; and Travelport Worldwide Limited (travel information technology) | |
Nancy T. Lukitsh
c/o Columbia Management Investment Advisers, LLC,
225 Franklin Street
Mail Drop BX32 05228,
Boston, MA 02110
1956 | | Trustee 2011 | | Senior Vice President, Partner and Director of Marketing, Wellington Management Company, LLP (investment adviser) from 1997 to 2010; Chair, Wellington Management Portfolios (commingled non-U.S. investment pools) from 2007 to 2010; Director, Wellington Trust Company, NA and other Wellington affiliates from 1997 to 2010 | | 56 | | None | |
Annual Report 2016
42
COLUMBIA EMERGING MARKETS FUND
TRUSTEES AND OFFICERS (continued)
Independent Trustees (continued)
Name,
Address,
Year of Birth | | Position Held With
the Trust and Length of
Service | | Principal Occupation(s)
During the Past Five Years
and Other Relevant
Professional Experience | | Number of
Funds in the
Columbia Funds
Complex
Overseen | | Other Directorships
Held by Trustee During
the Past Five Years | |
William E. Mayer
c/o Columbia Management Investment Advisers, LLC,
225 Franklin Street
Mail Drop BX32 05228,
Boston, MA 02110
1940 | | Trustee 1991 | | Partner, Park Avenue Equity Partners (private equity) since February 1999 | | 56 | | DynaVox Inc. (speech creation); Lee Enterprises (print media); WR Hambrecht + Co. (financial service provider) from 2000 to 2012; BlackRock Capital Investment Corporation (investment company); and Premier, Inc. (healthcare) | |
David M. Moffett
c/o Columbia Management Investment Advisers, LLC,
225 Franklin Street
Mail Drop BX32 05228,
Boston, MA 02110
1952 | | Trustee 2011 | | Retired. Consultant to Bridgewater and Associates | | 56 | | Director of CIT Bank, CIT Group Inc. (commercial and consumer finance); eBay Inc. (online trading community); Genworth Financial, Inc. (financial and insurance products and services); Paypal Holdings Inc. (payment and data processing services); and Trustee University of Oklahoma Foundation | |
Charles R. Nelson
c/o Columbia Management Investment Advisers, LLC,
225 Franklin Street
Mail Drop BX32 05228,
Boston, MA 02110
1942 | | Trustee 1981 | | Retired. Professor Emeritus, University of Washington since 2011; Professor of Economics, University of Washington from 1976 to 2011; Ford and Louisa Van Voorhis Professor of Political Economy, University of Washington from 1993 to 2011; Adjunct Professor of Statistics, University of Washington from 1980 to 2011; Associate Editor, Journal of Money, Credit and Banking from September 1993 to 2008; consultant on econometric and statistical matters | | 56 | | None | |
John J. Neuhauser
c/o Columbia Management Investment Advisers, LLC,
225 Franklin Street
Mail Drop BX32 05228,
Boston, MA 02110
1943 | | Trustee 1984 | | President, Saint Michael's College since August 2007; Director or Trustee of several non-profit organizations, including University of Vermont Medical Center; Academic Vice President and Dean of Faculties, Boston College from August 1999 to October 2005; University Professor, Boston College from November 2005 to August 2007 | | 56 | | Liberty All-Star Equity Fund and Liberty All-Star Growth Fund (closed-end funds) | |
Annual Report 2016
43
COLUMBIA EMERGING MARKETS FUND
TRUSTEES AND OFFICERS (continued)
Independent Trustees (continued)
Name,
Address,
Year of Birth | | Position Held With
the Trust and Length of
Service | | Principal Occupation(s)
During the Past Five Years
and Other Relevant
Professional Experience | | Number of
Funds in the
Columbia Funds
Complex
Overseen | | Other Directorships
Held by Trustee During
the Past Five Years | |
Patrick J. Simpson
c/o Columbia Management Investment Advisers, LLC,
225 Franklin Street
Mail Drop BX32 05228,
Boston, MA 02110
1944 | | Trustee 2000 | | Of Counsel, Perkins Coie LLP (law firm) since 2015; Partner, Perkins Coie LLP from 1988 to 2014 | | 56 | | None | |
Anne-Lee Verville
c/o Columbia Management Investment Advisers, LLC,
225 Franklin Street
Mail Drop BX32 05228,
Boston, MA 02110
1945 | | Trustee 1998 | | Retired. General Manager, Global Education Industry from 1994 to 1997, President — Application Systems Division from 1991 to 1994, Chief Financial Officer — US Marketing & Services from 1988 to 1991, and Chief Information Officer from 1987 to 1988, IBM Corporation (computer and technology) | | 56 | | Enesco Group, Inc. (producer of giftware and home and garden decor products) from 2001 to 2006 | |
Consultant to the Trustees*
Name,
Address,
Year of Birth | | Position Held With
the Trust and Length of
Service | | Principal Occupation(s)
During the Past Five Years
and Other Relevant
Professional Experience | | Number of
Funds in the
Columbia Funds
Complex
Overseen | | Other Directorships
Held by Trustee During
the Past Five Years | |
J. Kevin Connaughton
c/o Columbia
Management Investment Advisers, LLC,
225 Franklin Street
Mail Drop BX32 05228,
Boston, MA 02110
1964 | | Trustee Consultant 2016 | | Trustee Consultant, Columbia Funds since March 2016; Managing Director and General Manager of Mutual Fund Products, Columbia Management Investment Advisers, LLC from May 2010 to February 2015; President, Columbia Funds from 2009 to 2015; and senior officer of Columbia Funds and affiliated funds from 2003 to 2015 | | | 56 | | | Board of Governors, Gateway Healthcare since January 2016; Trustee, New Century Portfolios since March 2015; and Director, The Autism Project since March 2015 | |
* J. Kevin Connaughton was appointed consultant to the Trustees effective March 1, 2016. Shareholders of the Funds are expected to be asked to elect Mr. Connaughton as a Trustee at a future shareholder meeting.
Annual Report 2016
44
COLUMBIA EMERGING MARKETS FUND
TRUSTEES AND OFFICERS (continued)
Interested Trustee Affiliated with Investment Manager*
Name,
Address,
Year of Birth | | Position Held With
the Trust and Length of
Service | | Principal Occupation(s)
During the Past Five Years
and Other Relevant
Professional Experience | | Number of
Funds in the
Columbia Funds
Complex
Overseen | | Other Directorships
Held by Trustee During
the Past Five Years | |
William F. Truscott
c/o Columbia Management Investment Advisers, LLC,
225 Franklin Street
Boston, MA 02110
1960 | | Trustee 2012 | | Chairman of the Board and President, Columbia Management Investment Advisers, LLC since May 2010 and February 2012, respectively; Chief Executive Officer, Global Asset Management, Ameriprise Financial, Inc. since September 2012 (previously Chief Executive Officer, U.S. Asset Management & President, Annuities, May 2010- September 2012); Director and Chief Executive Officer, Columbia Management Investment Distributors, Inc. since May 2010 and February 2012, respectively; Chairman of the Board and Chief Executive Officer, RiverSource Distributors, Inc. since 2006; Director, Threadneedle Asset Management Holdings, SARL since 2014; President and Chief Executive Officer, Ameriprise Certificate Company, 2006-August 2012. | | 184 | | Trustee to other Columbia Funds since 2001; Chairman of the Board, Columbia Management Investment Advisers, LLC since May 2010; Director, Columbia Management Investment Distributors, Inc. since May 2010; Former Director, Ameriprise Certificate Company, 2006-January 2013 | |
* Interested person (as defined under the 1940 Act) by reason of being an officer, director, security holder and/or employee of the Investment Manager or Ameriprise Financial.
The Statement of Additional Information has additional information about the Fund's Board members and is available, without charge, upon request by calling 800.345.6611; contacting your financial intermediary; or visiting investor.columbiathreadneedleus.com.
Annual Report 2016
45
COLUMBIA EMERGING MARKETS FUND
TRUSTEES AND OFFICERS (continued)
The Board has appointed officers who are responsible for day-to-day business decisions based on policies it has established. The officers serve at the pleasure of the Board. The following table provides basic information about the Officers of the Fund, including principal occupations during the past five years, although their specific titles may have varied over the period. In addition to Mr. Truscott, who is Senior Vice President, the Fund's other officers are:
Fund Officers
Name,
Address and
Year of Birth | | Position and Year
First Appointed to
Position for any Fund
in the Columbia
Funds Complex or a
Predecessor Thereof | |
Principal Occupation(s) During Past Five Years | |
Christopher O. Petersen
5228 Ameriprise Financial Center
Minneapolis, MN 55474
Born 1970 | | President and Principal Executive Officer (2015) | | Vice President and Lead Chief Counsel, Ameriprise Financial, Inc. since January 2015 (previously, Vice President and Chief Counsel January 2010-December 2014; officer of Columbia Funds and affiliated funds since 2007. | |
Michael G. Clarke
225 Franklin Street
Boston, MA 02110
Born 1969 | | Treasurer (2011), Chief Financial Officer (2009) and Chief Accounting Officer (2015) | | Vice President — Mutual Fund Administration, Columbia Management Investment Advisers, LLC, since May 2010; senior officer of Columbia Funds and affiliated funds since 2002. | |
Paul B. Goucher
100 Park Avenue
New York, NY 10017
Born 1968 | | Senior Vice President (2011), Chief Legal Officer (2015) and Assistant Secretary (2008) | | Vice President and Lead Chief Counsel, Ameriprise Financial, Inc. since November 2008 and January 2013, respectively (previously Chief Counsel, January 2010-January 2013); Vice President, Chief Legal Officer and Assistant Secretary, Columbia Management Investment Advisers, LLC since May 2010. | |
Thomas P. McGuire
225 Franklin Street
Boston, MA 02110
Born 1972 | | Senior Vice President and Chief Compliance Officer (2012) | | Vice President — Asset Management Compliance, Ameriprise Financial, Inc., since May 2010; Chief Compliance Officer, Ameriprise Certificate Company since September 2010. | |
Colin Moore
225 Franklin Street
Boston, MA 02110
Born 1958 | | Senior Vice President (2010) | | Executive Vice President and Global Chief Investment Officer, Ameriprise Financial, Inc., since July 2013; Executive Vice President and Global Chief Investment Officer, Columbia Management Investment Advisers, LLC since July 2013 (previously Director and Global Chief Investment Officer, 2010-2013). | |
Michael E. DeFao
225 Franklin Street
Boston, MA 02110
Born 1968 | | Vice President (2011) and Assistant Secretary (2010) | | Vice President and Chief Counsel, Ameriprise Financial, Inc. since May 2010. | |
Amy Johnson
5228 Ameriprise Financial Center
Minneapolis, MN 55474
Born 1965 | | Vice President (2006) | | Managing Director and Global Head of Operations, Columbia Management Investment Advisers, LLC since April 2016 (previously Managing Director and Chief Operating Officer, 2010-2016). | |
Lyn Kephart-Strong
5228 Ameriprise
Financial Center
Minneapolis, MN 55474
Born 1960 | | Vice President (2015) | | President, Columbia Management Investment Services Corp. since October 2014; Vice President & Resolution Officer, Ameriprise Trust Company since August 2009. | |
Ryan C. Larrenaga
225 Franklin Street
Boston, MA 02110
Born 1970 | | Vice President and Secretary (2015) | | Vice President and Group Counsel, Ameriprise Financial, Inc. since August 2011; officer of Columbia Funds and affiliated funds since 2005. | |
Annual Report 2016
46
COLUMBIA EMERGING MARKETS FUND
BOARD CONSIDERATION AND APPROVAL OF MANAGEMENT
AGREEMENT
On June 10, 2016, the Board of Trustees (the Board) and the Trustees who are not interested persons (as defined in the Investment Company Act of 1940) (the Independent Trustees) of Columbia Funds Series Trust I (the Trust) unanimously approved the continuation of the Management Agreement (the Management Agreement) with Columbia Management Investment Advisers, LLC (the Investment Manager) with respect to Columbia Emerging Markets Fund (the Fund), a series of the Trust. As detailed below, the Board's Advisory Fees and Expenses Committee (the Committee) and the Board met on multiple occasions to review and discuss, both among themselves and with the management team of the Investment Manager, materials provided by the Investment Manager and others before determining to approve the continuation of the Management Agreement.
In connection with their deliberations regarding the continuation of the Management Agreement, the Committee and the Board evaluated materials requested from the Investment Manager regarding the Fund and the Management Agreement, and discussed these materials with representatives of the Investment Manager at Committee meetings held on March 8, 2016, April 27, 2016 and June 9, 2016 and at Board meetings held on March 9, 2016 and June 10, 2016. In addition, the Board considers matters bearing on the Management Agreement at most of its other meetings throughout the year and meets regularly with senior management of the Trust and the Investment Manager. Through the Board's Investment Oversight Committees, Trustees also meet with selected portfolio managers of the funds the Trustees oversee and other investment personnel at various times throughout the year. The Committee and the Board also consulted with its independent fee consultant, Fund counsel and with the Independent Trustees' independent legal counsel, who advised on various matters with respect to the Committee's and the Board's considerations and otherwise assisted the Committee and the Board in their deliberations. On June 9, 2016, the Committee recommended that the Board approve the continuation of the Management Agreement. On June 10, 2016, the Board, including the Independent Trustees, voting separately, unanimously approved the continuation of the Management Agreement for the Fund.
The Committee and the Board considered all information that they, their legal counsel or the Investment Manager believed reasonably necessary to evaluate and to determine whether to recommend for approval or approve the continuation of the Management Agreement. The information and factors considered by the Committee and the Board in recommending for approval or approving the continuation of the Management Agreement for the Fund included the following:
• Information on the investment performance of the Fund relative to the performance of a group of mutual funds determined to be comparable to the Fund by an independent third-party data provider, as well as performance relative to benchmarks;
• Information on the Fund's management fees and total expenses, including information comparing the Fund's expenses to those of a group of comparable mutual funds, as determined by the independent third-party data provider;
• The Investment Manager's agreement to contractually limit or cap total operating expenses for the Fund through December 31, 2017 so that total operating expenses (excluding certain fees and expenses, such as transaction costs and certain other investment related expenses, interest, taxes, acquired fund fees and expenses, and infrequent and/or unusual expenses) would not exceed a specified annual rate, as a percentage of the Fund's net assets;
• The terms and conditions of the Management Agreement;
• The current and proposed terms and conditions of other agreements and arrangements with affiliates of the Investment Manager relating to the operations of the Fund, including agreements with respect to the provision of distribution and transfer agency services to the Fund;
• Descriptions of various functions performed by the Investment Manager under the Management Agreement, including portfolio management and portfolio trading practices;
• Information regarding the management fees of similarly-managed portfolios of other clients of the Investment Manager, including institutional separate accounts;
Annual Report 2016
47
COLUMBIA EMERGING MARKETS FUND
BOARD CONSIDERATION AND APPROVAL OF MANAGEMENT
AGREEMENT (continued)
• Information regarding the reputation, regulatory history and resources of the Investment Manager, including information regarding senior management, portfolio managers and other personnel;
• Information regarding the capabilities of the Investment Manager with respect to compliance monitoring services, including an assessment of the Investment Manager's compliance system by the Fund's Chief Compliance Officer; and
• The profitability to the Investment Manager and its affiliates from their relationships with the Fund.
Nature, Extent and Quality of Services Provided under the Management Agreement
The Committee and the Board considered the nature, extent and quality of services provided to the Fund by the Investment Manager and its affiliates under the Management Agreement and under separate agreements for the provision of transfer agency services, and the resources dedicated to the Fund and the other Columbia Funds by the Investment Manager and its affiliates. The Committee and the Board considered, among other things, the Investment Manager's ability to attract, motivate and retain highly qualified research, advisory and supervisory investment professionals (including personnel and other resources, compensation programs for personnel involved in fund management, reputation and other attributes), the portfolio management services provided by those investment professionals, and the quality of the Investment Manager's investment research capabilities and trade execution services. The Committee and the Board also considered the potential benefits to shareholders of investing in a mutual fund that is part of a fund complex offering exposure to a variety of asset classes and investment disciplines and providing a variety of fund and shareholder services.
The Committee and the Board also considered the professional experience and qualifications of the senior personnel of the Investment Manager, which included consideration of the Investment Manager's experience with similarly-structured funds. The Committee and the Board noted the compliance programs of and the compliance-related resources provided to the Fund by the Investment Manager and its affiliates, and considered the Investment Manager's ability to provide administrative services to the Fund and coordinate the activities of the Fund's other service providers. After reviewing these and related factors, the Committee and the Board concluded, within the context of their overall conclusions, that the nature, extent and quality of the services provided to the Fund under the Management Agreement supported the continuation of the Management Agreement.
Investment Performance
The Committee and the Board reviewed information about the performance of the Fund over various time periods, including performance information relative to benchmarks and information based on reports of the independent third-party data provider that compared the performance of the Fund to the performance of a group of comparable mutual funds, and data provided by the independent fee consultant. The Committee and the Board also reviewed a description of the third party's methodology for identifying the Fund's peer groups for purposes of performance and expense comparisons.
The Committee and the Board noted that, through December 31, 2015, the Fund's performance was in the twenty-sixth, forty-first and twenty-fifth percentile (where the best performance would be in the first percentile) of its category selected by the independent third-party data provider for the purposes of performance comparisons for the one-, three- and five-year periods, respectively.
The Committee and the Board also considered the Investment Manager's performance and reputation generally, the Investment Manager's historical responsiveness to Board concerns about performance, and the Investment Manager's willingness to take steps intended to improve performance. After reviewing these and related factors, the Committee and the Board concluded, within the context of their overall conclusions, that the performance of the Fund and the Investment Manager was sufficient, in light of other considerations, to warrant the continuation of the Management Agreement.
Investment Management Fee Rates and Other Expenses
The Committee and the Board considered the management fees charged to the Fund under the Management Agreement as well as the total expenses incurred by the Fund. In assessing the reasonableness of the fees
Annual Report 2016
48
COLUMBIA EMERGING MARKETS FUND
BOARD CONSIDERATION AND APPROVAL OF MANAGEMENT
AGREEMENT (continued)
under the Management Agreement, the Committee and the Board considered, among other information, the Fund's management fee and its total expense ratio as a percentage of average daily net assets. The Committee and the Board considered data provided by the independent fee consultant. The Committee and the Board noted that, as of December 31, 2015, the Fund's actual management fee and net total expense ratio are ranked in the fourth and third quintiles, respectively, (where the lowest fees and expenses would be in the first quintile) against the Fund's expense universe as determined by the independent third-party data provider for purposes of expense comparison. The Committee and the Board also took into account the fee waiver and expense limitation arrangements agreed to by the Investment Manager, as noted above.
The Committee and the Board also received and considered information about the management fees charged by the Investment Manager to institutional separate accounts. In considering the fees charged to those accounts, the Committee and the Board took into account, among other things, the Investment Manager's representations about the differences between managing mutual funds as compared to other types of accounts, including differences in the services provided, differences in the risk profile of such business for the Investment Manager and the additional resources required to manage mutual funds effectively. The Committee and the Board also received and considered information about the fees charged by the Investment Manager for sub-advisory services provided to comparable unaffiliated funds. In evaluating the Fund's management fees, the Committee and the Board also took into account the demands, complexity and quality of the investment management of the Fund.
After reviewing these and related factors, the Committee and the Board concluded, within the context of their overall conclusions, that the management fee rates and expenses of the Fund were sufficient, in light of other considerations, to warrant the continuation of the Management Agreement.
Costs of Services Provided and Profitability
The Committee and the Board also took note of the costs the Investment Manager and its affiliates incur in connection with the services provided (both on an absolute and relative basis) and the profitability to the Investment Manager and its affiliates in connection with their relationships with the Fund.
The Committee and the Board also considered the compensation directly or indirectly received by the Investment Manager's affiliates in connection with their relationships with the Fund. The Committee and the Board reviewed information provided by management as to the profitability to the Investment Manager and its affiliates of their relationships with the Fund, information about the allocation of expenses used to calculate profitability, and comparisons of profitability levels realized in 2015 to profitability levels realized in 2014. When reviewing profitability, the Committee and the Board also considered court cases in which adviser profitability was an issue in whole or in part, the performance of similarly managed funds, the performance of the Fund, and the expense ratio of the Fund. In addition, the Committee and the Board considered information provided by the Investment Manager regarding the Investment Manager's financial condition and comparing its profitability to that of other asset management firms that are, or are subsidiaries of, publicly traded companies. In this regard, the Committee and the Board also considered data provided by the independent fee consultant.
After reviewing these and related factors, the Committee and the Board concluded, within the context of their overall conclusions, that the costs of services provided and the profitability to the Investment Manager and its affiliates from their relationships with the Fund supported the continuation of the Management Agreement.
Economies of Scale
The Committee and the Board considered the potential existence of economies of scale in the provision by the Investment Manager of services to the Fund, to groups of related funds, and to the Investment Manager's investment advisory clients as a whole, and whether those economies of scale were shared with the Fund through breakpoints in investment management fees or other means, such as expense limitation arrangements and additional investments by the Investment Manager in investment, trading and compliance resources. The Committee and the Board noted that the management fee schedules for the Fund contained breakpoints that would reduce the fee rate on assets above specified threshold levels.
Annual Report 2016
49
COLUMBIA EMERGING MARKETS FUND
BOARD CONSIDERATION AND APPROVAL OF MANAGEMENT
AGREEMENT (continued)
In considering these matters, the Committee and the Board also considered the costs of the services provided and the profitability to the Investment Manager and its affiliates from their relationships with the Fund, as discussed above. After reviewing these and related factors, the Committee and the Board concluded, within the context of their overall conclusions, that the extent to which any economies of scale were expected to be shared with the Fund supported the continuation of the Management Agreement.
Other Benefits to the Investment Manager
The Committee and the Board received and considered information regarding "fall-out" or ancillary benefits received by the Investment Manager and its affiliates as a result of their relationships with the Fund, such as the engagement of the Investment Manager's affiliates to provide distribution and transfer services to the Fund. In this regard, among other matters, the Committee and the Board considered that the Fund's distributor retains a portion of the distribution fees from the Fund and receives a portion of the sales charges on sales or redemptions of certain classes of shares of the Fund. The Committee and the Board also considered the benefits of research made available to the Investment Manager by reason of brokerage commissions generated by the Fund's securities transactions, and reviewed information about the Investment Manager's practices with respect to allocating portfolio transactions for brokerage and research services. The Committee and the Board considered the possible conflicts of interest associated with certain fall-out or other ancillary benefits and the reporting, disclosure and other processes that are in place to address such possible conflicts of interest. The Committee and the Board recognized that the Investment Manager's profitability would be somewhat lower without these benefits.
Conclusion
The Committee and the Board reviewed all of the above considerations in reaching their decisions to recommend or approve the continuation of the Management Agreement. In their deliberations, the Trustees did not identify any particular information that was all-important or controlling, and individual Trustees may have attributed different weights to the various factors. Based on their evaluation of all factors that they deemed to be material, including those factors described above, and assisted by the advice of independent legal counsel, the Board, including the Independent Trustees, voting separately, unanimously approved the continuation of the Management Agreement.
Annual Report 2016
50
COLUMBIA EMERGING MARKETS FUND
IMPORTANT INFORMATION ABOUT THIS REPORT
Each fund mails one shareholder report to each shareholder address. If you would like more than one report, please call shareholder services at 800.345.6611 and additional reports will be sent to you.
The policy of the Board is to vote the proxies of the companies in which each fund holds investments consistent with the procedures as stated in the Statement of Additional Information (SAI). You may obtain a copy of the SAI without charge by calling 800.345.6611; contacting your financial intermediary; visiting investor.columbiathreadneedleus.com; or searching the website of the Securities and Exchange Commission (SEC) at sec.gov. Information regarding how each fund voted proxies relating to portfolio securities is filed with the SEC by August 31st for the most recent 12-month period ending June 30th of that year, and is available without charge by visiting investor.columbiathreadneedleus.com, or searching the website of the SEC at sec.gov.
Each fund files a complete schedule of portfolio holdings with the SEC for the first and third quarters of each fiscal year on Form N-Q. Each fund's Form N-Q is available on the SEC's website at sec.gov and may be reviewed and copied at the SEC's Public Reference Room in Washington, D.C. Information on the operation of the Public Reference Room may be obtained by calling 800.SEC.0330. Each fund's complete schedule of portfolio holdings, as filed on Form N-Q, can also be obtained without charge, upon request, by calling 800.345.6611.
Annual Report 2016
51
Columbia Emerging Markets Fund
P.O. Box 8081
Boston, MA 02266-8081

Please read and consider the investment objectives, risks, charges and expenses for any fund carefully before investing. For a prospectus and summary prospectus, which contains this and other important information about the Fund, go to investor.columbiathreadneedleus.com. The Fund is distributed by Columbia Management Investment Distributors, Inc., member FINRA, and managed by Columbia Management Investment Advisers, LLC.
Columbia Threadneedle Investments (Columbia Threadneedle) is the global brand name of the Columbia and Threadneedle group of companies.
All rights reserved. Columbia Management Investment Distributors, Inc., 225 Franklin Street, Boston, MA 02110-2804
© 2016 Columbia Management Investment Advisers, LLC.
investor.columbiathreadneedleus.com
ANN142_08_F01_(10/16)

ANNUAL REPORT
August 31, 2016

COLUMBIA GLOBAL ENERGY AND NATURAL RESOURCES FUND

ABOUT COLUMBIA THREADNEEDLE INVESTMENTS
Columbia Threadneedle Investments is a leading global asset management group that provides a broad range of investment strategies and solutions for individual, institutional and corporate clients around the world.
With more than 2,000 people, including over 450 investment professionals based in North America, Europe and Asia, we manage $460 billion* of assets across developed and emerging market equities, fixed income, asset allocation solutions and alternatives. We are the 13th largest manager of long-term mutual fund assets in the U.S.** and the 4th largest manager of retail funds in the U.K.***
Our priority is the investment success of our clients. We aim to deliver the investment outcomes they expect through an investment approach that is team-based, performance-driven and risk-aware. Our culture is dynamic and interactive. By sharing our insights across asset classes and geographies, we generate richer perspectives on global, regional and local investment landscapes. The ability to exchange and debate investment ideas in a collaborative environment enriches our teams' investment processes. More importantly, it results in better informed investment decisions for our clients.
Columbia funds are distributed by Columbia Management Investment Distributors, Inc., member FINRA, and managed by Columbia Management Investment Advisers, LLC.
Columbia Threadneedle Investments (Columbia Threadneedle) is the global brand name of the Columbia and Threadneedle group of companies.
* In U.S. dollars as of June 30, 2016. Source: Ameriprise Q2 Earnings Release. Includes all assets managed by entities in the Columbia and Threadneedle group of companies. Contact us for more current data.
** Source: ICI as of June 30, 2016 for Columbia Management Investment Advisers, LLC.
*** Source: Investment Association as of March 2016 for Threadneedle Asset Management Limited.
© 2016 Columbia Management Investment Advisers, LLC. All rights reserved.
Not part of the shareholder report
 Dear Shareholders,
Volatility comes with the territory for long-term investors. Some investors instinctively want to pull out of the market or sell underperforming investments at the first sign of increased volatility or perhaps even as soon as they perceive it on the horizon. But taking yourself out of the market could mean losing out on potential opportunities, and putting your longer term investment goals at risk.
Cumulative return is not just about achieving high returns when markets are going up; it's also about remaining invested and minimizing losses during weak or volatile markets so that you can participate on the upside. Developing a deeper understanding of the various risks your portfolio is subject to can help you balance these risks.
Diversification is critical in seeking to achieve that balance. We believe that most portfolios could be more effectively diversified either by introducing holdings with performance profiles unrelated to existing holdings (like alternative products) or by rebalancing existing holdings with an eye toward risk allocation. Over time, distributing risk more evenly may produce a more pronounced diversification benefit and may improve portfolio efficiency. We believe market volatility can create significant opportunities and, in fact, these periods may be some of the very best times to invest.
With this in mind, I thought it important to highlight excerpts from a piece written by Colin Moore, Global Chief Investment Officer, in which he touches on some of these issues emphasizing the importance of a properly constructed portfolio in seeking to effectively manage volatility and to achieve consistency of returns. I encourage you to read the article in its entirety. To access the full article and for other insights on current market, please visit blog.columbiathreadneedleus.com/latest-perspectives.
You need investments that are designed to help you ease the impact of volatile market environments and keep the savings you have worked tirelessly to amass. Columbia Threadneedle Investments provides investment solutions to help you tackle financial challenges and achieve your desired outcome.
Best regards,

Christopher O. Petersen
President, Columbia Funds
Excerpts from:
Taking the scare out of the volatility bogeyman
By Colin Moore, Global Chief Investment Officer
Colin Moore is the global chief investment officer for Columbia Threadneedle Investments. His responsibilities include ensuring that a disciplined investment process is in place across all asset classes, including equity and fixed income. Mr. Moore joined one of the Columbia Threadneedle Investments legacy firms in 2002 as head of equity and was also head of fixed income and liquidity strategies from 2009 – 2010.

n In today's low growth, higher volatility world, the emphasis is shifting from maximization of returns to consistency of returns.
PRESIDENT'S MESSAGE (continued)
n Portfolios should represent the behavioral risk-return tradeoff of investors, remembering that they won't stay invested to realize the return if we get the risk tolerance wrong.
n Holding long-term savings in cash to avoid volatility (the financial equivalent of hiding under the sheets) is detrimental to achieving long-term goals.
According to Wikipedia, "The bogeyman is a common allusion to a mythical creature in many cultures used to control behavior. This monster has no specific appearance, and conceptions about it can vary drastically from household to household within the same community; in many cases he has no set appearance in the mind of an adult or child, but is simply a non-specific embodiment of terror." Different cultures have different names and physical representations for the bogeyman, and investors are no different. We have terrible monsters that we fear may destroy our portfolios, and we call one of the scariest of them volatility.
While the bogeyman is mythical (I hope!), volatility is real and can cause serious damage. To understand why investors have such a hard time coping with volatility, we first need to define three cognitive biases at work in today's investment environment:
1) Recency bias — something that has recently come to the forefront of our attention, regardless of how long established it is, suddenly seems to appear with improbable frequency.
2) Negativity bias — we tend to have a greater recall of unpleasant memories than positive memories.
3) Loss aversion — our dissatisfaction with losing money tends to be greater than our satisfaction with making money.
The level of volatility varies dramatically, and so does investor fear and panic selling — waxing when volatility rises, waning when it falls. Recent studies have pointed to demographics as an important driver of panic selling. The theory is that as people get closer to retirement, the prospects of a large (20% – 30%) loss in financial assets can have a much more pronounced effect on their sense of well-being. Wealth preservation instincts kick in much more quickly than for younger (and typically less wealthy) savers.
The reality is that there is little opportunity for return without volatility. Therefore, the bogeyman effect of holding long-term savings in cash to avoid volatility (the financial equivalent of hiding under the sheets) is detrimental to achieving long-term goals. This effect tends to be more pronounced during the episodic spikes in volatility. The significant spike in volatility in 2008 and 2009 led to significant withdrawals from long-term investment funds over the same period. Less pronounced effects can also be seen when comparing 2001 – 2003 and 2011 – 2012. Conversely, flows picked up when volatility returned to "normal" levels. Investor behavior of this type is consistent with the three behavioral biases.
I believe average volatility will be higher over the next 10 years than the last 10 years and episodic spikes will increase in frequency because sustainable economic growth will be structurally lower and geopolitical risk higher than any time since World War II. Low growth creates uncertainty while loss aversion will make investors fear that we are one economic mishap or geopolitical event away from no growth or recession. The result will be higher volatility on average. Negativity bias will tend to exacerbate "spike" reactions to event-driven geopolitical news, and the volatility bogeyman will appear more often. Assuming the behavioral biases continue, investor returns are likely to be very disappointing regardless of the total return generated by financial markets due to the bogeyman effect.
To mitigate this effect, we need to focus on portfolio construction and an improved understanding of diversification. I accept that equities are likely to offer the highest return over the next 10 years, but they also offer the highest volatility. Many portfolio construction optimization tools use historical average volatility, which is likely to underestimate the volatility investors will face. The bogeyman emerges when individual asset class volatility spikes and cross correlations rise, the combination of which increases overall portfolio volatility far beyond expectation. Diversification is meant to protect investors against volatility, but what's the point of owning lots of investments if the volatility bogeyman has not been properly estimated?
Most importantly, portfolios should be constructed to properly represent the behavioral risk-return trade off of investors, remembering that they won't stay invested to realize the return if we get the risk tolerance wrong. In a low growth, higher volatility world, the emphasis is shifting to return consistency rather than return maximization,
PRESIDENT'S MESSAGE (continued)
and investors are best served through investment approaches that appreciate that distinction. Even though it's a permanent feature of financial markets, volatility is less likely to be the bogeyman we all fear if portfolios are constructed with this understanding.
Please visit blog.columbiathreadneedleus.com/latest-perspectives to read the entire article.
Investors should consider the investment objectives, risks, charges and expenses of a mutual fund carefully before investing. For a free prospectus and summary prospectus, which contains this and other important information about a fund, visit investor.columbiathreadneedleus.com. The prospectus should be read carefully before investing.
The views expressed are as of April 2016, may change as market or other conditions change, and may differ from views expressed by other Columbia Management Investment Advisers, LLC (CMIA) associates or affiliates. Actual investments or investment decisions made by CMIA and its affiliates, whether for its own account or on behalf of clients, will not necessarily reflect the views expressed. This information is not intended to provide investment advice and does not account for individual investor circumstances. Investment decisions should always be made based on an investor's specific financial needs, objectives, goals, time horizon and risk tolerance. Asset classes described may not be suitable for all investors.
Past performance does not guarantee future results, and no forecast should be considered a guarantee either. Since economic and market conditions change frequently, there can be no assurance that the trends described here will continue or that the forecasts are accurate.
Diversification does not guarantee a profit or protect against loss.
Columbia Funds are distributed by Columbia Management Investment Distributors, Inc., member FINRA, and managed by Columbia Management Investment Advisers, LLC.
© 2016 Columbia Management Investment Advisers, LLC. All rights reserved.
COLUMBIA GLOBAL ENERGY AND NATURAL RESOURCES FUND
Fund Investment Manager
Columbia Management Investment
Advisers, LLC
225 Franklin Street
Boston, MA 02110
Fund Distributor
Columbia Management Investment
Distributors, Inc.
225 Franklin Street
Boston, MA 02110
Fund Transfer Agent
Columbia Management Investment
Services Corp.
P.O. Box 8081
Boston, MA 02266-8081
For more information about any of the funds, please visit investor.columbiathreadneedleus.com or call 800.345.6611. Customer Service Representatives are available to answer your questions Monday through Friday from 8 a.m. to 7 p.m. Eastern time.
The views expressed in this report reflect the current views of the respective parties. These views are not guarantees of future performance and involve certain risks, uncertainties and assumptions that are difficult to predict, so actual outcomes and results may differ significantly from the views expressed. These views are subject to change at any time based upon economic, market or other conditions and the respective parties disclaim any responsibility to update such views. These views may not be relied on as investment advice and, because investment decisions for a Columbia fund are based on numerous factors, may not be relied on as an indication of trading intent on behalf of any particular Columbia fund. References to specific securities should not be construed as a recommendation or investment advice.
Performance Overview | | | 3 | | |
Manager Discussion of Fund Performance | | | 5 | | |
Understanding Your Fund's Expenses | | | 8 | | |
Portfolio of Investments | | | 9 | | |
Statement of Assets and Liabilities | | | 13 | | |
Statement of Operations | | �� | 15 | | |
Statement of Changes in Net Assets | | | 16 | | |
Financial Highlights | | | 19 | | |
Notes to Financial Statements | | | 28 | | |
Report of Independent Registered Public Accounting Firm | | | 37 | | |
Trustees and Officers | | | 38 | | |
Board Consideration and Approval of Management Agreement | | | 43 | | |
Important Information About This Report | | | 47 | | |
COLUMBIA GLOBAL ENERGY AND NATURAL RESOURCES FUND
Performance Summary
n Columbia Global Energy and Natural Resources Fund (the Fund) Class A shares returned 5.54%, excluding sales charges, for the 12-month period that ended August 31, 2016.
n During the same time period, the Fund underperformed its Blended Index, which returned 7.99%, as well as the S&P North American Natural Resources Sector Index, which returned 8.24%.
n A slight underperformance in energy was partially offset by outperformance from the Fund's holdings in the materials sector.
Average Annual Total Returns (%) (for period ended August 31, 2016)
| | | Inception | | 1 Year | | 5 Years | | 10 Years | |
Class A* | | 09/28/07 | | | | | | | |
Excluding sales charges | | | | | | | 5.54 | | | | -2.47 | | | | 0.69 | | |
Including sales charges | | | | | | | -0.53 | | | | -3.62 | | | | 0.10 | | |
Class B* | | 03/07/11 | | | | | | | |
Excluding sales charges | | | | | | | 4.75 | | | | -3.19 | | | | -0.15 | | |
Including sales charges | | | | | | | -0.25 | | | | -3.54 | | | | -0.15 | | |
Class C* | | 09/28/07 | | | | | | | |
Excluding sales charges | | | | | | | 4.75 | | | | -3.20 | | | | -0.04 | | |
Including sales charges | | | | | | | 3.75 | | | | -3.20 | | | | -0.04 | | |
Class I* | | 09/27/10 | | | 6.08 | | | | -1.98 | | | | 1.08 | | |
Class K* | | 03/07/11 | | | 5.75 | | | | -2.29 | | | | 0.78 | | |
Class R* | | 09/27/10 | | | 5.24 | | | | -2.70 | | | | 0.40 | | |
Class R4* | | 11/08/12 | | | 5.89 | | | | -2.21 | | | | 0.94 | | |
Class R5* | | 11/08/12 | | | 5.99 | | | | -2.09 | | | | 1.00 | | |
Class Z | | 12/31/92 | | | 5.86 | | | | -2.21 | | | | 0.94 | | |
Blended Index | | | | | | | 7.99 | | | | -0.75 | | | | 1.82 | | |
S&P North American Natural Resources Sector Index | | | | | | | 8.24 | | | | -1.43 | | | | 2.18 | | |
Returns for Class A shown with and without the maximum initial sales charge of 5.75%. Returns for Class B are shown with and without the applicable contingent deferred sales charge (CDSC) of 5.00% in the first year, declining to 1.00% in the sixth year and eliminated thereafter. Returns for Class C are shown with and without the 1.00% CDSC for the first year only. The Fund's other classes are not subject to sales charges and have limited eligibility. Please see the Fund's prospectus for details. Performance for different share classes will vary based on differences in sales charges and fees associated with each class. All results shown assume reinvestment of distributions during the period. Returns do not reflect the deduction of taxes that a shareholder may pay on Fund distributions or on the redemption of Fund shares. Performance results reflect the effect of any fee waivers or reimbursements of Fund expenses by Columbia Management Investment Advisers, LLC and/or any of its affiliates. Absent these fee waivers or expense reimbursement arrangements, performance results would have been lower.
The performance information shown represents past performance and is not a guarantee of future results. The investment return and principal value of your investment will fluctuate so that your shares, when redeemed, may be worth more or less than their original cost. Current performance may be lower or higher than the performance information shown. You may obtain performance information current to the most recent month-end by contacting your financial intermediary, visiting investor.columbiathreadneedleus.com or calling 800.345.6611.
*The returns shown for periods prior to the share class inception date (including returns for the Life of the Fund, if shown, which are since Fund inception) include the returns of the Fund's oldest share class. These returns are adjusted to reflect any higher class-related operating expenses of the newer share classes, as applicable. Please visit investor.columbiathreadneedleus.com/investment-products/mutual-funds/appended-performance for more information.
The Blended Benchmark, a weighted custom composite, established by the Investment Manager, consists of a 60% weighting in the MSCI World Energy Sector Index (Net) and a 40% weighting in the MSCI World Materials Sector Index (Net). The MSCI World Energy Sector Index is a free float-adjusted market capitalization weighted index that represents the energy segment in global developed market equity performance. The MSCI World Materials Sector Index is a free float-adjusted market capitalization weighted index that represents the materials segment in global developed-market equity performance.
The S&P North American Natural Resources Sector Index is a modified market capitalization-weighted equity index designed as a benchmark for U.S. traded securities in the natural resources sector. The index includes companies involved in the following categories: extractive industries, energy companies, owners and operators of timber tracts, forestry services, producers of pulp and paper and owners of plantations.
Indices are not available for investment, are not professionally managed and do not reflect sales charges, fees, brokerage commissions, taxes (except the MSCI World Energy Sector Index (Net) and the MSCI World Materials Sector Index (Net), which reflects reinvested dividends net of withholding taxes) or other expenses of investing. Securities in the Fund may not match those in an index.
Annual Report 2016
3
COLUMBIA GLOBAL ENERGY AND NATURAL RESOURCES FUND
PERFORMANCE OVERVIEW (continued)
Performance of a Hypothetical $10,000 Investment (September 1, 2006 – August 31, 2016)
The chart above shows the change in value of a hypothetical $10,000 investment in Class A shares of Columbia Global Energy and Natural Resources Fund during the stated time period, and does not reflect the deduction of taxes that a shareholder may pay on Fund distributions or on the redemption of Fund shares.
Annual Report 2016
4
COLUMBIA GLOBAL ENERGY AND NATURAL RESOURCES FUND
MANAGER DISCUSSION OF FUND PERFORMANCE
For the 12-month period that ended August 31, 2016, the Fund's Class A shares returned 5.54% excluding sales charges. During the same time period, the Fund underperformed its Blended Index, which returned 7.99%, as well as the S&P North American Natural Resources Sector Index, which returned 8.24%. A slight underperformance in energy was partially offset by outperformance from the Fund's materials holdings.
Market Overview
Oil and natural gas prices rose during the period, but volatility masked some big moves within both. Domestic oil started the period at just under $50/barrel, fell into the $20s early in 2016, then rallied to just over $50 in June, after which the pattern was relatively sideways through the final months of the period. Oil prices were tested because of bloated inventories, increased OPEC production and, early in 2016, warmer weather. However, a decline in U.S. production helped strengthen the market for oil, and unplanned outages in Nigeria and forest fires in Canada and other parts of the world also helped tighten the supply/demand balance. Natural gas prices also were volatile, starting the period at approximately $2.70/cubic foot, falling below $2.00 in March then rallying to $2.90. The supply/demand outlook for natural gas brightened as a warmer summer materialized.
Certain commodity prices within the materials sector were also up strongly for the period. The price of gold took off after the U.K. vote to exit the European Union. Corn prices rallied early in the period, then pulled back. Iron ore traded all the way down to $40 in December then rallied up to approximately $70 in the spring of 2016.
Contributors and Detractors
A well-timed move away from more defensive energy stocks near the end of February 2016, especially within the exploration & production (E&P) segment, was the single biggest source of outperformance relative to the benchmark within energy holdings. An outsized position in Exxon also aided relative results. Exxon was one of the best individual contributors to Fund performance for the period. Positions in Devon Energy and Hess also added to Fund gains. However, these positive results were outweighed by underperformance among midstream energy holdings, where the Fund was overweight relative to the Blended Index. Mid-stream energy company business models proved to be more vulnerable than expected, as access to the capital markets seized up. In that regard, Kinder Morgan and Plains GP were particular disappointments. Kinder Morgan was forced to cut its dividend dramatically to shore up its financial situation. The company, which historically had depended on the capital markets to fund its growth, faced a potential credit rating downgrade. As a result, Kinder Morgan abandoned the model that had worked well for them in the past. The crisis of confidence that ensued spilled over to other parts of the industry and also affected Plains GP. The Fund also lost ground with positions in natural gas companies Williams Energy and Energy Transfer, whose proposed merger raised questions about how the deal would be funded. The prospect of increased debt for the combined
Portfolio Management
Josh Kapp, CFA
Jonathan Mogil, CFA
Morningstar Style BoxTM
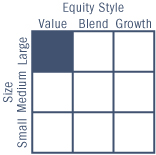
The Morningstar Style BoxTM is based on a fund's portfolio holdings. For equity funds, the vertical axis shows the market capitalization of the stocks owned, and the horizontal axis shows investment style (value, blend, or growth). Information shown is based on the most recent data provided by Morningstar.
©2016 Morningstar, Inc. All rights reserved. The Morningstar information contained herein: (1) is proprietary to Morningstar and/or its content providers; (2) may not be copied or distributed; and (3) is not warranted to be accurate, complete or timely. Neither Morningstar nor its content providers are responsible for any damages or losses arising from any use of this information.
Annual Report 2016
5
COLUMBIA GLOBAL ENERGY AND NATURAL RESOURCES FUND
MANAGER DISCUSSION OF FUND PERFORMANCE (continued)
Top Ten Holdings (%)
(at August 31, 2016) | |
Exxon Mobil Corp.
(United States) | | | 11.1 | | |
Royal Dutch Shell PLC, Class A
(United Kingdom) | | | 5.4 | | |
BP PLC (United Kingdom) | | | 4.1 | | |
Chevron Corp. (United States) | | | 3.2 | | |
Schlumberger Ltd.
(United States) | | | 3.1 | | |
Dow Chemical Co. (The)
(United States) | | | 3.0 | | |
PPG Industries, Inc.
(United States) | | | 2.8 | | |
Suncor Energy, Inc. (Canada) | | | 2.7 | | |
VanEck Vectors Gold Miners ETF
(United States) | | | 2.7 | | |
Eastman Chemical Co.
(United States) | | | 2.5 | | |
Percentages indicated are based upon total investments (excluding Money Market Funds).
For further detail about these holdings, please refer to the section entitled "Portfolio of Investments."
Fund holdings are as of the date given, are subject to change at any time, and are not recommendations to buy or sell any security.
Country Breakdown (%)
(at August 31, 2016) | |
Australia | | | 0.5 | | |
Belgium | | | 0.9 | | |
Canada | | | 8.5 | | |
France | | | 4.0 | | |
Germany | | | 2.2 | | |
Ireland | | | 0.3 | | |
Netherlands | | | 2.5 | | |
Switzerland | | | 1.2 | | |
United Kingdom | | | 13.1 | | |
United States(a) | | | 66.8 | | |
Total | | | 100.0 | | |
Country Breakdown is based primarily on issuer's place of organization/incorporation. Percentages indicated are based upon total investments. The Fund's portfolio composition is subject to change.
The Fund may use place of organization/incorporation or other in determining whether an issuer is domestic (U.S.) or foreign for purposes of its investment policies. At August 31, 2016, the Fund invested 50.5% in foreign companies in accordance with its principal investment strategy.
(a) Includes investments in Money Market Funds and Exchange-Traded Funds.
company ruffled investors, and shares of both companies suffered sharp declines.
Materials stocks outperformed relative to the Blended Index, with particularly solid gains from chemical and metals and mining holdings. Within chemicals, Albemarle shares rallied as investors continued to gain an appreciation for the potential of lithium, used in electric vehicle batteries, and one of the company's key products. Within metals, domestic steel producer Steel Dynamics benefited from higher prices. An overweight in Eastman Chemical detracted from Fund results as competitive pressures increased.
Fund Positioning
Within energy, we made continuous adjustments to positioning. We reduced exposure to mid-stream companies, integrated oils and, to a lesser extent, independent refiners. We used the proceeds of these transactions to increase exposure to domestic E&P companies. Within materials, we added some risk to the Fund last year with the addition of cyclical names such as Alcoa and Steel Dynamics. That was a drag on performance early in 2016, but we more than made up for it as the stocks rallied later in the year. As valuations rose, we trimmed metals positions and added to names that we think offer a more reasonable combination of growth and value. Overall, we have incrementally shifted the Fund to a more middle ground, aiming to underweight stocks whose valuations, in our estimation, have grown rich, and cyclical commodity stocks, which have run up with rising commodity prices.
Annual Report 2016
6
COLUMBIA GLOBAL ENERGY AND NATURAL RESOURCES FUND
MANAGER DISCUSSION OF FUND PERFORMANCE (continued)
Equity Sector Breakdown (%)
(at August 31, 2016) | |
Energy | | | 63.1 | | |
Materials | | | 36.9 | | |
Total | | | 100.0 | | |
Percentages indicated are based upon total equity investments. The Fund's portfolio composition is subject to change.
Summary of Investments in Securities
by Industry (%)
(at August 31, 2016) | |
Chemicals | | | 24.6 | | |
Construction Materials | | | 0.6 | | |
Containers & Packaging | | | 2.6 | | |
Diversified Financial Services | | | 3.4 | | |
Energy Equipment & Services | | | 6.2 | | |
Metals & Mining | | | 7.4 | | |
Oil, Gas & Consumable Fuels | | | 54.0 | | |
Money Market Funds | | | 1.0 | | |
Total | | | 99.8 | | |
Percentages indicated are based upon net assets. The Fund's portfolio composition is subject to change.
Investment Risks
Market risk may affect a single issuer, sector of the economy, industry or the market as a whole. Foreign investments subject the Fund to risks, including political, economic, market, social and others within a particular country, as well as to currency instabilities and less stringent financial and accounting standards generally applicable to U.S. issuers. Investing in derivatives is a specialized activity that involves special risks that subject the Fund to significant loss potential, including when used as leverage, and may result in greater fluctuation in fund value. Issuers engaged in the energy and natural resources industry may be subject to legislative or regulatory changes, adverse market conditions and/or increased competition. The values of natural resources are affected by numerous factors including naturally occurring events, demand, inflation, interest rates, and local and international politics. As a non-diversified fund, fewer investments could have a greater effect on performance. See the Fund's prospectus for information on these and other risks.
Annual Report 2016
7
COLUMBIA GLOBAL ENERGY AND NATURAL RESOURCES FUND
UNDERSTANDING YOUR FUND'S EXPENSES
(Unaudited)
As an investor, you incur two types of costs. There are transaction costs, which generally include sales charges on purchases and may include redemption fees. There are also ongoing costs, which generally include management fees, distribution and/or service fees, and other fund expenses. The following information is intended to help you understand your ongoing costs (in dollars) of investing in the Fund and to help you compare these costs with the ongoing costs of investing in other mutual funds.
Analyzing Your Fund's Expenses
To illustrate these ongoing costs, we have provided examples and calculated the expenses paid by investors in each share class of the Fund during the period. The actual and hypothetical information in the table is based on an initial investment of $1,000 at the beginning of the period indicated and held for the entire period. Expense information is calculated two ways and each method provides you with different information. The amount listed in the "Actual" column is calculated using the Fund's actual operating expenses and total return for the period. You may use the Actual information, together with the amount invested, to estimate the expenses that you paid over the period. Simply divide your account value by $1,000 (for example, an $8,600 account value divided by $1,000 = 8.6), then multiply the results by the expenses paid during the period under the "Actual" column. The amount listed in the "Hypothetical" column assumes a 5% annual rate of return before expenses (which is not the Fund's actual return) and then applies the Fund's actual expense ratio for the period to the hypothetical return. You should not use the hypothetical account values and expenses to estimate either your actual account balance at the end of the period or the expenses you paid during the period. See "Compare With Other Funds" below for details on how to use the hypothetical data.
Compare With Other Funds
Since all mutual funds are required to include the same hypothetical calculations about expenses in shareholder reports, you can use this information to compare the ongoing cost of investing in the Fund with other funds. To do so, compare the hypothetical example with the 5% hypothetical examples that appear in the shareholder reports of other funds. As you compare hypothetical examples of other funds, it is important to note that hypothetical examples are meant to highlight the ongoing costs of investing in a fund only and do not reflect any transaction costs, such as sales charges, or redemption or exchange fees. Therefore, the hypothetical calculations are useful in comparing ongoing costs only, and will not help you determine the relative total costs of owning different funds. If transaction costs were included in these calculations, your costs would be higher.
March 1, 2016 – August 31, 2016
| | | Account Value at the Beginning
of the Period ($) | | Account Value at the End of the
Period ($) | | Expenses Paid During the
Period ($) | | Fund's Annualized
Expense Ratio (%) | |
| | | Actual | | Hypothetical | | Actual | | Hypothetical | | Actual | | Hypothetical | | Actual | |
Class A | | | 1,000.00 | | | | 1,000.00 | | | | 1,186.00 | | | | 1,018.50 | | | | 7.25 | | | | 6.70 | | | | 1.32 | | |
Class B | | | 1,000.00 | | | | 1,000.00 | | | | 1,181.40 | | | | 1,014.73 | | | | 11.35 | | | | 10.48 | | | | 2.07 | | |
Class C | | | 1,000.00 | | | | 1,000.00 | | | | 1,181.40 | | | | 1,014.73 | | | | 11.35 | | | | 10.48 | | | | 2.07 | | |
Class I | | | 1,000.00 | | | | 1,000.00 | | | | 1,189.30 | | | | 1,020.81 | | | | 4.73 | | | | 4.37 | | | | 0.86 | | |
Class K | | | 1,000.00 | | | | 1,000.00 | | | | 1,186.40 | | | | 1,019.25 | | | | 6.43 | | | | 5.94 | | | | 1.17 | | |
Class R | | | 1,000.00 | | | | 1,000.00 | | | | 1,184.10 | | | | 1,017.24 | | | | 8.62 | | | | 7.96 | | | | 1.57 | | |
Class R4 | | | 1,000.00 | | | | 1,000.00 | | | | 1,187.90 | | | | 1,019.76 | | | | 5.88 | | | | 5.43 | | | | 1.07 | | |
Class R5 | | | 1,000.00 | | | | 1,000.00 | | | | 1,188.60 | | | | 1,020.56 | | | | 5.01 | | | | 4.62 | | | | 0.91 | | |
Class Z | | | 1,000.00 | | | | 1,000.00 | | | | 1,187.50 | | | | 1,019.76 | | | | 5.88 | | | | 5.43 | | | | 1.07 | | |
Expenses paid during the period are equal to the annualized expense ratio for each class as indicated above, multiplied by the average account value over the period and then multiplied by the number of days in the Fund's most recent fiscal half year and divided by 366.
Expenses do not include fees and expenses incurred indirectly by the Fund from its investment in underlying funds, including affiliated and non-affiliated pooled investment vehicles, such as mutual funds and exchange-traded funds.
Annual Report 2016
8
COLUMBIA GLOBAL ENERGY AND NATURAL RESOURCES FUND
PORTFOLIO OF INVESTMENTS
August 31, 2016
(Percentages represent value of investments compared to net assets)
Common Stocks 93.9%
Issuer | | Shares | | Value ($) | |
AUSTRALIA 0.4% | |
Tronox Ltd., Class A | | | 122,397 | | | | 1,117,485 | | |
BELGIUM 0.9% | |
Solvay SA | | | 20,137 | | | | 2,210,468 | | |
CANADA 8.5% | |
Canadian Natural Resources Ltd. | | | 122,511 | | | | 3,804,997 | | |
Canadian Natural Resources Ltd. | | | 53,638 | | | | 1,665,460 | | |
Enbridge, Inc. | | | 32,716 | | | | 1,290,279 | | |
First Quantum Minerals Ltd. | | | 143,277 | | | | 1,085,995 | | |
Methanex Corp. | | | 39,473 | | | | 1,144,717 | | |
Silver Wheaton Corp. | | | 52,617 | | | | 1,332,789 | | |
Suncor Energy, Inc. | | | 244,241 | | | | 6,622,853 | | |
Suncor Energy, Inc. | | | 44,806 | | | | 1,214,691 | | |
Tourmaline Oil Corp.(a) | | | 45,200 | | | | 1,271,142 | | |
TransCanada Corp. | | | 31,372 | | | | 1,422,672 | | |
Total | | | | | 20,855,595 | | |
FRANCE 4.0% | |
Air Liquide SA | | | 20,963 | | | | 2,299,268 | | |
Arkema SA | | | 21,740 | | | | 1,940,719 | | |
Total SA | | | 118,263 | | | | 5,639,430 | | |
Total | | | | | 9,879,417 | | |
GERMANY 2.2% | |
BASF SE | | | 67,288 | | | | 5,471,612 | | |
IRELAND 0.3% | |
Weatherford International PLC(a) | | | 137,357 | | | | 751,343 | | |
NETHERLANDS 2.5% | |
Akzo Nobel NV | | | 48,387 | | | | 3,269,702 | | |
LyondellBasell Industries NV, Class A | | | 36,541 | | | | 2,882,719 | | |
Total | | | | | 6,152,421 | | |
SWITZERLAND 1.2% | |
Clariant AG, Registered Shares | | | 93,778 | | | | 1,633,284 | | |
LafargeHolcim Ltd. | | | 26,002 | | | | 1,376,672 | | |
Total | | | | | 3,009,956 | | |
UNITED KINGDOM 13.1% | |
| BP PLC | | | 1,787,458 | | | | 10,043,666 | | |
| BP PLC, ADR | | | 8,173 | | | | 276,738 | | |
Common Stocks (continued)
Issuer | | Shares | | Value ($) | |
Cairn Energy PLC(a) | | | 326,376 | | | | 795,874 | | |
Ophir Energy PLC(a) | | | 289,714 | | | | 280,573 | | |
Randgold Resources Ltd. | | | 20,286 | | | | 1,904,656 | | |
Rio Tinto PLC | | | 192,021 | | | | 5,802,023 | | |
Rio Tinto PLC, ADR | | | 139 | | | | 4,193 | | |
Royal Dutch Shell PLC, Class A | | | 538,969 | | | | 13,167,629 | | |
Total | | | | | 32,275,352 | | |
UNITED STATES 60.8% | |
Albemarle Corp. | | | 45,117 | | | | 3,608,007 | | |
Alcoa, Inc. | | | 223,364 | | | | 2,251,509 | | |
Anadarko Petroleum Corp. | | | 81,593 | | | | 4,362,778 | | |
Atwood Oceanics, Inc. | | | 32,750 | | | | 258,725 | | |
Baker Hughes, Inc. | | | 29,855 | | | | 1,466,776 | | |
Cabot Oil & Gas Corp. | | | 62,152 | | | | 1,530,804 | | |
Cheniere Energy, Inc.(a) | | | 14,572 | | | | 625,139 | | |
Chevron Corp. | | | 77,529 | | | | 7,797,867 | | |
Cimarex Energy Co. | | | 10,926 | | | | 1,444,199 | | |
Cobalt International Energy, Inc.(a) | | | 93,096 | | | | 111,715 | | |
ConocoPhillips | | | 55,900 | | | | 2,294,695 | | |
Continental Resources, Inc.(a) | | | 23,545 | | | | 1,129,218 | | |
Delek U.S. Holdings, Inc. | | | 27,355 | | | | 480,080 | | |
Devon Energy Corp. | | | 107,230 | | | | 4,646,276 | | |
Dow Chemical Co. (The) | | | 134,938 | | | | 7,238,074 | | |
Eastman Chemical Co. | | | 89,206 | | | | 6,056,195 | | |
EI du Pont de Nemours & Co. | | | 56,359 | | | | 3,922,586 | | |
EOG Resources, Inc. | | | 37,239 | | | | 3,295,279 | | |
EQT Corp. | | | 26,359 | | | | 1,884,669 | | |
Exxon Mobil Corp. | | | 311,535 | | | | 27,147,160 | | |
FMC Technologies, Inc.(a) | | | 28,882 | | | | 814,472 | | |
Halliburton Co. | | | 87,085 | | | | 3,745,526 | | |
Hess Corp. | | | 47,593 | | | | 2,584,300 | | |
International Paper Co. | | | 44,775 | | | | 2,171,140 | | |
Kinder Morgan, Inc. | | | 179,957 | | | | 3,932,060 | | |
Marathon Petroleum Corp. | | | 36,734 | | | | 1,561,562 | | |
Monsanto Co. | | | 27,668 | | | | 2,946,642 | | |
Mosaic Co. (The) | | | 93,713 | | | | 2,817,950 | | |
Noble Energy, Inc. | | | 74,437 | | | | 2,566,588 | | |
Nucor Corp. | | | 51,970 | | | | 2,521,065 | | |
The accompanying Notes to Financial Statements are an integral part of this statement.
Annual Report 2016
9
COLUMBIA GLOBAL ENERGY AND NATURAL RESOURCES FUND
PORTFOLIO OF INVESTMENTS (continued)
August 31, 2016
Common Stocks (continued)
Issuer | | Shares | | Value ($) | |
Occidental Petroleum Corp. | | | 77,396 | | | | 5,947,883 | | |
Patterson-UTI Energy, Inc. | | | 39,368 | | | | 767,282 | | |
PBF Energy, Inc., Class A | | | 21,407 | | | | 468,813 | | |
Phillips 66 | | | 36,080 | | | | 2,830,476 | | |
PPG Industries, Inc. | | | 64,712 | | | | 6,851,707 | | |
Praxair, Inc. | | | 43,559 | | | | 5,315,940 | | |
Schlumberger Ltd. | | | 94,520 | | | | 7,467,080 | | |
Sealed Air Corp. | | | 88,653 | | | | 4,178,216 | | |
Spectra Energy Corp. | | | 29,987 | | | | 1,068,137 | | |
Steel Dynamics, Inc. | | | 137,408 | | | | 3,382,985 | | |
Tesoro Corp. | | | 7,974 | | | | 601,399 | | |
Valero Energy Corp. | | | 50,247 | | | | 2,781,171 | | |
Williams Companies, Inc. (The) | | | 34,573 | | | | 965,970 | | |
Total | | | | | 149,840,115 | | |
Total Common Stocks
(Cost: $226,404,621) | | | | | 231,563,764 | | |
Exchange-Traded Funds 3.4% | |
| | | Shares | | Value ($) | |
Energy Select Sector SPDR Fund | | | 14,581 | | | | 999,382 | | |
Materials Select Sector SPDR Fund | | | 15,787 | | | | 767,564 | | |
VanEck Vectors Gold Miners ETF | | | 258,082 | | | | 6,568,187 | | |
Total Exchange-Traded Funds
(Cost: $5,428,059) | | | | | 8,335,133 | | |
Warrants —%
Issuer | | Shares | | Value ($) | |
UNITED STATES —% | |
Kinder Morgan, Inc.(a) | | | 271,934 | | | | 5,167 | | |
Total Warrants
(Cost: $1,384,619) | | | | | 5,167 | | |
Limited Partnerships 1.5% | |
UNITED STATES 1.5% | |
Enterprise Products Partners LP | | | 60,663 | | | | 1,601,503 | | |
PBF Logistics LP | | | 42,440 | | | | 861,108 | | |
Plains GP Holdings LP, Class A | | | 104,704 | | | | 1,191,531 | | |
Total | | | | | 3,654,142 | | |
Total Limited Partnerships
(Cost: $4,503,377) | | | | | 3,654,142 | | |
Money Market Funds 1.0% | |
| | | Shares | | Value ($) | |
Columbia Short-Term Cash Fund,
0.415%(b)(c) | | | 2,417,147 | | | | 2,417,147 | | |
Total Money Market Funds
(Cost: $2,417,147) | | | | | 2,417,147 | | |
Total Investments
(Cost: $240,137,823) | | | | | 245,975,353 | | |
Other Assets & Liabilities, Net | | | | | 497,953 | | |
Net Assets | | | | | 246,473,306 | | |
Notes to Portfolio of Investments
(a) Non-income producing investment.
(b) The rate shown is the seven-day current annualized yield at August 31, 2016.
(c) As defined in the Investment Company Act of 1940, an affiliated company is one in which the Fund owns 5% or more of the company's outstanding voting securities, or a company which is under common ownership or control with the Fund. Holdings and transactions in these affiliated companies during the year ended August 31, 2016 are as follows:
Issuer | | Beginning
Cost ($) | | Purchase
Cost ($) | | Proceeds
From Sales ($) | | Ending
Cost ($) | | Dividends —
Affiliated
Issuers ($) | | Value ($) | |
Columbia Short-Term Cash Fund | | | 5,919,492 | | | | 74,700,000 | | | | (78,202,345 | ) | | | 2,417,147 | | | | 11,764 | | | | 2,417,147 | | |
Abbreviation Legend
ADR American Depositary Receipt
The accompanying Notes to Financial Statements are an integral part of this statement.
Annual Report 2016
10
COLUMBIA GLOBAL ENERGY AND NATURAL RESOURCES FUND
PORTFOLIO OF INVESTMENTS (continued)
August 31, 2016
Fair Value Measurements
The Fund categorizes its fair value measurements according to a three-level hierarchy that maximizes the use of observable inputs and minimizes the use of unobservable inputs by prioritizing that the most observable input be used when available. Observable inputs are those that market participants would use in pricing an investment based on market data obtained from sources independent of the reporting entity. Unobservable inputs are those that reflect the Fund's assumptions about the information market participants would use in pricing an investment. An investment's level within the fair value hierarchy is based on the lowest level of any input that is deemed significant to the asset's or liability's fair value measurement. The input levels are not necessarily an indication of the risk or liquidity associated with investments at that level. For example, certain U.S. government securities are generally high quality and liquid, however, they are reflected as Level 2 because the inputs used to determine fair value may not always be quoted prices in an active market.
Fair value inputs are summarized in the three broad levels listed below:
> Level 1 — Valuations based on quoted prices for investments in active markets that the Fund has the ability to access at the measurement date (including NAV for open-end mutual funds). Valuation adjustments are not applied to Level 1 investments.
> Level 2 — Valuations based on other significant observable inputs (including quoted prices for similar securities, interest rates, prepayment speeds, credit risks, etc.).
> Level 3 — Valuations based on significant unobservable inputs (including the Fund's own assumptions and judgment in determining the fair value of investments).
Inputs that are used in determining fair value of an investment may include price information, credit data, volatility statistics, and other factors. These inputs can be either observable or unobservable. The availability of observable inputs can vary between investments, and is affected by various factors such as the type of investment, and the volume and level of activity for that investment or similar investments in the marketplace. The inputs will be considered by the Investment Manager, along with any other relevant factors in the calculation of an investment's fair value. The Fund uses prices and inputs that are current as of the measurement date, which may include periods of market dislocations. During these periods, the availability of prices and inputs may be reduced for many investments. This condition could cause an investment to be reclassified between the various levels within the hierarchy.
Foreign equity securities actively traded in markets where there is a significant delay in the local close relative to the New York Stock Exchange (NYSE) are classified as Level 2. The values of these securities may include an adjustment to reflect the impact of significant market movements following the close of local trading, as described in Note 2 to the financial statements — Security Valuation.
Certain investments that have been measured at fair value using the net asset value per share (or its equivalent) are not categorized in the fair value hierarchy. The fair value amounts presented in the table are intended to reconcile the fair value hierarchy to the amounts presented in the Portfolio of Investments. The Columbia Short-Term Cash Fund seeks to provide shareholders with maximum current income consistent with liquidity and stability of principal. Investments in Columbia Short-Term Cash Fund may be redeemed on a daily basis without restriction.
Investments falling into the Level 3 category are primarily supported by quoted prices from brokers and dealers participating in the market for those investments. However, these may be classified as Level 3 investments due to lack of market transparency and corroboration to support these quoted prices. Additionally, valuation models may be used as the pricing source for any remaining investments classified as Level 3. These models may rely on one or more significant unobservable inputs and/or significant assumptions by the Investment Manager. Inputs used in valuations may include, but are not limited to, financial statement analysis, capital account balances, discount rates and estimated cash flows, and comparable company data.
Under the direction of the Fund's Board of Trustees (the Board), the Investment Manager's Valuation Committee (the Committee) is responsible for overseeing the valuation procedures approved by the Board. The Committee consists of voting and non-voting members from various groups within the Investment Manager's organization, including operations and accounting, trading and investments, compliance, risk management and legal.
The Committee meets at least monthly to review and approve valuation matters, which may include a description of specific valuation determinations, data regarding pricing information received from approved pricing vendors and brokers and the results of Board-approved valuation control policies and procedures (the Policies). The Policies address, among other things, instances when market quotations are or are not readily available, including recommendations of third party pricing vendors and a determination of appropriate pricing methodologies; events that require specific valuation determinations and assessment of fair value techniques; securities with a potential for stale pricing, including those that are illiquid, restricted, or in default; and the effectiveness of third party pricing vendors, including periodic reviews of vendors. The Committee meets more frequently, as needed, to discuss additional valuation matters, which may include the need to review back-testing results, review time-sensitive information or approve related valuation actions. The Committee reports to the Board, with members of the Committee meeting with the Board at each of its regularly scheduled meetings to discuss valuation matters and actions during the period, similar to those described earlier.
For investments categorized as Level 3, the Committee monitors information similar to that described above, which may include: (i) data specific to the issuer or comparable issuers, (ii) general market or specific sector news and (iii) quoted prices and specific or similar security transactions. The Committee considers this data and any changes from prior periods in order to assess the reasonableness of observable and unobservable inputs, any assumptions or internal models used to value those securities and changes in fair value. This data is also used to corroborate, when available, information received from approved pricing vendors and brokers. Various factors impact the frequency of monitoring this information (which may occur as often as daily). However, the Committee may determine that changes to inputs, assumptions and models are not required as a result of the monitoring procedures performed.
The accompanying Notes to Financial Statements are an integral part of this statement.
Annual Report 2016
11
COLUMBIA GLOBAL ENERGY AND NATURAL RESOURCES FUND
PORTFOLIO OF INVESTMENTS (continued)
August 31, 2016
Fair Value Measurements (continued)
The following table is a summary of the inputs used to value the Fund's investments at August 31, 2016:
| | | Level 1
Quoted Prices in Active
Markets for Identical
Assets ($) | | Level 2
Other Significant
Observable Inputs ($) | | Level 3
Significant
Unobservable Inputs ($) | | Total ($) | |
Investments | |
Common Stocks | |
Australia | | | 1,117,485 | | | | — | | | | — | | | | 1,117,485 | | |
Belgium | | | — | | | | 2,210,468 | | | | — | | | | 2,210,468 | | |
Canada | | | 20,855,595 | | | | — | | | | — | | | | 20,855,595 | | |
France | | | — | | | | 9,879,417 | | | | — | | | | 9,879,417 | | |
Germany | | | — | | | | 5,471,612 | | | | — | | | | 5,471,612 | | |
Ireland | | | 751,343 | | | | — | | | | — | | | | 751,343 | | |
Netherlands | | | 2,882,719 | | | | 3,269,702 | | | | — | | | | 6,152,421 | | |
Switzerland | | | — | | | | 3,009,956 | | | | — | | | | 3,009,956 | | |
United Kingdom | | | 280,931 | | | | 31,994,421 | | | | — | | | | 32,275,352 | | |
United States | | | 149,840,115 | | | | — | | | | — | | | | 149,840,115 | | |
Total Common Stocks | | | 175,728,188 | | | | 55,835,576 | | | | — | | | | 231,563,764 | | |
Exchange-Traded Funds | | | 8,335,133 | | | | — | | | | — | | | | 8,335,133 | | |
Warrants | |
United States | | | 5,167 | | | | — | | | | — | | | | 5,167 | | |
Limited Partnerships | |
United States | | | 3,654,142 | | | | — | | | | — | | | | 3,654,142 | | |
Money Market Funds | | | — | | | | — | | | | — | | | | 2,417,147 | | |
Total Investments | | | 187,722,630 | | | | 55,835,576 | | | | — | | | | 245,975,353 | | |
See the Portfolio of Investments for all investment classifications not indicated in the table.
The Fund's assets assigned to the Level 2 input category are generally valued using the market approach, in which a security's value is determined through reference to prices and information from market transactions for similar or identical assets. These assets include certain foreign securities for which a third party statistical pricing service may be employed for purposes of fair market valuation. The model utilized by such third party statistical pricing service takes into account a security's correlation to available market data including, but not limited to, intraday index, ADR, and exchange-traded fund movements.
There were no transfers of financial assets between levels during the period.
The accompanying Notes to Financial Statements are an integral part of this statement.
Annual Report 2016
12
COLUMBIA GLOBAL ENERGY AND NATURAL RESOURCES FUND
STATEMENT OF ASSETS AND LIABILITIES
August 31, 2016
Assets | |
Investments, at value | |
Unaffiliated issuers (identified cost $237,720,676) | | $ | 243,558,206 | | |
Affiliated issuers (identified cost $2,417,147) | | | 2,417,147 | | |
Total investments (identified cost $240,137,823) | | | 245,975,353 | | |
Receivable for: | |
Capital shares sold | | | 139,896 | | |
Dividends | | | 1,034,163 | | |
Foreign tax reclaims | | | 83,897 | | |
Prepaid expenses | | | 2,218 | | |
Trustees' deferred compensation plan | | | 39,238 | | |
Total assets | | | 247,274,765 | | |
Liabilities | |
Payable for: | |
Capital shares purchased | | | 664,025 | | |
Management services fees | | | 5,132 | | |
Distribution and/or service fees | | | 1,228 | | |
Transfer agent fees | | | 37,011 | | |
Plan administration fees | | | 1 | | |
Compensation of board members | | | 191 | | |
Chief compliance officer expenses | | | 20 | | |
Other expenses | | | 54,613 | | |
Trustees' deferred compensation plan | | | 39,238 | | |
Total liabilities | | | 801,459 | | |
Net assets applicable to outstanding capital stock | | $ | 246,473,306 | | |
Represented by | |
Paid-in capital | | $ | 270,167,692 | | |
Undistributed net investment income | | | 860,749 | | |
Accumulated net realized loss | | | (30,393,061 | ) | |
Unrealized appreciation (depreciation) on: | |
Investments | | | 5,837,530 | | |
Foreign currency translations | | | 396 | | |
Total — representing net assets applicable to outstanding capital stock | | $ | 246,473,306 | | |
The accompanying Notes to Financial Statements are an integral part of this statement.
Annual Report 2016
13
COLUMBIA GLOBAL ENERGY AND NATURAL RESOURCES FUND
STATEMENT OF ASSETS AND LIABILITIES (continued)
August 31, 2016
Class A | |
Net assets | | $ | 98,565,991 | | |
Shares outstanding | | | 5,876,091 | | |
Net asset value per share | | $ | 16.77 | | |
Maximum offering price per share(a) | | $ | 17.79 | | |
Class B | |
Net assets | | $ | 552,377 | | |
Shares outstanding | | | 34,764 | | |
Net asset value per share | | $ | 15.89 | | |
Class C | |
Net assets | | $ | 15,456,616 | | |
Shares outstanding | | | 972,510 | | |
Net asset value per share | | $ | 15.89 | | |
Class I | |
Net assets | | $ | 18,169,549 | | |
Shares outstanding | | | 1,063,258 | | |
Net asset value per share | | $ | 17.09 | | |
Class K | |
Net assets | | $ | 5,279 | | |
Shares outstanding | | | 312 | | |
Net asset value per share(b) | | $ | 16.93 | | |
Class R | |
Net assets | | $ | 7,031,338 | | |
Shares outstanding | | | 421,988 | | |
Net asset value per share | | $ | 16.66 | | |
Class R4 | |
Net assets | | $ | 7,890,105 | | |
Shares outstanding | | | 457,239 | | |
Net asset value per share | | $ | 17.26 | | |
Class R5 | |
Net assets | | $ | 6,557,516 | | |
Shares outstanding | | | 378,315 | | |
Net asset value per share | | $ | 17.33 | | |
Class Z | |
Net assets | | $ | 92,244,535 | | |
Shares outstanding | | | 5,436,863 | | |
Net asset value per share | | $ | 16.97 | | |
(a) The maximum offering price per share is calculated by dividing the net asset value per share by 1.0 minus the maximum sales charge of 5.75%.
(b) Net asset value per share rounds to this amount due to fractional shares outstanding.
The accompanying Notes to Financial Statements are an integral part of this statement.
Annual Report 2016
14
COLUMBIA GLOBAL ENERGY AND NATURAL RESOURCES FUND
STATEMENT OF OPERATIONS
Year Ended August 31, 2016
Net investment income | |
Income: | |
Dividends — unaffiliated issuers | | $ | 8,376,052 | | |
Dividends — affiliated issuers | | | 11,764 | | |
Foreign taxes withheld | | | (326,139 | ) | |
Total income | | | 8,061,677 | | |
Expenses: | |
Management services fees | | | 1,773,856 | | |
Distribution and/or service fees | |
Class A | | | 227,547 | | |
Class B | | | 6,868 | | |
Class C | | | 146,575 | | |
Class R | | | 24,563 | | |
Transfer agent fees | |
Class A | | | 204,225 | | |
Class B | | | 1,554 | | |
Class C | | | 32,980 | | |
Class K | | | 2 | | |
Class R | | | 10,958 | | |
Class R4 | | | 15,454 | | |
Class R5 | | | 2,629 | | |
Class Z | | | 204,234 | | |
Plan administration fees | |
Class K | | | 12 | | |
Compensation of board members | | | 20,073 | | |
Custodian fees | | | 21,732 | | |
Printing and postage fees | | | 52,161 | | |
Registration fees | | | 113,547 | | |
Audit fees | | | 30,103 | | |
Legal fees | | | 6,345 | | |
Chief compliance officer expenses | | | 112 | | |
Other | | | 14,451 | | |
Total expenses | | | 2,909,981 | | |
Expense reductions | | | (1,980 | ) | |
Total net expenses | | | 2,908,001 | | |
Net investment income | | | 5,153,676 | | |
Realized and unrealized gain (loss) — net | |
Net realized gain (loss) on: | |
Investments | | | (26,750,709 | ) | |
Foreign currency translations | | | (113,064 | ) | |
Forward foreign currency exchange contracts | | | 315,232 | | |
Net realized loss | | | (26,548,541 | ) | |
Net change in unrealized appreciation (depreciation) on: | |
Investments | | | 34,210,844 | | |
Foreign currency translations | | | 14,754 | | |
Net change in unrealized appreciation | | | 34,225,598 | | |
Net realized and unrealized gain | | | 7,677,057 | | |
Net increase in net assets resulting from operations | | $ | 12,830,733 | | |
The accompanying Notes to Financial Statements are an integral part of this statement.
Annual Report 2016
15
COLUMBIA GLOBAL ENERGY AND NATURAL RESOURCES FUND
STATEMENT OF CHANGES IN NET ASSETS
| | | Year Ended
August 31,
2016 | | Year Ended
August 31,
2015 | |
Operations | |
Net investment income | | $ | 5,153,676 | | | $ | 4,830,137 | | |
Net realized loss | | | (26,548,541 | ) | | | (7,392,937 | ) | |
Net change in unrealized appreciation (depreciation) | | | 34,225,598 | | | | (113,433,870 | ) | |
Net increase (decrease) in net assets resulting from operations | | | 12,830,733 | | | | (115,996,670 | ) | |
Distributions to shareholders | |
Net investment income | |
Net realized gains | |
Class A | | | — | | | | (6,713,299 | ) | |
Class B | | | — | | | | (122,869 | ) | |
Class C | | | — | | | | (1,012,641 | ) | |
Class I | | | — | | | | (2,383,969 | ) | |
Class K | | | — | | | | (558 | ) | |
Class R | | | — | | | | (153,897 | ) | |
Class R4 | | | — | | | | (640,129 | ) | |
Class R5 | | | — | | | | (284,327 | ) | |
Class Z | | | — | | | | (9,288,249 | ) | |
Total distributions to shareholders | | | — | | | | (20,599,938 | ) | |
Increase (decrease) in net assets from capital stock activity | | | (17,630,870 | ) | | | 939,387 | | |
Total decrease in net assets | | | (4,800,137 | ) | | | (135,657,221 | ) | |
Net assets at beginning of year | | | 251,273,443 | | | | 386,930,664 | | |
Net assets at end of year | | $ | 246,473,306 | | | $ | 251,273,443 | | |
Undistributed (excess of distributions over) net investment income | | $ | 860,749 | | | $ | (4,297,035 | ) | |
The accompanying Notes to Financial Statements are an integral part of this statement.
Annual Report 2016
16
COLUMBIA GLOBAL ENERGY AND NATURAL RESOURCES FUND
STATEMENT OF CHANGES IN NET ASSETS (continued)
| | | Year Ended August 31, 2016 | | Year Ended August 31, 2015 | |
| | | Shares | | Dollars ($) | | Shares | | Dollars ($) | |
Capital stock activity | |
Class A shares | |
Subscriptions(a) | | | 3,378,861 | | | | 52,411,407 | | | | 1,789,737 | | | | 33,413,364 | | |
Distributions reinvested | | | — | | | | — | | | | 375,496 | | | | 6,544,893 | | |
Redemptions | | | (2,922,740 | ) | | | (45,992,961 | ) | | | (1,977,843 | ) | | | (38,846,445 | ) | |
Net increase | | | 456,121 | | | | 6,418,446 | | | | 187,390 | | | | 1,111,812 | | |
Class B shares | |
Subscriptions | | | 1,852 | | | | 25,884 | | | | 6,165 | | | | 108,825 | | |
Distributions reinvested | | | — | | | | — | | | | 6,765 | | | | 113,113 | | |
Redemptions(a) | | | (32,123 | ) | | | (472,365 | ) | | | (45,257 | ) | | | (823,555 | ) | |
Net decrease | | | (30,271 | ) | | | (446,481 | ) | | | (32,327 | ) | | | (601,617 | ) | |
Class C shares | |
Subscriptions | | | 288,730 | | | | 4,167,002 | | | | 431,553 | | | | 7,524,091 | | |
Distributions reinvested | | | — | | | | — | | | | 55,511 | | | | 928,699 | | |
Redemptions | | | (267,212 | ) | | | (3,907,041 | ) | | | (230,818 | ) | | | (4,108,184 | ) | |
Net increase | | | 21,518 | | | | 259,961 | | | | 256,246 | | | | 4,344,606 | | |
Class I shares | |
Subscriptions | | | 35,261 | | | | 597,289 | | | | 446,103 | | | | 7,956,038 | | |
Distributions reinvested | | | — | | | | — | | | | 135,365 | | | | 2,383,782 | | |
Redemptions | | | (1,184,581 | ) | | | (17,912,630 | ) | | | (24,829 | ) | | | (439,951 | ) | |
Net increase (decrease) | | | (1,149,320 | ) | | | (17,315,341 | ) | | | 556,639 | | | | 9,899,869 | | |
Class K shares | |
Distributions reinvested | | | — | | | | — | | | | 23 | | | | 396 | | |
Redemptions | | | — | | | | — | | | | (2,867 | ) | | | (58,913 | ) | |
Net (decrease) | | | — | | | | — | | | | (2,844 | ) | | | (58,517 | ) | |
Class R shares | |
Subscriptions | | | 372,218 | | | | 5,735,638 | | | | 121,559 | | | | 2,260,130 | | |
Distributions reinvested | | | — | | | | — | | | | 8,850 | | | | 153,897 | | |
Redemptions | | | (142,602 | ) | | | (2,252,951 | ) | | | (63,594 | ) | | | (1,292,285 | ) | |
Net increase | | | 229,616 | | | | 3,482,687 | | | | 66,815 | | | | 1,121,742 | | |
Class R4 shares | |
Subscriptions | | | 495,439 | | | | 7,828,276 | | | | 196,943 | | | | 3,790,078 | | |
Distributions reinvested | | | — | | | | — | | | | 35,853 | | | | 639,975 | | |
Redemptions | | | (479,252 | ) | | | (7,592,219 | ) | | | (297,272 | ) | | | (5,758,896 | ) | |
Net increase (decrease) | | | 16,187 | | | | 236,057 | | | | (64,476 | ) | | | (1,328,843 | ) | |
The accompanying Notes to Financial Statements are an integral part of this statement.
Annual Report 2016
17
COLUMBIA GLOBAL ENERGY AND NATURAL RESOURCES FUND
STATEMENT OF CHANGES IN NET ASSETS (continued)
| | | Year Ended August 31, 2016 | | Year Ended August 31, 2015 | |
| | | Shares | | Dollars ($) | | Shares | | Dollars ($) | |
Capital stock activity (continued) | |
Class R5 shares | |
Subscriptions | | | 235,771 | | | | 3,731,941 | | | | 149,922 | | | | 2,869,278 | | |
Distributions reinvested | | | — | | | | — | | | | 15,893 | | | | 284,174 | | |
Redemptions | | | (161,916 | ) | | | (2,537,219 | ) | | | (40,616 | ) | | | (793,010 | ) | |
Net increase | | | 73,855 | | | | 1,194,722 | | | | 125,199 | | | | 2,360,442 | | |
Class Z shares | |
Subscriptions | | | 840,334 | | | | 12,757,609 | | | | 1,030,962 | | | | 19,595,090 | | |
Distributions reinvested | | | — | | | | — | | | | 507,374 | | | | 8,904,420 | | |
Redemptions | | | (1,569,013 | ) | | | (24,218,530 | ) | | | (2,328,664 | ) | | | (44,409,617 | ) | |
Net decrease | | | (728,679 | ) | | | (11,460,921 | ) | | | (790,328 | ) | | | (15,910,107 | ) | |
Total net increase (decrease) | | | (1,110,973 | ) | | | (17,630,870 | ) | | | 302,314 | | | | 939,387 | | |
(a) Includes conversions of Class B shares to Class A shares, if any.
The accompanying Notes to Financial Statements are an integral part of this statement.
Annual Report 2016
18
COLUMBIA GLOBAL ENERGY AND NATURAL RESOURCES FUND
The following tables are intended to help you understand the Fund's financial performance. Certain information reflects financial results for a single share of a class held for the periods shown. Per share net investment income (loss) amounts are calculated based on average shares outstanding during the period. Total return assumes reinvestment of all dividends and distributions, if any. Total return does not reflect payment of sales charges, if any. Total return and portfolio turnover are not annualized for periods of less than one year. The portfolio turnover rate is calculated without regard to purchase and sales transactions of short-term instruments and certain derivatives, if any. If such transactions were included, the Fund's portfolio turnover rate may be higher.
| | | Year Ended August 31, | | Year Ended
March 31, | |
Class A | | 2016 | | 2015 | | 2014 | | 2013 | | 2012(a) | | 2012 | |
Per share data | |
Net asset value, beginning of period | | $ | 15.89 | | | $ | 24.98 | | | $ | 21.07 | | | $ | 20.04 | | | $ | 20.89 | | | $ | 25.57 | | |
Income from investment operations: | |
Net investment income | | | 0.32 | | | | 0.29 | | | | 0.26 | | | | 0.24 | | | | 0.06 | | | | 0.05 | | |
Net realized and unrealized gain (loss) | | | 0.56 | | | | (7.95 | ) | | | 4.10 | | | | 0.87 | | | | (0.88 | ) | | | (4.32 | ) | |
Total from investment operations | | | 0.88 | | | | (7.66 | ) | | | 4.36 | | | | 1.11 | | | | (0.82 | ) | | | (4.27 | ) | |
Less distributions to shareholders: | |
Net investment income | | | — | | | | — | | | | (0.14 | ) | | | (0.08 | ) | | | (0.03 | ) | | | (0.05 | ) | |
Net realized gains | | | — | | | | (1.43 | ) | | | (0.31 | ) | | | — | | | | — | | | | (0.36 | ) | |
Total distributions to shareholders | | | — | | | | (1.43 | ) | | | (0.45 | ) | | | (0.08 | ) | | | (0.03 | ) | | | (0.41 | ) | |
Proceeds from regulatory settlements | | | — | | | | — | | | | — | | | | — | | | | — | | | | 0.00 | (b) | |
Net asset value, end of period | | $ | 16.77 | | | $ | 15.89 | | | $ | 24.98 | | | $ | 21.07 | | | $ | 20.04 | | | $ | 20.89 | | |
Total return | | | 5.54 | % | | | (31.16 | %) | | | 21.00 | % | | | 5.54 | % | | | (3.90 | %) | | | (16.64 | %) | |
Ratios to average net assets(c) | |
Total gross expenses | | | 1.33 | % | | | 1.32 | % | | | 1.30 | % | | | 1.32 | %(d) | | | 1.34 | %(e) | | | 1.28 | %(d) | |
Total net expenses(f) | | | 1.33 | %(g) | | | 1.32 | %(g) | | | 1.30 | %(g) | | | 1.32 | %(d)(g) | | | 1.34 | %(e)(g) | | | 1.28 | %(d)(g) | |
Net investment income | | | 2.06 | % | | | 1.48 | % | | | 1.13 | % | | | 1.17 | % | | | 0.79 | %(e) | | | 0.21 | % | |
Supplemental data | |
Net assets, end of period (in thousands) | | $ | 98,566 | | | $ | 86,133 | | | $ | 130,692 | | | $ | 110,896 | | | $ | 123,271 | | | $ | 145,298 | | |
Portfolio turnover | | | 45 | % | | | 51 | % | | | 34 | % | | | 73 | % | | | 14 | % | | | 167 | % | |
Notes to Financial Highlights
(a) For the period from April 1, 2012 to August 31, 2012. During the period, the Fund's fiscal year end was changed from March 31 to August 31.
(b) Rounds to zero.
(c) In addition to the fees and expenses that the Fund bears directly, the Fund indirectly bears a pro rata share of the fees and expenses of any other funds in which it invests. Such indirect expenses are not included in the Fund's reported expense ratios.
(d) Ratios include line of credit interest expense which is less than 0.01%.
(e) Annualized.
(f) Total net expenses include the impact of certain fee waivers/expense reimbursements made by the Investment Manager and certain of its affiliates, if applicable.
(g) The benefits derived from expense reductions had an impact of less than 0.01%.
The accompanying Notes to Financial Statements are an integral part of this statement.
Annual Report 2016
19
COLUMBIA GLOBAL ENERGY AND NATURAL RESOURCES FUND
FINANCIAL HIGHLIGHTS (continued)
| | | Year Ended August 31, | | Year Ended
March 31, | |
Class B | | 2016 | | 2015 | | 2014 | | 2013 | | 2012(a) | | 2012 | |
Per share data | |
Net asset value, beginning of period | | $ | 15.17 | | | $ | 24.10 | | | $ | 20.35 | | | $ | 19.44 | | | $ | 20.29 | | | $ | 24.96 | | |
Income from investment operations: | |
Net investment income (loss) | | | 0.20 | | | | 0.12 | | | | 0.08 | | | | 0.08 | | | | (0.00 | )(b) | | | (0.11 | ) | |
Net realized and unrealized gain (loss) | | | 0.52 | | | | (7.62 | ) | | | 3.98 | | | | 0.83 | | | | (0.85 | ) | | | (4.20 | ) | |
Total from investment operations | | | 0.72 | | | | (7.50 | ) | | | 4.06 | | | | 0.91 | | | | (0.85 | ) | | | (4.31 | ) | |
Less distributions to shareholders: | |
Net investment income | | | — | | | | — | | | | — | | | | (0.00 | )(b) | | | — | | | | — | | |
Net realized gains | | | — | | | | (1.43 | ) | | | (0.31 | ) | | | — | | | | — | | | | (0.36 | ) | |
Total distributions to shareholders | | | — | | | | (1.43 | ) | | | (0.31 | ) | | | (0.00 | )(b) | | | — | | | | (0.36 | ) | |
Proceeds from regulatory settlements | | | — | | | | — | | | | — | | | | — | | | | — | | | | 0.00 | (b) | |
Net asset value, end of period | | $ | 15.89 | | | $ | 15.17 | | | $ | 24.10 | | | $ | 20.35 | | | $ | 19.44 | | | $ | 20.29 | | |
Total return | | | 4.75 | % | | | (31.65 | %) | | | 20.13 | % | | | 4.70 | % | | | (4.19 | %) | | | (17.24 | %) | |
Ratios to average net assets(c) | |
Total gross expenses | | | 2.09 | % | | | 2.07 | % | | | 2.05 | % | | | 2.06 | %(d) | | | 2.09 | %(e) | | | 2.01 | %(d) | |
Total net expenses(f) | | | 2.09 | %(g) | | | 2.07 | %(g) | | | 2.05 | %(g) | | | 2.06 | %(d)(g) | | | 2.09 | %(e)(g) | | | 2.01 | %(d)(g) | |
Net investment income (loss) | | | 1.33 | % | | | 0.65 | % | | | 0.35 | % | | | 0.40 | % | | | (0.00 | )(b)(e) | | | (0.54 | %) | |
Supplemental data | |
Net assets, end of period (in thousands) | | $ | 552 | | | $ | 986 | | | $ | 2,346 | | | $ | 3,013 | | | $ | 3,913 | | | $ | 5,837 | | |
Portfolio turnover | | | 45 | % | | | 51 | % | | | 34 | % | | | 73 | % | | | 14 | % | | | 167 | % | |
Notes to Financial Highlights
(a) For the period from April 1, 2012 to August 31, 2012. During the period, the Fund's fiscal year end was changed from March 31 to August 31.
(b) Rounds to zero.
(c) In addition to the fees and expenses that the Fund bears directly, the Fund indirectly bears a pro rata share of the fees and expenses of any other funds in which it invests. Such indirect expenses are not included in the Fund's reported expense ratios.
(d) Ratios include line of credit interest expense which is less than 0.01%.
(e) Annualized.
(f) Total net expenses include the impact of certain fee waivers/expense reimbursements made by the Investment Manager and certain of its affiliates, if applicable.
(g) The benefits derived from expense reductions had an impact of less than 0.01%.
The accompanying Notes to Financial Statements are an integral part of this statement.
Annual Report 2016
20
COLUMBIA GLOBAL ENERGY AND NATURAL RESOURCES FUND
FINANCIAL HIGHLIGHTS (continued)
| | | Year Ended August 31, | | Year Ended
March 31, | |
Class C | | 2016 | | 2015 | | 2014 | | 2013 | | 2012(a) | | 2012 | |
Per share data | |
Net asset value, beginning of period | | $ | 15.17 | | | $ | 24.10 | | | $ | 20.36 | | | $ | 19.44 | | | $ | 20.30 | | | $ | 24.96 | | |
Income from investment operations: | |
Net investment income (loss) | | | 0.20 | | | | 0.14 | | | | 0.08 | | | | 0.08 | | | | 0.00 | (b) | | | (0.12 | ) | |
Net realized and unrealized gain (loss) | | | 0.52 | | | | (7.64 | ) | | | 3.97 | | | | 0.84 | | | | (0.86 | ) | | | (4.18 | ) | |
Total from investment operations | | | 0.72 | | | | (7.50 | ) | | | 4.05 | | | | 0.92 | | | | (0.86 | ) | | | (4.30 | ) | |
Less distributions to shareholders: | |
Net investment income | | | — | | | | — | | | | — | | | | (0.00 | )(b) | | | — | | | | — | | |
Net realized gains | | | — | | | | (1.43 | ) | | | (0.31 | ) | | | — | | | | — | | | | (0.36 | ) | |
Total distributions to shareholders | | | — | | | | (1.43 | ) | | | (0.31 | ) | | | (0.00 | )(b) | | | — | | | | (0.36 | ) | |
Proceeds from regulatory settlements | | | — | | | | — | | | | — | | | | — | | | | — | | | | 0.00 | (b) | |
Net asset value, end of period | | $ | 15.89 | | | $ | 15.17 | | | $ | 24.10 | | | $ | 20.36 | | | $ | 19.44 | | | $ | 20.30 | | |
Total return | | | 4.75 | % | | | (31.66 | %) | | | 20.07 | % | | | 4.75 | % | | | (4.24 | %) | | | (17.20 | %) | |
Ratios to average net assets(c) | |
Total gross expenses | | | 2.09 | % | | | 2.07 | % | | | 2.05 | % | | | 2.06 | %(d) | | | 2.09 | %(e) | | | 2.02 | %(d) | |
Total net expenses(f) | | | 2.09 | %(g) | | | 2.07 | %(g) | | | 2.05 | %(g) | | | 2.06 | %(d)(g) | | | 2.09 | %(e)(g) | | | 2.02 | %(d)(g) | |
Net investment income (loss) | | | 1.34 | % | | | 0.77 | % | | | 0.38 | % | | | 0.41 | % | | | 0.04 | %(e) | | | (0.55 | %) | |
Supplemental data | |
Net assets, end of period (in thousands) | | $ | 15,457 | | | $ | 14,428 | | | $ | 16,745 | | | $ | 15,340 | | | $ | 18,661 | | | $ | 22,785 | | |
Portfolio turnover | | | 45 | % | | | 51 | % | | | 34 | % | | | 73 | % | | | 14 | % | | | 167 | % | |
Notes to Financial Highlights
(a) For the period from April 1, 2012 to August 31, 2012. During the period, the Fund's fiscal year end was changed from March 31 to August 31.
(b) Rounds to zero.
(c) In addition to the fees and expenses that the Fund bears directly, the Fund indirectly bears a pro rata share of the fees and expenses of any other funds in which it invests. Such indirect expenses are not included in the Fund's reported expense ratios.
(d) Ratios include line of credit interest expense which is less than 0.01%.
(e) Annualized.
(f) Total net expenses include the impact of certain fee waivers/expense reimbursements made by the Investment Manager and certain of its affiliates, if applicable.
(g) The benefits derived from expense reductions had an impact of less than 0.01%.
The accompanying Notes to Financial Statements are an integral part of this statement.
Annual Report 2016
21
COLUMBIA GLOBAL ENERGY AND NATURAL RESOURCES FUND
FINANCIAL HIGHLIGHTS (continued)
| | | Year Ended August 31, | | Year Ended
March 31, | |
Class I | | 2016 | | 2015 | | 2014 | | 2013 | | 2012(a) | | 2012 | |
Per share data | |
Net asset value, beginning of period | | $ | 16.11 | | | $ | 25.18 | | | $ | 21.24 | | | $ | 20.15 | | | $ | 21.02 | | | $ | 25.70 | | |
Income from investment operations: | |
Net investment income | | | 0.40 | | | | 0.39 | | | | 0.36 | | | | 0.35 | | | | 0.10 | | | | 0.11 | | |
Net realized and unrealized gain (loss) | | | 0.58 | | | | (8.03 | ) | | | 4.14 | | | | 0.87 | | | | (0.89 | ) | | | (4.30 | ) | |
Total from investment operations | | | 0.98 | | | | (7.64 | ) | | | 4.50 | | | | 1.22 | | | | (0.79 | ) | | | (4.19 | ) | |
Less distributions to shareholders: | |
Net investment income | | | — | | | | — | | | | (0.25 | ) | | | (0.13 | ) | | | (0.08 | ) | | | (0.13 | ) | |
Net realized gains | | | — | | | | (1.43 | ) | | | (0.31 | ) | | | — | | | | — | | | | (0.36 | ) | |
Total distributions to shareholders | | | — | | | | (1.43 | ) | | | (0.56 | ) | | | (0.13 | ) | | | (0.08 | ) | | | (0.49 | ) | |
Proceeds from regulatory settlements | | | — | | | | — | | | | — | | | | — | | | | — | | | | 0.00 | (b) | |
Net asset value, end of period | | $ | 17.09 | | | $ | 16.11 | | | $ | 25.18 | | | $ | 21.24 | | | $ | 20.15 | | | $ | 21.02 | | |
Total return | | | 6.08 | % | | | (30.81 | %) | | | 21.57 | % | | | 6.06 | % | | | (3.72 | %) | | | (16.23 | %) | |
Ratios to average net assets(c) | |
Total gross expenses | | | 0.86 | % | | | 0.84 | % | | | 0.82 | % | | | 0.83 | %(d) | | | 0.86 | %(e) | | | 0.80 | %(d) | |
Total net expenses(f) | | | 0.86 | % | | | 0.84 | % | | | 0.82 | % | | | 0.83 | %(d) | | | 0.86 | %(e) | | | 0.80 | %(d)(g) | |
Net investment income | | | 2.51 | % | | | 1.99 | % | | | 1.56 | % | | | 1.70 | % | | | 1.29 | %(e) | | | 0.49 | % | |
Supplemental data | |
Net assets, end of period (in thousands) | | $ | 18,170 | | | $ | 35,650 | | | $ | 41,700 | | | $ | 44,595 | | | $ | 28,803 | | | $ | 29,761 | | |
Portfolio turnover | | | 45 | % | | | 51 | % | | | 34 | % | | | 73 | % | | | 14 | % | | | 167 | % | |
Notes to Financial Highlights
(a) For the period from April 1, 2012 to August 31, 2012. During the period, the Fund's fiscal year end was changed from March 31 to August 31.
(b) Rounds to zero.
(c) In addition to the fees and expenses that the Fund bears directly, the Fund indirectly bears a pro rata share of the fees and expenses of any other funds in which it invests. Such indirect expenses are not included in the Fund's reported expense ratios.
(d) Ratios include line of credit interest expense which is less than 0.01%.
(e) Annualized.
(f) Total net expenses include the impact of certain fee waivers/expense reimbursements made by the Investment Manager and certain of its affiliates, if applicable.
(g) The benefits derived from expense reductions had an impact of less than 0.01%.
The accompanying Notes to Financial Statements are an integral part of this statement.
Annual Report 2016
22
COLUMBIA GLOBAL ENERGY AND NATURAL RESOURCES FUND
FINANCIAL HIGHLIGHTS (continued)
| | | Year Ended August 31, | | Year Ended
March 31, | |
Class K | | 2016 | | 2015 | | 2014 | | 2013 | | 2012(a) | | 2012 | |
Per share data | |
Net asset value, beginning of period | | $ | 16.01 | | | $ | 25.11 | | | $ | 21.18 | | | $ | 20.13 | | | $ | 20.99 | | | $ | 25.67 | | |
Income from investment operations: | |
Net investment income | | | 0.36 | | | | 0.26 | | | | 0.30 | | | | 0.28 | | | | 0.07 | | | | 0.09 | | |
Net realized and unrealized gain (loss) | | | 0.56 | | | | (7.93 | ) | | | 4.12 | | | | 0.87 | | | | (0.88 | ) | | | (4.33 | ) | |
Total from investment operations | | | 0.92 | | | | (7.67 | ) | | | 4.42 | | | | 1.15 | | | | (0.81 | ) | | | (4.24 | ) | |
Less distributions to shareholders: | |
Net investment income | | | — | | | | — | | | | (0.18 | ) | | | (0.10 | ) | | | (0.05 | ) | | | (0.08 | ) | |
Net realized gains | | | — | | | | (1.43 | ) | | | (0.31 | ) | | | — | | | | — | | | | (0.36 | ) | |
Total distributions to shareholders | | | — | | | | (1.43 | ) | | | (0.49 | ) | | | (0.10 | ) | | | (0.05 | ) | | | (0.44 | ) | |
Proceeds from regulatory settlements | | | — | | | | — | | | | — | | | | — | | | | — | | | | 0.00 | (b) | |
Net asset value, end of period | | $ | 16.93 | | | $ | 16.01 | | | $ | 25.11 | | | $ | 21.18 | | | $ | 20.13 | | | $ | 20.99 | | |
Total return | | | 5.75 | % | | | (31.03 | %) | | | 21.21 | % | | | 5.71 | % | | | (3.85 | %) | | | (16.45 | %) | |
Ratios to average net assets(c) | |
Total gross expenses | | | 1.16 | % | | | 1.13 | % | | | 1.12 | % | | | 1.13 | %(d) | | | 1.16 | %(e) | | | 1.11 | %(d) | |
Total net expenses(f) | | | 1.16 | % | | | 1.13 | % | | | 1.12 | % | | | 1.13 | %(d) | | | 1.16 | %(e) | | | 1.11 | %(d)(g) | |
Net investment income | | | 2.27 | % | | | 1.18 | % | | | 1.31 | % | | | 1.35 | % | | | 0.90 | %(e) | | | 0.43 | % | |
Supplemental data | |
Net assets, end of period (in thousands) | | $ | 5 | | | $ | 5 | | | $ | 79 | | | $ | 69 | | | $ | 77 | | | $ | 109 | | |
Portfolio turnover | | | 45 | % | | | 51 | % | | | 34 | % | | | 73 | % | | | 14 | % | | | 167 | % | |
Notes to Financial Highlights
(a) For the period from April 1, 2012 to August 31, 2012. During the period, the Fund's fiscal year end was changed from March 31 to August 31.
(b) Rounds to zero.
(c) In addition to the fees and expenses that the Fund bears directly, the Fund indirectly bears a pro rata share of the fees and expenses of any other funds in which it invests. Such indirect expenses are not included in the Fund's reported expense ratios.
(d) Ratios include line of credit interest expense which is less than 0.01%.
(e) Annualized.
(f) Total net expenses include the impact of certain fee waivers/expense reimbursements made by the Investment Manager and certain of its affiliates, if applicable.
(g) The benefits derived from expense reductions had an impact of less than 0.01%.
The accompanying Notes to Financial Statements are an integral part of this statement.
Annual Report 2016
23
COLUMBIA GLOBAL ENERGY AND NATURAL RESOURCES FUND
FINANCIAL HIGHLIGHTS (continued)
| | | Year Ended August 31, | | Year Ended
March 31, | |
Class R | | 2016 | | 2015 | | 2014 | | 2013 | | 2012(a) | | 2012 | |
Per share data | |
Net asset value, beginning of period | | $ | 15.83 | | | $ | 24.94 | | | $ | 21.03 | | | $ | 20.03 | | | $ | 20.88 | | | $ | 25.56 | | |
Income from investment operations: | |
Net investment income | | | 0.29 | | | | 0.25 | | | | 0.21 | | | | 0.21 | | | | 0.05 | | | | 0.02 | | |
Net realized and unrealized gain (loss) | | | 0.54 | | | | (7.93 | ) | | | 4.10 | | | | 0.84 | | | | (0.89 | ) | | | (4.33 | ) | |
Total from investment operations | | | 0.83 | | | | (7.68 | ) | | | 4.31 | | | | 1.05 | | | | (0.84 | ) | | | (4.31 | ) | |
Less distributions to shareholders: | |
Net investment income | | | — | | | | — | | | | (0.09 | ) | | | (0.05 | ) | | | (0.01 | ) | | | (0.01 | ) | |
Net realized gains | | | — | | | | (1.43 | ) | | | (0.31 | ) | | | — | | | | — | | | | (0.36 | ) | |
Total distributions to shareholders | | | — | | | | (1.43 | ) | | | (0.40 | ) | | | (0.05 | ) | | | (0.01 | ) | | | (0.37 | ) | |
Proceeds from regulatory settlements | | | — | | | | — | | | | — | | | | — | | | | — | | | | 0.00 | (b) | |
Net asset value, end of period | | $ | 16.66 | | | $ | 15.83 | | | $ | 24.94 | | | $ | 21.03 | | | $ | 20.03 | | | $ | 20.88 | | |
Total return | | | 5.24 | % | | | (31.29 | %) | | | 20.73 | % | | | 5.27 | % | | | (4.04 | %) | | | (16.80 | %) | |
Ratios to average net assets(c) | |
Total gross expenses | | | 1.59 | % | | | 1.57 | % | | | 1.55 | % | | | 1.57 | %(d) | | | 1.59 | %(e) | | | 1.55 | %(d) | |
Total net expenses(f) | | | 1.59 | %(g) | | | 1.57 | %(g) | | | 1.55 | %(g) | | | 1.57 | %(d)(g) | | | 1.59 | %(e)(g) | | | 1.55 | %(d)(g) | |
Net investment income | | | 1.84 | % | | | 1.30 | % | | | 0.90 | % | | | 1.01 | % | | | 0.61 | %(e) | | | 0.11 | % | |
Supplemental data | |
Net assets, end of period (in thousands) | | $ | 7,031 | | | $ | 3,045 | | | $ | 3,131 | | | $ | 1,664 | | | $ | 1,226 | | | $ | 880 | | |
Portfolio turnover | | | 45 | % | | | 51 | % | | | 34 | % | | | 73 | % | | | 14 | % | | | 167 | % | |
Notes to Financial Highlights
(a) For the period from April 1, 2012 to August 31, 2012. During the period, the Fund's fiscal year end was changed from March 31 to August 31.
(b) Rounds to zero.
(c) In addition to the fees and expenses that the Fund bears directly, the Fund indirectly bears a pro rata share of the fees and expenses of any other funds in which it invests. Such indirect expenses are not included in the Fund's reported expense ratios.
(d) Ratios include line of credit interest expense which is less than 0.01%.
(e) Annualized.
(f) Total net expenses include the impact of certain fee waivers/expense reimbursements made by the Investment Manager and certain of its affiliates, if applicable.
(g) The benefits derived from expense reductions had an impact of less than 0.01%.
The accompanying Notes to Financial Statements are an integral part of this statement.
Annual Report 2016
24
COLUMBIA GLOBAL ENERGY AND NATURAL RESOURCES FUND
FINANCIAL HIGHLIGHTS (continued)
| | | Year Ended August 31, | |
Class R4 | | 2016 | | 2015 | | 2014 | | 2013(a) | |
Per share data | |
Net asset value, beginning of period | | $ | 16.30 | | | $ | 25.52 | | | $ | 21.51 | | | $ | 20.25 | | |
Income from investment operations: | |
Net investment income | | | 0.37 | | | | 0.34 | | | | 0.35 | | | | 0.35 | | |
Net realized and unrealized gain (loss) | | | 0.59 | | | | (8.13 | ) | | | 4.17 | | | | 0.96 | | |
Total from investment operations | | | 0.96 | | | | (7.79 | ) | | | 4.52 | | | | 1.31 | | |
Less distributions to shareholders: | |
Net investment income | | | — | | | | — | | | | (0.20 | ) | | | (0.05 | ) | |
Net realized gains | | | — | | | | (1.43 | ) | | | (0.31 | ) | | | — | | |
Total distributions to shareholders | | | — | | | | (1.43 | ) | | | (0.51 | ) | | | (0.05 | ) | |
Net asset value, end of period | | $ | 17.26 | | | $ | 16.30 | | | $ | 25.52 | | | $ | 21.51 | | |
Total return | | | 5.89 | % | | | (31.00 | %) | | | 21.32 | % | | | 6.50 | % | |
Ratios to average net assets(b) | |
Total gross expenses | | | 1.09 | % | | | 1.07 | % | | | 1.05 | % | | | 1.06 | %(c) | |
Total net expenses(d) | | | 1.09 | %(e) | | | 1.07 | %(e) | | | 1.05 | %(e) | | | 1.06 | %(c)(e) | |
Net investment income | | | 2.30 | %(c) | | | 1.69 | % | | | 1.49 | % | | | 2.05 | %(c) | |
Supplemental data | |
Net assets, end of period (in thousands) | | $ | 7,890 | | | $ | 7,191 | | | $ | 12,899 | | | $ | 1,575 | | |
Portfolio turnover | | | 45 | % | | | 51 | % | | | 34 | % | | | 73 | % | |
Notes to Financial Highlights
(a) Based on operations from November 8, 2012 (commencement of operations) through the stated period end.
(b) In addition to the fees and expenses that the Fund bears directly, the Fund indirectly bears a pro rata share of the fees and expenses of any other funds in which it invests. Such indirect expenses are not included in the Fund's reported expense ratios.
(c) Annualized.
(d) Total net expenses include the impact of certain fee waivers/expense reimbursements made by the Investment Manager and certain of its affiliates, if applicable.
(e) The benefits derived from expense reductions had an impact of less than 0.01%.
The accompanying Notes to Financial Statements are an integral part of this statement.
Annual Report 2016
25
COLUMBIA GLOBAL ENERGY AND NATURAL RESOURCES FUND
FINANCIAL HIGHLIGHTS (continued)
| | | Year Ended August 31, | |
Class R5 | | 2016 | | 2015 | | 2014 | | 2013(a) | |
Per share data | |
Net asset value, beginning of period | | $ | 16.35 | | | $ | 25.54 | | | $ | 21.53 | | | $ | 20.25 | | |
Income from investment operations: | |
Net investment income | | | 0.41 | | | | 0.39 | | | | 0.37 | | | | 0.34 | | |
Net realized and unrealized gain (loss) | | | 0.57 | | | | (8.15 | ) | | | 4.19 | | | | 1.00 | | |
Total from investment operations | | | 0.98 | | | | (7.76 | ) | | | 4.56 | | | | 1.34 | | |
Less distributions to shareholders: | |
Net investment income | | | — | | | | — | | | | (0.24 | ) | | | (0.06 | ) | |
Net realized gains | | | — | | | | (1.43 | ) | | | (0.31 | ) | | | — | | |
Total distributions to shareholders | | | — | | | | (1.43 | ) | | | (0.55 | ) | | | (0.06 | ) | |
Net asset value, end of period | | $ | 17.33 | | | $ | 16.35 | | | $ | 25.54 | | | $ | 21.53 | | |
Total return | | | 5.99 | % | | | (30.85 | %) | | | 21.53 | % | | | 6.63 | % | |
Ratios to average net assets(b) | |
Total gross expenses | | | 0.91 | % | | | 0.89 | % | | | 0.87 | % | | | 0.88 | %(c) | |
Total net expenses(d) | | | 0.91 | % | | | 0.89 | % | | | 0.87 | % | | | 0.88 | %(c) | |
Net investment income | | | 2.53 | % | | | 1.97 | % | | | 1.58 | % | | | 2.02 | %(c) | |
Supplemental data | |
Net assets, end of period (in thousands) | | $ | 6,558 | | | $ | 4,978 | | | $ | 4,578 | | | $ | 1,058 | | |
Portfolio turnover | | | 45 | % | | | 51 | % | | | 34 | % | | | 73 | % | |
Notes to Financial Highlights
(a) Based on operations from November 8, 2012 (commencement of operations) through the stated period end.
(b) In addition to the fees and expenses that the Fund bears directly, the Fund indirectly bears a pro rata share of the fees and expenses of any other funds in which it invests. Such indirect expenses are not included in the Fund's reported expense ratios.
(c) Annualized.
(d) Total net expenses include the impact of certain fee waivers/expense reimbursements made by the Investment Manager and certain of its affiliates, if applicable.
The accompanying Notes to Financial Statements are an integral part of this statement.
Annual Report 2016
26
COLUMBIA GLOBAL ENERGY AND NATURAL RESOURCES FUND
FINANCIAL HIGHLIGHTS (continued)
| | | Year Ended August 31, | | Year Ended
March 31, | |
Class Z | | 2016 | | 2015 | | 2014 | | 2013 | | 2012(a) | | 2012 | |
Per share data | |
Net asset value, beginning of period | | $ | 16.03 | | | $ | 25.12 | | | $ | 21.19 | | | $ | 20.13 | | | $ | 21.00 | | | $ | 25.67 | | |
Income from investment operations: | |
Net investment income | | | 0.37 | | | | 0.33 | | | | 0.32 | | | �� | 0.28 | | | | 0.08 | | | | 0.09 | | |
Net realized and unrealized gain (loss) | | | 0.57 | | | | (7.99 | ) | | | 4.12 | | | | 0.88 | | | | (0.89 | ) | | | (4.31 | ) | |
Total from investment operations | | | 0.94 | | | | (7.66 | ) | | | 4.44 | | | | 1.16 | | | | (0.81 | ) | | | (4.22 | ) | |
Less distributions to shareholders: | |
Net investment income | | | — | | | | — | | | | (0.20 | ) | | | (0.10 | ) | | | (0.06 | ) | | | (0.09 | ) | |
Net realized gains | | | — | | | | (1.43 | ) | | | (0.31 | ) | | | — | | | | — | | | | (0.36 | ) | |
Total distributions to shareholders | | | — | | | | (1.43 | ) | | | (0.51 | ) | | | (0.10 | ) | | | (0.06 | ) | | | (0.45 | ) | |
Proceeds from regulatory settlements | | | — | | | | — | | | | — | | | | — | | | | — | | | | 0.00 | (b) | |
Net asset value, end of period | | $ | 16.97 | | | $ | 16.03 | | | $ | 25.12 | | | $ | 21.19 | | | $ | 20.13 | | | $ | 21.00 | | |
Total return | | | 5.86 | % | | | (30.97 | %) | | | 21.29 | % | | | 5.80 | % | | | (3.84 | %) | | | (16.37 | %) | |
Ratios to average net assets(c) | |
Total gross expenses | | | 1.09 | % | | | 1.07 | % | | | 1.05 | % | | | 1.07 | %(d) | | | 1.09 | %(e) | | | 1.01 | %(d) | |
Total net expenses(f) | | | 1.09 | %(g) | | | 1.07 | %(g) | | | 1.05 | %(g) | | | 1.07 | %(d)(g) | | | 1.09 | %(e)(g) | | | 1.01 | %(d)(g) | |
Net investment income | | | 2.35 | % | | | 1.68 | % | | | 1.36 | % | | | 1.35 | % | | | 1.03 | %(e) | | | 0.42 | % | |
Supplemental data | |
Net assets, end of period (in thousands) | | $ | 92,245 | | | $ | 98,857 | | | $ | 174,759 | | | $ | 186,303 | | | $ | 310,620 | | | $ | 390,028 | | |
Portfolio turnover | | | 45 | % | | | 51 | % | | | 34 | % | | | 73 | % | | | 14 | % | | | 167 | % | |
Notes to Financial Highlights
(a) For the period from April 1, 2012 to August 31, 2012. During the period, the Fund's fiscal year end was changed from March 31 to August 31.
(b) Rounds to zero.
(c) In addition to the fees and expenses that the Fund bears directly, the Fund indirectly bears a pro rata share of the fees and expenses of any other funds in which it invests. Such indirect expenses are not included in the Fund's reported expense ratios.
(d) Ratios include line of credit interest expense which is less than 0.01%.
(e) Annualized.
(f) Total net expenses include the impact of certain fee waivers/expense reimbursements made by the Investment Manager and certain of its affiliates, if applicable.
(g) The benefits derived from expense reductions had an impact of less than 0.01%.
The accompanying Notes to Financial Statements are an integral part of this statement.
Annual Report 2016
27
COLUMBIA GLOBAL ENERGY AND NATURAL RESOURCES FUND
NOTES TO FINANCIAL STATEMENTS
August 31, 2016
Note 1. Organization
Columbia Global Energy and Natural Resources Fund (the Fund), a series of Columbia Funds Series Trust I (the Trust), is a non-diversified fund. The Trust is registered under the Investment Company Act of 1940, as amended (the 1940 Act), as an open-end management investment company organized as a Massachusetts business trust.
Fund Shares
The Trust may issue an unlimited number of shares (without par value). The Fund offers Class A, Class B, Class C, Class I, Class K, Class R, Class R4, Class R5 and Class Z shares. Although all share classes generally have identical voting, dividend and liquidation rights, each share class votes separately when required by the Trust's organizational documents or by law. Different share classes pay different distribution amounts to the extent the expenses of such share classes differ, and distributions in liquidation will be proportional to the net asset value of each share class. Each share class has its own expense and sales charge structure.
Class A shares are subject to a maximum front-end sales charge of 5.75% based on the initial investment amount. Class A shares purchased without an initial sales charge in accounts aggregating $1 million to $50 million at the time of purchase are subject to a contingent deferred sales charge (CDSC) if the shares are sold within 18 months after purchase, charged as follows: 1.00% CDSC if redeemed within 12 months after purchase, and 0.50% CDSC if redeemed more than 12, but less than 18, months after purchase.
Class B shares may be subject to a maximum CDSC of 5.00% based upon the holding period after purchase. Class B shares will generally convert to Class A shares eight years after purchase. The Fund no longer accepts investments by new or existing investors in the Fund's Class B shares, except in connection with the reinvestment of any dividend and/or capital gain distributions in Class B shares of the Fund and exchanges by existing Class B shareholders of certain other funds within the Columbia Family of Funds.
Class C shares are subject to a 1.00% CDSC on shares redeemed within 12 months after purchase.
Class I shares are not subject to sales charges and are available only to the Columbia Family of Funds.
Class K shares are not subject to sales charges, however this share class is closed to new investors.
Class R shares are not subject to sales charges and are generally available only to certain retirement plans and other investors as described in the Fund's prospectus.
Class R4 shares are not subject to sales charges and are generally available only to omnibus retirement plans and certain investors as described in the Fund's prospectus.
Class R5 shares are not subject to sales charges and are generally available only to investors purchasing through authorized investment professionals and omnibus retirement plans.
Class Z shares are not subject to sales charges and are generally available only to eligible investors, which are subject to different investment minimums as described in the Fund's prospectus.
Note 2. Summary of Significant Accounting Policies
Basis of Preparation
The Fund is an investment company that applies the accounting and reporting guidance in the Financial Accounting Standards Board (FASB) Accounting Standards Codification Topic 946, Financial Services — Investment Companies (ASC 946). The financial statements are prepared in accordance with U.S. generally accepted accounting principles (GAAP), which requires management to make certain estimates and assumptions that affect the reported amounts of assets and liabilities, the disclosure of contingent assets and liabilities at the date of the financial statements and the reported amounts of income and expenses during the reporting period. Actual results could differ from those estimates.
The following is a summary of significant accounting policies followed by the Fund in the preparation of its financial statements.
Security Valuation
All equity securities and exchange-traded funds are valued at the close of business of the New York Stock Exchange (NYSE). Equity securities and exchange-traded funds are valued at the last quoted sales price on the principal exchange or market on which they trade, except for securities traded on the NASDAQ Stock Market, which are valued at the NASDAQ official close price. Unlisted securities or listed securities for which there were no sales during the day are valued at the mean of the latest quoted bid and ask prices on such exchanges or markets.
Annual Report 2016
28
COLUMBIA GLOBAL ENERGY AND NATURAL RESOURCES FUND
NOTES TO FINANCIAL STATEMENTS (continued)
August 31, 2016
Foreign equity securities are valued based on the closing price on the foreign exchange in which such securities are primarily traded. If any foreign equity security closing prices are not readily available, the securities are valued at the mean of the latest quoted bid and ask prices on such exchanges or markets. Foreign currency exchange rates are generally determined at 4:00 p.m. Eastern (U.S.) time. Many securities markets and exchanges outside the U.S. close prior to the close of the NYSE; therefore, the closing prices for securities in such markets or on such exchanges may not fully reflect events that occur after such close but before the close of the NYSE. In those situations, foreign securities will be fair valued pursuant to a policy adopted by the Board of Trustees (the Board), including, if available, utilizing a third party pricing service to determine these fair values. The third party pricing service takes into account multiple factors, including, but not limited to, movements in the U.S. securities markets, certain depositary receipts, futures contracts and foreign exchange rates that have occurred subsequent to the close of the foreign exchange or market, to determine a good faith estimate that reasonably reflects the current market conditions as of the close of the NYSE. The fair value of a security is likely to be different from the quoted or published price, if available.
Investments in open-end investment companies, including money market funds, are valued at their latest net asset value.
Investments for which market quotations are not readily available, or that have quotations which management believes are not reflective of market value or reliable, are valued at fair value as determined in good faith under procedures approved by and under the general supervision of the Board. If a security or class of securities (such as foreign securities) is valued at fair value, such value is likely to be different from the quoted or published price for the security.
The determination of fair value often requires significant judgment. To determine fair value, management may use assumptions including but not limited to future cash flows and estimated risk premiums. Multiple inputs from various sources may be used to determine fair value.
GAAP requires disclosure regarding the inputs and valuation techniques used to measure fair value and any changes in valuation inputs or techniques. In addition, investments shall be disclosed by major category. This information is disclosed following the Fund's Portfolio of Investments.
Foreign Currency Transactions and Translations
The values of all assets and liabilities denominated in foreign currencies are generally translated into U.S. dollars at exchange rates determined at the close of the NYSE on any given day. Net realized and unrealized gains (losses) on foreign currency transactions and translations include gains (losses) arising from the fluctuation in exchange rates between trade and settlement dates on securities transactions, gains (losses) arising from the disposition of foreign currency and currency gains (losses) between the accrual and payment dates on dividends, interest income and foreign withholding taxes.
For financial statement purposes, the Fund does not distinguish that portion of gains (losses) on investments which is due to changes in foreign exchange rates from that which is due to changes in market prices of the investments. Such fluctuations are included with the net realized and unrealized gains (losses) on investments in the Statement of Operations.
Derivative Instruments
The Fund invests in certain derivative instruments, as detailed below, to meet its investment objectives. Derivatives are instruments whose values depend on, or are derived from, in whole or in part, the value of one or more securities, currencies, commodities, indices, or other assets or instruments. Derivatives may be used to increase investment flexibility (including to maintain cash reserves while maintaining desired exposure to certain assets), for risk management (hedging) purposes, to facilitate trading, to reduce transaction costs and to pursue higher investment returns. The Fund may also use derivative instruments to mitigate certain investment risks, such as foreign currency exchange rate risk, interest rate risk and credit risk. Derivatives may involve various risks, including the potential inability of the counterparty to fulfill its obligation under the terms of the contract, the potential for an illiquid secondary market (making it difficult for the Fund to sell, including at favorable prices) and the potential for market movements which may expose the Fund to gains or losses in excess of the amount shown in the Statement of Assets and Liabilities. The notional amounts of derivative instruments, if applicable, are not recorded in the financial statements.
A derivative instrument may suffer a marked-to-market loss if the value of the contract decreases due to an unfavorable change in the market rates or values of the underlying instrument. Losses can also occur if the
Annual Report 2016
29
COLUMBIA GLOBAL ENERGY AND NATURAL RESOURCES FUND
NOTES TO FINANCIAL STATEMENTS (continued)
August 31, 2016
counterparty does not perform under the contract. The Fund's risk of loss from counterparty credit risk on over-the-counter derivatives is generally limited to the aggregate unrealized gain netted against any collateral held by the Fund and the amount of any variation margin held by the counterparty. With exchange-traded or centrally cleared derivatives, there is reduced counterparty credit risk to the Fund since the exchange's clearinghouse, as counterparty to such instruments, guarantees against a possible default. The clearinghouse stands between the buyer and the seller of the contract; therefore, the counterparty credit risk is failure of the clearinghouse. However, credit risk still exists in exchange-traded or centrally cleared derivatives with respect to initial and variation margin that is held in a broker's customer account. While brokers are required to segregate customer margin from their own assets, in the event that a broker becomes insolvent or goes into bankruptcy and at that time there is a shortfall in the aggregate amount of margin held by the broker for all its clients, U.S. bankruptcy laws will typically allocate that shortfall on a pro-rata basis across all the broker's customers (including the Fund), potentially resulting in losses to the Fund.
In order to better define its contractual rights and to secure rights that will help the Fund mitigate its counterparty risk, the Fund may enter into an International Swaps and Derivatives Association, Inc. Master Agreement (ISDA Master Agreement) or similar agreement with its derivatives contract counterparties. An ISDA Master Agreement is an agreement between the Fund and a counterparty that governs over-the-counter derivatives and forward foreign currency exchange contracts and typically contains, among other things, collateral posting terms and netting provisions in the event of a default and/or termination event. Under an ISDA Master Agreement, the Fund may, under certain circumstances, offset with the counterparty certain derivative instrument's payables and/or receivables with collateral held and/or posted and create one single net payment. The provisions of the ISDA Master Agreement typically permit a single net payment in the event of default (close-out netting) including the bankruptcy or insolvency of the counterparty. Note, however, that bankruptcy or insolvency laws of a particular jurisdiction may impose restrictions on or prohibitions against the right of offset in bankruptcy, insolvency or other events.
Collateral (margin) requirements differ by type of derivative. Margin requirements are established by the exchange or clearinghouse for exchange-traded and centrally cleared derivatives. Brokers can ask for margin
in excess of the minimum in certain circumstances. Collateral terms are contract specific for over-the-counter derivatives. For over-the-counter derivatives traded under an ISDA Master Agreement, the collateral requirements are typically calculated by netting the marked-to-market amount for each transaction under such agreement and comparing that amount to the value of any variation margin currently pledged by the Fund and/or the counterparty. Generally, the amount of collateral due from or to a party has to exceed a minimum transfer amount threshold (e.g., $500,000) before a transfer has to be made. To the extent amounts due to the Fund from its counterparties are not fully collateralized, contractually or otherwise, the Fund bears the risk of loss from counterparty nonperformance. The Fund attempts to mitigate counterparty risk by only entering into agreements with counterparties that it believes have the financial resources to honor their obligations and by monitoring the financial stability of those counterparties.
Certain ISDA Master Agreements allow counterparties to over-the-counter derivatives transactions to terminate derivatives contracts prior to maturity in the event the Fund's net asset value declines by a stated percentage over a specified time period or if the Fund fails to meet certain terms of the ISDA Master Agreement, which would cause the Fund to accelerate payment of any net liability owed to the counterparty. The Fund also has termination rights if the counterparty fails to meet certain terms of the ISDA Master Agreement. In addition to considering counterparty credit risk, the Fund would consider terminating the derivatives contracts based on whether termination would result in a net liability owed from the counterparty.
For financial reporting purposes, the Fund does not offset derivative assets and derivative liabilities that are subject to netting arrangements in the Statement of Assets and Liabilities.
Forward Foreign Currency Exchange Contracts
Forward foreign currency exchange contracts are over-the-counter agreements between two parties to buy and sell a currency at a set price on a future date. The Fund utilized forward foreign currency exchange contracts to hedge the currency exposure associated with some or all of the Fund's securities, to shift foreign currency exposure back to U.S. dollars, to shift investment exposure from one currency to another and to shift U.S. dollar exposure to achieve a representative weighted mix of major currencies in its benchmark and/or to recover an underweight country exposure in its portfolio. These instruments may be used for other purposes in future periods.
Annual Report 2016
30
COLUMBIA GLOBAL ENERGY AND NATURAL RESOURCES FUND
NOTES TO FINANCIAL STATEMENTS (continued)
August 31, 2016
The values of forward foreign currency exchange contracts fluctuate daily with changes in foreign currency exchange rates. Changes in the value of these contracts are recorded as unrealized appreciation or depreciation until the contract is exercised or has expired. The Fund will realize a gain or loss when the forward foreign currency exchange contract is closed or expires.
The use of forward foreign currency exchange contracts does not eliminate fluctuations in the prices of the Fund's portfolio securities. The risks of forward foreign currency exchange contracts include movement in the values of the foreign currencies relative to the U.S. dollar (or other foreign currencies) and the possibility that counterparties will not complete their contractual obligations, which may be in excess of the amount reflected, if any, in the Statement of Assets and Liabilities.
Effects of Derivative Transactions in the Financial Statements
The following tables are intended to provide additional information about the effect of derivatives on the financial statements of the Fund, including: the fair value of derivatives by risk category and the location of those fair values in the Statement of Assets and Liabilities; and the impact of derivative transactions over the period in the Statement of Operations, including realized and unrealized gains (losses). The derivative instrument schedules following the Portfolio of Investments present additional information regarding derivative instruments outstanding at the end of the period, if any.
The following table indicates the effect of derivative instruments (not considered to be hedging instruments for accounting disclosure purposes) in the Statement of Operations for the year ended August 31, 2016:
Amount of Realized Gain (Loss) on Derivatives Recognized in Income | |
Risk Exposure
Category | | Forward Foreign
Currency Exchange
Contracts ($) | |
Foreign exchange risk | | | 315,232 | | |
The following table provides a summary of the average outstanding volume by derivative instrument for the year ended August 31 , 2016:
Derivative Instrument | | Average Unrealized
Appreciation ($)* | | Average Unrealized
Depreciation ($)* | |
Forward foreign currency
exchange contracts | | | 4,741 | | | | (1,459 | ) | |
*Based on the daily outstanding amounts for the year ended August 31, 2016.
Security Transactions
Security transactions are accounted for on the trade date. Cost is determined and gains (losses) are based upon the specific identification method for both financial statement and federal income tax purposes.
Income Recognition
Corporate actions and dividend income are generally recorded net of any non-reclaimable tax withholdings, on the ex-dividend date or upon receipt of ex-dividend notification in the case of certain foreign securities.
The Fund may receive distributions from holdings in equity securities, business development companies (BDCs), exchange-traded funds, other regulated investment companies (RICs), and real estate investment trusts (REITs), which report information on the tax character of their distributions annually. These distributions are allocated to dividend income, capital gain and return of capital based on actual information reported. Return of capital is recorded as a reduction of the cost basis of securities held. If the Fund no longer owns the applicable securities, return of capital is recorded as a realized gain. With respect to REITs, to the extent actual information has not yet been reported, estimates for return of capital are made by the Fund's management. Management's estimates are subsequently adjusted when the actual character of the distributions is disclosed by the REITs, which could result in a proportionate change in return of capital to shareholders.
Awards from class action litigation are recorded as a reduction of cost basis if the Fund still owns the applicable securities on the payment date. If the Fund no longer owns the applicable securities, the proceeds are recorded as realized gains.
Expenses
General expenses of the Trust are allocated to the Fund and other funds of the Trust based upon relative net assets or other expense allocation methodologies determined by the nature of the expense. Expenses directly attributable to the Fund are charged to the Fund. Expenses directly attributable to a specific class of shares are charged to that share class.
Determination of Class Net Asset Value
All income, expenses (other than class-specific expenses, which are charged to that share class, as shown in the Statement of Operations) and realized and unrealized gains (losses) are allocated to each class of the Fund on a daily basis, based on the relative net
Annual Report 2016
31
COLUMBIA GLOBAL ENERGY AND NATURAL RESOURCES FUND
NOTES TO FINANCIAL STATEMENTS (continued)
August 31, 2016
assets of each class, for purposes of determining the net asset value of each class.
Federal Income Tax Status
The Fund intends to qualify each year as a regulated investment company under Subchapter M of the Internal Revenue Code, as amended, and will distribute substantially all of its taxable income (including net short-term capital gains), if any, for its tax year, and as such will not be subject to federal income taxes. In addition, the Fund intends to distribute in each calendar year substantially all of its net investment income, capital gains and certain other amounts, if any, such that the Fund should not be subject to federal excise tax. Therefore, no federal income or excise tax provision is recorded.
Foreign Taxes
The Fund may be subject to foreign taxes on income, gains on investments or currency repatriation, a portion of which may be recoverable. The Fund will accrue such taxes and recoveries, as applicable, based upon its current interpretation of tax rules and regulations that exist in the markets in which it invests.
Realized gains in certain countries may be subject to foreign taxes at the Fund level, based on statutory rates. The Fund accrues for such foreign taxes on realized and unrealized gains at the appropriate rate for each jurisdiction, as applicable. The amount, if any, is disclosed as a liability on the Statement of Assets and Liabilities.
Distributions to Shareholders
Distributions from net investment income, if any, are declared and paid each calendar quarter. Net realized capital gains, if any, are distributed at least annually. Income distributions and capital gain distributions are determined in accordance with federal income tax regulations, which may differ from GAAP.
Guarantees and Indemnifications
Under the Trust's organizational documents and, in some cases, by contract, its officers and trustees are indemnified against certain liabilities arising out of the performance of their duties to the Trust or its funds. In addition, certain of the Fund's contracts with its service providers contain general indemnification clauses. The Fund's maximum exposure under these arrangements is unknown since the amount of any future claims that may be made against the Fund cannot be determined, and the Fund has no historical basis for predicting the likelihood of any such claims.
Note 3. Fees and Other Transactions with Affiliates
Management Services Fees
Effective January 1, 2016, the Fund entered into a Management Agreement with Columbia Management Investment Advisers, LLC (the Investment Manager), a wholly-owned subsidiary of Ameriprise Financial, Inc. (Ameriprise Financial). Under the Management Agreement, the Investment Manager provides the Fund with investment research and advice, as well as administrative and accounting services. The management services fee is an annual fee that is equal to a percentage of the Fund's average daily net assets that declines from 0.75% to 0.58% as the Fund's net assets increase. Prior to January 1, 2016, the Fund paid the Investment Manager an annual fee for advisory services under an Investment Management Services Agreement and a separate annual fee for administrative and accounting services under an Administrative Services Agreement. The effective management services fee rate for the year ended August 31, 2016 (reflecting all advisory and administrative services fees paid to the Investment Manager) was 0.75% of the Fund's average daily net assets. For the period from September 1, 2015 through December 31, 2015, the investment advisory services fee paid to the Investment Manager was $555,215, and the administrative services fee paid to the Investment Manager was $48,280.
Compensation of Board Members
Board members, who are not officers or employees of the Investment Manager or Ameriprise Financial, are compensated for their services to the Fund as disclosed in the Statement of Operations. These Board members may participate in a Deferred Compensation Plan (the Plan) which may be terminated at any time. Obligations of the Plan will be paid solely out of the Fund's assets, and all amounts payable under the Plan constitute a general unsecured obligation of the Fund.
Compensation of Chief Compliance Officer
The Board has appointed a Chief Compliance Officer to the Fund in accordance with federal securities regulations. The Fund is allocated a portion of the expenses associated with the Chief Compliance Officer based on relative net assets of the Trust.
Transfer Agency Fees
Under a Transfer and Dividend Disbursing Agent Agreement, Columbia Management Investment Services Corp. (the Transfer Agent), an affiliate of the Investment Manager and a wholly-owned subsidiary of Ameriprise
Annual Report 2016
32
COLUMBIA GLOBAL ENERGY AND NATURAL RESOURCES FUND
NOTES TO FINANCIAL STATEMENTS (continued)
August 31, 2016
Financial, is responsible for providing transfer agency services to the Fund. The Transfer Agent has contracted with Boston Financial Data Services (BFDS) to serve as sub-transfer agent. The Transfer Agent pays the fees of BFDS for services as sub-transfer agent and BFDS is not entitled to reimbursement for such fees from the Fund (with the exception of out-of-pocket fees).
The Fund pays the Transfer Agent a monthly transfer agency fee based on the number or the average value of accounts, depending on the type of account. In addition, prior to October 1, 2016, the Transfer Agent also received sub-transfer agency fees based on a percentage of the average aggregate value of the Fund's shares maintained in omnibus accounts (other than omnibus accounts for which American Enterprise Investment Services Inc. is the broker of record or accounts where the beneficial shareholder is a customer of Ameriprise Financial Services, Inc., for which the Transfer Agent receives a per account fee). Effective October 1, 2016, the Fund pays the Transfer Agent a fee for shareholder services based on the number of accounts or on a percentage of the average aggregate value of the Fund's shares maintained in omnibus accounts up to the lesser of the amount charged by the servicing agent or a cap established by the Board from time to time.
The Transfer Agent also receives compensation from the Fund for various shareholder services and reimbursements for certain out-of-pocket fees. Total transfer agency fees for Class K and Class R5 shares are subject to an annual limitation of not more than 0.05% of the average daily net assets attributable to each share class. Class I shares do not pay transfer agency fees.
For the year ended August 31, 2016, the Fund's effective transfer agency fee rates as a percentage of average daily net assets of each class were as follows:
Class A | | | 0.22 | % | |
Class B | | | 0.23 | | |
Class C | | | 0.23 | | |
Class K | | | 0.05 | | |
Class R | | | 0.22 | | |
Class R4 | | | 0.23 | | |
Class R5 | | | 0.05 | | |
Class Z | | | 0.23 | | |
An annual minimum account balance fee of $20 may apply to certain accounts with a value below the applicable share class's initial minimum investment requirements to reduce the impact of small accounts on transfer agency fees. These minimum account balance
fees are remitted to the Fund and recorded as part of expense reductions in the Statement of Operations. For the year ended August 31, 2016, these minimum account balance fees reduced total expenses of the Fund by $1,980.
Plan Administration Fees
Under a Plan Administration Services Agreement with the Transfer Agent, the Fund pays an annual fee at a rate of 0.25% of the Fund's average daily net assets attributable to Class K shares for the provision of various administrative, recordkeeping, communication and educational services.
Distribution and Service Fees
The Fund has an agreement with Columbia Management Investment Distributors, Inc. (the Distributor), an affiliate of the Investment Manager and a wholly-owned subsidiary of Ameriprise Financial, for distribution and shareholder services. The Board has approved, and the Fund has adopted, distribution and shareholder service plans (the Plans) applicable to certain share classes, which set the distribution and service fees for the Fund. These fees are calculated daily and are intended to compensate the Distributor and/or eligible selling and/or servicing agents for selling shares of the Fund and providing services to investors.
Under the Plans, the Fund pays a monthly service fee to the Distributor at the maximum annual rate of 0.25% of the average daily net assets attributable to Class A, Class B and Class C shares of the Fund. Also under the Plans, the Fund pays a monthly distribution fee to the Distributor at the maximum annual rates of 0.75%, 0.75% and 0.50% of the average daily net assets attributable to Class B, Class C and Class R shares of the Fund, respectively.
Sales Charges
Sales charges, including front-end charges and CDSCs, received by the Distributor for distributing Fund shares were $210,410 for Class A, $32 for Class B and $3,297 for Class C, shares for the year ended August 31, 2016.
Expenses Waived/Reimbursed by the Investment Manager and its Affiliates
The Fund's expense ratio is subject to an expense reimbursement arrangement pursuant to which fees will be waived and/or expenses reimbursed (excluding certain fees and expenses described below), so that the Fund's net operating expenses, after giving effect to fees waived/expenses reimbursed and any balance credits
Annual Report 2016
33
COLUMBIA GLOBAL ENERGY AND NATURAL RESOURCES FUND
NOTES TO FINANCIAL STATEMENTS (continued)
August 31, 2016
and/or overdraft charges from the Fund's custodian, do not exceed the annual rates of:
| | | Contractual
Expense Cap
January 1, 2016
Through
December 31, 2016 | | Voluntary
Expense Cap
Prior to
January 1, 2016 | |
Class A | | | 1.51 | % | | | 1.45 | % | |
Class B | | | 2.26 | | | | 2.20 | | |
Class C | | | 2.26 | | | | 2.20 | | |
Class I | | | 1.09 | | | | 1.04 | | |
Class K | | | 1.39 | | | | 1.34 | | |
Class R | | | 1.76 | | | | 1.70 | | |
Class R4 | | | 1.26 | | | | 1.20 | | |
Class R5 | | | 1.14 | | | | 1.09 | | |
Class Z | | | 1.26 | | | | 1.20 | | |
The contractual agreement may be modified or amended only with approval from the Investment Manager, certain of its affiliates and the Fund. Under the arrangements, the following fees and expenses are excluded from the waiver/reimbursement commitment, and therefore will be paid by the Fund, if applicable: taxes (including foreign transaction taxes), expenses associated with investments in affiliated and non-affiliated pooled investment vehicles (including mutual funds and exchange-traded funds), transaction costs and brokerage commissions, costs related to any securities lending program, dividend and interest expenses associated with securities sold short, inverse floater program fees and expenses, transaction charges and interest on borrowed money, interest and infrequent and/or unusual expenses. Any fees waived and/or expenses reimbursed under the expense reimbursement arrangements described above are not recoverable by the Investment Manager or its affiliates in future periods.
Note 4. Federal Tax Information
The timing and character of income and capital gain distributions are determined in accordance with income tax regulations, which may differ from GAAP because of temporary or permanent book to tax differences.
At August 31, 2016, these differences are primarily due to differing treatment for capital loss carryforwards, deferral/reversal of wash sale losses, Trustees' deferred compensation, foreign currency transactions, investments in partnerships, passive foreign investment company (PFIC) holdings and tax straddles. To the extent these differences are permanent, reclassifications are made among the components of the Fund's net assets in
the Statement of Assets and Liabilities. Temporary differences do not require reclassifications.
In the Statement of Assets and Liabilities the following reclassifications were made:
Undistributed net investment income | | $ | 4,108 | | |
Accumulated net realized loss | | | (4,023 | ) | |
Paid-in capital | | | (85 | ) | |
Net investment income (loss) and net realized gains (losses), as disclosed in the Statement of Operations, and net assets were not affected by this reclassification.
The tax character of distributions paid during the years indicated was as follows:
Year Ended August 31, | | 2016 | | 2015 | |
Ordinary income | | $ | — | | | $ | 5,319,821 | | |
Long-term capital gains | | | — | | | | 15,280,117 | | |
Total | | $ | — | | | $ | 20,599,938 | | |
Short-term capital gain distributions, if any, are considered ordinary income distributions for tax purposes.
At August 31, 2016, the components of distributable earnings on a tax basis were as follows:
Undistributed ordinary income | | $ | 606,514 | | |
Capital loss carryforwards | | | (26,156,104 | ) | |
Net unrealized appreciation | | | 1,894,137 | | |
At August 31, 2016, the cost of investments for federal income tax purposes was $244,081,216 and the aggregate gross unrealized appreciation and depreciation based on that cost was:
Unrealized appreciation | | $ | 26,050,007 | | |
Unrealized depreciation | | | (24,155,870 | ) | |
Net unrealized appreciation | | $ | 1,894,137 | | |
The following capital loss carryforwards, determined at August 31, 2016, may be available to reduce taxable income arising from future net realized gains on investments, if any, to the extent permitted by the Internal Revenue Code:
Year of Expiration | | Amount ($) | |
No expiration — short-term | | | 2,380,326 | | |
No expiration — long-term | | | 23,775,778 | | |
Total | | | 26,156,104 | | |
Management of the Fund has concluded that there are no significant uncertain tax positions in the Fund that would require recognition in the financial statements. However, management's conclusion may be subject to
Annual Report 2016
34
COLUMBIA GLOBAL ENERGY AND NATURAL RESOURCES FUND
NOTES TO FINANCIAL STATEMENTS (continued)
August 31, 2016
review and adjustment at a later date based on factors including, but not limited to, new tax laws, regulations, and administrative interpretations (including relevant court decisions). Generally, the Fund's federal tax returns for the prior three fiscal years remain subject to examination by the Internal Revenue Service.
Note 5. Portfolio Information
The cost of purchases and proceeds from sales of securities, excluding short-term investments and derivatives, if any, aggregated to $105,899,560 and $113,609,827, respectively, for the year ended August 31, 2016. The amount of purchase and sale activity impacts the portfolio turnover rate reported in the Financial Highlights.
Note 6. Affiliated Money Market Fund
The Fund invests in Columbia Short-Term Cash Fund, an affiliated money market fund established for the exclusive use by the Fund and other affiliated funds (the Affiliated MMF). The income earned by the Fund from such investments is included as Dividends — affiliated issuers in the Statement of Operations. As an investing fund, the Fund indirectly bears its proportionate share of the expenses of the Affiliated MMF. Effective October 1, 2016, the Affiliated MMF prices its shares with a floating net asset value (NAV) and no longer seeks to maintain a stable NAV. In addition, the Board of the Affiliated MMF may impose a fee on redemptions (sometimes referred to as a liquidity fee) or temporarily suspend redemptions (sometimes referred to as imposing a redemption gate) in the event its liquidity falls below regulatory limits.
Note 7. Line of Credit
The Fund has access to a revolving credit facility with a syndicate of banks led by Citibank, N.A., HSBC Bank USA, N.A. and JPMorgan Chase Bank, N.A. whereby the Fund may borrow for the temporary funding of shareholder redemptions or for other temporary or emergency purposes. The credit facility agreement, which is a collective agreement between the Fund and certain other funds managed by the Investment Manager, severally and not jointly, that permits collective borrowings up to $1 billion. Interest is charged to each participating fund based on its borrowings at a rate equal to the higher of (i) the overnight federal funds rate plus 1.00% or (ii) the one-month LIBOR rate plus 1.00%. Each borrowing under the credit facility matures no later than 60 days after the date of borrowing. The Fund also pays a commitment fee equal to its pro rata share of the amount of the credit facility at a rate of 0.15% per
annum. The commitment fee is included in other expenses in the Statement of Operations. Prior to December 8, 2015, JPMorgan was the sole lead bank under the credit facility agreement that permitted borrowings up to $550 million under the same terms and interest rates as described above with the exception of the commitment fee which was charged at a rate of 0.075% per annum.
The Fund had no borrowings during the year ended August 31, 2016.
Note 8. Significant Risks
Shareholder Concentration Risk
At August 31, 2016, two unaffiliated shareholders of record owned 23.9% of the outstanding shares of the Fund in one or more accounts. The Fund has no knowledge about whether any portion of those shares was owned beneficially. Affiliated shareholders of record owned 37.1% of the outstanding shares of the Fund in one or more accounts. Subscription and redemption activity by concentrated accounts may have a significant effect on the operations of the Fund. In the case of a large redemption, the Fund may be forced to sell investments at inopportune times, including its liquid or more liquid positions, resulting in Fund losses and the Fund holding a higher percentage of less liquid or illiquid securities. Large redemptions could result in decreased economies of scale and increased operating expenses for non-redeeming Fund shareholders.
Energy Sector Risk
The Fund may be more susceptible to the particular risks that may affect companies in the energy sector than if it were invested in a wider variety of companies in unrelated sectors. Companies in the energy sector are subject to certain risks, including legislative or regulatory changes, adverse market conditions and increased competition. Performance of such companies may be affected by factors including, among others, fluctuations in energy prices and supply and demand of energy fuels, energy conservation, the success of exploration projects, events occurring in nature and local and international politics. In addition, rising interest rates and high inflation may affect the demand for certain natural resources and, therefore, the performance of companies in the energy sector.
Annual Report 2016
35
COLUMBIA GLOBAL ENERGY AND NATURAL RESOURCES FUND
NOTES TO FINANCIAL STATEMENTS (continued)
August 31, 2016
Foreign Securities and Emerging Market Countries Risk
Investing in foreign securities may include certain risks and considerations not typically associated with investing in U.S. securities, such as fluctuating currency values and changing local and regional economic, political and social conditions, which may result in greater market volatility. In addition, certain foreign securities may not be as liquid as U.S. securities. Investing in emerging markets may accentuate these risks. These countries are also more likely to experience high levels of inflation, deflation or currency devaluation which could hurt their economies and securities markets. To the extent that the Fund concentrates its investment exposure to any one or a few specific countries, the Fund will be particularly susceptible to the various conditions, events or other factors impacting those countries and may, therefore, have a greater risk than that of a fund which is more geographically diversified.
Materials Sector Risk
The Fund may be more susceptible to the particular risks that may affect companies in the materials sector than if it were invested in a wider variety of companies in unrelated sectors. Companies in the materials sector are subject to certain risks, including that many materials companies are significantly affected by the level and volatility of commodity prices, exchange rates, import controls, worldwide competition, environmental policies and consumer demand. Performance of such companies may be affected by factors including, among others, that at times worldwide production of industrial materials has exceeded demand as a result of over-building or economic downturns, leading to poor investment returns or losses. Other risks may include liabilities for environmental damage and general civil liabilities, depletion of resources, and mandated expenditures for safety and pollution control. The materials sector may also be affected by economic cycles, technical progress, labor relations, and government regulations.
Non-Diversification Risk
A non-diversified fund is permitted to invest a greater percentage of its total assets in fewer issuers than a diversified fund. The Fund may, therefore, have a greater risk of loss from a few issuers than a similar fund that invests more broadly.
Note 9. Subsequent Events
Management has evaluated the events and transactions that have occurred through the date the financial statements were issued and noted no items requiring adjustment of the financial statements or additional disclosure.
Note 10. Information Regarding Pending and Settled Legal Proceedings
Ameriprise Financial and certain of its affiliates have historically been involved in a number of legal, arbitration and regulatory proceedings, including routine litigation, class actions, and governmental actions, concerning matters arising in connection with the conduct of their business activities. Ameriprise Financial believes that the Funds are not currently the subject of, and that neither Ameriprise Financial nor any of its affiliates are the subject of, any pending legal, arbitration or regulatory proceedings that are likely to have a material adverse effect on the Funds or the ability of Ameriprise Financial or its affiliates to perform under their contracts with the Funds. Ameriprise Financial is required to make quarterly (10-Q), annual (10-K) and, as necessary, 8-K filings with the Securities and Exchange Commission (SEC) on legal and regulatory matters that relate to Ameriprise Financial and its affiliates. Copies of these filings may be obtained by accessing the SEC website at www.sec.gov.
There can be no assurance that these matters, or the adverse publicity associated with them, will not result in increased fund redemptions, reduced sale of fund shares or other adverse consequences to the Funds. Further, although we believe proceedings are not likely to have a material adverse effect on the Funds or the ability of Ameriprise Financial or its affiliates to perform under their contracts with the Funds, these proceedings are subject to uncertainties and, as such, we are unable to estimate the possible loss or range of loss that may result. An adverse outcome in one or more of these proceedings could result in adverse judgments, settlements, fines, penalties or other relief that could have a material adverse effect on the consolidated financial condition or results of operations of Ameriprise Financial.
Annual Report 2016
36
COLUMBIA GLOBAL ENERGY AND NATURAL RESOURCES FUND
REPORT OF INDEPENDENT REGISTERED PUBLIC ACCOUNTING FIRM
To the Trustees of Columbia Funds Series Trust I and the Shareholders of
Columbia Global Energy and Natural Resources Fund
In our opinion, the accompanying statement of assets and liabilities, including the portfolio of investments, and the related statements of operations and of changes in net assets and the financial highlights present fairly, in all material respects, the financial position of Columbia Global Energy and Natural Resources Fund (the "Fund," a series of Columbia Funds Series Trust I) at August 31, 2016, and the results of its operations, the changes in its net assets and the financial highlights for each of the periods indicated, in conformity with accounting principles generally accepted in the United States of America. These financial statements and financial highlights (hereafter referred to as "financial statements") are the responsibility of the Fund's management. Our responsibility is to express an opinion on these financial statements based on our audits. We conducted our audits of these financial statements in accordance with the standards of the Public Company Accounting Oversight Board (United States). Those standards require that we plan and perform the audit to obtain reasonable assurance about whether the financial statements are free of material misstatement. An audit includes examining, on a test basis, evidence supporting the amounts and disclosures in the financial statements, assessing the accounting principles used and significant estimates made by management, and evaluating the overall financial statement presentation. We believe that our audits, which included confirmation of securities at August 31, 2016 by correspondence with the custodian and transfer agent, provide a reasonable basis for our opinion.
PricewaterhouseCoopers LLP
Minneapolis, MN
October 21, 2016
Annual Report 2016
37
COLUMBIA GLOBAL ENERGY AND NATURAL RESOURCES FUND
Shareholders elect the Board that oversees the Fund's operations. The Board appoints officers who are responsible for day-to-day business decisions based on policies set by the Board. The following table provides basic biographical information about the Fund's Trustees, including their principal occupations during the past five years, although specific titles for individuals may have varied over the period. The year set forth beneath Length of Service in the table below is the year in which the Trustee was first appointed or elected as Trustee to any Fund currently in the Columbia Funds Complex or a predecessor thereof. Under current Board policy, members serve terms of indefinite duration.
Trustees
Independent Trustees
Name,
Address,
Year of Birth | | Position Held With
the Trust and Length of
Service | | Principal Occupation(s)
During the Past Five Years
and Other Relevant
Professional Experience | | Number of
Funds in the
Columbia Funds
Complex
Overseen | | Other Directorships
Held by Trustee During
the Past Five Years | |
Janet Langford Carrig
c/o Columbia
Management Investment Advisers, LLC,
225 Franklin Street
Mail Drop BX32 05228,
Boston, MA 02110
1957 | | Trustee 1996 | | Senior Vice President, General Counsel and Corporate Secretary, ConocoPhillips (integrated energy company) since September 2007 | | 56 | | None | |
Douglas A. Hacker
c/o Columbia Management Investment Advisers, LLC,
225 Franklin Street
Mail Drop BX32 05228,
Boston, MA 02110
1955 | | Trustee and Chairman of the Board 1996 | | Independent business executive since May 2006; Executive Vice President — Strategy of United Airlines from December 2002 to May 2006; President of UAL Loyalty Services (airline marketing company) from September 2001 to December 2002; Executive Vice President and Chief Financial Officer of United Airlines from July 1999 to September 2001 | | 56 | | Spartan Nash Company (food distributor); Nash Finch Company (food distributor) from 2005 to 2013; Aircastle Limited (aircraft leasing); SeaCube Container Leasing Ltd. (container leasing) from 2010 to 2013; and Travelport Worldwide Limited (travel information technology) | |
Nancy T. Lukitsh
c/o Columbia Management Investment Advisers, LLC,
225 Franklin Street
Mail Drop BX32 05228,
Boston, MA 02110
1956 | | Trustee 2011 | | Senior Vice President, Partner and Director of Marketing, Wellington Management Company, LLP (investment adviser) from 1997 to 2010; Chair, Wellington Management Portfolios (commingled non-U.S. investment pools) from 2007 to 2010; Director, Wellington Trust Company, NA and other Wellington affiliates from 1997 to 2010 | | 56 | | None | |
Annual Report 2016
38
COLUMBIA GLOBAL ENERGY AND NATURAL RESOURCES FUND
TRUSTEES AND OFFICERS (continued)
Independent Trustees (continued)
Name,
Address,
Year of Birth | | Position Held With
the Trust and Length of
Service | | Principal Occupation(s)
During the Past Five Years
and Other Relevant
Professional Experience | | Number of
Funds in the
Columbia Funds
Complex
Overseen | | Other Directorships
Held by Trustee During
the Past Five Years | |
William E. Mayer
c/o Columbia Management Investment Advisers, LLC,
225 Franklin Street
Mail Drop BX32 05228,
Boston, MA 02110
1940 | | Trustee 1991 | | Partner, Park Avenue Equity Partners (private equity) since February 1999 | | 56 | | DynaVox Inc. (speech creation); Lee Enterprises (print media); WR Hambrecht + Co. (financial service provider) from 2000 to 2012; BlackRock Capital Investment Corporation (investment company); and Premier, Inc. (healthcare) | |
David M. Moffett
c/o Columbia Management Investment Advisers, LLC,
225 Franklin Street
Mail Drop BX32 05228,
Boston, MA 02110
1952 | | Trustee 2011 | | Retired. Consultant to Bridgewater and Associates | | 56 | | Director of CIT Bank, CIT Group Inc. (commercial and consumer finance); eBay Inc. (online trading community); Genworth Financial, Inc. (financial and insurance products and services); Paypal Holdings Inc. (payment and data processing services); and Trustee University of Oklahoma Foundation | |
Charles R. Nelson
c/o Columbia Management Investment Advisers, LLC,
225 Franklin Street
Mail Drop BX32 05228,
Boston, MA 02110
1942 | | Trustee 1981 | | Retired. Professor Emeritus, University of Washington since 2011; Professor of Economics, University of Washington from 1976 to 2011; Ford and Louisa Van Voorhis Professor of Political Economy, University of Washington from 1993 to 2011; Adjunct Professor of Statistics, University of Washington from 1980 to 2011; Associate Editor, Journal of Money, Credit and Banking from September 1993 to 2008; consultant on econometric and statistical matters | | 56 | | None | |
John J. Neuhauser
c/o Columbia Management Investment Advisers, LLC,
225 Franklin Street
Mail Drop BX32 05228,
Boston, MA 02110
1943 | | Trustee 1984 | | President, Saint Michael's College since August 2007; Director or Trustee of several non-profit organizations, including University of Vermont Medical Center; Academic Vice President and Dean of Faculties, Boston College from August 1999 to October 2005; University Professor, Boston College from November 2005 to August 2007 | | 56 | | Liberty All-Star Equity Fund and Liberty All-Star Growth Fund (closed-end funds) | |
Annual Report 2016
39
COLUMBIA GLOBAL ENERGY AND NATURAL RESOURCES FUND
TRUSTEES AND OFFICERS (continued)
Independent Trustees (continued)
Name,
Address,
Year of Birth | | Position Held With
the Trust and Length of
Service | | Principal Occupation(s)
During the Past Five Years
and Other Relevant
Professional Experience | | Number of
Funds in the
Columbia Funds
Complex
Overseen | | Other Directorships
Held by Trustee During
the Past Five Years | |
Patrick J. Simpson
c/o Columbia Management Investment Advisers, LLC,
225 Franklin Street
Mail Drop BX32 05228,
Boston, MA 02110
1944 | | Trustee 2000 | | Of Counsel, Perkins Coie LLP (law firm) since 2015; Partner, Perkins Coie LLP from 1988 to 2014 | | 56 | | None | |
Anne-Lee Verville
c/o Columbia Management Investment Advisers, LLC,
225 Franklin Street
Mail Drop BX32 05228,
Boston, MA 02110
1945 | | Trustee 1998 | | Retired. General Manager, Global Education Industry from 1994 to 1997, President — Application Systems Division from 1991 to 1994, Chief Financial Officer — US Marketing & Services from 1988 to 1991, and Chief Information Officer from 1987 to 1988, IBM Corporation (computer and technology) | | 56 | | Enesco Group, Inc. (producer of giftware and home and garden decor products) from 2001 to 2006 | |
Consultant to the Trustees*
Name,
Address,
Year of Birth | | Position Held With
the Trust and Length of
Service | | Principal Occupation(s)
During the Past Five Years
and Other Relevant
Professional Experience | | Number of
Funds in the
Columbia Funds
Complex
Overseen | | Other Directorships
Held by Trustee During
the Past Five Years | |
J. Kevin Connaughton
c/o Columbia
Management Investment Advisers, LLC,
225 Franklin Street
Mail Drop BX32 05228,
Boston, MA 02110
1964 | | Trustee Consultant 2016 | | Trustee Consultant, Columbia Funds since March 2016; Managing Director and General Manager of Mutual Fund Products, Columbia Management Investment Advisers, LLC from May 2010 to February 2015; President, Columbia Funds from 2009 to 2015; and senior officer of Columbia Funds and affiliated funds from 2003 to 2015 | | 56 | | Board of Governors, Gateway Healthcare since January 2016; Trustee, New Century Portfolios since March 2015; and Director, The Autism Project since March 2015 | |
* J. Kevin Connaughton was appointed consultant to the Trustees effective March 1, 2016. Shareholders of the Funds are expected to be asked to elect Mr. Connaughton as a Trustee at a future shareholder meeting.
Annual Report 2016
40
COLUMBIA GLOBAL ENERGY AND NATURAL RESOURCES FUND
TRUSTEES AND OFFICERS (continued)
Interested Trustee Affiliated with Investment Manager*
Name,
Address,
Year of Birth | | Position Held With
the Trust and Length of
Service | | Principal Occupation(s)
During the Past Five Years
and Other Relevant
Professional Experience | | Number of
Funds in the
Columbia Funds
Complex
Overseen | | Other Directorships
Held by Trustee During
the Past Five Years | |
William F. Truscott
c/o Columbia Management Investment Advisers, LLC,
225 Franklin Street
Boston, MA 02110
1960 | | Trustee 2012 | | Chairman of the Board and President, Columbia Management Investment Advisers, LLC since May 2010 and February 2012, respectively; Chief Executive Officer, Global Asset Management, Ameriprise Financial, Inc. since September 2012 (previously Chief Executive Officer, U.S. Asset Management & President, Annuities, May 2010- September 2012); Director and Chief Executive Officer, Columbia Management Investment Distributors, Inc. since May 2010 and February 2012, respectively; Chairman of the Board and Chief Executive Officer, RiverSource Distributors, Inc. since 2006; Director, Threadneedle Asset Management Holdings, SARL since 2014; President and Chief Executive Officer, Ameriprise Certificate Company, 2006-August 2012. | | 184 | | Trustee to other Columbia Funds since 2001; Chairman of the Board, Columbia Management Investment Advisers, LLC since May 2010; Director, Columbia Management Investment Distributors, Inc. since May 2010; Former Director, Ameriprise Certificate Company, 2006-January 2013 | |
* Interested person (as defined under the 1940 Act) by reason of being an officer, director, security holder and/or employee of the Investment Manager or Ameriprise Financial.
The Statement of Additional Information has additional information about the Fund's Board members and is available, without charge, upon request by calling 800.345.6611; contacting your financial intermediary; or visiting investor.columbiathreadneedleus.com.
Annual Report 2016
41
COLUMBIA GLOBAL ENERGY AND NATURAL RESOURCES FUND
TRUSTEES AND OFFICERS (continued)
The Board has appointed officers who are responsible for day-to-day business decisions based on policies it has established. The officers serve at the pleasure of the Board. The following table provides basic information about the Officers of the Fund, including principal occupations during the past five years, although their specific titles may have varied over the period. In addition to Mr. Truscott, who is Senior Vice President, the Fund's other officers are:
Fund Officers
Name,
Address and
Year of Birth | | Position and Year
First Appointed to
Position for any Fund
in the Columbia
Funds Complex or a
Predecessor Thereof | |
Principal Occupation(s) During Past Five Years | |
Christopher O. Petersen
5228 Ameriprise Financial Center
Minneapolis, MN 55474
Born 1970 | | President and Principal Executive Officer (2015) | | Vice President and Lead Chief Counsel, Ameriprise Financial, Inc. since January 2015 (previously, Vice President and Chief Counsel January 2010-December 2014; officer of Columbia Funds and affiliated funds since 2007. | |
Michael G. Clarke
225 Franklin Street
Boston, MA 02110
Born 1969 | | Treasurer (2011), Chief Financial Officer (2009) and Chief Accounting Officer (2015) | | Vice President — Mutual Fund Administration, Columbia Management Investment Advisers, LLC, since May 2010; senior officer of Columbia Funds and affiliated funds since 2002. | |
Paul B. Goucher
100 Park Avenue
New York, NY 10017
Born 1968 | | Senior Vice President (2011), Chief Legal Officer (2015) and Assistant Secretary (2008) | | Vice President and Lead Chief Counsel, Ameriprise Financial, Inc. since November 2008 and January 2013, respectively (previously Chief Counsel, January 2010-January 2013); Vice President, Chief Legal Officer and Assistant Secretary, Columbia Management Investment Advisers, LLC since May 2010. | |
Thomas P. McGuire
225 Franklin Street
Boston, MA 02110
Born 1972 | | Senior Vice President and Chief Compliance Officer (2012) | | Vice President — Asset Management Compliance, Ameriprise Financial, Inc., since May 2010; Chief Compliance Officer, Ameriprise Certificate Company since September 2010. | |
Colin Moore
225 Franklin Street
Boston, MA 02110
Born 1958 | | Senior Vice President (2010) | | Executive Vice President and Global Chief Investment Officer, Ameriprise Financial, Inc., since July 2013; Executive Vice President and Global Chief Investment Officer, Columbia Management Investment Advisers, LLC since July 2013 (previously Director and Global Chief Investment Officer, 2010-2013). | |
Michael E. DeFao
225 Franklin Street
Boston, MA 02110
Born 1968 | | Vice President (2011) and Assistant Secretary (2010) | | Vice President and Chief Counsel, Ameriprise Financial, Inc. since May 2010. | |
Amy Johnson
5228 Ameriprise Financial Center
Minneapolis, MN 55474
Born 1965 | | Vice President (2006) | | Managing Director and Global Head of Operations, Columbia Management Investment Advisers, LLC since April 2016 (previously Managing Director and Chief Operating Officer, 2010-2016). | |
Lyn Kephart-Strong
5228 Ameriprise
Financial Center
Minneapolis, MN 55474
Born 1960 | | Vice President (2015) | | President, Columbia Management Investment Services Corp. since October 2014; Vice President & Resolution Officer, Ameriprise Trust Company since August 2009. | |
Ryan C. Larrenaga
225 Franklin Street
Boston, MA 02110
Born 1970 | | Vice President and Secretary (2015) | | Vice President and Group Counsel, Ameriprise Financial, Inc. since August 2011; officer of Columbia Funds and affiliated funds since 2005. | |
Annual Report 2016
42
COLUMBIA GLOBAL ENERGY AND NATURAL RESOURCES FUND
BOARD CONSIDERATION AND APPROVAL OF MANAGEMENT
AGREEMENT
On June 10, 2016, the Board of Trustees (the Board) and the Trustees who are not interested persons (as defined in the Investment Company Act of 1940) (the Independent Trustees) of Columbia Funds Series Trust I (the Trust) unanimously approved the continuation of the Management Agreement (the Management Agreement) with Columbia Management Investment Advisers, LLC (the Investment Manager) with respect to Columbia Global Energy and Natural Resources Fund (the Fund), a series of the Trust. As detailed below, the Board's Advisory Fees and Expenses Committee (the Committee) and the Board met on multiple occasions to review and discuss, both among themselves and with the management team of the Investment Manager, materials provided by the Investment Manager and others before determining to approve the continuation of the Management Agreement.
In connection with their deliberations regarding the continuation of the Management Agreement, the Committee and the Board evaluated materials requested from the Investment Manager regarding the Fund and the Management Agreement, and discussed these materials with representatives of the Investment Manager at Committee meetings held on March 8, 2016, April 27, 2016 and June 9, 2016 and at Board meetings held on March 9, 2016 and June 10, 2016. In addition, the Board considers matters bearing on the Management Agreement at most of its other meetings throughout the year and meets regularly with senior management of the Trust and the Investment Manager. Through the Board's Investment Oversight Committees, Trustees also meet with selected portfolio managers of the funds the Trustees oversee and other investment personnel at various times throughout the year. The Committee and the Board also consulted with its independent fee consultant, Fund counsel and with the Independent Trustees' independent legal counsel, who advised on various matters with respect to the Committee's and the Board's considerations and otherwise assisted the Committee and the Board in their deliberations. On June 9, 2016, the Committee recommended that the Board approve the continuation of the Management Agreement. On June 10, 2016, the Board, including the Independent Trustees, voting separately, unanimously approved the continuation of the Management Agreement for the Fund.
The Committee and the Board considered all information that they, their legal counsel or the Investment Manager believed reasonably necessary to evaluate and to determine whether to recommend for approval or approve the continuation of the Management Agreement. The information and factors considered by the Committee and the Board in recommending for approval or approving the continuation of the Management Agreement for the Fund included the following:
• Information on the investment performance of the Fund relative to the performance of a group of mutual funds determined to be comparable to the Fund by an independent third-party data provider, as well as performance relative to benchmarks;
• Information on the Fund's management fees and total expenses, including information comparing the Fund's expenses to those of a group of comparable mutual funds, as determined by the independent third-party data provider;
• The Investment Manager's agreement to contractually limit or cap total operating expenses for the Fund through December 31, 2017 so that total operating expenses (excluding certain fees and expenses, such as transaction costs and certain other investment related expenses, interest, taxes, acquired fund fees and expenses, and infrequent and/or unusual expenses) would not exceed a specified annual rate, as a percentage of the Fund's net assets;
• The terms and conditions of the Management Agreement;
• The current and proposed terms and conditions of other agreements and arrangements with affiliates of the Investment Manager relating to the operations of the Fund, including agreements with respect to the provision of distribution and transfer agency services to the Fund;
• Descriptions of various functions performed by the Investment Manager under the Management Agreement, including portfolio management and portfolio trading practices;
• Information regarding the management fees of similarly-managed portfolios of other clients of the Investment Manager, including institutional separate accounts;
Annual Report 2016
43
COLUMBIA GLOBAL ENERGY AND NATURAL RESOURCES FUND
BOARD CONSIDERATION AND APPROVAL OF MANAGEMENT
AGREEMENT (continued)
• Information regarding the reputation, regulatory history and resources of the Investment Manager, including information regarding senior management, portfolio managers and other personnel;
• Information regarding the capabilities of the Investment Manager with respect to compliance monitoring services, including an assessment of the Investment Manager's compliance system by the Fund's Chief Compliance Officer; and
• The profitability to the Investment Manager and its affiliates from their relationships with the Fund.
Nature, Extent and Quality of Services Provided under the Management Agreement
The Committee and the Board considered the nature, extent and quality of services provided to the Fund by the Investment Manager and its affiliates under the Management Agreement and under separate agreements for the provision of transfer agency services, and the resources dedicated to the Fund and the other Columbia Funds by the Investment Manager and its affiliates. The Committee and the Board considered, among other things, the Investment Manager's ability to attract, motivate and retain highly qualified research, advisory and supervisory investment professionals (including personnel and other resources, compensation programs for personnel involved in fund management, reputation and other attributes), the portfolio management services provided by those investment professionals, and the quality of the Investment Manager's investment research capabilities and trade execution services. The Committee and the Board also considered the potential benefits to shareholders of investing in a mutual fund that is part of a fund complex offering exposure to a variety of asset classes and investment disciplines and providing a variety of fund and shareholder services.
The Committee and the Board also considered the professional experience and qualifications of the senior personnel of the Investment Manager, which included consideration of the Investment Manager's experience with similarly-structured funds. The Committee and the Board noted the compliance programs of and the compliance-related resources provided to the Fund by the Investment Manager and its affiliates, and considered the Investment Manager's ability to provide administrative services to the Fund and coordinate the activities of the Fund's other service providers. After reviewing these and related factors, the Committee and the Board concluded, within the context of their overall conclusions, that the nature, extent and quality of the services provided to the Fund under the Management Agreement supported the continuation of the Management Agreement.
Investment Performance
The Committee and the Board reviewed information about the performance of the Fund over various time periods, including performance information relative to benchmarks and information based on reports of the independent third-party data provider that compared the performance of the Fund to the performance of a group of comparable mutual funds, and data provided by the independent fee consultant. The Committee and the Board also reviewed a description of the third party's methodology for identifying the Fund's peer groups for purposes of performance and expense comparisons.
The Committee and the Board noted that, through December 31, 2015, the Fund's performance was in the thirtieth, twenty-second and twenty-seventh percentile (where the best performance would be in the first percentile) of its category selected by the independent third-party data provider for the purposes of performance comparisons for the one-, three- and five- year periods, respectively.
The Committee and the Board also considered the Investment Manager's performance and reputation generally, the Investment Manager's historical responsiveness to Board concerns about performance, and the Investment Manager's willingness to take steps intended to improve performance. After reviewing these and related factors, the Committee and the Board concluded, within the context of their overall conclusions, that the performance of the Fund and the Investment Manager was sufficient, in light of other considerations, to warrant the continuation of the Management Agreement.
Investment Management Fee Rates and Other Expenses
The Committee and the Board considered the management fees charged to the Fund under the Management Agreement as well as the total expenses incurred by the Fund. In assessing the reasonableness of the fees
Annual Report 2016
44
COLUMBIA GLOBAL ENERGY AND NATURAL RESOURCES FUND
BOARD CONSIDERATION AND APPROVAL OF MANAGEMENT
AGREEMENT (continued)
under the Management Agreement, the Committee and the Board considered, among other information, the Fund's management fee and its total expense ratio as a percentage of average daily net assets. The Committee and the Board considered data provided by the independent fee consultant. The Committee and the Board noted that, as of December 31, 2015, the Fund's actual management fee and net total expense ratio are both ranked in the third quintile (where the lowest fees and expenses would be in the first quintile) against the Fund's expense universe as determined by the independent third-party data provider for purposes of expense comparison. The Committee and the Board also took into account the fee waiver and expense limitation arrangements agreed to by the Investment Manager, as noted above.
The Committee and the Board also received and considered information about the management fees charged by the Investment Manager to institutional separate accounts. In considering the fees charged to those accounts, the Committee and the Board took into account, among other things, the Investment Manager's representations about the differences between managing mutual funds as compared to other types of accounts, including differences in the services provided, differences in the risk profile of such business for the Investment Manager and the additional resources required to manage mutual funds effectively. The Committee and the Board also received and considered information about the fees charged by the Investment Manager for sub-advisory services provided to comparable unaffiliated funds. In evaluating the Fund's management fees, the Committee and the Board also took into account the demands, complexity and quality of the investment management of the Fund.
After reviewing these and related factors, the Committee and the Board concluded, within the context of their overall conclusions, that the management fee rates and expenses of the Fund were sufficient, in light of other considerations, to warrant the continuation of the Management Agreement.
Costs of Services Provided and Profitability
The Committee and the Board also took note of the costs the Investment Manager and its affiliates incur in connection with the services provided (both on an absolute and relative basis) and the profitability to the Investment Manager and its affiliates in connection with their relationships with the Fund.
The Committee and the Board also considered the compensation directly or indirectly received by the Investment Manager's affiliates in connection with their relationships with the Fund. The Committee and the Board reviewed information provided by management as to the profitability to the Investment Manager and its affiliates of their relationships with the Fund, information about the allocation of expenses used to calculate profitability, and comparisons of profitability levels realized in 2015 to profitability levels realized in 2014. When reviewing profitability, the Committee and the Board also considered court cases in which adviser profitability was an issue in whole or in part, the performance of similarly managed funds, the performance of the Fund, and the expense ratio of the Fund. In addition, the Committee and the Board considered information provided by the Investment Manager regarding the Investment Manager's financial condition and comparing its profitability to that of other asset management firms that are, or are subsidiaries of, publicly traded companies. In this regard, the Committee and the Board also considered data provided by the independent fee consultant.
After reviewing these and related factors, the Committee and the Board concluded, within the context of their overall conclusions, that the costs of services provided and the profitability to the Investment Manager and its affiliates from their relationships with the Fund supported the continuation of the Management Agreement.
Economies of Scale
The Committee and the Board considered the potential existence of economies of scale in the provision by the Investment Manager of services to the Fund, to groups of related funds, and to the Investment Manager's investment advisory clients as a whole, and whether those economies of scale were shared with the Fund through breakpoints in investment management fees or other means, such as expense limitation arrangements and additional investments by the Investment Manager in investment, trading and compliance resources. The Committee and the Board noted that the management fee schedules for the Fund contained breakpoints that would reduce the fee rate on assets above specified threshold levels.
Annual Report 2016
45
COLUMBIA GLOBAL ENERGY AND NATURAL RESOURCES FUND
BOARD CONSIDERATION AND APPROVAL OF MANAGEMENT
AGREEMENT (continued)
In considering these matters, the Committee and the Board also considered the costs of the services provided and the profitability to the Investment Manager and its affiliates from their relationships with the Fund, as discussed above. After reviewing these and related factors, the Committee and the Board concluded, within the context of their overall conclusions, that the extent to which any economies of scale were expected to be shared with the Fund supported the continuation of the Management Agreement.
Other Benefits to the Investment Manager
The Committee and the Board received and considered information regarding "fall-out" or ancillary benefits received by the Investment Manager and its affiliates as a result of their relationships with the Fund, such as the engagement of the Investment Manager's affiliates to provide distribution and transfer agency services to the Fund. In this regard, among other matters, the Committee and the Board considered that the Fund's distributor retains a portion of the distribution fees from the Fund and receives a portion of the sales charges on sales or redemptions of certain classes of shares of the Fund. The Committee and the Board also considered the benefits of research made available to the Investment Manager by reason of brokerage commissions generated by the Fund's securities transactions, and reviewed information about the Investment Manager's practices with respect to allocating portfolio transactions for brokerage and research services. The Committee and the Board considered the possible conflicts of interest associated with certain fall-out or other ancillary benefits and the reporting, disclosure and other processes that are in place to address such possible conflicts of interest. The Committee and the Board recognized that the Investment Manager's profitability would be somewhat lower without these benefits.
Conclusion
The Committee and the Board reviewed all of the above considerations in reaching their decisions to recommend or approve the continuation of the Management Agreement. In their deliberations, the Trustees did not identify any particular information that was all-important or controlling, and individual Trustees may have attributed different weights to the various factors. Based on their evaluation of all factors that they deemed to be material, including those factors described above, and assisted by the advice of independent legal counsel, the Board, including the Independent Trustees, voting separately, unanimously approved the continuation of the Management Agreement.
Annual Report 2016
46
COLUMBIA GLOBAL ENERGY AND NATURAL RESOURCES FUND
IMPORTANT INFORMATION ABOUT THIS REPORT
Each fund mails one shareholder report to each shareholder address. If you would like more than one report, please call shareholder services at 800.345.6611 and additional reports will be sent to you.
The policy of the Board is to vote the proxies of the companies in which each fund holds investments consistent with the procedures as stated in the Statement of Additional Information (SAI). You may obtain a copy of the SAI without charge by calling 800.345.6611; contacting your financial intermediary; visiting investor.columbiathreadneedleus.com; or searching the website of the Securities and Exchange Commission (SEC) at sec.gov. Information regarding how each fund voted proxies relating to portfolio securities is filed with the SEC by August 31st for the most recent 12-month period ending June 30th of that year, and is available without charge by visiting investor.columbiathreadneedleus.com, or searching the website of the SEC at sec.gov.
Each fund files a complete schedule of portfolio holdings with the SEC for the first and third quarters of each fiscal year on Form N-Q. Each fund's Form N-Q is available on the SEC's website at sec.gov and may be reviewed and copied at the SEC's Public Reference Room in Washington, D.C. Information on the operation of the Public Reference Room may be obtained by calling 800.SEC.0330. Each fund's complete schedule of portfolio holdings, as filed on Form N-Q, can also be obtained without charge, upon request, by calling 800.345.6611.
Annual Report 2016
47
Columbia Global Energy and Natural Resources Fund
P.O. Box 8081
Boston, MA 02266-8081

Please read and consider the investment objectives, risks, charges and expenses for any fund carefully before investing. For a prospectus and summary prospectus, which contains this and other important information about the Fund, go to investor.columbiathreadneedleus.com. The Fund is distributed by Columbia Management Investment Distributors, Inc., member FINRA, and managed by Columbia Management Investment Advisers, LLC.
Columbia Threadneedle Investments (Columbia Threadneedle) is the global brand name of the Columbia and Threadneedle group of companies.
All rights reserved. Columbia Management Investment Distributors, Inc., 225 Franklin Street, Boston, MA 02110-2804
© 2016 Columbia Management Investment Advisers, LLC.
investor.columbiathreadneedleus.com
ANN144_08_F01_(10/16)

ANNUAL REPORT
August 31, 2016

COLUMBIA GLOBAL TECHNOLOGY GROWTH FUND

ABOUT COLUMBIA THREADNEEDLE INVESTMENTS
Columbia Threadneedle Investments is a leading global asset management group that provides a broad range of investment strategies and solutions for individual, institutional and corporate clients around the world.
With more than 2,000 people, including over 450 investment professionals based in North America, Europe and Asia, we manage $460 billion* of assets across developed and emerging market equities, fixed income, asset allocation solutions and alternatives. We are the 13th largest manager of long-term mutual fund assets in the U.S.** and the 4th largest manager of retail funds in the U.K.***
Our priority is the investment success of our clients. We aim to deliver the investment outcomes they expect through an investment approach that is team-based, performance-driven and risk-aware. Our culture is dynamic and interactive. By sharing our insights across asset classes and geographies, we generate richer perspectives on global, regional and local investment landscapes. The ability to exchange and debate investment ideas in a collaborative environment enriches our teams' investment processes. More importantly, it results in better informed investment decisions for our clients.
Columbia funds are distributed by Columbia Management Investment Distributors, Inc., member FINRA, and managed by Columbia Management Investment Advisers, LLC.
Columbia Threadneedle Investments (Columbia Threadneedle) is the global brand name of the Columbia and Threadneedle group of companies.
* In U.S. dollars as of June 30, 2016. Source: Ameriprise Q2 Earnings Release. Includes all assets managed by entities in the Columbia and Threadneedle group of companies. Contact us for more current data.
** Source: ICI as of June 30, 2016 for Columbia Management Investment Advisers, LLC.
*** Source: Investment Association as of March 2016 for Threadneedle Asset Management Limited.
© 2016 Columbia Management Investment Advisers, LLC. All rights reserved.
Not part of the shareholder report
Investment strategies to help meet investor needs
We are committed to helping investors navigate financial challenges to reach their desired outcomes. The possibilities are endless.
Your success is our priority.
 Retire comfortably
 Fund college or higher education
 Leave a legacy

Generate an appropriate stream of income in retirement
Traditional approaches to income may no longer be adequate — and they may no longer provide the diversification benefits they once did. Investors need to rethink how they generate retirement income.
Worried about running out of income? You are not alone.

Navigate a changing interest rate environment
Even in today's challenging interest rate environment, it's still possible to navigate markets and achieve your goals.
Make investment choices designed specifically for this market environment.

Maximize after-tax returns
In an environment where what you keep is more important than what you earn, municipal bonds can help mitigate higher taxes while providing attractive yields compared to other investment options.
You've worked too hard building your wealth to lose it to taxes.

Grow assets to achieve financial goals
Finding growth opportunities in today's complex market environment requires strong research capabilities, creative thinking and a disciplined approach.
Do your investments deliver the portfolio growth you need?

Ease the impact of volatile markets
With increasing concerns about market volatility, investors should consider diversifying their portfolios with non-traditional holdings.
Interested in turning volatility into opportunity?
To find out more, contact your financial professional, call 800.426.3750 or visit investor.columbiathreadneedleus.com
Not part of the shareholder report
Get the market insight you need from our investment experts and subscribe to our latest publications

Stay informed with Columbia Threadneedle Investments
Investor insight
Find economic and market commentary, investment videos, white papers, mutual fund commentary and more at investor.columbiathreadneedleus.com.
Subscribe to the latest information from Columbia Threadneedle. Register your information online at investor.columbiathreadneedleus.com/subscribe and select the publications you would like to receive, including:
n Columbia Threadneedle Investor Newsletter, highlighting the latest macro- and micro-economic trends, investment themes, products, service changes and other items of interest to our investors
n Investment Strategy Outlook, showcasing the Columbia Threadneedle Asset Allocation Team's perspective on global economic investment conditions and markets
n MarketTrack, featuring straightforward insight on current investment opportunities
n White papers that delve deep into a variety of investment topics
n Quarterly portfolio manager commentary and fund fact sheets
Update your subscriptions at any time by accessing the email subscription center.
Social media 
We offer you multiple ways to access our market commentary and investment insights.
n Perspectives blog at investor.columbiathreadneedleus.com
Read timely posts by our investment team, including our chief investment officer, chief economist and portfolio managers.
n Twitter.com/CTinvest_US
Follow us on Twitter for quick, up-to-the-minute comments on market news and more.
n Youtube.com/CTInvestUS
View our commentaries on the economy, markets and current investment opportunities.
n Linkedin.com/company/Columbia-Threadneedle-Investments-US
Connect with us on LinkedIn for updates from our thought leaders.
Not part of the shareholder report
 Dear Shareholders,
Volatility comes with the territory for long-term investors. Some investors instinctively want to pull out of the market or sell underperforming investments at the first sign of increased volatility or perhaps even as soon as they perceive it on the horizon. But taking yourself out of the market could mean losing out on potential opportunities, and putting your longer term investment goals at risk.
Cumulative return is not just about achieving high returns when markets are going up; it's also about remaining invested and minimizing losses during weak or volatile markets so that you can participate on the upside. Developing a deeper understanding of the various risks your portfolio is subject to can help you balance these risks.
Diversification is critical in seeking to achieve that balance. We believe that most portfolios could be more effectively diversified either by introducing holdings with performance profiles unrelated to existing holdings (like alternative products) or by rebalancing existing holdings with an eye toward risk allocation. Over time, distributing risk more evenly may produce a more pronounced diversification benefit and may improve portfolio efficiency. We believe market volatility can create significant opportunities and, in fact, these periods may be some of the very best times to invest.
With this in mind, I thought it important to highlight excerpts from a piece written by Colin Moore, Global Chief Investment Officer, in which he touches on some of these issues emphasizing the importance of a properly constructed portfolio in seeking to effectively manage volatility and to achieve consistency of returns. I encourage you to read the article in its entirety. To access the full article and for other insights on current market, please visit blog.columbiathreadneedleus.com/latest-perspectives.
You need investments that are designed to help you ease the impact of volatile market environments and keep the savings you have worked tirelessly to amass. Columbia Threadneedle Investments provides investment solutions to help you tackle financial challenges and achieve your desired outcome.
Best regards,

Christopher O. Petersen
President, Columbia Funds
Excerpts from:
Taking the scare out of the volatility bogeyman
By Colin Moore, Global Chief Investment Officer
Colin Moore is the global chief investment officer for Columbia Threadneedle Investments. His responsibilities include ensuring that a disciplined investment process is in place across all asset classes, including equity and fixed income. Mr. Moore joined one of the Columbia Threadneedle Investments legacy firms in 2002 as head of equity and was also head of fixed income and liquidity strategies from 2009 – 2010.

n In today's low growth, higher volatility world, the emphasis is shifting from maximization of returns to consistency of returns.
PRESIDENT'S MESSAGE (continued)
n Portfolios should represent the behavioral risk-return tradeoff of investors, remembering that they won't stay invested to realize the return if we get the risk tolerance wrong.
n Holding long-term savings in cash to avoid volatility (the financial equivalent of hiding under the sheets) is detrimental to achieving long-term goals.
According to Wikipedia, "The bogeyman is a common allusion to a mythical creature in many cultures used to control behavior. This monster has no specific appearance, and conceptions about it can vary drastically from household to household within the same community; in many cases he has no set appearance in the mind of an adult or child, but is simply a non-specific embodiment of terror." Different cultures have different names and physical representations for the bogeyman, and investors are no different. We have terrible monsters that we fear may destroy our portfolios, and we call one of the scariest of them volatility.
While the bogeyman is mythical (I hope!), volatility is real and can cause serious damage. To understand why investors have such a hard time coping with volatility, we first need to define three cognitive biases at work in today's investment environment:
1) Recency bias — something that has recently come to the forefront of our attention, regardless of how long established it is, suddenly seems to appear with improbable frequency.
2) Negativity bias — we tend to have a greater recall of unpleasant memories than positive memories.
3) Loss aversion — our dissatisfaction with losing money tends to be greater than our satisfaction with making money.
The level of volatility varies dramatically, and so does investor fear and panic selling — waxing when volatility rises, waning when it falls. Recent studies have pointed to demographics as an important driver of panic selling. The theory is that as people get closer to retirement, the prospects of a large (20% – 30%) loss in financial assets can have a much more pronounced effect on their sense of well-being. Wealth preservation instincts kick in much more quickly than for younger (and typically less wealthy) savers.
The reality is that there is little opportunity for return without volatility. Therefore, the bogeyman effect of holding long-term savings in cash to avoid volatility (the financial equivalent of hiding under the sheets) is detrimental to achieving long-term goals. This effect tends to be more pronounced during the episodic spikes in volatility. The significant spike in volatility in 2008 and 2009 led to significant withdrawals from long-term investment funds over the same period. Less pronounced effects can also be seen when comparing 2001 – 2003 and 2011 – 2012. Conversely, flows picked up when volatility returned to "normal" levels. Investor behavior of this type is consistent with the three behavioral biases.
I believe average volatility will be higher over the next 10 years than the last 10 years and episodic spikes will increase in frequency because sustainable economic growth will be structurally lower and geopolitical risk higher than any time since World War II. Low growth creates uncertainty while loss aversion will make investors fear that we are one economic mishap or geopolitical event away from no growth or recession. The result will be higher volatility on average. Negativity bias will tend to exacerbate "spike" reactions to event-driven geopolitical news, and the volatility bogeyman will appear more often. Assuming the behavioral biases continue, investor returns are likely to be very disappointing regardless of the total return generated by financial markets due to the bogeyman effect.
To mitigate this effect, we need to focus on portfolio construction and an improved understanding of diversification. I accept that equities are likely to offer the highest return over the next 10 years, but they also offer the highest volatility. Many portfolio construction optimization tools use historical average volatility, which is likely to underestimate the volatility investors will face. The bogeyman emerges when individual asset class volatility spikes and cross correlations rise, the combination of which increases overall portfolio volatility far beyond expectation. Diversification is meant to protect investors against volatility, but what's the point of owning lots of investments if the volatility bogeyman has not been properly estimated?
Most importantly, portfolios should be constructed to properly represent the behavioral risk-return trade off of investors, remembering that they won't stay invested to realize the return if we get the risk tolerance wrong. In a low growth, higher volatility world, the emphasis is shifting to return consistency rather than return maximization,
PRESIDENT'S MESSAGE (continued)
and investors are best served through investment approaches that appreciate that distinction. Even though it's a permanent feature of financial markets, volatility is less likely to be the bogeyman we all fear if portfolios are constructed with this understanding.
Please visit blog.columbiathreadneedleus.com/latest-perspectives to read the entire article.
Investors should consider the investment objectives, risks, charges and expenses of a mutual fund carefully before investing. For a free prospectus and summary prospectus, which contains this and other important information about a fund, visit investor.columbiathreadneedleus.com. The prospectus should be read carefully before investing.
The views expressed are as of April 2016, may change as market or other conditions change, and may differ from views expressed by other Columbia Management Investment Advisers, LLC (CMIA) associates or affiliates. Actual investments or investment decisions made by CMIA and its affiliates, whether for its own account or on behalf of clients, will not necessarily reflect the views expressed. This information is not intended to provide investment advice and does not account for individual investor circumstances. Investment decisions should always be made based on an investor's specific financial needs, objectives, goals, time horizon and risk tolerance. Asset classes described may not be suitable for all investors.
Past performance does not guarantee future results, and no forecast should be considered a guarantee either. Since economic and market conditions change frequently, there can be no assurance that the trends described here will continue or that the forecasts are accurate.
Diversification does not guarantee a profit or protect against loss.
Columbia Funds are distributed by Columbia Management Investment Distributors, Inc., member FINRA, and managed by Columbia Management Investment Advisers, LLC.
© 2016 Columbia Management Investment Advisers, LLC. All rights reserved.
COLUMBIA GLOBAL TECHNOLOGY GROWTH FUND
Fund Investment Manager
Columbia Management Investment
Advisers, LLC
225 Franklin Street
Boston, MA 02110
Fund Distributor
Columbia Management Investment
Distributors, Inc.
225 Franklin Street
Boston, MA 02110
Fund Transfer Agent
Columbia Management Investment
Services Corp.
P.O. Box 8081
Boston, MA 02266-8081
For more information about any of the funds, please visit investor.columbiathreadneedleus.com or call 800.345.6611. Customer Service Representatives are available to answer your questions Monday through Friday from 8 a.m. to 7 p.m. Eastern time.
The views expressed in this report reflect the current views of the respective parties. These views are not guarantees of future performance and involve certain risks, uncertainties and assumptions that are difficult to predict, so actual outcomes and results may differ significantly from the views expressed. These views are subject to change at any time based upon economic, market or other conditions and the respective parties disclaim any responsibility to update such views. These views may not be relied on as investment advice and, because investment decisions for a Columbia fund are based on numerous factors, may not be relied on as an indication of trading intent on behalf of any particular Columbia fund. References to specific securities should not be construed as a recommendation or investment advice.
Performance Overview | | | 3 | | |
Manager Discussion of Fund Performance | | | 5 | | |
Understanding Your Fund's Expenses | | | 8 | | |
Portfolio of Investments | | | 9 | | |
Statement of Assets and Liabilities | | | 13 | | |
Statement of Operations | | | 15 | | |
Statement of Changes in Net Assets | | | 16 | | |
Financial Highlights | | | 19 | | |
Notes to Financial Statements | | | 27 | | |
Report of Independent Registered Public Accounting Firm | | | 34 | | |
Federal Income Tax Information | | | 35 | | |
Trustees and Officers | | | 36 | | |
Board Consideration and Approval of Management Agreement | | | 41 | | |
Important Information About This Report | | | 45 | | |
COLUMBIA GLOBAL TECHNOLOGY GROWTH FUND
Performance Summary
n Columbia Global Technology Growth Fund (the Fund) Class A shares returned 17.52% excluding sales charges for the 12-month period that ended August 31, 2016.
n The Fund outperformed its benchmark, the Bank of America Merrill Lynch (BofAML) 100 Technology Index, which returned 17.12% for the same period.
n Stock selection aided the Fund's performance versus its benchmark, particularly in the internet software and services, communications equipment, semiconductors and IT services segments.
Average Annual Total Returns (%) (for period ended August 31, 2016)
| | | | | 1 Year | | 5 Years | | 10 Years | |
Class A | | 11/01/02 | | | | | | | | | | | | | |
Excluding sales charges | | | | | | | 17.52 | | | | 17.11 | | | | 9.78 | | |
Including sales charges | | | | | | | 10.76 | | | | 15.73 | | | | 9.13 | | |
Class B | | 11/01/02 | | | | | | | | | | | | | |
Excluding sales charges | | | | | | | 16.63 | | | | 16.24 | | | | 8.96 | | |
Including sales charges | | | | | | | 11.63 | | | | 16.02 | | | | 8.96 | | |
Class C | | 10/13/03 | | | | | | | | | | | | | |
Excluding sales charges | | | | | | | 16.65 | | | | 16.24 | | | | 8.96 | | |
Including sales charges | | | | | | | 15.65 | | | | 16.24 | | | | 8.96 | | |
Class I* | | 03/25/15 | | | 18.02 | | | | 17.47 | | | | 10.08 | | |
Class R4* | | 11/08/12 | | | 17.76 | | | | 17.41 | | | | 10.05 | | |
Class R5* | | 11/08/12 | | | 17.95 | | | | 17.54 | | | | 10.12 | | |
Class Y* | | 03/01/16 | | | 17.95 | | | | 17.43 | | | | 10.06 | | |
Class Z | | 11/09/00 | | | 17.82 | | | | 17.41 | | | | 10.05 | | |
BofAML 100 Technology Index | | | | | | | 17.12 | | | | 13.85 | | | | 7.79 | | |
Returns for Class A are shown with and without the maximum initial sales charge of 5.75%. Returns for Class B are shown with and without the applicable contingent deferred sales charge (CDSC) of 5.00% in the first year, declining to 1.00% in the sixth year and eliminated thereafter. Returns for Class C are shown with and without the 1.00% CDSC for the first year only. The Fund's other classes are not subject to sales charges and have limited eligibility. Please see the Fund's prospectus for details. Performance for different share classes will vary based on differences in sales charges and fees associated with each class. All results shown assume reinvestment of distributions during the period. Returns do not reflect the deduction of taxes that a shareholder may pay on Fund distributions or on the redemption of Fund shares. Performance results reflect the effect of any fee waivers or reimbursements of Fund expenses by Columbia Management Investment Advisers, LLC and/or any of its affiliates. Absent these fee waivers or expense reimbursement arrangements, performance results would have been lower.
The performance information shown represents past performance and is not a guarantee of future results. The investment return and principal value of your investment will fluctuate so that your shares, when redeemed, may be worth more or less than their original cost. Current performance may be lower or higher than the performance information shown. You may obtain performance information current to the most recent month-end by contacting your financial intermediary, visiting investor.columbiathreadneedleus.com or calling 800.345.6611.
*The returns shown for periods prior to the share class inception date (including returns for the Life of the Fund, if shown, which are since Fund inception) include the returns of the Fund's oldest share class. These returns are adjusted to reflect any higher class-related operating expenses of the newer share classes, as applicable. Please visit investor.columbiathreadneedleus.com/investment-products/mutual-funds/appended-performance for more information.
The BofAML 100 Technology Index is an unmanaged equally weighted index of 100 leading technology stocks.
Indices are not available for investment, are not professionally managed and do not reflect sales charges, fees, brokerage commissions, taxes or other expenses of investing. Securities in the Fund may not match those in an index.
Annual Report 2016
3
COLUMBIA GLOBAL TECHNOLOGY GROWTH FUND
PERFORMANCE OVERVIEW (continued)
Performance of a Hypothetical $10,000 Investment (September 1, 2006 – August 31, 2016)

The chart above shows the change in value of a hypothetical $10,000 investment in Class A shares of Columbia Global Technology Growth Fund during the stated time period, and does not reflect the deduction of taxes that a shareholder may pay on Fund distributions or on the redemption of Fund shares.
Annual Report 2016
4
COLUMBIA GLOBAL TECHNOLOGY GROWTH FUND
MANAGER DISCUSSION OF FUND PERFORMANCE
For the 12-month period that ended August 31, 2016, the Fund's Class A shares returned 17.52% excluding sales charge. The Fund outperformed its benchmark, the BofAML 100 Technology Index, which returned 17.12%. Stock selection aided the Fund's performance versus its benchmark, particularly in the internet software and services, communications equipment, semiconductors and IT (information technology) services segments.
A Challenging Year for Global Financial Markets
A host of factors weighed on investors during the first half of the 12-month period ended August 31, 2016: lackluster economic growth, contentious geopolitical conflicts and expectations of a shift in U.S. monetary policy. In December 2015, the U.S. Federal Reserve (the Fed) raised the target range of its benchmark interest rate by a quarter of a point. But the Fed took no further action during the period as subpar global economic growth continued, with China's slowdown heading the list of disappointments. Conflicts in the Middle East and terrorism, both at home and abroad, heightened security fears. Plummeting oil prices and a rising U.S. dollar rounded the list of mounting pressures in 2015.
However, both oil and the dollar reversed course in the second half of the period. The U.S. economy continued to expand modestly, and economic growth in Europe picked up, if ever so slightly. The U.S. manufacturing sector regained some traction in the spring of 2016, and the U.S. labor markets recovered to full employment for the first time since the Great Recession. The vote by the United Kingdom to exit the European Union gave markets a jolt in mid-June, but that downdraft was short lived.
Stock Selection Drove Fund's Performance Advantage
In a year of sharp gains for the information technology sector, the Fund modestly outperformed its benchmark and delivered solid returns for shareholders. Stock selection and allocation decisions figured into the Fund's performance advantage. In the internet software and services segment, an overweight combined with strong stock selection relative to the benchmark. The Fund was overweight in Facebook, which logged a significant advance for the period. Alphabet Class A (Google) and Amazon.com were also strong performers in this segment. All three have been core holdings for the Fund for some time. Yet, we believe they continue to offer the potential for growth as global internet penetration is only approximately 39% and e-commerce represents only 12% to 15% of total global retail sales. The Fund had no exposure to Twitter, which aided relative performance as its shares recorded a double-digit loss for the period. Stock selection within the semiconductor and semiconductor equipment industry benefited results. In the communications equipment and the IT services segments, underweights helped relative performance as both industries lagged the overall performance of the technology sector. Underweights in some of the communications equipment group's biggest losers for the period aided relative results. NVIDIA and Microsoft also were top individual contributors to Fund results. NVIDIA makes semiconductor chips for emerging growth applications, such as data centers, car automation and virtual reality. The company has delivered above-consensus
Portfolio Management
Rahul Narang
Morningstar Style BoxTM

The Morningstar Style BoxTM is based on a fund's portfolio holdings. For equity funds, the vertical axis shows the market capitalization of the stocks owned, and the horizontal axis shows investment style (value, blend, or growth). Information shown is based on the most recent data provided by Morningstar.
© 2016 Morningstar, Inc. All rights reserved. The Morningstar information contained herein: (1) is proprietary to Morningstar and/or its content providers; (2) may not be copied or distributed; and (3) is not warranted to be accurate, complete or timely. Neither Morningstar nor its content providers are responsible for any damages or losses arising from any use of this information.
Investment Risks
Market risk may affect a single issuer, sector of the economy, industry or the market as a whole. The products of technology companies may be subject to severe competition and rapid obsolescence, and technology stocks may be subject to greater price fluctuations. Growth securities, at times, may not perform as well as value securities or the stock market in general and may be out of favor with investors. Foreign investments subject the Fund to risks, including political, economic, market, social and others within a particular country, as well as to currency instabilities and less stringent financial and accounting standards generally applicable to U.S. issuers. Risks are enhanced for emerging market issuers. As a non-diversified fund, fewer investments could have a greater effect on performance. See the Fund's prospectus for more information on these and other risks.
Annual Report 2016
5
COLUMBIA GLOBAL TECHNOLOGY GROWTH FUND
MANAGER DISCUSSION OF FUND PERFORMANCE (continued)
Top Ten Holdings (%)
(at August 31, 2016) | |
Alphabet, Inc., Class A
(United States) | | | 6.1 | | |
Amazon.com, Inc.
(United States) | | | 4.0 | | |
Facebook, Inc., Class A
(United States) | | | 3.2 | | |
Apple, Inc. (United States) | | | 3.2 | | |
Microsoft Corp.
(United States) | | | 3.2 | | |
Visa, Inc., Class A
(United States) | | | 2.9 | | |
Broadcom Ltd. (Singapore) | | | 2.3 | | |
Activision Blizzard, Inc.
(United States) | | | 2.2 | | |
Lam Research Corp.
(United States) | | | 2.2 | | |
Salesforce.com, Inc.
(United States) | | | 2.0 | | |
Percentages indicated are based upon total investments (excluding Money Market Funds).
For further detail about these holdings, please refer to the section entitled "Portfolio of Investments."
Fund holdings are as of the date given, are subject to change at any time, and are not recommendations to buy or sell any security.
revenues and earnings growth. It was one of the best performing stocks in the Fund over the year. A timely shift of its business model to cloud computing aided Microsoft, and an overweight in the stock amplified the impact of its sharp gain on Fund results for the period.
In a period of few disappointments, stock selection in the technology hardware industry was a major drag on relative performance. A significant overweight in Apple detracted from results as fears of maturation in the smartphone market caused the stock to correct. Shares of Eros International, an Indian motion picture production and distribution company, fell sharply as earnings fell short of analysts' expectations and trimmed Fund gains. Positions in Seagate Technology, Akamai Technologies, VMware and Western Digital also lost ground, but underweights in all four stocks, relative to the benchmark, somewhat muted the impact of their results. We eliminated the Fund's positions in Eros International, Seagate Technology and VMware during the period.
Our Investment Process
In constructing the Fund's portfolio, our number one aim is to invest in what we consider to be great businesses regardless of market capitalization or geographic location. We seek to invest in companies with what we believe are sustainable competitive advantages, high barriers to entry and scale and strong returns on assets and earnings. The portfolio includes both growth and value stocks. At period's end, the Fund was overweight in internet-related stocks, with additional emphasis on companies connected to "the internet of things" — the network of physical objects embedded with electronics, software, sensors and network connectivity, which enables these objects to collect and exchange data. The Fund was also overweighted in companies that have been able to shift their business models to the cloud and "big data" — data sets that are so large or complex that traditional processing applications are inadequate to deal with them.
Annual Report 2016
6
COLUMBIA GLOBAL TECHNOLOGY GROWTH FUND
MANAGER DISCUSSION OF FUND PERFORMANCE (continued)
Country Breakdown (%)
(at August 31, 2016) | |
China | | | 5.0 | | |
Germany | | | 0.3 | | |
Guernsey | | | 1.0 | | |
India | | | 0.2 | | |
Israel | | | 0.7 | | |
Netherlands | | | 2.9 | | |
Singapore | | | 2.3 | | |
South Africa | | | 0.2 | | |
Switzerland | | | 1.2 | | |
Taiwan | | | 1.3 | | |
United Kingdom | | | 0.2 | | |
United States(a) | | | 84.7 | | |
Total | | | 100.0 | | |
Country Breakdown is based primarily on issuer's place of organization/incorporation. Percentages indicated are based upon total investments. The Fund's portfolio composition is subject to change.
The Fund may use place of organization/incorporation or other criteria in determining whether an issuer is domestic (U.S.) or foreign for purposes of its investment policies. At August 31, 2016, the Fund invested 59.5% in foreign companies in accordance with its principal investment strategy.
(a) Includes investments in Money Market Funds.
Equity Sector Breakdown (%)
(at August 31, 2016) | |
Consumer Discretionary | | | 7.8 | | |
Financials | | | 0.6 | | |
Industrials | | | 0.5 | | |
Information Technology | | | 90.4 | | |
Telecommunication Services | | | 0.7 | | |
Total | | | 100.0 | | |
Percentages indicated are based upon total equity investments. The Fund's portfolio composition is subject to change.
Annual Report 2016
7
COLUMBIA GLOBAL TECHNOLOGY GROWTH FUND
UNDERSTANDING YOUR FUND'S EXPENSES
(Unaudited)
As an investor, you incur two types of costs. There are transaction costs, which generally include sales charges on purchases and may include redemption fees. There are also ongoing costs, which generally include management fees, distribution and/or service fees, and other fund expenses. The following information is intended to help you understand your ongoing costs (in dollars) of investing in the Fund and to help you compare these costs with the ongoing costs of investing in other mutual funds.
Analyzing Your Fund's Expenses
To illustrate these ongoing costs, we have provided examples and calculated the expenses paid by investors in each share class of the Fund during the period. The actual and hypothetical information in the table is based on an initial investment of $1,000 at the beginning of the period indicated and held for the entire period. Expense information is calculated two ways and each method provides you with different information. The amount listed in the "Actual" column is calculated using the Fund's actual operating expenses and total return for the period. You may use the Actual information, together with the amount invested, to estimate the expenses that you paid over the period. Simply divide your account value by $1,000 (for example, an $8,600 account value divided by $1,000 = 8.6), then multiply the results by the expenses paid during the period under the "Actual" column. The amount listed in the "Hypothetical" column assumes a 5% annual rate of return before expenses (which is not the Fund's actual return) and then applies the Fund's actual expense ratio for the period to the hypothetical return. You should not use the hypothetical account values and expenses to estimate either your actual account balance at the end of the period or the expenses you paid during the period. See "Compare With Other Funds" below for details on how to use the hypothetical data.
Compare With Other Funds
Since all mutual funds are required to include the same hypothetical calculations about expenses in shareholder reports, you can use this information to compare the ongoing cost of investing in the Fund with other funds. To do so, compare the hypothetical example with the 5% hypothetical examples that appear in the shareholder reports of other funds. As you compare hypothetical examples of other funds, it is important to note that hypothetical examples are meant to highlight the ongoing costs of investing in a fund only and do not reflect any transaction costs, such as sales charges, or redemption or exchange fees. Therefore, the hypothetical calculations are useful in comparing ongoing costs only, and will not help you determine the relative total costs of owning different funds. If transaction costs were included in these calculations, your costs would be higher.
March 1, 2016 – August 31, 2016
| | | Account Value at the Beginning of
the Period ($) | | Account Value at the End of
the Period ($) | | Expenses Paid During the
Period ($) | | Fund's Annualized
Expense Ratio (%) | |
| | | Actual | | Hypothetical | | Actual | | Hypothetical | | Actual | | Hypothetical | | Actual | |
Class A | | | 1,000.00 | | | | 1,000.00 | | | | 1,193.10 | | | | 1,018.30 | | | | 7.50 | | | | 6.90 | | | | 1.36 | | |
Class B | | | 1,000.00 | | | | 1,000.00 | | | | 1,188.60 | | | | 1,014.53 | | | | 11.61 | | | | 10.68 | | | | 2.11 | | |
Class C | | | 1,000.00 | | | | 1,000.00 | | | | 1,188.90 | | | | 1,014.53 | | | | 11.61 | | | | 10.68 | | | | 2.11 | | |
Class I | | | 1,000.00 | | | | 1,000.00 | | | | 1,196.30 | | | | 1,020.46 | | | | 5.13 | | | | 4.72 | | | | 0.93 | | |
Class R4 | | | 1,000.00 | | | | 1,000.00 | | | | 1,194.70 | | | | 1,019.51 | | | | 6.18 | | | | 5.69 | | | | 1.12 | | |
Class R5 | | | 1,000.00 | | | | 1,000.00 | | | | 1,196.00 | | | | 1,020.21 | | | | 5.41 | | | | 4.98 | | | | 0.98 | | |
Class Y | | | 1,000.00 | | | | 1,000.00 | | | | 1,161.50 | (a) | | | 1,020.41 | | | | 5.05 | (a) | | | 4.77 | | | | 0.94 | (a) | |
Class Z | | | 1,000.00 | | | | 1,000.00 | | | | 1,195.00 | | | | 1,019.56 | | | | 6.12 | | | | 5.63 | | | | 1.11 | | |
(a) Based on operations from March 1, 2016 (commencement of operations) through the stated period end.
Expenses paid during the period are equal to the annualized expense ratio for each class as indicated above, multiplied by the average account value over the period and then multiplied by the number of days in the Fund's most recent fiscal half year and divided by 366.
Expenses do not include fees and expenses incurred indirectly by the Fund from its investment in underlying funds, including affiliated and non-affiliated pooled investment vehicles, such as mutual funds and exchange-traded funds.
Annual Report 2016
8
COLUMBIA GLOBAL TECHNOLOGY GROWTH FUND
PORTFOLIO OF INVESTMENTS
August 31, 2016
(Percentages represent value of investments compared to net assets)
Common Stocks 98.7%
Issuer | | Shares | | Value ($) | |
CHINA 5.0% | |
58.Com, Inc., ADR(a) | | | 29,140 | | | | 1,325,870 | | |
Alibaba Group Holding Ltd., ADR(a) | | | 76,682 | | | | 7,452,724 | | |
Baidu, Inc., ADR(a) | | | 19,089 | | | | 3,265,555 | | |
Ctrip.com International Ltd., ADR(a) | | | 40,317 | | | | 1,909,010 | | |
NetEase, Inc., ADR | | | 17,927 | | | | 3,799,986 | | |
Tencent Holdings Ltd. | | | 331,300 | | | | 8,585,601 | | |
Total | | | | | 26,338,746 | | |
GERMANY 0.3% | |
Rocket Internet SE(a) | | | 65,000 | | | | 1,385,194 | | |
GUERNSEY 1.0% | |
Amdocs Ltd. | | | 85,585 | | | | 5,145,370 | | |
INDIA 0.2% | |
Videocon d2h Ltd. ADR(a) | | | 119,144 | | | | 1,162,845 | | |
ISRAEL 0.7% | |
Check Point Software Technologies Ltd.(a) | | | 34,956 | | | | 2,682,523 | | |
CyberArk Software Ltd.(a) | | | 23,340 | | | | 1,232,352 | | |
Total | | | | | 3,914,875 | | |
NETHERLANDS 2.9% | |
| ASML Holding NV | | | 42,304 | | | | 4,507,491 | | |
Mobileye NV(a) | | | 39,240 | | | | 1,918,444 | | |
NXP Semiconductors NV(a) | | | 96,505 | | | | 8,494,370 | | |
Total | | | | | 14,920,305 | | |
SINGAPORE 2.3% | |
Broadcom Ltd. | | | 68,173 | | | | 12,027,081 | | |
SOUTH AFRICA 0.2% | |
MiX Telematics Ltd., ADR | | | 203,000 | | | | 1,012,970 | | |
SWITZERLAND 1.2% | |
TE Connectivity Ltd. | | | 55,597 | | | | 3,534,301 | | |
VAT Group AG(a) | | | 36,450 | | | | 2,768,355 | | |
Total | | | | | 6,302,656 | | |
TAIWAN 1.3% | |
Taiwan Semiconductor
Manufacturing Co., Ltd., ADR | | | 243,954 | | | | 7,011,238 | | |
UNITED KINGDOM 0.2% | |
Auto Trader Group PLC | | | 200,000 | | | | 979,872 | | |
Common Stocks (continued)
Issuer | | Shares | | Value ($) | |
UNITED STATES 83.4% | |
Accenture PLC, Class A | | | 54,131 | | | | 6,225,065 | | |
Activision Blizzard, Inc. | | | 270,983 | | | | 11,210,567 | | |
Adobe Systems, Inc.(a) | | | 55,869 | | | | 5,715,957 | | |
Akamai Technologies, Inc.(a) | | | 66,417 | | | | 3,646,293 | | |
Alliance Data Systems Corp.(a) | | | 13,320 | | | | 2,725,006 | | |
Alphabet, Inc., Class A(a) | | | 40,097 | | | | 31,670,615 | | |
Amazon.com, Inc.(a) | | | 26,693 | | | | 20,531,188 | | |
Amphenol Corp., Class A | | | 88,604 | | | | 5,520,915 | | |
Analog Devices, Inc. | | | 53,573 | | | | 3,351,527 | | |
ANSYS, Inc.(a) | | | 13,707 | | | | 1,303,399 | | |
Apple, Inc. | | | 156,281 | | | | 16,581,414 | | |
Applied Materials, Inc. | | | 278,034 | | | | 8,296,535 | | |
Applied Optoelectronics, Inc.(a) | | | 114,825 | | | | 1,934,801 | | |
Autodesk, Inc.(a) | | | 51,027 | | | | 3,439,220 | | |
Automatic Data Processing, Inc. | | | 33,244 | | | | 2,985,644 | | |
Blackhawk Network Holdings, Inc.(a) | | | 4,472 | | | | 153,166 | | |
CA, Inc. | | | 72,610 | | | | 2,462,205 | | |
Cavium, Inc.(a) | | | 55,135 | | | | 3,069,917 | | |
CDW Corp. | | | 56,460 | | | | 2,520,939 | | |
Cisco Systems, Inc. | | | 297,810 | | | | 9,363,146 | | |
Citrix Systems, Inc.(a) | | | 29,259 | | | | 2,551,385 | | |
Cognizant Technology Solutions Corp.,
Class A(a) | | | 51,085 | | | | 2,934,322 | | |
Comcast Corp., Class A | | | 98,712 | | | | 6,441,945 | | |
Corning, Inc. | | | 219,172 | | | | 4,973,013 | | |
CoStar Group, Inc.(a) | | | 15,920 | | | | 3,299,420 | | |
Cypress Semiconductor Corp. | | | 218,825 | | | | 2,610,582 | | |
eBay, Inc.(a) | | | 57,610 | | | | 1,852,738 | | |
Electronic Arts, Inc.(a) | | | 65,224 | | | | 5,298,146 | | |
EMC Corp. | | | 96,018 | | | | 2,783,562 | | |
Equinix, Inc. | | | 8,641 | | | | 3,185,505 | | |
Expedia, Inc. | | | 12,365 | | | | 1,349,269 | | |
Facebook, Inc., Class A(a) | | | 131,727 | | | | 16,613,409 | | |
Fidelity National Information Services, Inc. | | | 69,727 | | | | 5,531,443 | | |
Fiserv, Inc.(a) | | | 48,172 | | | | 4,964,125 | | |
FleetCor Technologies, Inc.(a) | | | 23,251 | | | | 3,817,814 | | |
Gartner, Inc.(a) | | | 14,050 | | | | 1,278,550 | | |
Global Payments, Inc. | | | 32,405 | | | | 2,461,160 | | |
The accompanying Notes to Financial Statements are an integral part of this statement.
Annual Report 2016
9
COLUMBIA GLOBAL TECHNOLOGY GROWTH FUND
PORTFOLIO OF INVESTMENTS (continued)
August 31, 2016
Common Stocks (continued)
Issuer | | Shares | | Value ($) | |
Guidewire Software, Inc.(a) | | | 33,331 | | | | 2,050,856 | | |
Harris Corp. | | | 16,940 | | | | 1,575,081 | | |
Hewlett Packard Enterprise Co. | | | 241,758 | | | | 5,192,962 | | |
Integrated Device Technology, Inc.(a) | | | 65,000 | | | | 1,305,850 | | |
Intel Corp. | | | 167,619 | | | | 6,015,846 | | |
International Business Machines Corp. | | | 31,751 | | | | 5,044,599 | | |
Intuit, Inc. | | | 51,944 | | | | 5,789,159 | | |
KLA-Tencor Corp. | | | 20,000 | | | | 1,385,200 | | |
Lam Research Corp. | | | 119,495 | | | | 11,151,273 | | |
Lattice Semiconductor Corp.(a) | | | 240,062 | | | | 1,476,381 | | |
MasterCard, Inc., Class A | | | 38,490 | | | | 3,719,289 | | |
Maxim Integrated Products, Inc. | | | 144,505 | | | | 5,884,244 | | |
Microchip Technology, Inc. | | | 105,546 | | | | 6,534,353 | | |
Micron Technology, Inc.(a) | | | 389,018 | | | | 6,414,907 | | |
Microsemi Corp.(a) | | | 102,650 | | | | 4,101,894 | | |
Microsoft Corp. | | | 285,859 | | | | 16,425,458 | | |
Motorola Solutions, Inc. | | | 35,593 | | | | 2,740,305 | | |
NetApp, Inc. | | | 37,490 | | | | 1,296,779 | | |
Netflix, Inc.(a) | | | 20,336 | | | | 1,981,743 | | |
NVIDIA Corp. | | | 133,972 | | | | 8,217,842 | | |
Oracle Corp. | | | 79,631 | | | | 3,282,390 | | |
Palo Alto Networks, Inc.(a) | | | 19,587 | | | | 2,608,401 | | |
PayPal Holdings, Inc.(a) | | | 65,843 | | | | 2,446,067 | | |
Power Integrations, Inc. | | | 32,350 | | | | 1,889,240 | | |
Priceline Group, Inc. (The)(a) | | | 4,656 | | | | 6,596,295 | | |
PTC, Inc.(a) | | | 47,032 | | | | 2,006,855 | | |
QUALCOMM, Inc. | | | 82,874 | | | | 5,226,863 | | |
Red Hat, Inc.(a) | | | 36,332 | | | | 2,651,509 | | |
Sabre Corp. | | | 137,966 | | | | 3,883,743 | | |
Salesforce.com, Inc.(a) | | | 131,957 | | | | 10,480,025 | | |
SBA Communications Corp., Class A(a) | | | 31,058 | | | | 3,545,271 | | |
Science Applications International Corp. | | | 33,177 | | | | 2,117,024 | | |
ServiceNow, Inc.(a) | | | 54,925 | | | | 3,991,400 | | |
Common Stocks (continued)
Issuer | | Shares | | Value ($) | |
Skyworks Solutions, Inc. | | | 78,262 | | | | 5,858,693 | | |
Splunk, Inc.(a) | | | 72,334 | | | | 4,212,732 | | |
SPS Commerce, Inc.(a) | | | 40,182 | | | | 2,623,081 | | |
SS&C Technologies Holdings, Inc. | | | 72,962 | | | | 2,404,098 | | |
Symantec Corp. | | | 87,995 | | | | 2,123,319 | | |
Synopsys, Inc.(a) | | | 101,606 | | | | 6,024,220 | | |
Tableau Software, Inc., Class A(a) | | | 31,600 | | | | 1,833,748 | | |
Texas Instruments, Inc. | | | 92,672 | | | | 6,444,411 | | |
Total System Services, Inc. | | | 88,700 | | | | 4,368,475 | | |
Tyler Technologies, Inc.(a) | | | 14,945 | | | | 2,450,233 | | |
Vantiv, Inc., Class A(a) | | | 87,056 | | | | 4,678,389 | | |
VeriSign, Inc.(a) | | | 44,102 | | | | 3,283,394 | | |
Visa, Inc., Class A | | | 183,133 | | | | 14,815,460 | | |
Western Digital Corp. | | | 77,611 | | | | 3,622,105 | | |
Workiva, Inc.(a) | | | 74,595 | | | | 1,332,267 | | |
Xilinx, Inc. | | | 91,691 | | | | 4,970,569 | | |
Zendesk, Inc.(a) | | | 44,658 | | | | 1,363,855 | | |
Total | | | | | 436,092,060 | | |
Total Common Stocks
(Cost: $383,322,612) | | | | | 516,293,212 | | |
Money Market Funds 1.3%
| | | Shares | | Value ($) | |
Columbia Short-Term Cash Fund,
0.415%(b)(c) | | | 6,995,170 | | | | 6,995,170 | | |
Total Money Market Funds
(Cost: $6,995,170) | | | | | 6,995,170 | | |
Total Investments
(Cost: $390,317,782) | | | | | 523,288,382 | | |
Other Assets & Liabilities, Net | | | | | (174,321 | ) | |
Net Assets | | | | | 523,114,061 | | |
The accompanying Notes to Financial Statements are an integral part of this statement.
Annual Report 2016
10
COLUMBIA GLOBAL TECHNOLOGY GROWTH FUND
PORTFOLIO OF INVESTMENTS (continued)
August 31, 2016
Notes to Portfolio of Investments
(a) Non-income producing investment.
(b) The rate shown is the seven-day current annualized yield at August 31, 2016.
(c) As defined in the Investment Company Act of 1940, an affiliated company is one in which the Fund owns 5% or more of the company's outstanding voting securities, or a company which is under common ownership or control with the Fund. Holdings and transactions in these affiliated companies during the year ended August 31, 2016 are as follows:
Issuer | | Beginning
Cost ($) | | Purchase
Cost ($) | | Proceeds
From Sales ($) | | Ending
Cost ($) | | Dividends —
Affiliated
Issuers ($) | | Value ($) | |
Columbia Short-Term Cash Fund | | | 12,140,396 | | | | 158,545,388 | | | | (163,690,614 | ) | | | 6,995,170 | | | | 39,183 | | | | 6,995,170 | | |
Abbreviation Legend
ADR American Depositary Receipt
Fair Value Measurements
The Fund categorizes its fair value measurements according to a three-level hierarchy that maximizes the use of observable inputs and minimizes the use of unobservable inputs by prioritizing that the most observable input be used when available. Observable inputs are those that market participants would use in pricing an investment based on market data obtained from sources independent of the reporting entity. Unobservable inputs are those that reflect the Fund's assumptions about the information market participants would use in pricing an investment. An investment's level within the fair value hierarchy is based on the lowest level of any input that is deemed significant to the asset's or liability's fair value measurement. The input levels are not necessarily an indication of the risk or liquidity associated with investments at that level. For example, certain U.S. government securities are generally high quality and liquid, however, they are reflected as Level 2 because the inputs used to determine fair value may not always be quoted prices in an active market.
Fair value inputs are summarized in the three broad levels listed below:
> Level 1 — Valuations based on quoted prices for investments in active markets that the Fund has the ability to access at the measurement date (including NAV for open-end mutual funds). Valuation adjustments are not applied to Level 1 investments.
> Level 2 — Valuations based on other significant observable inputs (including quoted prices for similar securities, interest rates, prepayment speeds, credit risks, etc.).
> Level 3 — Valuations based on significant unobservable inputs (including the Fund's own assumptions and judgment in determining the fair value of investments).
Inputs that are used in determining fair value of an investment may include price information, credit data, volatility statistics, and other factors. These inputs can be either observable or unobservable. The availability of observable inputs can vary between investments, and is affected by various factors such as the type of investment, and the volume and level of activity for that investment or similar investments in the marketplace. The inputs will be considered by the Investment Manager, along with any other relevant factors in the calculation of an investment's fair value. The Fund uses prices and inputs that are current as of the measurement date, which may include periods of market dislocations. During these periods, the availability of prices and inputs may be reduced for many investments. This condition could cause an investment to be reclassified between the various levels within the hierarchy.
Foreign equity securities actively traded in markets where there is a significant delay in the local close relative to the New York Stock Exchange (NYSE) are classified as Level 2. The values of these securities may include an adjustment to reflect the impact of significant market movements following the close of local trading, as described in Note 2 to the financial statements — Security Valuation.
Certain investments that have been measured at fair value using the net asset value per share (or its equivalent) are not categorized in the fair value hierarchy. The fair value amounts presented in the table are intended to reconcile the fair value hierarchy to the amounts presented in the Portfolio of Investments. The Columbia Short-Term Cash Fund seeks to provide shareholders with maximum current income consistent with liquidity and stability of principal. Investments in Columbia Short-Term Cash Fund may be redeemed on a daily basis without restriction.
Investments falling into the Level 3 category are primarily supported by quoted prices from brokers and dealers participating in the market for those investments. However, these may be classified as Level 3 investments due to lack of market transparency and corroboration to support these quoted prices. Additionally, valuation models may be used as the pricing source for any remaining investments classified as Level 3. These models may rely on one or more significant unobservable inputs and/or significant assumptions by the Investment Manager. Inputs used in valuations may include, but are not limited to, financial statement analysis, capital account balances, discount rates and estimated cash flows, and comparable company data.
Under the direction of the Fund's Board of Trustees (the Board), the Investment Manager's Valuation Committee (the Committee) is responsible for overseeing the valuation procedures approved by the Board. The Committee consists of voting and non-voting members from various groups within the Investment Manager's organization, including operations and accounting, trading and investments, compliance, risk management and legal.
The accompanying Notes to Financial Statements are an integral part of this statement.
Annual Report 2016
11
COLUMBIA GLOBAL TECHNOLOGY GROWTH FUND
PORTFOLIO OF INVESTMENTS (continued)
August 31, 2016
Fair Value Measurements (continued)
The Committee meets at least monthly to review and approve valuation matters, which may include a description of specific valuation determinations, data regarding pricing information received from approved pricing vendors and brokers and the results of Board-approved valuation control policies and procedures (the Policies). The Policies address, among other things, instances when market quotations are or are not readily available, including recommendations of third party pricing vendors and a determination of appropriate pricing methodologies; events that require specific valuation determinations and assessment of fair value techniques; securities with a potential for stale pricing, including those that are illiquid, restricted, or in default; and the effectiveness of third party pricing vendors, including periodic reviews of vendors. The Committee meets more frequently, as needed, to discuss additional valuation matters, which may include the need to review back-testing results, review time-sensitive information or approve related valuation actions. The Committee reports to the Board, with members of the Committee meeting with the Board at each of its regularly scheduled meetings to discuss valuation matters and actions during the period, similar to those described earlier.
For investments categorized as Level 3, the Committee monitors information similar to that described above, which may include: (i) data specific to the issuer or comparable issuers, (ii) general market or specific sector news and (iii) quoted prices and specific or similar security transactions. The Committee considers this data and any changes from prior periods in order to assess the reasonableness of observable and unobservable inputs, any assumptions or internal models used to value those securities and changes in fair value. This data is also used to corroborate, when available, information received from approved pricing vendors and brokers. Various factors impact the frequency of monitoring this information (which may occur as often as daily). However, the Committee may determine that changes to inputs, assumptions and models are not required as a result of the monitoring procedures performed.
The following table is a summary of the inputs used to value the Fund's investments at August 31, 2016:
| | | Level 1
Quoted Prices in Active
Markets for Identical
Assets ($) | | Level 2
Other Significant
Observable Inputs ($) | | Level 3
Significant
Unobservable Inputs ($) | | Total ($) | |
Investments | |
Common Stocks | |
China | | | 17,753,145 | | | | 8,585,601 | | | | — | | | | 26,338,746 | | |
Germany | | | — | | | | 1,385,194 | | | | — | | | | 1,385,194 | | |
Guernsey | | | 5,145,370 | | | | — | | | | — | | | | 5,145,370 | | |
India | | | 1,162,845 | | | | — | | | | — | | | | 1,162,845 | | |
Israel | | | 3,914,875 | | | | — | | | | — | | | | 3,914,875 | | |
Netherlands | | | 14,920,305 | | | | — | | | | — | | | | 14,920,305 | | |
Singapore | | | 12,027,081 | | | | — | | | | — | | | | 12,027,081 | | |
South Africa | | | 1,012,970 | | | | — | | | | — | | | | 1,012,970 | | |
Switzerland | | | 3,534,301 | | | | 2,768,355 | | | | — | | | | 6,302,656 | | |
Taiwan | | | 7,011,238 | | | | — | | | | — | | | | 7,011,238 | | |
United Kingdom | | | — | | | | 979,872 | | | | — | | | | 979,872 | | |
United States | | | 436,092,060 | | | | — | | | | — | | | | 436,092,060 | | |
Total Common Stocks | | | 502,574,190 | | | | 13,719,022 | | | | — | | | | 516,293,212 | | |
Investments measured at net asset value | |
Money Market Funds | | | — | | | | — | | | | — | | | | 6,995,170 | | |
Total Investments | | | 502,574,190 | | | | 13,719,022 | | | | — | | | | 523,288,382 | | |
See the Portfolio of Investments for all investment classifications not indicated in the table.
The Fund's assets assigned to the Level 2 input category are generally valued using the market approach, in which a security's value is determined through reference to prices and information from market transactions for similar or identical assets. These assets include certain foreign securities for which a third party statistical pricing service may be employed for purposes of fair market valuation. The model utilized by such third party statistical pricing service takes into account a security's correlation to available market data including, but not limited to, intraday index, ADR, and exchange-traded fund movements.
There were no transfers of financial assets between levels during the period.
The accompanying Notes to Financial Statements are an integral part of this statement.
Annual Report 2016
12
COLUMBIA GLOBAL TECHNOLOGY GROWTH FUND
STATEMENT OF ASSETS AND LIABILITIES
August 31, 2016
Assets | |
Investments, at value | |
Unaffiliated issuers (identified cost $383,322,612) | | $ | 516,293,212 | | |
Affiliated issuers (identified cost $6,995,170) | | | 6,995,170 | | |
Total investments (identified cost $390,317,782) | | | 523,288,382 | | |
Receivable for: | |
Investments sold | | | 4,293,306 | | |
Capital shares sold | | | 736,119 | | |
Dividends | | | 536,835 | | |
Prepaid expenses | | | 4,339 | | |
Trustees' deferred compensation plan | | | 37,049 | | |
Other assets | | | 6,686 | | |
Total assets | | | 528,902,716 | | |
Liabilities | |
Payable for: | |
Investments purchased | | | 4,230,366 | | |
Capital shares purchased | | | 1,377,706 | | |
Management services fees | | | 12,451 | | |
Distribution and/or service fees | | | 2,808 | | |
Transfer agent fees | | | 82,317 | | |
Compensation of board members | | | 72 | | |
Chief compliance officer expenses | | | 39 | | |
Other expenses | | | 45,847 | | |
Trustees' deferred compensation plan | | | 37,049 | | |
Total liabilities | | | 5,788,655 | | |
Net assets applicable to outstanding capital stock | | $ | 523,114,061 | | |
Represented by | |
Paid-in capital | | $ | 394,649,344 | | |
Excess of distributions over net investment income | | | (764,523 | ) | |
Accumulated net realized loss | | | (3,741,535 | ) | |
Unrealized appreciation (depreciation) on: | |
Investments | | | 132,970,600 | | |
Foreign currency translations | | | 175 | | |
Total — representing net assets applicable to outstanding capital stock | | $ | 523,114,061 | | |
The accompanying Notes to Financial Statements are an integral part of this statement.
Annual Report 2016
13
COLUMBIA GLOBAL TECHNOLOGY GROWTH FUND
STATEMENT OF ASSETS AND LIABILITIES (continued)
August 31, 2016
Class A | |
Net assets | | $ | 165,270,506 | | |
Shares outstanding | | | 7,799,123 | | |
Net asset value per share | | $ | 21.19 | | |
Maximum offering price per share(a) | | $ | 22.48 | | |
Class B | |
Net assets | | $ | 272,184 | | |
Shares outstanding | | | 14,162 | | |
Net asset value per share | | $ | 19.22 | | |
Class C | |
Net assets | | $ | 60,684,472 | | |
Shares outstanding | | | 3,151,287 | | |
Net asset value per share | | $ | 19.26 | | |
Class I | |
Net assets | | $ | 36,734,671 | | |
Shares outstanding | | | 1,594,527 | | |
Net asset value per share | | $ | 23.04 | | |
Class R4 | |
Net assets | | $ | 7,235,268 | | |
Shares outstanding | | | 325,750 | | |
Net asset value per share | | $ | 22.21 | | |
Class R5 | |
Net assets | | $ | 18,491,991 | | |
Shares outstanding | | | 828,225 | | |
Net asset value per share | | $ | 22.33 | | |
Class Y | |
Net assets | | $ | 675,309 | | |
Shares outstanding | | | 30,183 | | |
Net asset value per share | | $ | 22.37 | | |
Class Z | |
Net assets | | $ | 233,749,660 | | |
Shares outstanding | | | 10,654,985 | | |
Net asset value per share | | $ | 21.94 | | |
(a) The maximum offering price per share is calculated by dividing the net asset value per share by 1.0 minus the maximum sales charge of 5.75%.
The accompanying Notes to Financial Statements are an integral part of this statement.
Annual Report 2016
14
COLUMBIA GLOBAL TECHNOLOGY GROWTH FUND
STATEMENT OF OPERATIONS
Year Ended August 31, 2016
Net investment income | |
Income: | |
Dividends — unaffiliated issuers | | $ | 5,514,978 | | |
Dividends — affiliated issuers | | | 39,183 | | |
Foreign taxes withheld | | | (66,887 | ) | |
Total income | | | 5,487,274 | | |
Expenses: | |
Management services fees | | | 4,139,072 | | |
Distribution and/or service fees | |
Class A | | | 379,362 | | |
Class B | | | 6,362 | | |
Class C | | | 516,075 | | |
Transfer agent fees | |
Class A | | | 280,139 | | |
Class B | | | 1,175 | | |
Class C | | | 95,298 | | |
Class R4 | | | 14,257 | | |
Class R5 | | | 6,926 | | |
Class Z | | | 362,802 | | |
Compensation of board members | | | 24,170 | | |
Custodian fees | | | 16,354 | | |
Printing and postage fees | | | 49,063 | | |
Registration fees | | | 111,513 | | |
Audit fees | | | 29,777 | | |
Legal fees | | | 13,395 | | |
Chief compliance officer expenses | | | 234 | | |
Other | | | 34,647 | | |
Total expenses | | | 6,080,621 | | |
Expense reductions | | | (340 | ) | |
Total net expenses | | | 6,080,281 | | |
Net investment loss | | | (593,007 | ) | |
Realized and unrealized gain (loss) — net | |
Net realized gain (loss) on: | |
Investments | | | (2,717,331 | ) | |
Foreign currency translations | | | (23,319 | ) | |
Net realized loss | | | (2,740,650 | ) | |
Net change in unrealized appreciation (depreciation) on: | |
Investments | | | 76,882,591 | | |
Foreign currency translations | | | 175 | | |
Net change in unrealized appreciation | | | 76,882,766 | | |
Net realized and unrealized gain | | | 74,142,116 | | |
Net increase in net assets resulting from operations | | $ | 73,549,109 | | |
The accompanying Notes to Financial Statements are an integral part of this statement.
Annual Report 2016
15
COLUMBIA GLOBAL TECHNOLOGY GROWTH FUND
STATEMENT OF CHANGES IN NET ASSETS
| | | Year Ended
August 31,
2016 | | Year Ended
August 31,
2015 | |
Operations | |
Net investment loss | | $ | (593,007 | ) | | $ | (925,875 | ) | |
Net realized gain (loss) | | | (2,740,650 | ) | | | 11,319,242 | | |
Net change in unrealized appreciation (depreciation) | | | 76,882,766 | | | | (21,322 | ) | |
Net increase in net assets resulting from operations | | | 73,549,109 | | | | 10,372,045 | | |
Distributions to shareholders | |
Net investment income | |
Class A | | | — | | | | (404,060 | ) | |
Class B | | | — | | | | (3,716 | ) | |
Class C | | | — | | | | (52,091 | ) | |
Class R4 | | | — | | | | (20,592 | ) | |
Class R5 | | | — | | | | (16,532 | ) | |
Class Z | | | — | | | | (663,608 | ) | |
Net realized gains | |
Class A | | | (2,872,767 | ) | | | (3,763,868 | ) | |
Class B | | | (16,243 | ) | | | (76,169 | ) | |
Class C | | | (988,151 | ) | | | (1,067,669 | ) | |
Class I | | | (1,050,912 | ) | | | — | | |
Class R4 | | | (208,970 | ) | | | (161,967 | ) | |
Class R5 | | | (246,859 | ) | | | (118,927 | ) | |
Class Z | | | (3,498,455 | ) | | | (5,219,687 | ) | |
Total distributions to shareholders | | | (8,882,357 | ) | | | (11,568,886 | ) | |
Increase in net assets from capital stock activity | | | 70,263,003 | | | | 166,396,812 | | |
Total increase in net assets | | | 134,929,755 | | | | 165,199,971 | | |
Net assets at beginning of year | | | 388,184,306 | | | | 222,984,335 | | |
Net assets at end of year | | $ | 523,114,061 | | | $ | 388,184,306 | | |
Excess of distributions over net investment income | | $ | (764,523 | ) | | $ | (33,644 | ) | |
The accompanying Notes to Financial Statements are an integral part of this statement.
Annual Report 2016
16
COLUMBIA GLOBAL TECHNOLOGY GROWTH FUND
STATEMENT OF CHANGES IN NET ASSETS (continued)
| | | Year Ended August 31, 2016(a) | | Year Ended August 31, 2015(b) | |
| | | Shares | | Dollars ($) | | Shares | | Dollars ($) | |
Capital stock activity | |
Class A shares | |
Subscriptions(c) | | | 4,374,319 | | | | 84,281,813 | | | | 4,400,264 | | | | 82,218,947 | | |
Distributions reinvested | | | 141,756 | | | | 2,725,965 | | | | 220,321 | | | | 3,994,415 | | |
Redemptions | | | (3,854,626 | ) | | | (72,302,813 | ) | | | (2,085,187 | ) | | | (38,219,187 | ) | |
Net increase | | | 661,449 | | | | 14,704,965 | | | | 2,535,398 | | | | 47,994,175 | | |
Class B shares | |
Subscriptions | | | 1,102 | | | | 20,075 | | | | 3,546 | | | | 61,053 | | |
Distributions reinvested | | | 876 | | | | 15,360 | | | | 4,374 | | | | 73,009 | | |
Redemptions(c) | | | (56,400 | ) | | | (968,447 | ) | | | (61,049 | ) | | | (1,036,587 | ) | |
Net decrease | | | (54,422 | ) | | | (933,012 | ) | | | (53,129 | ) | | | (902,525 | ) | |
Class C shares | |
Subscriptions | | | 1,315,029 | | | | 23,084,042 | | | | 1,230,766 | | | | 21,167,794 | | |
Distributions reinvested | | | 38,728 | | | | 680,449 | | | | 41,819 | | | | 699,211 | | |
Redemptions | | | (557,277 | ) | | | (9,704,458 | ) | | | (212,634 | ) | | | (3,640,264 | ) | |
Net increase | | | 796,480 | | | | 14,060,033 | | | | 1,059,951 | | | | 18,226,741 | | |
Class I shares | |
Subscriptions | | | 2,141,999 | | | | 42,521,533 | | | | 1,741,813 | | | | 36,140,802 | | |
Distributions reinvested | | | 50,419 | | | | 1,050,737 | | | | — | | | | — | | |
Redemptions | | | (2,221,606 | ) | | | (47,579,454 | ) | | | (118,098 | ) | | | (2,430,540 | ) | |
Net increase (decrease) | | | (29,188 | ) | | | (4,007,184 | ) | | | 1,623,715 | | | | 33,710,262 | | |
Class R4 shares | |
Subscriptions | | | 421,575 | | | | 8,571,397 | | | | 462,980 | | | | 9,048,769 | | |
Distributions reinvested | | | 10,386 | | | | 208,970 | | | | 9,654 | | | | 182,559 | | |
Redemptions | | | (541,184 | ) | | | (10,580,589 | ) | | | (81,844 | ) | | | (1,575,194 | ) | |
Net increase (decrease) | | | (109,223 | ) | | | (1,800,222 | ) | | | 390,790 | | | | 7,656,134 | | |
Class R5 shares | |
Subscriptions | | | 601,554 | | | | 12,306,139 | | | | 467,347 | | | | 9,146,520 | | |
Distributions reinvested | | | 12,212 | | | | 246,806 | | | | 7,137 | | | | 135,326 | | |
Redemptions | | | (302,939 | ) | | | (5,861,084 | ) | | | (124,027 | ) | | | (2,408,969 | ) | |
Net increase | | | 310,827 | | | | 6,691,861 | | | | 350,457 | | | | 6,872,877 | | |
Class Y shares | |
Subscriptions | | | 33,561 | | | | 723,994 | | | | — | | | | — | | |
Redemptions | | | (3,378 | ) | | | (72,930 | ) | | | — | | | | — | | |
Net increase | | | 30,183 | | | | 651,064 | | | | — | | | | — | | |
The accompanying Notes to Financial Statements are an integral part of this statement.
Annual Report 2016
17
COLUMBIA GLOBAL TECHNOLOGY GROWTH FUND
STATEMENT OF CHANGES IN NET ASSETS (continued)
| | | Year Ended August 31, 2016(a) | | Year Ended August 31, 2015(b) | |
| | | Shares | | Dollars ($) | | Shares | | Dollars ($) | |
Capital stock activity (continued) | |
Class Z shares | |
Subscriptions | | | 5,624,845 | | | | 112,031,032 | | | | 4,539,525 | | | | 85,885,011 | | |
Distributions reinvested | | | 123,140 | | | | 2,446,794 | | | | 206,671 | | | | 3,860,616 | | |
Redemptions | | | (3,838,360 | ) | | | (73,582,328 | ) | | | (1,962,918 | ) | | | (36,906,479 | ) | |
Net increase | | | 1,909,625 | | | | 40,895,498 | | | | 2,783,278 | | | | 52,839,148 | | |
Total net increase | | | 3,515,731 | | | | 70,263,003 | | | | 8,690,460 | | | | 166,396,812 | | |
(a) Class Y shares are based on operations from March 1, 2016 (commencement of operations) through the stated period end.
(b) Class I shares are based on operations from March 25, 2015 (commencement of operations) through the stated period end.
(c) Includes conversions of Class B shares to Class A shares, if any.
The accompanying Notes to Financial Statements are an integral part of this statement.
Annual Report 2016
18
COLUMBIA GLOBAL TECHNOLOGY GROWTH FUND
The following tables are intended to help you understand the Fund's financial performance. Certain information reflects financial results for a single share of a class held for the periods shown. Per share net investment income (loss) amounts are calculated based on average shares outstanding during the period. Total return assumes reinvestment of all dividends and distributions, if any. Total return does not reflect payment of sales charges, if any. Total return and portfolio turnover are not annualized for periods of less than one year. The portfolio turnover rate is calculated without regard to purchase and sales transactions of short-term instruments and certain derivatives, if any. If such transactions were included, the Fund's portfolio turnover rate may be higher.
| | | Year Ended August 31, | |
Class A | | 2016 | | 2015 | | 2014 | | 2013 | | 2012 | |
Per share data | |
Net asset value, beginning of period | | $ | 18.36 | | | $ | 18.18 | | | $ | 13.47 | | | $ | 10.87 | | | $ | 10.25 | | |
Income from investment operations: | |
Net investment loss | | | (0.04 | ) | | | (0.07 | ) | | | (0.09 | ) | | | (0.04 | ) | | | (0.08 | ) | |
Net realized and unrealized gain | | | 3.22 | | | | 1.10 | | | | 4.80 | | | | 2.64 | | | | 0.70 | | |
Total from investment operations | | | 3.18 | | | | 1.03 | | | | 4.71 | | | | 2.60 | | | | 0.62 | | |
Less distributions to shareholders: | |
Net investment income | | | — | | | | (0.09 | ) | | | — | | | | — | | | | — | | |
Net realized gains | | | (0.35 | ) | | | (0.76 | ) | | | — | | | | — | | | | — | | |
Total distributions to shareholders | | | (0.35 | ) | | | (0.85 | ) | | | — | | | | — | | | | — | | |
Net asset value, end of period | | $ | 21.19 | | | $ | 18.36 | | | $ | 18.18 | | | $ | 13.47 | | | $ | 10.87 | | |
Total return | | | 17.52 | % | | | 5.70 | % | | | 34.97 | % | | | 23.92 | % | | | 6.05 | % | |
Ratios to average net assets(a) | |
Total gross expenses | | | 1.36 | % | | | 1.40 | % | | | 1.42 | % | | | 1.49 | % | | | 1.39 | % | |
Total net expenses(b) | | | 1.36 | %(c) | | | 1.40 | %(c) | | | 1.42 | %(c) | | | 1.46 | %(c) | | | 1.39 | %(c) | |
Net investment loss | | | (0.21 | %) | | | (0.37 | %) | | | (0.55 | %) | | | (0.36 | %) | | | (0.80 | %) | |
Supplemental data | |
Net assets, end of period (in thousands) | | $ | 165,271 | | | $ | 131,079 | | | $ | 83,656 | | | $ | 53,711 | | | $ | 50,574 | | |
Portfolio turnover | | | 55 | % | | | 60 | % | | | 68 | % | | | 135 | % | | | 220 | % | |
Notes to Financial Highlights
(a) In addition to the fees and expenses that the Fund bears directly, the Fund indirectly bears a pro rata share of the fees and expenses of any other funds in which it invests. Such indirect expenses are not included in the Fund's reported expense ratios.
(b) Total net expenses include the impact of certain fee waivers/expense reimbursements made by the Investment Manager and certain of its affiliates, if applicable.
(c) The benefits derived from expense reductions had an impact of less than 0.01%.
The accompanying Notes to Financial Statements are an integral part of this statement.
Annual Report 2016
19
COLUMBIA GLOBAL TECHNOLOGY GROWTH FUND
FINANCIAL HIGHLIGHTS (continued)
| | | Year Ended August 31, | |
Class B | | 2016 | | 2015 | | 2014 | | 2013 | | 2012 | |
Per share data | |
Net asset value, beginning of period | | $ | 16.81 | | | $ | 16.79 | | | $ | 12.53 | | | $ | 10.19 | | | $ | 9.68 | | |
Income from investment operations: | |
Net investment loss | | | (0.17 | ) | | | (0.18 | ) | | | (0.20 | ) | | | (0.12 | ) | | | (0.15 | ) | |
Net realized and unrealized gain | | | 2.93 | | | | 1.00 | | | | 4.46 | | | | 2.46 | | | | 0.66 | | |
Total from investment operations | | | 2.76 | | | | 0.82 | | | | 4.26 | | | | 2.34 | | | | 0.51 | | |
Less distributions to shareholders: | |
Net investment income | | | — | | | | (0.04 | ) | | | — | | | | — | | | | — | | |
Net realized gains | | | (0.35 | ) | | | (0.76 | ) | | | — | | | | — | | | | — | | |
Total distributions to shareholders | | | (0.35 | ) | | | (0.80 | ) | | | — | | | | — | | | | — | | |
Net asset value, end of period | | $ | 19.22 | | | $ | 16.81 | | | $ | 16.79 | | | $ | 12.53 | | | $ | 10.19 | | |
Total return | | | 16.63 | % | | | 4.92 | % | | | 34.00 | % | | | 22.96 | % | | | 5.27 | % | |
Ratios to average net assets(a) | |
Total gross expenses | | | 2.11 | % | | | 2.14 | % | | | 2.16 | % | | | 2.24 | % | | | 2.15 | % | |
Total net expenses(b) | | | 2.11 | %(c) | | | 2.14 | %(c) | | | 2.16 | %(c) | | | 2.21 | %(c) | | | 2.15 | %(c) | |
Net investment loss | | | (0.95 | %) | | | (1.08 | %) | | | (1.35 | %) | | | (1.10 | %) | | | (1.56 | %) | |
Supplemental data | |
Net assets, end of period (in thousands) | | $ | 272 | | | $ | 1,153 | | | $ | 2,043 | | | $ | 3,147 | | | $ | 3,788 | | |
Portfolio turnover | | | 55 | % | | | 60 | % | | | 68 | % | | | 135 | % | | | 220 | % | |
Notes to Financial Highlights
(a) In addition to the fees and expenses that the Fund bears directly, the Fund indirectly bears a pro rata share of the fees and expenses of any other funds in which it invests. Such indirect expenses are not included in the Fund's reported expense ratios.
(b) Total net expenses include the impact of certain fee waivers/expense reimbursements made by the Investment Manager and certain of its affiliates, if applicable.
(c) The benefits derived from expense reductions had an impact of less than 0.01%.
The accompanying Notes to Financial Statements are an integral part of this statement.
Annual Report 2016
20
COLUMBIA GLOBAL TECHNOLOGY GROWTH FUND
FINANCIAL HIGHLIGHTS (continued)
| | | Year Ended August 31, | |
Class C | | 2016 | | 2015 | | 2014 | | 2013 | | 2012 | |
Per share data | |
Net asset value, beginning of period | | $ | 16.84 | | | $ | 16.82 | | | $ | 12.55 | | | $ | 10.21 | | | $ | 9.70 | | |
Income from investment operations: | |
Net investment loss | | | (0.17 | ) | | | (0.20 | ) | | | (0.20 | ) | | | (0.12 | ) | | | (0.15 | ) | |
Net realized and unrealized gain | | | 2.94 | | | | 1.02 | | | | 4.47 | | | | 2.46 | | | | 0.66 | | |
Total from investment operations | | | 2.77 | | | | 0.82 | | | | 4.27 | | | | 2.34 | | | | 0.51 | | |
Less distributions to shareholders: | |
Net investment income | | | — | | | | (0.04 | ) | | | — | | | | — | | | | — | | |
Net realized gains | | | (0.35 | ) | | | (0.76 | ) | | | — | | | | — | | | | — | | |
Total distributions to shareholders | | | (0.35 | ) | | | (0.80 | ) | | | — | | | | — | | | | — | | |
Net asset value, end of period | | $ | 19.26 | | | $ | 16.84 | | | $ | 16.82 | | | $ | 12.55 | | | $ | 10.21 | | |
Total return | | | 16.65 | % | | | 4.91 | % | | | 34.02 | % | | | 22.92 | % | | | 5.26 | % | |
Ratios to average net assets(a) | |
Total gross expenses | | | 2.12 | % | | | 2.15 | % | | | 2.17 | % | | | 2.23 | % | | | 2.17 | % | |
Total net expenses(b) | | | 2.12 | %(c) | | | 2.15 | %(c) | | | 2.17 | %(c) | | | 2.21 | %(c) | | | 2.17 | %(c) | |
Net investment loss | | | (0.97 | %) | | | (1.13 | %) | | | (1.31 | %) | | | (1.11 | %) | | | (1.57 | %) | |
Supplemental data | |
Net assets, end of period (in thousands) | | $ | 60,684 | | | $ | 39,660 | | | $ | 21,775 | | | $ | 16,791 | | | $ | 15,821 | | |
Portfolio turnover | | | 55 | % | | | 60 | % | | | 68 | % | | | 135 | % | | | 220 | % | |
Notes to Financial Highlights
(a) In addition to the fees and expenses that the Fund bears directly, the Fund indirectly bears a pro rata share of the fees and expenses of any other funds in which it invests. Such indirect expenses are not included in the Fund's reported expense ratios.
(b) Total net expenses include the impact of certain fee waivers/expense reimbursements made by the Investment Manager and certain of its affiliates, if applicable.
(c) The benefits derived from expense reductions had an impact of less than 0.01%.
The accompanying Notes to Financial Statements are an integral part of this statement.
Annual Report 2016
21
COLUMBIA GLOBAL TECHNOLOGY GROWTH FUND
FINANCIAL HIGHLIGHTS (continued)
| | | Year Ended August 31, | |
Class I | | 2016 | | 2015(a) | |
Per share data | |
Net asset value, beginning of period | | $ | 19.85 | | | $ | 19.98 | | |
Income from investment operations: | |
Net investment income | | | 0.05 | | | | (0.00 | )(b) | |
Net realized and unrealized gain (loss) | | | 3.49 | | | | (0.13 | )(c) | |
Total from investment operations | | | 3.54 | | | | (0.13 | ) | |
Less distributions to shareholders: | |
Net realized gains | | | (0.35 | ) | | | — | | |
Total distributions to shareholders | | | (0.35 | ) | | | — | | |
Net asset value, end of period | | $ | 23.04 | | | $ | 19.85 | | |
Total return | | | 18.02 | % | | | (0.65 | %) | |
Ratios to average net assets(d) | |
Total gross expenses | | | 0.93 | % | | | 0.98 | %(e) | |
Total net expenses(f) | | | 0.93 | % | | | 0.98 | %(e) | |
Net investment income (loss) | | | 0.24 | % | | | (0.02 | %)(e) | |
Supplemental data | |
Net assets, end of period (in thousands) | | $ | 36,735 | | | $ | 32,235 | | |
Portfolio turnover | | | 55 | % | | | 60 | % | |
Notes to Financial Highlights
(a) Based on operations from March 25, 2015 (commencement of operations) through the stated period end.
(b) Rounds to zero.
(c) Calculation of the net gain (loss) per share (both realized and unrealized) does not correlate to the aggregate realized and unrealized gain (loss) presented in the Statement of Operations due to the timing of subscriptions and redemptions of Fund shares in relation to fluctuations in the market value of the portfolio.
(d) In addition to the fees and expenses that the Fund bears directly, the Fund indirectly bears a pro rata share of the fees and expenses of any other funds in which it invests. Such indirect expenses are not included in the Fund's reported expense ratios.
(e) Annualized.
(f) Total net expenses include the impact of certain fee waivers/expense reimbursements made by the Investment Manager and certain of its affiliates, if applicable.
The accompanying Notes to Financial Statements are an integral part of this statement.
Annual Report 2016
22
COLUMBIA GLOBAL TECHNOLOGY GROWTH FUND
FINANCIAL HIGHLIGHTS (continued)
| | | Year Ended August 31, | |
Class R4 | | 2016 | | 2015 | | 2014 | | 2013(a) | |
Per share data | |
Net asset value, beginning of period | | $ | 19.19 | | | $ | 18.92 | | | $ | 13.99 | | | $ | 10.73 | | |
Income from investment operations: | |
Net investment income (loss) | | | 0.01 | | | | (0.04 | ) | | | (0.06 | ) | | | (0.03 | ) | |
Net realized and unrealized gain | | | 3.36 | | | | 1.17 | | | | 4.99 | | | | 3.29 | | |
Total from investment operations | | | 3.37 | | | | 1.13 | | | | 4.93 | | | | 3.26 | | |
Less distributions to shareholders: | |
Net investment income | | | — | | | | (0.10 | ) | | | — | | | | — | | |
Net realized gains | | | (0.35 | ) | | | (0.76 | ) | | | — | | | | — | | |
Total distributions to shareholders | | | (0.35 | ) | | | (0.86 | ) | | | — | | | | — | | |
Net asset value, end of period | | $ | 22.21 | | | $ | 19.19 | | | $ | 18.92 | | | $ | 13.99 | | |
Total return | | | 17.76 | % | | | 6.04 | % | | | 35.24 | % | | | 30.38 | % | |
Ratios to average net assets(b) | |
Total gross expenses | | | 1.11 | % | | | 1.15 | % | | | 1.16 | % | | | 1.22 | %(c) | |
Total net expenses(d) | | | 1.11 | %(e) | | | 1.15 | %(e) | | | 1.16 | %(e) | | | 1.22 | %(c)(e) | |
Net investment income (loss) | | | 0.07 | % | | | (0.23 | %) | | | (0.37 | %) | | | (0.28 | %)(c) | |
Supplemental data | |
Net assets, end of period (in thousands) | | $ | 7,235 | | | $ | 8,345 | | | $ | 836 | | | $ | 177 | | |
Portfolio turnover | | | 55 | % | | | 60 | % | | | 68 | % | | | 135 | % | |
Notes to Financial Highlights
(a) Based on operations from November 8, 2012 (commencement of operations) through the stated period end.
(b) In addition to the fees and expenses that the Fund bears directly, the Fund indirectly bears a pro rata share of the fees and expenses of any other funds in which it invests. Such indirect expenses are not included in the Fund's reported expense ratios.
(c) Annualized.
(d) Total net expenses include the impact of certain fee waivers/expense reimbursements made by the Investment Manager and certain of its affiliates, if applicable.
(e) The benefits derived from expense reductions had an impact of less than 0.01%.
The accompanying Notes to Financial Statements are an integral part of this statement.
Annual Report 2016
23
COLUMBIA GLOBAL TECHNOLOGY GROWTH FUND
FINANCIAL HIGHLIGHTS (continued)
| | | Year Ended August 31, | |
Class R5 | | 2016 | | 2015 | | 2014 | | 2013(a) | |
Per share data | |
Net asset value, beginning of period | | $ | 19.26 | | | $ | 18.98 | | | $ | 14.00 | | | $ | 10.73 | | |
Income from investment operations: | |
Net investment income (loss) | | | 0.03 | | | | (0.01 | ) | | | (0.01 | ) | | | 0.00 | (b) | |
Net realized and unrealized gain | | | 3.39 | | | | 1.16 | | | | 4.99 | | | | 3.27 | | |
Total from investment operations | | | 3.42 | | | | 1.15 | | | | 4.98 | | | | 3.27 | | |
Less distributions to shareholders: | |
Net investment income | | | — | | | | (0.11 | ) | | | — | | | | — | | |
Net realized gains | | | (0.35 | ) | | | (0.76 | ) | | | — | | | | — | | |
Total distributions to shareholders | | | (0.35 | ) | | | (0.87 | ) | | | — | | | | — | | |
Net asset value, end of period | | $ | 22.33 | | | $ | 19.26 | | | $ | 18.98 | | | $ | 14.00 | | |
Total return | | | 17.95 | % | | | 6.13 | % | | | 35.57 | % | | | 30.48 | % | |
Ratios to average net assets(c) | |
Total gross expenses | | | 0.98 | % | | | 1.00 | % | | | 1.03 | % | | | 1.08 | %(d) | |
Total net expenses(e) | | | 0.98 | % | | | 1.00 | % | | | 1.03 | % | | | 1.08 | %(d) | |
Net investment income (loss) | | | 0.16 | % | | | (0.05 | %) | | | (0.09 | %) | | | (0.08 | %)(d) | |
Supplemental data | |
Net assets, end of period (in thousands) | | $ | 18,492 | | | $ | 9,964 | | | $ | 3,168 | | | $ | 203 | | |
Portfolio turnover | | | 55 | % | | | 60 | % | | | 68 | % | | | 135 | % | |
Notes to Financial Highlights
(a) Based on operations from November 8, 2012 (commencement of operations) through the stated period end.
(b) Rounds to zero.
(c) In addition to the fees and expenses that the Fund bears directly, the Fund indirectly bears a pro rata share of the fees and expenses of any other funds in which it invests. Such indirect expenses are not included in the Fund's reported expense ratios.
(d) Annualized.
(e) Total net expenses include the impact of certain fee waivers/expense reimbursements made by the Investment Manager and certain of its affiliates, if applicable.
The accompanying Notes to Financial Statements are an integral part of this statement.
Annual Report 2016
24
COLUMBIA GLOBAL TECHNOLOGY GROWTH FUND
FINANCIAL HIGHLIGHTS (continued)
Class Y | | Year Ended
August 31,
2016(a) | |
Per share data | |
Net asset value, beginning of period | | $ | 19.26 | | |
Income from investment operations: | |
Net investment income | | | 0.04 | | |
Net realized and unrealized gain | | | 3.07 | | |
Total from investment operations | | | 3.11 | | |
Net asset value, end of period | | $ | 22.37 | | |
Total return | | | 16.15 | % | |
Ratios to average net assets(b) | |
Total gross expenses | | | 0.94 | %(c) | |
Total net expenses(d) | | | 0.94 | %(c) | |
Net investment income | | | 0.33 | %(c) | |
Supplemental data | |
Net assets, end of period (in thousands) | | $ | 675 | | |
Portfolio turnover | | | 55 | % | |
Notes to Financial Highlights
(a) Based on operations from March 1, 2016 (commencement of operations) through the stated period end.
(b) In addition to the fees and expenses that the Fund bears directly, the Fund indirectly bears a pro rata share of the fees and expenses of any other funds in which it invests. Such indirect expenses are not included in the Fund's reported expense ratios.
(c) Annualized.
(d) Total net expenses include the impact of certain fee waivers/expense reimbursements made by the Investment Manager and certain of its affiliates, if applicable.
The accompanying Notes to Financial Statements are an integral part of this statement.
Annual Report 2016
25
COLUMBIA GLOBAL TECHNOLOGY GROWTH FUND
FINANCIAL HIGHLIGHTS (continued)
| | | Year Ended August 31, | |
Class Z | | 2016 | | 2015 | | 2014 | | 2013 | | 2012 | |
Per share data | |
Net asset value, beginning of period | | $ | 18.95 | | | $ | 18.70 | | | $ | 13.82 | | | $ | 11.13 | | | $ | 10.47 | | |
Income from investment operations: | |
Net investment income (loss) | | | 0.01 | | | | (0.02 | ) | | | (0.05 | ) | | | (0.01 | ) | | | (0.07 | ) | |
Net realized and unrealized gain | | | 3.33 | | | | 1.13 | | | | 4.93 | | | | 2.70 | | | | 0.73 | | |
Total from investment operations | | | 3.34 | | | | 1.11 | | | | 4.88 | | | | 2.69 | | | | 0.66 | | |
Less distributions to shareholders: | |
Net investment income | | | — | | | | (0.10 | ) | | | — | | | | — | | | | — | | |
Net realized gains | | | (0.35 | ) | | | (0.76 | ) | | | — | | | | — | | | | — | | |
Total distributions to shareholders | | | (0.35 | ) | | | (0.86 | ) | | | — | | | | — | | | | — | | |
Net asset value, end of period | | $ | 21.94 | | | $ | 18.95 | | | $ | 18.70 | | | $ | 13.82 | | | $ | 11.13 | | |
Total return | | | 17.82 | % | | | 6.00 | % | | | 35.31 | % | | | 24.17 | % | | | 6.30 | % | |
Ratios to average net assets(a) | |
Total gross expenses | | | 1.11 | % | | | 1.15 | % | | | 1.17 | % | | | 1.24 | % | | | 1.19 | % | |
Total net expenses(b) | | | 1.11 | %(c) | | | 1.15 | %(c) | | | 1.17 | %(c) | | | 1.21 | %(c) | | | 1.19 | %(c) | |
Net investment income (loss) | | | 0.04 | % | | | (0.11 | %) | | | (0.30 | %) | | | (0.12 | %) | | | (0.62 | %) | |
Supplemental data | |
Net assets, end of period (in thousands) | | $ | 233,750 | | | $ | 165,748 | | | $ | 111,506 | | | $ | 77,279 | | | $ | 71,456 | | |
Portfolio turnover | | | 55 | % | | | 60 | % | | | 68 | % | | | 135 | % | | | 220 | % | |
Notes to Financial Highlights
(a) In addition to the fees and expenses that the Fund bears directly, the Fund indirectly bears a pro rata share of the fees and expenses of any other funds in which it invests. Such indirect expenses are not included in the Fund's reported expense ratios.
(b) Total net expenses include the impact of certain fee waivers/expense reimbursements made by the Investment Manager and certain of its affiliates, if applicable.
(c) The benefits derived from expense reductions had an impact of less than 0.01%.
The accompanying Notes to Financial Statements are an integral part of this statement.
Annual Report 2016
26
COLUMBIA GLOBAL TECHNOLOGY GROWTH FUND
NOTES TO FINANCIAL STATEMENTS
August 31, 2016
Note 1. Organization
Columbia Global Technology Growth Fund (the Fund), a series of Columbia Funds Series Trust I (the Trust), is a non-diversified fund. The Trust is registered under the Investment Company Act of 1940, as amended (the 1940 Act), as an open-end management investment company organized as a Massachusetts business trust.
Fund Shares
The Trust may issue an unlimited number of shares (without par value). The Fund offers Class A, Class B, Class C, Class I, Class R4, Class R5 and Class Z shares. Effective March 1, 2016, the Fund also offers Class Y shares. Although all share classes generally have identical voting, dividend and liquidation rights, each share class votes separately when required by the Trust's organizational documents or by law. Different share classes pay different distribution amounts to the extent the expenses of such share classes differ, and distributions in liquidation will be proportional to the net asset value of each share class. Each share class has its own expense and sales charge structure.
Class A shares are subject to a maximum front-end sales charge of 5.75% based on the initial investment amount. Class A shares purchased without an initial sales charge in accounts aggregating $1 million to $50 million at the time of purchase are subject to a contingent deferred sales charge (CDSC) if the shares are sold within 18 months after purchase, charged as follows: 1.00% CDSC if redeemed within 12 months after purchase, and 0.50% CDSC if redeemed more than 12, but less than 18, months after purchase.
Class B shares may be subject to a maximum CDSC of 5.00% based upon the holding period after purchase. Class B shares will generally convert to Class A shares eight years after purchase. The Fund no longer accepts investments by new or existing investors in the Fund's Class B shares, except in connection with the reinvestment of any dividend and/or capital gain distributions in Class B shares of the Fund and exchanges by existing Class B shareholders of certain other funds within the Columbia Family of Funds.
Class C shares are subject to a 1.00% CDSC on shares redeemed within 12 months after purchase.
Class I shares are not subject to sales charges and are available only to the Columbia Family of Funds.
Class R4 shares are not subject to sales charges and are generally available only to omnibus retirement plans
and certain investors as described in the Fund's prospectus.
Class R5 shares are not subject to sales charges and are generally available only to investors purchasing through authorized investment professionals and omnibus retirement plans.
Class Y shares are not subject to sales charges and are generally available only to certain retirement plans as described in the Fund's prospectus. Class Y shares commenced operations on March 1, 2016.
Class Z shares are not subject to sales charges and are generally available only to eligible investors, which are subject to different investment minimums as described in the Fund's prospectus.
Note 2. Summary of Significant Accounting Policies
Basis of Preparation
The Fund is an investment company that applies the accounting and reporting guidance in the Financial Accounting Standards Board (FASB) Accounting Standards Codification Topic 946, Financial Services — Investment Companies (ASC 946). The financial statements are prepared in accordance with U.S. generally accepted accounting principles (GAAP), which requires management to make certain estimates and assumptions that affect the reported amounts of assets and liabilities, the disclosure of contingent assets and liabilities at the date of the financial statements and the reported amounts of income and expenses during the reporting period. Actual results could differ from those estimates.
The following is a summary of significant accounting policies followed by the Fund in the preparation of its financial statements.
Security Valuation
All equity securities and exchange-traded funds are valued at the close of business of the New York Stock Exchange (NYSE). Equity securities and exchange-traded funds are valued at the last quoted sales price on the principal exchange or market on which they trade, except for securities traded on the NASDAQ Stock Market, which are valued at the NASDAQ official close price. Unlisted securities or listed securities for which there were no sales during the day are valued at the mean of the latest quoted bid and ask prices on such exchanges or markets.
Annual Report 2016
27
COLUMBIA GLOBAL TECHNOLOGY GROWTH FUND
NOTES TO FINANCIAL STATEMENTS (continued)
August 31, 2016
Foreign equity securities are valued based on the closing price on the foreign exchange in which such securities are primarily traded. If any foreign equity security closing prices are not readily available, the securities are valued at the mean of the latest quoted bid and ask prices on such exchanges or markets. Foreign currency exchange rates are generally determined at 4:00 p.m. Eastern (U.S.) time. Many securities markets and exchanges outside the U.S. close prior to the close of the NYSE; therefore, the closing prices for securities in such markets or on such exchanges may not fully reflect events that occur after such close but before the close of the NYSE. In those situations, foreign securities will be fair valued pursuant to a policy adopted by the Board of Trustees (the Board), including, if available, utilizing a third party pricing service to determine these fair values. The third party pricing service takes into account multiple factors, including, but not limited to, movements in the U.S. securities markets, certain depositary receipts, futures contracts and foreign exchange rates that have occurred subsequent to the close of the foreign exchange or market, to determine a good faith estimate that reasonably reflects the current market conditions as of the close of the NYSE. The fair value of a security is likely to be different from the quoted or published price, if available.
Investments in open-end investment companies, including money market funds, are valued at their latest net asset value.
Investments for which market quotations are not readily available, or that have quotations which management believes are not reflective of market value or reliable, are valued at fair value as determined in good faith under procedures approved by and under the general supervision of the Board. If a security or class of securities (such as foreign securities) is valued at fair value, such value is likely to be different from the quoted or published price for the security.
The determination of fair value often requires significant judgment. To determine fair value, management may use assumptions including but not limited to future cash flows and estimated risk premiums. Multiple inputs from various sources may be used to determine fair value.
GAAP requires disclosure regarding the inputs and valuation techniques used to measure fair value and any changes in valuation inputs or techniques. In addition, investments shall be disclosed by major category. This information is disclosed following the Fund's Portfolio of Investments.
Foreign Currency Transactions and Translations
The values of all assets and liabilities denominated in foreign currencies are generally translated into U.S. dollars at exchange rates determined at the close of the NYSE on any given day. Net realized and unrealized gains (losses) on foreign currency transactions and translations include gains (losses) arising from the fluctuation in exchange rates between trade and settlement dates on securities transactions, gains (losses) arising from the disposition of foreign currency and currency gains (losses) between the accrual and payment dates on dividends, interest income and foreign withholding taxes.
For financial statement purposes, the Fund does not distinguish that portion of gains (losses) on investments which is due to changes in foreign exchange rates from that which is due to changes in market prices of the investments. Such fluctuations are included with the net realized and unrealized gains (losses) on investments in the Statement of Operations.
Security Transactions
Security transactions are accounted for on the trade date. Cost is determined and gains (losses) are based upon the specific identification method for both financial statement and federal income tax purposes.
Income Recognition
Corporate actions and dividend income are generally recorded net of any non-reclaimable tax withholdings, on the ex-dividend date or upon receipt of ex-dividend notification in the case of certain foreign securities.
The Fund may receive distributions from holdings in equity securities, business development companies (BDCs), exchange-traded funds, other regulated investment companies (RICs), and real estate investment trusts (REITs), which report information on the tax character of their distributions annually. These distributions are allocated to dividend income, capital gain and return of capital based on actual information reported. Return of capital is recorded as a reduction of the cost basis of securities held. If the Fund no longer owns the applicable securities, return of capital is recorded as a realized gain. With respect to REITs, to the extent actual information has not yet been reported, estimates for return of capital are made by the Fund's management. Management's estimates are subsequently adjusted when the actual character of the distributions is disclosed by the REITs, which could result
Annual Report 2016
28
COLUMBIA GLOBAL TECHNOLOGY GROWTH FUND
NOTES TO FINANCIAL STATEMENTS (continued)
August 31, 2016
in a proportionate change in return of capital to shareholders.
Awards from class action litigation are recorded as a reduction of cost basis if the Fund still owns the applicable securities on the payment date. If the Fund no longer owns the applicable securities, the proceeds are recorded as realized gains.
Expenses
General expenses of the Trust are allocated to the Fund and other funds of the Trust based upon relative net assets or other expense allocation methodologies determined by the nature of the expense. Expenses directly attributable to the Fund are charged to the Fund. Expenses directly attributable to a specific class of shares are charged to that share class.
Determination of Class Net Asset Value
All income, expenses (other than class-specific expenses, which are charged to that share class, as shown in the Statement of Operations) and realized and unrealized gains (losses) are allocated to each class of the Fund on a daily basis, based on the relative net assets of each class, for purposes of determining the net asset value of each class.
Federal Income Tax Status
The Fund intends to qualify each year as a regulated investment company under Subchapter M of the Internal Revenue Code, as amended, and will distribute substantially all of its taxable income (including net short-term capital gains), if any, for its tax year, and as such will not be subject to federal income taxes. In addition, the Fund intends to distribute in each calendar year substantially all of its net investment income, capital gains and certain other amounts, if any, such that the Fund should not be subject to federal excise tax. Therefore, no federal income or excise tax provision is recorded.
Foreign Taxes
The Fund may be subject to foreign taxes on income, gains on investments or currency repatriation, a portion of which may be recoverable. The Fund will accrue such taxes and recoveries, as applicable, based upon its current interpretation of tax rules and regulations that exist in the markets in which it invests.
Realized gains in certain countries may be subject to foreign taxes at the Fund level, based on statutory rates. The Fund accrues for such foreign taxes on realized and unrealized gains at the appropriate rate for each
jurisdiction, as applicable. The amount, if any, is disclosed as a liability on the Statement of Assets and Liabilities.
Distributions to Shareholders
Distributions from net investment income, if any, are declared and paid annually. Net realized capital gains, if any, are distributed along with the income distribution. Income distributions and capital gain distributions are determined in accordance with federal income tax regulations, which may differ from GAAP.
Guarantees and Indemnifications
Under the Trust's organizational documents and, in some cases, by contract, its officers and trustees are indemnified against certain liabilities arising out of the performance of their duties to the Trust or its funds. In addition, certain of the Fund's contracts with its service providers contain general indemnification clauses. The Fund's maximum exposure under these arrangements is unknown since the amount of any future claims that may be made against the Fund cannot be determined, and the Fund has no historical basis for predicting the likelihood of any such claims.
Note 3. Fees and Other Transactions with Affiliates
Management Services Fees
Effective January 1, 2016, the Fund entered into a Management Agreement with Columbia Management Investment Advisers, LLC (the Investment Manager), a wholly-owned subsidiary of Ameriprise Financial, Inc. (Ameriprise Financial). Under the Management Agreement, the Investment Manager provides the Fund with investment research and advice, as well as administrative and accounting services. The management services fee is an annual fee that is equal to a percentage of the Fund's average daily net assets that declines from 0.87% to 0.77% as the Fund's net assets increase. Prior to January 1, 2016, the Investment Manager provided advisory services under an Investment Management Services Agreement and administrative and accounting services under a separate Administrative Services Agreement. The effective management services fee rate for the year ended August 31, 2016 (reflecting all advisory and administrative services fees paid to the Investment Manager) was 0.87% of the Fund's average daily net assets. For the period from September 1, 2015 through December 31, 2015, the investment advisory services
Annual Report 2016
29
COLUMBIA GLOBAL TECHNOLOGY GROWTH FUND
NOTES TO FINANCIAL STATEMENTS (continued)
August 31, 2016
fee paid to the Investment Manager was $1,315,278. The Investment Manager did not receive a fee for its services under the Administrative Services Agreement.
Compensation of Board Members
Board members, who are not officers or employees of the Investment Manager or Ameriprise Financial, are compensated for their services to the Fund as disclosed in the Statement of Operations. These Board members may participate in a Deferred Compensation Plan (the Plan) which may be terminated at any time. Obligations of the Plan will be paid solely out of the Fund's assets, and all amounts payable under the Plan constitute a general unsecured obligation of the Fund.
Compensation of Chief Compliance Officer
The Board has appointed a Chief Compliance Officer to the Fund in accordance with federal securities regulations. The Fund is allocated a portion of the expenses associated with the Chief Compliance Officer based on relative net assets of the Trust.
Transfer Agency Fees
Under a Transfer and Dividend Disbursing Agent Agreement, Columbia Management Investment Services Corp. (the Transfer Agent), an affiliate of the Investment Manager and a wholly-owned subsidiary of Ameriprise Financial, is responsible for providing transfer agency services to the Fund. The Transfer Agent has contracted with Boston Financial Data Services (BFDS) to serve as sub-transfer agent. The Transfer Agent pays the fees of BFDS for services as sub-transfer agent and BFDS is not entitled to reimbursement of such fees from the Fund (with the exception of out-of-pocket fees).
The Fund pays the Transfer Agent a monthly transfer agency fee based on the number or the average value of accounts, depending on the type of account. In addition, prior to October 1, 2016, the Transfer Agent also received sub-transfer agency fees based on a percentage of the average aggregate value of the Fund's shares maintained in omnibus accounts (other than omnibus accounts for which American Enterprise Investment Services Inc. is the broker of record or accounts where the beneficial shareholder is a customer of Ameriprise Financial Services, Inc., for which the Transfer Agent receives a per account fee). Effective October 1, 2016, the Fund pays the Transfer Agent a fee for shareholder services based on the number of accounts or on a percentage of the average aggregate value of the Fund's shares maintained in omnibus accounts up to the lesser
of the amount charged by the servicing agent or a cap established by the Board from time to time.
The Transfer Agent also receives compensation from the Fund for various shareholder services and reimbursements for certain out-of-pocket fees. Total transfer agency fees for Class R5 shares are subject to an annual limitation of not more than 0.05% of the average daily net assets attributable to Class R5 shares. Class I and Class Y shares do not pay transfer agency fees.
For the year ended August 31, 2016, the Fund's effective transfer agency fee rates as a percentage of average daily net assets of each class were as follows:
Class A | | | 0.18 | % | |
Class B | | | 0.18 | | |
Class C | | | 0.18 | | |
Class R4 | | | 0.18 | | |
Class R5 | | | 0.05 | | |
Class Z | | | 0.18 | | |
An annual minimum account balance fee of $20 may apply to certain accounts with a value below the applicable share class's initial minimum investment requirements to reduce the impact of small accounts on transfer agency fees. These minimum account balance fees are remitted to the Fund and recorded as part of expense reductions in the Statement of Operations. For the year ended August 31, 2016, these minimum account balance fees reduced total expenses of the Fund by $340.
Distribution and Service Fees
The Fund has an agreement with Columbia Management Investment Distributors, Inc. (the Distributor), an affiliate of the Investment Manager and a wholly-owned subsidiary of Ameriprise Financial, for distribution and shareholder services. The Board has approved, and the Fund has adopted, distribution and shareholder service plans (the Plans) applicable to certain share classes, which set the distribution and service fees for the Fund. These fees are calculated daily and are intended to compensate the Distributor and/or eligible selling and/or servicing agents for selling shares of the Fund and providing services to investors.
Under the Plans, the Fund pays a monthly service fee to the Distributor at the maximum annual rate of 0.25% of the average daily net assets attributable to Class A, Class B and Class C shares of the Fund. Also under the Plans, the Fund pays a monthly distribution fee to the
Annual Report 2016
30
COLUMBIA GLOBAL TECHNOLOGY GROWTH FUND
NOTES TO FINANCIAL STATEMENTS (continued)
August 31, 2016
Distributor at the maximum annual rates of 0.10%, 0.75% and 0.75% of the average daily net assets attributable to Class A, Class B and Class C shares of the Fund, respectively.
Although the Fund may pay distribution and service fees up to a maximum annual rate of 0.35% of the Fund's average daily net assets attributable to Class A shares (comprised of up to 0.10% for distribution services and up to 0.25% for shareholder liaison services), the Fund currently limits such fees to an aggregate fee of not more than 0.25% of the Fund's average daily net assets attributable to Class A shares.
Sales Charges
Sales charges, including front-end charges and CDSCs, received by the Distributor for distributing Fund shares were $539,523 for Class A, $0 for Class B, and $25,977 for Class C shares for the year ended August 31, 2016.
Expenses Waived/Reimbursed by the Investment Manager and its Affiliates
The Fund's expense ratio is subject to an expense reimbursement arrangement pursuant to which fees will be waived and/or expenses reimbursed (excluding certain fees and expenses described below), so that the Fund's net operating expenses, after giving effect to fees waived/expenses reimbursed and any balance credits and/or overdraft charges from the Fund's custodian, do not exceed the annual rates of:
| | | Contractual
Expense Cap
January 1, 2016
through
December 31, 2016 | | Voluntary
Expense Cap
Prior to
January 1, 2016 | |
Class A | | | 1.50 | % | | | 1.45 | % | |
Class B | | | 2.25 | | | | 2.20 | | |
Class C | | | 2.25 | | | | 2.20 | | |
Class I | | | 1.11 | | | | 1.05 | | |
Class R4 | | | 1.25 | | | | 1.20 | | |
Class R5 | | | 1.16 | | | | 1.10 | | |
Class Y* | | | 1.11 | | | | — | | |
Class Z | | | 1.25 | | | | 1.20 | | |
*Expense cap rate is contractual from March 1, 2016 (the commencement of operations of Class Y shares) through August 31, 2016.
The contractual agreement may be modified or amended only with approval from the Investment Manager, certain of its affiliates and the Fund. Under the arrangements, the following fees and expenses are excluded from the
waiver/reimbursement commitment, and therefore will be paid by the Fund, if applicable: taxes (including foreign transaction taxes), expenses associated with investments in affiliated and non-affiliated pooled investment vehicles (including mutual funds and exchange-traded funds), transaction costs and brokerage commissions, costs related to any securities lending program, dividend and interest expenses associated with securities sold short, inverse floater program fees and expenses, transaction charges and interest on borrowed money, interest and infrequent and/or unusual expenses. Any fees waived and/or expenses reimbursed under the expense reimbursement arrangements described above are not recoverable by the Investment Manager or its affiliates in future periods.
Note 4. Federal Tax Information
The timing and character of income and capital gain distributions are determined in accordance with income tax regulations, which may differ from GAAP because of temporary or permanent book to tax differences.
At August 31, 2016, these differences are primarily due to differing treatment for deferral/reversal of wash sale losses, Trustees' deferred compensation, distribution reclassifications, foreign currency transactions, post-October capital losses and late-year ordinary losses. To the extent these differences are permanent, reclassifications are made among the components of the Fund's net assets in the Statement of Assets and Liabilities. Temporary differences do not require reclassifications.
In the Statement of Assets and Liabilities the following reclassifications were made:
Excess of distributions over net investment income | | $ | (137,872 | ) | |
Accumulated net realized loss | | | 154,105 | | |
Paid-in capital | | | (16,233 | ) | |
Net investment income (loss) and net realized gains (losses), as disclosed in the Statement of Operations, and net assets were not affected by this reclassification.
The tax character of distributions paid during the years indicated was as follows:
Year Ended August 31, | | 2016 | | 2015 | |
Ordinary income | | $ | 126,451 | | | $ | 7,561,325 | | |
Long-term capital gains | | | 8,755,906 | | | | 4,007,561 | | |
Total | | $ | 8,882,357 | | | $ | 11,568,886 | | |
Annual Report 2016
31
COLUMBIA GLOBAL TECHNOLOGY GROWTH FUND
NOTES TO FINANCIAL STATEMENTS (continued)
August 31, 2016
Short-term capital gain distributions, if any, are considered ordinary income distributions for tax purposes.
At August 31, 2016, the components of distributable earnings on a tax basis were as follows:
Net unrealized appreciation | | | 130,752,004 | | |
At August 31, 2016, the cost of investments for federal income tax purposes was $392,536,378 and the aggregate gross unrealized appreciation and depreciation based on that cost was:
Unrealized appreciation | | $ | 133,652,776 | | |
Unrealized depreciation | | | (2,900,772 | ) | |
Net unrealized appreciation | | $ | 130,752,004 | | |
Under current tax rules, regulated investment companies can elect to treat certain late-year ordinary losses incurred and post-October capital losses (capital losses realized after October 31) as arising on the first day of the following taxable year. As of August 31, 2016, the Fund will elect to treat late-year ordinary losses of $727,474 and post-October capital losses of $1,522,939 as arising on September 1, 2016.
Management of the Fund has concluded that there are no significant uncertain tax positions in the Fund that would require recognition in the financial statements. However, management's conclusion may be subject to review and adjustment at a later date based on factors including, but not limited to, new tax laws, regulations, and administrative interpretations (including relevant court decisions). Generally, the Fund's federal tax returns for the prior three fiscal years remain subject to examination by the Internal Revenue Service.
Note 5. Portfolio Information
The cost of purchases and proceeds from sales of securities, excluding short-term investments and derivatives, if any, aggregated to $323,070,201 and $256,604,521, respectively, for the year ended August 31, 2016. The amount of purchase and sale activity impacts the portfolio turnover rate reported in the Financial Highlights.
Note 6. Affiliated Money Market Fund
The Fund invests in Columbia Short-Term Cash Fund, an affiliated money market fund established for the exclusive use by the Fund and other affiliated funds (the Affiliated MMF). The income earned by the Fund from such investments is included as Dividends — affiliated issuers in the Statement of Operations. As an investing
fund, the Fund indirectly bears its proportionate share of the expenses of the Affiliated MMF. Effective October 1, 2016, the Affiliated MMF prices its shares with a floating net asset value (NAV) and no longer seeks to maintain a stable NAV. In addition, the Board of the Affiliated MMF may impose a fee on redemptions (sometimes referred to as a liquidity fee) or temporarily suspend redemptions (sometimes referred to as imposing a redemption gate) in the event its liquidity falls below regulatory limits.
Note 7. Line of Credit
The Fund has access to a revolving credit facility whereby the Fund may borrow for the temporary funding of shareholder redemptions or for other temporary or emergency purposes. Effective December 8, 2015, Citibank, N.A. and HSBC Bank USA, N.A. joined JPMorgan Chase Bank, N.A. (JPMorgan) as lead of a syndicate of banks under the credit facility, which is a collective agreement between the Fund and certain other funds managed by the Investment Manager, severally and not jointly, that permits collective borrowings up to $1 billion. Interest is charged to each participating fund based on its borrowings at a rate equal to the higher of (i) the overnight federal funds rate plus 1.00% or (ii) the one-month LIBOR rate plus 1.00%. Each borrowing under the credit facility matures no later than 60 days after the date of borrowing. The Fund also pays a commitment fee equal to its pro rata share of the amount of the credit facility at a rate of 0.15% per annum. The commitment fee is included in other expenses in the Statement of Operations. Prior to December 8, 2015, JPMorgan was the sole lead bank under the credit facility agreement that permitted borrowings up to $550 million under the same terms and interest rates as described above with the exception of the commitment fee which was charged at a rate of 0.075% per annum.
The Fund had no borrowings during the year ended August 31, 2016.
Note 8. Significant Risks
Shareholder Concentration Risk
At August 31, 2016, 2 unaffiliated shareholders of record owned 32.7% of the outstanding shares of the Fund in one or more accounts. The Fund has no knowledge about whether any portion of those shares was owned beneficially. Affiliated shareholders of record owned 22.5% of the outstanding shares of the Fund in one or more accounts. Subscription and redemption activity by concentrated accounts may have a significant effect on the operations of the Fund. In the case of a large redemption, the Fund may be forced to sell investments
Annual Report 2016
32
COLUMBIA GLOBAL TECHNOLOGY GROWTH FUND
NOTES TO FINANCIAL STATEMENTS (continued)
August 31, 2016
at inopportune times, including its liquid or more liquid positions, resulting in Fund losses and the Fund holding a higher percentage of less liquid or illiquid securities. Large redemptions could result in decreased economies of scale and increased operating expenses for non-redeeming Fund shareholders.
Foreign Securities and Emerging Market Countries Risk
Investing in foreign securities may include certain risks and considerations not typically associated with investing in U.S. securities, such as fluctuating currency values and changing local and regional economic, political and social conditions, which may result in greater market volatility. In addition, certain foreign securities may not be as liquid as U.S. securities. Investing in emerging markets may accentuate these risks. These countries are also more likely to experience high levels of inflation, deflation or currency devaluation which could hurt their economies and securities markets. To the extent that the Fund concentrates its investment exposure to any one or a few specific countries, the Fund will be particularly susceptible to the various conditions, events or other factors impacting those countries and may, therefore, have a greater risk than that of a fund which is more geographically diversified.
Non-Diversification Risk
A non-diversified fund is permitted to invest a greater percentage of its total assets in fewer issuers than a diversified fund. The Fund may, therefore, have a greater risk of loss from a few issuers than a similar fund that invests more broadly.
Technology and Technology-related Investment Risk
The Fund may be more susceptible to the particular risks that may affect companies in the information technology sector, as well as other technology-related sectors (collectively, the technology sectors) than if it were invested in a wider variety of companies in unrelated sectors. Companies in the technology sectors are subject to certain risks, including the risk that new services, equipment or technologies will not be accepted by consumers and businesses or will become rapidly obsolete. Performance of such companies may be affected by factors including obtaining and protecting patents (or the failure to do so) and significant competitive pressures, including aggressive pricing of their products or services, new market entrants, competition for market share and short product cycles due to an accelerated rate of technological developments. Such competitive pressures may lead to
limited earnings and/or falling profit margins. As a result, the value of their securities may fall or fail to rise. In addition, many technology sector companies have limited operating histories and prices of these companies' securities historically have been more volatile than other securities, especially over the short term.
Note 9. Subsequent Events
Management has evaluated the events and transactions that have occurred through the date the financial statements were issued and noted no items requiring adjustment of the financial statements or additional disclosure.
Note 10. Information Regarding Pending and Settled Legal Proceedings
Ameriprise Financial and certain of its affiliates have historically been involved in a number of legal, arbitration and regulatory proceedings, including routine litigation, class actions, and governmental actions, concerning matters arising in connection with the conduct of their business activities. Ameriprise Financial believes that the Funds are not currently the subject of, and that neither Ameriprise Financial nor any of its affiliates are the subject of, any pending legal, arbitration or regulatory proceedings that are likely to have a material adverse effect on the Funds or the ability of Ameriprise Financial or its affiliates to perform under their contracts with the Funds. Ameriprise Financial is required to make quarterly (10-Q), annual (10-K) and, as necessary, 8-K filings with the Securities and Exchange Commission (SEC) on legal and regulatory matters that relate to Ameriprise Financial and its affiliates. Copies of these filings may be obtained by accessing the SEC website at www.sec.gov.
There can be no assurance that these matters, or the adverse publicity associated with them, will not result in increased fund redemptions, reduced sale of fund shares or other adverse consequences to the Funds. Further, although we believe proceedings are not likely to have a material adverse effect on the Funds or the ability of Ameriprise Financial or its affiliates to perform under their contracts with the Funds, these proceedings are subject to uncertainties and, as such, we are unable to estimate the possible loss or range of loss that may result. An adverse outcome in one or more of these proceedings could result in adverse judgments, settlements, fines, penalties or other relief that could have a material adverse effect on the consolidated financial condition or results of operations of Ameriprise Financial.
Annual Report 2016
33
COLUMBIA GLOBAL TECHNOLOGY GROWTH FUND
REPORT OF INDEPENDENT REGISTERED PUBLIC ACCOUNTING FIRM
To the Trustees of Columbia Funds Series Trust I and the Shareholders of
Columbia Global Technology Growth Fund
In our opinion, the accompanying statement of assets and liabilities, including the portfolio of investments, and the related statements of operations and of changes in net assets and the financial highlights present fairly, in all material respects, the financial position of Columbia Global Technology Growth Fund (the "Fund," a series of Columbia Funds Series Trust I) at August 31, 2016, and the results of its operations, the changes in its net assets and the financial highlights for each of the periods indicated, in conformity with accounting principles generally accepted in the United States of America. These financial statements and financial highlights (hereafter referred to as "financial statements") are the responsibility of the Fund's management. Our responsibility is to express an opinion on these financial statements based on our audits. We conducted our audits of these financial statements in accordance with the standards of the Public Company Accounting Oversight Board (United States). Those standards require that we plan and perform the audit to obtain reasonable assurance about whether the financial statements are free of material misstatement. An audit includes examining, on a test basis, evidence supporting the amounts and disclosures in the financial statements, assessing the accounting principles used and significant estimates made by management, and evaluating the overall financial statement presentation. We believe that our audits, which included confirmation of securities at August 31, 2016 by correspondence with the custodian, brokers and transfer agent, and the application of alternative auditing procedures where such confirmations had not been received, provide a reasonable basis for our opinion.
PricewaterhouseCoopers LLP
Minneapolis, MN
October 21, 2016
Annual Report 2016
34
COLUMBIA GLOBAL TECHNOLOGY GROWTH FUND
FEDERAL INCOME TAX INFORMATION
(Unaudited)
The Fund hereby designates the following tax attributes for the fiscal year ended August 31, 2016. Shareholders will be notified in early 2017 of the amounts for use in preparing 2016 income tax returns.
Tax Designations
Qualified Dividend Income | | | 100.00 | % | |
Dividends Received Deduction | | | 100.00 | % | |
Capital Gain Dividend | | $ | 514,414 | | |
Qualified Dividend Income. For taxable, non-corporate shareholders, the percentage of ordinary income distributed during the fiscal year that represents qualified dividend income subject to reduced tax rates.
Dividends Received Deduction. The percentage of ordinary income distributed during the fiscal year that qualifies for the corporate dividends received deduction.
Capital Gain Dividend. The Fund designates as a capital gain dividend the amount reflected above, or if subsequently determined to be different, the net capital gain of such fiscal period.
Annual Report 2016
35
COLUMBIA GLOBAL TECHNOLOGY GROWTH FUND
Shareholders elect the Board that oversees the Fund's operations. The Board appoints officers who are responsible for day-to-day business decisions based on policies set by the Board. The following table provides basic biographical information about the Fund's Trustees, including their principal occupations during the past five years, although specific titles for individuals may have varied over the period. The year set forth beneath Length of Service in the table below is the year in which the Trustee was first appointed or elected as Trustee to any Fund currently in the Columbia Funds Complex or a predecessor thereof. Under current Board policy, members serve terms of indefinite duration.
Trustees
Independent Trustees
Name,
Address,
Year of Birth | | Position Held With
the Trust and Length of
Service | | Principal Occupation(s)
During the Past Five Years
and Other Relevant
Professional Experience | | Number of
Funds in the
Columbia Funds
Complex
Overseen | | Other Directorships
Held by Trustee During
the Past Five Years | |
Janet Langford Carrig
c/o Columbia
Management Investment Advisers, LLC,
225 Franklin Street
Mail Drop BX32 05228,
Boston, MA 02110
1957 | | Trustee 1996 | | Senior Vice President, General Counsel and Corporate Secretary, ConocoPhillips (integrated energy company) since September 2007 | | | 56 | | | None | |
Douglas A. Hacker
c/o Columbia Management Investment Advisers, LLC,
225 Franklin Street
Mail Drop BX32 05228,
Boston, MA 02110
1955 | | Trustee and Chairman of the Board 1996 | | Independent business executive since May 2006; Executive Vice President — Strategy of United Airlines from December 2002 to May 2006; President of UAL Loyalty Services (airline marketing company) from September 2001 to December 2002; Executive Vice President and Chief Financial Officer of United Airlines from July 1999 to September 2001 | | | 56 | | | Spartan Nash Company (food distributor); Nash Finch Company (food distributor) from 2005 to 2013; Aircastle Limited (aircraft leasing); SeaCube Container Leasing Ltd. (container leasing) from 2010 to 2013; and Travelport Worldwide Limited (travel information technology) | |
Nancy T. Lukitsh
c/o Columbia Management Investment Advisers, LLC,
225 Franklin Street
Mail Drop BX32 05228,
Boston, MA 02110
1956 | | Trustee 2011 | | Senior Vice President, Partner and Director of Marketing, Wellington Management Company, LLP (investment adviser) from 1997 to 2010; Chair, Wellington Management Portfolios (commingled non-U.S. investment pools) from 2007 to 2010; Director, Wellington Trust Company, NA and other Wellington affiliates from 1997 to 2010 | | | 56 | | | None | |
Annual Report 2016
36
COLUMBIA GLOBAL TECHNOLOGY GROWTH FUND
TRUSTEES AND OFFICERS (continued)
Independent Trustees (continued)
Name,
Address,
Year of Birth | | Position Held With
the Trust and Length of
Service | | Principal Occupation(s)
During the Past Five Years
and Other Relevant
Professional Experience | | Number of
Funds in the
Columbia Funds
Complex
Overseen | | Other Directorships
Held by Trustee During
the Past Five Years | |
William E. Mayer
c/o Columbia Management Investment Advisers, LLC,
225 Franklin Street
Mail Drop BX32 05228,
Boston, MA 02110
1940 | | Trustee 1991 | | Partner, Park Avenue Equity Partners (private equity) since February 1999 | | | 56 | | | DynaVox Inc. (speech creation); Lee Enterprises (print media); WR Hambrecht + Co. (financial service provider) from 2000 to 2012; BlackRock Capital Investment Corporation (investment company); and Premier, Inc. (healthcare) | |
David M. Moffett
c/o Columbia Management Investment Advisers, LLC,
225 Franklin Street
Mail Drop BX32 05228,
Boston, MA 02110
1952 | | Trustee 2011 | | Retired. Consultant to Bridgewater and Associates | | | 56 | | | Director of CIT Bank, CIT Group Inc. (commercial and consumer finance); eBay Inc. (online trading community); Genworth Financial, Inc. (financial and insurance products and services); Paypal Holdings Inc. (payment and data processing services); and Trustee University of Oklahoma Foundation | |
Charles R. Nelson
c/o Columbia Management Investment Advisers, LLC,
225 Franklin Street
Mail Drop BX32 05228,
Boston, MA 02110
1942 | | Trustee 1981 | | Retired. Professor Emeritus, University of Washington since 2011; Professor of Economics, University of Washington from 1976 to 2011; Ford and Louisa Van Voorhis Professor of Political Economy, University of Washington from 1993 to 2011; Adjunct Professor of Statistics, University of Washington from 1980 to 2011; Associate Editor, Journal of Money, Credit and Banking from September 1993 to 2008; consultant on econometric and statistical matters | | | 56 | | | None | |
John J. Neuhauser
c/o Columbia Management Investment Advisers, LLC,
225 Franklin Street
Mail Drop BX32 05228,
Boston, MA 02110
1943 | | Trustee 1984 | | President, Saint Michael's College since August 2007; Director or Trustee of several non-profit organizations, including University of Vermont Medical Center; Academic Vice President and Dean of Faculties, Boston College from August 1999 to October 2005; University Professor, Boston College from November 2005 to August 2007 | | | 56 | | | Liberty All-Star Equity Fund and Liberty All-Star Growth Fund (closed-end funds) | |
Annual Report 2016
37
COLUMBIA GLOBAL TECHNOLOGY GROWTH FUND
TRUSTEES AND OFFICERS (continued)
Independent Trustees (continued)
Name,
Address,
Year of Birth | | Position Held With
the Trust and Length of
Service | | Principal Occupation(s)
During the Past Five Years
and Other Relevant
Professional Experience | | Number of
Funds in the
Columbia Funds
Complex
Overseen | | Other Directorships
Held by Trustee During
the Past Five Years | |
Patrick J. Simpson
c/o Columbia Management Investment Advisers, LLC,
225 Franklin Street
Mail Drop BX32 05228,
Boston, MA 02110
1944 | | Trustee 2000 | | Of Counsel, Perkins Coie LLP (law firm) since 2015; Partner, Perkins Coie LLP from 1988 to 2014 | | | 56 | | | None | |
Anne-Lee Verville
c/o Columbia Management Investment Advisers, LLC,
225 Franklin Street
Mail Drop BX32 05228,
Boston, MA 02110
1945 | | Trustee 1998 | | Retired. General Manager, Global Education Industry from 1994 to 1997, President — Application Systems Division from 1991 to 1994, Chief Financial Officer — US Marketing & Services from 1988 to 1991, and Chief Information Officer from 1987 to 1988, IBM Corporation (computer and technology) | | | 56 | | | Enesco Group, Inc. (producer of giftware and home and garden decor products) from 2001 to 2006 | |
Consultant to the Trustees*
Name,
Address,
Year of Birth | | Position Held With
the Trust and Length of
Service | | Principal Occupation(s)
During the Past Five Years
and Other Relevant
Professional Experience | | Number of
Funds in the
Columbia Funds
Complex
Overseen | | Other Directorships
Held by Trustee During
the Past Five Years | |
J. Kevin Connaughton
c/o Columbia
Management Investment Advisers, LLC,
225 Franklin Street
Mail Drop BX32 05228,
Boston, MA 02110
1964 | | Trustee Consultant 2016 | | Trustee Consultant, Columbia Funds since March 2016; Managing Director and General Manager of Mutual Fund Products, Columbia Management Investment Advisers, LLC from May 2010 to February 2015; President, Columbia Funds from 2009 to 2015; and senior officer of Columbia Funds and affiliated funds from 2003 to 2015 | | | 56 | | | Board of Governors, Gateway Healthcare since January 2016; Trustee, New Century Portfolios since March 2015; and Director, The Autism Project since March 2015 | |
* J. Kevin Connaughton was appointed consultant to the Trustees effective March 1, 2016. Shareholders of the Funds are expected to be asked to elect Mr. Connaughton as a Trustee at a future shareholder meeting.
Annual Report 2016
38
COLUMBIA GLOBAL TECHNOLOGY GROWTH FUND
TRUSTEES AND OFFICERS (continued)
Interested Trustee Affiliated with Investment Manager*
Name,
Address,
Year of Birth | | Position Held With
the Trust and Length of
Service | | Principal Occupation(s)
During the Past Five Years
and Other Relevant
Professional Experience | | Number of
Funds in the
Columbia Funds
Complex
Overseen | | Other Directorships
Held by Trustee During
the Past Five Years | |
William F. Truscott
c/o Columbia Management Investment Advisers, LLC,
225 Franklin Street
Boston, MA 02110
1960 | | Trustee 2012 | | Chairman of the Board and President, Columbia Management Investment Advisers, LLC since May 2010 and February 2012, respectively; Chief Executive Officer, Global Asset Management, Ameriprise Financial, Inc. since September 2012 (previously Chief Executive Officer, U.S. Asset Management & President, Annuities, May 2010- September 2012); Director and Chief Executive Officer, Columbia Management Investment Distributors, Inc. since May 2010 and February 2012, respectively; Chairman of the Board and Chief Executive Officer, RiverSource Distributors, Inc. since 2006; Director, Threadneedle Asset Management Holdings, SARL since 2014; President and Chief Executive Officer, Ameriprise Certificate Company, 2006-August 2012. | | | 184 | | | Trustee to other Columbia Funds since 2001; Chairman of the Board, Columbia Management Investment Advisers, LLC since May 2010; Director, Columbia Management Investment Distributors, Inc. since May 2010; Former Director, Ameriprise Certificate Company, 2006-January 2013 | |
* Interested person (as defined under the 1940 Act) by reason of being an officer, director, security holder and/or employee of the Investment Manager or Ameriprise Financial.
The Statement of Additional Information has additional information about the Fund's Board members and is available, without charge, upon request by calling 800.345.6611; contacting your financial intermediary; or visiting investor.columbiathreadneedleus.com.
Annual Report 2016
39
COLUMBIA GLOBAL TECHNOLOGY GROWTH FUND
TRUSTEES AND OFFICERS (continued)
The Board has appointed officers who are responsible for day-to-day business decisions based on policies it has established. The officers serve at the pleasure of the Board. The following table provides basic information about the Officers of the Fund, including principal occupations during the past five years, although their specific titles may have varied over the period. In addition to Mr. Truscott, who is Senior Vice President, the Fund's other officers are:
Fund Officers
Name,
Address and
Year of Birth | | Position and Year
First Appointed to
Position for any Fund
in the Columbia
Funds Complex or a
Predecessor Thereof | |
Principal Occupation(s) During Past Five Years | |
Christopher O. Petersen
5228 Ameriprise Financial Center
Minneapolis, MN 55474
Born 1970 | | President and Principal Executive Officer (2015) | | Vice President and Lead Chief Counsel, Ameriprise Financial, Inc. since January 2015 (previously, Vice President and Chief Counsel January 2010-December 2014; officer of Columbia Funds and affiliated funds since 2007. | |
Michael G. Clarke
225 Franklin Street
Boston, MA 02110
Born 1969 | | Treasurer (2011), Chief Financial Officer (2009) and Chief Accounting Officer (2015) | | Vice President — Mutual Fund Administration, Columbia Management Investment Advisers, LLC, since May 2010; senior officer of Columbia Funds and affiliated funds since 2002. | |
Paul B. Goucher
100 Park Avenue
New York, NY 10017
Born 1968 | | Senior Vice President (2011), Chief Legal Officer (2015) and Assistant Secretary (2008) | | Vice President and Lead Chief Counsel, Ameriprise Financial, Inc. since November 2008 and January 2013, respectively (previously Chief Counsel, January 2010-January 2013); Vice President, Chief Legal Officer and Assistant Secretary, Columbia Management Investment Advisers, LLC since May 2010. | |
Thomas P. McGuire
225 Franklin Street
Boston, MA 02110
Born 1972 | | Senior Vice President and Chief Compliance Officer (2012) | | Vice President — Asset Management Compliance, Ameriprise Financial, Inc., since May 2010; Chief Compliance Officer, Ameriprise Certificate Company since September 2010. | |
Colin Moore
225 Franklin Street
Boston, MA 02110
Born 1958 | | Senior Vice President (2010) | | Executive Vice President and Global Chief Investment Officer, Ameriprise Financial, Inc., since July 2013; Executive Vice President and Global Chief Investment Officer, Columbia Management Investment Advisers, LLC since July 2013 (previously Director and Global Chief Investment Officer, 2010-2013). | |
Michael E. DeFao
225 Franklin Street
Boston, MA 02110
Born 1968 | | Vice President (2011) and Assistant Secretary (2010) | | Vice President and Chief Counsel, Ameriprise Financial, Inc. since May 2010. | |
Amy Johnson
5228 Ameriprise Financial Center
Minneapolis, MN 55474
Born 1965 | | Vice President (2006) | | Managing Director and Global Head of Operations, Columbia Management Investment Advisers, LLC since April 2016 (previously Managing Director and Chief Operating Officer, 2010-2016). | |
Lyn Kephart-Strong
5228 Ameriprise
Financial Center
Minneapolis, MN 55474
Born 1960 | | Vice President (2015) | | President, Columbia Management Investment Services Corp. since October 2014; Vice President & Resolution Officer, Ameriprise Trust Company since August 2009. | |
Ryan C. Larrenaga
225 Franklin Street
Boston, MA 02110
Born 1970 | | Vice President and Secretary (2015) | | Vice President and Group Counsel, Ameriprise Financial, Inc. since August 2011; officer of Columbia Funds and affiliated funds since 2005. | |
Annual Report 2016
40
COLUMBIA GLOBAL TECHNOLOGY GROWTH FUND
BOARD CONSIDERATION AND APPROVAL OF MANAGEMENT
AGREEMENT
On June 10, 2016, the Board of Trustees (the Board) and the Trustees who are not interested persons (as defined in the Investment Company Act of 1940) (the Independent Trustees) of Columbia Funds Series Trust I (the Trust) unanimously approved the continuation of the Management Agreement (the Management Agreement) with Columbia Management Investment Advisers, LLC (the Investment Manager) with respect to Columbia Global Technology Growth Fund (the Fund), a series of the Trust. As detailed below, the Board's Advisory Fees and Expenses Committee (the Committee) and the Board met on multiple occasions to review and discuss, both among themselves and with the management team of the Investment Manager, materials provided by the Investment Manager and others before determining to approve the continuation of the Management Agreement.
In connection with their deliberations regarding the continuation of the Management Agreement, the Committee and the Board evaluated materials requested from the Investment Manager regarding the Fund and the Management Agreement, and discussed these materials with representatives of the Investment Manager at Committee meetings held on March 8, 2016, April 27, 2016 and June 9, 2016 and at Board meetings held on March 9, 2016 and June 10, 2016. In addition, the Board considers matters bearing on the Management Agreement at most of its other meetings throughout the year and meets regularly with senior management of the Trust and the Investment Manager. Through the Board's Investment Oversight Committees, Trustees also meet with selected portfolio managers of the funds the Trustees oversee and other investment personnel at various times throughout the year. The Committee and the Board also consulted with its independent fee consultant, Fund counsel and with the Independent Trustees' independent legal counsel, who advised on various matters with respect to the Committee's and the Board's considerations and otherwise assisted the Committee and the Board in their deliberations. On June 9, 2016, the Committee recommended that the Board approve the continuation of the Management Agreement. On June 10, 2016, the Board, including the Independent Trustees, voting separately, unanimously approved the continuation of the Management Agreement for the Fund.
The Committee and the Board considered all information that they, their legal counsel or the Investment Manager believed reasonably necessary to evaluate and to determine whether to recommend for approval or approve the continuation of the Management Agreement. The information and factors considered by the Committee and the Board in recommending for approval or approving the continuation of the Management Agreement for the Fund included the following:
• Information on the investment performance of the Fund relative to the performance of a group of mutual funds determined to be comparable to the Fund by an independent third-party data provider, as well as performance relative to benchmarks;
• Information on the Fund's management fees and total expenses, including information comparing the Fund's expenses to those of a group of comparable mutual funds, as determined by the independent third-party data provider;
• The Investment Manager's agreement to contractually limit or cap total operating expenses for the Fund through December 31, 2017 so that total operating expenses (excluding certain fees and expenses, such as transaction costs and certain other investment related expenses, interest, taxes, acquired fund fees and expenses, and infrequent and/or unusual expenses) would not exceed a specified annual rate, as a percentage of the Fund's net assets;
• The terms and conditions of the Management Agreement;
• The current and proposed terms and conditions of other agreements and arrangements with affiliates of the Investment Manager relating to the operations of the Fund, including agreements with respect to the provision of distribution and transfer agency services to the Fund;
• Descriptions of various functions performed by the Investment Manager under the Management Agreement, including portfolio management and portfolio trading practices;
• Information regarding the management fees of similarly-managed portfolios of other clients of the Investment Manager, including institutional separate accounts;
Annual Report 2016
41
COLUMBIA GLOBAL TECHNOLOGY GROWTH FUND
BOARD CONSIDERATION AND APPROVAL OF MANAGEMENT
AGREEMENT (continued)
• Information regarding the reputation, regulatory history and resources of the Investment Manager, including information regarding senior management, portfolio managers and other personnel;
• Information regarding the capabilities of the Investment Manager with respect to compliance monitoring services, including an assessment of the Investment Manager's compliance system by the Fund's Chief Compliance Officer; and
• The profitability to the Investment Manager and its affiliates from their relationships with the Fund.
Nature, Extent and Quality of Services Provided under the Management Agreement
The Committee and the Board considered the nature, extent and quality of services provided to the Fund by the Investment Manager and its affiliates under the Management Agreement and under separate agreements for the provision of transfer agency services, and the resources dedicated to the Fund and the other Columbia Funds by the Investment Manager and its affiliates. The Committee and the Board considered, among other things, the Investment Manager's ability to attract, motivate and retain highly qualified research, advisory and supervisory investment professionals (including personnel and other resources, compensation programs for personnel involved in fund management, reputation and other attributes), the portfolio management services provided by those investment professionals, and the quality of the Investment Manager's investment research capabilities and trade execution services. The Committee and the Board also considered the potential benefits to shareholders of investing in a mutual fund that is part of a fund complex offering exposure to a variety of asset classes and investment disciplines and providing a variety of fund and shareholder services.
The Committee and the Board also considered the professional experience and qualifications of the senior personnel of the Investment Manager, which included consideration of the Investment Manager's experience with similarly-structured funds. The Committee and the Board noted the compliance programs of and the compliance-related resources provided to the Fund by the Investment Manager and its affiliates, and considered the Investment Manager's ability to provide administrative services to the Fund and coordinate the activities of the Fund's other service providers. After reviewing these and related factors, the Committee and the Board concluded, within the context of their overall conclusions, that the nature, extent and quality of the services provided to the Fund under the Management Agreement supported the continuation of the Management Agreement.
Investment Performance
The Committee and the Board reviewed information about the performance of the Fund over various time periods, including performance information relative to benchmarks and information based on reports of the independent third-party data provider that compared the performance of the Fund to the performance of a group of comparable mutual funds, and data provided by the independent fee consultant. The Committee and the Board also reviewed a description of the third party's methodology for identifying the Fund's peer groups for purposes of performance and expense comparisons.
The Committee and the Board noted that, through December 31, 2015, the Fund's performance was in the twelfth, twelfth and eighth percentile (where the best performance would be in the first percentile) of its category selected by the independent third-party data provider for the purposes of performance comparisons for the one-, three- and five-year periods, respectively.
The Committee and the Board also considered the Investment Manager's performance and reputation generally, the Investment Manager's historical responsiveness to Board concerns about performance, and the Investment Manager's willingness to take steps intended to improve performance. After reviewing these and related factors, the Committee and the Board concluded, within the context of their overall conclusions, that the performance of the Fund and the Investment Manager was sufficient, in light of other considerations, to warrant the continuation of the Management Agreement.
Investment Management Fee Rates and Other Expenses
The Committee and the Board considered the management fees charged to the Fund under the Management Agreement as well as the total expenses incurred by the Fund. In assessing the reasonableness of the fees
Annual Report 2016
42
COLUMBIA GLOBAL TECHNOLOGY GROWTH FUND
BOARD CONSIDERATION AND APPROVAL OF MANAGEMENT
AGREEMENT (continued)
under the Management Agreement, the Committee and the Board considered, among other information, the Fund's management fee and its total expense ratio as a percentage of average daily net assets. The Committee and the Board considered data provided by the independent fee consultant. The Committee and the Board noted that, as of December 31, 2015, the Fund's actual management fee and net total expense ratio are ranked in the fourth and third quintiles, respectively, (where the lowest fees and expenses would be in the first quintile) against the Fund's expense universe as determined by the independent third-party data provider for purposes of expense comparison. The Committee and the Board also took into account the fee waiver and expense limitation arrangements agreed to by the Investment Manager, as noted above.
The Committee and the Board also received and considered information about the management fees charged by the Investment Manager to institutional separate accounts. In considering the fees charged to those accounts, the Committee and the Board took into account, among other things, the Investment Manager's representations about the differences between managing mutual funds as compared to other types of accounts, including differences in the services provided, differences in the risk profile of such business for the Investment Manager and the additional resources required to manage mutual funds effectively. The Committee and the Board also received and considered information about the fees charged by the Investment Manager for sub-advisory services provided to comparable unaffiliated funds. In evaluating the Fund's management fees, the Committee and the Board also took into account the demands, complexity and quality of the investment management of the Fund.
After reviewing these and related factors, the Committee and the Board concluded, within the context of their overall conclusions, that the management fee rates and expenses of the Fund were sufficient, in light of other considerations, to warrant the continuation of the Management Agreement.
Costs of Services Provided and Profitability
The Committee and the Board also took note of the costs the Investment Manager and its affiliates incur in connection with the services provided (both on an absolute and relative basis) and the profitability to the Investment Manager and its affiliates in connection with their relationships with the Fund.
The Committee and the Board also considered the compensation directly or indirectly received by the Investment Manager's affiliates in connection with their relationships with the Fund. The Committee and the Board reviewed information provided by management as to the profitability to the Investment Manager and its affiliates of their relationships with the Fund, information about the allocation of expenses used to calculate profitability, and comparisons of profitability levels realized in 2015 to profitability levels realized in 2014. When reviewing profitability, the Committee and the Board also considered court cases in which adviser profitability was an issue in whole or in part, the performance of similarly managed funds, the performance of the Fund, and the expense ratio of the Fund. In addition, the Committee and the Board considered information provided by the Investment Manager regarding the Investment Manager's financial condition and comparing its profitability to that of other asset management firms that are, or are subsidiaries of, publicly traded companies. In this regard, the Committee and the Board also considered data provided by the independent fee consultant.
After reviewing these and related factors, the Committee and the Board concluded, within the context of their overall conclusions, that the costs of services provided and the profitability to the Investment Manager and its affiliates from their relationships with the Fund supported the continuation of the Management Agreement.
Economies of Scale
The Committee and the Board considered the potential existence of economies of scale in the provision by the Investment Manager of services to the Fund, to groups of related funds, and to the Investment Manager's investment advisory clients as a whole, and whether those economies of scale were shared with the Fund through breakpoints in investment management fees or other means, such as expense limitation arrangements and additional investments by the Investment Manager in investment, trading and compliance resources. The Committee and the Board noted that the management fee schedules for the Fund contained breakpoints that would reduce the fee rate on assets above specified threshold levels.
Annual Report 2016
43
COLUMBIA GLOBAL TECHNOLOGY GROWTH FUND
BOARD CONSIDERATION AND APPROVAL OF MANAGEMENT
AGREEMENT (continued)
In considering these matters, the Committee and the Board also considered the costs of the services provided and the profitability to the Investment Manager and its affiliates from their relationships with the Fund, as discussed above. After reviewing these and related factors, the Committee and the Board concluded, within the context of their overall conclusions, that the extent to which any economies of scale were expected to be shared with the Fund supported the continuation of the Management Agreement.
Other Benefits to the Investment Manager
The Committee and the Board received and considered information regarding "fall-out" or ancillary benefits received by the Investment Manager and its affiliates as a result of their relationships with the Fund, such as the engagement of the Investment Manager's affiliates to provide distribution and transfer agency services to the Fund. In this regard, among other matters, the Committee and the Board considered that the Fund's distributor retains a portion of the distribution fees from the Fund and receives a portion of the sales charges on sales or redemptions of certain classes of shares of the Fund. The Committee and the Board also considered the benefits of research made available to the Investment Manager by reason of brokerage commissions generated by the Fund's securities transactions, and reviewed information about the Investment Manager's practices with respect to allocating portfolio transactions for brokerage and research services. The Committee and the Board considered the possible conflicts of interest associated with certain fall-out or other ancillary benefits and the reporting, disclosure and other processes that are in place to address such possible conflicts of interest. The Committee and the Board recognized that the Investment Manager's profitability would be somewhat lower without these benefits.
Conclusion
The Committee and the Board reviewed all of the above considerations in reaching their decisions to recommend or approve the continuation of the Management Agreement. In their deliberations, the Trustees did not identify any particular information that was all-important or controlling, and individual Trustees may have attributed different weights to the various factors. Based on their evaluation of all factors that they deemed to be material, including those factors described above, and assisted by the advice of independent legal counsel, the Board, including the Independent Trustees, voting separately, unanimously approved the continuation of the Management Agreement.
Annual Report 2016
44
COLUMBIA GLOBAL TECHNOLOGY GROWTH FUND
IMPORTANT INFORMATION ABOUT THIS REPORT
Each fund mails one shareholder report to each shareholder address. If you would like more than one report, please call shareholder services at 800.345.6611 and additional reports will be sent to you.
The policy of the Board is to vote the proxies of the companies in which each fund holds investments consistent with the procedures as stated in the Statement of Additional Information (SAI). You may obtain a copy of the SAI without charge by calling 800.345.6611; contacting your financial intermediary; visiting investor.columbiathreadneedleus.com; or searching the website of the Securities and Exchange Commission (SEC) at sec.gov. Information regarding how each fund voted proxies relating to portfolio securities is filed with the SEC by August 31st for the most recent 12-month period ending June 30th of that year, and is available without charge by visiting investor.columbiathreadneedleus.com, or searching the website of the SEC at sec.gov.
Each fund files a complete schedule of portfolio holdings with the SEC for the first and third quarters of each fiscal year on Form N-Q. Each fund's Form N-Q is available on the SEC's website at sec.gov and may be reviewed and copied at the SEC's Public Reference Room in Washington, D.C. Information on the operation of the Public Reference Room may be obtained by calling 800.SEC.0330. Each fund's complete schedule of portfolio holdings, as filed on Form N-Q, can also be obtained without charge, upon request, by calling 800.345.6611.
Annual Report 2016
45
Columbia Global Technology Growth Fund
P.O. Box 8081
Boston, MA 02266-8081

Please read and consider the investment objectives, risks, charges and expenses for any fund carefully before investing. For a prospectus and summary prospectus, which contains this and other important information about the Fund, go to investor.columbiathreadneedleus.com. The Fund is distributed by Columbia Management Investment Distributors, Inc., member FINRA, and managed by Columbia Management Investment Advisers, LLC.
Columbia Threadneedle Investments (Columbia Threadneedle) is the global brand name of the Columbia and Threadneedle group of companies.
All rights reserved. Columbia Management Investment Distributors, Inc., 225 Franklin Street, Boston, MA 02110-2804
© 2016 Columbia Management Investment Advisers, LLC.
investor.columbiathreadneedleus.com
ANN234_08_F01_(10/16)

ANNUAL REPORT
August 31, 2016


ABOUT COLUMBIA THREADNEEDLE INVESTMENTS
Columbia Threadneedle Investments is a leading global asset management group that provides a broad range of investment strategies and solutions for individual, institutional and corporate clients around the world.
With more than 2,000 people, including over 450 investment professionals based in North America, Europe and Asia, we manage $460 billion* of assets across developed and emerging market equities, fixed income, asset allocation solutions and alternatives. We are the 13th largest manager of long-term mutual fund assets in the U.S.** and the 4th largest manager of retail funds in the U.K.***
Our priority is the investment success of our clients. We aim to deliver the investment outcomes they expect through an investment approach that is team-based, performance-driven and risk-aware. Our culture is dynamic and interactive. By sharing our insights across asset classes and geographies, we generate richer perspectives on global, regional and local investment landscapes. The ability to exchange and debate investment ideas in a collaborative environment enriches our teams' investment processes. More importantly, it results in better informed investment decisions for our clients.
Columbia funds are distributed by Columbia Management Investment Distributors, Inc., member FINRA, and managed by Columbia Management Investment Advisers, LLC.
Columbia Threadneedle Investments (Columbia Threadneedle) is the global brand name of the Columbia and Threadneedle group of companies.
* In U.S. dollars as of June 30, 2016. Source: Ameriprise Q2 Earnings Release. Includes all assets managed by entities in the Columbia and Threadneedle group of companies. Contact us for more current data.
** Source: ICI as of June 30, 2016 for Columbia Management Investment Advisers, LLC.
*** Source: Investment Association as of March 2016 for Threadneedle Asset Management Limited.
© 2016 Columbia Management Investment Advisers, LLC. All rights reserved.
Not part of the shareholder report
Investment strategies to help meet investor needs
We are committed to helping investors navigate financial challenges to reach their desired outcomes. The possibilities are endless.
Your success is our priority.
Retire comfortably
Fund college or higher education
Leave a legacy
Generate an appropriate stream of income in retirement
Traditional approaches to income may no longer be adequate — and they may no longer provide the diversification benefits they once did. Investors need to rethink how they generate retirement income.
Worried about running out of income? You are not alone.
Navigate a changing interest rate environment
Even in today's challenging interest rate environment, it's still possible to navigate markets and achieve your goals.
Make investment choices designed specifically for this market environment.
Maximize after-tax returns
In an environment where what you keep is more important than what you earn, municipal bonds can help mitigate higher taxes while providing attractive yields compared to other investment options.
You've worked too hard building your wealth to lose it to taxes.
Grow assets to achieve financial goals
Finding growth opportunities in today's complex market environment requires strong research capabilities, creative thinking and a disciplined approach.
Do your investments deliver the portfolio growth you need?
Ease the impact of volatile markets
With increasing concerns about market volatility, investors should consider diversifying their portfolios with non-traditional holdings.
Interested in turning volatility into opportunity?
To find out more, contact your financial professional, call 800.426.3750 or visit investor.columbiathreadneedleus.com
Not part of the shareholder report
Get the market insight you need from our investment experts and subscribe to our latest publications
Stay informed with Columbia Threadneedle Investments
Investor insight
Find economic and market commentary, investment videos, white papers, mutual fund commentary and more at investor.columbiathreadneedleus.com.
Subscribe to the latest information from Columbia Threadneedle. Register your information online at investor.columbiathreadneedleus.com/subscribe and select the publications you would like to receive, including:
n Columbia Threadneedle Investor Newsletter, highlighting the latest macro- and micro-economic trends, investment themes, products, service changes and other items of interest to our investors
n Investment Strategy Outlook, showcasing the Columbia Threadneedle Asset Allocation Team's perspective on global economic investment conditions and markets
n MarketTrack, featuring straightforward insight on current investment opportunities
n White papers that delve deep into a variety of investment topics
n Quarterly portfolio manager commentary and fund fact sheets
Update your subscriptions at any time by accessing the email subscription center.
Social media
We offer you multiple ways to access our market commentary and investment insights.
n Perspectives blog at investor.columbiathreadneedleus.com
Read timely posts by our investment team, including our chief investment officer, chief economist and portfolio managers.
n Twitter.com/CTinvest_US
Follow us on Twitter for quick, up-to-the-minute comments on market news and more.
n Youtube.com/CTInvestUS
View our commentaries on the economy, markets and current investment opportunities.
n Linkedin.com/company/Columbia-Threadneedle-Investments-US
Connect with us on LinkedIn for updates from our thought leaders.
Not part of the shareholder report
 Dear Shareholders,
Volatility comes with the territory for long-term investors. Some investors instinctively want to pull out of the market or sell underperforming investments at the first sign of increased volatility or perhaps even as soon as they perceive it on the horizon. But taking yourself out of the market could mean losing out on potential opportunities, and putting your longer term investment goals at risk.
Cumulative return is not just about achieving high returns when markets are going up; it's also about remaining invested and minimizing losses during weak or volatile markets so that you can participate on the upside. Developing a deeper understanding of the various risks your portfolio is subject to can help you balance these risks.
Diversification is critical in seeking to achieve that balance. We believe that most portfolios could be more effectively diversified either by introducing holdings with performance profiles unrelated to existing holdings (like alternative products) or by rebalancing existing holdings with an eye toward risk allocation. Over time, distributing risk more evenly may produce a more pronounced diversification benefit and may improve portfolio efficiency. We believe market volatility can create significant opportunities and, in fact, these periods may be some of the very best times to invest.
With this in mind, I thought it important to highlight excerpts from a piece written by Colin Moore, Global Chief Investment Officer, in which he touches on some of these issues emphasizing the importance of a properly constructed portfolio in seeking to effectively manage volatility and to achieve consistency of returns. I encourage you to read the article in its entirety. To access the full article and for other insights on current market, please visit blog.columbiathreadneedleus.com/latest-perspectives.
You need investments that are designed to help you ease the impact of volatile market environments and keep the savings you have worked tirelessly to amass. Columbia Threadneedle Investments provides investment solutions to help you tackle financial challenges and achieve your desired outcome.
Best regards,

Christopher O. Petersen
President, Columbia Funds
Excerpts from:
Taking the scare out of the volatility bogeyman
By Colin Moore, Global Chief Investment Officer
Colin Moore is the global chief investment officer for Columbia Threadneedle Investments. His responsibilities include ensuring that a disciplined investment process is in place across all asset classes, including equity and fixed income. Mr. Moore joined one of the Columbia Threadneedle Investments legacy firms in 2002 as head of equity and was also head of fixed income and liquidity strategies from 2009 – 2010.

n In today's low growth, higher volatility world, the emphasis is shifting from maximization of returns to consistency of returns.
PRESIDENT'S MESSAGE (continued)
n Portfolios should represent the behavioral risk-return tradeoff of investors, remembering that they won't stay invested to realize the return if we get the risk tolerance wrong.
n Holding long-term savings in cash to avoid volatility (the financial equivalent of hiding under the sheets) is detrimental to achieving long-term goals.
According to Wikipedia, "The bogeyman is a common allusion to a mythical creature in many cultures used to control behavior. This monster has no specific appearance, and conceptions about it can vary drastically from household to household within the same community; in many cases he has no set appearance in the mind of an adult or child, but is simply a non-specific embodiment of terror." Different cultures have different names and physical representations for the bogeyman, and investors are no different. We have terrible monsters that we fear may destroy our portfolios, and we call one of the scariest of them volatility.
While the bogeyman is mythical (I hope!), volatility is real and can cause serious damage. To understand why investors have such a hard time coping with volatility, we first need to define three cognitive biases at work in today's investment environment:
1) Recency bias — something that has recently come to the forefront of our attention, regardless of how long established it is, suddenly seems to appear with improbable frequency.
2) Negativity bias — we tend to have a greater recall of unpleasant memories than positive memories.
3) Loss aversion — our dissatisfaction with losing money tends to be greater than our satisfaction with making money.
The level of volatility varies dramatically, and so does investor fear and panic selling — waxing when volatility rises, waning when it falls. Recent studies have pointed to demographics as an important driver of panic selling. The theory is that as people get closer to retirement, the prospects of a large (20% – 30%) loss in financial assets can have a much more pronounced effect on their sense of well-being. Wealth preservation instincts kick in much more quickly than for younger (and typically less wealthy) savers.
The reality is that there is little opportunity for return without volatility. Therefore, the bogeyman effect of holding long-term savings in cash to avoid volatility (the financial equivalent of hiding under the sheets) is detrimental to achieving long-term goals. This effect tends to be more pronounced during the episodic spikes in volatility. The significant spike in volatility in 2008 and 2009 led to significant withdrawals from long-term investment funds over the same period. Less pronounced effects can also be seen when comparing 2001 – 2003 and 2011 – 2012. Conversely, flows picked up when volatility returned to "normal" levels. Investor behavior of this type is consistent with the three behavioral biases.
I believe average volatility will be higher over the next 10 years than the last 10 years and episodic spikes will increase in frequency because sustainable economic growth will be structurally lower and geopolitical risk higher than any time since World War II. Low growth creates uncertainty while loss aversion will make investors fear that we are one economic mishap or geopolitical event away from no growth or recession. The result will be higher volatility on average. Negativity bias will tend to exacerbate "spike" reactions to event-driven geopolitical news, and the volatility bogeyman will appear more often. Assuming the behavioral biases continue, investor returns are likely to be very disappointing regardless of the total return generated by financial markets due to the bogeyman effect.
To mitigate this effect, we need to focus on portfolio construction and an improved understanding of diversification. I accept that equities are likely to offer the highest return over the next 10 years, but they also offer the highest volatility. Many portfolio construction optimization tools use historical average volatility, which is likely to underestimate the volatility investors will face. The bogeyman emerges when individual asset class volatility spikes and cross correlations rise, the combination of which increases overall portfolio volatility far beyond expectation. Diversification is meant to protect investors against volatility, but what's the point of owning lots of investments if the volatility bogeyman has not been properly estimated?
Most importantly, portfolios should be constructed to properly represent the behavioral risk-return trade off of investors, remembering that they won't stay invested to realize the return if we get the risk tolerance wrong. In a low growth, higher volatility world, the emphasis is shifting to return consistency rather than return maximization,
PRESIDENT'S MESSAGE (continued)
and investors are best served through investment approaches that appreciate that distinction. Even though it's a permanent feature of financial markets, volatility is less likely to be the bogeyman we all fear if portfolios are constructed with this understanding.
Please visit blog.columbiathreadneedleus.com/latest-perspectives to read the entire article.
Investors should consider the investment objectives, risks, charges and expenses of a mutual fund carefully before investing. For a free prospectus and summary prospectus, which contains this and other important information about a fund, visit investor.columbiathreadneedleus.com. The prospectus should be read carefully before investing.
The views expressed are as of April 2016, may change as market or other conditions change, and may differ from views expressed by other Columbia Management Investment Advisers, LLC (CMIA) associates or affiliates. Actual investments or investment decisions made by CMIA and its affiliates, whether for its own account or on behalf of clients, will not necessarily reflect the views expressed. This information is not intended to provide investment advice and does not account for individual investor circumstances. Investment decisions should always be made based on an investor's specific financial needs, objectives, goals, time horizon and risk tolerance. Asset classes described may not be suitable for all investors.
Past performance does not guarantee future results, and no forecast should be considered a guarantee either. Since economic and market conditions change frequently, there can be no assurance that the trends described here will continue or that the forecasts are accurate.
Diversification does not guarantee a profit or protect against loss.
Columbia Funds are distributed by Columbia Management Investment Distributors, Inc., member FINRA, and managed by Columbia Management Investment Advisers, LLC.
© 2016 Columbia Management Investment Advisers, LLC. All rights reserved.
Fund Investment Manager
Columbia Management Investment
Advisers, LLC
225 Franklin Street
Boston, MA 02110
Fund Distributor
Columbia Management Investment
Distributors, Inc.
225 Franklin Street
Boston, MA 02110
Fund Transfer Agent
Columbia Management Investment
Services Corp.
P.O. Box 8081
Boston, MA 02266-8081
For more information about any of the funds, please visit investor.columbiathreadneedleus.com or call 800.345.6611. Customer Service Representatives are available to answer your questions Monday through Friday from 8 a.m. to 7 p.m. Eastern time.
The views expressed in this report reflect the current views of the respective parties. These views are not guarantees of future performance and involve certain risks, uncertainties and assumptions that are difficult to predict, so actual outcomes and results may differ significantly from the views expressed. These views are subject to change at any time based upon economic, market or other conditions and the respective parties disclaim any responsibility to update such views. These views may not be relied on as investment advice and, because investment decisions for a Columbia fund are based on numerous factors, may not be relied on as an indication of trading intent on behalf of any particular Columbia fund. References to specific securities should not be construed as a recommendation or investment advice.
Performance Overview | | | 3 | | |
Manager Discussion of Fund Performance | | | 5 | | |
Understanding Your Fund's Expenses | | | 8 | | |
Portfolio of Investments | | | 9 | | |
Statement of Assets and Liabilities | | | 32 | | |
Statement of Operations | | | 34 | | |
Statement of Changes in Net Assets | | | 35 | | |
Financial Highlights | | | 38 | | |
Notes to Financial Statements | | | 47 | | |
Report of Independent Registered Public Accounting Firm | | | 58 | | |
Federal Income Tax Information | | | 59 | | |
Trustees and Officers | | | 60 | | |
Board Consideration and Approval of Management Agreement | | | 65 | | |
Important Information About This Report | | | 69 | | |
Performance Summary
n Columbia Balanced Fund (the Fund) Class A shares returned 8.60% excluding sales charges for the 12-month period that ended August 31, 2016.
n The Fund lagged its Blended Index which returned 10.09% for the same time period.
n During the same time period, the Fund's equity benchmark, the S&P 500 Index, returned 12.55%, while the Fund's fixed-income benchmark, the Bloomberg Barclays U.S. Aggregate Bond Index, returned 5.97%.
n The Fund's equity portfolio modestly lagged its benchmark, while the fixed-income portion of the Fund outperformed its benchmark.
Average Annual Total Returns (%) (for period ended August 31, 2016)
| | | Inception | | 1 Year | | 5 Years | | 10 Years | |
Class A | | 11/01/02 | | | | | | | | | | | | | |
Excluding sales charges | | | | | | | 8.60 | | | | 10.74 | | | | 7.91 | | |
Including sales charges | | | | | | | 2.36 | | | | 9.43 | | | | 7.28 | | |
Class B | | 11/01/02 | | | | | | | | | | | | | |
Excluding sales charges | | | | | | | 7.75 | | | | 9.90 | | | | 7.10 | | |
Including sales charges | | | | | | | 2.75 | | | | 9.62 | | | | 7.10 | | |
Class C | | 10/13/03 | | | | | | | | | | | | | |
Excluding sales charges | | | | | | | 7.80 | | | | 9.92 | | | | 7.10 | | |
Including sales charges | | | | | | | 6.80 | | | | 9.92 | | | | 7.10 | | |
Class K* | | 03/07/11 | | | 8.69 | | | | 10.85 | | | | 7.96 | | |
Class R* | | 09/27/10 | | | 8.35 | | | | 10.48 | | | | 7.64 | | |
Class R4* | | 11/08/12 | | | 8.86 | | | | 11.03 | | | | 8.18 | | |
Class R5* | | 03/07/11 | | | 8.96 | | | | 11.14 | | | | 8.23 | | |
Class Y* | | 11/08/12 | | | 9.02 | | | | 11.15 | | | | 8.24 | | |
Class Z | | 10/01/91 | | | 8.85 | | | | 11.01 | | | | 8.17 | | |
Blended Index | | | | | | | 10.09 | | | | 10.17 | | | | 6.76 | | |
S&P 500 Index | | | | | | | 12.55 | | | | 14.69 | | | | 7.51 | | |
Bloomberg Barclays U.S. Aggregate Bond Index | | | | | | | 5.97 | | | | 3.24 | | | | 4.89 | | |
Returns for Class A are shown with and without the maximum initial sales charge of 5.75%. Returns for Class B are shown with and without the applicable contingent deferred sales charge (CDSC) of 5.00% in the first year, declining to 1.00% in the sixth year and eliminated thereafter. Returns for Class C are shown with and without the 1.00% CDSC for the first year only. The Fund's other classes are not subject to sales charges and have limited eligibility. Please see the Fund's prospectus for details. Performance for different share classes will vary based on differences in sales charges and fees associated with each class. All results shown assume reinvestment of distributions during the period. Returns do not reflect the deduction of taxes that a shareholder may pay on Fund distributions or on the redemption of Fund shares. Performance results reflect the effect of any fee waivers or reimbursements of Fund expenses by Columbia Management Investment Advisers, LLC and/or any of its affiliates. Absent these fee waivers or expense reimbursement arrangements, performance results would have been lower.
The performance information shown represents past performance and is not a guarantee of future results. The investment return and principal value of your investment will fluctuate so that your shares, when redeemed, may be worth more or less than their original cost. Current performance may be lower or higher than the performance information shown. You may obtain performance information current to the most recent month-end by contacting your financial intermediary, visiting investor.columbiathreadneedleus.com or calling 800.345.6611.
*The returns shown for periods prior to the share class inception date (including returns for the Life of the Fund, if shown, which are since Fund inception) include the returns of the Fund's oldest share class. These returns are adjusted to reflect any higher class-related operating expenses of the newer share classes, as applicable. Please visit investor.columbiathreadneedleus.com/investment-products/mutual-funds/
appended-performance for more information.
The Blended Index is a weighted custom composite consisting of 60% S&P 500 Index and 40% Bloomberg Barclays U.S. Aggregate Bond Index.
Annual Report 2016
3
PERFORMANCE OVERVIEW (continued)
The S&P 500 Index, an unmanaged index, measures the performance of 500 widely held, large-capitalization U.S. stocks and is frequently used as a general measure of market performance.
The Bloomberg Barclays U.S. Aggregate Bond Index is a broad-based benchmark that measures the investment-grade, U.S. dollar-denominated, fixed-rate taxable bond market, including Treasuries, government-related and corporate securities, mortgage-backed securities (agency fixed-rate and hybrid adjustable-rate mortgage passthroughs), asset-backed securities, and commercial mortgage-backed securities. Effective August 24, 2016, the Barclays U.S. Aggregate Bond Index was rebranded as the Bloomberg Barclays U.S. Aggregate Bond Index.
Indices are not available for investment, are not professionally managed and do not reflect sales charges, fees, brokerage commissions, taxes or other expenses of investing. Securities in the Fund may not match those in an index.
Performance of a Hypothetical $10,000 Investment (September 1, 2006 – August 31, 2016)
The chart above shows the change in value of a hypothetical $10,000 investment in Class A shares of Columbia Balanced Fund during the stated time period, and does not reflect the deduction of taxes that a shareholder may pay on Fund distributions or on the redemption of Fund shares.
Annual Report 2016
4
MANAGER DISCUSSION OF FUND PERFORMANCE
For the 12-month period that ended August 31, 2016, the Fund's Class A shares returned 8.60% excluding sales charges. The Fund's Blended Index, returned 10.09%. During the same time period, the Fund's equity benchmark, the S&P 500 Index, returned 12.55%, while the Fund's fixed-income benchmark, the Bloomberg Barclays U.S. Aggregate Bond Index, returned 5.97%. The Fund's equity portfolio modestly underperformed its benchmark while the fixed-income portfolio outperformed its benchmark.
Markets Logged Solid Gains
Even though a host of factors weighed on investors during the 12-month period ended August 31, 2016, strong rebounds after three significant declines left stock markets with solid gains while falling interest rates helped boost bond prices. Lackluster economic growth, contentious geopolitical conflicts and expectations of a shift in U.S. monetary policy weighed on investors in the first half of the period. In December 2015, the Federal Reserve (the Fed) raised the target range of its benchmark interest rate by a quarter of a point. But the Fed took no further action as subpar global economic growth continued and mixed economic data undermined confidence at home.
The U.S. economy continued to expand modestly throughout the period, as the manufacturing sector regained some traction in the spring and the U.S. labor markets recovered to full employment for the first time since the Great Recession. The vote by the United Kingdom to exit the European Union gave global stock markets a jolt in mid-June and led to an investor flight to safety, which pushed U.S. Treasury yields down to historically low levels. But the anxiety was short lived.
The S&P 500 Index rose 12.55%. Large-cap stocks outperformed mid- and small-cap stocks. Value stocks outperformed growth stocks, with an especially large advantage for mid-cap and small-cap value stocks versus their growth counterparts. As interest rates (except for the very shortest rates) declined during the period, typically interest-rate sensitive telecommunications services and utilities were the strongest performing equity sectors for the period, along with information technology. Falling interest rates also boosted bond prices. At the end of the reporting period, five-, 10- and 30-year U.S. Treasury yields closed at 1.20%, 1.58% and 2.23%, respectively.
Equity Portfolio Delivers Solid Return
Within the equity portion of the Fund, stock selection was particularly strong in the consumer discretionary, information technology and industrial sectors. Within the consumer discretionary sector, Aramark and Comcast were standout performers as the market rewarded them for their business stability. Within the information technology sector, positions in Activision Blizzard, Facebook and Alphabet (Google) delivered outsized returns. Strong digital advertising growth benefited both Facebook and Google. In addition, investors have responded favorably to the renewed financial discipline brought in by Alphabet CFO Ruth Porat. Within the industrials sector, positions in Nielsen Holdings and Dun & Bradstreet, aided returns. Both business service companies were resilient in an environment of easing global industrial activity. General Electric, which has
Portfolio Management
Leonard Aplet, CFA
Brian Lavin, CFA
Gregory Liechty
Guy Pope, CFA
Ronald Stahl, CFA
Top Ten Holdings (%)
(at August 31, 2016) | |
Apple, Inc. | | | 2.3 | | |
Berkshire Hathaway, Inc.,
Class B | | | 2.1 | | |
Verizon Communications, Inc. | | | 2.0 | | |
Alphabet, Inc., Class C | | | 2.0 | | |
Citigroup, Inc. | | | 1.9 | | |
Microsoft Corp. | | | 1.8 | | |
JPMorgan Chase & Co. | | | 1.7 | | |
Facebook, Inc., Class A | | | 1.7 | | |
Johnson & Johnson | | | 1.6 | | |
Comcast Corp., Class A | | | 1.6 | | |
Percentages indicated are based upon total investments (excluding Money Market Funds).
For further detail about these holdings, please refer to the section entitled "Portfolio of Investments."
Fund holdings are as of the date given, are subject to change at any time, and are not recommendations to buy or sell any security.
Annual Report 2016
5
MANAGER DISCUSSION OF FUND PERFORMANCE (continued)
Portfolio Breakdown (%)
(at August 31, 2016) | |
Asset-Backed Securities —
Non-Agency | | | 1.8 | | |
Commercial Mortgage-Backed
Securities — Agency | | | 2.6 | | |
Commercial Mortgage-Backed
Securities — Non-Agency | | | 2.4 | | |
Common Stocks | | | 60.6 | | |
Corporate Bonds & Notes | | | 12.0 | | |
Foreign Government Obligations | | | 0.3 | | |
Inflation-Indexed Bonds | | | 0.6 | | |
Money Market Funds | | | 7.0 | | |
Municipal Bonds | | | 0.1 | | |
Residential Mortgage-Backed
Securities — Agency | | | 8.8 | | |
Residential Mortgage-Backed
Securities — Non-Agency | | | 0.9 | | |
Senior Loans | | | 0.0 | (a) | |
U.S. Government & Agency
Obligations | | | 0.3 | | |
U.S. Treasury Obligations | | | 2.6 | | |
Total | | | 100.0 | | |
Percentages indicated are based upon total investments. The Fund's portfolio composition is subject to change.
(a) Rounds to zero.
Equity Sector Breakdown (%)
(at August 31, 2016) | |
Consumer Discretionary | | | 13.7 | | |
Consumer Staples | | | 7.5 | | |
Energy | | | 7.5 | | |
Financials | | | 20.3 | | |
Health Care | | | 16.7 | | |
Industrials | | | 8.1 | | |
Information Technology | | | 21.4 | | |
Materials | | | 0.6 | | |
Telecommunication Services | | | 3.1 | | |
Utilities | | | 1.1 | | |
Total | | | 100.0 | | |
Percentages indicated are based upon total equity investments. The Fund's portfolio composition is subject to change.
long been out of favor, was rewarded by investors for its continued efforts in restructuring.
Consumer staples, financials and health care holdings were the biggest detractors from equity results for the period. In the consumer staples sector, overweight positions in Philip Morris International and PepsiCo delivered double-digit returns. However, these were not enough to offset disappointments from holdings such as CVS Health and Walgreens Boots Alliance, both strong performers a year ago, which lost ground during this 12-month period. Both CVS and Walgreens, with their link to health care, were vulnerable to concerns about the possibility of increased drug price regulation. Lack of exposure to some of the consumer staples sector's strongest performers, including Altria, Tyson Foods and Procter & Gamble, also detracted from relative performance.
In the financials sector, which was a subpar performer, the Fund underperformed the equity benchmark. An overweight in Citigroup produced disappointing results, as lower interest rates and easing global capital market activity weighed on the company. In health care, the Fund performed generally in line with the equity benchmark. However it had more exposure to health care than the equity benchmark, which was a drag on relative performance. Good results from a substantial position in Johnson & Johnson, for example, with its attractive dividend yield, was offset by a substantial slide in Vertex Pharmaceuticals, which stumbled as market acceptance of its cystic fibrosis drug was slower than expected.
Fixed Income Outperformed its Benchmark
During a period in which investors were generally comfortable with risk, most non-Treasury sectors produced strong returns relative to similar duration U.S. Treasuries. As yields beyond two-year notes declined, the U.S. Treasury yield curve flattened during the reporting period. Two-year notes rose seven basis points to 0.81%, while 10-year notes fell 64 basis points to 1.58%. (A basis point is one hundredth of one percent.)
Strong investor demand for yield in a global environment of near-record low interest rates boosted bond prices across almost all sectors. Within structured securities, commercial mortgage-backed securities (CMBS) continued to be the portfolio's largest overweight relative to the fixed-income benchmark. We found both agency and non-agency AAA rated CMBS paper to be relatively attractive as commercial real estate fundamentals continued to improve. (Bond ratings are divided into categories ranging from AAA (highest) to D (lowest) and are subject to change.)
Corporate bonds also benefited from the quest for yield. All major subsectors within the investment-grade corporate market posted solid returns in excess of similar-duration Treasuries. While the Bloomberg Barclays Credit Index returned approximately three percentage points more than Treasuries, bonds within the media, wirelines and wireless sectors posted excess returns just short of six percentage points respectively. Although the portfolio had only a small position in high-yield bonds, it also contributed to outperformance.
Disappointments for the period were few. Within the portfolio's corporate bond holdings, exposure to the insurance and energy sectors detracted
Annual Report 2016
6
MANAGER DISCUSSION OF FUND PERFORMANCE (continued)
from performance as they underperformed other segments of the corporate bond market. The Fund's shorter duration relative to its benchmark nicked performance as longer rates fell during the period. Treasury future contracts were used to hedge the Fund's duration and yield curve management.
At Period End
Regardless of market conditions or the economic outlook, we focus on executing our core contrarian philosophy in constructing the Fund's equity portfolio and managing it from day to day. We continue to believe our disciplined approach will serve us well over a long-term time frame.
Within the Fund's fixed-income portfolio, we have targeted a duration that is shorter than that of the fixed-income benchmark. Because the Fed has indicated that its interest rate policy remains data dependent, we continue to watch commodity prices, inflation expectations, employment and global economic concerns. The portfolio remains underweight in U.S. government securities and overweight in structured and investment-grade corporate securities. Within the structured segment, we have emphasized asset-back securities and CMBS (including Ginnie Mae government-backed project loans), which we believe currently offer attractive yields (relative to Treasuries) in the investment-grade universe, especially seasoned, AAA, super-senior CMBS holdings and current pay Ginnie Mae project loan tranches. The fixed-income segment also remained overweight in corporate bonds, with more exposure than the fixed-income benchmark to the banking, communications and insurance sectors.
Investment Risks
Market risk may affect a single issuer, sector of the economy, industry or the market as a whole. There are risks associated with fixed-income investments, including credit risk, interest rate risk, and prepayment and extension risk. In general, bond prices rise when interest rates fall and vice versa. This effect is usually more pronounced for longer term securities. A rise in interest rates may result in a price decline of fixed-income instruments held by the Fund, negatively impacting its performance and NAV. Falling rates may result in the Fund investing in lower yielding debt instruments, lowering the Fund's income and yield. These risks may be heightened for longer maturity and duration securities. Foreign investments subject the Fund to risks, including political, economic, market, social and others within a particular country, as well as to currency instabilities and less stringent financial and accounting standards generally applicable to U.S. issuers. Investing in derivatives is a specialized activity that involves special risks that subject the Fund to significant loss potential, including when used as leverage, and may result in greater fluctuation in Fund value. See the Fund's prospectus for more information on these and other risks.
Annual Report 2016
7
UNDERSTANDING YOUR FUND'S EXPENSES
(Unaudited)
As an investor, you incur two types of costs. There are transaction costs, which generally include sales charges on purchases and may include redemption fees. There are also ongoing costs, which generally include management fees, distribution and/or service fees, and other fund expenses. The following information is intended to help you understand your ongoing costs (in dollars) of investing in the Fund and to help you compare these costs with the ongoing costs of investing in other mutual funds.
Analyzing Your Fund's Expenses
To illustrate these ongoing costs, we have provided examples and calculated the expenses paid by investors in each share class of the Fund during the period. The actual and hypothetical information in the table is based on an initial investment of $1,000 at the beginning of the period indicated and held for the entire period. Expense information is calculated two ways and each method provides you with different information. The amount listed in the "Actual" column is calculated using the Fund's actual operating expenses and total return for the period. You may use the Actual information, together with the amount invested, to estimate the expenses that you paid over the period. Simply divide your account value by $1,000 (for example, an $8,600 account value divided by $1,000 = 8.6), then multiply the results by the expenses paid during the period under the "Actual" column. The amount listed in the "Hypothetical" column assumes a 5% annual rate of return before expenses (which is not the Fund's actual return) and then applies the Fund's actual expense ratio for the period to the hypothetical return. You should not use the hypothetical account values and expenses to estimate either your actual account balance at the end of the period or the expenses you paid during the period. See "Compare With Other Funds" below for details on how to use the hypothetical data.
Compare With Other Funds
Since all mutual funds are required to include the same hypothetical calculations about expenses in shareholder reports, you can use this information to compare the ongoing cost of investing in the Fund with other funds. To do so, compare the hypothetical example with the 5% hypothetical examples that appear in the shareholder reports of other funds. As you compare hypothetical examples of other funds, it is important to note that hypothetical examples are meant to highlight the ongoing costs of investing in a fund only and do not reflect any transaction costs, such as sales charges, or redemption or exchange fees. Therefore, the hypothetical calculations are useful in comparing ongoing costs only, and will not help you determine the relative total costs of owning different funds. If transaction costs were included in these calculations, your costs would be higher.
March 1, 2016 – August 31, 2016
| | | Account Value at the Beginning
of the Period ($) | | Account Value at the End of the
Period ($) | | Expenses Paid During the
Period ($) | | Fund's Annualized
Expense Ratio (%) | |
| | | Actual | | Hypothetical | | Actual | | Hypothetical | | Actual | | Hypothetical | | Actual | |
Class A | | | 1,000.00 | | | | 1,000.00 | | | | 1,092.60 | | | | 1,020.01 | | | | 5.37 | | | | 5.18 | | | | 1.02 | | |
Class B | | | 1,000.00 | | | | 1,000.00 | | | | 1,088.30 | | | | 1,016.24 | | | | 9.29 | | | | 8.97 | | | | 1.77 | | |
Class C | | | 1,000.00 | | | | 1,000.00 | | | | 1,088.60 | | | | 1,016.24 | | | | 9.29 | | | | 8.97 | | | | 1.77 | | |
Class K | | | 1,000.00 | | | | 1,000.00 | | | | 1,092.90 | | | | 1,020.51 | | | | 4.84 | | | | 4.67 | | | | 0.92 | | |
Class R | | | 1,000.00 | | | | 1,000.00 | | | | 1,091.20 | | | | 1,018.75 | | | | 6.68 | | | | 6.44 | | | | 1.27 | | |
Class R4 | | | 1,000.00 | | | | 1,000.00 | | | | 1,093.80 | | | | 1,021.27 | | | | 4.05 | | | | 3.91 | | | | 0.77 | | |
Class R5 | | | 1,000.00 | | | | 1,000.00 | | | | 1,094.20 | | | | 1,021.77 | | | | 3.53 | | | | 3.40 | | | | 0.67 | | |
Class Y | | | 1,000.00 | | | | 1,000.00 | | | | 1,094.60 | | | | 1,022.02 | | | | 3.26 | | | | 3.15 | | | | 0.62 | | |
Class Z | | | 1,000.00 | | | | 1,000.00 | | | | 1,093.80 | | | | 1,021.27 | | | | 4.05 | | | | 3.91 | | | | 0.77 | | |
Expenses paid during the period are equal to the annualized expense ratio for each class as indicated above, multiplied by the average account value over the period and then multiplied by the number of days in the Fund's most recent fiscal half year and divided by 366.
Expenses do not include fees and expenses incurred indirectly by the Fund from its investment in underlying funds, including affiliated and non-affiliated pooled investment vehicles, such as mutual funds and exchange-traded funds.
Annual Report 2016
8
PORTFOLIO OF INVESTMENTS
August 31, 2016
(Percentages represent value of investments compared to net assets)
Common Stocks 60.4%
Issuer | | Shares | | Value ($) | |
CONSUMER DISCRETIONARY 8.3% | |
Auto Components 1.2% | |
Delphi Automotive PLC | | | 615,910 | | | | 43,520,201 | | |
Johnson Controls, Inc. | | | 487,648 | | | | 21,397,994 | | |
Total | | | | | 64,918,195 | | |
Hotels, Restaurants & Leisure 1.1% | |
Aramark | | | 521,125 | | | | 19,766,271 | | |
Marriott International, Inc., Class A | | | 244,365 | | | | 17,430,555 | | |
McDonald's Corp. | | | 215,245 | | | | 24,895,237 | | |
Total | | | | | 62,092,063 | | |
Household Durables 0.5% | |
Newell Brands, Inc. | | | 493,365 | | | | 26,187,814 | | |
Internet & Catalog Retail 0.5% | |
Expedia, Inc. | | | 260,705 | | | | 28,448,130 | | |
Media 2.1% | |
Comcast Corp., Class A | | | 1,266,846 | | | | 82,674,370 | | |
Walt Disney Co. (The) | | | 376,715 | | | | 35,584,499 | | |
Total | | | | | 118,258,869 | | |
Specialty Retail 1.7% | |
Advance Auto Parts, Inc. | | | 85,990 | | | | 13,533,106 | | |
Lowe's Companies, Inc. | | | 889,597 | | | | 68,107,547 | | |
Michaels Companies, Inc. (The)(a) | | | 687,242 | | | | 16,466,318 | | |
Total | | | | | 98,106,971 | | |
Textiles, Apparel & Luxury Goods 1.2% | |
Coach, Inc. | | | 892,240 | | | | 34,065,723 | | |
PVH Corp. | | | 309,801 | | | | 33,384,156 | | |
Total | | | | | 67,449,879 | | |
Total Consumer Discretionary | | | | | 465,461,921 | | |
CONSUMER STAPLES 4.5% | |
Beverages 1.6% | |
Diageo PLC, ADR | | | 180,664 | | | | 20,321,087 | | |
PepsiCo, Inc. | | | 663,478 | | | | 70,826,276 | | |
Total | | | | | 91,147,363 | | |
Food & Staples Retailing 2.1% | |
CVS Health Corp. | | | 570,055 | | | | 53,243,137 | | |
Kroger Co. (The) | | | 755,100 | | | | 24,155,649 | | |
Walgreens Boots Alliance, Inc. | | | 512,254 | | | | 41,344,020 | | |
Total | | | | | 118,742,806 | | |
Common Stocks (continued)
Issuer | | Shares | | Value ($) | |
Tobacco 0.8% | |
Philip Morris International, Inc. | | | 436,480 | | | | 43,617,447 | | |
Total Consumer Staples | | | | | 253,507,616 | | |
ENERGY 4.5% | |
Energy Equipment & Services 0.6% | |
Schlumberger Ltd. | | | 410,760 | | | | 32,450,040 | | |
Oil, Gas & Consumable Fuels 3.9% | |
Canadian Natural Resources Ltd. | | | 1,446,930 | | | | 44,927,176 | | |
Chevron Corp. | | | 477,576 | | | | 48,034,594 | | |
ConocoPhillips | | | 711,539 | | | | 29,208,676 | | |
EQT Corp. | | | 221,225 | | | | 15,817,588 | | |
Exxon Mobil Corp. | | | 709,760 | | | | 61,848,486 | | |
Noble Energy, Inc. | | | 645,058 | | | | 22,241,600 | | |
Total | | | | | 222,078,120 | | |
Total Energy | | | | | 254,528,160 | | |
FINANCIALS 12.3% | |
Banks 4.6% | |
Citigroup, Inc. | | | 2,064,392 | | | | 98,554,074 | | |
JPMorgan Chase & Co. | | | 1,347,308 | | | | 90,943,290 | | |
Wells Fargo & Co. | | | 1,302,301 | | | | 66,156,891 | | |
Total | | | | | 255,654,255 | | |
Capital Markets 3.4% | |
Bank of New York Mellon Corp. (The) | | | 1,262,036 | | | | 52,589,040 | | |
BlackRock, Inc. | | | 149,711 | | | | 55,813,758 | | |
Invesco Ltd. | | | 251,795 | | | | 7,853,486 | | |
Morgan Stanley | | | 2,365,890 | | | | 75,850,434 | | |
Total | | | | | 192,106,718 | | |
Diversified Financial Services 2.7% | |
Berkshire Hathaway, Inc., Class B(a) | | | 739,785 | | | | 111,330,244 | | |
S&P Global, Inc. | | | 320,555 | | | | 39,601,365 | | |
Total | | | | | 150,931,609 | | |
Insurance 0.5% | |
Aon PLC | | | 260,837 | | | | 29,044,200 | | |
Real Estate Investment Trusts (REITs) 0.8% | |
American Tower Corp. | | | 412,680 | | | | 46,789,658 | | |
Real Estate Management & Development 0.3% | |
CBRE Group, Inc., Class A(a) | | | 472,408 | | | | 14,120,275 | | |
Total Financials | | | | | 688,646,715 | | |
The accompanying Notes to Financial Statements are an integral part of this statement.
Annual Report 2016
9
PORTFOLIO OF INVESTMENTS (continued)
August 31, 2016
Common Stocks (continued)
Issuer | | Shares | | Value ($) | |
HEALTH CARE 10.1% | |
Biotechnology 1.9% | |
Alexion Pharmaceuticals, Inc.(a) | | | 145,595 | | | | 18,324,587 | | |
Biogen, Inc.(a) | | | 135,080 | | | | 41,284,500 | | |
Celgene Corp.(a) | | | 297,142 | | | | 31,716,937 | | |
Vertex Pharmaceuticals, Inc.(a) | | | 139,010 | | | | 13,137,835 | | |
Total | | | | | 104,463,859 | | |
Health Care Equipment & Supplies 3.5% | |
Abbott Laboratories | | | 886,935 | | | | 37,269,009 | | |
Cooper Companies, Inc. (The) | | | 210,914 | | | | 39,213,131 | | |
Medtronic PLC | | | 853,219 | | | | 74,255,649 | | |
Zimmer Biomet Holdings, Inc. | | | 367,670 | | | | 47,653,709 | | |
Total | | | | | 198,391,498 | | |
Health Care Providers & Services 1.4% | |
Anthem, Inc. | | | 259,095 | | | | 32,407,603 | | |
Cardinal Health, Inc. | | | 351,906 | | | | 28,036,351 | | |
CIGNA Corp. | | | 122,704 | | | | 15,738,015 | | |
Total | | | | | 76,181,969 | | |
Pharmaceuticals 3.3% | |
Allergan PLC(a) | | | 80,275 | | | | 18,827,698 | | |
Johnson & Johnson | | | 715,520 | | | | 85,390,157 | | |
Pfizer, Inc. | | | 2,369,300 | | | | 82,451,640 | | |
Total | | | | | 186,669,495 | | |
Total Health Care | | | | | 565,706,821 | | |
INDUSTRIALS 4.8% | |
Aerospace & Defense 1.1% | |
Honeywell International, Inc. | | | 561,823 | | | | 65,570,362 | | |
Air Freight & Logistics 1.2% | |
FedEx Corp. | | | 398,477 | | | | 65,720,812 | | |
Electrical Equipment 0.4% | |
Eaton Corp. PLC | | | 362,663 | | | | 24,131,596 | | |
Industrial Conglomerates 0.5% | |
General Electric Co. | | | 900,615 | | | | 28,135,213 | | |
Professional Services 1.6% | |
Dun & Bradstreet Corp. (The) | | | 158,448 | | | | 21,810,367 | | |
Nielsen Holdings PLC | | | 1,270,985 | | | | 67,718,081 | | |
Total | | | | | 89,528,448 | | |
Total Industrials | | | | | 273,086,431 | | |
Common Stocks (continued)
Issuer | | Shares | | Value ($) | |
INFORMATION TECHNOLOGY 12.9% | |
Communications Equipment 0.2% | |
Palo Alto Networks, Inc.(a) | | | 106,995 | | | | 14,248,524 | | |
Internet Software & Services 4.4% | |
Akamai Technologies, Inc.(a) | | | 166,260 | | | | 9,127,674 | | |
Alphabet, Inc., Class A(a) | | | 57,359 | | | | 45,305,006 | | |
Alphabet, Inc., Class C(a) | | | 132,903 | | | | 101,943,246 | | |
Facebook, Inc., Class A(a) | | | 712,790 | | | | 89,897,075 | | |
Total | | | | | 246,273,001 | | |
IT Services 1.3% | |
Fidelity National Information Services, Inc. | | | 347,530 | | | | 27,569,555 | | |
MasterCard, Inc., Class A | | | 467,959 | | | | 45,218,878 | | |
Total | | | | | 72,788,433 | | |
Semiconductors & Semiconductor Equipment 1.5% | |
Broadcom Ltd. | | | 247,620 | | | | 43,685,120 | | |
QUALCOMM, Inc. | | | 396,805 | | | | 25,026,491 | | |
Skyworks Solutions, Inc. | | | 213,338 | | | | 15,970,483 | | |
Total | | | | | 84,682,094 | | |
Software 3.4% | |
Activision Blizzard, Inc. | | | 1,206,465 | | | | 49,911,457 | | |
Electronic Arts, Inc.(a) | | | 441,152 | | | | 35,834,777 | | |
Intuit, Inc. | | | 77,565 | | | | 8,644,620 | | |
Microsoft Corp. | | | 1,644,794 | | | | 94,509,863 | | |
Total | | | | | 188,900,717 | | |
Technology Hardware, Storage & Peripherals 2.1% | |
Apple, Inc. | | | 1,131,865 | | | | 120,090,877 | | |
Total Information Technology | | | | | 726,983,646 | | |
MATERIALS 0.4% | |
Chemicals 0.4% | |
Monsanto Co. | | | 194,885 | | | | 20,755,252 | | |
Total Materials | | | | | 20,755,252 | | |
TELECOMMUNICATION SERVICES 1.9% | |
Diversified Telecommunication Services 1.9% | |
Verizon Communications, Inc. | | | 2,028,634 | | | | 106,158,417 | | |
Total Telecommunication Services | | | | | 106,158,417 | | |
UTILITIES 0.7% | |
Electric Utilities 0.5% | |
Edison International | | | 387,466 | | | | 28,176,528 | | |
The accompanying Notes to Financial Statements are an integral part of this statement.
Annual Report 2016
10
PORTFOLIO OF INVESTMENTS (continued)
August 31, 2016
Common Stocks (continued)
Issuer | | Shares | | Value ($) | |
Multi-Utilities 0.2% | |
DTE Energy Co. | | | 111,520 | | | | 10,360,208 | | |
Total Utilities | | | | | 38,536,736 | | |
Total Common Stocks
(Cost: $2,814,215,695) | | | | | 3,393,371,715 | | |
Corporate Bonds & Notes 11.9%
Issuer | | Coupon
Rate | | Principal
Amount ($) | | Value ($) | |
AEROSPACE & DEFENSE 0.3% | |
BAE Systems Holdings, Inc.(b)
10/07/24 | | | 3.800 | % | | | 3,783,000 | | | | 4,001,771 | | |
Huntington Ingalls Industries, Inc.(b)
11/15/25 | | | 5.000 | % | | | 18,000 | | | | 19,327 | | |
L-3 Communications Corp.
02/15/21 | | | 4.950 | % | | | 5,490,000 | | | | 6,061,504 | | |
Lockheed Martin Corp.
09/15/21 | | | 3.350 | % | | | 6,000,000 | | | | 6,417,252 | | |
TransDigm, Inc.
10/15/20 | | | 5.500 | % | | | 4,000 | | | | 4,105 | | |
07/15/21 | | | 7.500 | % | | | 35,000 | | | | 37,122 | | |
07/15/24 | | | 6.500 | % | | | 310,000 | | | | 321,625 | | |
05/15/25 | | | 6.500 | % | | | 94,000 | | | | 97,290 | | |
TransDigm, Inc.(b)
06/15/26 | | | 6.375 | % | | | 155,000 | | | | 158,100 | | |
Total | | | | | | | 17,118,096 | | |
AUTOMOTIVE 0.1% | |
American Axle & Manufacturing, Inc.
02/15/19 | | | 5.125 | % | | | 28,000 | | | | 28,504 | | |
03/15/21 | | | 6.250 | % | | | 75,000 | | | | 78,375 | | |
Ford Motor Credit Co. LLC
08/04/25 | | | 4.134 | % | | | 6,000,000 | | | | 6,369,906 | | |
Gates Global LLC/Co.(b)
07/15/22 | | | 6.000 | % | | | 85,000 | | | | 80,750 | | |
Schaeffler Finance BV(b)
05/15/21 | | | 4.250 | % | | | 196,000 | | | | 200,900 | | |
05/15/23 | | | 4.750 | % | | | 371,000 | | | | 386,304 | | |
Schaeffler Holding Finance BV
PIK(b)
11/15/19 | | | 6.250 | % | | | 65,000 | | | | 67,437 | | |
ZF North America Capital, Inc.(b)
04/29/25 | | | 4.750 | % | | | 160,000 | | | | 169,800 | | |
Total | | | | | | | 7,381,976 | | |
Corporate Bonds & Notes (continued)
Issuer | | Coupon
Rate | | Principal
Amount ($) | | Value ($) | |
BANKING 2.3% | |
Ally Financial, Inc.
02/15/17 | | | 5.500 | % | | | 54,000 | | | | 54,940 | | |
01/27/19 | | | 3.500 | % | | | 31,000 | | | | 31,388 | | |
02/13/22 | | | 4.125 | % | | | 186,000 | | | | 191,115 | | |
05/19/22 | | | 4.625 | % | | | 153,000 | | | | 160,650 | | |
09/30/24 | | | 5.125 | % | | | 190,000 | | | | 205,794 | | |
03/30/25 | | | 4.625 | % | | | 751,000 | | | | 779,162 | | |
Subordinated
11/20/25 | | | 5.750 | % | | | 164,000 | | | | 174,455 | | |
BB&T Corp.(c)
05/01/19 | | | 1.287 | % | | | 6,625,000 | | | | 6,639,409 | | |
Bank of America Corp.
01/05/21 | | | 5.875 | % | | | 10,000,000 | | | | 11,528,620 | | |
Bank of New York Mellon Corp. (The)
04/15/21 | | | 2.500 | % | | | 5,000,000 | | | | 5,149,885 | | |
Barclays Bank PLC
05/15/24 | | | 3.750 | % | | | 4,500,000 | | | | 4,752,346 | | |
Capital One Financial Corp.
07/15/21 | | | 4.750 | % | | | 4,500,000 | | | | 5,027,728 | | |
Citigroup, Inc.
01/14/22 | | | 4.500 | % | | | 6,775,000 | | | | 7,474,871 | | |
Credit Suisse AG
09/09/24 | | | 3.625 | % | | | 4,500,000 | | | | 4,724,716 | | |
Discover Financial Services
11/21/22 | | | 3.850 | % | | | 3,300,000 | | | | 3,414,012 | | |
Fifth Third Bancorp
03/15/22 | | | 3.500 | % | | | 2,995,000 | | | | 3,162,088 | | |
Goldman Sachs Group, Inc. (The)
07/08/24 | | | 3.850 | % | | | 9,375,000 | | | | 9,955,950 | | |
HSBC Holdings PLC
05/25/26 | | | 3.900 | % | | | 6,000,000 | | | | 6,264,972 | | |
Huntington National Bank (The)
06/30/18 | | | 2.000 | % | | | 4,640,000 | | | | 4,672,030 | | |
ING Bank NV(b)(c)
03/22/19 | | | 1.777 | % | | | 6,300,000 | | | | 6,394,790 | | |
JPMorgan Chase & Co.
08/15/21 | | | 4.350 | % | | | 7,053,000 | | | | 7,776,236 | | |
Morgan Stanley
07/27/26 | | | 3.125 | % | | | 9,000,000 | | | | 9,105,192 | | |
PNC Bank NA
Subordinated
01/30/23 | | | 2.950 | % | | | 4,300,000 | | | | 4,459,788 | | |
Regions Financial Corp.
02/08/21 | | | 3.200 | % | | | 5,695,000 | | | | 5,908,335 | | |
State Street Corp.
11/20/23 | | | 3.700 | % | | | 4,510,000 | | | | 4,979,180 | | |
The accompanying Notes to Financial Statements are an integral part of this statement.
Annual Report 2016
11
PORTFOLIO OF INVESTMENTS (continued)
August 31, 2016
Corporate Bonds & Notes (continued)
Issuer | | Coupon
Rate | | Principal
Amount ($) | | Value ($) | |
Synovus Financial Corp.
02/15/19 | | | 7.875 | % | | | 113,000 | | | | 126,701 | | |
Subordinated
06/15/17 | | | 5.125 | % | | | 17,000 | | | | 17,255 | | |
Toronto-Dominion Bank (The)
01/22/19 | | | 1.950 | % | | | 5,500,000 | | | | 5,568,123 | | |
U.S. Bancorp
Subordinated
04/27/26 | | | 3.100 | % | | | 5,400,000 | | | | 5,588,617 | | |
Wells Fargo & Co.
Subordinated
02/13/23 | | | 3.450 | % | | | 5,375,000 | | | | 5,637,875 | | |
Total | | | | | | | 129,926,223 | | |
BROKERAGE/ASSET MANAGERS/EXCHANGES —% | |
E*TRADE Financial Corp.
11/15/22 | | | 5.375 | % | | | 169,000 | | | | 181,464 | | |
09/15/23 | | | 4.625 | % | | | 447,000 | | | | 463,923 | | |
National Financial Partners Corp.(b)
07/15/21 | | | 9.000 | % | | | 121,000 | | | | 124,933 | | |
Total | | | | | | | 770,320 | | |
BUILDING MATERIALS —% | |
Allegion PLC
09/15/23 | | | 5.875 | % | | | 137,000 | | | | 147,960 | | |
Allegion US Holding Co., Inc.
10/01/21 | | | 5.750 | % | | | 76,000 | | | | 79,610 | | |
American Builders & Contractors Supply Co., Inc.(b)
04/15/21 | | | 5.625 | % | | | 361,000 | | | | 373,635 | | |
12/15/23 | | | 5.750 | % | | | 53,000 | | | | 55,915 | | |
Beacon Roofing Supply, Inc.
10/01/23 | | | 6.375 | % | | | 344,000 | | | | 369,800 | | |
Eagle Materials, Inc.
08/01/26 | | | 4.500 | % | | | 42,000 | | | | 42,740 | | |
Gibraltar Industries, Inc.
02/01/21 | | | 6.250 | % | | | 19,000 | | | | 19,665 | | |
HD Supply, Inc.
07/15/20 | | | 7.500 | % | | | 311,000 | | | | 323,829 | | |
HD Supply, Inc.(b)
12/15/21 | | | 5.250 | % | | | 91,000 | | | | 96,971 | | |
04/15/24 | | | 5.750 | % | | | 156,000 | | | | 166,140 | | |
Nortek, Inc.
04/15/21 | | | 8.500 | % | | | 355,000 | | | | 371,862 | | |
Standard Industries, Inc.(b)
02/15/23 | | | 5.500 | % | | | 140,000 | | | | 148,575 | | |
US Concrete, Inc.
06/01/24 | | | 6.375 | % | | | 77,000 | | | | 80,273 | | |
Total | | | | | | | 2,276,975 | | |
Corporate Bonds & Notes (continued)
Issuer | | Coupon
Rate | | Principal
Amount ($) | | Value ($) | |
CABLE AND SATELLITE 0.2% | |
Altice US Finance I Corp.(b)
07/15/23 | | | 5.375 | % | | | 251,000 | | | | 262,609 | | |
05/15/26 | | | 5.500 | % | | | 318,000 | | | | 335,490 | | |
CCO Holdings LLC/Capital Corp.
09/30/22 | | | 5.250 | % | | | 98,000 | | | | 102,900 | | |
CCO Holdings LLC/Capital Corp.(b)
05/01/23 | | | 5.125 | % | | | 4,000 | | | | 4,209 | | |
04/01/24 | | | 5.875 | % | | | 775,000 | | | | 835,062 | | |
05/01/25 | | | 5.375 | % | | | 97,000 | | | | 102,214 | | |
02/15/26 | | | 5.750 | % | | | 173,000 | | | | 185,110 | | |
05/01/26 | | | 5.500 | % | | | 8,000 | | | | 8,470 | | |
05/01/27 | | | 5.875 | % | | | 70,000 | | | | 74,900 | | |
CSC Holdings LLC
02/15/18 | | | 7.875 | % | | | 22,000 | | | | 23,760 | | |
02/15/19 | | | 8.625 | % | | | 32,000 | | | | 35,840 | | |
11/15/21 | | | 6.750 | % | | | 85,000 | | | | 91,056 | | |
06/01/24 | | | 5.250 | % | | | 251,000 | | | | 244,253 | | |
CSC Holdings LLC(b)
10/15/25 | | | 6.625 | % | | | 208,000 | | | | 225,940 | | |
10/15/25 | | | 10.875 | % | | | 467,000 | | | | 546,390 | | |
Cequel Communications Holdings I LLC/Capital Corp.(b)
09/15/20 | | | 6.375 | % | | | 98,000 | | | | 101,308 | | |
12/15/21 | | | 5.125 | % | | | 48,000 | | | | 48,420 | | |
12/15/21 | | | 5.125 | % | | | 205,000 | | | | 207,306 | | |
07/15/25 | | | 7.750 | % | | | 195,000 | | | | 213,037 | | |
DISH DBS Corp.
07/15/22 | | | 5.875 | % | | | 95,000 | | | | 96,900 | | |
03/15/23 | | | 5.000 | % | | | 155,000 | | | | 149,203 | | |
11/15/24 | | | 5.875 | % | | | 444,000 | | | | 437,895 | | |
DISH DBS Corp.(b)
07/01/26 | | | 7.750 | % | | | 211,000 | | | | 225,135 | | |
Hughes Satelite Systems Corp.(b)
08/01/26 | | | 5.250 | % | | | 171,000 | | | | 169,630 | | |
08/01/26 | | | 6.625 | % | | | 100,000 | | | | 99,250 | | |
NBCUniversal Media LLC
04/01/41 | | | 5.950 | % | | | 3,600,000 | | | | 4,922,608 | | |
Quebecor Media, Inc.
01/15/23 | | | 5.750 | % | | | 287,000 | | | | 301,709 | | |
Sirius XM Radio, Inc.(b)
04/15/25 | | | 5.375 | % | | | 184,000 | | | | 191,820 | | |
UPCB Finance IV Ltd.(b)
01/15/25 | | | 5.375 | % | | | 136,000 | | | | 139,740 | | |
Unitymedia GmbH(b)
01/15/25 | | | 6.125 | % | | | 112,000 | | | | 120,120 | | |
Unitymedia Hessen GmbH & Co. KG NRW(b)
01/15/25 | | | 5.000 | % | | | 512,000 | | | | 533,760 | | |
Videotron Ltd.
07/15/22 | | | 5.000 | % | | | 355,000 | | | | 372,306 | | |
The accompanying Notes to Financial Statements are an integral part of this statement.
Annual Report 2016
12
PORTFOLIO OF INVESTMENTS (continued)
August 31, 2016
Corporate Bonds & Notes (continued)
Issuer | | Coupon
Rate | | Principal
Amount ($) | | Value ($) | |
Videotron Ltd.(b)
06/15/24 | | | 5.375 | % | | | 21,000 | | | | 22,076 | | |
Virgin Media Finance PLC(b)
10/15/24 | | | 6.000 | % | | | 56,000 | | | | 58,380 | | |
01/15/25 | | | 5.750 | % | | | 624,000 | | | | 634,920 | | |
Virgin Media Secured Finance PLC(b)
01/15/26 | | | 5.250 | % | | | 60,000 | | | | 61,350 | | |
Total | | | | | | | 12,185,076 | | |
CHEMICALS 0.3% | |
Angus Chemical Co.(b)
02/15/23 | | | 8.750 | % | | | 109,000 | | | | 111,180 | | |
Axalta Coating Systems LLC(b)
08/15/24 | | | 4.875 | % | | | 190,000 | | | | 198,075 | | |
Celanese U.S. Holdings LLC
06/15/21 | | | 5.875 | % | | | 412,000 | | | | 469,935 | | |
11/15/22 | | | 4.625 | % | | | 3,467,000 | | | | 3,779,030 | | |
Chemours Co. (The)
05/15/23 | | | 6.625 | % | | | 160,000 | | | | 153,600 | | |
05/15/25 | | | 7.000 | % | | | 413,000 | | | | 395,189 | | |
Dow Chemical Co. (The)
11/01/29 | | | 7.375 | % | | | 1,103,000 | | | | 1,502,359 | | |
Eastman Chemical Co.
01/15/20 | | | 2.700 | % | | | 5,000,000 | | | | 5,145,580 | | |
Eco Services Operations LLC/Finance Corp.(b)
11/01/22 | | | 8.500 | % | | | 161,000 | | | | 166,635 | | |
Huntsman International LLC
11/15/20 | | | 4.875 | % | | | 29,000 | | | | 30,088 | | |
11/15/22 | | | 5.125 | % | | | 80,000 | | | | 82,600 | | |
INEOS Group Holdings SA(b)
02/15/19 | | | 5.875 | % | | | 94,000 | | | | 96,350 | | |
08/01/24 | | | 5.625 | % | | | 138,000 | | | | 137,655 | | |
LYB International Finance BV
07/15/23 | | | 4.000 | % | | | 5,000,000 | | | | 5,446,620 | | |
PQ Corp.(b)
11/15/22 | | | 6.750 | % | | | 188,000 | | | | 199,515 | | |
Platform Specialty Products Corp.(b)
05/01/21 | | | 10.375 | % | | | 219,000 | | | | 229,950 | | |
02/01/22 | | | 6.500 | % | | | 56,000 | | | | 53,060 | | |
WR Grace & Co.(b)
10/01/21 | | | 5.125 | % | | | 173,000 | | | | 184,245 | | |
10/01/24 | | | 5.625 | % | | | 28,000 | | | | 30,240 | | |
Total | | | | | | | 18,411,906 | | |
CONSTRUCTION MACHINERY 0.2% | |
Caterpillar Financial Services Corp.
06/01/22 | | | 2.850 | % | | | 3,250,000 | | | | 3,399,441 | | |
Corporate Bonds & Notes (continued)
Issuer | | Coupon
Rate | | Principal
Amount ($) | | Value ($) | |
John Deere Capital Corp.
06/10/26 | | | 2.650 | % | | | 5,000,000 | | | | 5,143,590 | | |
United Rentals North America, Inc.
09/15/26 | | | 5.875 | % | | | 242,000 | | | | 251,680 | | |
Total | | | | | | | 8,794,711 | | |
CONSUMER CYCLICAL SERVICES —% | |
APX Group, Inc.
12/01/19 | | | 6.375 | % | | | 106,000 | | | | 108,781 | | |
12/01/20 | | | 8.750 | % | | | 61,000 | | | | 58,636 | | |
12/01/22 | | | 7.875 | % | | | 317,000 | | | | 332,850 | | |
APX Group, Inc.(b)
12/01/22 | | | 7.875 | % | | | 60,000 | | | | 63,000 | | |
IHS Markit Ltd.(b)
11/01/22 | | | 5.000 | % | | | 353,000 | | | | 375,063 | | |
Interval Acquisition Corp.
04/15/23 | | | 5.625 | % | | | 367,000 | | | | 379,845 | | |
Total | | | | | | | 1,318,175 | | |
CONSUMER PRODUCTS 0.1% | |
Prestige Brands, Inc.(b)
03/01/24 | | | 6.375 | % | | | 356,000 | | | | 380,030 | | |
Procter & Gamble Co. (The)
02/02/26 | | | 2.700 | % | | | 5,500,000 | | | | 5,803,160 | | |
Scotts Miracle-Gro Co. (The)(b)
10/15/23 | | | 6.000 | % | | | 345,000 | | | | 368,719 | | |
Serta Simmons Bedding LLC(b)
10/01/20 | | | 8.125 | % | | | 282,000 | | | | 293,985 | | |
Spectrum Brands, Inc.
11/15/22 | | | 6.625 | % | | | 343,000 | | | | 367,010 | | |
12/15/24 | | | 6.125 | % | | | 174,000 | | | | 187,702 | | |
07/15/25 | | | 5.750 | % | | | 211,000 | | | | 228,671 | | |
Springs Industries, Inc.
06/01/21 | | | 6.250 | % | | | 194,000 | | | | 199,820 | | |
Tempur Sealy International, Inc.
10/15/23 | | | 5.625 | % | | | 181,000 | | | | 189,824 | | |
Tempur Sealy International, Inc.(b)
06/15/26 | | | 5.500 | % | | | 130,000 | | | | 135,785 | | |
Valvoline, Inc.(b)
07/15/24 | | | 5.500 | % | | | 27,000 | | | | 28,337 | | |
Total | | | | | | | 8,183,043 | | |
DIVERSIFIED MANUFACTURING 0.1% | |
Entegris, Inc.(b)
04/01/22 | | | 6.000 | % | | | 180,000 | | | | 187,200 | | |
Manitowoc Foodservice, Inc.(b)
02/15/24 | | | 9.500 | % | | | 30,000 | | | | 33,900 | | |
The accompanying Notes to Financial Statements are an integral part of this statement.
Annual Report 2016
13
PORTFOLIO OF INVESTMENTS (continued)
August 31, 2016
Corporate Bonds & Notes (continued)
Issuer | | Coupon
Rate | | Principal
Amount ($) | | Value ($) | |
SPX FLOW, Inc.(b)
08/15/24 | | | 5.625 | % | | | 48,000 | | | | 49,320 | | |
08/15/26 | | | 5.875 | % | | | 178,000 | | | | 183,785 | | |
United Technologies Corp.
06/01/22 | | | 3.100 | % | | | 4,600,000 | | | | 4,943,887 | | |
WESCO Distribution, Inc.(b)
06/15/24 | | | 5.375 | % | | | 71,000 | | | | 72,597 | | |
Zekelman Industries, Inc.(b)
06/15/23 | | | 9.875 | % | | | 38,000 | | | | 40,660 | | |
Total | | | | | | | 5,511,349 | | |
ELECTRIC 1.3% | |
AES Corp. (The)
07/01/21 | | | 7.375 | % | | | 169,000 | | | | 193,927 | | |
05/15/26 | | | 6.000 | % | | | 157,000 | | | | 166,616 | | |
Arizona Public Service Co.
04/01/42 | | | 4.500 | % | | | 1,925,000 | | | | 2,283,893 | | |
Berkshire Hathaway Energy Co.
02/01/25 | | | 3.500 | % | | | 1,950,000 | | | | 2,101,027 | | |
CMS Energy Corp.
03/01/24 | | | 3.875 | % | | | 5,076,000 | | | | 5,568,677 | | |
Calpine Corp.
01/15/23 | | | 5.375 | % | | | 140,000 | | | | 140,087 | | |
Calpine Corp.(b)
01/15/22 | | | 6.000 | % | | | 75,000 | | | | 78,563 | | |
01/15/24 | | | 5.875 | % | | | 105,000 | | | | 111,038 | | |
Consolidated Edison Co. of New York, Inc.
12/01/45 | | | 4.500 | % | | | 2,500,000 | | | | 2,935,512 | | |
DTE Energy Co.
04/15/33 | | | 6.375 | % | | | 1,840,000 | | | | 2,427,573 | | |
Dominion Resources, Inc.
10/01/25 | | | 3.900 | % | | | 4,000,000 | | | | 4,343,592 | | |
Emera US Finance LP(b)
06/15/26 | | | 3.550 | % | | | 6,400,000 | | | | 6,741,402 | | |
Indiana Michigan Power Co.
03/15/37 | | | 6.050 | % | | | 3,100,000 | | | | 3,943,420 | | |
NRG Energy, Inc.
07/15/22 | | | 6.250 | % | | | 178,000 | | | | 181,782 | | |
05/01/24 | | | 6.250 | % | | | 45,000 | | | | 44,663 | | |
NRG Energy, Inc.(b)
05/15/26 | | | 7.250 | % | | | 127,000 | | | | 131,889 | | |
01/15/27 | | | 6.625 | % | | | 229,000 | | | | 229,428 | | |
NRG Yield Operating LLC
08/15/24 | | | 5.375 | % | | | 450,000 | | | | 469,125 | | |
Nevada Power Co.
08/01/18 | | | 6.500 | % | | | 900,000 | | | | 985,881 | | |
NextEra Energy Capital Holdings, Inc.
06/15/23 | | | 3.625 | % | | | 3,700,000 | | | | 3,918,152 | | |
Corporate Bonds & Notes (continued)
Issuer | | Coupon
Rate | | Principal
Amount ($) | | Value ($) | |
PPL Capital Funding, Inc.
06/01/23 | | | 3.400 | % | | | 5,645,000 | | | | 5,959,669 | | |
PacifiCorp
07/01/25 | | | 3.350 | % | | | 1,821,000 | | | | 1,972,416 | | |
Pacific Gas & Electric Co.
03/01/37 | | | 5.800 | % | | | 3,421,000 | | | | 4,546,776 | | |
Progress Energy, Inc.
03/01/31 | | | 7.750 | % | | | 2,983,000 | | | | 4,220,841 | | |
Public Service Co. of Colorado
05/15/25 | | | 2.900 | % | | | 3,050,000 | | | | 3,210,247 | | |
Southern California Edison Co.
09/01/40 | | | 4.500 | % | | | 1,775,000 | | | | 2,102,150 | | |
Southern Co. (The)
07/01/23 | | | 2.950 | % | | | 6,450,000 | | | | 6,664,095 | | |
TransAlta Corp.
06/03/17 | | | 1.900 | % | | | 4,000,000 | | | | 4,002,476 | | |
WEC Energy Group, Inc.
06/15/25 | | | 3.550 | % | | | 3,300,000 | | | | 3,559,472 | | |
Total | | | | | | | 73,234,389 | | |
FINANCE COMPANIES 0.2% | |
AerCap Ireland Capital Ltd./Global Aviation Trust
02/01/22 | | | 3.950 | % | | | 120,000 | | | | 124,500 | | |
Aircastle Ltd.
03/15/21 | | | 5.125 | % | | | 27,000 | | | | 29,295 | | |
02/15/22 | | | 5.500 | % | | | 129,000 | | | | 140,126 | | |
04/01/23 | | | 5.000 | % | | | 44,000 | | | | 46,640 | | |
CIT Group, Inc.
08/15/17 | | | 4.250 | % | | | 48,000 | | | | 48,900 | | |
05/15/20 | | | 5.375 | % | | | 428,000 | | | | 457,425 | | |
CIT Group, Inc.(b)
04/01/18 | | | 6.625 | % | | | 99,000 | | | | 105,435 | | |
02/15/19 | | | 5.500 | % | | | 120,000 | | | | 127,050 | | |
GE Capital International Funding Co. Unlimited Co.
11/15/25 | | | 3.373 | % | | | 7,500,000 | | | | 8,196,817 | | |
International Lease Finance Corp.
04/15/21 | | | 4.625 | % | | | 5,000 | | | | 5,303 | | |
Navient Corp.
03/25/20 | | | 8.000 | % | | | 24,000 | | | | 26,040 | | |
10/26/20 | | | 5.000 | % | | | 242,000 | | | | 243,210 | | |
07/26/21 | | | 6.625 | % | | | 100,000 | | | | 103,125 | | |
01/25/22 | | | 7.250 | % | | | 28,000 | | | | 29,085 | | |
01/25/23 | | | 5.500 | % | | | 58,000 | | | | 55,100 | | |
10/25/24 | | | 5.875 | % | | | 37,000 | | | | 34,873 | | |
OneMain Financial Holdings LLC(b)
12/15/19 | | | 6.750 | % | | | 38,000 | | | | 39,853 | | |
12/15/21 | | | 7.250 | % | | | 253,000 | | | | 265,017 | | |
The accompanying Notes to Financial Statements are an integral part of this statement.
Annual Report 2016
14
PORTFOLIO OF INVESTMENTS (continued)
August 31, 2016
Corporate Bonds & Notes (continued)
Issuer | | Coupon
Rate | | Principal
Amount ($) | | Value ($) | |
Provident Funding Associates LP/Finance Corp.(b)
06/15/21 | | | 6.750 | % | | | 384,000 | | | | 379,200 | | |
Quicken Loans, Inc.(b)
05/01/25 | | | 5.750 | % | | | 151,000 | | | | 150,668 | | |
Springleaf Finance Corp.
12/15/20 | | | 8.250 | % | | | 59,000 | | | | 64,457 | | |
10/01/23 | | | 8.250 | % | | | 131,000 | | | | 137,304 | | |
Total | | | | | | | 10,809,423 | | |
FOOD AND BEVERAGE 0.7% | |
Anheuser-Busch InBev Finance, Inc.
02/01/23 | | | 3.300 | % | | | 9,000,000 | | | | 9,451,089 | | |
ConAgra Foods, Inc.
01/25/23 | | | 3.200 | % | | | 5,000,000 | | | | 5,213,300 | | |
Constellation Brands, Inc.
11/15/24 | | | 4.750 | % | | | 633,000 | | | | 689,970 | | |
12/01/25 | | | 4.750 | % | | | 6,000 | | | | 6,529 | | |
Diageo Investment Corp.
05/11/22 | | | 2.875 | % | | | 4,226,000 | | | | 4,425,416 | | |
FAGE International SA/USA Dairy Industry, Inc.(b)
08/15/26 | | | 5.625 | % | | | 127,000 | | | | 131,286 | | |
Kraft Heinz Foods Co.
07/15/22 | | | 3.500 | % | | | 5,020,000 | | | | 5,364,292 | | |
Molson Coors Brewing Co.
05/01/42 | | | 5.000 | % | | | 3,000,000 | | | | 3,503,607 | | |
PepsiCo, Inc.
03/05/22 | | | 2.750 | % | | | 3,245,000 | | | | 3,407,020 | | |
Pinnacle Foods Finance LLC/Corp.(b)
01/15/24 | | | 5.875 | % | | | 208,000 | | | | 224,120 | | |
Post Holdings, Inc.(b)
12/15/22 | | | 6.000 | % | | | 282,000 | | | | 299,287 | | |
03/15/24 | | | 7.750 | % | | | 152,000 | | | | 168,910 | | |
08/15/26 | | | 5.000 | % | | | 175,000 | | | | 174,562 | | |
SABMiller Holdings, Inc.(b)
01/15/22 | | | 3.750 | % | | | 4,500,000 | | | | 4,897,561 | | |
Treehouse Foods, Inc.(b)
02/15/24 | | | 6.000 | % | | | 107,000 | | | | 116,363 | | |
WhiteWave Foods Co. (The)
10/01/22 | | | 5.375 | % | | | 147,000 | | | | 165,742 | | |
Total | | | | | | | 38,239,054 | | |
GAMING —% | |
Boyd Gaming Corp.
05/15/23 | | | 6.875 | % | | | 49,000 | | | | 52,920 | | |
Boyd Gaming Corp.(b)
04/01/26 | | | 6.375 | % | | | 76,000 | | | | 80,940 | | |
GLP Capital LP/Financing II, Inc.
11/01/20 | | | 4.875 | % | | | 70,000 | | | | 74,900 | | |
Corporate Bonds & Notes (continued)
Issuer | | Coupon
Rate | | Principal
Amount ($) | | Value ($) | |
11/01/23 | | | 5.375 | % | | | 51,000 | | | | 55,845 | | |
04/15/26 | | | 5.375 | % | | | 76,000 | | | | 83,030 | | |
International Game Technology PLC(b)
02/15/22 | | | 6.250 | % | | | 269,000 | | | | 289,847 | | |
02/15/25 | | | 6.500 | % | | | 100,000 | | | | 108,400 | | |
MGM Growth Properties Operating Partnership
LP/Finance Co-Issuer, Inc.(b)
09/01/26 | | | 4.500 | % | | | 80,000 | | | | 79,950 | | |
MGM Growth Properties Operating Partnership LP/MGP
Finance Co-Issuer, Inc.(b)
05/01/24 | | | 5.625 | % | | | 78,000 | | | | 84,630 | | |
MGM Resorts International
10/01/20 | | | 6.750 | % | | | 44,000 | | | | 49,170 | | |
12/15/21 | | | 6.625 | % | | | 112,000 | | | | 125,720 | | |
03/15/23 | | | 6.000 | % | | | 323,000 | | | | 350,649 | | |
Penn National Gaming, Inc.
11/01/21 | | | 5.875 | % | | | 25,000 | | | | 26,000 | | |
Pinnacle Entertainment, Inc.(b)
05/01/24 | | | 5.625 | % | | | 63,000 | | | | 64,260 | | |
Rivers Pittsburgh Borrower LP/Finance Corp.(b)
08/15/21 | | | 6.125 | % | | | 49,000 | | | | 50,470 | | |
Scientific Games International, Inc.
12/01/22 | | | 10.000 | % | | | 132,000 | | | | 122,100 | | |
Scientific Games International, Inc.(b)
01/01/22 | | | 7.000 | % | | | 369,000 | | | | 392,062 | | |
Seminole Tribe of Florida, Inc.(b)
10/01/20 | | | 6.535 | % | | | 41,000 | | | | 41,410 | | |
SugarHouse HSP Gaming LP/Finance Corp.(b)
06/01/21 | | | 6.375 | % | | | 193,000 | | | | 193,483 | | |
Tunica-Biloxi Gaming Authority(b)(d)
11/15/16 | | | 0.000 | % | | | 25,000 | | | | 10,250 | | |
Total | | | | | | | 2,336,036 | | |
HEALTH CARE 0.5% | |
Acadia Healthcare Co., Inc.
07/01/22 | | | 5.125 | % | | | 14,000 | | | | 13,965 | | |
02/15/23 | | | 5.625 | % | | | 24,000 | | | | 24,420 | | |
03/01/24 | | | 6.500 | % | | | 249,000 | | | | 261,761 | | |
Alere, Inc.(b)
07/01/23 | | | 6.375 | % | | | 67,000 | | | | 68,508 | | |
Amsurg Corp.
11/30/20 | | | 5.625 | % | | | 85,000 | | | | 87,975 | | |
07/15/22 | | | 5.625 | % | | | 37,000 | | | | 38,203 | | |
Becton Dickinson and Co.
12/15/24 | | | 3.734 | % | | | 4,400,000 | | | | 4,784,644 | | |
CHS/Community Health Systems, Inc.
11/15/19 | | | 8.000 | % | | | 65,000 | | | | 61,506 | | |
08/01/21 | | | 5.125 | % | | | 410,000 | | | | 404,362 | | |
02/01/22 | | | 6.875 | % | | | 273,000 | | | | 226,590 | | |
The accompanying Notes to Financial Statements are an integral part of this statement.
Annual Report 2016
15
PORTFOLIO OF INVESTMENTS (continued)
August 31, 2016
Corporate Bonds & Notes (continued)
Issuer | | Coupon
Rate | | Principal
Amount ($) | | Value ($) | |
Cardinal Health, Inc.
12/15/20 | | | 4.625 | % | | | 1,325,000 | | | | 1,474,823 | | |
Change Healthcare Holdings, Inc.
12/31/19 | | | 11.000 | % | | | 58,000 | | | | 61,263 | | |
Change Healthcare Holdings, Inc.(b)
02/15/21 | | | 6.000 | % | | | 62,000 | | | | 65,720 | | |
ConvaTec Finance International SA
Junior Subordinated PIK(b)
01/15/19 | | | 8.250 | % | | | 67,000 | | | | 67,101 | | |
ConvaTec Healthcare E SA(b)
12/15/18 | | | 10.500 | % | | | 147,000 | | | | 151,042 | | |
Covidien International Finance SA
06/15/22 | | | 3.200 | % | | | 4,763,000 | | | | 5,042,031 | | |
DaVita, Inc.
08/15/22 | | | 5.750 | % | | | 349,000 | | | | 366,014 | | |
07/15/24 | | | 5.125 | % | | | 111,000 | | | | 114,607 | | |
05/01/25 | | | 5.000 | % | | | 13,000 | | | | 13,176 | | |
Express Scripts Holding Co.
02/25/21 | | | 3.300 | % | | | 895,000 | | | | 942,619 | | |
02/15/22 | | | 3.900 | % | | | 2,000,000 | | | | 2,156,600 | | |
Fresenius Medical Care U.S. Finance II, Inc.(b)
07/31/19 | | | 5.625 | % | | | 99,000 | | | | 108,405 | | |
01/31/22 | | | 5.875 | % | | | 340,000 | | | | 386,750 | | |
10/15/24 | | | 4.750 | % | | | 32,000 | | | | 34,240 | | |
HCA, Inc.
02/15/22 | | | 7.500 | % | | | 78,000 | | | | 88,920 | | |
03/15/22 | | | 5.875 | % | | | 273,000 | | | | 300,300 | | |
02/01/25 | | | 5.375 | % | | | 1,020,000 | | | | 1,050,600 | | |
04/15/25 | | | 5.250 | % | | | 255,000 | | | | 273,169 | | |
02/15/27 | | | 4.500 | % | | | 217,000 | | | | 218,899 | | |
HealthSouth Corp.
11/01/24 | | | 5.750 | % | | | 187,000 | | | | 193,919 | | |
09/15/25 | | | 5.750 | % | | | 23,000 | | | | 24,064 | | |
Hologic, Inc.(b)
07/15/22 | | | 5.250 | % | | | 207,000 | | | | 220,196 | | |
Kinetic Concepts, Inc./KCI U.S.A., Inc.
11/01/18 | | | 10.500 | % | | | 40,000 | | | | 41,000 | | |
Kinetic Concepts, Inc./KCI U.S.A., Inc.(b)
02/15/21 | | | 7.875 | % | | | 83,000 | | | | 89,640 | | |
MEDNAX, Inc.(b)
12/01/23 | | | 5.250 | % | | | 286,000 | | | | 301,015 | | |
MPH Acquisition Holdings LLC(b)
06/01/24 | | | 7.125 | % | | | 195,000 | | | | 209,625 | | |
McKesson Corp.
12/15/22 | | | 2.700 | % | | | 4,000,000 | | | | 4,067,820 | | |
Sterigenics-Nordion Holdings LLC(b)
05/15/23 | | | 6.500 | % | | | 263,000 | | | | 274,856 | | |
Surgical Care Affiliates, Inc.(b)
04/01/23 | | | 6.000 | % | | | 35,000 | | | | 36,750 | | |
Corporate Bonds & Notes (continued)
Issuer | | Coupon
Rate | | Principal
Amount ($) | | Value ($) | |
Teleflex, Inc.
06/01/26 | | | 4.875 | % | | | 46,000 | | | | 47,955 | | |
Tenet Healthcare Corp.
06/01/20 | | | 4.750 | % | | | 84,000 | | | | 85,890 | | |
10/01/20 | | | 6.000 | % | | | 123,000 | | | | 129,919 | | |
04/01/21 | | | 4.500 | % | | | 335,000 | | | | 338,182 | | |
04/01/22 | | | 8.125 | % | | | 118,000 | | | | 119,475 | | |
06/15/23 | | | 6.750 | % | | | 168,000 | | | | 159,810 | | |
Total | | | | | | | 25,228,329 | | |
HEALTHCARE INSURANCE 0.2% | |
Aetna, Inc.
06/15/23 | | | 2.800 | % | | | 6,715,000 | | | | 6,870,822 | | |
Centene Corp.
05/15/22 | | | 4.750 | % | | | 152,000 | | | | 157,890 | | |
02/15/24 | | | 6.125 | % | | | 341,000 | | | | 371,690 | | |
Molina Healthcare, Inc.(b)
11/15/22 | | | 5.375 | % | | | 267,000 | | | | 275,010 | | |
UnitedHealth Group, Inc.
03/15/23 | | | 2.875 | % | | | 3,100,000 | | | | 3,241,828 | | |
Total | | | | | | | 10,917,240 | | |
HOME CONSTRUCTION —% | |
CalAtlantic Group, Inc.
12/15/21 | | | 6.250 | % | | | 36,000 | | | | 39,510 | | |
11/15/24 | | | 5.875 | % | | | 149,000 | | | | 160,920 | | |
D.R. Horton, Inc.
09/15/22 | | | 4.375 | % | | | 50,000 | | | | 52,750 | | |
Lennar Corp.
06/15/19 | | | 4.500 | % | | | 364,000 | | | | 382,200 | | |
Meritage Homes Corp.
04/15/20 | | | 7.150 | % | | | 16,000 | | | | 17,680 | | |
04/01/22 | | | 7.000 | % | | | 248,000 | | | | 276,520 | | |
06/01/25 | | | 6.000 | % | | | 93,000 | | | | 99,045 | | |
Taylor Morrison Communities, Inc./Monarch, Inc.(b)
04/15/21 | | | 5.250 | % | | | 121,000 | | | | 124,328 | | |
03/01/24 | | | 5.625 | % | | | 81,000 | | | | 83,025 | | |
Toll Brothers Finance Corp.
12/31/18 | | | 4.000 | % | | | 201,000 | | | | 209,291 | | |
11/15/25 | | | 4.875 | % | | | 184,000 | | | | 192,970 | | |
Total | | | | | | | 1,638,239 | | |
INDEPENDENT ENERGY 0.4% | |
Anadarko Petroleum Corp.
09/15/36 | | | 6.450 | % | | | 3,430,000 | | | | 3,959,606 | | |
Antero Resources Corp.
12/01/22 | | | 5.125 | % | | | 415,000 | | | | 409,813 | | |
Canadian Natural Resources Ltd.
04/15/24 | | | 3.800 | % | | | 5,452,000 | | | | 5,467,620 | | |
The accompanying Notes to Financial Statements are an integral part of this statement.
Annual Report 2016
16
PORTFOLIO OF INVESTMENTS (continued)
August 31, 2016
Corporate Bonds & Notes (continued)
Issuer | | Coupon
Rate | | Principal
Amount ($) | | Value ($) | |
Carrizo Oil & Gas, Inc.
04/15/23 | | | 6.250 | % | | | 658,000 | | | | 649,775 | | |
Concho Resources, Inc.
01/15/22 | | | 6.500 | % | | | 19,000 | | | | 19,760 | | |
04/01/23 | | | 5.500 | % | | | 651,000 | | | | 672,157 | | |
Continental Resources, Inc.
04/15/23 | | | 4.500 | % | | | 123,000 | | | | 115,928 | | |
06/01/24 | | | 3.800 | % | | | 245,000 | | | | 221,113 | | |
CrownRock LP/Finance, Inc.(b)
02/15/23 | | | 7.750 | % | | | 418,000 | | | | 444,125 | | |
Denbury Resources, Inc.(b)
05/15/21 | | | 9.000 | % | | | 212,000 | | | | 217,830 | | |
Devon Energy Corp.
07/15/21 | | | 4.000 | % | | | 1,925,000 | | | | 2,012,472 | | |
Diamondback Energy, Inc.
10/01/21 | | | 7.625 | % | | | 96,000 | | | | 101,820 | | |
Extraction Oil & Gas Holdings LLC/Finance Corp.(b)
07/15/21 | | | 7.875 | % | | | 390,000 | | | | 393,900 | | |
Laredo Petroleum, Inc.
01/15/22 | | | 5.625 | % | | | 189,000 | | | | 176,715 | | |
05/01/22 | | | 7.375 | % | | | 145,000 | | | | 146,450 | | |
03/15/23 | | | 6.250 | % | | | 593,000 | | | | 564,832 | | |
Newfield Exploration Co.
01/30/22 | | | 5.750 | % | | | 14,000 | | | | 14,525 | | |
07/01/24 | | | 5.625 | % | | | 235,000 | | | | 242,638 | | |
Oasis Petroleum, Inc.
03/15/22 | | | 6.875 | % | | | 131,000 | | | | 121,830 | | |
01/15/23 | | | 6.875 | % | | | 268,000 | | | | 247,230 | | |
PDC Energy, Inc.
10/15/22 | | | 7.750 | % | | | 122,000 | | | | 128,100 | | |
Parsley Energy LLC/Finance Corp.(b)
02/15/22 | | | 7.500 | % | | | 278,000 | | | | 293,290 | | |
06/01/24 | | | 6.250 | % | | | 290,000 | | | | 299,425 | | |
QEP Resources, Inc.
05/01/23 | | | 5.250 | % | | | 7,000 | | | | 6,860 | | |
RSP Permian, Inc.
10/01/22 | | | 6.625 | % | | | 323,000 | | | | 335,920 | | |
Range Resources Corp.
06/01/21 | | | 5.750 | % | | | 53,000 | | | | 53,795 | | |
WPX Energy, Inc.
01/15/22 | | | 6.000 | % | | | 643,000 | | | | 625,317 | | |
Whiting Petroleum Corp.
03/15/21 | | | 5.750 | % | | | 240,000 | | | | 215,100 | | |
Woodside Finance Ltd.(b)
03/05/25 | | | 3.650 | % | | | 6,615,000 | | | | 6,577,691 | | |
Total | | | | | | | 24,735,637 | | |
Corporate Bonds & Notes (continued)
Issuer | | Coupon
Rate | | Principal
Amount ($) | | Value ($) | |
INTEGRATED ENERGY 0.2% | |
BP Capital Markets PLC
02/10/24 | | | 3.814 | % | | | 5,165,000 | | | | 5,625,806 | | |
Cenovus Energy, Inc.
08/15/22 | | | 3.000 | % | | | 1,325,000 | | | | 1,264,719 | | |
09/15/23 | | | 3.800 | % | | | 1,510,000 | | | | 1,458,699 | | |
Petro-Canada
05/15/18 | | | 6.050 | % | | | 2,000,000 | | | | 2,142,146 | | |
Total | | | | | | | 10,491,370 | | |
LEISURE —% | |
Cedar Fair LP/Canada's Wonderland Co./Magnum
Management Corp.
03/15/21 | | | 5.250 | % | | | 48,000 | | | | 49,800 | | |
06/01/24 | | | 5.375 | % | | | 17,000 | | | | 17,978 | | |
LTF Merger Sub, Inc.(b)
06/15/23 | | | 8.500 | % | | | 153,000 | | | | 154,147 | | |
Total | | | | | | | 221,925 | | |
LIFE INSURANCE 0.4% | |
American International Group, Inc.
02/15/24 | | | 4.125 | % | | | 6,000,000 | | | | 6,458,568 | | |
Five Corners Funding Trust(b)
11/15/23 | | | 4.419 | % | | | 6,000,000 | | | | 6,483,108 | | |
Metropolitan Life Global Funding I(b)
04/11/22 | | | 3.875 | % | | | 4,145,000 | | | | 4,496,911 | | |
Peachtree Corners Funding Trust(b)
02/15/25 | | | 3.976 | % | | | 3,600,000 | | | | 3,632,533 | | |
Total | | | | | | | 21,071,120 | | |
LODGING —% | |
Choice Hotels International, Inc.
07/01/22 | | | 5.750 | % | | | 155,000 | | | | 169,725 | | |
Hilton Escrow Issuer LLC/Corp.(b)
09/01/24 | | | 4.250 | % | | | 105,000 | | | | 107,034 | | |
Playa Resorts Holding BV(b)
08/15/20 | | | 8.000 | % | | | 378,000 | | | | 387,923 | | |
Total | | | | | | | 664,682 | | |
MEDIA AND ENTERTAINMENT 0.4% | |
21st Century Fox America, Inc.
03/15/33 | | | 6.550 | % | | | 2,241,000 | | | | 2,898,888 | | |
AMC Networks, Inc.
04/01/24 | | | 5.000 | % | | | 108,000 | | | | 110,700 | | |
Lamar Media Corp.(b)
02/01/26 | | | 5.750 | % | | | 208,000 | | | | 224,900 | | |
MDC Partners, Inc.(b)
05/01/24 | | | 6.500 | % | | | 525,000 | | | | 498,750 | | |
The accompanying Notes to Financial Statements are an integral part of this statement.
Annual Report 2016
17
PORTFOLIO OF INVESTMENTS (continued)
August 31, 2016
Corporate Bonds & Notes (continued)
Issuer | | Coupon
Rate | | Principal
Amount ($) | | Value ($) | |
Match Group, Inc.
06/01/24 | | | 6.375 | % | | | 187,000 | | | | 203,596 | | |
Netflix, Inc.
02/15/22 | | | 5.500 | % | | | 454,000 | | | | 488,050 | | |
02/15/25 | | | 5.875 | % | | | 54,000 | | | | 58,590 | | |
Nielsen Finance LLC/Co.
10/01/20 | | | 4.500 | % | | | 36,000 | | | | 36,884 | | |
Outfront Media Capital LLC/Corp.
02/15/22 | | | 5.250 | % | | | 8,000 | | | | 8,380 | | |
03/15/25 | | | 5.875 | % | | | 276,000 | | | | 296,010 | | |
RELX Capital, Inc.
10/15/22 | | | 3.125 | % | | | 3,000,000 | | | | 3,077,883 | | |
Scripps Networks Interactive, Inc.
11/15/24 | | | 3.900 | % | | | 6,000,000 | | | | 6,340,680 | | |
Sky PLC(b)
11/26/22 | | | 3.125 | % | | | 3,334,000 | | | | 3,427,036 | | |
Thomson Reuters Corp.
05/23/43 | | | 4.500 | % | | | 2,204,000 | | | | 2,358,379 | | |
Univision Communications, Inc.(b)
09/15/22 | | | 6.750 | % | | | 59,000 | | | | 62,872 | | |
05/15/23 | | | 5.125 | % | | | 28,000 | | | | 29,120 | | |
02/15/25 | | | 5.125 | % | | | 524,000 | | | | 547,580 | | |
Total | | | | | | | 20,668,298 | | |
METALS 0.1% | |
ArcelorMittal(c)
03/01/21 | | | 6.500 | % | | | 216,000 | | | | 234,360 | | |
02/25/22 | | | 7.250 | % | | | 105,000 | | | | 118,125 | | |
Constellium NV(b)
05/15/24 | | | 5.750 | % | | | 63,000 | | | | 58,275 | | |
Freeport-McMoRan, Inc.
03/01/22 | | | 3.550 | % | | | 69,000 | | | | 60,202 | | |
03/15/23 | | | 3.875 | % | | | 140,000 | | | | 120,050 | | |
11/14/24 | | | 4.550 | % | | | 351,000 | | | | 307,125 | | |
Novelis Corp.(b)
08/15/24 | | | 6.250 | % | | | 84,000 | | | | 87,570 | | |
Vale Overseas Ltd.
01/11/22 | | | 4.375 | % | | | 3,300,000 | | | | 3,212,550 | | |
Total | | | | | | | 4,198,257 | | |
MIDSTREAM 0.5% | |
Columbia Pipeline Group, Inc.
06/01/45 | | | 5.800 | % | | | 4,249,000 | | | | 5,117,542 | | |
Energy Transfer Equity LP
06/01/27 | | | 5.500 | % | | | 225,000 | | | | 225,562 | | |
Enterprise Products Operating LLC
02/01/41 | | | 5.950 | % | | | 3,715,000 | | | | 4,420,341 | | |
Corporate Bonds & Notes (continued)
Issuer | | Coupon
Rate | | Principal
Amount ($) | | Value ($) | |
Hiland Partners Holdings LLC/Finance Corp.(b)
10/01/20 | | | 7.250 | % | | | 131,000 | | | | 135,749 | | |
05/15/22 | | | 5.500 | % | | | 50,000 | | | | 51,688 | | |
Holly Energy Partners LP/Finance Corp.(b)
08/01/24 | | | 6.000 | % | | | 36,000 | | | | 36,720 | | |
Kinder Morgan Energy Partners LP
03/01/44 | | | 5.500 | % | | | 4,300,000 | | | | 4,366,250 | | |
MPLX LP(b)
02/15/23 | | | 5.500 | % | | | 99,000 | | | | 102,800 | | |
07/15/23 | | | 4.500 | % | | | 132,000 | | | | 133,326 | | |
12/01/24 | | | 4.875 | % | | | 212,000 | | | | 216,870 | | |
06/01/25 | | | 4.875 | % | | | 514,000 | | | | 524,608 | | |
Plains All American Pipeline LP/Finance Corp.
11/01/24 | | | 3.600 | % | | | 5,000,000 | | | | 4,854,255 | | |
Sabine Pass Liquefaction LLC
03/01/25 | | | 5.625 | % | | | 408,000 | | | | 431,460 | | |
Sabine Pass Liquefaction LLC(b)
06/30/26 | | | 5.875 | % | | | 170,000 | | | | 181,900 | | |
Tallgrass Energy Partners LP/Finance Corp.(b)(e)
09/15/24 | | | 5.500 | % | | | 119,000 | | | | 121,975 | | |
Targa Resources Partners LP/Finance Corp.
01/15/18 | | | 5.000 | % | | | 55,000 | | | | 56,100 | | |
11/15/19 | | | 4.125 | % | | | 26,000 | | | | 26,195 | | |
05/01/23 | | | 5.250 | % | | | 3,000 | | | | 3,045 | | |
11/15/23 | | | 4.250 | % | | | 227,000 | | | | 218,488 | | |
Targa Resources Partners LP/Finance Corp.(b)
03/15/24 | | | 6.750 | % | | | 92,000 | | | | 97,750 | | |
Tesoro Logistics LP/Finance Corp.
10/15/19 | | | 5.500 | % | | | 18,000 | | | | 19,170 | | |
10/15/22 | | | 6.250 | % | | | 376,000 | | | | 397,996 | | |
05/01/24 | | | 6.375 | % | | | 89,000 | | | | 95,008 | | |
Western Gas Partners LP
07/01/22 | | | 4.000 | % | | | 88,000 | | | | 89,624 | | |
06/01/25 | | | 3.950 | % | | | 167,000 | | | | 164,333 | | |
Williams Companies, Inc. (The)
01/15/23 | | | 3.700 | % | | | 104,000 | | | | 100,880 | | |
06/24/24 | | | 4.550 | % | | | 588,000 | | | | 601,230 | | |
Williams Partners LP
03/04/24 | | | 4.300 | % | | | 4,438,000 | | | | 4,542,830 | | |
Total | | | | | | | 27,333,695 | | |
NATURAL GAS 0.1% | |
NiSource Finance Corp.
02/15/44 | | | 4.800 | % | | | 1,300,000 | | | | 1,499,354 | | |
Sempra Energy
10/01/22 | | | 2.875 | % | | | 6,146,000 | | | | 6,356,482 | | |
Total | | | | | | | 7,855,836 | | |
The accompanying Notes to Financial Statements are an integral part of this statement.
Annual Report 2016
18
PORTFOLIO OF INVESTMENTS (continued)
August 31, 2016
Corporate Bonds & Notes (continued)
Issuer | | Coupon
Rate | | Principal
Amount ($) | | Value ($) | |
OFFICE REIT 0.1% | |
Boston Properties LP
02/01/26 | | | 3.650 | % | | | 3,850,000 | | | | 4,115,585 | | |
OIL FIELD SERVICES 0.1% | |
Noble Holding International Ltd.
03/01/21 | | | 4.625 | % | | | 2,610,000 | | | | 2,186,136 | | |
SESI LLC
05/01/19 | | | 6.375 | % | | | 122,000 | | | | 120,780 | | |
12/15/21 | | | 7.125 | % | | | 36,000 | | | | 35,100 | | |
Weatherford International Ltd.
06/15/21 | | | 7.750 | % | | | 236,000 | | | | 233,640 | | |
Total | | | | | | | 2,575,656 | | |
OTHER INDUSTRY —% | |
CB Richard Ellis Services, Inc.
03/15/25 | | | 5.250 | % | | | 108,000 | | | | 116,536 | | |
OTHER REIT 0.1% | |
CyrusOne LP/Finance Corp.
11/15/22 | | | 6.375 | % | | | 48,000 | | | | 51,000 | | |
Duke Realty LP
04/15/23 | | | 3.625 | % | | | 3,705,000 | | | | 3,912,169 | | |
Total | | | | | | | 3,963,169 | | |
PACKAGING 0.1% | |
Ardagh Packaging Finance PLC/Holdings USA, Inc.(b)
01/31/21 | | | 6.750 | % | | | 43,000 | | | | 44,559 | | |
05/15/23 | | | 4.625 | % | | | 195,000 | | | | 198,412 | | |
05/15/24 | | | 7.250 | % | | | 143,000 | | | | 152,116 | | |
Ball Corp.
12/15/20 | | | 4.375 | % | | | 421,000 | | | | 454,154 | | |
Berry Plastics Corp.
05/15/22 | | | 5.500 | % | | | 141,000 | | | | 146,640 | | |
10/15/22 | | | 6.000 | % | | | 77,000 | | | | 81,620 | | |
07/15/23 | | | 5.125 | % | | | 330,000 | | | | 338,052 | | |
Beverage Packaging Holdings (Luxembourg) II SA(b)
12/15/16 | | | 5.625 | % | | | 15,000 | | | | 15,037 | | |
Plastipak Holdings, Inc.(b)
10/01/21 | | | 6.500 | % | | | 301,000 | | | | 313,040 | | |
Reynolds Group Issuer, Inc./LLC
10/15/20 | | | 5.750 | % | | | 355,000 | | | | 366,094 | | |
02/15/21 | | | 6.875 | % | | | 94,000 | | | | 97,525 | | |
Reynolds Group Issuer, Inc./LLC(b)
07/15/24 | | | 7.000 | % | | | 251,000 | | | | 268,884 | | |
Corporate Bonds & Notes (continued)
Issuer | | Coupon
Rate | | Principal
Amount ($) | | Value ($) | |
Reynolds Group Issuer, Inc./LLC(c)
02/15/21 | | | 8.250 | % | | | 200,000 | | | | 208,000 | | |
Signode Industrial Group Luxembourg SA/US, Inc.(b)
05/01/22 | | | 6.375 | % | | | 39,000 | | | | 39,780 | | |
Total | | | | | | | 2,723,913 | | |
PHARMACEUTICALS 0.5% | |
AbbVie, Inc.
05/14/21 | | | 2.300 | % | | | 4,275,000 | | | | 4,319,580 | | |
Actavis Funding SCS
03/15/22 | | | 3.450 | % | | | 7,560,000 | | | | 7,918,473 | | |
Amgen, Inc.
05/22/24 | | | 3.625 | % | | | 3,460,000 | | | | 3,733,759 | | |
Concordia International Corp.(b)
04/15/23 | | | 7.000 | % | | | 45,000 | | | | 34,875 | | |
Endo Finance LLC/Finco, Inc.(b)
02/01/25 | | | 6.000 | % | | | 249,000 | | | | 220,987 | | |
Endo Finance LLC/Ltd./Finco, Inc.(b)
07/15/23 | | | 6.000 | % | | | 2,000 | | | | 1,815 | | |
Gilead Sciences, Inc.
09/01/22 | | | 3.250 | % | | | 3,650,000 | | | | 3,888,907 | | |
Grifols Worldwide Operations Ltd.
04/01/22 | | | 5.250 | % | | | 355,000 | | | | 370,975 | | |
Jaguar Holding Co. II/Pharmaceutical Product
Development LLC(b)
08/01/23 | | | 6.375 | % | | | 283,000 | | | | 296,442 | | |
Mallinckrodt International Finance SA/CB LLC(b)
04/15/25 | | | 5.500 | % | | | 28,000 | | | | 27,580 | | |
Mallinckrodt International Finance SA
04/15/18 | | | 3.500 | % | | | 126,000 | | | | 126,157 | | |
Quintiles Transnational Corp.(b)
05/15/23 | | | 4.875 | % | | | 108,000 | | | | 112,320 | | |
Roche Holdings, Inc.(b)
09/30/24 | | | 3.350 | % | | | 3,500,000 | | | | 3,796,128 | | |
Valeant Pharmaceuticals International, Inc.(b)
07/15/21 | | | 7.500 | % | | | 79,000 | | | | 77,642 | | |
12/01/21 | | | 5.625 | % | | | 15,000 | | | | 13,500 | | |
03/01/23 | | | 5.500 | % | | | 125,000 | | | | 109,063 | | |
05/15/23 | | | 5.875 | % | | | 123,000 | | | | 108,240 | | |
04/15/25 | | | 6.125 | % | | | 1,024,000 | | | | 899,840 | | |
Total | | | | | | | 26,056,283 | | |
PROPERTY & CASUALTY 0.6% | |
Alliant Holdings I LP(b)
08/01/23 | | | 8.250 | % | | | 9,000 | | | | 9,303 | | |
Berkshire Hathaway, Inc.
03/15/23 | | | 2.750 | % | | | 6,500,000 | | | | 6,760,175 | | |
The accompanying Notes to Financial Statements are an integral part of this statement.
Annual Report 2016
19
PORTFOLIO OF INVESTMENTS (continued)
August 31, 2016
Corporate Bonds & Notes (continued)
Issuer | | Coupon
Rate | | Principal
Amount ($) | | Value ($) | |
CNA Financial Corp.
03/01/26 | | | 4.500 | % | | | 5,125,000 | | | | 5,547,966 | | |
Chubb INA Holdings, Inc.
03/13/23 | | | 2.700 | % | | | 4,000,000 | | | | 4,142,812 | | |
HUB International Ltd.(b)
02/15/21 | | | 9.250 | % | | | 31,000 | | | | 32,705 | | |
10/01/21 | | | 7.875 | % | | | 377,000 | | | | 385,483 | | |
Hartford Financial Services Group, Inc. (The)
04/15/22 | | | 5.125 | % | | | 4,740,000 | | | | 5,374,051 | | |
Hub Holdings LLC/Finance, Inc.
PIK(b)
07/15/19 | | | 8.125 | % | | | 13,000 | | | | 12,675 | | |
Liberty Mutual Group, Inc.(b)
05/01/22 | | | 4.950 | % | | | 4,000,000 | | | | 4,460,344 | | |
Loews Corp.
05/15/23 | | | 2.625 | % | | | 6,400,000 | | | | 6,468,960 | | |
Transatlantic Holdings, Inc.
11/30/39 | | | 8.000 | % | | | 1,000,000 | | | | 1,395,629 | | |
Total | | | | | | | 34,590,103 | | |
RAILROADS 0.1% | |
Burlington Northern Santa Fe LLC
09/01/24 | | | 3.400 | % | | | 4,200,000 | | | | 4,553,934 | | |
CSX Corp.
03/15/44 | | | 4.100 | % | | | 2,230,000 | | | | 2,426,155 | | |
Total | | | | | | | 6,980,089 | | |
REFINING —% | |
Marathon Petroleum Corp.
03/01/41 | | | 6.500 | % | | | 800,000 | | | | 898,758 | | |
RESTAURANTS —% | |
BC ULC/New Red Finance, Inc.(b)
01/15/22 | | | 4.625 | % | | | 255,000 | | | | 263,925 | | |
04/01/22 | | | 6.000 | % | | | 63,000 | | | | 65,914 | | |
KFC Holding Co./Pizza Hut Holdings LLC/Taco Bell of
America LLC(b)
06/01/26 | | | 5.250 | % | | | 310,000 | | | | 329,375 | | |
Total | | | | | | | 659,214 | | |
RETAIL REIT 0.1% | |
Kimco Realty Corp.
06/01/23 | | | 3.125 | % | | | 5,000,000 | | | | 5,149,905 | | |
Simon Property Group LP
02/01/40 | | | 6.750 | % | | | 2,000,000 | | | | 2,994,782 | | |
Total | | | | | | | 8,144,687 | | |
Corporate Bonds & Notes (continued)
Issuer | | Coupon
Rate | | Principal
Amount ($) | | Value ($) | |
RETAILERS 0.3% | |
Asbury Automotive Group, Inc.
12/15/24 | | | 6.000 | % | | | 78,000 | | | | 81,608 | | |
CVS Health Corp.
07/20/22 | | | 3.500 | % | | | 4,000,000 | | | | 4,299,460 | | |
CVS Pass-Through Trust(b)
01/10/32 | | | 7.507 | % | | | 296,177 | | | | 380,927 | | |
Dollar Tree, Inc.
03/01/23 | | | 5.750 | % | | | 243,000 | | | | 261,529 | | |
Group 1 Automotive, Inc.
06/01/22 | | | 5.000 | % | | | 22,000 | | | | 22,110 | | |
Group 1 Automotive, Inc.(b)
12/15/23 | | | 5.250 | % | | | 72,000 | | | | 72,900 | | |
Hanesbrands, Inc.(b)
05/15/24 | | | 4.625 | % | | | 102,000 | | | | 106,717 | | |
05/15/26 | | | 4.875 | % | | | 102,000 | | | | 106,590 | | |
Home Depot, Inc. (The)
04/01/26 | | | 3.000 | % | | | 5,000,000 | | | | 5,335,770 | | |
Macy's Retail Holdings, Inc.
07/15/34 | | | 6.700 | % | | | 750,000 | | | | 849,670 | | |
Penske Automotive Group, Inc.
12/01/24 | | | 5.375 | % | | | 36,000 | | | | 36,630 | | |
05/15/26 | | | 5.500 | % | | | 64,000 | | | | 64,040 | | |
Rite Aid Corp.
Junior Subordinated
02/15/27 | | | 7.700 | % | | | 25,000 | | | | 31,750 | | |
Rite Aid Corp.(b)
04/01/23 | | | 6.125 | % | | | 111,000 | | | | 119,833 | | |
Sally Holdings LLC/Capital, Inc.
06/01/22 | | | 5.750 | % | | | 175,000 | | | | 182,656 | | |
12/01/25 | | | 5.625 | % | | | 33,000 | | | | 35,739 | | |
Target Corp.
07/01/24 | | | 3.500 | % | | | 1,800,000 | | | | 1,984,286 | | |
Total | | | | | | | 13,972,215 | | |
SUPERMARKETS —% | |
Albertsons Companies, LLC/Safeway, Inc.(b)
03/15/25 | | | 5.750 | % | | | 154,000 | | | | 159,390 | | |
TECHNOLOGY 0.5% | |
Alliance Data Systems Corp.(b)
12/01/17 | | | 5.250 | % | | | 59,000 | | | | 60,328 | | |
04/01/20 | | | 6.375 | % | | | 102,000 | | | | 103,785 | | |
08/01/22 | | | 5.375 | % | | | 271,000 | | | | 266,935 | | |
Ancestry.com, Inc.
Junior Subordinated
12/15/20 | | | 11.000 | % | | | 70,000 | | | | 75,075 | | |
The accompanying Notes to Financial Statements are an integral part of this statement.
Annual Report 2016
20
PORTFOLIO OF INVESTMENTS (continued)
August 31, 2016
Corporate Bonds & Notes (continued)
Issuer | | Coupon
Rate | | Principal
Amount ($) | | Value ($) | |
Apple, Inc.
05/03/23 | | | 2.400 | % | | | 7,000,000 | | | | 7,171,094 | | |
Cisco Systems, Inc.
02/28/21 | | | 2.200 | % | | | 4,830,000 | | | | 4,960,932 | | |
Diamond 1 Finance Corp./Diamond 2 Finance Corp.(b)
06/15/21 | | | 5.875 | % | | | 116,000 | | | | 122,652 | | |
06/15/23 | | | 5.450 | % | | | 150,000 | | | | 159,927 | | |
06/15/24 | | | 7.125 | % | | | 129,000 | | | | 139,753 | | |
06/15/26 | | | 6.020 | % | | | 300,000 | | | | 320,978 | | |
Equinix, Inc.
04/01/20 | | | 4.875 | % | | | 132,000 | | | | 137,280 | | |
01/01/22 | | | 5.375 | % | | | 25,000 | | | | 26,703 | | |
04/01/23 | | | 5.375 | % | | | 111,000 | | | | 117,383 | | |
01/15/26 | | | 5.875 | % | | | 248,000 | | | | 270,164 | | |
First Data Corp.(b)
08/15/23 | | | 5.375 | % | | | 183,000 | | | | 189,862 | | |
12/01/23 | | | 7.000 | % | | | 438,000 | | | | 458,805 | | |
01/15/24 | | | 5.000 | % | | | 39,000 | | | | 39,683 | | |
01/15/24 | | | 5.750 | % | | | 547,000 | | | | 559,991 | | |
Hewlett Packard Enterprise Co.(b)
10/15/45 | | | 6.350 | % | | | 4,100,000 | | | | 4,231,827 | | |
Infor US, Inc.(b)
08/15/20 | | | 5.750 | % | | | 23,000 | | | | 24,277 | | |
Informatica LLC(b)
07/15/23 | | | 7.125 | % | | | 37,000 | | | | 34,965 | | |
MSCI, Inc.(b)
11/15/24 | | | 5.250 | % | | | 208,000 | | | | 221,000 | | |
08/15/25 | | | 5.750 | % | | | 81,000 | | | | 87,784 | | |
08/01/26 | | | 4.750 | % | | | 80,000 | | | | 82,100 | | |
Microsemi Corp.(b)
04/15/23 | | | 9.125 | % | | | 206,000 | | | | 235,870 | | |
NXP BV/Funding LLC(b)
06/15/22 | | | 4.625 | % | | | 112,000 | | | | 117,949 | | |
09/01/22 | | | 3.875 | % | | | 265,000 | | | | 269,306 | | |
Oracle Corp.
04/15/38 | | | 6.500 | % | | | 3,000,000 | | | | 4,234,200 | | |
PTC, Inc.
05/15/24 | | | 6.000 | % | | | 207,000 | | | | 223,819 | | |
Qualitytech LP/Finance Corp.
08/01/22 | | | 5.875 | % | | | 183,000 | | | | 188,947 | | |
Riverbed Technology, Inc.(b)
03/01/23 | | | 8.875 | % | | | 134,000 | | | | 143,715 | | |
Sensata Technologies UK Financing Co. PLC(b)
02/15/26 | | | 6.250 | % | | | 174,000 | | | | 190,747 | | |
Solera LLC/Finance, Inc.(b)
03/01/24 | | | 10.500 | % | | | 173,000 | | | | 191,597 | | |
Corporate Bonds & Notes (continued)
Issuer | | Coupon
Rate | | Principal
Amount ($) | | Value ($) | |
VeriSign, Inc.
05/01/23 | | | 4.625 | % | | | 368,000 | | | | 376,280 | | |
04/01/25 | | | 5.250 | % | | | 72,000 | | | | 75,060 | | |
Zebra Technologies Corp.
10/15/22 | | | 7.250 | % | | | 341,000 | | | | 369,985 | | |
Total | | | | | | | 26,480,758 | | |
TRANSPORTATION SERVICES 0.1% | |
ERAC U.S.A. Finance LLC(b)
10/15/37 | | | 7.000 | % | | | 2,796,000 | | | | 3,837,759 | | |
Hertz Corp. (The)
01/15/21 | | | 7.375 | % | | | 12,000 | | | | 12,495 | | |
10/15/22 | | | 6.250 | % | | | 24,000 | | | | 25,238 | | |
Total | | | | | | | 3,875,492 | | |
WIRELESS 0.1% | |
Rogers Communications, Inc.
10/01/23 | | | 4.100 | % | | | 2,223,000 | | | | 2,473,672 | | |
SBA Communications Corp.(b)
09/01/24 | | | 4.875 | % | | | 457,000 | | | | 463,284 | | |
SBA Communications Corp
07/15/22 | | | 4.875 | % | | | 180,000 | | | | 184,500 | | |
SBA Telecommunications, Inc.
07/15/20 | | | 5.750 | % | | | 47,000 | | | | 48,351 | | |
SFR Group SA(b)
05/15/22 | | | 6.000 | % | | | 444,000 | | | | 453,768 | | |
05/01/26 | | | 7.375 | % | | | 359,000 | | | | 370,667 | | |
Sprint Communications, Inc.(b)
11/15/18 | | | 9.000 | % | | | 122,000 | | | | 133,895 | | |
03/01/20 | | | 7.000 | % | | | 633,000 | | | | 678,892 | | |
Sprint Corp.
09/15/21 | | | 7.250 | % | | | 41,000 | | | | 40,539 | | |
09/15/23 | | | 7.875 | % | | | 111,000 | | | | 107,891 | | |
06/15/24 | | | 7.125 | % | | | 66,000 | | | | 61,545 | | |
02/15/25 | | | 7.625 | % | | | 394,000 | | | | 374,054 | | |
T-Mobile USA, Inc.
04/28/21 | | | 6.633 | % | | | 86,000 | | | | 90,085 | | |
01/15/22 | | | 6.125 | % | | | 18,000 | | | | 18,990 | | |
04/28/22 | | | 6.731 | % | | | 14,000 | | | | 14,717 | | |
03/01/23 | | | 6.000 | % | | | 75,000 | | | | 79,503 | | |
04/01/23 | | | 6.625 | % | | | 657,000 | | | | 700,934 | | |
04/28/23 | | | 6.836 | % | | | 74,000 | | | | 79,365 | | |
01/15/24 | | | 6.500 | % | | | 52,000 | | | | 55,900 | | |
03/01/25 | | | 6.375 | % | | | 21,000 | | | | 22,575 | | |
01/15/26 | | | 6.500 | % | | | 199,000 | | | | 217,781 | | |
Wind Acquisition Finance SA(b)
04/30/20 | | | 6.500 | % | | | 111,000 | | | | 116,204 | | |
07/15/20 | | | 4.750 | % | | | 76,000 | | | | 76,950 | | |
04/23/21 | | | 7.375 | % | | | 67,000 | | | | 69,010 | | |
Total | | | | | | | 6,933,072 | | |
The accompanying Notes to Financial Statements are an integral part of this statement.
Annual Report 2016
21
PORTFOLIO OF INVESTMENTS (continued)
August 31, 2016
Corporate Bonds & Notes (continued)
Issuer | | Coupon
Rate | | Principal
Amount ($) | | Value ($) | |
WIRELINES 0.6% | |
AT&T, Inc.
03/15/22 | | | 3.800 | % | | | 3,750,000 | | | | 4,025,689 | | |
02/15/39 | | | 6.550 | % | | | 5,000,000 | | | | 6,497,515 | | |
CenturyLink, Inc.
04/01/20 | | | 5.625 | % | | | 48,000 | | | | 51,120 | | |
03/15/22 | | | 5.800 | % | | | 320,000 | | | | 331,072 | | |
12/01/23 | | | 6.750 | % | | | 45,000 | | | | 47,363 | | |
04/01/24 | | | 7.500 | % | | | 156,000 | | | | 169,162 | | |
04/01/25 | | | 5.625 | % | | | 42,000 | | | | 40,950 | | |
Deutsche Telekom International Finance BV
08/20/18 | | | 6.750 | % | | | 4,000,000 | | | | 4,419,300 | | |
Frontier Communications Corp.
09/15/20 | | | 8.875 | % | | | 193,000 | | | | 210,370 | | |
07/01/21 | | | 9.250 | % | | | 22,000 | | | | 23,815 | | |
09/15/22 | | | 10.500 | % | | | 98,000 | | | | 106,636 | | |
01/15/23 | | | 7.125 | % | | | 59,000 | | | | 55,608 | | |
01/15/25 | | | 6.875 | % | | | 262,000 | | | | 235,145 | | |
09/15/25 | | | 11.000 | % | | | 653,000 | | | | 705,240 | | |
Level 3 Communications, Inc.
12/01/22 | | | 5.750 | % | | | 94,000 | | | | 98,230 | | |
Level 3 Financing, Inc.
01/15/21 | | | 6.125 | % | | | 36,000 | | | | 37,350 | | |
08/15/22 | | | 5.375 | % | | | 127,000 | | | | 132,734 | | |
01/15/24 | | | 5.375 | % | | | 71,000 | | | | 74,372 | | |
Level 3 Financing, Inc.(b)
03/15/26 | | | 5.250 | % | | | 294,000 | | | | 304,657 | | |
Orange SA
07/08/19 | | | 5.375 | % | | | 4,000,000 | | | | 4,424,080 | | |
Telecom Italia SpA(b)
05/30/24 | | | 5.303 | % | | | 191,000 | | | | 195,536 | | |
Telefonica Emisiones SAU
06/20/36 | | | 7.045 | % | | | 2,800,000 | | | | 3,755,450 | | |
Verizon Communications, Inc.
03/15/34 | | | 5.050 | % | | | 6,000,000 | | | | 6,841,578 | | |
11/01/34 | | | 4.400 | % | | | 1,670,000 | | | | 1,775,873 | | |
Zayo Group LLC/Capital, Inc.
04/01/23 | | | 6.000 | % | | | 238,000 | | | | 247,520 | | |
05/15/25 | | | 6.375 | % | | | 319,000 | | | | 336,612 | | |
Total | | | | | | | 35,142,977 | | |
Total Corporate Bonds & Notes
(Cost: $638,770,114) | | | | | | | 668,909,277 | | |
Residential Mortgage-Backed Securities —
Agency 8.8%
Issuer | | Coupon
Rate | | Principal
Amount ($) | | Value ($) | |
Federal Home Loan Mortgage Corp.
10/01/26-
12/01/45 | | | 3.500 | % | | | 97,844,701 | | | | 103,179,443 | | |
03/01/17-
10/01/39 | | | 6.000 | % | | | 1,161,507 | | | | 1,330,847 | | |
06/01/32-
07/01/32 | | | 7.000 | % | | | 465,979 | | | | 565,738 | | |
12/01/17-
01/01/39 | | | 5.500 | % | | | 707,507 | | | | 781,936 | | |
08/01/18-
05/01/41 | | | 5.000 | % | | | 1,691,666 | | | | 1,858,042 | | |
05/01/39-
06/01/41 | | | 4.500 | % | | | 6,397,605 | | | | 7,012,229 | | |
12/01/42-
12/01/45 | | | 4.000 | % | | | 77,498,564 | | | | 82,929,033 | | |
12/01/42-
06/01/45 | | | 3.000 | % | | | 39,848,001 | | | | 41,395,936 | | |
03/01/38 | | | 6.500 | % | | | 8,615 | | | | 9,872 | | |
CMO Series 1614 Class MZ
11/15/23 | | | 6.500 | % | | | 14,749 | | | | 16,249 | | |
Federal Home Loan Mortgage Corp.(e)
09/14/46 | | | 3.500 | % | | | 11,800,000 | | | | 12,426,414 | | |
Federal Home Loan Mortgage Corp.(c)
12/01/36 | | | 6.151 | % | | | 4,861 | | | | 5,105 | | |
08/01/36 | | | 2.798 | % | | | 39,848 | | | | 42,525 | | |
Federal Home Loan Mortgage Corp.(f)
09/01/43 | | | 3.500 | % | | | 4,461,655 | | | | 4,714,225 | | |
Federal National Mortgage Association
12/01/25-
03/01/46 | | | 3.500 | % | | | 84,823,627 | | | | 89,481,429 | | |
07/01/27-
11/01/45 | | | 3.000 | % | | | 26,702,662 | | | | 27,817,921 | | |
03/01/17-
03/01/37 | | | 6.500 | % | | | 447,057 | | | | 515,530 | | |
09/01/17 | | | 6.000 | % | | | 37,839 | | | | 38,159 | | |
08/01/18-
02/01/38 | | | 5.500 | % | | | 320,232 | | | | 357,034 | | |
12/01/20 | | | 5.000 | % | | | 66,948 | | | | 70,556 | | |
01/01/29-
10/01/45 | | | 4.000 | % | | | 75,622,524 | | | | 80,923,712 | | |
05/01/40-
06/01/44 | | | 4.500 | % | | | 8,234,554 | | | | 9,006,753 | | |
06/01/31 | | | 7.000 | % | | | 239,070 | | | | 285,153 | | |
Federal National Mortgage Association(e)
02/01/31 | | | 3.000 | % | | | 10,277,429 | | | | 10,766,309 | | |
Government National Mortgage Association
02/15/45 | | | 3.500 | % | | | 15,691,591 | | | | 16,661,796 | | |
Total Residential Mortgage-Backed
Securities — Agency
(Cost: $485,728,668) | | | | | | | 492,191,946 | | |
The accompanying Notes to Financial Statements are an integral part of this statement.
Annual Report 2016
22
PORTFOLIO OF INVESTMENTS (continued)
August 31, 2016
Residential Mortgage-Backed Securities —
Non-Agency 0.9%
Issuer | | Coupon
Rate | | Principal
Amount ($) | | Value ($) | |
COLT Mortgage Loan Trust
CMO Series 2016-1 Class A1(b)
05/25/46 | | | 3.000 | % | | | 2,022,199 | | | | 2,046,845 | | |
Equifirst Mortgage Loan Trust
CMO Series 2003-1 Class IF1(c)
12/25/32 | | | 4.010 | % | | | 69,716 | | | | 70,254 | | |
JPMorgan Resecuritization Trust
CMO Series 2009-12 Class 9A1(b)(c)
05/26/36 | | | 2.964 | % | | | 521,668 | | | | 522,527 | | |
Mill City Mortgage Trust(b)
CMO Series 15-1 Class A1
06/25/56 | | | 2.230 | % | | | 3,638,470 | | | | 3,644,192 | | |
Series 2015-2 Class A1
09/25/57 | | | 3.000 | % | | | 4,991,735 | | | | 5,011,781 | | |
Series 2016-1 Class A1
04/25/57 | | | 2.500 | % | | | 5,200,000 | | | | 5,233,379 | | |
SACO I, Inc.
CMO Series 1995-1 Class A(b)(c)(g)
09/25/24 | | | 0.000 | % | | | 3,820 | | | | 2,121 | | |
Springleaf Mortgage Loan Trust(b)
CMO Series 2013-1A Class A
06/25/58 | | | 1.270 | % | | | 369,679 | | | | 369,635 | | |
CMO Series 2013-2A Class A
12/25/65 | | | 1.780 | % | | | 553,808 | | | | 550,981 | | |
CMO Series 2013-3A Class A
09/25/57 | | | 1.870 | % | | | 1,432,601 | | | | 1,424,760 | | |
Towd Point Mortgage Trust(b)
CMO Series 15-5 Class A1
05/25/55 | | | 3.500 | % | | | 4,923,843 | | | | 5,073,224 | | |
CMO Series 15-6 Class A1
04/25/55 | | | 3.500 | % | | | 5,288,034 | | | | 5,455,718 | | |
CMO Series 2015-4 Class A1
04/25/55 | | | 3.500 | % | | | 3,400,805 | | | | 3,496,723 | | |
CMO Series 2016-1 Class A1
02/25/55 3.500% 6,685,903 6,879,573
CMO Series 2016-2 Class A1
08/25/55 | | | 3.000 | % | | | 7,784,374 | | | | 7,938,549 | | |
Series 2016-3 Class A1
08/25/55 | | | 2.250 | % | | | 4,454,788 | | | | 4,446,074 | | |
Total Residential Mortgage-Backed
Securities — Non-Agency
(Cost: $51,813,401) | | | | | | | 52,166,336 | | |
Commercial Mortgage-Backed Securities —
Agency 2.6%
Federal National Mortgage Association
Series 2006-M2 Class A2A
10/25/32 | | | 5.271 | % | | | 1,877,887 | | | | 2,074,348 | | |
Commercial Mortgage-Backed Securities —
Agency (continued)
Issuer | | Coupon
Rate | | Principal
Amount ($) | | Value ($) | |
Government National Mortgage Association
Series 2011-161 Class A
01/16/34 | | | 1.738 | % | | | 1,370,932 | | | | 1,370,360 | | |
Series 2012-111 Class AC
04/16/47 | | | 2.211 | % | | | 447,782 | | | | 448,325 | | |
Series 2012-25 Class A
11/16/42 | | | 2.575 | % | | | 1,649,165 | | | | 1,675,246 | | |
Series 2012-45 Class A
03/16/40 | | | 2.830 | % | | | 454,264 | | | | 457,568 | | |
Series 2012-55 Class A
08/16/33 | | | 1.704 | % | | | 647,278 | | | | 648,172 | | |
Series 2012-58 Class A
01/16/40 | | | 2.500 | % | | | 717,556 | | | | 726,038 | | |
Series 2012-9 Class A
05/16/39 | | | 3.220 | % | | | 151,500 | | | | 152,193 | | |
Series 2013-105 Class A
02/16/37 | | | 1.705 | % | | | 4,416,336 | | | | 4,376,023 | | |
Series 2013-118 Class AB
06/16/36 | | | 2.000 | % | | | 2,192,072 | | | | 2,206,720 | | |
Series 2013-12 Class A
10/16/42 | | | 1.410 | % | | | 4,711,718 | | | | 4,655,059 | | |
Series 2013-126 Class AB
04/16/38 | | | 1.540 | % | | | 7,142,343 | | | | 7,045,894 | | |
Series 2013-138 Class A
08/16/35 | | | 2.150 | % | | | 4,914,652 | | | | 4,934,610 | | |
Series 2013-146 Class AH
08/16/40 | | | 2.000 | % | | | 2,042,755 | | | | 2,056,100 | | |
Series 2013-17 Class AH
10/16/43 | | | 1.558 | % | | | 1,393,280 | | | | 1,376,261 | | |
Series 2013-179 Class A
07/16/37 | | | 1.800 | % | | | 2,373,252 | | | | 2,355,119 | | |
Series 2013-194 Class AB
05/16/38 | | | 2.250 | % | | | 1,659,776 | | | | 1,669,254 | | |
Series 2013-2 Class AB
12/16/42 | | | 1.600 | % | | | 1,085,147 | | | | 1,081,970 | | |
Series 2013-30 Class A
05/16/42 | | | 1.500 | % | | | 2,637,799 | | | | 2,619,527 | | |
Series 2013-32 Class AB
01/16/42 | | | 1.900 | % | | | 2,518,113 | | | | 2,501,990 | | |
Series 2013-33 Class A
07/16/38 | | | 1.061 | % | | | 3,828,782 | | | | 3,725,082 | | |
Series 2013-40 Class A
10/16/41 | | | 1.511 | % | | | 1,567,183 | | | | 1,548,261 | | |
Series 2013-50 Class AH
06/16/39 | | | 2.100 | % | | | 1,640,934 | | | | 1,640,860 | | |
Series 2013-57 Class A
06/16/37 | | | 1.350 | % | | | 4,356,012 | | | | 4,306,404 | | |
Series 2013-61 Class A
01/16/43 | | | 1.450 | % | | | 1,981,319 | | | | 1,948,095 | | |
Series 2013-73 Class AE
01/16/39 | | | 1.350 | % | | | 6,517,301 | | | | 6,464,397 | | |
Series 2013-78 Class AB
07/16/39 | | | 1.624 | % | | | 1,776,368 | | | | 1,772,162 | | |
Series 2014-103 Class AB
06/16/53 | | | 1.742 | % | | | 2,603,723 | | | | 2,659,846 | | |
Series 2014-109 Class A
01/16/46 | | | 2.325 | % | | | 5,105,628 | | | | 5,146,331 | | |
The accompanying Notes to Financial Statements are an integral part of this statement.
Annual Report 2016
23
PORTFOLIO OF INVESTMENTS (continued)
August 31, 2016
Commercial Mortgage-Backed Securities —
Agency (continued)
Issuer | | Coupon
Rate | | Principal
Amount ($) | | Value ($) | |
Series 2014-135 Class AD
08/16/45 | | | 2.400 | % | | | 3,767,581 | | | | 3,783,067 | | |
Series 2014-138 Class A
01/16/44 | | | 2.700 | % | | | 1,976,136 | | | | 2,007,204 | | |
Series 2014-148 Class A
11/16/43 | | | 2.650 | % | | | 2,893,133 | | | | 2,947,250 | | |
Series 2014-169 Class A
11/16/42 | | | 2.600 | % | | | 2,678,246 | | | | 2,712,733 | | |
Series 2014-24 Class BA
07/16/38 | | | 2.100 | % | | | 3,112,506 | | | | 3,122,091 | | |
Series 2014-33 Class A
08/16/39 | | | 2.300 | % | | | 1,265,133 | | | | 1,271,882 | | |
Series 2014-64 Class A
02/16/45 | | | 2.200 | % | | | 2,585,646 | | | | 2,601,596 | | |
Series 2014-67 Class AE
05/16/39 | | | 2.150 | % | | | 1,118,049 | | | | 1,140,245 | | |
Series 2015-109 Class A
02/16/40 | | | 2.528 | % | | | 7,953,043 | | | | 8,044,915 | | |
Series 2015-21 Class A
11/16/42 | | | 2.600 | % | | | 4,947,108 | | | | 5,024,681 | | |
Series 2015-33 Class AH
02/16/45 | | | 2.650 | % | | | 1,176,799 | | | | 1,193,712 | | |
Series 2015-5 Class KA
11/16/39 | | | 2.500 | % | | | 5,003,829 | | | | 5,068,404 | | |
Series 2015-78 Class A
06/16/40 | | | 2.918 | % | | | 5,269,736 | | | | 5,372,127 | | |
Series 2015-85 Class AF
05/16/44 | | | 2.400 | % | | | 5,840,982 | | | | 5,892,278 | | |
Series 2015-98 Class AE
04/16/41 | | | 2.100 | % | | | 3,043,289 | | | | 3,056,789 | | |
Series 2016-39 Class AG
01/16/43 | | | 2.300 | % | | | 7,652,542 | | | | 7,705,999 | | |
Government National Mortgage Association(c)
CMO Series 2015-71 Class DA
09/16/49 | | | 2.169 | % | | | 8,871,536 | | | | 8,899,604 | | |
Total Commercial Mortgage-Backed
Securities — Agency
(Cost: $144,200,654) | | | | | | | 143,486,792 | | |
Commercial Mortgage-Backed Securities —
Non-Agency 2.4%
American Homes 4 Rent Trust(b)
Series 2014-SFR2 Class A
10/17/36 | | | 3.786 | % | | | 2,940,512 | | | | 3,178,905 | | |
Series 2014-SFR3 Class A
12/17/36 | | | 3.678 | % | | | 3,451,624 | | | | 3,712,990 | | |
Series 2015-SFR2 Class A
10/17/45 | | | 3.732 | % | | | 2,685,989 | | | | 2,906,784 | | |
American Homes 4 Rent
Series 2015-SFR1 Class A(b)
04/17/52 | | | 3.467 | % | | | 3,585,680 | | | | 3,808,688 | | |
Commercial Mortgage-Backed Securities —
Non-Agency (continued)
Issuer | | Coupon
Rate | | Principal
Amount ($) | | Value ($) | |
Americold 2010 LLC Trust
Series 2010-ARTA Class A1(b)
01/14/29 | | | 3.847 | % | | | 226,333 | | | | 236,716 | | |
Bear Stearns Commercial Mortgage Securities Trust
Series 2006-PW14 Class A4
12/11/38 | | | 5.201 | % | | | 5,130,559 | | | | 5,140,131 | | |
Series 2006-T24 Class A4
10/12/41 | | | 5.537 | % | | | 33,774 | | | | 33,746 | | |
Series 2007-T26 Class A4
01/12/45 | | | 5.471 | % | | | 5,444,026 | | | | 5,494,873 | | |
Series 2007-T28 Class A4
09/11/42 | | | 5.742 | % | | | 556,066 | | | | 573,514 | | |
Bear Stearns Commercial Mortgage Securities Trust(c)
Series 2007-PW17 Class A4
06/11/50 | | | 5.694 | % | | | 5,050,545 | | | | 5,207,894 | | |
CD Mortgage Trust
Series 2007-CD5 Class A4
11/15/44 | | | 5.886 | % | | | 5,732,816 | | | | 5,895,677 | | |
CFCRE Commercial Mortgage Trust
Series 2016-C4 Class A1
05/10/58 | | | 1.501 | % | | | 3,221,531 | | | | 3,219,911 | | |
CGGS Commercial Mortgage Trust
Series 2016-RNDA Class AFX(b)
02/10/33 | | | 2.757 | % | | | 11,200,000 | | | | 11,372,587 | | |
COBALT CMBS Commercial Mortgage Trust(c)
Series 2007-C2 Class A3
04/15/47 | | | 5.484 | % | | | 8,378,168 | | | | 8,478,802 | | |
Series 2007-C3 Class A4
05/15/46 | | | 5.958 | % | | | 4,406,353 | | | | 4,506,002 | | |
CSAIL Commercial Mortgage Trust
Series 2016-C5 Class A1
11/15/48 | | | 1.747 | % | | | 3,217,241 | | | | 3,231,800 | | |
Citigroup Commercial Mortgage Trust
Series 2006-C5 Class A4
10/15/49 | | | 5.431 | % | | | 482,660 | | | | 482,090 | | |
Citigroup/Deutsche Bank Commercial Mortgage Trust
Series 2007-CD4 Class A4
12/11/49 | | | 5.322 | % | | | 5,717,327 | | | | 5,748,907 | | |
Colony Multifamily Mortgage Trust
Series 2014-1 Class A(b)
04/20/50 | | | 2.543 | % | | | 4,749,344 | | | | 4,723,728 | | |
Commercial Mortgage Trust
Series 2006-C8 Class A1A
12/10/46 | | | 5.292 | % | | | 1,291,025 | | | | 1,299,297 | | |
DBUBS Mortgage Trust
Series 2011-LC1A Class A3(b)
11/10/46 | | | 5.002 | % | | | 150,000 | | | | 165,924 | | |
GS Mortgage Securities Trust
Series 2006-GG8 Class A4
11/10/39 | | | 5.560 | % | | | 78,357 | | | | 78,309 | | |
The accompanying Notes to Financial Statements are an integral part of this statement.
Annual Report 2016
24
PORTFOLIO OF INVESTMENTS (continued)
August 31, 2016
Commercial Mortgage-Backed Securities —
Non-Agency (continued)
Issuer | | Coupon
Rate | | Principal
Amount ($) | | Value ($) | |
General Electric Capital Assurance Co.
Series 2003-1 Class A5(b)
05/12/35 | | | 5.743 | % | | | 155,723 | | | | 167,621 | | |
Greenwich Capital Commercial Funding Corp.
Series 2007-GG11 Class A1A
12/10/49 | | | 5.704 | % | | | 4,991,087 | | | | 5,114,785 | | |
JPMorgan Chase Commercial Mortgage Securities Trust
Series 2007-CB18 Class A4
06/12/47 | | | 5.440 | % | | | 2,781,535 | | | | 2,801,757 | | |
JPMorgan Chase Commercial Mortgage Securities Trust(b)
Series 2009-IWST Class A2
12/05/27 | | | 5.633 | % | | | 300,000 | | | | 330,362 | | |
Series 2010-CNTR Class A2
08/05/32 | | | 4.311 | % | | | 450,000 | | | | 480,169 | | |
Series 2011-C3 Class A4
02/15/46 | | | 4.717 | % | | | 450,000 | | | | 498,012 | | |
LB-UBS Commercial Mortgage Trust
Series 2007-C2 Class A3
02/15/40 | | | 5.430 | % | | | 5,934,572 | | | | 5,994,157 | | |
Series 2007-C7 Class A3
09/15/45 | | | 5.866 | % | | | 3,701,932 | | | | 3,843,850 | | |
Morgan Stanley Capital I Trust
Series 2007-HQ11 Class A4
02/12/44 | | | 5.447 | % | | | 3,451,284 | | | | 3,467,403 | | |
Series 2007-IQ13 Class A1A
03/15/44 | | | 5.312 | % | | | 3,714,473 | | | | 3,748,327 | | |
Series 2007-IQ13 Class A4
03/15/44 | | | 5.364 | % | | | 3,907,214 | | | | 3,950,534 | | |
Morgan Stanley Capital I Trust(b)
Series 2011-C1 Class A4
09/15/47 | | | 5.033 | % | | | 300,000 | | | | 334,956 | | |
Morgan Stanley Capital I Trust(c)
Series 2007-T27 Class A1A
06/11/42 | | | 5.818 | % | | | 3,312,880 | | | | 3,396,526 | | |
Series 2007-T27 Class A4
06/11/42 | | | 5.818 | % | | | 7,788,447 | | | | 7,982,091 | | |
Morgan Stanley Re-Remic Trust(b)(c)
Series 2009-GG10 Class A4A
08/12/45 | | | 5.988 | % | | | 1,833,453 | | | | 1,855,323 | | |
Series 2010-GG10 Class A4A
08/15/45 | | | 5.988 | % | | | 4,722,779 | | | | 4,796,312 | | |
Wachovia Bank Commercial Mortgage Trust
Series 2006-C26 Class A3
06/15/45 | | | 6.011 | % | | | 81,054 | | | | 81,001 | | |
Series 2006-C29 Class A1A
11/15/48 | | | 5.297 | % | | | 4,883,833 | | | | 4,901,807 | | |
Wachovia Bank Commercial Mortgage Trust(c)
Series 2006-C26 Class A1A
06/15/45 | | | 6.009 | % | | | 198,602 | | | | 198,421 | | |
Total Commercial Mortgage-Backed
Securities — Non-Agency
(Cost: $134,800,499) | | | | | | | 133,440,689 | | |
Asset-Backed Securities — Non-Agency 1.8%
Issuer | | Coupon
Rate | | Principal
Amount ($) | | Value ($) | |
ARI Fleet Lease Trust
Series 2015-A Class A2(b)
11/15/18 | | | 1.110 | % | | | 1,121,403 | | | | 1,119,652 | | |
Ally Master Owner Trust
Series 2012-5 Class A
09/15/19 | | | 1.540 | % | | | 3,810,000 | | | | 3,821,168 | | |
American Credit Acceptance Receivables Trust(b)
Series 2015-2 Class A
06/12/19 | | | 1.570 | % | | | 337,275 | | | | 336,523 | | |
Series 2015-3 Class A
09/12/19 | | | 1.950 | % | | | 2,427,340 | | | | 2,420,544 | | |
Series 2016-1A Class A
05/12/20 | | | 2.370 | % | | | 1,137,442 | | | | 1,135,683 | | |
Series 2016-3 Class A
11/12/20 | | | 1.700 | % | | | 5,200,000 | | | | 5,194,458 | | |
Avis Budget Rental Car Funding AESOP LLC
Series 2016-2A Class A(b)
11/20/22 | | | 2.720 | % | | | 4,100,000 | | | | 4,123,270 | | |
CCG Receivables Trust
Series 2015-1 Class A2(b)
11/14/18 | | | 1.460 | % | | | 6,384,584 | | | | 6,374,937 | | |
California Republic Auto Receivables Trust
Series 2015-1 Class A3
04/15/19 | | | 1.330 | % | | | 1,045,416 | | | | 1,045,504 | | |
California Republic Auto Receivables Trust(b)
Series 2015-4 Class A2
09/17/18 | | | 1.600 | % | | | 639,108 | | | | 640,481 | | |
Subordinated, Series 2012-1 Class B
01/16/18 | | | 1.760 | % | | | 646,960 | | | | 647,173 | | |
CarFinance Capital Auto Trust(b)
Series 2014-1A Class A
12/17/18 | | | 1.460 | % | | | 68,257 | | | | 68,169 | | |
Series 2015-1A Class A
06/15/21 | | | 1.750 | % | | | 953,394 | | | | 948,310 | | |
Chesapeake Funding II LLC(b)
Series 2016-1A Class A1
03/15/28 | | | 2.110 | % | | | 4,574,000 | | | | 4,580,598 | | |
Series 2016-2A Class A1
06/15/28 | | | 1.880 | % | | | 5,850,000 | | | | 5,836,901 | | |
Conn's Receivables Funding LLC
Series 2016-A Class A(b)
04/16/18 | | | 4.680 | % | | | 1,875,129 | | | | 1,874,485 | | |
DT Auto Owner Trust(b)
Series 2015-2A Class A
09/17/18 | | | 1.240 | % | | | 329,846 | | | | 329,827 | | |
Series 2015-3A Class A
03/15/19 | | | 1.660 | % | | | 1,170,776 | | | | 1,170,693 | | |
Series 2016-1A Class A
09/16/19 | | | 2.000 | % | | | 2,991,731 | | | | 2,990,964 | | |
The accompanying Notes to Financial Statements are an integral part of this statement.
Annual Report 2016
25
PORTFOLIO OF INVESTMENTS (continued)
August 31, 2016
Asset-Backed Securities — Non-Agency (continued)
Issuer | | Coupon
Rate | | Principal
Amount ($) | | Value ($) | |
Diamond Resorts Owner Trust
Series 2013-2 Class A(b)
05/20/26 | | | 2.270 | % | | | 433,275 | | | | 430,546 | | |
Drive Auto Receivables Trust(b)
Series 2015-CA Class A3
10/15/18 | | | 1.380 | % | | | 172,856 | | | | 172,853 | | |
Series 2015-DA Class A3
12/17/18 | | | 1.590 | % | | | 1,100,000 | | | | 1,100,020 | | |
Exeter Automobile Receivables Trust(b)
Series 2014-2A Class A
08/15/18 | | | 1.060 | % | | | 7,168 | | | | 7,167 | | |
Series 2014-3A Class A
01/15/19 | | | 1.320 | % | | | 183,727 | | | | 183,372 | | |
Series 2015-1A Class A
06/17/19 | | | 1.600 | % | | | 916,304 | | | | 916,853 | | |
Series 2015-2A Class A
11/15/19 | | | 1.540 | % | | | 1,638,578 | | | | 1,632,272 | | |
Series 2015-3A Class A
03/16/20 | | | 2.000 | % | | | 2,867,730 | | | | 2,855,331 | | |
Series 2016-1A Class A
07/15/20 | | | 2.350 | % | | | 2,864,010 | | | | 2,857,162 | | |
First Investors Auto Owner Trust
Series 2014-3A Class A2(b)
11/15/18 | | | 1.060 | % | | | 50,963 | | | | 50,958 | | |
Hertz Fleet Lease Funding LP
Series 2014-1 Class A(b)(c)
04/10/28 | | | 0.912 | % | | | 913,366 | | | | 913,710 | | |
Hertz Vehicle Financing LLC
Series 2016-3A Class A(b)
07/25/20 | | | 2.270 | % | | | 5,175,000 | | | | 5,177,483 | | |
Hilton Grand Vacations Trust(b)
Series 2013-A Class A
01/25/26 | | | 2.280 | % | | | 872,694 | | | | 874,203 | | |
Series 2014-AA Class A
11/25/26 | | | 1.770 | % | | | 1,443,208 | | | | 1,427,153 | | |
KeyCorp Student Loan Trust
Series 1999-A Class A2(c)
12/27/29 | | | 0.970 | % | | | 28,405 | | | | 28,305 | | |
Kubota Credit Owner Trust
Series 2016-1A Class A3(b)
07/15/20 | | | 1.500 | % | | | 3,525,000 | | | | 3,520,336 | | |
MVW Owner Trust(b)
Series 2015-1A Class A
12/20/32 | | | 2.520 | % | | | 3,466,546 | | | | 3,466,752 | | |
Series 2016-1A Class A
12/20/33 | | | 2.250 | % | | | 5,150,000 | | | | 5,133,919 | | |
Navient Private Education Loan Trust
Series 2015-AA Class A1(b)(c)
12/15/21 | | | 1.008 | % | | | 242,817 | | | | 242,624 | | |
New York City Tax Lien Trust
Series 2016-A Class A(b)
11/10/29 | | | 1.470 | % | | | 3,325,000 | | | | 3,325,000 | | |
Asset-Backed Securities — Non-Agency (continued)
Issuer | | Coupon
Rate | | Principal
Amount ($) | | Value ($) | |
OneMain Direct Auto Receivables Trust
Series 2016-1A Class A(b)
01/15/21 | | | 2.040 | % | | | 2,029,381 | | | | 2,025,820 | | |
PFS Tax Lien Trust
Series 2014-1 Class NOTE(b)
05/15/29 | | | 1.440 | % | | | 323,517 | | | | 321,616 | | |
Prestige Auto Receivables Trust
Series 2015-1 Class A2(b)
02/15/19 | | | 1.090 | % | | | 276,416 | | | | 276,320 | | |
SLM Private Credit Student Loan Trust
Series 2004-B Class A2(c)
06/15/21 | | | 0.853 | % | | | 214,608 | | | | 214,065 | | |
SLM Private Education Loan Trust(b)
Series 2012-A Class A2
01/17/45 | | | 3.830 | % | | | 5,420,000 | | | | 5,603,098 | | |
SLM Private Education Loan Trust(b)(c)
Series 2014-A Class A1
07/15/22 | | | 1.108 | % | | | 586,935 | | | | 586,527 | | |
SMART ABS Trust
Series 2015-1US Class A3A
09/14/18 | | | 1.500 | % | | | 2,035,000 | | | | 2,031,524 | | |
SMB Private Education Loan Trust
Series 2015-B Class A1(b)(c)
02/15/23 | | | 1.208 | % | | | 572,154 | | | | 572,247 | | |
TAL Advantage V LLC
Series 2014-2A Class A1(b)
05/20/39 | | | 1.700 | % | | | 766,270 | | | | 755,368 | | |
TCF Auto Receivables Owner Trust(b)
Series 2015-1A Class A2
08/15/18 | | | 1.020 | % | | | 389,788 | | | | 389,676 | | |
Series 2015-2A Class A2
01/15/19 | | | 1.640 | % | | | 2,366,914 | | | | 2,364,847 | | |
Verizon Owner Trust
Series 2016-1A Class A(b)
01/20/21 | | | 1.420 | % | | | 3,200,000 | | | | 3,199,954 | | |
Westlake Automobile Receivables Trust
Series 2015-1A Class A2(b)
03/15/18 | | | 1.170 | % | | | 632,817 | | | | 632,588 | | |
Total Asset-Backed Securities — Non-Agency
(Cost: $98,030,041) | | | | | | | 97,949,009 | | |
Inflation-Indexed Bonds 0.6%
UNITED STATES 0.6% | |
U.S. Treasury Inflation-Indexed Bond
04/15/19 | | | 0.125 | % | | | 34,949,063 | | | | 35,258,432 | | |
Total Inflation-Indexed Bonds
(Cost: $34,970,994) | | | | | | | 35,258,432 | | |
The accompanying Notes to Financial Statements are an integral part of this statement.
Annual Report 2016
26
PORTFOLIO OF INVESTMENTS (continued)
August 31, 2016
U.S. Treasury Obligations 2.6%
Issuer | | Coupon
Rate | | Principal
Amount ($) | | Value ($) | |
U.S. Treasury
02/15/45 | | | 2.500 | % | | | 76,225,000 | | | | 80,500,765 | | |
08/15/40 | | | 3.875 | % | | | 46,925,000 | | | | 62,397,440 | | |
Total U.S. Treasury Obligations
(Cost: $142,249,353) | | | | | | | 142,898,205 | | |
U.S. Government & Agency Obligations 0.3%
Federal Farm Credit Banks(c)
10/22/18 | | | 0.577 | % | | | 12,065,000 | | | | 12,044,116 | | |
05/25/18 | | | 0.614 | % | | | 5,400,000 | | | | 5,396,668 | | |
Total U.S. Government & Agency Obligations
(Cost: $17,437,806) | | | | | | | 17,440,784 | | |
Foreign Government Obligations 0.3%
CANADA 0.3% | |
Province of Nova Scotia
01/26/17 | | | 5.125 | % | | | 4,000,000 | | | | 4,064,384 | | |
Province of Ontario
02/14/18 | | | 1.200 | % | | | 7,160,000 | | | | 7,172,150 | | |
Province of Quebec
05/14/18 | | | 4.625 | % | | | 7,000,000 | | | | 7,416,080 | | |
Total | | | | | | | 18,652,614 | | |
Total Foreign Government Obligations
(Cost: $18,525,939) | | | | | | | 18,652,614 | | |
Municipal Bonds 0.1%
Issue
Description | | Coupon
Rate | | Principal
Amount ($) | | Value ($) | |
ILLINOIS 0.1% | |
State of Illinois
Unlimited General Obligation Bonds
Taxable
Series 2011
03/01/17 | | | 5.365 | % | | | 6,000,000 | | | | 6,114,180 | | |
Total Municipal Bonds
(Cost: $6,099,243) | | | | | | | 6,114,180 | | |
Senior Loans —%
Borrower | | Weighted
Average
Coupon | | Principal
Amount ($) | | Value ($) | |
CHEMICALS —% | |
PQ Corp.
Tranche B1 Term Loan(c)(h)
11/04/22 | | | 5.750 | % | | | 34,892 | | | | 35,104 | | |
DIVERSIFIED MANUFACTURING —% | |
Accudyne Industries Borrower SCA/LLC
Term Loan(c)(h)
12/13/19 | | | 4.000 | % | | | 170,000 | | | | 151,215 | | |
Manitowoc Foodservice, Inc.
Tranche B Term Loan(c)(h)
03/03/23 | | | 5.750 | % | | | 58,185 | | | | 58,815 | | |
Total | | | | | | | 210,030 | | |
ELECTRIC —% | |
Dynegy, Inc.
Term Loan(c)(h)
06/27/23 | | | 5.000 | % | | | 248,000 | | | | 248,040 | | |
INDEPENDENT ENERGY —% | |
Chesapeake Energy Corp.
Tranche A Term Loan(c)(e)(h)
08/17/21 | | | 8.500 | % | | | 186,172 | | | | 191,990 | | |
LEISURE —% | |
UFC Holdings LLC(c)(e)(h)
1st Lien Term Loan
08/18/23 | | | 5.000 | % | | | 52,000 | | | | 52,104 | | |
2nd Lien Term Loan
08/18/24 | | | 8.500 | % | | | 16,000 | | | | 16,095 | | |
Total | | | | | | | 68,199 | | |
PHARMACEUTICALS —% | |
Concordia International Corp.
Term Loan(c)(h)
10/21/21 | | | 5.250 | % | | | 65,670 | | | | 62,089 | | |
RETAILERS —% | |
Rite Aid Corp.
Tranche 1 2nd Lien Term Loan(c)(h)
08/21/20 | | | 5.750 | % | | | 50,000 | | | | 50,109 | | |
Total Senior Loans
(Cost: $860,197) | | | | | | | 865,561 | | |
The accompanying Notes to Financial Statements are an integral part of this statement.
Annual Report 2016
27
PORTFOLIO OF INVESTMENTS (continued)
August 31, 2016
Money Market Funds 7.0%
| | | Shares | | Value ($) | |
Columbia Short-Term Cash Fund,
0.415%(i)(j) | | | 393,937,921 | | | | 393,937,921 | | |
Total Money Market Funds
(Cost: $393,937,921) | | | | | 393,937,921 | | |
Total Investments
(Cost: $4,981,640,525) | | | | | 5,596,683,461 | | |
Other Assets & Liabilities, Net | | | | | 18,449,249 | | |
Net Assets | | | | | 5,615,132,710 | | |
At August 31, 2016, securities totaling $583,651 were pledged as collateral.
Investments in Derivatives
Futures Contracts Outstanding at August 31, 2016
Long Futures Contracts Outstanding
| Contract Description | | Number of
Contracts | | Trading
Currency | | Notional
Market
Value ($) | | Expiration
Date | | Unrealized
Appreciation ($) | | Unrealized
(Depreciation) ($) | |
U.S. Treasury 5-Year Note | | | 575 | | | USD | | | 69,718,750 | | | 12/2016 | | | — | | | | (144,843 | ) | |
Notes to Portfolio of Investments
(a) Non-income producing investment.
(b) Represents privately placed and other securities and instruments exempt from SEC registration (collectively, private placements), such as Section 4(a)(2) and Rule 144A eligible securities, which are often sold only to qualified institutional buyers. The Fund may invest in private placements determined to be liquid as well as those determined to be illiquid. Private placements may be determined to be liquid under guidelines established by the Fund's Board of Trustees. At August 31, 2016, the value of these securities amounted to $279,426,632 or 4.98% of net assets.
(c) Variable rate security.
(d) Represents securities that have defaulted on payment of interest. The Fund has stopped accruing interest on these securities. At August 31, 2016, the value of these securities amounted to $10,250, which represents less than 0.01% of net assets.
(e) Security, or a portion thereof, has been purchased on a when-issued or delayed delivery basis.
(f) This security or a portion of this security has been pledged as collateral in connection with derivative contracts.
(g) Represents fair value as determined in good faith under procedures approved by the Board of Trustees. At August 31, 2016, the value of these securities amounted to $2,121, which represents less than 0.01% of net assets.
(h) Senior loans have interest rates that float periodically based primarily on the London Interbank Offered Rate ("LIBOR") and other short-term rates. The interest rate shown reflects the weighted average coupon as of August 31, 2016. The interest rate shown for senior loans purchased on a when-issued or delayed delivery basis, if any, reflects an estimated average coupon. Remaining maturities of senior loans may be less than the stated maturities shown as a result of contractual or optional prepayments by the borrower. Such prepayments cannot be predicted.
(i) The rate shown is the seven-day current annualized yield at August 31, 2016.
The accompanying Notes to Financial Statements are an integral part of this statement.
Annual Report 2016
28
PORTFOLIO OF INVESTMENTS (continued)
August 31, 2016
Notes to Portfolio of Investments (continued)
(j) As defined in the Investment Company Act of 1940, an affiliated company is one in which the Fund owns 5% or more of the company's outstanding voting securities, or a company which is under common ownership or control with the Fund. Holdings and transactions in these affiliated companies during the year ended August 31, 2016 are as follows:
Issuer | | Beginning
Cost ($) | | Purchase
Cost ($) | | Proceeds
From Sales ($) | | Ending
Cost ($) | | Dividends —
Affiliated
Issuers ($) | | Value ($) | |
Columbia Short-Term Cash Fund | | | 266,135,925 | | | | 1,877,282,281 | | | | (1,749,480,285 | ) | | | 393,937,921 | | | | 1,094,495 | | | | 393,937,921 | | |
Abbreviation Legend
ADR American Depositary Receipt
CMO Collateralized Mortgage Obligation
PIK Payment-in-Kind
Currency Legend
USD US Dollar
Fair Value Measurements
The Fund categorizes its fair value measurements according to a three-level hierarchy that maximizes the use of observable inputs and minimizes the use of unobservable inputs by prioritizing that the most observable input be used when available. Observable inputs are those that market participants would use in pricing an investment based on market data obtained from sources independent of the reporting entity. Unobservable inputs are those that reflect the Fund's assumptions about the information market participants would use in pricing an investment. An investment's level within the fair value hierarchy is based on the lowest level of any input that is deemed significant to the asset's or liability's fair value measurement. The input levels are not necessarily an indication of the risk or liquidity associated with investments at that level. For example, certain U.S. government securities are generally high quality and liquid, however, they are reflected as Level 2 because the inputs used to determine fair value may not always be quoted prices in an active market.
Fair value inputs are summarized in the three broad levels listed below:
> Level 1 — Valuations based on quoted prices for investments in active markets that the Fund has the ability to access at the measurement date (including NAV for open-end mutual funds). Valuation adjustments are not applied to Level 1 investments.
> Level 2 — Valuations based on other significant observable inputs (including quoted prices for similar securities, interest rates, prepayment speeds, credit risks, etc.).
> Level 3 — Valuations based on significant unobservable inputs (including the Fund's own assumptions and judgment in determining the fair value of investments).
Inputs that are used in determining fair value of an investment may include price information, credit data, volatility statistics, and other factors. These inputs can be either observable or unobservable. The availability of observable inputs can vary between investments, and is affected by various factors such as the type of investment, and the volume and level of activity for that investment or similar investments in the marketplace. The inputs will be considered by the Investment Manager, along with any other relevant factors in the calculation of an investment's fair value. The Fund uses prices and inputs that are current as of the measurement date, which may include periods of market dislocations. During these periods, the availability of prices and inputs may be reduced for many investments. This condition could cause an investment to be reclassified between the various levels within the hierarchy.
Certain investments that have been measured at fair value using the net asset value per share (or its equivalent) are not categorized in the fair value hierarchy. The fair value amounts presented in the table are intended to reconcile the fair value hierarchy to the amounts presented in the Portfolio of Investments. The Columbia Short-Term Cash Fund seeks to provide shareholders with maximum current income consistent with liquidity and stability of principal. Investments in Columbia Short-Term Cash Fund may be redeemed on a daily basis without restriction.
Investments falling into the Level 3 category are primarily supported by quoted prices from brokers and dealers participating in the market for those investments. However, these may be classified as Level 3 investments due to lack of market transparency and corroboration to support these quoted prices. Additionally, valuation models may be used as the pricing source for any remaining investments classified as Level 3. These models may rely on one or more significant unobservable inputs and/or significant assumptions by the Investment Manager. Inputs used in valuations may include, but are not limited to, financial statement analysis, capital account balances, discount rates and estimated cash flows, and comparable company data.
Under the direction of the Fund's Board of Trustees (the Board), the Investment Manager's Valuation Committee (the Committee) is responsible for overseeing the valuation procedures approved by the Board. The Committee consists of voting and non-voting members from
The accompanying Notes to Financial Statements are an integral part of this statement.
Annual Report 2016
29
PORTFOLIO OF INVESTMENTS (continued)
August 31, 2016
Fair Value Measurements (continued)
various groups within the Investment Manager's organization, including operations and accounting, trading and investments, compliance, risk management and legal.
The Committee meets at least monthly to review and approve valuation matters, which may include a description of specific valuation determinations, data regarding pricing information received from approved pricing vendors and brokers and the results of Board-approved valuation control policies and procedures (the Policies). The Policies address, among other things, instances when market quotations are or are not readily available, including recommendations of third party pricing vendors and a determination of appropriate pricing methodologies; events that require specific valuation determinations and assessment of fair value techniques; securities with a potential for stale pricing, including those that are illiquid, restricted, or in default; and the effectiveness of third party pricing vendors, including periodic reviews of vendors. The Committee meets more frequently, as needed, to discuss additional valuation matters, which may include the need to review back-testing results, review time-sensitive information or approve related valuation actions. The Committee reports to the Board, with members of the Committee meeting with the Board at each of its regularly scheduled meetings to discuss valuation matters and actions during the period, similar to those described earlier.
For investments categorized as Level 3, the Committee monitors information similar to that described above, which may include: (i) data specific to the issuer or comparable issuers, (ii) general market or specific sector news and (iii) quoted prices and specific or similar security transactions. The Committee considers this data and any changes from prior periods in order to assess the reasonableness of observable and unobservable inputs, any assumptions or internal models used to value those securities and changes in fair value. This data is also used to corroborate, when available, information received from approved pricing vendors and brokers. Various factors impact the frequency of monitoring this information (which may occur as often as daily). However, the Committee may determine that changes to inputs, assumptions and models are not required as a result of the monitoring procedures performed.
The following table is a summary of the inputs used to value the Fund's investments at August 31, 2016:
| | | Level 1
Quoted Prices in Active
Markets for Identical
Assets ($) | | Level 2
Other Significant
Observable Inputs ($) | | Level 3
Significant
Unobservable Inputs ($) | | Total ($) | |
Investments | |
Common Stocks | |
Consumer Discretionary | | | 465,461,921 | | | | — | | | | — | | | | 465,461,921 | | |
Consumer Staples | | | 253,507,616 | | | | — | | | | — | | | | 253,507,616 | | |
Energy | | | 254,528,160 | | | | — | | | | — | | | | 254,528,160 | | |
Financials | | | 688,646,715 | | | | — | | | | — | | | | 688,646,715 | | |
Health Care | | | 565,706,821 | | | | — | | | | — | | | | 565,706,821 | | |
Industrials | | | 273,086,431 | | | | — | | | | — | | | | 273,086,431 | | |
Information Technology | | | 726,983,646 | | | | — | | | | — | | | | 726,983,646 | | |
Materials | | | 20,755,252 | | | | — | | | | — | | | | 20,755,252 | | |
Telecommunication Services | | | 106,158,417 | | | | — | | | | — | | | | 106,158,417 | | |
Utilities | | | 38,536,736 | | | | — | | | | — | | | | 38,536,736 | | |
Total Common Stocks | | | 3,393,371,715 | | | | — | | | | — | | | | 3,393,371,715 | | |
Corporate Bonds & Notes | | | — | | | | 668,909,277 | | | | — | | | | 668,909,277 | | |
Residential Mortgage-Backed
Securities — Agency | | | — | | | | 492,191,946 | | | | — | | | | 492,191,946 | | |
Residential Mortgage-Backed
Securities — Non-Agency | | | — | | | | 50,117,370 | | | | 2,048,966 | | | | 52,166,336 | | |
Commercial Mortgage-Backed
Securities — Agency | | | — | | | | 143,486,792 | | | | — | | | | 143,486,792 | | |
Commercial Mortgage-Backed
Securities — Non-Agency | | | — | | | | 133,440,689 | | | | — | | | | 133,440,689 | | |
Asset-Backed Securities — Non-Agency | | | — | | | | 97,949,009 | | | | — | | | | 97,949,009 | | |
Inflation-Indexed Bonds | | | — | | | | 35,258,432 | | | | — | | | | 35,258,432 | | |
The accompanying Notes to Financial Statements are an integral part of this statement.
Annual Report 2016
30
PORTFOLIO OF INVESTMENTS (continued)
August 31, 2016
Fair Value Measurements (continued)
| | | Level 1
Quoted Prices in Active
Markets for Identical
Assets ($) | | Level 2
Other Significant
Observable Inputs ($) | | Level 3
Significant
Unobservable Inputs ($) | | Total ($) | |
U.S. Treasury Obligations | | | 142,898,205 | | | | — | | | | — | | | | 142,898,205 | | |
U.S. Government & Agency Obligations | | | — | | | | 17,440,784 | | | | — | | | | 17,440,784 | | |
Foreign Government Obligations | | | — | | | | 18,652,614 | | | | — | | | | 18,652,614 | | |
Municipal Bonds | | | — | | | | 6,114,180 | | | | — | | | | 6,114,180 | | |
Senior Loans | | | — | | | | 865,561 | | | | — | | | | 865,561 | | |
Investments measured at net asset value | |
Money Market Funds | | | — | | | | — | | | | — | | | | 393,937,921 | | |
Total Investments | | | 3,536,269,920 | | | | 1,664,426,654 | | | | 2,048,966 | | | | 5,596,683,461 | | |
Derivatives | |
Liabilities | |
Futures Contracts | | | (144,843 | ) | | | — | | | | — | | | | (144,843 | ) | |
Total | | | 3,536,125,077 | | | | 1,664,426,654 | | | | 2,048,966 | | | | 5,596,538,618 | | |
See the Portfolio of Investments for all investment classifications not indicated in the table.
The Fund's assets assigned to the Level 2 input category are generally valued using the market approach, in which a security's value is determined through reference to prices and information from market transactions for similar or identical assets.
Derivative instruments are valued at unrealized appreciation (depreciation).
There were no transfers of financial assets between levels during the period.
The Fund does not hold any significant investments (greater than one percent of net assets) categorized as Level 3.
The Fund's assets assigned to the Level 3 category are valued utilizing the valuation technique deemed the most appropriate in the circumstances. Certain residential mortgage-backed securities classified as Level 3 securities are valued using the market approach. To determine fair value for these securities, management considered various factors which may have included, but were not limited to, estimated cash flows of the securities, discount rates observed in the market for similar assets as well as observed yields on securities management deemed comparable. Significant increases (decreases) to any of these inputs would result in a significantly lower (higher) fair value measurement. Generally, a change in observable yields on comparable securities would result in a directionally similar change to discount rates.
The accompanying Notes to Financial Statements are an integral part of this statement.
Annual Report 2016
31
STATEMENT OF ASSETS AND LIABILITIES
August 31, 2016
Assets | |
Investments, at value | |
Unaffiliated issuers (identified cost $4,587,702,604) | | $ | 5,202,745,540 | | |
Affiliated issuers (identified cost $393,937,921) | | | 393,937,921 | | |
Total investments (identified cost $4,981,640,525) | | | 5,596,683,461 | | |
Cash | | | 409,668 | | |
Receivable for: | |
Investments sold | | | 24,800,414 | | |
Capital shares sold | | | 25,934,062 | | |
Dividends | | | 6,680,083 | | |
Interest | | | 9,695,809 | | |
Foreign tax reclaims | | | 54,040 | | |
Variation margin | | | 8,984 | | |
Prepaid expenses | | | 45,920 | | |
Trustees' deferred compensation plan | | | 74,448 | | |
Other assets | | | 3,553 | | |
Total assets | | | 5,664,390,442 | | |
Liabilities | |
Payable for: | |
Investments purchased | | | 18,500,918 | | |
Investments purchased on a delayed delivery basis | | | 23,580,014 | | |
Capital shares purchased | | | 6,081,321 | | |
Management services fees | | | 90,085 | | |
Distribution and/or service fees | | | 55,990 | | |
Transfer agent fees | | | 647,359 | | |
Plan administration fees | | | 5,524 | | |
Compensation of board members | | | 350 | | |
Chief compliance officer expenses | | | 380 | | |
Other expenses | | | 221,343 | | |
Trustees' deferred compensation plan | | | 74,448 | | |
Total liabilities | | | 49,257,732 | | |
Net assets applicable to outstanding capital stock | | $ | 5,615,132,710 | | |
Represented by | |
Paid-in capital | | $ | 5,002,150,107 | | |
Undistributed net investment income | | | 13,514,962 | | |
Accumulated net realized loss | | | (15,430,452 | ) | |
Unrealized appreciation (depreciation) on: | |
Investments | | | 615,042,936 | | |
Futures contracts | | | (144,843 | ) | |
Total — representing net assets applicable to outstanding capital stock | | $ | 5,615,132,710 | | |
The accompanying Notes to Financial Statements are an integral part of this statement.
Annual Report 2016
32
STATEMENT OF ASSETS AND LIABILITIES (continued)
August 31, 2016
Class A | |
Net assets | | $ | 2,960,832,117 | | |
Shares outstanding | | | 78,873,210 | | |
Net asset value per share | | $ | 37.54 | | |
Maximum offering price per share(a) | | $ | 39.83 | | |
Class B | |
Net assets | | $ | 6,374,219 | | |
Shares outstanding | | | 170,458 | | |
Net asset value per share | | $ | 37.39 | | |
Class C | |
Net assets | | $ | 1,265,078,770 | | |
Shares outstanding | | | 33,811,710 | | |
Net asset value per share | | $ | 37.42 | | |
Class K | |
Net assets | | $ | 23,493,949 | | |
Shares outstanding | | | 626,838 | | |
Net asset value per share | | $ | 37.48 | | |
Class R | |
Net assets | | $ | 79,917,458 | | |
Shares outstanding | | | 2,129,144 | | |
Net asset value per share | | $ | 37.54 | | |
Class R4 | |
Net assets | | $ | 112,108,430 | | |
Shares outstanding | | | 2,964,605 | | |
Net asset value per share | | $ | 37.82 | | |
Class R5 | |
Net assets | | $ | 181,220,627 | | |
Shares outstanding | | | 4,830,751 | | |
Net asset value per share | | $ | 37.51 | | |
Class Y | |
Net assets | | $ | 118,552,977 | | |
Shares outstanding | | | 3,133,529 | | |
Net asset value per share | | $ | 37.83 | | |
Class Z | |
Net assets | | $ | 867,554,163 | | |
Shares outstanding | | | 23,146,076 | | |
Net asset value per share | | $ | 37.48 | | |
(a) The maximum offering price per share is calculated by dividing the net asset value per share by 1.0 minus the maximum sales charge of 5.75%.
The accompanying Notes to Financial Statements are an integral part of this statement.
Annual Report 2016
33
STATEMENT OF OPERATIONS
Year Ended August 31, 2016
Net investment income | |
Income: | |
Dividends — unaffiliated issuers | | $ | 49,886,470 | | |
Dividends — affiliated issuers | | | 1,094,495 | | |
Interest | | | 39,898,777 | | |
Foreign taxes withheld | | | (53,981 | ) | |
Total income | | | 90,825,761 | | |
Expenses: | |
Management services fees | | | 26,032,683 | | |
Distribution and/or service fees | |
Class A | | | 6,031,202 | | |
Class B | | | 73,401 | | |
Class C | | | 9,213,426 | | |
Class R | | | 292,874 | | |
Transfer agent fees | |
Class A | | | 3,580,638 | | |
Class B | | | 10,830 | | |
Class C | | | 1,369,900 | | |
Class K | | | 11,458 | | |
Class R | | | 87,147 | | |
Class R4 | | | 100,754 | | |
Class R5 | | | 66,205 | | |
Class Z | | | 953,080 | | |
Plan administration fees | |
Class K | | | 57,343 | | |
Compensation of board members | | | 89,297 | | |
Custodian fees | | | 66,407 | | |
Printing and postage fees | | | 358,670 | | |
Registration fees | | | 433,904 | | |
Audit fees | | | 40,456 | | |
Legal fees | | | 119,862 | | |
Chief compliance officer expenses | | | 2,077 | | |
Other | | | 95,889 | | |
Total expenses | | | 49,087,503 | | |
Expense reductions | | | (2,320 | ) | |
Total net expenses | | | 49,085,183 | | |
Net investment income | | | 41,740,578 | | |
Realized and unrealized gain (loss) — net | |
Net realized gain (loss) on: | |
Investments | | | (3,680,907 | ) | |
Foreign currency translations | | | 2,443 | | |
Futures contracts | | | 1,683,865 | | |
Net realized loss | | | (1,994,599 | ) | |
Net change in unrealized appreciation (depreciation) on: | |
Investments | | | 340,731,280 | | |
Futures contracts | | | (144,843 | ) | |
Net change in unrealized appreciation | | | 340,586,437 | | |
Net realized and unrealized gain | | | 338,591,838 | | |
Net increase in net assets resulting from operations | | $ | 380,332,416 | | |
The accompanying Notes to Financial Statements are an integral part of this statement.
Annual Report 2016
34
STATEMENT OF CHANGES IN NET ASSETS
| | | Year Ended
August 31,
2016 | | Year Ended
August 31,
2015 | |
Operations | |
Net investment income | | $ | 41,740,578 | | | $ | 53,876,473 | | |
Net realized gain (loss) | | | (1,994,599 | ) | | | 79,663,278 | | |
Net change in unrealized appreciation (depreciation) | | | 340,586,437 | | | | (126,045,208 | ) | |
Net increase in net assets resulting from operations | | | 380,332,416 | | | | 7,494,543 | | |
Distributions to shareholders | |
Net investment income | |
Class A | | | (35,023,138 | ) | | | (17,583,657 | ) | |
Class B | | | (69,193 | ) | | | (42,723 | ) | |
Class C | | | (6,204,832 | ) | | | (2,170,594 | ) | |
Class K | | | (383,278 | ) | | | (279,351 | ) | |
Class R | | | (660,979 | ) | | | (235,751 | ) | |
Class R4 | | | (999,615 | ) | | | (405,564 | ) | |
Class R5 | | | (2,390,624 | ) | | | (1,182,676 | ) | |
Class Y | | | (1,525,806 | ) | | | (464,225 | ) | |
Class Z | | | (10,613,315 | ) | | | (5,540,058 | ) | |
Net realized gains | |
Class A | | | (40,972,070 | ) | | | (51,318,940 | ) | |
Class B | | | (153,615 | ) | | | (436,395 | ) | |
Class C | | | (14,622,344 | ) | | | (12,484,969 | ) | |
Class K | | | (420,956 | ) | | | (829,944 | ) | |
Class R | | | (926,491 | ) | | | (829,019 | ) | |
Class R4 | | | (955,301 | ) | | | (869,521 | ) | |
Class R5 | | | (2,361,482 | ) | | | (1,893,151 | ) | |
Class Y | | | (1,330,113 | ) | | | (936,890 | ) | |
Class Z | | | (10,356,825 | ) | | | (13,624,282 | ) | |
Total distributions to shareholders | | | (129,969,977 | ) | | | (111,127,710 | ) | |
Increase in net assets from capital stock activity | | | 2,103,451,935 | | | | 1,222,955,848 | | |
Total increase in net assets | | | 2,353,814,374 | | | | 1,119,322,681 | | |
Net assets at beginning of year | | | 3,261,318,336 | | | | 2,141,995,655 | | |
Net assets at end of year | | $ | 5,615,132,710 | | | $ | 3,261,318,336 | | |
Undistributed net investment income | | $ | 13,514,962 | | | $ | 29,776,070 | | |
The accompanying Notes to Financial Statements are an integral part of this statement.
Annual Report 2016
35
STATEMENT OF CHANGES IN NET ASSETS (continued)
| | | Year Ended August 31, 2016 | | Year Ended August 31, 2015 | |
| | | Shares | | Dollars ($) | | Shares | | Dollars ($) | |
Capital stock activity | |
Class A shares | |
Subscriptions(a) | | | 38,196,367 | | | | 1,373,016,007 | | | | 23,044,574 | | | | 849,143,615 | | |
Distributions reinvested | | | 1,999,566 | | | | 71,224,030 | | | | 1,755,826 | | | | 63,595,896 | | |
Redemptions | | | (13,991,552 | ) | | | (504,067,901 | ) | | | (8,445,175 | ) | | | (310,953,059 | ) | |
Net increase | | | 26,204,381 | | | | 940,172,136 | | | | 16,355,225 | | | | 601,786,452 | | |
Class B shares | |
Subscriptions | | | 59,327 | | | | 2,128,664 | | | | 88,902 | | | | 3,259,026 | | |
Distributions reinvested | | | 5,773 | | | | 204,975 | | | | 12,310 | | | | 443,459 | | |
Redemptions(a) | | | (142,320 | ) | | | (5,077,895 | ) | | | (192,301 | ) | | | (7,050,415 | ) | |
Net decrease | | | (77,220 | ) | | | (2,744,256 | ) | | | (91,089 | ) | | | (3,347,930 | ) | |
Class C shares | |
Subscriptions | | | 19,540,243 | | | | 701,075,793 | | | | 10,211,580 | | | | 375,103,625 | | |
Distributions reinvested | �� | | 532,278 | | | | 18,919,620 | | | | 363,462 | | | | 13,124,747 | | |
Redemptions | | | (3,419,494 | ) | | | (122,654,511 | ) | | | (1,423,591 | ) | | | (52,266,510 | ) | |
Net increase | | | 16,653,027 | | | | 597,340,902 | | | | 9,151,451 | | | | 335,961,862 | | |
Class K shares | |
Subscriptions | | | 68,707 | | | | 2,430,168 | | | | 94,952 | | | | 3,466,998 | | |
Distributions reinvested | | | 22,615 | | | | 803,862 | | | | 30,677 | | | | 1,108,787 | | |
Redemptions | | | (87,211 | ) | | | (3,173,881 | ) | | | (133,353 | ) | | | (4,891,086 | ) | |
Net increase (decrease) | | | 4,111 | | | | 60,149 | | | | (7,724 | ) | | | (315,301 | ) | |
Class R shares | |
Subscriptions | | | 1,439,975 | | | | 51,690,440 | | | | 797,090 | | | | 29,364,631 | | |
Distributions reinvested | | | 26,919 | | | | 959,273 | | | | 21,236 | | | | 768,655 | | |
Redemptions | | | (373,956 | ) | | | (13,470,118 | ) | | | (361,624 | ) | | | (13,361,380 | ) | |
Net increase | | | 1,092,938 | | | | 39,179,595 | | | | 456,702 | | | | 16,771,906 | | |
Class R4 shares | |
Subscriptions | | | 2,526,108 | | | | 92,297,483 | | | | 868,563 | | | | 32,087,299 | | |
Distributions reinvested | | | 51,084 | | | | 1,833,811 | | | | 29,517 | | | | 1,078,665 | | |
Redemptions | | | (680,087 | ) | | | (24,683,149 | ) | | | (249,090 | ) | | | (9,255,556 | ) | |
Net increase | | | 1,897,105 | | | | 69,448,145 | | | | 648,990 | | | | 23,910,408 | | |
Class R5 shares | |
Subscriptions | | | 4,269,929 | | | | 153,979,342 | | | | 2,250,236 | | | | 82,589,442 | | |
Distributions reinvested | | | 133,516 | | | | 4,750,215 | | | | 84,668 | | | | 3,075,827 | | |
Redemptions | | | (2,673,498 | ) | | | (95,400,884 | ) | | | (527,586 | ) | | | (19,297,513 | ) | |
Net increase | | | 1,729,947 | | | | 63,328,673 | | | | 1,807,318 | | | | 66,367,756 | | |
The accompanying Notes to Financial Statements are an integral part of this statement.
Annual Report 2016
36
STATEMENT OF CHANGES IN NET ASSETS (continued)
| | | Year Ended August 31, 2016 | | Year Ended August 31, 2015 | |
| | | Shares | | Dollars ($) | | Shares | | Dollars ($) | |
Capital stock activity (continued) | |
Class Y shares | |
Subscriptions | | | 1,765,549 | | | | 63,873,858 | | | | 1,537,795 | | | | 57,194,044 | | |
Distributions reinvested | | | 72,198 | | | | 2,591,074 | | | | 38,339 | | | | 1,401,115 | | |
Redemptions | | | (527,260 | ) | | | (19,104,289 | ) | | | (211,982 | ) | | | (7,879,818 | ) | |
Net increase | | | 1,310,487 | | | | 47,360,643 | | | | 1,364,152 | | | | 50,715,341 | | |
Class Z shares | |
Subscriptions | | | 13,344,310 | | | | 479,768,783 | | | | 6,092,718 | | | | 223,848,477 | | |
Distributions reinvested | | | 470,931 | | | | 16,746,774 | | | | 437,899 | | | | 15,841,211 | | |
Redemptions | | | (4,101,024 | ) | | | (147,209,609 | ) | | | (2,959,328 | ) | | | (108,584,334 | ) | |
Net increase | | | 9,714,217 | | | | 349,305,948 | | | | 3,571,289 | | | | 131,105,354 | | |
Total net increase | | | 58,528,993 | | | | 2,103,451,935 | | | | 33,256,314 | | | | 1,222,955,848 | | |
(a) Includes conversions of Class B shares to Class A shares, if any.
The accompanying Notes to Financial Statements are an integral part of this statement.
Annual Report 2016
37
The following tables are intended to help you understand the Fund's financial performance. Certain information reflects financial results for a single share of a class held for the periods shown. Per share net investment income (loss) amounts are calculated based on average shares outstanding during the period. Total return assumes reinvestment of all dividends and distributions, if any. Total return does not reflect payment of sales charges, if any. Total return and portfolio turnover are not annualized for periods of less than one year. The portfolio turnover rate is calculated without regard to purchase and sales transactions of short-term instruments and certain derivatives, if any. If such transactions were included, the Fund's portfolio turnover rate may be higher.
| | | Year Ended August 31, | |
Class A | | 2016 | | 2015 | | 2014 | | 2013 | | 2012 | |
Per share data | |
Net asset value, beginning of period | | $ | 35.80 | | | $ | 37.01 | | | $ | 31.83 | | | $ | 28.21 | | | $ | 26.06 | | |
Income from investment operations: | |
Net investment income | | | 0.38 | | | | 0.75 | (a) | | | 0.32 | | | | 0.28 | | | | 0.33 | | |
Net realized and unrealized gain (loss) | | | 2.62 | | | | (0.23 | ) | | | 5.16 | | | | 3.64 | | | | 2.97 | | |
Total from investment operations | | | 3.00 | | | | 0.52 | | | | 5.48 | | | | 3.92 | | | | 3.30 | | |
Less distributions to shareholders: | |
Net investment income | | | (0.58 | ) | | | (0.40 | ) | | | (0.30 | ) | | | (0.30 | ) | | | (0.34 | ) | |
Net realized gains | | | (0.68 | ) | | | (1.33 | ) | | | — | | | | — | | | | (0.81 | ) | |
Total distributions to shareholders | | | (1.26 | ) | | | (1.73 | ) | | | (0.30 | ) | | | (0.30 | ) | | | (1.15 | ) | |
Net asset value, end of period | | $ | 37.54 | | | $ | 35.80 | | | $ | 37.01 | | | $ | 31.83 | | | $ | 28.21 | | |
Total return | | | 8.60 | % | | | 1.38 | % | | | 17.29 | % | | | 13.97 | % | | | 13.14 | % | |
Ratios to average net assets(b) | |
Total gross expenses | | | 1.03 | % | | | 1.06 | % | | | 1.09 | % | | | 1.14 | % | | | 1.16 | % | |
Total net expenses(c) | | | 1.03 | %(d) | | | 1.06 | %(d) | | | 1.09 | %(d) | | | 1.13 | %(d) | | | 1.11 | %(d) | |
Net investment income | | | 1.06 | % | | | 2.03 | % | | | 0.94 | % | | | 0.91 | % | | | 1.24 | % | |
Supplemental data | |
Net assets, end of period (in thousands) | | $ | 2,960,832 | | | $ | 1,885,538 | | | $ | 1,344,071 | | | $ | 994,163 | | | $ | 774,214 | | |
Portfolio turnover | | | 60 | % | | | 102 | % | | | 109 | % | | | 141 | % | | | 130 | % | |
Notes to Financial Highlights
(a) Net investment income per share includes special dividends. The effect of these dividends amounted to $0.48 per share.
(b) In addition to the fees and expenses that the Fund bears directly, the Fund indirectly bears a pro rata share of the fees and expenses of any other funds in which it invests. Such indirect expenses are not included in the Fund's reported expense ratios.
(c) Total net expenses include the impact of certain fee waivers/expense reimbursements made by the Investment Manager and certain of its affiliates, if applicable.
(d) The benefits derived from expense reductions had an impact of less than 0.01%.
The accompanying Notes to Financial Statements are an integral part of this statement.
Annual Report 2016
38
FINANCIAL HIGHLIGHTS (continued)
| | | Year Ended August 31, | |
Class B | | 2016 | | 2015 | | 2014 | | 2013 | | 2012 | |
Per share data | |
Net asset value, beginning of period | | $ | 35.67 | | | $ | 36.91 | | | $ | 31.75 | | | $ | 28.15 | | | $ | 26.00 | | |
Income from investment operations: | |
Net investment income | | | 0.10 | | | | 0.30 | (a) | | | 0.06 | | | | 0.05 | | | | 0.13 | | |
Net realized and unrealized gain (loss) | | | 2.61 | | | | (0.06 | ) | | | 5.15 | | | | 3.63 | | | | 2.97 | | |
Total from investment operations | | | 2.71 | | | | 0.24 | | | | 5.21 | | | | 3.68 | | | | 3.10 | | |
Less distributions to shareholders: | |
Net investment income | | | (0.31 | ) | | | (0.15 | ) | | | (0.05 | ) | | | (0.08 | ) | | | (0.14 | ) | |
Net realized gains | | | (0.68 | ) | | | (1.33 | ) | | | — | | | | — | | | | (0.81 | ) | |
Total distributions to shareholders | | | (0.99 | ) | | | (1.48 | ) | | | (0.05 | ) | | | (0.08 | ) | | | (0.95 | ) | |
Net asset value, end of period | | $ | 37.39 | | | $ | 35.67 | | | $ | 36.91 | | | $ | 31.75 | | | $ | 28.15 | | |
Total return | | | 7.75 | % | | | 0.63 | % | | | 16.40 | % | | | 13.12 | % | | | 12.30 | % | |
Ratios to average net assets(b) | |
Total gross expenses | | | 1.77 | % | | | 1.81 | % | | | 1.84 | % | | | 1.89 | % | | | 1.91 | % | |
Total net expenses(c) | | | 1.77 | %(d) | | | 1.81 | %(d) | | | 1.84 | %(d) | | | 1.88 | %(d) | | | 1.86 | %(d) | |
Net investment income | | | 0.28 | % | | | 0.82 | % | | | 0.18 | % | | | 0.16 | % | | | 0.49 | % | |
Supplemental data | |
Net assets, end of period (in thousands) | | $ | 6,374 | | | $ | 8,834 | | | $ | 12,504 | | | $ | 12,225 | | | $ | 11,910 | | |
Portfolio turnover | | | 60 | % | | | 102 | % | | | 109 | % | | | 141 | % | | | 130 | % | |
Notes to Financial Highlights
(a) Net investment income per share includes special dividends. The effect of these dividends amounted to $0.32 per share.
(b) In addition to the fees and expenses that the Fund bears directly, the Fund indirectly bears a pro rata share of the fees and expenses of any other funds in which it invests. Such indirect expenses are not included in the Fund's reported expense ratios.
(c) Total net expenses include the impact of certain fee waivers/expense reimbursements made by the Investment Manager and certain of its affiliates, if applicable.
(d) The benefits derived from expense reductions had an impact of less than 0.01%.
The accompanying Notes to Financial Statements are an integral part of this statement.
Annual Report 2016
39
FINANCIAL HIGHLIGHTS (continued)
| | | Year Ended August 31, | |
Class C | | 2016 | | 2015 | | 2014 | | 2013 | | 2012 | |
Per share data | |
Net asset value, beginning of period | | $ | 35.68 | | | $ | 36.92 | | | $ | 31.75 | | | $ | 28.15 | | | $ | 25.99 | | |
Income from investment operations: | |
Net investment income | | | 0.11 | | | | 0.56 | (a) | | | 0.07 | | | | 0.05 | | | | 0.13 | | |
Net realized and unrealized gain (loss) | | | 2.62 | | | | (0.32 | ) | | | 5.14 | | | | 3.63 | | | | 2.98 | | |
Total from investment operations | | | 2.73 | | | | 0.24 | | | | 5.21 | | | | 3.68 | | | | 3.11 | | |
Less distributions to shareholders: | |
Net investment income | | | (0.31 | ) | | | (0.15 | ) | | | (0.05 | ) | | | (0.08 | ) | | | (0.14 | ) | |
Net realized gains | | | (0.68 | ) | | | (1.33 | ) | | | — | | | | — | | | | (0.81 | ) | |
Total distributions to shareholders | | | (0.99 | ) | | | (1.48 | ) | | | (0.05 | ) | | | (0.08 | ) | | | (0.95 | ) | |
Increase from payment by affiliate | | | — | | | | — | | | | 0.01 | | | | — | | | | — | | |
Net asset value, end of period | | $ | 37.42 | | | $ | 35.68 | | | $ | 36.92 | | | $ | 31.75 | | | $ | 28.15 | | |
Total return | | | 7.80 | % | | | 0.63 | % | | | 16.44 | %(b) | | | 13.12 | % | | | 12.34 | % | |
Ratios to average net assets(c) | |
Total gross expenses | | | 1.78 | % | | | 1.81 | % | | | 1.84 | % | | | 1.89 | % | | | 1.91 | % | |
Total net expenses(d) | | | 1.78 | %(e) | | | 1.81 | %(e) | | | 1.84 | %(e) | | | 1.88 | %(e) | | | 1.86 | %(e) | |
Net investment income | | | 0.32 | % | | | 1.52 | % | | | 0.19 | % | | | 0.16 | % | | | 0.50 | % | |
Supplemental data | |
Net assets, end of period (in thousands) | | $ | 1,265,079 | | | $ | 612,243 | | | $ | 295,665 | | | $ | 149,581 | | | $ | 74,771 | | |
Portfolio turnover | | | 60 | % | | | 102 | % | | | 109 | % | | | 141 | % | | | 130 | % | |
Notes to Financial Highlights
(a) Net investment income per share includes special dividends. The effect of these dividends amounted to $0.56 per share.
(b) The Fund received a payment from an affiliate. Had the Fund not received this payment, the total return would have been lower by 0.03%.
(c) In addition to the fees and expenses that the Fund bears directly, the Fund indirectly bears a pro rata share of the fees and expenses of any other funds in which it invests. Such indirect expenses are not included in the Fund's reported expense ratios.
(d) Total net expenses include the impact of certain fee waivers/expense reimbursements made by the Investment Manager and certain of its affiliates, if applicable.
(e) The benefits derived from expense reductions had an impact of less than 0.01%.
The accompanying Notes to Financial Statements are an integral part of this statement.
Annual Report 2016
40
FINANCIAL HIGHLIGHTS (continued)
| | | Year Ended August 31, | |
Class K | | 2016 | | 2015 | | 2014 | | 2013 | | 2012 | |
Per share data | |
Net asset value, beginning of period | | $ | 35.75 | | | $ | 36.96 | | | $ | 31.80 | | | $ | 28.18 | | | $ | 26.02 | | |
Income from investment operations: | |
Net investment income | | | 0.41 | | | | 0.69 | (a) | | | 0.35 | | | | 0.31 | | | | 0.35 | | |
Net realized and unrealized gain (loss) | | | 2.61 | | | | (0.13 | ) | | | 5.15 | | | | 3.64 | | | | 2.98 | | |
Total from investment operations | | | 3.02 | | | | 0.56 | | | | 5.50 | | | | 3.95 | | | | 3.33 | | |
Less distributions to shareholders: | |
Net investment income | | | (0.61 | ) | | | (0.44 | ) | | | (0.34 | ) | | | (0.33 | ) | | | (0.36 | ) | |
Net realized gains | | | (0.68 | ) | | | (1.33 | ) | | | — | | | | — | | | | (0.81 | ) | |
Total distributions to shareholders | | | (1.29 | ) | | | (1.77 | ) | | | (0.34 | ) | | | (0.33 | ) | | | (1.17 | ) | |
Net asset value, end of period | | $ | 37.48 | | | $ | 35.75 | | | $ | 36.96 | | | $ | 31.80 | | | $ | 28.18 | | |
Total return | | | 8.69 | % | | | 1.49 | % | | | 17.39 | % | | | 14.11 | % | | | 13.26 | % | |
Ratios to average net assets(b) | |
Total gross expenses | | | 0.93 | % | | | 0.95 | % | | | 0.97 | % | | | 1.01 | % | | | 1.03 | % | |
Total net expenses(c) | | | 0.93 | % | | | 0.95 | % | | | 0.97 | % | | | 1.01 | % | | | 1.03 | % | |
Net investment income | | | 1.15 | % | | | 1.86 | % | | | 1.00 | % | | | 1.02 | % | | | 1.32 | % | |
Supplemental data | |
Net assets, end of period (in thousands) | | $ | 23,494 | | | $ | 22,260 | | | $ | 23,303 | | | $ | 70,411 | | | $ | 60,735 | | |
Portfolio turnover | | | 60 | % | | | 102 | % | | | 109 | % | | | 141 | % | | | 130 | % | |
Notes to Financial Highlights
(a) Net investment income per share includes special dividends. The effect of these dividends amounted to $0.39 per share.
(b) In addition to the fees and expenses that the Fund bears directly, the Fund indirectly bears a pro rata share of the fees and expenses of any other funds in which it invests. Such indirect expenses are not included in the Fund's reported expense ratios.
(c) Total net expenses include the impact of certain fee waivers/expense reimbursements made by the Investment Manager and certain of its affiliates, if applicable.
The accompanying Notes to Financial Statements are an integral part of this statement.
Annual Report 2016
41
FINANCIAL HIGHLIGHTS (continued)
| | | Year Ended August 31, | |
Class R | | 2016 | | 2015 | | 2014 | | 2013 | | 2012 | |
Per share data | |
Net asset value, beginning of period | | $ | 35.79 | | | $ | 37.01 | | | $ | 31.82 | | | $ | 28.19 | | | $ | 26.04 | | |
Income from investment operations: | |
Net investment income | | | 0.29 | | | | 0.73 | (a) | | | 0.24 | | | | 0.20 | | | | 0.27 | | |
Net realized and unrealized gain (loss) | | | 2.63 | | | | (0.31 | ) | | | 5.15 | | | | 3.65 | | | | 2.97 | | |
Total from investment operations | | | 2.92 | | | | 0.42 | | | | 5.39 | | | | 3.85 | | | | 3.24 | | |
Less distributions to shareholders: | |
Net investment income | | | (0.49 | ) | | | (0.31 | ) | | | (0.21 | ) | | | (0.22 | ) | | | (0.28 | ) | |
Net realized gains | | | (0.68 | ) | | | (1.33 | ) | | | — | | | | — | | | | (0.81 | ) | |
Total distributions to shareholders | | | (1.17 | ) | | | (1.64 | ) | | | (0.21 | ) | | | (0.22 | ) | | | (1.09 | ) | |
Increase from payment by affiliate | | | — | | | | — | | | | 0.01 | | | | — | | | | — | | |
Net asset value, end of period | | $ | 37.54 | | | $ | 35.79 | | | $ | 37.01 | | | $ | 31.82 | | | $ | 28.19 | | |
Total return | | | 8.35 | % | | | 1.10 | % | | | 17.04 | %(b) | | | 13.73 | % | | | 12.87 | % | |
Ratios to average net assets(c) | |
Total gross expenses | | | 1.28 | % | | | 1.31 | % | | | 1.34 | % | | | 1.39 | % | | | 1.42 | % | |
Total net expenses(d) | | | 1.28 | %(e) | | | 1.31 | %(e) | | | 1.34 | %(e) | | | 1.38 | %(e) | | | 1.36 | %(e) | |
Net investment income | | | 0.82 | % | | | 1.97 | % | | | 0.69 | % | | | 0.64 | % | | | 1.01 | % | |
Supplemental data | |
Net assets, end of period (in thousands) | | $ | 79,917 | | | $ | 37,089 | | | $ | 21,445 | | | $ | 13,113 | | | $ | 2,740 | | |
Portfolio turnover | | | 60 | % | | | 102 | % | | | 109 | % | | | 141 | % | | | 130 | % | |
Notes to Financial Highlights
(a) Net investment income per share includes special dividends. The effect of these dividends amounted to $0.55 per share.
(b) The Fund received a payment from an affiliate. Had the Fund not received this payment, the total return would have been lower by 0.03%.
(c) In addition to the fees and expenses that the Fund bears directly, the Fund indirectly bears a pro rata share of the fees and expenses of any other funds in which it invests. Such indirect expenses are not included in the Fund's reported expense ratios.
(d) Total net expenses include the impact of certain fee waivers/expense reimbursements made by the Investment Manager and certain of its affiliates, if applicable.
(e) The benefits derived from expense reductions had an impact of less than 0.01%.
The accompanying Notes to Financial Statements are an integral part of this statement.
Annual Report 2016
42
FINANCIAL HIGHLIGHTS (continued)
| | | Year Ended August 31, | |
Class R4 | | 2016 | | 2015 | | 2014 | | 2013(a) | |
Per share data | |
Net asset value, beginning of period | | $ | 36.06 | | | $ | 37.27 | | | $ | 32.03 | | | $ | 28.25 | | |
Income from investment operations: | |
Net investment income | | | 0.48 | | | | 0.88 | (b) | | | 0.42 | | | | 0.29 | | |
Net realized and unrealized gain (loss) | | | 2.63 | | | | (0.27 | ) | | | 5.18 | | | | 3.76 | | |
Total from investment operations | | | 3.11 | | | | 0.61 | | | | 5.60 | | | | 4.05 | | |
Less distributions to shareholders: | |
Net investment income | | | (0.67 | ) | | | (0.49 | ) | | | (0.38 | ) | | | (0.27 | ) | |
Net realized gains | | | (0.68 | ) | | | (1.33 | ) | | | — | | | | — | | |
Total distributions to shareholders | | | (1.35 | ) | | | (1.82 | ) | | | (0.38 | ) | | | (0.27 | ) | |
Increase from payment by affiliate | | | — | | | | — | | | | 0.02 | | | | — | | |
Net asset value, end of period | | $ | 37.82 | | | $ | 36.06 | | | $ | 37.27 | | | $ | 32.03 | | |
Total return | | | 8.86 | % | | | 1.62 | % | | | 17.64 | %(c) | | | 14.40 | % | |
Ratios to average net assets(d) | |
Total gross expenses | | | 0.78 | % | | | 0.81 | % | | | 0.84 | % | | | 0.88 | %(e) | |
Total net expenses(f) | | | 0.78 | %(g) | | | 0.81 | %(g) | | | 0.84 | %(g) | | | 0.88 | %(e)(g) | |
Net investment income | | | 1.33 | % | | | 2.37 | % | | | 1.21 | % | | | 1.14 | %(e) | |
Supplemental data | |
Net assets, end of period (in thousands) | | $ | 112,108 | | | $ | 38,489 | | | $ | 15,596 | | | $ | 3,515 | | |
Portfolio turnover | | | 60 | % | | | 102 | % | | | 109 | % | | | 141 | % | |
Notes to Financial Highlights
(a) Based on operations from November 8, 2012 (commencement of operations) through the stated period end.
(b) Net investment income per share includes special dividends. The effect of these dividends amounted to $0.51 per share.
(c) The Fund received a payment from an affiliate. Had the Fund not received this payment, the total return would have been lower by 0.05%.
(d) In addition to the fees and expenses that the Fund bears directly, the Fund indirectly bears a pro rata share of the fees and expenses of any other funds in which it invests. Such indirect expenses are not included in the Fund's reported expense ratios.
(e) Annualized.
(f) Total net expenses include the impact of certain fee waivers/expense reimbursements made by the Investment Manager and certain of its affiliates, if applicable.
(g) The benefits derived from expense reductions had an impact of less than 0.01%.
The accompanying Notes to Financial Statements are an integral part of this statement.
Annual Report 2016
43
FINANCIAL HIGHLIGHTS (continued)
| | | Year Ended August 31, | |
Class R5 | | 2016 | | 2015 | | 2014 | | 2013 | | 2012 | |
Per share data | |
Net asset value, beginning of period | | $ | 35.78 | | | $ | 36.99 | | | $ | 31.80 | | | $ | 28.17 | | | $ | 26.02 | | |
Income from investment operations: | |
Net investment income | | | 0.51 | | | | 0.97 | (a) | | | 0.45 | | | | 0.39 | | | | 0.42 | | |
Net realized and unrealized gain (loss) | | | 2.60 | | | | (0.32 | ) | | | 5.14 | | | | 3.64 | | | | 2.97 | | |
Total from investment operations | | | 3.11 | | | | 0.65 | | | | 5.59 | | | | 4.03 | | | | 3.39 | | |
Less distributions to shareholders: | |
Net investment income | | | (0.70 | ) | | | (0.53 | ) | | | (0.42 | ) | | | (0.40 | ) | | | (0.43 | ) | |
Net realized gains | | | (0.68 | ) | | | (1.33 | ) | | | — | | | | — | | | | (0.81 | ) | |
Total distributions to shareholders | | | (1.38 | ) | | | (1.86 | ) | | | (0.42 | ) | | | (0.40 | ) | | | (1.24 | ) | |
Increase from payment by affiliate | | | — | | | | — | | | | 0.02 | | | | — | | | | — | | |
Net asset value, end of period | | $ | 37.51 | | | $ | 35.78 | | | $ | 36.99 | | | $ | 31.80 | | | $ | 28.17 | | |
Total return | | | 8.96 | % | | | 1.74 | % | | | 17.76 | %(b) | | | 14.42 | % | | | 13.52 | % | |
Ratios to average net assets(c) | |
Total gross expenses | | | 0.68 | % | | | 0.70 | % | | | 0.73 | % | | | 0.76 | % | | | 0.78 | % | |
Total net expenses(d) | | | 0.68 | % | | | 0.70 | % | | | 0.73 | % | | | 0.76 | % | | | 0.78 | % | |
Net investment income | | | 1.41 | % | | | 2.63 | % | | | 1.30 | % | | | 1.26 | % | | | 1.57 | % | |
Supplemental data | |
Net assets, end of period (in thousands) | | $ | 181,221 | | | $ | 110,946 | | | $ | 47,848 | | | $ | 29,617 | | | $ | 15 | | |
Portfolio turnover | | | 60 | % | | | 102 | % | | | 109 | % | | | 141 | % | | | 130 | % | |
Notes to Financial Highlights
(a) Net investment income per share includes special dividends. The effect of these dividends amounted to $0.57 per share.
(b) The Fund received a payment from an affiliate. Had the Fund not received this payment, the total return would have been lower by 0.05%.
(c) In addition to the fees and expenses that the Fund bears directly, the Fund indirectly bears a pro rata share of the fees and expenses of any other funds in which it invests. Such indirect expenses are not included in the Fund's reported expense ratios.
(d) Total net expenses include the impact of certain fee waivers/expense reimbursements made by the Investment Manager and certain of its affiliates, if applicable.
The accompanying Notes to Financial Statements are an integral part of this statement.
Annual Report 2016
44
FINANCIAL HIGHLIGHTS (continued)
| | | Year Ended August 31, | |
Class Y | | 2016 | | 2015 | | 2014 | | 2013(a) | |
Per share data | |
Net asset value, beginning of period | | $ | 36.07 | | | $ | 37.28 | | | $ | 32.04 | | | $ | 28.25 | | |
Income from investment operations: | |
Net investment income | | | 0.53 | | | | 1.21 | (b) | | | 0.47 | | | | 0.34 | | |
Net realized and unrealized gain (loss) | | | 2.63 | | | | (0.54 | ) | | | 5.19 | | | | 3.75 | | |
Total from investment operations | | | 3.16 | | | | 0.67 | | | | 5.66 | | | | 4.09 | | |
Less distributions to shareholders: | |
Net investment income | | | (0.72 | ) | | | (0.55 | ) | | | (0.44 | ) | | | (0.30 | ) | |
Net realized gains | | | (0.68 | ) | | | (1.33 | ) | | | — | | | | — | | |
Total distributions to shareholders | | | (1.40 | ) | | | (1.88 | ) | | | (0.44 | ) | | | (0.30 | ) | |
Increase from payment by affiliate | | | — | | | | — | | | | 0.02 | | | | — | | |
Net asset value, end of period | | $ | 37.83 | | | $ | 36.07 | | | $ | 37.28 | | | $ | 32.04 | | |
Total return | | | 9.02 | % | | | 1.78 | % | | | 17.84 | %(c) | | | 14.54 | % | |
Ratios to average net assets(d) | |
Total gross expenses | | | 0.63 | % | | | 0.66 | % | | | 0.68 | % | | | 0.70 | %(e) | |
Total net expenses(f) | | | 0.63 | % | | | 0.66 | % | | | 0.68 | % | | | 0.70 | %(e) | |
Net investment income | | | 1.47 | % | | | 3.27 | % | | | 1.35 | % | | | 1.34 | %(e) | |
Supplemental data | |
Net assets, end of period (in thousands) | | $ | 118,553 | | | $ | 65,758 | | | $ | 17,106 | | | $ | 9,784 | | |
Portfolio turnover | | | 60 | % | | | 102 | % | | | 109 | % | | | 141 | % | |
Notes to Financial Highlights
(a) Based on operations from November 8, 2012 (commencement of operations) through the stated period end.
(b) Net investment income per share includes special dividends. The effect of these dividends amounted to $0.78 per share.
(c) The Fund received a payment from an affiliate. Had the Fund not received this payment, the total return would have been lower by 0.04%.
(d) In addition to the fees and expenses that the Fund bears directly, the Fund indirectly bears a pro rata share of the fees and expenses of any other funds in which it invests. Such indirect expenses are not included in the Fund's reported expense ratios.
(e) Annualized.
(f) Total net expenses include the impact of certain fee waivers/expense reimbursements made by the Investment Manager and certain of its affiliates, if applicable.
The accompanying Notes to Financial Statements are an integral part of this statement.
Annual Report 2016
45
FINANCIAL HIGHLIGHTS (continued)
| | | Year Ended August 31, | |
Class Z | | 2016 | | 2015 | | 2014 | | 2013 | | 2012 | |
Per share data | |
Net asset value, beginning of period | | $ | 35.75 | | | $ | 36.96 | | | $ | 31.78 | | | $ | 28.17 | | | $ | 26.02 | | |
Income from investment operations: | |
Net investment income | | | 0.47 | | | | 0.83 | (a) | | | 0.41 | | | | 0.35 | | | | 0.40 | | |
Net realized and unrealized gain (loss) | | | 2.61 | | | | (0.22 | ) | | | 5.15 | | | | 3.63 | | | | 2.96 | | |
Total from investment operations | | | 3.08 | | | | 0.61 | | | | 5.56 | | | | 3.98 | | | | 3.36 | | |
Less distributions to shareholders: | |
Net investment income | | | (0.67 | ) | | | (0.49 | ) | | | (0.38 | ) | | | (0.37 | ) | | | (0.40 | ) | |
Net realized gains | | | (0.68 | ) | | | (1.33 | ) | | | — | | | | — | | | | (0.81 | ) | |
Total distributions to shareholders | | | (1.35 | ) | | | (1.82 | ) | | | (0.38 | ) | | | (0.37 | ) | | | (1.21 | ) | |
Net asset value, end of period | | $ | 37.48 | | | $ | 35.75 | | | $ | 36.96 | | | $ | 31.78 | | | $ | 28.17 | | |
Total return | | | 8.85 | % | | | 1.64 | % | | | 17.60 | % | | | 14.24 | % | | | 13.42 | % | |
Ratios to average net assets(b) | |
Total gross expenses | | | 0.78 | % | | | 0.81 | % | | | 0.84 | % | | | 0.89 | % | | | 0.91 | % | |
Total net expenses(c) | | | 0.78 | %(d) | | | 0.81 | %(d) | | | 0.84 | %(d) | | | 0.88 | %(d) | | | 0.86 | %(d) | |
Net investment income | | | 1.32 | % | | | 2.24 | % | | | 1.18 | % | | | 1.16 | % | | | 1.49 | % | |
Supplemental data | |
Net assets, end of period (in thousands) | | $ | 867,554 | | | $ | 480,162 | | | $ | 364,457 | | | $ | 308,945 | | | $ | 284,934 | | |
Portfolio turnover | | | 60 | % | | | 102 | % | | | 109 | % | | | 141 | % | | | 130 | % | |
Notes to Financial Highlights
(a) Net investment income per share includes special dividends. The effect of these dividends amounted to $0.47 per share.
(b) In addition to the fees and expenses that the Fund bears directly, the Fund indirectly bears a pro rata share of the fees and expenses of any other funds in which it invests. Such indirect expenses are not included in the Fund's reported expense ratios.
(c) Total net expenses include the impact of certain fee waivers/expense reimbursements made by the Investment Manager and certain of its affiliates, if applicable.
(d) The benefits derived from expense reductions had an impact of less than 0.01%.
The accompanying Notes to Financial Statements are an integral part of this statement.
Annual Report 2016
46
NOTES TO FINANCIAL STATEMENTS
August 31, 2016
Note 1. Organization
Columbia Balanced Fund (the Fund), a series of Columbia Funds Series Trust I (the Trust), is a diversified fund. The Trust is registered under the Investment Company Act of 1940, as amended (the 1940 Act), as an open-end management investment company organized as a Massachusetts business trust.
Fund Shares
The Trust may issue an unlimited number of shares (without par value). The Fund offers Class A, Class B, Class C, Class K, Class R, Class R4, Class R5, Class Y and Class Z shares. Although all share classes generally have identical voting, dividend and liquidation rights, each share class votes separately when required by the Trust's organizational documents or by law. Different share classes pay different distribution amounts to the extent the expenses of such share classes differ, and distributions in liquidation will be proportional to the net asset value of each share class. Each share class has its own expense and sales charge structure.
Class A shares are subject to a maximum front-end sales charge of 5.75% based on the initial investment amount. Class A shares purchased without an initial sales charge in accounts aggregating $1 million to $50 million at the time of purchase are subject to a contingent deferred sales charge (CDSC) if the shares are sold within 18 months after purchase, charged as follows: 1.00% CDSC if redeemed within 12 months after purchase, and 0.50% CDSC if redeemed more than 12, but less than 18, months after purchase.
Class B shares may be subject to a maximum CDSC of 5.00% based upon the holding period after purchase. Class B shares will generally convert to Class A shares eight years after purchase. The Fund no longer accepts investments by new or existing investors in the Fund's Class B shares, except in connection with the reinvestment of any dividend and/or capital gain distributions in Class B shares of the Fund and exchanges by existing Class B shareholders of certain other funds within the Columbia Family of Funds.
Class C shares are subject to a 1.00% CDSC on shares redeemed within 12 months after purchase.
Class K shares are not subject to sales charges, however this share class is closed to new investors.
Class R shares are not subject to sales charges and are generally available only to certain retirement plans and other investors as described in the Fund's prospectus.
Class R4 shares are not subject to sales charges and are generally available only to omnibus retirement plans and certain investors as described in the Fund's prospectus.
Class R5 shares are not subject to sales charges and are generally available only to investors purchasing through authorized investment professionals and omnibus retirement plans.
Class Y shares are not subject to sales charges and are generally available only to certain retirement plans as described in the Fund's prospectus.
Class Z shares are not subject to sales charges and are generally available only to eligible investors, which are subject to different investment minimums as described in the Fund's prospectus.
Note 2. Summary of Significant Accounting Policies
Basis of Preparation
The Fund is an investment company that applies the accounting and reporting guidance in the Financial Accounting Standards Board (FASB) Accounting Standards Codification Topic 946, Financial Services — Investment Companies (ASC 946). The financial statements are prepared in accordance with U.S. generally accepted accounting principles (GAAP), which requires management to make certain estimates and assumptions that affect the reported amounts of assets and liabilities, the disclosure of contingent assets and liabilities at the date of the financial statements and the reported amounts of income and expenses during the reporting period. Actual results could differ from those estimates.
The following is a summary of significant accounting policies followed by the Fund in the preparation of its financial statements.
Security Valuation
All equity securities are valued at the close of business of the New York Stock Exchange (NYSE). Equity securities are valued at the last quoted sales price on the principal exchange or market on which they trade, except for securities traded on the NASDAQ Stock Market, which are valued at the NASDAQ official close price. Unlisted securities or listed securities for which there were no sales during the day are valued at the mean of the latest quoted bid and ask prices on such exchanges or markets.
Annual Report 2016
47
NOTES TO FINANCIAL STATEMENTS (continued)
August 31, 2016
Debt securities generally are valued by pricing services approved by the Board of Trustees (the Board) based upon market transactions for normal, institutional-size trading units of similar securities. The services may use various pricing techniques that take into account, as applicable, factors such as yield, quality, coupon rate, maturity, type of issue, trading characteristics and other data, as well as approved independent broker-dealer quotes. Debt securities for which quotations are not readily available or not believed to be reflective of market value may also be valued based upon a bid quote from an approved independent broker-dealer. Debt securities maturing in 60 days or less are valued primarily at amortized cost value, unless this method results in a valuation that management believes does not approximate market value.
Asset- and mortgage-backed securities are generally valued by pricing services, which utilize pricing models that incorporate the securities' cash flow and loan performance data. These models also take into account available market data, including trades, market quotations, and benchmark yield curves for identical or similar securities. Factors used to identify similar securities may include, but are not limited to, issuer, collateral type, vintage, prepayment speeds, collateral performance, credit ratings, credit enhancement and expected life. Asset-backed securities for which quotations are readily available may also be valued based upon an over-the-counter or exchange bid quote from an approved independent broker-dealer.
Senior loan securities for which reliable market quotations are readily available are generally valued by pricing services at the average of the bids received.
Foreign equity securities are valued based on the closing price on the foreign exchange in which such securities are primarily traded. If any foreign equity security closing prices are not readily available, the securities are valued at the mean of the latest quoted bid and ask prices on such exchanges or markets. Foreign currency exchange rates are generally determined at 4:00 p.m. Eastern (U.S.) time. Many securities markets and exchanges outside the U.S. close prior to the close of the NYSE; therefore, the closing prices for securities in such markets or on such exchanges may not fully reflect events that occur after such close but before the close of the NYSE. In those situations, foreign securities will be fair valued pursuant to a policy adopted by the Board, including, if available, utilizing a third party pricing service to determine these fair values. The third party pricing service takes into account multiple factors, including, but
not limited to, movements in the U.S. securities markets, certain depositary receipts, futures contracts and foreign exchange rates that have occurred subsequent to the close of the foreign exchange or market, to determine a good faith estimate that reasonably reflects the current market conditions as of the close of the NYSE. The fair value of a security is likely to be different from the quoted or published price, if available.
Investments in open-end investment companies, including money market funds, are valued at their latest net asset value.
Futures and options on futures contracts are valued based upon the settlement price at the close of regular trading on their principal exchanges or, in the absence of transactions, at the mean of the latest quoted bid and ask prices.
Investments for which market quotations are not readily available, or that have quotations which management believes are not reflective of market value or reliable, are valued at fair value as determined in good faith under procedures approved by and under the general supervision of the Board. If a security or class of securities (such as foreign securities) is valued at fair value, such value is likely to be different from the quoted or published price for the security.
The determination of fair value often requires significant judgment. To determine fair value, management may use assumptions including but not limited to future cash flows and estimated risk premiums. Multiple inputs from various sources may be used to determine fair value.
GAAP requires disclosure regarding the inputs and valuation techniques used to measure fair value and any changes in valuation inputs or techniques. In addition, investments shall be disclosed by major category. This information is disclosed following the Fund's Portfolio of Investments.
Foreign Currency Transactions and Translations
The values of all assets and liabilities denominated in foreign currencies are generally translated into U.S. dollars at exchange rates determined at the close of the NYSE on any given day. Net realized and unrealized gains (losses) on foreign currency transactions and translations include gains (losses) arising from the fluctuation in exchange rates between trade and settlement dates on securities transactions, gains (losses) arising from the disposition of foreign currency and currency gains (losses) between the accrual and
Annual Report 2016
48
NOTES TO FINANCIAL STATEMENTS (continued)
August 31, 2016
payment dates on dividends, interest income and foreign withholding taxes.
For financial statement purposes, the Fund does not distinguish that portion of gains (losses) on investments which is due to changes in foreign exchange rates from that which is due to changes in market prices of the investments. Such fluctuations are included with the net realized and unrealized gains (losses) on investments in the Statement of Operations.
Derivative Instruments
The Fund invests in certain derivative instruments, as detailed below, to meet its investment objectives. Derivatives are instruments whose values depend on, or are derived from, in whole or in part, the value of one or more securities, currencies, commodities, indices, or other assets or instruments. Derivatives may be used to increase investment flexibility (including to maintain cash reserves while maintaining desired exposure to certain assets), for risk management (hedging) purposes, to facilitate trading, to reduce transaction costs and to pursue higher investment returns. The Fund may also use derivative instruments to mitigate certain investment risks, such as foreign currency exchange rate risk, interest rate risk and credit risk. Derivatives may involve various risks, including the potential inability of the counterparty to fulfill its obligations under the terms of the contract, the potential for an illiquid secondary market (making it difficult for the Fund to sell or terminate, including at favorable prices) and the potential for market movements which may expose the Fund to gains or losses in excess of the amount shown in the Statement of Assets and Liabilities. The notional amounts of derivative instruments, if applicable, are not recorded in the financial statements.
A derivative instrument may suffer a marked-to-market loss if the value of the contract decreases due to an unfavorable change in the market rates or values of the underlying instrument. Losses can also occur if the counterparty does not perform its obligations under the contract. The Fund's risk of loss from counterparty credit risk on over-the-counter derivatives is generally limited to the aggregate unrealized gain netted against any collateral held by the Fund and the amount of any variation margin held by the counterparty, plus any replacement costs or related amounts. With exchange-traded or centrally cleared derivatives, there is reduced counterparty credit risk to the Fund since the clearinghouse or central counterparty (CCP) provides some protection in the case of clearing member default.
The clearinghouse or CCP stands between the buyer and the seller of the contract; therefore, additional counterparty credit risk is failure of the clearinghouse or CCP. However, credit risk still exists in exchange-traded or centrally cleared derivatives with respect to initial and variation margin that is held in a broker's customer account. While brokers are required to segregate customer margin from their own assets, in the event that a broker becomes insolvent or goes into bankruptcy and at that time there is a shortfall in the aggregate amount of margin held by the broker for all its clients, U.S. bankruptcy laws will typically allocate that shortfall on a pro-rata basis across all the broker's customers (including the Fund), potentially resulting in losses to the Fund.
In order to better define its contractual rights and to secure rights that will help the Fund mitigate its counterparty risk, the Fund may enter into an International Swaps and Derivatives Association, Inc. Master Agreement (ISDA Master Agreement) or similar agreement with its derivatives contract counterparties. An ISDA Master Agreement is an agreement between the Fund and a counterparty that governs over-the-counter derivatives and typically contains, among other things, collateral posting terms and netting provisions in the event of a default and/or termination event. Under an ISDA Master Agreement, the Fund may, under certain circumstances, offset with the counterparty certain derivative instrument's payables and/or receivables with collateral held and/or posted and create one single net payment. The provisions of the ISDA Master Agreement typically permit a single net payment in the event of default (close-out netting), including the bankruptcy or insolvency of the counterparty. Note, however, that bankruptcy or insolvency laws of a particular jurisdiction may impose restrictions on or prohibitions against the right of offset or netting in bankruptcy, insolvency or other events.
Collateral (margin) requirements differ by type of derivative. Margin requirements are established by the clearinghouse or CCP for exchange-traded and centrally cleared derivatives. Brokers can ask for margin in excess of the minimum in certain circumstances. Collateral terms are contract specific for over-the-counter derivatives. For over-the-counter derivatives traded under an ISDA Master Agreement, the collateral requirements are typically calculated by netting the marked-to-market amount for each transaction under such agreement and comparing that amount to the value of any variation margin currently pledged by the Fund and/or the counterparty. Generally, the amount of collateral due from
Annual Report 2016
49
NOTES TO FINANCIAL STATEMENTS (continued)
August 31, 2016
or to a party has to exceed a minimum transfer amount threshold (e.g., $250,000) before a transfer has to be made. To the extent amounts due to the Fund from its counterparties are not fully collateralized, contractually or otherwise, the Fund bears the risk of loss from counterparty nonperformance. The Fund attempts to mitigate counterparty risk by only entering into agreements with counterparties that it believes have the financial resources to honor their obligations and by monitoring the financial stability of those counterparties.
Certain ISDA Master Agreements allow counterparties to over-the-counter derivatives transactions to terminate derivatives contracts prior to maturity in the event the Fund's net asset value declines by a stated percentage over a specified time period or if the Fund fails to meet certain terms of the ISDA Master Agreement, which would cause the Fund to accelerate payment of any net liability owed to the counterparty. The Fund also has termination rights if the counterparty fails to meet certain terms of the ISDA Master Agreement. In addition to considering counterparty credit risk, the Fund would consider terminating the derivatives contracts based on whether termination would result in a net liability owed from the counterparty.
For financial reporting purposes, the Fund does not offset derivative assets and derivative liabilities that are subject to netting arrangements in the Statement of Assets and Liabilities.
Futures Contracts
Futures contracts are exchange-traded and represent commitments for the future purchase or sale of an asset at a specified price on a specified date. The Fund bought and sold futures contracts to manage the duration and yield curve exposure of the Fund versus the benchmark and to manage exposure to movements in interest rates. These instruments may be used for other purposes in future periods. Upon entering into futures contracts, the Fund bears risks that it may not achieve the anticipated benefits of the futures contracts and may realize a loss. Additional risks include counterparty credit risk, the possibility of an illiquid market, and that a change in the value of the contract or option may not correlate with changes in the value of the underlying asset.
Upon entering into a futures contract, the Fund deposits cash or securities with the broker, known as a futures commissions merchant (FCM), in an amount sufficient to meet the initial margin requirement. The initial margin deposit must be maintained at an established level over the life of the contract. Cash deposited as initial margin is recorded in the Statement of Assets and Liabilities as
margin deposits. Securities deposited as initial margin are designated in the Portfolio of Investments. Subsequent payments (variation margin) are made or received by the Fund each day. The variation margin payments are equal to the daily change in the contract value and are recorded as variation margin receivable or payable and are offset in unrealized gains or losses. The Fund recognizes a realized gain or loss when the contract is closed or expires. Futures contracts involve, to varying degrees, risk of loss in excess of the variation margin disclosed in the Statement of Assets and Liabilities.
Effects of Derivative Transactions in the Financial Statements
The following tables are intended to provide additional information about the effect of derivatives on the financial statements of the Fund, including: the fair value of derivatives by risk category and the location of those fair values in the Statement of Assets and Liabilities; and the impact of derivative transactions over the period in the Statement of Operations, including realized and unrealized gains (losses). The derivative instrument schedules following the Portfolio of Investments present additional information regarding derivative instruments outstanding at the end of the period, if any.
The following table is a summary of the fair value of derivative instruments (not considered to be hedging instruments for accounting disclosure purposes) at August 31, 2016:
Liability Derivatives | |
Risk Exposure
Category | | Statement of Assets and
Liabilities Location | | Fair Value ($) | |
Interest rate
risk
| | Net assets — unrealized
depreciation on futures
contracts | | | 144,843
| * | |
*Includes cumulative appreciation (depreciation) as reported in the tables following the Portfolio of Investments. Only the current day's variation margin is reported in receivables or payables in the Statement of Assets and Liabilities.
The following table indicates the effect of derivative instruments (not considered to be hedging instruments for accounting disclosure purposes) in the Statement of Operations for the year ended August 31, 2016:
Amount of Realized Gain (Loss) on Derivatives Recognized in Income | |
Risk Exposure Category | | Futures Contracts ($) | |
Interest rate risk | | | 1,683,865 | | |
Change in Unrealized Appreciation (Depreciation) on
Derivatives Recognized in Income | |
Risk Exposure Category | | Futures Contracts ($) | |
Interest rate risk | | | (144,843 | ) | |
Annual Report 2016
50
NOTES TO FINANCIAL STATEMENTS (continued)
August 31, 2016
The following table provides a summary of the average outstanding volume by derivative instrument for the year ended August 31, 2016:
Derivative Instrument | | Average Notional Amounts ($)* | |
Futures contracts — Long | | | 54,848,916 | | |
*Based on the ending quarterly outstanding amounts for the year ended August 31, 2016.
Investments in Senior Loans
The Fund may invest in senior loan assignments. When the Fund purchases an assignment of a senior loan, the Fund typically has direct rights against the borrower; provided, however, that the Fund's rights may be more limited than the lender from which it acquired the assignment and the Fund may be able to enforce its rights only through an administrative agent. Although certain senior loan assignments are secured by collateral, the Fund could experience delays or limitations in realizing such collateral or have its interest subordinated to other indebtedness of the obligor. In the event that the administrator or collateral agent of a loan becomes insolvent, enters into receivership or bankruptcy, the Fund may incur costs and delays in realizing payment or may suffer a loss of principal and/or interest. The risk of loss is greater for unsecured or subordinated loans. In addition, senior loan assignments are vulnerable to market, economic or other conditions or events that may reduce the demand for senior loan assignments and certain senior loan assignments which were liquid, when purchased, may become illiquid.
The Fund may enter into senior loan assignments where all or a portion of the loan may be unfunded. The Fund is obligated to fund these commitments at the borrower's discretion. These commitments are generally traded and priced in the same manner as other senior loan securities and are disclosed as unfunded senior loan commitments in the Fund's Portfolio of Investments with a corresponding payable for investments purchased. The Fund designates cash or liquid securities to cover these commitments.
Asset- and Mortgage-Backed Securities
The Fund may invest in asset-backed and mortgage-backed securities. The maturity dates shown represent the original maturity of the underlying obligation. Actual maturity may vary based upon prepayment activity on these obligations. All, or a portion, of the obligation may be prepaid at any time because the underlying asset may be prepaid. As a result, decreasing market interest rates could result in an increased level of prepayment. An increased prepayment rate will have the effect of
shortening the maturity of the security. Unless otherwise noted, the coupon rates presented are fixed rates.
Delayed Delivery Securities
The Fund may trade securities on other than normal settlement terms, including securities purchased or sold on a "when-issued" basis. This may increase risk to the Fund since the other party to the transaction may fail to deliver, which could cause the Fund to subsequently invest at less advantageous prices. The Fund designates cash or liquid securities in an amount equal to the delayed delivery commitment.
To Be Announced Securities
The Fund may trade securities on a To Be Announced (TBA) basis. As with other delayed-delivery transactions, a seller agrees to issue a TBA security at a future date. However, the seller does not specify the particular securities to be delivered. Instead, the Fund agrees to accept any security that meets specified terms.
In some cases, Master Securities Forward Transaction Agreements (MSFTAs) may be used to govern transactions of certain forward-settling agency mortgage-backed securities, such as delayed-delivery and TBAs, between the Fund and counterparty. The MSFTA maintains provisions for, among other things, initiation and confirmation, payment and transfer, events of default, termination, and maintenance of collateral relating to such transactions.
Mortgage Dollar Roll Transactions
The Fund may enter into mortgage "dollar rolls" in which the Fund sells securities for delivery in the current month and simultaneously contracts with the same counterparty to repurchase similar but not identical securities (same type, coupon and maturity) on a specified future date. During the roll period, the Fund loses the right to receive principal and interest paid on the securities sold. However, the Fund will benefit because it receives negotiated amounts in the form of reductions of the purchase price for the future purchase plus the interest earned on the cash proceeds of the securities sold until the settlement date of the forward purchase. The Fund records the incremental difference between the forward purchase and sale of each forward roll as a realized gain or loss. Unless any realized gains exceed the income, capital appreciation, and gain or loss due to mortgage prepayments that would have been realized on the securities sold as part of the mortgage dollar roll, the use of this technique will diminish the investment
Annual Report 2016
51
NOTES TO FINANCIAL STATEMENTS (continued)
August 31, 2016
performance of the Fund compared to what the performance would have been without the use of mortgage dollar rolls. All cash proceeds will be invested in instruments that are permissible investments for the Fund. The Fund identifies cash or liquid securities in an amount equal to the forward purchase price.
For financial reporting and tax purposes, the Fund treats "to be announced" mortgage dollar rolls as two separate transactions, one involving the purchase of a security and a separate transaction involving a sale. These transactions may increase the Fund's portfolio turnover rate. The Fund does not currently enter into mortgage dollar rolls that are accounted for as financing transactions.
Mortgage dollar rolls involve the risk that the market value of the securities the Fund is obligated to repurchase may decline below the repurchase price, or that the counterparty may default on its obligations.
Treasury Inflation Protected Securities
The Fund may invest in treasury inflation protected securities (TIPS). The principal amount of TIPS is adjusted periodically and is increased for inflation or decreased for deflation based on a monthly published index. These adjustments are recorded as interest income in the Statement of Operations. Coupon payments are based on the adjusted principal at the time the interest is paid.
Security Transactions
Security transactions are accounted for on the trade date. Cost is determined and gains (losses) are based upon the specific identification method for both financial statement and federal income tax purposes.
Trade date for senior loans purchased in the primary market is the date on which the loan is allocated. Trade date for senior loans purchased in the secondary market is the date on which the transaction is entered into.
Income Recognition
Corporate actions and dividend income are generally recorded net of any non-reclaimable tax withholdings, on the ex-dividend date or upon receipt of ex-dividend notification in the case of certain foreign securities.
Interest income is recorded on an accrual basis. Market premiums and discounts, including original issue discounts, are amortized and accreted, respectively, over the expected life of the security on all debt securities, unless otherwise noted. The Fund classifies gains and
losses realized on prepayments received on mortgage-backed securities as adjustments to interest income.
The Fund may place a debt security on non-accrual status and reduce related interest income when it becomes probable that the interest will not be collected and the amount of uncollectible interest can be reasonably estimated. A defaulted debt security is removed from non-accrual status when the issuer resumes interest payments or when collectibility of interest is reasonably assured.
The Fund may receive distributions from holdings in equity securities, business development companies (BDCs), exchange-traded funds, other regulated investment companies (RICs), and real estate investment trusts (REITs), which report information on the tax character of their distributions annually. These distributions are allocated to dividend income, capital gain and return of capital based on actual information reported. Return of capital is recorded as a reduction of the cost basis of securities held. If the Fund no longer owns the applicable securities, return of capital is recorded as a realized gain. With respect to REITs, to the extent actual information has not yet been reported, estimates for return of capital are made by the Fund's management. Management's estimates are subsequently adjusted when the actual character of the distributions is disclosed by the REITs, which could result in a proportionate change in return of capital to shareholders.
Awards from class action litigation are recorded as a reduction of cost basis if the Fund still owns the applicable securities on the payment date. If the Fund no longer owns the applicable securities, the proceeds are recorded as realized gains.
The value of additional securities received as an income payment is recorded as income and increases the cost basis of such securities.
The Fund may receive other income from senior loans, including amendment fees, consent fees and commitment fees. These fees are recorded as income when received by the Fund. These amounts are included in Interest Income in the Statement of Operations.
Expenses
General expenses of the Trust are allocated to the Fund and other funds of the Trust based upon relative net assets or other expense allocation methodologies determined by the nature of the expense. Expenses directly attributable to the Fund are charged to the Fund.
Annual Report 2016
52
NOTES TO FINANCIAL STATEMENTS (continued)
August 31, 2016
Expenses directly attributable to a specific class of shares are charged to that share class.
Determination of Class Net Asset Value
All income, expenses (other than class-specific expenses, which are charged to that share class, as shown in the Statement of Operations) and realized and unrealized gains (losses) are allocated to each class of the Fund on a daily basis, based on the relative net assets of each class, for purposes of determining the net asset value of each class.
Federal Income Tax Status
The Fund intends to qualify each year as a regulated investment company under Subchapter M of the Internal Revenue Code, as amended, and will distribute substantially all of its taxable income (including net short-term capital gains), if any, for its tax year, and as such will not be subject to federal income taxes. In addition, the Fund intends to distribute in each calendar year substantially all of its net investment income, capital gains and certain other amounts, if any, such that the Fund should not be subject to federal excise tax. Therefore, no federal income or excise tax provision is recorded.
Foreign Taxes
The Fund may be subject to foreign taxes on income, gains on investments or currency repatriation, a portion of which may be recoverable. The Fund will accrue such taxes and recoveries, as applicable, based upon its current interpretation of tax rules and regulations that exist in the markets in which it invests.
Realized gains in certain countries may be subject to foreign taxes at the Fund level, based on statutory rates. The Fund accrues for such foreign taxes on realized and unrealized gains at the appropriate rate for each jurisdiction, as applicable. The amount, if any, is disclosed as a liability on the Statement of Assets and Liabilities.
Distributions to Shareholders
Distributions from net investment income, if any, are declared and paid each calendar quarter. Net realized capital gains, if any, are distributed at least annually. Income distributions and capital gain distributions are determined in accordance with federal income tax regulations, which may differ from GAAP.
Guarantees and Indemnifications
Under the Trust's organizational documents and, in some cases, by contract, its officers and trustees are
indemnified against certain liabilities arising out of the performance of their duties to the Trust or its funds. In addition, certain of the Fund's contracts with its service providers contain general indemnification clauses. The Fund's maximum exposure under these arrangements is unknown since the amount of any future claims that may be made against the Fund cannot be determined, and the Fund has no historical basis for predicting the likelihood of any such claims.
Note 3. Fees and Other Transactions with Affiliates
Management Services Fees
Effective January 1, 2016, the Fund entered into a Management Agreement with Columbia Management Investment Advisers, LLC (the Investment Manager), a wholly-owned subsidiary of Ameriprise Financial, Inc. (Ameriprise Financial). Under the Management Agreement, the Investment Manager provides the Fund with investment research and advice, as well as administrative and accounting services. The management services fee is an annual fee that is equal to a percentage of the Fund's average daily net assets that declines from 0.72% to 0.52% as the Fund's net assets increase. Prior to January 1, 2016, the Fund paid the Investment Manager an annual fee for advisory services under an Investment Management Services Agreement and a separate annual fee for administrative and accounting services under an Administrative Services Agreement. The effective management services fee rate for the year ended August 31, 2016 (reflecting all advisory and administrative services fees paid to the Investment Manager) was 0.60% of the Fund's average daily net assets. For the period from September 1, 2015 through December 31, 2015, the investment advisory services fee paid to the Investment Manager was $6,697,690, and the administrative services fee paid to the Investment Manager was $605,430.
Compensation of Board Members
Board members, who are not officers or employees of the Investment Manager or Ameriprise Financial, are compensated for their services to the Fund as disclosed in the Statement of Operations. These Board members may participate in a Deferred Compensation Plan (the Plan) which may be terminated at any time. Obligations of the Plan will be paid solely out of the Fund's assets, and all amounts payable under the Plan constitute a general unsecured obligation of the Fund.
Annual Report 2016
53
NOTES TO FINANCIAL STATEMENTS (continued)
August 31, 2016
Compensation of Chief Compliance Officer
The Board has appointed a Chief Compliance Officer to the Fund in accordance with federal securities regulations. The Fund is allocated a portion of the expenses associated with the Chief Compliance Officer based on relative net assets of the Trust.
Transactions with Affiliates
For the year ended August 31, 2016, the Fund engaged in purchase and/or sale transactions with affiliates and/or accounts that have a common investment manager (or affiliated investment managers), common directors/trustees, and/or common officers. Those purchase transactions complied with provisions of Rule 17a-7 under the 1940 Act and were $1,791,169.
Transfer Agency Fees
Under a Transfer and Dividend Disbursing Agent Agreement, Columbia Management Investment Services Corp. (the Transfer Agent), an affiliate of the Investment Manager and a wholly-owned subsidiary of Ameriprise Financial, is responsible for providing transfer agency services to the Fund. The Transfer Agent has contracted with Boston Financial Data Services (BFDS) to serve as sub-transfer agent. The Transfer Agent pays the fees of BFDS for services as sub-transfer agent and BFDS is not entitled to reimbursement for such fees from the Fund (with the exception of out-of-pocket fees).
The Fund pays the Transfer Agent a monthly transfer agency fee based on the number or the average value of accounts, depending on the type of account. In addition, prior to October 1, 2016, the Transfer Agent also received sub-transfer agency fees based on a percentage of the average aggregate value of the Fund's shares maintained in omnibus accounts (other than omnibus accounts for which American Enterprise Investment Services Inc. is the broker of record or accounts where the beneficial shareholder is a customer of Ameriprise Financial Services, Inc., for which the Transfer Agent receives a per account fee). Effective October 1, 2016, the Fund pays the Transfer Agent a fee for shareholder services based on the number of accounts or on a percentage of the average aggregate value of the Fund's shares maintained in omnibus accounts up to the lesser of the amount charged by the servicing agent or a cap established by the Board from time to time.
The Transfer Agent also receives compensation from the Fund for various shareholder services and reimbursements for certain out-of-pocket fees. Total transfer agency fees for Class K and Class R5 shares are subject to an annual limitation of not more than
0.05% of the average daily net assets attributable to each share class. Class Y shares do not pay transfer agency fees.
For the year ended August 31, 2016, the Fund's effective transfer agency fee rates as a percentage of average daily net assets of each class were as follows:
Class A | | | 0.15 | % | |
Class B | | | 0.15 | | |
Class C | | | 0.15 | | |
Class K | | | 0.05 | | |
Class R | | | 0.15 | | |
Class R4 | | | 0.15 | | |
Class R5 | | | 0.05 | | |
Class Z | | | 0.15 | | |
The Fund and certain other associated investment companies have severally, but not jointly, guaranteed the performance and observance of all the terms and conditions of a lease entered into by Seligman Data Corp. (SDC), the former transfer agent, including the payment of rent by SDC (the Guaranty). SDC was the legacy Seligman funds' former transfer agent.
The lease and the Guaranty expire in January 2019. At August 31, 2016, the Fund's total potential future obligation over the life of the Guaranty is $16,204. The liability remaining at August 31, 2016 for non-recurring charges associated with the lease amounted to $10,317 and is recorded as a part of the payable for other expenses in the Statement of Assets and Liabilities. SDC is owned by six associated investment companies, including the Fund. The Fund's ownership interest in SDC at August 31, 2016 is recorded as a part of other assets in the Statement of Assets and Liabilities at a cost of $3,553, which approximates the fair value of the ownership interest.
An annual minimum account balance fee of $20 may apply to certain accounts with a value below the applicable share class's initial minimum investment requirements to reduce the impact of small accounts on transfer agency fees. These minimum account balance fees are remitted to the Fund and recorded as part of expense reductions in the Statement of Operations. For the year ended August 31, 2016, these minimum account balance fees reduced total expenses of the Fund by $2,320.
Plan Administration Fees
Under a Plan Administration Services Agreement with the Transfer Agent, the Fund pays an annual fee at a rate of 0.25% of the Fund's average daily net assets attributable
Annual Report 2016
54
NOTES TO FINANCIAL STATEMENTS (continued)
August 31, 2016
to Class K shares for the provision of various administrative, recordkeeping, communication and educational services.
Distribution and Service Fees
The Fund has an agreement with Columbia Management Investment Distributors, Inc. (the Distributor), an affiliate of the Investment Manager and a wholly-owned subsidiary of Ameriprise Financial, for distribution and shareholder services. The Board has approved, and the Fund has adopted, distribution and shareholder service plans (the Plans) applicable to certain share classes, which set the distribution and service fees for the Fund. These fees are calculated daily and are intended to compensate the Distributor and/or eligible selling and/or servicing agents for selling shares of the Fund and providing services to investors.
Under the Plans, the Fund pays a monthly service fee to the Distributor at the maximum annual rate of 0.25% of the average daily net assets attributable to Class A, Class B and Class C shares of the Fund. Also under the Plans, the Fund pays a monthly distribution fee to the Distributor at the maximum annual rates of 0.10%, 0.75%, 0.75% and 0.50% of the average daily net assets attributable to Class A, Class B, Class C and Class R shares of the Fund, respectively.
Although the Fund may pay distribution and service fees up to a maximum annual rate of 0.35% of the Fund's average daily net assets attributable to Class A shares (comprised of up to 0.10% for distribution services and up to 0.25% for shareholder liaison services), the Fund currently limits such fees to an aggregate fee of not more than 0.25% of the Fund's average daily net assets attributable to Class A shares.
Sales Charges
Sales charges, including front-end charges and CDSCs, received by the Distributor for distributing Fund shares were $10,825,414 for Class A, $603 for Class B, and $131,861 for Class C shares for the year ended August 31, 2016.
Expenses Waived/Reimbursed by the Investment Manager and its Affiliates
The Fund's expense ratio is subject to an expense reimbursement arrangement pursuant to which fees will be waived and/or expenses reimbursed (excluding certain fees and expenses described below), so that the Fund's net operating expenses, after giving effect to fees waived/expenses reimbursed and any balance credits
and/or overdraft charges from the Fund's custodian, do not exceed the annual rates of:
| | | Contractual
Expense Cap
January 1, 2016
through
December 31, 2016 | | Voluntary
Expense Cap
Prior to
January 1, 2016 | |
Class A | | | 1.20 | % | | | 1.20 | % | |
Class B | | | 1.95 | | | | 1.95 | | |
Class C | | | 1.95 | | | | 1.95 | | |
Class K | | | 1.14 | | | | 1.14 | | |
Class R | | | 1.45 | | | | 1.45 | | |
Class R4 | | | 0.95 | | | | 0.95 | | |
Class R5 | | | 0.89 | | | | 0.89 | | |
Class Y | | | 0.84 | | | | 0.84 | | |
Class Z | | | 0.95 | | | | 0.95 | | |
The contractual agreement may be modified or amended only with approval from the Investment Manager, certain of its affiliates and the Fund. Under the arrangements, the following fees and expenses are excluded from the waiver/reimbursement commitment, and therefore will be paid by the Fund, if applicable: taxes (including foreign transaction taxes), expenses associated with investments in affiliated and non-affiliated pooled investment vehicles (including mutual funds and exchange-traded funds), transaction costs and brokerage commissions, costs related to any securities lending program, dividend and interest expenses associated with securities sold short, inverse floater program fees and expenses, transaction charges and interest on borrowed money, interest and infrequent and/or unusual expenses. Any fees waived and/or expenses reimbursed under the expense reimbursement arrangements described above are not recoverable by the Investment Manager or its affiliates in future periods.
Note 4. Federal Tax Information
The timing and character of income and capital gain distributions are determined in accordance with income tax regulations, which may differ from GAAP because of temporary or permanent book to tax differences.
At August 31, 2016, these differences are primarily due to differing treatment for principal and/or interest from fixed income securities, deferral/reversal of wash sale losses, Trustees' deferred compensation, distribution reclassifications, foreign currency transactions, re-characterization of distributions for investments and derivative investments. To the extent these differences are permanent, reclassifications are made among the components of the Fund's net assets in the Statement of
Annual Report 2016
55
NOTES TO FINANCIAL STATEMENTS (continued)
August 31, 2016
Assets and Liabilities. Temporary differences do not require reclassifications.
In the Statement of Assets and Liabilities the following reclassifications were made:
Undistributed net investment income | | $ | (130,906 | ) | |
Accumulated net realized loss | | | 130,906 | | |
Net investment income (loss) and net realized gains (losses), as disclosed in the Statement of Operations, and net assets were not affected by this reclassification.
The tax character of distributions paid during the years indicated was as follows:
Year Ended August 31, | | 2016 | | 2015 | |
Ordinary income | | $ | 61,529,208 | | | $ | 27,904,599 | | |
Long-term capital gains | | | 68,440,769 | | | | 83,223,111 | | |
Total | | $ | 129,969,977 | | | $ | 111,127,710 | | |
Short-term capital gain distributions, if any, are considered ordinary income distributions for tax purposes.
At August 31, 2016, the components of distributable earnings on a tax basis were as follows:
Undistributed ordinary income | | $ | 12,825,324 | | |
Undistributed long-term capital gains | | | 10,819,598 | | |
Net unrealized appreciation | | | 589,450,698 | | |
At August 31, 2016, the cost of investments for federal income tax purposes was $5,007,232,763 and the aggregate gross unrealized appreciation and depreciation based on that cost was:
Unrealized appreciation | | $ | 612,405,085 | | |
Unrealized depreciation | | | (22,954,387 | ) | |
Net unrealized appreciation | | $ | 589,450,698 | | |
Management of the Fund has concluded that there are no significant uncertain tax positions in the Fund that would require recognition in the financial statements. However, management's conclusion may be subject to review and adjustment at a later date based on factors including, but not limited to, new tax laws, regulations, and administrative interpretations (including relevant court decisions). Generally, the Fund's federal tax returns for the prior three fiscal years remain subject to examination by the Internal Revenue Service.
Note 5. Portfolio Information
The cost of purchases and proceeds from sales of securities, excluding short-term investments and derivatives, if any, aggregated to $4,292,374,815 and
$2,466,890,420, respectively, for the year ended August 31, 2016, of which $1,158,311,303 and $895,783,817, respectively, were U.S. government securities. The amount of purchase and sale activity impacts the portfolio turnover rate reported in the Financial Highlights.
Note 6. Affiliated Money Market Fund
The Fund invests in Columbia Short-Term Cash Fund, an affiliated money market fund established for the exclusive use by the Fund and other affiliated funds (the Affiliated MMF). The income earned by the Fund from such investments is included as Dividends — affiliated issuers in the Statement of Operations. As an investing fund, the Fund indirectly bears its proportionate share of the expenses of the Affiliated MMF. Effective October 1, 2016, the Affiliated MMF prices its shares with a floating net asset value (NAV) and no longer seeks to maintain a stable NAV. In addition, the Board of the Affiliated MMF may impose a fee on redemptions (sometimes referred to as a liquidity fee) or temporarily suspend redemptions (sometimes referred to as imposing a redemption gate) in the event its liquidity falls below regulatory limits.
Note 7. Line of Credit
The Fund has access to a revolving credit facility whereby the Fund may borrow for the temporary funding of shareholder redemptions or for other temporary or emergency purposes. Effective December 8, 2015, Citibank, N.A. and HSBC Bank USA, N.A. joined JPMorgan Chase Bank, N.A. (JPMorgan) as lead of a syndicate of banks under the credit facility, which is a collective agreement between the Fund and certain other funds managed by the Investment Manager, severally and not jointly, that permits collective borrowings up to $1 billion. Interest is charged to each participating fund based on its borrowings at a rate equal to the higher of (i) the overnight federal funds rate plus 1.00% or (ii) the one-month LIBOR rate plus 1.00%. Each borrowing under the credit facility matures no later than 60 days after the date of borrowing. The Fund also pays a commitment fee equal to its pro rata share of the amount of the credit facility at a rate of 0.15% per annum. The commitment fee is included in other expenses in the Statement of Operations. Prior to December 8, 2015, JPMorgan was the sole lead bank under the credit facility agreement that permitted borrowings up to $550 million under the same terms and interest rates as described above with the exception of the commitment fee which was charged at a rate of 0.075% per annum.
The Fund had no borrowings during the year ended August 31, 2016.
Annual Report 2016
56
NOTES TO FINANCIAL STATEMENTS (continued)
August 31, 2016
Note 8. Significant Risks
Shareholder Concentration Risk
At August 31, 2016, one unaffiliated shareholder of record owned 10.7% of the outstanding shares of the Fund in one or more accounts. The Fund has no knowledge about whether any portion of those shares was owned beneficially. Affiliated shareholders of record owned 40.4% of the outstanding shares of the Fund in one or more accounts. Subscription and redemption activity by concentrated accounts may have a significant effect on the operations of the Fund. In the case of a large redemption, the Fund may be forced to sell investments at inopportune times, including its liquid or more liquid positions, resulting in Fund losses and the Fund holding a higher percentage of less liquid or illiquid securities. Large redemptions could result in decreased economies of scale and increased operating expenses for non-redeeming Fund shareholders.
Credit Risk
Credit risk is the risk that the value of debt securities in the Fund's portfolio may decline because the issuer may default and fail to pay interest or repay principal when due. Rating agencies assign credit ratings to debt securities to indicate their credit risk. Lower rated or unrated debt securities held by the Fund may present increased credit risk as compared to higher-rated debt securities.
Interest Rate Risk
Interest rate risk is the risk of losses attributable to changes in interest rates. In general, if prevailing interest rates rise, the values of debt securities tend to fall, and if interest rates fall, the values of debt securities tend to rise. Actions by governments and central banking authorities can result in increases in interest rates. Increasing interest rates may negatively affect the value of debt securities held by the Fund, resulting in a negative impact on the Fund's performance and net asset value per share. In general, the longer the maturity or duration of a debt security, the greater its sensitivity to changes in interest rates.
Liquidity Risk
Liquidity risk is the risk associated with a lack of marketability of investments which may make it difficult to sell the investment at a desirable time or price. Changing regulatory, market or other conditions or environments (for example, the interest rate or credit environments) may adversely affect the liquidity of the Fund's investments. The Fund may have to accept a lower selling price for the holding, sell other investments, or forego another, more appealing investment opportunity.
Generally, the less liquid the market at the time the Fund sells a portfolio investment, the greater the risk of loss or decline of value to the Fund. A less liquid market can lead to an increase in Fund redemptions, which may negatively impact Fund performance and net asset value per share, including, for example, if the Fund is forced to sell securities in a down market.
Note 9. Subsequent Events
Management has evaluated the events and transactions that have occurred through the date the financial statements were issued and noted no items requiring adjustment of the financial statements or additional disclosure.
Note 10. Information Regarding Pending and Settled Legal Proceedings
Ameriprise Financial and certain of its affiliates have historically been involved in a number of legal, arbitration and regulatory proceedings, including routine litigation, class actions, and governmental actions, concerning matters arising in connection with the conduct of their business activities. Ameriprise Financial believes that the Funds are not currently the subject of, and that neither Ameriprise Financial nor any of its affiliates are the subject of, any pending legal, arbitration or regulatory proceedings that are likely to have a material adverse effect on the Funds or the ability of Ameriprise Financial or its affiliates to perform under their contracts with the Funds. Ameriprise Financial is required to make quarterly (10-Q), annual (10-K) and, as necessary, 8-K filings with the Securities and Exchange Commission (SEC) on legal and regulatory matters that relate to Ameriprise Financial and its affiliates. Copies of these filings may be obtained by accessing the SEC website at www.sec.gov.
There can be no assurance that these matters, or the adverse publicity associated with them, will not result in increased fund redemptions, reduced sale of fund shares or other adverse consequences to the Funds. Further, although we believe proceedings are not likely to have a material adverse effect on the Funds or the ability of Ameriprise Financial or its affiliates to perform under their contracts with the Funds, these proceedings are subject to uncertainties and, as such, we are unable to estimate the possible loss or range of loss that may result. An adverse outcome in one or more of these proceedings could result in adverse judgments, settlements, fines, penalties or other relief that could have a material adverse effect on the consolidated financial condition or results of operations of Ameriprise Financial.
Annual Report 2016
57
REPORT OF INDEPENDENT REGISTERED PUBLIC ACCOUNTING FIRM
To the Trustees of Columbia Funds Series Trust I and the Shareholders of
Columbia Balanced Fund
In our opinion, the accompanying statement of assets and liabilities, including the portfolio of investments, and the related statements of operations and of changes in net assets and the financial highlights present fairly, in all material respects, the financial position of Columbia Balanced Fund (the "Fund," a series of Columbia Funds Series Trust I) at August 31, 2016, and the results of its operations, the changes in its net assets and the financial highlights for each of the periods indicated, in conformity with accounting principles generally accepted in the United States of America. These financial statements and financial highlights (hereafter referred to as "financial statements") are the responsibility of the Fund's management. Our responsibility is to express an opinion on these financial statements based on our audits. We conducted our audits of these financial statements in accordance with the standards of the Public Company Accounting Oversight Board (United States). Those standards require that we plan and perform the audit to obtain reasonable assurance about whether the financial statements are free of material misstatement. An audit includes examining, on a test basis, evidence supporting the amounts and disclosures in the financial statements, assessing the accounting principles used and significant estimates made by management, and evaluating the overall financial statement presentation. We believe that our audits, which included confirmation of securities at August 31, 2016 by correspondence with the custodian, brokers and transfer agent, and the application of alternative auditing procedures where such confirmations had not been received, provide a reasonable basis for our opinion.
PricewaterhouseCoopers LLP
Minneapolis, MN
October 21, 2016
Annual Report 2016
58
FEDERAL INCOME TAX INFORMATION
(Unaudited)
The Fund hereby designates the following tax attributes for the fiscal year ended August 31, 2016. Shareholders will be notified in early 2017 of the amounts for use in preparing 2016 income tax returns.
Tax Designations
Qualified Dividend Income | | | 100.00 | % | |
Dividends Received Deduction | | | 100.00 | % | |
Capital Gain Dividend | | $ | 11,399,880 | | |
Qualified Dividend Income. For taxable, non-corporate shareholders, the percentage of ordinary income distributed during the fiscal year that represents qualified dividend income subject to reduced tax rates.
Dividends Received Deduction. The percentage of ordinary income distributed during the fiscal year that qualifies for the corporate dividends received deduction.
Capital Gain Dividend. The Fund designates as a capital gain dividend the amount reflected above, or if subsequently determined to be different, the net capital gain of such fiscal period.
Annual Report 2016
59
Shareholders elect the Board that oversees the Fund's operations. The Board appoints officers who are responsible for day-to-day business decisions based on policies set by the Board. The following table provides basic biographical information about the Fund's Trustees, including their principal occupations during the past five years, although specific titles for individuals may have varied over the period. The year set forth beneath Length of Service in the table below is the year in which the Trustee was first appointed or elected as Trustee to any Fund currently in the Columbia Funds Complex or a predecessor thereof. Under current Board policy, members serve terms of indefinite duration.
Trustees
Independent Trustees
Name,
Address,
Year of Birth | | Position Held With
the Trust and Length of
Service | | Principal Occupation(s)
During the Past Five Years
and Other Relevant
Professional Experience | | Number of
Funds in the
Columbia Funds
Complex
Overseen | | Other Directorships
Held by Trustee During
the Past Five Years | |
Janet Langford Carrig
c/o Columbia
Management Investment Advisers, LLC,
225 Franklin Street
Mail Drop BX32 05228,
Boston, MA 02110
1957 | | Trustee 1996 | | Senior Vice President, General Counsel and Corporate Secretary, ConocoPhillips (integrated energy company) since September 2007 | | | 56 | | | None | |
Douglas A. Hacker
c/o Columbia Management Investment Advisers, LLC,
225 Franklin Street
Mail Drop BX32 05228,
Boston, MA 02110
1955 | | Trustee and Chairman of the Board 1996 | | Independent business executive since May 2006; Executive Vice President — Strategy of United Airlines from December 2002 to May 2006; President of UAL Loyalty Services (airline marketing company) from September 2001 to December 2002; Executive Vice President and Chief Financial Officer of United Airlines from July 1999 to September 2001 | | | 56 | | | Spartan Nash Company (food distributor); Nash Finch Company (food distributor) from 2005 to 2013; Aircastle Limited (aircraft leasing); SeaCube Container Leasing Ltd. (container leasing) from 2010 to 2013; and Travelport Worldwide Limited (travel information technology) | |
Nancy T. Lukitsh
c/o Columbia Management Investment Advisers, LLC,
225 Franklin Street
Mail Drop BX32 05228,
Boston, MA 02110
1956 | | Trustee 2011 | | Senior Vice President, Partner and Director of Marketing, Wellington Management Company, LLP (investment adviser) from 1997 to 2010; Chair, Wellington Management Portfolios (commingled non-U.S. investment pools) from 2007 to 2010; Director, Wellington Trust Company, NA and other Wellington affiliates from 1997 to 2010 | | | 56 | | | None | |
Annual Report 2016
60
TRUSTEES AND OFFICERS (continued)
Independent Trustees (continued)
Name,
Address,
Year of Birth | | Position Held With
the Trust and Length of
Service | | Principal Occupation(s)
During the Past Five Years
and Other Relevant
Professional Experience | | Number of
Funds in the
Columbia Funds
Complex
Overseen | | Other Directorships
Held by Trustee During
the Past Five Years | |
William E. Mayer
c/o Columbia Management Investment Advisers, LLC,
225 Franklin Street
Mail Drop BX32 05228,
Boston, MA 02110
1940 | | Trustee 1991 | | Partner, Park Avenue Equity Partners (private equity) since February 1999 | | | 56 | | | DynaVox Inc. (speech creation); Lee Enterprises (print media); WR Hambrecht + Co. (financial service provider) from 2000 to 2012; BlackRock Capital Investment Corporation (investment company); and Premier, Inc. (healthcare) | |
David M. Moffett
c/o Columbia Management Investment Advisers, LLC,
225 Franklin Street
Mail Drop BX32 05228,
Boston, MA 02110
1952 | | Trustee 2011 | | Retired. Consultant to Bridgewater and Associates | | | 56 | | | Director of CIT Bank, CIT Group Inc. (commercial and consumer finance); eBay Inc. (online trading community); Genworth Financial, Inc. (financial and insurance products and services); Paypal Holdings Inc. (payment and data processing services); and Trustee University of Oklahoma Foundation | |
Charles R. Nelson
c/o Columbia Management Investment Advisers, LLC,
225 Franklin Street
Mail Drop BX32 05228,
Boston, MA 02110
1942 | | Trustee 1981 | | Retired. Professor Emeritus, University of Washington since 2011; Professor of Economics, University of Washington from 1976 to 2011; Ford and Louisa Van Voorhis Professor of Political Economy, University of Washington from 1993 to 2011; Adjunct Professor of Statistics, University of Washington from 1980 to 2011; Associate Editor, Journal of Money, Credit and Banking from September 1993 to 2008; consultant on econometric and statistical matters | | | 56 | | | None | |
John J. Neuhauser
c/o Columbia Management Investment Advisers, LLC,
225 Franklin Street
Mail Drop BX32 05228,
Boston, MA 02110
1943 | | Trustee 1984 | | President, Saint Michael's College since August 2007; Director or Trustee of several non-profit organizations, including University of Vermont Medical Center; Academic Vice President and Dean of Faculties, Boston College from August 1999 to October 2005; University Professor, Boston College from November 2005 to August 2007 | | | 56 | | | Liberty All-Star Equity Fund and Liberty All-Star Growth Fund (closed-end funds) | |
Annual Report 2016
61
TRUSTEES AND OFFICERS (continued)
Independent Trustees (continued)
Name,
Address,
Year of Birth | | Position Held With
the Trust and Length of
Service | | Principal Occupation(s)
During the Past Five Years
and Other Relevant
Professional Experience | | Number of
Funds in the
Columbia Funds
Complex
Overseen | | Other Directorships
Held by Trustee During
the Past Five Years | |
Patrick J. Simpson
c/o Columbia Management Investment Advisers, LLC,
225 Franklin Street
Mail Drop BX32 05228,
Boston, MA 02110
1944 | | Trustee 2000 | | Of Counsel, Perkins Coie LLP (law firm) since 2015; Partner, Perkins Coie LLP from 1988 to 2014 | | | 56 | | | None | |
Anne-Lee Verville
c/o Columbia Management Investment Advisers, LLC,
225 Franklin Street
Mail Drop BX32 05228,
Boston, MA 02110
1945 | | Trustee 1998 | | Retired. General Manager, Global Education Industry from 1994 to 1997, President — Application Systems Division from 1991 to 1994, Chief Financial Officer — US Marketing & Services from 1988 to 1991, and Chief Information Officer from 1987 to 1988, IBM Corporation (computer and technology) | | | 56 | | | Enesco Group, Inc. (producer of giftware and home and garden decor products) from 2001 to 2006 | |
Consultant to the Trustees*
Name,
Address,
Year of Birth | | Position Held With
the Trust and Length of
Service | | Principal Occupation(s)
During the Past Five Years
and Other Relevant
Professional Experience | | Number of
Funds in the
Columbia Funds
Complex
Overseen | | Other Directorships
Held by Trustee During
the Past Five Years | |
J. Kevin Connaughton
c/o Columbia
Management Investment Advisers, LLC,
225 Franklin Street
Mail Drop BX32 05228,
Boston, MA 02110
1964 | | Trustee Consultant 2016 | | Trustee Consultant, Columbia Funds since March 2016; Managing Director and General Manager of Mutual Fund Products, Columbia Management Investment Advisers, LLC from May 2010 to February 2015; President, Columbia Funds from 2009 to 2015; and senior officer of Columbia Funds and affiliated funds from 2003 to 2015 | | | 56 | | | Board of Governors, Gateway Healthcare since January 2016; Trustee, New Century Portfolios since March 2015; and Director, The Autism Project since March 2015 | |
* J. Kevin Connaughton was appointed consultant to the Trustees effective March 1, 2016. Shareholders of the Funds are expected to be asked to elect Mr. Connaughton as a Trustee at a future shareholder meeting.
Annual Report 2016
62
TRUSTEES AND OFFICERS (continued)
Interested Trustee Affiliated with Investment Manager*
Name,
Address,
Year of Birth | | Position Held With
the Trust and Length of
Service | | Principal Occupation(s)
During the Past Five Years
and Other Relevant
Professional Experience | | Number of
Funds in the
Columbia Funds
Complex
Overseen | | Other Directorships
Held by Trustee During
the Past Five Years | |
William F. Truscott
c/o Columbia Management Investment Advisers, LLC,
225 Franklin Street
Boston, MA 02110
1960 | | Trustee 2012 | | Chairman of the Board and President, Columbia Management Investment Advisers, LLC since May 2010 and February 2012, respectively; Chief Executive Officer, Global Asset Management, Ameriprise Financial, Inc. since September 2012 (previously Chief Executive Officer, U.S. Asset Management & President, Annuities, May 2010- September 2012); Director and Chief Executive Officer, Columbia Management Investment Distributors, Inc. since May 2010 and February 2012, respectively; Chairman of the Board and Chief Executive Officer, RiverSource Distributors, Inc. since 2006; Director, Threadneedle Asset Management Holdings, SARL since 2014; President and Chief Executive Officer, Ameriprise Certificate Company, 2006-August 2012. | | | 184 | | | Trustee to other Columbia Funds since 2001; Chairman of the Board, Columbia Management Investment Advisers, LLC since May 2010; Director, Columbia Management Investment Distributors, Inc. since May 2010; Former Director, Ameriprise Certificate Company, 2006-January 2013 | |
* Interested person (as defined under the 1940 Act) by reason of being an officer, director, security holder and/or employee of the Investment Manager or Ameriprise Financial.
The Statement of Additional Information has additional information about the Fund's Board members and is available, without charge, upon request by calling 800.345.6611; contacting your financial intermediary; or visiting investor.columbiathreadneedleus.com.
Annual Report 2016
63
TRUSTEES AND OFFICERS (continued)
The Board has appointed officers who are responsible for day-to-day business decisions based on policies it has established. The officers serve at the pleasure of the Board. The following table provides basic information about the Officers of the Fund, including principal occupations during the past five years, although their specific titles may have varied over the period. In addition to Mr. Truscott, who is Senior Vice President, the Fund's other officers are:
Fund Officers
Name,
Address and
Year of Birth | | Position and Year
First Appointed to
Position for any Fund
in the Columbia
Funds Complex or a
Predecessor Thereof | |
Principal Occupation(s) During Past Five Years | |
Christopher O. Petersen
5228 Ameriprise Financial Center
Minneapolis, MN 55474
Born 1970 | | President and Principal Executive Officer (2015) | | Vice President and Lead Chief Counsel, Ameriprise Financial, Inc. since January 2015 (previously, Vice President and Chief Counsel January 2010-December 2014; officer of Columbia Funds and affiliated funds since 2007. | |
Michael G. Clarke
225 Franklin Street
Boston, MA 02110
Born 1969 | | Treasurer (2011), Chief Financial Officer (2009) and Chief Accounting Officer (2015) | | Vice President — Mutual Fund Administration, Columbia Management Investment Advisers, LLC, since May 2010; senior officer of Columbia Funds and affiliated funds since 2002. | |
Paul B. Goucher
100 Park Avenue
New York, NY 10017
Born 1968 | | Senior Vice President (2011), Chief Legal Officer (2015) and Assistant Secretary (2008) | | Vice President and Lead Chief Counsel, Ameriprise Financial, Inc. since November 2008 and January 2013, respectively (previously Chief Counsel, January 2010-January 2013); Vice President, Chief Legal Officer and Assistant Secretary, Columbia Management Investment Advisers, LLC since May 2010. | |
Thomas P. McGuire
225 Franklin Street
Boston, MA 02110
Born 1972 | | Senior Vice President and Chief Compliance Officer (2012) | | Vice President — Asset Management Compliance, Ameriprise Financial, Inc., since May 2010; Chief Compliance Officer, Ameriprise Certificate Company since September 2010. | |
Colin Moore
225 Franklin Street
Boston, MA 02110
Born 1958 | | Senior Vice President (2010) | | Executive Vice President and Global Chief Investment Officer, Ameriprise Financial, Inc., since July 2013; Executive Vice President and Global Chief Investment Officer, Columbia Management Investment Advisers, LLC since July 2013 (previously Director and Global Chief Investment Officer, 2010-2013). | |
Michael E. DeFao
225 Franklin Street
Boston, MA 02110
Born 1968 | | Vice President (2011) and Assistant Secretary (2010) | | Vice President and Chief Counsel, Ameriprise Financial, Inc. since May 2010. | |
Amy Johnson
5228 Ameriprise Financial Center
Minneapolis, MN 55474
Born 1965 | | Vice President (2006) | | Managing Director and Global Head of Operations, Columbia Management Investment Advisers, LLC since April 2016 (previously Managing Director and Chief Operating Officer, 2010-2016). | |
Lyn Kephart-Strong
5228 Ameriprise
Financial Center
Minneapolis, MN 55474
Born 1960 | | Vice President (2015) | | President, Columbia Management Investment Services Corp. since October 2014; Vice President & Resolution Officer, Ameriprise Trust Company since August 2009. | |
Ryan C. Larrenaga
225 Franklin Street
Boston, MA 02110
Born 1970 | | Vice President and Secretary (2015) | | Vice President and Group Counsel, Ameriprise Financial, Inc. since August 2011; officer of Columbia Funds and affiliated funds since 2005. | |
Annual Report 2016
64
BOARD CONSIDERATION AND APPROVAL OF MANAGEMENT
AGREEMENT
On June 10, 2016, the Board of Trustees (the Board) and the Trustees who are not interested persons (as defined in the Investment Company Act of 1940) (the Independent Trustees) of Columbia Funds Series Trust I (the Trust) unanimously approved the continuation of the Management Agreement (the Management Agreement) with Columbia Management Investment Advisers, LLC (the Investment Manager) with respect to Columbia Balanced Fund (the Fund), a series of the Trust. As detailed below, the Board's Advisory Fees and Expenses Committee (the Committee) and the Board met on multiple occasions to review and discuss, both among themselves and with the management team of the Investment Manager, materials provided by the Investment Manager and others before determining to approve the continuation of the Management Agreement.
In connection with their deliberations regarding the continuation of the Management Agreement, the Committee and the Board evaluated materials requested from the Investment Manager regarding the Fund and the Management Agreement, and discussed these materials with representatives of the Investment Manager at Committee meetings held on March 8, 2016, April 27, 2016 and June 9, 2016 and at Board meetings held on March 9, 2016 and June 10, 2016. In addition, the Board considers matters bearing on the Management Agreement at most of its other meetings throughout the year and meets regularly with senior management of the Trust and the Investment Manager. Through the Board's Investment Oversight Committees, Trustees also meet with selected portfolio managers of the funds the Trustees oversee and other investment personnel at various times throughout the year. The Committee and the Board also consulted with its independent fee consultant, Fund counsel and with the Independent Trustees' independent legal counsel, who advised on various matters with respect to the Committee's and the Board's considerations and otherwise assisted the Committee and the Board in their deliberations. On June 9, 2016, the Committee recommended that the Board approve the continuation of the Management Agreement. On June 10, 2016, the Board, including the Independent Trustees, voting separately, unanimously approved the continuation of the Management Agreement for the Fund.
The Committee and the Board considered all information that they, their legal counsel or the Investment Manager believed reasonably necessary to evaluate and to determine whether to recommend for approval or approve the continuation of the Management Agreement. The information and factors considered by the Committee and the Board in recommending for approval or approving the continuation of the Management Agreement for the Fund included the following:
• Information on the investment performance of the Fund relative to the performance of a group of mutual funds determined to be comparable to the Fund by an independent third-party data provider, as well as performance relative to benchmarks;
• Information on the Fund's management fees and total expenses, including information comparing the Fund's expenses to those of a group of comparable mutual funds, as determined by the independent third-party data provider;
• The Investment Manager's agreement to contractually limit or cap total operating expenses for the Fund through December 31, 2017 so that total operating expenses (excluding certain fees and expenses, such as transaction costs and certain other investment related expenses, interest, taxes, acquired fund fees and expenses, and infrequent and/or unusual expenses) would not exceed a specified annual rate, as a percentage of the Fund's net assets;
• The terms and conditions of the Management Agreement;
• The current and proposed terms and conditions of other agreements and arrangements with affiliates of the Investment Manager relating to the operations of the Fund, including agreements with respect to the provision of distribution and transfer agency services to the Fund;
• Descriptions of various functions performed by the Investment Manager under the Management Agreement, including portfolio management and portfolio trading practices;
• Information regarding the management fees of similarly-managed portfolios of other clients of the Investment Manager, including institutional separate accounts;
Annual Report 2016
65
BOARD CONSIDERATION AND APPROVAL OF MANAGEMENT
AGREEMENT (continued)
• Information regarding the reputation, regulatory history and resources of the Investment Manager, including information regarding senior management, portfolio managers and other personnel;
• Information regarding the capabilities of the Investment Manager with respect to compliance monitoring services, including an assessment of the Investment Manager's compliance system by the Fund's Chief Compliance Officer; and
• The profitability to the Investment Manager and its affiliates from their relationships with the Fund.
Nature, Extent and Quality of Services Provided under the Management Agreement
The Committee and the Board considered the nature, extent and quality of services provided to the Fund by the Investment Manager and its affiliates under the Management Agreement and under separate agreements for the provision of transfer agency services, and the resources dedicated to the Fund and the other Columbia Funds by the Investment Manager and its affiliates. The Committee and the Board considered, among other things, the Investment Manager's ability to attract, motivate and retain highly qualified research, advisory and supervisory investment professionals (including personnel and other resources, compensation programs for personnel involved in fund management, reputation and other attributes), the portfolio management services provided by those investment professionals, and the quality of the Investment Manager's investment research capabilities and trade execution services. The Committee and the Board also considered the potential benefits to shareholders of investing in a mutual fund that is part of a fund complex offering exposure to a variety of asset classes and investment disciplines and providing a variety of fund and shareholder services.
The Committee and the Board also considered the professional experience and qualifications of the senior personnel of the Investment Manager, which included consideration of the Investment Manager's experience with similarly-structured funds. The Committee and the Board noted the compliance programs of and the compliance-related resources provided to the Fund by the Investment Manager and its affiliates, and considered the Investment Manager's ability to provide administrative services to the Fund and coordinate the activities of the Fund's other service providers. After reviewing these and related factors, the Committee and the Board concluded, within the context of their overall conclusions, that the nature, extent and quality of the services provided to the Fund under the Management Agreement supported the continuation of the Management Agreement.
Investment Performance
The Committee and the Board reviewed information about the performance of the Fund over various time periods, including performance information relative to benchmarks and information based on reports of the independent third-party data provider that compared the performance of the Fund to the performance of a group of comparable mutual funds, and data provided by the independent fee consultant. The Committee and the Board also reviewed a description of the third party's methodology for identifying the Fund's peer groups for purposes of performance and expense comparisons.
The Committee and the Board noted that, through December 31, 2015, the Fund's performance was in the fourth, sixth and fourth percentile (where the best performance would be in the first percentile) of its category selected by the independent third-party data provider for the purposes of performance comparisons for the one-, three- and five- year periods, respectively.
The Committee and the Board also considered the Investment Manager's performance and reputation generally, the Investment Manager's historical responsiveness to Board concerns about performance, and the Investment Manager's willingness to take steps intended to improve performance. After reviewing these and related factors, the Committee and the Board concluded, within the context of their overall conclusions, that the performance of the Fund and the Investment Manager was sufficient, in light of other considerations, to warrant the continuation of the Management Agreement.
Investment Management Fee Rates and Other Expenses
The Committee and the Board considered the management fees charged to the Fund under the Management Agreement as well as the total expenses incurred by the Fund. In assessing the reasonableness of the fees
Annual Report 2016
66
BOARD CONSIDERATION AND APPROVAL OF MANAGEMENT
AGREEMENT (continued)
under the Management Agreement, the Committee and the Board considered, among other information, the Fund's management fee and its total expense ratio as a percentage of average daily net assets. The Committee and the Board considered data provided by the independent fee consultant. The Committee and the Board noted that, as of December 31, 2015, the Fund's actual management fee and net total expense ratio are ranked in the third and second quintiles, respectively, (where the lowest fees and expenses would be in the first quintile) against the Fund's expense universe as determined by the independent third-party data provider for purposes of expense comparison. The Committee and the Board also took into account the fee waiver and expense limitation arrangements agreed to by the Investment Manager, as noted above.
The Committee and the Board also received and considered information about the management fees charged by the Investment Manager to institutional separate accounts. In considering the fees charged to those accounts, the Committee and the Board took into account, among other things, the Investment Manager's representations about the differences between managing mutual funds as compared to other types of accounts, including differences in the services provided, differences in the risk profile of such business for the Investment Manager and the additional resources required to manage mutual funds effectively. The Committee and the Board also received and considered information about the fees charged by the Investment Manager for sub-advisory services provided to comparable unaffiliated funds. In evaluating the Fund's management fees, the Committee and the Board also took into account the demands, complexity and quality of the investment management of the Fund.
After reviewing these and related factors, the Committee and the Board concluded, within the context of their overall conclusions, that the management fee rates and expenses of the Fund were sufficient, in light of other considerations, to warrant the continuation of the Management Agreement.
Costs of Services Provided and Profitability
The Committee and the Board also took note of the costs the Investment Manager and its affiliates incur in connection with the services provided (both on an absolute and relative basis) and the profitability to the Investment Manager and its affiliates in connection with their relationships with the Fund.
The Committee and the Board also considered the compensation directly or indirectly received by the Investment Manager's affiliates in connection with their relationships with the Fund. The Committee and the Board reviewed information provided by management as to the profitability to the Investment Manager and its affiliates of their relationships with the Fund, information about the allocation of expenses used to calculate profitability, and comparisons of profitability levels realized in 2015 to profitability levels realized in 2014. When reviewing profitability, the Committee and the Board also considered court cases in which adviser profitability was an issue in whole or in part, the performance of similarly managed funds, the performance of the Fund, and the expense ratio of the Fund. In addition, the Committee and the Board considered information provided by the Investment Manager regarding the Investment Manager's financial condition and comparing its profitability to that of other asset management firms that are, or are subsidiaries of, publicly traded companies. In this regard, the Committee and the Board also considered data provided by the independent fee consultant.
After reviewing these and related factors, the Committee and the Board concluded, within the context of their overall conclusions, that the costs of services provided and the profitability to the Investment Manager and its affiliates from their relationships with the Fund supported the continuation of the Management Agreement.
Economies of Scale
The Committee and the Board considered the potential existence of economies of scale in the provision by the Investment Manager of services to the Fund, to groups of related funds, and to the Investment Manager's investment advisory clients as a whole, and whether those economies of scale were shared with the Fund through breakpoints in investment management fees or other means, such as expense limitation arrangements and additional investments by the Investment Manager in investment, trading and compliance resources. The Committee and the Board noted that the management fee schedules for the Fund contained breakpoints that would reduce the fee rate on assets above specified threshold levels.
Annual Report 2016
67
BOARD CONSIDERATION AND APPROVAL OF MANAGEMENT
AGREEMENT (continued)
In considering these matters, the Committee and the Board also considered the costs of the services provided and the profitability to the Investment Manager and its affiliates from their relationships with the Fund, as discussed above. After reviewing these and related factors, the Committee and the Board concluded, within the context of their overall conclusions, that the extent to which any economies of scale were expected to be shared with the Fund supported the continuation of the Management Agreement.
Other Benefits to the Investment Manager
The Committee and the Board received and considered information regarding "fall-out" or ancillary benefits received by the Investment Manager and its affiliates as a result of their relationships with the Fund, such as the engagement of the Investment Manager's affiliates to provide distribution and transfer agency services to the Fund. In this regard, among other matters, the Committee and the Board considered that the Fund's distributor retains a portion of the distribution fees from the Fund and receives a portion of the sales charges on sales or redemptions of certain classes of shares of the Fund. The Committee and the Board also considered the benefits of research made available to the Investment Manager by reason of brokerage commissions generated by the Fund's securities transactions, and reviewed information about the Investment Manager's practices with respect to allocating portfolio transactions for brokerage and research services. The Committee and the Board considered the possible conflicts of interest associated with certain fall-out or other ancillary benefits and the reporting, disclosure and other processes that are in place to address such possible conflicts of interest. The Committee and the Board recognized that the Investment Manager's profitability would be somewhat lower without these benefits.
Conclusion
The Committee and the Board reviewed all of the above considerations in reaching their decisions to recommend or approve the continuation of the Management Agreement. In their deliberations, the Trustees did not identify any particular information that was all-important or controlling, and individual Trustees may have attributed different weights to the various factors. Based on their evaluation of all factors that they deemed to be material, including those factors described above, and assisted by the advice of independent legal counsel, the Board, including the Independent Trustees, voting separately, unanimously approved the continuation of the Management Agreement.
Annual Report 2016
68
IMPORTANT INFORMATION ABOUT THIS REPORT
Each fund mails one shareholder report to each shareholder address. If you would like more than one report, please call shareholder services at 800.345.6611 and additional reports will be sent to you.
The policy of the Board is to vote the proxies of the companies in which each fund holds investments consistent with the procedures as stated in the Statement of Additional Information (SAI). You may obtain a copy of the SAI without charge by calling 800.345.6611; contacting your financial intermediary; visiting investor.columbiathreadneedleus.com; or searching the website of the Securities and Exchange Commission (SEC) at sec.gov. Information regarding how each fund voted proxies relating to portfolio securities is filed with the SEC by August 31st for the most recent 12-month period ending June 30th of that year, and is available without charge by visiting investor.columbiathreadneedleus.com, or searching the website of the SEC at sec.gov.
Each fund files a complete schedule of portfolio holdings with the SEC for the first and third quarters of each fiscal year on Form N-Q. Each fund's Form N-Q is available on the SEC's website at sec.gov and may be reviewed and copied at the SEC's Public Reference Room in Washington, D.C. Information on the operation of the Public Reference Room may be obtained by calling 800.SEC.0330. Each fund's complete schedule of portfolio holdings, as filed on Form N-Q, can also be obtained without charge, upon request, by calling 800.345.6611.
Annual Report 2016
69
Columbia Balanced Fund
P.O. Box 8081
Boston, MA 02266-8081

Please read and consider the investment objectives, risks, charges and expenses for any fund carefully before investing. For a prospectus and summary prospectus, which contains this and other important information about the Fund, go to investor.columbiathreadneedleus.com. The Fund is distributed by Columbia Management Investment Distributors, Inc., member FINRA, and managed by Columbia Management Investment Advisers, LLC.
Columbia Threadneedle Investments (Columbia Threadneedle) is the global brand name of the Columbia and Threadneedle group of companies.
All rights reserved. Columbia Management Investment Distributors, Inc., 225 Franklin Street, Boston, MA 02110-2804
© 2016 Columbia Management Investment Advisers, LLC.
investor.columbiathreadneedleus.com
ANN120_08_F01_(10/16)

ANNUAL REPORT
August 31, 2016

COLUMBIA CONTRARIAN CORE FUND

ABOUT COLUMBIA THREADNEEDLE INVESTMENTS
Columbia Threadneedle Investments is a leading global asset management group that provides a broad range of investment strategies and solutions for individual, institutional and corporate clients around the world.
With more than 2,000 people, including over 450 investment professionals based in North America, Europe and Asia, we manage $460 billion* of assets across developed and emerging market equities, fixed income, asset allocation solutions and alternatives. We are the 13th largest manager of long-term mutual fund assets in the U.S.** and the 4th largest manager of retail funds in the U.K.***
Our priority is the investment success of our clients. We aim to deliver the investment outcomes they expect through an investment approach that is team-based, performance-driven and risk-aware. Our culture is dynamic and interactive. By sharing our insights across asset classes and geographies, we generate richer perspectives on global, regional and local investment landscapes. The ability to exchange and debate investment ideas in a collaborative environment enriches our teams' investment processes. More importantly, it results in better informed investment decisions for our clients.
Columbia funds are distributed by Columbia Management Investment Distributors, Inc., member FINRA, and managed by Columbia Management Investment Advisers, LLC.
Columbia Threadneedle Investments (Columbia Threadneedle) is the global brand name of the Columbia and Threadneedle group of companies.
* In U.S. dollars as of June 30, 2016. Source: Ameriprise Q2 Earnings Release. Includes all assets managed by entities in the Columbia and Threadneedle group of companies. Contact us for more current data.
** Source: ICI as of June 30, 2016 for Columbia Management Investment Advisers, LLC.
*** Source: Investment Association as of March 2016 for Threadneedle Asset Management Limited.
© 2016 Columbia Management Investment Advisers, LLC. All rights reserved.
Not part of the shareholder report
 Dear Shareholders,
Volatility comes with the territory for long-term investors. Some investors instinctively want to pull out of the market or sell underperforming investments at the first sign of increased volatility or perhaps even as soon as they perceive it on the horizon. But taking yourself out of the market could mean losing out on potential opportunities, and putting your longer term investment goals at risk.
Cumulative return is not just about achieving high returns when markets are going up; it's also about remaining invested and minimizing losses during weak or volatile markets so that you can participate on the upside. Developing a deeper understanding of the various risks your portfolio is subject to can help you balance these risks.
Diversification is critical in seeking to achieve that balance. We believe that most portfolios could be more effectively diversified either by introducing holdings with performance profiles unrelated to existing holdings (like alternative products) or by rebalancing existing holdings with an eye toward risk allocation. Over time, distributing risk more evenly may produce a more pronounced diversification benefit and may improve portfolio efficiency. We believe market volatility can create significant opportunities and, in fact, these periods may be some of the very best times to invest.
With this in mind, I thought it important to highlight excerpts from a piece written by Colin Moore, Global Chief Investment Officer, in which he touches on some of these issues emphasizing the importance of a properly constructed portfolio in seeking to effectively manage volatility and to achieve consistency of returns. I encourage you to read the article in its entirety. To access the full article and for other insights on current market, please visit blog.columbiathreadneedleus.com/latest-perspectives.
You need investments that are designed to help you ease the impact of volatile market environments and keep the savings you have worked tirelessly to amass. Columbia Threadneedle Investments provides investment solutions to help you tackle financial challenges and achieve your desired outcome.
Best regards,

Christopher O. Petersen
President, Columbia Funds
Excerpts from:
Taking the scare out of the volatility bogeyman
By Colin Moore, Global Chief Investment Officer
Colin Moore is the global chief investment officer for Columbia Threadneedle Investments. His responsibilities include ensuring that a disciplined investment process is in place across all asset classes, including equity and fixed income. Mr. Moore joined one of the Columbia Threadneedle Investments legacy firms in 2002 as head of equity and was also head of fixed income and liquidity strategies from 2009 – 2010.

n In today's low growth, higher volatility world, the emphasis is shifting from maximization of returns to consistency of returns.
PRESIDENT'S MESSAGE (continued)
n Portfolios should represent the behavioral risk-return tradeoff of investors, remembering that they won't stay invested to realize the return if we get the risk tolerance wrong.
n Holding long-term savings in cash to avoid volatility (the financial equivalent of hiding under the sheets) is detrimental to achieving long-term goals.
According to Wikipedia, "The bogeyman is a common allusion to a mythical creature in many cultures used to control behavior. This monster has no specific appearance, and conceptions about it can vary drastically from household to household within the same community; in many cases he has no set appearance in the mind of an adult or child, but is simply a non-specific embodiment of terror." Different cultures have different names and physical representations for the bogeyman, and investors are no different. We have terrible monsters that we fear may destroy our portfolios, and we call one of the scariest of them volatility.
While the bogeyman is mythical (I hope!), volatility is real and can cause serious damage. To understand why investors have such a hard time coping with volatility, we first need to define three cognitive biases at work in today's investment environment:
1) Recency bias — something that has recently come to the forefront of our attention, regardless of how long established it is, suddenly seems to appear with improbable frequency.
2) Negativity bias — we tend to have a greater recall of unpleasant memories than positive memories.
3) Loss aversion — our dissatisfaction with losing money tends to be greater than our satisfaction with making money.
The level of volatility varies dramatically, and so does investor fear and panic selling — waxing when volatility rises, waning when it falls. Recent studies have pointed to demographics as an important driver of panic selling. The theory is that as people get closer to retirement, the prospects of a large (20% – 30%) loss in financial assets can have a much more pronounced effect on their sense of well-being. Wealth preservation instincts kick in much more quickly than for younger (and typically less wealthy) savers.
The reality is that there is little opportunity for return without volatility. Therefore, the bogeyman effect of holding long-term savings in cash to avoid volatility (the financial equivalent of hiding under the sheets) is detrimental to achieving long-term goals. This effect tends to be more pronounced during the episodic spikes in volatility. The significant spike in volatility in 2008 and 2009 led to significant withdrawals from long-term investment funds over the same period. Less pronounced effects can also be seen when comparing 2001 – 2003 and 2011 – 2012. Conversely, flows picked up when volatility returned to "normal" levels. Investor behavior of this type is consistent with the three behavioral biases.
I believe average volatility will be higher over the next 10 years than the last 10 years and episodic spikes will increase in frequency because sustainable economic growth will be structurally lower and geopolitical risk higher than any time since World War II. Low growth creates uncertainty while loss aversion will make investors fear that we are one economic mishap or geopolitical event away from no growth or recession. The result will be higher volatility on average. Negativity bias will tend to exacerbate "spike" reactions to event-driven geopolitical news, and the volatility bogeyman will appear more often. Assuming the behavioral biases continue, investor returns are likely to be very disappointing regardless of the total return generated by financial markets due to the bogeyman effect.
To mitigate this effect, we need to focus on portfolio construction and an improved understanding of diversification. I accept that equities are likely to offer the highest return over the next 10 years, but they also offer the highest volatility. Many portfolio construction optimization tools use historical average volatility, which is likely to underestimate the volatility investors will face. The bogeyman emerges when individual asset class volatility spikes and cross correlations rise, the combination of which increases overall portfolio volatility far beyond expectation. Diversification is meant to protect investors against volatility, but what's the point of owning lots of investments if the volatility bogeyman has not been properly estimated?
Most importantly, portfolios should be constructed to properly represent the behavioral risk-return trade off of investors, remembering that they won't stay invested to realize the return if we get the risk tolerance wrong. In a low growth, higher volatility world, the emphasis is shifting to return consistency rather than return maximization,
PRESIDENT'S MESSAGE (continued)
and investors are best served through investment approaches that appreciate that distinction. Even though it's a permanent feature of financial markets, volatility is less likely to be the bogeyman we all fear if portfolios are constructed with this understanding.
Please visit blog.columbiathreadneedleus.com/latest-perspectives to read the entire article.
Investors should consider the investment objectives, risks, charges and expenses of a mutual fund carefully before investing. For a free prospectus and summary prospectus, which contains this and other important information about a fund, visit investor.columbiathreadneedleus.com. The prospectus should be read carefully before investing.
The views expressed are as of April 2016, may change as market or other conditions change, and may differ from views expressed by other Columbia Management Investment Advisers, LLC (CMIA) associates or affiliates. Actual investments or investment decisions made by CMIA and its affiliates, whether for its own account or on behalf of clients, will not necessarily reflect the views expressed. This information is not intended to provide investment advice and does not account for individual investor circumstances. Investment decisions should always be made based on an investor's specific financial needs, objectives, goals, time horizon and risk tolerance. Asset classes described may not be suitable for all investors.
Past performance does not guarantee future results, and no forecast should be considered a guarantee either. Since economic and market conditions change frequently, there can be no assurance that the trends described here will continue or that the forecasts are accurate.
Diversification does not guarantee a profit or protect against loss.
Columbia Funds are distributed by Columbia Management Investment Distributors, Inc., member FINRA, and managed by Columbia Management Investment Advisers, LLC.
© 2016 Columbia Management Investment Advisers, LLC. All rights reserved.
COLUMBIA CONTRARIAN CORE FUND
Fund Investment Manager
Columbia Management Investment
Advisers, LLC
225 Franklin Street
Boston, MA 02110
Fund Distributor
Columbia Management Investment
Distributors, Inc.
225 Franklin Street
Boston, MA 02110
Fund Transfer Agent
Columbia Management Investment
Services Corp.
P.O. Box 8081
Boston, MA 02266-8081
For more information about any of the funds, please visit investor.columbiathreadneedleus.com or call 800.345.6611. Customer Service Representatives are available to answer your questions Monday through Friday from 8 a.m. to 7 p.m. Eastern time.
The views expressed in this report reflect the current views of the respective parties. These views are not guarantees of future performance and involve certain risks, uncertainties and assumptions that are difficult to predict, so actual outcomes and results may differ significantly from the views expressed. These views are subject to change at any time based upon economic, market or other conditions and the respective parties disclaim any responsibility to update such views. These views may not be relied on as investment advice and, because investment decisions for a Columbia fund are based on numerous factors, may not be relied on as an indication of trading intent on behalf of any particular Columbia fund. References to specific securities should not be construed as a recommendation or investment advice.
Performance Overview | | | 3 | | |
Manager Discussion of Fund Performance | | | 5 | | |
Understanding Your Fund's Expenses | | | 7 | | |
Portfolio of Investments | | | 8 | | |
Statement of Assets and Liabilities | | | 13 | | |
Statement of Operations | | | 16 | | |
Statement of Changes in Net Assets | | | 17 | | |
Financial Highlights | | | 20 | | |
Notes to Financial Statements | | | 32 | | |
Report of Independent Registered Public Accounting Firm | | | 40 | | |
Federal Income Tax Information | | | 41 | | |
Trustees and Officers | | | 42 | | |
Board Consideration and Approval of Management Agreement | | | 47 | | |
Important Information About This Report | | | 51 | | |
COLUMBIA CONTRARIAN CORE FUND
Performance Summary
n Columbia Contrarian Core Fund (the Fund) Class A shares returned 10.79% excluding sales charges for the 12-month period that ended August 31, 2016.
n The Fund underperformed its benchmark, the Russell 1000 Index, which returned 11.69% for the same time period.
n Stock selection provided a performance advantage in six out of ten sectors of the benchmark, with the biggest relative gains coming from the consumer discretionary, information technology and industrials sectors. Management fees generally accounted for the Fund's modest shortfall relative to the benchmark.
Average Annual Total Returns (%) (for period ended August 31, 2016)
| | | Inception | | 1 Year | | 5 Years | | 10 Years | |
Class A | | 11/01/98 | | | | | | | | | | | | | |
Excluding sales charges | | | | | | | 10.79 | | | | 15.17 | | | | 9.49 | | |
Including sales charges | | | | | | | 4.41 | | | | 13.81 | | | | 8.84 | | |
Class B | | 11/01/98 | | | | | | | | | | | | | |
Excluding sales charges | | | | | | | 9.96 | | | | 14.30 | | | | 8.66 | | |
Including sales charges | | | | | | | 4.96 | | | | 14.07 | | | | 8.66 | | |
Class C | | 12/09/02 | | | | | | | | | | | | | |
Excluding sales charges | | | | | | | 9.98 | | | | 14.30 | | | | 8.67 | | |
Including sales charges | | | | | | | 8.98 | | | | 14.30 | | | | 8.67 | | |
Class I* | | 09/27/10 | | | 11.26 | | | | 15.67 | | | | 9.88 | | |
Class K* | | 03/07/11 | | | 10.92 | | | | 15.32 | | | | 9.61 | | |
Class R* | | 09/27/10 | | | 10.55 | | | | 14.90 | | | | 9.23 | | |
Class R4* | | 11/08/12 | | | 11.07 | | | | 15.47 | | | | 9.77 | | |
Class R5* | | 11/08/12 | | | 11.22 | | | | 15.58 | | | | 9.82 | | |
Class T | | 02/12/93 | | | | | | | | | | | | | |
Excluding sales charges | | | | | | | 10.83 | | | | 15.14 | | | | 9.44 | | |
Including sales charges | | | | | | | 4.44 | | | | 13.79 | | | | 8.79 | | |
Class W* | | 09/27/10 | | | 10.79 | | | | 15.17 | | | | 9.49 | | |
Class Y* | | 11/08/12 | | | 11.22 | | | | 15.63 | | | | 9.84 | | |
Class Z | | 12/14/92 | | | 11.05 | | | | 15.45 | | | | 9.76 | | |
Russell 1000 Index | | | | | | | 11.69 | | | | 14.60 | | | | 7.64 | | |
Returns for Class A and Class T are shown with and without the maximum initial sales charge of 5.75%. Returns for Class B are shown with and without the applicable contingent deferred sales charge (CDSC) of 5.00% in the first year, declining to 1.00% in the sixth year and eliminated thereafter. Returns for Class C are shown with and without the 1.00% CDSC for the first year only. The Fund's other classes are not subject to sales charges and have limited eligibility. Please see the Fund's prospectus for details. Performance for different share classes will vary based on differences in sales charges and fees associated with each class. All results shown assume reinvestment of distributions during the period. Returns do not reflect the deduction of taxes that a shareholder may pay on Fund distributions or on the redemption of Fund shares. Performance results reflect the effect of any fee waivers or reimbursements of Fund expenses by Columbia Management Investment Advisers, LLC and/or any of its affiliates. Absent these fee waivers or expense reimbursement arrangements, performance results would have been lower.
The performance information shown represents past performance and is not a guarantee of future results. The investment return and principal value of your investment will fluctuate so that your shares, when redeemed, may be worth more or less than their original cost. Current performance may be lower or higher than the performance information shown. You may obtain performance information current to the most recent month-end by contacting your financial intermediary, visiting investor.columbiathreadneedleus.com or calling 800.345.6611.
*The returns shown for periods prior to the share class inception date (including returns for the Life of the Fund, if shown, which are since Fund inception) include the returns of the Fund's oldest share class. These returns are adjusted to reflect any higher class-related operating expenses of the newer share classes, as applicable. Please visit investor.columbiathreadneedleus.com/investment-products/mutual-funds/
appended-performance for more information.
The Russell 1000 Index tracks the performance of 1,000 of the largest U.S. companies, based on market capitalization.
Indices are not available for investment, are not professionally managed and do not reflect sales charges, fees, brokerage commissions, taxes or other expenses of investing. Securities in the Fund may not match those in an index.
Annual Report 2016
3
COLUMBIA CONTRARIAN CORE FUND
PERFORMANCE OVERVIEW (continued)
Performance of a Hypothetical $10,000 Investment (September 1, 2006 – August 31, 2016)
The chart above shows the change in value of a hypothetical $10,000 investment in Class A shares of Columbia Contrarian Core Fund during the stated time period, and does not reflect the deduction of taxes that a shareholder may pay on Fund distributions or on the redemption of Fund shares.
Annual Report 2016
4
COLUMBIA CONTRARIAN CORE FUND
MANAGER DISCUSSION OF FUND PERFORMANCE
For the 12-month period that ended August 31, 2016, the Fund's Class A shares returned 10.79% excluding sales charges. The Fund underperformed its benchmark, the Russell 1000 Index, which returned 11.69% for the same time period. Stock selection provided a performance advantage in six out of ten sectors of the benchmark, with the biggest relative gains coming from the consumer discretionary, information technology and industrials sectors. Management fees, which the Fund incurs and the index does not, generally accounted for the Fund's modest shortfall relative to the benchmark.
Stocks Log Strong Gains in Volatile Market
Even though a host of factors weighed on investors during the one-year period ended August 31, 2016, strong rebounds after three significant market declines left stock markets with solid gains. Lackluster economic growth, contentious geopolitical conflicts and expectations of a shift in U.S. monetary policy weighed on investors in the first half of the period. In December 2015, the Federal Reserve (the Fed) raised the target range of its benchmark interest rate by a quarter of a point. But the Fed took no further action as subpar global economic growth continued and mixed economic data undermined confidence at home.
The U.S. economy, however, continued to expand modestly throughout the period, and economic growth in Europe picked up, if ever so slightly. The U.S. manufacturing sector regained some traction in the spring, and the U.S. labor markets recovered to full employment for the first time since the Great Recession, despite some weaker reports on new job growth. The vote by the United Kingdom to exit the European Union, known as Brexit, gave markets a jolt in mid-June, but that downdraft was short lived.
Against this backdrop, stocks pulled back three times during the 12-month period ended August 31, 2016. Large-cap stocks outperformed mid- and small-cap stocks. Value stocks outperformed growth stocks, with an especially big advantage for mid-cap and small-cap value stocks versus their growth counterparts. As interest rates (except for the very shortest rates) declined during the period, interest-rate sensitive telecommunications services and utilities were the strongest performing sectors for the period, along with information technology. Health care, energy and financials lagged, with modest single-digit returns.
Contributors and Detractors
Within the Fund, stock selection was particularly strong in the consumer discretionary, information technology and industrial sectors. Within the consumer discretionary sector, Aramark and Comcast were standout performers as the market rewarded them for their business stability. Both are long-term Fund holdings. Within the information technology sector, positions in Activision Blizzard, Facebook and Alphabet (formerly Google) delivered outsized returns. Strong digital advertising growth benefited both Facebook and Alphabet. In addition, investors have responded favorably to the renewed financial discipline brought in by Alphabet CFO Ruth Porat. Within the industrials sector, positions in Nielsen Holdings and Dun & Bradstreet aided returns. Both business service companies were resilient in an environment of easing global industrial activity. General Electric,
Portfolio Management
Guy Pope, CFA
Morningstar Style BoxTM

The Morningstar Style BoxTM is based on a fund's portfolio holdings. For equity funds, the vertical axis shows the market capitalization of the stocks owned, and the horizontal axis shows investment style (value, blend, or growth). Information shown is based on the most recent data provided by Morningstar.
© 2016 Morningstar, Inc. All rights reserved. The Morningstar information contained herein: (1) is proprietary to Morningstar and/or its content providers; (2) may not be copied or distributed; and (3) is not warranted to be accurate, complete or timely. Neither Morningstar nor its content providers are responsible for any damages or losses arising from any use of this information.
Top Ten Holdings (%)
(at August 31, 2016) | |
Apple, Inc. | | | 3.6 | | |
Berkshire Hathaway, Inc.,
Class B | | | 3.3 | | |
Verizon Communications, Inc. | | | 3.1 | | |
Alphabet, Inc., Class C | | | 3.0 | | |
Citigroup, Inc. | | | 2.9 | | |
Microsoft Corp. | | | 2.8 | | |
JPMorgan Chase & Co. | | | 2.7 | | |
Facebook, Inc., Class A | | | 2.7 | | |
Johnson & Johnson | | | 2.5 | | |
Comcast Corp., Class A | | | 2.4 | | |
Percentages indicated are based upon total investments (excluding Money Market Funds).
For further detail about these holdings, please refer to the section entitled "Portfolio of Investments."
Fund holdings are as of the date given, are subject to change at any time, and are not recommendations to buy or sell any security.
Annual Report 2016
5
COLUMBIA CONTRARIAN CORE FUND
MANAGER DISCUSSION OF FUND PERFORMANCE (continued)
Portfolio Breakdown (%)
(at August 31, 2016) | |
Common Stocks | | | 96.9 | | |
Money Market Funds | | | 3.1 | | |
Total | | | 100.0 | | |
Percentages indicated are based upon total investments. The Fund's portfolio composition is subject to change.
Equity Sector Breakdown (%)
(at August 31, 2016) | |
Consumer Discretionary | | | 13.7 | | |
Consumer Staples | | | 7.5 | | |
Energy | | | 7.5 | | |
Financials | | | 20.3 | | |
Health Care | | | 16.6 | | |
Industrials | | | 8.0 | | |
Information Technology | | | 21.5 | | |
Materials | | | 0.6 | | |
Telecommunication Services | | | 3.2 | | |
Utilities | | | 1.1 | | |
Total | | | 100.0 | | |
Percentages indicated are based upon total equity investments. The Fund's portfolio composition is subject to change.
Investment Risks
Market risk may affect a single issuer, sector of the economy, industry or the market as a whole. Foreign investments subject the Fund to risks, including political, economic, market, social and others within a particular country, as well as to currency instabilities and less stringent financial and accounting standards generally applicable to U.S. issuers. Growth securities, at times, may not perform as well as value securities or the stock market in general and may be out of favor with investors. Value securities may be unprofitable if the market fails to recognize their intrinsic worth or the portfolio manager misgauged that worth. The Fund may invest significantly in issuers within a particular sector, which may be negatively affected by market, economic or other conditions, making the Fund more vulnerable to unfavorable developments in the sector. See the Fund's prospectus for information on these and other risks.
which has long been out of favor, was rewarded by investors for its continued efforts in restructuring. The company has focused on its industrial businesses and de-emphasizing its financial business.
Consumer staples, financials and health care holdings were the biggest detractors from Fund results for the period. In the consumer staples, where the Fund was generally underweight relative to the benchmark, results were mixed. An overweight position in Philip Morris International generated a substantial gain for the Fund. PepsiCo also delivered a double-digit return. However, these were not enough to offset disappointments from holdings such as CVS Health and Walgreens Boots Alliance, both strong performers a year ago, which lost ground during this 12-month period. Rumblings about the potential for increased regulation, especially regarding pharmaceutical pricing, put a damper on health care stocks in general. Both CVS and Walgreen's, with their link to health care, were vulnerable to the same concerns. After years of gaining significant market share in the pharmacy benefit management (PBM) business, CVS/Caremark has run up against more stiff competition. We continue to think CVS/Caremark is one of the better PBM offerings, even though the competition is slowing its share gain progress. Lack of exposure to some of the consumer staples sector's strongest performers, including Altria, Tyson Foods and Procter & Gamble, also detracted from relative performance.
In the financials sector, which was a subpar performer during the period, the Fund underperformed the benchmark. An overweight in Citigroup produced disappointing results, as lower interest rates and easing global capital market activity weighed on the company. Financials, in general, were caught up in the aftermath of Brexit. The falloff in financials also seemed to acknowledge that a period of benign global credit conditions has probably peaked and we have already seen some slight increase in credit stresses. In health care, the Fund performed generally in line with the benchmark. However it had more exposure to health care than the benchmark and that was a drag on relative performance. Good results from a substantial position in Johnson & Johnson, for example, with its nice dividend yield, was offset by a substantial slide in Vertex Pharmaceuticals, which stumbled as market acceptance of its cystic fibrosis drug was slower than expected.
Fund Strategy
Regardless of market conditions or the economic outlook, we focus on executing our core contrarian philosophy in constructing the portfolio and managing it from day to day. We continue to believe our disciplined approach will serve us well over a long-term time frame.
Annual Report 2016
6
COLUMBIA CONTRARIAN CORE FUND
UNDERSTANDING YOUR FUND'S EXPENSES
(Unaudited)
As an investor, you incur two types of costs. There are transaction costs, which generally include sales charges on purchases and may include redemption fees. There are also ongoing costs, which generally include management fees, distribution and/or service fees, and other fund expenses. The following information is intended to help you understand your ongoing costs (in dollars) of investing in the Fund and to help you compare these costs with the ongoing costs of investing in other mutual funds.
Analyzing Your Fund's Expenses
To illustrate these ongoing costs, we have provided examples and calculated the expenses paid by investors in each share class of the Fund during the period. The actual and hypothetical information in the table is based on an initial investment of $1,000 at the beginning of the period indicated and held for the entire period. Expense information is calculated two ways and each method provides you with different information. The amount listed in the "Actual" column is calculated using the Fund's actual operating expenses and total return for the period. You may use the Actual information, together with the amount invested, to estimate the expenses that you paid over the period. Simply divide your account value by $1,000 (for example, an $8,600 account value divided by $1,000 = 8.6), then multiply the results by the expenses paid during the period under the "Actual" column. The amount listed in the "Hypothetical" column assumes a 5% annual rate of return before expenses (which is not the Fund's actual return) and then applies the Fund's actual expense ratio for the period to the hypothetical return. You should not use the hypothetical account values and expenses to estimate either your actual account balance at the end of the period or the expenses you paid during the period. See "Compare With Other Funds" below for details on how to use the hypothetical data.
Compare With Other Funds
Since all mutual funds are required to include the same hypothetical calculations about expenses in shareholder reports, you can use this information to compare the ongoing cost of investing in the Fund with other funds. To do so, compare the hypothetical example with the 5% hypothetical examples that appear in the shareholder reports of other funds. As you compare hypothetical examples of other funds, it is important to note that hypothetical examples are meant to highlight the ongoing costs of investing in a fund only and do not reflect any transaction costs, such as sales charges, or redemption or exchange fees. Therefore, the hypothetical calculations are useful in comparing ongoing costs only, and will not help you determine the relative total costs of owning different funds. If transaction costs were included in these calculations, your costs would be higher.
March 1, 2016 – August 31, 2016
| | | Account Value at the Beginning
of the Period ($) | | Account Value at the End of the
Period ($) | | Expenses Paid During the
Period ($) | | Fund's Annualized
Expense Ratio (%) | |
| | | Actual | | Hypothetical | | Actual | | Hypothetical | | Actual | | Hypothetical | | Actual | |
Class A | | | 1,000.00 | | | | 1,000.00 | | | | 1,129.20 | | | | 1,019.76 | | | | 5.73 | | | | 5.43 | | | | 1.07 | | |
Class B | | | 1,000.00 | | | | 1,000.00 | | | | 1,124.40 | | | | 1,016.04 | | | | 9.67 | | | | 9.17 | | | | 1.81 | | |
Class C | | | 1,000.00 | | | | 1,000.00 | | | | 1,124.20 | | | | 1,015.99 | | | | 9.72 | | | | 9.22 | | | | 1.82 | | |
Class I | | | 1,000.00 | | | | 1,000.00 | | | | 1,131.50 | | | | 1,021.92 | | | | 3.43 | | | | 3.25 | | | | 0.64 | | |
Class K | | | 1,000.00 | | | | 1,000.00 | | | | 1,129.40 | | | | 1,020.36 | | | | 5.08 | | | | 4.82 | | | | 0.95 | | |
Class R | | | 1,000.00 | | | | 1,000.00 | | | | 1,127.50 | | | | 1,018.50 | | | | 7.06 | | | | 6.70 | | | | 1.32 | | |
Class R4 | | | 1,000.00 | | | | 1,000.00 | | | | 1,130.30 | | | | 1,021.01 | | | | 4.39 | | | | 4.17 | | | | 0.82 | | |
Class R5 | | | 1,000.00 | | | | 1,000.00 | | | | 1,131.00 | | | | 1,021.67 | | | | 3.70 | | | | 3.51 | | | | 0.69 | | |
Class T | | | 1,000.00 | | | | 1,000.00 | | | | 1,128.80 | | | | 1,019.76 | | | | 5.73 | | | | 5.43 | | | | 1.07 | | |
Class W | | | 1,000.00 | | | | 1,000.00 | | | | 1,128.60 | | | | 1,019.76 | | | | 5.73 | | | | 5.43 | | | | 1.07 | | |
Class Y | | | 1,000.00 | | | | 1,000.00 | | | | 1,130.90 | | | | 1,021.92 | | | | 3.43 | | | | 3.25 | | | | 0.64 | | |
Class Z | | | 1,000.00 | | | | 1,000.00 | | | | 1,129.80 | | | | 1,021.01 | | | | 4.39 | | | | 4.17 | | | | 0.82 | | |
Expenses paid during the period are equal to the annualized expense ratio for each class as indicated above, multiplied by the average account value over the period and then multiplied by the number of days in the Fund's most recent fiscal half year and divided by 366.
Expenses do not include fees and expenses incurred indirectly by the Fund from its investment in underlying funds, including affiliated and non-affiliated pooled investment vehicles, such as mutual funds and exchange-traded funds.
Annual Report 2016
7
COLUMBIA CONTRARIAN CORE FUND
PORTFOLIO OF INVESTMENTS
August 31, 2016
(Percentages represent value of investments compared to net assets)
Common Stocks 96.4%
Issuer | | Shares | | Value ($) | |
CONSUMER DISCRETIONARY 13.2% | |
Auto Components 1.8% | |
Delphi Automotive PLC | | | 1,745,248 | | | | 123,319,224 | | |
Johnson Controls, Inc. | | | 1,379,489 | | | | 60,531,977 | | |
Total | | | | | 183,851,201 | | |
Hotels, Restaurants & Leisure 1.8% | |
Aramark | | | 1,479,248 | | | | 56,107,877 | | |
Marriott International, Inc., Class A | | | 681,623 | | | | 48,620,168 | | |
McDonald's Corp. | | | 599,480 | | | | 69,335,857 | | |
Total | | | | | 174,063,902 | | |
Household Durables 0.7% | |
Newell Brands, Inc. | | | 1,398,320 | | | | 74,222,826 | | |
Internet & Catalog Retail 0.8% | |
Expedia, Inc. | | | 737,770 | | | | 80,505,462 | | |
Media 3.4% | |
Comcast Corp., Class A | | | 3,584,888 | | | | 233,949,791 | | |
Walt Disney Co. (The) | | | 1,049,255 | | | | 99,112,627 | | |
Total | | | | | 333,062,418 | | |
Specialty Retail 2.8% | |
Advance Auto Parts, Inc. | | | 244,365 | | | | 38,458,164 | | |
Lowe's Companies, Inc. | | | 2,496,099 | | | | 191,101,339 | | |
Michaels Companies, Inc. (The)(a) | | | 1,951,237 | | | | 46,751,639 | | |
Total | | | | | 276,311,142 | | |
Textiles, Apparel & Luxury Goods 1.9% | |
Coach, Inc. | | | 2,499,620 | | | | 95,435,492 | | |
PVH Corp. | | | 875,748 | | | | 94,370,604 | | |
Total | | | | | 189,806,096 | | |
Total Consumer Discretionary | | | | | 1,311,823,047 | | |
CONSUMER STAPLES 7.2% | |
Beverages 2.6% | |
Diageo PLC, ADR | | | 512,857 | | | | 57,686,155 | | |
PepsiCo, Inc. | | | 1,877,790 | | | | 200,454,083 | | |
Total | | | | | 258,140,238 | | |
Food & Staples Retailing 3.4% | |
CVS Health Corp. | | | 1,614,922 | | | | 150,833,715 | | |
Kroger Co. (The) | | | 2,136,870 | | | | 68,358,471 | | |
Walgreens Boots Alliance, Inc. | | | 1,450,634 | | | | 117,080,670 | | |
Total | | | | | 336,272,856 | | |
Common Stocks (continued)
Issuer | | Shares | | Value ($) | |
Tobacco 1.2% | |
Philip Morris International, Inc. | | | 1,235,290 | | | | 123,442,530 | | |
Total Consumer Staples | | | | | 717,855,624 | | |
ENERGY 7.2% | |
Energy Equipment & Services 0.9% | |
Schlumberger Ltd. | | | 1,160,910 | | | | 91,711,890 | | |
Oil, Gas & Consumable Fuels 6.3% | |
Canadian Natural Resources Ltd. | | | 4,084,770 | | | | 126,832,108 | | |
Chevron Corp. | | | 1,354,698 | | | | 136,255,525 | | |
ConocoPhillips | | | 1,984,746 | | | | 81,473,823 | | |
EQT Corp. | | | 627,745 | | | | 44,883,768 | | |
Exxon Mobil Corp. | | | 2,015,235 | | | | 175,607,578 | | |
Noble Energy, Inc. | | | 1,799,302 | | | | 62,039,933 | | |
Total | | | | | 627,092,735 | | |
Total Energy | | | | | 718,804,625 | | |
FINANCIALS 19.6% | |
Banks 7.3% | |
Citigroup, Inc. | | | 5,851,906 | | | | 279,369,992 | | |
JPMorgan Chase & Co. | | | 3,823,723 | | | | 258,101,303 | | |
Wells Fargo & Co. | | | 3,637,508 | | | | 184,785,406 | | |
Total | | | | | 722,256,701 | | |
Capital Markets 5.4% | |
Bank of New York Mellon Corp. (The) | | | 3,523,556 | | | | 146,826,578 | | |
BlackRock, Inc. | | | 424,159 | | | | 158,130,717 | | |
Invesco Ltd. | | | 712,890 | | | | 22,235,039 | | |
Morgan Stanley | | | 6,636,930 | | | | 212,779,976 | | |
Total | | | | | 539,972,310 | | |
Diversified Financial Services 4.3% | |
Berkshire Hathaway, Inc., Class B(a) | | | 2,086,193 | | | | 313,951,185 | | |
S&P Global, Inc. | | | 907,680 | | | | 112,134,787 | | |
Total | | | | | 426,085,972 | | |
Insurance 0.8% | |
Aon PLC | | | 731,882 | | | | 81,495,061 | | |
Real Estate Investment Trusts (REITs) 1.4% | |
American Tower Corp. | | | 1,171,445 | | | | 132,818,434 | | |
Real Estate Management & Development 0.4% | |
CBRE Group, Inc., Class A(a) | | | 1,341,163 | | | | 40,087,362 | | |
Total Financials | | | | | 1,942,715,840 | | |
The accompanying Notes to Financial Statements are an integral part of this statement.
Annual Report 2016
8
COLUMBIA CONTRARIAN CORE FUND
PORTFOLIO OF INVESTMENTS (continued)
August 31, 2016
Common Stocks (continued)
Issuer | | Shares | | Value ($) | |
HEALTH CARE 16.0% | |
Biotechnology 2.9% | |
Alexion Pharmaceuticals, Inc.(a) | | | 410,575 | | | | 51,674,969 | | |
Biogen, Inc.(a) | | | 381,020 | | | | 116,451,143 | | |
Celgene Corp.(a) | | | 828,821 | | | | 88,468,354 | | |
Vertex Pharmaceuticals, Inc.(a) | | | 393,391 | | | | 37,179,383 | | |
Total | | | | | 293,773,849 | | |
Health Care Equipment & Supplies 5.6% | |
Abbott Laboratories | | | 2,478,559 | | | | 104,149,049 | | |
Cooper Companies, Inc. (The) | | | 598,267 | | | | 111,229,801 | | |
Medtronic PLC | | | 2,394,031 | | | | 208,352,518 | | |
Zimmer Biomet Holdings, Inc. | | | 1,042,425 | | | | 135,108,704 | | |
Total | | | | | 558,840,072 | | |
Health Care Providers & Services 2.2% | |
Anthem, Inc. | | | 733,905 | | | | 91,796,837 | | |
Cardinal Health, Inc. | | | 997,168 | | | | 79,444,375 | | |
CIGNA Corp. | | | 347,240 | | | | 44,537,002 | | |
Total | | | | | 215,778,214 | | |
Pharmaceuticals 5.3% | |
Allergan PLC(a) | | | 226,583 | | | | 53,142,777 | | |
Johnson & Johnson | | | 2,004,446 | | | | 239,210,586 | | |
Pfizer, Inc. | | | 6,698,265 | | | | 233,099,622 | | |
Total | | | | | 525,452,985 | | |
Total Health Care | | | | | 1,593,845,120 | | |
INDUSTRIALS 7.8% | |
Aerospace & Defense 1.9% | |
Honeywell International, Inc. | | | 1,595,309 | | | | 186,188,513 | | |
Air Freight & Logistics 1.9% | |
FedEx Corp. | | | 1,118,091 | | | | 184,406,749 | | |
Electrical Equipment 0.7% | |
Eaton Corp. PLC | | | 1,027,276 | | | | 68,354,945 | | |
Industrial Conglomerates 0.8% | |
General Electric Co. | | | 2,539,740 | | | | 79,341,477 | | |
Professional Services 2.5% | |
Dun & Bradstreet Corp. (The) | | | 442,667 | | | | 60,933,113 | | |
Nielsen Holdings PLC | | | 3,589,055 | | | | 191,224,850 | | |
Total | | | | | 252,157,963 | | |
Total Industrials | | | | | 770,449,647 | | |
Common Stocks (continued)
Issuer | | Shares | | Value ($) | |
INFORMATION TECHNOLOGY 20.7% | |
Communications Equipment 0.4% | |
Palo Alto Networks, Inc.(a) | | | 303,185 | | | | 40,375,146 | | |
Internet Software & Services 7.0% | |
Akamai Technologies, Inc.(a) | | | 465,310 | | | | 25,545,519 | | |
Alphabet, Inc., Class A(a) | | | 163,518 | | | | 129,154,692 | | |
Alphabet, Inc., Class C(a) | | | 377,487 | | | | 289,551,404 | | |
Facebook, Inc., Class A(a) | | | 2,017,135 | | | | 254,401,066 | | |
Total | | | | | 698,652,681 | | |
IT Services 2.1% | |
Fidelity National Information
Services, Inc. | | | 983,490 | | | | 78,020,262 | | |
MasterCard, Inc., Class A | | | 1,326,974 | | | | 128,225,497 | | |
Total | | | | | 206,245,759 | | |
Semiconductors & Semiconductor Equipment 2.4% | |
Broadcom Ltd. | | | 701,650 | | | | 123,785,093 | | |
QUALCOMM, Inc. | | | 1,123,100 | | | | 70,833,917 | | |
Skyworks Solutions, Inc. | | | 603,188 | | | | 45,154,654 | | |
Total | | | | | 239,773,664 | | |
Software 5.4% | |
Activision Blizzard, Inc. | | | 3,424,720 | | | | 141,680,666 | | |
Electronic Arts, Inc.(a) | | | 1,235,891 | | | | 100,391,426 | | |
Intuit, Inc. | | | 221,079 | | | | 24,639,254 | | |
Microsoft Corp. | | | 4,652,597 | | | | 267,338,224 | | |
Total | | | | | 534,049,570 | | |
Technology Hardware, Storage & Peripherals 3.4% | |
Apple, Inc. | | | 3,210,456 | | | | 340,629,382 | | |
Total Information Technology | | | | | 2,059,726,202 | | |
MATERIALS 0.6% | |
Chemicals 0.6% | |
Monsanto Co. | | | 552,550 | | | | 58,846,575 | | |
Total Materials | | | | | 58,846,575 | | |
TELECOMMUNICATION SERVICES 3.0% | |
Diversified Telecommunication Services 3.0% | |
Verizon Communications, Inc. | | | 5,749,578 | | | | 300,875,417 | | |
Total Telecommunication Services | | | | | 300,875,417 | | |
The accompanying Notes to Financial Statements are an integral part of this statement.
Annual Report 2016
9
COLUMBIA CONTRARIAN CORE FUND
PORTFOLIO OF INVESTMENTS (continued)
August 31, 2016
Common Stocks (continued)
Issuer | | Shares | | Value ($) | |
UTILITIES 1.1% | |
Electric Utilities 0.8% | |
Edison International | | | 1,100,682 | | | | 80,041,595 | | |
Multi-Utilities 0.3% | |
DTE Energy Co. | | | 312,914 | | | | 29,069,711 | | |
Total Utilities | | | | | 109,111,306 | | |
Total Common Stocks
(Cost: $7,572,463,875) | | | | | 9,584,053,403 | | |
Money Market Funds 3.1%
| | | Shares | | Value ($) | |
Columbia Short-Term Cash Fund,
0.415%(b)(c) | | | 305,769,244 | | | | 305,769,244 | | |
Total Money Market Funds
(Cost: $305,769,244) | | | | | 305,769,244 | | |
Total Investments
(Cost: $7,878,233,119) | | | | | 9,889,822,647 | | |
Other Assets & Liabilities, Net | | | | | 44,825,601 | | |
Net Assets | | | | | 9,934,648,248 | | |
Notes to Portfolio of Investments
(a) Non-income producing investment.
(b) The rate shown is the seven-day current annualized yield at August 31, 2016.
(c) As defined in the Investment Company Act of 1940, an affiliated company is one in which the Fund owns 5% or more of the company's outstanding voting securities, or a company which is under common ownership or control with the Fund. Holdings and transactions in these affiliated companies during the year ended August 31, 2016 are as follows:
Issuer | | Beginning
Cost ($) | | Received in
Reorganization ($) | | Purchase
Cost ($) | | Proceeds
From Sales ($) | | Ending
Cost ($) | | Dividends —
Affiliated
Issuers ($) | | Value ($) | |
Columbia Short-Term
Cash Fund | | | 189,205,745 | | | | 31,332,578 | | | | 2,283,673,984 | | | | (2,198,443,063 | ) | | | 305,769,244 | | | | 802,528 | | | | 305,769,244 | | |
Abbreviation Legend
ADR American Depositary Receipt
Fair Value Measurements
The Fund categorizes its fair value measurements according to a three-level hierarchy that maximizes the use of observable inputs and minimizes the use of unobservable inputs by prioritizing that the most observable input be used when available. Observable inputs are those that market participants would use in pricing an investment based on market data obtained from sources independent of the reporting entity. Unobservable inputs are those that reflect the Fund's assumptions about the information market participants would use in pricing an investment. An investment's level within the fair value hierarchy is based on the lowest level of any input that is deemed significant to the asset's or liability's fair value measurement. The input levels are not necessarily an indication of the risk or liquidity associated with investments at that level. For example, certain U.S. government securities are generally high quality and liquid, however, they are reflected as Level 2 because the inputs used to determine fair value may not always be quoted prices in an active market.
Fair value inputs are summarized in the three broad levels listed below:
> Level 1 — Valuations based on quoted prices for investments in active markets that the Fund has the ability to access at the measurement date (including NAV for open-end mutual funds). Valuation adjustments are not applied to Level 1 investments.
> Level 2 — Valuations based on other significant observable inputs (including quoted prices for similar securities, interest rates, prepayment speeds, credit risks, etc.).
> Level 3 — Valuations based on significant unobservable inputs (including the Fund's own assumptions and judgment in determining the fair value of investments).
Inputs that are used in determining fair value of an investment may include price information, credit data, volatility statistics, and other factors. These inputs can be either observable or unobservable. The availability of observable inputs can vary between investments, and is affected by various factors such as the type of investment, and the volume and level of activity for that investment or similar investments in the marketplace. The inputs will be considered by the Investment Manager, along with any other relevant factors in the calculation of an investment's fair value. The Fund uses prices and inputs that are current as of the measurement date, which may include periods of market dislocations. During these periods, the availability of prices and inputs may be reduced for many investments. This condition could cause an investment to be reclassified between the various levels within the hierarchy.
The accompanying Notes to Financial Statements are an integral part of this statement.
Annual Report 2016
10
COLUMBIA CONTRARIAN CORE FUND
PORTFOLIO OF INVESTMENTS (continued)
August 31, 2016
Fair Value Measurements (continued)
Certain investments that have been measured at fair value using the net asset value per share (or its equivalent) are not categorized in the fair value hierarchy. The fair value amounts presented in the table are intended to reconcile the fair value hierarchy to the amounts presented in the Portfolio of Investments. The Columbia Short-Term Cash Fund seeks to provide shareholders with maximum current income consistent with liquidity and stability of principal. Investments in Columbia Short-Term Cash Fund may be redeemed on a daily basis without restriction.
Investments falling into the Level 3 category are primarily supported by quoted prices from brokers and dealers participating in the market for those investments. However, these may be classified as Level 3 investments due to lack of market transparency and corroboration to support these quoted prices. Additionally, valuation models may be used as the pricing source for any remaining investments classified as Level 3. These models may rely on one or more significant unobservable inputs and/or significant assumptions by the Investment Manager. Inputs used in valuations may include, but are not limited to, financial statement analysis, capital account balances, discount rates and estimated cash flows, and comparable company data.
Under the direction of the Fund's Board of Trustees (the Board), the Investment Manager's Valuation Committee (the Committee) is responsible for overseeing the valuation procedures approved by the Board. The Committee consists of voting and non-voting members from various groups within the Investment Manager's organization, including operations and accounting, trading and investments, compliance, risk management and legal.
The Committee meets at least monthly to review and approve valuation matters, which may include a description of specific valuation determinations, data regarding pricing information received from approved pricing vendors and brokers and the results of Board-approved valuation control policies and procedures (the Policies). The Policies address, among other things, instances when market quotations are or are not readily available, including recommendations of third party pricing vendors and a determination of appropriate pricing methodologies; events that require specific valuation determinations and assessment of fair value techniques; securities with a potential for stale pricing, including those that are illiquid, restricted, or in default; and the effectiveness of third party pricing vendors, including periodic reviews of vendors. The Committee meets more frequently, as needed, to discuss additional valuation matters, which may include the need to review back-testing results, review time-sensitive information or approve related valuation actions. The Committee reports to the Board, with members of the Committee meeting with the Board at each of its regularly scheduled meetings to discuss valuation matters and actions during the period, similar to those described earlier.
For investments categorized as Level 3, the Committee monitors information similar to that described above, which may include: (i) data specific to the issuer or comparable issuers, (ii) general market or specific sector news and (iii) quoted prices and specific or similar security transactions. The Committee considers this data and any changes from prior periods in order to assess the reasonableness of observable and unobservable inputs, any assumptions or internal models used to value those securities and changes in fair value. This data is also used to corroborate, when available, information received from approved pricing vendors and brokers. Various factors impact the frequency of monitoring this information (which may occur as often as daily). However, the Committee may determine that changes to inputs, assumptions and models are not required as a result of the monitoring procedures performed.
The accompanying Notes to Financial Statements are an integral part of this statement.
Annual Report 2016
11
COLUMBIA CONTRARIAN CORE FUND
PORTFOLIO OF INVESTMENTS (continued)
August 31, 2016
Fair Value Measurements (continued)
The following table is a summary of the inputs used to value the Fund's investments at August 31, 2016:
| | | Level 1
Quoted Prices in Active
Markets for Identical
Assets ($) | | Level 2
Other Significant
Observable Inputs ($) | | Level 3
Significant
Unobservable Inputs ($) | | Total ($) | |
Investments | |
Common Stocks | |
Consumer Discretionary | | | 1,311,823,047 | | | | — | | | | — | | | | 1,311,823,047 | | |
Consumer Staples | | | 717,855,624 | | | | — | | | | — | | | | 717,855,624 | | |
Energy | | | 718,804,625 | | | | — | | | | — | | | | 718,804,625 | | |
Financials | | | 1,942,715,840 | | | | — | | | | — | | | | 1,942,715,840 | | |
Health Care | | | 1,593,845,120 | | | | — | | | | — | | | | 1,593,845,120 | | |
Industrials | | | 770,449,647 | | | | — | | | | — | | | | 770,449,647 | | |
Information Technology | | | 2,059,726,202 | | | | — | | | | — | | | | 2,059,726,202 | | |
Materials | | | 58,846,575 | | | | — | | | | — | | | | 58,846,575 | | |
Telecommunication Services | | | 300,875,417 | | | | — | | | | — | | | | 300,875,417 | | |
Utilities | | | 109,111,306 | | | | — | | | | — | | | | 109,111,306 | | |
Total Common Stocks | | | 9,584,053,403 | | | | — | | | | — | | | | 9,584,053,403 | | |
Investments measured at net asset value | |
Money Market Funds | | | — | | | | — | | | | — | | | | 305,769,244 | | |
Total Investments | | | 9,584,053,403 | | | | — | | | | — | | | | 9,889,822,647 | | |
See the Portfolio of Investments for all investment classifications not indicated in the table.
There were no transfers of financial assets between levels during the period.
The accompanying Notes to Financial Statements are an integral part of this statement.
Annual Report 2016
12
COLUMBIA CONTRARIAN CORE FUND
STATEMENT OF ASSETS AND LIABILITIES
August 31, 2016
Assets | |
Investments, at value | |
Unaffiliated issuers (identified cost $7,572,463,875) | | $ | 9,584,053,403 | | |
Affiliated issuers (identified cost $305,769,244) | | | 305,769,244 | | |
Total investments (identified cost $7,878,233,119) | | | 9,889,822,647 | | |
Receivable for: | |
Investments sold | | | 71,084,396 | | |
Capital shares sold | | | 13,960,310 | | |
Dividends | | | 18,730,962 | | |
Foreign tax reclaims | | | 351 | | |
Prepaid expenses | | | 71,758 | | |
Trustees' deferred compensation plan | | | 340,104 | | |
Total assets | | | 9,994,010,528 | | |
Liabilities | |
Payable for: | |
Investments purchased | | | 46,614,641 | | |
Capital shares purchased | | | 10,578,924 | | |
Management services fees | | | 166,886 | | |
Distribution and/or service fees | | | 41,906 | | |
Transfer agent fees | | | 1,306,659 | | |
Plan administration fees | | | 1,245 | | |
Compensation of board members | | | 319 | | |
Chief compliance officer expenses | | | 717 | | |
Other expenses | | | 310,879 | | |
Trustees' deferred compensation plan | | | 340,104 | | |
Total liabilities | | | 59,362,280 | | |
Net assets applicable to outstanding capital stock | | $ | 9,934,648,248 | | |
Represented by | |
Paid-in capital | | $ | 7,896,075,263 | | |
Undistributed net investment income | | | 45,532,775 | | |
Accumulated net realized loss | | | (18,549,316 | ) | |
Unrealized appreciation (depreciation) on: | |
Investments | | | 2,011,589,528 | | |
Foreign currency translations | | | (2 | ) | |
Total — representing net assets applicable to outstanding capital stock | | $ | 9,934,648,248 | | |
The accompanying Notes to Financial Statements are an integral part of this statement.
Annual Report 2016
13
COLUMBIA CONTRARIAN CORE FUND
STATEMENT OF ASSETS AND LIABILITIES (continued)
August 31, 2016
Class A | |
Net assets | | $ | 2,860,805,928 | | |
Shares outstanding | | | 128,365,042 | | |
Net asset value per share | | $ | 22.29 | | |
Maximum offering price per share(a) | | $ | 23.65 | | |
Class B | |
Net assets | | $ | 6,018,625 | | |
Shares outstanding | | | 297,408 | | |
Net asset value per share | | $ | 20.24 | | |
Class C | |
Net assets | | $ | 669,226,066 | | |
Shares outstanding | | | 32,998,664 | | |
Net asset value per share | | $ | 20.28 | | |
Class I | |
Net assets | | $ | 359,555,946 | | |
Shares outstanding | | | 16,011,586 | | |
Net asset value per share | | $ | 22.46 | | |
Class K | |
Net assets | | $ | 5,316,832 | | |
Shares outstanding | | | 236,991 | | |
Net asset value per share | | $ | 22.43 | | |
Class R | |
Net assets | | $ | 96,585,993 | | |
Shares outstanding | | | 4,334,053 | | |
Net asset value per share | | $ | 22.29 | | |
Class R4 | |
Net assets | | $ | 377,945,653 | | |
Shares outstanding | | | 16,571,418 | | |
Net asset value per share | | $ | 22.81 | | |
Class R5 | |
Net assets | | $ | 627,659,127 | | |
Shares outstanding | | | 27,527,505 | | |
Net asset value per share | | $ | 22.80 | | |
Class T | |
Net assets | | $ | 146,879,379 | | |
Shares outstanding | | | 6,650,496 | | |
Net asset value per share | | $ | 22.09 | | |
Maximum offering price per share(a) | | $ | 23.44 | | |
The accompanying Notes to Financial Statements are an integral part of this statement.
Annual Report 2016
14
COLUMBIA CONTRARIAN CORE FUND
STATEMENT OF ASSETS AND LIABILITIES (continued)
August 31, 2016
Class W | |
Net assets | | $ | 220,501,834 | | |
Shares outstanding | | | 9,892,249 | | |
Net asset value per share | | $ | 22.29 | | |
Class Y | |
Net assets | | $ | 329,514,193 | | |
Shares outstanding | | | 14,445,556 | | |
Net asset value per share | | $ | 22.81 | | |
Class Z | |
Net assets | | $ | 4,234,638,672 | | |
Shares outstanding | | | 188,591,241 | | |
Net asset value per share | | $ | 22.45 | | |
(a) The maximum offering price per share is calculated by dividing the net asset value per share by 1.0 minus the maximum sales charge of 5.75%.
The accompanying Notes to Financial Statements are an integral part of this statement.
Annual Report 2016
15
COLUMBIA CONTRARIAN CORE FUND
STATEMENT OF OPERATIONS
Year Ended August 31, 2016
Net investment income | |
Income: | |
Dividends — unaffiliated issuers | | $ | 134,065,805 | | |
Dividends — affiliated issuers | | | 802,528 | | |
Foreign taxes withheld | | | (162,883 | ) | |
Total income | | | 134,705,450 | | |
Expenses: | |
Management services fees | | | 46,537,308 | | |
Distribution and/or service fees | |
Class A | | | 6,359,888 | | |
Class B | | | 76,014 | | |
Class C | | | 5,323,306 | | |
Class R | | | 345,403 | | |
Class T | | | 357,601 | | |
Class W | | | 294,416 | | |
Transfer agent fees | |
Class A | | | 4,527,791 | | |
Class B | | | 13,567 | | |
Class C | | | 946,325 | | |
Class K | | | 880 | | |
Class R | | | 122,600 | | |
Class R4 | | | 529,598 | | |
Class R5 | | | 217,759 | | |
Class T | | | 254,814 | | |
Class W | | | 208,419 | | |
Class Z | | | 4,858,023 | | |
Plan administration fees | |
Class K | | | 4,401 | | |
Compensation of board members | | | 140,921 | | |
Custodian fees | | | 57,822 | | |
Printing and postage fees | | | 489,178 | | |
Registration fees | | | 508,231 | | |
Audit fees | | | 35,676 | | |
Legal fees | | | 196,856 | | |
Chief compliance officer expenses | | | 3,559 | | |
Other | | | 176,982 | | |
Total expenses | | | 72,587,338 | | |
Expense reductions | | | (4,350 | ) | |
Total net expenses | | | 72,582,988 | | |
Net investment income | | | 62,122,462 | | |
Realized and unrealized gain (loss) — net | |
Net realized gain (loss) on: | |
Investments | | | 8,897,048 | | |
Foreign currency translations | | | 8,423 | | |
Net realized gain | | | 8,905,471 | | |
Net change in unrealized appreciation (depreciation) on: | |
Investments | | | 815,596,964 | | |
Foreign currency translations | | | 466 | | |
Net change in unrealized appreciation | | | 815,597,430 | | |
Net realized and unrealized gain | | | 824,502,901 | | |
Net increase in net assets resulting from operations | | $ | 886,625,363 | | |
The accompanying Notes to Financial Statements are an integral part of this statement.
Annual Report 2016
16
COLUMBIA CONTRARIAN CORE FUND
STATEMENT OF CHANGES IN NET ASSETS
| | | Year Ended
August 31,
2016 | | Year Ended
August 31,
2015 | |
Operations | |
Net investment income | | $ | 62,122,462 | | | $ | 167,200,123 | | |
Net realized gain | | | 8,905,471 | | | | 226,539,268 | | |
Net change in unrealized appreciation (depreciation) | | | 815,597,430 | | | | (305,101,185 | ) | |
Net increase in net assets resulting from operations | | | 886,625,363 | | | | 88,638,206 | | |
Distributions to shareholders | |
Net investment income | |
Class A | | | (61,603,501 | ) | | | (8,507,483 | ) | |
Class B | | | (169,643 | ) | | | — | | |
Class C | | | (9,230,922 | ) | | | — | | |
Class I | | | (11,959,112 | ) | | | (4,798,155 | ) | |
Class K | | | (3,093 | ) | | | (674 | ) | |
Class R | | | (1,343,578 | ) | | | (78,264 | ) | |
Class R4 | | | (7,021,383 | ) | | | (816,168 | ) | |
Class R5 | | | (11,778,388 | ) | | | (1,922,616 | ) | |
Class T | | | (3,614,625 | ) | | | (642,160 | ) | |
Class W | | | (1,414,819 | ) | | | (758,782 | ) | |
Class Y | | | (1,957,696 | ) | | | (173,175 | ) | |
Class Z | | | (65,021,880 | ) | | | (13,614,092 | ) | |
Net realized gains | |
Class A | | | (71,377,749 | ) | | | (115,352,574 | ) | |
Class B | | | (281,084 | ) | | | (893,272 | ) | |
Class C | | | (15,383,736 | ) | | | (18,521,704 | ) | |
Class I | | | (11,792,193 | ) | | | (34,264,726 | ) | |
Class K | | | (3,406 | ) | | | (7,110 | ) | |
Class R | | | (1,730,183 | ) | | | (2,167,951 | ) | |
Class R4 | | | (7,412,136 | ) | | | (7,325,441 | ) | |
Class R5 | | | (11,842,976 | ) | | | (14,509,724 | ) | |
Class T | | | (4,210,566 | ) | | | (9,478,836 | ) | |
Class W | | | (1,639,301 | ) | | | (10,286,956 | ) | |
Class Y | | | (1,934,742 | ) | | | (1,236,681 | ) | |
Class Z | | | (68,474,886 | ) | | | (120,565,017 | ) | |
Total distributions to shareholders | | | (371,201,598 | ) | | | (365,921,561 | ) | |
Increase in net assets from capital stock activity | | | 3,228,540,706 | | | | 1,626,379,501 | | |
Total increase in net assets | | | 3,743,964,471 | | | | 1,349,096,146 | | |
Net assets at beginning of year | | | 6,190,683,777 | | | | 4,841,587,631 | | |
Net assets at end of year | | $ | 9,934,648,248 | | | $ | 6,190,683,777 | | |
Undistributed net investment income | | $ | 45,532,775 | | | $ | 159,226,713 | | |
The accompanying Notes to Financial Statements are an integral part of this statement.
Annual Report 2016
17
COLUMBIA CONTRARIAN CORE FUND
STATEMENT OF CHANGES IN NET ASSETS (continued)
| | | Year Ended August 31, 2016 | | Year Ended August 31, 2015 | |
| | | Shares | | Dollars ($) | | Shares | | Dollars ($) | |
Capital stock activity | |
Class A shares | |
Subscriptions(a) | | | 48,128,391 | | | | 1,017,079,358 | | | | 45,567,965 | | | | 1,005,475,133 | | |
Fund reorganization | | | 2,911,441 | | | | 60,325,156 | | | | — | | | | — | | |
Distributions reinvested | | | 6,161,108 | | | | 126,980,438 | | | | 5,695,290 | | | | 119,202,421 | | |
Redemptions | | | (36,847,943 | ) | | | (778,168,494 | ) | | | (17,440,479 | ) | | | (384,215,880 | ) | |
Net increase | | | 20,352,997 | | | | 426,216,458 | | | | 33,822,776 | | | | 740,461,674 | | |
Class B shares | |
Subscriptions | | | 45,719 | | | | 884,791 | | | | 88,496 | | | | 1,787,513 | | |
Distributions reinvested | | | 23,557 | | | | 443,344 | | | | 45,319 | | | | 869,677 | | |
Redemptions(a) | | | (264,258 | ) | | | (5,049,400 | ) | | | (322,718 | ) | | | (6,500,704 | ) | |
Net decrease | | | (194,982 | ) | | | (3,721,265 | ) | | | (188,903 | ) | | | (3,843,514 | ) | |
Class C shares | |
Subscriptions | | | 14,095,386 | | | | 272,495,550 | | | | 11,677,531 | | | | 236,079,207 | | |
Fund reorganization | | | 1,127,343 | | | | 21,281,992 | | | | — | | | | — | | |
Distributions reinvested | | | 1,091,134 | | | | 20,578,795 | | | | 776,999 | | | | 14,941,695 | | |
Redemptions | | | (4,401,923 | ) | | | (85,094,434 | ) | | | (2,175,882 | ) | | | (43,913,211 | ) | |
Net increase | | | 11,911,940 | | | | 229,261,903 | | | | 10,278,648 | | | | 207,107,691 | | |
Class I shares | |
Subscriptions | | | 4,361,594 | | | | 90,879,128 | | | | 8,920,645 | | | | 198,518,571 | | |
Fund reorganization | | | 94 | | | | 1,955 | | | | — | | | | — | | |
Distributions reinvested | | | 1,147,398 | | | | 23,751,142 | | | | 1,858,358 | | | | 39,062,676 | | |
Redemptions | | | (9,376,151 | ) | | | (201,335,473 | ) | | | (12,672,345 | ) | | | (284,995,676 | ) | |
Net decrease | | | (3,867,065 | ) | | | (86,703,248 | ) | | | (1,893,342 | ) | | | (47,414,429 | ) | |
Class K shares | |
Subscriptions | | | 248,597 | | | | 5,280,131 | | | | — | | | | — | | |
Distributions reinvested | | | 306 | | | | 6,336 | | | | 360 | | | | 7,576 | | |
Redemptions | | | (17,292 | ) | | | (383,527 | ) | | | — | | | | — | | |
Net increase | | | 231,611 | | | | 4,902,940 | | | | 360 | | | | 7,576 | | |
Class R shares | |
Subscriptions | | | 2,493,106 | | | | 52,783,290 | | | | 1,525,966 | | | | 33,723,333 | | |
Fund reorganization | | | 348,131 | | | | 7,216,396 | | | | — | | | | — | | |
Distributions reinvested | | | 102,297 | | | | 2,112,434 | | | | 69,759 | | | | 1,462,150 | | |
Redemptions | | | (963,209 | ) | | | (20,257,607 | ) | | | (596,145 | ) | | | (13,163,703 | ) | |
Net increase | | | 1,980,325 | | | | 41,854,513 | | | | 999,580 | | | | 22,021,780 | | |
The accompanying Notes to Financial Statements are an integral part of this statement.
Annual Report 2016
18
COLUMBIA CONTRARIAN CORE FUND
STATEMENT OF CHANGES IN NET ASSETS (continued)
| | | Year Ended August 31, 2016 | | Year Ended August 31, 2015 | |
| | | Shares | | Dollars ($) | | Shares | | Dollars ($) | |
Capital stock activity (continued) | |
Class R4 shares | |
Subscriptions | | | 8,232,471 | | | | 177,759,473 | | | | 7,603,669 | | | | 167,657,282 | | |
Fund reorganization | | | 364,058 | | | | 7,717,423 | | | | — | | | | — | | |
Distributions reinvested | | | 682,566 | | | | 14,368,022 | | | | 379,661 | | | | 8,105,769 | | |
Redemptions | | | (3,193,911 | ) | | | (69,241,659 | ) | | | (2,116,266 | ) | | | (47,395,372 | ) | |
Net increase | | | 6,085,184 | | | | 130,603,259 | | | | 5,867,064 | | | | 128,367,679 | | |
Class R5 shares | |
Subscriptions | | | 19,032,190 | | | | 414,631,025 | | | | 8,767,116 | | | | 197,169,255 | | |
Fund reorganization | | | 926,239 | | | | 19,625,841 | | | | — | | | | — | | |
Distributions reinvested | | | 1,117,699 | | | | 23,505,208 | | | | 761,574 | | | | 16,244,381 | | |
Redemptions | | | (9,009,812 | ) | | | (190,228,689 | ) | | | (3,244,261 | ) | | | (72,265,852 | ) | |
Net increase | | | 12,066,316 | | | | 267,533,385 | | | | 6,284,429 | | | | 141,147,784 | | |
Class T shares | |
Subscriptions | | | 110,941 | | | | 2,272,788 | | | | 143,425 | | | | 3,011,870 | | |
Distributions reinvested | | | 266,648 | | | | 5,444,949 | | | | 338,177 | | | | 7,017,172 | | |
Redemptions | | | (524,066 | ) | | | (11,080,577 | ) | | | (509,561 | ) | | | (11,173,172 | ) | |
Net decrease | | | (146,477 | ) | | | (3,362,840 | ) | | | (27,959 | ) | | | (1,144,130 | ) | |
Class W shares | |
Subscriptions | | | 9,044,630 | | | | 190,637,528 | | | | 4,495,889 | | | | 100,570,978 | | |
Fund reorganization | | | 95 | | | | 1,963 | | | | — | | | | — | | |
Distributions reinvested | | | 148,179 | | | | 3,053,977 | | | | 527,738 | | | | 11,045,553 | | |
Redemptions | | | (4,860,868 | ) | | | (105,635,402 | ) | | | (5,005,755 | ) | | | (109,077,232 | ) | |
Net increase | | | 4,332,036 | | | | 88,058,066 | | | | 17,872 | | | | 2,539,299 | | |
Class Y shares | |
Subscriptions | | | 12,749,816 | | | | 268,717,492 | | | | 2,447,484 | | | | 55,829,769 | | |
Fund reorganization | | | 65,725 | | | | 1,392,855 | | | | — | | | | — | | |
Distributions reinvested | | | 132,077 | | | | 2,777,583 | | | | 14,348 | | | | 306,053 | | |
Redemptions | | | (950,699 | ) | | | (20,822,683 | ) | | | (123,265 | ) | | | (2,790,813 | ) | |
Net increase | | | 11,996,919 | | | | 252,065,247 | | | | 2,338,567 | | | | 53,345,009 | | |
Class Z shares | |
Subscriptions | | | 56,743,145 | | | | 1,206,996,663 | | | | 31,332,502 | | | | 691,476,272 | | |
Fund reorganization | | | 59,654,609 | | | | 1,245,149,414 | | | | — | | | | — | | |
Distributions reinvested | | | 4,076,451 | | | | 84,504,832 | | | | 3,893,061 | | | | 81,910,017 | | |
Redemptions | | | (30,828,122 | ) | | | (654,818,621 | ) | | | (17,581,024 | ) | | | (389,603,207 | ) | |
Net increase | | | 89,646,083 | | | | 1,881,832,288 | | | | 17,644,539 | | | | 383,783,082 | | |
Total net increase | | | 154,394,887 | | | | 3,228,540,706 | | | | 75,143,631 | | | | 1,626,379,501 | | |
(a) Includes conversions of Class B shares to Class A shares, if any.
The accompanying Notes to Financial Statements are an integral part of this statement.
Annual Report 2016
19
COLUMBIA CONTRARIAN CORE FUND
The following tables are intended to help you understand the Fund's financial performance. Certain information reflects financial results for a single share of a class held for the periods shown. Per share net investment income (loss) amounts are calculated based on average shares outstanding during the period. Total return assumes reinvestment of all dividends and distributions, if any. Total return does not reflect payment of sales charges, if any. Total return and portfolio turnover are not annualized for periods of less than one year. The portfolio turnover rate is calculated without regard to purchase and sales transactions of short-term instruments and certain derivatives, if any. If such transactions were included, the Fund's portfolio turnover rate may be higher.
| | | Year Ended August 31, | | Year Ended
September 30, | |
Class A | | 2016 | | 2015 | | 2014 | | 2013 | | 2012(a) | | 2011 | |
Per share data | |
Net asset value, beginning of period | | $ | 21.27 | | | $ | 22.37 | | | $ | 19.15 | | | $ | 15.68 | | | $ | 12.63 | | | $ | 12.61 | | |
Income from investment operations: | |
Net investment income | | | 0.15 | | | | 0.65 | (b) | | | 0.14 | | | | 0.13 | | | | 0.11 | | | | 0.08 | | |
Net realized and unrealized gain (loss) | | | 2.05 | | | | (0.23 | ) | | | 4.32 | | | | 3.48 | | | | 3.32 | | | | (0.03 | ) | |
Total from investment operations | | | 2.20 | | | | 0.42 | | | | 4.46 | | | | 3.61 | | | | 3.43 | | | | 0.05 | | |
Less distributions to shareholders: | |
Net investment income | | | (0.55 | ) | | | (0.10 | ) | | | (0.11 | ) | | | (0.12 | ) | | | (0.07 | ) | | | (0.03 | ) | |
Net realized gains | | | (0.63 | ) | | | (1.42 | ) | | | (1.13 | ) | | | (0.02 | ) | | | (0.31 | ) | | | — | | |
Total distributions to shareholders | | | (1.18 | ) | | | (1.52 | ) | | | (1.24 | ) | | | (0.14 | ) | | | (0.38 | ) | | | (0.03 | ) | |
Net asset value, end of period | | $ | 22.29 | | | $ | 21.27 | | | $ | 22.37 | | | $ | 19.15 | | | $ | 15.68 | | | $ | 12.63 | | |
Total return | | | 10.79 | % | | | 1.99 | % | | | 24.15 | % | | | 23.23 | % | | | 27.59 | % | | | 0.39 | % | |
Ratios to average net assets(c) | |
Total gross expenses | | | 1.07 | % | | | 1.09 | % | | | 1.11 | % | | | 1.15 | % | | | 1.19 | %(d) | | | 1.19 | %(e) | |
Total net expenses(f) | | | 1.07 | %(g) | | | 1.09 | %(g) | | | 1.11 | %(g) | | | 1.14 | %(g) | | | 1.16 | %(d)(g) | | | 1.16 | %(e)(g) | |
Net investment income | | | 0.72 | % | | | 2.93 | % | | | 0.69 | % | | | 0.73 | % | | | 0.82 | %(d) | | | 0.56 | % | |
Supplemental data | |
Net assets, end of period (in thousands) | | $ | 2,860,806 | | | $ | 2,297,176 | | | $ | 1,659,841 | | | $ | 913,212 | | | $ | 588,182 | | | $ | 427,039 | | |
Portfolio turnover | | | 47 | % | | | 60 | % | | | 65 | % | | | 47 | % | | | 62 | % | | | 78 | % | |
Notes to Financial Highlights
(a) For the period from October 1, 2011 to August 31, 2012. During the period, the Fund's fiscal year end was changed from September 30 to August 31.
(b) Net investment income per share includes special dividends. The effect of these dividends amounted to $0.54 per share.
(c) In addition to the fees and expenses that the Fund bears directly, the Fund indirectly bears a pro rata share of the fees and expenses of any other funds in which it invests. Such indirect expenses are not included in the Fund's reported expense ratios.
(d) Annualized.
(e) Ratios include line of credit interest expense which is less than 0.01%.
(f) Total net expenses include the impact of certain fee waivers/expense reimbursements made by the Investment Manager and certain of its affiliates, if applicable.
(g) The benefits derived from expense reductions had an impact of less than 0.01%.
The accompanying Notes to Financial Statements are an integral part of this statement.
Annual Report 2016
20
COLUMBIA CONTRARIAN CORE FUND
FINANCIAL HIGHLIGHTS (continued)
| | | Year Ended August 31, | | Year Ended
September 30, | |
Class B | | 2016 | | 2015 | | 2014 | | 2013 | | 2012(a) | | 2011 | |
Per share data | |
Net asset value, beginning of period | | $ | 19.40 | | | $ | 20.58 | | | $ | 17.74 | | | $ | 14.53 | | | $ | 11.74 | | | $ | 11.78 | | |
Income from investment operations: | |
Net investment income (loss) | | | (0.01 | ) | | | 0.29 | (b) | | | (0.01 | ) | | | (0.00 | )(c) | | | 0.01 | | | | (0.03 | ) | |
Net realized and unrealized gain (loss) | | | 1.87 | | | | (0.05 | ) | | | 3.98 | | | | 3.24 | | | | 3.09 | | | | (0.01 | ) | |
Total from investment operations | | | 1.86 | | | | 0.24 | | | | 3.97 | | | | 3.24 | | | | 3.10 | | | | (0.04 | ) | |
Less distributions to shareholders: | |
Net investment income | | | (0.39 | ) | | | — | | | | — | | | | (0.01 | ) | | | — | | | | — | | |
Net realized gains | | | (0.63 | ) | | | (1.42 | ) | | | (1.13 | ) | | | (0.02 | ) | | | (0.31 | ) | | | — | | |
Total distributions to shareholders | | | (1.02 | ) | | | (1.42 | ) | | | (1.13 | ) | | | (0.03 | ) | | | (0.31 | ) | | | — | | |
Net asset value, end of period | | $ | 20.24 | | | $ | 19.40 | | | $ | 20.58 | | | $ | 17.74 | | | $ | 14.53 | | | $ | 11.74 | | |
Total return | | | 9.96 | % | | | 1.22 | % | | | 23.20 | % | | | 22.32 | % | | | 26.72 | % | | | (0.34 | %) | |
Ratios to average net assets(d) | |
Total gross expenses | | | 1.83 | % | | | 1.84 | % | | | 1.86 | % | | | 1.90 | % | | | 1.94 | %(e) | | | 1.92 | %(f) | |
Total net expenses(g) | | | 1.83 | %(h) | | | 1.84 | %(h) | | | 1.86 | %(h) | | | 1.89 | %(h) | | | 1.91 | %(e)(h) | | | 1.90 | %(f)(h) | |
Net investment income (loss) | | | (0.06 | %) | | | 1.40 | % | | | (0.08 | %) | | | (0.02 | %) | | | 0.05 | %(e) | | | (0.19 | %) | |
Supplemental data | |
Net assets, end of period (in thousands) | | $ | 6,019 | | | $ | 9,551 | | | $ | 14,023 | | | $ | 16,396 | | | $ | 17,292 | | | $ | 21,560 | | |
Portfolio turnover | | | 47 | % | | | 60 | % | | | 65 | % | | | 47 | % | | | 62 | % | | | 78 | % | |
Notes to Financial Highlights
(a) For the period from October 1, 2011 to August 31, 2012. During the period, the Fund's fiscal year end was changed from September 30 to August 31.
(b) Net investment income per share includes special dividends. The effect of these dividends amounted to $0.35 per share.
(c) Rounds to zero.
(d) In addition to the fees and expenses that the Fund bears directly, the Fund indirectly bears a pro rata share of the fees and expenses of any other funds in which it invests. Such indirect expenses are not included in the Fund's reported expense ratios.
(e) Annualized.
(f) Ratios include line of credit interest expense which is less than 0.01%.
(g) Total net expenses include the impact of certain fee waivers/expense reimbursements made by the Investment Manager and certain of its affiliates, if applicable.
(h) The benefits derived from expense reductions had an impact of less than 0.01%.
The accompanying Notes to Financial Statements are an integral part of this statement.
Annual Report 2016
21
COLUMBIA CONTRARIAN CORE FUND
FINANCIAL HIGHLIGHTS (continued)
| | | Year Ended August 31, | | Year Ended
September 30, | |
Class C | | 2016 | | 2015 | | 2014 | | 2013 | | 2012(a) | | 2011 | |
Per share data | |
Net asset value, beginning of period | | $ | 19.43 | | | $ | 20.62 | | | $ | 17.77 | | | $ | 14.55 | | | $ | 11.76 | | | $ | 11.80 | | |
Income from investment operations: | |
Net investment income (loss) | | | (0.00 | ) | | | 0.50 | (b) | | | (0.01 | ) | | | (0.00 | )(c) | | | 0.01 | | | | (0.03 | ) | |
Net realized and unrealized gain (loss) | | | 1.86 | | | | (0.27 | ) | | | 3.99 | | | | 3.25 | | | | 3.09 | | | | (0.01 | ) | |
Total from investment operations | | | 1.86 | | | | 0.23 | | | | 3.98 | | | | 3.25 | | | | 3.10 | | | | (0.04 | ) | |
Less distributions to shareholders: | |
Net investment income | | | (0.38 | ) | | | — | | | | — | | | | (0.01 | ) | | | — | | | | — | | |
Net realized gains | | | (0.63 | ) | | | (1.42 | ) | | | (1.13 | ) | | | (0.02 | ) | | | (0.31 | ) | | | — | | |
Total distributions to shareholders | | | (1.01 | ) | | | (1.42 | ) | | | (1.13 | ) | | | (0.03 | ) | | | (0.31 | ) | | | — | | |
Net asset value, end of period | | $ | 20.28 | | | $ | 19.43 | | | $ | 20.62 | | | $ | 17.77 | | | $ | 14.55 | | | $ | 11.76 | | |
Total return | | | 9.98 | % | | | 1.17 | % | | | 23.22 | % | | | 22.36 | % | | | 26.68 | % | | | (0.34 | %) | |
Ratios to average net assets(d) | |
Total gross expenses | | | 1.83 | % | | | 1.85 | % | | | 1.86 | % | | | 1.90 | % | | | 1.94 | %(e) | | | 1.95 | %(f) | |
Total net expenses(g) | | | 1.83 | %(h) | | | 1.85 | %(h) | | | 1.86 | %(h) | | | 1.89 | %(h) | | | 1.91 | %(e)(h) | | | 1.92 | %(f)(h) | |
Net investment income (loss) | | | (0.02 | %) | | | 2.46 | % | | | (0.06 | %) | | | (0.02 | %) | | | 0.07 | %(e) | | | (0.22 | %) | |
Supplemental data | |
Net assets, end of period (in thousands) | | $ | 669,226 | | | $ | 409,798 | | | $ | 222,834 | | | $ | 115,940 | | | $ | 58,257 | | | $ | 36,559 | | |
Portfolio turnover | | | 47 | % | | | 60 | % | | | 65 | % | | | 47 | % | | | 62 | % | | | 78 | % | |
Notes to Financial Highlights
(a) For the period from October 1, 2011 to August 31, 2012. During the period, the Fund's fiscal year end was changed from September 30 to August 31.
(b) Net investment income per share includes special dividends. The effect of these dividends amounted to $0.55 per share.
(c) Rounds to zero.
(d) In addition to the fees and expenses that the Fund bears directly, the Fund indirectly bears a pro rata share of the fees and expenses of any other funds in which it invests. Such indirect expenses are not included in the Fund's reported expense ratios.
(e) Annualized.
(f) Ratios include line of credit interest expense which is less than 0.01%.
(g) Total net expenses include the impact of certain fee waivers/expense reimbursements made by the Investment Manager and certain of its affiliates, if applicable.
(h) The benefits derived from expense reductions had an impact of less than 0.01%.
The accompanying Notes to Financial Statements are an integral part of this statement.
Annual Report 2016
22
COLUMBIA CONTRARIAN CORE FUND
FINANCIAL HIGHLIGHTS (continued)
| | | Year Ended August 31, | | Year Ended
September 30, | |
Class I | | 2016 | | 2015 | | 2014 | | 2013 | | 2012(a) | | 2011 | |
Per share data | |
Net asset value, beginning of period | | $ | 21.43 | | | $ | 22.53 | | | $ | 19.27 | | | $ | 15.78 | | | $ | 12.71 | | | $ | 12.69 | | |
Income from investment operations: | |
Net investment income | | | 0.24 | | | | 0.57 | (b) | | | 0.23 | | | | 0.21 | | | | 0.17 | | | | 0.14 | | |
Net realized and unrealized gain (loss) | | | 2.06 | | | | (0.06 | ) | | | 4.35 | | | | 3.49 | | | | 3.34 | | | | (0.03 | ) | |
Total from investment operations | | | 2.30 | | | | 0.51 | | | | 4.58 | | | | 3.70 | | | | 3.51 | | | | 0.11 | | |
Less distributions to shareholders: | |
Net investment income | | | (0.64 | ) | | | (0.19 | ) | | | (0.19 | ) | | | (0.19 | ) | | | (0.13 | ) | | | (0.09 | ) | |
Net realized gains | | | (0.63 | ) | | | (1.42 | ) | | | (1.13 | ) | | | (0.02 | ) | | | (0.31 | ) | | | — | | |
Total distributions to shareholders | | | (1.27 | ) | | | (1.61 | ) | | | (1.32 | ) | | | (0.21 | ) | | | (0.44 | ) | | | (0.09 | ) | |
Net asset value, end of period | | $ | 22.46 | | | $ | 21.43 | | | $ | 22.53 | | | $ | 19.27 | | | $ | 15.78 | | | $ | 12.71 | | |
Total return | | | 11.26 | % | | | 2.42 | % | | | 24.71 | % | | | 23.73 | % | | | 28.12 | % | | | 0.81 | % | |
Ratios to average net assets(c) | |
Total gross expenses | | | 0.65 | % | | | 0.65 | % | | | 0.68 | % | | | 0.70 | % | | | 0.75 | %(d) | | | 0.76 | %(e) | |
Total net expenses(f) | | | 0.65 | % | | | 0.65 | % | | | 0.68 | % | | | 0.70 | % | | | 0.75 | %(d) | | | 0.76 | %(e)(g) | |
Net investment income | | | 1.14 | % | | | 2.55 | % | | | 1.12 | % | | | 1.17 | % | | | 1.24 | %(d) | | | 0.99 | % | |
Supplemental data | |
Net assets, end of period (in thousands) | | $ | 359,556 | | | $ | 425,921 | | | $ | 490,451 | | | $ | 424,376 | | | $ | 385,802 | | | $ | 280,304 | | |
Portfolio turnover | | | 47 | % | | | 60 | % | | | 65 | % | | | 47 | % | | | 62 | % | | | 78 | % | |
Notes to Financial Highlights
(a) For the period from October 1, 2011 to August 31, 2012. During the period, the Fund's fiscal year end was changed from September 30 to August 31.
(b) Net investment income per share includes special dividends. The effect of these dividends amounted to $0.37 per share.
(c) In addition to the fees and expenses that the Fund bears directly, the Fund indirectly bears a pro rata share of the fees and expenses of any other funds in which it invests. Such indirect expenses are not included in the Fund's reported expense ratios.
(d) Annualized.
(e) Ratios include line of credit interest expense which is less than 0.01%.
(f) Total net expenses include the impact of certain fee waivers/expense reimbursements made by the Investment Manager and certain of its affiliates, if applicable.
(g) The benefits derived from expense reductions had an impact of less than 0.01%.
The accompanying Notes to Financial Statements are an integral part of this statement.
Annual Report 2016
23
COLUMBIA CONTRARIAN CORE FUND
FINANCIAL HIGHLIGHTS (continued)
| | | Year Ended August 31, | | Year Ended
September 30, | |
Class K | | 2016 | | 2015 | | 2014 | | 2013 | | 2012(a) | | 2011(b) | |
Per share data | |
Net asset value, beginning of period | | $ | 21.40 | | | $ | 22.50 | | | $ | 19.26 | | | $ | 15.77 | | | $ | 12.70 | | | $ | 14.93 | | |
Income from investment operations: | |
Net investment income | | | 0.23 | | | | 0.61 | (c) | | | 0.17 | | | | 0.15 | | | | 0.13 | | | | 0.06 | | |
Net realized and unrealized gain (loss) | | | 2.01 | | | | (0.16 | ) | | | 4.33 | | | | 3.51 | | | | 3.34 | | | | (2.29 | ) | |
Total from investment operations | | | 2.24 | | | | 0.45 | | | | 4.50 | | | | 3.66 | | | | 3.47 | | | | (2.23 | ) | |
Less distributions to shareholders: | |
Net investment income | | | (0.58 | ) | | | (0.13 | ) | | | (0.13 | ) | | | (0.15 | ) | | | (0.09 | ) | | | — | | |
Net realized gains | | | (0.63 | ) | | | (1.42 | ) | | | (1.13 | ) | | | (0.02 | ) | | | (0.31 | ) | | | — | | |
Total distributions to shareholders | | | (1.21 | ) | | | (1.55 | ) | | | (1.26 | ) | | | (0.17 | ) | | | (0.40 | ) | | | — | | |
Net asset value, end of period | | $ | 22.43 | | | $ | 21.40 | | | $ | 22.50 | | | $ | 19.26 | | | $ | 15.77 | | | $ | 12.70 | | |
Total return | | | 10.92 | % | | | 2.12 | % | | | 24.27 | % | | | 23.40 | % | | | 27.74 | % | | | (14.94 | %) | |
Ratios to average net assets(d) | |
Total gross expenses | | | 0.95 | % | | | 0.96 | % | | | 0.97 | % | | | 1.00 | % | | | 1.05 | %(e) | | | 1.05 | %(e)(f) | |
Total net expenses(g) | | | 0.95 | % | | | 0.96 | % | | | 0.97 | % | | | 1.00 | % | | | 1.05 | %(e) | | | 1.05 | %(e)(f)(h) | |
Net investment income | | | 1.08 | % | | | 2.73 | % | | | 0.81 | % | | | 0.87 | % | | | 0.93 | %(e) | | | 0.72 | %(e) | |
Supplemental data | |
Net assets, end of period (in thousands) | | $ | 5,317 | | | $ | 115 | | | $ | 113 | | | $ | 144 | | | $ | 117 | | | $ | 100 | | |
Portfolio turnover | | | 47 | % | | | 60 | % | | | 65 | % | | | 47 | % | | | 62 | % | | | 78 | % | |
Notes to Financial Highlights
(a) For the period from October 1, 2011 to August 31, 2012. During the period, the Fund's fiscal year end was changed from September 30 to August 31.
(b) Based on operations from March 7, 2011 (commencement of operations) through the stated period end.
(c) Net investment income per share includes special dividends. The effect of these dividends amounted to $0.47 per share.
(d) In addition to the fees and expenses that the Fund bears directly, the Fund indirectly bears a pro rata share of the fees and expenses of any other funds in which it invests. Such indirect expenses are not included in the Fund's reported expense ratios.
(e) Annualized.
(f) Ratios include line of credit interest expense which is less than 0.01%.
(g) Total net expenses include the impact of certain fee waivers/expense reimbursements made by the Investment Manager and certain of its affiliates, if applicable.
(h) The benefits derived from expense reductions had an impact of less than 0.01%.
The accompanying Notes to Financial Statements are an integral part of this statement.
Annual Report 2016
24
COLUMBIA CONTRARIAN CORE FUND
FINANCIAL HIGHLIGHTS (continued)
| | | Year Ended August 31, | | Year Ended
September 30, | |
Class R | | 2016 | | 2015 | | 2014 | | 2013 | | 2012(a) | | 2011 | |
Per share data | |
Net asset value, beginning of period | | $ | 21.26 | | | $ | 22.37 | | | $ | 19.15 | | | $ | 15.68 | | | $ | 12.63 | | | $ | 12.61 | | |
Income from investment operations: | |
Net investment income | | | 0.10 | | | | 0.65 | (b) | | | 0.09 | | | | 0.08 | | | | 0.08 | | | | 0.05 | | |
Net realized and unrealized gain (loss) | | | 2.05 | | | | (0.29 | ) | | | 4.32 | | | | 3.49 | | | | 3.32 | | | | (0.03 | ) | |
Total from investment operations | | | 2.15 | | | | 0.36 | | | | 4.41 | | | | 3.57 | | | | 3.40 | | | | 0.02 | | |
Less distributions to shareholders: | |
Net investment income | | | (0.49 | ) | | | (0.05 | ) | | | (0.06 | ) | | | (0.08 | ) | | | (0.04 | ) | | | — | | |
Net realized gains | | | (0.63 | ) | | | (1.42 | ) | | | (1.13 | ) | | | (0.02 | ) | | | (0.31 | ) | | | — | | |
Total distributions to shareholders | | | (1.12 | ) | | | (1.47 | ) | | | (1.19 | ) | | | (0.10 | ) | | | (0.35 | ) | | | — | | |
Net asset value, end of period | | $ | 22.29 | | | $ | 21.26 | | | $ | 22.37 | | | $ | 19.15 | | | $ | 15.68 | | | $ | 12.63 | | |
Total return | | | 10.55 | % | | | 1.69 | % | | | 23.86 | % | | | 22.93 | % | | | 27.34 | % | | | 0.16 | % | |
Ratios to average net assets(c) | |
Total gross expenses | | | 1.32 | % | | | 1.34 | % | | | 1.36 | % | | | 1.39 | % | | | 1.42 | %(d) | | | 1.44 | %(e) | |
Total net expenses(f) | | | 1.32 | %(g) | | �� | 1.34 | %(g) | | | 1.36 | %(g) | | | 1.39 | %(g) | | | 1.41 | %(d)(g) | | | 1.39 | %(e)(g) | |
Net investment income | | | 0.49 | % | | | 2.93 | % | | | 0.44 | % | | | 0.46 | % | | | 0.59 | %(d) | | | 0.32 | % | |
Supplemental data | |
Net assets, end of period (in thousands) | | $ | 96,586 | | | $ | 50,048 | | | $ | 30,291 | | | $ | 13,102 | | | $ | 4,489 | | | $ | 6 | | |
Portfolio turnover | | | 47 | % | | | 60 | % | | | 65 | % | | | 47 | % | | | 62 | % | | | 78 | % | |
Notes to Financial Highlights
(a) For the period from October 1, 2011 to August 31, 2012. During the period, the Fund's fiscal year end was changed from September 30 to August 31.
(b) Net investment income per share includes special dividends. The effect of these dividends amounted to $0.60 per share.
(c) In addition to the fees and expenses that the Fund bears directly, the Fund indirectly bears a pro rata share of the fees and expenses of any other funds in which it invests. Such indirect expenses are not included in the Fund's reported expense ratios.
(d) Annualized.
(e) Ratios include line of credit interest expense which is less than 0.01%.
(f) Total net expenses include the impact of certain fee waivers/expense reimbursements made by the Investment Manager and certain of its affiliates, if applicable.
(g) The benefits derived from expense reductions had an impact of less than 0.01%.
The accompanying Notes to Financial Statements are an integral part of this statement.
Annual Report 2016
25
COLUMBIA CONTRARIAN CORE FUND
FINANCIAL HIGHLIGHTS (continued)
| | | Year Ended August 31, | |
Class R4 | | 2016 | | 2015 | | 2014 | | 2013(a) | |
Per share data | |
Net asset value, beginning of period | | $ | 21.74 | | | $ | 22.83 | | | $ | 19.52 | | | $ | 15.84 | | |
Income from investment operations: | |
Net investment income | | | 0.21 | | | | 0.80 | (b) | | | 0.20 | | | | 0.16 | | |
Net realized and unrealized gain (loss) | | | 2.09 | | | | (0.32 | ) | | | 4.40 | | | | 3.70 | | |
Total from investment operations | | | 2.30 | | | | 0.48 | | | | 4.60 | | | | 3.86 | | |
Less distributions to shareholders: | |
Net investment income | | | (0.60 | ) | | | (0.15 | ) | | | (0.16 | ) | | | (0.16 | ) | |
Net realized gains | | | (0.63 | ) | | | (1.42 | ) | | | (1.13 | ) | | | (0.02 | ) | |
Total distributions to shareholders | | | (1.23 | ) | | | (1.57 | ) | | | (1.29 | ) | | | (0.18 | ) | |
Net asset value, end of period | | $ | 22.81 | | | $ | 21.74 | | | $ | 22.83 | | | $ | 19.52 | | |
Total return | | | 11.07 | % | | | 2.25 | % | | | 24.44 | % | | | 24.61 | % | |
Ratios to average net assets(c) | |
Total gross expenses | | | 0.82 | % | | | 0.85 | % | | | 0.86 | % | | | 0.89 | %(d) | |
Total net expenses(e) | | | 0.82 | %(f) | | | 0.85 | %(f) | | | 0.86 | %(f) | | | 0.89 | %(d)(f) | |
Net investment income | | | 0.99 | % | | | 3.53 | % | | | 0.94 | % | | | 1.04 | %(d) | |
Supplemental data | |
Net assets, end of period (in thousands) | | $ | 377,946 | | | $ | 227,941 | | | $ | 105,458 | | | $ | 46,212 | | |
Portfolio turnover | | | 47 | % | | | 60 | % | | | 65 | % | | | 47 | % | |
Notes to Financial Highlights
(a) Based on operations from November 8, 2012 (commencement of operations) through the stated period end.
(b) Net investment income per share includes special dividends. The effect of these dividends amounted to $0.63 per share.
(c) In addition to the fees and expenses that the Fund bears directly, the Fund indirectly bears a pro rata share of the fees and expenses of any other funds in which it invests. Such indirect expenses are not included in the Fund's reported expense ratios.
(d) Annualized.
(e) Total net expenses include the impact of certain fee waivers/expense reimbursements made by the Investment Manager and certain of its affiliates, if applicable.
(f) The benefits derived from expense reductions had an impact of less than 0.01%.
The accompanying Notes to Financial Statements are an integral part of this statement.
Annual Report 2016
26
COLUMBIA CONTRARIAN CORE FUND
FINANCIAL HIGHLIGHTS (continued)
| | | Year Ended August 31, | |
Class R5 | | 2016 | | 2015 | | 2014 | | 2013(a) | |
Per share data | |
Net asset value, beginning of period | | $ | 21.73 | | | $ | 22.83 | | | $ | 19.52 | | | $ | 15.84 | | |
Income from investment operations: | |
Net investment income | | | 0.24 | | | | 0.78 | (b) | | | 0.23 | | | | 0.15 | | |
Net realized and unrealized gain (loss) | | | 2.09 | | | | (0.28 | ) | | | 4.39 | | | | 3.73 | | |
Total from investment operations | | | 2.33 | | | | 0.50 | | | | 4.62 | | | | 3.88 | | |
Less distributions to shareholders: | |
Net investment income | | | (0.63 | ) | | | (0.18 | ) | | | (0.18 | ) | | | (0.18 | ) | |
Net realized gains | | | (0.63 | ) | | | (1.42 | ) | | | (1.13 | ) | | | (0.02 | ) | |
Total distributions to shareholders | | | (1.26 | ) | | | (1.60 | ) | | | (1.31 | ) | | | (0.20 | ) | |
Net asset value, end of period | | $ | 22.80 | | | $ | 21.73 | | | $ | 22.83 | | | $ | 19.52 | | |
Total return | | | 11.22 | % | | | 2.34 | % | | | 24.60 | % | | | 24.75 | % | |
Ratios to average net assets(c) | |
Total gross expenses | | | 0.70 | % | | | 0.71 | % | | | 0.73 | % | | | 0.75 | %(d) | |
Total net expenses(e) | | | 0.70 | % | | | 0.71 | % | | | 0.73 | % | | | 0.75 | %(d) | |
Net investment income | | | 1.12 | % | | | 3.45 | % | | | 1.08 | % | | | 1.01 | %(d) | |
Supplemental data | |
Net assets, end of period (in thousands) | | $ | 627,659 | | | $ | 336,043 | | | $ | 209,498 | | | $ | 68,709 | | |
Portfolio turnover | | | 47 | % | | | 60 | % | | | 65 | % | | | 47 | % | |
Notes to Financial Highlights
(a) Based on operations from November 8, 2012 (commencement of operations) through the stated period end.
(b) Net investment income per share includes special dividends. The effect of these dividends amounted to $0.58 per share.
(c) In addition to the fees and expenses that the Fund bears directly, the Fund indirectly bears a pro rata share of the fees and expenses of any other funds in which it invests. Such indirect expenses are not included in the Fund's reported expense ratios.
(d) Annualized.
(e) Total net expenses include the impact of certain fee waivers/expense reimbursements made by the Investment Manager and certain of its affiliates, if applicable.
The accompanying Notes to Financial Statements are an integral part of this statement.
Annual Report 2016
27
COLUMBIA CONTRARIAN CORE FUND
FINANCIAL HIGHLIGHTS (continued)
| | | Year Ended August 31, | | Year Ended
September 30, | |
Class T | | 2016 | | 2015 | | 2014 | | 2013 | | 2012(a) | | 2011 | |
Per share data | |
Net asset value, beginning of period | | $ | 21.08 | | | $ | 22.19 | | | $ | 19.01 | | | $ | 15.56 | | | $ | 12.54 | | | $ | 12.51 | | |
Income from investment operations: | |
Net investment income | | | 0.15 | | | | 0.55 | (b) | | | 0.13 | | | | 0.12 | | | | 0.10 | | | | 0.06 | | |
Net realized and unrealized gain (loss) | | | 2.04 | | | | (0.15 | ) | | | 4.28 | | | | 3.47 | | | | 3.29 | | | | — | | |
Total from investment operations | | | 2.19 | | | | 0.40 | | | | 4.41 | | | | 3.59 | | | | 3.39 | | | | 0.06 | | |
Less distributions to shareholders: | |
Net investment income | | | (0.55 | ) | | | (0.09 | ) | | | (0.10 | ) | | | (0.12 | ) | | | (0.06 | ) | | | (0.03 | ) | |
Net realized gains | | | (0.63 | ) | | | (1.42 | ) | | | (1.13 | ) | | | (0.02 | ) | | | (0.31 | ) | | | — | | |
Total distributions to shareholders | | | (1.18 | ) | | | (1.51 | ) | | | (1.23 | ) | | | (0.14 | ) | | | (0.37 | ) | | | (0.03 | ) | |
Net asset value, end of period | | $ | 22.09 | | | $ | 21.08 | | | $ | 22.19 | | | $ | 19.01 | | | $ | 15.56 | | | $ | 12.54 | | |
Total return | | | 10.83 | % | | | 1.92 | % | | | 24.06 | % | | | 23.22 | % | | | 27.49 | % | | | 0.43 | % | |
Ratios to average net assets(c) | |
Total gross expenses | | | 1.08 | % | | | 1.11 | % | | | 1.16 | % | | | 1.20 | % | | | 1.24 | %(d) | | | 1.26 | %(e) | |
Total net expenses(f) | | | 1.08 | %(g) | | | 1.11 | %(g) | | | 1.16 | %(g) | | | 1.19 | %(g) | | | 1.21 | %(d)(g) | | | 1.21 | %(e)(g) | |
Net investment income | | | 0.71 | % | | | 2.49 | % | | | 0.63 | % | | | 0.68 | % | | | 0.77 | %(d) | | | 0.44 | % | |
Supplemental data | |
Net assets, end of period (in thousands) | | $ | 146,879 | | | $ | 143,304 | | | $ | 151,430 | | | $ | 131,732 | | | $ | 117,457 | | | $ | 100,805 | | |
Portfolio turnover | | | 47 | % | | | 60 | % | | | 65 | % | | | 47 | % | | | 62 | % | | | 78 | % | |
Notes to Financial Highlights
(a) For the period from October 1, 2011 to August 31, 2012. During the period, the Fund's fiscal year end was changed from September 30 to August 31.
(b) Net investment income per share includes special dividends. The effect of these dividends amounted to $0.45 per share.
(c) In addition to the fees and expenses that the Fund bears directly, the Fund indirectly bears a pro rata share of the fees and expenses of any other funds in which it invests. Such indirect expenses are not included in the Fund's reported expense ratios.
(d) Annualized.
(e) Ratios include line of credit interest expense which is less than 0.01%.
(f) Total net expenses include the impact of certain fee waivers/expense reimbursements made by the Investment Manager and certain of its affiliates, if applicable.
(g) The benefits derived from expense reductions had an impact of less than 0.01%.
The accompanying Notes to Financial Statements are an integral part of this statement.
Annual Report 2016
28
COLUMBIA CONTRARIAN CORE FUND
FINANCIAL HIGHLIGHTS (continued)
| | | Year Ended August 31, | | Year Ended
September 30, | |
Class W | | 2016 | | 2015 | | 2014 | | 2013 | | 2012(a) | | 2011 | |
Per share data | |
Net asset value, beginning of period | | $ | 21.27 | | | $ | 22.38 | | | $ | 19.16 | | | $ | 15.69 | | | $ | 12.64 | | | $ | 12.61 | | |
Income from investment operations: | |
Net investment income | | | 0.15 | | | | 0.50 | (b) | | | 0.14 | | | | 0.13 | | | | 0.11 | | | | 0.08 | | |
Net realized and unrealized gain (loss) | | | 2.05 | | | | (0.09 | ) | | | 4.32 | | | | 3.48 | | | | 3.32 | | | | (0.02 | ) | |
Total from investment operations | | | 2.20 | | | | 0.41 | | | | 4.46 | | | | 3.61 | | | | 3.43 | | | | 0.06 | | |
Less distributions to shareholders: | |
Net investment income | | | (0.55 | ) | | | (0.10 | ) | | | (0.11 | ) | | | (0.12 | ) | | | (0.07 | ) | | | (0.03 | ) | |
Net realized gains | | | (0.63 | ) | | | (1.42 | ) | | | (1.13 | ) | | | (0.02 | ) | | | (0.31 | ) | | | — | | |
Total distributions to shareholders | | | (1.18 | ) | | | (1.52 | ) | | | (1.24 | ) | | | (0.14 | ) | | | (0.38 | ) | | | (0.03 | ) | |
Net asset value, end of period | | $ | 22.29 | | | $ | 21.27 | | | $ | 22.38 | | | $ | 19.16 | | | $ | 15.69 | | | $ | 12.64 | | |
Total return | | | 10.79 | % | | | 1.95 | % | | | 24.15 | % | | | 23.21 | % | | | 27.57 | % | | | 0.47 | % | |
Ratios to average net assets(c) | |
Total gross expenses | | | 1.07 | % | | | 1.09 | % | | | 1.10 | % | | | 1.14 | % | | | 1.19 | %(d) | | | 1.20 | %(e) | |
Total net expenses(f) | | | 1.07 | %(g) | | | 1.09 | %(g) | | | 1.10 | %(g) | | | 1.14 | %(g) | | | 1.16 | %(d)(g) | | | 1.16 | %(e)(g) | |
Net investment income | | | 0.71 | % | | | 2.26 | % | | | 0.67 | % | | | 0.73 | % | | | 0.83 | %(d) | | | 0.54 | % | |
Supplemental data | |
Net assets, end of period (in thousands) | | $ | 220,502 | | | $ | 118,262 | | | $ | 124,021 | | | $ | 254,377 | | | $ | 106,075 | | | $ | 74,302 | | |
Portfolio turnover | | | 47 | % | | | 60 | % | | | 65 | % | | | 47 | % | | | 62 | % | | | 78 | % | |
Notes to Financial Highlights
(a) For the period from October 1, 2011 to August 31, 2012. During the period, the Fund's fiscal year end was changed from September 30 to August 31.
(b) Net investment income per share includes special dividends. The effect of these dividends amounted to $0.40 per share.
(c) In addition to the fees and expenses that the Fund bears directly, the Fund indirectly bears a pro rata share of the fees and expenses of any other funds in which it invests. Such indirect expenses are not included in the Fund's reported expense ratios.
(d) Annualized.
(e) Ratios include line of credit interest expense which is less than 0.01%.
(f) Total net expenses include the impact of certain fee waivers/expense reimbursements made by the Investment Manager and certain of its affiliates, if applicable.
(g) The benefits derived from expense reductions had an impact of less than 0.01%.
The accompanying Notes to Financial Statements are an integral part of this statement.
Annual Report 2016
29
COLUMBIA CONTRARIAN CORE FUND
FINANCIAL HIGHLIGHTS (continued)
| | | Year Ended August 31, | |
Class Y | | 2016 | | 2015 | | 2014 | | 2013(a) | |
Per share data | |
Net asset value, beginning of period | | $ | 21.75 | | | $ | 22.84 | | | $ | 19.52 | | | $ | 15.84 | | |
Income from investment operations: | |
Net investment income | | | 0.27 | | | | 1.19 | (b) | | | 0.24 | | | | 0.24 | | |
Net realized and unrealized gain (loss) | | | 2.06 | | | | (0.67 | ) | | | 4.40 | | | | 3.64 | | |
Total from investment operations | | | 2.33 | | | | 0.52 | | | | 4.64 | | | | 3.88 | | |
Less distributions to shareholders: | |
Net investment income | | | (0.64 | ) | | | (0.19 | ) | | | (0.19 | ) | | | (0.18 | ) | |
Net realized gains | | | (0.63 | ) | | | (1.42 | ) | | | (1.13 | ) | | | (0.02 | ) | |
Total distributions to shareholders | | | (1.27 | ) | | | (1.61 | ) | | | (1.32 | ) | | | (0.20 | ) | |
Net asset value, end of period | | $ | 22.81 | | | $ | 21.75 | | | $ | 22.84 | | | $ | 19.52 | | |
Total return | | | 11.22 | % | | | 2.44 | % | | | 24.71 | % | | | 24.79 | % | |
Ratios to average net assets(c) | |
Total gross expenses | | | 0.65 | % | | | 0.66 | % | | | 0.68 | % | | | 0.72 | %(d) | |
Total net expenses(e) | | | 0.65 | % | | | 0.66 | % | | | 0.68 | % | | | 0.72 | %(d) | |
Net investment income | | | 1.23 | % | | | 5.26 | % | | | 1.12 | % | | | 1.60 | %(d) | |
Supplemental data | |
Net assets, end of period (in thousands) | | $ | 329,514 | | | $ | 53,246 | | | $ | 2,514 | | | $ | 79 | | |
Portfolio turnover | | | 47 | % | | | 60 | % | | | 65 | % | | | 47 | % | |
Notes to Financial Highlights
(a) Based on operations from November 8, 2012 (commencement of operations) through the stated period end.
(b) Net investment income per share includes special dividends. The effect of these dividends amounted to $0.96 per share.
(c) In addition to the fees and expenses that the Fund bears directly, the Fund indirectly bears a pro rata share of the fees and expenses of any other funds in which it invests. Such indirect expenses are not included in the Fund's reported expense ratios.
(d) Annualized.
(e) Total net expenses include the impact of certain fee waivers/expense reimbursements made by the Investment Manager and certain of its affiliates, if applicable.
The accompanying Notes to Financial Statements are an integral part of this statement.
Annual Report 2016
30
COLUMBIA CONTRARIAN CORE FUND
FINANCIAL HIGHLIGHTS (continued)
| | | Year Ended August 31, | | Year Ended
September 30, | |
Class Z | | 2016 | | 2015 | | 2014 | | 2013 | | 2012(a) | | 2011 | |
Per share data | |
Net asset value, beginning of period | | $ | 21.42 | | | $ | 22.52 | | | $ | 19.27 | | | $ | 15.78 | | | $ | 12.71 | | | $ | 12.68 | | |
Income from investment operations: | |
Net investment income | | | 0.21 | | | | 0.66 | (b) | | | 0.19 | | | | 0.17 | | | | 0.15 | | | | 0.11 | | |
Net realized and unrealized gain (loss) | | | 2.05 | | | | (0.18 | ) | | | 4.35 | | | | 3.50 | | | | 3.34 | | | | (0.01 | ) | |
Total from investment operations | | | 2.26 | | | | 0.48 | | | | 4.54 | | | | 3.67 | | | | 3.49 | | | | 0.10 | | |
Less distributions to shareholders: | |
Net investment income | | | (0.60 | ) | | | (0.16 | ) | | | (0.16 | ) | | | (0.16 | ) | | | (0.11 | ) | | | (0.07 | ) | |
Net realized gains | | | (0.63 | ) | | | (1.42 | ) | | | (1.13 | ) | | | (0.02 | ) | | | (0.31 | ) | | | — | | |
Total distributions to shareholders | | | (1.23 | ) | | | (1.58 | ) | | | (1.29 | ) | | | (0.18 | ) | | | (0.42 | ) | | | (0.07 | ) | |
Net asset value, end of period | | $ | 22.45 | | | $ | 21.42 | | | $ | 22.52 | | | $ | 19.27 | | | $ | 15.78 | | | $ | 12.71 | | |
Total return | | | 11.05 | % | | | 2.24 | % | | | 24.45 | % | | | 23.50 | % | | | 27.91 | % | | | 0.72 | % | |
Ratios to average net assets(c) | |
Total gross expenses | | | 0.82 | % | | | 0.84 | % | | | 0.86 | % | | | 0.90 | % | | | 0.94 | %(d) | | | 0.96 | %(e) | |
Total net expenses(f) | | | 0.82 | %(g) | | | 0.84 | %(g) | | | 0.86 | %(g) | | | 0.89 | %(g) | | | 0.91 | %(d)(g) | | | 0.91 | %(e)(g) | |
Net investment income | | | 0.99 | % | | | 2.97 | % | | | 0.93 | % | | | 0.98 | % | | | 1.08 | %(d) | | | 0.76 | % | |
Supplemental data | |
Net assets, end of period (in thousands) | | $ | 4,234,639 | | | $ | 2,119,278 | | | $ | 1,831,114 | | | $ | 1,315,874 | | | $ | 819,630 | | | $ | 494,107 | | |
Portfolio turnover | | | 47 | % | | | 60 | % | | | 65 | % | | | 47 | % | | | 62 | % | | | 78 | % | |
Notes to Financial Highlights
(a) For the period from October 1, 2011 to August 31, 2012. During the period, the Fund's fiscal year end was changed from September 30 to August 31.
(b) Net investment income per share includes special dividends. The effect of these dividends amounted to $0.50 per share.
(c) In addition to the fees and expenses that the Fund bears directly, the Fund indirectly bears a pro rata share of the fees and expenses of any other funds in which it invests. Such indirect expenses are not included in the Fund's reported expense ratios.
(d) Annualized.
(e) Ratios include line of credit interest expense which is less than 0.01%.
(f) Total net expenses include the impact of certain fee waivers/expense reimbursements made by the Investment Manager and certain of its affiliates, if applicable.
(g) The benefits derived from expense reductions had an impact of less than 0.01%.
The accompanying Notes to Financial Statements are an integral part of this statement.
Annual Report 2016
31
COLUMBIA CONTRARIAN CORE FUND
NOTES TO FINANCIAL STATEMENTS
August 31, 2016
Note 1. Organization
Columbia Contrarian Core Fund (the Fund), a series of Columbia Funds Series Trust I (the Trust), is a diversified fund. The Trust is registered under the Investment Company Act of 1940, as amended (the 1940 Act), as an open-end management investment company organized as a Massachusetts business trust.
Fund Shares
The Trust may issue an unlimited number of shares (without par value). The Fund offers Class A, Class B, Class C, Class I, Class K, Class R, Class R4, Class R5, Class T, Class W, Class Y and Class Z shares. Although all share classes generally have identical voting, dividend and liquidation rights, each share class votes separately when required by the Trust's organizational documents or by law. Different share classes pay different distribution amounts to the extent the expenses of such share classes differ, and distributions in liquidation will be proportional to the net asset value of each share class. Each share class has its own expense and sales charge structure.
Class A shares are subject to a maximum front-end sales charge of 5.75% based on the initial investment amount. Class A shares purchased without an initial sales charge in accounts aggregating $1 million to $50 million at the time of purchase are subject to a contingent deferred sales charge (CDSC) if the shares are sold within 18 months after purchase, charged as follows: 1.00% CDSC if redeemed within 12 months after purchase, and 0.50% CDSC if redeemed more than 12, but less than 18, months after purchase.
Class B shares may be subject to a maximum CDSC of 5.00% based upon the holding period after purchase. Class B shares will generally convert to Class A shares eight years after purchase. The Fund no longer accepts investments by new or existing investors in the Fund's Class B shares, except in connection with the reinvestment of any dividend and/or capital gain distributions in Class B shares of the Fund and exchanges by existing Class B shareholders of certain other funds within the Columbia Family of Funds.
Class C shares are subject to a 1.00% CDSC on shares redeemed within 12 months after purchase.
Class I shares are not subject to sales charges and are available only to the Columbia Family of Funds.
Class K shares are not subject to sales charges, however this share class is closed to new investors.
Class R shares are not subject to sales charges and are generally available only to certain retirement plans and other investors as described in the Fund's prospectus.
Class R4 shares are not subject to sales charges and are generally available only to omnibus retirement plans and certain investors as described in the Fund's prospectus.
Class R5 shares are not subject to sales charges and are generally available only to investors purchasing through authorized investment professionals and omnibus retirement plans.
Class T shares are subject to a maximum front-end sales charge of 5.75% based on the investment amount. Class T shares purchased without an initial sales charge in accounts aggregating $1 million to $50 million at the time of purchase are subject to a CDSC if the shares are sold within 18 months after purchase, charged as follows: 1.00% CDSC if redeemed within 12 months after purchase, and 0.50% CDSC if redeemed more than 12, but less than 18, months after purchase, with certain limitations. Class T shares are available only to investors who received (and who have continuously held) Class T shares in connection with previous fund reorganizations.
Class W shares are not subject to sales charges and are generally available only to investors purchasing through authorized investment programs managed by investment professionals, including discretionary managed account programs.
Class Y shares are not subject to sales charges and are generally available only to certain retirement plans as described in the Fund's prospectus.
Class Z shares are not subject to sales charges and are generally available only to eligible investors, which are subject to different investment minimums as described in the Fund's prospectus.
Note 2. Summary of Significant Accounting Policies
Basis of Preparation
The Fund is an investment company that applies the accounting and reporting guidance in the Financial Accounting Standards Board (FASB) Accounting Standards Codification Topic 946, Financial Services — Investment Companies (ASC 946). The financial statements are prepared in accordance with U.S. generally accepted accounting principles (GAAP), which requires management to make certain estimates and assumptions that affect the reported amounts of assets
Annual Report 2016
32
COLUMBIA CONTRARIAN CORE FUND
NOTES TO FINANCIAL STATEMENTS (continued)
August 31, 2016
and liabilities, the disclosure of contingent assets and liabilities at the date of the financial statements and the reported amounts of income and expenses during the reporting period. Actual results could differ from those estimates.
The following is a summary of significant accounting policies followed by the Fund in the preparation of its financial statements.
Security Valuation
All equity securities are valued at the close of business of the New York Stock Exchange (NYSE). Equity securities are valued at the last quoted sales price on the principal exchange or market on which they trade, except for securities traded on the NASDAQ Stock Market, which are valued at the NASDAQ official close price. Unlisted securities or listed securities for which there were no sales during the day are valued at the mean of the latest quoted bid and ask prices on such exchanges or markets.
Foreign equity securities are valued based on the closing price on the foreign exchange in which such securities are primarily traded. If any foreign equity security closing prices are not readily available, the securities are valued at the mean of the latest quoted bid and ask prices on such exchanges or markets. Foreign currency exchange rates are generally determined at 4:00 p.m. Eastern (U.S.) time. Many securities markets and exchanges outside the U.S. close prior to the close of the NYSE; therefore, the closing prices for securities in such markets or on such exchanges may not fully reflect events that occur after such close but before the close of the NYSE. In those situations, foreign securities will be fair valued pursuant to a policy adopted by the Board of Trustees (the Board), including, if available, utilizing a third party pricing service to determine these fair values. The third party pricing service takes into account multiple factors, including, but not limited to, movements in the U.S. securities markets, certain depositary receipts, futures contracts and foreign exchange rates that have occurred subsequent to the close of the foreign exchange or market, to determine a good faith estimate that reasonably reflects the current market conditions as of the close of the NYSE. The fair value of a security is likely to be different from the quoted or published price, if available.
Investments in open-end investment companies, including money market funds, are valued at their latest net asset value.
Investments for which market quotations are not readily available, or that have quotations which management believes are not reflective of market value or reliable, are valued at fair value as determined in good faith under procedures approved by and under the general supervision of the Board. If a security or class of securities (such as foreign securities) is valued at fair value, such value is likely to be different from the quoted or published price for the security.
The determination of fair value often requires significant judgment. To determine fair value, management may use assumptions including but not limited to future cash flows and estimated risk premiums. Multiple inputs from various sources may be used to determine fair value.
GAAP requires disclosure regarding the inputs and valuation techniques used to measure fair value and any changes in valuation inputs or techniques. In addition, investments shall be disclosed by major category. This information is disclosed following the Fund's Portfolio of Investments.
Foreign Currency Transactions and Translations
The values of all assets and liabilities denominated in foreign currencies are generally translated into U.S. dollars at exchange rates determined at the close of the NYSE on any given day. Net realized and unrealized gains (losses) on foreign currency transactions and translations include gains (losses) arising from the fluctuation in exchange rates between trade and settlement dates on securities transactions, gains (losses) arising from the disposition of foreign currency and currency gains (losses) between the accrual and payment dates on dividends, interest income and foreign withholding taxes.
For financial statement purposes, the Fund does not distinguish that portion of gains (losses) on investments which is due to changes in foreign exchange rates from that which is due to changes in market prices of the investments. Such fluctuations are included with the net realized and unrealized gains (losses) on investments in the Statement of Operations.
Security Transactions
Security transactions are accounted for on the trade date. Cost is determined and gains (losses) are based upon the specific identification method for both financial statement and federal income tax purposes.
Annual Report 2016
33
COLUMBIA CONTRARIAN CORE FUND
NOTES TO FINANCIAL STATEMENTS (continued)
August 31, 2016
Income Recognition
Corporate actions and dividend income are generally recorded net of any non-reclaimable tax withholdings, on the ex-dividend date or upon receipt of ex-dividend notification in the case of certain foreign securities.
The Fund may receive distributions from holdings in equity securities, business development companies (BDCs), exchange-traded funds, other regulated investment companies (RICs), and real estate investment trusts (REITs), which report information on the tax character of their distributions annually. These distributions are allocated to dividend income, capital gain and return of capital based on actual information reported. Return of capital is recorded as a reduction of the cost basis of securities held. If the Fund no longer owns the applicable securities, return of capital is recorded as a realized gain. With respect to REITs, to the extent actual information has not yet been reported, estimates for return of capital are made by the Fund's management. Management's estimates are subsequently adjusted when the actual character of the distributions is disclosed by the REITs, which could result in a proportionate change in return of capital to shareholders.
Awards from class action litigation are recorded as a reduction of cost basis if the Fund still owns the applicable securities on the payment date. If the Fund no longer owns the applicable securities, the proceeds are recorded as realized gains.
Expenses
General expenses of the Trust are allocated to the Fund and other funds of the Trust based upon relative net assets or other expense allocation methodologies determined by the nature of the expense. Expenses directly attributable to the Fund are charged to the Fund. Expenses directly attributable to a specific class of shares are charged to that share class.
Determination of Class Net Asset Value
All income, expenses (other than class-specific expenses, which are charged to that share class, as shown in the Statement of Operations) and realized and unrealized gains (losses) are allocated to each class of the Fund on a daily basis, based on the relative net assets of each class, for purposes of determining the net asset value of each class.
Federal Income Tax Status
The Fund intends to qualify each year as a regulated investment company under Subchapter M of the Internal Revenue Code, as amended, and will distribute substantially all of its taxable income (including net short-term capital gains), if any, for its tax year, and as such will not be subject to federal income taxes. In addition, the Fund intends to distribute in each calendar year substantially all of its net investment income, capital gains and certain other amounts, if any, such that the Fund should not be subject to federal excise tax. Therefore, no federal income or excise tax provision is recorded.
Foreign Taxes
The Fund may be subject to foreign taxes on income, gains on investments or currency repatriation, a portion of which may be recoverable. The Fund will accrue such taxes and recoveries, as applicable, based upon its current interpretation of tax rules and regulations that exist in the markets in which it invests.
Realized gains in certain countries may be subject to foreign taxes at the Fund level, based on statutory rates. The Fund accrues for such foreign taxes on realized and unrealized gains at the appropriate rate for each jurisdiction, as applicable. The amount, if any, is disclosed as a liability on the Statement of Assets and Liabilities.
Distributions to Shareholders
Distributions from net investment income, if any, are declared and paid annually. Net realized capital gains, if any, are distributed along with the income distribution. Income distributions and capital gain distributions are determined in accordance with federal income tax regulations, which may differ from GAAP.
Guarantees and Indemnifications
Under the Trust's organizational documents and, in some cases, by contract, its officers and trustees are indemnified against certain liabilities arising out of the performance of their duties to the Trust or its funds. In addition, certain of the Fund's contracts with its service providers contain general indemnification clauses. The Fund's maximum exposure under these arrangements is unknown since the amount of any future claims that may be made against the Fund cannot be determined, and the Fund has no historical basis for predicting the likelihood of any such claims.
Annual Report 2016
34
COLUMBIA CONTRARIAN CORE FUND
NOTES TO FINANCIAL STATEMENTS (continued)
August 31, 2016
Note 3. Fees and Other Transactions with Affiliates
Management Services Fees
Effective January 1, 2016, the Fund entered into a Management Agreement with Columbia Management Investment Advisers, LLC (the Investment Manager), a wholly-owned subsidiary of Ameriprise Financial, Inc. (Ameriprise Financial). Under the Management Agreement, the Investment Manager provides the Fund with investment research and advice, as well as administrative and accounting services. The management services fee is an annual fee that is equal to a percentage of the Fund's average daily net assets that declines from 0.77% to 0.57% as the Fund's net assets increase. Prior to January 1, 2016, the Fund paid the Investment Manager an annual fee for advisory services under an Investment Management Services Agreement and a separate annual fee for administrative and accounting services under an Administrative Services Agreement. The effective management services fee rate for the year ended August 31, 2016 (reflecting all advisory and administrative services fees paid to the Investment Manager) was 0.62% of the Fund's average daily net assets. For the period from September 1, 2015 through December 31, 2015, the investment advisory services fee paid to the Investment Manager was $12,844,105, and the administrative services fee paid to the Investment Manager was $1,004,339.
Compensation of Board Members
Board members, who are not officers or employees of the Investment Manager or Ameriprise Financial, are compensated for their services to the Fund as disclosed in the Statement of Operations. These Board members may participate in a Deferred Compensation Plan (the Plan) which may be terminated at any time. Obligations of the Plan will be paid solely out of the Fund's assets, and all amounts payable under the Plan constitute a general unsecured obligation of the Fund.
Compensation of Chief Compliance Officer
The Board has appointed a Chief Compliance Officer to the Fund in accordance with federal securities regulations. The Fund is allocated a portion of the expenses associated with the Chief Compliance Officer based on relative net assets of the Trust.
Transfer Agency Fees
Under a Transfer and Dividend Disbursing Agent Agreement, Columbia Management Investment
Services Corp. (the Transfer Agent), an affiliate of the Investment Manager and a wholly-owned subsidiary of Ameriprise Financial, is responsible for providing transfer agency services to the Fund. The Transfer Agent has contracted with Boston Financial Data Services (BFDS) to serve as sub-transfer agent. The Transfer Agent pays the fees of BFDS for services as sub-transfer agent and BFDS is not entitled to reimbursement for such fees from the Fund (with the exception of out-of-pocket fees).
The Fund pays the Transfer Agent a monthly transfer agency fee based on the number or the average value of accounts, depending on the type of account. In addition, prior to October 1, 2016, the Transfer Agent also received sub-transfer agency fees based on a percentage of the average aggregate value of the Fund's shares maintained in omnibus accounts (other than omnibus accounts for which American Enterprise Investment Services Inc. is the broker of record or accounts where the beneficial shareholder is a customer of Ameriprise Financial Services, Inc., for which the Transfer Agent receives a per account fee). Effective October 1, 2016, the Fund pays the Transfer Agent a fee for shareholder services based on the number of accounts or on a percentage of the average aggregate value of the Fund's shares maintained in omnibus accounts up to the lesser of the amount charged by the servicing agent or a cap established by the Board from time to time.
The Transfer Agent also receives compensation from the Fund for various shareholder services and reimbursements for certain out-of-pocket fees. Total transfer agency fees for Class K and Class R5 shares are subject to an annual limitation of not more than 0.05% of the average daily net assets attributable to each share class. Class I and Class Y shares do not pay transfer agency fees.
For the year ended August 31, 2016, the Fund's effective transfer agency fee rates as a percentage of average daily net assets of each class were as follows:
Class A | | | 0.18 | % | |
Class B | | | 0.18 | | |
Class C | | | 0.18 | | |
Class K | | | 0.05 | | |
Class R | | | 0.18 | | |
Class R4 | | | 0.18 | | |
Class R5 | | | 0.05 | | |
Class T | | | 0.18 | | |
Class W | | | 0.18 | | |
Class Z | | | 0.18 | | |
Annual Report 2016
35
COLUMBIA CONTRARIAN CORE FUND
NOTES TO FINANCIAL STATEMENTS (continued)
August 31, 2016
An annual minimum account balance fee of $20 may apply to certain accounts with a value below the applicable share class's initial minimum investment requirements to reduce the impact of small accounts on transfer agency fees. These minimum account balance fees are remitted to the Fund and recorded as part of expense reductions in the Statement of Operations. For the year ended August 31, 2016, these minimum account balance fees reduced total expenses of the Fund by $4,350.
Plan Administration Fees
Under a Plan Administration Services Agreement with the Transfer Agent, the Fund pays an annual fee at a rate of 0.25% of the Fund's average daily net assets attributable to Class K shares for the provision of various administrative, recordkeeping, communication and educational services.
Distribution and Service Fees
The Fund has an agreement with Columbia Management Investment Distributors, Inc. (the Distributor), an affiliate of the Investment Manager and a wholly-owned subsidiary of Ameriprise Financial, for distribution and shareholder services. The Board has approved, and the Fund has adopted, distribution and shareholder service plans (the Plans) applicable to certain share classes, which set the distribution and service fees for the Fund. These fees are calculated daily and are intended to compensate the Distributor and/or eligible selling and/or servicing agents for selling shares of the Fund and providing services to investors.
Under the Plans, the Fund pays a monthly service fee to the Distributor at the maximum annual rate of 0.25% of the average daily net assets attributable to Class A, Class B, Class C and Class W shares of the Fund. Also under the Plans, the Fund pays a monthly distribution fee to the Distributor at the maximum annual rates of 0.10%, 0.75%, 0.75%, 0.50% and 0.25% of the average daily net assets attributable to Class A, Class B, Class C, Class R and Class W shares of the Fund, respectively.
Although the Fund may pay distribution and service fees up to a maximum annual rate of 0.35% of the Fund's average daily net assets attributable to Class A shares (comprised of up to 0.10% for distribution services and up to 0.25% for shareholder liaison services), the Fund currently limits such fees to an aggregate fee of not more than 0.25% of the Fund's average daily net assets attributable to Class A shares.
Although the Fund may pay a distribution fee up to 0.25% of the Fund's average daily net assets attributable to Class W shares and a service fee of up to 0.25% of the Fund's average daily net assets attributable to Class W shares, the aggregate fee shall not exceed 0.25% of the Fund's average daily net assets attributable to Class W shares.
Shareholder Services Fees
The Fund has adopted a shareholder services plan that permits it to pay for certain services provided to Class T shareholders by their selling and/or servicing agents. The Fund may pay shareholder servicing fees up to an aggregate annual rate of 0.50% of the Fund's average daily net assets attributable to Class T shares (comprised of up to 0.25% for shareholder liaison services and up to 0.25% for administrative support services). These fees are currently limited to an aggregate annual rate of not more than 0.25% of the Fund's average daily net assets attributable to Class T shares.
Sales Charges
Sales charges, including front-end charges and CDSCs, received by the Distributor for distributing Fund shares were $4,113,554 for Class A, $534 for Class B, $87,521 for Class C and $9,167 for Class T shares for the year ended August 31, 2016.
Expenses Waived/Reimbursed by the Investment Manager and its Affiliates
The Fund's expense ratio is subject to an expense reimbursement arrangement pursuant to which fees will be waived and/or expenses reimbursed (excluding certain fees and expenses described below as well as any reorganization costs allocated to the Fund), so that the Fund's net operating expenses, after giving effect to fees waived/expenses reimbursed and any balance
Annual Report 2016
36
COLUMBIA CONTRARIAN CORE FUND
NOTES TO FINANCIAL STATEMENTS (continued)
August 31, 2016
credits and/or overdraft charges from the Fund's custodian, do not exceed the annual rates of:
| | | Contractual
Expense Cap
January 1, 2016
Through
December 31, 2016 | | Voluntary
Expense Cap
Prior to
January 1, 2016 | |
Class A | | | 1.19 | % | | | 1.18 | % | |
Class B | | | 1.94 | | | | 1.93 | | |
Class C | | | 1.94 | | | | 1.93 | | |
Class I | | | 0.81 | | | | 0.79 | | |
Class K | | | 1.11 | | | | 1.09 | | |
Class R | | | 1.44 | | | | 1.43 | | |
Class R4 | | | 0.94 | | | | 0.93 | | |
Class R5 | | | 0.86 | | | | 0.84 | | |
Class T | | | 1.19 | | | | 1.18 | | |
Class W | | | 1.19 | | | | 1.18 | | |
Class Y | | | 0.81 | | | | 0.79 | | |
Class Z | | | 0.94 | | | | 0.93 | | |
The contractual agreement may be modified or amended only with approval from the Investment Manager, certain of its affiliates and the Fund. Under the arrangements, the following fees and expenses are excluded from the waiver/reimbursement commitment, and therefore will be paid by the Fund, if applicable: taxes (including foreign transaction taxes), expenses associated with investments in affiliated and non-affiliated pooled investment vehicles (including mutual funds and exchange-traded funds), transaction costs and brokerage commissions, costs related to any securities lending program, dividend and interest expenses associated with securities sold short, inverse floater program fees and expenses, transaction charges and interest on borrowed money, interest and infrequent and/or unusual expenses. Any fees waived and/or expenses reimbursed under the expense reimbursement arrangements described above are not recoverable by the Investment Manager or its affiliates in future periods. Reorganization (see Note 8) costs were allocated to the Fund only to the extent they are expected to be offset by the anticipated reduction in expenses borne by the Fund's shareholders during the first year following the reorganization.
Note 4. Federal Tax Information
The timing and character of income and capital gain distributions are determined in accordance with income tax regulations, which may differ from GAAP because of temporary or permanent book to tax differences.
At August 31, 2016, these differences are primarily due to differing treatment for deferral/reversal of wash sale losses, Trustees' deferred compensation, foreign currency transactions, non-deductible expenses, passive foreign investment company (PFIC) holdings and re-characterization of distributions for investments. To the extent these differences are permanent, reclassifications are made among the components of the Fund's net assets in the Statement of Assets and Liabilities. Temporary differences do not require reclassifications.
In the Statement of Assets and Liabilities the following reclassifications were made:
Undistributed net investment income | | $ | (697,760 | ) | |
Accumulated net realized loss | | | (10,010,916 | ) | |
Paid-in capital | | | 10,708,676 | | |
Net investment income (loss) and net realized gains (losses), as disclosed in the Statement of Operations, and net assets were not affected by this reclassification.
The tax character of distributions paid during the years indicated was as follows:
Year Ended August 31, | | 2016 | | 2015 | |
Ordinary income | | $ | 175,118,640 | | | $ | 69,622,372 | | |
Long-term capital gains | | | 196,082,958 | | | | 296,299,189 | | |
Total | | $ | 371,201,598 | | | $ | 365,921,561 | | |
Short-term capital gain distributions, if any, are considered ordinary income distributions for tax purposes.
At August 31, 2016, the components of distributable earnings on a tax basis were as follows:
Undistributed ordinary income | | $ | 45,873,196 | | |
Undistributed long-term capital gains | | | 31,285,310 | | |
Net unrealized appreciation | | | 1,961,754,902 | | |
At August 31, 2016, the cost of investments for federal income tax purposes was $7,928,067,745 and the aggregate gross unrealized appreciation and depreciation based on that cost was:
Unrealized appreciation | | $ | 2,020,717,843 | | |
Unrealized depreciation | | | (58,962,941 | ) | |
Net unrealized appreciation | | $ | 1,961,754,902 | | |
Management of the Fund has concluded that there are no significant uncertain tax positions in the Fund that would require recognition in the financial statements. However, management's conclusion may be subject to
Annual Report 2016
37
COLUMBIA CONTRARIAN CORE FUND
NOTES TO FINANCIAL STATEMENTS (continued)
August 31, 2016
review and adjustment at a later date based on factors including, but not limited to, new tax laws, regulations, and administrative interpretations (including relevant court decisions). Generally, the Fund's federal tax returns for the prior three fiscal years remain subject to examination by the Internal Revenue Service.
Note 5. Portfolio Information
The cost of purchases and proceeds from sales of securities, excluding short-term investments and derivatives, if any, aggregated to $4,938,443,055 and $3,456,876,719, respectively, for the year ended August 31, 2016. The amount of purchase and sale activity impacts the portfolio turnover rate reported in the Financial Highlights.
Note 6. Affiliated Money Market Fund
The Fund invests in Columbia Short-Term Cash Fund, an affiliated money market fund established for the exclusive use by the Fund and other affiliated funds (the Affiliated MMF). The income earned by the Fund from such investments is included as Dividends — affiliated issuers in the Statement of Operations. As an investing fund, the Fund indirectly bears its proportionate share of the expenses of the Affiliated MMF. Effective October 1, 2016, the Affiliated MMF prices its shares with a floating net asset value (NAV) and no longer seeks to maintain a stable NAV. In addition, the Board of the Affiliated MMF may impose a fee on redemptions (sometimes referred to as a liquidity fee) or temporarily suspend redemptions (sometimes referred to as imposing a redemption gate) in the event its liquidity falls below regulatory limits.
Note 7. Line of Credit
The Fund has access to a revolving credit facility whereby the Fund may borrow for the temporary funding of shareholder redemptions or for other temporary or emergency purposes. Effective December 8, 2015, Citibank, N.A. and HSBC Bank USA, N.A. joined JPMorgan Chase Bank, N.A. (JPMorgan) as lead of a syndicate of banks under the credit facility, which is a collective agreement between the Fund and certain other funds managed by the Investment Manager, severally and not jointly, that permits collective borrowings up to $1 billion. Interest is charged to each participating fund based on its borrowings at a rate equal to the higher of (i) the overnight federal funds rate plus 1.00% or (ii) the one-month LIBOR rate plus 1.00%. Each borrowing under the credit facility matures no later than 60 days after the date of borrowing. The Fund also pays a commitment fee equal to its pro rata share of the amount of the credit facility at a rate of 0.15% per annum. The commitment
fee is included in other expenses in the Statement of Operations. Prior to December 8, 2015, JPMorgan was the sole lead bank under the credit facility agreement that permitted borrowings up to $550 million under the same terms and interest rates as described above with the exception of the commitment fee which was charged at a rate of 0.075% per annum.
The Fund had no borrowings during the year ended August 31, 2016.
Note 8. Fund Reorganization
At the close of business on June 24, 2016, the Fund acquired the assets and assumed the identified liabilities of Columbia Value and Restructuring Fund, a series of Columbia Funds Series Trust I (the acquired fund). The reorganization was completed after shareholders of the acquired fund approved a plan of reorganization on June 13, 2016. The purpose of the transaction was to combine two funds managed by the Investment Manager with comparable investment objectives and strategies.
The aggregate net assets of the Fund immediately before the reorganization were $7,568,007,669 and the combined net assets immediately after the reorganization were $8,930,720,664.
The reorganization was accomplished by a tax-free exchange of 35,751,821 shares of the acquired fund valued at $1,362,712,995 (including $305,892,225 of unrealized appreciation).
In exchange for the acquired fund's shares, the Fund issued the following number of shares:
| | | Shares | |
Class A | | | 2,911,441 | | |
Class C | | | 1,127,343 | | |
Class I | | | 94 | | |
Class R | | | 348,131 | | |
Class R4 | | | 364,058 | | |
Class R5 | | | 926,239 | | |
Class W | | | 95 | | |
Class Y | | | 65,725 | | |
Class Z | | | 59,654,609 | | |
For financial reporting purposes, net assets received and shares issued by the Fund were recorded at fair value; however, the acquired fund's cost of investments was carried forward.
The financial statements reflect the operations of the Fund for the period prior to the reorganization and the combined fund for the period subsequent to the reorganization. Because the combined investment
Annual Report 2016
38
COLUMBIA CONTRARIAN CORE FUND
NOTES TO FINANCIAL STATEMENTS (continued)
August 31, 2016
portfolios have been managed as a single integrated portfolio since the reorganization was completed, it is not practicable to separate the amounts of revenue and earnings of the acquired fund that have been included in the combined Fund's Statement of Operations since the reorganization was completed.
Assuming the reorganization had been completed on September 1, 2015, the Fund's pro-forma net investment income, net gain on investments, net change in unrealized appreciation and net increase in net assets from operations for the year ended August 31, 2016 would have been approximately $72.9 million, $93.4 million, $770.0 million and $936.3 million, respectively.
Note 9. Significant Risks
Shareholder Concentration Risk
At August 31, 2016, two unaffiliated shareholders of record owned 26.0% of the outstanding shares of the Fund in one or more accounts. The Fund has no knowledge about whether any portion of those shares was owned beneficially. Affiliated shareholders of record owned 29.6% of the outstanding shares of the Fund in one or more accounts. Subscription and redemption activity by concentrated accounts may have a significant effect on the operations of the Fund. In the case of a large redemption, the Fund may be forced to sell investments at inopportune times, including its liquid or more liquid positions, resulting in Fund losses and the Fund holding a higher percentage of less liquid or illiquid securities. Large redemptions could result in decreased economies of scale and increased operating expenses for non-redeeming Fund shareholders.
Technology and Technology-related Investment Risk
The Fund may be more susceptible to the particular risks that may affect companies in the information technology sector, as well as other technology-related sectors (collectively, the technology sectors) than if it were invested in a wider variety of companies in unrelated sectors. Companies in the technology sectors are subject to certain risks, including the risk that new services, equipment or technologies will not be accepted by consumers and businesses or will become rapidly obsolete. Performance of such companies may be affected by factors including obtaining and protecting patents (or the failure to do so) and significant competitive pressures, including aggressive pricing of their products or services, new market entrants, competition for market share and short product cycles due to an accelerated rate of technological developments.
Such competitive pressures may lead to limited earnings and/or falling profit margins. As a result, the value of their securities may fall or fail to rise. In addition, many technology sector companies have limited operating histories and prices of these companies' securities historically have been more volatile than other securities, especially over the short term.
Note 10. Subsequent Events
Management has evaluated the events and transactions that have occurred through the date the financial statements were issued and noted no items requiring adjustment of the financial statements or additional disclosure.
Note 11. Information Regarding Pending and Settled Legal Proceedings
Ameriprise Financial and certain of its affiliates have historically been involved in a number of legal, arbitration and regulatory proceedings, including routine litigation, class actions, and governmental actions, concerning matters arising in connection with the conduct of their business activities. Ameriprise Financial believes that the Funds are not currently the subject of, and that neither Ameriprise Financial nor any of its affiliates are the subject of, any pending legal, arbitration or regulatory proceedings that are likely to have a material adverse effect on the Funds or the ability of Ameriprise Financial or its affiliates to perform under their contracts with the Funds. Ameriprise Financial is required to make quarterly (10-Q), annual (10-K) and, as necessary, 8-K filings with the Securities and Exchange Commission (SEC) on legal and regulatory matters that relate to Ameriprise Financial and its affiliates. Copies of these filings may be obtained by accessing the SEC website at www.sec.gov.
There can be no assurance that these matters, or the adverse publicity associated with them, will not result in increased fund redemptions, reduced sale of fund shares or other adverse consequences to the Funds. Further, although we believe proceedings are not likely to have a material adverse effect on the Funds or the ability of Ameriprise Financial or its affiliates to perform under their contracts with the Funds, these proceedings are subject to uncertainties and, as such, we are unable to estimate the possible loss or range of loss that may result. An adverse outcome in one or more of these proceedings could result in adverse judgments, settlements, fines, penalties or other relief that could have a material adverse effect on the consolidated financial condition or results of operations of Ameriprise Financial.
Annual Report 2016
39
COLUMBIA CONTRARIAN CORE FUND
REPORT OF INDEPENDENT REGISTERED PUBLIC ACCOUNTING FIRM
To the Trustees of Columbia Funds Series Trust I and the Shareholders of
Columbia Contrarian Core Fund
In our opinion, the accompanying statement of assets and liabilities, including the portfolio of investments, and the related statements of operations and of changes in net assets and the financial highlights present fairly, in all material respects, the financial position of Columbia Contrarian Core Fund (the "Fund," a series of Columbia Funds Series Trust I) at August 31, 2016, and the results of its operations, the changes in its net assets and the financial highlights for each of the periods indicated, in conformity with accounting principles generally accepted in the United States of America. These financial statements and financial highlights (hereafter referred to as "financial statements") are the responsibility of the Fund's management. Our responsibility is to express an opinion on these financial statements based on our audits. We conducted our audits of these financial statements in accordance with the standards of the Public Company Accounting Oversight Board (United States). Those standards require that we plan and perform the audit to obtain reasonable assurance about whether the financial statements are free of material misstatement. An audit includes examining, on a test basis, evidence supporting the amounts and disclosures in the financial statements, assessing the accounting principles used and significant estimates made by management, and evaluating the overall financial statement presentation. We believe that our audits, which included confirmation of securities at August 31, 2016 by correspondence with the custodian, brokers and transfer agent, and the application of alternative auditing procedures where such confirmations had not been received, provide a reasonable basis for our opinion.
PricewaterhouseCoopers LLP
Minneapolis, MN
October 21, 2016
Annual Report 2016
40
COLUMBIA CONTRARIAN CORE FUND
FEDERAL INCOME TAX INFORMATION
(Unaudited)
The Fund hereby designates the following tax attributes for the fiscal year ended August 31, 2016. Shareholders will be notified in early 2017 of the amounts for use in preparing 2016 income tax returns.
Tax Designations
Qualified Dividend Income | | | 100.00 | % | |
Dividends Received Deduction | | | 100.00 | % | |
Capital Gain Dividend | | $ | 33,643,283 | | |
Qualified Dividend Income. For taxable, non-corporate shareholders, the percentage of ordinary income distributed during the fiscal year that represents qualified dividend income subject to reduced tax rates.
Dividends Received Deduction. The percentage of ordinary income distributed during the fiscal year that qualifies for the corporate dividends received deduction.
Capital Gain Dividend. The Fund designates as a capital gain dividend the amount reflected above, or if subsequently determined to be different, the net capital gain of such fiscal period.
Annual Report 2016
41
COLUMBIA CONTRARIAN CORE FUND
Shareholders elect the Board that oversees the Fund's operations. The Board appoints officers who are responsible for day-to-day business decisions based on policies set by the Board. The following table provides basic biographical information about the Fund's Trustees, including their principal occupations during the past five years, although specific titles for individuals may have varied over the period. The year set forth beneath Length of Service in the table below is the year in which the Trustee was first appointed or elected as Trustee to any Fund currently in the Columbia Funds Complex or a predecessor thereof. Under current Board policy, members serve terms of indefinite duration.
Trustees
Independent Trustees
Name,
Address,
Year of Birth | | Position Held With
the Trust and Length of
Service | | Principal Occupation(s)
During the Past Five Years
and Other Relevant
Professional Experience | | Number of
Funds in the
Columbia Funds
Complex
Overseen | | Other Directorships
Held by Trustee During
the Past Five Years | |
Janet Langford Carrig
c/o Columbia
Management Investment Advisers, LLC,
225 Franklin Street
Mail Drop BX32 05228,
Boston, MA 02110
1957 | | Trustee 1996 | | Senior Vice President, General Counsel and Corporate Secretary, ConocoPhillips (integrated energy company) since September 2007 | | | 56 | | | None | |
Douglas A. Hacker
c/o Columbia Management Investment Advisers, LLC,
225 Franklin Street
Mail Drop BX32 05228,
Boston, MA 02110
1955 | | Trustee and Chairman of the Board 1996 | | Independent business executive since May 2006; Executive Vice President — Strategy of United Airlines from December 2002 to May 2006; President of UAL Loyalty Services (airline marketing company) from September 2001 to December 2002; Executive Vice President and Chief Financial Officer of United Airlines from July 1999 to September 2001 | | | 56 | | | Spartan Nash Company (food distributor); Nash Finch Company (food distributor) from 2005 to 2013; Aircastle Limited (aircraft leasing); SeaCube Container Leasing Ltd. (container leasing) from 2010 to 2013; and Travelport Worldwide Limited (travel information technology) | |
Nancy T. Lukitsh
c/o Columbia Management Investment Advisers, LLC,
225 Franklin Street
Mail Drop BX32 05228,
Boston, MA 02110
1956 | | Trustee 2011 | | Senior Vice President, Partner and Director of Marketing, Wellington Management Company, LLP (investment adviser) from 1997 to 2010; Chair, Wellington Management Portfolios (commingled non-U.S. investment pools) from 2007 to 2010; Director, Wellington Trust Company, NA and other Wellington affiliates from 1997 to 2010 | | | 56 | | | None | |
Annual Report 2016
42
COLUMBIA CONTRARIAN CORE FUND
TRUSTEES AND OFFICERS (continued)
Independent Trustees (continued)
Name,
Address,
Year of Birth | | Position Held With
the Trust and Length of
Service | | Principal Occupation(s)
During the Past Five Years
and Other Relevant
Professional Experience | | Number of
Funds in the
Columbia Funds
Complex
Overseen | | Other Directorships
Held by Trustee During
the Past Five Years | |
William E. Mayer
c/o Columbia Management Investment Advisers, LLC,
225 Franklin Street
Mail Drop BX32 05228,
Boston, MA 02110
1940 | | Trustee 1991 | | Partner, Park Avenue Equity Partners (private equity) since February 1999 | | | 56 | | | DynaVox Inc. (speech creation); Lee Enterprises (print media); WR Hambrecht + Co. (financial service provider) from 2000 to 2012; BlackRock Capital Investment Corporation (investment company); and Premier, Inc. (healthcare) | |
David M. Moffett
c/o Columbia Management Investment Advisers, LLC,
225 Franklin Street
Mail Drop BX32 05228,
Boston, MA 02110
1952 | | Trustee 2011 | | Retired. Consultant to Bridgewater and Associates | | | 56 | | | Director of CIT Bank, CIT Group Inc. (commercial and consumer finance); eBay Inc. (online trading community); Genworth Financial, Inc. (financial and insurance products and services); Paypal Holdings Inc. (payment and data processing services); and Trustee University of Oklahoma Foundation | |
Charles R. Nelson
c/o Columbia Management Investment Advisers, LLC,
225 Franklin Street
Mail Drop BX32 05228,
Boston, MA 02110
1942 | | Trustee 1981 | | Retired. Professor Emeritus, University of Washington since 2011; Professor of Economics, University of Washington from 1976 to 2011; Ford and Louisa Van Voorhis Professor of Political Economy, University of Washington from 1993 to 2011; Adjunct Professor of Statistics, University of Washington from 1980 to 2011; Associate Editor, Journal of Money, Credit and Banking from September 1993 to 2008; consultant on econometric and statistical matters | | | 56 | | | None | |
John J. Neuhauser
c/o Columbia Management Investment Advisers, LLC,
225 Franklin Street
Mail Drop BX32 05228,
Boston, MA 02110
1943 | | Trustee 1984 | | President, Saint Michael's College since August 2007; Director or Trustee of several non-profit organizations, including University of Vermont Medical Center; Academic Vice President and Dean of Faculties, Boston College from August 1999 to October 2005; University Professor, Boston College from November 2005 to August 2007 | | | 56 | | | Liberty All-Star Equity Fund and Liberty All-Star Growth Fund (closed-end funds) | |
Annual Report 2016
43
COLUMBIA CONTRARIAN CORE FUND
TRUSTEES AND OFFICERS (continued)
Independent Trustees (continued)
Name,
Address,
Year of Birth | | Position Held With
the Trust and Length of
Service | | Principal Occupation(s)
During the Past Five Years
and Other Relevant
Professional Experience | | Number of
Funds in the
Columbia Funds
Complex
Overseen | | Other Directorships
Held by Trustee During
the Past Five Years | |
Patrick J. Simpson
c/o Columbia Management Investment Advisers, LLC,
225 Franklin Street
Mail Drop BX32 05228,
Boston, MA 02110
1944 | | Trustee 2000 | | Of Counsel, Perkins Coie LLP (law firm) since 2015; Partner, Perkins Coie LLP from 1988 to 2014 | | | 56 | | | None | |
Anne-Lee Verville
c/o Columbia Management Investment Advisers, LLC,
225 Franklin Street
Mail Drop BX32 05228,
Boston, MA 02110
1945 | | Trustee 1998 | | Retired. General Manager, Global Education Industry from 1994 to 1997, President — Application Systems Division from 1991 to 1994, Chief Financial Officer — US Marketing & Services from 1988 to 1991, and Chief Information Officer from 1987 to 1988, IBM Corporation (computer and technology) | | | 56 | | | Enesco Group, Inc. (producer of giftware and home and garden decor products) from 2001 to 2006 | |
Consultant to the Trustees*
Name,
Address,
Year of Birth | | Position Held With
the Trust and Length of
Service | | Principal Occupation(s)
During the Past Five Years
and Other Relevant
Professional Experience | | Number of
Funds in the
Columbia Funds
Complex
Overseen | | Other Directorships
Held by Trustee During
the Past Five Years | |
J. Kevin Connaughton
c/o Columbia
Management Investment Advisers, LLC,
225 Franklin Street
Mail Drop BX32 05228,
Boston, MA 02110
1964 | | Trustee Consultant 2016 | | Trustee Consultant, Columbia Funds since March 2016; Managing Director and General Manager of Mutual Fund Products, Columbia Management Investment Advisers, LLC from May 2010 to February 2015; President, Columbia Funds from 2009 to 2015; and senior officer of Columbia Funds and affiliated funds from 2003 to 2015 | | | 56 | | | Board of Governors, Gateway Healthcare since January 2016; Trustee, New Century Portfolios since March 2015; and Director, The Autism Project since March 2015 | |
* J. Kevin Connaughton was appointed consultant to the Trustees effective March 1, 2016. Shareholders of the Funds are expected to be asked to elect Mr. Connaughton as a Trustee at a future shareholder meeting.
Annual Report 2016
44
COLUMBIA CONTRARIAN CORE FUND
TRUSTEES AND OFFICERS (continued)
Interested Trustee Affiliated with Investment Manager*
Name,
Address,
Year of Birth | | Position Held With
the Trust and Length of
Service | | Principal Occupation(s)
During the Past Five Years
and Other Relevant
Professional Experience | | Number of
Funds in the
Columbia Funds
Complex
Overseen | | Other Directorships
Held by Trustee During
the Past Five Years | |
William F. Truscott
c/o Columbia Management Investment Advisers, LLC,
225 Franklin Street
Boston, MA 02110
1960 | | Trustee 2012 | | Chairman of the Board and President, Columbia Management Investment Advisers, LLC since May 2010 and February 2012, respectively; Chief Executive Officer, Global Asset Management, Ameriprise Financial, Inc. since September 2012 (previously Chief Executive Officer, U.S. Asset Management & President, Annuities, May 2010- September 2012); Director and Chief Executive Officer, Columbia Management Investment Distributors, Inc. since May 2010 and February 2012, respectively; Chairman of the Board and Chief Executive Officer, RiverSource Distributors, Inc. since 2006; Director, Threadneedle Asset Management Holdings, SARL since 2014; President and Chief Executive Officer, Ameriprise Certificate Company, 2006-August 2012. | | | 184 | | | Trustee to other Columbia Funds since 2001; Chairman of the Board, Columbia Management Investment Advisers, LLC since May 2010; Director, Columbia Management Investment Distributors, Inc. since May 2010; Former Director, Ameriprise Certificate Company, 2006-January 2013 | |
* Interested person (as defined under the 1940 Act) by reason of being an officer, director, security holder and/or employee of the Investment Manager or Ameriprise Financial.
The Statement of Additional Information has additional information about the Fund's Board members and is available, without charge, upon request by calling 800.345.6611; contacting your financial intermediary; or visiting investor.columbiathreadneedleus.com.
Annual Report 2016
45
COLUMBIA CONTRARIAN CORE FUND
TRUSTEES AND OFFICERS (continued)
The Board has appointed officers who are responsible for day-to-day business decisions based on policies it has established. The officers serve at the pleasure of the Board. The following table provides basic information about the Officers of the Fund, including principal occupations during the past five years, although their specific titles may have varied over the period. In addition to Mr. Truscott, who is Senior Vice President, the Fund's other officers are:
Fund Officers
Name,
Address and
Year of Birth | | Position and Year
First Appointed to
Position for any Fund
in the Columbia
Funds Complex or a
Predecessor Thereof | |
Principal Occupation(s) During Past Five Years | |
Christopher O. Petersen
5228 Ameriprise Financial Center
Minneapolis, MN 55474
Born 1970 | | President and Principal Executive Officer (2015) | | Vice President and Lead Chief Counsel, Ameriprise Financial, Inc. since January 2015 (previously, Vice President and Chief Counsel January 2010-December 2014; officer of Columbia Funds and affiliated funds since 2007. | |
Michael G. Clarke
225 Franklin Street
Boston, MA 02110
Born 1969 | | Treasurer (2011), Chief Financial Officer (2009) and Chief Accounting Officer (2015) | | Vice President — Mutual Fund Administration, Columbia Management Investment Advisers, LLC, since May 2010; senior officer of Columbia Funds and affiliated funds since 2002. | |
Paul B. Goucher
100 Park Avenue
New York, NY 10017
Born 1968 | | Senior Vice President (2011), Chief Legal Officer (2015) and Assistant Secretary (2008) | | Vice President and Lead Chief Counsel, Ameriprise Financial, Inc. since November 2008 and January 2013, respectively (previously Chief Counsel, January 2010-January 2013); Vice President, Chief Legal Officer and Assistant Secretary, Columbia Management Investment Advisers, LLC since May 2010. | |
Thomas P. McGuire
225 Franklin Street
Boston, MA 02110
Born 1972 | | Senior Vice President and Chief Compliance Officer (2012) | | Vice President — Asset Management Compliance, Ameriprise Financial, Inc., since May 2010; Chief Compliance Officer, Ameriprise Certificate Company since September 2010. | |
Colin Moore
225 Franklin Street
Boston, MA 02110
Born 1958 | | Senior Vice President (2010) | | Executive Vice President and Global Chief Investment Officer, Ameriprise Financial, Inc., since July 2013; Executive Vice President and Global Chief Investment Officer, Columbia Management Investment Advisers, LLC since July 2013 (previously Director and Global Chief Investment Officer, 2010-2013). | |
Michael E. DeFao
225 Franklin Street
Boston, MA 02110
Born 1968 | | Vice President (2011) and Assistant Secretary (2010) | | Vice President and Chief Counsel, Ameriprise Financial, Inc. since May 2010. | |
Amy Johnson
5228 Ameriprise Financial Center
Minneapolis, MN 55474
Born 1965 | | Vice President (2006) | | Managing Director and Global Head of Operations, Columbia Management Investment Advisers, LLC since April 2016 (previously Managing Director and Chief Operating Officer, 2010-2016). | |
Lyn Kephart-Strong
5228 Ameriprise
Financial Center
Minneapolis, MN 55474
Born 1960 | | Vice President (2015) | | President, Columbia Management Investment Services Corp. since October 2014; Vice President & Resolution Officer, Ameriprise Trust Company since August 2009. | |
Ryan C. Larrenaga
225 Franklin Street
Boston, MA 02110
Born 1970 | | Vice President and Secretary (2015) | | Vice President and Group Counsel, Ameriprise Financial, Inc. since August 2011; officer of Columbia Funds and affiliated funds since 2005. | |
Annual Report 2016
46
COLUMBIA CONTRARIAN CORE FUND
BOARD CONSIDERATION AND APPROVAL OF MANAGEMENT
AGREEMENT
On June 10, 2016, the Board of Trustees (the Board) and the Trustees who are not interested persons (as defined in the Investment Company Act of 1940) (the Independent Trustees) of Columbia Funds Series Trust I (the Trust) unanimously approved the continuation of the Management Agreement (the Management Agreement) with Columbia Management Investment Advisers, LLC (the Investment Manager) with respect to Columbia Contrarian Core Fund (the Fund), a series of the Trust. As detailed below, the Board's Advisory Fees and Expenses Committee (the Committee) and the Board met on multiple occasions to review and discuss, both among themselves and with the management team of the Investment Manager, materials provided by the Investment Manager and others before determining to approve the continuation of the Management Agreement.
In connection with their deliberations regarding the continuation of the Management Agreement, the Committee and the Board evaluated materials requested from the Investment Manager regarding the Fund and the Management Agreement, and discussed these materials with representatives of the Investment Manager at Committee meetings held on March 8, 2016, April 27, 2016 and June 9, 2016 and at Board meetings held on March 9, 2016 and June 10, 2016. In addition, the Board considers matters bearing on the Management Agreement at most of its other meetings throughout the year and meets regularly with senior management of the Trust and the Investment Manager. Through the Board's Investment Oversight Committees, Trustees also meet with selected portfolio managers of the funds the Trustees oversee and other investment personnel at various times throughout the year. The Committee and the Board also consulted with its independent fee consultant, Fund counsel and with the Independent Trustees' independent legal counsel, who advised on various matters with respect to the Committee's and the Board's considerations and otherwise assisted the Committee and the Board in their deliberations. On June 9, 2016, the Committee recommended that the Board approve the continuation of the Management Agreement. On June 10, 2016, the Board, including the Independent Trustees, voting separately, unanimously approved the continuation of the Management Agreement for the Fund.
The Committee and the Board considered all information that they, their legal counsel or the Investment Manager believed reasonably necessary to evaluate and to determine whether to recommend for approval or approve the continuation of the Management Agreement. The information and factors considered by the Committee and the Board in recommending for approval or approving the continuation of the Management Agreement for the Fund included the following:
• Information on the investment performance of the Fund relative to the performance of a group of mutual funds determined to be comparable to the Fund by an independent third-party data provider, as well as performance relative to benchmarks;
• Information on the Fund's management fees and total expenses, including information comparing the Fund's expenses to those of a group of comparable mutual funds, as determined by the independent third-party data provider;
• The Investment Manager's agreement to contractually limit or cap total operating expenses for the Fund through December 31, 2017 so that total operating expenses (excluding certain fees and expenses, such as transaction costs and certain other investment related expenses, interest, taxes, acquired fund fees and expenses, and infrequent and/or unusual expenses) would not exceed a specified annual rate, as a percentage of the Fund's net assets;
• The terms and conditions of the Management Agreement;
• The current and proposed terms and conditions of other agreements and arrangements with affiliates of the Investment Manager relating to the operations of the Fund, including agreements with respect to the provision of distribution and transfer agency services to the Fund;
• Descriptions of various functions performed by the Investment Manager under the Management Agreement, including portfolio management and portfolio trading practices;
• Information regarding the management fees of similarly-managed portfolios of other clients of the Investment Manager, including institutional separate accounts;
Annual Report 2016
47
COLUMBIA CONTRARIAN CORE FUND
BOARD CONSIDERATION AND APPROVAL OF MANAGEMENT
AGREEMENT (continued)
• Information regarding the reputation, regulatory history and resources of the Investment Manager, including information regarding senior management, portfolio managers and other personnel;
• Information regarding the capabilities of the Investment Manager with respect to compliance monitoring services, including an assessment of the Investment Manager's compliance system by the Fund's Chief Compliance Officer; and
• The profitability to the Investment Manager and its affiliates from their relationships with the Fund.
Nature, Extent and Quality of Services Provided under the Management Agreement
The Committee and the Board considered the nature, extent and quality of services provided to the Fund by the Investment Manager and its affiliates under the Management Agreement and under separate agreements for the provision of transfer agency services, and the resources dedicated to the Fund and the other Columbia Funds by the Investment Manager and its affiliates. The Committee and the Board considered, among other things, the Investment Manager's ability to attract, motivate and retain highly qualified research, advisory and supervisory investment professionals (including personnel and other resources, compensation programs for personnel involved in fund management, reputation and other attributes), the portfolio management services provided by those investment professionals, and the quality of the Investment Manager's investment research capabilities and trade execution services. The Committee and the Board also considered the potential benefits to shareholders of investing in a mutual fund that is part of a fund complex offering exposure to a variety of asset classes and investment disciplines and providing a variety of fund and shareholder services.
The Committee and the Board also considered the professional experience and qualifications of the senior personnel of the Investment Manager, which included consideration of the Investment Manager's experience with similarly-structured funds. The Committee and the Board noted the compliance programs of and the compliance-related resources provided to the Fund by the Investment Manager and its affiliates, and considered the Investment Manager's ability to provide administrative services to the Fund and coordinate the activities of the Fund's other service providers. After reviewing these and related factors, the Committee and the Board concluded, within the context of their overall conclusions, that the nature, extent and quality of the services provided to the Fund under the Management Agreement supported the continuation of the Management Agreement.
Investment Performance
The Committee and the Board reviewed information about the performance of the Fund over various time periods, including performance information relative to benchmarks and information based on reports of the independent third-party data provider that compared the performance of the Fund to the performance of a group of comparable mutual funds, and data provided by the independent fee consultant. The Committee and the Board also reviewed a description of the third party's methodology for identifying the Fund's peer groups for purposes of performance and expense comparisons.
The Committee and the Board noted that, through December 31, 2015, the Fund's performance was in the thirteenth, fourth and ninth percentile (where the best performance would be in the first percentile) of its category selected by the independent third-party data provider for the purposes of performance comparisons for the one-, three- and five- year periods, respectively.
The Committee and the Board also considered the Investment Manager's performance and reputation generally, the Investment Manager's historical responsiveness to Board concerns about performance, and the Investment Manager's willingness to take steps intended to improve performance. After reviewing these and related factors, the Committee and the Board concluded, within the context of their overall conclusions, that the performance of the Fund and the Investment Manager was sufficient, in light of other considerations, to warrant the continuation of the Management Agreement.
Investment Management Fee Rates and Other Expenses
The Committee and the Board considered the management fees charged to the Fund under the Management Agreement as well as the total expenses incurred by the Fund. In assessing the reasonableness of the fees
Annual Report 2016
48
COLUMBIA CONTRARIAN CORE FUND
BOARD CONSIDERATION AND APPROVAL OF MANAGEMENT
AGREEMENT (continued)
under the Management Agreement, the Committee and the Board considered, among other information, the Fund's management fee and its total expense ratio as a percentage of average daily net assets. The Committee and the Board considered data provided by the independent fee consultant. The Committee and the Board noted that, as of December 31, 2015, the Fund's actual management fee and net total expense ratio are both ranked in the third quintile (where the lowest fees and expenses would be in the first quintile) against the Fund's expense universe as determined by the independent third-party data provider for purposes of expense comparison. The Committee and the Board also took into account the fee waiver and expense limitation arrangements agreed to by the Investment Manager, as noted above.
The Committee and the Board also received and considered information about the management fees charged by the Investment Manager to institutional separate accounts. In considering the fees charged to those accounts, the Committee and the Board took into account, among other things, the Investment Manager's representations about the differences between managing mutual funds as compared to other types of accounts, including differences in the services provided, differences in the risk profile of such business for the Investment Manager and the additional resources required to manage mutual funds effectively. The Committee and the Board also received and considered information about the fees charged by the Investment Manager for sub-advisory services provided to comparable unaffiliated funds. In evaluating the Fund's management fees, the Committee and the Board also took into account the demands, complexity and quality of the investment management of the Fund.
After reviewing these and related factors, the Committee and the Board concluded, within the context of their overall conclusions, that the management fee rates and expenses of the Fund were sufficient, in light of other considerations, to warrant the continuation of the Management Agreement.
Costs of Services Provided and Profitability
The Committee and the Board also took note of the costs the Investment Manager and its affiliates incur in connection with the services provided (both on an absolute and relative basis) and the profitability to the Investment Manager and its affiliates in connection with their relationships with the Fund.
The Committee and the Board also considered the compensation directly or indirectly received by the Investment Manager's affiliates in connection with their relationships with the Fund. The Committee and the Board reviewed information provided by management as to the profitability to the Investment Manager and its affiliates of their relationships with the Fund, information about the allocation of expenses used to calculate profitability, and comparisons of profitability levels realized in 2015 to profitability levels realized in 2014. When reviewing profitability, the Committee and the Board also considered court cases in which adviser profitability was an issue in whole or in part, the performance of similarly managed funds, the performance of the Fund, and the expense ratio of the Fund. In addition, the Committee and the Board considered information provided by the Investment Manager regarding the Investment Manager's financial condition and comparing its profitability to that of other asset management firms that are, or are subsidiaries of, publicly traded companies. In this regard, the Committee and the Board also considered data provided by the independent fee consultant.
After reviewing these and related factors, the Committee and the Board concluded, within the context of their overall conclusions, that the costs of services provided and the profitability to the Investment Manager and its affiliates from their relationships with the Fund supported the continuation of the Management Agreement.
Economies of Scale
The Committee and the Board considered the potential existence of economies of scale in the provision by the Investment Manager of services to the Fund, to groups of related funds, and to the Investment Manager's investment advisory clients as a whole, and whether those economies of scale were shared with the Fund through breakpoints in investment management fees or other means, such as expense limitation arrangements and additional investments by the Investment Manager in investment, trading and compliance resources. The Committee and the Board noted that the management fee schedules for the Fund contained breakpoints that would reduce the fee rate on assets above specified threshold levels.
Annual Report 2016
49
COLUMBIA CONTRARIAN CORE FUND
BOARD CONSIDERATION AND APPROVAL OF MANAGEMENT
AGREEMENT (continued)
In considering these matters, the Committee and the Board also considered the costs of the services provided and the profitability to the Investment Manager and its affiliates from their relationships with the Fund, as discussed above. After reviewing these and related factors, the Committee and the Board concluded, within the context of their overall conclusions, that the extent to which any economies of scale were expected to be shared with the Fund supported the continuation of the Management Agreement.
Other Benefits to the Investment Manager
The Committee and the Board received and considered information regarding "fall-out" or ancillary benefits received by the Investment Manager and its affiliates as a result of their relationships with the Fund, such as the engagement of the Investment Manager's affiliates to provide distribution, transfer agency and shareholder services to the Fund. In this regard, among other matters, the Committee and the Board considered that the Fund's distributor retains a portion of the distribution fees from the Fund and receives a portion of the sales charges on sales or redemptions of certain classes of shares of the Fund. The Committee and the Board also considered the benefits of research made available to the Investment Manager by reason of brokerage commissions generated by the Fund's securities transactions, and reviewed information about the Investment Manager's practices with respect to allocating portfolio transactions for brokerage and research services. The Committee and the Board considered the possible conflicts of interest associated with certain fall-out or other ancillary benefits and the reporting, disclosure and other processes that are in place to address such possible conflicts of interest. The Committee and the Board recognized that the Investment Manager's profitability would be somewhat lower without these benefits.
Conclusion
The Committee and the Board reviewed all of the above considerations in reaching their decisions to recommend or approve the continuation of the Management Agreement. In their deliberations, the Trustees did not identify any particular information that was all-important or controlling, and individual Trustees may have attributed different weights to the various factors. Based on their evaluation of all factors that they deemed to be material, including those factors described above, and assisted by the advice of independent legal counsel, the Board, including the Independent Trustees, voting separately, unanimously approved the continuation of the Management Agreement.
Annual Report 2016
50
COLUMBIA CONTRARIAN CORE FUND
IMPORTANT INFORMATION ABOUT THIS REPORT
Each fund mails one shareholder report to each shareholder address. If you would like more than one report, please call shareholder services at 800.345.6611 and additional reports will be sent to you.
The policy of the Board is to vote the proxies of the companies in which each fund holds investments consistent with the procedures as stated in the Statement of Additional Information (SAI). You may obtain a copy of the SAI without charge by calling 800.345.6611; contacting your financial intermediary; visiting investor.columbiathreadneedleus.com; or searching the website of the Securities and Exchange Commission (SEC) at sec.gov. Information regarding how each fund voted proxies relating to portfolio securities is filed with the SEC by August 31st for the most recent 12-month period ending June 30th of that year, and is available without charge by visiting investor.columbiathreadneedleus.com, or searching the website of the SEC at sec.gov.
Each fund files a complete schedule of portfolio holdings with the SEC for the first and third quarters of each fiscal year on Form N-Q. Each fund's Form N-Q is available on the SEC's website at sec.gov and may be reviewed and copied at the SEC's Public Reference Room in Washington, D.C. Information on the operation of the Public Reference Room may be obtained by calling 800.SEC.0330. Each fund's complete schedule of portfolio holdings, as filed on Form N-Q, can also be obtained without charge, upon request, by calling 800.345.6611.
Annual Report 2016
51
Columbia Contrarian Core Fund
P.O. Box 8081
Boston, MA 02266-8081

Please read and consider the investment objectives, risks, charges and expenses for any fund carefully before investing. For a prospectus and summary prospectus, which contains this and other important information about the Fund, go to investor.columbiathreadneedleus.com. The Fund is distributed by Columbia Management Investment Distributors, Inc., member FINRA, and managed by Columbia Management Investment Advisers, LLC.
Columbia Threadneedle Investments (Columbia Threadneedle) is the global brand name of the Columbia and Threadneedle group of companies.
All rights reserved. Columbia Management Investment Distributors, Inc., 225 Franklin Street, Boston, MA 02110-2804
© 2016 Columbia Management Investment Advisers, LLC.
investor.columbiathreadneedleus.com
ANN133_08_F01_(10/16)

ANNUAL REPORT
August 31, 2016

ACTIVE PORTFOLIOS® MULTI-MANAGER ALTERNATIVES FUND
(formerly Active Portfolios® Multi-Manager Alternative Strategies Fund)


ABOUT COLUMBIA THREADNEEDLE INVESTMENTS
Columbia Threadneedle Investments is a leading global asset management group that provides a broad range of investment strategies and solutions for individual, institutional and corporate clients around the world.
With more than 2,000 people, including over 450 investment professionals based in North America, Europe and Asia, we manage $460 billion* of assets across developed and emerging market equities, fixed income, asset allocation solutions and alternatives. We are the 13th largest manager of long-term mutual fund assets in the U.S.** and the 4th largest manager of retail funds in the U.K.***
Our priority is the investment success of our clients. We aim to deliver the investment outcomes they expect through an investment approach that is team-based, performance-driven and risk-aware. Our culture is dynamic and interactive. By sharing our insights across asset classes and geographies, we generate richer perspectives on global, regional and local investment landscapes. The ability to exchange and debate investment ideas in a collaborative environment enriches our teams’ investment processes. More importantly, it results in better informed investment decisions for our clients.
Columbia funds are distributed by Columbia Management Investment Distributors, Inc., member FINRA, and managed by Columbia Management Investment Advisers, LLC.
Columbia Threadneedle Investments (Columbia Threadneedle) is the global brand name of the Columbia and Threadneedle group of companies.
| * | | In U.S. dollars as of June 30, 2016. Source: Ameriprise Q2 Earnings Release. Includes all assets managed by entities in the Columbia and Threadneedle group of companies. Contact us for more current data. |
| ** | | Source: ICI as of June 30, 2016 for Columbia Management Investment Advisers, LLC. |
| *** | | Source: Investment Association as of March 2016 for Threadneedle Asset Management Limited. |
© 2016 Columbia Management Investment Advisers, LLC. All rights reserved.
Not part of the shareholder report
| | | | |
| | Investment strategies to help meet investor needs |
| |
| | We are committed to helping investors navigate financial challenges to reach their desired outcomes. The possibilities are endless. |
| | | | |
| | | | |
| | Your success is our priority. |
| | | | |
| | |
| |  | | Retire comfortably |
| | | | |
| | |
| | | | Fund college or higher education |
| | | | |
| | |
| | | | Leave a legacy |
| | | | |
| | | | |
 | | Generate an appropriate stream of income in retirement Traditional approaches to income may no longer be adequate — and they may no longer provide the diversification benefits they once did. Investors need to rethink how they generate retirement income. Worried about running out of income? You are not alone. |
| | | | |
| | | | |
 | | Navigate a changing interest rate environment Even in today’s challenging interest rate environment, it’s still possible to navigate markets and achieve your goals. Make investment choices designed specifically for this market environment. |
| | | | |
| | | | |
| |
 | | Maximize after-tax returns In an environment where what you keep is more important than what you earn, municipal bonds can help mitigate higher taxes while providing attractive yields compared to other investment options. You’ve worked too hard building your wealth to lose it to taxes. |
| | | | |
| | | | |
 | | Grow assets to achieve financial goals Finding growth opportunities in today’s complex market environment requires strong research capabilities, creative thinking and a disciplined approach. Do your investments deliver the portfolio growth you need? |
| | | | |
| | | | |
| |
 | | Ease the impact of volatile markets With increasing concerns about market volatility, investors should consider diversifying their portfolios with non-traditional holdings. Interested in turning volatility into opportunity? |
To find out more, contact your financial professional, call 800.426.3750 or visit investor.columbiathreadneedleus.com
Not part of the shareholder report
PRESIDENT’S MESSAGE

Dear Shareholders,
Volatility comes with the territory for long-term investors. Some investors instinctively want to pull out of the market or sell underperforming investments at the first sign of increased volatility or perhaps even as soon as they perceive it on the horizon. But taking yourself out of the market could mean losing out on potential opportunities, and putting your longer term investment goals at risk.
Cumulative return is not just about achieving high returns when markets are going up; it’s also about remaining invested and minimizing losses during weak or volatile markets so that you can participate on the upside. Developing a deeper understanding of the various risks your portfolio is subject to can help you balance these risks.
Diversification is critical in seeking to achieve that balance. We believe that most portfolios could be more effectively diversified either by introducing holdings with performance profiles unrelated to existing holdings (like alternative products) or by rebalancing existing holdings with an eye toward risk allocation. Over time, distributing risk more evenly may produce a more pronounced diversification benefit and may improve portfolio efficiency. We believe market volatility can create significant opportunities and, in fact, these periods may be some of the very best times to invest.
With this in mind, I thought it important to highlight excerpts from a piece written by Colin Moore, Global Chief Investment Officer, in which he touches on some of these issues emphasizing the importance of a properly constructed portfolio in seeking to effectively manage volatility and to achieve consistency of returns. I encourage you to read the article in its entirety. To access the full article and for other insights on current market, please visit blog.columbiathreadneedleus.com/latest-perspectives.
You need investments that are designed to help you ease the impact of volatile market environments and keep the savings you have worked tirelessly to amass. Columbia Threadneedle Investments provides investment solutions to help you tackle financial challenges and achieve your desired outcome.
Best regards,

Christopher O. Petersen
President, Columbia Funds
Excerpts from:
Taking the scare out of the volatility bogeyman
By Colin Moore, Global Chief Investment Officer

Colin Moore is the global chief investment officer for Columbia Threadneedle Investments. His responsibilities include ensuring that a disciplined investment process is in place across all asset classes, including equity and fixed income. Mr. Moore joined one of the Columbia Threadneedle Investments legacy firms in 2002 as head of equity and was also head of fixed income and liquidity strategies from 2009-2010.
| n | | In today’s low growth, higher volatility world, the emphasis is shifting from maximization of returns to consistency of returns. |
| n | | Portfolios should represent the behavioral risk-return tradeoff of investors, remembering that they won’t stay invested to realize the return if we get the risk tolerance wrong. |
Annual Report 2016
PRESIDENT’S MESSAGE (continued)
| n | | Holding long-term savings in cash to avoid volatility (the financial equivalent of hiding under the sheets) is detrimental to achieving long-term goals. |
According to Wikipedia, “The bogeyman is a common allusion to a mythical creature in many cultures used to control behavior. This monster has no specific appearance, and conceptions about it can vary drastically from household to household within the same community; in many cases he has no set appearance in the mind of an adult or child, but is simply a non-specific embodiment of terror.” Different cultures have different names and physical representations for the bogeyman, and investors are no different. We have terrible monsters that we fear may destroy our portfolios, and we call one of the scariest of them volatility.
While the bogeyman is mythical (I hope!), volatility is real and can cause serious damage. To understand why investors have such a hard time coping with volatility, we first need to define three cognitive biases at work in today’s investment environment:
| | 1) | | Recency bias — something that has recently come to the forefront of our attention, regardless of how long established it is, suddenly seems to appear with improbable frequency. |
| | 2) | | Negativity bias — we tend to have a greater recall of unpleasant memories than positive memories. |
| | 3) | | Loss aversion — our dissatisfaction with losing money tends to be greater than our satisfaction with making money. |
The level of volatility varies dramatically, and so does investor fear and panic selling — waxing when volatility rises, waning when it falls. Recent studies have pointed to demographics as an important driver of panic selling. The theory is that as people get closer to retirement, the prospects of a large (20%-30%) loss in financial assets can have a much more pronounced effect on their sense of well-being. Wealth preservation instincts kick in much more quickly than for younger (and typically less wealthy) savers.
The reality is that there is little opportunity for return without volatility. Therefore, the bogeyman effect of holding long-term savings in cash to avoid volatility (the financial equivalent of hiding under the sheets) is detrimental to achieving long-term goals. This effect tends to be more pronounced during the episodic spikes in volatility. The significant spike in volatility in 2008 and 2009 led to significant withdrawals from long-term investment funds over the same period. Less pronounced effects can also be seen when comparing 2001–2003 and 2011–2012. Conversely, flows picked up when volatility returned to “normal” levels. Investor behavior of this type is consistent with the three behavioral biases.
I believe average volatility will be higher over the next 10 years than the last 10 years and episodic spikes will increase in frequency because sustainable economic growth will be structurally lower and geopolitical risk higher than any time since World War II. Low growth creates uncertainty while loss aversion will make investors fear that we are one economic mishap or geopolitical event away from no growth or recession. The result will be higher volatility on average. Negativity bias will tend to exacerbate “spike” reactions to event-driven geopolitical news, and the volatility bogeyman will appear more often. Assuming the behavioral biases continue, investor returns are likely to be very disappointing regardless of the total return generated by financial markets due to the bogeyman effect.
To mitigate this effect, we need to focus on portfolio construction and an improved understanding of diversification. I accept that equities are likely to offer the highest return over the next 10 years, but they also offer the highest volatility. Many portfolio construction optimization tools use historical average volatility, which is likely to underestimate the volatility investors will face. The bogeyman emerges when individual asset class volatility spikes and cross correlations rise, the combination of which increases overall portfolio volatility far beyond expectation. Diversification is meant to protect investors against volatility, but what’s the point of owning lots of investments if the volatility bogeyman has not been properly estimated?
Most importantly, portfolios should be constructed to properly represent the behavioral risk-return tradeoff of investors, remembering that they won’t stay invested to realize the return if we get the risk tolerance wrong. In a low growth, higher volatility world, the emphasis is shifting to return consistency rather than return maximization, and investors are
Annual Report 2016
PRESIDENT’S MESSAGE (continued)
best served through investment approaches that appreciate that distinction. Even though it’s a permanent feature of financial markets, volatility is less likely to be the bogeyman we all fear if portfolios are constructed with this understanding.
Please visit blog.columbiathreadneedleus.com/latest-perspectives to read the entire article.
Investors should consider the investment objectives, risks, charges and expenses of a mutual fund carefully before investing. For a free prospectus and summary prospectus, which contains this and other important information about a fund, visit investor.columbiathreadneedleus.com. The prospectus should be read carefully before investing.
The views expressed are as of April 2016, may change as market or other conditions change, and may differ from views expressed by other Columbia Management Investment Advisers, LLC (CMIA) associates or affiliates. Actual investments or investment decisions made by CMIA and its affiliates, whether for its own account or on behalf of clients, will not necessarily reflect the views expressed. This information is not intended to provide investment advice and does not account for individual investor circumstances. Investment decisions should always be made based on an investor’s specific financial needs, objectives, goals, time horizon and risk tolerance. Asset classes described may not be suitable for all investors.
Past performance does not guarantee future results, and no forecast should be considered a guarantee either. Since economic and market conditions change frequently, there can be no assurance that the trends described here will continue or that the forecasts are accurate.
Diversification does not guarantee a profit or protect against loss.
Columbia Funds are distributed by Columbia Management Investment Distributors, Inc., member FINRA, and managed by Columbia Management Investment Advisers, LLC.
© 2016 Columbia Management Investment Advisers, LLC. All rights reserved.
Annual Report 2016
| | | | | | |
| | |
| | | | ACTIVE PORTFOLIOS® MULTI-MANAGER ALTERNATIVES FUND | | |
TABLE OF CONTENTS
Fund Investment Manager
Columbia Management Investment
Advisers, LLC
225 Franklin Street
Boston, MA 02110
Fund Distributor
Columbia Management Investment
Distributors, Inc.
225 Franklin Street
Boston, MA 02110
Fund Transfer Agent
Columbia Management Investment
Services Corp.
P.O. Box 8081
Boston, MA 02266-8081
For more information about any of the funds, please visit investor.columbiathreadneedleus.com or call 800.345.6611. Customer Service Representatives are available to answer your questions Monday through Friday from 8 a.m. to 7 p.m. Eastern time.
The views expressed in this report reflect the current views of the respective parties. These views are not guarantees of future performance and involve certain risks, uncertainties and assumptions that are difficult to predict, so actual outcomes and results may differ significantly from the views expressed. These views are subject to change at any time based upon economic, market or other conditions and the respective parties disclaim any responsibility to update such views. These views may not be relied on as investment advice and, because investment decisions for a Columbia fund are based on numerous factors, may not be relied on as an indication of trading intent on behalf of any particular Columbia fund. References to specific securities should not be construed as a recommendation or investment advice.
Annual Report 2016
| | | | | | |
| | |
| | | | ACTIVE PORTFOLIOS® MULTI-MANAGER ALTERNATIVES FUND | | |
PERFORMANCE OVERVIEW
Performance Summary
| n | | Active Portfolios® Multi-Manager Alternatives Fund (the Fund) Class A shares returned 0.79% for the 12-month period that ended August 31, 2016. |
| n | | The Fund outperformed its benchmark, the Citi Three-Month U.S. Treasury Bill Index, which returned 0.18% over the same period. |
| n | | The Fund’s outperformance can be attributed primarily to implementation of various alternative strategies. |
| | | | | | | | | | |
Average Annual Total Returns (%) (for period ended August 31, 2016) | |
| | | Inception | | 1 Year | | | Life | |
Class A | | 04/23/12 | | | 0.79 | | | | 2.35 | |
Citi Three-Month U.S. Treasury Bill Index | | | | | 0.18 | | | | 0.08 | |
All results shown assume reinvestment of distributions during the period. Returns do not reflect the deduction of taxes that a shareholder may pay on Fund distributions or on the redemption of Fund shares. Performance results reflect the effect of any fee waivers or reimbursements of Fund expenses by Columbia Management Investment Advisers, LLC and/or any of its affiliates. Absent these fee waivers or expense reimbursement arrangements, performance results would have been lower.
The performance information shown represents past performance and is not a guarantee of future results. The investment return and principal value of your investment will fluctuate so that your shares, when redeemed, may be worth more or less than their original cost. Current performance may be lower or higher than the performance information shown. You may obtain performance information current to the most recent month-end by contacting your financial intermediary, visiting investor.columbiathreadneedleus.com or calling 800.345.6611.
The Citi Three-Month U.S. Treasury Bill Index, an unmanaged index, is representative of the performance of three-month Treasury bills.
Indices are not available for investment, are not professionally managed and do not reflect sales charges, fees, brokerage commissions, taxes or other expenses of investing. Securities in the Fund may not match those in an index.
| | | | | | |
| | |
| | | | ACTIVE PORTFOLIOS® MULTI-MANAGER ALTERNATIVES FUND | | |
PERFORMANCE OVERVIEW (continued)
|
Performance of a Hypothetical $10,000 Investment (April 23, 2012 — August 31, 2016) |
The chart above shows the change in value of a hypothetical $10,000 investment in Class A shares of Active Portfolios® Multi-Manager Alternatives Fund during the stated time period, and does not reflect the deduction of taxes that a shareholder may pay on Fund distributions or on the redemption of Fund shares.
| | | | | | |
| | |
| | | | ACTIVE PORTFOLIOS® MULTI-MANAGER ALTERNATIVES FUND | | |
MANAGER DISCUSSION OF FUND PERFORMANCE
Portfolio Management
AQR Capital Management, LLC
Clifford Asness, Ph.D., M.B.A.
Brian Hurst
John Liew, Ph.D., M.B.A.
Yao Hua Ooi
Ari Levine, M.S.
Wasatch Advisors, Inc.
Michael Shinnick
Terry Lally, CFA
Water Island Capital, LLC
Edward Chen
Roger Foltynowicz, CAIA
Gregg Loprete
Todd Munn
| | | | |
Portfolio Breakdown — Long Positions (%)
(at August 31, 2016) | |
Common Stocks | | | 58.2 | |
Convertible Bonds | | | 0.7 | |
Corporate Bonds & Notes | | | 6.4 | |
Exchange-Traded Funds | | | 0.4 | |
Options Purchased Calls | | | 0.0 | (a) |
Options Purchased Puts | | | 0.0 | (a) |
Treasury Bills | | | 14.6 | |
Short-Term Investments Segregated in Connection with Open Derivatives Contracts(b) | | | 45.7 | |
Total | | | 126.0 | |
Percentages indicated are based upon total investments, net of investments sold short. The Fund’s portfolio composition is subject to change.
| (b) | Includes investments in Money Market Funds (amounting to $258.3 million) which have been segregated to cover obligations relating to the Fund’s investment in derivatives which provide exposure to multiple markets. For a description of the Fund’s investments in derivatives, see Investments in Derivatives following the Consolidated Portfolio of Investments and Note 2 to the Notes to Consolidated Financial Statements. |
| | | | |
Portfolio Breakdown — Short Positions (%)
(at August 31, 2016) | |
Common Stocks | | | (24.9 | ) |
Corporate Bonds & Notes | | | (0.8 | ) |
Exchange-Traded Funds | | | (0.3 | ) |
Total | | | (26.0 | ) |
Percentages indicated are based upon total investments, net of investments sold short. The Fund’s portfolio composition is subject to change.
Effective October 12, 2016, the Fund was renamed Active Portfolios® Multi-Manager Alternatives Fund. Additionally, on October 20, 2016, Wasatch Advisors, Inc. will no longer serve as a subadviser of the Fund.
As of August 31, 2016, the Fund is managed by three independent money management firms and each invests a portion of the portfolio’s assets. AQR Capital Management, LLC (AQR), Wasatch Advisors, Inc. (Wasatch) and Water Island Capital, LLC (Water Island) managed approximately 39%, 30% and 31% of the portfolio, respectively. While the Fund’s benchmark is the Citi Three-Month U.S. Treasury Bill Index, Wasatch also compares the performance of its portion of the Fund to the S&P 500 Index.
For the 12-month period that ended August 31, 2016, the Fund’s Class A shares returned 0.79%. The Fund outperformed its benchmark, the Citi Three-Month U.S. Treasury Bill Index, which returned 0.18% over the same period. The Fund’s outperformance can be attributed primarily to implementation of various alternative strategies.
Financial Markets Faced Challenges Amid Heightened Volatility
Financial market volatility experienced in the last months of 2015 was predicated largely by a collapse in oil prices, and the trend continued into the first quarter of 2016. Investors were gripped by negativity surrounding economic growth, divergent central bank policies and tepid corporate earnings. Year-to-date February 11, 2016, both U.S. equities and high-yield fixed income fell significantly. However, a combination of actions led to a sudden reversal that pushed markets into positive territory by the end of the first quarter of 2016. From mid-February 2016, the European Central Bank provided a larger-than-expected expansion of monetary policy; Chinese officials at the G20 meeting calmed worries around growth and currency policy; the world’s major oil-producing countries hinted at production cuts and cooperation; U.S. recession fears faded; and the Federal Reserve’s (the Fed’s) tone turned considerably more dovish toward expected interest rate increases. When all was said and done, the equity and high-yield market had rallied significantly in the latter half of the first quarter of 2016.
The second quarter of 2016 saw fit to continue the rally. Credit products experienced dual tailwinds, namely declines both in the 10-year U.S. Treasury yield and in high-yield credit spreads. Central bank support, under-investment and significant cash balances combined to provide ample stimulus for the markets — pushing the U.S. equity market, the high-yield market and the broad U.S. fixed-income market, as represented by the S&P 500 Index, the BofAML High Yield Index and the Bloomberg Barclays U.S. Aggregate Bond Index — near their 2016 highs by the end of the second quarter of 2016. Still, the environment was punctuated by bouts of significant short-term volatility. Market sentiment seemed to veer from risk-on to risk-off on a daily basis. The U.K. referendum to leave the European Union, for example, saw the S&P 500 Index fall materially in the four days after the vote only to recover by virtually the same amount over the following three days. Equities rallied overall toward the end of the 12-month period on the expectation of stimulus from central banks. For the period as a whole, the S&P 500 Index returned 12.55%, the BofAML High Yield Constrained Index returned 9.22%, and the Bloomberg Barclays U.S. Aggregate Bond Index returned 5.97%.
| | | | | | |
| | |
| | | | ACTIVE PORTFOLIOS® MULTI-MANAGER ALTERNATIVES FUND | | |
MANAGER DISCUSSION OF FUND PERFORMANCE (continued)
Results Based on Variety of Alternative Strategies
AQR: Our portion of the Fund, which pursues an actively managed futures strategy, outperformed the benchmark during the 12-month period. We invest in futures and forward contracts, both long and short, across the global equity, fixed-income, commodity and currency markets. In implementing our strategy, we utilize both short-term and long-term trend-following signals to attempt to profit from different types of trends that occur in each of these markets. Trend following can be simply described as taking long positions in markets that are rising in price and taking short positions in markets that are falling in price. In addition to trend-following signals, we also seek to incorporate signals that identify over-extended trends and reduce risk when the chance of a reversal is perceived as higher than normal, since market reversals generally cause losses for trend-following strategies.
By asset class, fixed income and commodities contributed positively to our portion of the Fund’s performance during the period, while currencies and equities detracted. By signal, long-term trend-following signals and over-extended trend signals, the latter of which attempt to identify trends that have gone too far and are due for reversals, contributed positively. Short-term trend-following signals detracted.
The main economic factors driving returns were related to a number of shifts in market sentiment and particularly the impact this had on trend following in equities. Equities generally started the period on a weak note, only to reverse sharply in October 2015. Early in 2016, equity markets exhibited weakness again, dropping through mid-February, before reversing sharply again in March into early April. These swings were mostly the result of shifting views around the global economy, central bank action, particularly outside the U.S. and expectations of Fed actions in response to broader global dynamics. Equity markets suffered again in June 2016, first on weak macro data, then on the U.K. referendum “Brexit” outcome. Equity markets rallied back toward the end of the period on the expectation of stimulus from central banks. Our portion of the Fund maintains a diversified approach to trend following, so it was able to capture upside from trends in other asset classes. In particular, the actions of central banks and global economic concerns allowed for a sustained bullish trend in fixed income. In commodities, bearish trends in the first half of the period were beneficial, and we managed risk to preserve gains. In the second half of the period, idiosyncratic market dynamics, such as the rally in soybeans due to supply concerns out of Latin America helped the strategy.
Wasatch: Our portion of the Fund, which implements a long/short equity strategy, outperformed the benchmark during the period. The performance of our portion of the Fund can be attributed primarily to strong performance from long positions relative to the S&P 500 Index in the financials, energy, consumer discretionary and telecommunication services sectors. Short positions in the energy, utilities and information technology sectors also added value. These positive contributors were only partially offset by long positions relative to the S&P 500 Index in the industrials, consumer staples and information technology sectors and short positions in the health care, consumer staples and financials sectors, which detracted.
| | | | |
Equity Sector Breakdown — Long Positions (%)
(at August 31, 2016) | |
Consumer Discretionary | | | 18.7 | |
Consumer Staples | | | 7.0 | |
Energy | | | 4.9 | |
Financials | | | 10.8 | |
Health Care | | | 13.7 | |
Industrials | | | 3.2 | |
Information Technology | | | 25.3 | |
Materials | | | 7.8 | |
Telecommunication Services | | | 1.4 | |
Utilities | | | 7.2 | |
Total | | | 100.0 | |
Percentages indicated are based upon total long equity investments. The Fund’s portfolio composition is subject to change.
| | | | |
Equity Sector Breakdown — Short Positions (%)
(at August 31, 2016) | |
Consumer Discretionary | | | (25.2 | ) |
Consumer Staples | | | (14.0 | ) |
Energy | | | (2.9 | ) |
Financials | | | (5.9 | ) |
Health Care | | | (17.2 | ) |
Industrials | | | (9.0 | ) |
Information Technology | | | (17.6 | ) |
Materials | | | (1.4 | ) |
Telecommunication Services | | | (2.2 | ) |
Utilities | | | (4.6 | ) |
Total | | | (100.0 | ) |
Percentages indicated are based upon total short equity investments. The Fund’s portfolio composition is subject to change.
| | | | | | |
| | |
| | | | ACTIVE PORTFOLIOS® MULTI-MANAGER ALTERNATIVES FUND | | |
MANAGER DISCUSSION OF FUND PERFORMANCE (continued)
| | | | | | | | | | | | |
Market Exposure Through Derivatives Investments
(% of notional exposure) (at August 31, 2016) (a) | |
| | | | Long | | | | Short | | | | Net | |
Fixed Income Derivative Contracts | | | 87.1 | | | | (8.3 | ) | | | 78.8 | |
Commodities Derivative Contracts | | | 4.3 | | | | (3.8 | ) | | | 0.5 | |
Equity Derivative Contracts | | | 14.0 | | | | (2.3 | ) | | | 11.7 | |
Foreign Currency Derivative Contracts | | | 57.4 | | | | (48.4 | ) | | | 9.0 | |
Total Notional Market Value of Derivative Contracts | | | 162.8 | | | | (62.8 | ) | | | 100.0 | |
| (a) | The Fund has market exposure (long and/or short) to fixed income, commodity and equity asset classes and foreign currency through its investments in derivatives. The notional exposure of a financial instrument is the nominal or face amount that is used to calculate payments made on that instrument and/or changes in value for the instrument. The notional exposure is a hypothetical underlying quantity upon which payment obligations are computed. Notional exposures provide a gauge for how the Fund may behave given changes in individual markets. For a description of the Fund’s investments in derivatives, see Investments in Derivatives following the Consolidated Portfolio of Investments, and Note 2 to the financial statements. |
The biggest individual contributors to our portion of the Fund’s results were real estate investment trust Iron Mountain, energy exploration and production company Bill Barrett and mini-mill steel producer Steel Dynamics. Iron Mountain gained upon its conversion to a real estate investment trust. As energy prices stabilized somewhat, Bill Barrett was rewarded for its strong balance sheet and financial results that beat market expectations. Steel Dynamics successfully integrated a large acquisition that provided a boost to its operating results.
Positions in agricultural chemical products supplier Mosaic Company and cosmetics and beauty supplies retailers Ulta Salon, Cosmetics & Fragrance and Zeltiq Aesthetics detracted most from our portion of the fund’s relative results. Mosaic Company, despite trading at historically low forward multiples, saw its stock decline due to weak demand for potash. Short positions in Ulta Salon, Cosmetics & Fragrance and in Zeltiq Aesthetics hurt as each company’s stock moved higher. We maintained our portion of the Fund’s positions in all three of these companies at the end of the period.
Water Island: Our portion of the Fund, which employs a variety of alternative strategies, outperformed the benchmark index during the period. Merger arbitrage was our portion of the Fund’s top performing sub-strategy during the period, followed by the credit opportunities sub-strategy. The equity special situations sub-strategy detracted from results during the period. Our portion of the Fund did experience losses in a handful of idiosyncratic events that did not unfold as planned. However, in the fourth quarter of 2015, the drop in global energy prices and turmoil in the high-yield markets also had a meaningful impact on our portion of the Fund. The fallout in the energy sector, for example, led to a number of our energy-related credit opportunities and equity special situations positions experiencing heightened volatility, extended timelines or even terminated planned catalysts. In response, we restructured our portion of the Fund, shifting to a more defensive position by increasing its balance between long and short positions and by including a higher allocation to our less volatile merger arbitrage portfolio and an increased focus on shorter-dated, firmer-catalyst events in our credit opportunities and equity special situations portfolios. Year-to-date August 2016, this has enabled our portion of the Fund to capture a portion of the upside in the S&P 500 Index, BofAML High Yield Constrained Index and Bloomberg Barclays U.S. Aggregate Bond Index rallies while simultaneously better protecting against the numerous short-term bouts of extreme volatility that impacted the markets during the period.
The largest contributors to our portion of the Fund’s performance during the period were an equity special situations investment in Media General; a merger arbitrage investment in the merger between Time Warner Cable and Charter Communications; and a merger arbitrage investment in the merger between Starwood Hotels & Resorts Worldwide and Marriott International. From a sector perspective, consumer discretionary and information technology contributed most to our portion of the Fund’s returns. The countries that made the strongest positive contributions to performance were the U.S., the U.K. and the Netherlands.
The largest detractors from our portion of the Fund’s results during the period were an equity special situations investment in InfraREIT, a merger arbitrage investment in the merger between Williams Companies and energy Transfer Equity LP, and an equity special situations investment in Dynegy.
| | | | | | |
| | |
| | | | ACTIVE PORTFOLIOS® MULTI-MANAGER ALTERNATIVES FUND | | |
MANAGER DISCUSSION OF FUND PERFORMANCE (continued)
From a sector perspective, energy and industrials detracted most from our portion of the Fund’s returns. The only country that detracted from our portion of the Fund’s performance during the period was Singapore.
Changes Based on Strategy Implementation
AQR: Our portion of the Fund aims to take a risk-balanced approach to asset classes, allowing for tactical deviation as a result of attractiveness of trends. Overall, trend following in the Japanese yen, heating oil and gas oil were the largest positive contributors to our portion of the Fund’s performance during the period. Trend following in the Australian dollar, the New Zealand dollar and the NASDAQ Index were the largest detractors from our portion of the Fund’s performance during the period. By country, trends in Japan, particularly the currency and bonds, performed strongly, as the Bank of Japan provided strong stimulus in the middle of the period and lowered marginal deposit rates to negative levels. Conversely, trends in Australian markets were notable detractors, as surprise rate cuts by the Reserve Bank of Australia later in the period and general shifts in sentiment related to the global economy caused the Australian currency to change positioning.
By asset class, fixed income was the best performer in our portion of the fund during the period, driven by sustained bullish trends in fixed-income markets. Fixed-income markets were supported by global economic growth concerns and central bank stimulus efforts throughout the period.
Commodities were also a positive contributor to performance during the period. Commodities experienced strong bearish trends in the early part of the period, and our portion of the Fund benefited. In the second half of the period, bearish trends reversed across a number of sectors, such as precious metals and certain agricultural markets, but our portion of the Fund was able to capture new directional trends, particularly in agricultural commodities.
Equities detracted. There were very few clear trends in equities during the period. While trends in equities detracted from performance, it is important to note that our portion of the Fund overall maintained a negative correlation to equities, offering strong diversification to equity-centric portfolios. This is not always the case, as our portion of the Fund in the long term is expected to have low to no correlation to equities.
Currencies were another detractor from our portion of the Fund’s performance. This was mainly the result of currencies being susceptible to many of the sentiment shifts that impacted equities as well as to some of the reversals in commodities, which impacted commodity-sensitive currencies.
At the end of the period, our portion of the Fund ended long U.S. and South Korean equity markets and short Japanese equity markets. Within fixed income, our portion of the Fund ended the period long German markets and Japanese markets. Within currencies, our portion of the Fund ended the period long the Japanese yen and short the U.S. dollar. Within commodities, our portion of the Fund ended the period long gold and short grains and energies.
Wasatch: During the period, we established positions in our portion of the Fund in premium clothing and accessories retailer Michael Kors Holdings
Investment Risks
Market risk may affect a single issuer, sector of the economy, industry or the market as a whole. Investing in derivatives is a specialized activity that involves special risks that subject the Fund to significant loss potential, including when used as leverage, and may result in greater fluctuation in fund value. Commodity investments may be affected by the overall market and industry- and commodity-specific factors, and may be more volatile and less liquid than other investments. Fixed-income securities present issuer default risk. Non-investment-grade (high-yield or junk) securities present greater price volatility and more risk to principal and income than higher rated securities. A rise in interest rates may result in a price decline of fixed-income instruments held by the Fund, negatively impacting its performance and NAV. Falling rates may result in the Fund investing in lower yielding debt instruments, lowering the Fund’s income and yield. These risks may be heightened for longer maturity and duration securities. International investing involves certain risks and volatility due to potential political, economic or currency instabilities and different financial and accounting standards. Certain issuer events, including initial public offerings, business consolidation or restructuring, may present heightened risks to securities from the high degree of uncertainty associated with such events. Short positions (where the underlying asset is not owned) can create unlimited risk. Risks are enhanced for emerging market and sovereign debt issuers. The Fund is managed by multiple advisers independently of one another, which may result in contradicting trades (i.e., with no net benefit to the fund), while increasing transaction costs. As a non-diversified fund, fewer investments could have a greater effect on performance. Market or other (e.g., interest rate) environments may adversely affect the liquidity of fund investments, negatively impacting their price. Generally, the less liquid the market at the time the Fund sells a holding, the greater the risk of loss or decline of value to the Fund. See the Fund’s prospectus for information on these and other risks.
| | | | | | |
| | |
| | | | ACTIVE PORTFOLIOS® MULTI-MANAGER ALTERNATIVES FUND | | |
MANAGER DISCUSSION OF FUND PERFORMANCE (continued)
and in information technology giant Apple. We sold our portion of the Fund’s position in real estate investment trust American Campus Communities, taking profits. We also sold our portion of the Fund’s position in Halliburton, whose shares declined after failing to gain approval for a merger with Baker Hughes.
Toward the end of the period, we reduced our portion of the Fund’s net exposure due to what we consider to be relatively full equity valuations and increased market volatility. We believe this was a prudent approach in an environment with increased risks. We also aligned sector weightings closer to the S&P 500 Index to tighten the focus on stock selection as a driver of performance.
The most significant shift in our portion of the Fund was the increase of our short exposure. Historically high stock valuations provided us with more opportunities to short what we viewed as overvalued companies. On the long side, we significantly increased our portion of the Fund’s weighting to consumer discretionary as we sought to take advantage of weakness in the sector. We reduced the energy weighting, moving to a modest underweight relative to the S&P 500 Index. Moreover, we made significant shifts within our energy exposure, selling those companies that we believe will struggle in an environment of prolonged low energy prices and either holding or buying those companies that we believe can continue to add value despite these headwinds.
Overall, as of August 31, 2016, our portion of the Fund was most significantly overweight relative to the S&P 500 Index in materials, consumer discretionary and real estate and was most underweight in health care, financials, information technology, industrials and consumer staples. Our portion of the Fund was rather neutrally weighted to the S&P 500 Index in energy and telecommunication services and had no long positions at all in utilities at the end of the period. Our portion of the Fund also had short positions in the health care, consumer discretionary, consumer staples, industrials, information technology, financials and energy sectors at the end of the period.
Water Island: During the period, we established positions in the mergers between LinkedIn and Microsoft and between The Fresh Market and Apollo Global Management. Upon successful deal closings, our portion of the Fund no longer held a position in the acquisition of TNT Express by FedEx or in the acquisition of Cablevision Systems by Altice. Any shifts in sector exposure are largely the result of the available opportunity set in terms of corporate activity and the subset of events that meet our risk/reward criteria. That said, one of the sectors that saw the most significant increase in corporate activity during the period was information technology. While there were no changes to our portion of the Fund’s credit portfolio with regard to quality emphasis, yield curve or duration positioning, it is worth noting that we focused on shorter-duration events with firmer catalysts. As always, we seek returns driven by the outcomes of specific, idiosyncratic corporate events, rather than by the overall market. Our strategy is agnostic in terms of capitalization, style, sector or country weighting.
| | | | | | |
| | |
| | | | ACTIVE PORTFOLIOS® MULTI-MANAGER ALTERNATIVES FUND | | |
MANAGER DISCUSSION OF FUND PERFORMANCE (continued)
Derivative Positions
AQR: Our portion of the Fund invests mostly via derivatives, primarily futures contracts and futures-related instruments. These include global developed and emerging market equity index futures; global developed and emerging market currency forwards; commodity futures and swaps on commodity futures; and global developed market bonds and interest rate futures as well as swaps on bond futures. Our portion of the Fund is implemented using derivative instruments because we believe derivatives offer the most liquid, low cost and efficient way to gain market exposure. The overall impact of derivatives on performance is varied and linked to the strategies within which they are implemented.
Wasatch: We did not invest in derivative instruments during the period in our portion of the Fund.
Water Island: During the period, our portion of the Fund employed total return equity swaps, equity options and currency forwards for four core purposes — to hedge currency risk, to invest outside the U.S. more efficiently, to create income and optionality, and to limit volatility and correlation. During the 12-month period ended August 31, 2016, derivatives detracted from our portion of the Fund’s performance.
| | | | | | |
| | |
| | | | ACTIVE PORTFOLIOS® MULTI-MANAGER ALTERNATIVES FUND | | |
UNDERSTANDING YOUR FUND’S EXPENSES
(Unaudited)
As an investor, you incur two types of costs. There are transaction costs, which generally include sales charges on purchases and may include redemption fees. There are also ongoing costs, which generally include management fees, distribution and/or service fees, and other fund expenses. The following information is intended to help you understand your ongoing costs (in dollars) of investing in the Fund and to help you compare these costs with the ongoing costs of investing in other mutual funds.
Analyzing Your Fund’s Expenses
To illustrate these ongoing costs, we have provided examples and calculated the expenses paid by investors of the Fund during the period. The actual and hypothetical information in the table is based on an initial investment of $1,000 at the beginning of the period indicated and held for the entire period. Expense information is calculated two ways and each method provides you with different information. The amount listed in the “Actual” column is calculated using the Fund’s actual operating expenses and total return for the period. You may use the Actual information, together with the amount invested, to estimate the expenses that you paid over the period. Simply divide your account value by $1,000 (for example, an $8,600 account value divided by $1,000 = 8.6), then multiply the results by the expenses paid during the period under the “Actual” column. The amount listed in the “Hypothetical” column assumes a 5% annual rate of return before expenses (which is not the Fund’s actual return) and then applies the Fund’s actual expense ratio for the period to the hypothetical return. You should not use the hypothetical account values and expenses to estimate either your actual account balance at the end of the period or the expenses you paid during the period. See “Compare With Other Funds” below for details on how to use the hypothetical data.
Compare With Other Funds
Since all mutual funds are required to include the same hypothetical calculations about expenses in shareholder reports, you can use this information to compare the ongoing cost of investing in the Fund with other funds. To do so, compare the hypothetical example with the 5% hypothetical examples that appear in the shareholder reports of other funds. As you compare hypothetical examples of other funds, it is important to note that hypothetical examples are meant to highlight the ongoing costs of investing in a fund only and do not reflect any transaction costs, such as sales charges, or redemption or exchange fees. Therefore, the hypothetical calculations are useful in comparing ongoing costs only, and will not help you determine the relative total costs of owning different funds. If transaction costs were included in these calculations, your costs would be higher.
March 1, 2016 – August 31, 2016
| | | | | | | | | | | | | | | | | | | | | | | | | | | | |
| | | Account Value at the
Beginning of the
Period ($) | | | Account Value at the
End of the
Period ($) | | | Expenses Paid During
the Period ($) | | | Fund’s Annualized
Expense Ratio (%) | |
| | | | Actual | | | | Hypothetical | | | | Actual | | | | Hypothetical | | | | Actual | | | | Hypothetical | | | | Actual | |
Class A | | | 1,000.00 | | | | 1,000.00 | | | | 1,024.90 | | | | 1,015.99 | | | | 9.26 | | | | 9.22 | | | | 1.82 | |
Expenses paid during the period are equal to the annualized expense ratio as indicated above, multiplied by the average account value over the period and then multiplied by the number of days in the Fund’s most recent fiscal half year and divided by 366.
Expenses do not include fees and expenses incurred indirectly by the Fund from its investment in underlying funds, including affiliated and non-affiliated pooled investment vehicles, such as mutual funds and exchange-traded funds.
Class A shares of the Fund are available only to certain eligible investors through certain wrap fee programs sponsored and/or managed by Ameriprise Financial, Inc. or its affiliates. Participants in wrap fee programs pay other fees that are not included in the above table. Please refer to the wrap program documents for information about the fees charged.
| | | | | | |
| | |
| | | | ACTIVE PORTFOLIOS® MULTI-MANAGER ALTERNATIVES FUND | | |
CONSOLIDATED PORTFOLIO OF INVESTMENTS
August 31, 2016
(Percentages represent value of investments compared to net assets)
| | | | | | | | |
| Common Stocks 43.9% | |
| Issuer | | Shares | | | Value ($) | |
CONSUMER DISCRETIONARY 8.2% | |
Automobiles 0.8% | |
| | |
General Motors Co. | | | 190,729 | | | | 6,088,070 | |
|
Hotels, Restaurants & Leisure 2.5% | |
| | |
La Quinta Holdings, Inc.(a) | | | 245,297 | | | | 2,833,181 | |
| | |
Starwood Hotels & Resorts Worldwide, Inc.(b) | | | 200,705 | | | | 15,546,609 | |
| | | | | | | | | |
Total | | | | | | | 18,379,790 | |
|
Household Durables 0.1% | |
| | |
Skullcandy, Inc.(a) | | | 163,573 | | | | 1,033,781 | |
|
Media 0.7% | |
| | |
Comcast Corp., Class A | | | 53,592 | | | | 3,497,414 | |
| | |
Nexstar Broadcasting Group, Inc., Class A(c) | | | 28,975 | | | | 1,527,562 | |
| | | | | | | | | |
Total | | | | | | | 5,024,976 | |
|
Multiline Retail 1.0% | |
| | |
Macy’s, Inc. | | | 122,863 | | | | 4,445,183 | |
| | |
Poundland Group PLC | | | 209,381 | | | | 616,572 | |
| | |
Target Corp.(b) | | | 30,240 | | | | 2,122,546 | |
| | | | | | | | | |
Total | | | | | | | 7,184,301 | |
|
Specialty Retail 2.2% | |
| | |
Cabela’s, Inc.(a) | | | 11,718 | | | | 574,065 | |
| | |
Chico’s FAS, Inc.(b) | | | 619,509 | | | | 7,855,374 | |
| | |
CST Brands, Inc. | | | 81,027 | | | | 3,873,901 | |
| | |
Outerwall, Inc. | | | 6,213 | | | | 322,827 | |
| | |
Restoration Hardware Holdings, Inc(a) | | | 126,101 | | | | 4,253,387 | |
| | | | | | | | | |
Total | | | | | | | 16,879,554 | |
|
Textiles, Apparel & Luxury Goods 0.9% | |
| | |
Michael Kors Holdings Ltd.(a) | | | 136,522 | | | | 6,682,752 | |
| | | | | | | | | |
Total Consumer Discretionary | | | | | | | 61,273,224 | |
| | |
| | | | | | | | |
CONSUMER STAPLES 3.1% | |
Beverages 1.2% | |
| | |
SABMiller PLC | | | 155,125 | | | | 8,958,827 | |
|
Food & Staples Retailing 0.9% | |
| | |
Safeway, Inc. Casa Ley CVR(a)(d) | | | 287,209 | | | | 291,488 | |
| | |
Safeway, Inc. PDC CVR(a)(d) | | | 287,209 | | | | 14,016 | |
| | |
SUPERVALU, Inc.(a) | | | 134,996 | | | | 739,778 | |
| | |
Wal-Mart Stores, Inc.(b) | | | 33,553 | | | | 2,397,026 | |
| | |
Whole Foods Market, Inc.(b) | | | 97,741 | | | | 2,969,372 | |
| | | | | | | | | |
Total | | | | | | | 6,411,680 | |
|
Food Products 0.8% | |
| | |
Nomad Foods Ltd.(a) | | | 76,961 | | | | 899,674 | |
| | | | | | | | |
| Common Stocks (continued) | |
| Issuer | | Shares | | | Value ($) | |
WhiteWave Foods Co. (The)(a)(c) | | | 98,644 | | | | 5,467,837 | |
| | | | | | | | | |
Total | | | | | | | 6,367,511 | |
|
Household Products 0.2% | |
| | |
Procter & Gamble Co. (The) | | | 13,371 | | | | 1,167,422 | |
| | | | | | | | | |
Total Consumer Staples | | | | | | | 22,905,440 | |
| | |
| | | | | | | | |
ENERGY 2.2% | |
Energy Equipment & Services 0.7% | |
| | |
Unit Corp.(a) | | | 274,478 | | | | 4,690,829 | |
|
Oil, Gas & Consumable Fuels 1.5% | |
| | |
Bill Barrett Corp.(a)(b) | | | 903,611 | | | | 5,999,977 | |
| | |
Denbury Resources, Inc. | | | 523,313 | | | | 1,611,804 | |
| | |
InterOil Corp.(a) | | | 30,703 | | | | 1,506,903 | |
| | |
Southwestern Energy Co.(a) | | | 163,389 | | | | 2,272,741 | |
| | | | | | | | | |
Total | | | | | | | 11,391,425 | |
| | | | | | | | | |
Total Energy | | | | | | | 16,082,254 | |
| | |
| | | | | | | | |
FINANCIALS 4.7% | |
Banks 2.0% | |
| | |
Citigroup, Inc.(b) | | | 156,945 | | | | 7,492,554 | |
| | |
KeyCorp | | | 179,385 | | | | 2,253,076 | |
| | |
PNC Financial Services Group, Inc. (The)(b) | | | 59,008 | | | | 5,316,621 | |
| | | | | | | | | |
Total | | | | | | | 15,062,251 | |
|
Insurance 0.8% | |
| | |
Loews Corp. | | | 136,175 | | | | 5,700,285 | |
|
Real Estate Investment Trusts (REITs) 1.5% | |
| | |
Investors Real Estate Trust | | | 370,271 | | | | 2,458,600 | |
| | |
Iron Mountain, Inc. | | | 110,179 | | | | 4,231,975 | |
| | |
Outfront Media, Inc. | | | 184,749 | | | | 4,123,598 | |
| | |
Post Properties, Inc. | | | 5,575 | | | | 369,511 | |
| | | | | | | | | |
Total | | | | | | | 11,183,684 | |
|
Thrifts & Mortgage Finance 0.4% | |
| | |
BofI Holding, Inc.(a) | | | 157,229 | | | | 3,380,423 | |
| | | | | | | | | |
Total Financials | | | | | | | 35,326,643 | |
| | |
| | | | | | | | |
HEALTH CARE 6.0% | |
Biotechnology 0.7% | |
| | |
Medivation, Inc.(a) | | | 67,622 | | | | 5,447,629 | |
| | |
Prosensa Holdings CVR(a)(d)(e) | | | 16,099 | | | | — | |
| | |
Trius Therapeutics, Inc.(a)(d) | | | 186,725 | | | | 8,944 | |
| | | | | | | | | |
Total | | | | | | | 5,456,573 | |
|
Health Care Equipment & Supplies 2.4% | |
| | |
Medtronic PLC(b) | | | 71,552 | | | | 6,227,170 | |
| | |
St. Jude Medical, Inc.(c) | | | 105,576 | | | | 8,226,482 | |
The accompanying Notes to Consolidated Financial Statements are an integral part of this statement.
| | | | | | |
| | |
| | | | ACTIVE PORTFOLIOS® MULTI-MANAGER ALTERNATIVES FUND | | |
CONSOLIDATED PORTFOLIO OF INVESTMENTS (continued)
August 31, 2016
| | | | | | | | |
| Common Stocks (continued) | |
| Issuer | | Shares | | | Value ($) | |
Stryker Corp.(b) | | | 29,015 | | | | 3,355,875 | |
| | | | | | | | | |
Total | | | | | | | 17,809,527 | |
|
Health Care Providers & Services 0.7% | |
| | |
ExamWorks Group, Inc.(a)(d) | | | 5,479 | | | | 192,039 | |
| | |
Express Scripts Holding Co.(a) | | | 71,405 | | | | 5,191,144 | |
| | | | | | | | | |
Total | | | | | | | 5,383,183 | |
|
Pharmaceuticals 2.2% | |
| | |
Johnson & Johnson(b) | | | 41,283 | | | | 4,926,713 | |
| | |
Novartis AG, ADR(b) | | | 63,626 | | | | 5,011,820 | |
| | |
Relypsa, Inc.(a)(c) | | | 67,221 | | | | 2,150,400 | |
| | |
Zoetis, Inc. | | | 85,254 | | | | 4,356,479 | |
| | | | | | | | | |
Total | | | | | | | 16,445,412 | |
| | | | | | | | | |
Total Health Care | | | | | | | 45,094,695 | |
| | |
| | | | | | | | |
INDUSTRIALS 1.4% | |
Airlines 0.9% | |
| | |
United Continental Holdings, Inc.(a) | | | 137,980 | | | | 6,955,572 | |
|
Electrical Equipment 0.4% | |
| | |
Emerson Electric Co.(b) | | | 47,845 | | | | 2,520,474 | |
|
Machinery 0.1% | |
| | |
Joy Global, Inc.(c) | | | 33,100 | | | | 902,968 | |
| | | | | | | | | |
Total Industrials | | | | | | | 10,379,014 | |
| | |
| | | | | | | | |
INFORMATION TECHNOLOGY 11.1% | |
Communications Equipment 1.0% | |
| | |
Cisco Systems, Inc.(b) | | | 126,826 | | | | 3,987,410 | |
| | |
Polycom, Inc.(a) | | | 290,630 | | | | 3,615,437 | |
| | | | | | | | | |
Total | | | | | | | 7,602,847 | |
|
Electronic Equipment, Instruments & Components 0.6% | |
| | |
Premier Farnell PLC | | | 360,487 | | | | 863,906 | |
| | |
Rofin-Sinar Technologies, Inc.(a) | | | 106,693 | | | | 3,415,243 | |
| | | | | | | | | |
Total | | | | | | | 4,279,149 | |
|
Internet Software & Services 3.2% | |
| | |
Akamai Technologies, Inc.(a)(b) | | | 103,769 | | | | 5,696,918 | |
| | |
Cvent, Inc.(a)(b) | | | 191,421 | | | | 6,255,638 | |
| | |
LinkedIn Corp., Class A(a)(b) | | | 45,844 | | | | 8,836,431 | |
| | |
Yahoo!, Inc.(a)(b) | | | 82,488 | | | | 3,526,362 | |
| | | | | | | | | |
Total | | | | | | | 24,315,349 | |
|
IT Services 0.6% | |
| | |
Accenture PLC, Class A | | | 3,276 | | | | 376,740 | |
| | |
CGI Group, Inc., Class A(a) | | | 13,534 | | | | 658,971 | |
| | |
Cognizant Technology Solutions Corp., Class A(a) | | | 6,200 | | | | 356,128 | |
| | |
Genpact Ltd.(a) | | | 9,217 | | | | 218,074 | |
| | | | | | | | |
| Common Stocks (continued) | |
| Issuer | | Shares | | | Value ($) | |
International Business Machines Corp. | | | 2,063 | | | | 327,769 | |
| | |
Leidos Holdings, Inc. | | | 67,129 | | | | 2,719,396 | |
| | | | | | | | | |
Total | | | | | | | 4,657,078 | |
|
Semiconductors & Semiconductor Equipment 0.9% | |
| | |
Intel Corp. | | | 9,808 | | | | 352,009 | |
| | |
QUALCOMM, Inc.(b) | | | 104,031 | | | | 6,561,235 | |
| | | | | | | | | |
Total | | | | | | | 6,913,244 | |
|
Software 2.7% | |
| | |
AVG Technologies NV(a) | | | 211,148 | | | | 5,249,139 | |
| | |
CA, Inc. | | | 9,525 | | | | 322,993 | |
| | |
FireEye, Inc.(a) | | | 53,704 | | | | 771,190 | |
| | |
Imperva, Inc.(a)(c) | | | 18,568 | | | | 835,746 | |
| | |
Infoblox, Inc.(a) | | | 75,127 | | | | 1,612,225 | |
| | |
NetSuite, Inc.(a)(c) | | | 17,421 | | | | 1,897,147 | |
| | |
Oracle Corp. | | | 170,578 | | | | 7,031,225 | |
| | |
Rovi Corp.(a)(c) | | | 3,200 | | | | 65,504 | |
| | |
VMware, Inc., Class A(a) | | | 30,671 | | | | 2,249,104 | |
| | | | | | | | | |
Total | | | | | | | 20,034,273 | |
|
Technology Hardware, Storage & Peripherals 2.1% | |
| | |
Apple, Inc.(b) | | | 96,736 | | | | 10,263,690 | |
| | |
Canon, Inc., ADR | | | 29,776 | | | | 852,487 | |
| | |
Electronics for Imaging, Inc.(a) | | | 19,851 | | | | 934,585 | |
| | |
Hewlett Packard Enterprise Co.(b) | | | 158,027 | | | | 3,394,420 | |
| | | | | | | | | |
Total | | | | | | | 15,445,182 | |
| | | | | | | | | |
Total Information Technology | | | | | | | 83,247,122 | |
| | |
| | | | | | | | |
MATERIALS 3.4% | |
Chemicals 2.8% | |
| | |
Agrium, Inc. | | | 18,384 | | | | 1,771,482 | |
| | |
Monsanto Co.(b) | | | 31,775 | | | | 3,384,038 | |
| | |
Mosaic Co. (The) | | | 240,167 | | | | 7,221,822 | |
| | |
Syngenta AG, ADR | | | 27,444 | | | | 2,394,489 | |
| | |
Valspar Corp. (The)(b) | | | 60,486 | | | | 6,375,829 | |
| | | | | | | | | |
Total | | | | | | | 21,147,660 | |
|
Metals & Mining 0.6% | |
| | |
Steel Dynamics, Inc. | | | 185,384 | | | | 4,564,154 | |
| | | | | | | | | |
Total Materials | | | | | | | 25,711,814 | |
| | |
| | | | | | | | |
TELECOMMUNICATION SERVICES 0.6% | |
Diversified Telecommunication Services 0.6% | |
| | |
Verizon Communications, Inc. | | | 85,585 | | | | 4,478,663 | |
| | | | | | | | | |
Total Telecommunication Services | | | | | | | 4,478,663 | |
| | |
| | | | | | | | |
The accompanying Notes to Consolidated Financial Statements are an integral part of this statement.
| | | | | | |
| | |
| | | | ACTIVE PORTFOLIOS® MULTI-MANAGER ALTERNATIVES FUND | | |
CONSOLIDATED PORTFOLIO OF INVESTMENTS (continued)
August 31, 2016
| | | | | | | | |
| Common Stocks (continued) | |
| Issuer | | Shares | | | Value ($) | |
UTILITIES 3.2% | |
Electric Utilities 2.1% | |
| | |
ITC Holdings Corp.(b) | | | 258,358 | | | | 11,682,949 | |
| | |
Westar Energy, Inc.(b) | | | 78,495 | | | | 4,312,515 | |
| | | | | | | | | |
Total | | | | | | | 15,995,464 | |
|
Gas Utilities 1.0% | |
| | |
Piedmont Natural Gas Co., Inc. | | | 119,249 | | | | 7,166,865 | |
|
Independent Power and Renewable Electricity Producers 0.1% | |
| | |
Talen Energy Corp.(a) | | | 43,658 | | | | 602,917 | |
| | | | | | | | | |
Total Utilities | | | | | | | 23,765,246 | |
| | | | | | | | | |
Total Common Stocks | | | | | | | | |
(Cost: $318,001,439) | | | | | | | 328,264,115 | |
| | | | | | | | | | | | |
| | | |
| | | | | | | | | | | | |
| Corporate Bonds & Notes 4.8% | |
| Issuer | | Coupon
Rate | | | Principal
Amount ($) | | | Value ($) | |
CABLE AND SATELLITE 0.4% | |
CSC Holdings LLC(f) | | | | | | | | | | | | |
10/15/25 | | | 10.875% | | | | 2,345,000 | | | | 2,743,650 | |
| | | |
| | | | | | | | | | | | |
CHEMICALS 0.5% | |
LSB Industries, Inc. | | | | | | | | | | | | |
08/01/19 | | | 7.750% | | | | 3,934,000 | | | | 4,052,020 | |
| | | |
| | | | | | | | | | | | |
CONSUMER PRODUCTS 0.3% | |
Sun Products Corp. (The)(f) | |
03/15/21 | | | 7.750% | | | | 2,461,000 | | | | 2,556,364 | |
| | | |
| | | | | | | | | | | | |
ELECTRIC 1.2% | |
Energy Future Intermediate Holding Co. LLC/Finance, Inc.(f)(g) | |
12/01/18 | | | 0.000% | | | | 2,418,000 | | | | 2,436,135 | |
03/01/22 | | | 0.000% | | | | 5,629,358 | | | | 6,860,781 | |
| | | | | | | | | | | | | |
Total | | | | | | | | | | | 9,296,916 | |
| | | |
| | | | | | | | | | | | |
MEDIA AND ENTERTAINMENT 0.4% | |
DreamWorks Animation LLC(f) | |
08/15/20 | | | 6.875% | | | | 1,396,000 | | | | 1,471,035 | |
| | | |
LIN Television Corp. | | | | | | | | | | | | |
01/15/21 | | | 6.375% | | | | 1,333,000 | | | | 1,392,985 | |
| | | | | | | | | | | | | |
Total | | | | | | | | | | | 2,864,020 | |
| | | |
| | | | | | | | | | | | |
METALS 0.4% | |
Thompson Creek Metals Co, Inc. | |
06/01/18 | | | 7.375% | | | | 805,000 | | | | 780,850 | |
05/01/19 | | | 12.500% | | | | 1,751,000 | | | | 1,812,285 | |
| | | | | | | | | | | | | |
Total | | | | | | | | | | | 2,593,135 | |
| | | | | | | | | | | | |
| Corporate Bonds & Notes (continued) | |
| Issuer | | Coupon
Rate | | | Principal
Amount ($) | | | Value ($) | |
PROPERTY & CASUALTY 0.6% | |
Ambac Assurance Corp. Subordinated(f) | | | | | | | | | | | | |
06/07/20 | | | 5.100% | | | | 3,966,636 | | | | 4,571,547 | |
| | | |
| | | | | | | | | | | | |
WIRELESS 0.6% | |
Sprint Communications, Inc. | | | | | | | | | | | | |
12/01/16 | | | 6.000% | | | | 3,323,000 | | | | 3,356,230 | |
03/01/17 | | | 9.125% | | | | 844,000 | | | | 868,265 | |
| | | | | | | | | | | | | |
Total | | | | | | | | | | | 4,224,495 | |
| | | |
| | | | | | | | | | | | |
WIRELINES 0.4% | |
Frontier Communications Corp. | |
09/15/25 | | | 11.000% | | | | 2,897,000 | | | | 3,128,760 | |
| | | | | | | | | | | | | |
Total Corporate Bonds & Notes | | | | | |
(Cost: $34,528,505) | | | | | | | | 36,030,907 | |
| | | |
| | | | | | | | | | | | |
| Convertible Bonds 0.5% | |
TECHNOLOGY 0.5% | |
TiVo, Inc. | | | | | | | | | | | | |
10/01/21 | | | 2.000% | | | | 3,826,000 | | | | 3,826,956 | |
| | | | | | | | | | | | | |
Total Convertible Bonds | | | | | |
(Cost: $3,772,091) | | | | | | | | 3,826,956 | |
| | | | | | | | |
| | |
| | | | | | | | |
| Exchange-Traded Funds 0.4% | |
| | | Shares | | | Value ($) | |
Consumer Staples Select Sector SPDR Fund | | | 15,191 | | | | 826,694 | |
| | |
Industrial Select Sector SPDR Fund | | | 6,653 | | | | 389,799 | |
| | |
SPDR S&P Homebuilders ETF | | | 35,117 | | | | 1,269,129 | |
| | | | | | | | | |
Total Exchange-Traded Funds | | | | | | | | |
(Cost: $2,425,172) | | | | | | | 2,485,622 | |
| | | | | | | | | | | | |
| | | |
| | | | | | | | | | | | |
| Treasury Bills 11.0% | |
| Issuer | | Effective
Yield | | | Principal
Amount ($) | | | Value ($) | |
UNITED STATES 11.0% | |
U.S. Treasury Bills | |
09/01/16 | | | 0.220% | | | | 186,000 | | | | 185,999 | |
09/29/16 | | | 0.230% | | | | 733,000 | | | | 732,864 | |
10/06/16 | | | 0.220% | | | | 771,000 | | | | 770,833 | |
10/13/16 | | | 0.260% | | | | 1,026,000 | | | | 1,025,688 | |
12/01/16 | | | 0.330% | | | | 1,728,000 | | | | 1,726,567 | |
12/22/16 | | | 0.330% | | | | 2,058,000 | | | | 2,055,917 | |
01/05/17 | | | 0.350% | | | | 1,519,000 | | | | 1,517,144 | |
01/26/17 | | | 0.410% | | | | 50,317,000 | | | | 50,233,172 | |
02/02/17 | | | 0.440% | | | | 10,464,000 | | | | 10,444,631 | |
02/09/17 | | | 0.440% | | | | 9,088,000 | | | | 9,070,215 | |
The accompanying Notes to Consolidated Financial Statements are an integral part of this statement.
| | | | | | |
| | |
| | | | ACTIVE PORTFOLIOS® MULTI-MANAGER ALTERNATIVES FUND | | |
CONSOLIDATED PORTFOLIO OF INVESTMENTS (continued)
August 31, 2016
| | | | | | | | | | | | |
| Treasury Bills (continued) | |
| Issuer | | Effective
Yield | | | Principal
Amount ($) | | | Value ($) | |
02/16/17 | | | 0.450% | | | | 4,659,000 | | | | 4,649,407 | |
| | | | | | | | | | | | | |
Total | | | | | | | | | | | 82,412,437 | |
| | | | | | | | | | | | | |
Total Treasury Bills | | | | | |
(Cost: $82,409,126) | | | | | | | | 82,412,437 | |
| | | | | | | | | | | | | | | | |
| | | | |
| | | | | | | | | | | | | | | | |
| Options Purchased Calls —% | | | | | |
| Issuer | | Notional ($)/
Contracts | | | Exercise
Price | | | Expiration
Date | | | Value ($) | |
Great Plains Energy, Inc. | |
| | | 36 | | | | 30.00 | | | | 09/16/16 | | | | 180 | |
|
Great Plains Energy, Inc. | |
| | | 62 | | | | 30.00 | | | | 09/16/16 | | | | 310 | |
|
Great Plains Energy, Inc. | |
| | | 34 | | | | 30.00 | | | | 12/16/16 | | | | 935 | |
|
Great Plains Energy, Inc. | |
| | | 48 | | | | 30.00 | | | | 12/16/16 | | | | 1,320 | |
|
LinkedIn Corp., Class A | |
| | | 23 | | | | 200.00 | | | | 09/16/16 | | | | 115 | |
|
LinkedIn Corp., Class A | |
| | | 41 | | | | 200.00 | | | | 09/16/16 | | | | 205 | |
|
Molson Coors Brewing Co., Class B | |
| | | 34 | | | | 97.50 | | | | 10/21/16 | | | | 24,650 | |
|
Molson Coors Brewing Co., Class B | |
| | | 111 | | | | 97.50 | | | | 10/21/16 | | | | 80,475 | |
|
Symantec Corp. | |
| | | 335 | | | | 25.00 | | | | 09/16/16 | | | | 5,025 | |
|
Symantec Corp. | |
| | | 334 | | | | 26.00 | | | | 09/16/16 | | | | 2,338 | |
|
T-Mobile USA, Inc. | |
| | | 142 | | | | 48.00 | | | | 09/16/16 | | | | 4,260 | |
|
T-Mobile USA, Inc. | |
| | | 487 | | | | 48.00 | | | | 11/18/16 | | | | 74,267 | |
| | | | | | | | | | | | | | | | | |
Total Options Purchased Calls | | | | | |
(Cost: $222,079) | | | | | | | | | | | | 194,080 | |
| | | | |
| | | | | | | | | | | | | | | | |
| Options Purchased Puts —% | |
Cvent, Inc. | | | | | | | | | | | | | | | | |
| | | 9 | | | | 30.00 | | | | 10/21/16 | | | | 878 | |
|
LinkedIn Corp., Class A | |
| | | 58 | | | | 160.00 | | | | 11/18/16 | | | | 2,030 | |
|
Marketo, Inc(d)(e) | |
| | | 2 | | | | 25.00 | | | | 09/16/16 | | | | — | |
|
Rofin-Sinar Technologies, Inc. | |
| | | 86 | | | | 25.00 | | | | 09/16/16 | | | | 7,525 | |
|
Rofin-Sinar Technologies, Inc. | |
| | | 135 | | | | 30.00 | | | | 09/16/16 | | | | 1,013 | |
Rovi Corp. | |
| | | 127 | | | | 15.00 | | | | 10/21/16 | | | | 6,033 | |
| | | | | | | | | | | | | | | | |
| Options Purchased Puts (continued) | |
| Issuer | | Notional ($)/
Contracts | | | Exercise
Price | | | Expiration
Date | | | Value ($) | |
St. Jude Medical, Inc. | |
| | | 85 | | | | 70.00 | | | | 10/21/16 | | | | 12,112 | |
|
St. Jude Medical, Inc. | |
| | | 38 | | | | 70.00 | | | | 10/21/16 | | | | 5,415 | |
|
St. Jude Medical, Inc. | |
| | | 9 | | | | 70.00 | | | | 12/16/16 | | | | 2,475 | |
|
Westar Energy, Inc. | |
| | | 113 | | | | 50.00 | | | | 12/16/16 | | | | 9,887 | |
|
Westar Energy, Inc. | |
| | | 22 | | | | 50.00 | | | | 12/16/16 | | | | 1,925 | |
| | | | | | | | | | | | | | | | | |
Total Options Purchased Puts | | | | | |
(Cost: $75,204) | | | | | | | | | | | | 49,293 | |
| | | | | | | | |
| | |
| | | | | | | | |
| Money Market Funds 34.6% | |
| | | Shares | | | Value ($) | |
| | |
Columbia Short-Term Cash Fund, 0.415%(i)(j)(k) | | | 255,529,165 | | | | 255,529,165 | |
| | |
JPMorgan Prime Money Market Fund, Capital Shares, 0.390%(b)(i) | | | 2,803,274 | | | | 2,803,274 | |
| | | | | | | | | |
Total Money Market Funds | | | | | | | | |
(Cost: $258,332,439) | | | | | | | 258,332,439 | |
| | | | | | | | | |
Total Investments | | | | | | | | |
(Cost: $699,766,055) | | | | | | | 711,595,849 | |
| | |
| | | | | | | | |
| Investments Sold Short (19.6)% | |
| Common Stocks (18.8)% | |
| Issuer | | Shares | | | Value ($) | |
CONSUMER DISCRETIONARY (4.8)% | |
Automobiles (0.3)% | |
| | |
Tesla Motors, Inc.(a) | | | (9,747 | ) | | | (2,066,461 | ) |
|
Hotels, Restaurants & Leisure (1.5)% | |
| | |
Marriott International, Inc., Class A | | | (160,890 | ) | | | (11,476,284 | ) |
|
Household Durables (0.5)% | |
| | |
Newell Rubbermaid, Inc. | | | (64,284 | ) | | | (3,412,195 | ) |
|
Media (0.7)% | |
| | |
Cable One, Inc. | | | (2,851 | ) | | | (1,542,733 | ) |
| | |
Charter Communications, Inc., Class A(a) | | | (11,729 | ) | | | (3,016,816 | ) |
| | |
Gray Television, Inc.(a) | | | (26,433 | ) | | | (296,843 | ) |
| | |
Sinclair Broadcast Group, Inc., Class A | | | (12,556 | ) | | | (357,595 | ) |
| | |
Tegna, Inc. | | | (15,712 | ) | | | (318,325 | ) |
| | | | | | | | | |
Total | | | | | | | (5,532,312 | ) |
The accompanying Notes to Consolidated Financial Statements are an integral part of this statement.
| | | | | | |
| | |
| | | | ACTIVE PORTFOLIOS® MULTI-MANAGER ALTERNATIVES FUND | | |
CONSOLIDATED PORTFOLIO OF INVESTMENTS (continued)
August 31, 2016
| | | | | | | | |
| Investments Sold Short (continued) | |
| Common Stocks (continued) | |
| Issuer | | Shares | | | Value ($) | |
Multiline Retail (0.2)% | |
| | |
JCPenney Co., Inc.(a) | | | (135,380 | ) | | | (1,276,633 | ) |
|
Specialty Retail (1.1)% | |
| | |
Tractor Supply Co. | | | (33,857 | ) | | | (2,842,295 | ) |
| | |
Ulta Salon Cosmetics & Fragrance, Inc.(a) | | | (22,341 | ) | | | (5,522,919 | ) |
| | | | | | | | | |
Total | | | | | | | (8,365,214 | ) |
|
Textiles, Apparel & Luxury Goods (0.5)% | |
| | |
Coach, Inc. | | | (87,577 | ) | | | (3,343,690 | ) |
| | | | | | | | | |
Total Consumer Discretionary | | | | | | | (35,472,789 | ) |
| | |
| | | | | | | | |
CONSUMER STAPLES (2.6)% | |
Beverages (0.2)% | |
| | |
Molson Coors Brewing Co., Class B | | | (14,525 | ) | | | (1,486,198 | ) |
|
Food & Staples Retailing (1.3)% | |
| | |
Kroger Co. | | | (62,271 | ) | | | (1,992,049 | ) |
| | |
SpartanNash Co. | | | (5,245 | ) | | | (167,945 | ) |
| | |
Sprouts Farmers Market, Inc.(a) | | | (77,390 | ) | | | (1,743,597 | ) |
| | |
SYSCO Corp. | | | (113,268 | ) | | | (5,874,078 | ) |
| | |
United Natural Foods, Inc.(a) | | | (3,301 | ) | | | (150,526 | ) |
| | | | | | | | | |
Total | | | | | | | (9,928,195 | ) |
|
Food Products (0.4)% | |
| | |
Blue Buffalo Pet Products, Inc.(a) | | | (111,832 | ) | | | (2,883,029 | ) |
|
Personal Products (0.7)% | |
| | |
Estee Lauder Companies, Inc. (The), Class A | | | (60,913 | ) | | | (5,435,267 | ) |
| | | | | | | | | |
Total Consumer Staples | | | | | | | (19,732,689 | ) |
| | |
| | | | | | | | |
ENERGY (0.5)% | |
Energy Equipment & Services (0.5)% | |
| | |
Helmerich & Payne | | | (66,514 | ) | | | (4,021,437 | ) |
| | | | | | | | | |
Total Energy | | | | | | | (4,021,437 | ) |
| | |
| | | | | | | | |
FINANCIALS (1.1)% | |
Insurance (0.7)% | |
| | |
First American Financial | | | (128,306 | ) | | | (5,528,705 | ) |
|
Real Estate Investment Trusts (REITs) (0.4)% | |
| | |
American Tower Corp. | | | (21,196 | ) | | | (2,403,203 | ) |
| | |
Mid-America Apartment Communities, Inc. | | | (3,967 | ) | | | (372,858 | ) |
| | | | | | | | | |
Total | | | | | | | (2,776,061 | ) |
| | | | | | | | | |
Total Financials | | | | | | | (8,304,766 | ) |
| | |
| | | | | | | | |
HEALTH CARE (3.2)% | |
Health Care Equipment & Supplies (2.1)% | |
| | |
Abbott Laboratories | | | (91,142 | ) | | | (3,829,787 | ) |
| | | | | | | | |
| Investments Sold Short (continued) | |
| Common Stocks (continued) | |
| Issuer | | Shares | | | Value ($) | |
Inogen, Inc.(a) | | | (99,762 | ) | | | (5,788,191 | ) |
| | |
Zeltiq Aesthetics, Inc.(a) | | | (170,027 | ) | | | (6,481,429 | ) |
| | | | | | | | | |
Total | | | | | | | (16,099,407 | ) |
|
Health Care Providers & Services (0.2)% | |
| | |
Aetna, Inc. | | | (13,470 | ) | | | (1,577,606 | ) |
|
Health Care Technology (0.5)% | |
| | |
Veeva Systems Inc., Class A(a) | | | (92,806 | ) | | | (3,797,622 | ) |
|
Pharmaceuticals (0.4)% | |
| | |
Prestige Brands Holdings, Inc.(a) | | | (55,711 | ) | | | (2,681,371 | ) |
| | | | | | | | | |
Total Health Care | | | | | | | (24,156,006 | ) |
| | |
| | | | | | | | |
INDUSTRIALS (1.7)% | |
Airlines (0.3)% | |
| | |
Alaska Air Group, Inc. | | | (33,573 | ) | | | (2,267,185 | ) |
|
Building Products (0.2)% | |
| | |
Armstrong World Industries, Inc.(a) | | | (30,359 | ) | | | (1,319,706 | ) |
|
Commercial Services & Supplies (0.4)% | |
| | |
Healthcare Services Group, Inc. | | | (74,299 | ) | | | (2,999,450 | ) |
|
Machinery (0.8)% | |
| | |
Caterpillar, Inc. | | | (69,009 | ) | | | (5,655,287 | ) |
| | |
Manitowoc Foodservice, Inc.(a) | | | (26,751 | ) | | | (431,494 | ) |
| | | | | | | | | |
Total | | | | | | | (6,086,781 | ) |
| | | | | | | | | |
Total Industrials | | | | | | | (12,673,122 | ) |
| | |
| | | | | | | | |
INFORMATION TECHNOLOGY (3.3)% | |
Communications Equipment (0.1)% | |
| | |
Cisco Systems, Inc. | | | (24,968 | ) | | | (784,994 | ) |
|
Electronic Equipment, Instruments & Components (0.3)% | |
| | |
Cognex Corp. | | | (45,851 | ) | | | (2,281,546 | ) |
|
Internet Software & Services (0.7)% | |
| | |
Alibaba Group Holding Ltd., ADR(a) | | | (33,366 | ) | | | (3,242,842 | ) |
| | |
inContact, Inc.(a) | | | (16,134 | ) | | | (224,101 | ) |
| | |
LogMeIn, Inc. | | | (20,240 | ) | | | (1,690,040 | ) |
| | | | | | | | | |
Total | | | | | | | (5,156,983 | ) |
|
IT Services (1.0)% | |
| | |
Computer Sciences Corp. | | | (43,622 | ) | | | (2,051,979 | ) |
| | |
International Business Machines Corp. | | | (4,788 | ) | | | (760,717 | ) |
| | |
Leidos Holdings, Inc. | | | (67,129 | ) | | | (2,719,396 | ) |
| | |
Xerox Corp. | | | (177,237 | ) | | | (1,745,784 | ) |
| | | | | | | | | |
Total | | | | | | | (7,277,876 | ) |
|
Semiconductors & Semiconductor Equipment (0.1)% | |
| | |
Intel Corp. | | | (22,888 | ) | | | (821,450 | ) |
|
Software (1.1)% | |
| | |
Electronic Arts, Inc.(a) | | | (26,827 | ) | | | (2,179,157 | ) |
The accompanying Notes to Consolidated Financial Statements are an integral part of this statement.
| | | | | | |
| | |
| | | | ACTIVE PORTFOLIOS® MULTI-MANAGER ALTERNATIVES FUND | | |
CONSOLIDATED PORTFOLIO OF INVESTMENTS (continued)
August 31, 2016
| | | | | | | | |
| Investments Sold Short (continued) | |
| Common Stocks (continued) | |
| Issuer | | Shares | | | Value ($) | |
Paycom Software, Inc.(a) | | | (69,608 | ) | | | (3,573,675 | ) |
| | |
Symantec Corp. | | | (108,877 | ) | | | (2,627,202 | ) |
| | | | | | | | | |
Total | | | | | | | (8,380,034 | ) |
| | | | | | | | | |
Total Information Technology | | | | | | | (24,702,883 | ) |
| | |
| | | | | | | | |
MATERIALS (0.3)% | |
Chemicals (0.3)% | |
| | |
Potash Corp. of Saskatchewan, Inc. | | | (110,304 | ) | | | (1,996,502 | ) |
| | | | | | | | | |
Total Materials | | | | | | | (1,996,502 | ) |
| | |
| | | | | | | | |
TELECOMMUNICATION SERVICES (0.4)% | |
Diversified Telecommunication Services —% | |
| | |
Frontier Communications Corp. | | | (25,067 | ) | | | (115,308 | ) |
|
Wireless Telecommunication Services (0.4)% | |
| | |
T-Mobile USA, Inc.(a) | | | (63,403 | ) | | | (2,938,095 | ) |
| | | | | | | | | |
Total Telecommunication Services | | | | | | | (3,053,403 | ) |
| | |
| | | | | | | | |
UTILITIES (0.9)% | |
Electric Utilities (0.9)% | |
| | |
Fortis, Inc. | | | (194,176 | ) | | | (6,107,793 | ) |
| | |
Great Plains Energy, Inc. | | | (13,565 | ) | | | (368,426 | ) |
| | | | | | | | | |
Total | | | | | | | (6,476,219 | ) |
| | | | | | | | | |
Total Utilities | | | | | | | (6,476,219 | ) |
| | | | | | | | | |
Total Common Stocks | | | | | | | | |
(Proceeds: $128,780,593) | | | | | | | (140,589,816 | ) |
| | | | | | | | | | | | |
| Investments Sold Short (continued) | | | | | |
| Corporate Bonds & Notes (0.6)% | |
| Issuer | | Coupon
Rate | | | Principal
Amount ($) | | | Value ($) | |
CABLE AND SATELLITE (0.3)% | |
CSC Holdings LLC | |
06/01/24 | | | 5.250% | | | | (2,574,000 | ) | | | (2,504,811 | ) |
| | | |
| | | | | | | | | | | | |
OIL FIELD SERVICES (0.1)% | |
National Oilwell Varco, Inc. | |
12/01/22 | | | 2.600% | | | | (565,000 | ) | | | (531,998 | ) |
| | | |
| | | | | | | | | | | | |
TECHNOLOGY (0.1)% | |
Diamond 1 Finance Corp./Diamond 2 Finance Corp.(f) | |
06/15/23 | | | 5.450% | | | | (351,000 | ) | | | (374,229 | ) |
| | | |
| | | | | | | | | | | | |
WIRELINES (0.1)% | |
CenturyLink, Inc. | | | | | | | | | | | | |
04/01/25 | | | 5.625% | | | | (922,000 | ) | | | (898,950 | ) |
| | | | | | | | | | | | | |
Total Corporate Bonds & Notes | |
(Proceeds: $3,987,954) | | | | | | | | | | | (4,309,988 | ) |
| | | | | | | | |
| | |
| | | | | | | | |
| Exchange-Traded Funds (0.2)% | |
| Issuer | | Shares | | | Value ($) | |
Consumer Staples Select Sector SPDR Fund | | | (31,446 | ) | | | (1,711,291 | ) |
| | |
SPDR S&P Retail ETF | | | (2,029 | ) | | | (90,230 | ) |
| | | | | | | | | |
Total Exchange-Traded Funds | |
(Proceeds: $1,734,162) | | | | | | | (1,801,521 | ) |
| | | | | | | | | |
Total Investments Sold Short | |
(Proceeds: $134,502,709) | | | | | | | (146,701,325 | ) |
| | | | | | | | | |
Total Investments, Net of Investments Sold Short | | | | 564,894,524 | |
| | | | | | | | | |
Other Assets & Liabilities, Net | | | | 182,581,701 | |
| | | | | | | | | |
Net Assets | | | | 747,476,225 | |
| | | | | | | | | |
At August 31, 2016, securities and cash totaling $299,557,392 were pledged as collateral.
Investments in Derivatives
Forward Foreign Currency Exchange Contracts Open at August 31, 2016
| | | | | | | | | | | | | | | | | | | | | | | | | | | | |
| Counterparty | | Exchange
Date | | | Currency to
be Delivered | | | Currency to
be Received | | | Unrealized
Appreciation ($) | | | Unrealized
Depreciation ($) | |
Citi | | | 09/21/2016 | | | | 10,285,000 | | | | AUD | | | | 7,879,859 | | | | USD | | | | 154,010 | | | | — | |
| | | | | | | |
Citi | | | 09/21/2016 | | | | 76,929,000 | | | | AUD | | | | 55,408,968 | | | | USD | | | | — | | | | (2,378,279 | ) |
| | | | | | | |
Citi | | | 09/21/2016 | | | | 378,000 | | | | BRL | | | | 118,661 | | | | USD | | | | 2,264 | | | | — | |
| | | | | | | |
Citi | | | 09/21/2016 | | | | 7,540,868 | | | | BRL | | | | 2,289,854 | | | | USD | | | | — | | | | (32,194 | ) |
| | | | | | | |
Citi | | | 09/21/2016 | | | | 46,575,002 | | | | CAD | | | | 35,777,108 | | | | USD | | | | 257,853 | | | | — | |
| | | | | | | |
Citi | | | 09/21/2016 | | | | 12,064,000 | | | | CAD | | | | 9,153,595 | | | | USD | | | | — | | | | (46,711 | ) |
| | | | | | | |
Citi | | | 09/21/2016 | | | | 317,534 | | | | CHF | | | | 328,601 | | | | USD | | | | 5,365 | | | | — | |
| | | | | | | |
Citi | | | 09/21/2016 | | | | 211,293 | | | | CHF | | | | 214,615 | | | | USD | | | | — | | | | (473 | ) |
| | | | | | | |
Citi | | | 09/21/2016 | | | | 2,099,465,000 | | | | CLP | | | | 3,112,833 | | | | USD | | | | 33,489 | | | | — | |
The accompanying Notes to Consolidated Financial Statements are an integral part of this statement.
| | | | | | |
| | |
| | | | ACTIVE PORTFOLIOS® MULTI-MANAGER ALTERNATIVES FUND | | |
CONSOLIDATED PORTFOLIO OF INVESTMENTS (continued)
August 31, 2016
Forward Foreign Currency Exchange Contracts Open at August 31, 2016 (continued)
| | | | | | | | | | | | | | | | | | | | | | | | | | | | |
| Counterparty | | Exchange
Date | | | Currency to
be Delivered | | | Currency to
be Received | | | Unrealized
Appreciation ($) | | | Unrealized
Depreciation ($) | |
Citi | | | 09/21/2016 | | | | 969,247,000 | | | | CLP | | | | 1,387,068 | | | | USD | | | | — | | | | (34,554 | ) |
| | | | | | | |
Citi | | | 09/21/2016 | | | | 1,511,765,592 | | | | COP | | | | 512,282 | | | | USD | | | | 5,603 | | | | — | |
| | | | | | | |
Citi | | | 09/21/2016 | | | | 3,584,031,000 | | | | COP | | | | 1,151,868 | | | | USD | | | | — | | | | (49,345 | ) |
| | | | | | | |
Citi | | | 09/21/2016 | | | | 68,830,000 | | | | EUR | | | | 77,806,542 | | | | USD | | | | 964,277 | | | | — | |
| | | | | | | |
Citi | | | 09/21/2016 | | | | 25,804,000 | | | | EUR | | | | 28,603,501 | | | | USD | | | | — | | | | (204,254 | ) |
| | | | | | | |
Citi | | | 09/21/2016 | | | | 21,902,000 | | | | GBP | | | | 30,548,032 | | | | USD | | | | 1,773,289 | | | | — | |
| | | | | | | |
Citi | | | 09/21/2016 | | | | 4,068,000 | | | | GBP | | | | 5,306,291 | | | | USD | | | | — | | | | (38,228 | ) |
| | | | | | | |
Citi | | | 09/21/2016 | | | | 1,159,142 | | | | HKD | | | | 149,522 | | | | USD | | | | 70 | | | | — | |
| | | | | | | |
Citi | | | 09/21/2016 | | | | 331,858 | | | | HKD | | | | 42,769 | | | | USD | | | | — | | | | (19 | ) |
| | | | | | | |
Citi | | | 09/21/2016 | | | | 488,995,233 | | | | HUF | | | | 1,769,081 | | | | USD | | | | 7,481 | | | | — | |
| | | | | | | |
Citi | | | 09/21/2016 | | | | 1,490,221,000 | | | | HUF | | | | 5,277,541 | | | | USD | | | | — | | | | (90,964 | ) |
| | | | | | | |
Citi | | | 09/21/2016 | | | | 31,664,444,147 | | | | IDR | | | | 2,379,701 | | | | USD | | | | 1,986 | | | | — | |
| | | | | | | |
Citi | | | 09/21/2016 | | | | 11,354,888,000 | | | | IDR | | | | 817,423 | | | | USD | | | | — | | | | (35,227 | ) |
| | | | | | | |
Citi | | | 09/21/2016 | | | | 12,894,000 | | | | ILS | | | | 3,341,353 | | | | USD | | | | — | | | | (73,527 | ) |
| | | | | | | |
Citi | | | 09/21/2016 | | | | 283,852,638 | | | | INR | | | | 4,169,770 | | | | USD | | | | — | | | | (55,969 | ) |
| | | | | | | |
Citi | | | 09/21/2016 | | | | 2,933,183,496 | | | | JPY | | | | 28,744,821 | | | | USD | | | | 369,864 | | | | — | |
| | | | | | | |
Citi | | | 09/21/2016 | | | | 3,539,934,000 | | | | JPY | | | | 33,502,774 | | | | USD | | | | — | | | | (741,752 | ) |
| | | | | | | |
Citi | | | 09/21/2016 | | | | 3,185,459,000 | | | | KRW | | | | 2,875,960 | | | | USD | | | | 20,830 | | | | — | |
| | | | | | | |
Citi | | | 09/21/2016 | | | | 26,212,465,725 | | | | KRW | | | | 22,359,167 | | | | USD | | | | — | | | | (1,135,093 | ) |
| | | | | | | |
Citi | | | 09/21/2016 | | | | 265,023,000 | | | | MXN | | | | 14,148,016 | | | | USD | | | | 81,774 | | | | — | |
| | | | | | | |
Citi | | | 09/21/2016 | | | | 76,371,000 | | | | MXN | | | | 4,025,946 | | | | USD | | | | — | | | | (27,487 | ) |
| | | | | | | |
Citi | | | 09/21/2016 | | | | 12,965,000 | | | | MYR | | | | 3,202,456 | | | | USD | | | | 26,561 | | | | — | |
| | | | | | | |
Citi | | | 09/21/2016 | | | | 9,598,000 | | | | MYR | | | | 2,326,995 | | | | USD | | | | — | | | | (24,123 | ) |
| | | | | | | |
Citi | | | 09/21/2016 | | | | 32,056,486 | | | | NOK | | | | 3,859,556 | | | | USD | | | | 12,353 | | | | — | |
| | | | | | | |
Citi | | | 09/21/2016 | | | | 133,443,514 | | | | NOK | | | | 15,777,421 | | | | USD | | | | — | | | | (237,567 | ) |
| | | | | | | |
Citi | | | 09/21/2016 | | | | 262,000 | | | | NZD | | | | 190,704 | | | | USD | | | | 753 | | | | — | |
| | | | | | | |
Citi | | | 09/21/2016 | | | | 36,675,179 | | | | NZD | | | | 26,226,977 | | | | USD | | | | — | | | | (362,704 | ) |
| | | | | | | |
Citi | | | 09/21/2016 | | | | 102,957,336 | | | | PHP | | | | 2,215,268 | | | | USD | | | | 7,745 | | | | — | |
| | | | | | | |
Citi | | | 09/21/2016 | | | | 146,337,000 | | | | PHP | | | | 3,101,171 | | | | USD | | | | — | | | | (36,461 | ) |
| | | | | | | |
Citi | | | 09/21/2016 | | | | 9,336,917 | | | | PLN | | | | 2,404,270 | | | | USD | | | | 16,293 | | | | — | |
| | | | | | | |
Citi | | | 09/21/2016 | | | | 60,054,000 | | | | PLN | | | | 15,145,347 | | | | USD | | | | — | | | | (213,846 | ) |
| | | | | | | |
Citi | | | 09/21/2016 | | | | 192,044,000 | | | | SEK | | | | 22,951,115 | | | | USD | | | | 495,897 | | | | — | |
| | | | | | | |
Citi | | | 09/21/2016 | | | | 25,963,000 | | | | SEK | | | | 3,016,119 | | | | USD | | | | — | | | | (19,669 | ) |
| | | | | | | |
Citi | | | 09/21/2016 | | | | 4,022,256 | | | | SGD | | | | 2,965,107 | | | | USD | | | | 13,021 | | | | — | |
| | | | | | | |
Citi | | | 09/21/2016 | | | | 2,879,000 | | | | SGD | | | | 2,090,216 | | | | USD | | | | — | | | | (22,790 | ) |
| | | | | | | |
Citi | | | 09/21/2016 | | | | 3,911,172 | | | | TRY | | | | 1,316,888 | | | | USD | | | | 108 | | | | — | |
| | | | | | | |
Citi | | | 09/21/2016 | | | | 33,795,000 | | | | TRY | | | | 10,997,191 | | | | USD | | | | — | | | | (380,618 | ) |
| | | | | | | |
Citi | | | 09/21/2016 | | | | 51,452,000 | | | | TWD | | | | 1,625,906 | | | | USD | | | | 2,900 | | | | — | |
| | | | | | | |
Citi | | | 09/21/2016 | | | | 114,202,000 | | | | TWD | | | | 3,513,724 | | | | USD | | | | — | | | | (88,673 | ) |
| | | | | | | |
Citi | | | 09/21/2016 | | | | 37,770,546 | | | | USD | | | | 51,116,000 | | | | AUD | | | | 626,586 | | | | — | |
| | | | | | | |
Citi | | | 09/21/2016 | | | | 27,283,903 | | | | USD | | | | 35,727,056 | | | | AUD | | | | — | | | | (446,583 | ) |
| | | | | | | |
Citi | | | 09/21/2016 | | | | 5,768,495 | | | | USD | | | | 20,615,000 | | | | BRL | | | | 579,452 | | | | — | |
| | | | | | | |
Citi | | | 09/21/2016 | | | | 1,794,082 | | | | USD | | | | 2,359,000 | | | | CAD | | | | 4,950 | | | | — | |
The accompanying Notes to Consolidated Financial Statements are an integral part of this statement.
| | | | | | |
| | |
| | | | ACTIVE PORTFOLIOS® MULTI-MANAGER ALTERNATIVES FUND | | |
CONSOLIDATED PORTFOLIO OF INVESTMENTS (continued)
August 31, 2016
Forward Foreign Currency Exchange Contracts Open at August 31, 2016 (continued)
| | | | | | | | | | | | | | | | | | | | | | | | | | | | |
| Counterparty | | Exchange
Date | | | Currency to
be Delivered | | | Currency to
be Received | | | Unrealized
Appreciation ($) | | | Unrealized
Depreciation ($) | |
Citi | | | 09/21/2016 | | | | 49,381,033 | | | | USD | | | | 63,591,000 | | | | CAD | | | | — | | | | (884,954 | ) |
| | | | | | | |
Citi | | | 09/21/2016 | | | | 568,513 | | | | USD | | | | 552,000 | | | | CHF | | | | — | | | | (6,600 | ) |
| | | | | | | |
Citi | | | 09/21/2016 | | | | 848,328 | | | | USD | | | | 580,497,000 | | | | CLP | | | | 3,103 | | | | — | |
| | | | | | | |
Citi | | | 09/21/2016 | | | | 3,764,369 | | | | USD | | | | 2,488,215,000 | | | | CLP | | | | — | | | | (114,834 | ) |
| | | | | | | |
Citi | | | 09/21/2016 | | | | 751,159 | | | | USD | | | | 2,253,660,000 | | | | COP | | | | 4,171 | | | | — | |
| | | | | | | |
Citi | | | 09/21/2016 | | | | 2,180,952 | | | | USD | | | | 6,390,733,000 | | | | COP | | | | — | | | | (39,053 | ) |
| | | | | | | |
Citi | | | 09/21/2016 | | | | 15,337,746 | | | | USD | | | | 13,870,000 | | | | EUR | | | | 146,813 | | | | — | |
| | | | | | | |
Citi | | | 09/21/2016 | | | | 63,622,141 | | | | USD | | | | 56,712,275 | | | | EUR | | | | — | | | | (308,184 | ) |
| | | | | | | |
Citi | | | 09/21/2016 | | | | 21,214,139 | | | | USD | | | | 16,235,000 | | | | GBP | | | | 115,328 | | | | — | |
| | | | | | | |
Citi | | | 09/21/2016 | | | | 13,849,824 | | | | USD | | | | 9,735,000 | | | | GBP | | | | — | | | | (1,060,027 | ) |
| | | | | | | |
Citi | | | 09/21/2016 | | | | 9,159 | | | | USD | | | | 71,000 | | | | HKD | | | | — | | | | (4 | ) |
| | | | | | | |
Citi | | | 09/21/2016 | | | | 5,724,882 | | | | USD | | | | 1,612,444,000 | | | | HUF | | | | 83,930 | | | | — | |
| | | | | | | |
Citi | | | 09/21/2016 | | | | 4,382,544 | | | | USD | | | | 1,204,577,000 | | | | HUF | | | | — | | | | (43,069 | ) |
| | | | | | | |
Citi | | | 09/21/2016 | | | | 4,088,312 | | | | USD | | | | 56,507,048,000 | | | | IDR | | | | 154,859 | | | | — | |
| | | | | | | |
Citi | | | 09/21/2016 | | | | 4,654,217 | | | | USD | | | | 17,756,000 | | | | ILS | | | | 48,328 | | | | — | |
| | | | | | | |
Citi | | | 09/21/2016 | | | | 909,089 | | | | USD | | | | 3,426,000 | | | | ILS | | | | — | | | | (1,738 | ) |
| | | | | | | |
Citi | | | 09/21/2016 | | | | 5,103,010 | | | | USD | | | | 348,051,794 | | | | INR | | | | 78,467 | | | | — | |
| | | | | | | |
Citi | | | 09/21/2016 | | | | 1,157,660 | | | | USD | | | | 77,618,000 | | | | INR | | | | — | | | | (2,154 | ) |
| | | | | | | |
Citi | | | 09/21/2016 | | | | 51,707,119 | | | | USD | | | | 5,568,303,000 | | | | JPY | | | | 2,159,392 | | | | — | |
| | | | | | | |
Citi | | | 09/21/2016 | | | | 18,932,988 | | | | USD | | | | 1,911,954,000 | | | | JPY | | | | — | | | | (437,175 | ) |
| | | | | | | |
Citi | | | 09/21/2016 | | | | 23,717,666 | | | | USD | | | | 27,231,760,000 | | | | KRW | | | | 690,187 | | | | — | |
| | | | | | | |
Citi | | | 09/21/2016 | | | | 11,109,541 | | | | USD | | | | 12,298,018,000 | | | | KRW | | | | — | | | | (86,815 | ) |
| | | | | | | |
Citi | | | 09/21/2016 | | | | 2,471,213 | | | | USD | | | | 47,379,000 | | | | MXN | | | | 43,454 | | | | — | |
| | | | | | | |
Citi | | | 09/21/2016 | | | | 16,017,716 | | | | USD | | | | 294,015,000 | | | | MXN | | | | — | | | | (412,708 | ) |
| | | | | | | |
Citi | | | 09/21/2016 | | | | 243,098 | | | | USD | | | | 1,005,000 | | | | MYR | | | | 3,086 | | | | — | |
| | | | | | | |
Citi | | | 09/21/2016 | | | | 5,369,833 | | | | USD | | | | 21,558,000 | | | | MYR | | | | — | | | | (89,004 | ) |
| | | | | | | |
Citi | | | 09/21/2016 | | | | 2,096,922 | | | | USD | | | | 17,722,000 | | | | NOK | | | | 29,952 | | | | — | |
| | | | | | | |
Citi | | | 09/21/2016 | | | | 20,832,873 | | | | USD | | | | 171,076,000 | | | | NOK | | | | — | | | | (301,489 | ) |
| | | | | | | |
Citi | | | 09/21/2016 | | | | 47,255,040 | | | | USD | | | | 67,523,000 | | | | NZD | | | | 1,699,459 | | | | — | |
| | | | | | | |
Citi | | | 09/21/2016 | | | | 7,918,848 | | | | USD | | | | 10,878,000 | | | | NZD | | | | — | | | | (32,246 | ) |
| | | | | | | |
Citi | | | 09/21/2016 | | | | 5,358,207 | | | | USD | | | | 251,977,000 | | | | PHP | | | | 44,467 | | | | — | |
| | | | | | | |
Citi | | | 09/21/2016 | | | | 1,503,774 | | | | USD | | | | 69,811,000 | | | | PHP | | | | — | | | | (6,946 | ) |
| | | | | | | |
Citi | | | 09/21/2016 | | | | 8,091,645 | | | | USD | | | | 32,178,000 | | | | PLN | | | | 138,083 | | | | — | |
| | | | | | | |
Citi | | | 09/21/2016 | | | | 16,771,076 | | | | USD | | | | 64,577,000 | | | | PLN | | | | — | | | | (255,096 | ) |
| | | | | | | |
Citi | | | 09/21/2016 | | | | 12,587,775 | | | | USD | | | | 104,133,000 | | | | SEK | | | | — | | | | (411,767 | ) |
| | | | | | | |
Citi | | | 09/21/2016 | | | | 284,868 | | | | USD | | | | 393,000 | | | | SGD | | | | 3,569 | | | | — | |
| | | | | | | |
Citi | | | 09/21/2016 | | | | 6,015,144 | | | | USD | | | | 8,111,000 | | | | SGD | | | | — | | | | (62,175 | ) |
| | | | | | | |
Citi | | | 09/21/2016 | | | | 22,100,490 | | | | USD | | | | 66,399,000 | | | | TRY | | | | 254,153 | | | | — | |
| | | | | | | |
Citi | | | 09/21/2016 | | | | 11,431,336 | | | | USD | | | | 33,730,000 | | | | TRY | | | | — | | | | (75,411 | ) |
| | | | | | | |
Citi | | | 09/21/2016 | | | | 3,160,362 | | | | USD | | | | 101,358,000 | | | | TWD | | | | 36,883 | | | | — | |
| | | | | | | |
Citi | | | 09/21/2016 | | | | 2,054,608 | | | | USD | | | | 64,296,000 | | | | TWD | | | | — | | | | (26,450 | ) |
| | | | | | | |
Citi | | | 09/21/2016 | | | | 8,923,762 | | | | USD | | | | 135,855,000 | | | | ZAR | | | | 281,367 | | | | — | |
| | | | | | | |
Citi | | | 09/21/2016 | | | | 1,654,646 | | | | USD | | | | 24,132,000 | | | | ZAR | | | | — | | | | (19,534 | ) |
The accompanying Notes to Consolidated Financial Statements are an integral part of this statement.
| | | | | | |
| | |
| | | | ACTIVE PORTFOLIOS® MULTI-MANAGER ALTERNATIVES FUND | | |
CONSOLIDATED PORTFOLIO OF INVESTMENTS (continued)
August 31, 2016
Forward Foreign Currency Exchange Contracts Open at August 31, 2016 (continued)
| | | | | | | | | | | | | | | | | | | | | | | | | | | | |
| Counterparty | | Exchange
Date | | | Currency to
be Delivered | | | Currency to
be Received | | | Unrealized
Appreciation ($) | | | Unrealized
Depreciation ($) | |
Citi | | | 09/21/2016 | | | | 9,871,229 | | | | ZAR | | | | 680,164 | | | | USD | | | | 11,319 | | | | — | |
| | | | | | | |
Citi | | | 09/21/2016 | | | | 119,416,000 | | | | ZAR | | | | 7,485,067 | | | | USD | | | | — | | | | (606,205 | ) |
| | | | | | | |
Citi | | | 12/21/2016 | | | | 291,056 | | | | AUD | | | | 219,427 | | | | USD | | | | 1,254 | | | | — | |
| | | | | | | |
Citi | | | 12/21/2016 | | | | 2,944,000 | | | | CAD | | | | 2,244,142 | | | | USD | | | | — | | | | (2,110 | ) |
| | | | | | | |
Citi | | | 12/21/2016 | | | | 199,369,000 | | | | CLP | | | | 294,200 | | | | USD | | | | 4,044 | | | | — | |
| | | | | | | |
Citi | | | 12/21/2016 | | | | 5,405,275 | | | | EUR | | | | 6,059,128 | | | | USD | | | | 327 | | | | — | |
| | | | | | | |
Citi | | | 12/21/2016 | | | | 9,041,000 | | | | GBP | | | | 11,876,728 | | | | USD | | | | — | | | | (23,639 | ) |
| | | | | | | |
Citi | | | 12/21/2016 | | | | 118,358,000 | | | | HUF | | | | 432,650 | | | | USD | | | | 5,741 | | | | — | |
| | | | | | | |
Citi | | | 12/21/2016 | | | | 239,447,000 | | | | IDR | | | | 17,745 | | | | USD | | | | 7 | | | | — | |
| | | | | | | |
Citi | | | 12/21/2016 | | | | 376,000 | | | | ILS | | | | 100,365 | | | | USD | | | | 556 | | | | — | |
| | | | | | | |
Citi | | | 12/21/2016 | | | | 4,746,000 | | | | INR | | | | 69,559 | | | | USD | | | | — | | | | (167 | ) |
| | | | | | | |
Citi | | | 12/21/2016 | | | | 343,747,000 | | | | JPY | | | | 3,349,442 | | | | USD | | | | 10,780 | | | | — | |
| | | | | | | |
Citi | | | 12/21/2016 | | | | 79,310,000 | | | | KRW | | | | 71,165 | | | | USD | | | | 113 | | | | — | |
| | | | | | | |
Citi | | | 12/21/2016 | | | | 439,828,000 | | | | KRW | | | | 392,940 | | | | USD | | | | — | | | | (1,091 | ) |
| | | | | | | |
Citi | | | 12/21/2016 | | | | 9,667,000 | | | | MXN | | | | 508,845 | | | | USD | | | | 218 | | | | — | |
| | | | | | | |
Citi | | | 12/21/2016 | | | | 20,535,000 | | | | MXN | | | | 1,078,656 | | | | USD | | | | — | | | | (1,787 | ) |
| | | | | | | |
Citi | | | 12/21/2016 | | | | 1,413,000 | | | | PLN | | | | 364,550 | | | | USD | | | | 3,689 | | | | — | |
| | | | | | | |
Citi | | | 12/21/2016 | | | | 6,611,000 | | | | PLN | | | | 1,687,430 | | | | USD | | | | — | | | | (931 | ) |
| | | | | | | |
Citi | | | 12/21/2016 | | | | 3,996,000 | | | | SEK | | | | 469,282 | | | | USD | | | | — | | | | (97 | ) |
| | | | | | | |
Citi | | | 12/21/2016 | | | | 1,154,000 | | | | SGD | | | | 852,641 | | | | USD | | | | 5,887 | | | | — | |
| | | | | | | |
Citi | | | 12/21/2016 | | | | 376,000 | | | | SGD | | | | 275,737 | | | | USD | | | | — | | | | (155 | ) |
| | | | | | | |
Citi | | | 12/21/2016 | | | | 2,106,785 | | | | USD | | | | 7,087,868 | | | | BRL | | | | 17,079 | | | | — | |
| | | | | | | |
Citi | | | 12/21/2016 | | | | 9,949 | | | | USD | | | | 33,000 | | | | BRL | | | | — | | | | (60 | ) |
| | | | | | | |
Citi | | | 12/21/2016 | | | | 463,714 | | | | USD | | | | 606,002 | | | | CAD | | | | — | | | | (1,338 | ) |
| | | | | | | |
Citi | | | 12/21/2016 | | | | 850 | | | | USD | | | | 827 | | | | CHF | | | | — | | | | (4 | ) |
| | | | | | | |
Citi | | | 12/21/2016 | | | | 2,838,544 | | | | USD | | | | 1,930,912,000 | | | | CLP | | | | — | | | | (28,344 | ) |
| | | | | | | |
Citi | | | 12/21/2016 | | | | 693,568 | | | | USD | | | | 2,079,228,592 | | | | COP | | | | — | | | | (7,835 | ) |
| | | | | | | |
Citi | | | 12/21/2016 | | | | 983,892 | | | | USD | | | | 870,000 | | | | EUR | | | | — | | | | (8,704 | ) |
| | | | | | | |
Citi | | | 12/21/2016 | | | | 61,631 | | | | USD | | | | 47,000 | | | | GBP | | | | 234 | | | | — | |
| | | | | | | |
Citi | | | 12/21/2016 | | | | 902,586 | | | | USD | | | | 683,000 | | | | GBP | | | | — | | | | (3,576 | ) |
| | | | | | | |
Citi | | | 12/21/2016 | | | | 332,689 | | | | USD | | | | 2,578,000 | | | | HKD | | | | 16 | | | | — | |
| | | | | | | |
Citi | | | 12/21/2016 | | | | 29,622 | | | | USD | | | | 8,240,000 | | | | HUF | | | | 99 | | | | — | |
| | | | | | | |
Citi | | | 12/21/2016 | | | | 2,065,109 | | | | USD | | | | 571,372,233 | | | | HUF | | | | — | | | | (4,206 | ) |
| | | | | | | |
Citi | | | 12/21/2016 | | | | 2,345,138 | | | | USD | | | | 31,632,072,147 | | | | IDR | | | | — | | | | (1,897 | ) |
| | | | | | | |
Citi | | | 12/21/2016 | | | | 680,438 | | | | USD | | | | 2,573,000 | | | | ILS | | | | 2,563 | | | | — | |
| | | | | | | |
Citi | | | 12/21/2016 | | | | 1,828,244 | | | | USD | | | | 124,731,638 | | | | INR | | | | 4,248 | | | | — | |
| | | | | | | |
Citi | | | 12/21/2016 | | | | 2,223,651 | | | | USD | | | | 225,797,496 | | | | JPY | | | | — | | | | (30,580 | ) |
| | | | | | | |
Citi | | | 12/21/2016 | | | | 1,717,482 | | | | USD | | | | 1,930,150,725 | | | | KRW | | | | 11,690 | | | | — | |
| | | | | | | |
Citi | | | 12/21/2016 | | | | 3,003,700 | | | | USD | | | | 12,180,000 | | | | MYR | | | | — | | | | (38,044 | ) |
| | | | | | | |
Citi | | | 12/21/2016 | | | | 374,583 | | | | USD | | | | 3,125,000 | | | | NOK | | | | 587 | | | | — | |
| | | | | | | |
Citi | | | 12/21/2016 | | | | 1,440,125 | | | | USD | | | | 11,891,000 | | | | NOK | | | | — | | | | (12,560 | ) |
| | | | | | | |
Citi | | | 12/21/2016 | | | | 12,600,668 | | | | USD | | | | 17,473,179 | | | | NZD | | | | 22,421 | | | | — | |
| | | | | | | |
Citi | | | 12/21/2016 | | | | 32,982 | | | | USD | | | | 1,548,000 | | | | PHP | | | | 96 | | | | — | |
The accompanying Notes to Consolidated Financial Statements are an integral part of this statement.
| | | | | | |
| | |
| | | | ACTIVE PORTFOLIOS® MULTI-MANAGER ALTERNATIVES FUND | | |
CONSOLIDATED PORTFOLIO OF INVESTMENTS (continued)
August 31, 2016
Forward Foreign Currency Exchange Contracts Open at August 31, 2016 (continued)
| | | | | | | | | | | | | | | | | | | | | | | | | | | | |
| Counterparty | | Exchange
Date | | | Currency to
be Delivered | | | Currency to
be Received | | | Unrealized
Appreciation ($) | | | Unrealized
Depreciation ($) | |
Citi | | | 12/21/2016 | | | | 1,664,535 | | | | USD | | | | 77,534,336 | | | | PHP | | | | — | | | | (7,777 | ) |
| | | | | | | |
Citi | | | 12/21/2016 | | | | 1,660,969 | | | | USD | | | | 6,461,917 | | | | PLN | | | | — | | | | (10,682 | ) |
| | | | | | | |
Citi | | | 12/21/2016 | | | | 1,214,440 | | | | USD | | | | 10,149,000 | | | | SEK | | | | — | | | | (22,315 | ) |
| | | | | | | |
Citi | | | 12/21/2016 | | | | 833,585 | | | | USD | | | | 1,135,256 | | | | SGD | | | | — | | | | (584 | ) |
| | | | | | | |
Citi | | | 12/21/2016 | | | | 1,026,356 | | | | USD | | | | 3,108,000 | | | | TRY | | | | 420 | | | | — | |
| | | | | | | |
Citi | | | 12/21/2016 | | | | 2,865,886 | | | | USD | | | | 8,655,172 | | | | TRY | | | | — | | | | (6,515 | ) |
| | | | | | | |
Citi | | | 12/21/2016 | | | | 1,634,129 | | | | USD | | | | 51,452,000 | | | | TWD | | | | — | | | | (4,640 | ) |
| | | | | | | |
Citi | | | 12/21/2016 | | | | 2,218,171 | | | | USD | | | | 32,437,229 | | | | ZAR | | | | — | | | | (59,161 | ) |
| | | | | | | |
Citi | | | 12/21/2016 | | | | 4,029,000 | | | | ZAR | | | | 267,766 | | | | USD | | | | — | | | | (403 | ) |
| | | | | | | |
Goldman Sachs | | | 09/15/2016 | | | | 3,143,300 | | | | CAD | | | | 2,419,291 | | | | USD | | | | 22,213 | | | | — | |
| | | | | | | |
Goldman Sachs | | | 09/15/2016 | | | | 23,300 | | | | CHF | | | | 24,227 | | | | USD | | | | 518 | | | | — | |
| | | | | | | |
Goldman Sachs | | | 09/15/2016 | | | | 839,500 | | | | EUR | | | | 949,430 | | | | USD | | | | 12,460 | | | | — | |
| | | | | | | |
Goldman Sachs | | | 09/15/2016 | | | | 9,214,400 | | | | GBP | | | | 12,930,439 | | | | USD | | | | 826,483 | | | | — | |
| | | | | | | |
Goldman Sachs | | | 09/15/2016 | | | | 329,100 | | | | GBP | | | | 426,447 | | | | USD | | | | — | | | | (5,856 | ) |
| | | | | | | |
Goldman Sachs | | | 09/15/2016 | | | | 10,689,200 | | | | SEK | | | | 1,278,891 | | | | USD | | | | 29,414 | | | | — | |
| | | | | | | |
Goldman Sachs | | | 09/15/2016 | | | | 6,816,000 | | | | SEK | | | | 793,048 | | | | USD | | | | — | | | | (3,685 | ) |
| | | | | | | |
Goldman Sachs | | | 09/15/2016 | | | | 2,443,279 | | | | USD | | | | 3,143,300 | | | | CAD | | | | — | | | | (46,200 | ) |
| | | | | | | |
Goldman Sachs | | | 09/15/2016 | | | | 904,560 | | | | USD | | | | 823,200 | | | | EUR | | | | 14,218 | | | | — | |
| | | | | | | |
Goldman Sachs | | | 09/15/2016 | | | | 18,474 | | | | USD | | | | 16,300 | | | | EUR | | | | — | | | | (282 | ) |
| | | | | | | |
Goldman Sachs | | | 09/15/2016 | | | | 194,884 | | | | USD | | | | 149,400 | | | | GBP | | | | 1,367 | | | | — | |
| | | | | | | |
Goldman Sachs | | | 09/15/2016 | | | | 2,113,084 | | | | USD | | | | 1,591,100 | | | | GBP | | | | — | | | | (23,029 | ) |
| | | | | | | |
Goldman Sachs | | | 09/15/2016 | | | | 2,045,054 | | | | USD | | | | 17,505,200 | | | | SEK | | | | 1,155 | | | | — | |
| | | | | | | |
Goldman Sachs | | | 09/15/2016 | | | | 473,104 | | | | USD | | | | 7,291,300 | | | | ZAR | | | | 21,533 | | | | — | |
| | | | | | | |
Goldman Sachs | | | 09/15/2016 | | | | 7,291,300 | | | | ZAR | | | | 475,114 | | | | USD | | | | — | | | | (19,524 | ) |
| | | | | | | | | | | | | | | | | | | | | | | | | | | | | |
Total | | | | | | | | | | | | | | | | | | | | | | | 12,516,574 | | | | (12,438,526 | ) |
| | | | | | | | | | | | | | | | | | | | | | | | | | | | | |
Futures Contracts Outstanding at August 31, 2016
Long Futures Contracts Outstanding
| | | | | | | | | | | | | | | | | | | | | | | | |
| Contract Description | | Number of
Contracts | | | Trading
Currency | | | Notional Market
Value ($) | | | Expiration Date | | | Unrealized
Appreciation ($) | | | Unrealized
(Depreciation) ($) | |
3-Month Euro Euribor | | | 105 | | | | EUR | | | | 29,375,730 | | | | 12/2016 | | | | — | | | | (10,911 | ) |
3-Month Euro Euribor | | | 106 | | | | EUR | | | | 29,658,455 | | | | 03/2017 | | | | — | | | | (11,320 | ) |
3-Month Euro Euribor | | | 134 | | | | EUR | | | | 37,496,500 | | | | 06/2017 | | | | — | | | | (3,633 | ) |
3-Month Euro Euribor | | | 175 | | | | EUR | | | | 48,971,750 | | | | 09/2017 | | | | — | | | | (16,209 | ) |
3-Month Euro Euribor | | | 219 | | | | EUR | | | | 61,287,701 | | | | 12/2017 | | | | 6,923 | | | | — | |
3-Month Euro Euribor | | | 232 | | | | EUR | | | | 64,925,784 | | | | 03/2018 | | | | 32,207 | | | | — | |
3-Month Euro Euribor | | | 146 | | | | EUR | | | | 40,856,432 | | | | 06/2018 | | | | 3,085 | | | | — | |
90-Day Euro$ | | | 13 | | | | USD | | | | 3,216,363 | | | | 06/2017 | | | | — | | | | (1,637 | ) |
90-Day Euro$ | | | 79 | | | | USD | | | | 19,537,688 | | | | 09/2017 | | | | — | | | | (15,295 | ) |
90-Day Euro$ | | | 94 | | | | USD | | | | 23,236,800 | | | | 12/2017 | | | | — | | | | (22,715 | ) |
90-Day Euro$ | | | 101 | | | | USD | | | | 24,960,888 | | | | 03/2018 | | | | — | | | | (30,467 | ) |
90-Day Euro$ | | | 107 | | | | USD | | | | 26,435,688 | | | | 06/2018 | | | | — | | | | (29,202 | ) |
90-Day Sterling | | | 326 | | | | GBP | | | | 53,350,304 | | | | 12/2016 | | | | 21,473 | | | | — | |
90-Day Sterling | | | 307 | | | | GBP | | | | 50,251,009 | | | | 03/2017 | | | | 64,331 | | | | — | |
90-Day Sterling | | | 266 | | | | GBP | | | | 43,544,328 | | | | 06/2017 | | | | 106,829 | | | | — | |
90-Day Sterling | | | 235 | | | | GBP | | | | 38,473,470 | | | | 09/2017 | | | | 80,447 | | | | — | |
90-Day Sterling | | | 214 | | | | GBP | | | | 35,035,416 | | | | 12/2017 | | | | 82,803 | | | | — | |
90-Day Sterling | | | 200 | | | | GBP | | | | 32,743,379 | | | | 03/2018 | | | | 83,603 | | | | — | |
The accompanying Notes to Consolidated Financial Statements are an integral part of this statement.
| | | | | | |
| | |
| | | | ACTIVE PORTFOLIOS® MULTI-MANAGER ALTERNATIVES FUND | | |
CONSOLIDATED PORTFOLIO OF INVESTMENTS (continued)
August 31, 2016
Long Futures Contracts Outstanding (continued)
| | | | | | | | | | | | | | | | | | | | | | | | |
| Contract Description | | Number of
Contracts | | | Trading
Currency | | | Notional Market
Value ($) | | | Expiration Date | | | Unrealized
Appreciation ($) | | | Unrealized
(Depreciation) ($) | |
90-Day Sterling | | | 188 | | | | GBP | | | | 30,775,690 | | | | 06/2018 | | | | 73,210 | | | | — | |
Amsterdam IDX | | | 22 | | | | EUR | | | | 2,229,696 | | | | 09/2016 | | | | 14,822 | | | | — | |
Australian 10 Year Bond | | | 165 | | | | AUD | | | | 17,099,637 | | | | 09/2016 | | | | 358,375 | | | | — | |
Australian 3 Year Bond | | | 673 | | | | AUD | | | | 57,423,399 | | | | 09/2016 | | | | 225,867 | | | | — | |
C$ Currency | | | 84 | | | | USD | | | | 6,404,160 | | | | 09/2016 | | | | — | | | | (97,873 | ) |
Canadian Government 10-Year Bond | | | 188 | | | | CAD | | | | 21,040,689 | | | | 12/2016 | | | | 28,102 | | | | — | |
Cocoa ICE | | | 69 | | | | GBP | | | | 2,091,217 | | | | 12/2016 | | | | — | | | | (63,002 | ) |
Coffee C | | | 30 | | | | USD | | | | 1,654,313 | | | | 12/2016 | | | | 43,503 | | | | — | |
Cotton | | | 24 | | | | USD | | | | 786,960 | | | | 12/2016 | | | | 1,185 | | | | — | |
Cotton | | | 3 | | | | USD | | | | 98,370 | | | | 12/2016 | | | | — | | | | (11,569 | ) |
DAX Index | | | 16 | | | | EUR | | | | 4,734,194 | | | | 09/2016 | | | | 3,273 | | | | — | |
DJIA Mini E-CBOT | | | 173 | | | | USD | | | | 15,911,675 | | | | 09/2016 | | | | 6,873 | | | | — | |
Euro-Bobl | | | 102 | | | | EUR | | | | 15,199,325 | | | | 09/2016 | | | | — | | | | (5,522 | ) |
Euro-Bund | | | 73 | | | | EUR | | | | 13,629,396 | | | | 09/2016 | | | | 170,934 | | | | — | |
Euro-Buxl 30 Year | | | 34 | | | | EUR | | | | 7,318,826 | | | | 09/2016 | | | | 227,978 | | | | — | |
Euro-Schatz | | | 7 | | | | EUR | | | | 874,591 | | | | 09/2016 | | | | — | | | | (374 | ) |
FTSE 100 Index | | | 149 | | | | GBP | | | | 13,277,437 | | | | 09/2016 | | | | 145,966 | | | | — | |
FTSE/JSE Top 40 Index | | | 19 | | | | ZAR | | | | 598,083 | | | | 09/2016 | | | | — | | | | (7,923 | ) |
Gold 100 oz. | | | 133 | | | | USD | | | | 17,441,620 | | | | 12/2016 | | | | — | | | | (303,424 | ) |
Hang Seng Index | | | 7 | | | | HKD | | | | 1,034,495 | | | | 09/2016 | | | | 4,887 | | | | — | |
JPY Currency | | | 508 | | | | USD | | | | 61,429,900 | | | | 09/2016 | | | | 2,905,692 | | | | — | |
JPY Currency | | | 52 | | | | USD | | | | 6,288,100 | | | | 09/2016 | | | | — | | | | (132,579 | ) |
KOSPI 200 Index | | | 1 | | | | KRW | | | | 115,022 | | | | 09/2016 | | | | 353 | | | | — | |
LME Nickel | | | 11 | | | | USD | | | | 645,117 | | | | 12/2016 | | | | — | | | | (10,943 | ) |
LME Primary Aluminum | | | 54 | | | | USD | | | | 2,182,613 | | | | 12/2016 | | | | — | | | | (48,759 | ) |
LME Zinc | | | 40 | | | | USD | | | | 2,314,750 | | | | 12/2016 | | | | 36,822 | | | | — | |
Long Gilt | | | 35 | | | | GBP | | | | 6,045,149 | | | | 12/2016 | | | | 14,990 | | | | — | |
MSCI Singapore IX ETS | | | 147 | | | | SGD | | | | 3,349,026 | | | | 09/2016 | | | | — | | | | (56,501 | ) |
NASDAQ 100 E-mini | | | 215 | | | | USD | | | | 20,527,125 | | | | 09/2016 | | | | 388,825 | | | | — | |
New Zealand $ | | | 93 | | | | USD | | | | 6,742,500 | | | | 09/2016 | | | | 327,387 | | | | — | |
New Zealand $ | | | 57 | | | | USD | | | | 4,132,500 | | | | 09/2016 | | | | — | | | | (18,063 | ) |
Platinum | | | 44 | | | | USD | | | | 2,317,700 | | | | 10/2016 | | | | — | | | | (81,992 | ) |
Platinum | | | 51 | | | | USD | | | | 2,686,425 | | | | 10/2016 | | | | — | | | | (161,031 | ) |
Russell 2000 Mini | | | 85 | | | | USD | | | | 10,529,800 | | | | 09/2016 | | | | 139,364 | | | | — | |
S&P 500 E-mini | | | 141 | | | | USD | | | | 15,294,975 | | | | 09/2016 | | | | 31,794 | | | | — | |
S&P Mid 400 E-mini | | | 48 | | | | USD | | | | 7,506,240 | | | | 09/2016 | | | | 106,481 | | | | — | |
S&P/TSE 60 Index | | | 84 | | | | CAD | | | | 10,890,407 | | | | 09/2016 | | | | 234,989 | | | | — | |
SGX Nifty Index | | | 85 | | | | USD | | | | 1,503,565 | | | | 09/2016 | | | | 28,978 | | | | — | |
SPI 200 Index | | | 133 | | | | AUD | | | | 13,519,074 | | | | 09/2016 | | | | 27,487 | | | | — | |
Silver | | | 69 | | | | USD | | | | 6,453,915 | | | | 12/2016 | | | | — | | | | (232,641 | ) |
Soybean | | | 28 | | | | USD | | | | 1,320,200 | | | | 11/2016 | | | | — | | | | (91,937 | ) |
Sugar #11 | | | 358 | | | | USD | | | | 8,043,258 | | | | 09/2016 | | | | 163,010 | | | | — | |
Sugar #11 | | | 1 | | | | USD | | | | 22,467 | | | | 09/2016 | | | | — | | | | (90 | ) |
U.S. Long Bond | | | 72 | | | | USD | | | | 12,267,000 | | | | 12/2016 | | | | — | | | | (38,139 | ) |
U.S. Treasury 10-Year Note | | | 158 | | | | USD | | | | 20,685,656 | | | | 12/2016 | | | | — | | | | (52,080 | ) |
U.S. Treasury 2-Year Note | | | 170 | | | | USD | | | | 37,113,125 | | | | 12/2016 | | | | — | | | | (26,520 | ) |
U.S. Treasury 5-Year Note | | | 279 | | | | USD | | | | 33,828,750 | | | | 12/2016 | | | | — | | | | (70,460 | ) |
| | | | | | | | | | | | | | | | | | | | | | | | | |
Total | | | | | | | | | | | 1,190,735,817 | | | | | | | | 6,192,848 | | | | (1,652,811 | ) |
| | | | | | | | | | | | | | | | | | | | | | | | | |
Short Futures Contracts Outstanding
| | | | | | | | | | | | | | | | | | | | | | | | |
| Contract Description | | Number of
Contracts | | | Trading
Currency | | | Notional Market
Value ($) | | | Expiration Date | | | Unrealized
Appreciation ($) | | | Unrealized
(Depreciation) ($) | |
10-Year Mini JGB | | | (72 | ) | | | JPY | | | | (10,537,824 | ) | | | 09/2016 | | | | 1,352 | | | | — | |
90-Day Euro$ | | | (124 | ) | | | USD | | | | (30,705,500 | ) | | | 12/2016 | | | | 1,802 | | | | — | |
90-Day Euro$ | | | (53 | ) | | | USD | | | | (13,118,825 | ) | | | 03/2017 | | | | — | | | | (376 | ) |
AUD/USD Currency | | | (73 | ) | | | USD | | | | (5,482,300 | ) | | | 09/2016 | | | | 77,094 | | | | — | |
BP Currency | | | (82 | ) | | | USD | | | | (6,729,125 | ) | | | 09/2016 | | | | 681,221 | | | | — | |
BP Currency | | | (16 | ) | | | USD | | | | (1,313,000 | ) | | | 09/2016 | | | | — | | | | (4,659 | ) |
The accompanying Notes to Consolidated Financial Statements are an integral part of this statement.
| | | | | | |
| | |
| | | | ACTIVE PORTFOLIOS® MULTI-MANAGER ALTERNATIVES FUND | | |
CONSOLIDATED PORTFOLIO OF INVESTMENTS (continued)
August 31, 2016
Short Futures Contracts Outstanding (continued)
| | | | | | | | | | | | | | | | | | | | | | | | |
| Contract Description | | Number of
Contracts | | | Trading
Currency | | | Notional Market
Value ($) | | | Expiration Date | | | Unrealized
Appreciation ($) | | | Unrealized
(Depreciation) ($) | |
Banker’s Acceptance | | | (109 | ) | | | CAD | | | | (20,588,150 | ) | | | 12/2016 | | | | — | | | | (2,951 | ) |
Banker’s Acceptance | | | (65 | ) | | | CAD | | | | (12,277,337 | ) | | | 03/2017 | | | | — | | | | (1,326 | ) |
Brent Crude | | | (47 | ) | | | USD | | | | (2,203,830 | ) | | | 09/2016 | | | | 97,195 | | | | — | |
CAC40 Index | | | (5 | ) | | | EUR | | | | (247,518 | ) | | | 09/2016 | | | | — | | | | (284 | ) |
Cocoa | | | (2 | ) | | | USD | | | | (57,960 | ) | | | 12/2016 | | | | — | | | | (142 | ) |
Copper | | | (63 | ) | | | USD | | | | (3,272,063 | ) | | | 12/2016 | | | | 78,136 | | | | — | |
Corn | | | (377 | ) | | | USD | | | | (5,947,175 | ) | | | 12/2016 | | | | 311,450 | | | | — | |
EURO STOXX 50 | | | (80 | ) | | | EUR | | | | (2,703,851 | ) | | | 09/2016 | | | | — | | | | (51,599 | ) |
Euro CHF 3-Month ICE | | | (18 | ) | | | CHF | | | | (4,611,408 | ) | | | 12/2016 | | | | 2,078 | | | | — | |
Euro CHF 3-Month ICE | | | (10 | ) | | | CHF | | | | (2,562,147 | ) | | | 03/2017 | | | | 798 | | | | — | |
Euro CHF 3-Month ICE | | | (6 | ) | | | CHF | | | | (1,537,288 | ) | | | 06/2017 | | | | 542 | | | | — | |
Euro FX | | | (216 | ) | | | USD | | | | (30,149,550 | ) | | | 09/2016 | | | | 19,850 | | | | — | |
FTSE/MIB Index | | | (17 | ) | | | EUR | | | | (1,605,947 | ) | | | 09/2016 | | | | — | | | | (95,114 | ) |
IBEX 35 Index | | | (40 | ) | | | EUR | | | | (3,892,654 | ) | | | 09/2016 | | | | — | | | | (70,219 | ) |
Japanese 10-Year Government Bond | | | (6 | ) | | | JPY | | | | (8,780,361 | ) | | | 09/2016 | | | | — | | | | (1,508 | ) |
KC HRW Wheat | | | (53 | ) | | | USD | | | | (1,053,375 | ) | | | 12/2016 | | | | 98,801 | | | | — | |
LME Copper | | | (21 | ) | | | USD | | | | (2,425,369 | ) | | | 12/2016 | | | | 9,567 | | | | — | |
Lean Hogs | | | (84 | ) | | | USD | | | | (2,111,760 | ) | | | 10/2016 | | | | — | | | | (9,508 | ) |
Low Sulphur Gasoil | | | (85 | ) | | | USD | | | | (3,567,875 | ) | | | 10/2016 | | | | — | | | | (201,700 | ) |
NY Harbor ULSD | | | (46 | ) | | | USD | | | | (2,754,452 | ) | | | 09/2016 | | | | — | | | | (111,511 | ) |
Natural Gas | | | (12 | ) | | | USD | | | | (346,440 | ) | | | 09/2016 | | | | — | | | | (30,753 | ) |
RBOB Gasoline | | | (90 | ) | | | USD | | | | (5,040,252 | ) | | | 09/2016 | | | | — | | | | (184,006 | ) |
Soybean Meal | | | (20 | ) | | | USD | | | | (613,400 | ) | | | 12/2016 | | | | 51,539 | | | | — | |
TOPIX Index | | | (72 | ) | | | JPY | | | | (9,258,783 | ) | | | 09/2016 | | | | — | | | | (346,904 | ) |
WTI Crude | | | (88 | ) | | | USD | | | | (3,933,600 | ) | | | 09/2016 | | | | — | | | | (41,964 | ) |
Wheat | | | (198 | ) | | | USD | | | | (3,843,675 | ) | | | 12/2016 | | | | 490,138 | | | | — | |
| | | | | | | | | | | | | | | | | | | | | | | | | |
Total | | | | | | | | | | | (203,272,794 | ) | | | | | | | 1,921,563 | | | | (1,154,524 | ) |
| | | | | | | | | | | | | | | | | | | | | | | | | |
Open Options Contracts Written at August 31, 2016
| | | | | | | | | | | | | | | | | | | | | | | | | | | | |
| Issuer | | Puts/Calls | | | Trading
Currency | | | Number of
Contracts | | | Exercise
Price | | | Premium
Received ($) | | | Expiration
Date | | | Value ($) | |
Charter Communications, Inc., Class A | | | Put | | | | USD | | | | (8 | ) | | | 250.00 | | | | (4,793 | ) | | | 09/16/2016 | | | | (2,120 | ) |
| | | | | | | |
Imperva, Inc. | | | Call | | | | USD | | | | (34 | ) | | | 50.00 | | | | (4,751 | ) | | | 09/16/2016 | | | | (1,615 | ) |
| | | | | | | |
Imperva, Inc. | | | Put | | | | USD | | | | (34 | ) | | | 40.00 | | | | (3,371 | ) | | | 09/16/2016 | | | | (850 | ) |
| | | | | | | |
Joy Global, Inc. | | | Call | | | | USD | | | | (12 | ) | | | 28.00 | | | | (618 | ) | | | 09/16/2016 | | | | (390 | ) |
| | | | | | | |
Joy Global, Inc. | | | Put | | | | USD | | | | (1 | ) | | | 27.50 | | | | (54 | ) | | | 09/02/2016 | | | | (47 | ) |
| | | | | | | |
Joy Global, Inc. | | | Put | | | | USD | | | | (36 | ) | | | 27.00 | | | | (1,112 | ) | | | 09/16/2016 | | | | (756 | ) |
| | | | | | | |
LinkedIn Corp., Class A | | | Put | | | | USD | | | | (23 | ) | | | 180.00 | | | | (903 | ) | | | 09/16/2016 | | | | (172 | ) |
| | | | | | | |
LinkedIn Corp., Class A | | | Put | | | | USD | | | | (41 | ) | | | 180.00 | | | | (1,020 | ) | | | 09/16/2016 | | | | (308 | ) |
| | | | | | | |
Marketo, Inc. | | | Call | | | | USD | | | | (2 | ) | | | 40.00 | | | | (21 | ) | | | 09/16/2016 | | | | — | |
| | | | | | | |
Marketo, Inc. | | | Call | | | | USD | | | | (6 | ) | | | 35.00 | | | | (415 | ) | | | 09/16/2016 | | | | (150 | ) |
| | | | | | | |
Molson Coors Brewing Co., Class B | | | Call | | | | USD | | | | (24 | ) | | | 110.00 | | | | (2,023 | ) | | | 09/16/2016 | | | | (180 | ) |
| | | | | | | |
Molson Coors Brewing Co., Class B | | | Call | | | | USD | | | | (42 | ) | | | 105.00 | | | | (3,800 | ) | | | 09/16/2016 | | | | (2,940 | ) |
| | | | | | | |
Molson Coors Brewing Co., Class B | | | Call | | | | USD | | | | (34 | ) | | | 105.00 | | | | (6,095 | ) | | | 10/21/2016 | | | | (9,095 | ) |
| | | | | | | |
Molson Coors Brewing Co., Class B | | | Put | | | | USD | | | | (13 | ) | | | 90.00 | | | | (1,330 | ) | | | 09/16/2016 | | | | (390 | ) |
| | | | | | | |
Molson Coors Brewing Co., Class B | | | Put | | | | USD | | | | (53 | ) | | | 95.00 | | | | (8,906 | ) | | | 09/16/2016 | | | | (2,518 | ) |
| | | | | | | |
NetSuite, Inc. | | | Call | | | | USD | | | | (11 | ) | | | 110.00 | | | | (275 | ) | | | 09/16/2016 | | | | (165 | ) |
| | | | | | | |
NetSuite, Inc. | | | Put | | | | USD | | | | (11 | ) | | | 105.00 | | | | (216 | ) | | | 09/16/2016 | | | | (55 | ) |
| | | | | | | |
Nexstar Broadcasting Group, Inc., Class A | | | Call | | | | USD | | | | (83 | ) | | | 55.00 | | | | (10,300 | ) | | | 09/16/2016 | | | | (4,358 | ) |
The accompanying Notes to Consolidated Financial Statements are an integral part of this statement.
| | | | | | |
| | |
| | | | ACTIVE PORTFOLIOS® MULTI-MANAGER ALTERNATIVES FUND | | |
CONSOLIDATED PORTFOLIO OF INVESTMENTS (continued)
August 31, 2016
Open Options Contracts Written at August 31, 2016 (continued)
| | | | | | | | | | | | | | | | | | | | | | | | | | | | |
| Issuer | | Puts/Calls | | | Trading
Currency | | | Number of
Contracts | | | Exercise
Price | | | Premium
Received ($) | | | Expiration
Date | | | Value ($) | |
Relypsa, Inc. | | | Call | | | | USD | | | | (259 | ) | | | 32.00 | | | | (9,026 | ) | | | 09/16/2016 | | | | (648 | ) |
| | | | | | | |
Rovi Corp. | | | Call | | | | USD | | | | (63 | ) | | | 20.00 | | | | (8,570 | ) | | | 10/21/2016 | | | | (9,921 | ) |
| | | | | | | |
St. Jude Medical, Inc. | | | Call | | | | USD | | | | (47 | ) | | | 80.00 | | | | (5,433 | ) | | | 09/16/2016 | | | | (4,112 | ) |
| | | | | | | |
St. Jude Medical, Inc. | | | Call | | | | USD | | | | (85 | ) | | | 80.00 | | | | (7,798 | ) | | | 09/16/2016 | | | | (7,438 | ) |
| | | | | | | |
St. Jude Medical, Inc. | | | Put | | | | USD | | | | (4 | ) | | | 75.00 | | | | (339 | ) | | | 09/16/2016 | | | | (440 | ) |
| | | | | | | |
St. Jude Medical, Inc. | | | Put | | | | USD | | | | (43 | ) | | | 70.00 | | | | (2,825 | ) | | | 09/16/2016 | | | | (2,258 | ) |
| | | | | | | |
St. Jude Medical, Inc. | | | Put | | | | USD | | | | (85 | ) | | | 70.00 | | | | (9,820 | ) | | | 09/16/2016 | | | | (4,462 | ) |
| | | | | | | |
T-Mobile USA, Inc. | | | Call | | | | USD | | | | (37 | ) | | | 48.00 | | | | (1,276 | ) | | | 09/02/2016 | | | | (278 | ) |
| | | | | | | |
T-Mobile USA, Inc. | | | Call | | | | USD | | | | (37 | ) | | | 48.00 | | | | (778 | ) | | | 09/09/2016 | | | | (536 | ) |
| | | | | | | |
T-Mobile USA, Inc. | | | Put | | | | USD | | | | (37 | ) | | | 45.00 | | | | (1,587 | ) | | | 09/02/2016 | | | | (481 | ) |
| | | | | | | |
T-Mobile USA, Inc. | | | Put | | | | USD | | | | (37 | ) | | | 45.00 | | | | (865 | ) | | | 09/09/2016 | | | | (851 | ) |
| | | | | | | |
T-Mobile USA, Inc. | | | Put | | | | USD | | | | (48 | ) | | | 45.00 | | | | (3,797 | ) | | | 09/16/2016 | | | | (1,896 | ) |
| | | | | | | |
T-Mobile USA, Inc. | | | Put | | | | USD | | | | (48 | ) | | | 46.00 | | | | (5,381 | ) | | | 09/16/2016 | | | | (3,408 | ) |
| | | | | | | |
WhiteWave Foods Co. (The) | | | Call | | | | USD | | | | (60 | ) | | | 60.00 | | | | (2,210 | ) | | | 10/21/2016 | | | | (300 | ) |
| | | | | | | | | | | | | | | | | | | | | | | | | | | | | |
Total | | | | | | | | | | | | | | | | | | | | | | | | | | | (63,138 | ) |
| | | | | | | | | | | | | | | | | | | | | | | | | | | | | |
Total Return Swap Contracts Outstanding at August 31, 2016
| | | | | | | | | | | | | | | | | | | | | | | | | | | | | | | | |
| Counterparty | | Fund Receives | | Fund Pays | | Expiration
Date | | | Notional
Currency | | | Notional
Amount | | | Premium
Paid
($) | | | Premium
Received
($) | | | Unrealized
Appreciation
($) | | | Unrealized
Depreciation
($) | |
Goldman Sachs | | Total return on SABMiller PLC | | Floating rate based on 1-month GBP LIBOR-BBA plus 0.55% | | | 06/06/2017 | | | | GBP | | | | 455,304 | | | | — | | | | — | | | | — | | | | (2,665 | ) |
| | | | | | | | | |
Goldman Sachs | | Total return on SABMiller PLC | | Floating rate based on 1-month GBP LIBOR-BBA plus 0.55% | | | 06/06/2017 | | | | GBP | | | | 99,624 | | | | — | | | | — | | | | — | | | | (583 | ) |
| | | | | | | | | |
Goldman Sachs | | Total return on SABMiller PLC | | Floating rate based on 1-month GBP LIBOR-BBA plus 0.55% | | | 06/06/2017 | | | | GBP | | | | 376,426 | | | | — | | | | — | | | | — | | | | (2,203 | ) |
| | | | | | | | | |
Goldman Sachs | | Total return on SABMiller PLC | | Floating rate based on 1-month GBP LIBOR-BBA plus 0.55% | | | 06/06/2017 | | | | GBP | | | | 205,428 | | | | — | | | | — | | | | — | | | | (1,202 | ) |
| | | | | | | | | |
Goldman Sachs | | Total return on SABMiller PLC | | Floating rate based on 1-month GBP LIBOR-BBA plus 0.55% | | | 06/06/2017 | | | | GBP | | | | 358,064 | | | | — | | | | — | | | | — | | | | (2,096 | ) |
| | | | | | | | | |
Goldman Sachs | | Total return on SABMiller PLC | | Floating rate based on 1-month GBP LIBOR-BBA plus 0.55% | | | 06/06/2017 | | | | GBP | | | | 222,466 | | | | — | | | | — | | | | — | | | | (1,302 | ) |
| | | | | | | | | |
Goldman Sachs | | Total return on SABMiller PLC | | Floating rate based on 1-month GBP LIBOR-BBA plus 0.55% | | | 06/06/2017 | | | | GBP | | | | 187,816 | | | | — | | | | — | | | | — | | | | (1,099 | ) |
| | | | | | | | | |
Goldman Sachs | | Total return on SABMiller PLC | | Floating rate based on 1-month GBP LIBOR-BBA plus 0.55% | | | 06/06/2017 | | | | GBP | | | | 374,181 | | | | — | | | | — | | | | 4,323 | | | | — | |
| | | | | | | | | |
Goldman Sachs | | Total return on Poundland Group PLC | | Floating rate based on 1-month GBP LIBOR-BBA plus 1.00% | | | 06/21/2017 | | | | GBP | | | | 194,447 | | | | — | | | | — | | | | — | | | | (3,124 | ) |
The accompanying Notes to Consolidated Financial Statements are an integral part of this statement.
| | | | | | |
| | |
| | | | ACTIVE PORTFOLIOS® MULTI-MANAGER ALTERNATIVES FUND | | |
CONSOLIDATED PORTFOLIO OF INVESTMENTS (continued)
August 31, 2016
Total Return Swap Contracts Outstanding at August 31, 2016 (continued)
| | | | | | | | | | | | | | | | | | | | | | | | | | | | | | | | |
| Counterparty | | Fund Receives | | Fund Pays | | Expiration
Date | | | Notional
Currency | | | Notional
Amount | | | Premium
Paid
($) | | | Premium
Received
($) | | | Unrealized
Appreciation
($) | | | Unrealized
Depreciation
($) | |
Goldman Sachs | | Total return on Poundland Group PLC | | Floating rate based on 1-month GBP LIBOR-BBA plus 1.00% | | | 06/22/2017 | | | | GBP | | | | 11,421 | | | | — | | | | — | | | | — | | | | (184 | ) |
| | | | | | | | | |
Goldman Sachs | | Total return on Poundland Group PLC | | Floating rate based on 1-month GBP LIBOR-BBA plus 1.00% | | | 06/22/2017 | | | | GBP | | | | 77,517 | | | | — | | | | — | | | | — | | | | (1,246 | ) |
| | | | | | | | | |
Goldman Sachs | | Total return on Poundland Group PLC | | Floating rate based on 1-month GBP LIBOR-BBA plus 1.00% | | | 06/22/2017 | | | | GBP | | | | 52,647 | | | | — | | | | — | | | | — | | | | (846 | ) |
| | | | | | | | | |
Goldman Sachs | | Total return on Poundland Group PLC | | Floating rate based on 1-month GBP LIBOR-BBA plus 1.00% | | | 06/22/2017 | | | | GBP | | | | 50,878 | | | | — | | | | — | | | | — | | | | (818 | ) |
| | | | | | | | | |
Goldman Sachs | | Total return on Poundland Group PLC | | Floating rate based on 1-month GBP LIBOR-BBA plus 1.00% | | | 06/22/2017 | | | | GBP | | | | 16,512 | | | | — | | | | — | | | | — | | | | (265 | ) |
| | | | | | | | | |
Goldman Sachs | | Total return on Poundland Group PLC | | Floating rate based on 1-month GBP LIBOR-BBA plus 1.00% | | | 06/22/2017 | | | | GBP | | | | 79,691 | | | | — | | | | — | | | | — | | | | (1,281 | ) |
| | | | | | | | | |
Goldman Sachs | | Total return on Poundland Group PLC | | Floating rate based on 1-month GBP LIBOR-BBA plus 1.00% | | | 06/22/2017 | | | | GBP | | | | 23,827 | | | | — | | | | — | | | | — | | | | (383 | ) |
| | | | | | | | | |
Goldman Sachs | | Total return on Poundland Group PLC | | Floating rate based on 1-month GBP LIBOR-BBA plus 1.00% | | | 06/22/2017 | | | | GBP | | | | 11,360 | | | | — | | | | — | | | | — | | | | (183 | ) |
| | | | | | | | | |
Goldman Sachs | | Total return on Poundland Group PLC | | Floating rate based on 1-month GBP LIBOR-BBA plus 1.00% | | | 06/22/2017 | | | | GBP | | | | 14,718 | | | | — | | | | — | | | | — | | | | (237 | ) |
| | | | | | | | | |
Goldman Sachs | | Total return on Poundland Group PLC | | Floating rate based on 1-month GBP LIBOR-BBA plus 1.00% | | | 06/22/2017 | | | | GBP | | | | 23,353 | | | | — | | | | — | | | | — | | | | (375 | ) |
| | | | | | | | | |
Goldman Sachs | | Total return on Poundland Group PLC | | Floating rate based on 1-month GBP LIBOR-BBA plus 1.00% | | | 06/22/2017 | | | | GBP | | | | 104,870 | | | | — | | | | — | | | | — | | | | (79 | ) |
| | | | | | | | | |
Goldman Sachs | | Total return on Poundland Group PLC | | Floating rate based on 1-month GBP LIBOR-BBA plus 1.00% | | | 06/22/2017 | | | | GBP | | | | 58,424 | | | | — | | | | — | | | | — | | | | (119 | ) |
| | | | | | | | | |
Goldman Sachs | | Total return on ARM Holdings PLC | | Floating rate based on 1-month GBP LIBOR-BBA plus 0.45% | | | 07/20/2017 | | | | GBP | | | | 621,767 | | | | — | | | | — | | | | 11,111 | | | | — | |
| | | | | | | | | |
Goldman Sachs | | Total return on ARM Holdings PLC | | Floating rate based on 1-month GBP LIBOR-BBA plus 0.45% | | | 07/20/2017 | | | | GBP | | | | 1,593,266 | | | | — | | | | — | | | | 28,472 | | | | — | |
| | | | | | | | | |
Goldman Sachs | | Total return on ARM Holdings PLC | | Floating rate based on 1-month GBP LIBOR-BBA plus 0.45% | | | 07/20/2017 | | | | GBP | | | | 349,732 | | | | — | | | | — | | | | 6,250 | | | | — | |
| | | | | | | | | |
Goldman Sachs | | Total return on ARM Holdings PLC | | Floating rate based on 1-month GBP LIBOR-BBA plus 0.45% | | | 07/20/2017 | | | | GBP | | | | 157,820 | | | | — | | | | — | | | | 2,820 | | | | — | |
| | | | | | | | | |
Goldman Sachs | | Total return on ARM Holdings PLC | | Floating rate based on 1-month GBP LIBOR-BBA plus 0.45% | | | 07/20/2017 | | | | GBP | | | | 418,268 | | | | — | | | | — | | | | 7,475 | | | | — | |
The accompanying Notes to Consolidated Financial Statements are an integral part of this statement.
| | | | | | |
| | |
| | | | ACTIVE PORTFOLIOS® MULTI-MANAGER ALTERNATIVES FUND | | |
CONSOLIDATED PORTFOLIO OF INVESTMENTS (continued)
August 31, 2016
Total Return Swap Contracts Outstanding at August 31, 2016 (continued)
| | | | | | | | | | | | | | | | | | | | | | | | | | | | | | | | |
| Counterparty | | Fund Receives | | Fund Pays | | Expiration
Date | | | Notional
Currency | | | Notional
Amount | | | Premium
Paid
($) | | | Premium
Received
($) | | | Unrealized
Appreciation
($) | | | Unrealized
Depreciation
($) | |
Goldman Sachs | | Total return on ARM Holdings PLC | | Floating rate based on 1-month GBP LIBOR-BBA plus 0.45% | | | 07/20/2017 | | | | GBP | | | | 86,108 | | | | — | | | | — | | | | 1,539 | | | | — | |
| | | | | | | | | |
Goldman Sachs | | Total return on ARM Holdings PLC | | Floating rate based on 1-month GBP LIBOR-BBA plus 0.45% | | | 07/20/2017 | | | | GBP | | | | 328,381 | | | | — | | | | — | | | | 5,868 | | | | — | |
| | | | | | | | | |
Goldman Sachs | | Total return on ARM Holdings PLC | | Floating rate based on 1-month GBP LIBOR-BBA plus 0.45% | | | 07/20/2017 | | | | GBP | | | | 46,682 | | | | — | | | | — | | | | 834 | | | | — | |
| | | | | | | | | |
Goldman Sachs | | Total return on ARM Holdings PLC | | Floating rate based on 1-month GBP LIBOR-BBA plus 0.45% | | | 07/20/2017 | | | | GBP | | | | 181,144 | | | | — | | | | — | | | | 3,237 | | | | — | |
| | | | | | | | | |
Goldman Sachs | | Total return on ARM Holdings PLC | | Floating rate based on 1-month GBP LIBOR-BBA plus 0.45% | | | 07/20/2017 | | | | GBP | | | | 88,215 | | | | — | | | | — | | | | 1,576 | | | | — | |
| | | | | | | | | |
Goldman Sachs | | Total return on ARM Holdings PLC | | Floating rate based on 1-month GBP LIBOR-BBA plus 0.45% | | | 07/20/2017 | | | | GBP | | | | 72,314 | | | | — | | | | — | | | | 1,292 | | | | — | |
| | | | | | | | | |
Goldman Sachs | | Total return on ARM Holdings PLC | | Floating rate based on 1-month GBP LIBOR-BBA plus 0.45% | | | 07/20/2017 | | | | GBP | | | | 69,104 | | | | — | | | | — | | | | 1,237 | | | | — | |
| | | | | | | | | |
Goldman Sachs | | Total return on ARM Holdings PLC | | Floating rate based on 1-month GBP LIBOR-BBA plus 0.45% | | | 07/20/2017 | | | | GBP | | | | 348,664 | | | | — | | | | — | | | | 1,808 | | | | — | |
| | | | | | | | | |
Goldman Sachs | | Total return on ARM Holdings PLC | | Floating rate based on 1-month GBP LIBOR-BBA plus 0.45% | | | 07/20/2017 | | | | GBP | | | | 387,452 | | | | — | | | | — | | | | 2,154 | | | | — | |
| | | | | | | | | |
Goldman Sachs | | Total return on ARM Holdings PLC | | Floating rate based on 1-month GBP LIBOR-BBA plus 0.45% | | | 07/20/2017 | | | | GBP | | | | 79,793 | | | | — | | | | — | | | | 372 | | | | — | |
| | | | | | | | | |
Goldman Sachs | | Total return on ARM Holdings PLC | | Floating rate based on 1-month GBP LIBOR-BBA plus 0.45% | | | 07/20/2017 | | | | GBP | | | | 426,524 | | | | — | | | | — | | | | 2,017 | | | | — | |
| | | | | | | | | |
Goldman Sachs | | Total return on ARM Holdings PLC | | Floating rate based on 1-month GBP LIBOR-BBA plus 0.45% | | | 07/20/2017 | | | | GBP | | | | 83,846 | | | | — | | | | — | | | | 625 | | | | — | |
| | | | | | | | | |
Goldman Sachs | | Total return on ARM Holdings PLC | | Floating rate based on 1-month GBP LIBOR-BBA plus 0.70% | | | 07/20/2017 | | | | GBP | | | | 73,366 | | | | — | | | | — | | | | 520 | | | | — | |
| | | | | | | | | |
Goldman Sachs | | Total return on ARM Holdings PLC | | Floating rate based on 1-month GBP LIBOR-BBA plus 0.70% | | | 07/20/2017 | | | | GBP | | | | 50,679 | | | | — | | | | — | | | | 280 | | | | — | |
| | | | | | | | | |
Goldman Sachs | | Total return on ARM Holdings PLC | | Floating rate based on 1-month GBP LIBOR-BBA plus 0.70% | | | 07/20/2017 | | | | GBP | | | | 91,246 | | | | — | | | | — | | | | 507 | | | | — | |
| | | | | | | | | |
Goldman Sachs | | Total return on ARM Holdings PLC | | Floating rate based on 1-month GBP LIBOR-BBA plus 0.70% | | | 07/20/2017 | | | | GBP | | | | 179,081 | | | | — | | | | — | | | | 563 | | | | — | |
| | | | | | | | | |
Goldman Sachs | | Total return on ARM Holdings PLC | | Floating rate based on 1-month GBP LIBOR-BBA plus 0.70% | | | 07/20/2017 | | | | GBP | | | | 287,928 | | | | — | | | | — | | | | 1,551 | | | | — | |
The accompanying Notes to Consolidated Financial Statements are an integral part of this statement.
| | | | | | |
| | |
| | | | ACTIVE PORTFOLIOS® MULTI-MANAGER ALTERNATIVES FUND | | |
CONSOLIDATED PORTFOLIO OF INVESTMENTS (continued)
August 31, 2016
Total Return Swap Contracts Outstanding at August 31, 2016 (continued)
| | | | | | | | | | | | | | | | | | | | | | | | | | | | | | | | |
| Counterparty | | Fund Receives | | Fund Pays | | Expiration
Date | | | Notional
Currency | | | Notional
Amount | | | Premium
Paid
($) | | | Premium
Received
($) | | | Unrealized
Appreciation
($) | | | Unrealized
Depreciation
($) | |
Goldman Sachs | | Total return on ARM Holdings PLC | | Floating rate based on 1-month GBP LIBOR-BBA plus 0.70% | | | 07/20/2017 | | | | GBP | | | | 224,793 | | | | — | | | | — | | | | 928 | | | | — | |
| | | | | | | | | |
Goldman Sachs | | Total return on Premier Farnell PLC | | Floating rate based on 1-month GBP LIBOR-BBA plus 0.60% | | | 08/31/2017 | | | | GBP | | | | 204,165 | | | | — | | | | — | | | | — | | | | (328 | ) |
| | | | | | | | | |
Total | | | | | | | | | | | | | | | | | | | — | | | | — | | | | 87,359 | | | | (20,618 | ) |
Total Return Swap Contracts on Futures at August 31, 2016
| | | | | | | | | | | | | | | | | | | | | | | | |
| Counterparty | | Reference Instrument | | | Expiration
Date | | | Trading
Currency | | | Notional
Amount | | | Unrealized
Appreciation ($) | | | Unrealized
(Depreciation) ($) | |
Barclays | | | Euro-Schatz | | | | 09/08/2016 | | | | EUR | | | | 98,079,139 | | | | 87,873 | | | | — | |
| | | | | | |
Barclays | | | Euro-Bobl | | | | 09/08/2016 | | | | EUR | | | | 48,578,236 | | | | 491,030 | | | | — | |
| | | | | | |
Barclays | | | Euro-Bund | | | | 09/08/2016 | | | | EUR | | | | 8,401,683 | | | | 211,309 | | | | — | |
| | | | | | |
Barclays | |
| Canadian Government
10-Year Bond |
| | | 12/19/2016 | | | | CAD | | | | 223,837 | | | | 1,156 | | | | — | |
| | | | | | |
Barclays | | | Long Gilt | | | | 12/28/2016 | | | | GBP | | | | 1,036,311 | | | | 659 | | | | — | |
| | | | | | |
Citi | | | Cotton | | | | 12/07/2016 | | | | USD | | | | 1,934,610 | | | | — | | | | (8,328 | ) |
| | | | | | |
Citi | | | Soybean Oil | | | | 12/14/2016 | | | | USD | | | | 1,853,868 | | | | — | | | | (82,913 | ) |
| | | | | | |
Citi | | | Corn | | | | 12/14/2016 | | | | USD | | | | (1,230,450 | ) | | | 70,200 | | | | — | |
| | | | | | |
Citi | | | Cocoa | | | | 12/14/2016 | | | | USD | | | | (202,860 | ) | | | 4,451 | | | | — | |
| | | | | | |
Citi | | | Wheat | | | | 12/14/2016 | | | | USD | | | | (59,625 | ) | | | 6,075 | | | | — | |
| | | | | | |
Citi | | | Wheat | | | | 12/14/2016 | | | | USD | | | | (4,115,450 | ) | | | 531,416 | | | | — | |
| | | | | | |
Citi | | | Coffee | | | | 12/19/2016 | | | | USD | | | | 606,581 | | | | 14,334 | | | | — | |
| | | | | | |
Deutsche Bank | | | Lean Hogs | | | | 10/14/2016 | | | | USD | | | | (678,780 | ) | | | — | | | | (24,969 | ) |
| | | | | | |
Deutsche Bank | | | Cotton | | | | 12/07/2016 | | | | USD | | | | 262,320 | | | | — | | | | (30,490 | ) |
| | | | | | |
Deutsche Bank | | | Soybean Oil | | | | 12/14/2016 | | | | USD | | | | 1,281,930 | | | | — | | | | (58,026 | ) |
| | | | | | |
Deutsche Bank | | | Corn | | | | 12/14/2016 | | | | USD | | | | (2,240,050 | ) | | | 88,017 | | | | — | |
| | | | | | |
Deutsche Bank | | | Cocoa | | | | 12/14/2016 | | | | USD | | | | (86,940 | ) | | | 1,800 | | | | — | |
| | | | | | |
Deutsche Bank | | | Wheat | | | | 12/14/2016 | | | | USD | | | | (496,875 | ) | | | 49,897 | | | | — | |
| | | | | | |
Deutsche Bank | | | Wheat | | | | 12/14/2016 | | | | USD | | | | (815,325 | ) | | | 72,562 | | | | — | |
| | | | | | |
JPMorgan | | | Swiss Market Index | | | | 09/16/2016 | | | | CHF | | | | (2,245,814 | ) | | | — | | | | (15,508 | ) |
| | | | | | |
JPMorgan | | | TAIEX | | | | 09/21/2016 | | | | TWD | | | | 3,111,706 | | | | — | | | | (38,396 | ) |
| | | | | | |
JPMorgan | | | H-Shares Index | | | | 09/29/2016 | | | | HKD | | | | 10,094,682 | | | | — | | | | (4,843 | ) |
| | | | | | |
JPMorgan | | | Hang Seng Index | | | | 09/29/2016 | | | | HKD | | | | 4,285,767 | | | | 15,676 | | | | — | |
| | | | | | |
JPMorgan | | | SGX Nifty Index | | | | 09/29/2016 | | | | USD | | | | 2,936,374 | | | | 50,950 | | | | — | |
| | | | | | |
JPMorgan | | | MSCI Taiwan Index | | | | 09/29/2016 | | | | USD | | | | 10,293,710 | | | | — | | | | (91,695 | ) |
| | | | | | | | | | | | | | | | | | | | | | | | | |
Total | | | | | | | | | | | | | | | | | | | 1,697,405 | | | | (355,168 | ) |
| | | | | | | | | | | | | | | | | | | | | | | | | |
Notes to Consolidated Portfolio of Investments
| (a) | Non-income producing investment. |
| (b) | This security or a portion of this security has been pledged as collateral in connection with derivative contracts and securities sold short. |
| (c) | At August 31, 2016, securities valued at $3,061,762 were held to cover open call options written. |
| (d) | Represents fair value as determined in good faith under procedures approved by the Board of Trustees. At August 31, 2016, the value of these securities amounted to $506,487, which represents 0.07% of net assets. |
The accompanying Notes to Consolidated Financial Statements are an integral part of this statement.
| | | | | | |
| | |
| | | | ACTIVE PORTFOLIOS® MULTI-MANAGER ALTERNATIVES FUND | | |
CONSOLIDATED PORTFOLIO OF INVESTMENTS (continued)
August 31, 2016
Notes to Consolidated Portfolio of Investments (continued)
| (e) | Negligible market value. |
| (f) | Represents privately placed and other securities and instruments exempt from SEC registration (collectively, private placements), such as Section 4(a)(2) and Rule 144A eligible securities, which are often sold only to qualified institutional buyers. The Fund may invest in private placements determined to be liquid as well as those determined to be illiquid. Private placements may be determined to be liquid under guidelines established by the Fund’s Board of Trustees. At August 31, 2016, the value of these securities amounted to $20,265,283 or 2.71% of net assets. |
| (g) | Represents securities that have defaulted on payment of interest. The Fund has stopped accruing interest on these securities. At August 31, 2016, the value of these securities amounted to $9,296,916, which represents 1.24% of net assets. |
| (h) | Variable rate security. |
| (i) | The rate shown is the seven-day current annualized yield at August 31, 2016. |
| (j) | As defined in the Investment Company Act of 1940, an affiliated company is one in which the Fund owns 5% or more of the company’s outstanding voting securities, or a company which is under common ownership or control with the Fund. Holdings and transactions in these affiliated companies during the year ended August 31, 2016 are as follows: |
| | | | | | | | | | | | | | | | | | | | | | |
| Issuer | | Beginning
Cost ($) | | Purchase
Cost ($) | | | Proceeds
From Sales ($) | | | Ending
Cost ($) | | | Dividends —
Affiliated
Issuers ($) | | | Value ($) | |
Columbia Short-Term Cash Fund | | 300,974,302 | | | 874,106,389 | | | | (919,551,526 | ) | | | 255,529,165 | | | | 898,441 | | | | 255,529,165 | |
| (k) | At August 31, 2016, cash or short-term securities were designated to cover open put and/or call options written. |
Abbreviation Legend
| | |
| ADR | | American Depositary Receipt |
Currency Legend
| | |
| AUD | | Australian Dollar |
| BRL | | Brazilian Real |
| CAD | | Canadian Dollar |
| CHF | | Swiss Franc |
| CLP | | Chilean Peso |
| COP | | Colombian Peso |
| EUR | | Euro |
| GBP | | British Pound |
| HKD | | Hong Kong Dollar |
| HUF | | Hungarian Forint |
| IDR | | Indonesian Rupiah |
| ILS | | Israeli Shekel |
| INR | | Indian Rupee |
| JPY | | Japanese Yen |
| KRW | | Korean Won |
| MXN | | Mexican Peso |
| MYR | | Malaysia Ringgits |
| NOK | | Norwegian Krone |
| NZD | | New Zealand Dollar |
| PHP | | Philippine Peso |
| PLN | | Polish Zloty |
| SEK | | Swedish Krona |
| SGD | | Singapore Dollar |
| TRY | | Turkish Lira |
| TWD | | Taiwan Dollar |
| USD | | US Dollar |
| ZAR | | South African Rand |
The accompanying Notes to Consolidated Financial Statements are an integral part of this statement.
| | | | | | |
| | |
| | | | ACTIVE PORTFOLIOS® MULTI-MANAGER ALTERNATIVES FUND | | |
CONSOLIDATED PORTFOLIO OF INVESTMENTS (continued)
August 31, 2016
Fair Value Measurements
The Fund categorizes its fair value measurements according to a three-level hierarchy that maximizes the use of observable inputs and minimizes the use of unobservable inputs by prioritizing that the most observable input be used when available. Observable inputs are those that market participants would use in pricing an investment based on market data obtained from sources independent of the reporting entity. Unobservable inputs are those that reflect the Fund’s assumptions about the information market participants would use in pricing an investment. An investment’s level within the fair value hierarchy is based on the lowest level of any input that is deemed significant to the asset’s or liability’s fair value measurement. The input levels are not necessarily an indication of the risk or liquidity associated with investments at that level. For example, certain U.S. government securities are generally high quality and liquid, however, they are reflected as Level 2 because the inputs used to determine fair value may not always be quoted prices in an active market.
Fair value inputs are summarized in the three broad levels listed below:
| n | | Level 1 — Valuations based on quoted prices for investments in active markets that the Fund has the ability to access at the measurement date (including NAV for open-end mutual funds). Valuation adjustments are not applied to Level 1 investments. |
| n | | Level 2 — Valuations based on other significant observable inputs (including quoted prices for similar securities, interest rates, prepayment speeds, credit risks, etc.). |
| n | | Level 3 — Valuations based on significant unobservable inputs (including the Fund’s own assumptions and judgment in determining the fair value of investments). |
Inputs that are used in determining fair value of an investment may include price information, credit data, volatility statistics, and other factors. These inputs can be either observable or unobservable. The availability of observable inputs can vary between investments, and is affected by various factors such as the type of investment, and the volume and level of activity for that investment or similar investments in the marketplace. The inputs will be considered by the Investment Manager, along with any other relevant factors in the calculation of an investment’s fair value. The Fund uses prices and inputs that are current as of the measurement date, which may include periods of market dislocations. During these periods, the availability of prices and inputs may be reduced for many investments. This condition could cause an investment to be reclassified between the various levels within the hierarchy.
Foreign equity securities actively traded in markets where there is a significant delay in the local close relative to the New York Stock Exchange (NYSE) are classified as Level 2. The values of these securities may include an adjustment to reflect the impact of significant market movements following the close of local trading, as described in Note 2 to the financial statements — Security Valuation.
Certain investments that have been measured at fair value using the net asset value per share (or its equivalent) are not categorized in the fair value hierarchy. The fair value amounts presented in the table are intended to reconcile the fair value hierarchy to the amounts presented in the Consolidated Portfolio of Investments. The Columbia Short-Term Cash Fund seeks to provide shareholders with maximum current income consistent with liquidity and stability of principal. Investments in Columbia Short-Term Cash Fund may be redeemed on a daily basis without restriction.
Investments falling into the Level 3 category are primarily supported by quoted prices from brokers and dealers participating in the market for those investments. However, these may be classified as Level 3 investments due to lack of market transparency and corroboration to support these quoted prices. Additionally, valuation models may be used as the pricing source for any remaining investments classified as Level 3. These models may rely on one or more significant unobservable inputs and/or significant assumptions by the Investment Manager. Inputs used in valuations may include, but are not limited to, financial statement analysis, capital account balances, discount rates and estimated cash flows, and comparable company data.
Under the direction of the Fund’s Board of Trustees (the Board), the Investment Manager’s Valuation Committee (the Committee) is responsible for overseeing the valuation procedures approved by the Board. The Committee consists of voting and non-voting members from various groups within the Investment Manager’s organization, including operations and accounting, trading and investments, compliance, risk management and legal.
The Committee meets at least monthly to review and approve valuation matters, which may include a description of specific valuation determinations, data regarding pricing information received from approved pricing vendors and brokers and the results of Board-approved valuation control policies and procedures (the Policies). The Policies address, among other things, instances when market quotations are or are not readily available, including recommendations of third party pricing vendors and a determination of appropriate pricing methodologies; events that require specific valuation determinations and assessment of fair value techniques; securities with a potential for stale pricing, including those that are illiquid, restricted, or in default; and the effectiveness of third party pricing vendors, including periodic reviews of vendors. The Committee meets more frequently, as needed, to discuss additional valuation matters, which may include the need to review back-testing results, review time-sensitive information or approve related valuation actions. The Committee reports to the Board, with members of the Committee meeting with the Board at each of its regularly scheduled meetings to discuss valuation matters and actions during the period, similar to those described earlier.
For investments categorized as Level 3, the Committee monitors information similar to that described above, which may include: (i) data specific to the issuer or comparable issuers, (ii) general market or specific sector news and (iii) quoted prices and specific or similar security transactions. The Committee considers this data and any changes from prior periods in order to assess the reasonableness of observable and unobservable inputs, any assumptions or internal models used to value those securities and changes in fair value. This data is also used to corroborate, when available, information received from approved pricing vendors and brokers. Various factors impact the frequency of monitoring this information (which may occur as often as daily). However, the Committee may determine that changes to inputs, assumptions and models are not required as a result of the monitoring procedures performed.
The accompanying Notes to Consolidated Financial Statements are an integral part of this statement.
| | | | | | |
| | |
| | | | ACTIVE PORTFOLIOS® MULTI-MANAGER ALTERNATIVES FUND | | |
CONSOLIDATED PORTFOLIO OF INVESTMENTS (continued)
August 31, 2016
Fair Value Measurements (continued)
The following table is a summary of the inputs used to value the Fund’s investments at August 31, 2016:
| | | | | | | | | | | | | | | | |
| | | Level 1
Quoted Prices in Active
Markets for Identical
Assets ($) | | | Level 2 Other Significant
Observable Inputs ($) | | | Level 3 Significant
Unobservable Inputs ($) | | | Total ($) | |
Investments | | | | | | | | | | | | | | | | |
| | | | |
Common Stocks | | | | | | | | | | | | | | | | |
| | | | |
Consumer Discretionary | | | 60,656,652 | | | | 616,572 | | | | — | | | | 61,273,224 | |
| | | | |
Consumer Staples | | | 13,641,109 | | | | 8,958,827 | | | | 305,504 | | | | 22,905,440 | |
| | | | |
Energy | | | 16,082,254 | | | | — | | | | — | | | | 16,082,254 | |
| | | | |
Financials | | | 35,326,643 | | | | — | | | | — | | | | 35,326,643 | |
| | | | |
Health Care | | | 44,893,712 | | | | — | | | | 200,983 | | | | 45,094,695 | |
| | | | |
Industrials | | | 10,379,014 | | | | — | | | | — | | | | 10,379,014 | |
| | | | |
Information Technology | | | 82,383,216 | | | | 863,906 | | | | — | | | | 83,247,122 | |
| | | | |
Materials | | | 25,711,814 | | | | — | | | | — | | | | 25,711,814 | |
| | | | |
Telecommunication Services | | | 4,478,663 | | | | — | | | | — | | | | 4,478,663 | |
| | | | |
Utilities | | | 23,765,246 | | | | — | | | | — | | | | 23,765,246 | |
| | | | | | | | | | | | | | | | | |
Total Common Stocks | | | 317,318,323 | | | | 10,439,305 | | | | 506,487 | | | | 328,264,115 | |
| | | | | | | | | | | | | | | | | |
Corporate Bonds & Notes | | | — | | | | 36,030,907 | | | | — | | | | 36,030,907 | |
| | | | |
Convertible Bonds | | | — | | | | 3,826,956 | | | | — | | | | 3,826,956 | |
| | | | |
Exchange-Traded Funds | | | 2,485,622 | | | | — | | | | — | | | | 2,485,622 | |
| | | | |
Treasury Bills | | | 82,412,437 | | | | — | | | | — | | | | 82,412,437 | |
| | | | |
Options Purchased Calls | | | 194,080 | | | | — | | | | — | | | | 194,080 | |
| | | | |
Options Purchased Puts | | | 49,293 | | | | — | | | | — | | | | 49,293 | |
| | | | |
Money Market Funds | | | 2,803,274 | | | | — | | | | — | | | | 2,803,274 | |
| | | | |
Investments measured at NAV per share practical expedient | | | | | | | | | | | | | | | | |
| | | | |
Money Market Funds | | | — | | | | — | | | | — | | | | 255,529,165 | |
| | | | | | | | | | | | | | | | | |
Total Investments | | | 405,263,029 | | | | 50,297,168 | | | | 506,487 | | | | 711,595,849 | |
| | | | | | | | | | | | | | | | | |
Investments Sold Short | | | | | | | | | | | | | | | | |
| | | | |
Common Stocks | | | | | | | | | | | | | | | | |
| | | | |
Consumer Discretionary | | | (35,472,789 | ) | | | — | | | | — | | | | (35,472,789 | ) |
| | | | |
Consumer Staples | | | (19,732,689 | ) | | | — | | | | — | | | | (19,732,689 | ) |
| | | | |
Energy | | | (4,021,437 | ) | | | — | | | | — | | | | (4,021,437 | ) |
| | | | |
Financials | | | (8,304,766 | ) | | | — | | | | — | | | | (8,304,766 | ) |
| | | | |
Health Care | | | (24,156,006 | ) | | | — | | | | — | | | | (24,156,006 | ) |
| | | | |
Industrials | | | (12,673,122 | ) | | | — | | | | — | | | | (12,673,122 | ) |
| | | | |
Information Technology | | | (24,702,883 | ) | | | — | | | | — | | | | (24,702,883 | ) |
| | | | |
Materials | | | (1,996,502 | ) | | | — | | | | — | | | | (1,996,502 | ) |
| | | | |
Telecommunication Services | | | (3,053,403 | ) | | | — | | | | — | | | | (3,053,403 | ) |
| | | | |
Utilities | | | (6,476,219 | ) | | | — | | | | — | | | | (6,476,219 | ) |
| | | | | | | | | | | | | | | | | |
Total Common Stocks | | | (140,589,816 | ) | | | — | | | | — | | | | (140,589,816 | ) |
| | | | | | | | | | | | | | | | | |
Corporate Bonds & Notes | | | — | | | | (4,309,988 | ) | | | — | | | | (4,309,988 | ) |
| | | | |
Exchange-Traded Funds | | | (1,801,521 | ) | | | — | | | | — | | | | (1,801,521 | ) |
| | | | | | | | | | | | | | | | | |
Total Investments Sold Short | | | (142,391,337 | ) | | | (4,309,988 | ) | | | — | | | | (146,701,325 | ) |
| | | | | | | | | | | | | | | | | |
Total Investments, Net of Investments Sold Short | | | 262,871,692 | | | | 45,987,180 | | | | 506,487 | | | | 564,894,524 | |
| | | | | | | | | | | | | | | | | |
The accompanying Notes to Consolidated Financial Statements are an integral part of this statement.
| | | | | | |
| | |
| | | | ACTIVE PORTFOLIOS® MULTI-MANAGER ALTERNATIVES FUND | | |
CONSOLIDATED PORTFOLIO OF INVESTMENTS (continued)
August 31, 2016
Fair Value Measurements (continued)
| | | | | | | | | | | | | | | | |
| | | Level 1
Quoted Prices in Active
Markets for Identical
Assets ($) | | | Level 2 Other Significant
Observable Inputs ($) | | | Level 3 Significant
Unobservable Inputs ($) | | | Total ($) | |
Derivatives | | | | | | | | | | | | | | | | |
| | | | |
Assets | | | | | | | | | | | | | | | | |
| | | | |
Forward Foreign Currency Exchange Contracts | | | — | | | | 12,516,574 | | | | — | | | | 12,516,574 | |
| | | | |
Futures Contracts | | | 8,114,411 | | | | — | | | | — | | | | 8,114,411 | |
| | | | |
Swap Contracts | | | — | | | | 1,784,764 | | | | — | | | | 1,784,764 | |
| | | | |
Liabilities | | | | | | | | | | | | | | | | |
| | | | |
Forward Foreign Currency Exchange Contracts | | | — | | | | (12,438,526 | ) | | | — | | | | (12,438,526 | ) |
| | | | |
Futures Contracts | | | (2,807,335 | ) | | | — | | | | — | | | | (2,807,335 | ) |
| | | | |
Options Contracts Written | | | (62,988 | ) | | | — | | | | (150 | ) | | | (63,138 | ) |
| | | | |
Swap Contracts | | | — | | | | (375,786 | ) | | | — | | | | (375,786 | ) |
| | | | | | | | | | | | | | | | | |
Total | | | 268,115,780 | | | | 47,474,206 | | | | 506,337 | | | | 571,625,488 | |
| | | | | | | | | | | | | | | | | |
See the Consolidated Portfolio of Investments for all investment classifications not indicated in the table.
The Fund’s assets assigned to the Level 2 input category are generally valued using the market approach, in which a security’s value is determined through reference to prices and information from market transactions for similar or identical assets. These assets include certain foreign securities for which a third party statistical pricing service may be employed for purposes of fair market valuation. The model utilized by such third party statistical pricing service takes into account a security’s correlation to available market data including, but not limited to, intraday index, ADR, and exchange-traded fund movements.
Forward foreign currency exchange contracts, futures contracts and swap contracts are valued at unrealized appreciation (depreciation).
Financial assets were transferred from Level 2 to Level 1 as the market for these assets was deemed to be active during the period and fair values were consequently obtained using quoted prices for identical assets rather than being based upon other observable market inputs as of period end.
The following table shows transfers between Level 1 and Level 2 of the fair value hierarchy:
| | | | | | |
| Transfers In | | Transfers Out |
| Level 1 ($) | | Level 2 ($) | | Level 1 ($) | | Level 2 ($) |
| 736,678 | | — | | — | | 736,678 |
| | | | | | | |
Transfers between Level 1 and Level 2 are determined based on the fair value at the beginning of the period for security positions held throughout the period.
The Fund does not hold any significant investments (greater than one percent of net assets) categorized as Level 3.
The Fund’s assets assigned to the Level 3 category are valued utilizing the valuation technique deemed the most appropriate in the circumstances. Certain common stocks and options classified as Level 3 are valued using the market approach. To determine fair value for these securities, management considered various factors which may have included, but were not limited to, estimated cash flows of the securities, observed yields on securities deemed comparable, the subscription price of the security, closing prices of similar securities from the issuer. Significant increases (decreases) to any of these inputs would result in a significantly lower (higher) fair value measurement.
There were no transfers of financial assets between Levels 2 and 3 during the period.
The accompanying Notes to Consolidated Financial Statements are an integral part of this statement.
| | | | | | |
| | |
| | | | ACTIVE PORTFOLIOS® MULTI-MANAGER ALTERNATIVES FUND | | |
CONSOLIDATED STATEMENT OF ASSETS AND LIABILITIES
August 31, 2016
| | | | |
Assets | | | | |
Investments, at value | | | | |
Unaffiliated issuers (identified cost $443,939,607) | | | $455,823,311 | |
Affiliated issuers (identified cost $255,529,165) | | | 255,529,165 | |
Options purchased (identified cost $297,283) | | | 243,373 | |
| |
Total investments (identified cost $699,766,055) | | | 711,595,849 | |
Cash | | | 237,557 | |
Foreign currency (identified cost $271,432) | | | 267,914 | |
Cash collateral held at broker | | | 160,089,175 | |
Margin deposits | | | 19,623,342 | |
Unrealized appreciation on forward foreign currency exchange contracts | | | 12,516,574 | |
Unrealized appreciation on swap contracts | | | 1,784,764 | |
Receivable for: | | | | |
Investments sold | | | 12,156,981 | |
Capital shares sold | | | 985,915 | |
Dividends | | | 370,314 | |
Interest | | | 516,042 | |
Foreign tax reclaims | | | 2,906 | |
Variation margin | | | 881,681 | |
Prepaid expenses | | | 6,915 | |
Trustees’ deferred compensation plan | | | 23,605 | |
| |
Total assets | | | 921,059,534 | |
| |
| |
Liabilities | | | | |
Securities sold short, at value (proceeds $134,502,709) | | | 146,701,325 | |
Option contracts written, at value (premiums received $109,708) | | | 63,138 | |
Unrealized depreciation on forward foreign currency exchange contracts | | | 12,438,526 | |
Unrealized depreciation on swap contracts | | | 375,786 | |
Payable for: | | | | |
Investments purchased | | | 8,910,586 | |
Capital shares purchased | | | 2,285,635 | |
Dividends and interest on securities sold short | | | 282,120 | |
Collateral and deposits | | | 830,767 | |
Variation margin | | | 1,493,361 | |
Management services fees | | | 22,178 | |
Distribution and/or service fees | | | 5,118 | |
Transfer agent fees | | | 58,326 | |
Compensation of board members | | | 167 | |
Chief compliance officer expenses | | | 60 | |
Other expenses | | | 92,611 | |
Trustees’ deferred compensation plan | | | 23,605 | |
| |
Total liabilities | | | 173,583,309 | |
| |
Net assets applicable to outstanding capital stock | | | $747,476,225 | |
| |
| |
Represented by | | | | |
Paid-in capital | | | $802,997,806 | |
Excess of distributions over net investment income | | | (42,446,542 | ) |
Accumulated net realized loss | | | (19,507,545 | ) |
Unrealized appreciation (depreciation) on: | | | | |
Investments | | | 11,883,704 | |
Foreign currency translations | | | (39,344 | ) |
Forward foreign currency exchange contracts | | | 78,048 | |
Futures contracts | | | 5,307,076 | |
Options purchased | | | (53,910 | ) |
Options contracts written | | | 46,570 | |
Securities sold short | | | (12,198,616 | ) |
Swap contracts | | | 1,408,978 | |
| |
Total — representing net assets applicable to outstanding capital stock | | | $747,476,225 | |
| |
| |
Class A | | | | |
Net assets | | | $747,476,225 | |
Shares outstanding | | | 79,100,925 | |
Net asset value per share | | | $9.45 | |
| |
The accompanying Notes to Consolidated Financial Statements are an integral part of this statement.
| | | | | | |
| | |
| | | | ACTIVE PORTFOLIOS® MULTI-MANAGER ALTERNATIVES FUND | | |
CONSOLIDATED STATEMENT OF OPERATIONS
Year Ended August 31, 2016
| | | | |
Net investment income | | | | |
| |
Income: | | | | |
| |
Dividends — unaffiliated issuers | | | $7,329,759 | |
| |
Dividends — affiliated issuers | | | 898,441 | |
| |
Interest | | | 1,843,929 | |
| |
Foreign taxes withheld | | | (63,450 | ) |
| |
Total income | | | 10,008,679 | |
| |
| |
Expenses: | | | | |
| |
Management services fees | | | 8,278,277 | |
| |
Distribution and/or service fees | | | | |
| |
Class A | | | 1,911,440 | |
| |
Transfer agent fees | | | | |
| |
Class A | | | 788,093 | |
| |
Compensation of board members | | | 30,022 | |
| |
Custodian fees | | | 68,968 | |
| |
Printing and postage fees | | | 75,875 | |
| |
Registration fees | | | 60,388 | |
| |
Audit fees | | | 73,624 | |
| |
Legal fees | | | 20,862 | |
| |
Dividends and interest on securities sold short | | | 2,440,981 | |
| |
Chief compliance officer expenses | | | 371 | |
| |
Other | | | 26,758 | |
| |
Total expenses | | | 13,775,659 | |
| |
Net investment loss | | | (3,766,980 | ) |
| |
| |
Realized and unrealized gain (loss) — net | | | | |
| |
Net realized gain (loss) on: | | | | |
| |
Investments | | | (20,381,884 | ) |
| |
Foreign currency translations | | | 908,757 | |
| |
Forward foreign currency exchange contracts | | | (4,157,206 | ) |
| |
Futures contracts | | | (1,198,970 | ) |
| |
Options purchased | | | (2,796,037 | ) |
| |
Options contracts written | | | 1,136,593 | |
| |
Securities sold short | | | (287,858 | ) |
| |
Swap contracts | | | (1,665,825 | ) |
| |
Net realized loss | | | (28,442,430 | ) |
| |
Net change in unrealized appreciation (depreciation) on: | | | | |
| |
Investments | | | 52,542,970 | |
| |
Foreign currency translations | | | 28,764 | |
| |
Forward foreign currency exchange contracts | | | (1,374,181 | ) |
| |
Futures contracts | | | 750,764 | |
| |
Options purchased | | | (705,314 | ) |
| |
Options contracts written | | | 552,008 | |
| |
Securities sold short | | | (16,195,017 | ) |
| |
Swap contracts | | | 1,734,146 | |
| |
Net change in unrealized appreciation | | | 37,334,140 | |
| |
Net realized and unrealized gain | | | 8,891,710 | |
| |
Net increase in net assets resulting from operations | | | $5,124,730 | |
| |
The accompanying Notes to Consolidated Financial Statements are an integral part of this statement.
| | | | | | |
| | |
| | | | ACTIVE PORTFOLIOS® MULTI-MANAGER ALTERNATIVES FUND | | |
CONSOLIDATED STATEMENT OF CHANGES IN NET ASSETS
| | | | | | | | |
| | | Year Ended
August 31, 2016 | | | Year Ended
August 31, 2015 | |
Operations | | | | | | | | |
| | |
Net investment income (loss) | | | $(3,766,980 | ) | | | $2,068,494 | |
| | |
Net realized gain (loss) | | | (28,442,430 | ) | | | 50,842,800 | |
| | |
Net change in unrealized appreciation (depreciation) | | | 37,334,140 | | | | (71,280,109 | ) |
| |
Net increase (decrease) in net assets resulting from operations | | | 5,124,730 | | | | (18,368,815 | ) |
| |
| | |
Distributions to shareholders | | | | | | | | |
| | |
Net investment income | | | | | | | | |
| | |
Class A | | | (52,422,234 | ) | | | (7,150,893 | ) |
| | |
Net realized gains | | | | | | | | |
| | |
Class A | | | — | | | | (33,605,548 | ) |
| |
Total distributions to shareholders | | | (52,422,234 | ) | | | (40,756,441 | ) |
| |
Increase in net assets from capital stock activity | | | 9,833,439 | | | | 66,254,197 | |
| |
Total increase (decrease) in net assets | | | (37,464,065 | ) | | | 7,128,941 | |
| | |
Net assets at beginning of year | | | 784,940,290 | | | | 777,811,349 | |
| |
Net assets at end of year | | | $747,476,225 | | | | $784,940,290 | |
| |
Undistributed (excess of distributions over) net investment income | | | $(42,446,542 | ) | | | $15,226,126 | |
| |
The accompanying Notes to Consolidated Financial Statements are an integral part of this statement.
| | | | | | |
| | |
| | | | ACTIVE PORTFOLIOS® MULTI-MANAGER ALTERNATIVES FUND | | |
CONSOLIDATED STATEMENT OF CHANGES IN NET ASSETS (continued)
| | | | | | | | | | | | | | | | |
| | | Year Ended August 31, 2016 | | | Year Ended August 31, 2015 | |
| | | Shares | | | Dollars ($) | | | Shares | | | Dollars ($) | |
Capital stock activity | |
|
Class A shares | |
| | | | |
Subscriptions | | | 20,877,104 | | | | 197,467,461 | | | | 18,474,845 | | | | 194,295,243 | |
| | | | |
Distributions reinvested | | | 5,773,356 | | | | 52,422,072 | | | | 3,896,396 | | | | 40,756,301 | |
| | | | |
Redemptions | | | (25,487,363 | ) | | | (240,056,094 | ) | | | (15,908,226 | ) | | | (168,797,347 | ) |
| |
Net increase | | | 1,163,097 | | | | 9,833,439 | | | | 6,463,015 | | | | 66,254,197 | |
| |
Total net increase | | | 1,163,097 | | | | 9,833,439 | | | | 6,463,015 | | | | 66,254,197 | |
| |
The accompanying Notes to Consolidated Financial Statements are an integral part of this statement.
| | | | | | |
| | |
| | | | ACTIVE PORTFOLIOS® MULTI-MANAGER ALTERNATIVES FUND | | |
CONSOLIDATED FINANCIAL HIGHLIGHTS
The following table is intended to help you understand the Fund’s financial performance. Certain information reflects financial results for a single share of a class held for the periods shown. Per share net investment income (loss) amounts are calculated based on average shares outstanding during the period. Total return assumes reinvestment of all dividends and distributions, if any. Total return does not reflect payment of sales charges, if any. Total return and portfolio turnover are not annualized for periods of less than one year. The portfolio turnover rate is calculated without regard to purchase and sales transactions of short-term instruments and certain derivatives, if any. If such transactions were included, the Fund’s portfolio turnover rate may be higher.
| | | | | | | | | | | | | | | | | | | | |
| | | Year Ended August 31, | |
Class A | | | 2016 | | | | 2015 | | | | 2014 | | | | 2013 | | | | 2012(a) | |
Per share data | |
Net asset value, beginning of period | | | $10.07 | | | | $10.88 | | | | $10.49 | | | | $10.03 | | | | $10.00 | |
| | | | | | | | | | | | | | | | | | | | | |
Income from investment operations: | |
| | | | | |
Net investment income (loss) | | | (0.05 | ) | | | 0.03 | (b) | | | (0.03 | ) | | | 0.02 | | | | 0.01 | |
| | | | | | | | | | | | | | | | | | | | | |
Net realized and unrealized gain (loss) | | | 0.10 | | | | (0.26 | ) | | | 0.67 | | | | 0.53 | | | | 0.02 | |
| | | | | | | | | | | | | | | | | | | | | |
Total from investment operations | | | 0.05 | | | | (0.23 | ) | | | 0.64 | | | | 0.55 | | | | 0.03 | |
| | | | | | | | | | | | | | | | | | | | | |
Less distributions to shareholders: | |
| | | | | |
Net investment income | | | (0.67 | ) | | | (0.10 | ) | | | (0.13 | ) | | | (0.08 | ) | | | — | |
| | | | | | | | | | | | | | | | | | | | | |
Net realized gains | | | — | | | | (0.48 | ) | | | (0.12 | ) | | | (0.01 | ) | | | — | |
| | | | | | | | | | | | | | | | | | | | | |
Total distributions to shareholders | | | (0.67 | ) | | | (0.58 | ) | | | (0.25 | ) | | | (0.09 | ) | | | — | |
| | | | | | | | | | | | | | | | | | | | | |
Net asset value, end of period | | | $9.45 | | | | $10.07 | | | | $10.88 | | | | $10.49 | | | | $10.03 | |
| | | | | | | | | | | | | | | | | | | | | |
Total return | | | 0.79 | % | | | (2.30 | %) | | | 6.15 | % | | | 5.53 | % | | | 0.30 | % |
| | | | | | | | | | | | | | | | | | | | | |
Ratios to average net assets(c) | |
| | | | | |
Total gross expenses | | | 1.80 | %(d) | | | 1.83 | %(d) | | | 1.79 | %(d) | | | 1.70 | %(d) | | | 1.73 | %(d)(e) |
| | | | | | | | | | | | | | | | | | | | | |
Total net expenses(f) | | | 1.80 | %(d) | | | 1.83 | %(d) | | | 1.79 | %(d) | | | 1.67 | %(d) | | | 1.63 | %(d)(e) |
| | | | | | | | | | | | | | | | | | | | | |
Net investment income (loss) | | | (0.49 | %) | | | 0.27 | % | | | (0.27 | %) | | | 0.17 | % | | | 0.31 | %(e) |
| | | | | | | | | | | | | | | | | | | | | |
Supplemental data | |
| | | | | |
Net assets, end of period (in thousands) | | | $747,476 | | | | $784,940 | | | | $777,811 | | | | $666,228 | | | | $476,520 | |
| | | | | | | | | | | | | | | | | | | | | |
Portfolio turnover | | | 289 | % | | | 304 | % | | | 246 | % | | | 239 | % | | | 141 | % |
| | | | | | | | | | | | | | | | | | | | | |
Notes to Consolidated Financial Highlights
| (a) | Based on operations from April 23, 2012 (commencement of operations) through the stated period end. |
| (b) | Net investment income per share includes special dividends. The effect of these dividends amounted to $0.08 per share. |
| (c) | In addition to the fees and expenses that the Fund bears directly, the Fund indirectly bears a pro rata share of the fees and expenses of any other funds in which it invests. Such indirect expenses are not included in the Fund’s reported expense ratios. |
| (d) | Ratios include dividends and interest on securities sold short. If dividends and interest on securities sold short had been excluded, expenses would have been lower by 0.32%, 0.35%, 0.31%, 0.17% and 0.13% for the years ended August 31, 2016, 2015, 2014, 2013 and 2012, respectively. |
| (f) | Total net expenses include the impact of certain fee waivers/expense reimbursements made by the Investment Manager and certain of its affiliates, if applicable. |
The accompanying Notes to Consolidated Financial Statements are an integral part of this statement.
| | | | | | |
| | |
| | | | ACTIVE PORTFOLIOS® MULTI-MANAGER ALTERNATIVES FUND | | |
NOTES TO CONSOLIDATED FINANCIAL STATEMENTS
August 31, 2016
Note 1. Organization
Active Portfolios® Multi-Manager Alternatives Fund (formerly known as Active Portfolios® Multi-Manager Alternative Strategies Fund) (the Fund), a series of Columbia Funds Series Trust I (the Trust), is a non-diversified fund. The Trust is registered under the Investment Company Act of 1940, as amended (the 1940 Act), as an open-end management investment company organized as a Massachusetts business trust. Effective October 12, 2016, Active Portfolios® Multi-Manager Alternative Strategies Fund was renamed Active Portfolios® Multi-Manager Alternatives Fund.
Basis for Consolidation
ASGM Offshore Fund, Ltd. and ASMF Offshore Fund, Ltd. (each, a Subsidiary) are each a Cayman Islands exempted company and wholly-owned subsidiary of the Fund. Each Subsidiary acts as an investment vehicle in order to effect certain investment strategies consistent with the Fund’s investment objective and policies as stated in its current prospectus and statement of additional information. In accordance with the Memorandum and Articles of Association of the Subsidiary (the Articles), the Fund owns the sole issued share of each Subsidiary and retains all rights associated with such share, including the right to receive notice of, attend and vote at general meetings of the Subsidiaries, rights in a winding-up or repayment of capital and the right to participate in the profits or assets of the Subsidiaries. The consolidated financial statements (financial statements) include the accounts of the consolidated Fund and each respective Subsidiary. Subsequent references to the Fund within the Notes to Consolidated Financial Statements collectively refer to the Fund and each Subsidiary. All intercompany transactions and balances have been eliminated in the consolidation process.
At August 31, 2016, each Subsidiary’s financial statement information is as follows:
| | | | | | | | |
| | | ASGM Offshore
Fund, Ltd. | | | ASMF Offshore
Fund, Ltd. | |
% of consolidated fund net assets | | | 0.01 | % | | | 8.94 | % |
Net assets | | | $54,335 | | | | $66,789,676 | |
Net investment income (loss) | | | (4,095 | ) | | | (571,813 | ) |
Net realized gain (loss) | | | — | | | | 6,549,628 | |
Net change in unrealized appreciation (depreciation) | | | — | | | | (784,023 | ) |
The financial statements present the portfolio holdings, financial position and results of operations of the Fund and the Subsidiaries on a consolidated basis.
Fund Shares
The Trust may issue an unlimited number of shares (without par value). The Fund only offers Class A shares that are available only to certain eligible investors through certain wrap fee programs sponsored and/or managed by Ameriprise Financial, Inc. (Ameriprise Financial) or its affiliates.
Class A shares are not subject to any front-end sales charge or contingent deferred sales charge.
Note 2. Summary of Significant Accounting Policies
Basis of Preparation
The Fund is an investment company that applies the accounting and reporting guidance in the Financial Accounting Standards Board (FASB) Accounting Standards Codification Topic 946, Financial Services — Investment Companies (ASC 946). The financial statements are prepared in accordance with U.S. generally accepted accounting principles (GAAP), which requires management to make certain estimates and assumptions that affect the reported amounts of assets and liabilities, the disclosure of contingent assets and liabilities at the date of the financial statements and the reported amounts of income and expenses during the reporting period. Actual results could differ from those estimates.
The following is a summary of significant accounting policies followed by the Fund in the preparation of its financial statements.
Security Valuation
All equity securities and exchange-traded funds are valued at the close of business of the New York Stock Exchange (NYSE). Equity securities and exchange-traded funds are valued at the last quoted sales price on the principal exchange or market on which they trade, except for securities traded on the NASDAQ Stock Market, which are valued at the NASDAQ official close price. Unlisted securities or listed securities for which there were no sales during the day are valued at the mean of the latest quoted bid and ask prices on such exchanges or markets.
Debt securities generally are valued by pricing services approved by the Board of Trustees (the Board) based
| | | | | | |
| | |
| | | | ACTIVE PORTFOLIOS® MULTI-MANAGER ALTERNATIVES FUND | | |
NOTES TO CONSOLIDATED FINANCIAL STATEMENTS (continued)
August 31, 2016
upon market transactions for normal, institutional-size trading units of similar securities. The services may use various pricing techniques that take into account, as applicable, factors such as yield, quality, coupon rate, maturity, type of issue, trading characteristics and other data, as well as approved independent broker-dealer quotes. Debt securities for which quotations are not readily available or not believed to be reflective of market value may also be valued based upon a bid quote from an approved independent broker-dealer. Debt securities maturing in 60 days or less are valued primarily at amortized cost value, unless this method results in a valuation that management believes does not approximate market value.
Foreign equity securities are valued based on the closing price on the foreign exchange in which such securities are primarily traded. If any foreign equity security closing prices are not readily available, the securities are valued at the mean of the latest quoted bid and ask prices on such exchanges or markets. Foreign currency exchange rates are generally determined at 4:00 p.m. Eastern (U.S.) time. Many securities markets and exchanges outside the U.S. close prior to the close of the NYSE; therefore, the closing prices for securities in such markets or on such exchanges may not fully reflect events that occur after such close but before the close of the NYSE. In those situations, foreign securities will be fair valued pursuant to a policy adopted by the Board, including, if available, utilizing a third party pricing service to determine these fair values. The third party pricing service takes into account multiple factors, including, but not limited to, movements in the U.S. securities markets, certain depositary receipts, futures contracts and foreign exchange rates that have occurred subsequent to the close of the foreign exchange or market, to determine a good faith estimate that reasonably reflects the current market conditions as of the close of the NYSE. The fair value of a security is likely to be different from the quoted or published price, if available.
Investments in open-end investment companies, including money market funds, are valued at their latest net asset value.
Forward foreign currency exchange contracts are marked-to-market based upon foreign currency exchange rates provided by a pricing service.
Futures and options on futures contracts are valued based upon the settlement price at the close of regular trading on their principal exchanges or, in the absence of transactions, at the mean of the latest quoted bid and ask prices.
Option contracts are valued at the mean of the latest quoted bid and ask prices on their primary exchanges. Option contracts, including over-the-counter option contracts, with no readily available market quotations are valued using quotes obtained from independent brokers as of the close of the NYSE.
Swap transactions are valued through an independent pricing service or broker, or if neither is available, through an internal model based upon observable inputs.
Investments for which market quotations are not readily available, or that have quotations which management believes are not reflective of market value or reliable, are valued at fair value as determined in good faith under procedures approved by and under the general supervision of the Board. If a security or class of securities (such as foreign securities) is valued at fair value, such value is likely to be different from the quoted or published price for the security.
The determination of fair value often requires significant judgment. To determine fair value, management may use assumptions including but not limited to future cash flows and estimated risk premiums. Multiple inputs from various sources may be used to determine fair value.
GAAP requires disclosure regarding the inputs and valuation techniques used to measure fair value and any changes in valuation inputs or techniques. In addition, investments shall be disclosed by major category. This information is disclosed following the Fund’s Consolidated Portfolio of Investments.
Foreign Currency Transactions and Translations
The values of all assets and liabilities denominated in foreign currencies are generally translated into U.S. dollars at exchange rates determined at the close of the NYSE on any given day. Net realized and unrealized gains (losses) on foreign currency transactions and translations include gains (losses) arising from the fluctuation in exchange rates between trade and settlement dates on securities transactions, gains (losses) arising from the disposition of foreign currency and currency gains (losses) between the accrual and payment dates on dividends, interest income and foreign withholding taxes.
For financial statement purposes, the Fund does not distinguish that portion of gains (losses) on investments which is due to changes in foreign exchange rates from that which is due to changes in market prices of the investments. Such fluctuations are included with the net realized and unrealized gains (losses) on investments in the Consolidated Statement of Operations.
| | | | | | |
| | |
| | | | ACTIVE PORTFOLIOS® MULTI-MANAGER ALTERNATIVES FUND | | |
NOTES TO CONSOLIDATED FINANCIAL STATEMENTS (continued)
August 31, 2016
Derivative Instruments
The Fund invests in certain derivative instruments, as detailed below, to meet its investment objectives. Derivatives are instruments whose values depend on, or are derived from, in whole or in part, the value of one or more securities, currencies, commodities, indices, or other assets or instruments. Derivatives may be used to increase investment flexibility (including to maintain cash reserves while maintaining desired exposure to certain assets), for risk management (hedging) purposes, to facilitate trading, to reduce transaction costs and to pursue higher investment returns. The Fund may also use derivative instruments to mitigate certain investment risks, such as foreign currency exchange rate risk, interest rate risk and credit risk. Derivatives may involve various risks, including the potential inability of the counterparty to fulfill its obligations under the terms of the contract, the potential for an illiquid secondary market (making it difficult for the Fund to sell or terminate, including at favorable prices) and the potential for market movements which may expose the Fund to gains or losses in excess of the amount shown in the Consolidated Statement of Assets and Liabilities. The notional amounts of derivative instruments, if applicable, are not recorded in the financial statements.
A derivative instrument may suffer a marked-to-market loss if the value of the contract decreases due to an unfavorable change in the market rates or values of the underlying instrument. Losses can also occur if the counterparty does not perform its obligations under the contract. The Fund’s risk of loss from counterparty credit risk on over-the-counter derivatives is generally limited to the aggregate unrealized gain netted against any collateral held by the Fund and the amount of any variation margin held by the counterparty, plus any replacement costs or related amounts. With exchange-traded or centrally cleared derivatives, there is reduced counterparty credit risk to the Fund since the clearinghouse or central counterparty (CCP) provides some protection in the case of clearing member default. The clearinghouse or CCP stands between the buyer and the seller of the contract; therefore, additional counterparty credit risk is failure of the clearinghouse or CCP. However, credit risk still exists in exchange-traded or centrally cleared derivatives with respect to initial and variation margin that is held in a broker’s customer account. While brokers are required to segregate customer margin from their own assets, in the event that a broker becomes insolvent or goes into bankruptcy and at that time there is a shortfall in the aggregate amount
of margin held by the broker for all its clients, U.S. bankruptcy laws will typically allocate that shortfall on a pro-rata basis across all the broker’s customers (including the Fund), potentially resulting in losses to the Fund.
In order to better define its contractual rights and to secure rights that will help the Fund mitigate its counterparty risk, the Fund may enter into an International Swaps and Derivatives Association, Inc. Master Agreement (ISDA Master Agreement) or similar agreement with its derivatives contract counterparties. An ISDA Master Agreement is an agreement between the Fund and a counterparty that governs over-the-counter derivatives and typically contains, among other things, collateral posting terms and netting provisions in the event of a default and/or termination event. Under an ISDA Master Agreement, the Fund may, under certain circumstances, offset with the counterparty certain derivative instrument’s payables and/or receivables with collateral held and/or posted and create one single net payment. The provisions of the ISDA Master Agreement typically permit a single net payment in the event of default (close-out netting), including the bankruptcy or insolvency of the counterparty. Note, however, that bankruptcy or insolvency laws of a particular jurisdiction may impose restrictions on or prohibitions against the right of offset or netting in bankruptcy, insolvency or other events.
Collateral (margin) requirements differ by type of derivative. Margin requirements are established by the clearinghouse or CCP for exchange-traded and centrally cleared derivatives. Brokers can ask for margin in excess of the minimum in certain circumstances. Collateral terms are contract specific for over-the-counter derivatives. For over-the-counter derivatives traded under an ISDA Master Agreement, the collateral requirements are typically calculated by netting the marked-to-market amount for each transaction under such agreement and comparing that amount to the value of any variation margin currently pledged by the Fund and/or the counterparty. Generally, the amount of collateral due from or to a party has to exceed a minimum transfer amount threshold (e.g., $250,000) before a transfer has to be made. To the extent amounts due to the Fund from its counterparties are not fully collateralized, contractually or otherwise, the Fund bears the risk of loss from counterparty nonperformance. The Fund attempts to mitigate counterparty risk by only entering into agreements with counterparties that it believes have the financial resources to honor their obligations and by monitoring the financial stability of those counterparties.
| | | | | | |
| | |
| | | | ACTIVE PORTFOLIOS® MULTI-MANAGER ALTERNATIVES FUND | | |
NOTES TO CONSOLIDATED FINANCIAL STATEMENTS (continued)
August 31, 2016
Certain ISDA Master Agreements allow counterparties to over-the-counter derivatives transactions to terminate derivatives contracts prior to maturity in the event the Fund’s net asset value declines by a stated percentage over a specified time period or if the Fund fails to meet certain terms of the ISDA Master Agreement, which would cause the Fund to accelerate payment of any net liability owed to the counterparty. The Fund also has termination rights if the counterparty fails to meet certain terms of the ISDA Master Agreement. In addition to considering counterparty credit risk, the Fund would consider terminating the derivatives contracts based on whether termination would result in a net liability owed from the counterparty.
For financial reporting purposes, the Fund does not offset derivative assets and derivative liabilities that are subject to netting arrangements in the Consolidated Statement of Assets and Liabilities.
Forward Foreign Currency Exchange Contracts
Forward foreign currency exchange contracts are over-the-counter agreements between two parties to buy and sell a currency at a set price on a future date. The Fund utilized forward foreign currency exchange contracts to hedge the currency exposure associated with some or all of the Fund’s securities, to shift foreign currency exposure back to U.S. dollars and to generate total return through long and short currency positions versus the U.S. dollar. These instruments may be used for other purposes in future periods.
The values of forward foreign currency exchange contracts fluctuate daily with changes in foreign currency exchange rates. Changes in the value of these contracts are recorded as unrealized appreciation or depreciation until the contract is exercised or has expired. The Fund will realize a gain or loss when the forward foreign currency exchange contract is closed or expires.
The use of forward foreign currency exchange contracts does not eliminate fluctuations in the prices of the Fund’s portfolio securities. The risks of forward foreign currency exchange contracts include movement in the values of the foreign currencies relative to the U.S. dollar (or other foreign currencies) and the possibility that counterparties will not complete their contractual obligations, which may be in excess of the amount reflected, if any, in the Consolidated Statement of Assets and Liabilities.
Futures Contracts
Futures contracts are exchange-traded and represent commitments for the future purchase or sale of an asset
at a specified price on a specified date. The Fund bought and sold futures contracts to produce incremental earnings, to manage exposure to movements in interest rates, to manage exposure to the securities market and to gain commodity and currency exposure. These instruments may be used for other purposes in future periods. Upon entering into futures contracts, the Fund bears risks that it may not achieve the anticipated benefits of the futures contracts and may realize a loss. Additional risks include counterparty credit risk, the possibility of an illiquid market, and that a change in the value of the contract or option may not correlate with changes in the value of the underlying asset.
Upon entering into a futures contract, the Fund deposits cash or securities with the broker, known as a futures commissions merchant (FCM), in an amount sufficient to meet the initial margin requirement. The initial margin deposit must be maintained at an established level over the life of the contract. Cash deposited as initial margin is recorded in the Consolidated Statement of Assets and Liabilities as margin deposits. Securities deposited as initial margin are designated in the Consolidated Portfolio of Investments. Subsequent payments (variation margin) are made or received by the Fund each day. The variation margin payments are equal to the daily change in the contract value and are recorded as variation margin receivable or payable and are offset in unrealized gains or losses. The Fund recognizes a realized gain or loss when the contract is closed or expires. Futures contracts involve, to varying degrees, risk of loss in excess of the variation margin disclosed in the Consolidated Statement of Assets and Liabilities.
Options Contracts
Options are contracts which entitle the holder to purchase or sell securities or other identified assets at a specified price, or in the case of index option contracts, to receive or pay the difference between the index value and the strike price of the index option contract. Option contracts can be either exchange-traded or over-the-counter. The Fund purchased and/or wrote option contracts to decrease the Fund’s exposure to equity market risk and to increase return on investments, to protect gains and to facilitate buying and selling of securities for investments. These instruments may be used for other purposes in future periods. Completion of transactions for option contracts traded in the over-the-counter market depends upon the performance of the other party. Cash collateral may be collected or posted by the Fund to secure certain over-the-counter option contract trades. Cash collateral held or posted by the
| | | | | | |
| | |
| | | | ACTIVE PORTFOLIOS® MULTI-MANAGER ALTERNATIVES FUND | | |
NOTES TO CONSOLIDATED FINANCIAL STATEMENTS (continued)
August 31, 2016
Fund for such option contract trades must be returned to the broker or the Fund upon closure, exercise or expiration of the contract.
Options contracts purchased are recorded as investments. When the Fund writes an options contract, the premium received is recorded as an asset and an amount equivalent to the premium is recorded as a liability in the Consolidated Statement of Assets and Liabilities and is subsequently adjusted to reflect the current fair value of the option written. Changes in the fair value of the written option are recorded as unrealized appreciation or depreciation until the contract is exercised or has expired. The Fund will realize a gain or loss when the option contract is closed or expires. When option contracts are exercised, the proceeds on sales for a written call or purchased put option contract, or the purchase cost for a written put or purchased call option contract, is adjusted by the amount of premium received or paid.
For over-the-counter options purchased, the Fund bears the risk of loss of the amount of the premiums paid plus the positive change in market values net of any collateral held by the Fund should the counterparty fail to perform under the contracts. Option contracts written by the Fund do not typically give rise to significant counterparty credit risk, as options written generally obligate the Fund and not the counterparty to perform. The risk in writing a call option contract is that the Fund gives up the opportunity for profit if the market price of the security increases above the strike price and the option contract is exercised. The risk in writing a put option contract is that the Fund may incur a loss if the market price of the security decreases below the strike price and the option contract is exercised. Exercise of a written option could result in the Fund purchasing or selling a security or foreign currency when it otherwise would not, or at a price different from the current market value. In purchasing and writing options, the Fund bears the risk of an unfavorable change in the value of the underlying instrument or the risk that the Fund may not be able to enter into a closing transaction due to an illiquid market.
Contracts and premiums associated with options contracts written for the year ended August 31, 2016 are as follows:
| | | | | | | | | | | | | | | | |
| | | | Calls | | | | Puts | |
| | | | Contracts | | | | Premiums ($) | | | | Contracts | | | | Premiums ($) | |
Balance at August 31, 2015 | | | (5,360 | ) | | | (479,403 | ) | | | (3,988 | ) | | | (435,923 | ) |
Opened | | | (12,415 | ) | | | (1,021,536 | ) | | | (11,725 | ) | | | (959,869 | ) |
Closed | | | 4,003 | | | | 498,512 | | | | 7,463 | | | | 720,908 | |
Expired | | | 9,580 | | | | 517,080 | | | | 6,433 | | | | 431,008 | |
Exercised | | | 3,356 | | | | 421,958 | | | | 1,295 | | | | 197,557 | |
| | | | | | | | | | | | | | | | | |
Balance at August 31, 2016 | | | (836 | ) | | | (63,389 | ) | | | (522 | ) | | | (46,319 | ) |
| | | | | | | | | | | | | | | | | |
Swap Contracts
Swap contracts are negotiated in the over-the-counter market and may be entered into as a bilateral contract or centrally cleared (centrally cleared swap contract). In a centrally cleared swap contract, immediately following execution of the swap contract with a broker, the swap contract is novated to a central counterparty (the CCP) and the CCP becomes the Fund’s counterparty to the centrally cleared swap contract. The Fund is required to deposit initial margin with the FCM, which pledges it through to the CCP in the form of cash or securities in an amount that varies depending on the size and risk profile of the particular swap contract. Securities deposited as initial margin are designated in the Consolidated Portfolio of Investments and cash deposited is recorded in the Consolidated Statement of Assets and Liabilities as margin deposits. Unlike a bilateral swap contract, for centrally cleared swap contracts, the Fund has less credit exposure to the FCM because the CCP stands between the Fund and the relevant buyer/seller on the other side of the contract. Swap contracts are marked-to-market daily and changes in value are recorded as unrealized appreciation (depreciation). The daily change in valuation of centrally cleared swap contracts, if any, is recorded as a receivable or payable for variation margin in the Consolidated Statement of Assets and Liabilities.
Entering into these contracts involves, to varying degrees, elements of interest, liquidity and counterparty credit risk in excess of the amounts recognized in the Consolidated Statement of Assets and Liabilities. Such risks involve the possibility that there may be unfavorable changes in interest rates, market conditions or other conditions, it may be difficult to initiate a swap transaction or liquidate a position at an advantageous time or price which may result in significant losses, and that the FCM or CCP may not fulfill its obligation under the contract.
| | | | | | |
| | |
| | | | ACTIVE PORTFOLIOS® MULTI-MANAGER ALTERNATIVES FUND | | |
NOTES TO CONSOLIDATED FINANCIAL STATEMENTS (continued)
August 31, 2016
Total Return Swap Contracts
The Fund entered into total return swap contracts to manage long or short exposure to the total return on a specified reference security in return for periodic payments based on a fixed or variable interest rate and to get synthetic exposure to bond, commodity and equity index futures. These instruments may be used for other purposes in future periods. Total return swap contracts may be used to obtain exposure to an underlying reference security, instrument, or other asset or index or market without owning, taking physical custody of, or short selling any such security, instrument or asset in a market.
Total return swap contracts are valued daily, and the change in value is recorded as unrealized appreciation (depreciation) until the termination of the swap, at which time the Fund will realize a gain (loss). Periodic payments received (or made) by the Fund over the term of the contract are recorded as realized gains (losses). Total return swap contracts are subject to the risk associated with the investment in the underlying reference security, instrument or asset. The risk in the case of short total return swap contracts is unlimited based on the potential for unlimited increases in the market value of the underlying reference security, instrument or asset. This risk may be offset if the Fund holds any of the underlying reference security, instrument or asset. The risk in the case of long total return swap contracts is limited to the current notional amount of the total return swap contract.
Effects of Derivative Transactions in the Financial Statements
The following tables are intended to provide additional information about the effect of derivatives on the financial statements of the Fund, including: the fair value of derivatives by risk category and the location of those fair values in the Consolidated Statement of Assets and Liabilities; and the impact of derivative transactions over the period in the Consolidated Statement of Operations, including realized and unrealized gains (losses). The derivative instrument schedules following the Consolidated Portfolio of Investments present additional information regarding derivative instruments outstanding at the end of the period, if any.
The following table is a summary of the fair value of derivative instruments (not considered to be hedging instruments for accounting disclosure purposes) at August 31, 2016:
| | | | | | |
| | | | | | | |
| | Asset Derivatives | |
Risk Exposure Category | | Consolidated Statement of Assets and Liabilities Location | | | Fair Value ($) | |
Equity risk | | Net assets — unrealized appreciation on futures contracts | | | 1,134,094 | * |
Equity risk | | Investments, at value — Options purchased | | | 243,373 | |
Equity risk | | Net assets — unrealized appreciation on swap contracts | | | 153,985 | * |
Foreign exchange risk | | Unrealized appreciation on forward foreign currency exchange contracts | | | 12,516,574 | |
Foreign exchange risk | | Net assets — unrealized appreciation on futures contracts | | | 4,011,244 | * |
Interest rate risk | | Net assets — unrealized appreciation on futures contracts | | | 1,587,728 | * |
Interest rate risk | | Net assets — unrealized appreciation on swap contracts | | | 792,027 | * |
Commodity-related investment risk | | Net assets — unrealized appreciation on futures contracts | | | 1,381,345 | * |
Commodity-related investment risk | | Net assets — unrealized appreciation on swap contracts | | | 838,752 | * |
Total | | | | | 22,659,122 | |
| |
| | Liability Derivatives | |
Risk Exposure Category | | Consolidated Statement of Assets and Liabilities Location | | | Fair Value ($) | |
Equity risk | | Net assets — unrealized depreciation on futures contracts | | | 628,545 | * |
Equity risk | | Options contracts written, at value | | | 63,138 | |
Equity risk | | Net assets — unrealized depreciation on swap contracts | | | 171,060 | * |
Foreign exchange risk | | Unrealized depreciation on forward foreign currency exchange contracts | | | 12,438,526 | |
Foreign exchange risk | | Net assets — unrealized depreciation on futures contracts | | | 253,173 | * |
| | | | | | |
| | |
| | | | ACTIVE PORTFOLIOS® MULTI-MANAGER ALTERNATIVES FUND | | |
NOTES TO CONSOLIDATED FINANCIAL STATEMENTS (continued)
August 31, 2016
| | | | | | |
| | | | | | | |
| | Liability Derivatives | |
Risk Exposure Category | | Consolidated Statement of Assets and Liabilities Location | | | Fair Value ($) | |
Interest rate risk | | Net assets — unrealized depreciation on futures contracts | | | 340,644 | * |
Commodity-related investment risk | | Net assets — unrealized depreciation on futures contracts | | | 1,584,973 | * |
Commodity-related investment risk | | Net assets — Unrealized depreciation on swap contracts | | | 204,726 | * |
Total | | | | | 15,684,785 | |
| * | Includes cumulative appreciation (depreciation) as reported in the tables following the Consolidated Portfolio of Investments. Only the current day’s variation margin is reported in receivables or payables in the Consolidated Statement of Assets and Liabilities. |
The following table indicates the effect of derivative instruments (not considered to be hedging instruments for accounting disclosure purposes) in the Consolidated Statement of Operations for the year ended August 31, 2016:
| | | | | | | | | | | | | | | | | | | | | | | | |
| | | | | | | | | | | | | | | | | | | | | | | | | |
| | | Amount of Realized Gain (Loss) on Derivatives Recognized in Income | |
Risk Exposure Category | |
| Forward Foreign
Currency Exchange
Contracts ($ |
) | |
| Futures
Contracts ($ |
) | |
| Options
Contracts
Written ($ |
) | |
| Options
Contracts
Purchased ($ |
) | |
| Swap
Contracts ($ |
) | | | Total ($ | ) |
Commodity-related investment risk | | | — | | | | 8,146,502 | | | | — | | | | — | | | | (1,519,367 | ) | | | 6,627,135 | |
Equity risk | | | — | | | | (17,181,062 | ) | | | 1,136,593 | | | | (2,796,037 | ) | | | (835,953 | ) | | | (19,676,459 | ) |
Foreign exchange risk | | | (4,157,206 | ) | | | 3,516,619 | | | | — | | | | — | | | | — | | | | (640,587 | ) |
Interest rate risk | | | — | | | | 4,318,971 | | | | — | | | | — | | | | 689,495 | | | | 5,008,466 | |
Total | | | (4,157,206 | ) | | | (1,198,970 | ) | | | 1,136,593 | | | | (2,796,037 | ) | | | (1,665,825 | ) | | | (8,681,445 | ) |
| |
| | | Change in Unrealized Appreciation (Depreciation) on Derivatives Recognized in Income | |
Risk Exposure Category | |
| Forward Foreign
Currency Exchange
Contracts ($ |
) | |
| Futures
Contracts ($ |
) | |
| Options
Contracts
Written ($ |
) | |
| Options
Contracts
Purchased ($ |
) | |
| Swap
Contracts ($ |
) | | | Total ($ | ) |
Commodity-related investment risk | | | — | | | | (1,628,540 | ) | | | — | | | | — | | | | 696,222 | | | | (932,318 | ) |
Equity risk | | | — | | | | (205,825 | ) | | | 552,008 | | | | (705,314 | ) | | | (17,495 | ) | | | (376,626 | ) |
Foreign exchange risk | | | (1,374,181 | ) | | | 3,757,531 | | | | — | | | | — | | | | — | | | | 2,383,350 | |
Interest rate risk | | | — | | | | (1,172,402 | ) | | | — | | | | — | | | | 1,055,419 | | | | (116,983 | ) |
Total | | | (1,374,181 | ) | | | 750,764 | | | | 552,008 | | | | (705,314 | ) | | | 1,734,146 | | | | 957,423 | |
The following table provides a summary of the average outstanding volume by derivative instrument for the year ended August 31, 2016:
| | | | |
| Derivative Instrument | | Average Notional
Amounts ($)* | |
Futures contracts — Long | | | 1,121,165,386 | |
Futures contracts — Short | | | 219,015,812 | |
| | | | |
| Derivative Instrument | | Average Market
Value ($)* | |
Options contracts — Purchased | | | 349,495 | |
Options contracts — Written | | | (123,481 | ) |
| | | | | | | | |
| Derivative Instrument | | Average
Unrealized
Appreciation ($)* | | | Average
Unrealized
Depreciation ($)* | |
Forward foreign currency exchange contracts | | | 11,983,630 | | | | (13,055,824 | ) |
Total return swap contracts | | | 1,302,766 | | | | (235,439 | ) |
| * | Based on the ending quarterly outstanding amounts for the year ended August 31, 2016. |
Short Sales
The Fund may sell a security it does not own in anticipation of a decline in the fair value of the security. When the Fund sells a security short, it must borrow the
| | | | | | |
| | |
| | | | ACTIVE PORTFOLIOS® MULTI-MANAGER ALTERNATIVES FUND | | |
NOTES TO CONSOLIDATED FINANCIAL STATEMENTS (continued)
August 31, 2016
security sold short and deliver it to the broker-dealer through which it made the short sale. The Fund is required to maintain a margin account with the broker and to pledge assets to the broker as collateral for the borrowed security. Securities pledged as collateral are designated in the Consolidated Portfolio of Investments. In addition, cash collateral is recorded as cash collateral held at broker in the Consolidated Statement of Assets and Liabilities. The Fund can purchase the same security at the current market price and deliver it to the broker to close out the short sale. The Fund is obligated to pay the broker a fee for borrowing the security. The fee is included in “Dividends and interest on securities sold short” in the Consolidated Statement of Operations and
a short position is reported as a liability at fair value in the Consolidated Statement of Assets and Liabilities. The Fund must also pay the broker for any dividends accrued (recognized on ex-date) on the borrowed security. This amount is recorded as an expense in the Consolidated Statement of Operations. The Fund will record a gain if the security declines in value, and will realize a loss if the security appreciates. Such gain, limited to the price at which the Fund sold the security short, or such loss, potentially unlimited in size because the short position loses value as the market price of the security sold short increases, will be recognized upon the termination of a short sale.
Offsetting of Assets and Liabilities
The following table presents the Fund’s gross and net amount of assets and liabilities available for offset under netting arrangements as well as any related collateral received or pledged by the Fund as of August 31, 2016:
| | | | | | | | | | | | | | | | | | | | | | | | | | | | | | | | | | | | |
| | | Barclays
($) | | | Citi
($)(d) | | | Citi
($)(d) | | | Deutsche
Bank
($) | | | Goldman
Sachs
($)(d) | | | Goldman
Sachs
($)(d) | | | JPMorgan
($)(d) | | | JPMorgan ($)(d) | | | Total
($) | |
Assets | | | | | | | | | | | | | | | | | | | | | | | | | | | | | | | | | | | | |
Forward foreign currency exchange contracts | | | — | | | | 11,587,213 | | | | — | | | | — | | | | 929,361 | | | | — | | | | — | | | | — | | | | 12,516,574 | |
Options purchased calls | | | — | | | | — | | | | — | | | | — | | | | 194,080 | | | | — | | | | — | | | | — | | | | 194,080 | |
Options purchased puts | | | — | | | | — | | | | — | | | | — | | | | 49,293 | | | | — | | | | — | | | | — | | | | 49,293 | |
OTC total return swap contracts(a) | | | — | | | | — | | | | — | | | | — | | | | — | | | | 87,359 | | | | — | | | | — | | | | 87,359 | |
OTC total return swap contracts on futures(a) | | | 792,027 | | | | — | | | | 626,476 | | | | 212,276 | | | | — | | | | — | | | | — | | | | 66,626 | | | | 1,697,405 | |
Total Assets | | | 792,027 | | | | 11,587,213 | | | | 626,476 | | | | 212,276 | | | | 1,172,734 | | | | 87,359 | | | | — | | | | 66,626 | | | | 14,544,711 | |
Liabilities | | | | | | | | | | | | | | | | | | | | | | | | | | | | | | | | | | | | |
Forward foreign currency exchange contracts | | | — | | | | 12,339,950 | | | | — | | | | — | | | | 98,576 | | | | — | | | | — | | | | — | | | | 12,438,526 | |
Options contracts written | | | — | | | | — | | | | — | | | | — | | | | 63,138 | | | | — | | | | — | | | | — | | | | 63,138 | |
OTC total return swap contracts(a) | | | — | | | | — | | | | — | | | | — | | | | — | | | | 20,618 | | | | — | | | | — | | | | 20,618 | |
OTC total return swap contracts on futures(a) | | | — | | | | — | | | | 91,241 | | | | 113,485 | | | | — | | | | — | | | | — | | | | 150,442 | | | | 355,168 | |
Securities borrowed | | | — | | | | — | | | | — | | | | — | | | | 60,787,288 | | | | — | | | | 85,914,037 | | | | — | | | | 146,701,325 | |
Total Liabilities | | | — | | | | 12,339,950 | | | | 91,241 | | | | 113,485 | | | | 60,949,002 | | | | 20,618 | | | | 85,914,037 | | | | 150,442 | | | | 159,578,775 | |
Total Financial and Derivative Net Assets | | | 792,027 | | | | (752,737 | ) | | | 535,235 | | | | 98,791 | | | | (59,776,268 | ) | | | 66,741 | | | | (85,914,037 | ) | | | (83,816 | ) | | | (145,034,064 | ) |
Total collateral received (pledged)(b) | | | 792,027 | | | | (752,737 | ) | | | — | | | | — | | | | (59,776,268 | ) | | | — | | | | (85,914,037 | ) | | | (83,816 | ) | | | (145,734,831 | ) |
Net Amount(c) | | | — | | | | — | | | | 535,235 | | | | 98,791 | | | | — | | | | 66,741 | | | | — | | | | — | | | | 700,767 | |
| (a) | Over-the-Counter Swap Contracts are presented at market value plus periodic payments receivable (payable), which is comprised of unrealized appreciation, unrealized depreciation, premiums paid and premiums received. |
| (b) | In some instances, the actual collateral received and/or pledged may be more than the amount shown due to overcollateralization. |
| (c) | Represents the net amount due from/(to) counterparties in the event of default. |
| (d) | Exposure can only be netted across transactions governed under the same master agreement with the same legal entity. |
| | | | | | |
| | |
| | | | ACTIVE PORTFOLIOS® MULTI-MANAGER ALTERNATIVES FUND | | |
NOTES TO CONSOLIDATED FINANCIAL STATEMENTS (continued)
August 31, 2016
Security Transactions
Security transactions are accounted for on the trade date. Cost is determined and gains (losses) are based upon the specific identification method for both financial statement and federal income tax purposes.
Income Recognition
Corporate actions and dividend income are generally recorded net of any non-reclaimable tax withholdings, on the ex-dividend date or upon receipt of ex-dividend notification in the case of certain foreign securities.
Interest income is recorded on an accrual basis. Market premiums and discounts, including original issue discounts, are amortized and accreted, respectively, over the expected life of the security on all debt securities, unless otherwise noted.
The Fund may place a debt security on non-accrual status and reduce related interest income when it becomes probable that the interest will not be collected and the amount of uncollectible interest can be reasonably estimated. A defaulted debt security is removed from non-accrual status when the issuer resumes interest payments or when collectibility of interest is reasonably assured.
The Fund may receive distributions from holdings in equity securities, business development companies (BDCs), exchange-traded funds, other regulated investment companies (RICs), and real estate investment trusts (REITs), which report information on the tax character of their distributions annually. These distributions are allocated to dividend income, capital gain and return of capital based on actual information reported. Return of capital is recorded as a reduction of the cost basis of securities held. If the Fund no longer owns the applicable securities, return of capital is recorded as a realized gain. With respect to REITs, to the extent actual information has not yet been reported, estimates for return of capital are made by the Fund’s management. Management’s estimates are subsequently adjusted when the actual character of the distributions is disclosed by the REITs, which could result in a proportionate change in return of capital to shareholders.
Awards from class action litigation are recorded as a reduction of cost basis if the Fund still owns the applicable securities on the payment date. If the Fund no longer owns the applicable securities, the proceeds are recorded as realized gains.
Expenses
General expenses of the Trust are allocated to the Fund and other funds of the Trust based upon relative net assets or other expense allocation methodologies determined by the nature of the expense. Expenses directly attributable to the Fund are charged to the Fund.
Federal Income Tax Status
The Fund intends to qualify each year as a regulated investment company under Subchapter M of the Internal Revenue Code, as amended, and will distribute substantially all of its taxable income (including net short-term capital gains), if any, for its tax year, and as such will not be subject to federal income taxes. In addition, the Fund intends to distribute in each calendar year substantially all of its net investment income, capital gains and certain other amounts, if any, such that the Fund should not be subject to federal excise tax. Therefore, no federal income or excise tax provision is recorded.
Foreign Taxes
The Fund may be subject to foreign taxes on income, gains on investments or currency repatriation, a portion of which may be recoverable. The Fund will accrue such taxes and recoveries, as applicable, based upon its current interpretation of tax rules and regulations that exist in the markets in which it invests.
Realized gains in certain countries may be subject to foreign taxes at the Fund level, based on statutory rates. The Fund accrues for such foreign taxes on realized and unrealized gains at the appropriate rate for each jurisdiction, as applicable. The amount, if any, is disclosed as a liability on the Consolidated Statement of Assets and Liabilities.
Distributions to Shareholders
Distributions from net investment income, if any, are declared and paid annually. Net realized capital gains, if any, are distributed along with the income distribution. Income distributions and capital gain distributions are determined in accordance with federal income tax regulations, which may differ from GAAP.
Guarantees and Indemnifications
Under the Trust’s organizational documents and, in some cases, by contract, its officers and trustees are indemnified against certain liabilities arising out of the performance of their duties to the Trust or its funds. In addition, certain of the Fund’s contracts with its service
| | | | | | |
| | |
| | | | ACTIVE PORTFOLIOS® MULTI-MANAGER ALTERNATIVES FUND | | |
NOTES TO CONSOLIDATED FINANCIAL STATEMENTS (continued)
August 31, 2016
providers contain general indemnification clauses. The Fund’s maximum exposure under these arrangements is unknown since the amount of any future claims that may be made against the Fund cannot be determined, and the Fund has no historical basis for predicting the likelihood of any such claims.
Note 3. Fees and Other Transactions with Affiliates
Management Services Fees
Effective January 1, 2016, the Fund entered into a Management Agreement with Columbia Management Investment Advisers, LLC (the Investment Manager), a wholly-owned subsidiary of Ameriprise Financial, Inc. (Ameriprise Financial). Under the Management Agreement, the Investment Manager provides the Fund with investment research and advice, as well as administrative and accounting services. The Investment Manager is responsible for the ultimate oversight of investments made by the Fund. The Fund’s subadvisers (see Subadvisory Agreements below) have the primary responsibility for the day-to-day portfolio management of their portion of the Fund. The management services fee is an annual fee that is equal to a percentage of the Fund’s average daily net assets that declines from 1.10% to 0.95% as the Fund’s net assets increase. Prior to January 1, 2016, the Fund paid the Investment Manager an annual fee for advisory services under an Investment Management Services Agreement and a separate annual fee for administrative and accounting services under an Administrative Services Agreement. The effective management services fee rate for the year ended August 31, 2016 (reflecting all advisory and administrative services fees paid to the Investment Manager) was 1.08% of the Fund’s average daily net assets. For the period from September 1, 2015 through December 31, 2015, the investment advisory services fee paid to the Investment Manager was $2,594,022, and the administrative services fee paid to the Investment Manager was $202,111.
Subadvisory Agreement
The Investment Manager has entered into Subadvisory Agreements with AQR Capital Management, LLC, Wasatch Advisors, Inc. and Water Island Capital, LLC, each of which subadvises a portion of the assets of the Fund. Effective October 20, 2016, Wasatch Advisors, Inc. will no longer serve as a subadviser of the Fund. New investments in the Fund, net of any redemptions, are allocated in accordance with the Investment Manager’s
determination, subject to the oversight of the Fund’s Board. Each subadviser’s proportionate share of investments in the Fund will vary due to market fluctuations. The Investment Manager compensates each subadviser to manage the investment of the Fund’s assets.
Compensation of Board Members
Board members, who are not officers or employees of the Investment Manager or Ameriprise Financial, are compensated for their services to the Fund as disclosed in the Consolidated Statement of Operations. These Board members may participate in a Deferred Compensation Plan (the Plan) which may be terminated at any time. Obligations of the Plan will be paid solely out of the Fund’s assets, and all amounts payable under the Plan constitute a general unsecured obligation of the Fund.
Compensation of Chief Compliance Officer
The Board has appointed a Chief Compliance Officer to the Fund in accordance with federal securities regulations. The Fund is allocated a portion of the expenses associated with the Chief Compliance Officer based on relative net assets of the Trust.
Transfer Agency Fees
Under a Transfer and Dividend Disbursing Agent Agreement, Columbia Management Investment Services Corp. (the Transfer Agent), an affiliate of the Investment Manager and a wholly-owned subsidiary of Ameriprise Financial, is responsible for providing transfer agency services to the Fund. The Transfer Agent has contracted with Boston Financial Data Services (BFDS) to serve as sub-transfer agent. The Transfer Agent pays the fees of BFDS for services as sub-transfer agent and BFDS is not entitled to reimbursement for such fees from the Fund (with the exception of out-of-pocket fees).
The Fund pays the Transfer Agent a monthly transfer agency fee based on the number or the average value of accounts, depending on the type of account. In addition, prior to October 1, 2016, the Transfer Agent also received sub-transfer agency fees based on a percentage of the average aggregate value of the Fund’s shares maintained in omnibus accounts (other than omnibus accounts for which American Enterprise Investment Services Inc. is the broker of record or accounts where the beneficial shareholder is a customer of Ameriprise Financial Services, Inc., for which the Transfer Agent receives a per account fee). Effective October 1, 2016, the Fund pays the Transfer Agent a fee for shareholder
| | | | | | |
| | |
| | | | ACTIVE PORTFOLIOS® MULTI-MANAGER ALTERNATIVES FUND | | |
NOTES TO CONSOLIDATED FINANCIAL STATEMENTS (continued)
August 31, 2016
services based on the number of accounts or on a percentage of the average aggregate value of the Fund’s shares maintained in omnibus accounts up to the lesser of the amount charged by the servicing agent or a cap established by the Board from time to time.
The Transfer Agent also receives compensation from the Fund for various shareholder services and reimbursements for certain out-of-pocket fees.
For the year ended August 31, 2016, the Fund’s effective transfer agency fee rates as a percentage of average daily net assets for Class A shares was 0.10%.
Distribution and Service Fees
The Fund has an agreement with Columbia Management Investment Distributors, Inc. (the Distributor), an affiliate of the Investment Manager and a wholly-owned subsidiary of Ameriprise Financial, for distribution and shareholder services. The Board has approved, and the Fund has adopted, distribution and shareholder service plans (the Plans) applicable to certain share classes, which set the distribution and service fees for the Fund. These fees are calculated daily and are intended to compensate the Distributor and/or eligible selling and/or servicing agents for selling shares of the Fund and providing services to investors.
The Fund may pay distribution fee of up to 0.25% of the Fund’s average daily net assets attributable to Class A shares and a service fee of up to 0.25% of the Fund’s average daily net assets attributable to Class A shares, provided, that the aggregate fee shall not exceed 0.25% of the Fund’s average daily net assets attributable to Class A shares.
Expenses Waived/Reimbursed by the Investment Manager and its Affiliates
The Fund’s expense ratio is subject to an expense reimbursement arrangement pursuant to which fees will be waived and/or expenses reimbursed (excluding certain fees and expenses described below), so that the Fund’s net operating expenses, after giving effect to fees waived/expenses reimbursed and any balance credits and/or overdraft charges from the Fund’s custodian, do not exceed the annual rates of:
| | | | | | | | |
| | | Contractual Expense Cap January 1, 2016 Through December 31, 2016 | | | Voluntary Expense Cap Prior to January 1, 2016 | |
Class A | | | 2.00 | % | | | 1.52 | % |
The contractual agreement may be modified or amended only with approval from the Investment Manager, certain of its affiliates and the Fund. Under the arrangements, the following fees and expenses are excluded from the waiver/reimbursement commitment, and therefore will be paid by the Fund, if applicable: taxes (including foreign transaction taxes), expenses associated with investments in affiliated and non-affiliated pooled investment vehicles (including mutual funds and exchange-traded funds), transaction costs and brokerage commissions, costs related to any securities lending program, dividend and interest expenses associated with securities sold short, inverse floater program fees and expenses, transaction charges and interest on borrowed money, interest and infrequent and/or unusual expenses. Any fees waived and/or expenses reimbursed under the expense reimbursement arrangements described above are not recoverable by the Investment Manager or its affiliates in future periods.
Note 4. Federal Tax Information
The timing and character of income and capital gain distributions are determined in accordance with income tax regulations, which may differ from GAAP because of temporary or permanent book to tax differences.
At August 31, 2016, these differences are primarily due to differing treatment for capital loss carryforwards, deferral/reversal of wash sale losses, Trustees’ deferred compensation, foreign currency transactions, investments in partnerships, passive foreign investment company (PFIC) holdings, late-year ordinary losses, re-characterization of distributions for investments, derivative investments, tax straddles, swap investments, investments in commodity subsidiaries, constructive sales and non-deductible expenses. To the extent these differences are permanent, reclassifications are made among the components of the Fund’s net assets in the Consolidated Statement of Assets and Liabilities. Temporary differences do not require reclassifications.
In the Consolidated Statement of Assets and Liabilities the following reclassifications were made:
| | | | |
Excess of distributions over net investment income | | | $(1,483,454 | ) |
Accumulated net realized loss | | | 2,326,352 | |
Paid-in capital | | | (842,898 | ) |
Net investment income (loss) and net realized gains (losses), as disclosed in the Consolidated Statement of Operations, and net assets were not affected by this reclassification.
| | | | | | |
| | |
| | | | ACTIVE PORTFOLIOS® MULTI-MANAGER ALTERNATIVES FUND | | |
NOTES TO CONSOLIDATED FINANCIAL STATEMENTS (continued)
August 31, 2016
The tax character of distributions paid during the years indicated was as follows:
| | | | | | | | |
| | | Year Ended
August 31, 2016 ($) | | | Year Ended
August 31, 2015 ($) | |
Ordinary income | | | 52,422,234 | | | | 25,062,490 | |
Long-term capital gains | | | — | | | | 15,693,951 | |
Total | | | 52,422,234 | | | | 40,756,441 | |
Short-term capital gain distributions, if any, are considered ordinary income distributions for tax purposes.
At August 31, 2016, the components of distributable earnings on a tax basis were as follows:
| | | | |
Capital loss carryforwards | | | $(38,450,359 | ) |
Net unrealized depreciation | | | (811,470 | ) |
At August 31, 2016, the cost of investments for federal income tax purposes was $722,397,973 and the aggregate gross unrealized appreciation and depreciation based on that cost was:
| | | | |
Unrealized appreciation | | | $14,600,266 | |
Unrealized depreciation | | | (15,411,736 | ) |
Net unrealized depreciation | | | $(811,470 | ) |
The following capital loss carryforwards, determined at August 31, 2016, may be available to reduce taxable income arising from future net realized gains on investments, if any, to the extent permitted by the Internal Revenue Code:
| | | | |
| Year of Expiration | | Amount ($) | |
No expiration — short-term | | | 16,103,999 | |
No expiration — long-term | | | 22,346,360 | |
Total | | | 38,450,359 | |
Under current tax rules, regulated investment companies can elect to treat certain late-year ordinary losses incurred and post-October capital losses (capital losses realized after October 31) as arising on the first day of the following taxable year. As of August 31, 2016, the Fund will elect to treat late-year ordinary losses of $1,692,575 as arising on September 1, 2016.
Management of the Fund has concluded that there are no significant uncertain tax positions in the Fund that would require recognition in the financial statements. However, management’s conclusion may be subject to review and adjustment at a later date based on factors including, but not limited to, new tax laws, regulations, and administrative interpretations (including relevant court decisions). Generally, the Fund’s federal tax returns
for the prior three fiscal years remain subject to examination by the Internal Revenue Service.
Note 5. Portfolio Information
The cost of purchases and proceeds from sales of securities, excluding short-term investments and derivatives, if any, aggregated to $1,427,251,178 and $1,480,368,964, respectively, for the year ended August 31, 2016. The amount of purchase and sale activity impacts the portfolio turnover rate reported in the Consolidated Financial Highlights.
Note 6. Affiliated Money Market Fund
The Fund invests significantly in Columbia Short-Term Cash Fund, an affiliated money market fund established for the exclusive use by the Fund and other affiliated funds (the Affiliated MMF). The income earned by the Fund from such investments is included as Dividends — affiliated issuers in the Consolidated Statement of Operations. As an investing fund, the Fund indirectly bears its proportionate share of the expenses of the Affiliated MMF. Effective October 1, 2016, the Affiliated MMF prices its shares with a floating net asset value (NAV) and no longer seeks to maintain a stable NAV. In addition, the Board of the Affiliated MMF may impose a fee on redemptions (sometimes referred to as a liquidity fee) or temporarily suspend redemptions (sometimes referred to as imposing a redemption gate) in the event its liquidity falls below regulatory limits.
Note 7. Line of Credit
The Fund has access to a revolving credit facility whereby the Fund may borrow for the temporary funding of shareholder redemptions or for other temporary or emergency purposes. Effective December 8, 2015, Citibank, N.A. and HSBC Bank USA, N.A. joined JPMorgan Chase Bank, N.A. (JPMorgan) as lead of a syndicate of banks under the credit facility, which is a collective agreement between the Fund and certain other funds managed by the Investment Manager, severally and not jointly, that permits collective borrowings up to $1 billion. Interest is charged to each participating fund based on its borrowings at a rate equal to the higher of (i) the overnight federal funds rate plus 1.00% or (ii) the one-month LIBOR rate plus 1.00%. Each borrowing under the credit facility matures no later than 60 days after the date of borrowing. The Fund also pays a commitment fee equal to its pro rata share of the amount of the credit facility at a rate of 0.15% per annum. The commitment fee is included in other expenses in the Consolidated Statement of Operations. Prior to December 8, 2015,
| | | | | | |
| | |
| | | | ACTIVE PORTFOLIOS® MULTI-MANAGER ALTERNATIVES FUND | | |
NOTES TO CONSOLIDATED FINANCIAL STATEMENTS (continued)
August 31, 2016
JPMorgan was the sole lead bank under the credit facility agreement that permitted borrowings up to $550 million under the same terms and interest rates as described above with the exception of the commitment fee which was charged at a rate of 0.075% per annum.
The Fund had no borrowings during the year ended August 31, 2016.
Note 8. Significant Risks
Shareholder Concentration Risk
At August 31, 2016, affiliated shareholders of record owned 100.0% of the outstanding shares of the Fund in one or more accounts. Subscription and redemption activity by concentrated accounts may have a significant effect on the operations of the Fund. In the case of a large redemption, the Fund may be forced to sell investments at inopportune times, including its liquid or more liquid positions, resulting in Fund losses and the Fund holding a higher percentage of less liquid or illiquid securities. Large redemptions could result in decreased economies of scale and increased operating expenses for non-redeeming Fund shareholders.
Derivatives Risk
Losses involving derivative instruments may be substantial, because a relatively small price movement in the underlying security(ies), commodity, currency or index or other instrument or asset may result in a substantial loss for the Fund. In addition to the potential for increased losses, the use of derivative instruments may lead to increased volatility within the Fund. Derivatives will typically increase the Fund’s exposure to principal risks to which it is otherwise exposed, and may expose the Fund to additional risks, including correlation risk, counterparty risk, hedging risk, leverage risk and liquidity risk.
Non-Diversification Risk
A non-diversified fund is permitted to invest a greater percentage of its total assets in fewer issuers than a diversified fund. The Fund may, therefore, have a greater risk of loss from a few issuers than a similar fund that invests more broadly.
Short Selling Risk
Leverage occurs when the Fund increases its assets available for investment using borrowings, short sales, derivatives, or similar instruments or techniques. Because short sales involve borrowing securities and then selling them, the Fund’s short sales effectively
leverage the Fund’s assets. The Fund’s assets that are used as collateral to secure the Fund’s obligations to return the securities sold short may decrease in value while the short positions are outstanding, which may force the Fund to use its other assets to increase the collateral. Leverage can create an interest expense that may lower the Fund’s overall returns. Leverage presents the opportunity for increased net income and capital gains, but may also exaggerate the Fund’s volatility and risk of loss. There can be no guarantee that a leveraging strategy will be successful.
Note 9. Subsequent Events
Management has evaluated the events and transactions that have occurred through the date the financial statements were issued and noted no items requiring adjustment of the financial statements or additional disclosure.
Note 10. Information Regarding Pending and Settled Legal Proceedings
Ameriprise Financial and certain of its affiliates have historically been involved in a number of legal, arbitration and regulatory proceedings, including routine litigation, class actions, and governmental actions, concerning matters arising in connection with the conduct of their business activities. Ameriprise Financial believes that the Funds are not currently the subject of, and that neither Ameriprise Financial nor any of its affiliates are the subject of, any pending legal, arbitration or regulatory proceedings that are likely to have a material adverse effect on the Funds or the ability of Ameriprise Financial or its affiliates to perform under their contracts with the Funds. Ameriprise Financial is required to make quarterly (10-Q), annual (10-K) and, as necessary, 8-K filings with the Securities and Exchange Commission (SEC) on legal and regulatory matters that relate to Ameriprise Financial and its affiliates. Copies of these filings may be obtained by accessing the SEC website at www.sec.gov.
There can be no assurance that these matters, or the adverse publicity associated with them, will not result in increased fund redemptions, reduced sale of fund shares or other adverse consequences to the Funds. Further, although we believe proceedings are not likely to have a material adverse effect on the Funds or the ability of Ameriprise Financial or its affiliates to perform under their contracts with the Funds, these proceedings are subject to uncertainties and, as such, we are unable to estimate the possible loss or range of loss that may result. An adverse outcome in one or more of these
| | | | | | |
| | |
| | | | ACTIVE PORTFOLIOS® MULTI-MANAGER ALTERNATIVES FUND | | |
NOTES TO CONSOLIDATED FINANCIAL STATEMENTS (continued)
August 31, 2016
proceedings could result in adverse judgments, settlements, fines, penalties or other relief that could have a material adverse effect on the consolidated financial condition or results of operations of Ameriprise Financial.
| | | | | | |
| | |
| | | | ACTIVE PORTFOLIOS® MULTI-MANAGER ALTERNATIVES FUND | | |
REPORT OF INDEPENDENT REGISTERED PUBLIC ACCOUNTING FIRM
To the Trustees of Columbia Funds Series Trust I and the Shareholders of
Active Portfolios® Multi-Manager Alternatives Fund (formerly known as
Active Portfolios® Multi-Manager Alternative Strategies Fund)
In our opinion, the accompanying consolidated statement of assets and liabilities, including the consolidated portfolio of investments, and the related consolidated statements of operations and of changes in net assets and the consolidated financial highlights present fairly, in all material respects, the financial position of Active Portfolios® Multi-Manager Alternatives Fund (formerly known as Active Portfolios® Multi-Manager Alternative Strategies Fund) (the “Fund,” a series of Columbia Funds Series Trust I) at August 31, 2016, and the results of its operations, the changes in its net assets and the financial highlights for each of the periods indicated, in conformity with accounting principles generally accepted in the United States of America. These financial statements and financial highlights (hereafter referred to as “financial statements”) are the responsibility of the Fund’s management. Our responsibility is to express an opinion on these financial statements based on our audits. We conducted our audits of these financial statements in accordance with the standards of the Public Company Accounting Oversight Board (United States). Those standards require that we plan and perform the audit to obtain reasonable assurance about whether the financial statements are free of material misstatement. An audit includes examining, on a test basis, evidence supporting the amounts and disclosures in the financial statements, assessing the accounting principles used and significant estimates made by management, and evaluating the overall financial statement presentation. We believe that our audits, which included confirmation of securities at August 31, 2016 by correspondence with the custodian, brokers and transfer agent, and the application of alternative auditing procedures where such confirmations had not been received, provide a reasonable basis for our opinion.
PricewaterhouseCoopers LLP
Minneapolis, MN
October 25, 2016
| | | | | | |
| | |
| | | | ACTIVE PORTFOLIOS® MULTI-MANAGER ALTERNATIVES FUND | | |
FEDERAL INCOME TAX INFORMATION
(Unaudited)
The Fund hereby designates the following tax attributes for the fiscal year ended August 31, 2016. Shareholders will be notified in early 2017 of the amounts for use in preparing 2016 income tax returns.
Tax Designations
| | | | |
Qualified Dividend Income | | | 15.88 | % |
Dividends Received Deduction | | | 7.18 | % |
Qualified Dividend Income. For taxable, non-corporate shareholders, the percentage of ordinary income distributed during the fiscal year that represents qualified dividend income subject to reduced tax rates.
Dividends Received Deduction. The percentage of ordinary income distributed during the fiscal year that qualifies for the corporate dividends received deduction.
| | | | | | |
| | |
| | | | ACTIVE PORTFOLIOS® MULTI-MANAGER ALTERNATIVES FUND | | |
TRUSTEES AND OFFICERS
Shareholders elect the Board that oversees the Fund’s operations. The Board appoints officers who are responsible for day-to-day business decisions based on policies set by the Board. The following table provides basic biographical information about the Fund’s Trustees, including their principal occupations during the past five years, although specific titles for individuals may have varied over the period. The year set forth beneath Length of Service in the table below is the year in which the Trustee was first appointed or elected as Trustee to any Fund currently in the Columbia Funds Complex or a predecessor thereof. Under current Board policy, members serve terms of indefinite duration.
Trustees
| | | | | | | | |
| Independent Trustees |
Name,
Address,
Year of Birth | | Position Held
with the Trust and Length of Service | | Principal Occupation(s)
During the Past Five Years
and Other Relevant
Professional Experience | | Number of
Funds in the
Columbia Funds
Complex
Overseen | | Other Directorships Held by Trustee During the Past
Five Years |
Janet Langford Carrig
c/o Columbia Management Investment Advisers, LLC, 225 Franklin Street Mail Drop BX32 05228, Boston, MA 02110 1957 | | Trustee 1996 | | Senior Vice President, General Counsel and Corporate Secretary, ConocoPhillips (integrated energy company) since September 2007 | | 56 | | None |
Douglas A. Hacker
c/o Columbia Management Investment Advisers, LLC, 225 Franklin Street Mail Drop BX32 05228, Boston, MA 02110 1955 | | Trustee and Chairman of the Board 1996 | | Independent business executive since May 2006; Executive Vice President — Strategy of United Airlines from December 2002 to May 2006; President of UAL Loyalty Services (airline marketing company) from September 2001 to December 2002; Executive Vice President and Chief Financial Officer of United Airlines from July 1999 to September 2001 | | 56 | | Spartan Nash Company (food distributor); Nash Finch Company (food distributor) from 2005 to 2013; Aircastle Limited (aircraft leasing); SeaCube Container Leasing Ltd. (container leasing) from 2010 to 2013; and Travelport Worldwide Limited (travel information technology) |
Nancy T. Lukitsh
c/o Columbia Management Investment Advisers, LLC, 225 Franklin Street Mail Drop BX32 05228, Boston, MA 02110 1956 | | Trustee 2011 | | Senior Vice President, Partner and Director of Marketing, Wellington Management Company, LLP (investment adviser) from 1997 to 2010; Chair, Wellington Management Portfolios (commingled non-U.S. investment pools) from 2007 to 2010; Director, Wellington Trust Company, NA and other Wellington affiliates from 1997 to 2010 | | 56 | | None |
William E. Mayer
c/o Columbia Management Investment Advisers, LLC, 225 Franklin Street Mail Drop BX32 05228, Boston, MA 02110 1940 | | Trustee 1991 | | Partner, Park Avenue Equity Partners (private equity) since February 1999 | | 56 | | DynaVox Inc. (speech creation); Lee Enterprises (print media); WR Hambrecht + Co. (financial service provider) from 2000 to 2012; BlackRock Capital Investment Corporation (investment company); and Premier, Inc. (healthcare) |
| | | | | | |
| | |
| | | | ACTIVE PORTFOLIOS® MULTI-MANAGER ALTERNATIVES FUND | | |
TRUSTEES AND OFFICERS (continued)
| | | | | | | | |
| Independent Trustees (continued) |
Name,
Address,
Year of Birth | | Position Held
with the Trust and Length of Service | | Principal Occupation(s)
During the Past Five Years
and Other Relevant
Professional Experience | | Number of
Funds in the
Columbia Funds
Complex
Overseen | | Other Directorships Held by Trustee During the Past
Five Years |
David M. Moffett
c/o Columbia Management Investment Advisers, LLC, 225 Franklin Street Mail Drop BX32 05228, Boston, MA 02110 1952 | | Trustee 2011 | | Retired. Consultant to Bridgewater and Associates | | 56 | | Director of CIT Bank, CIT Group Inc. (commercial and consumer finance); eBay Inc. (online trading community); Genworth Financial, Inc. (financial and insurance products and services); Paypal Holdings Inc. (payment and data processing services); and Trustee, University of Oklahoma Foundation |
Charles R. Nelson
c/o Columbia Management Investment Advisers, LLC, 225 Franklin Street Mail Drop BX32 05228, Boston, MA 02110 1942 | | Trustee 1981 | | Retired. Professor Emeritus, University of Washington since 2011; Professor of Economics, University of Washington from 1976 to 2011; Ford and Louisa Van Voorhis Professor of Political Economy, University of Washington from 1993 to 2011; Adjunct Professor of Statistics, University of Washington from 1980 to 2011; Associate Editor, Journal of Money, Credit and Banking from September 1993 to 2008; consultant on econometric and statistical matters | | 56 | | None |
John J. Neuhauser
c/o Columbia Management Investment Advisers, LLC, 225 Franklin Street Mail Drop BX32 05228, Boston, MA 02110 1943 | | Trustee 1984 | | President, Saint Michael’s College since August 2007; Director or Trustee of several non-profit organizations, including University of Vermont Medical Center; Academic Vice President and Dean of Faculties, Boston College from August 1999 to October 2005; University Professor, Boston College from November 2005 to August 2007 | | 56 | | Liberty All-Star Equity Fund and Liberty All-Star Growth Fund (closed-end funds) |
Patrick J. Simpson c/o Columbia Management Investment Advisers, LLC, 225 Franklin Street Mail Drop BX32 05228, Boston, MA 02110 1944 | | Trustee 2000 | | Of Counsel, Perkins Coie LLP (law firm) since 2015; Partner, Perkins Coie LLP from 1988 to 2014 | | 56 | | None |
Anne-Lee Verville c/o Columbia Management Investment Advisers, LLC, 225 Franklin Street Mail Drop BX32 05228, Boston, MA 02110 1945 | | Trustee 1998 | | Retired. General Manager, Global Education Industry from 1994 to 1997, President — Application Systems Division from 1991 to 1994, Chief Financial Officer — US Marketing & Services from 1988 to 1991, and Chief Information Officer from 1987 to 1988, IBM Corporation (computer and technology) | | 56 | | Enesco Group, Inc. (producer of giftware and home and garden decor products) from 2001 to 2006 |
| | | | | | |
| | |
| | | | ACTIVE PORTFOLIOS® MULTI-MANAGER ALTERNATIVES FUND | | |
TRUSTEES AND OFFICERS (continued)
| | | | | | | | |
| Consultant to the Trustees* | | |
Name,
Address,
Year of Birth | | Position Held
with the Trust and Length of Service | | Principal Occupation(s)
During the Past Five Years
and Other Relevant
Professional Experience | | Number of
Funds in the
Columbia Funds
Complex
Overseen | | Other Directorships Held by Trustee During the Past Five Years |
J. Kevin Connaughton c/o Columbia Management Investment Advisers, LLC, 225 Franklin Street Mail Drop BX32 05228, Boston, MA 02110 1964 | | Trustee Consultant 2016 | | Trustee Consultant, Columbia Funds since March 2016; Managing Director and General Manager of Mutual Fund Products, Columbia Management Investment Advisers, LLC from May 2010 to February 2015; President, Columbia Funds from 2009 to 2015; and senior officer of Columbia Funds and affiliated funds from 2003 to 2015 | | 56 | | Board of Governors, Gateway Healthcare since January 2016; Trustee, New Century Portfolios since March 2015; and Director, The Autism Project since March 2015 |
| * | J. Kevin Connaughton was appointed consultant to the Trustees effective March 1, 2016. Shareholders of the Funds are expected to be asked to elect Mr. Connaughton as a Trustee at a future shareholder meeting. |
| | | | | | | | |
| Interested Trustee Affiliated with Investment Manager* | | |
Name,
Address,
Year of Birth | | Position Held
with the Trust and
Length of Service | | Principal Occupation(s)
During the Past Five Years
and Other Relevant
Professional Experience | | Number of
Funds in the
Columbia Funds
Complex
Overseen | | Other Directorships
Held by Trustee
During the Past
Five Years |
William F. Truscott c/o Columbia Management Investment Advisers, LLC, 225 Franklin Street Boston, MA 02110 1960 | | Trustee 2012 | | Chairman of the Board and President, Columbia Management Investment Advisers, LLC since May 2010 and February 2012, respectively; Chief Executive Officer, Global Asset Management, Ameriprise Financial, Inc. since September 2012 (previously Chief Executive Officer, U.S. Asset Management & President, Annuities, May 2010-September 2012); Director and Chief Executive Officer, Columbia Management Investment Distributors, Inc. since May 2010 and February 2012, respectively; Chairman of the Board and Chief Executive Officer, RiverSource Distributors, Inc. since 2006; Director, Threadneedle Asset Management Holdings, SARL since 2014; President and Chief Executive Officer, Ameriprise Certificate Company, 2006-August 2012. | | 184 | | Trustee to other Columbia Funds since 2001; Chairman of the Board, Columbia Management Investment Advisers, LLC since May 2010; Director, Columbia Management Investment Distributors, Inc. since May 2010; Former Director, Ameriprise Certificate Company, 2006-January 2013 |
| * | Interested person (as defined under the 1940 Act) by reason of being an officer, director, security holder and/or employee of the Investment Manager or Ameriprise Financial. |
The Statement of Additional Information has additional information about the Fund’s Board members and is available, without charge, upon request by calling 800.345.6611; contacting your financial intermediary; or
visiting investor.columbiathreadneedleus.com.
| | | | | | |
| | |
| | | | ACTIVE PORTFOLIOS® MULTI-MANAGER ALTERNATIVES FUND | | |
TRUSTEES AND OFFICERS (continued)
The Board has appointed officers who are responsible for day-to-day business decisions based on policies it has established. The officers serve at the pleasure of the Board. The following table provides basic information about the Officers of the Fund, including principal occupations during the past five years, although their specific titles may have varied over the period. In addition to Mr. Truscott, who is Senior Vice President, the Fund’s other officers are:
| | | | |
| Fund Officers |
Name, Address and
Year of Birth | | Position and Year First Appointed to Position for any Fund in the Columbia Funds Complex or a Predecessor Thereof | | Principal Occupation(s) During Past Five Years |
Christopher O. Petersen 5228 Ameriprise Financial Center Minneapolis, MN 55474 Born 1970 | | President and Principal Executive Officer (2015) | | Vice President and Lead Chief Counsel, Ameriprise Financial, Inc. since January 2015 (previously, Vice President and Chief Counsel January 2010-December 2014); officer of Columbia Funds and affiliated funds since 2007. |
Michael G. Clarke 225 Franklin Street Boston, MA 02110 Born 1969 | | Treasurer (2011), Chief Financial Officer (2009) and Chief Accounting Officer (2015) | | Vice President — Mutual Fund Administration, Columbia Management Investment Advisers, LLC, since May 2010; senior officer of Columbia Funds and affiliated funds since 2002. |
Paul B. Goucher 100 Park Avenue New York, NY 10017 Born 1968 | | Senior Vice President (2011), Chief Legal Officer (2015) and Assistant Secretary (2008) | | Vice President and Lead Chief Counsel, Ameriprise Financial, Inc. since November 2008 and January 2013, respectively (previously Chief Counsel, January 2010-January 2013); Vice President, Chief Legal Officer and Assistant Secretary, Columbia Management Investment Advisers, LLC since May 2010. |
Thomas P. McGuire 225 Franklin Street Boston, MA 02110 Born 1972 | | Senior Vice President and Chief Compliance Officer (2012) | | Vice President — Asset Management Compliance, Ameriprise Financial, Inc., since May 2010; Chief Compliance Officer, Ameriprise Certificate Company since September 2010. |
Colin Moore 225 Franklin Street Boston, MA 02110 Born 1958 | | Senior Vice President (2010) | | Executive Vice President and Global Chief Investment Officer, Ameriprise Financial, Inc., since July 2013; Executive Vice President and Global Chief Investment Officer, Columbia Management Investment Advisers, LLC since July 2013 (previously Director and Global Chief Investment Officer, 2010-2013). |
Michael E. DeFao 225 Franklin Street Boston, MA 02110 Born 1968 | | Vice President (2011) and Assistant Secretary (2010) | | Vice President and Chief Counsel, Ameriprise Financial, Inc. since May 2010. |
Amy Johnson 5228 Ameriprise Financial Center Minneapolis, MN 55474 Born 1965 | | Vice President (2006) | | Managing Director and Global Head of Operations, Columbia Management Investment Advisers, LLC since April 2016 (previously Managing Director and Chief Operating Officer, 2010-2016). |
Lyn Kephart-Strong 5228 Ameriprise Financial Center Minneapolis, MN 55474 Born 1960 | | Vice President (2015) | | President, Columbia Management Investment Services Corp. since October 2014; Vice President & Resolution Officer, Ameriprise Trust Company since August 2009. |
Ryan C. Larrenaga 225 Franklin Street Boston, MA 02110 Born 1970 | | Vice President and Secretary (2015) | | Vice President and Group Counsel, Ameriprise Financial, Inc. since August 2011; officer of Columbia Funds and affiliated funds since 2005. |
| | | | | | |
| | |
| | | | ACTIVE PORTFOLIOS® MULTI-MANAGER ALTERNATIVES FUND | | |
BOARD CONSIDERATION AND APPROVAL OF MANAGEMENT AGREEMENT AND SUBADVISORY AGREEMENTS
On June 10, 2016, the Board of Trustees (the Board) and the Trustees who are not interested persons (as defined in the Investment Company Act of 1940) (the Independent Trustees) of Columbia Funds Series Trust I (the Trust) unanimously approved the continuation of the Management Agreement (the Management Agreement) with Columbia Management Investment Advisers, LLC (the Investment Manager) and the Subadvisory Agreements (the Subadvisory Agreements) between the Investment Manager and AQR Capital Management, LLC, Wasatch Advisors, Inc. and Water Island Capital (the Subadvisers) with respect to Active Portfolios® Multi-Manager Alternatives Fund (the Fund), a series of the Trust.1 As detailed below, the Board’s Advisory Fees and Expenses Committee (the Committee) and the Board met on multiple occasions to review and discuss, both among themselves and with the management team of the Investment Manager, materials provided by the Investment Manager and others before determining to approve the continuation of the Management Agreement and the Subadvisory Agreements (collectively, the Agreements).
In connection with their deliberations regarding the continuation of the Management Agreement and the Subadvisory Agreements, the Committee and the Board evaluated materials requested from the Investment Manager regarding the Fund and the Agreements, and discussed these materials with representatives of the Investment Manager at Committee meetings held on March 8, 2016, April 27, 2016 and June 9, 2016 and at Board meetings held on March 9, 2016 and June 10, 2016. In addition, the Board considers matters bearing on the Agreements at most of its other meetings throughout the year and meets regularly with senior management of the Trust and the Investment Manager. Through the Board’s Investment Oversight Committees, Trustees also meet with selected portfolio managers of the funds the Trustees oversee and other investment personnel at various times throughout the year. The Committee and the Board also consulted with its independent fee consultant, Fund counsel and with the Independent Trustees’ independent legal counsel, who advised on various matters with respect to the Committee’s and the Board’s considerations and otherwise assisted the Committee and the Board in their deliberations. On June 9, 2016, the Committee recommended that the Board approve the continuation of the Management Agreement and the Subadvisory Agreements. On June 10, 2016, the Board, including the Independent Trustees, voting separately, unanimously approved the continuation of the Management Agreement and the Subadvisory Agreements for the Fund.
The Committee and the Board considered all information that they, their legal counsel or the Investment Manager believed reasonably necessary to evaluate and to determine whether to recommend for approval or approve the continuation of the Management Agreement and the Subadvisory Agreements. The information and factors considered by the Committee and the Board in recommending for approval or approving the continuation of the Management Agreement and the Subadvisory Agreements for the Fund included the following:
| • | | Information on the investment performance of the Fund relative to the performance of a group of mutual funds determined to be comparable to the Fund by an independent third-party data provider, as well as performance relative to benchmarks; |
| • | | Information on the Fund’s management fees and total expenses, including information comparing the Fund’s expenses to those of a group of comparable mutual funds, as determined by the independent third-party data provider; |
| • | | The Investment Manager’s agreement to contractually limit or cap total operating expenses for the Fund through December 31, 2017 so that total operating expenses (excluding certain fees and expenses, such as transaction costs and certain other investment related expenses, interest, taxes, acquired fund fees and expenses, and infrequent and/or unusual expenses) would not exceed a specified annual rate, as a percentage of the Fund’s net assets; |
| • | | The terms and conditions of the Agreements; |
| • | | The subadvisory fees to be charged to the Investment Manager under the Subadvisory Agreements; |
| • | | The current and proposed terms and conditions of other agreements and arrangements with affiliates of the Investment Manager relating to the operations of the Fund, including agreements with respect to the provision of distribution and transfer agency services to the Fund; |
| 1 | At a meeting held on August 17, 2016, the Board approved the termination of the Subadvisory Agreement with Wasatch Advisors, Inc., to be effective on or about October 20, 2016. |
| | | | | | |
| | |
| | | | ACTIVE PORTFOLIOS® MULTI-MANAGER ALTERNATIVES FUND | | |
BOARD CONSIDERATION AND APPROVAL OF MANAGEMENT AGREEMENT AND SUBADVISORY AGREEMENTS (continued)
| • | | Descriptions of various functions performed by the Investment Manager and the Subadvisers under the Agreements, including portfolio management and portfolio trading practices; |
| • | | Information regarding the management fees of similarly-managed portfolios of other clients of the Investment Manager, including institutional separate accounts; |
| • | | Information regarding the reputation, regulatory history and resources of the Investment Manager and Subadvisers, including information regarding senior management, portfolio managers and other personnel; |
| • | | Information regarding the capabilities of the Investment Manager with respect to compliance monitoring services, including an assessment of the Investment Manager’s and the Subadvisers’ compliance systems by the Fund’s Chief Compliance Officer; and |
| • | | The profitability to the Investment Manager and its affiliates from their relationships with the Fund. |
Nature, Extent and Quality of Services Provided under the Agreements
The Committee and the Board considered the nature, extent and quality of services provided to the Fund by the Investment Manager, the Subadvisers and the Investment Manager’s affiliates under the Agreements and under separate agreements for the provision of transfer agency services, and the resources dedicated to the Fund and the other Columbia Funds by the Investment Manager, the Subadvisers and the Investment Manager’s affiliates. The Committee and the Board considered, among other things, the Investment Manager’s ability to attract, motivate and retain highly qualified research, advisory and supervisory investment professionals (including personnel and other resources, compensation programs for personnel involved in fund management, reputation and other attributes), the portfolio management services provided by those investment professionals, and the quality of the Investment Manager’s investment research capabilities and trade execution services. The Committee and the Board also considered the potential benefits to shareholders of investing in a mutual fund that is part of a fund complex offering exposure to a variety of asset classes and investment disciplines and providing a variety of fund and shareholder services.
The Committee and the Board also considered the professional experience and qualifications of the senior personnel of the Investment Manager and the Subadvisers, which included consideration of the Investment Manager’s and the Subadvisers’ experience with similarly-structured funds. The Committee and the Board noted the compliance programs of and the compliance-related resources provided to the Fund by the Investment Manager and its affiliates, and considered the Investment Manager’s ability to provide administrative services to the Fund and coordinate the activities of the Fund’s other service providers. The Board also noted that the Board had approved the Subadvisers’ codes of ethics and compliance programs, and that the Chief Compliance Officer of the Funds reports to the Trustees on the Subadvisers’ compliance programs.
The Committee and the Board considered the diligence and selection process undertaken by the Investment Manager to select the Subadvisers, including the Investment Manager’s rationale for recommending the continuation of the Subadvisory Agreements, and the process for monitoring the Subadvisers’ ongoing performance of services for the Fund. As part of these deliberations, the Committee and the Board considered the ability of the Investment Manager, subject to the approval of the Board, to modify or enter into new subadvisory agreements without a shareholder vote pursuant to an exemptive order of the Securities and Exchange Commission. The Committee and the Board also considered the scope of services provided to the Fund by the Investment Manager that are distinct from and in addition to those provided by the Subadvisers, including cash flow management, treasury services, risk oversight, investment oversight and Subadviser selection, oversight and transition management. After reviewing these and related factors, the Committee and the Board concluded, within the context of their overall conclusions, that the nature, extent and quality of the services provided to the Fund under the Agreements supported the continuation of the Management Agreement and the Subadvisory Agreements.
Investment Performance
The Committee and the Board reviewed information about the performance of the Fund over various time periods, including performance information relative to benchmarks and information based on reports of the independent
| | | | | | |
| | |
| | | | ACTIVE PORTFOLIOS® MULTI-MANAGER ALTERNATIVES FUND | | |
BOARD CONSIDERATION AND APPROVAL OF MANAGEMENT AGREEMENT AND SUBADVISORY AGREEMENTS (continued)
third-party data provider that compared the performance of the Fund to the performance of a group of comparable mutual funds, and data provided by the independent fee consultant. The Committee and the Board also reviewed a description of the third party’s methodology for identifying the Fund’s peer groups for purposes of performance and expense comparisons. Although the Fund’s performance lagged that of a relevant peer group for certain (although not necessarily all) periods, the Committee and the Board concluded that other factors relevant to performance were sufficient, in light of other considerations, to warrant continuation of the Management Agreement and the Subadvisory Agreements. Those factors included one or more of the following: (i) that the Fund’s performance, although lagging in certain recent periods, was stronger over the longer term; (ii) that the underperformance was attributable, to a significant extent, to investment decisions that were reasonable and consistent with the Fund’s investment strategy and policies and that the Fund was performing within a reasonable range of expectations, given those investment decisions, market conditions and the Fund’s investment strategy; (iii) that the Fund’s performance was competitive when compared to other relevant performance benchmarks or peer groups; and (iv) that the Investment Manager had taken or was taking steps designed to help improve the Fund’s investment performance, including, but not limited to, replacing portfolio managers, enhancing the resources supporting the portfolio managers, or modifying investment strategies.
The Committee and the Board noted that, through December 31, 2015, the Fund’s performance was in the ninetieth and sixty-first percentile (where the best performance would be in the first percentile) of its category selected by the independent third-party data provider for the purposes of performance comparisons for the one- and three-year periods, respectively.
The Committee and the Board also considered the Investment Manager’s performance and reputation generally, the Investment Manager’s historical responsiveness to Board concerns about performance, and the Investment Manager’s willingness to take steps intended to improve performance. After reviewing these and related factors, the Committee and the Board concluded, within the context of their overall conclusions, that the performance of the Fund, the Investment Manager and the Subadvisers were sufficient, in light of other considerations, to warrant the continuation of the Management Agreement and the Subadvisory Agreements.
Investment Management Fee Rates and Other Expenses
The Committee and the Board considered the management fees charged to the Fund under the Management Agreement and the Subadvisory Agreements, as well as the total expenses incurred by the Fund. In assessing the reasonableness of the fees under the Management Agreement, the Committee and the Board considered, among other information, the Fund’s management fee and its total expense ratio as a percentage of average daily net assets. The Committee and the Board considered data provided by the independent fee consultant. The Committee and the Board noted that, as of December 31, 2015, the Fund’s actual management fee and net total expense ratio are ranked in the third and second quintiles, respectively, (where the lowest fees and expenses would be in the first quintile) against the Fund’s expense universe as determined by the independent third-party data provider for purposes of expense comparison. The Committee and the Board also considered the fees that the Subadvisers charge to their other clients, and noted that the Investment Manager pays the fees of the Subadvisers. The Committee and the Board also took into account the fee waiver and expense limitation arrangements agreed to by the Investment Manager, as noted above.
The Committee and the Board also received and considered information about the management fees charged by the Investment Manager to institutional separate accounts. In considering the fees charged to those accounts, the Committee and the Board took into account, among other things, the Investment Manager’s representations about the differences between managing mutual funds as compared to other types of accounts, including differences in the services provided, differences in the risk profile of such business for the Investment Manager and the additional resources required to manage mutual funds effectively. The Committee and the Board received and considered information about the fees charged by the Investment Manager for sub-advisory services provided to comparable unaffiliated funds. In evaluating the Fund’s management fees, the Committee and the Board also took into account the demands, complexity and quality of the investment management of the Fund.
| | | | | | |
| | |
| | | | ACTIVE PORTFOLIOS® MULTI-MANAGER ALTERNATIVES FUND | | |
BOARD CONSIDERATION AND APPROVAL OF MANAGEMENT AGREEMENT AND SUBADVISORY AGREEMENTS (continued)
After reviewing these and related factors, the Committee and the Board concluded, within the context of their overall conclusions, that the management fee rates and expenses of the Fund were sufficient, in light of other considerations, to warrant the continuation of the Management Agreement and the Subadvisory Agreements.
Costs of Services Provided and Profitability
The Committee and the Board also took note of the costs the Investment Manager and its affiliates incur in connection with the services provided (both on an absolute and relative basis) and the profitability to the Investment Manager and its affiliates in connection with their relationships with the Fund.
The Committee and the Board also considered the compensation directly or indirectly received by the Investment Manager’s affiliates in connection with their relationships with the Fund. The Committee and the Board reviewed information provided by management as to the profitability to the Investment Manager and its affiliates of their relationships with the Fund, information about the allocation of expenses used to calculate profitability, and comparisons of profitability levels realized in 2015 to profitability levels realized in 2014. When reviewing profitability, the Committee and the Board also considered court cases in which adviser profitability was an issue in whole or in part, the performance of similarly managed funds, the performance of the Fund, and the expense ratio of the Fund. In addition, the Committee and the Board considered information provided by the Investment Manager regarding its financial condition and comparing its profitability to that of other asset management firms that are, or are subsidiaries of, publicly traded companies. Because the Subadvisory Agreements were negotiated at arms-length by the Investment Manager, which is responsible for payments to the Subadvisers thereunder, the Committee and the Board did not consider the profitability to each Subadviser of its relationship with the Fund.
After reviewing these and related factors, the Committee and the Board concluded, within the context of their overall conclusions, that the costs of services provided and the profitability to the Investment Manager and its affiliates from their relationships with the Fund supported the continuation of the Management Agreement and the Subadvisory Agreements.
Economies of Scale
The Committee and the Board considered the potential existence of economies of scale in the provision by the Investment Manager of services to the Fund, to groups of related funds, and to the Investment Manager’s investment advisory clients as a whole, and whether those economies of scale were shared with the Fund through breakpoints in investment management fees or other means, such as expense limitation arrangements and additional investments by the Investment Manager in investment, trading and compliance resources. The Committee and the Board noted that the management fee schedules for the Fund contained breakpoints that would reduce the fee rate on assets above specified threshold levels.
The Committee and the Board noted that the breakpoints, if any, in the Subadvisory Agreements did not occur at the same levels as the breakpoints in the Management Agreement. The Committee and the Board noted that absent a shareholder vote, the Investment Manager would bear any increase in fees payable under the Subadvisory Agreements. The Committee and the Board also noted the potential challenges of seeking to tailor the Management Agreement breakpoints to those of a subadvisory agreement in this context, and the effect that capacity constraints on a subadviser’s ability to manage assets could potentially have on the ability of the Investment Manager to achieve economies of scale, as new subadvisers may need to be added as the Fund grows, increasing the Investment Manager’s cost of compensating and overseeing the Fund’s subadvisers.
In considering these matters, the Committee and the Board also considered the costs of the services provided and the profitability to the Investment Manager and its affiliates from their relationships with the Fund, as discussed above. After reviewing these and related factors, the Committee and the Board concluded, within the context of their overall conclusions, that the extent to which any economies of scale were expected to be shared with the Fund supported the continuation of the Management Agreement and the Subadvisory Agreements.
| | | | | | |
| | |
| | | | ACTIVE PORTFOLIOS® MULTI-MANAGER ALTERNATIVES FUND | | |
BOARD CONSIDERATION AND APPROVAL OF MANAGEMENT AGREEMENT AND SUBADVISORY AGREEMENTS (continued)
Other Benefits to the Investment Manager
The Committee and the Board received and considered information regarding “fall-out” or ancillary benefits received by the Investment Manager and its affiliates as a result of their relationships with the Fund, such as the engagement of the Investment Manager’s affiliates to provide distribution and transfer agency services to the Fund. In this regard, among other matters, the Committee and the Board considered that the Fund’s distributor retains a portion of the distribution fees from the Fund and receives a portion of the sales charges on sales or redemptions of certain classes of shares of the Fund. The Committee and the Board also considered the benefits of research made available to the Investment Manager by reason of brokerage commissions generated by the Fund’s securities transactions, and reviewed information about the Investment Manager’s practices with respect to allocating portfolio transactions for brokerage and research services. The Committee and the Board considered the possible conflicts of interest associated with certain fall-out or other ancillary benefits and the reporting, disclosure and other processes that are in place to address such possible conflicts of interest. The Committee and the Board recognized that the Investment Manager’s profitability would be somewhat lower without these benefits.
Conclusion
The Committee and the Board reviewed all of the above considerations in reaching their decisions to recommend or approve the continuation of the Management Agreement and the Subadvisory Agreements. In their deliberations, the Trustees did not identify any particular information that was all-important or controlling, and individual Trustees may have attributed different weights to the various factors. Based on their evaluation of all factors that they deemed to be material, including those factors described above, and assisted by the advice of independent legal counsel, the Board, including the Independent Trustees, voting separately, unanimously approved the continuation of the Management Agreement and the Subadvisory Agreements.
| | | | | | |
| | |
| | | | ACTIVE PORTFOLIOS® MULTI-MANAGER ALTERNATIVES FUND | | |
IMPORTANT INFORMATION ABOUT THIS REPORT
Each fund mails one shareholder report to each shareholder address. If you would like more than one report, please call shareholder services at 800.345.6611 and additional reports will be sent to you.
The policy of the Board is to vote the proxies of the companies in which each fund holds investments consistent with the procedures as stated in the Statement of Additional Information (SAI). You may obtain a copy of the SAI without charge by calling 800.345.6611; contacting your financial intermediary; visiting investor.columbiathreadneedleus.com; or searching the website of the Securities and Exchange Commission (SEC) at sec.gov. Information regarding how each fund voted proxies relating to portfolio securities is filed with the SEC by August 31st for the most recent 12-month period ending June 30th of that year, and is available without charge by visiting investor.columbiathreadneedleus.com, or searching the website of the SEC at sec.gov.
Each fund files a complete schedule of portfolio holdings with the SEC for the first and third quarters of each fiscal year on Form N-Q. Each fund’s Form N-Q is available on the SEC’s website at sec.gov and may be reviewed and copied at the SEC’s Public Reference Room in Washington, D.C. Information on the operation of the Public Reference Room may be obtained by calling 800.SEC.0330. Each fund’s complete schedule of portfolio holdings, as filed on Form N-Q, can also be obtained without charge, upon request, by calling 800.345.6611.
You may obtain the current net asset value (NAV) of Fund shares at no cost by calling 800.345.6611 or by sending an email to serviceinquiries@columbiathreadneedle.com.
Active Portfolios® Multi-Manager Alternatives Fund
P.O. Box 8081
Boston, MA 02266-8081
Please read and consider the investment objectives, risks, charges and expenses for any fund carefully before investing. For a prospectus and summary prospectus, which contains this and other important information about the Fund, go to investor.columbiathreadneedleus.com. The Fund is distributed by Columbia Management Investment Distributors, Inc., member FINRA, and managed by Columbia Management Investment Advisers, LLC.
Columbia Threadneedle Investments (Columbia Threadneedle) is the global brand name of the Columbia and Threadneedle group of companies. All rights reserved. Columbia Management Investment Distributors, Inc., 225 Franklin Street, Boston, MA 02110-2804
© 2016 Columbia Management Investment Advisers, LLC.
investor.columbiathreadneedleus.com
ANN100_08_F01_(10/16)

ANNUAL REPORT
August 31, 2016

ACTIVE PORTFOLIOS® MULTI-MANAGER SMALL CAP EQUITY FUND


ABOUT COLUMBIA THREADNEEDLE INVESTMENTS
Columbia Threadneedle Investments is a leading global asset management group that provides a broad range of investment strategies and solutions for individual, institutional and corporate clients around the world.
With more than 2,000 people, including over 450 investment professionals based in North America, Europe and Asia, we manage $460 billion* of assets across developed and emerging market equities, fixed income, asset allocation solutions and alternatives. We are the 13th largest manager of long-term mutual fund assets in the U.S.** and the 4th largest manager of retail funds in the U.K.***
Our priority is the investment success of our clients. We aim to deliver the investment outcomes they expect through an investment approach that is team-based, performance-driven and risk-aware. Our culture is dynamic and interactive. By sharing our insights across asset classes and geographies, we generate richer perspectives on global, regional and local investment landscapes. The ability to exchange and debate investment ideas in a collaborative environment enriches our teams’ investment processes. More importantly, it results in better informed investment decisions for our clients.
Columbia funds are distributed by Columbia Management Investment Distributors, Inc., member FINRA, and managed by Columbia Management Investment Advisers, LLC.
Columbia Threadneedle Investments (Columbia Threadneedle) is the global brand name of the Columbia and Threadneedle group of companies.
| * | | In U.S. dollars as of June 30, 2016. Source: Ameriprise Q2 Earnings Release. Includes all assets managed by entities in the Columbia and Threadneedle group of companies. Contact us for more current data. |
| ** | | Source: ICI as of June 30, 2016 for Columbia Management Investment Advisers, LLC. |
| *** | | Source: Investment Association as of March 2016 for Threadneedle Asset Management Limited. |
© 2016 Columbia Management Investment Advisers, LLC. All rights reserved.
Not part of the shareholder report
| | | | |
| | Investment strategies to help meet investor needs |
| |
| | We are committed to helping investors navigate financial challenges to reach their desired outcomes. The possibilities are endless. |
| | | | |
| | | | |
| | Your success is our priority. |
| | | | |
| | |
| |  | | Retire comfortably |
| | | | |
| | |
| | | | Fund college or higher education |
| | | | |
| | |
| | | | Leave a legacy |
| | | | |
| | | | |
 | | Generate an appropriate stream of income in retirement Traditional approaches to income may no longer be adequate — and they may no longer provide the diversification benefits they once did. Investors need to rethink how they generate retirement income. Worried about running out of income? You are not alone. |
| | | | |
| | | | |
 | | Navigate a changing interest rate environment Even in today’s challenging interest rate environment, it’s still possible to navigate markets and achieve your goals. Make investment choices designed specifically for this market environment. |
| | | | |
| | | | |
| |
 | | Maximize after-tax returns In an environment where what you keep is more important than what you earn, municipal bonds can help mitigate higher taxes while providing attractive yields compared to other investment options. You’ve worked too hard building your wealth to lose it to taxes. |
| | | | |
| | | | |
 | | Grow assets to achieve financial goals Finding growth opportunities in today’s complex market environment requires strong research capabilities, creative thinking and a disciplined approach. Do your investments deliver the portfolio growth you need? |
| | | | |
| | | | |
| |
 | | Ease the impact of volatile markets With increasing concerns about market volatility, investors should consider diversifying their portfolios with non-traditional holdings. Interested in turning volatility into opportunity? |
To find out more, contact your financial professional, call 800.426.3750 or visit investor.columbiathreadneedleus.com
Not part of the shareholder report
PRESIDENT’S MESSAGE

Dear Shareholders,
Volatility comes with the territory for long-term investors. Some investors instinctively want to pull out of the market or sell underperforming investments at the first sign of increased volatility or perhaps even as soon as they perceive it on the horizon. But taking yourself out of the market could mean losing out on potential opportunities, and putting your longer term investment goals at risk.
Cumulative return is not just about achieving high returns when markets are going up; it’s also about remaining invested and minimizing losses during weak or volatile markets so that you can participate on the upside. Developing a deeper understanding of the various risks your portfolio is subject to can help you balance these risks.
Diversification is critical in seeking to achieve that balance. We believe that most portfolios could be more effectively diversified either by introducing holdings with performance profiles unrelated to existing holdings (like alternative products) or by rebalancing existing holdings with an eye toward risk allocation. Over time, distributing risk more evenly may produce a more pronounced diversification benefit and may improve portfolio efficiency. We believe market volatility can create significant opportunities and, in fact, these periods may be some of the very best times to invest.
With this in mind, I thought it important to highlight excerpts from a piece written by Colin Moore, Global Chief Investment Officer, in which he touches on some of these issues emphasizing the importance of a properly constructed portfolio in seeking to effectively manage volatility and to achieve consistency of returns. I encourage you to read the article in its entirety. To access the full article and for other insights on current market, please visit blog.columbiathreadneedleus.com/latest-perspectives.
You need investments that are designed to help you ease the impact of volatile market environments and keep the savings you have worked tirelessly to amass. Columbia Threadneedle Investments provides investment solutions to help you tackle financial challenges and achieve your desired outcome.
Best regards,

Christopher O. Petersen
President, Columbia Funds
Excerpts from:
Taking the scare out of the volatility bogeyman
By Colin Moore, Global Chief Investment Officer

Colin Moore is the global chief investment officer for Columbia Threadneedle Investments. His responsibilities include ensuring that a disciplined investment process is in place across all asset classes, including equity and fixed income. Mr. Moore joined one of the Columbia Threadneedle Investments legacy firms in 2002 as head of equity and was also head of fixed income and liquidity strategies from 2009-2010.
| n | | In today’s low growth, higher volatility world, the emphasis is shifting from maximization of returns to consistency of returns. |
| n | | Portfolios should represent the behavioral risk-return tradeoff of investors, remembering that they won’t stay invested to realize the return if we get the risk tolerance wrong. |
Annual Report 2016
PRESIDENT’S MESSAGE (continued)
| n | | Holding long-term savings in cash to avoid volatility (the financial equivalent of hiding under the sheets) is detrimental to achieving long-term goals. |
According to Wikipedia, “The bogeyman is a common allusion to a mythical creature in many cultures used to control behavior. This monster has no specific appearance, and conceptions about it can vary drastically from household to household within the same community; in many cases he has no set appearance in the mind of an adult or child, but is simply a non-specific embodiment of terror.” Different cultures have different names and physical representations for the bogeyman, and investors are no different. We have terrible monsters that we fear may destroy our portfolios, and we call one of the scariest of them volatility.
While the bogeyman is mythical (I hope!), volatility is real and can cause serious damage. To understand why investors have such a hard time coping with volatility, we first need to define three cognitive biases at work in today’s investment environment:
| | 1) | | Recency bias — something that has recently come to the forefront of our attention, regardless of how long established it is, suddenly seems to appear with improbable frequency. |
| | 2) | | Negativity bias — we tend to have a greater recall of unpleasant memories than positive memories. |
| | 3) | | Loss aversion — our dissatisfaction with losing money tends to be greater than our satisfaction with making money. |
The level of volatility varies dramatically, and so does investor fear and panic selling — waxing when volatility rises, waning when it falls. Recent studies have pointed to demographics as an important driver of panic selling. The theory is that as people get closer to retirement, the prospects of a large (20%-30%) loss in financial assets can have a much more pronounced effect on their sense of well-being. Wealth preservation instincts kick in much more quickly than for younger (and typically less wealthy) savers.
The reality is that there is little opportunity for return without volatility. Therefore, the bogeyman effect of holding long-term savings in cash to avoid volatility (the financial equivalent of hiding under the sheets) is detrimental to achieving long-term goals. This effect tends to be more pronounced during the episodic spikes in volatility. The significant spike in volatility in 2008 and 2009 led to significant withdrawals from long-term investment funds over the same period. Less pronounced effects can also be seen when comparing 2001–2003 and 2011–2012. Conversely, flows picked up when volatility returned to “normal” levels. Investor behavior of this type is consistent with the three behavioral biases.
I believe average volatility will be higher over the next 10 years than the last 10 years and episodic spikes will increase in frequency because sustainable economic growth will be structurally lower and geopolitical risk higher than any time since World War II. Low growth creates uncertainty while loss aversion will make investors fear that we are one economic mishap or geopolitical event away from no growth or recession. The result will be higher volatility on average. Negativity bias will tend to exacerbate “spike” reactions to event-driven geopolitical news, and the volatility bogeyman will appear more often. Assuming the behavioral biases continue, investor returns are likely to be very disappointing regardless of the total return generated by financial markets due to the bogeyman effect.
To mitigate this effect, we need to focus on portfolio construction and an improved understanding of diversification. I accept that equities are likely to offer the highest return over the next 10 years, but they also offer the highest volatility. Many portfolio construction optimization tools use historical average volatility, which is likely to underestimate the volatility investors will face. The bogeyman emerges when individual asset class volatility spikes and cross correlations rise, the combination of which increases overall portfolio volatility far beyond expectation. Diversification is meant to protect investors against volatility, but what’s the point of owning lots of investments if the volatility bogeyman has not been properly estimated?
Most importantly, portfolios should be constructed to properly represent the behavioral risk-return tradeoff of investors, remembering that they won’t stay invested to realize the return if we get the risk tolerance wrong. In a low growth, higher volatility world, the emphasis is shifting to return consistency rather than return maximization, and investors are
Annual Report 2016
PRESIDENT’S MESSAGE (continued)
best served through investment approaches that appreciate that distinction. Even though it’s a permanent feature of financial markets, volatility is less likely to be the bogeyman we all fear if portfolios are constructed with this understanding.
Please visit blog.columbiathreadneedleus.com/latest-perspectives to read the entire article.
Investors should consider the investment objectives, risks, charges and expenses of a mutual fund carefully before investing. For a free prospectus and summary prospectus, which contains this and other important information about a fund, visit investor.columbiathreadneedleus.com. The prospectus should be read carefully before investing.
The views expressed are as of April 2016, may change as market or other conditions change, and may differ from views expressed by other Columbia Management Investment Advisers, LLC (CMIA) associates or affiliates. Actual investments or investment decisions made by CMIA and its affiliates, whether for its own account or on behalf of clients, will not necessarily reflect the views expressed. This information is not intended to provide investment advice and does not account for individual investor circumstances. Investment decisions should always be made based on an investor’s specific financial needs, objectives, goals, time horizon and risk tolerance. Asset classes described may not be suitable for all investors.
Past performance does not guarantee future results, and no forecast should be considered a guarantee either. Since economic and market conditions change frequently, there can be no assurance that the trends described here will continue or that the forecasts are accurate.
Diversification does not guarantee a profit or protect against loss.
Columbia Funds are distributed by Columbia Management Investment Distributors, Inc., member FINRA, and managed by Columbia Management Investment Advisers, LLC.
© 2016 Columbia Management Investment Advisers, LLC. All rights reserved.
Annual Report 2016
| | | | | | |
| | |
| | | | ACTIVE PORTFOLIOS® MULTI-MANAGER SMALL CAP EQUITY FUND | | |
TABLE OF CONTENTS
Fund Investment Manager
Columbia Management Investment
Advisers, LLC
225 Franklin Street
Boston, MA 02110
Fund Distributor
Columbia Management Investment
Distributors, Inc.
225 Franklin Street
Boston, MA 02110
Fund Transfer Agent
Columbia Management Investment
Services Corp.
P.O. Box 8081
Boston, MA 02266-8081
For more information about any of the funds, please visit investor.columbiathreadneedleus.com or call 800.345.6611. Customer Service Representatives are available to answer your questions Monday through Friday from 8 a.m. to 7 p.m. Eastern time.
The views expressed in this report reflect the current views of the respective parties. These views are not guarantees of future performance and involve certain risks, uncertainties and assumptions that are difficult to predict, so actual outcomes and results may differ significantly from the views expressed. These views are subject to change at any time based upon economic, market or other conditions and the respective parties disclaim any responsibility to update such views. These views may not be relied on as investment advice and, because investment decisions for a Columbia fund are based on numerous factors, may not be relied on as an indication of trading intent on behalf of any particular Columbia fund. References to specific securities should not be construed as a recommendation or investment advice.
Annual Report 2016
| | | | | | |
| | |
| | | | ACTIVE PORTFOLIOS® MULTI-MANAGER SMALL CAP EQUITY FUND | | |
PERFORMANCE OVERVIEW
Performance Summary
| n | | Active Portfolios® Multi-Manager Small Cap Equity Fund (the Fund) Class A shares returned 6.91% for the 12-month period that ended August 31, 2016. |
| n | | The Fund underperformed its benchmark, the Russell 2000 Index, which returned 8.59% over the same period. |
| n | | Individual stock selection generally accounted for the Fund’s relative underperformance. |
| | | | | | | | | | |
Average Annual Total Returns (%) (for period ended August 31, 2016) | |
| | | Inception | | 1 Year | | | Life | |
Class A | | 04/20/12 | | | 6.91 | | | | 11.27 | |
Russell 2000 Index | | | | | 8.59 | | | | 11.98 | |
All results shown assume reinvestment of distributions during the period. Returns do not reflect the deduction of taxes that a shareholder may pay on Fund distributions or on the redemption of Fund shares. Performance results reflect the effect of any fee waivers or reimbursements of Fund expenses by Columbia Management Investment Advisers, LLC and/or any of its affiliates. Absent these fee waivers or expense reimbursement arrangements, performance results would have been lower.
The performance information shown represents past performance and is not a guarantee of future results. The investment return and principal value of your investment will fluctuate so that your shares, when redeemed, may be worth more or less than their original cost. Current performance may be lower or higher than the performance information shown. You may obtain performance information current to the most recent month-end by contacting your financial intermediary, visiting investor.columbiathreadneedleus.com or calling 800.345.6611.
The Russell 2000 Index measures the performance of the small-cap segment of the U.S. equity universe. The Russell 2000 is a subset of the Russell 3000 Index representing approximately 10% of the total market capitalization of that index. It includes approximately 2000 of the smallest securities based on a combination of their market cap and current index membership.
Indices are not available for investment, are not professionally managed and do not reflect sales charges, fees, brokerage commissions, taxes or other expenses of investing. Securities in the Fund may not match those in an index.
| | | | | | |
| | |
| | | | ACTIVE PORTFOLIOS® MULTI-MANAGER SMALL CAP EQUITY FUND | | |
PERFORMANCE OVERVIEW (continued)
|
Performance of a Hypothetical $10,000 Investment (April 20, 2012 — August 31, 2016) |
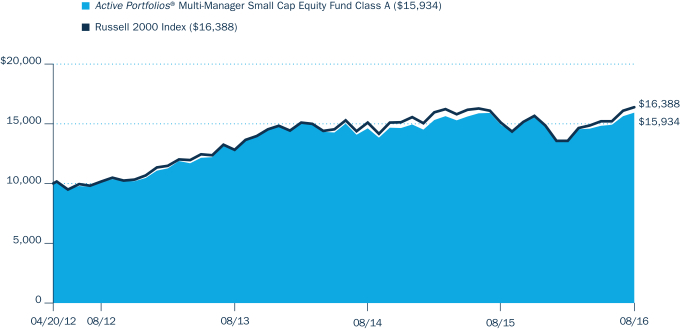
The chart above shows the change in value of a hypothetical $10,000 investment in Class A shares of Active Portfolios® Multi-Manager Small Cap Equity Fund during the stated time period, and does not reflect the deduction of taxes that a shareholder may pay on Fund distributions or on the redemption of Fund shares.
| | | | | | |
| | |
| | | | ACTIVE PORTFOLIOS® MULTI-MANAGER SMALL CAP EQUITY FUND | | |
MANAGER DISCUSSION OF FUND PERFORMANCE
Portfolio Management
BMO Asset Management Corp.
David Corris, CFA
Thomas Lettenberger, CFA
Columbia Management Investment Advisers, LLC
Christian Stadlinger, Ph.D., CFA
Jarl Ginsberg, CFA, CAIA
Conestoga Capital Advisors, LLC
Robert Mitchell
Joseph Monahan
Dalton, Greiner, Hartman, Maher & Co., LLC
Bruce Geller, CFA
Jeffrey Baker, CFA
Peter Gulli, CFA
Edward Turville, CFA
EAM Investors, LLC
Montie Weisenberger
Morningstar Style Box™
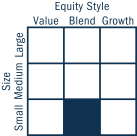
The Morningstar Style Box™ is based on a fund’s portfolio holdings. For equity funds, the vertical axis shows the market capitalization of the stocks owned, and the horizontal axis shows investment style (value, blend, or growth). Information shown is based on the most recent data provided by Morningstar.
© 2016 Morningstar, Inc. All rights reserved. The Morningstar information contained herein: (1) is proprietary to Morningstar and/or its content providers; (2) may not be copied or distributed; and (3) is not warranted to be accurate, complete or timely. Neither Morningstar nor its content providers are responsible for any damages or losses arising from any use of this information.
Effective October 26, 2015, BMO Asset Management Corp. (BMO) was added as a manager of a portion of the Fund. The Fund is currently managed by four independent money management firms and by Columbia Management Investment Advisers, LLC (CMIA) and each invests a portion of the portfolio’s assets. As of August 31, 2016, Dalton, Greiner, Harman, Maher & Co., LLC (DGHM), EAM Investors, LLC (EAM), Conestoga Capital Advisors LLC (Conestoga), BMO and CMIA managed approximately 20%, 21%, 19%, 20% and 20% of the portfolio, respectively.
For the 12-month period that ended August 31, 2016, the Fund’s Class A shares returned 6.91%. The Fund underperformed its benchmark, the Russell 2000 Index, which returned 8.59% over the same period. Individual stock selection generally accounted for the Fund’s relative underperformance.
Small Cap Equities Gained Despite Heightened Volatility
Perhaps the most significant factor affecting U.S. small cap equities during the 12-month period ended August 31, 2016 was heightened volatility. Extreme risk aversion dominated the last months of 2015 and first six weeks of 2016 and was driven by slowing economic growth in China, collapsing energy prices, fears that European and emerging market economies were entering a recession, anticipation of tightening Federal Reserve (Fed) policy and then the actual increase of interest rates by the Fed in December 2015. In mid-February 2016, the Fed suggested a halt on further increases in interest rates, and the equity markets switched toward embracing risk, while at the same time continuing to stretch for yield. Further supporting the small-cap segment of the U.S. equity market during the second half of the period was continued economic growth in the U.S., employment expansion and corporate earnings growth in line with consensus expectations. Temporarily adding an element of volatility in June 2016 was the U.K.’s referendum to leave the European Union, popularly known as Brexit, but such a disruption was short-lived, and the equity markets generally trended upward through the end of the period.
For the period as a whole, value stocks significantly outperformed growth stocks within the small-cap equity universe. There was also a wide dispersion of returns across sectors, with consumer staples and information technology posting strong results, while energy and health care declined sharply.
Individual Stock Selection Impacted Fund Performance Most
DGHM: Our portion of the Fund outperformed the benchmark, attributable primarily to an underweight allocation to the weakly performing health care sector and an overweight exposure to the stronger performing financials sector. Stock selection in the health care and energy sectors and in the retail/apparel industry also contributed positively. These positive contributors more than offset the impact of positioning in the information technology, basic materials and business services market segments, which detracted.
The individual positions in our portion of the Fund’s portfolio that contributed most positively were WPX Energy, BioMed Realty Trust and Global Brass and Copper Holdings. WPX Energy, a North American exploration and production
| | | | | | |
| | |
| | | | ACTIVE PORTFOLIOS® MULTI-MANAGER SMALL CAP EQUITY FUND | | |
MANAGER DISCUSSION OF FUND PERFORMANCE (continued)
company, saw its shares appreciate significantly based on its solid balance sheet and the recovery in oil prices. Shares of BioMed Realty Trust, a health care real estate investment trust (REIT), rose due to its purchase by Blackstone’s private equity fund. We sold our shares in BioMed Realty Trust before the close of the reporting period. Global Brass and Copper Holdings is a converter, fabricator and distributor of specialized brass and copper products. Its stock gained as a restructuring during the economic downturn positively positioned the company to capitalize on the upturn in its end markets, particularly building and housing.
Individual positions that disappointed most during the period were Radian Group, Korn/Ferry International and Hersha Hospitality Trust. Radian Group is one of the largest private mortgage insurance companies. While we believe the company should benefit from the improvement in mortgage credit, the recovery in housing and the reduction of the U.S. government’s presence in the single-family mortgage market, industry pricing concerns and general macroeconomic worries drove its shares down. Korn/Ferry International is a recruitment/consulting firm that has grown beyond its core executive search business to also focus on leadership/talent, consulting and outsourcing. Concerns about slowing employment trends and global macroeconomic worries caused its share price to decline. Hersha Hospitality Trust is a hotel REIT with a focus on owning, acquiring, redeveloping and recycling urban hotel assets, both branded and independent. Many of its assets have a cost basis well below replacement and fair market value, and, in our view, there appears to be a disconnect between its market price and the intrinsic value of its portfolio. Its shares declined on concerns about peaking hotel fundamentals.
EAM: Our portion of the Fund underperformed the benchmark due to a combination of difficult stock selection and unfavorable sector allocation effects. Stock selection in health care, especially the biotech/pharma industry, and information technology weighed most on relative results, which were partially offset by positive stock selection within energy and consumer staples. Our growth-oriented style suffered from a significant overweight to the underperforming health care sector and a significant underweight to the outperforming financials sector relative to the benchmark, but results were partially offset by the positive contribution of an overweight to the outperforming telecommunication services sector.
The biggest individual detractors from our portion of the Fund’s results during the period were biopharmaceutical companies Portola Pharmaceuticals and Cara Therapeutics and development stage specialty pharmaceutical company Adamas Pharmaceuticals. Portola Pharmaceuticals’ Phase 3 study for betrixaban in mentally ill patients at risk for blood clots missed the first step in the primary analysis plan, lowering the probability for regulatory and/or commercial success. Shares of Cara Therapeutics and Adamas Pharmaceuticals pulled back in the broad industry correction early in the first quarter of 2016. We sold our portion of the Fund’s shares in each of these three stocks.
Positions in Celator Pharmaceuticals, Clayton Williams Energy and John Bean Technologies were top contributors to our portion of the Fund’s results. Celator Pharmaceuticals is a biopharmaceutical company that engages in developing therapies to treat cancer. Its stock surged on an announcement that its Vyxeos Phase III study met its primary endpoint to
| | | | |
Top Ten Holdings (%)
(at August 31, 2016) | |
EMCOR Group, Inc. | | | 0.9 | |
Cantel Medical Corp. | | | 0.8 | |
Omnicell, Inc. | | | 0.8 | |
Vascular Solutions, Inc. | | | 0.8 | |
Brandywine Realty Trust | | | 0.7 | |
SPS Commerce, Inc. | | | 0.7 | |
Neogen Corp. | | | 0.7 | |
Merit Medical Systems, Inc. | | | 0.6 | |
Blackbaud, Inc. | | | 0.6 | |
Mesa Laboratories, Inc. | | | 0.6 | |
Percentages indicated are based upon total investments (excluding Money Market Funds).
For further detail about these holdings, please refer to the section entitled “Portfolio of Investments.”
Fund holdings are as of the date given, are subject to change at any time, and are not recommendations to buy or sell any security.
Investment Risks
Market risk may affect a single issuer, sector of the economy, industry or the market as a whole. Foreign investments subject the Fund to risks, including political, economic, market, social and others within a particular country, as well as to currency instabilities and less stringent financial and accounting standards generally applicable to U.S. issuers. Investments in small-cap companies involve risks and volatility greater than investments in larger, more established companies. The Fund may invest significantly in issuers within a particular sector, which may be negatively affected by market, economic or other conditions, making the Fund more vulnerable to unfavorable developments in the sector. The Fund is managed by multiple advisers independently of one another, which may result in contradicting trades (i.e., with no net benefit to the Fund), while increasing transaction costs. Market or other (e.g., interest rate) environments may adversely affect the liquidity of fund investments, negatively impacting their price. Generally, the less liquid the market at the time the Fund sells a holding, the greater the risk of loss or decline of value to the Fund. See the Fund’s prospectus for information on these and other risks.
| | | | |
Portfolio Breakdown (%)
(at August 31, 2016) | |
Common Stocks | | | 98.5 | |
Money Market Funds | | | 1.5 | |
Total | | | 100.0 | |
Percentages indicated are based upon total investments. The Fund’s portfolio composition is subject to change.
| | | | | | |
| | |
| | | | ACTIVE PORTFOLIOS® MULTI-MANAGER SMALL CAP EQUITY FUND | | |
MANAGER DISCUSSION OF FUND PERFORMANCE (continued)
| | | | |
Equity Sector Breakdown (%)
(at August 31, 2016) | |
Consumer Discretionary | | | 9.9 | |
Consumer Staples | | | 2.7 | |
Energy | | | 4.2 | |
Financials | | | 24.8 | |
Health Care | | | 15.1 | |
Industrials | | | 16.7 | |
Information Technology | | | 18.9 | |
Materials | | | 4.6 | |
Telecommunication Services | | | 0.1 | |
Utilities | | | 3.0 | |
Total | | | 100.0 | |
Percentages indicated are based upon total equity investments. The Fund’s portfolio composition is subject to change.
show a survival improvement for select patients. The company was subsequently acquired by Jazz Pharmaceuticals for access to its paradigm-changing leukemia drug. We sold our shares in Jazz Pharmaceuticals before the close of the reporting period. Clayton Williams Energy, an independent oil and gas producer, outperformed its exploration and production peers, as recent transactions highlighted the potential value of the company’s acreage in the Permian and Eagle Ford basins. The market reacted positively to the company raising $150 million in equity to help reduce its debt load and ramp up its drilling program. John Bean Technologies makes capital equipment for food processing and airports. Its stock benefited from favorable end-market trends in the food equipment business and from favorable consumer dietary changes.
Conestoga: Our portion of the Fund outperformed the benchmark during the period due primarily to an emphasis on high quality companies, that is, those with positive earnings, sustainable earnings growth and strong balance sheets. Stock selection also added to relative returns as did sector allocation.
More specifically, stock selection was strongest in the health care, consumer discretionary and industrials sectors. Having an underweight to the weaker consumer discretionary sector and an overweight to the stronger industrials sector also helped. Only partially offsetting these positive contributors was the detracting effect of having an underweight to financials and no exposure to consumer staples, as each of these sectors outpaced the benchmark during the period. Stock selection in financials and information technology also detracted.
The biggest individual contributors to our portion of the Fund’s results were Cantel Medical, a leading provider of infection prevention and control products and services; AAON, a manufacturer of large-tonnage rooftop HVAC equipment for non-residential buildings; and Trex Company, a market leader in composite decking and railing. We sold our shares in Trex Company before the close of the reporting period. Cantel Medical saw share gains due to strong revenue and operating profit growth, both of which were driven organically. Following several disappointing quarters, AAON announced a significant new product line while also reporting a sharp acceleration in orders. Shares of Trex Company rose due primarily to strong revenue and net income growth. Also, the company made positive comments about a solid start to the decking season and some new international growth opportunities.
Positions in Advisory Board Company, PROS Holdings and Rubicon Project detracted most from our portion of the Fund’s results. Advisory Board Company, which provides best practices research and consulting services to health care systems and hospitals, reported disappointing fourth quarter 2015 and 2016 guidance. Moreover, it recorded a $96 million write-off of goodwill of its acquisition of Royall & Co. The business was challenged in its core health care business, particularly around the revenue cycle management segment. We removed Advisory Board Company from our portion of the Fund on concerns about valuation and disappointment in its management actions. PROS Holdings is a provider of price optimization software and services, which has been transitioning from a perpetual license revenue model to a cloud-based model, but thus far the transition has not gone smoothly. We continue to monitor the company’s progress
| | | | | | |
| | |
| | | | ACTIVE PORTFOLIOS® MULTI-MANAGER SMALL CAP EQUITY FUND | | |
MANAGER DISCUSSION OF FUND PERFORMANCE (continued)
closely. Rubicon Project is a market-leading platform enabling the automation of buying and selling digital advertising. A strong first quarter 2016 earnings report was nevertheless met with disappointment from investors, as guidance was not raised and a key reporting metric was weaker than anticipated. At the end of the period, we believed our investment thesis in Rubicon Project, based on its competitive positioning and strong secular growth, had not changed.
BMO: We began managing a portion of the Fund on October 26, 2015. For the period from October 26, 2015 through August 31, 2016, our portion of the Fund outperformed the benchmark. The primary driver of outperformance was stock selection. Our strategy is designed to add value through stock selection by focusing on fundamentally strong, attractively valued stocks with positive investor interest. During this period, our stock selection model drove outperformance with all three components — strong fundamentals, attractive valuations and investor interest — contributing positively. Sector allocation also contributed positively to our portion of the Fund’s performance.
The strongest-contributing sectors to our portion of the Fund were information technology, energy and utilities. In information technology, both stock selection, particularly within the electronic equipment and communications equipment industries, and an overweight to the sector proved beneficial. In energy, stock selection, especially among exploration and production companies, and having an underweight to the poorly performing sector contributed positively. The primary driver of energy returns during the period was oil price volatility, with prices plummeting in late 2015 and early 2016, then rebounding following mid-February. In utilities, stock selection more than offset the slightly negative allocation effect of being underweight the strongly performing sector. The primary drivers of the sector’s returns were the continued decline in interest rates, along with rising risk aversion and concern about global economic growth and the potential impact of Brexit.
The sectors that detracted most from our portion of the Fund’s performance during the period were industrials, consumer discretionary and health care, with stock selection a challenge in each. In industrials, stock selection within the transportation industry hurt most. In consumer discretionary, choices in the retail industry dampened results. In health care, being overweight the underperforming sector also detracted.
From an individual holdings perspective, the biggest positive contributors to our portion of the Fund’s results included Amkor Technology, a provider of semiconductor packaging and testing, which gained as business improvement led to strong financial results and an improved outlook. Shares of NeoPhotonics, a maker of electronic communication products, gained, as its strong position within its niche led to growth, particularly in China. We sold our portion of the Fund’s position in NeoPhotonics as shares became expensive. Quad/Graphics, a commercial printer, was another strong positive contributor, due primarily to a sharp rebound in its share price when investors recognized the company’s strong cash flows. Conversely, individual detractors included Hornbeck Offshore Services, a provider of offshore energy services, whose shares declined due to a combination of declining oil prices and relatively high debt levels. Shares of Express, an apparel retailer, declined, as a difficult retail environment led to a decline in
| | | | | | |
| | |
| | | | ACTIVE PORTFOLIOS® MULTI-MANAGER SMALL CAP EQUITY FUND | | |
MANAGER DISCUSSION OF FUND PERFORMANCE (continued)
same-store sales. Another detractor was Arc Best, a less-than-truckload transportation provider, whose shares declined due to a difficult trucking environment in which rates softened. We sold our shares in Arc Best before the close of the reporting period.
CMIA: During the period, our portion of the Fund underperformed the benchmark, against which our portion of the Fund is managed. Stock selection was the primary driver of underperformance relative to the benchmark in our portion of the Fund — particularly in the consumer discretionary, financials and health care sectors. Having overweighted allocations to consumer discretionary and health care, each of which lagged the benchmark during the period, hurt as well. In financials, our portion of the Fund’s bank holdings lagged during the period in 2016 when risk aversion was low, but, importantly, we did not see a deterioration in their fundamental earnings power. Only partially offsetting these detractors was effective stock selection in energy, industrials and information technology, which contributed positively. In energy, a focus on companies with strongly producing assets and healthy balance sheets was most beneficial. In industrials, positions in the construction and machinery industries performed particularly well.
The biggest individual detractors from our portion of the Fund’s results were Sequential Brands, which owns a portfolio of consumer and apparel brands; PharMerica, which provides institutional pharmacy services to health care operators; and Esterline Technologies, which operates in the defense and aerospace sector. While we believe the acquisition of Martha Stewart will benefit Sequential Brands over the long term, it created uncertainty in the short-term for Sequential Brands. We sold our portion of the Fund’s position in PharMerica after it announced significant restructuring of client service contracts that pushed earnings into later years. We also exited our portion of the Fund’s position in Esterline Technologies after it surprised with a sequence of poor profitability contracts.
From an individual holdings perspective, the top three positive contributors to our portion of the Fund’s results were Parsley Energy, an energy production company; MasTec, which operates in the infrastructure development mostly of pipelines and telecommunication lines; and Amerisafe, which provides workers’ compensation insurance mostly for small and midsized companies. Parsley Energy benefited from its strong production profile in the Permian Basin. MasTec grew revenues and cash flows above market expectations as it expanded its business. Shares of Amerisafe rose on improvement in the labor markets, which provided a demand increase for its products.
Sector Weighting Changes Driven By Bottom-Up Stock Selection
The Fund’s portfolio turnover rate for the 12-month period was 115%, inclusive of all portions of the Fund.
DGHM: We initiated a position in our portion of the Fund during the period in Continental Building Products, a leading producer of gypsum wallboard used in building and construction. The company should benefit, in our view, from its strong market positon and high barriers to entry; low cost position; solid leverage to the ongoing recovery in U.S. housing markets; healthy free cash
| | | | | | |
| | |
| | | | ACTIVE PORTFOLIOS® MULTI-MANAGER SMALL CAP EQUITY FUND | | |
MANAGER DISCUSSION OF FUND PERFORMANCE (continued)
flow; stock buybacks; and reasonable valuation. We established a position in our portion of the Fund in Dean Foods Company, the largest processor and distributor of milk and dairy products in the U.S. Its management is driving acceleration of a more diverse dairy portfolio with better margins. We believe ongoing consolidation and logistic opportunities provide further margin upside. In our view, global dairy fundamentals remain favorable, and the company has an improved balance sheet and a solid free cash flow supporting increased shareholder returns. Conversely, we sold our portion of the Fund’s position in home accessories retailer Kirkland’s due to weakening fundamentals. We also exited our portion of the Fund’s position in reinsurance company Maiden Holdings due to concerns about the company’s reserve development and investment profile.
We do not engage in significant sector timing activities. Based on individual stock selection, our portion of the Fund was overweight relative to the benchmark in financials, was underweight consumer cyclicals, non-cyclicals and information technology and was rather neutral to the benchmark in utilities and industrials at the end of the period.
EAM: We initiated a Fund position in Exelixis, a biopharmaceutical company developing small molecule therapies for the treatment of cancer, including the recently FDA-approved cabometyx, a therapy for the treatment of renal cell carcinoma. We established a position in Oclaro, a provider of optical components for the communications market. Oclaro reported strong revenues and guidance, as sales for its products were robust in China and the U.S. We purchased shares of Advanced Micro Devices, which designs computer-processor and graphic technologies that power intelligent devices, including personal computers, game consoles and servers. In our view, the company is effectively executing a turnaround by monetizing its intellectual property with a new Chinese partner and launching next generation chips in the computer graphics and virtual reality markets.
We sold our portion of the Fund’s position in Lipocine, a specialty pharmaceutical company developing innovative pharmaceutical products for use in men’s and women’s health using its proprietary drug delivery technologies. The market did not react to news of multiple upcoming catalysts for its several drug candidates, and so we sold the position in favor of higher conviction ideas. We exited our portion of the Fund’s position in consumer banking services provider BofI Holdings, as we believed an announcement concerning its lending practices may act as an overhang on the stock and/or adversely affect its fundamental business trends. We eliminated our portion of the Fund’s position in Collegium Pharmaceuticals, a pharmaceutical company focused on abuse-deterrent opioids, based on concerns raised around the launch trajectory of its FDA-approved tamper-deterrent, extended-release form of oxycodone.
Changes in sector allocation are a by-product of our purely bottom-up investment process. That said, overall, we increased our portion of the Fund’s exposure relative to the benchmark in energy, industrials and consumer discretionary during the period. We decreased relative allocations to health care and information technology. As of August 31, 2016, our portion of the Fund was overweight relative to the benchmark in health care, information technology, energy, industrials and consumer discretionary and underweight relative to the benchmark in financials and utilities.
| | | | | | |
| | |
| | | | ACTIVE PORTFOLIOS® MULTI-MANAGER SMALL CAP EQUITY FUND | | |
MANAGER DISCUSSION OF FUND PERFORMANCE (continued)
Our portion of the Fund was rather neutrally weighted to the benchmark in telecommunication services, materials and consumer staples.
Conestoga: During the period, we established a new position in our portion of the Fund in WageWorks, a leading provider of consumer-directed benefit accounts, based largely on its technology innovation, high-touch claims processing and customer service. We initiated a position in our portion of the Fund in Press Ganey Holdings, which is the market leader in measuring patient experience, primarily through patient surveys. Its mission is “to help healthcare organizations reduce suffering and improve clinical quality, safety and the overall patient experience.” In addition to the sale of Advisory Board Company, already mentioned, we sold our portion of the Fund’s positions in Hibbett Sports, which owns and operates sporting goods stores, primarily in smaller markets across the Southeast U.S. The company did not meet our earnings growth expectations, and we expect the company to have continued growth challenges over the next several years.
At Conestoga, sector allocations are driven more by our bottom-up stock selection process than by any top-down or sector level research. That said, we did not make any material changes in sector weightings relative to the benchmark during the period. At the end of August 2016, our portion of the Fund was overweight relative to the benchmark in health care, industrials and information technology; underweight consumer discretionary, consumer staples, financials, materials and utilities; and relatively neutral in energy and telecommunication services.
BMO: Since we assumed management of a portion of the Fund, we established a position in Minerals Technologies, a producer of specialty minerals. Its shares had declined as the company was perceived to have significant commodity exposure. The company, however, has been consistently profitable with strong cash flows for several years, and we felt the share decline early in 2016 offered an opportunity to own a high quality company at what we considered to be an attractive valuation. We also initiated a position in SYNNEX, a developer and distributor of technology products. Despite strong fundamental performance, its shares had declined, and, in our view, its valuation became attractive. The company has a history of consistent profitable growth. We purchased shares of Atwood Oceanics, an offshore drilling company. While its shares had sold off significantly as energy prices declined, Atwood Oceanics had longer term contracts in place that would provide, we believed, continued profitability into 2017. Conversely, we sold our portion of the Fund’s position in Life Storage, a self-storage real estate investment trust. In our view, while its fundamentals remained strong, its shares, had become expensive. We exited our portion of the Fund’s position in Hancock Holdings, a Southeast bank, as both its fundamentals and valuation had deteriorated, largely due to energy exposure. Several other holdings were sold due to announced acquisitions, including Polycom, FirstMerit, Empire District Electric and PrivateBancorp.
As a result of bottom-up stock attractiveness strategy, rather than top-down sector positioning, our portion of the Fund’s weight to materials, information technology and industrials increased and its weights to consumer discretionary, financial and utilities decreased. As of August 31, 2016, our portion of the Fund was overweight relative to the benchmark in information technology, industrials, health care and materials and was underweight
| | | | | | |
| | |
| | | | ACTIVE PORTFOLIOS® MULTI-MANAGER SMALL CAP EQUITY FUND | | |
MANAGER DISCUSSION OF FUND PERFORMANCE (continued)
relative to the benchmark in consumer discretionary, financials, utilities and energy. Our portion of the Fund was rather neutrally weighted compared to the benchmark in consumer staples and telecommunication services at the end of August 2016.
CMIA: During the period, we established a position in SkyWest, which operates as a feeder airline under the brands United Express and Delta Connection. The company has embarked on a fleet transition program replacing smaller 50-seat aircraft for larger aircraft viewed as more efficient in terms of fuel and crew costs. We exited our portion of the Fund’s position in Red Robin Gourmet Burgers. A general downturn in casual restaurant visits translated into disappointing same-store sales for the burger chain. The company has implemented improvements to its menu; however, the changes have not yet stemmed the weakening. We also sold our portion of the Fund’s position in Super Micro Computer, which manufactures highly optimized application server systems and subsystems. While it reported earnings in line with market expectations, the company guided to lower than expected earnings for the second quarter of 2016, as it saw headwinds in a weakening macro climate and pushouts of orders by some of its larger clients.
Based on our individual fundamental, bottom-up stock selection process, notable sector shifts in our portion of the Fund included increased allocations to industrials and information technology and decreased exposure to consumer discretionary. At the end of the period, our portion of the Fund was overweight relative to the benchmark in energy, industrials, materials, consumer staples, health care and consumer discretionary. Our portion of the Fund was underweight relative to the benchmark in information technology, telecommunication services, utilities and financials at the end of August 2016.
| | | | | | |
| | |
| | | | ACTIVE PORTFOLIOS® MULTI-MANAGER SMALL CAP EQUITY FUND | | |
UNDERSTANDING YOUR FUND’S EXPENSES
(Unaudited)
As an investor, you incur two types of costs. There are transaction costs, which generally include sales charges on purchases and may include redemption fees. There are also ongoing costs, which generally include management fees, distribution and/or service fees, and other fund expenses. The following information is intended to help you understand your ongoing costs (in dollars) of investing in the Fund and to help you compare these costs with the ongoing costs of investing in other mutual funds.
Analyzing Your Fund’s Expenses
To illustrate these ongoing costs, we have provided examples and calculated the expenses paid by investors in each share class of the Fund during the period. The actual and hypothetical information in the table is based on an initial investment of $1,000 at the beginning of the period indicated and held for the entire period. Expense information is calculated two ways and each method provides you with different information. The amount listed in the “Actual” column is calculated using the Fund’s actual operating expenses and total return for the period. You may use the Actual information, together with the amount invested, to estimate the expenses that you paid over the period. Simply divide your account value by $1,000 (for example, an $8,600 account value divided by $1,000 = 8.6), then multiply the results by the expenses paid during the period under the “Actual” column. The amount listed in the “Hypothetical” column assumes a 5% annual rate of return before expenses (which is not the Fund’s actual return) and then applies the Fund’s actual expense ratio for the period to the hypothetical return. You should not use the hypothetical account values and expenses to estimate either your actual account balance at the end of the period or the expenses you paid during the period. See “Compare With Other Funds” below for details on how to use the hypothetical data.
Compare With Other Funds
Since all mutual funds are required to include the same hypothetical calculations about expenses in shareholder reports, you can use this information to compare the ongoing cost of investing in the Fund with other funds. To do so, compare the hypothetical example with the 5% hypothetical examples that appear in the shareholder reports of other funds. As you compare hypothetical examples of other funds, it is important to note that hypothetical examples are meant to highlight the ongoing costs of investing in a fund only and do not reflect any transaction costs, such as sales charges, or redemption or exchange fees. Therefore, the hypothetical calculations are useful in comparing ongoing costs only, and will not help you determine the relative total costs of owning different funds. If transaction costs were included in these calculations, your costs would be higher.
March 1, 2016 – August 31, 2016
| | | | | | | | | | | | | | | | | | | | | | | | | | | | |
| | | Account Value at the
Beginning of the
Period ($) | | | Account Value at the
End of the
Period ($) | | | Expenses Paid During
the Period ($) | | | Fund’s Annualized
Expense Ratio (%) | |
| | | | Actual | | | | Hypothetical | | | | Actual | | | | Hypothetical | | | | Actual | | | | Hypothetical | | | | Actual | |
Class A | | | 1,000.00 | | | | 1,000.00 | | | | 1,178.70 | | | | 1,018.20 | | | | 7.56 | | | | 7.00 | | | | 1.38 | |
Expenses paid during the period are equal to the annualized expense ratio for each class as indicated above, multiplied by the average account value over the period and then multiplied by the number of days in the Fund’s most recent fiscal half year and divided by 366.
Expenses do not include fees and expenses incurred indirectly by the Fund from its investment in underlying funds, including affiliated and non-affiliated pooled investment vehicles, such as mutual funds and exchange-traded funds.
Had Columbia Management Investment Advisers, LLC and/or certain of its affiliates not waived/reimbursed certain fees and expenses, account value at the end of the period would have been reduced.
Class A shares of the Fund are available only to certain eligible investors through certain wrap fee programs sponsored and/or managed by Ameriprise Financial, Inc. or its affiliates. Participants in wrap fee programs pay other fees that are not included in the above table. Please refer to the wrap program documents for information about the fees charged.
| | | | | | |
| | |
| | | | ACTIVE PORTFOLIOS® MULTI-MANAGER SMALL CAP EQUITY FUND | | |
PORTFOLIO OF INVESTMENTS
August 31, 2016
(Percentages represent value of investments compared to net assets)
| | | | | | | | |
| Common Stocks 98.9% | |
| Issuer | | Shares | | | Value ($) | |
CONSUMER DISCRETIONARY 9.8% | |
Auto Components 2.3% | |
| | |
Cooper Tire & Rubber Co. | | | 18,830 | | | | 640,032 | |
| | |
Cooper-Standard Holding, Inc.(a) | | | 43,451 | | | | 4,303,821 | |
| | |
Dana, Inc. | | | 137,542 | | | | 1,983,356 | |
| | |
Dorman Products, Inc.(a) | | | 75,400 | | | | 4,755,478 | |
| | |
Drew Industries, Inc. | | | 13,093 | | | | 1,333,522 | |
| | |
Fox Factory Holding Corp.(a) | | | 120,100 | | | | 2,493,276 | |
| | |
Spartan Motors, Inc. | | | 156,266 | | | | 1,540,783 | |
| | |
Superior Industries International, Inc. | | | 48,428 | | | | 1,409,739 | |
| | |
Tenneco, Inc.(a) | | | 25,700 | | | | 1,434,831 | |
| | |
Tower International, Inc.(a) | | | 89,753 | | | | 2,180,998 | |
| | | | | | | | | |
Total | | | | | | | 22,075,836 | |
|
Automobiles 0.5% | |
| | |
Thor Industries, Inc. | | | 62,678 | | | | 5,086,320 | |
|
Diversified Consumer Services 1.3% | |
| | |
American Public Education, Inc.(a) | | | 31,351 | | | | 648,025 | |
| | |
Grand Canyon Education, Inc.(a) | | | 74,800 | | | | 3,106,444 | |
| | |
K12, Inc.(a) | | | 65,817 | | | | 786,513 | |
| | |
Nord Anglia Education, Inc.(a) | | | 61,000 | | | | 1,291,980 | |
| | |
ServiceMaster Global Holdings, Inc.(a) | | | 98,169 | | | | 3,662,686 | |
| | |
Sotheby’s | | | 57,500 | | | | 2,279,875 | |
| | | | | | | | | |
Total | | | | | | | 11,775,523 | |
|
Hotels, Restaurants & Leisure 1.0% | |
| | |
Dave & Buster’s Entertainment, Inc.(a) | | | 22,345 | | | | 1,037,925 | |
| | |
Isle of Capri Casinos, Inc.(a) | | | 84,835 | | | | 1,471,887 | |
| | |
Jack in the Box, Inc. | | | 13,325 | | | | 1,325,305 | |
| | |
Papa John’s International, Inc. | | | 16,039 | | | | 1,200,198 | |
| | |
Penn National Gaming, Inc.(a) | | | 109,200 | | | | 1,548,456 | |
| | |
Planet Fitness, Inc., Class A(a) | | | 64,967 | | | | 1,406,536 | |
| | |
Wingstop, Inc. | | | 44,770 | | | | 1,356,083 | |
| | | | | | | | | |
Total | | | | | | | 9,346,390 | |
|
Household Durables 0.7% | |
| | |
CalAtlantic Group, Inc. | | | 28,300 | | | | 1,032,667 | |
| | |
Cavco Industries, Inc.(a) | | | 12,798 | | | | 1,338,287 | |
| | |
Ethan Allen Interiors, Inc. | | | 37,624 | | | | 1,258,899 | |
| | |
Helen of Troy Ltd.(a) | | | 8,971 | | | | 810,440 | |
| | |
Tempur Sealy International, Inc.(a) | | | 15,961 | | | | 1,251,662 | |
| | |
Universal Electronics, Inc.(a) | | | 17,404 | | | | 1,288,418 | |
| | | | | | | | | |
Total | | | | | | | 6,980,373 | |
|
Internet & Catalog Retail 0.3% | |
| | |
Duluth Holdings, Inc., Class B(a) | | | 41,009 | | | | 1,242,983 | |
| | |
Nutrisystem, Inc. | | | 46,724 | | | | 1,346,586 | |
| | | | | | | | | |
Total | | | | | | | 2,589,569 | |
| | | | | | | | |
| Common Stocks (continued) | |
| Issuer | | Shares | | | Value ($) | |
Leisure Products 0.2% | |
| | |
Callaway Golf Co. | | | 122,069 | | | | 1,394,028 | |
| | |
JAKKS Pacific, Inc.(a) | | | 51,235 | | | | 471,874 | |
| | | | | | | | | |
Total | | | | | | | 1,865,902 | |
|
Media 0.5% | |
| | |
AMC Entertainment Holdings, Inc., Class A | | | 45,500 | | | | 1,383,655 | |
| | |
Entravision Communications Corp., Class A | | | 269,320 | | | | 2,025,286 | |
| | |
Meredith Corp. | | | 13,068 | | | | 693,127 | |
| | |
Sinclair Broadcast Group, Inc., Class A | | | 34,000 | | | | 968,320 | |
| | | | | | | | | |
Total | | | | | | | 5,070,388 | |
|
Multiline Retail 0.2% | |
| | |
Big Lots, Inc. | | | 26,848 | | | | 1,324,143 | |
|
Specialty Retail 2.4% | |
| | |
Abercrombie & Fitch Co., Class A | | | 73,115 | | | | 1,297,060 | |
| | |
American Eagle Outfitters, Inc. | | | 138,064 | | | | 2,559,707 | |
| | |
Burlington Stores, Inc.(a) | | | 16,420 | | | | 1,333,632 | |
| | |
Cato Corp. (The), Class A | | | 27,321 | | | | 936,564 | |
| | |
Children’s Place, Inc. (The) | | | 37,158 | | | | 3,024,661 | |
| | |
Dick’s Sporting Goods, Inc. | | | 57,329 | | | | 3,359,479 | |
| | |
Express, Inc.(a) | | | 163,518 | | | | 1,934,418 | |
| | |
Finish Line, Inc., Class A (The) | | | 56,100 | | | | 1,350,327 | |
| | |
Five Below, Inc.(a) | | | 26,686 | | | | 1,189,128 | |
| | |
GameStop Corp., Class A | | | 100,456 | | | | 2,851,946 | |
| | |
Genesco, Inc.(a) | | | 21,574 | | | | 1,567,135 | |
| | |
Rent-A-Center, Inc. | | | 73,935 | | | | 903,486 | |
| | |
TravelCenters of America LLC(a) | | | 34,357 | | | | 233,628 | |
| | | | | | | | | |
Total | | | | | | | 22,541,171 | |
|
Textiles, Apparel & Luxury Goods 0.4% | |
| | |
Culp, Inc. | | | 15,444 | | | | 489,729 | |
| | |
Deckers Outdoor Corp.(a) | | | 42,680 | | | | 2,789,138 | |
| | |
Sequential Brands Group, Inc.(a) | | | 99,300 | | | | 723,897 | |
| | | | | | | | | |
Total | | | | | | | 4,002,764 | |
| | | | | | | | | |
Total Consumer Discretionary | | | | | | | 92,658,379 | |
| | |
| | | | | | | | |
CONSUMER STAPLES 2.6% | |
Beverages 0.4% | |
| | |
MGP Ingredients, Inc. | | | 88,232 | | | | 3,523,986 | |
|
Food & Staples Retailing 0.6% | |
| | |
Casey’s General Stores, Inc. | | | 8,968 | | | | 1,177,588 | |
| | |
Performance Food Group Co.(a) | | | 38,000 | | | | 976,600 | |
| | |
SpartanNash Co. | | | 42,463 | | | | 1,359,665 | |
| | |
Weis Markets, Inc. | | | 49,462 | | | | 2,519,595 | |
| | | | | | | | | |
Total | | | | | | | 6,033,448 | |
The accompanying Notes to Financial Statements are an integral part of this statement.
| | | | | | |
| | |
| | | | ACTIVE PORTFOLIOS® MULTI-MANAGER SMALL CAP EQUITY FUND | | |
PORTFOLIO OF INVESTMENTS (continued)
August 31, 2016
| | | | | | | | |
| Common Stocks (continued) | |
| Issuer | | Shares | | | Value ($) | |
Food Products 1.4% | |
| | |
AdvancePierre Foods Holdings, Inc. | | | 68,000 | | | | 1,721,080 | |
| | |
B&G Foods, Inc. | | | 27,133 | | | | 1,288,275 | |
| | |
Darling Ingredients, Inc.(a) | | | 199,113 | | | | 2,803,511 | |
| | |
Dean Foods Co. | | | 130,194 | | | | 2,240,639 | |
| | |
Fresh Del Monte Produce, Inc. | | | 21,209 | | | | 1,233,727 | |
| | |
Post Holdings, Inc.(a) | | | 21,900 | | | | 1,856,682 | |
| | |
Sanderson Farms, Inc. | | | 20,194 | | | | 1,943,269 | |
| | | | | | | | | |
Total | | | | | | | 13,087,183 | |
|
Household Products 0.1% | |
| | |
Central Garden & Pet Co.(a) | | | 53,434 | | | | 1,372,185 | |
|
Personal Products 0.1% | |
| | |
Nutraceutical International Corp.(a) | | | 40,118 | | | | 1,016,189 | |
| | | | | | | | | |
Total Consumer Staples | | | | | | | 25,032,991 | |
| | |
| | | | | | | | |
ENERGY 4.1% | |
Energy Equipment & Services 0.9% | |
| | |
Atwood Oceanics, Inc. | | | 80,672 | | | | 637,309 | |
| | |
Hornbeck Offshore Services, Inc.(a) | | | 87,529 | | | | 478,784 | |
| | |
Newpark Resources, Inc.(a) | | | 111,234 | | | | 785,312 | |
| | |
Patterson-UTI Energy, Inc. | | | 194,010 | | | | 3,781,255 | |
| | |
Precision Drilling Corp. | | | 443,161 | | | | 1,825,823 | |
| | |
US Silica Holdings, Inc. | | | 25,730 | | | | 1,009,902 | |
| | | | | | | | | |
Total | | | | | | | 8,518,385 | |
|
Oil, Gas & Consumable Fuels 3.2% | |
| | |
Aegean Marine Petroleum Network, Inc. | | | 77,400 | | | | 773,226 | |
| | |
Bill Barrett Corp.(a) | | | 173,904 | | | | 1,154,723 | |
| | |
Carrizo Oil & Gas, Inc.(a) | | | 58,874 | | | | 2,254,285 | |
| | |
Clayton Williams Energy, Inc.(a) | | | 26,906 | | | | 1,698,038 | |
| | |
Matador Resources Co.(a) | | | 176,826 | | | | 4,058,157 | |
| | |
Pacific Ethanol, Inc.(a) | | | 208,756 | | | | 1,348,564 | |
| | |
Parsley Energy, Inc., Class A(a) | | | 92,023 | | | | 3,114,979 | |
| | |
PDC Energy, Inc.(a) | | | 78,753 | | | | 5,229,199 | |
| | |
QEP Resources, Inc. | | | 39,083 | | | | 746,485 | |
| | |
Resolute Energy Corp.(a) | | | 73,777 | | | | 1,247,569 | |
| | |
RSP Permian, Inc.(a) | | | 71,530 | | | | 2,793,246 | |
| | |
Sanchez Energy Corp.(a) | | | 81,873 | | | | 703,289 | |
| | |
SM Energy Co. | | | 43,000 | | | | 1,628,840 | |
| | |
Teekay Tankers Ltd., Class A | | | 164,500 | | | | 429,345 | |
| | |
Whiting Petroleum Corp.(a) | | | 60,000 | | | | 437,400 | |
| | |
WPX Energy, Inc.(a) | | | 267,079 | | | | 3,204,948 | |
| | | | | | | | | |
Total | | | | | | | 30,822,293 | |
| | | | | | | | | |
Total Energy | | | | | | | 39,340,678 | |
| | | | | | | | |
| Common Stocks (continued) | |
| Issuer | | Shares | | | Value ($) | |
FINANCIALS 24.5% | |
Banks 10.1% | |
| | |
1st Source Corp. | | | 12,641 | | | | 447,365 | |
| | |
Ameris Bancorp | | | 54,500 | | | | 1,897,690 | |
| | |
Associated Banc-Corp. | | | 163,733 | | | | 3,248,463 | |
| | |
Banc of California, Inc. | | | 36,343 | | | | 811,176 | |
| | |
BancFirst Corp. | | | 7,301 | | | | 500,848 | |
| | |
BancorpSouth, Inc. | | | 85,279 | | | | 2,123,447 | |
| | |
Bank of the Ozarks, Inc. | | | 48,500 | | | | 1,900,230 | |
| | |
Boston Private Financial Holdings, Inc. | | | 146,658 | | | | 1,888,955 | |
| | |
Brookline Bancorp, Inc. | | | 95,267 | | | | 1,137,488 | |
| | |
Capital Bank Financial Corp. Class A(a) | | | 70,205 | | | | 2,198,118 | |
| | |
Cathay General Bancorp | | | 40,000 | | | | 1,256,800 | |
| | |
Central Pacific Financial Corp. | | | 62,286 | | | | 1,593,899 | |
| | |
City Holding Co. | | | 17,583 | | | | 889,524 | |
| | |
Community Bank System, Inc. | | | 60,600 | | | | 2,875,470 | |
| | |
Community Trust Bancorp, Inc. | | | 85,979 | | | | 3,169,186 | |
| | |
Customers Bancorp, Inc.(a) | | | 117,971 | | | | 3,154,544 | |
| | |
Fidelity Southern Corp. | | | 41,485 | | | | 744,656 | |
| | |
First Interstate Bancsystem, Inc. | | | 42,163 | | | | 1,296,091 | |
| | |
First Midwest Bancorp, Inc. | | | 183,789 | | | | 3,596,751 | |
| | |
Fulton Financial Corp. | | | 235,756 | | | | 3,409,032 | |
| | |
Great Southern Bancorp, Inc. | | | 9,146 | | | | 384,955 | |
| | |
Great Western Bancorp, Inc. | | | 60,993 | | | | 2,088,400 | |
| | |
Hancock Holding Co. | | | 147,742 | | | | 4,820,821 | |
| | |
Hanmi Financial Corp. | | | 58,969 | | | | 1,546,757 | |
| | |
Heartland Financial USA, Inc. | | | 20,821 | | | | 756,219 | |
| | |
Hilltop Holdings, Inc.(a) | | | 73,859 | | | | 1,672,168 | |
| | |
Hope Bancorp, Inc. | | | 220,416 | | | | 3,791,155 | |
| | |
Huntington Bancshares, Inc. | | | 1 | | | | 10 | |
| | |
Independent Bank Corp. | | | 50,300 | | | | 2,664,894 | |
| | |
Investors Bancorp, Inc. | | | 196,307 | | | | 2,404,761 | |
| | |
MB Financial, Inc. | | | 37,000 | | | | 1,449,660 | |
| | |
Old National Bancorp | | | 350,049 | | | | 4,956,694 | |
| | |
Preferred Bank/Los Angeles | | | 10,381 | | | | 363,854 | |
| | |
Prosperity Bancshares, Inc. | | | 36,889 | | | | 2,046,233 | |
| | |
Renasant Corp. | | | 71,600 | | | | 2,538,220 | |
| | |
Sandy Spring Bancorp, Inc. | | | 173,163 | | | | 5,459,829 | |
| | |
South State Corp. | | | 19,146 | | | | 1,454,904 | |
| | |
Sterling Bancorp | | | 143,200 | | | | 2,556,120 | |
| | |
Trico Bancshares | | | 23,044 | | | | 623,110 | |
| | |
Trustmark Corp. | | | 76,688 | | | | 2,174,872 | |
| | |
UMB Financial Corp. | | | 20,200 | | | | 1,228,160 | |
| | |
Umpqua Holdings Corp. | | | 56,100 | | | | 921,162 | |
The accompanying Notes to Financial Statements are an integral part of this statement.
| | | | | | |
| | |
| | | | ACTIVE PORTFOLIOS® MULTI-MANAGER SMALL CAP EQUITY FUND | | |
PORTFOLIO OF INVESTMENTS (continued)
August 31, 2016
| | | | | | | | |
| Common Stocks (continued) | |
| Issuer | | Shares | | | Value ($) | |
Union Bankshares Corp. | | | 75,100 | | | | 2,090,033 | |
| | |
Univest Corporation of Pennsylvania | | | 56,917 | | | | 1,328,443 | |
| | |
WesBanco, Inc. | | | 69,902 | | | | 2,287,892 | |
| | |
Western Alliance Bancorp(a) | | | 64,000 | | | | 2,446,080 | |
| | |
Wintrust Financial Corp. | | | 64,491 | | | | 3,584,410 | |
| | | | | | | | | |
Total | | | | | | | 95,779,549 | |
|
Capital Markets 0.8% | |
| | |
Janus Capital Group, Inc. | | | 106,182 | | | | 1,578,926 | |
| | |
KCG Holdings, Inc., Class A(a) | | | 81,799 | | | | 1,181,996 | |
| | |
Triplepoint Venture Growth BDC Corp. | | | 34,735 | | | | 393,200 | |
| | |
Virtu Financial, Inc. Class A | | | 72,800 | | | | 1,187,368 | |
| | |
Westwood Holdings Group, Inc. | | | 64,500 | | | | 3,228,225 | |
| | | | | | | | | |
Total | | | | | | | 7,569,715 | |
|
Consumer Finance 0.1% | |
| | |
Nelnet, Inc., Class A | | | 17,110 | | | | 605,694 | |
| | |
Regional Management Corp.(a) | | | 25,656 | | | | 554,683 | |
| | | | | | | | | |
Total | | | | | | | 1,160,377 | |
|
Diversified Financial Services 0.1% | |
| | |
Cardtronics PLC, Class A(a) | | | 27,393 | | | | 1,230,220 | |
|
Insurance 3.5% | |
| | |
American Equity Investment Life Holding Co. | | | 89,518 | | | | 1,577,307 | |
| | |
AMERISAFE, Inc. | | | 64,470 | | | | 3,868,845 | |
| | |
Amtrust Financial Services, Inc. | | | 55,500 | | | | 1,470,195 | |
| | |
Argo Group International Holdings Ltd. | | | 79,501 | | | | 4,510,887 | |
| | |
CNO Financial Group, Inc. | | | 59,500 | | | | 966,875 | |
| | |
Employers Holdings, Inc. | | | 120,899 | | | | 3,683,792 | |
| | |
First American Financial Corp. | | | 87,918 | | | | 3,788,387 | |
| | |
HCI Group, Inc. | | | 42,329 | | | | 1,345,639 | |
| | |
Horace Mann Educators Corp. | | | 107,648 | | | | 3,934,534 | |
| | |
Maiden Holdings Ltd. | | | 84,597 | | | | 1,168,285 | |
| | |
MBIA, Inc.(a) | | | 97,500 | | | | 785,850 | |
| | |
Navigators Group, Inc. (The) | | | 5,485 | | | | 515,371 | |
| | |
Selective Insurance Group, Inc. | | | 51,748 | | | | 2,064,745 | |
| | |
United Fire Group, Inc. | | | 68,453 | | | | 2,957,854 | |
| | |
United Insurance Holdings Corp. | | | 20,343 | | | | 320,402 | |
| | | | | | | | | |
Total | | | | | | | 32,958,968 | |
|
Real Estate Investment Trusts (REITs) 7.6% | |
| | |
Agree Realty Corp. | | | 26,045 | | | | 1,249,900 | |
| | |
American Assets Trust, Inc. | | | 85,628 | | | | 3,793,320 | |
| | |
Brandywine Realty Trust | | | 428,354 | | | | 6,909,350 | |
| | |
Chesapeake Lodging Trust | | | 123,238 | | | | 3,140,104 | |
| | |
Colony Capital, Inc. | | | 272,399 | | | | 5,031,210 | |
| | |
Colony Starwood Homes | | | 39,967 | | | | 1,238,977 | |
| | | | | | | | |
| Common Stocks (continued) | |
| Issuer | | Shares | | | Value ($) | |
Cousins Properties, Inc. | | | 464,954 | | | | 5,123,793 | |
| | |
CyrusOne, Inc. | | | 25,836 | | | | 1,313,502 | |
| | |
DCT Industrial Trust, Inc. | | | 31,469 | | | | 1,532,855 | |
| | |
DuPont Fabros Technology, Inc. | | | 30,923 | | | | 1,311,135 | |
| | |
EPR Properties | | | 16,523 | | | | 1,294,081 | |
| | |
First Industrial Realty Trust, Inc. | | | 161,180 | | | | 4,637,149 | |
| | |
First Potomac Realty Trust | | | 95,363 | | | | 960,305 | |
| | |
Four Corners Property Trust, Inc. | | | 60,050 | | | | 1,243,635 | |
| | |
Getty Realty Corp. | | | 20,671 | | | | 486,389 | |
| | |
Hersha Hospitality Trust | | | 273,401 | | | | 5,342,256 | |
| | |
Highwoods Properties, Inc. | | | 39,200 | | | | 2,079,168 | |
| | |
Hudson Pacific Properties, Inc. | | | 46,000 | | | | 1,539,620 | |
| | |
Kite Realty Group Trust | | | 160,031 | | | | 4,621,695 | |
| | |
LaSalle Hotel Properties | | | 53,200 | | | | 1,492,792 | |
| | |
Mack-Cali Realty Corp. | | | 143,633 | | | | 3,987,252 | |
| | |
Physicians Realty Trust | | | 63,172 | | | | 1,352,513 | |
| | |
PS Business Parks, Inc. | | | 19,149 | | | | 2,121,326 | |
| | |
QTS Realty Trust Inc., Class A | | | 23,412 | | | | 1,268,696 | |
| | |
RLJ Lodging Trust | | | 72,137 | | | | 1,683,678 | |
| | |
Ryman Hospitality Properties, Inc. | | | 14,080 | | | | 759,757 | |
| | |
Saul Centers, Inc. | | | 11,574 | | | | 767,125 | |
| | |
Select Income REIT | | | 67,549 | | | | 1,843,412 | |
| | |
STORE Capital Corp. | | | 40,850 | | | | 1,210,385 | |
| | |
Sun Communities, Inc. | | | 23,100 | | | | 1,767,612 | |
| | |
Washington Real Estate Investment Trust | | | 27,357 | | | | 889,103 | |
| | | | | | | | | |
Total | | | | | | | 71,992,095 | |
|
Real Estate Management & Development 0.5% | |
| | |
Kennedy-Wilson Holdings, Inc. | | | 242,637 | | | | 5,352,572 | |
|
Thrifts & Mortgage Finance 1.8% | |
| | |
BofI Holding, Inc.(a) | | | 44,000 | | | | 946,000 | |
| | |
First Defiance Financial Corp. | | | 11,531 | | | | 524,545 | |
| | |
Meta Financial Group, Inc. | | | 22,034 | | | | 1,356,193 | |
| | |
MGIC Investment Corp.(a) | | | 305,000 | | | | 2,467,450 | |
| | |
Provident Financial Services, Inc. | | | 177,964 | | | | 3,838,683 | |
| | |
Radian Group, Inc. | | | 217,622 | | | | 2,983,598 | |
| | |
TrustCo Bank Corp. | | | 70,365 | | | | 502,406 | |
| | |
Walker & Dunlop, Inc.(a) | | | 51,726 | | | | 1,370,739 | |
| | |
Washington Federal, Inc. | | | 85,892 | | | | 2,276,138 | |
| | |
WSFS Financial Corp. | | | 26,200 | | | | 1,019,180 | |
| | | | | | | | | |
Total | | | | | | | 17,284,932 | |
| | | | | | | | | |
Total Financials | | | | | | | 233,328,428 | |
| | |
| | | | | | | | |
The accompanying Notes to Financial Statements are an integral part of this statement.
| | | | | | |
| | |
| | | | ACTIVE PORTFOLIOS® MULTI-MANAGER SMALL CAP EQUITY FUND | | |
PORTFOLIO OF INVESTMENTS (continued)
August 31, 2016
| | | | | | | | |
| Common Stocks (continued) | |
| Issuer | | Shares | | | Value ($) | |
HEALTH CARE 14.9% | |
Biotechnology 2.0% | |
| | |
Acorda Therapeutics, Inc.(a) | | | 44,372 | | | | 1,068,478 | |
| | |
Advaxis, Inc.(a) | | | 94,953 | | | | 1,094,808 | |
| | |
Aptevo Therapeutics, Inc.(a) | | | 14,923 | | | | 40,591 | |
| | |
Bluebird Bio, Inc.(a) | | | 10,000 | | | | 493,400 | |
| | |
Cytokinetics, Inc.(a) | | | 115,140 | | | | 1,389,740 | |
| | |
Emergent Biosolutions, Inc.(a) | | | 29,847 | | | | 795,422 | |
| | |
Exelixis, Inc.(a) | | | 120,183 | | | | 1,340,040 | |
| | |
Ligand Pharmaceuticals, Inc.(a) | | | 42,300 | | | | 4,370,013 | |
| | |
Puma Biotechnology, Inc.(a) | | | 21,536 | | | | 1,273,854 | |
| | |
Radius Health, Inc.(a) | | | 22,620 | | | | 1,240,481 | |
| | |
Repligen Corp.(a) | | | 139,000 | | | | 4,307,610 | |
| | |
TESARO, Inc.(a) | | | 15,014 | | | | 1,271,536 | |
| | | | | | | | | |
Total | | | | | | | 18,685,973 | |
|
Health Care Equipment & Supplies 6.9% | |
| | |
Abaxis, Inc. | | | 59,125 | | | | 2,964,527 | |
| | |
ABIOMED, Inc.(a) | | | 11,235 | | | | 1,325,056 | |
| | |
Align Technology, Inc.(a) | | | 50,600 | | | | 4,700,740 | |
| | |
Analogic Corp. | | | 35,325 | | | | 3,143,925 | |
| | |
Cantel Medical Corp. | | | 99,318 | | | | 7,509,434 | |
| | |
Cardiovascular Systems, Inc.(a) | | | 69,710 | | | | 1,705,804 | |
| | |
Cynosure Inc., Class A(a) | | | 27,345 | | | | 1,424,401 | |
| | |
Glaukos Corp.(a) | | | 37,571 | | | | 1,121,119 | |
| | |
Globus Medical, Inc., Class A(a) | | | 49,700 | | | | 1,154,531 | |
| | |
Hill-Rom Holdings, Inc. | | | 22,009 | | | | 1,305,354 | |
| | |
Insulet Corp.(a) | | | 29,811 | | | | 1,261,900 | |
| | |
Integra LifeSciences Holdings Corp.(a) | | | 16,415 | | | | 1,418,584 | |
| | |
iRadimed Corp.(a) | | | 63,500 | | | | 1,185,545 | |
| | |
Masimo Corp.(a) | | | 23,339 | | | | 1,380,268 | |
| | |
Merit Medical Systems, Inc.(a) | | | 246,726 | | | | 5,980,638 | |
| | |
Natus Medical, Inc.(a) | | | 31,730 | | | | 1,234,614 | |
| | |
Neogen Corp.(a) | | | 104,162 | | | | 6,151,808 | |
| | |
Nevro Corp.(a) | | | 15,282 | | | | 1,443,079 | |
| | |
NuVasive, Inc.(a) | | | 21,022 | | | | 1,376,310 | |
| | |
OraSure Technologies, Inc.(a) | | | 154,671 | | | | 1,325,530 | |
| | |
Penumbra, Inc.(a) | | | 19,830 | | | | 1,399,205 | |
| | |
Spectranetics Corp. (The)(a) | | | 51,020 | | | | 1,255,602 | |
| | |
Syneron Medical Ltd.(a) | | | 325,596 | | | | 2,135,910 | |
| | |
Vascular Solutions, Inc.(a) | | | 149,064 | | | | 7,180,413 | |
| | |
West Pharmaceutical Services, Inc. | | | 15,213 | | | | 1,244,880 | |
| | |
Wright Medical Group NV(a) | | | 66,000 | | | | 1,634,160 | |
| | |
Zeltiq Aesthetics, Inc.(a) | | | 32,906 | | | | 1,254,377 | |
| | | | | | | | | |
Total | | | | | | | 65,217,714 | |
| | | | | | | | |
| Common Stocks (continued) | |
| Issuer | | Shares | | | Value ($) | |
Health Care Providers & Services 1.6% | |
| | |
Aceto Corp. | | | 37,010 | | | | 747,232 | |
| | |
Amsurg Corp.(a) | | | 17,500 | | | | 1,136,100 | |
| | |
BioTelemetry, Inc.(a) | | | 66,724 | | | | 1,232,392 | |
| | |
Kindred Healthcare, Inc. | | | 39,669 | | | | 437,946 | |
| | |
LHC Group, Inc.(a) | | | 30,000 | | | | 1,066,800 | |
| | |
Magellan Health, Inc.(a) | | | 23,774 | | | | 1,357,971 | |
| | |
Molina Healthcare, Inc.(a) | | | 15,368 | | | | 826,952 | |
| | |
National Research Corp., Class A | | | 58,375 | | | | 924,076 | |
| | |
National Research Corp., Class B | | | 27,180 | | | | 932,002 | |
| | |
PharMerica Corp.(a) | | | 50,173 | | | | 1,267,370 | |
| | |
Surgical Care Affiliates, Inc.(a) | | | 19,711 | | | | 813,079 | |
| | |
Triple-S Management Corp., Class B(a) | | | 35,400 | | | | 774,906 | |
| | |
U.S. Physical Therapy, Inc. | | | 13,292 | | | | 838,061 | |
| | |
VCA, Inc.(a) | | | 28,300 | | | | 2,003,923 | |
| | |
WellCare Health Plans, Inc.(a) | | | 11,823 | | | | 1,332,452 | |
| | | | | | | | | |
Total | | | | | | | 15,691,262 | |
|
Health Care Technology 2.4% | |
| | |
Cotiviti Holdings, Inc.(a) | | | 44,142 | | | | 1,467,280 | |
| | |
Evolent Health, Inc., Class A(a) | | | 38,866 | | | | 966,598 | |
| | |
HealthStream, Inc.(a) | | | 170,900 | | | | 4,544,231 | |
| | |
Medidata Solutions, Inc.(a) | | | 81,823 | | | | 4,426,624 | |
| | |
Omnicell, Inc.(a) | | | 197,500 | | | | 7,422,050 | |
| | |
Press Ganey Holdings, Inc.(a) | | | 70,385 | | | | 2,835,812 | |
| | |
Veeva Systems Inc., Class A(a) | | | 34,686 | | | | 1,419,351 | |
| | | | | | | | | |
Total | | | | | | | 23,081,946 | |
|
Life Sciences Tools & Services 1.2% | |
| | |
Bio-Techne Corp. | | | 19,400 | | | | 2,043,790 | |
| | |
Luminex Corp.(a) | | | 54,383 | | | | 1,145,850 | |
| | |
NeoGenomics, Inc.(a) | | | 162,609 | | | | 1,307,376 | |
| | |
PAREXEL International Corp.(a) | | | 63,976 | | | | 4,352,287 | |
| | |
Patheon NV(a) | | | 43,000 | | | | 1,203,570 | |
| | |
Pra Health Sciences, Inc.(a) | | | 26,659 | | | | 1,347,613 | |
| | | | | | | | | |
Total | | | | | | | 11,400,486 | |
|
Pharmaceuticals 0.8% | |
| | |
Amphastar Pharmaceuticals, Inc.(a) | | | 59,810 | | | | 1,136,390 | |
| | |
Catalent, Inc.(a) | | | 46,200 | | | | 1,165,626 | |
| | |
Dermira, Inc.(a) | | | 50,091 | | | | 1,554,824 | |
| | |
Heska Corp.(a) | | | 24,833 | | | | 1,355,137 | |
| | |
Intra-Cellular Therapies, Inc.(a) | | | 28,855 | | | | 1,164,011 | |
| | |
Lannett Co., Inc.(a) | | | 15,269 | | | | 517,008 | |
| | |
Supernus Pharmaceuticals, Inc.(a) | | | 50,415 | | | | 1,077,873 | |
| | | | | | | | | |
Total | | | | | | | 7,970,869 | |
| | | | | | | | | |
Total Health Care | | | | | | | 142,048,250 | |
The accompanying Notes to Financial Statements are an integral part of this statement.
| | | | | | |
| | |
| | | | ACTIVE PORTFOLIOS® MULTI-MANAGER SMALL CAP EQUITY FUND | | |
PORTFOLIO OF INVESTMENTS (continued)
August 31, 2016
| | | | | | | | |
| Common Stocks (continued) | |
| Issuer | | Shares | | | Value ($) | |
INDUSTRIALS 16.6% | |
Aerospace & Defense 0.8% | |
| | |
Curtiss-Wright Corp. | | | 31,933 | | | | 2,870,777 | |
| | |
DigitalGlobe, Inc.(a) | | | 24,221 | | | | 656,147 | |
| | |
HEICO Corp. | | | 16,930 | | | | 1,150,563 | |
| | |
KEYW Holding Corp. (The)(a) | | | 112,192 | | | | 1,118,554 | |
| | |
Moog, Inc., Class A(a) | | | 30,779 | | | | 1,815,653 | |
| | | | | | | | | |
Total | | | | | | | 7,611,694 | |
|
Air Freight & Logistics 0.7% | |
| | |
Air Transport Services Group, Inc.(a) | | | 88,716 | | | | 1,284,608 | |
| | |
Atlas Air Worldwide Holdings, Inc.(a) | | | 40,769 | | | | 1,514,161 | |
| | |
HUB Group, Inc., Class A(a) | | | 35,333 | | | | 1,439,820 | |
| | |
XPO Logistics, Inc.(a) | | | 64,408 | | | | 2,305,806 | |
| | | | | | | | | |
Total | | | | | | | 6,544,395 | |
|
Airlines 0.3% | |
| | |
Skywest, Inc. | | | 94,605 | | | | 2,670,699 | |
|
Building Products 2.1% | |
| | |
AAON, Inc. | | | 188,150 | | | | 5,324,645 | |
| | |
Continental Building Product(a) | | | 82,892 | | | | 1,841,031 | |
| | |
Gibraltar Industries, Inc.(a) | | | 33,204 | | | | 1,267,065 | |
| | |
Patrick Industries, Inc.(a) | | | 21,766 | | | | 1,393,677 | |
| | |
Simpson Manufacturing Co., Inc. | | | 121,925 | | | | 5,350,069 | |
| | |
Trex Co., Inc.(a) | | | 77,500 | | | | 4,800,350 | |
| | | | | | | | | |
Total | | | | | | | 19,976,837 | |
|
Commercial Services & Supplies 2.9% | |
| | |
ABM Industries, Inc. | | | 52,600 | | | | 2,021,418 | |
| | |
ACCO Brands Corp.(a) | | | 179,622 | | | | 1,796,220 | |
| | |
Brink’s Co. (The) | | | 40,315 | | | | 1,471,497 | |
| | |
Deluxe Corp. | | | 32,300 | | | | 2,201,891 | |
| | |
Healthcare Services Group, Inc. | | | 107,750 | | | | 4,349,867 | |
| | |
Hudson Technologies, Inc.(a) | | | 205,463 | | | | 1,329,346 | |
| | |
Mobile Mini, Inc. | | | 82,900 | | | | 2,478,710 | |
| | |
Quad/Graphics, Inc. | | | 51,459 | | | | 1,394,024 | |
| | |
Rollins, Inc. | | | 118,425 | | | | 3,375,112 | |
| | |
Steelcase, Inc., Class A | | | 250,640 | | | | 3,744,562 | |
| | |
Tetra Tech, Inc. | | | 37,919 | | | | 1,338,541 | |
| | |
Unifirst Corp. | | | 12,158 | | | | 1,560,966 | |
| | | | | | | | | |
Total | | | | | | | 27,062,154 | |
|
Construction & Engineering 2.3% | |
| | |
Aegion Corp.(a) | | | 59,635 | | | | 1,104,440 | |
| | |
Argan, Inc. | | | 28,933 | | | | 1,383,287 | |
| | |
EMCOR Group, Inc. | | | 147,598 | | | | 8,451,462 | |
| | |
Granite Construction, Inc. | | | 55,878 | | | | 2,682,144 | |
| | |
MasTec, Inc.(a) | | | 129,645 | | | | 3,818,045 | |
| | | | | | | | |
| Common Stocks (continued) | |
| Issuer | | Shares | | | Value ($) | |
Quanta Services, Inc.(a) | | | 118,340 | | | | 3,044,888 | |
| | |
Tutor Perini Corp.(a) | | | 51,755 | | | | 1,200,198 | |
| | | | | | | | | |
Total | | | | | | | 21,684,464 | |
|
Electrical Equipment 0.3% | |
| | |
EnerSys | | | 19,997 | | | | 1,407,389 | |
| | |
TPI Composites, Inc.(a) | | | 69,024 | | | | 1,372,887 | |
| | | | | | | | | |
Total | | | | | | | 2,780,276 | |
|
Machinery 3.1% | |
| | |
Barnes Group, Inc. | | | 43,300 | | | | 1,790,022 | |
| | |
Chart Industries, Inc.(a) | | | 69,710 | | | | 2,099,665 | |
| | |
Columbus McKinnon Corp. | | | 25,758 | | | | 452,310 | |
| | |
EnPro Industries, Inc. | | | 17,343 | | | | 934,788 | |
| | |
Franklin Electric Co., Inc. | | | 42,200 | | | | 1,614,150 | |
| | |
Global Brass & Copper Holdings, Inc. | | | 177,463 | | | | 4,981,386 | |
| | |
John Bean Technologies Corp. | | | 18,485 | | | | 1,269,550 | |
| | |
Kadant, Inc. | | | 11,551 | | | | 619,596 | |
| | |
Lydall, Inc.(a) | | | 28,102 | | | | 1,350,020 | |
| | |
Mueller Industries, Inc. | | | 91,622 | | | | 3,166,456 | |
| | |
Mueller Water Products, Inc., Class A | | | 104,137 | | | | 1,259,016 | |
| | |
Nordson Corp. | | | 12,924 | | | | 1,275,987 | |
| | |
Oshkosh Corp. | | | 37,600 | | | | 2,027,768 | |
| | |
Proto Labs, Inc.(a) | | | 70,300 | | | | 3,846,816 | |
| | |
Sun Hydraulics Corp. | | | 100,700 | | | | 3,103,574 | |
| | | | | | | | | |
Total | | | | | | | 29,791,104 | |
|
Professional Services 2.0% | |
| | |
Exponent, Inc. | | | 71,600 | | | | 3,610,788 | |
| | |
FTI Consulting, Inc.(a) | | | 12,971 | | | | 574,486 | |
| | |
Korn/Ferry International | | | 149,903 | | | | 3,573,687 | |
| | |
RPX Corp.(a) | | | 124,598 | | | | 1,304,541 | |
| | |
TransUnion(a) | | | 40,729 | | | | 1,343,650 | |
| | |
TrueBlue, Inc.(a) | | | 145,726 | | | | 3,184,113 | |
| | |
Wageworks, Inc.(a) | | | 80,532 | | | | 4,976,072 | |
| | | | | | | | | |
Total | | | | | | | 18,567,337 | |
|
Road & Rail 1.2% | |
| | |
ArcBest Corp. | | | 93,018 | | | | 1,703,159 | |
| | |
Knight Transportation, Inc. | | | 101,966 | | | | 2,865,245 | |
| | |
Old Dominion Freight Line, Inc.(a) | | | 45,036 | | | | 3,203,411 | |
| | |
Roadrunner Transportation Systems, Inc.(a) | | | 144,747 | | | | 1,207,190 | |
| | |
Swift Transportation Co.(a) | | | 149,016 | | | | 2,773,188 | |
| | | | | | | | | |
Total | | | | | | | 11,752,193 | |
|
Trading Companies & Distributors 0.9% | |
| | |
Aircastle Ltd. | | | 48,628 | | | | 1,052,796 | |
| | |
Beacon Roofing Supply, Inc.(a) | | | 67,473 | | | | 3,102,409 | |
The accompanying Notes to Financial Statements are an integral part of this statement.
| | | | | | |
| | |
| | | | ACTIVE PORTFOLIOS® MULTI-MANAGER SMALL CAP EQUITY FUND | | |
PORTFOLIO OF INVESTMENTS (continued)
August 31, 2016
| | | | | | | | |
| Common Stocks (continued) | |
| Issuer | | Shares | | | Value ($) | |
MRC Global, Inc.(a) | | | 83,853 | | | | 1,230,124 | |
| | |
Neff Corp. Class A(a) | | | 82,124 | | | | 771,144 | |
| | |
SiteOne Landscape Supply, Inc.(a) | | | 73,562 | | | | 2,813,011 | |
| | | | | | | | | |
Total | | | | | | | 8,969,484 | |
| | | | | | | | | |
Total Industrials | | | | | | | 157,410,637 | |
| | |
| | | | | | | | |
INFORMATION TECHNOLOGY 18.7% | |
Communications Equipment 1.5% | |
| | |
Finisar Corp.(a) | | | 134,074 | | | | 2,839,687 | |
| | |
InterDigital, Inc. | | | 20,111 | | | | 1,436,127 | |
| | |
Lumentum Holdings, Inc.(a) | | | 41,829 | | | | 1,469,035 | |
| | |
NETGEAR, Inc.(a) | | | 55,632 | | | | 3,171,024 | |
| | |
Netscout Systems, Inc.(a) | | | 96,054 | | | | 2,841,277 | |
| | |
Oclaro, Inc.(a) | | | 357,975 | | | | 2,820,843 | |
| | | | | | | | | |
Total | | | | | | | 14,577,993 | |
|
Electronic Equipment, Instruments & Components 3.7% | |
| | |
Belden, Inc. | | | 16,488 | | | | 1,229,840 | |
| | |
Benchmark Electronics, Inc.(a) | | | 70,361 | | | | 1,697,107 | |
| | |
Coherent, Inc.(a) | | | 11,043 | | | | 1,161,503 | |
| | |
Fabrinet(a) | | | 45,600 | | | | 1,770,192 | |
| | |
II-VI, Inc.(a) | | | 140,118 | | | | 2,969,100 | |
| | |
Insight Enterprises, Inc.(a) | | | 47,635 | | | | 1,457,631 | |
| | |
IPG Photonics Corp.(a) | | | 37,370 | | | | 3,250,443 | |
| | |
Mesa Laboratories, Inc. | | | 48,617 | | | | 5,462,606 | |
| | |
Plexus Corp.(a) | | | 21,095 | | | | 973,534 | |
| | |
Rogers Corp.(a) | | | 63,293 | | | | 3,538,712 | |
| | |
Sanmina Corp.(a) | | | 64,441 | | | | 1,693,509 | |
| | |
Scansource, Inc.(a) | | | 25,714 | | | | 879,676 | |
| | |
SYNNEX Corp. | | | 35,655 | | | | 3,785,491 | |
| | |
Tech Data Corp.(a) | | | 4,720 | | | | 350,413 | |
| | |
TTM Technologies, Inc.(a) | | | 263,250 | | | | 2,824,673 | |
| | |
Vishay Intertechnology, Inc. | | | 144,124 | | | | 2,040,796 | |
| | | | | | | | | |
Total | | | | | | | 35,085,226 | |
|
Internet Software & Services 3.3% | |
| | |
2U, Inc.(a) | | | 37,273 | | | | 1,317,228 | |
| | |
Alarm.com Holdings, Inc.(a) | | | 48,632 | | | | 1,333,976 | |
| | |
Brightcove, Inc.(a) | | | 115,837 | | | | 1,493,139 | |
| | |
CoStar Group, Inc.(a) | | | 17,825 | | | | 3,694,231 | |
| | |
DHI Group, Inc.(a) | | | 110,470 | | | | 855,038 | |
| | |
Envestnet, Inc.(a) | | | 25,015 | | | | 988,343 | |
| | |
Five9, Inc.(a) | | | 107,176 | | | | 1,606,568 | |
| | |
Instructure, Inc.(a) | | | 51,841 | | | | 1,240,555 | |
| | |
LogMeIn, Inc.(a) | | | 14,817 | | | | 1,237,219 | |
| | |
Monster Worldwide, Inc.(a) | | | 163,914 | | | | 599,925 | |
| | | | | | | | |
| Common Stocks (continued) | |
| Issuer | | Shares | | | Value ($) | |
NIC, Inc. | | | 195,600 | | | | 4,494,888 | |
| | |
SPS Commerce, Inc.(a) | | | 98,000 | | | | 6,397,440 | |
| | |
Stamps.com, Inc.(a) | | | 49,800 | | | | 4,816,656 | |
| | |
Yelp, Inc.(a) | | | 33,964 | | | | 1,306,935 | |
| | | | | | | | | |
Total | | | | | | | 31,382,141 | |
|
IT Services 0.7% | |
| | |
Convergys Corp. | | | 53,083 | | | | 1,583,466 | |
| | |
Science Applications International Corp. | | | 28,200 | | | | 1,799,442 | |
| | |
Sykes Enterprises, Inc.(a) | | | 34,148 | | | | 998,146 | |
| | |
Travelport Worldwide Ltd. | | | 120,736 | | | | 1,657,705 | |
| | | | | | | | | |
Total | | | | | | | 6,038,759 | |
|
Semiconductors & Semiconductor Equipment 3.9% | |
| | |
Acacia Communications, Inc.(a) | | | 11,833 | | | | 1,321,154 | |
| | |
Advanced Micro Devices, Inc.(a) | | | 188,029 | | | | 1,391,415 | |
| | |
Amkor Technology, Inc.(a) | | | 278,794 | | | | 2,537,025 | |
| | |
Ceva, Inc.(a) | | | 36,983 | | | | 1,164,225 | |
| | |
Cirrus Logic, Inc.(a) | | | 67,221 | | | | 3,411,466 | |
| | |
Cypress Semiconductor Corp. | | | 128,000 | | | | 1,527,040 | |
| | |
Diodes, Inc.(a) | | | 50,872 | | | | 1,047,454 | |
| | |
Formfactor, Inc.(a) | | | 101,000 | | | | 1,045,350 | |
| | |
Inphi Corp.(a) | | | 34,461 | | | | 1,484,235 | |
| | |
Integrated Device Technology, Inc.(a) | | | 201,248 | | | | 4,043,072 | |
| | |
Intersil Corp., Class A | | | 81,468 | | | | 1,608,178 | |
| | |
Kulicke & Soffa Industries, Inc.(a) | | | 129,900 | | | | 1,588,677 | |
| | |
Microsemi Corp.(a) | | | 31,705 | | | | 1,266,932 | |
| | |
MKS Instruments, Inc. | | | 27,517 | | | | 1,341,179 | |
| | |
Monolithic Power Systems, Inc. | | | 17,162 | | | | 1,316,669 | |
| | |
Nanometrics, Inc.(a) | | | 60,590 | | | | 1,232,401 | |
| | |
NeoPhotonics Corp.(a) | | | 94,330 | | | | 1,408,347 | |
| | |
NVE Corp. | | | 33,200 | | | | 1,927,260 | |
| | |
PDF Solutions, Inc.(a) | | | 47,405 | | | | 794,034 | |
| | |
Photronics, Inc.(a) | | | 124,315 | | | | 1,188,451 | |
| | |
Rudolph Technologies, Inc.(a) | | | 78,848 | | | | 1,382,994 | |
| | |
Silicon Laboratories, Inc.(a) | | | 18,182 | | | | 1,041,829 | |
| | |
Teradyne, Inc. | | | 93,925 | | | | 1,978,060 | |
| | | | | | | | | |
Total | | | | | | | 37,047,447 | |
|
Software 5.6% | |
| | |
8x8, Inc.(a) | | | 87,567 | | | | 1,162,014 | |
| | |
ACI Worldwide, Inc.(a) | | | 188,600 | | | | 3,602,260 | |
| | |
AVG Technologies NV(a) | | | 136,842 | | | | 3,401,892 | |
| | |
Blackbaud, Inc. | | | 86,625 | | | | 5,835,926 | |
| | |
Bottomline Technologies de, Inc.(a) | | | 172,400 | | | | 3,980,716 | |
| | |
BroadSoft, Inc.(a) | | | 28,198 | | | | 1,288,931 | |
| | |
CommVault Systems, Inc.(a) | | | 24,397 | | | | 1,257,421 | |
The accompanying Notes to Financial Statements are an integral part of this statement.
| | | | | | |
| | |
| | | | ACTIVE PORTFOLIOS® MULTI-MANAGER SMALL CAP EQUITY FUND | | |
PORTFOLIO OF INVESTMENTS (continued)
August 31, 2016
| | | | | | | | |
| Common Stocks (continued) | |
| Issuer | | Shares | | | Value ($) | |
Ebix, Inc. | | | 37,316 | | | | 2,127,012 | |
| | |
Exa Corp.(a) | | | 180,931 | | | | 2,873,184 | |
| | |
FleetMatics Group PLC(a) | | | 45,800 | | | | 2,742,046 | |
| | |
Gigamon, Inc.(a) | | | 31,735 | | | | 1,402,687 | |
| | |
Guidewire Software, Inc.(a) | | | 19,247 | | | | 1,184,268 | |
| | |
Mitek Systems, Inc.(a) | | | 173,504 | | | | 1,348,126 | |
| | |
Paycom Software, Inc.(a) | | | 26,537 | | | | 1,362,410 | |
| | |
Pegasystems, Inc. | | | 35,713 | | | | 919,610 | |
| | |
Proofpoint, Inc.(a) | | | 17,142 | | | | 1,319,077 | |
| | |
PROS Holdings, Inc.(a) | | | 174,923 | | | | 3,442,485 | |
| | |
PTC, Inc.(a) | | | 108,538 | | | | 4,631,317 | |
| | |
Rubicon Project, Inc. (The)(a) | | | 27,328 | | | | 232,288 | |
| | |
Synchronoss Technologies, Inc.(a) | | | 31,387 | | | | 1,310,407 | |
| | |
Take-Two Interactive Software, Inc.(a) | | | 32,400 | | | | 1,408,428 | |
| | |
Tyler Technologies, Inc.(a) | | | 31,875 | | | | 5,225,906 | |
| | |
Zendesk, Inc.(a) | | | 35,991 | | | | 1,099,165 | |
| | | | | | | | | |
Total | | | | | | | 53,157,576 | |
| | | | | | | | | |
Total Information Technology | | | | | | | 177,289,142 | |
| | |
| | | | | | | | |
MATERIALS 4.6% | |
Chemicals 2.2% | |
| | |
A. Schulman, Inc. | | | 25,749 | | | | 656,600 | |
| | |
Balchem Corp. | | | 49,200 | | | | 3,445,476 | |
| | |
Cabot Corp. | | | 37,700 | | | | 1,879,722 | |
| | |
Innospec, Inc. | | | 54,580 | | | | 3,235,502 | |
| | |
Koppers Holdings, Inc.(a) | | | 19,542 | | | | 637,851 | |
| | |
Minerals Technologies, Inc. | | | 23,618 | | | | 1,666,722 | |
| | |
Olin Corp. | | | 77,000 | | | | 1,666,280 | |
| | |
Orion Engineered Carbons SA | | | 172,940 | | | | 3,111,191 | |
| | |
Scotts Miracle-Gro Co., Class A | | | 15,590 | | | | 1,290,852 | |
| | |
Sensient Technologies Corp. | | | 16,491 | | | | 1,207,636 | |
| | |
Stepan Co. | | | 25,817 | | | | 1,813,902 | |
| | | | | | | | | |
Total | | | | | | | 20,611,734 | |
|
Construction Materials 0.1% | |
| | |
US Concrete, Inc.(a) | | | 23,035 | | | | 1,221,316 | |
|
Containers & Packaging 0.2% | |
| | |
Berry Plastics Group, Inc.(a) | | | 31,013 | | | | 1,407,680 | |
|
Metals & Mining 1.4% | |
| | |
AK Steel Holding Corp.(a) | | | 227,817 | | | | 1,016,064 | |
| | |
Carpenter Technology Corp. | | | 77,781 | | | | 2,821,894 | |
| | |
Commercial Metals Co. | | | 82,671 | | | | 1,283,054 | |
| | |
Hecla Mining Co. | | | 211,000 | | | | 1,177,380 | |
| | |
Kaiser Aluminum Corp. | | | 53,960 | | | | 4,599,011 | |
| | |
Materion Corp. | | | 30,500 | | | | 894,870 | |
| | | | | | | | |
| Common Stocks (continued) | |
| Issuer | | Shares | | | Value ($) | |
Ryerson Holding Corp.(a) | | | 86,710 | | | | 1,048,324 | |
| | |
United States Steel Corp. | | | 46,000 | | | | 894,240 | |
| | | | | | | | | |
Total | | | | | | | 13,734,837 | |
|
Paper & Forest Products 0.7% | |
| | |
Clearwater Paper Corp.(a) | | | 50,844 | | | | 3,155,887 | |
| | |
Neenah Paper, Inc. | | | 44,582 | | | | 3,585,730 | |
| | | | | | | | | |
Total | | | | | | | 6,741,617 | |
| | | | | | | | | |
Total Materials | | | | | | | 43,717,184 | |
| | |
| | | | | | | | |
TELECOMMUNICATION SERVICES 0.1% | |
Diversified Telecommunication Services 0.1% | |
| | |
Inteliquent, Inc. | | | 65,424 | | | | 1,088,655 | |
| | | | | | | | | |
Total Telecommunication Services | | | | | | | 1,088,655 | |
| | |
| | | | | | | | |
UTILITIES 3.0% | |
Electric Utilities 1.0% | |
| | |
Allete, Inc. | | | 24,573 | | | | 1,457,179 | |
| | |
El Paso Electric Co. | | | 34,849 | | | | 1,592,251 | |
| | |
Great Plains Energy, Inc. | | | 94,737 | | | | 2,573,057 | |
| | |
PNM Resources, Inc. | | | 64,303 | | | | 2,044,192 | |
| | |
Portland General Electric Co. | | | 55,393 | | | | 2,332,599 | |
| | | | | | | | | |
Total | | | | | | | 9,999,278 | |
|
Gas Utilities 0.8% | |
| | |
New Jersey Resources Corp. | | | 57,800 | | | | 1,944,392 | |
| | |
ONE Gas, Inc. | | | 17,300 | | | | 1,059,279 | |
| | |
South Jersey Industries, Inc. | | | 68,000 | | | | 2,018,240 | |
| | |
Southwest Gas Corp. | | | 37,930 | | | | 2,648,273 | |
| | | | | | | | | |
Total | | | | | | | 7,670,184 | |
|
Multi-Utilities 0.9% | |
| | |
Avista Corp. | | | 117,104 | | | | 4,756,764 | |
| | |
Black Hills Corp. | | | 19,000 | | | | 1,111,690 | |
| | |
Vectren Corp. | | | 52,867 | | | | 2,585,725 | |
| | | | | | | | | |
Total | | | | | | | 8,454,179 | |
|
Water Utilities 0.3% | |
| | |
California Water Service Group | | | 82,624 | | | | 2,519,206 | |
| | | | | | | | | |
Total Utilities | | | | | | | 28,642,847 | |
| | | | | | | | | |
Total Common Stocks | | | | | | | | |
(Cost: $838,638,236) | | | | | | | 940,557,191 | |
| | |
| | | | | | | | |
The accompanying Notes to Financial Statements are an integral part of this statement.
| | | | | | |
| | |
| | | | ACTIVE PORTFOLIOS® MULTI-MANAGER SMALL CAP EQUITY FUND | | |
PORTFOLIO OF INVESTMENTS (continued)
August 31, 2016
| | | | | | | | |
| Money Market Funds 1.5% | |
| | | Shares | | | Value ($) | |
Columbia Short-Term Cash Fund, 0.415%(b)(c) | | | 13,907,784 | | | | 13,907,784 | |
| | | | | | | | | |
Total Money Market Funds | | | | | | | | |
(Cost: $13,907,784) | | | | | | | 13,907,784 | |
| | | | | | | | | |
Total Investments | | | | | | | | |
(Cost: $852,546,020) | | | | | | | 954,464,975 | |
| | | | | | | | | |
Other Assets & Liabilities, Net | | | | | | | (3,868,374 | ) |
| | | | | | | | | |
Net Assets | | | | | | | 950,596,601 | |
| | | | | | | | | |
Notes to Portfolio of Investments
| (a) | Non-income producing investment. |
| (b) | The rate shown is the seven-day current annualized yield at August 31, 2016. |
| (c) | As defined in the Investment Company Act of 1940, an affiliated company is one in which the Fund owns 5% or more of the company’s outstanding voting securities, or a company which is under common ownership or control with the Fund. Holdings and transactions in these affiliated companies during the year ended August 31, 2016 are as follows: |
| | | | | | | | | | | | | | | | | | | | | | | | |
| Issuer | | Beginning
Cost ($) | | | Purchase
Cost ($) | | | Proceeds
From Sales ($) | | | Ending
Cost ($) | | | Dividends —
Affiliated
Issuers ($) | | | Value ($) | |
Columbia Short-Term Cash Fund | | | 162,568,889 | | | | 607,829,535 | | | | (756,490,640 | ) | | | 13,907,784 | | | | 116,964 | | | | 13,907,784 | |
Fair Value Measurements
The Fund categorizes its fair value measurements according to a three-level hierarchy that maximizes the use of observable inputs and minimizes the use of unobservable inputs by prioritizing that the most observable input be used when available. Observable inputs are those that market participants would use in pricing an investment based on market data obtained from sources independent of the reporting entity. Unobservable inputs are those that reflect the Fund’s assumptions about the information market participants would use in pricing an investment. An investment’s level within the fair value hierarchy is based on the lowest level of any input that is deemed significant to the asset’s or liability’s fair value measurement. The input levels are not necessarily an indication of the risk or liquidity associated with investments at that level. For example, certain U.S. government securities are generally high quality and liquid, however, they are reflected as Level 2 because the inputs used to determine fair value may not always be quoted prices in an active market.
Fair value inputs are summarized in the three broad levels listed below:
| n | | Level 1 — Valuations based on quoted prices for investments in active markets that the Fund has the ability to access at the measurement date (including NAV for open-end mutual funds). Valuation adjustments are not applied to Level 1 investments. |
| n | | Level 2 — Valuations based on other significant observable inputs (including quoted prices for similar securities, interest rates, prepayment speeds, credit risks, etc.). |
| n | | Level 3 — Valuations based on significant unobservable inputs (including the Fund’s own assumptions and judgment in determining the fair value of investments). |
Inputs that are used in determining fair value of an investment may include price information, credit data, volatility statistics, and other factors. These inputs can be either observable or unobservable. The availability of observable inputs can vary between investments, and is affected by various factors such as the type of investment, and the volume and level of activity for that investment or similar investments in the marketplace. The inputs will be considered by the Investment Manager, along with any other relevant factors in the calculation of an investment’s fair value. The Fund uses prices and inputs that are current as of the measurement date, which may include periods of market dislocations. During these periods, the availability of prices and inputs may be reduced for many investments. This condition could cause an investment to be reclassified between the various levels within the hierarchy.
Certain investments that have been measured at fair value using the net asset value per share (or its equivalent) are not categorized in the fair value hierarchy. The fair value amounts presented in the table are intended to reconcile the fair value hierarchy to the amounts presented in the Portfolio of Investments. The Columbia Short-Term Cash Fund seeks to provide shareholders with maximum current income consistent with liquidity and stability of principal. Investments in Columbia Short-Term Cash Fund may be redeemed on a daily basis without restriction.
Investments falling into the Level 3 category are primarily supported by quoted prices from brokers and dealers participating in the market for those investments. However, these may be classified as Level 3 investments due to lack of market transparency and corroboration to support these quoted prices. Additionally, valuation models may be used as the pricing source for any remaining investments classified as Level 3. These models may rely on one or more significant unobservable inputs and/or significant assumptions by the Investment Manager. Inputs used in valuations may include, but are not limited to, financial statement analysis, capital account balances, discount rates and estimated cash flows, and comparable company data.
The accompanying Notes to Financial Statements are an integral part of this statement.
| | | | | | |
| | |
| | | | ACTIVE PORTFOLIOS® MULTI-MANAGER SMALL CAP EQUITY FUND | | |
PORTFOLIO OF INVESTMENTS (continued)
August 31, 2016
Fair Value Measurements (continued)
Under the direction of the Fund’s Board of Trustees (the Board), the Investment Manager’s Valuation Committee (the Committee) is responsible for overseeing the valuation procedures approved by the Board. The Committee consists of voting and non-voting members from various groups within the Investment Manager’s organization, including operations and accounting, trading and investments, compliance, risk management and legal.
The Committee meets at least monthly to review and approve valuation matters, which may include a description of specific valuation determinations, data regarding pricing information received from approved pricing vendors and brokers and the results of Board-approved valuation control policies and procedures (the Policies). The Policies address, among other things, instances when market quotations are or are not readily available, including recommendations of third party pricing vendors and a determination of appropriate pricing methodologies; events that require specific valuation determinations and assessment of fair value techniques; securities with a potential for stale pricing, including those that are illiquid, restricted, or in default; and the effectiveness of third party pricing vendors, including periodic reviews of vendors. The Committee meets more frequently, as needed, to discuss additional valuation matters, which may include the need to review back-testing results, review time-sensitive information or approve related valuation actions. The Committee reports to the Board, with members of the Committee meeting with the Board at each of its regularly scheduled meetings to discuss valuation matters and actions during the period, similar to those described earlier.
For investments categorized as Level 3, the Committee monitors information similar to that described above, which may include: (i) data specific to the issuer or comparable issuers, (ii) general market or specific sector news and (iii) quoted prices and specific or similar security transactions. The Committee considers this data and any changes from prior periods in order to assess the reasonableness of observable and unobservable inputs, any assumptions or internal models used to value those securities and changes in fair value. This data is also used to corroborate, when available, information received from approved pricing vendors and brokers. Various factors impact the frequency of monitoring this information (which may occur as often as daily). However, the Committee may determine that changes to inputs, assumptions and models are not required as a result of the monitoring procedures performed.
The following table is a summary of the inputs used to value the Fund’s investments at August 31, 2016:
| | | | | | | | | | | | | | | | |
| | | Level 1
Quoted Prices in Active
Markets for Identical
Assets ($) | | | Level 2
Other Significant
Observable Inputs ($) | | | Level 3
Significant
Unobservable Inputs ($) | | | Total ($) | |
Investments | | | | | | | | | | | | | | | | |
| | | | |
Common Stocks | | | | | | | | | | | | | | | | |
| | | | |
Consumer Discretionary | | | 92,658,379 | | | | — | | | | — | | | | 92,658,379 | |
| | | | |
Consumer Staples | | | 25,032,991 | | | | — | | | | — | | | | 25,032,991 | |
| | | | |
Energy | | | 39,340,678 | | | | — | | | | — | | | | 39,340,678 | |
| | | | |
Financials | | | 233,328,428 | | | | — | | | | — | | | | 233,328,428 | |
| | | | |
Health Care | | | 142,048,250 | | | | — | | | | — | | | | 142,048,250 | |
| | | | |
Industrials | | | 157,410,637 | | | | — | | | | — | | | | 157,410,637 | |
| | | | |
Information Technology | | | 177,289,142 | | | | — | | | | — | | | | 177,289,142 | |
| | | | |
Materials | | | 43,717,184 | | | | — | | | | — | | | | 43,717,184 | |
| | | | |
Telecommunication Services | | | 1,088,655 | | | | — | | | | — | | | | 1,088,655 | |
| | | | |
Utilities | | | 28,642,847 | | | | — | | | | — | | | | 28,642,847 | |
| | | | | | | | | | | | | | | | | |
Total Common Stocks | | | 940,557,191 | | | | — | | | | — | | | | 940,557,191 | |
| | | | | | | | | | | | | | | | | |
Investments measured at net asset value | | | | | | | | | | | | | | | | |
| | | | |
Money Market Funds | | | — | | | | — | | | | — | | | | 13,907,784 | |
| | | | | | | | | | | | | | | | | |
Total Investments | | | 940,557,191 | | | | — | | | | — | | | | 954,464,975 | |
| | | | | | | | | | | | | | | | | |
See the Portfolio of Investments for all investment classifications not indicated in the table.
There were no transfers of financial assets between levels during the period.
The accompanying Notes to Financial Statements are an integral part of this statement.
| | | | | | |
| | |
| | | | ACTIVE PORTFOLIOS® MULTI-MANAGER SMALL CAP EQUITY FUND | | |
STATEMENT OF ASSETS AND LIABILITIES
August 31, 2016
| | | | |
Assets | |
|
Investments, at value | |
| |
Unaffiliated issuers (identified cost $838,638,236) | | | $940,557,191 | |
| |
Affiliated issuers (identified cost $13,907,784) | | | 13,907,784 | |
| |
Total investments (identified cost $852,546,020) | | | 954,464,975 | |
|
Receivable for: | |
| |
Investments sold | | | 6,012,653 | |
| |
Capital shares sold | | | 1,359,730 | |
| |
Dividends | | | 713,804 | |
| |
Expense reimbursement due from Investment Manager | | | 4,157 | |
| |
Prepaid expenses | | | 11,002 | |
| |
Trustees’ deferred compensation plan | | | 22,564 | |
| |
Total assets | | | 962,588,885 | |
| |
|
Liabilities | |
|
Payable for: | |
| |
Investments purchased | | | 9,071,343 | |
| |
Capital shares purchased | | | 2,444,493 | |
| |
Management services fees | | | 23,935 | |
| |
Distribution and/or service fees | | | 6,526 | |
| |
Transfer agent fees | | | 266,983 | |
| |
Compensation of board members | | | 259 | |
| |
Chief compliance officer expenses | | | 96 | |
| |
Other expenses | | | 156,085 | |
| |
Trustees’ deferred compensation plan | | | 22,564 | |
| |
Total liabilities | | | 11,992,284 | |
| |
Net assets applicable to outstanding capital stock | | | $950,596,601 | |
| |
|
Represented by | |
| |
Paid-in capital | | | $854,994,053 | |
| |
Excess of distributions over net investment income | | | (621,339 | ) |
| |
Accumulated net realized loss | | | (5,695,068 | ) |
|
Unrealized appreciation (depreciation) on: | |
| |
Investments | | | 101,918,955 | |
| |
Total — representing net assets applicable to outstanding capital stock | | | $950,596,601 | |
| |
|
Class A | |
| |
Net assets | | | $950,596,601 | |
| |
Shares outstanding | | | 71,002,959 | |
| |
Net asset value per share | | | $13.39 | |
| |
The accompanying Notes to Financial Statements are an integral part of this statement.
| | | | | | |
| | |
| | | | ACTIVE PORTFOLIOS® MULTI-MANAGER SMALL CAP EQUITY FUND | | |
STATEMENT OF OPERATIONS
Year Ended August 31, 2016
| | | | |
Net investment income | | | | |
| |
Income: | | | | |
| |
Dividends — unaffiliated issuers | | | $16,998,453 | |
| |
Dividends — affiliated issuers | | | 116,964 | |
| |
Foreign taxes withheld | | | (34,697 | ) |
| |
Total income | | | 17,080,720 | |
| |
| |
Expenses: | | | | |
| |
Management services fees | | | 11,256,001 | |
| |
Distribution and/or service fees | | | | |
| |
Class A | | | 3,105,137 | |
| |
Transfer agent fees | | | | |
| |
Class A | | | 3,790,960 | |
| |
Compensation of board members | | | 39,818 | |
| |
Custodian fees | | | 63,431 | |
| |
Printing and postage fees | | | 448,842 | |
| |
Registration fees | | | 109,970 | |
| |
Audit fees | | | 27,777 | |
| |
Legal fees | | | 38,582 | |
| |
Chief compliance officer expenses | | | 649 | |
| |
Other | | | 28,700 | |
| |
Total expenses | | | 18,909,867 | |
| |
Fees waived or expenses reimbursed by Investment Manager and its affiliates | | | (1,786,978 | ) |
| |
Total net expenses | | | 17,122,889 | |
| |
Net investment loss | | | (42,169 | ) |
| |
| |
Realized and unrealized gain (loss) — net | | | | |
| |
Net realized gain (loss) on: | | | | |
| |
Investments | | | (3,254,297 | ) |
| |
Futures contracts | | | (10,855,725 | ) |
| |
Net realized loss | | | (14,110,022 | ) |
| |
Net change in unrealized appreciation (depreciation) on: | | | | |
| |
Investments | | | 61,537,677 | |
| |
Futures contracts | | | 12,077,786 | |
| |
Net change in unrealized appreciation | | | 73,615,463 | |
| |
Net realized and unrealized gain | | | 59,505,441 | |
| |
Net increase in net assets resulting from operations | | | $59,463,272 | |
| |
The accompanying Notes to Financial Statements are an integral part of this statement.
| | | | | | |
| | |
| | | | ACTIVE PORTFOLIOS® MULTI-MANAGER SMALL CAP EQUITY FUND | | |
STATEMENT OF CHANGES IN NET ASSETS
| | | | | | | | |
| | | Year Ended
August 31, 2016 | | | Year Ended
August 31, 2015 | |
Operations | | | | | | | | |
| | |
Net investment loss | | | $(42,169 | ) | | | $(3,136,467 | ) |
| | |
Net realized gain (loss) | | | (14,110,022 | ) | | | 38,704,927 | |
| | |
Net change in unrealized appreciation (depreciation) | | | 73,615,463 | | | | (68,520,639 | ) |
| |
Net increase (decrease) in net assets resulting from operations | | | 59,463,272 | | | | (32,952,179 | ) |
| |
| | |
Distributions to shareholders | | | | | | | | |
| | |
Net realized gains | | | | | | | | |
| | |
Class A | | | (28,524,836 | ) | | | (54,289,860 | ) |
| |
Total distributions to shareholders | | | (28,524,836 | ) | | | (54,289,860 | ) |
| |
Increase (decrease) in net assets from capital stock activity | | | (420,616,448 | ) | | | 799,416,389 | |
| |
Total increase (decrease) in net assets | | | (389,678,012 | ) | | | 712,174,350 | |
| | |
Net assets at beginning of year | | | 1,340,274,613 | | | | 628,100,263 | |
| |
Net assets at end of year | | | $950,596,601 | | | | $1,340,274,613 | |
| |
Excess of distributions over net investment income | | | $(621,339 | ) | | | $(3,145,324 | ) |
| |
The accompanying Notes to Financial Statements are an integral part of this statement.
| | | | | | |
| | |
| | | | ACTIVE PORTFOLIOS® MULTI-MANAGER SMALL CAP EQUITY FUND | | |
STATEMENT OF CHANGES IN NET ASSETS (continued)
| | | | | | | | | | | | | | | | |
| | | Year Ended
August 31, 2016 | | | Year Ended
August 31, 2015 | |
| | | Shares | | | Dollars ($) | | | Shares | | | Dollars ($) | |
Capital stock activity | | | | | | | | | | | | | | | | |
| | | | |
Class A shares | | | | | | | | | | | | | | | | |
| | | | |
Subscriptions | | | 22,401,596 | | | | 275,029,786 | | | | 67,126,100 | | | | 911,201,063 | |
| | | | |
Distributions reinvested | | | 2,330,456 | | | | 28,524,783 | | | | 4,374,668 | | | | 54,289,632 | |
| | | | |
Redemptions | | | (58,523,127 | ) | | | (724,171,017 | ) | | | (12,620,702 | ) | | | (166,074,306 | ) |
| |
Net increase (decrease) | | | (33,791,075 | ) | | | (420,616,448 | ) | | | 58,880,066 | | | | 799,416,389 | |
| |
Total net increase (decrease) | | | (33,791,075 | ) | | | (420,616,448 | ) | | | 58,880,066 | | | | 799,416,389 | |
| |
The accompanying Notes to Financial Statements are an integral part of this statement.
| | | | | | |
| | |
| | | | ACTIVE PORTFOLIOS® MULTI-MANAGER SMALL CAP EQUITY FUND | | |
FINANCIAL HIGHLIGHTS
The following table is intended to help you understand the Fund’s financial performance. Certain information reflects financial results for a single share of a class held for the periods shown. Per share net investment income (loss) amounts are calculated based on average shares outstanding during the period. Total return assumes reinvestment of all dividends and distributions, if any. Total return does not reflect payment of sales charges, if any. Total return and portfolio turnover are not annualized for periods of less than one year. The portfolio turnover rate is calculated without regard to purchase and sales transactions of short-term instruments and certain derivatives, if any. If such transactions were included, the Fund’s portfolio turnover rate may be higher.
| | | | | | | | | | | | | | | | | | | | |
| | | Year Ended August 31, | |
Class A | | | 2016 | | | | 2015 | | | | 2014 | | | | 2013 | | | | 2012(a) | |
Per share data | | | | | | | | | | | | | | | | | | | | |
Net asset value, beginning of period | | | $12.79 | | | | $13.68 | | | | $12.73 | | | | $10.07 | | | | $10.00 | |
| | | | | | | | | | | | | | | | | | | | | |
Income from investment operations: | | | | | | | | | | | | | | | | | | | | |
| | | | | |
Net investment income (loss) | | | (0.00 | )(b) | | | (0.05 | ) | | | (0.07 | ) | | | 0.03 | | | | (0.01 | ) |
| | | | | | | | | | | | | | | | | | | | | |
Net realized and unrealized gain | | | 0.86 | | | | 0.28 | (c) | | | 1.86 | | | | 2.69 | | | | 0.08 | (c) |
| | | | | | | | | | | | | | | | | | | | | |
Total from investment operations | | | 0.86 | | | | 0.23 | | | | 1.79 | | | | 2.72 | | | | 0.07 | |
| | | | | | | | | | | | | | | | | | | | | |
Less distributions to shareholders: | | | | | | | | | | | | | | | | | | | | |
| | | | | |
Net investment income | | | — | | | | — | | | | — | | | | (0.06 | ) | | | — | |
| | | | | | | | | | | | | | | | | | | | | |
Net realized gains | | | (0.26 | ) | | | (1.12 | ) | | | (0.84 | ) | | | — | | | | — | |
| | | | | | | | | | | | | | | | | | | | | |
Total distributions to shareholders | | | (0.26 | ) | | | (1.12 | ) | | | (0.84 | ) | | | (0.06 | ) | | | — | |
| | | | | | | | | | | | | | | | | | | | | |
Net asset value, end of period | | | $13.39 | | | | $12.79 | | | | $13.68 | | | | $12.73 | | | | $10.07 | |
| | | | | | | | | | | | | | | | | | | | | |
Total return | | | 6.91 | % | | | 1.90 | % | | | 14.28 | % | | | 27.11 | % | | | 0.70 | % |
| | | | | | | | | | | | | | | | | | | | | |
Ratios to average net assets(d) | | | | | | | | | | | | | | | | | | | | |
| | | | | |
Total gross expenses | | | 1.52 | % | | | 1.58 | %(e) | | | 1.57 | % | | | 1.63 | % | | | 1.77 | %(f) |
| | | | | | | | | | | | | | | | | | | | | |
Total net expenses(g) | | | 1.38 | % | | | 1.37 | %(e) | | | 1.34 | % | | | 1.34 | % | | | 1.34 | %(f) |
| | | | | | | | | | | | | | | | | | | | | |
Net investment income (loss) | | | (0.00 | %)(b) | | | (0.38 | %) | | | (0.48 | %) | | | 0.30 | % | | | (0.21 | %)(f) |
| | | | | | | | | | | | | | | | | | | | | |
Supplemental data | | | | | | | | | | | | | | | | | | | | |
| | | | | |
Net assets, end of period (in thousands) | | | $950,597 | | | | $1,340,275 | | | | $628,100 | | | | $570,786 | | | | $405,992 | |
| | | | | | | | | | | | | | | | | | | | | |
Portfolio turnover | | | 115 | % | | | 75 | % | | | 73 | % | | | 97 | % | | | 26 | % |
| | | | | | | | | | | | | | | | | | | | | |
Notes to Financial Highlights
| (a) | Based on operations from April 20, 2012 (commencement of operations) through the stated period end. |
| (c) | Calculation of the net gain (loss) per share (both realized and unrealized) does not correlate to the aggregate realized and unrealized gain (loss) presented in the Statement of Operations due to the timing of subscriptions and redemptions of Fund shares in relation to fluctuations in the market value of the portfolio. |
| (d) | In addition to the fees and expenses that the Fund bears directly, the Fund indirectly bears a pro rata share of the fees and expenses of any other funds in which it invests. Such indirect expenses are not included in the Fund’s reported expense ratios. |
| (e) | Ratios include line of credit interest expense which is less than 0.01%. |
| (g) | Total net expenses include the impact of certain fee waivers/expense reimbursements made by the Investment Manager and certain of its affiliates, if applicable. |
The accompanying Notes to Financial Statements are an integral part of this statement.
| | | | | | |
| | |
| | | | ACTIVE PORTFOLIOS® MULTI-MANAGER SMALL CAP EQUITY FUND | | |
NOTES TO FINANCIAL STATEMENTS
August 31, 2016
Note 1. Organization
Active Portfolios® Multi-Manager Small Cap Equity Fund (the Fund), a series of Columbia Funds Series Trust I (the Trust), is a diversified fund. The Trust is registered under the Investment Company Act of 1940, as amended (the 1940 Act), as an open-end management investment company organized as a Massachusetts business trust.
Fund Shares
The Trust may issue an unlimited number of shares (without par value). The Fund only offers Class A shares that are available only to certain eligible investors through certain wrap fee programs sponsored and/or managed by Ameriprise Financial, Inc. (Ameriprise Financial) or its affiliates.
Class A shares are not subject to any front-end sales charge or contingent deferred sales charge.
Note 2. Summary of Significant Accounting Policies
Basis of Preparation
The Fund is an investment company that applies the accounting and reporting guidance in the Financial Accounting Standards Board (FASB) Accounting Standards Codification Topic 946, Financial Services —Investment Companies (ASC 946). The financial statements are prepared in accordance with U.S. generally accepted accounting principles (GAAP), which requires management to make certain estimates and assumptions that affect the reported amounts of assets and liabilities, the disclosure of contingent assets and liabilities at the date of the financial statements and the reported amounts of income and expenses during the reporting period. Actual results could differ from those estimates.
The following is a summary of significant accounting policies followed by the Fund in the preparation of its financial statements.
Security Valuation
All equity securities and exchange-traded funds are valued at the close of business of the New York Stock Exchange (NYSE). Equity securities and exchange-traded funds are valued at the last quoted sales price on the principal exchange or market on which they trade, except for securities traded on the NASDAQ Stock Market, which are valued at the NASDAQ official close price. Unlisted securities or listed securities for which there were no sales during the day are valued at the mean of the latest
quoted bid and ask prices on such exchanges or markets.
Foreign equity securities are valued based on the closing price on the foreign exchange in which such securities are primarily traded. If any foreign equity security closing prices are not readily available, the securities are valued at the mean of the latest quoted bid and ask prices on such exchanges or markets. Foreign currency exchange rates are generally determined at 4:00 p.m. Eastern (U.S.) time. Many securities markets and exchanges outside the U.S. close prior to the close of the NYSE; therefore, the closing prices for securities in such markets or on such exchanges may not fully reflect events that occur after such close but before the close of the NYSE. In those situations, foreign securities will be fair valued pursuant to a policy adopted by the Board of Trustees (the Board), including, if available, utilizing a third party pricing service to determine these fair values. The third party pricing service takes into account multiple factors, including, but not limited to, movements in the U.S. securities markets, certain depositary receipts, futures contracts and foreign exchange rates that have occurred subsequent to the close of the foreign exchange or market, to determine a good faith estimate that reasonably reflects the current market conditions as of the close of the NYSE. The fair value of a security is likely to be different from the quoted or published price, if available.
Investments in open-end investment companies, including money market funds, are valued at their latest net asset value.
Futures and options on futures contracts are valued based upon the settlement price at the close of regular trading on their principal exchanges or, in the absence of transactions, at the mean of the latest quoted bid and ask prices.
Investments for which market quotations are not readily available, or that have quotations which management believes are not reflective of market value or reliable, are valued at fair value as determined in good faith under procedures approved by and under the general supervision of the Board. If a security or class of securities (such as foreign securities) is valued at fair value, such value is likely to be different from the quoted or published price for the security.
The determination of fair value often requires significant judgment. To determine fair value, management may use assumptions including but not limited to future cash flows and estimated risk premiums. Multiple inputs from various sources may be used to determine fair value.
| | | | | | |
| | |
| | | | ACTIVE PORTFOLIOS® MULTI-MANAGER SMALL CAP EQUITY FUND | | |
NOTES TO FINANCIAL STATEMENTS (continued)
August 31, 2016
GAAP requires disclosure regarding the inputs and valuation techniques used to measure fair value and any changes in valuation inputs or techniques. In addition, investments shall be disclosed by major category. This information is disclosed following the Fund’s Portfolio of Investments.
Derivative Instruments
The Fund invests in certain derivative instruments, as detailed below, to meet its investment objectives. Derivatives are instruments whose values depend on, or are derived from, in whole or in part, the value of one or more securities, currencies, commodities, indices, or other assets or instruments. Derivatives may be used to increase investment flexibility (including to maintain cash reserves while maintaining desired exposure to certain assets), for risk management (hedging) purposes, to facilitate trading, to reduce transaction costs and to pursue higher investment returns. The Fund may also use derivative instruments to mitigate certain investment risks, such as foreign currency exchange rate risk, interest rate risk and credit risk. Derivatives may involve various risks, including the potential inability of the counterparty to fulfill its obligations under the terms of the contract, the potential for an illiquid secondary market (making it difficult for the Fund to sell or terminate, including at favorable prices) and the potential for market movements which may expose the Fund to gains or losses in excess of the amount shown in the Statement of Assets and Liabilities. The notional amounts of derivative instruments, if applicable, are not recorded in the financial statements.
A derivative instrument may suffer a marked-to-market loss if the value of the contract decreases due to an unfavorable change in the market rates or values of the underlying instrument. Losses can also occur if the counterparty does not perform its obligations under the contract. The Fund’s risk of loss from counterparty credit risk on over-the-counter derivatives is generally limited to the aggregate unrealized gain netted against any collateral held by the Fund and the amount of any variation margin held by the counterparty, plus any replacement costs or related amounts. With exchange-traded or centrally cleared derivatives, there is reduced counterparty credit risk to the Fund since the clearinghouse or central counterparty (CCP) provides some protection in the case of clearing member default. The clearinghouse or CCP stands between the buyer and the seller of the contract; therefore, additional counterparty credit risk is failure of the clearinghouse or CCP. However, credit risk still exists in exchange-traded
or centrally cleared derivatives with respect to initial and variation margin that is held in a broker’s customer account. While brokers are required to segregate customer margin from their own assets, in the event that a broker becomes insolvent or goes into bankruptcy and at that time there is a shortfall in the aggregate amount of margin held by the broker for all its clients, U.S. bankruptcy laws will typically allocate that shortfall on a pro-rata basis across all the broker’s customers (including the Fund), potentially resulting in losses to the Fund.
In order to better define its contractual rights and to secure rights that will help the Fund mitigate its counterparty risk, the Fund may enter into an International Swaps and Derivatives Association, Inc. Master Agreement (ISDA Master Agreement) or similar agreement with its derivatives contract counterparties. An ISDA Master Agreement is an agreement between the Fund and a counterparty that governs over-the-counter derivatives and typically contains, among other things, collateral posting terms and netting provisions in the event of a default and/or termination event. Under an ISDA Master Agreement, the Fund may, under certain circumstances, offset with the counterparty certain derivative instrument’s payables and/or receivables with collateral held and/or posted and create one single net payment. The provisions of the ISDA Master Agreement typically permit a single net payment in the event of default (close-out netting), including the bankruptcy or insolvency of the counterparty. Note, however, that bankruptcy or insolvency laws of a particular jurisdiction may impose restrictions on or prohibitions against the right of offset or netting in bankruptcy, insolvency or other events.
Collateral (margin) requirements differ by type of derivative. Margin requirements are established by the clearinghouse or CCP for exchange-traded and centrally cleared derivatives. Brokers can ask for margin in excess of the minimum in certain circumstances. Collateral terms are contract specific for over-the-counter derivatives. For over-the-counter derivatives traded under an ISDA Master Agreement, the collateral requirements are typically calculated by netting the marked-to-market amount for each transaction under such agreement and comparing that amount to the value of any variation margin currently pledged by the Fund and/or the counterparty. Generally, the amount of collateral due from or to a party has to exceed a minimum transfer amount threshold (e.g., $250,000) before a transfer has to be made. To the extent amounts due to the Fund from its counterparties are not fully collateralized,
| | | | | | |
| | |
| | | | ACTIVE PORTFOLIOS® MULTI-MANAGER SMALL CAP EQUITY FUND | | |
NOTES TO FINANCIAL STATEMENTS (continued)
August 31, 2016
contractually or otherwise, the Fund bears the risk of loss from counterparty nonperformance. The Fund attempts to mitigate counterparty risk by only entering into agreements with counterparties that it believes have the financial resources to honor their obligations and by monitoring the financial stability of those counterparties.
Certain ISDA Master Agreements allow counterparties to over-the-counter derivatives transactions to terminate derivatives contracts prior to maturity in the event the Fund’s net asset value declines by a stated percentage over a specified time period or if the Fund fails to meet certain terms of the ISDA Master Agreement, which would cause the Fund to accelerate payment of any net liability owed to the counterparty. The Fund also has termination rights if the counterparty fails to meet certain terms of the ISDA Master Agreement. In addition to considering counterparty credit risk, the Fund would consider terminating the derivatives contracts based on whether termination would result in a net liability owed from the counterparty.
For financial reporting purposes, the Fund does not offset derivative assets and derivative liabilities that are subject to netting arrangements in the Statement of Assets and Liabilities.
Futures Contracts
Futures contracts are exchange-traded and represent commitments for the future purchase or sale of an asset at a specified price on a specified date. The Fund bought and sold futures contracts to manage exposure to the securities market. These instruments may be used for other purposes in future periods. Upon entering into futures contracts, the Fund bears risks that it may not achieve the anticipated benefits of the futures contracts and may realize a loss. Additional risks include counterparty credit risk, the possibility of an illiquid market, and that a change in the value of the contract or option may not correlate with changes in the value of the underlying asset.
Upon entering into a futures contract, the Fund deposits cash or securities with the broker, known as a futures commissions merchant (FCM), in an amount sufficient to meet the initial margin requirement. The initial margin deposit must be maintained at an established level over the life of the contract. Cash deposited as initial margin is recorded in the Statement of Assets and Liabilities as margin deposits. Securities deposited as initial margin are designated in the Portfolio of Investments. Subsequent payments (variation margin) are made or received by the Fund each day. The variation margin
payments are equal to the daily change in the contract value and are recorded as variation margin receivable or payable and are offset in unrealized gains or losses. The Fund recognizes a realized gain or loss when the contract is closed or expires. Futures contracts involve, to varying degrees, risk of loss in excess of the variation margin disclosed in the Statement of Assets and Liabilities.
Effects of Derivative Transactions in the Financial Statements
The following tables are intended to provide additional information about the effect of derivatives on the financial statements of the Fund, including: the fair value of derivatives by risk category and the location of those fair values in the Statement of Assets and Liabilities; and the impact of derivative transactions over the period in the Statement of Operations, including realized and unrealized gains (losses). The derivative instrument schedules following the Portfolio of Investments present additional information regarding derivative instruments outstanding at the end of the period, if any.
The following table indicates the effect of derivative instruments (not considered to be hedging instruments for accounting disclosure purposes) in the Statement of Operations for the year ended August 31, 2016:
| | | | |
Amount of Realized Gain (Loss) on Derivatives Recognized in
Income | |
Risk Exposure
Category | | Futures
Contracts ($) | |
Equity risk | | | (10,855,725 | ) |
Change in Unrealized Appreciation (Depreciation) on Derivatives
Recognized in Income | |
Risk Exposure
Category | | Futures
Contracts ($) | |
Equity risk | | | (12,077,786 | ) |
The following table provides a summary of the average outstanding volume by derivative instrument for the year ended August 31, 2016:
| | | | |
| Derivative Instrument | | Average notional
amounts ($)* | |
Futures contracts — Long | | | 18,431,008 | |
| * | Based on the daily outstanding amounts for the year ended August 31, 2016. |
Security Transactions
Security transactions are accounted for on the trade date. Cost is determined and gains (losses) are based upon the specific identification method for both financial statement and federal income tax purposes.
| | | | | | |
| | |
| | | | ACTIVE PORTFOLIOS® MULTI-MANAGER SMALL CAP EQUITY FUND | | |
NOTES TO FINANCIAL STATEMENTS (continued)
August 31, 2016
Income Recognition
Corporate actions and dividend income are generally recorded net of any non-reclaimable tax withholdings, on the ex-dividend date or upon receipt of ex-dividend notification in the case of certain foreign securities.
The Fund may receive distributions from holdings in equity securities, business development companies (BDCs), exchange-traded funds, other regulated investment companies (RICs), and real estate investment trusts (REITs), which report information on the tax character of their distributions annually. These distributions are allocated to dividend income, capital gain and return of capital based on actual information reported. Return of capital is recorded as a reduction of the cost basis of securities held. If the Fund no longer owns the applicable securities, return of capital is recorded as a realized gain. With respect to REITs, to the extent actual information has not yet been reported, estimates for return of capital are made by the Fund’s management. Management’s estimates are subsequently adjusted when the actual character of the distributions is disclosed by the REITs, which could result in a proportionate change in return of capital to shareholders.
Awards from class action litigation are recorded as a reduction of cost basis if the Fund still owns the applicable securities on the payment date. If the Fund no longer owns the applicable securities, the proceeds are recorded as realized gains.
Expenses
General expenses of the Trust are allocated to the Fund and other funds of the Trust based upon relative net assets or other expense allocation methodologies determined by the nature of the expense. Expenses directly attributable to the Fund are charged to the Fund.
Federal Income Tax Status
The Fund intends to qualify each year as a regulated investment company under Subchapter M of the Internal Revenue Code, as amended, and will distribute substantially all of its taxable income (including net short-term capital gains), if any, for its tax year, and as such will not be subject to federal income taxes. In addition, the Fund intends to distribute in each calendar year substantially all of its net investment income, capital gains and certain other amounts, if any, such that the Fund should not be subject to federal excise tax. Therefore, no federal income or excise tax provision is recorded.
Foreign Taxes
The Fund may be subject to foreign taxes on income, gains on investments or currency repatriation, a portion of which may be recoverable. The Fund will accrue such taxes and recoveries, as applicable, based upon its current interpretation of tax rules and regulations that exist in the markets in which it invests.
Realized gains in certain countries may be subject to foreign taxes at the Fund level, based on statutory rates. The Fund accrues for such foreign taxes on realized and unrealized gains at the appropriate rate for each jurisdiction, as applicable. The amount, if any, is disclosed as a liability on the Statement of Assets and Liabilities.
Distributions to Shareholders
Distributions from net investment income, if any, are declared and paid annually. Net realized capital gains, if any, are distributed along with the income distribution. Income distributions and capital gain distributions are determined in accordance with federal income tax regulations, which may differ from GAAP.
Guarantees and Indemnifications
Under the Trust’s organizational documents and, in some cases, by contract, its officers and trustees are indemnified against certain liabilities arising out of the performance of their duties to the Trust or its funds. In addition, certain of the Fund’s contracts with its service providers contain general indemnification clauses. The Fund’s maximum exposure under these arrangements is unknown since the amount of any future claims that may be made against the Fund cannot be determined, and the Fund has no historical basis for predicting the likelihood of any such claims.
Note 3. Fees and Other Transactions with Affiliates
Management Services Fees
Effective January 1, 2016, the Fund entered into a Management Agreement with Columbia Management Investment Advisers, LLC (the Investment Manager), a wholly-owned subsidiary of Ameriprise Financial, Inc. (Ameriprise Financial). Under the Management Agreement, the Investment Manager provides the Fund with investment research and advice, as well as administrative and accounting services. The Investment Manager is responsible for the ultimate oversight of investments made by the Fund. The Fund’s subadvisers (see Subadvisory Agreements below) have the primary
| | | | | | |
| | |
| | | | ACTIVE PORTFOLIOS® MULTI-MANAGER SMALL CAP EQUITY FUND | | |
NOTES TO FINANCIAL STATEMENTS (continued)
August 31, 2016
responsibility for the day-to-day portfolio management of their portion of the Fund. The management services fee is an annual fee that is equal to a percentage of the Fund’s average daily net assets that declines from 0.98% to 0.85% as the Fund’s net assets increase. Prior to January 1, 2016, the Fund paid the Investment Manager an annual fee for advisory services under an Investment Management Services Agreement and a separate annual fee for administrative and accounting services under an Administrative Services Agreement. The annualized effective management services fee rate for the year ended August 31, 2016 (reflecting all advisory and administrative services fees paid to the Investment Manager) was 0.91% of the Fund’s average daily net assets. For the period from September 1, 2015 through December 31, 2015, the investment advisory services fee paid to the Investment Manager was $3,830,983, and the administrative services fee paid to the Investment Manager was $349,312.
Subadvisory Agreement
The Investment Manager has entered into Subadvisory Agreements with Conestoga Capital Advisors, LLC, Dalton, Greiner, Hartman, Maher & Co., LLC (DGHM), EAM Investors, LLC and effective October 26, 2015, BMO Asset Management Corp., with each serving as a subadviser to the Fund. In addition, Real Estate Management Services Group, LLC provides advisory services with respect to REITs in DGHM’s sleeve of investments. New investments in the Fund, net of any redemptions, are allocated in accordance with the Investment Manager’s determination, subject to the oversight of the Fund’s Board. Each subadviser’s proportionate share of investments in the Fund will vary due to market fluctuations. The Investment Manager compensates each subadviser to manage the investment of the Fund’s assets.
Compensation of Board Members
Board members, who are not officers or employees of the Investment Manager or Ameriprise Financial, are compensated for their services to the Fund as disclosed in the Statement of Operations. These Board members may participate in a Deferred Compensation Plan (the Plan) which may be terminated at any time. Obligations of the Plan will be paid solely out of the Fund’s assets, and all amounts payable under the Plan constitute a general unsecured obligation of the Fund.
Compensation of Chief Compliance Officer
The Board has appointed a Chief Compliance Officer to the Fund in accordance with federal securities
regulations. The Fund is allocated a portion of the expenses associated with the Chief Compliance Officer based on relative net assets of the Trust.
Transfer Agency Fees
Under a Transfer and Dividend Disbursing Agent Agreement, Columbia Management Investment Services Corp. (the Transfer Agent), an affiliate of the Investment Manager and a wholly-owned subsidiary of Ameriprise Financial, is responsible for providing transfer agency services to the Fund. The Transfer Agent has contracted with Boston Financial Data Services (BFDS) to serve as sub-transfer agent. The Transfer Agent pays the fees of BFDS for services as sub-transfer agent and BFDS is not entitled to reimbursement for such fees from the Fund (with the exception of out-of-pocket fees).
The Fund pays the Transfer Agent a monthly transfer agency fee based on the number or the average value of accounts, depending on the type of account. In addition, prior to October 1, 2016, the Transfer Agent also received sub-transfer agency fees based on a percentage of the average aggregate value of the Fund’s shares maintained in omnibus accounts (other than omnibus accounts for which American Enterprise Investment Services Inc. is the broker of record or accounts where the beneficial shareholder is a customer of Ameriprise Financial Services, Inc., for which the Transfer Agent receives a per account fee). Effective October 1, 2016, the Fund pays the Transfer Agent a fee for shareholder services based on the number of accounts or on a percentage of the average aggregate value of the Fund’s shares maintained in omnibus accounts up to the lesser of the amount charged by the servicing agent or a cap established by the Board from time to time.
The Transfer Agent also receives compensation from the Fund for various shareholder services and reimbursements for certain out-of-pocket fees.
For the year ended August 31, 2016, the Fund’s effective transfer agency fee rates as a percentage of average daily net assets for Class A shares was 0.31%.
Distribution and Service Fees
The Fund has an agreement with Columbia Management Investment Distributors, Inc. (the Distributor), an affiliate of the Investment Manager and a wholly-owned subsidiary of Ameriprise Financial, for distribution and shareholder services. The Board has approved, and the Fund has adopted, distribution and shareholder service plans (the Plans) applicable to certain share classes, which set the distribution and service fees for the Fund.
| | | | | | |
| | |
| | | | ACTIVE PORTFOLIOS® MULTI-MANAGER SMALL CAP EQUITY FUND | | |
NOTES TO FINANCIAL STATEMENTS (continued)
August 31, 2016
These fees are calculated daily and are intended to compensate the Distributor and/or eligible selling and/or servicing agents for selling shares of the Fund and providing services to investors.
The Fund may pay distribution fee of up to 0.25% of the Fund’s average daily net assets attributable to Class A shares and a service fee of up to 0.25% of the Fund’s average daily net assets attributable to Class A shares, provided that the aggregate fee shall not exceed 0.25% of the Fund’s average daily net assets attributable to Class A shares.
Expenses Waived/Reimbursed by the Investment Manager and its Affiliates
The Fund’s expense ratio is subject to an expense reimbursement arrangement pursuant to which fees will be waived and/or expenses reimbursed (excluding certain fees and expenses described below), so that the Fund’s net operating expenses, after giving effect to fees waived/expenses reimbursed and any balance credits and/or overdraft charges from the Fund’s custodian, do not exceed the annual rates of:
| | | | | | | | |
| | | Contractual Expense Cap
January 1, 2016
Through
December 31, 2016 | | | Voluntary
Expense Cap
Prior to
January 1, 2016 | |
Class A | | | 1.38 | % | | | 1.38 | % |
The contractual agreement may be modified or amended only with approval from the Investment Manager, certain of its affiliates and the Fund. Under the arrangements, the following fees and expenses are excluded from the waiver/reimbursement commitment, and therefore will be paid by the Fund, if applicable: taxes (including foreign transaction taxes), expenses associated with investments in affiliated and non-affiliated pooled investment vehicles (including mutual funds and exchange-traded funds), transaction costs and brokerage commissions, costs related to any securities lending program, dividend and interest expenses associated with securities sold short, inverse floater program fees and expenses, transaction charges and interest on borrowed money, interest and infrequent and/or unusual expenses. Any fees waived and/or expenses reimbursed under the expense reimbursement arrangements described above are not recoverable by the Investment Manager or its affiliates in future periods.
Note 4. Federal Tax Information
The timing and character of income and capital gain distributions are determined in accordance with income
tax regulations, which may differ from GAAP because of temporary or permanent book to tax differences.
At August 31, 2016, these differences are primarily due to differing treatment for deferral/reversal of wash sale losses, Trustees’ deferred compensation, net operating loss reclassification, passive foreign investment company (PFIC) holdings, late-year ordinary losses. To the extent these differences are permanent, reclassifications are made among the components of the Fund’s net assets in the Statement of Assets and Liabilities. Temporary differences do not require reclassifications.
In the Statement of Assets and Liabilities the following reclassifications were made:
| | | | |
Excess of distributions over net investment income | | | $2,566,154 | |
Accumulated net realized loss | | | 23,722 | |
Paid-in capital | | | (2,589,876 | ) |
Net investment income (loss) and net realized gains (losses), as disclosed in the Statement of Operations, and net assets were not affected by this reclassification.
The tax character of distributions paid during the years indicated was as follows:
| | | | | | | | |
| Year Ended August 31, | | 2016 | | | 2015 | |
Ordinary income | | | $— | | | | $6,439,032 | |
Long-term capital gains | | | 28,524,836 | | | | 47,850,828 | |
Total | | | $28,524,836 | | | | $54,289,860 | |
Short-term capital gain distributions, if any, are considered ordinary income distributions for tax purposes.
At August 31, 2016, the components of distributable earnings on a tax basis were as follows:
| | | | |
Undistributed long-term capital gains | | | $2,625,348 | |
Net unrealized appreciation | | | 93,636,775 | |
At August 31, 2016, the cost of investments for federal income tax purposes was $860,828,200 and the aggregate gross unrealized appreciation and depreciation based on that cost was:
| | | | |
Unrealized appreciation | | | $116,566,754 | |
Unrealized depreciation | | | (22,929,979 | ) |
Net unrealized appreciation | | | $93,636,775 | |
Under current tax rules, regulated investment companies can elect to treat certain late-year ordinary losses
| | | | | | |
| | |
| | | | ACTIVE PORTFOLIOS® MULTI-MANAGER SMALL CAP EQUITY FUND | | |
NOTES TO FINANCIAL STATEMENTS (continued)
August 31, 2016
incurred and post-October capital losses (capital losses realized after October 31) as arising on the first day of the following taxable year. As of August 31, 2016, the Fund will elect to treat late-year ordinary losses of $633,453 as arising on September 1, 2016.
Management of the Fund has concluded that there are no significant uncertain tax positions in the Fund that would require recognition in the financial statements. However, management’s conclusion may be subject to review and adjustment at a later date based on factors including, but not limited to, new tax laws, regulations, and administrative interpretations (including relevant court decisions). Generally, the Fund’s federal tax returns for the prior three fiscal years remain subject to examination by the Internal Revenue Service.
Note 5. Portfolio Information
The cost of purchases and proceeds from sales of securities, excluding short-term investments and derivatives, if any, aggregated to $1,369,401,661 and $1,662,205,223, respectively, for the year ended August 31, 2016. The amount of purchase and sale activity impacts the portfolio turnover rate reported in the Financial Highlights.
Note 6. Affiliated Money Market Fund
The Fund invests in Columbia Short-Term Cash Fund, an affiliated money market fund established for the exclusive use by the Fund and other affiliated funds (the Affiliated MMF). The income earned by the Fund from such investments is included as Dividends — affiliated issuers in the Statement of Operations. As an investing fund, the Fund indirectly bears its proportionate share of the expenses of the Affiliated MMF. Effective October 1, 2016, the Affiliated MMF prices its shares with a floating net asset value (NAV) and no longer seeks to maintain a stable NAV. In addition, the Board of the Affiliated MMF may impose a fee on redemptions (sometimes referred to as a liquidity fee) or temporarily suspend redemptions (sometimes referred to as imposing a redemption gate) in the event its liquidity falls below regulatory limits.
Note 7. Line of Credit
The Fund has access to a revolving credit facility whereby the Fund may borrow for the temporary funding of shareholder redemptions or for other temporary or emergency purposes. Effective December 8, 2015, Citibank, N.A. and HSBC Bank USA, N.A. joined JPMorgan Chase Bank, N.A. (JPMorgan) as lead of a syndicate of banks under the credit facility, which is a collective agreement between the Fund and certain other funds
managed by the Investment Manager, severally and not jointly, that permits collective borrowings up to $1 billion. Interest is charged to each participating fund based on its borrowings at a rate equal to the higher of (i) the overnight federal funds rate plus 1.00% or (ii) the one-month LIBOR rate plus 1.00%. Each borrowing under the credit facility matures no later than 60 days after the date of borrowing. The Fund also pays a commitment fee equal to its pro rata share of the amount of the credit facility at a rate of 0.15% per annum. The commitment fee is included in other expenses in the Statement of Operations. Prior to December 8, 2015, JPMorgan was the sole lead bank under the credit facility agreement that permitted borrowings up to $550 million under the same terms and interest rates as described above with the exception of the commitment fee which was charged at a rate of 0.075% per annum.
The Fund had no borrowings during the year ended August 31, 2016.
Note 8. Significant Risks
Shareholder Concentration Risk
At August 31, 2016, affiliated shareholders of record owned 100.0% of the outstanding shares of the Fund in one or more accounts. Subscription and redemption activity by concentrated accounts may have a significant effect on the operations of the Fund. In the case of a large redemption, the Fund may be forced to sell investments at inopportune times, including its liquid or more liquid positions, resulting in Fund losses and the Fund holding a higher percentage of less liquid or illiquid securities. Large redemptions could result in decreased economies of scale and increased operating expenses for non-redeeming Fund shareholders.
Financial Sector Risk
The Fund may be more susceptible to the particular risks that may affect companies in the financial services sector than if it were invested in a wider variety of companies in unrelated sectors. Companies in the financial services sector are subject to certain risks, including the risk of regulatory change, decreased liquidity in credit markets and unstable interest rates. Such companies may have concentrated portfolios, such as a high level of loans to real estate developers, which makes them vulnerable to economic conditions that affect that industry. Performance of such companies may be affected by competitive pressures and exposure to investments or agreements that, under certain circumstances, may lead to losses (e.g., subprime loans). Companies in the financial services sector are
| | | | | | |
| | |
| | | | ACTIVE PORTFOLIOS® MULTI-MANAGER SMALL CAP EQUITY FUND | | |
NOTES TO FINANCIAL STATEMENTS (continued)
August 31, 2016
subject to extensive governmental regulation that may limit the amount and types of loans and other financial commitments they can make, and interest rates and fees that they may charge. In addition, profitability of such companies is largely dependent upon the availability and the cost of capital.
Note 9. Subsequent Events
Management has evaluated the events and transactions that have occurred through the date the financial statements were issued and noted no items requiring adjustment of the financial statements or additional disclosure.
Note 10. Information Regarding Pending and Settled Legal Proceedings
Ameriprise Financial and certain of its affiliates have historically been involved in a number of legal, arbitration and regulatory proceedings, including routine litigation, class actions, and governmental actions, concerning matters arising in connection with the conduct of their business activities. Ameriprise Financial believes that the Funds are not currently the subject of, and that neither Ameriprise Financial nor any of its affiliates are the subject of, any pending legal, arbitration or regulatory proceedings that are likely to have a material adverse effect on the Funds or the ability of Ameriprise Financial or its affiliates to perform under their contracts with the Funds. Ameriprise Financial is required to make quarterly (10-Q), annual (10-K) and, as necessary, 8-K filings with the Securities and Exchange Commission (SEC) on legal and regulatory matters that relate to Ameriprise Financial and its affiliates. Copies of these filings may be obtained by accessing the SEC website at www.sec.gov.
There can be no assurance that these matters, or the adverse publicity associated with them, will not result in increased fund redemptions, reduced sale of fund shares or other adverse consequences to the Funds. Further, although we believe proceedings are not likely to have a material adverse effect on the Funds or the ability of Ameriprise Financial or its affiliates to perform under their contracts with the Funds, these proceedings are subject to uncertainties and, as such, we are unable to estimate the possible loss or range of loss that may result. An adverse outcome in one or more of these proceedings could result in adverse judgments, settlements, fines, penalties or other relief that could have a material adverse effect on the consolidated financial condition or results of operations of Ameriprise Financial.
| | | | | | |
| | |
| | | | ACTIVE PORTFOLIOS® MULTI-MANAGER SMALL CAP EQUITY FUND | | |
REPORT OF INDEPENDENT REGISTERED PUBLIC ACCOUNTING FIRM
To the Trustees of Columbia Funds Series Trust I and the Shareholders of
Active Portfolios® Multi-Manager Small Cap Equity Fund
In our opinion, the accompanying statement of assets and liabilities, including the portfolio of investments, and the related statements of operations and of changes in net assets and the financial highlights present fairly, in all material respects, the financial position of Active Portfolios® Multi-Manager Small Cap Equity Fund (the “Fund,” a series of Columbia Funds Series Trust I) at August 31, 2016, and the results of its operations, the changes in its net assets and the financial highlights for each of the periods indicated, in conformity with accounting principles generally accepted in the United States of America. These financial statements and financial highlights (hereafter referred to as “financial statements”) are the responsibility of the Fund’s management. Our responsibility is to express an opinion on these financial statements based on our audits. We conducted our audits of these financial statements in accordance with the standards of the Public Company Accounting Oversight Board (United States). Those standards require that we plan and perform the audit to obtain reasonable assurance about whether the financial statements are free of material misstatement. An audit includes examining, on a test basis, evidence supporting the amounts and disclosures in the financial statements, assessing the accounting principles used and significant estimates made by management, and evaluating the overall financial statement presentation. We believe that our audits, which included confirmation of securities at August 31, 2016 by correspondence with the custodian, brokers and transfer agent, and the application of alternative auditing procedures where such confirmations had not been received, provide a reasonable basis for our opinion.
PricewaterhouseCoopers LLP
Minneapolis, MN
October 21, 2016
| | | | | | |
| | |
| | | | ACTIVE PORTFOLIOS® MULTI-MANAGER SMALL CAP EQUITY FUND | | |
FEDERAL INCOME TAX INFORMATION
(Unaudited)
The Fund hereby designates the following tax attributes for the fiscal year ended August 31, 2016. Shareholders will be notified in early 2017 of the amounts for use in preparing 2016 income tax returns.
Tax Designations
| | | | |
Capital Gain Dividend | | | $3,004,311 | |
Capital Gain Dividend. The Fund designates as a capital gain dividend the amount reflected above, or if subsequently determined to be different, the net capital gain of such fiscal period.
| | | | | | |
| | |
| | | | ACTIVE PORTFOLIOS® MULTI-MANAGER SMALL CAP EQUITY FUND | | |
TRUSTEES AND OFFICERS
Shareholders elect the Board that oversees the Fund’s operations. The Board appoints officers who are responsible for day-to-day business decisions based on policies set by the Board. The following table provides basic biographical information about the Fund’s Trustees, including their principal occupations during the past five years, although specific titles for individuals may have varied over the period. The year set forth beneath Length of Service in the table below is the year in which the Trustee was first appointed or elected as Trustee to any Fund currently in the Columbia Funds Complex or a predecessor thereof. Under current Board policy, members serve terms of indefinite duration.
Trustees
| | | | | | | | |
| Independent Trustees |
Name,
Address,
Year of Birth | | Position Held
with the Trust and
Length of Service | | Principal Occupation(s)
During the Past Five Years
and Other Relevant
Professional Experience | | Number of
Funds in the
Columbia Funds
Complex
Overseen | | Other Directorships
Held by Trustee
During the Past
Five Years |
Janet Langford Carrig c/o Columbia Management Investment Advisers, LLC, 225 Franklin Street Mail Drop BX32 05228, Boston, MA 02110 1957 | | Trustee 1996 | | Senior Vice President, General Counsel and Corporate Secretary, ConocoPhillips (integrated energy company) since September 2007 | | 56 | | None |
Douglas A. Hacker c/o Columbia Management Investment Advisers, LLC, 225 Franklin Street Mail Drop BX32 05228, Boston, MA 02110 1955 | | Trustee and Chairman of the Board 1996 | | Independent business executive since May 2006; Executive Vice President — Strategy of United Airlines from December 2002 to May 2006; President of UAL Loyalty Services (airline marketing company) from September 2001 to December 2002; Executive Vice President and Chief Financial Officer of United Airlines from July 1999 to September 2001 | | 56 | | Spartan Nash Company (food distributor); Nash Finch Company (food distributor) from 2005 to 2013; Aircastle Limited (aircraft leasing); SeaCube Container Leasing Ltd. (container leasing) from 2010 to 2013; and Travelport Worldwide Limited (travel information technology) |
Nancy T. Lukitsh c/o Columbia Management Investment Advisers, LLC, 225 Franklin Street Mail Drop BX32 05228, Boston, MA 02110 1956 | | Trustee 2011 | | Senior Vice President, Partner and Director of Marketing, Wellington Management Company, LLP (investment adviser) from 1997 to 2010; Chair, Wellington Management Portfolios (commingled non-U.S. investment pools) from 2007 to 2010; Director, Wellington Trust Company, NA and other Wellington affiliates from 1997 to 2010 | | 56 | | None |
William E. Mayer c/o Columbia Management Investment Advisers, LLC, 225 Franklin Street Mail Drop BX32 05228, Boston, MA 02110 1940 | | Trustee 1991 | | Partner, Park Avenue Equity Partners (private equity) since February 1999 | | 56 | | DynaVox Inc. (speech creation); Lee Enterprises (print media); WR Hambrecht + Co. (financial service provider) from 2000 to 2012; BlackRock Capital Investment Corporation (investment company); and Premier, Inc. (healthcare) |
| | | | | | |
| | |
| | | | ACTIVE PORTFOLIOS® MULTI-MANAGER SMALL CAP EQUITY FUND | | |
TRUSTEES AND OFFICERS (continued)
| | | | | | | | |
| Independent Trustees (continued) |
Name,
Address,
Year of Birth | | Position Held
with the Trust and
Length of Service | | Principal Occupation(s)
During the Past Five Years
and Other Relevant
Professional Experience | | Number of
Funds in the
Columbia Funds
Complex
Overseen | | Other Directorships
Held by Trustee
During the Past
Five Years |
David M. Moffett c/o Columbia Management Investment Advisers, LLC, 225 Franklin Street Mail Drop BX32 05228, Boston, MA 02110 1952 | | Trustee 2011 | | Retired. Consultant to Bridgewater and Associates | | 56 | | Director of CIT Bank, CIT Group Inc. (commercial and consumer finance); eBay Inc. (online trading community); Genworth Financial, Inc. (financial and insurance products and services); Paypal Holdings Inc. (payment and data processing services); and Trustee, University of Oklahoma Foundation |
Charles R. Nelson c/o Columbia Management Investment Advisers, LLC, 225 Franklin Street Mail Drop BX32 05228, Boston, MA 02110 1942 | | Trustee 1981 | | Retired. Professor Emeritus, University of Washington since 2011; Professor of Economics, University of Washington from 1976 to 2011; Ford and Louisa Van Voorhis Professor of Political Economy, University of Washington from 1993 to 2011; Adjunct Professor of Statistics, University of Washington from 1980 to 2011; Associate Editor, Journal of Money, Credit and Banking from September 1993 to 2008; consultant on econometric and statistical matters | | 56 | | None |
John J. Neuhauser c/o Columbia Management Investment Advisers, LLC, 225 Franklin Street Mail Drop BX32 05228, Boston, MA 02110 1943 | | Trustee 1984 | | President, Saint Michael’s College since August 2007; Director or Trustee of several non-profit organizations, including University of Vermont Medical Center; Academic Vice President and Dean of Faculties, Boston College from August 1999 to October 2005; University Professor, Boston College from November 2005 to August 2007 | | 56 | | Liberty All-Star Equity Fund and Liberty All-Star Growth Fund (closed-end funds) |
Patrick J. Simpson c/o Columbia Management Investment Advisers, LLC, 225 Franklin Street Mail Drop BX32 05228, Boston, MA 02110 1944 | | Trustee 2000 | | Of Counsel, Perkins Coie LLP (law firm) since 2015; Partner, Perkins Coie LLP from 1988 to 2014 | | 56 | | None |
Anne-Lee Verville c/o Columbia Management Investment Advisers, LLC, 225 Franklin Street Mail Drop BX32 05228, Boston, MA 02110 1945 | | Trustee 1998 | | Retired. General Manager, Global Education Industry from 1994 to 1997, President — Application Systems Division from 1991 to 1994, Chief Financial Officer — US Marketing & Services from 1988 to 1991, and Chief Information Officer from 1987 to 1988, IBM Corporation (computer and technology) | | 56 | | Enesco Group, Inc. (producer of giftware and home and garden decor products) from 2001 to 2006 |
| | | | | | |
| | |
| | | | ACTIVE PORTFOLIOS® MULTI-MANAGER SMALL CAP EQUITY FUND | | |
TRUSTEES AND OFFICERS (continued)
| | | | | | | | |
| Consultant to the Trustees* |
Name,
Address,
Year of Birth | | Position Held
with the Trust and
Length of Service | | Principal Occupation(s)
During the Past Five Years
and Other Relevant
Professional Experience | | Number of
Funds in the
Columbia Funds
Complex
Overseen | | Other Directorships
Held by Trustee
During the Past
Five Years |
J. Kevin Connaughton c/o Columbia Management Investment Advisers, LLC, 225 Franklin Street Mail Drop BX32 05228, Boston, MA 02110 1964 | | Trustee Consultant 2016 | | Trustee Consultant, Columbia Funds since March 2016; Managing Director and General Manager of Mutual Fund Products, Columbia Management Investment Advisers, LLC from May 2010 to February 2015; President, Columbia Funds from 2009 to 2015; and senior officer of Columbia Funds and affiliated funds from 2003 to 2015 | | 56 | | Board of Governors, Gateway Healthcare since January 2016; Trustee, New Century Portfolios since March 2015; and Director, The Autism Project since March 2015 |
| * | J. Kevin Connaughton was appointed consultant to the Trustees effective March 1, 2016. Shareholders of the Funds are expected to be asked to elect Mr. Connaughton as a Trustee at a future shareholder meeting. |
| | | | | | | | |
| Interested Trustee Affiliated with Investment Manager* |
Name,
Address,
Year of Birth | | Position Held
with the Trust and
Length of Service | | Principal Occupation(s)
During the Past Five Years
and Other Relevant
Professional Experience | | Number of
Funds in the
Columbia Funds
Complex
Overseen | | Other Directorships
Held by Trustee
During the Past
Five Years |
William F. Truscott c/o Columbia Management Investment Advisers, LLC, 225 Franklin Street Boston, MA 02110 1960 | | Trustee 2012 | | Chairman of the Board and President, Columbia Management Investment Advisers, LLC since May 2010 and February 2012, respectively; Chief Executive Officer, Global Asset Management, Ameriprise Financial, Inc. since September 2012 (previously Chief Executive Officer, U.S. Asset Management & President, Annuities, May 2010-September 2012); Director and Chief Executive Officer, Columbia Management Investment Distributors, Inc. since May 2010 and February 2012, respectively; Chairman of the Board and Chief Executive Officer, RiverSource Distributors, Inc. since 2006; Director, Threadneedle Asset Management Holdings, SARL since 2014; President and Chief Executive Officer, Ameriprise Certificate Company, 2006-August 2012. | | 184 | | Trustee to other Columbia Funds since 2001; Chairman of the Board, Columbia Management Investment Advisers, LLC since May 2010; Director, Columbia Management Investment Distributors, Inc. since May 2010; Former Director, Ameriprise Certificate Company, 2006-January 2013 |
| * | Interested person (as defined under the 1940 Act) by reason of being an officer, director, security holder and/or employee of the Investment Manager or Ameriprise Financial. |
The Statement of Additional Information has additional information about the Fund’s Board members and is available, without charge, upon request by calling 800.345.6611; contacting your financial intermediary; or visiting investor.columbiathreadneedleus.com.
| | | | | | |
| | |
| | | | ACTIVE PORTFOLIOS® MULTI-MANAGER SMALL CAP EQUITY FUND | | |
TRUSTEES AND OFFICERS (continued)
The Board has appointed officers who are responsible for day-to-day business decisions based on policies it has established. The officers serve at the pleasure of the Board. The following table provides basic information about the Officers of the Fund, including principal occupations during the past five years, although their specific titles may have varied over the period. In addition to Mr. Truscott, who is Senior Vice President, the Fund’s other officers are:
| | | | |
| Fund Officers |
Name, Address and
Year of Birth | | Position and Year
First Appointed to
Position for any Fund
in the Columbia
Funds Complex or a
Predecessor Thereof | | Principal Occupation(s) During Past Five Years |
Christopher O. Petersen 5228 Ameriprise Financial Center Minneapolis, MN 55474 Born 1970 | | President and Principal Executive Officer (2015) | | Vice President and Lead Chief Counsel, Ameriprise Financial, Inc. since January 2015 (previously, Vice President and Chief Counsel January 2010-December 2014); officer of Columbia Funds and affiliated funds since 2007. |
Michael G. Clarke 225 Franklin Street Boston, MA 02110 Born 1969 | | Treasurer (2011), Chief Financial Officer (2009) and Chief Accounting Officer (2015) | | Vice President — Mutual Fund Administration, Columbia Management Investment Advisers, LLC, since May 2010; senior officer of Columbia Funds and affiliated funds since 2002. |
Paul B. Goucher 100 Park Avenue New York, NY 10017 Born 1968 | | Senior Vice President (2011), Chief Legal Officer (2015) and Assistant Secretary (2008) | | Vice President and Lead Chief Counsel, Ameriprise Financial, Inc. since November 2008 and January 2013, respectively (previously Chief Counsel, January 2010-January 2013); Vice President, Chief Legal Officer and Assistant Secretary, Columbia Management Investment Advisers, LLC since May 2010. |
Thomas P. McGuire 225 Franklin Street Boston, MA 02110 Born 1972 | | Senior Vice President and Chief Compliance Officer (2012) | | Vice President — Asset Management Compliance, Ameriprise Financial, Inc., since May 2010; Chief Compliance Officer, Ameriprise Certificate Company since September 2010. |
Colin Moore 225 Franklin Street Boston, MA 02110 Born 1958 | | Senior Vice President (2010) | | Executive Vice President and Global Chief Investment Officer, Ameriprise Financial, Inc., since July 2013; Executive Vice President and Global Chief Investment Officer, Columbia Management Investment Advisers, LLC since July 2013 (previously Director and Global Chief Investment Officer, 2010-2013). |
Michael E. DeFao 225 Franklin Street Boston, MA 02110 Born 1968 | | Vice President (2011) and Assistant Secretary (2010) | | Vice President and Chief Counsel, Ameriprise Financial, Inc. since May 2010. |
Amy Johnson 5228 Ameriprise Financial Center Minneapolis, MN 55474 Born 1965 | | Vice President (2006) | | Managing Director and Global Head of Operations, Columbia Management Investment Advisers, LLC since April 2016 (previously Managing Director and Chief Operating Officer, 2010-2016). |
Lyn Kephart-Strong 5228 Ameriprise Financial Center Minneapolis, MN 55474 Born 1960 | | Vice President (2015) | | President, Columbia Management Investment Services Corp. since October 2014; Vice President & Resolution Officer, Ameriprise Trust Company since August 2009. |
Ryan C. Larrenaga 225 Franklin Street Boston, MA 02110 Born 1970 | | Vice President and Secretary (2015) | | Vice President and Group Counsel, Ameriprise Financial, Inc. since August 2011; officer of Columbia Funds and affiliated funds since 2005. |
| | | | | | |
| | |
| | | | ACTIVE PORTFOLIOS® MULTI-MANAGER SMALL CAP EQUITY FUND | | |
BOARD CONSIDERATION AND APPROVAL OF MANAGEMENT AGREEMENT AND SUBADVISORY AGREEMENTS
On June 10, 2016, the Board of Trustees (the Board) and the Trustees who are not interested persons (as defined in the Investment Company Act of 1940) (the Independent Trustees) of Columbia Funds Series Trust I (the Trust) unanimously approved the continuation of the Management Agreement (the Management Agreement) with Columbia Management Investment Advisers, LLC (the Investment Manager) and the Subadvisory Agreements (the Subadvisory Agreements) between the Investment Manager and BMO Asset Management Corp., Conestoga Capital Advisors, LLC, Dalton, Greiner, Hartman, Maher & Co., LLC and EAM Investors, LLC (the Subadvisers) with respect to Active Portfolios® Multi-Manager Small Cap Equity Fund (the Fund), a series of the Trust. As detailed below, the Board’s Advisory Fees and Expenses Committee (the Committee) and the Board met on multiple occasions to review and discuss, both among themselves and with the management team of the Investment Manager, materials provided by the Investment Manager and others before determining to approve the continuation of the Management Agreement and the Subadvisory Agreements (collectively, the Agreements).
In connection with their deliberations regarding the continuation of the Management Agreement and the Subadvisory Agreements, the Committee and the Board evaluated materials requested from the Investment Manager regarding the Fund and the Agreements, and discussed these materials with representatives of the Investment Manager at Committee meetings held on March 8, 2016, April 27, 2016 and June 9, 2016 and at Board meetings held on March 9, 2016 and June 10, 2016. In addition, the Board considers matters bearing on the Agreements at most of its other meetings throughout the year and meets regularly with senior management of the Trust and the Investment Manager. Through the Board’s Investment Oversight Committees, Trustees also meet with selected portfolio managers of the funds the Trustees oversee and other investment personnel at various times throughout the year. The Committee and the Board also consulted with its independent fee consultant, Fund counsel and with the Independent Trustees’ independent legal counsel, who advised on various matters with respect to the Committee’s and the Board’s considerations and otherwise assisted the Committee and the Board in their deliberations. On June 9, 2016, the Committee recommended that the Board approve the continuation of the Management Agreement and the Subadvisory Agreements. On June 10, 2016, the Board, including the Independent Trustees, voting separately, unanimously approved the continuation of the Management Agreement and the Subadvisory Agreements for the Fund.
The Committee and the Board considered all information that they, their legal counsel or the Investment Manager believed reasonably necessary to evaluate and to determine whether to recommend for approval or approve the continuation of the Management Agreement and the Subadvisory Agreements. The information and factors considered by the Committee and the Board in recommending for approval or approving the continuation of the Management Agreement and the Subadvisory Agreements for the Fund included the following:
| • | | Information on the investment performance of the Fund relative to the performance of a group of mutual funds determined to be comparable to the Fund by an independent third-party data provider, as well as performance relative to benchmarks; |
| • | | Information on the Fund’s management fees and total expenses, including information comparing the Fund’s expenses to those of a group of comparable mutual funds, as determined by the independent third-party data provider; |
| • | | The Investment Manager’s agreement to contractually limit or cap total operating expenses for the Fund through December 31, 2017 so that total operating expenses (excluding certain fees and expenses, such as transaction costs and certain other investment related expenses, interest, taxes, acquired fund fees and expenses, and infrequent and/or unusual expenses) would not exceed a specified annual rate, as a percentage of the Fund’s net assets; |
| • | | The terms and conditions of the Agreements; |
| • | | The subadvisory fees to be charged to the Investment Manager under the Subadvisory Agreements; |
| • | | The current and proposed terms and conditions of other agreements and arrangements with affiliates of the Investment Manager relating to the operations of the Fund, including agreements with respect to the provision of distribution and transfer agency services to the Fund; |
| • | | Descriptions of various functions performed by the Investment Manager and the Subadvisers under the Agreements, including portfolio management and portfolio trading practices; |
| | | | | | |
| | |
| | | | ACTIVE PORTFOLIOS® MULTI-MANAGER SMALL CAP EQUITY FUND | | |
BOARD CONSIDERATION AND APPROVAL OF MANAGEMENT AGREEMENT AND SUBADVISORY AGREEMENTS (continued)
| • | | Information regarding the management fees of similarly-managed portfolios of other clients of the Investment Manager, including institutional separate accounts; |
| • | | Information regarding the reputation, regulatory history and resources of the Investment Manager and Subadvisers, including information regarding senior management, portfolio managers and other personnel; |
| • | | Information regarding the capabilities of the Investment Manager with respect to compliance monitoring services, including an assessment of the Investment Manager’s and the Subadvisers’ compliance systems by the Fund’s Chief Compliance Officer; and |
| • | | The profitability to the Investment Manager and its affiliates from their relationships with the Fund. |
Nature, Extent and Quality of Services Provided under the Agreements
The Committee and the Board considered the nature, extent and quality of services provided to the Fund by the Investment Manager, the Subadvisers and the Investment Manager’s affiliates under the Agreements and under separate agreements for the provision of transfer agency services, and the resources dedicated to the Fund and the other Columbia Funds by the Investment Manager, the Subadvisers and the Investment Manager’s affiliates. The Committee and the Board considered, among other things, the Investment Manager’s ability to attract, motivate and retain highly qualified research, advisory and supervisory investment professionals (including personnel and other resources, compensation programs for personnel involved in fund management, reputation and other attributes), the portfolio management services provided by those investment professionals, and the quality of the Investment Manager’s investment research capabilities and trade execution services. The Committee and the Board also considered the potential benefits to shareholders of investing in a mutual fund that is part of a fund complex offering exposure to a variety of asset classes and investment disciplines and providing a variety of fund and shareholder services.
The Committee and the Board also considered the professional experience and qualifications of the senior personnel of the Investment Manager and the Subadvisers, which included consideration of the Investment Manager’s and the Subadvisers’ experience with similarly-structured funds. The Committee and the Board noted the compliance programs of and the compliance-related resources provided to the Fund by the Investment Manager and its affiliates, and considered the Investment Manager’s ability to provide administrative services to the Fund and coordinate the activities of the Fund’s other service providers. The Board also noted that the Board had approved the Subadvisers’ codes of ethics and compliance programs, and that the Chief Compliance Officer of the Funds reports to the Trustees on the Subadvisers’ compliance programs.
The Committee and the Board considered the diligence and selection process undertaken by the Investment Manager to select the Subadvisers, including the Investment Manager’s rationale for recommending the continuation of the Subadvisory Agreements, and the process for monitoring the Subadvisers’ ongoing performance of services for the Fund. As part of these deliberations, the Committee and the Board considered the ability of the Investment Manager, subject to the approval of the Board, to modify or enter into new subadvisory agreements without a shareholder vote pursuant to an exemptive order of the Securities and Exchange Commission. The Committee and the Board also considered the scope of services provided to the Fund by the Investment Manager that are distinct from and in addition to those provided by the Subadvisers, including cash flow management, treasury services, risk oversight, investment oversight and Subadviser selection, oversight and transition management. After reviewing these and related factors, the Committee and the Board concluded, within the context of their overall conclusions, that the nature, extent and quality of the services provided to the Fund under the Agreements supported the continuation of the Management Agreement and the Subadvisory Agreements.
Investment Performance
The Committee and the Board reviewed information about the performance of the Fund over various time periods, including performance information relative to benchmarks and information based on reports of the independent third-party data provider that compared the performance of the Fund to the performance of a group of comparable mutual funds, and data provided by the independent fee consultant. The Committee and the Board also reviewed a description of the third party’s methodology for identifying the Fund’s peer groups for purposes of performance and expense
| | | | | | |
| | |
| | | | ACTIVE PORTFOLIOS® MULTI-MANAGER SMALL CAP EQUITY FUND | | |
BOARD CONSIDERATION AND APPROVAL OF MANAGEMENT AGREEMENT AND SUBADVISORY AGREEMENTS (continued)
comparisons. Although the Fund’s performance lagged that of a relevant peer group for certain (although not necessarily all) periods, the Committee and the Board concluded that other factors relevant to performance were sufficient, in light of other considerations, to warrant continuation of the Management Agreement and the Subadvisory Agreements. Those factors included one or more of the following: (i) that the Fund’s performance, although lagging in certain recent periods, was stronger over the longer term; (ii) that the underperformance was attributable, to a significant extent, to investment decisions that were reasonable and consistent with the Fund’s investment strategy and policies and that the Fund was performing within a reasonable range of expectations, given those investment decisions, market conditions and the Fund’s investment strategy; (iii) that the Fund’s performance was competitive when compared to other relevant performance benchmarks or peer groups; and (iv) that the Investment Manager had taken or was taking steps designed to help improve the Fund’s investment performance, including, but not limited to, replacing portfolio managers, enhancing the resources supporting the portfolio managers, or modifying investment strategies.
The Committee and the Board noted that, through December 31, 2015, the Fund’s performance was in the thirty-eighth and sixtieth percentile (where the best performance would be in the first percentile) of its category selected by the independent third-party data provider for the purposes of performance comparisons for the one- and three-year periods, respectively.
The Committee and the Board also considered the Investment Manager’s performance and reputation generally, the Investment Manager’s historical responsiveness to Board concerns about performance, and the Investment Manager’s willingness to take steps intended to improve performance. After reviewing these and related factors, the Committee and the Board concluded, within the context of their overall conclusions, that the performance of the Fund, the Investment Manager and the Subadvisers were sufficient, in light of other considerations, to warrant the continuation of the Management Agreement and the Subadvisory Agreements.
Investment Management Fee Rates and Other Expenses
The Committee and the Board considered the management fees charged to the Fund under the Management Agreement and the Subadvisory Agreements, as well as the total expenses incurred by the Fund. In assessing the reasonableness of the fees under the Management Agreement, the Committee and the Board considered, among other information, the Fund’s management fee and its total expense ratio as a percentage of average daily net assets. The Committee and the Board considered data provided by the independent fee consultant. The Committee and the Board noted that, as of December 31, 2015, the Fund’s actual management fee and net total expense ratio are ranked in the second and third quintiles, respectively, (where the lowest fees and expenses would be in the first quintile) against the Fund’s expense universe as determined by the independent third-party data provider for purposes of expense comparison. The Committee and the Board also considered the fees that the Subadvisers charge to their other clients, and noted that the Investment Manager pays the fees of the Subadvisers. The Committee and the Board also took into account the fee waiver and expense limitation arrangements agreed to by the Investment Manager, as noted above.
The Committee and the Board also received and considered information about the management fees charged by the Investment Manager to institutional separate accounts. In considering the fees charged to those accounts, the Committee and the Board took into account, among other things, the Investment Manager’s representations about the differences between managing mutual funds as compared to other types of accounts, including differences in the services provided, differences in the risk profile of such business for the Investment Manager and the additional resources required to manage mutual funds effectively. The Committee and the Board received and considered information about the fees charged by the Investment Manager for sub-advisory services provided to comparable unaffiliated funds. In evaluating the Fund’s management fees, the Committee and the Board also took into account the demands, complexity and quality of the investment management of the Fund.
After reviewing these and related factors, the Committee and the Board concluded, within the context of their overall conclusions, that the management fee rates and expenses of the Fund were sufficient, in light of other considerations, to warrant the continuation of the Management Agreement and the Subadvisory Agreements.
| | | | | | |
| | |
| | | | ACTIVE PORTFOLIOS® MULTI-MANAGER SMALL CAP EQUITY FUND | | |
BOARD CONSIDERATION AND APPROVAL OF MANAGEMENT AGREEMENT AND SUBADVISORY AGREEMENTS (continued)
Costs of Services Provided and Profitability
The Committee and the Board also took note of the costs the Investment Manager and its affiliates incur in connection with the services provided (both on an absolute and relative basis) and the profitability to the Investment Manager and its affiliates in connection with their relationships with the Fund.
The Committee and the Board also considered the compensation directly or indirectly received by the Investment Manager’s affiliates in connection with their relationships with the Fund. The Committee and the Board reviewed information provided by management as to the profitability to the Investment Manager and its affiliates of their relationships with the Fund, information about the allocation of expenses used to calculate profitability, and comparisons of profitability levels realized in 2015 to profitability levels realized in 2014. When reviewing profitability, the Committee and the Board also considered court cases in which adviser profitability was an issue in whole or in part, the performance of similarly managed funds, the performance of the Fund, and the expense ratio of the Fund. In addition, the Committee and the Board considered information provided by the Investment Manager regarding its financial condition and comparing its profitability to that of other asset management firms that are, or are subsidiaries of, publicly traded companies. Because the Subadvisory Agreements were negotiated at arms-length by the Investment Manager, which is responsible for payments to the Subadvisers thereunder, the Committee and the Board did not consider the profitability to each Subadviser of its relationship with the Fund.
After reviewing these and related factors, the Committee and the Board concluded, within the context of their overall conclusions, that the costs of services provided and the profitability to the Investment Manager and its affiliates from their relationships with the Fund supported the continuation of the Management Agreement and the Subadvisory Agreements.
Economies of Scale
The Committee and the Board considered the potential existence of economies of scale in the provision by the Investment Manager of services to the Fund, to groups of related funds, and to the Investment Manager’s investment advisory clients as a whole, and whether those economies of scale were shared with the Fund through breakpoints in investment management fees or other means, such as expense limitation arrangements and additional investments by the Investment Manager in investment, trading and compliance resources. The Committee and the Board noted that the management fee schedules for the Fund contained breakpoints that would reduce the fee rate on assets above specified threshold levels.
The Committee and the Board noted that the breakpoints, if any, in the Subadvisory Agreements did not occur at the same levels as the breakpoints in the Management Agreement. The Committee and the Board noted that absent a shareholder vote, the Investment Manager would bear any increase in fees payable under the Subadvisory Agreements. The Committee and the Board also noted the potential challenges of seeking to tailor the Management Agreement breakpoints to those of a subadvisory agreement in this context, and the effect that capacity constraints on a subadviser’s ability to manage assets could potentially have on the ability of the Investment Manager to achieve economies of scale, as new subadvisers may need to be added as the Fund grows, increasing the Investment Manager’s cost of compensating and overseeing the Fund’s subadvisers.
In considering these matters, the Committee and the Board also considered the costs of the services provided and the profitability to the Investment Manager and its affiliates from their relationships with the Fund, as discussed above. After reviewing these and related factors, the Committee and the Board concluded, within the context of their overall conclusions, that the extent to which any economies of scale were expected to be shared with the Fund supported the continuation of the Management Agreement and the Subadvisory Agreements.
Other Benefits to the Investment Manager
The Committee and the Board received and considered information regarding “fall-out” or ancillary benefits received by the Investment Manager and its affiliates as a result of their relationships with the Fund, such as the engagement of the Investment Manager’s affiliates to provide distribution and transfer agency services to the Fund. In this regard, among other matters, the Committee and the Board considered that the Fund’s distributor retains a portion of the distribution fees from the Fund and receives a portion of the sales charges on sales or redemptions of certain classes
| | | | | | |
| | |
| | | | ACTIVE PORTFOLIOS® MULTI-MANAGER SMALL CAP EQUITY FUND | | |
BOARD CONSIDERATION AND APPROVAL OF MANAGEMENT AGREEMENT AND SUBADVISORY AGREEMENTS (continued)
of shares of the Fund. The Committee and the Board also considered the benefits of research made available to the Investment Manager by reason of brokerage commissions generated by the Fund’s securities transactions, and reviewed information about the Investment Manager’s practices with respect to allocating portfolio transactions for brokerage and research services. The Committee and the Board considered the possible conflicts of interest associated with certain fall-out or other ancillary benefits and the reporting, disclosure and other processes that are in place to address such possible conflicts of interest. The Committee and the Board recognized that the Investment Manager’s profitability would be somewhat lower without these benefits.
Conclusion
The Committee and the Board reviewed all of the above considerations in reaching their decisions to recommend or approve the continuation of the Management Agreement and the Subadvisory Agreements. In their deliberations, the Trustees did not identify any particular information that was all-important or controlling, and individual Trustees may have attributed different weights to the various factors. Based on their evaluation of all factors that they deemed to be material, including those factors described above, and assisted by the advice of independent legal counsel, the Board, including the Independent Trustees, voting separately, unanimously approved the continuation of the Management Agreement and the Subadvisory Agreements.
| | | | | | |
| | |
| | | | ACTIVE PORTFOLIOS® MULTI-MANAGER SMALL CAP EQUITY FUND | | |
BOARD CONSIDERATION AND APPROVAL OF SUBADVISORY AGREEMENT
On October 20, 2015, the Board of Trustees (the “Board”) and the Trustees who are not interested persons (as defined in the Investment Company Act of 1940) (the “Independent Trustees”) of Columbia Funds Series Trust I (the “Trust”) unanimously approved, for an initial two-year term, the Subadvisory Agreement (the “Subadvisory Agreement”) between Columbia Management Investment Advisers, LLC (the “Investment Manager”) and BMO Asset Management Corp. (“BMO”) with respect to Active Portfolios® Multi-Manager Small Cap Equity Fund (the “Fund”), a series of the Trust. The Board noted its considerations at meetings held in connection with the continuation of the Investment Management Services Agreement (the “Advisory Agreement”) and the Subadvisory Agreements between the Investment Manager and Conestoga Capital Advisors, LLC, Dalton, Greiner, Hartman, Maher & Co. LLC, and EAM Investors, LLC, each with respect to the Fund, as well as its considerations in approving an agreement (the “Management Agreement”) combining the Advisory Agreement and the Fund’s existing administrative services agreement (the “Administrative Services Agreement”) in a single agreement to be effective for the Fund on January 1, 2016.
In connection with its deliberations regarding the proposed Subadvisory Agreement, the Board requested and evaluated materials from the Investment Manager and others regarding the Fund and the Subadvisory Agreement, and discussed these materials with representatives of the Investment Manager at the Board meeting held on October 20, 2015. The Board also consulted with Fund counsel and with the Independent Trustees’ independent legal counsel, who advised on various matters with respect to the Board’s considerations and otherwise assisted the Board in its deliberations. As part of these deliberations, the Board considered the ability of the Investment Manager, subject to the approval of the Board, to modify or enter into new subadvisory agreements without a shareholder vote pursuant to an exemptive order of the Securities and Exchange Commission.
The Board considered all information that the Board, its legal counsel or the Investment Manager believed reasonably necessary to evaluate and to determine whether to approve the Subadvisory Agreement. The information and factors considered by the Board in approving the Subadvisory Agreement included the following:
| • | | The terms and conditions of the Subadvisory Agreement; |
| • | | Information regarding the reputation, regulatory history and resources of the Subadviser, including information regarding senior management, portfolio managers and other personnel of the Subadviser; |
| • | | Information regarding the capabilities of the Subadviser with respect to compliance monitoring services, including an assessment of the Subadviser’s compliance system by the Fund’s Chief Compliance Officer; |
| • | | The subadvisory fees to be charged to the Investment Manager under the Subadvisory Agreement; |
| • | | The Investment Manager’s agreement to contractually limit or cap total operating expenses for the Fund so that total operating expenses (excluding certain fees and expenses, such as portfolio transaction costs and certain other investment related expenses, interest, taxes, acquired fund fees and expenses, and extraordinary expenses) would not exceed a specified percentage of the Fund’s average annual net assets from January 1, 2016 through December 31, 2016; and |
| • | | Descriptions of various functions performed by the Subadviser under the Subadvisory Agreement, including portfolio management and portfolio trading practices. |
Nature, Extent and Quality of Services Provided under the Subadvisory Agreement
The Board considered the nature, extent and quality of services to be provided to the Fund by the Subadviser under the Subadvisory Agreement, and the resources dedicated to the Fund by the Subadviser. The Board considered, among other things, the Subadviser’s ability to attract, motivate and retain highly qualified research, advisory and supervisory investment professionals (including personnel and other resources, reputation and other attributes), the portfolio management services provided by those investment professionals, and the quality of the Subadviser’s investment research capabilities.
The Board also considered the professional experience and qualifications of the senior personnel of the Subadviser, which included consideration of the Subadviser’s experience with similarly-structured accounts, and the ability of the Subadviser to accommodate the significant increase in its assets under management to be represented by the Fund. The Board noted the compliance program of the Subadviser and reviewed its code of ethics. In evaluating the
| | | | | | |
| | |
| | | | ACTIVE PORTFOLIOS® MULTI-MANAGER SMALL CAP EQUITY FUND | | |
BOARD CONSIDERATION AND APPROVAL OF SUBADVISORY AGREEMENT (continued)
nature, extent and quality of services provided under the Subadvisory Agreement, the Board considered that these services were provided to the Fund, rather than directly to Fund shareholders. The Board accordingly affirmed, after considering various other matters, including the potential benefits to the Fund and its shareholders of the Independent Trustees’ important role as pre-suit gatekeepers with respect to claims that they may determine are meritless or contrary to the Fund’s best interests, that it was not the intention of the Board or the Investment Manager that there be any third-party beneficiaries of the Subadvisory Agreement.
The Board also considered the diligence and selection process undertaken by the Investment Manager to select the Subadviser. After reviewing these and related factors, the Board concluded, within the context of its overall conclusions, that the nature, extent and quality of the services provided to the Fund under the Subadvisory Agreement supported the approval of the Subadvisory Agreement.
Investment Performance
The Board reviewed information about the performance of the Fund over various time periods, including performance information relative to benchmarks and information based on reports of the independent third-party data provider that compared the performance of the Fund to the performance of a group of comparable mutual funds. The Board noted that, through September 30, 2015, the Fund’s performance was in the 49th percentile and the 50th percentile (where the best performance would be in the first percentile) of its category selected by the independent third-party data provider for the purposes of performance comparisons for the one- and three-year periods, respectively.
The Board considered the Subadviser’s performance and reputation generally. The Board also considered the Subadviser’s investment performance, including its absolute and risk-adjusted returns, noting that the Subadviser had delivered strong performance results over the one-, three- and five-year periods for its Disciplined Small-Cap Value Strategy, using a strategy substantially similar to that proposed for its sleeve of the Fund. After reviewing these and related factors, the Board concluded, within the context of its overall conclusions, that the anticipated performance of the sleeve managed by the Subadviser supported approval of the Subadvisory Agreement.
Subadvisory Fee Rates and Other Expenses
The Board considered the subadvisory fees to be charged to the Fund under the Subadvisory Agreement, and the total expenses to be incurred by the Fund. The Board also considered the fees that the Subadviser charges to its other clients, and noted that the Investment Manager pays the fees of the Subadvisers.
After reviewing these and related factors, the Board concluded, within the context of its overall conclusions, that the subadvisory fee rates and expenses of the Fund were sufficient, in light of other considerations, to warrant the approval of the Subadvisory Agreement.
Costs of Services Provided and Profitability
The Board noted that in relation to its review of the Subadvisory Agreement, it had considered information provided by the Investment Manager with respect to estimated costs of services and profitability. When reviewing profitability, the Board also considered court cases in which adviser profitability was an issue in whole or in part, the performance of similarly managed funds, the performance of the Fund, and the expense ratio of the Fund. Because the Subadvisory Agreement was negotiated at arms-length by the Investment Manager, which is responsible for payments to the Subadviser, the Board did not consider the profitability to the Subadviser of its relationship with the Fund.
After reviewing these and related factors, the Board concluded, within the context of its overall conclusions, that the costs of services provided and the profitability to the Investment Manager and its affiliates from their relationships with the Fund supported the approval of the Subadvisory Agreement.
Economies of Scale
The Board considered the potential existence of economies of scale in the provision by the Investment Manager of services to the Fund, to groups of related funds, and to the Investment Manager’s investment advisory clients as a whole, and whether those economies of scale were shared with the Fund through breakpoints in investment advisory fees or other means, such as expense limitation arrangements and additional investments by the Investment Manager
| | | | | | |
| | |
| | | | ACTIVE PORTFOLIOS® MULTI-MANAGER SMALL CAP EQUITY FUND | | |
BOARD CONSIDERATION AND APPROVAL OF SUBADVISORY AGREEMENT (continued)
in investment, trading and compliance resources. The Board noted that the investment advisory, management fee, and subadvisory fee schedules for the Fund contained breakpoints that would reduce the fee rate on assets above specified threshold levels.
The Board noted that the breakpoints in the Management Agreement did not occur at the same levels as the breakpoints in the Subadvisory Agreement. The Board noted that absent a shareholder vote, the Investment Manager would bear any increase in fees payable under the Subadvisory Agreement. The Board also noted the potential challenges of seeking to tailor the Management Agreement breakpoints to those of a subadvisory agreement in this context, and the effect that capacity constraints on a subadviser’s ability to manage assets could potentially have on the ability of the Investment Manager to achieve economies of scale, as new subadvisers may need to be added as the Fund grows, increasing the Investment Manager’s cost of compensating and overseeing the Fund’s subadvisers.
In considering these matters, the Board also considered the costs of the services provided and the profitability to the Investment Manager and its affiliates from their relationships with the Fund, as discussed above. After reviewing these and related factors, the Board concluded, within the context of its overall conclusions, that the extent to which any economies of scale were expected to be shared with the Fund supported the approval of the Subadvisory Agreement.
Conclusion
The Board reviewed all of the above considerations in reaching its decision to recommend or approve the proposed Subadvisory Agreement. In its deliberations, the Trustees did not identify any particular information that was all-important or controlling, and individual Trustees may have attributed different weights to the various factors. Based on their evaluation of all factors that they deemed to be material, including those factors described above, and assisted by the advice of independent legal counsel, the Board, including the Independent Trustees, voting separately, unanimously approved the Subadvisory Agreement.
| | | | | | |
| | |
| | | | ACTIVE PORTFOLIOS® MULTI-MANAGER SMALL CAP EQUITY FUND | | |
IMPORTANT INFORMATION ABOUT THIS REPORT
Each fund mails one shareholder report to each shareholder address. If you would like more than one report, please call shareholder services at 800.345.6611 and additional reports will be sent to you.
The policy of the Board is to vote the proxies of the companies in which each fund holds investments consistent with the procedures as stated in the Statement of Additional Information (SAI). You may obtain a copy of the SAI without charge by calling 800.345.6611; contacting your financial intermediary; visiting investor.columbiathreadneedleus.com; or searching the website of the Securities and Exchange Commission (SEC) at sec.gov. Information regarding how each fund voted proxies relating to portfolio securities is filed with the SEC by August 31st for the most recent 12-month period ending June 30th of that year, and is available without charge by visiting investor.columbiathreadneedleus.com, or searching the website of the SEC at sec.gov.
Each fund files a complete schedule of portfolio holdings with the SEC for the first and third quarters of each fiscal year on Form N-Q. Each fund’s Form N-Q is available on the SEC’s website at sec.gov and may be reviewed and copied at the SEC’s Public Reference Room in Washington, D.C. Information on the operation of the Public Reference Room may be obtained by calling 800.SEC.0330. Each fund’s complete schedule of portfolio holdings, as filed on Form N-Q, can also be obtained without charge, upon request, by calling 800.345.6611.
Active Portfolios® Multi-Manager Small Cap Equity Fund
P.O. Box 8081
Boston, MA 02266-8081
Please read and consider the investment objectives, risks, charges and expenses for any fund carefully before investing. For a prospectus and summary prospectus, which contains this and other important information about the Fund, go to investor.columbiathreadneedleus.com. The Fund is distributed by Columbia Management Investment Distributors, Inc., member FINRA, and managed by Columbia Management Investment Advisers, LLC.
Columbia Threadneedle Investments (Columbia Threadneedle) is the global brand name of the Columbia and Threadneedle group of companies. All rights reserved. Columbia Management Investment Distributors, Inc., 225 Franklin Street, Boston, MA 02110-2804
© 2016 Columbia Management Investment Advisers, LLC.
investor.columbiathreadneedleus.com
ANN102_08_F01_(10/16)

ANNUAL REPORT
August 31, 2016

ACTIVE PORTFOLIOS® MULTI-MANAGER TOTAL RETURN BOND FUND


ABOUT COLUMBIA THREADNEEDLE INVESTMENTS
Columbia Threadneedle Investments is a leading global asset management group that provides a broad range of investment strategies and solutions for individual, institutional and corporate clients around the world.
With more than 2,000 people, including over 450 investment professionals based in North America, Europe and Asia, we manage $460 billion* of assets across developed and emerging market equities, fixed income, asset allocation solutions and alternatives. We are the 13th largest manager of long-term mutual fund assets in the U.S.** and the 4th largest manager of retail funds in the U.K.***
Our priority is the investment success of our clients. We aim to deliver the investment outcomes they expect through an investment approach that is team-based, performance-driven and risk-aware. Our culture is dynamic and interactive. By sharing our insights across asset classes and geographies, we generate richer perspectives on global, regional and local investment landscapes. The ability to exchange and debate investment ideas in a collaborative environment enriches our teams’ investment processes. More importantly, it results in better informed investment decisions for our clients.
Columbia funds are distributed by Columbia Management Investment Distributors, Inc., member FINRA, and managed by Columbia Management Investment Advisers, LLC.
Columbia Threadneedle Investments (Columbia Threadneedle) is the global brand name of the Columbia and Threadneedle group of companies.
| * | | In U.S. dollars as of June 30, 2016. Source: Ameriprise Q2 Earnings Release. Includes all assets managed by entities in the Columbia and Threadneedle group of companies. Contact us for more current data. |
| ** | | Source: ICI as of June 30, 2016 for Columbia Management Investment Advisers, LLC. |
| *** | | Source: Investment Association as of March 2016 for Threadneedle Asset Management Limited. |
© 2016 Columbia Management Investment Advisers, LLC. All rights reserved.
Not part of the shareholder report
| | | | |
| | Investment strategies to help meet investor needs |
| |
| | We are committed to helping investors navigate financial challenges to reach their desired outcomes. The possibilities are endless. |
| | | | |
| | | | |
| | Your success is our priority. |
| | | | |
| | |
| |  | | Retire comfortably |
| | | | |
| | |
| | | | Fund college or higher education |
| | | | |
| | |
| | | | Leave a legacy |
| | | | |
| | | | |
 | | Generate an appropriate stream of income in retirement Traditional approaches to income may no longer be adequate — and they may no longer provide the diversification benefits they once did. Investors need to rethink how they generate retirement income. Worried about running out of income? You are not alone. |
| | | | |
| | | | |
 | | Navigate a changing interest rate environment Even in today’s challenging interest rate environment, it’s still possible to navigate markets and achieve your goals. Make investment choices designed specifically for this market environment. |
| | | | |
| | | | |
| |
 | | Maximize after-tax returns In an environment where what you keep is more important than what you earn, municipal bonds can help mitigate higher taxes while providing attractive yields compared to other investment options. You’ve worked too hard building your wealth to lose it to taxes. |
| | | | |
| | | | |
 | | Grow assets to achieve financial goals Finding growth opportunities in today’s complex market environment requires strong research capabilities, creative thinking and a disciplined approach. Do your investments deliver the portfolio growth you need? |
| | | | |
| | | | |
| |
 | | Ease the impact of volatile markets With increasing concerns about market volatility, investors should consider diversifying their portfolios with non-traditional holdings. Interested in turning volatility into opportunity? |
To find out more, contact your financial professional, call 800.426.3750 or visit investor.columbiathreadneedleus.com
Not part of the shareholder report
PRESIDENT’S MESSAGE

Dear Shareholders,
Volatility comes with the territory for long-term investors. Some investors instinctively want to pull out of the market or sell underperforming investments at the first sign of increased volatility or perhaps even as soon as they perceive it on the horizon. But taking yourself out of the market could mean losing out on potential opportunities, and putting your longer term investment goals at risk.
Cumulative return is not just about achieving high returns when markets are going up; it’s also about remaining invested and minimizing losses during weak or volatile markets so that you can participate on the upside. Developing a deeper understanding of the various risks your portfolio is subject to can help you balance these risks.
Diversification is critical in seeking to achieve that balance. We believe that most portfolios could be more effectively diversified either by introducing holdings with performance profiles unrelated to existing holdings (like alternative products) or by rebalancing existing holdings with an eye toward risk allocation. Over time, distributing risk more evenly may produce a more pronounced diversification benefit and may improve portfolio efficiency. We believe market volatility can create significant opportunities and, in fact, these periods may be some of the very best times to invest.
With this in mind, I thought it important to highlight excerpts from a piece written by Colin Moore, Global Chief Investment Officer, in which he touches on some of these issues emphasizing the importance of a properly constructed portfolio in seeking to effectively manage volatility and to achieve consistency of returns. I encourage you to read the article in its entirety. To access the full article and for other insights on current market, please visit blog.columbiathreadneedleus.com/latest-perspectives.
You need investments that are designed to help you ease the impact of volatile market environments and keep the savings you have worked tirelessly to amass. Columbia Threadneedle Investments provides investment solutions to help you tackle financial challenges and achieve your desired outcome.
Best regards,

Christopher O. Petersen
President, Columbia Funds
Excerpts from:
Taking the scare out of the volatility bogeyman
By Colin Moore, Global Chief Investment Officer

Colin Moore is the global chief investment officer for Columbia Threadneedle Investments. His responsibilities include ensuring that a disciplined investment process is in place across all asset classes, including equity and fixed income. Mr. Moore joined one of the Columbia Threadneedle Investments legacy firms in 2002 as head of equity and was also head of fixed income and liquidity strategies from 2009-2010.
| n | | In today’s low growth, higher volatility world, the emphasis is shifting from maximization of returns to consistency of returns. |
| n | | Portfolios should represent the behavioral risk-return tradeoff of investors, remembering that they won’t stay invested to realize the return if we get the risk tolerance wrong. |
Annual Report 2016
PRESIDENT’S MESSAGE (continued)
| n | | Holding long-term savings in cash to avoid volatility (the financial equivalent of hiding under the sheets) is detrimental to achieving long-term goals. |
According to Wikipedia, “The bogeyman is a common allusion to a mythical creature in many cultures used to control behavior. This monster has no specific appearance, and conceptions about it can vary drastically from household to household within the same community; in many cases he has no set appearance in the mind of an adult or child, but is simply a non-specific embodiment of terror.” Different cultures have different names and physical representations for the bogeyman, and investors are no different. We have terrible monsters that we fear may destroy our portfolios, and we call one of the scariest of them volatility.
While the bogeyman is mythical (I hope!), volatility is real and can cause serious damage. To understand why investors have such a hard time coping with volatility, we first need to define three cognitive biases at work in today’s investment environment:
| | 1) | | Recency bias — something that has recently come to the forefront of our attention, regardless of how long established it is, suddenly seems to appear with improbable frequency. |
| | 2) | | Negativity bias — we tend to have a greater recall of unpleasant memories than positive memories. |
| | 3) | | Loss aversion — our dissatisfaction with losing money tends to be greater than our satisfaction with making money. |
The level of volatility varies dramatically, and so does investor fear and panic selling — waxing when volatility rises, waning when it falls. Recent studies have pointed to demographics as an important driver of panic selling. The theory is that as people get closer to retirement, the prospects of a large (20%-30%) loss in financial assets can have a much more pronounced effect on their sense of well-being. Wealth preservation instincts kick in much more quickly than for younger (and typically less wealthy) savers.
The reality is that there is little opportunity for return without volatility. Therefore, the bogeyman effect of holding long-term savings in cash to avoid volatility (the financial equivalent of hiding under the sheets) is detrimental to achieving long-term goals. This effect tends to be more pronounced during the episodic spikes in volatility. The significant spike in volatility in 2008 and 2009 led to significant withdrawals from long-term investment funds over the same period. Less pronounced effects can also be seen when comparing 2001–2003 and 2011–2012. Conversely, flows picked up when volatility returned to “normal” levels. Investor behavior of this type is consistent with the three behavioral biases.
I believe average volatility will be higher over the next 10 years than the last 10 years and episodic spikes will increase in frequency because sustainable economic growth will be structurally lower and geopolitical risk higher than any time since World War II. Low growth creates uncertainty while loss aversion will make investors fear that we are one economic mishap or geopolitical event away from no growth or recession. The result will be higher volatility on average. Negativity bias will tend to exacerbate “spike” reactions to event-driven geopolitical news, and the volatility bogeyman will appear more often. Assuming the behavioral biases continue, investor returns are likely to be very disappointing regardless of the total return generated by financial markets due to the bogeyman effect.
To mitigate this effect, we need to focus on portfolio construction and an improved understanding of diversification. I accept that equities are likely to offer the highest return over the next 10 years, but they also offer the highest volatility. Many portfolio construction optimization tools use historical average volatility, which is likely to underestimate the volatility investors will face. The bogeyman emerges when individual asset class volatility spikes and cross correlations rise, the combination of which increases overall portfolio volatility far beyond expectation. Diversification is meant to protect investors against volatility, but what’s the point of owning lots of investments if the volatility bogeyman has not been properly estimated?
Most importantly, portfolios should be constructed to properly represent the behavioral risk-return tradeoff of investors, remembering that they won’t stay invested to realize the return if we get the risk tolerance wrong. In a low growth, higher volatility world, the emphasis is shifting to return consistency rather than return maximization, and investors are
Annual Report 2016
PRESIDENT’S MESSAGE (continued)
best served through investment approaches that appreciate that distinction. Even though it’s a permanent feature of financial markets, volatility is less likely to be the bogeyman we all fear if portfolios are constructed with this understanding.
Please visit blog.columbiathreadneedleus.com/latest-perspectives to read the entire article.
Investors should consider the investment objectives, risks, charges and expenses of a mutual fund carefully before investing. For a free prospectus and summary prospectus, which contains this and other important information about a fund, visit investor.columbiathreadneedleus.com. The prospectus should be read carefully before investing.
The views expressed are as of April 2016, may change as market or other conditions change, and may differ from views expressed by other Columbia Management Investment Advisers, LLC (CMIA) associates or affiliates. Actual investments or investment decisions made by CMIA and its affiliates, whether for its own account or on behalf of clients, will not necessarily reflect the views expressed. This information is not intended to provide investment advice and does not account for individual investor circumstances. Investment decisions should always be made based on an investor’s specific financial needs, objectives, goals, time horizon and risk tolerance. Asset classes described may not be suitable for all investors.
Past performance does not guarantee future results, and no forecast should be considered a guarantee either. Since economic and market conditions change frequently, there can be no assurance that the trends described here will continue or that the forecasts are accurate.
Diversification does not guarantee a profit or protect against loss.
Columbia Funds are distributed by Columbia Management Investment Distributors, Inc., member FINRA, and managed by Columbia Management Investment Advisers, LLC.
© 2016 Columbia Management Investment Advisers, LLC. All rights reserved.
Annual Report 2016
| | | | | | |
| | |
| | | | ACTIVE PORTFOLIOS® MULTI-MANAGER TOTAL RETURN BOND FUND | | |
TABLE OF CONTENTS
Fund Investment Manager
Columbia Management Investment
Advisers, LLC
225 Franklin Street
Boston, MA 02110
Fund Distributor
Columbia Management Investment
Distributors, Inc.
225 Franklin Street
Boston, MA 02110
Fund Transfer Agent
Columbia Management Investment
Services Corp.
P.O. Box 8081
Boston, MA 02266-8081
For more information about any of the funds, please visit investor.columbiathreadneedleus.com or call 800.345.6611. Customer Service Representatives are available to answer your questions Monday through Friday from 8 a.m. to 7 p.m. Eastern time.
The views expressed in this report reflect the current views of the respective parties. These views are not guarantees of future performance and involve certain risks, uncertainties and assumptions that are difficult to predict, so actual outcomes and results may differ significantly from the views expressed. These views are subject to change at any time based upon economic, market or other conditions and the respective parties disclaim any responsibility to update such views. These views may not be relied on as investment advice and, because investment decisions for a Columbia fund are based on numerous factors, may not be relied on as an indication of trading intent on behalf of any particular Columbia fund. References to specific securities should not be construed as a recommendation or investment advice.
Annual Report 2016
| | | | | | |
| | |
| | | | ACTIVE PORTFOLIOS® MULTI-MANAGER TOTAL RETURN BOND FUND | | |
PERFORMANCE OVERVIEW
Performance Summary
| n | | Active Portfolios® Multi-Manager Total Return Bond Fund (the Fund) Class A shares returned 5.82% for the 12-month period that ended August 31, 2016. |
| n | | The Fund closely tracked its benchmark, the Bloomberg Barclays U.S. Aggregate Bond Index, which returned 5.97% over the same period. |
| n | | The Fund’s performance can be attributed primarily to sector allocation and duration positioning decisions. |
| | | | | | | | | | |
Average Annual Total Returns (%) (for period ended August 31, 2016) | |
| | | Inception | | 1 Year | | | Life | |
Class A | | 04/20/12 | | | 5.82 | | | | 3.21 | |
Bloomberg Barclays U.S. Aggregate Bond Index | | | | | 5.97 | | | | 3.01 | |
All results shown assume reinvestment of distributions during the period. Returns do not reflect the deduction of taxes that a shareholder may pay on Fund distributions or on the redemption of Fund shares. Performance results reflect the effect of any fee waivers or reimbursements of Fund expenses by Columbia Management Investment Advisers, LLC and/or any of its affiliates. Absent these fee waivers or expense reimbursement arrangements, performance results would have been lower.
The performance information shown represents past performance and is not a guarantee of future results. The investment return and principal value of your investment will fluctuate so that your shares, when redeemed, may be worth more or less than their original cost. Current performance may be lower or higher than the performance information shown. You may obtain performance information current to the most recent month-end by contacting your financial intermediary, visiting investor.columbiathreadneedleus.com or calling 800.345.6611.
The Bloomberg Barclays U.S. Aggregate Bond Index is a broad-based benchmark that measures the investment-grade, U.S. dollar-denominated, fixed-rate taxable bond market, including Treasuries, government-related and corporate securities, mortgage-backed securities (agency fixed-rate and hybrid adjustable-rate mortgage passthroughs), asset-backed securities, and commercial mortgage-backed securities. Effective August 24, 2016, the Barclays U.S. Aggregate Bond Index was rebranded as the Bloomberg Barclays U.S. Aggregate Bond Index.
Indices are not available for investment, are not professionally managed and do not reflect sales charges, fees, brokerage commissions, taxes or other expenses of investing. Securities in the Fund may not match those in an index.
| | | | | | |
| | |
| | | | ACTIVE PORTFOLIOS® MULTI-MANAGER TOTAL RETURN BOND FUND | | |
PERFORMANCE OVERVIEW (continued)
|
Performance of a Hypothetical $10,000 Investment (April 20, 2012 — August 31, 2016) |
The chart above shows the change in value of a hypothetical $10,000 investment in Class A shares of Active Portfolios® Multi-Manager Total Return Bond Fund during the stated time period, and does not reflect the deduction of taxes that a shareholder may pay on Fund distributions or on the redemption of Fund shares.
| | | | | | |
| | |
| | | | ACTIVE PORTFOLIOS® MULTI-MANAGER TOTAL RETURN BOND FUND | | |
MANAGER DISCUSSION OF FUND PERFORMANCE
Portfolio Management
Columbia Management Investment Advisers, LLC
Brian Lavin, CFA
Carl Pappo, CFA
Jason Callan
Loomis, Sayles & Company, L.P.
Christopher Harms
Clifton Rowe, CFA
Kurt Wagner, CFA, CIC
PGIM, Inc. (Prudential)
Michael Collins, CFA
Robert Tipp, CFA
Richard Piccirillo
Gregory Peters
TCW Investment Management Company
Stephen Kane, CFA
Laird Landmann
Tad Rivelle
Bryan Whalen, CFA
| | | | |
Portfolio Breakdown (%)
(at August 31, 2016) | |
Asset-Backed Securities — Agency | | | 0.3 | |
Asset-Backed Securities — Non-Agency | | | 10.2 | |
Commercial Mortgage-Backed Securities — Agency | | | 1.5 | |
Commercial Mortgage-Backed Securities — Non-Agency | | | 5.0 | |
Common Stocks | | | 0.0 | (a) |
Corporate Bonds & Notes | | | 35.6 | |
Fixed-Income Funds | | | 1.0 | |
Foreign Government Obligations | | | 1.6 | |
Inflation-Indexed Bonds | | | 0.8 | |
Money Market Funds | | | 5.2 | |
Municipal Bonds | | | 0.4 | |
Preferred Debt | | | 0.3 | |
Residential Mortgage-Backed Securities — Agency | | | 17.4 | |
Residential Mortgage-Backed Securities — Non-Agency | | | 2.4 | |
Senior Loans | | | 0.6 | |
Treasury Bills | | | 0.4 | |
U.S. Government & Agency Obligations | | | 1.7 | |
U.S. Treasury Obligations | | | 15.6 | |
Total | | | 100.0 | |
Percentages indicated are based upon total investments. The Fund’s portfolio composition is subject to change.
Effective April 11, 2016, the Fund was re-named Active Portfolios® — Multi-Manager Total Return Bond Fund. Also, effective April 11, 2016, Loomis, Sayles & Company, L.P. (Loomis Sayles) was added as a manager of a portion of the Fund. Effective May 16, 2016, PGIM, Inc. (PGIM), the asset management arm of Prudential Financial (Prudential), was added as a manager of a portion of the Fund, and Federated Investment Management Company was removed as a manager.
The Fund is currently managed by three independent money management firms and by Columbia Management Investment Advisers, LLC (CMIA), each managing a portion of the portfolio’s assets. As of August 31, 2016, TCW Investment Management Company (TCW), Loomis Sayles, PGIM and CMIA managed approximately 27%, 20%, 26% and 27% of the portfolio, respectively.
For the 12-month period that ended August 31, 2016, the Fund’s Class A shares returned 5.82%. The Fund closely tracked its benchmark, the Bloomberg Barclays U.S. Aggregate Bond Index, which returned 5.97% over the same period. The Fund’s performance can be attributed primarily to sector allocation and duration positioning decisions.
A Tale of Two Halves
The 12-month period ended August 31, 2016 was marked by a tale of two halves for the fixed-income markets. In the fourth quarter of 2015, stresses emerged in the credit markets, with West Texas Intermediate crude oil prices hitting a seven-year low of less than $35 a barrel. Investors worried about overleveraged producers, bringing added stress to energy and other commodity-related issues. Meanwhile, the U.S. Federal Reserve (the Fed) finally moved forward in December 2015 with its first rate hike in nearly a decade, and while the market largely expected this hike, the Fed was still unable to shore up confidence in the strength of the U.S. economic outlook. The sell-off continued during the first six weeks of 2016, peaking in mid-February 2016.
The sell-off subsequently gave way to a vigorous rally. Observers could be forgiven for assuming that a material change in the fundamental data occurred and a consensus had developed for a vastly improved economic and market outlook. While the case for weakness, and, thus, downside volatility was well-informed by sluggish economic growth, sagging commodity demand, declining corporate profitability and stingy wage gains, notwithstanding payroll expansion, the reversal could boast little in the way of contrasting evidence. A more than 10% year-to-date loss on the S&P 500 Index through February 11, 2016 turned into a slight upturn by March month-end and nearly erased a 28% deficit experienced in the high yield energy sector, with no change in underlying fundamentals. The reason behind the move could be found in central bank commitment to monetary accommodation. The Fed was joined by the European Central Bank, the Bank of Japan and People’s Bank of China, which each exhibited a willingness to wield various instruments of stimulus. Japan took interest rates into negative terrain, and Europe announced further rate cuts and quantitative easing measures, including the purchase of corporate bonds. For its part, the Fed scaled back expectations for tightening policy, halving its December 2015 forecast for four rate hikes in 2016 to two.
| | | | | | |
| | |
| | | | ACTIVE PORTFOLIOS® MULTI-MANAGER TOTAL RETURN BOND FUND | | |
MANAGER DISCUSSION OF FUND PERFORMANCE (continued)
Amid easy accommodative policies, the S&P 500 Index climbed higher, while the corporate bond sector, especially high yield, outpaced stocks, as the appetite for risk appeared undiminished. Even after a surprising “leave” outcome from the U.K. referendum on membership in the European Union toward the end of June 2016, the initially extreme volatility proved short-lived. Markets quickly recovered, indicating confidence among investors that the Fed and its fellow global central banks would maintain the dovish policies that have supported asset prices with few interruptions since the 2008 financial crisis.
Given the backdrop of accommodative monetary policy, interest rates remained low and therefore drove investors’ search for yield. As such, all fixed-income sectors were in positive territory during the period, and lower quality generally outperformed higher quality. Notwithstanding deteriorating fundamentals, the credit sector led fixed-income returns, with industrials performing especially well. High-yield and municipal securities also posted strong returns. Among securitized products, commercial mortgage-backed securities (CMBS) generated impressive returns, particularly non-agency CMBS. As the Fed remained accommodative and lower rates overseas supported demand for U.S. Treasuries, intermediate and long-term U.S. Treasury yields declined during the period, while short-term yields were modestly higher due to expectations for the end of Fed accommodative policy. In turn, the yield curve, or spectrum of maturities, flattened, meaning the differential in yields between longer term and shorter term yields narrowed.
Sector Allocations and Duration Positioning Drove Fund Returns
Federated: During the period, we managed a portion of the Fund through May 13, 2016. During that time, our portion of the Fund outperformed the benchmark primarily due to effective security selection, particularly among high-yield credits, despite a “down in quality” credit sector bias. Also benefiting performance was an overweight to banks and positions in Kinder Morgan and Mexico sovereign debt. Duration positioning detracted, as our portion of the Fund had a shorter duration than that of the benchmark during a time when interest rates declined. Our portion of the Fund was overweight the credit sectors — high yield, investment-grade corporate bonds, emerging markets debt and CMBS. Sector allocation also detracted through mid-February as spreads widened, then contributed positively as spreads subsequently tightened but not quite enough to offset the losses from the earlier period. Yield curve positioning had a rather neutral effect on our portion of the Fund’s results overall, as a flattening bias contributed positively, but an underweight to the intermediate segment of the yield curve detracted.
TCW: Our portion of the Fund underperformed the benchmark during the period, due in part to the defensive duration position, which detracted as intermediate and long-term U.S. Treasury yields fell. Performance was also dampened by the relative underweight to corporate and non-corporate credit, both of which outpaced duration-equivalent U.S. Treasuries, as commodity prices recovered and demand for U.S. and higher quality non-U.S. sovereign securities persisted. In particular, the relative underweight to the better performing industrial sector was a drag on results. Our portion of the Fund
| | | | |
Quality Breakdown (%)
(at August 31, 2016) | |
AAA rating | | | 54.7 | |
AA rating | | | 4.2 | |
A rating | | | 10.0 | |
BBB rating | | | 20.8 | |
BB rating | | | 4.7 | |
B rating | | | 3.3 | |
CCC rating | | | 1.1 | |
CC rating | | | 0.3 | |
C rating | | | 0.0 | (a) |
D rating | | | 0.2 | |
Not rated | | | 0.7 | |
Total | | | 100.0 | |
Percentages indicated are based upon total fixed income investments (excluding Money Market Funds).
Bond ratings apply to the underlying holdings of the Fund and not the Fund itself and are divided into categories ranging from highest to lowest credit quality, determined by using the middle rating of Moody’s, S&P and Fitch, after dropping the highest and lowest available ratings. When ratings are available from only two rating agencies, the lower rating is used. When a rating is available from only one rating agency, that rating is used. When a bond is not rated by any rating agency, it is designated as “Not rated.” Credit quality ratings assigned by a rating agency are subjective opinions, not statements of fact, and are subject to change, including daily. The ratings assigned by credit rating agencies are but one of the considerations that the Investment Manager and/or Fund’s subadviser incorporates into its credit analysis process, along with such other issuer-specific factors as cash flows, capital structure and leverage ratios, ability to de-leverage (repay) through free cash flow, quality of management, market positioning and access to capital, as well as such security-specific factors as the terms of the security (e.g., interest rate and time to maturity) and the amount and type of any collateral.
| | | | | | |
| | |
| | | | ACTIVE PORTFOLIOS® MULTI-MANAGER TOTAL RETURN BOND FUND | | |
MANAGER DISCUSSION OF FUND PERFORMANCE (continued)
| | | | | | | | | | | | |
Market Exposure Through Derivatives Investments (% of notional exposure) (at August 31, 2016)(a) | |
| | | | Long | | | | Short | | | | Net | |
Fixed Income Derivative Contracts | | | 493.1 | | | | (393.0 | ) | | | 100.1 | |
Foreign Currency Derivative Contracts | | | 0.0 | | | | (0.1 | ) | | | (0.1 | ) |
Total Notional Market Value of Derivative Contracts | | | 493.1 | | | | (393.1 | ) | | | 100.0 | |
| (a) | The Fund has market exposure (long and/or short) to the fixed income and foreign currency through its investments in derivatives. The notional exposure of a financial instrument is the nominal or face amount that is used to calculate payments made on that instrument and/or changes in value for the instrument. The notional exposure is a hypothetical underlying quantity upon which payment obligations are computed. Notional exposures provide a gauge for how the Fund may behave given changes in individual markets. For a description of the Fund’s investments in derivatives, see Investments in Derivatives following the Portfolio of Investments, and Note 2 to the financial statements. |
Investment Risks
Market risk may affect a single issuer, sector of the economy, industry or the market as a whole. Mortgage- and asset-backed securities are affected by interest rates, financial health of issuers/originators, creditworthiness of entities providing credit enhancements and the value of underlying assets. Fixed-income securities present issuer default risk. Non-investment-grade (high-yield or junk) securities present greater price volatility and more risk to principal and income than higher rated securities. A rise in interest rates may result in a price decline of fixed-income instruments held by the Fund, negatively impacting its performance and NAV. Falling rates may result in the Fund investing in lower yielding debt instruments, lowering the Fund’s income and yield. These risks may be heightened for longer maturity and duration securities. Prepayment and extension risk exists because a loan, bond or other investment may be called, prepaid or redeemed before maturity and similar yielding investments may not be available for purchase. Investing in derivatives is a specialized activity that involves special risks that subject the Fund to significant loss potential, including when used as leverage, and may result in greater fluctuation in fund value. The Fund is managed by multiple advisers independently of one another, which may result in contradicting trades (i.e., with no net benefit to the Fund), while increasing transaction costs. Market or other (e.g.,
maintained a relative underweight to the volatile metals and mining subsector, which was the best performer in the benchmark during the period. This was somewhat offset by a focus on transportation credits, which benefited our portion of the Fund, as the subsector outpaced the broader corporate sector substantially. Returns benefited from the allocation to non-agency mortgage-backed securities, which saw strong demand and improvement in underlying fundamentals. Further contributions came from the relative overweight to CMBS, particularly non-agency-backed CMBS, which significantly outpaced duration-equivalent U.S. Treasuries. Our portion of the Fund also benefited from its relative overweight to asset-backed securities, though the emphasis within the sector on government-guaranteed student loans weighed on returns, as uncertainty surrounding potential rating agency actions drove spreads, or yield differentials to U.S. Treasuries, wider at the beginning of the period. Yield curve positioning contributed positively. As the short-term end of the yield curve sold off on expectations of Fed rate hikes, our portion of the Fund’s underweight to this segment of the yield curve benefited returns as short-term rates rose.
Loomis Sayles: Since assuming management of a portion of the Fund on April 11, 2016, our portion of the Fund outperformed the benchmark. Sector allocation benefited relative results most. Specifically, an overweight to investment-grade industrials added value. A relative overweight to investment-grade financials and underweights to U.S. Treasuries and agency securities also contributed positively. Issue selection among investment-grade industrials and financials proved effective. Only partially offsetting these positive contributors were an overweight to asset-backed securities and underweights to investment-grade utilities and government-related bonds, which detracted. Issue selection among CMBS, agency pass-through mortgages also detracted. Finally, although we targeted a duration neutral to that of the benchmark, our duration and yield curve positioning had a modestly positive effect on relative performance as well.
PGIM: Since assuming management of a portion of the Fund on May 16, 2016, our portion of the Fund outperformed the benchmark, with duration, yield curve and sector positioning and security selection all contributing positively to relative results. More specifically, overweight allocations to high-yield corporate bonds, investment-grade corporate bonds, emerging markets debt and bank loans contributed positively as did having an underweight to U.S. Treasuries. Issue selection among investment-grade corporate bonds and emerging markets debt was also a positive contributor. Having a longer duration than that of the benchmark during a period when interest rates fell added further value. Yield curve positioning also improved our portion of the Fund’s relative results. Our portion of the Fund was positioned to anticipate that the U.S. Treasury yield curve, or spectrum of maturities, would flatten, which it did, meaning the differential between longer term yields and shorter term yields narrowed. Partially offsetting these positive contributors was issue selection among high-yield corporate bonds, which modestly detracted. Our style of below-investment-grade investing trends toward defensive, lower volatility bonds, such as higher quality, lower average life bonds and less cyclical bonds. As bonds rated CCC and energy/cyclical bonds performed better during the period, and as our portion of the Fund was underweight these aggressive issues, such positioning detracted. Also dampening relative results was issue selection
| | | | | | |
| | |
| | | | ACTIVE PORTFOLIOS® MULTI-MANAGER TOTAL RETURN BOND FUND | | |
MANAGER DISCUSSION OF FUND PERFORMANCE (continued)
among U.S. bank loans and having an underweight to mortgage-backed securities.
CMIA: Our portion of the Fund outperformed the benchmark in large part due to effective timing of shifts in allocation to credit. We reduced our portion of the Fund’s overweight to credit early in the period, prompted by an expected change in Fed policy as well as by overall rich credit valuations. We then increased our overweight to credit when spreads, or yield differentials to U.S. Treasuries, widened, especially during the broad risk sell-off in early 2016. Having a modestly longer duration than that of the benchmark during a period when interest rates generally declined, also contributed positively to relative results.
In addition to an overweighted allocation to credit, both investment grade and high yield, an overweight to CMBS and underweights to U.S. Treasuries and agency mortgage-backed securities contributed positively to our portion of the Fund’s performance. Within the allocation to credit, security selection among energy-related bonds aided results as did exposure to financial institutions lower in the capital structure. Conversely, having an underweight to the metals and mining industry within the allocation to credit detracted. Further, our bias toward higher quality dampened results, as higher quality securities lagged the market during the period. Duration and yield curve positioning more modestly detracted from relative results.
Shifting Market Conditions Drove Portfolio Changes
The Fund’s portfolio turnover rate for the 12-month period was 289%. A significant portion of the turnover was the result of rolling-maturity mortgage securities, processing of prepayments and opportunistic changes our managers made at the margin in response to valuations or market developments.
Federated: There were no major changes to our portion of the Fund during the reporting period other than modestly trimming high-yield and investment-grade corporate exposure while remaining overweight compared to the benchmark. Maintaining the credit overweight enabled our portion of the Fund to recoup losses incurred through mid-February 2016, as spreads narrowed in March and April. We also sought to take advantage of price dislocations to add select companies at inexpensive levels during the risk-off trade. During the reporting period, we added a number of what we considered to be “safer” consumer-oriented bonds, including those of Anheuser-Busch, American Electric Power, Autozone, Dollar General, Hyatt, National Rural Utilities, Newell Brands, Penske and O’Reilly Automotive. Our rationale was that despite the recession in the U.S. manufacturing sector, the consumer was likely, in our view, to provide a source of growth to the economy given the declining unemployment rate, rising home prices, recovery in equity prices and signs of budding wage gains. Sales during the reporting period included a number of insurance companies, such as Prudential, Met Life and Hartford, as we believed low long-term interest rates negatively affected the ability of these firms to profitably fund their long-term liabilities. A number of bonds were also sold due to richness and liquidity as our portion of the Fund trimmed back corporate exposure.
As of May 13, 2016, our portion of the Fund was overweight high yield, emerging markets debt, investment-grade corporate bonds and CMBS; was
interest rate) environments may adversely affect the liquidity of fund investments, negatively impacting their price. Generally, the less liquid the market at the time the Fund sells a holding, the greater the risk of loss or decline of value to the Fund. See the Fund’s prospectus for information on these and other risks.
| | | | | | |
| | |
| | | | ACTIVE PORTFOLIOS® MULTI-MANAGER TOTAL RETURN BOND FUND | | |
MANAGER DISCUSSION OF FUND PERFORMANCE (continued)
underweight U.S. Treasuries and agency securities; and was rather neutrally weighted in agency mortgage-backed securities relative to the benchmark. Our portion of the Fund had a duration modestly shorter than that of the benchmark on the same date.
TCW: Given the lack of fundamental support for the rally in prices seen during the period, our expectations were for a more significant deleveraging as the credit cycle aged. As such, our portion of the Fund remained defensively positioned with a shorter duration than that of the benchmark and an emphasis on higher quality issues. That said, our bias was to expand the risk profile of our portion of the Fund, as we looked to add opportunistically across undervalued sectors should spreads widen. In terms of sector positioning, we trimmed exposure to corporate credits, as valuations had become less attractive from a risk/return standpoint, in our view. There were, however, relative value trades made throughout the period. Allocations to pharmaceuticals, electric utilities and life insurance increased given what we viewed as more compelling opportunities within those industries. Given ongoing Fed distortion in the rates space, our response to duration is asymmetric, which means a preference to get closer to a neutral stance while remaining disciplined to a dollar cost average implementation. As such, we added back a small amount of duration over the period when rates traded higher, moving from approximately three-quarters of a year shorter than that of the benchmark to end August 2016 at approximately six-tenths of a year shorter than the duration of the benchmark.
At the end of the period, our portion of the Fund maintained an underweight relative to the benchmark in corporate credit, with positioning focused on U.S. financials given limited re-leveraging risk and what we view as reasonable yield premiums. A small allocation to high yield was also maintained, though the strength in the market during the period provided an opportunity to rotate into higher quality holdings that we believe will likely, have the credit resilience to make it through the end of the credit cycle. We believe structured products continued to offer opportunities for attractive risk-adjusted returns and protection, and therefore represented an overweight versus the benchmark at the end of the period. Non-agency mortgage-backed securities represented a relative underweight in our portion of the Fund despite being higher quality and more liquid, as yield compensation remained small historically and prepayment risk weighed on the market in the low rate environment. CMBS and asset-backed securities holdings were focused on high quality collateral in the senior most parts of the capital structure, often with government guarantees, making them, in our view, solid defensive credits.
Loomis Sayles: As spreads, or yield differentials between corporate bonds and U.S. Treasuries, tightened, we reduced the corporate beta, or volatility factor, within our portion of the Fund. More specifically, we had a modest overweight to energy, with a more favorable view on independents, pipelines and integrateds versus the refining and oil field service subsectors. Within energy, we focused on issuers we believe to be committed to maintaining their investment-grade rating and appear to have the ability to do so. For example, our portion of the Fund held names including ConocoPhillips, Access Midstream, Plains All American, Kinder Morgan, Chevron and BP, each of which performed well during the period. Overall, we modestly
| | | | | | |
| | |
| | | | ACTIVE PORTFOLIOS® MULTI-MANAGER TOTAL RETURN BOND FUND | | |
MANAGER DISCUSSION OF FUND PERFORMANCE (continued)
increased our portion of the Fund’s banking exposure by participating in what we view as attractive new issues. For names such as Morgan Stanley, HSBC and Goldman Sachs, we realized new issue concessions, and we used these sale proceeds as a source for other new purchases. We also looked for attractive swap opportunities along an individual issuer’s credit curve by identifying both inexpensive and rich bonds (bonds trading at a premium versus their peers) of an issuer.
At the end of the period, our portion of the Fund was overweight U.S. credit, asset-backed securities and CMBS and was underweight mortgage-backed securities, agency securities and U.S. Treasuries relative to the benchmark. We were targeting neutral duration and yield curve positions at the end of the period.
PGIM: Since assuming management of a portion of the Fund on May 16, 2016, modest changes were made to active duration positioning. We also increased our portion of the Fund’s exposure to high-yield corporate bonds and to structured products, including asset-backed securities and CMBS.
At the end of the period, our portion of the Fund was underweight U.S. Treasuries, mortgage-backed securities, agency securities and non-U.S. government related bonds and was overweight asset-backed securities, high-yield corporate bonds, CMBS, investment-grade corporate bonds and emerging markets debt relative to the benchmark. Our portion of the Fund was rather neutrally weighted relative to the benchmark in municipal bonds. Our portion of the Fund also had exposure to bank loans, which are not represented in the benchmark. As of August 31, 2016, our portion of the Fund had a duration approximately one-half year longer than that of the benchmark.
CMIA: In addition to modest adjustments in duration and yield curve positioning as market conditions shifted, we reduced our portion of the Fund’s allocation to credit early in the period, and the general credit quality improved as we deemed credit valuations too tight and likely to deteriorate with rising rates. We then increased the credit sector allocation in early 2016 as valuations became less rich with increased volatility and global economic concerns.
Within the credit allocation, we increased our portion of the Fund’s exposure to energy-related bonds, particularly during the first quarter of 2016 when spreads reached historically inexpensive levels due to depressed oil prices. Our portion of the Fund made purchases of various senior unsecured bonds in the Plains All American and Anadarko Petroleum complexes. We maintained the overweight allocation to financial institutions based on valuations and our opinion of the overall strength of their balance sheets. Notable sales included bonds in the retail industry and the life insurance industry. For example, we sold our portion of the Fund’s unsecured senior bonds of Macy’s, MetLife and American International Group.
At the end of the period, our portion of the Fund was underweight relative to the benchmark in U.S. Treasuries, agency mortgage-backed securities and government-related securities and was overweight relative to the benchmark in investment-grade credit, asset-backed securities, CMBS and other structured products, all as measured by market weight.
| | | | | | |
| | |
| | | | ACTIVE PORTFOLIOS® MULTI-MANAGER TOTAL RETURN BOND FUND | | |
UNDERSTANDING YOUR FUND’S EXPENSES
(Unaudited)
As an investor, you incur two types of costs. There are transaction costs, which may include redemption fees. There are also ongoing costs, which generally include management fees, distribution and/or service fees, and other fund expenses. The following information is intended to help you understand your ongoing costs (in dollars) of investing in the Fund and to help you compare these costs with the ongoing costs of investing in other mutual funds.
Analyzing Your Fund’s Expenses
To illustrate these ongoing costs, we have provided examples and calculated the expenses paid by investors of the Fund during the period. The actual and hypothetical information in the table is based on an initial investment of $1,000 at the beginning of the period indicated and held for the entire period. Expense information is calculated two ways and each method provides you with different information. The amount listed in the “Actual” column is calculated using the Fund’s actual operating expenses and total return for the period. You may use the Actual information, together with the amount invested, to estimate the expenses that you paid over the period. Simply divide your account value by $1,000 (for example, an $8,600 account value divided by $1,000 = 8.6), then multiply the results by the expenses paid during the period under the “Actual” column. The amount listed in the “Hypothetical” column assumes a 5% annual rate of return before expenses (which is not the Fund’s actual return) and then applies the Fund’s actual expense ratio for the period to the hypothetical return. You should not use the hypothetical account values and expenses to estimate either your actual account balance at the end of the period or the expenses you paid during the period. See “Compare With Other Funds” below for details on how to use the hypothetical data.
Compare With Other Funds
Since all mutual funds are required to include the same hypothetical calculations about expenses in shareholder reports, you can use this information to compare the ongoing cost of investing in the Fund with other funds. To do so, compare the hypothetical example with the 5% hypothetical examples that appear in the shareholder reports of other funds. As you compare hypothetical examples of other funds, it is important to note that hypothetical examples are meant to highlight the ongoing costs of investing in a fund only and do not reflect any transaction costs, such as redemption or exchange fees. Therefore, the hypothetical calculations are useful in comparing ongoing costs only, and will not help you determine the relative total costs of owning different funds. If transaction costs were included in these calculations, your costs would be higher.
March 1, 2016 – August 31, 2016
| | | | | | | | | | | | | | | | | | | | | | | | | | | | |
| | | Account Value at the
Beginning of the
Period ($) | | | Account Value at the
End of the
Period ($) | | | Expenses Paid During
the Period ($) | | | Fund’s Annualized
Expense Ratio (%) | |
| | | | Actual | | | | Hypothetical | | | | Actual | | | | Hypothetical | | | | Actual | | | | Hypothetical | | | | Actual | |
Class A | | | 1,000.00 | | | | 1,000.00 | | | | 1,048.20 | | | | 1,021.11 | | | | 4.12 | | | | 4.06 | | | | 0.80 | |
Expenses paid during the period are equal to the annualized expense ratio as indicated above, multiplied by the average account value over the period and then multiplied by the number of days in the Fund’s most recent fiscal half year and divided by 366.
Expenses do not include fees and expenses incurred indirectly by the Fund from its investment in underlying funds, including affiliated and non-affiliated pooled investment vehicles, such as mutual funds and exchange-traded funds.
Had Columbia Management Investment Advisers, LLC and/or certain of its affiliates not waived/reimbursed certain fees and expenses, account value at the end of the period would have been reduced.
Class A shares of the Fund are available only to certain eligible investors through certain wrap fee programs sponsored and/or managed by Ameriprise Financial, Inc. or its affiliates. Participants in wrap fee programs pay other fees that are not included in the above table. Please refer to the wrap program documents for information about the fees charged.
| | | | | | |
| | |
| | | | ACTIVE PORTFOLIOS® MULTI-MANAGER TOTAL RETURN BOND FUND | | |
PORTFOLIO OF INVESTMENTS
August 31, 2016
(Percentages represent value of investments compared to net assets)
| | | | | | | | | | | | |
| Corporate Bonds & Notes 38.6% | |
| Issuer | | Coupon
Rate | | | Principal
Amount ($) | | | Value ($) | |
AEROSPACE & DEFENSE 0.2% | |
Lockheed Martin Corp. | |
01/15/23 | | | 3.100% | | | | 1,469,000 | | | | 1,550,845 | |
09/01/36 | | | 6.150% | | | | 1,540,000 | | | | 2,091,394 | |
05/15/46 | | | 4.700% | | | | 6,790,000 | | | | 8,131,833 | |
|
Textron, Inc. | |
03/01/24 | | | 4.300% | | | | 690,000 | | | | 743,819 | |
03/01/25 | | | 3.875% | | | | 300,000 | | | | 316,430 | |
|
TransDigm, Inc. | |
07/15/21 | | | 7.500% | | | | 275,000 | | | | 291,672 | |
07/15/22 | | | 6.000% | | | | 250,000 | | | | 260,000 | |
07/15/24 | | | 6.500% | | | | 979,000 | | | | 1,015,713 | |
05/15/25 | | | 6.500% | | | | 409,000 | | | | 423,315 | |
|
TransDigm, Inc.(a) | |
06/15/26 | | | 6.375% | | | | 332,000 | | | | 338,640 | |
| | | | | | | | | | | | | |
Total | | | | | | | | | | | 15,163,661 | |
| | | |
| | | | | | | | | | | | |
AIRLINES 0.5% | |
American Airlines Pass-Through Trust | |
01/15/23 | | | 4.950% | | | | 1,630,192 | | | | 1,780,985 | |
|
Continental Airlines Pass-Through Trust | |
01/02/18 | | | 6.900% | | | | 185,745 | | | | 190,612 | |
02/02/19 | | | 6.545% | | | | 1,724,702 | | | | 1,824,907 | |
04/19/22 | | | 5.983% | | | | 2,985,179 | | | | 3,369,670 | |
|
Delta Air Lines Pass-Through Trust | |
01/02/23 | | | 6.718% | | | | 3,155,812 | | | | 3,589,736 | |
|
JetBlue Airways Pass-Through Trust(b) | |
11/15/16 | | | 1.267% | | | | 5,910,000 | | | | 5,901,726 | |
| | | |
Southwest Airlines Co. | | | | | | | | | | | | |
03/01/17 | | | 5.125% | | | | 3,000,000 | | | | 3,058,311 | |
|
U.S. Airways Pass-Through Trust | |
10/01/24 | | | 5.900% | | | | 799,445 | | | | 926,357 | |
06/03/25 | | | 4.625% | | | | 3,523,465 | | | | 3,858,194 | |
|
United Airlines, Inc. Pass-Through Trust | |
01/15/17 | | | 9.750% | | | | 701,567 | | | | 720,860 | |
Series 2016-1 Class AA | |
07/07/28 | | | 3.100% | | | | 7,160,000 | | | | 7,428,500 | |
| | | | | | | | | | | | | |
Total | | | | | | | | | | | 32,649,858 | |
| | | |
| | | | | | | | | | | | |
APARTMENT REIT 0.1% | |
AvalonBay Communities, Inc. | |
03/15/20 | | | 6.100% | | | | 1,865,000 | | | | 2,128,758 | |
09/15/22 | | | 2.950% | | | | 4,650,000 | | | | 4,785,794 | |
| | | | | | | | | | | | | |
Total | | | | | | | | | | | 6,914,552 | |
| | | |
| | | | | | | | | | | | |
AUTOMOTIVE 1.3% | |
American Axle & Manufacturing, Inc. | |
02/15/19 | | | 5.125% | | | | 64,000 | | | | 65,152 | |
03/15/21 | | | 6.250% | | | | 131,000 | | | | 136,895 | |
10/15/22 | | | 6.625% | | | | 450,000 | | | | 479,813 | |
|
American Honda Finance Corp.(a) | |
10/01/18 | | | 7.625% | | | | 2,250,000 | | | | 2,531,178 | |
| | | | | | | | | | | | |
| Corporate Bonds & Notes (continued) | |
| Issuer | | Coupon
Rate | | | Principal
Amount ($) | | | Value ($) | |
Daimler Finance North America LLC(a) | |
09/03/19 | | | 2.250% | | | | 5,895,000 | | | | 5,998,752 | |
03/02/20 | | | 2.250% | | | | 1,500,000 | | | | 1,528,583 | |
|
Ford Motor Co. | |
02/01/29 | | | 6.375% | | | | 1,165,000 | | | | 1,418,255 | |
01/15/43 | | | 4.750% | | | | 2,640,000 | | | | 2,855,939 | |
|
Ford Motor Credit Co. LLC | |
06/12/17 | | | 3.000% | | | | 1,600,000 | | | | 1,619,379 | |
05/15/18 | | | 5.000% | | | | 1,975,000 | | | | 2,081,786 | |
06/15/18 | | | 2.240% | | | | 3,000,000 | | | | 3,025,452 | |
08/04/20 | | | 3.157% | | | | 5,720,000 | | | | 5,908,651 | |
09/20/22 | | | 4.250% | | | | 1,100,000 | | | | 1,189,834 | |
05/04/23 | | | 3.096% | | | | 2,375,000 | | | | 2,403,887 | |
01/08/26 | | | 4.389% | | | | 2,945,000 | | | | 3,190,545 | |
|
Gates Global LLC/Co.(a) | |
07/15/22 | | | 6.000% | | | | 775,000 | | | | 736,250 | |
|
General Motors Co. | |
04/01/25 | | | 4.000% | | | | 1,060,000 | | | | 1,083,764 | |
04/01/36 | | | 6.600% | | | | 1,857,000 | | | | 2,289,991 | |
04/01/45 | | | 5.200% | | | | 1,270,000 | | | | 1,352,194 | |
04/01/46 | | | 6.750% | | | | 1,505,000 | | | | 1,931,639 | |
|
General Motors Financial Co., Inc. | |
09/25/17 | | | 3.000% | | | | 5,000,000 | | | | 5,066,100 | |
07/06/21 | | | 3.200% | | | | 7,234,000 | | | | 7,352,124 | |
09/25/21 | | | 4.375% | | | | 5,625,000 | | | | 6,003,894 | |
03/01/26 | | | 5.250% | | | | 2,345,000 | | | | 2,606,069 | |
|
Goodyear Tire & Rubber Co. (The) | |
11/15/23 | | | 5.125% | | | | 200,000 | | | | 209,000 | |
|
Harley-Davidson Financial Services, Inc.(a) | |
03/15/17 | | | 2.700% | | | | 1,380,000 | | | | 1,390,634 | |
|
Hyundai Capital America(a) | |
02/06/19 | | | 2.550% | | | | 180,000 | | | | 183,626 | |
03/19/20 | | | 2.600% | | | | 680,000 | | | | 693,850 | |
|
Lear Corp. | |
01/15/23 | | | 4.750% | | | | 1,667,000 | | | | 1,737,848 | |
03/15/24 | | | 5.375% | | | | 1,242,000 | | | | 1,332,045 | |
| | | |
Magna International, Inc. | | | | | | | | | | | | |
06/15/24 | | | 3.625% | | | | 1,100,000 | | | | 1,155,894 | |
|
Nemak SAB de CV(a) | |
02/28/23 | | | 5.500% | | | | 450,000 | | | | 470,250 | |
|
Nissan Motor Acceptance Corp.(a) | |
09/12/17 | | | 1.950% | | | | 2,500,000 | | | | 2,514,840 | |
|
PACCAR Financial Corp. | |
08/12/19 | | | 1.200% | | | | 1,110,000 | | | | 1,106,933 | |
| | | |
RCI Banque SA(a) | | | | | | | | | | | | |
04/03/18 | | | 3.500% | | | | 4,000,000 | | | | 4,113,988 | |
|
Schaeffler Finance BV(a) | |
05/15/21 | | | 4.250% | | | | 599,000 | | | | 613,975 | |
05/15/21 | | | 4.750% | | | | 704,000 | | | | 728,640 | |
05/15/23 | | | 4.750% | | | | 200,000 | | | | 208,250 | |
|
Schaeffler Holding Finance BV(a)
PIK | |
08/15/18 | | | 6.875% | | | | 160,480 | | | | 163,690 | |
11/15/19 | | | 6.250% | | | | 135,000 | | | | 140,063 | |
11/15/22 | | | 6.750% | | | | 120,318 | | | | 132,951 | |
The accompanying Notes to Financial Statements are an integral part of this statement.
| | | | | | |
| | |
| | | | ACTIVE PORTFOLIOS® MULTI-MANAGER TOTAL RETURN BOND FUND | | |
PORTFOLIO OF INVESTMENTS (continued)
August 31, 2016
| | | | | | | | | | | | |
| Corporate Bonds & Notes (continued) | |
| Issuer | | Coupon
Rate | | | Principal
Amount ($) | | | Value ($) | |
Toyota Motor Credit Corp. | |
05/20/19 | | | 1.400% | | | | 4,380,000 | | | | 4,392,356 | |
|
ZF North America Capital, Inc.(a) | |
04/29/25 | | | 4.750% | | | | 842,000 | | | | 893,573 | |
| | | | | | | | | | | | | |
Total | | | | | | | | | | | 85,038,532 | |
| | | |
| | | | | | | | | | | | |
BANKING 9.9% | |
Ally Financial, Inc. | |
01/30/17 | | | 2.750% | | | | 225,000 | | | | 225,115 | |
09/10/18 | | | 4.750% | | | | 575,000 | | | | 597,281 | |
03/30/20 | | | 4.125% | | | | 50,000 | | | | 51,625 | |
05/19/22 | | | 4.625% | | | | 344,000 | | | | 361,200 | |
09/30/24 | | | 5.125% | | | | 2,203,000 | | | | 2,386,124 | |
03/30/25 | | | 4.625% | | | | 265,000 | | | | 274,938 | |
Subordinated | |
11/20/25 | | | 5.750% | | | | 745,000 | | | | 792,494 | |
|
American Express Credit Corp. | |
09/22/17 | | | 1.550% | | | | 1,950,000 | | | | 1,956,745 | |
|
Australia & New Zealand Banking Group Ltd. | |
06/01/21 | | | 2.300% | | | | 3,300,000 | | | | 3,355,519 | |
|
BB&T Corp. | |
02/01/19 | | | 2.250% | | | | 1,600,000 | | | | 1,631,432 | |
|
BBVA Bancomer SA
Junior Subordinated(a) | |
04/22/20 | | | 7.250% | | | | 200,000 | | | | 222,000 | |
|
BNP Paribas SA
Junior Subordinated(a)(b) | |
12/31/49 | | | 7.375% | | | | 2,366,000 | | | | 2,407,405 | |
|
Banco Internacional Del Peru SAA/Panama(a) | |
10/07/20 | | | 5.750% | | | | 100,000 | | | | 111,200 | |
|
Banco Santander SA(a) | |
11/09/22 | | | 4.125% | | | | 150,000 | | | | 156,750 | |
|
Bank of America Corp. | |
10/14/16 | | | 5.625% | | | | 650,000 | | | | 653,475 | |
01/11/18 | | | 2.000% | | | | 4,000,000 | | | | 4,024,896 | |
04/25/18 | | | 6.875% | | | | 6,980,000 | | | | 7,566,641 | |
10/19/20 | | | 2.625% | | | | 4,000,000 | | | | 4,096,084 | |
01/24/22 | | | 5.700% | | | | 4,800,000 | | | | 5,603,846 | |
01/11/23 | | | 3.300% | | | | 2,000,000 | | | | 2,078,718 | |
01/22/24 | | | 4.125% | | | | 3,000,000 | | | | 3,269,415 | |
04/19/26 | | | 3.500% | | | | 2,000,000 | | | | 2,089,294 | |
04/01/44 | | | 4.875% | | | | 1,000,000 | | | | 1,174,742 | |
Subordinated | |
05/02/17 | | | 5.700% | | | | 3,740,000 | | | | 3,842,678 | |
01/22/25 | | | 4.000% | | | | 795,000 | | | | 829,093 | |
04/21/25 | | | 3.950% | | | | 2,500,000 | | | | 2,604,035 | |
|
Bank of America Corp.(b)
Junior Subordinated | |
12/31/49 | | | 6.100% | | | | 10,294,000 | | | | 10,821,567 | |
12/31/49 | | | 6.250% | | | | 2,052,000 | | | | 2,154,600 | |
|
Bank of America NA
Subordinated | |
03/15/17 | | | 5.300% | | | | 5,000,000 | | | | 5,105,835 | |
06/15/17 | | | 6.100% | | | | 4,000,000 | | | | 4,149,660 | |
| | | | | | | | | | | | |
| Corporate Bonds & Notes (continued) | |
| Issuer | | Coupon
Rate | | | Principal
Amount ($) | | | Value ($) | |
Bank of Montreal | |
04/09/18 | | | 1.450% | | | | 750,000 | | | | 751,828 | |
07/18/19 | | | 1.500% | | | | 3,145,000 | | | | 3,147,588 | |
08/27/21 | | | 1.900% | | | | 5,530,000 | | | | 5,506,564 | |
|
Bank of New York Mellon Corp. (The) | |
05/15/19 | | | 5.450% | | | | 800,000 | | | | 884,445 | |
05/03/21 | | | 2.050% | | | | 2,510,000 | | | | 2,539,518 | |
08/16/23 | | | 2.200% | | | | 4,180,000 | | | | 4,169,404 | |
09/11/24 | | | 3.250% | | | | 1,960,000 | | | | 2,090,550 | |
08/17/26 | | | 2.450% | | | | 6,450,000 | | | | 6,441,254 | |
|
Bank of New York Mellon Corp. (The)(b)
Junior Subordinated | |
12/29/49 | | | 4.500% | | | | 6,992,000 | | | | 6,860,900 | |
12/31/49 | | | 4.625% | | | | 3,780,000 | | | | 3,784,725 | |
|
Bank of Nova Scotia (The) | |
06/14/19 | | | 1.650% | | | | 7,240,000 | | | | 7,267,280 | |
|
Barclays Bank PLC
Subordinated | |
09/11/24 | | | 4.375% | | | | 915,000 | | | | 928,408 | |
|
Barclays Bank PLC(b)
Junior Subordinated | |
12/31/49 | | | 6.625% | | | | 2,626,000 | | | | 2,478,419 | |
|
Barclays PLC | |
11/08/19 | | | 2.750% | | | | 1,940,000 | | | | 1,955,619 | |
08/10/21 | | | 3.200% | | | | 12,335,000 | | | | 12,407,690 | |
01/12/26 | | | 4.375% | | | | 1,755,000 | | | | 1,831,179 | |
|
Canadian Imperial Bank of Commerce(c) | |
09/06/19 | | | 1.600% | | | | 4,500,000 | | | | 4,496,661 | |
|
Capital One Bank NA | |
07/23/21 | | | 2.950% | | | | 1,050,000 | | | | 1,087,194 | |
|
Capital One Financial Corp. | |
11/21/18 | | | 2.150% | | | | 1,150,000 | | | | 1,160,878 | |
Subordinated | |
10/29/25 | | | 4.200% | | | | 3,490,000 | | | | 3,648,537 | |
| | | |
Capital One NA | | | | | | | | | | | | |
08/17/18 | | | 2.350% | | | | 2,610,000 | | | | 2,645,767 | |
|
Citigroup, Inc. | |
11/15/16 | | | 1.300% | | | | 750,000 | | | | 750,111 | |
08/09/20 | | | 5.375% | | | | 10,000,000 | | | | 11,253,020 | |
05/01/26 | | | 3.400% | | | | 6,400,000 | | | | 6,610,138 | |
Subordinated | |
06/10/25 | | | 4.400% | | | | 4,250,000 | | | | 4,507,924 | |
08/25/36 | | | 6.125% | | | | 1,980,000 | | | | 2,435,119 | |
|
Citigroup, Inc.(b) | |
08/14/17 | | | 1.307% | | | | 6,620,000 | | | | 6,623,164 | |
05/15/18 | | | 2.517% | | | | 2,275,000 | | | | 2,318,930 | |
09/01/23 | | | 2.410% | | | | 6,435,000 | | | | 6,468,250 | |
Junior Subordinated | |
12/31/49 | | | 5.950% | | | | 9,790,000 | | | | 10,114,294 | |
|
Comerica, Inc. | |
05/23/19 | | | 2.125% | | | | 645,000 | | | | 650,572 | |
Subordinated | |
07/22/26 | | | 3.800% | | | | 900,000 | | | | 932,313 | |
|
Commonwealth Bank of Australia(a)(c) | |
09/06/21 | | | 2.000% | | | | 6,450,000 | | | | 6,446,575 | |
The accompanying Notes to Financial Statements are an integral part of this statement.
| | | | | | |
| | |
| | | | ACTIVE PORTFOLIOS® MULTI-MANAGER TOTAL RETURN BOND FUND | | |
PORTFOLIO OF INVESTMENTS (continued)
August 31, 2016
| | | | | | | | | | | | |
| Corporate Bonds & Notes (continued) | |
| Issuer | | Coupon
Rate | | | Principal
Amount ($) | | | Value ($) | |
Compass Bank | |
09/29/19 | | | 2.750% | | | | 1,400,000 | | | | 1,398,089 | |
|
Cooperatieve Rabobank UA | |
12/01/23 | | | 4.625% | | | | 4,115,000 | | | | 4,461,417 | |
|
Cooperatieve Rabobank UA(a)(b)
Junior Subordinated | |
12/31/49 | | | 11.000% | | | | 2,170,000 | | | | 2,648,756 | |
|
Credit Suisse Group Funding Guernsey Ltd. | |
12/10/20 | | | 3.125% | | | | 1,910,000 | | | | 1,937,978 | |
|
Credit Suisse Group Funding Guernsey Ltd.(a) | |
04/16/21 | | | 3.450% | | | | 1,600,000 | | | | 1,635,174 | |
06/09/23 | | | 3.800% | | | | 12,305,000 | | | | 12,519,009 | |
| | | |
Danske Bank A/S(a)(c) | | | | | | | | | | | | |
03/10/21 | | | 2.000% | | | | 4,510,000 | | | | 4,491,689 | |
|
Deutsche Bank AG | |
05/12/21 | | | 3.375% | | | | 9,718,000 | | | | 9,715,104 | |
|
Discover Bank | |
02/21/18 | | | 2.000% | | | | 680,000 | | | | 682,817 | |
08/08/23 | | | 4.200% | | | | 4,000,000 | | | | 4,287,780 | |
|
Discover Financial Services | |
04/27/22 | | | 5.200% | | | | 2,697,000 | | | | 2,958,649 | |
11/21/22 | | | 3.850% | | | | 3,653,000 | | | | 3,779,207 | |
|
Fifth Third Bancorp | |
03/01/19 | | | 2.300% | | | | 310,000 | | | | 315,038 | |
07/27/20 | | | 2.875% | | | | 1,570,000 | | | | 1,625,845 | |
|
Fifth Third Bancorp(b)
Junior Subordinated | |
12/31/49 | | | 5.100% | | | | 6,970,000 | | | | 6,909,012 | |
|
Goldman Sachs Group, Inc. (The) | |
01/18/18 | | | 5.950% | | | | 4,000,000 | | | | 4,239,556 | |
04/01/18 | | | 6.150% | | | | 7,210,000 | | | | 7,722,292 | |
07/19/18 | | | 2.900% | | | | 2,200,000 | | | | 2,256,498 | |
09/15/20 | | | 2.750% | | | | 6,670,000 | | | | 6,855,099 | |
01/24/22 | | | 5.750% | | | | 3,800,000 | | | | 4,410,117 | |
07/08/24 | | | 3.850% | | | | 3,605,000 | | | | 3,828,395 | |
01/23/25 | | | 3.500% | | | | 4,375,000 | | | | 4,546,456 | |
Subordinated | |
10/21/25 | | | 4.250% | | | | 2,300,000 | | | | 2,434,037 | |
05/22/45 | | | 5.150% | | | | 2,100,000 | | | | 2,297,908 | |
|
Goldman Sachs Group, Inc. (The)(b)
Junior Subordinated | |
12/31/49 | | | 5.700% | | | | 5,000,000 | | | | 5,107,500 | |
|
HBOS PLC
Subordinated(a) | |
05/21/18 | | | 6.750% | | | | 5,927,000 | | | | 6,342,400 | |
|
HSBC Holdings PLC
Junior Subordinated(b) | |
12/31/49 | | | 6.375% | | | | 782,000 | | | | 778,090 | |
|
HSBC USA, Inc. | |
01/16/18 | | | 1.625% | | | | 3,000,000 | | | | 3,000,939 | |
03/05/20 | | | 2.350% | | | | 2,575,000 | | | | 2,591,238 | |
|
Huntington National Bank (The) | |
04/01/19 | | | 2.200% | | | | 1,500,000 | | | | 1,516,091 | |
| | | | | | | | | | | | |
| Corporate Bonds & Notes (continued) | |
| Issuer | | Coupon
Rate | | | Principal
Amount ($) | | | Value ($) | |
ICICI Bank Ltd.
Junior Subordinated(a)(b) | |
04/30/22 | | | 6.375% | | | | 750,000 | | | | 763,630 | |
| | | |
ING Bank NV(a) | | | | | | | | | | | | |
08/15/21 | | | 2.050% | | | | 4,520,000 | | | | 4,528,421 | |
|
JPMorgan Chase & Co. | |
03/01/18 | | | 1.700% | | | | 8,130,000 | | | | 8,169,187 | |
04/23/19 | | | 6.300% | | | | 5,000,000 | | | | 5,593,170 | |
10/15/20 | | | 4.250% | | | | 2,000,000 | | | | 2,177,968 | |
01/24/22 | | | 4.500% | | | | 1,000,000 | | | | 1,108,244 | |
07/15/25 | | | 3.900% | | | | 4,000,000 | | | | 4,330,544 | |
10/01/26 | | | 2.950% | | | | 1,180,000 | | | | 1,190,686 | |
Subordinated | |
05/01/23 | | | 3.375% | | | | 1,000,000 | | | | 1,032,128 | |
09/10/24 | | | 3.875% | | | | 5,440,000 | | | | 5,746,354 | |
|
JPMorgan Chase & Co.(b)
Junior Subordinated | |
12/29/49 | | | 6.000% | | | | 2,868,000 | | | | 3,023,446 | |
12/31/49 | | | 6.100% | | | | 15,237,000 | | | | 16,227,405 | |
|
JPMorgan Chase Bank NA
Subordinated | |
10/01/17 | | | 6.000% | | | | 2,605,000 | | | | 2,731,236 | |
|
JPMorgan Chase Capital XXI
Junior Subordinated(b) | |
02/02/37 | | | 1.709% | | | | 18,206,000 | | | | 14,724,102 | |
|
JPMorgan Chase Capital XXIII
Junior Subordinated(b) | |
05/15/47 | | | 1.817% | | | | 8,000,000 | | | | 6,220,000 | |
|
KeyBank NA | |
08/22/19 | | | 1.600% | | | | 4,835,000 | | | | 4,836,325 | |
Subordinated | |
05/20/26 | | | 3.400% | | | | 915,000 | | | | 937,978 | |
|
KeyCorp Capital I
Junior Subordinated(b) | |
07/01/28 | | | 1.386% | | | | 3,921,000 | | | | 3,220,121 | |
| | | |
Lloyds Bank PLC | | | | | | | | | | | | |
05/14/18 | | | 1.750% | | | | 5,805,000 | | | | 5,802,237 | |
|
Lloyds Banking Group PLC | |
07/06/21 | | | 3.100% | | | | 420,000 | | | | 428,945 | |
Subordinated | |
03/24/26 | | | 4.650% | | | | 2,940,000 | | | | 3,053,834 | |
|
Lloyds Banking Group PLC(a)
Subordinated | |
12/10/25 | | | 4.582% | | | | 18,935,000 | | | | 19,365,591 | |
|
Lloyds Banking Group PLC(b)
Junior Subordinated | |
12/31/49 | | | 7.500% | | | | 6,665,000 | | | | 6,773,306 | |
|
M&T Bank Corp. | |
01/30/17 | | | 1.127% | | | | 700,000 | | | | 700,486 | |
07/25/19 | | | 2.250% | | | | 3,000,000 | | | | 3,054,297 | |
Junior Subordinated | |
12/31/49 | | | 6.875% | | | | 2,989,000 | | | | 3,007,681 | |
|
MUFG Union Bank NA | |
09/26/18 | | | 2.625% | | | | 1,925,000 | | | | 1,960,372 | |
05/06/19 | | | 2.250% | | | | 825,000 | | | | 835,439 | |
The accompanying Notes to Financial Statements are an integral part of this statement.
| | | | | | |
| | |
| | | | ACTIVE PORTFOLIOS® MULTI-MANAGER TOTAL RETURN BOND FUND | | |
PORTFOLIO OF INVESTMENTS (continued)
August 31, 2016
| | | | | | | | | | | | |
| Corporate Bonds & Notes (continued) | |
| Issuer | | Coupon
Rate | | | Principal
Amount ($) | | | Value ($) | |
Macquarie Bank Ltd.
Subordinated(a) | |
04/07/21 | | | 6.625% | | | | 3,860,000 | | | | 4,443,080 | |
|
Mellon Capital IV
Junior Subordinated(b) | |
06/29/49 | | | 4.000% | | | | 250,000 | | | | 212,813 | |
|
Mitsubishi UFJ Financial Group, Inc. | |
03/01/21 | | | 2.950% | | | | 1,535,000 | | | | 1,583,270 | |
|
Morgan Stanley | |
05/13/19 | | | 7.300% | | | | 1,000,000 | | | | 1,142,064 | |
10/23/24 | | | 3.700% | | | | 2,000,000 | | | | 2,120,828 | |
07/23/25 | | | 4.000% | | | | 280,000 | | | | 302,620 | |
07/24/42 | | | 6.375% | | | | 4,300,000 | | | | 5,901,862 | |
Subordinated | |
11/24/25 | | | 5.000% | | | | 4,950,000 | | | | 5,536,139 | |
|
Morgan Stanley(b) | |
01/05/18 | | | 1.393% | | | | 2,000,000 | | | | 2,003,176 | |
Junior Subordinated | |
12/31/49 | | | 5.450% | | | | 5,000,000 | | | | 5,012,500 | |
|
Northern Trust Corp.
Junior Subordinated(b) | |
12/31/49 | | | 4.600% | | | | 2,190,000 | | | | 2,236,538 | |
|
PNC Bank NA | |
04/29/21 | | | 2.150% | | | | 2,050,000 | | | | 2,075,356 | |
06/01/25 | | | 3.250% | | | | 1,450,000 | | | | 1,543,277 | |
|
QNB Finance Ltd.(a) | |
10/31/18 | | | 2.750% | | | | 200,000 | | | | 203,000 | |
|
Rabobank Capital Funding Trust III
Junior Subordinated(a)(b) | |
12/31/49 | | | 5.254% | | | | 3,335,000 | | | | 3,321,060 | |
|
Regions Financial Corp. | |
02/08/21 | | | 3.200% | | | | 4,725,000 | | | | 4,901,998 | |
|
Royal Bank of Canada | |
04/15/19 | | | 1.625% | | | | 4,800,000 | | | | 4,815,355 | |
|
Royal Bank of Scotland Group PLC | |
10/21/19 | | | 6.400% | | | | 1,350,000 | | | | 1,498,605 | |
|
Royal Bank of Scotland Group PLC(b)
Junior Subordinated | |
12/31/49 | | | 8.000% | | | | 2,562,000 | | | | 2,479,247 | |
12/31/49 | | | 8.625% | | | | 4,015,000 | | | | 4,090,281 | |
|
Santander Holdings USA, Inc. | |
05/24/19 | | | 2.700% | | | | 7,235,000 | | | | 7,318,297 | |
|
Santander Issuances SAU
Subordinated | |
11/19/25 | | | 5.179% | | | | 6,210,000 | | | | 6,445,533 | |
|
Santander UK Group Holdings PLC | |
08/05/21 | | | 2.875% | | | | 3,425,000 | | | | 3,421,072 | |
|
Santander UK Group Holdings PLC(a)
Subordinated | |
09/15/25 | | | 4.750% | | | | 8,167,000 | | | | 8,208,635 | |
09/15/45 | | | 5.625% | | | | 3,598,000 | | | | 3,697,467 | |
|
Societe Generale SA(a)
Subordinated | |
01/17/24 | | | 5.000% | | | | 2,855,000 | | | | 3,024,678 | |
| | | | | | | | | | | | |
| Corporate Bonds & Notes (continued) | |
| Issuer | | Coupon
Rate | | | Principal
Amount ($) | | | Value ($) | |
08/19/26 | | | 4.250% | | | | 1,510,000 | | | | 1,526,109 | |
|
Standard Chartered PLC(a) | |
04/12/26 | | | 4.050% | | | | 2,990,000 | | | | 3,096,764 | |
|
State Street Capital Trust IV
Junior Subordinated(b) | |
06/15/37 | | | 1.653% | | | | 1,976,000 | | | | 1,694,420 | |
|
State Street Corp.
Junior Subordinated | |
03/15/18 | | | 4.956% | | | | 4,235,000 | | | | 4,433,105 | |
|
Sumitomo Mitsui Financial Group, Inc. | |
07/14/21 | | | 2.058% | | | | 6,600,000 | | | | 6,557,331 | |
|
SunTrust Banks, Inc. | |
05/01/19 | | | 2.500% | | | | 1,770,000 | | | | 1,807,478 | |
03/03/21 | | | 2.900% | | | | 920,000 | | | | 954,232 | |
|
Svenska Handelsbanken AB(c) | |
09/06/19 | | | 1.500% | | | | 4,510,000 | | | | 4,494,819 | |
09/07/21 | | | 1.875% | | | | 9,060,000 | | | | 9,027,937 | |
|
Synchrony Financial | |
01/15/19 | | | 2.600% | | | | 2,500,000 | | | | 2,534,338 | |
07/23/25 | | | 4.500% | | | | 4,500,000 | | | | 4,752,612 | |
|
Synovus Financial Corp. | |
02/15/19 | | | 7.875% | | | | 131,000 | | | | 146,884 | |
|
Synovus Financial Corp.(b)
Subordinated | |
12/15/25 | | | 5.750% | | | | 5,755,000 | | | | 6,044,246 | |
|
Toronto-Dominion Bank (The)(c) | |
09/06/18 | | | 1.450% | | | | 6,400,000 | | | | 6,398,259 | |
|
U.S. Bancorp
Subordinated | |
04/27/26 | | | 3.100% | | | | 3,560,000 | | | | 3,684,347 | |
|
UBS Group Funding Jersey Ltd.(a) | |
02/01/22 | | | 2.650% | | | | 5,330,000 | | | | 5,328,023 | |
|
Vesey Street Investment Trust 1(b) | |
09/01/16 | | | 4.404% | | | | 480,000 | | | | 480,042 | |
|
Wells Fargo & Co. | |
09/09/24 | | | 3.300% | | | | 4,300,000 | | | | 4,546,093 | |
04/22/26 | | | 3.000% | | | | 2,765,000 | | | | 2,836,849 | |
Subordinated | | | | | | | | | | | | |
08/15/23 | | | 4.125% | | | | 4,160,000 | | | | 4,540,623 | |
11/17/45 | | | 4.900% | | | | 1,365,000 | | | | 1,559,055 | |
06/14/46 | | | 4.400% | | | | 3,285,000 | | | | 3,507,010 | |
|
Wells Fargo & Co.(b)
Junior Subordinated | |
12/31/49 | | | 5.900% | | | | 7,172,000 | | | | 7,629,215 | |
|
Wells Fargo Bank NA | |
05/24/19 | | | 1.750% | | | | 9,345,000 | | | | 9,441,525 | |
|
Westpac Banking Corp. | |
08/19/19 | | | 1.600% | | | | 3,220,000 | | | | 3,219,005 | |
08/19/21 | | | 2.000% | | | | 6,500,000 | | | | 6,501,748 | |
| | | | | | | | | | | | | |
Total | | | | | | | | | | | 652,905,358 | |
| | | |
| | | | | | | | | | | | |
The accompanying Notes to Financial Statements are an integral part of this statement.
| | | | | | |
| | |
| | | | ACTIVE PORTFOLIOS® MULTI-MANAGER TOTAL RETURN BOND FUND | | |
PORTFOLIO OF INVESTMENTS (continued)
August 31, 2016
| | | | | | | | | | | | |
| Corporate Bonds & Notes (continued) | |
| Issuer | | Coupon
Rate | | | Principal
Amount ($) | | | Value ($) | |
BROKERAGE/ASSET MANAGERS/EXCHANGES 0.1% | |
E*TRADE Financial Corp. | |
11/15/22 | | | 5.375% | | | | 135,000 | | | | 144,956 | |
09/15/23 | | | 4.625% | | | | 1,547,000 | | | | 1,605,569 | |
|
Jefferies Group LLC | |
07/15/19 | | | 8.500% | | | | 2,800,000 | | | | 3,213,916 | |
01/20/43 | | | 6.500% | | | | 600,000 | | | | 632,850 | |
|
Nasdaq, Inc. | |
01/15/20 | | | 5.550% | | | | 600,000 | | | | 665,777 | |
|
National Financial Partners Corp.(a) | |
07/15/21 | | | 9.000% | | | | 43,000 | | | | 44,398 | |
|
Stifel Financial Corp. | |
12/01/20 | | | 3.500% | | | | 980,000 | | | | 996,170 | |
07/18/24 | | | 4.250% | | | | 750,000 | | | | 764,242 | |
| | | | | | | | | | | | | |
Total | | | | | | | | | | | 8,067,878 | |
| | | |
| | | | | | | | | | | | |
BUILDING MATERIALS 0.1% | |
Allegion PLC | |
09/15/23 | | | 5.875% | | | | 210,000 | | | | 226,800 | |
|
Allegion US Holding Co., Inc. | |
10/01/21 | | | 5.750% | | | | 142,000 | | | | 148,745 | |
|
American Builders & Contractors Supply Co., Inc.(a) | |
04/15/21 | | | 5.625% | | | | 778,000 | | | | 805,230 | |
12/15/23 | | | 5.750% | | | | 94,000 | | | | 99,170 | |
|
Beacon Roofing Supply, Inc. | |
10/01/23 | | | 6.375% | | | | 559,000 | | | | 600,925 | |
|
Cemex Finance LLC(a) | |
04/01/24 | | | 6.000% | | | | 500,000 | | | | 527,500 | |
|
Eagle Materials, Inc. | |
08/01/26 | | | 4.500% | | | | 84,000 | | | | 85,480 | |
|
Gibraltar Industries, Inc. | |
02/01/21 | | | 6.250% | | | | 56,000 | | | | 57,960 | |
|
HD Supply, Inc. | |
07/15/20 | | | 7.500% | | | | 393,000 | | | | 409,211 | |
|
HD Supply, Inc.(a) | |
12/15/21 | | | 5.250% | | | | 1,068,000 | | | | 1,138,082 | |
04/15/24 | | | 5.750% | | | | 503,000 | | | | 535,695 | |
|
Nortek, Inc. | |
04/15/21 | | | 8.500% | | | | 616,000 | | | | 645,260 | |
|
Standard Industries, Inc.(a) | |
10/15/25 | | | 6.000% | | | | 3,360,000 | | | | 3,683,400 | |
|
US Concrete, Inc. | |
06/01/24 | | | 6.375% | | | | 166,000 | | | | 173,055 | |
|
USG Corp.(a) | |
11/01/21 | | | 5.875% | | | | 50,000 | | | | 52,438 | |
03/01/25 | | | 5.500% | | | | 150,000 | | | | 162,000 | |
| | | | | | | | | | | | | |
Total | | | | | | | | | | | 9,350,951 | |
| | | |
| | | | | | | | | | | | |
CABLE AND SATELLITE 1.1% | |
Altice US Finance I Corp.(a) | |
07/15/23 | | | 5.375% | | | | 392,000 | | | | 410,130 | |
05/15/26 | | | 5.500% | | | | 2,871,000 | | | | 3,028,905 | |
| | | | | | | | | | | | |
| Corporate Bonds & Notes (continued) | |
| Issuer | | Coupon
Rate | | | Principal
Amount ($) | | | Value��($) | |
CCO Holdings LLC/Capital Corp. | |
03/15/21 | | | 5.250% | | | | 61,000 | | | | 63,599 | |
09/30/22 | | | 5.250% | | | | 4,140,000 | | | | 4,347,000 | |
09/01/23 | | | 5.750% | | | | 1,000,000 | | | | 1,055,000 | |
|
CCO Holdings LLC/Capital Corp.(a) | |
05/01/23 | | | 5.125% | | | | 393,000 | | | | 413,511 | |
04/01/24 | | | 5.875% | | | | 160,000 | | | | 172,400 | |
05/01/25 | | | 5.375% | | | | 991,000 | | | | 1,044,266 | |
02/15/26 | | | 5.750% | | | | 219,000 | | | | 234,330 | |
05/01/26 | | | 5.500% | | | | 123,000 | | | | 130,226 | |
05/01/27 | | | 5.875% | | | | 564,000 | | | | 603,480 | |
|
COX Communications, Inc.(a) | |
12/15/22 | | | 3.250% | | | | 500,000 | | | | 503,500 | |
|
CSC Holdings LLC | |
02/15/18 | | | 7.875% | | | | 33,000 | | | | 35,640 | |
02/15/19 | | | 8.625% | | | | 294,000 | | | | 329,280 | |
11/15/21 | | | 6.750% | | | | 95,000 | | | | 101,769 | |
06/01/24 | | | 5.250% | | | | 440,000 | | | | 428,173 | |
|
CSC Holdings LLC(a) | |
10/15/25 | | | 6.625% | | | | 1,401,000 | | | | 1,521,836 | |
10/15/25 | | | 10.875% | | | | 1,118,000 | | | | 1,308,060 | |
|
Cablevision Systems Corp. | |
04/15/18 | | | 7.750% | | | | 3,500,000 | | | | 3,736,250 | |
|
Cequel Communications Holdings I LLC/Capital Corp.(a) | |
09/15/20 | | | 6.375% | | | | 1,600,000 | | | | 1,654,000 | |
12/15/21 | | | 5.125% | | | | 98,000 | | | | 98,858 | |
12/15/21 | | | 5.125% | | | | 1,122,000 | | | | 1,134,623 | |
07/15/25 | | | 7.750% | | | | 350,000 | | | | 382,375 | |
|
Charter Communications Operating LLC/Capital(a) | |
07/23/22 | | | 4.464% | | | | 5,210,000 | | | | 5,653,460 | |
10/23/45 | | | 6.484% | | | | 10,280,000 | | | | 12,633,544 | |
|
Comcast Corp. | |
01/15/17 | | | 6.500% | | | | 1,700,000 | | | | 1,734,042 | |
02/15/25 | | | 3.375% | | | | 900,000 | | | | 968,434 | |
07/15/46 | | | 3.400% | | | | 3,300,000 | | | | 3,240,263 | |
|
DISH DBS Corp. | |
05/01/20 | | | 5.125% | | | | 1,400,000 | | | | 1,449,000 | |
06/01/21 | | | 6.750% | | | | 1,354,000 | | | | 1,454,704 | |
07/15/22 | | | 5.875% | | | | 300,000 | | | | 306,000 | |
11/15/24 | | | 5.875% | | | | 60,000 | | | | 59,175 | |
|
DISH DBS Corp.(a) | |
07/01/26 | | | 7.750% | | | | 3,982,000 | | | | 4,248,754 | |
|
Hughes Satellite Systems Corp. | |
06/15/19 | | | 6.500% | | | | 99,000 | | | | 108,281 | |
|
Hughes Satellite Systems Corp.(a) | |
08/01/26 | | | 5.250% | | | | 348,000 | | | | 345,213 | |
08/01/26 | | | 6.625% | | | | 203,000 | | | | 201,478 | |
|
NBCUniversal Media LLC | |
04/30/20 | | | 5.150% | | | | 2,280,000 | | | | 2,573,185 | |
01/15/23 | | | 2.875% | | | | 720,000 | | | | 754,947 | |
|
Sirius XM Radio, Inc.(a) | |
04/15/25 | | | 5.375% | | | | 390,000 | | | | 406,575 | |
|
Time Warner Cable, Inc. | |
02/01/20 | | | 5.000% | | | | 1,500,000 | | | | 1,634,373 | |
09/01/21 | | | 4.000% | | | | 1,500,000 | | | | 1,599,667 | |
09/01/41 | | | 5.500% | | | | 1,500,000 | | | | 1,629,244 | |
The accompanying Notes to Financial Statements are an integral part of this statement.
| | | | | | |
| | |
| | | | ACTIVE PORTFOLIOS® MULTI-MANAGER TOTAL RETURN BOND FUND | | |
PORTFOLIO OF INVESTMENTS (continued)
August 31, 2016
| | | | | | | | | | | | |
| Corporate Bonds & Notes (continued) | |
| Issuer | | Coupon
Rate | | | Principal
Amount ($) | | | Value ($) | |
UPCB Finance IV Ltd.(a) | |
01/15/25 | | | 5.375% | | | | 627,000 | | | | 644,243 | |
|
Unitymedia GmbH(a) | |
01/15/25 | | | 6.125% | | | | 482,000 | | | | 516,945 | |
|
Unitymedia Hessen GmbH & Co. KG NRW(a) | |
01/15/23 | | | 5.500% | | | | 608,000 | | | | 639,920 | |
01/15/25 | | | 5.000% | | | | 662,000 | | | | 690,135 | |
|
Videotron Ltd. | |
07/15/22 | | | 5.000% | | | | 4,327,000 | | | | 4,537,941 | |
|
Virgin Media Finance PLC(a) | |
04/15/23 | | | 6.375% | | | | 300,000 | | | | 319,500 | |
01/15/25 | | | 5.750% | | | | 4,400,000 | | | | 4,477,000 | |
|
Virgin Media Secured Finance PLC(a) | |
01/15/26 | | | 5.250% | | | | 673,000 | | | | 688,143 | |
| | | | | | | | | | | | | |
Total | | | | | | | | | | | 76,251,377 | |
| | | |
| | | | | | | | | | | | |
CHEMICALS 0.4% | |
Agrium, Inc. | |
01/15/45 | | | 5.250% | | | | 1,400,000 | | | | 1,558,544 | |
|
Albemarle Corp. | |
12/01/24 | | | 4.150% | | | | 535,000 | | | | 577,637 | |
12/01/44 | | | 5.450% | | | | 545,000 | | | | 645,071 | |
|
Angus Chemical Co.(a) | |
02/15/23 | | | 8.750% | | | | 397,000 | | | | 404,940 | |
|
Ashland, Inc.(b) | |
08/15/22 | | | 4.750% | | | | 325,000 | | | | 340,437 | |
|
Axalta Coating Systems LLC(a) | |
08/15/24 | | | 4.875% | | | | 274,000 | | | | 285,645 | |
|
Braskem Finance Ltd.(a) | |
04/15/21 | | | 5.750% | | | | 200,000 | | | | 209,500 | |
|
CF Industries, Inc. | |
03/15/44 | | | 5.375% | | | | 1,350,000 | | | | 1,311,229 | |
|
Celanese U.S. Holdings LLC | |
06/15/21 | | | 5.875% | | | | 874,000 | | | | 996,902 | |
11/15/22 | | | 4.625% | | | | 108,000 | | | | 117,720 | |
|
Chemours Co. (The) | |
05/15/23 | | | 6.625% | | | | 588,000 | | | | 564,480 | |
05/15/25 | | | 7.000% | | | | 582,000 | | | | 556,901 | |
|
Compass Minerals International, Inc.(a) | |
07/15/24 | | | 4.875% | | | | 200,000 | | | | 191,500 | |
|
Dow Chemical Co. (The) | |
05/15/19 | | | 8.550% | | | | 500,000 | | | | 590,103 | |
|
Eastman Chemical Co. | |
03/15/25 | | | 3.800% | | | | 2,250,000 | | | | 2,379,834 | |
|
Eco Services Operations LLC/Finance Corp.(a) | |
11/01/22 | | | 8.500% | | | | 338,000 | | | | 349,830 | |
|
Huntsman International LLC | |
11/15/20 | | | 4.875% | | | | 90,000 | | | | 93,375 | |
11/15/22 | | | 5.125% | | | | 33,000 | | | | 34,073 | |
|
INEOS Group Holdings SA(a) | |
02/15/19 | | | 5.875% | | | | 403,000 | | | | 413,075 | |
08/01/24 | | | 5.625% | | | | 287,000 | | | | 286,283 | |
| | | | | | | | | | | | |
| Corporate Bonds & Notes (continued) | |
| Issuer | | Coupon
Rate | | | Principal
Amount ($) | | | Value ($) | |
Incitec Pivot Finance LLC(a) | |
12/10/19 | | | 6.000% | | | | 1,000,000 | | | | 1,084,152 | |
|
LYB International Finance BV | |
03/15/44 | | | 4.875% | | | | 730,000 | | | | 795,280 | |
|
LyondellBasell Industries NV | |
02/26/55 | | | 4.625% | | | | 1,800,000 | | | | 1,805,969 | |
|
Mosaic Co. (The) | |
11/15/43 | | | 5.625% | | | | 1,000,000 | | | | 1,097,014 | |
|
PQ Corp.(a) | |
11/15/22 | | | 6.750% | | | | 395,000 | | | | 419,194 | |
|
Platform Specialty Products Corp.(a) | |
05/01/21 | | | 10.375% | | | | 266,000 | | | | 279,300 | |
02/01/22 | | | 6.500% | | | | 1,053,000 | | | | 997,717 | |
|
WR Grace & Co.(a) | |
10/01/21 | | | 5.125% | | | | 2,375,000 | | | | 2,529,375 | |
10/01/24 | | | 5.625% | | | | 320,000 | | | | 345,600 | |
|
Westlake Chemical Corp.(a) | |
08/15/26 | | | 3.600% | | | | 3,105,000 | | | | 3,115,756 | |
| | | | | | | | | | | | | |
Total | | | | | | | | | | | 24,376,436 | |
| | | |
| | | | | | | | | | | | |
CONSTRUCTION MACHINERY 0.4% | |
Caterpillar Financial Services Corp. | |
11/25/16 | | | 1.000% | | | | 1,500,000 | | | | 1,501,086 | |
05/18/19 | | | 1.350% | | | | 9,350,000 | | | | 9,354,151 | |
08/09/21 | | | 1.700% | | | | 6,400,000 | | | | 6,363,987 | |
|
John Deere Capital Corp.(b) | |
01/16/18 | | | 0.969% | | | | 2,665,000 | | | | 2,669,632 | |
|
United Rentals North America, Inc. | |
06/15/23 | | | 6.125% | | | | 46,000 | | | | 48,358 | |
07/15/23 | | | 4.625% | | | | 175,000 | | | | 179,034 | |
07/15/25 | | | 5.500% | | | | 5,300,000 | | | | 5,465,625 | |
09/15/26 | | | 5.875% | | | | 495,000 | | | | 514,800 | |
| | | | | | | | | | | | | |
Total | | | | | | | | | | | 26,096,673 | |
| | | |
| | | | | | | | | | | | |
CONSUMER CYCLICAL SERVICES 0.3% | |
APX Group, Inc. | |
12/01/19 | | | 6.375% | | | | 342,000 | | | | 350,974 | |
12/01/20 | | | 8.750% | | | | 136,000 | | | | 130,730 | |
12/01/22 | | | 7.875% | | | | 629,000 | | | | 660,450 | |
|
APX Group, Inc.(a) | |
12/01/22 | | | 7.875% | | | | 93,000 | | | | 97,650 | |
|
Alibaba Group Holding Ltd. | |
11/28/19 | | | 2.500% | | | | 6,130,000 | | | | 6,242,424 | |
|
Automatic Data Processing, Inc. | |
09/15/25 | | | 3.375% | | | | 1,360,000 | | | | 1,483,397 | |
|
Hearthside Group Holdings LLC/Finance Co.(a) | |
05/01/22 | | | 6.500% | | | | 550,000 | | | | 529,375 | |
|
IHS Markit Ltd.(a) | |
11/01/22 | | | 5.000% | | | | 605,000 | | | | 642,812 | |
|
Interval Acquisition Corp. | |
04/15/23 | | | 5.625% | | | | 740,000 | | | | 765,900 | |
The accompanying Notes to Financial Statements are an integral part of this statement.
| | | | | | |
| | |
| | | | ACTIVE PORTFOLIOS® MULTI-MANAGER TOTAL RETURN BOND FUND | | |
PORTFOLIO OF INVESTMENTS (continued)
August 31, 2016
| | | | | | | | | | | | |
| Corporate Bonds & Notes (continued) | |
| Issuer | | Coupon
Rate | | | Principal
Amount ($) | | | Value ($) | |
Visa, Inc. | |
12/14/25 | | | 3.150% | | | | 690,000 | | | | 735,864 | |
|
eBay, Inc. | |
03/09/22 | | | 3.800% | | | | 5,640,000 | | | | 6,029,386 | |
| | | | | | | | | | | | | |
Total | | | | | | | | | | | 17,668,962 | |
| | | |
| | | | | | | | | | | | |
CONSUMER PRODUCTS 0.2% | |
First Quality Finance Co., Inc.(a) | |
05/15/21 | | | 4.625% | | | | 600,000 | | | | 598,500 | |
|
Newell, Inc. | |
04/01/26 | | | 4.200% | | | | 4,150,000 | | | | 4,533,970 | |
|
Prestige Brands, Inc.(a) | |
12/15/21 | | | 5.375% | | | | 675,000 | | | | 699,469 | |
03/01/24 | | | 6.375% | | | | 434,000 | | | | 463,295 | |
|
Scotts Miracle-Gro Co. (The)(a) | |
10/15/23 | | | 6.000% | | | | 746,000 | | | | 797,287 | |
|
Serta Simmons Bedding LLC(a) | |
10/01/20 | | | 8.125% | | | | 745,000 | | | | 776,663 | |
|
Spectrum Brands, Inc. | |
11/15/22 | | | 6.625% | | | | 495,000 | | | | 529,650 | |
12/15/24 | | | 6.125% | | | | 175,000 | | | | 188,781 | |
07/15/25 | | | 5.750% | | | | 747,000 | | | | 809,561 | |
|
Springs Industries, Inc. | |
06/01/21 | | | 6.250% | | | | 3,194,000 | | | | 3,289,820 | |
|
Tempur Sealy International, Inc. | |
10/15/23 | | | 5.625% | | | | 571,000 | | | | 598,836 | |
|
Tempur Sealy International, Inc.(a) | |
06/15/26 | | | 5.500% | | | | 151,000 | | | | 157,720 | |
|
Valvoline, Inc.(a) | |
07/15/24 | | | 5.500% | | | | 54,000 | | | | 56,673 | |
| | | | | | | | | | | | | |
Total | | | | | | | | | | | 13,500,225 | |
|
| |
DIVERSIFIED MANUFACTURING 0.9% | |
EnerSys(a) | | | | | | | | | | | | |
04/30/23 | | | 5.000% | | | | 200,000 | | | | 200,500 | |
| | | |
Entegris, Inc.(a) | | | | | | | | | | | | |
04/01/22 | | | 6.000% | | | | 537,000 | | | | 558,480 | |
|
Fortive Corp.(a) | |
06/15/26 | | | 3.150% | | | | 1,125,000 | | | | 1,171,953 | |
|
General Electric Co. | |
01/08/20 | | | 5.500% | | | | 1,432,000 | | | | 1,625,823 | |
10/17/21 | | | 4.650% | | | | 487,000 | | | | 556,089 | |
09/07/22 | | | 3.150% | | | | 337,000 | | | | 360,050 | |
01/09/23 | | | 3.100% | | | | 1,146,000 | | | | 1,224,917 | |
01/14/38 | | | 5.875% | | | | 1,196,000 | | | | 1,636,754 | |
|
General Electric Co.(b) | |
08/15/36 | | | 1.297% | | | | 5,380,000 | | | | 4,576,814 | |
|
Junior Subordinated | |
12/31/49 | | | 5.000% | | | | 39,978,000 | | | | 42,876,405 | |
|
Manitowoc Foodservice, Inc.(a) | |
02/15/24 | | | 9.500% | | | | 102,000 | | | | 115,260 | |
| | | | | | | | | | | | |
| Corporate Bonds & Notes (continued) | |
| Issuer | | Coupon
Rate | | | Principal
Amount ($) | | | Value ($) | |
Milacron LLC/Finance Corp(a) | |
02/15/21 | | | 7.750% | | | | 25,000 | | | | 26,125 | |
|
Roper Technologies, Inc. | |
12/15/25 | | | 3.850% | | | | 440,000 | | | | 466,895 | |
|
SPX FLOW, Inc.(a) | |
08/15/24 | | | 5.625% | | | | 98,000 | | | | 100,695 | |
08/15/26 | | | 5.875% | | | | 361,000 | | | | 372,732 | |
|
Valmont Industries, Inc. | |
10/01/54 | | | 5.250% | | | | 2,050,000 | | | | 1,941,202 | |
|
WESCO Distribution, Inc.(a) | |
06/15/24 | | | 5.375% | | | | 153,000 | | | | 156,443 | |
|
WW Grainger, Inc. | |
05/15/46 | | | 3.750% | | | | 3,125,000 | | | | 3,308,391 | |
|
Zekelman Industries, Inc.(a) | |
06/15/23 | | | 9.875% | | | | 82,000 | | | | 87,740 | |
| | | | | | | | | | | | | |
Total | | | | | | | | | | | 61,363,268 | |
| | | |
| | | | | | | | | | | | |
ELECTRIC 2.8% | |
AEP Texas Central Co. | |
02/15/33 | | | 6.650% | | | | 1,730,000 | | | | 2,237,601 | |
|
AEP Texas Central Co.(a) | |
10/01/25 | | | 3.850% | | | | 880,000 | | | | 950,756 | |
|
AES Corp. (The) | |
07/01/21 | | | 7.375% | | | | 221,000 | | | | 253,598 | |
05/15/26 | | | 6.000% | | | | 346,000 | | | | 367,193 | |
|
Alabama Power Co. | |
01/02/46 | | | 4.300% | | | | 985,000 | | | | 1,135,475 | |
|
Ameren Corp. | |
02/15/26 | | | 3.650% | | | | 590,000 | | | | 632,782 | |
|
American Electric Power Co., Inc. | |
12/15/22 | | | 2.950% | | | | 750,000 | | | | 782,654 | |
|
Arizona Public Service Co. | |
11/15/45 | | | 4.350% | | | | 2,495,000 | | | | 2,893,095 | |
|
Berkshire Hathaway Energy Co. | |
02/01/25 | | | 3.500% | | | | 1,075,000 | | | | 1,158,259 | |
|
Calpine Corp. | |
01/15/23 | | | 5.375% | | | | 692,000 | | | | 692,429 | |
01/15/25 | | | 5.750% | | | | 5,550,000 | | | | 5,529,187 | |
|
Calpine Corp.(a) | |
01/15/22 | | | 6.000% | | | | 214,000 | | | | 224,165 | |
01/15/24 | | | 5.875% | | | | 75,000 | | | | 79,313 | |
|
Cleco Corporate Holdings LLC(a) | |
05/01/26 | | | 3.743% | | | | 1,920,000 | | | | 2,018,152 | |
05/01/46 | | | 4.973% | | | | 1,185,000 | | | | 1,326,379 | |
|
Commonwealth Edison Co. | |
06/15/46 | | | 3.650% | | | | 1,920,000 | | | | 2,028,017 | |
|
Consolidated Edison Co. of New York, Inc. | |
04/01/18 | | | 5.850% | | | | 3,000,000 | | | | 3,212,349 | |
06/15/46 | | | 3.850% | | | | 3,730,000 | | | | 4,025,479 | |
|
DPL, Inc. | |
10/15/21 | | | 7.250% | | | | 5,875,000 | | | | 5,924,937 | |
The accompanying Notes to Financial Statements are an integral part of this statement.
| | | | | | |
| | |
| | | | ACTIVE PORTFOLIOS® MULTI-MANAGER TOTAL RETURN BOND FUND | | |
PORTFOLIO OF INVESTMENTS (continued)
August 31, 2016
| | | | | | | | | | | | |
| Corporate Bonds & Notes (continued) | |
| Issuer | | Coupon
Rate | | | Principal
Amount ($) | | | Value ($) | |
DTE Electric Co. | |
06/01/46 | | | 3.700% | | | | 2,985,000 | | | | 3,217,597 | |
|
Dominion Resources, Inc. | |
08/15/26 | | | 2.850% | | | | 750,000 | | | | 751,847 | |
|
Dominion Resources, Inc.(b)
Junior Subordinated | |
07/01/19 | | | 2.962% | | | | 845,000 | | | | 868,325 | |
|
Duke Energy Corp. | |
09/01/26 | | | 2.650% | | | | 8,675,000 | | | | 8,640,829 | |
09/01/46 | | | 3.750% | | | | 7,390,000 | | | | 7,464,129 | |
|
Duke Energy Ohio, Inc. | |
06/15/46 | | | 3.700% | | | | 981,000 | | | | 1,033,179 | |
|
Duke Energy Progress LLC | |
03/30/44 | | | 4.375% | | | | 960,000 | | | | 1,112,484 | |
|
Duke Energy Progress, Inc. | |
08/15/45 | | | 4.200% | | | | 2,325,000 | | | | 2,642,860 | |
|
Duquesne Light Holdings, Inc.(a) | |
09/15/20 | | | 6.400% | | | | 5,000,000 | | | | 5,673,960 | |
|
Dynegy, Inc. | |
11/01/22 | | | 7.375% | | | | 5,000,000 | | | | 4,937,500 | |
06/01/23 | | | 5.875% | | | | 300,000 | | | | 272,250 | |
11/01/24 | | | 7.625% | | | | 400,000 | | | | 392,000 | |
|
Emera US Finance LP(a) | |
06/15/26 | | | 3.550% | | | | 1,160,000 | | | | 1,221,879 | |
|
Emera, Inc.
Subordinated(b) | |
06/15/76 | | | 6.750% | | | | 9,895,000 | | | | 10,698,969 | |
|
Entergy Louisiana LLC | |
06/01/31 | | | 3.050% | | | | 3,465,000 | | | | 3,538,725 | |
|
Entergy Mississippi, Inc. | |
07/01/23 | | | 3.100% | | | | 2,000,000 | | | | 2,063,780 | |
|
Exelon Corp. | |
06/15/25 | | | 3.950% | | | | 3,362,000 | | | | 3,675,369 | |
|
Exelon Generation Co. LLC | |
10/01/41 | | | 5.750% | | | | 2,000,000 | | | | 2,180,688 | |
|
FirstEnergy Corp. | |
03/15/18 | | | 2.750% | | | | 530,000 | | | | 535,391 | |
|
FirstEnergy Transmission LLC(a) | |
07/15/44 | | | 5.450% | | | | 1,000,000 | | | | 1,134,819 | |
|
Gulf Power Co. | |
10/01/44 | | | 4.550% | | | | 1,350,000 | | | | 1,473,293 | |
|
IPALCO Enterprises, Inc. | |
05/01/18 | | | 5.000% | | | | 3,130,000 | | | | 3,286,500 | |
|
ITC Holdings Corp. | |
06/15/24 | | | 3.650% | | | | 3,810,000 | | | | 3,999,464 | |
|
Jersey Central Power & Light Co.(a) | |
04/01/24 | | | 4.700% | | | | 500,000 | | | | 547,007 | |
|
Kansas City Power & Light Co. | |
08/15/25 | | | 3.650% | | | | 665,000 | | | | 700,504 | |
|
MidAmerican Energy Co. | |
05/01/46 | | | 4.250% | | | | 3,433,000 | | | | 4,019,174 | |
| | | | | | | | | | | | |
| Corporate Bonds & Notes (continued) | |
| Issuer | | Coupon
Rate | | | Principal
Amount ($) | | | Value ($) | |
NRG Energy, Inc. | |
07/15/22 | | | 6.250% | | | | 510,000 | | | | 520,837 | |
03/15/23 | | | 6.625% | | | | 5,309,000 | | | | 5,415,180 | |
05/01/24 | | | 6.250% | | | | 227,000 | | | | 225,298 | |
|
NRG Energy, Inc.(a) | |
05/15/26 | | | 7.250% | | | | 260,000 | | | | 270,010 | |
01/15/27 | | | 6.625% | | | | 405,000 | | | | 405,757 | |
|
NRG Yield Operating LLC | |
08/15/24 | | | 5.375% | | | | 1,036,000 | | | | 1,080,030 | |
|
National Rural Utilities Cooperative Finance Corp. | |
11/01/18 | | | 10.375% | | | | 2,500,000 | | | | 2,968,260 | |
|
National Rural Utilities Cooperative Finance Corp.(b)
Subordinated | |
04/20/46 | | | 5.250% | | | | 1,750,000 | | | | 1,847,414 | |
|
NextEra Energy Capital Holdings, Inc. | |
06/15/23 | | | 3.625% | | | | 3,000,000 | | | | 3,176,880 | |
|
NextEra Energy Capital Holdings, Inc.(c) | |
09/01/18 | | | 1.649% | | | | 6,440,000 | | | | 6,456,454 | |
|
Oncor Electric Delivery Co. LLC | |
04/01/25 | | | 2.950% | | | | 2,560,000 | | | | 2,679,562 | |
09/30/40 | | | 5.250% | | | | 4,000,000 | | | | 5,180,404 | |
04/01/45 | | | 3.750% | | | | 2,655,000 | | | | 2,841,944 | |
|
PPL Capital Funding, Inc. | |
06/15/22 | | | 4.200% | | | | 1,508,000 | | | | 1,646,596 | |
12/01/22 | | | 3.500% | | | | 1,535,000 | | | | 1,629,005 | |
06/01/23 | | | 3.400% | | | | 3,682,000 | | | | 3,887,246 | |
03/15/24 | | | 3.950% | | | | 1,200,000 | | | | 1,299,317 | |
05/15/26 | | | 3.100% | | | | 4,355,000 | | | | 4,437,331 | |
|
PSEG Power LLC | |
11/15/18 | | | 2.450% | | | | 840,000 | | | | 850,152 | |
|
Pacific Gas & Electric Co. | |
06/15/23 | | | 3.250% | | | | 2,291,000 | | | | 2,436,950 | |
03/01/26 | | | 2.950% | | | | 3,140,000 | | | | 3,275,748 | |
03/01/34 | | | 6.050% | | | | 235,000 | | | | 316,683 | |
|
Public Service Electric & Gas Co. | |
11/01/45 | | | 4.150% | | | | 1,980,000 | | | | 2,296,311 | |
|
San Diego Gas & Electric Co. | |
05/15/26 | | | 2.500% | | | | 585,000 | | | | 592,149 | |
|
Southern Co. (The) | |
07/01/26 | | | 3.250% | | | | 2,520,000 | | | | 2,622,854 | |
07/01/46 | | | 4.400% | | | | 2,795,000 | | | | 3,079,145 | |
|
Toledo Edison Co. (The) | |
05/15/37 | | | 6.150% | | | | 2,231,000 | | | | 2,793,384 | |
|
TransAlta Corp. | |
06/03/17 | | | 1.900% | | | | 3,413,000 | | | | 3,415,113 | |
|
Tucson Electric Power Co. | |
03/15/23 | | | 3.850% | | | | 3,100,000 | | | | 3,253,515 | |
|
Virginia Electric & Power Co. | |
06/30/19 | | | 5.000% | | | | 1,280,000 | | | | 1,389,893 | |
|
WEC Energy Group, Inc. | |
06/15/25 | | | 3.550% | | | | 1,100,000 | | | | 1,186,491 | |
| | | | | | | | | | | | | |
Total | | | | | | | | | | | 185,030,255 | |
The accompanying Notes to Financial Statements are an integral part of this statement.
| | | | | | |
| | |
| | | | ACTIVE PORTFOLIOS® MULTI-MANAGER TOTAL RETURN BOND FUND | | |
PORTFOLIO OF INVESTMENTS (continued)
August 31, 2016
| | | | | | | | | | | | |
| Corporate Bonds & Notes (continued) | |
| Issuer | | Coupon
Rate | | | Principal
Amount ($) | | | Value ($) | |
ENVIRONMENTAL —% | |
Waste Management, Inc. | |
05/15/23 | | | 2.400% | | | | 2,445,000 | | | | 2,474,990 | |
| | | |
| | | | | | | | | | | | |
FINANCE COMPANIES 0.7% | |
AerCap Ireland Capital Ltd./Global Aviation Trust | |
10/30/20 | | | 4.625% | | | | 1,413,000 | | | | 1,497,603 | |
05/15/21 | | | 4.500% | | | | 7,241,000 | | | | 7,639,255 | |
10/01/21 | | | 5.000% | | | | 1,082,000 | | | | 1,165,855 | |
07/01/22 | | | 4.625% | | | | 150,000 | | | | 159,188 | |
|
Aircastle Ltd. | |
03/15/21 | | | 5.125% | | | | 63,000 | | | | 68,355 | |
02/15/22 | | | 5.500% | | | | 529,000 | | | | 574,626 | |
04/01/23 | | | 5.000% | | | | 34,000 | | | | 36,040 | |
|
Brookfield Finance, Inc. | |
06/02/26 | | | 4.250% | | | | 4,035,000 | | | | 4,188,685 | |
|
CIT Group, Inc. | |
05/15/20 | | | 5.375% | | | | 1,154,000 | | | | 1,233,337 | |
08/01/23 | | | 5.000% | | | | 325,000 | | | | 344,500 | |
|
CIT Group, Inc.(a) | |
02/15/19 | | | 5.500% | | | | 312,000 | | | | 330,330 | |
|
GE Capital International Funding Co. Unlimited Co. | |
11/15/20 | | | 2.342% | | | | 5,522,000 | | | | 5,687,373 | |
11/15/25 | | | 3.373% | | | | 2,980,000 | | | | 3,256,869 | |
11/15/35 | | | 4.418% | | | | 5,630,000 | | | | 6,439,740 | |
|
HSBC Finance Corp.
Subordinated | |
01/15/21 | | | 6.676% | | | | 6,916,000 | | | | 7,981,410 | |
|
International Lease Finance Corp. | |
12/15/20 | | | 8.250% | | | | 321,000 | | | | 383,996 | |
08/15/22 | | | 5.875% | | | | 625,000 | | | | 705,469 | |
|
Navient Corp. | |
06/15/18 | | | 8.450% | | | | 595,000 | | | | 648,550 | |
03/25/20 | | | 8.000% | | | | 51,000 | | | | 55,335 | |
10/26/20 | | | 5.000% | | | | 19,000 | | | | 19,095 | |
07/26/21 | | | 6.625% | | | | 213,000 | | | | 219,656 | |
01/25/22 | | | 7.250% | | | | 61,000 | | | | 63,364 | |
01/25/23 | | | 5.500% | | | | 50,000 | | | | 47,500 | |
10/25/24 | | | 5.875% | | | | 350,000 | | | | 329,875 | |
|
OneMain Financial Holdings LLC(a) | |
12/15/19 | | | 6.750% | | | | 69,000 | | | | 72,364 | |
12/15/21 | | | 7.250% | | | | 696,000 | | | | 729,060 | |
|
Provident Funding Associates LP/Finance Corp.(a) | |
06/15/21 | | | 6.750% | | | | 287,000 | | | | 283,412 | |
|
Quicken Loans, Inc.(a) | |
05/01/25 | | | 5.750% | | | | 146,000 | | | | 145,679 | |
|
Springleaf Finance Corp. | |
12/15/20 | | | 8.250% | | | | 141,000 | | | | 154,043 | |
10/01/21 | | | 7.750% | | | | 184,000 | | | | 193,200 | |
10/01/23 | | | 8.250% | | | | 62,000 | | | | 64,984 | |
| | | | | | | | | | | | | |
Total | | | | | | | | | | | 44,718,748 | |
| | | | | | | | | | | | |
| Corporate Bonds & Notes (continued) | |
| Issuer | | Coupon
Rate | | | Principal
Amount ($) | | | Value ($) | |
FOOD AND BEVERAGE 1.5% | |
Acosta, Inc.(a) | | | | | | | | | | | | |
10/01/22 | | | 7.750% | | | | 750,000 | | | | 691,875 | |
|
Anheuser-Busch InBev Finance, Inc. | |
02/01/23 | | | 3.300% | | | | 8,745,000 | | | | 9,183,308 | |
02/01/26 | | | 3.650% | | | | 21,733,000 | | | | 23,182,504 | |
02/01/36 | | | 4.700% | | | | 2,596,000 | | | | 3,012,546 | |
02/01/46 | | | 4.900% | | | | 3,295,000 | | | | 3,996,588 | |
|
Aramark Services, Inc. | |
03/15/20 | | | 5.750% | | | | 113,000 | | | | 116,390 | |
|
B&G Foods, Inc. | |
06/01/21 | | | 4.625% | | | | 86,000 | | | | 88,688 | |
|
Bottling Group LLC | |
01/15/19 | | | 5.125% | | | | 1,980,000 | | | | 2,159,552 | |
|
Bunge Ltd. Finance Corp. | |
08/15/26 | | | 3.250% | | | | 3,220,000 | | | | 3,243,264 | |
|
Coca-Cola Co. (The) | |
05/30/19 | | | 1.375% | | | | 6,260,000 | | | | 6,304,433 | |
|
Coca-Cola Co. (The)(c) | |
09/01/26 | | | 2.250% | | | | 5,070,000 | | | | 5,071,551 | |
|
Coca-Cola Femsa SAB de CV | |
11/26/18 | | | 2.375% | | | | 1,000,000 | | | | 1,017,793 | |
02/15/20 | | | 4.625% | | | | 1,500,000 | | | | 1,626,118 | |
| | | |
ConAgra Foods, Inc. | | | | | | | | | | | | |
01/25/23 | | | 3.200% | | | | 3,609,000 | | | | 3,762,960 | |
|
Constellation Brands, Inc. | |
11/15/19 | | | 3.875% | | | | 100,000 | | | | 105,250 | |
11/15/24 | | | 4.750% | | | | 669,000 | | | | 729,210 | |
12/01/25 | | | 4.750% | | | | 27,000 | | | | 29,379 | |
|
Cott Beverages, Inc. | |
01/01/20 | | | 6.750% | | | | 2,000,000 | | | | 2,095,000 | |
|
DS Services of America, Inc.(a) | |
09/01/21 | | | 10.000% | | | | 1,500,000 | | | | 1,683,750 | |
|
FAGE International SA/USA Dairy Industry, Inc.(a) | |
08/15/26 | | | 5.625% | | | | 258,000 | | | | 266,708 | |
|
Fomento Economico Mexicano SAB de CV | |
05/10/23 | | | 2.875% | | | | 150,000 | | | | 151,140 | |
|
Hershey Co. (The) | |
08/15/26 | | | 2.300% | | | | 2,780,000 | | | | 2,771,641 | |
|
JBS USA LUX SA/Finance, Inc.(a) | |
06/15/25 | | | 5.750% | | | | 100,000 | | | | 101,500 | |
|
Kraft Heinz Foods Co. | |
06/01/26 | | | 3.000% | | | | 4,840,000 | | | | 4,904,556 | |
06/01/46 | | | 4.375% | | | | 3,960,000 | | | | 4,283,694 | |
|
Mead Johnson Nutrition Co. | |
11/15/25 | | | 4.125% | | | | 640,000 | | | | 700,981 | |
|
Molson Coors Brewing Co. | |
07/15/21 | | | 2.100% | | | | 1,400,000 | | | | 1,410,101 | |
07/15/26 | | | 3.000% | | | | 3,070,000 | | | | 3,109,149 | |
05/01/42 | | | 5.000% | | | | 2,445,000 | | | | 2,855,440 | |
07/15/46 | | | 4.200% | | | | 840,000 | | | | 887,336 | |
The accompanying Notes to Financial Statements are an integral part of this statement.
| | | | | | |
| | |
| | | | ACTIVE PORTFOLIOS® MULTI-MANAGER TOTAL RETURN BOND FUND | | |
PORTFOLIO OF INVESTMENTS (continued)
August 31, 2016
| | | | | | | | | | | | |
| Corporate Bonds & Notes (continued) | |
| Issuer | | Coupon
Rate | | | Principal
Amount ($) | | | Value ($) | |
PepsiCo, Inc. | |
01/07/19 | | | 2.250% | | | | 3,715,000 | | | | 3,805,769 | |
04/30/25 | | | 2.750% | | | | 1,300,000 | | | | 1,361,890 | |
07/17/45 | | | 4.600% | | | | 480,000 | | | | 585,093 | |
|
Pinnacle Foods Finance LLC/Corp. | |
05/01/21 | | | 4.875% | | | | 450,000 | | | | 463,500 | |
|
Pinnacle Foods Finance LLC/Corp.(a) | |
01/15/24 | | | 5.875% | | | | 156,000 | | | | 168,090 | |
|
Post Holdings, Inc.(a) | |
12/15/22 | | | 6.000% | | | | 18,000 | | | | 19,103 | |
03/15/24 | | | 7.750% | | | | 834,000 | | | | 926,782 | |
07/15/25 | | | 8.000% | | | | 425,000 | | | | 485,563 | |
08/15/26 | | | 5.000% | | | | 438,000 | | | | 436,905 | |
|
Smithfield Foods, Inc.(a) | |
08/01/21 | | | 5.875% | | | | 425,000 | | | | 444,125 | |
|
Treehouse Foods, Inc.(a) | |
02/15/24 | | | 6.000% | | | | 129,000 | | | | 140,288 | |
| | | |
Tyson Foods, Inc. | | | | | | | | | | | | |
08/15/44 | | | 5.150% | | | | 200,000 | | | | 242,794 | |
|
WhiteWave Foods Co. (The) | |
10/01/22 | | | 5.375% | | | | 399,000 | | | | 449,873 | |
| | | | | | | | | | | | | |
Total | | | | | | | | | | | 99,072,180 | |
| | | |
| | | | | | | | | | | | |
GAMING 0.3% | |
Boyd Gaming Corp. | |
05/15/23 | | | 6.875% | | | | 439,000 | | | | 474,120 | |
|
Boyd Gaming Corp.(a) | |
04/01/26 | | | 6.375% | | | | 211,000 | | | | 224,715 | |
|
Churchill Downs, Inc.(a) | |
12/15/21 | | | 5.375% | | | | 1,070,000 | | | | 1,112,800 | |
|
GLP Capital LP/Financing II, Inc. | |
11/01/23 | | | 5.375% | | | | 506,000 | | | | 554,070 | |
04/15/26 | | | 5.375% | | | | 248,000 | | | | 270,940 | |
|
International Game Technology PLC(a) | |
02/15/22 | | | 6.250% | | | | 364,000 | | | | 392,210 | |
02/15/25 | | | 6.500% | | | | 416,000 | | | | 450,944 | |
|
MGM Growth Properties Operating Partnership LP/Finance
Co-Issuer, Inc.(a) | |
09/01/26 | | | 4.500% | | | | 1,915,000 | | | | 1,913,803 | |
|
MGM Growth Properties Operating Partnership LP/MGP Finance
Co-Issuer, Inc.(a) | |
05/01/24 | | | 5.625% | | | | 213,000 | | | | 231,105 | |
|
MGM Resorts International | |
03/01/18 | | | 11.375% | | | | 611,000 | | | | 688,902 | |
03/31/20 | | | 5.250% | | | | 350,000 | | | | 374,500 | |
10/01/20 | | | 6.750% | | | | 304,000 | | | | 339,720 | |
12/15/21 | | | 6.625% | | | | 168,000 | | | | 188,580 | |
03/15/23 | | | 6.000% | | | | 4,623,000 | | | | 5,018,729 | |
09/01/26 | | | 4.625% | | | | 397,000 | | | | 393,030 | |
|
Penn National Gaming, Inc. | |
11/01/21 | | | 5.875% | | | | 450,000 | | | | 468,000 | |
|
Pinnacle Entertainment, Inc.(a) | |
05/01/24 | | | 5.625% | | | | 3,209,000 | | | | 3,273,180 | |
| | | | | | | | | | | | |
| Corporate Bonds & Notes (continued) | |
| Issuer | | Coupon
Rate | | | Principal
Amount ($) | | | Value ($) | |
Rivers Pittsburgh Borrower LP/Finance Corp.(a) | |
08/15/21 | | | 6.125% | | | | 101,000 | | | | 104,030 | |
|
Scientific Games International, Inc. | |
12/01/22 | | | 10.000% | | | | 282,000 | | | | 260,850 | |
|
Scientific Games International, Inc.(a) | |
01/01/22 | | | 7.000% | | | | 1,316,000 | | | | 1,398,250 | |
|
Seminole Tribe of Florida, Inc.(a) | |
10/01/20 | | | 6.535% | | | | 125,000 | | | | 126,250 | |
|
Tunica-Biloxi Gaming Authority(a)(d) | |
11/15/16 | | | 0.000% | | | | 99,000 | | | | 40,590 | |
| | | | | | | | | | | | | |
Total | | | | | | | | | | | 18,299,318 | |
| | | |
| | | | | | | | | | | | |
HEALTH CARE 1.3% | |
Acadia Healthcare Co., Inc. | |
07/01/22 | | | 5.125% | | | | 31,000 | | | | 30,923 | |
02/15/23 | | | 5.625% | | | | 50,000 | | | | 50,875 | |
03/01/24 | | | 6.500% | | | | 514,000 | | | | 540,342 | |
| | | |
Alere, Inc.(a) | | | | | | | | | | | | |
07/01/23 | | | 6.375% | | | | 386,000 | | | | 394,685 | |
| | | |
Amsurg Corp. | | | | | | | | | | | | |
07/15/22 | | | 5.625% | | | | 486,000 | | | | 501,795 | |
|
Barnabas Health, Inc. | |
07/01/28 | | | 4.000% | | | | 4,000,000 | | | | 4,218,936 | |
|
Baxter International, Inc. | |
08/15/26 | | | 2.600% | | | | 2,385,000 | | | | 2,361,415 | |
|
Becton Dickinson and Co. | |
12/15/24 | | | 3.734% | | | | 340,000 | | | | 369,722 | |
12/15/44 | | | 4.685% | | | | 320,000 | | | | 371,521 | |
|
CHS/Community Health Systems, Inc. | |
11/15/19 | | | 8.000% | | | | 203,000 | | | | 192,089 | |
07/15/20 | | | 7.125% | | | | 4,300,000 | | | | 3,845,834 | |
08/01/21 | | | 5.125% | | | | 400,000 | | | | 394,500 | |
02/01/22 | | | 6.875% | | | | 1,385,000 | | | | 1,149,550 | |
|
CR Bard, Inc. | |
05/15/26 | | | 3.000% | | | | 685,000 | | | | 700,670 | |
|
Catholic Health Initiatives | |
11/01/22 | | | 2.950% | | | | 1,970,000 | | | | 1,981,014 | |
|
Change Healthcare Holdings, Inc. | |
12/31/19 | | | 11.000% | | | | 363,000 | | | | 383,419 | |
|
Change Healthcare Holdings, Inc.(a) | |
02/15/21 | | | 6.000% | | | | 478,000 | | | | 506,680 | |
|
ConvaTec Finance International SA
Junior Subordinated PIK(a) | |
01/15/19 | | | 8.250% | | | | 321,000 | | | | 321,485 | |
|
Crimson Merger Sub, Inc.(a) | |
05/15/22 | | | 6.625% | | | | 975,000 | | | | 872,625 | |
|
DaVita, Inc. | |
08/15/22 | | | 5.750% | | | | 667,000 | | | | 699,516 | |
07/15/24 | | | 5.125% | | | | 1,721,000 | | | | 1,776,932 | |
05/01/25 | | | 5.000% | | | | 500,000 | | | | 506,750 | |
|
Express Scripts Holding Co. | |
07/15/23 | | | 3.000% | | | | 6,590,000 | | | | 6,699,084 | |
The accompanying Notes to Financial Statements are an integral part of this statement.
| | | | | | |
| | |
| | | | ACTIVE PORTFOLIOS® MULTI-MANAGER TOTAL RETURN BOND FUND | | |
PORTFOLIO OF INVESTMENTS (continued)
August 31, 2016
| | | | | | | | | | | | |
| Corporate Bonds & Notes (continued) | |
| Issuer | | Coupon
Rate | | | Principal
Amount ($) | | | Value ($) | |
Fresenius Medical Care U.S. Finance II, Inc.(a) | |
07/31/19 | | | 5.625% | | | | 87,000 | | | | 95,265 | |
01/31/22 | | | 5.875% | | | | 95,000 | | | | 108,063 | |
10/15/24 | | | 4.750% | | | | 413,000 | | | | 441,910 | |
|
Fresenius Medical Care US Finance II, Inc.(a) | |
10/15/20 | | | 4.125% | | | | 525,000 | | | | 553,875 | |
|
HCA, Inc. | |
02/15/20 | | | 6.500% | | | | 2,808,000 | | | | 3,102,840 | |
02/15/22 | | | 7.500% | | | | 518,000 | | | | 590,520 | |
03/15/22 | | | 5.875% | | | | 275,000 | | | | 302,500 | |
05/01/23 | | | 5.875% | | | | 53,000 | | | | 56,313 | |
03/15/24 | | | 5.000% | | | | 250,000 | | | | 265,000 | |
02/01/25 | | | 5.375% | | | | 6,280,000 | | | | 6,468,400 | |
04/15/25 | | | 5.250% | | | | 1,968,000 | | | | 2,108,220 | |
02/15/27 | | | 4.500% | | | | 442,000 | | | | 445,868 | |
|
HealthSouth Corp. | |
11/01/24 | | | 5.750% | | | | 195,000 | | | | 202,215 | |
09/15/25 | | | 5.750% | | | | 30,000 | | | | 31,388 | |
|
Kinetic Concepts, Inc./KCI U.S.A., Inc. | |
11/01/18 | | | 10.500% | | | | 64,000 | | | | 65,600 | |
|
Kinetic Concepts, Inc./KCI U.S.A., Inc.(a) | |
02/15/21 | | | 7.875% | | | | 190,000 | | | | 205,200 | |
|
LifePoint Health, Inc. | |
12/01/21 | | | 5.500% | | | | 400,000 | | | | 418,000 | |
12/01/23 | | | 5.875% | | | | 3,575,000 | | | | 3,762,687 | |
| | | |
MEDNAX, Inc.(a) | | | | | | | | | | | | |
12/01/23 | | | 5.250% | | | | 310,000 | | | | 326,275 | |
|
MPH Acquisition Holdings LLC(a) | |
06/01/24 | | | 7.125% | | | | 423,000 | | | | 454,725 | |
|
Memorial Sloan-Kettering Cancer Center | |
07/01/52 | | | 4.125% | | | | 4,630,000 | | | | 5,209,069 | |
|
NYU Hospitals Center | |
07/01/42 | | | 4.428% | | | | 4,000,000 | | | | 4,354,656 | |
07/01/43 | | | 5.750% | | | | 705,000 | | | | 934,746 | |
|
New York and Presbyterian Hospital (The) | |
08/01/16 | | | 4.763% | | | | 1,050,000 | | | | 1,151,402 | |
|
Northwell Healthcare, Inc. | |
11/01/42 | | | 4.800% | | | | 6,365,000 | | | | 7,439,838 | |
| | | |
Quest Diagnostics, Inc. | | | | | | | | | | | | |
06/01/26 | | | 3.450% | | | | 3,255,000 | | | | 3,383,491 | |
|
Sterigenics-Nordion Holdings LLC(a) | |
05/15/23 | | | 6.500% | | | | 777,000 | | | | 812,027 | |
|
Surgical Care Affiliates, Inc.(a) | |
04/01/23 | | | 6.000% | | | | 241,000 | | | | 253,050 | |
|
Sutter Health | |
08/15/53 | | | 2.286% | | | | 2,300,000 | | | | 2,297,125 | |
|
Teleflex, Inc. | |
06/15/24 | | | 5.250% | | | | 250,000 | | | | 261,875 | |
06/01/26 | | | 4.875% | | | | 99,000 | | | | 103,208 | |
|
Tenet Healthcare Corp. | |
02/01/20 | | | 6.750% | | | | 2,800,000 | | | | 2,786,000 | |
06/01/20 | | | 4.750% | | | | 204,000 | | | | 208,590 | |
10/01/20 | | | 6.000% | | | | 77,000 | | | | 81,331 | |
| | | | | | | | | | | | |
| Corporate Bonds & Notes (continued) | |
| Issuer | | Coupon
Rate | | | Principal
Amount ($) | | | Value ($) | |
04/01/21 | | | 4.500% | | | | 1,361,000 | | | | 1,373,929 | |
10/01/21 | | | 4.375% | | | | 25,000 | | | | 25,086 | |
04/01/22 | | | 8.125% | | | | 1,086,000 | | | | 1,099,575 | |
06/15/23 | | | 6.750% | | | | 375,000 | | | | 356,719 | |
|
Tenet Healthcare Corp.(b) | |
06/15/20 | | | 4.153% | | | | 2,000,000 | | | | 2,002,500 | |
|
Texas Health Resources | |
11/15/55 | | | 4.330% | | | | 700,000 | | | | 798,495 | |
|
Zimmer Biomet Holdings, Inc. | |
04/01/25 | | | 3.550% | | | | 985,000 | | | | 1,027,059 | |
| | | | | | | | | | | | | |
Total | | | | | | | | | | | 84,834,997 | |
| | | |
| | | | | | | | | | | | |
HEALTHCARE INSURANCE 0.3% | |
Aetna, Inc. | |
06/15/26 | | | 3.200% | | | | 5,310,000 | | | | 5,398,358 | |
06/15/36 | | | 4.250% | | | | 2,520,000 | | | | 2,621,805 | |
06/15/46 | | | 4.375% | | | | 3,785,000 | | | | 3,926,915 | |
|
Centene Corp. | |
05/15/22 | | | 4.750% | | | | 2,666,000 | | | | 2,769,308 | |
02/15/24 | | | 6.125% | | | | 313,000 | | | | 341,170 | |
|
Molina Healthcare, Inc.(a) | |
11/15/22 | | | 5.375% | | | | 585,000 | | | | 602,550 | |
|
UnitedHealth Group, Inc. | |
11/15/17 | | | 6.000% | | | | 2,383,000 | | | | 2,512,564 | |
07/15/25 | | | 3.750% | | | | 1,295,000 | | | | 1,435,498 | |
07/15/45 | | | 4.750% | | | | 460,000 | | | | 569,999 | |
| | | | | | | | | | | | | |
Total | | | | | | | | | | | 20,178,167 | |
| | | |
| | | | | | | | | | | | |
HEALTHCARE REIT 0.5% | |
Alexandria Real Estate Equities, Inc. | |
04/01/22 | | | 4.600% | | | | 1,798,000 | | | | 1,947,667 | |
06/15/23 | | | 3.900% | | | | 8,000,000 | | | | 8,342,072 | |
|
HCP, Inc. | |
08/01/22 | | | 3.150% | | | | 3,575,000 | | | | 3,607,197 | |
11/15/23 | | | 4.250% | | | | 5,601,000 | | | | 5,905,358 | |
08/15/24 | | | 3.875% | | | | 782,000 | | | | 800,727 | |
|
Healthcare Trust of America Holdings LP | |
07/15/21 | | | 3.375% | | | | 3,455,000 | | | | 3,560,091 | |
|
Ventas Realty LP/Capital Corp. | |
04/01/20 | | | 2.700% | | | | 3,000,000 | | | | 3,067,578 | |
|
Welltower, Inc. | |
04/01/19 | | | 4.125% | | | | 2,000,000 | | | | 2,108,024 | |
03/15/23 | | | 3.750% | | | | 2,145,000 | | | | 2,259,399 | |
| | | | | | | | | | | | | |
Total | | | | | | | | | | | 31,598,113 | |
| | | |
| | | | | | | | | | | | |
HOME CONSTRUCTION 0.1% | |
CalAtlantic Group, Inc. | |
12/15/21 | | | 6.250% | | | | 174,000 | | | | 190,965 | |
11/15/24 | | | 5.875% | | | | 270,000 | | | | 291,600 | |
|
D.R. Horton, Inc. | |
09/15/22 | | | 4.375% | | | | 60,000 | | | | 63,300 | |
08/15/23 | | | 5.750% | | | | 612,000 | | | | 690,030 | |
The accompanying Notes to Financial Statements are an integral part of this statement.
| | | | | | |
| | |
| | | | ACTIVE PORTFOLIOS® MULTI-MANAGER TOTAL RETURN BOND FUND | | |
PORTFOLIO OF INVESTMENTS (continued)
August 31, 2016
| | | | | | | | | | | | |
| Corporate Bonds & Notes (continued) | |
| Issuer | | Coupon
Rate | | | Principal
Amount ($) | | | Value ($) | |
Meritage Homes Corp. | |
03/01/18 | | | 4.500% | | | | 86,000 | | | | 88,150 | |
04/01/22 | | | 7.000% | | | | 364,000 | | | | 405,860 | |
06/01/25 | | | 6.000% | | | | 172,000 | | | | 183,180 | |
| | | |
PulteGroup, Inc. | | | | | | | | | | | | |
01/15/27 | | | 5.000% | | | | 1,425,000 | | | | 1,457,062 | |
|
Taylor Morrison Communities, Inc./Monarch, Inc.(a) | |
04/15/23 | | | 5.875% | | | | 121,000 | | | | 126,899 | |
03/01/24 | | | 5.625% | | | | 56,000 | | | | 57,400 | |
|
Toll Brothers Finance Corp. | |
11/15/25 | | | 4.875% | | | | 149,000 | | | | 156,264 | |
| | | | | | | | | | | | | |
Total | | | | | | | | | | | 3,710,710 | |
| | | |
| | | | | | | | | | | | |
INDEPENDENT ENERGY 1.0% | |
Afren PLC(a)(d) | |
12/09/20 | | | 0.000% | | | | 195,167 | | | | 20 | |
|
Anadarko Petroleum Corp. | |
07/15/24 | | | 3.450% | | | | 2,100,000 | | | | 2,045,782 | |
03/15/26 | | | 5.550% | | | | 1,150,000 | | | | 1,271,816 | |
07/15/44 | | | 4.500% | | | | 580,000 | | | | 528,765 | |
03/15/46 | | | 6.600% | | | | 1,773,000 | | | | 2,110,833 | |
| | | |
Antero Resources Corp. | | | | | | | | | | | | |
12/01/22 | | | 5.125% | | | | 683,000 | | | | 674,462 | |
| | | |
Apache Corp. | | | | | | | | | | | | |
01/15/23 | | | 2.625% | | | | 1,500,000 | | | | 1,480,326 | |
|
California Resources Corp. | |
11/15/24 | | | 6.000% | | | | 40,000 | | | | 19,300 | |
|
Canadian Natural Resources Ltd. | |
02/15/37 | | | 6.500% | | | | 690,000 | | | | 762,319 | |
02/01/39 | | | 6.750% | | | | 1,705,000 | | | | 1,936,597 | |
|
Carrizo Oil & Gas, Inc. | |
04/15/23 | | | 6.250% | | | | 1,341,000 | | | | 1,324,237 | |
|
Concho Resources, Inc. | |
04/01/23 | | | 5.500% | | | | 1,578,000 | | | | 1,629,285 | |
|
Conoco Funding Co. | |
10/15/31 | | | 7.250% | | | | 2,000,000 | | | | 2,645,828 | |
|
ConocoPhillips Co. | |
03/15/26 | | | 4.950% | | | | 8,525,000 | | | | 9,701,322 | |
|
Continental Resources, Inc. | |
04/15/23 | | | 4.500% | | | | 652,000 | | | | 614,510 | |
06/01/24 | | | 3.800% | | | | 1,981,000 | | | | 1,787,852 | |
|
CrownRock LP/Finance, Inc.(a) | |
04/15/21 | | | 7.125% | | | | 150,000 | | | | 156,000 | |
02/15/23 | | | 7.750% | | | | 598,000 | | | | 635,375 | |
|
Denbury Resources, Inc.(a) | |
05/15/21 | | | 9.000% | | | | 428,000 | | | | 439,770 | |
|
Devon Energy Corp. | |
07/15/41 | | | 5.600% | | | | 2,500,000 | | | | 2,499,135 | |
|
Diamondback Energy, Inc. | |
10/01/21 | | | 7.625% | | | | 146,000 | | | | 154,851 | |
|
EOG Resources, Inc. | |
03/15/23 | | | 2.625% | | | | 1,195,000 | | | | 1,193,093 | |
| | | | | | | | | | | | |
| Corporate Bonds & Notes (continued) | |
| Issuer | | Coupon
Rate | | | Principal
Amount ($) | | | Value ($) | |
Extraction Oil & Gas Holdings LLC/Finance Corp.(a) | |
07/15/21 | | | 7.875% | | | | 789,000 | | | | 796,890 | |
|
Hess Corp. | |
02/15/41 | | | 5.600% | | | | 2,000,000 | | | | 2,032,644 | |
|
Kerr-McGee Corp. | |
07/01/24 | | | 6.950% | | | | 2,733,000 | | | | 3,197,829 | |
|
Laredo Petroleum, Inc. | |
01/15/22 | | | 5.625% | | | | 308,000 | | | | 287,980 | |
05/01/22 | | | 7.375% | | | | 319,000 | | | | 322,190 | |
03/15/23 | | | 6.250% | | | | 1,261,000 | | | | 1,201,102 | |
|
Newfield Exploration Co. | |
01/30/22 | | | 5.750% | | | | 33,000 | | | | 34,238 | |
07/01/24 | | | 5.625% | | | | 413,000 | | | | 426,423 | |
|
Noble Energy, Inc. | |
11/15/24 | | | 3.900% | | | | 1,000,000 | | | | 1,021,478 | |
11/15/43 | | | 5.250% | | | | 6,434,000 | | | | 6,498,778 | |
11/15/44 | | | 5.050% | | | | 2,412,000 | | | | 2,407,572 | |
|
Oasis Petroleum, Inc. | |
03/15/22 | | | 6.875% | | | | 273,000 | | | | 253,890 | |
01/15/23 | | | 6.875% | | | | 528,000 | | | | 487,080 | |
|
PDC Energy, Inc. | |
10/15/22 | | | 7.750% | | | | 298,000 | | | | 312,900 | |
|
Parsley Energy LLC/Finance Corp.(a) | |
02/15/22 | | | 7.500% | | | | 538,000 | | | | 567,590 | |
06/01/24 | | | 6.250% | | | | 631,000 | | | | 651,507 | |
|
QEP Resources, Inc. | |
05/01/23 | | | 5.250% | | | | 15,000 | | | | 14,700 | |
|
RSP Permian, Inc. | |
10/01/22 | | | 6.625% | | | | 1,044,000 | | | | 1,085,760 | |
|
Range Resources Corp. | |
05/15/25 | | | 4.875% | | | | 496,000 | | | | 478,640 | |
|
Ras Laffan Liquefied Natural Gas Co., Ltd. II(a) | |
09/30/20 | | | 5.298% | | | | 781,624 | | | | 840,363 | |
|
Rice Energy, Inc. | |
05/01/22 | | | 6.250% | | | | 325,000 | | | | 333,125 | |
05/01/23 | | | 7.250% | | | | 50,000 | | | | 52,250 | |
|
SandRidge Energy, Inc.(d) | |
03/15/21 | | | 0.000% | | | | 50,000 | | | | 3,438 | |
|
WPX Energy, Inc. | |
01/15/22 | | | 6.000% | | | | 1,297,000 | | | | 1,261,332 | |
|
Whiting Petroleum Corp. | |
03/15/21 | | | 5.750% | | | | 478,000 | | | | 428,407 | |
|
Woodside Finance Ltd.(a) | |
03/05/25 | | | 3.650% | | | | 5,594,000 | | | | 5,562,450 | |
| | | | | | | | | | | | | |
Total | | | | | | | | | | | 64,172,034 | |
| | | |
| | | | | | | | | | | | |
INTEGRATED ENERGY 0.5% | |
BG Energy Capital PLC
Subordinated(a)(b) | |
11/30/72 | | | 6.500% | | | | 632,000 | | | | 662,936 | |
|
BP Capital Markets PLC | |
05/03/19 | | | 1.676% | | | | 2,905,000 | | | | 2,927,319 | |
The accompanying Notes to Financial Statements are an integral part of this statement.
| | | | | | |
| | |
| | | | ACTIVE PORTFOLIOS® MULTI-MANAGER TOTAL RETURN BOND FUND | | |
PORTFOLIO OF INVESTMENTS (continued)
August 31, 2016
| | | | | | | | | | | | |
| Corporate Bonds & Notes (continued) | |
| Issuer | | Coupon
Rate | | | Principal
Amount ($) | | | Value ($) | |
05/06/22 | | | 3.245% | | | | 1,875,000 | | | | 1,985,906 | |
05/10/23 | | | 2.750% | | | | 2,945,000 | | | | 3,002,910 | |
05/04/26 | | | 3.119% | | | | 1,890,000 | | | | 1,952,340 | |
|
Cenovus Energy, Inc. | |
11/15/39 | | | 6.750% | | | | 1,225,000 | | | | 1,307,972 | |
|
Chevron Corp. | |
06/24/23 | | | 3.191% | | | | 700,000 | | | | 749,343 | |
05/16/26 | | | 2.954% | | | | 2,490,000 | | | | 2,596,921 | |
|
Husky Energy, Inc. | |
04/15/22 | | | 3.950% | | | | 3,000,000 | | | | 3,173,709 | |
|
Lone Pine Resources Canada Ltd.(e)(f) | |
02/15/17 | | | 10.375% | | | | 25,000 | | | | — | |
|
Shell International Finance BV | |
08/10/18 | | | 1.900% | | | | 5,840,000 | | | | 5,920,090 | |
05/10/21 | | | 1.875% | | | | 3,080,000 | | | | 3,093,580 | |
05/10/46 | | | 4.000% | | | | 2,835,000 | | | | 2,970,845 | |
| | | | | | | | | | | | | |
Total | | | | | | | | | | | 30,343,871 | |
| | | |
| | | | | | | | | | | | |
LEISURE 0.1% | |
Cedar Fair LP/Canada’s Wonderland Co./Magnum Management Corp. | |
03/15/21 | | | 5.250% | | | | 206,000 | | | | 213,725 | |
06/01/24 | | | 5.375% | | | | 44,000 | | | | 46,530 | |
| | | |
Cinemark USA, Inc. | | | | | | | | | | | | |
06/01/23 | | | 4.875% | | | | 3,500,000 | | | | 3,587,500 | |
|
LTF Merger Sub, Inc.(a) | |
06/15/23 | | | 8.500% | | | | 239,000 | | | | 240,792 | |
|
Regal Entertainment Group | |
03/15/22 | | | 5.750% | | | | 150,000 | | | | 156,938 | |
02/01/25 | | | 5.750% | | | | 275,000 | | | | 279,812 | |
| | | |
Viking Cruises Ltd.(a) | | | | | | | | | | | | |
10/15/22 | | | 8.500% | | | | 2,400,000 | | | | 2,112,000 | |
| | | | | | | | | | | | | |
Total | | | | | | | | | | | 6,637,297 | |
| | | |
| | | | | | | | | | | | |
LIFE INSURANCE 1.1% | |
American International Group, Inc. | |
02/15/24 | | | 4.125% | | | | 1,600,000 | | | | 1,722,285 | |
|
Five Corners Funding Trust(a) | |
11/15/23 | | | 4.419% | | | | 1,815,000 | | | | 1,961,140 | |
|
Guardian Life Global Funding(a) | |
04/26/21 | | | 2.000% | | | | 4,600,000 | | | | 4,626,104 | |
|
Guardian Life Insurance Co. of America (The)
Subordinated(a) | |
06/19/64 | | | 4.875% | | | | 1,530,000 | | | | 1,632,715 | |
|
Jackson National Life Global Funding(a) | |
12/09/20 | | | 2.600% | | | | 3,215,000 | | | | 3,299,898 | |
04/29/26 | | | 3.050% | | | | 3,620,000 | | | | 3,683,752 | |
|
Lincoln National Corp. | |
06/15/40 | | | 7.000% | | | | 2,610,000 | | | | 3,396,766 | |
|
Massachusetts Mutual Life Insurance Co.(a)
Subordinated | |
06/01/39 | | | 8.875% | | | | 345,000 | | | | 549,578 | |
04/15/65 | | | 4.500% | | | | 955,000 | | | | 967,232 | |
| | | | | | | | | | | | |
| Corporate Bonds & Notes (continued) | |
| Issuer | | Coupon
Rate | | | Principal
Amount ($) | | | Value ($) | |
MetLife Capital Trust X
Junior Subordinated(a)(b) | |
04/08/38 | | | 9.250% | | | | 10,122,000 | | | | 14,470,209 | |
|
MetLife, Inc. | |
08/15/18 | | | 6.817% | | | | 3,000,000 | | | | 3,310,047 | |
Junior Subordinated | |
08/01/39 | | | 10.750% | | | | 4,114,000 | | | | 6,623,540 | |
|
Metropolitan Life Global Funding I(a) | |
04/11/22 | | | 3.875% | | | | 4,000,000 | | | | 4,339,600 | |
|
Northwestern Mutual Life Insurance Co. (The)
Subordinated(a) | |
03/30/40 | | | 6.063% | | | | 1,250,000 | | | | 1,629,241 | |
|
Pricoa Global Funding I(a) | |
05/16/19 | | | 2.200% | | | | 4,850,000 | | | | 4,938,682 | |
|
Principal Financial Group, Inc. | |
09/15/22 | | | 3.300% | | | | 1,510,000 | | | | 1,561,701 | |
05/15/23 | | | 3.125% | | | | 667,000 | | | | 683,107 | |
|
Principal Life Global Funding II(a) | |
04/18/26 | | | 3.000% | | | | 3,310,000 | | | | 3,388,454 | |
|
Prudential Financial, Inc. | |
12/01/17 | | | 6.000% | | | | 42,000 | | | | 44,349 | |
|
TIAA Asset Management Finance Co. LLC(a) | |
11/01/24 | | | 4.125% | | | | 1,050,000 | | | | 1,105,869 | |
|
Teachers Insurance & Annuity Association of America
Subordinated(a) | |
09/15/44 | | | 4.900% | | | | 1,615,000 | | | | 1,845,121 | |
| | | |
Unum Group | | | | | | | | | | | | |
05/15/21 | | | 3.000% | | | | 1,250,000 | | | | 1,276,636 | |
|
Voya Financial, Inc. | |
06/15/26 | | | 3.650% | | | | 3,575,000 | | | | 3,610,636 | |
| | | | | | | | | | | | | |
Total | | | | | | | | | | | 70,666,662 | |
| | | |
| | | | | | | | | | | | |
LODGING 0.1% | |
Choice Hotels International, Inc. | |
07/01/22 | | | 5.750% | | | | 732,000 | | | | 801,540 | |
|
Hilton Escrow Issuer LLC/Corp.(a) | |
09/01/24 | | | 4.250% | | | | 215,000 | | | | 219,166 | |
|
Marriott International, Inc. | |
06/15/26 | | | 3.125% | | | | 4,235,000 | | | | 4,313,204 | |
|
Playa Resorts Holding BV(a) | |
08/15/20 | | | 8.000% | | | | 462,000 | | | | 474,127 | |
|
RHP Hotel Properties LP/Finance Corp. | |
04/15/23 | | | 5.000% | | | | 2,400,000 | | | | 2,442,000 | |
| | | | | | | | | | | | | |
Total | | | | | | | | | | | 8,250,037 | |
| | | |
| | | | | | | | | | | | |
MEDIA AND ENTERTAINMENT 0.9% | |
21st Century Fox America, Inc. | |
08/15/20 | | | 5.650% | | | | 1,760,000 | | | | 2,011,150 | |
03/15/33 | | | 6.550% | | | | 1,000,000 | | | | 1,293,569 | |
01/09/38 | | | 6.750% | | | | 220,000 | | | | 281,999 | |
02/15/41 | | | 6.150% | | | | 2,985,000 | | | | 3,872,858 | |
The accompanying Notes to Financial Statements are an integral part of this statement.
| | | | | | |
| | |
| | | | ACTIVE PORTFOLIOS® MULTI-MANAGER TOTAL RETURN BOND FUND | | |
PORTFOLIO OF INVESTMENTS (continued)
August 31, 2016
| | | | | | | | | | | | |
| Corporate Bonds & Notes (continued) | |
| Issuer | | Coupon
Rate | | | Principal
Amount ($) | | | Value ($) | |
AMC Networks, Inc. | |
04/01/24 | | | 5.000% | | | | 2,780,000 | | | | 2,849,500 | |
|
Activision Blizzard, Inc.(a) | |
09/15/23 | | | 6.125% | | | | 810,000 | | | | 885,937 | |
|
Clear Channel Worldwide Holdings, Inc. | |
11/15/22 | | | 6.500% | | | | 625,000 | | | | 654,687 | |
|
Electronic Arts, Inc. | |
03/01/21 | | | 3.700% | | | | 2,000,000 | | | | 2,114,282 | |
| | | |
Entercom Radio LLC | | | | | | | | | | | | |
12/01/19 | | | 10.500% | | | | 275,000 | | | | 287,719 | |
|
Gray Television, Inc. | |
10/01/20 | | | 7.500% | | | | 400,000 | | | | 416,000 | |
|
Grupo Televisa SAB | |
05/15/18 | | | 6.000% | | | | 200,000 | | | | 214,644 | |
05/13/45 | | | 5.000% | | | | 2,100,000 | | | | 2,188,439 | |
|
Lamar Media Corp. | |
05/01/23 | | | 5.000% | | | | 375,000 | | | | 396,563 | |
01/15/24 | | | 5.375% | | | | 125,000 | | | | 133,125 | |
|
Lamar Media Corp.(a) | |
02/01/26 | | | 5.750% | | | | 162,000 | | | | 175,163 | |
|
Lin Television Corp. | |
11/15/22 | | | 5.875% | | | | 300,000 | | | | 317,250 | |
| | | |
MDC Partners, Inc.(a) | | | | | | | | | | | | |
05/01/24 | | | 6.500% | | | | 1,104,000 | | | | 1,048,800 | |
|
Match Group, Inc. | |
06/01/24 | | | 6.375% | | | | 403,000 | | | | 438,766 | |
|
Netflix, Inc. | |
02/15/22 | | | 5.500% | | | | 557,000 | | | | 598,775 | |
02/15/25 | | | 5.875% | | | | 470,000 | | | | 509,950 | |
|
Nielsen Finance Co. SARL (The)(a) | |
10/01/21 | | | 5.500% | | | | 194,000 | | | | 202,245 | |
|
Nielsen Finance LLC/Co.(a) | |
04/15/22 | | | 5.000% | | | | 3,350,000 | | | | 3,441,689 | |
|
Outfront Media Capital LLC/Corp. | |
02/15/22 | | | 5.250% | | | | 312,000 | | | | 326,820 | |
03/15/25 | | | 5.875% | | | | 565,000 | | | | 605,963 | |
|
Scripps Networks Interactive, Inc. | |
06/15/22 | | | 3.500% | | | | 3,739,000 | | | | 3,890,886 | |
|
Sinclair Television Group, Inc. | |
10/01/22 | | | 6.125% | | | | 75,000 | | | | 79,313 | |
|
Sinclair Television Group, Inc.(a) | |
08/01/24 | | | 5.625% | | | | 550,000 | | | | 572,880 | |
|
Sky PLC(a) | |
09/16/24 | | | 3.750% | | | | 5,874,000 | | | | 6,239,257 | |
|
TEGNA, Inc. | |
10/15/23 | | | 6.375% | | | | 325,000 | | | | 351,000 | |
|
TEGNA, Inc.(a) | |
09/15/24 | | | 5.500% | | | | 200,000 | | | | 211,000 | |
|
Thomson Reuters Corp. | |
05/15/26 | | | 3.350% | | | | 8,815,000 | | | | 9,106,177 | |
| | | | | | | | | | | | |
| Corporate Bonds & Notes (continued) | |
| Issuer | | Coupon
Rate | | | Principal
Amount ($) | | | Value ($) | |
Time Warner, Inc. | |
03/29/21 | | | 4.750% | | | | 1,700,000 | | | | 1,907,074 | |
03/29/41 | | | 6.250% | | | | 2,280,000 | | | | 3,000,405 | |
|
Tribune Media Co. | |
07/15/22 | | | 5.875% | | | | 475,000 | | | | 485,688 | |
|
Univision Communications, Inc.(a) | |
09/15/22 | | | 6.750% | | | | 130,000 | | | | 138,531 | |
05/15/23 | | | 5.125% | | | | 368,000 | | | | 382,720 | |
02/15/25 | | | 5.125% | | | | 1,100,000 | | | | 1,149,500 | |
|
Viacom, Inc. | |
04/01/17 | | | 3.500% | | | | 1,500,000 | | | | 1,517,869 | |
04/01/19 | | | 2.200% | | | | 455,000 | | | | 456,692 | |
09/01/23 | | | 4.250% | | | | 2,410,000 | | | | 2,559,709 | |
|
Walt Disney Co. (The) | |
07/30/46 | | | 3.000% | | | | 2,550,000 | | | | 2,458,055 | |
| | | | | | | | | | | | | |
Total | | | | | | | | | | | 59,772,649 | |
| | | |
| | | | | | | | | | | | |
METALS 0.6% | |
Alcoa, Inc. | |
04/15/21 | | | 5.400% | | | | 2,250,000 | | | | 2,387,115 | |
|
ArcelorMittal(b) | |
03/01/21 | | | 6.500% | | | | 293,000 | | | | 317,905 | |
02/25/22 | | | 7.250% | | | | 352,000 | | | | 396,000 | |
03/01/41 | | | 7.750% | | | | 730,000 | | | | 759,200 | |
|
BHP Billiton Finance USA Ltd.
Junior Subordinated(a)(b) | |
10/19/75 | | | 6.750% | | | | 3,200,000 | | | | 3,652,000 | |
|
Barrick Gold Corp. | |
05/01/23 | | | 4.100% | | | | 6,300,000 | | | | 6,782,170 | |
|
Barrick North America Finance LLC | |
05/30/21 | | | 4.400% | | | | 3,845,000 | | | | 4,204,284 | |
|
Constellium NV(a) | |
05/15/24 | | | 5.750% | | | | 129,000 | | | | 119,325 | |
|
Freeport-McMoRan, Inc. | |
11/14/17 | | | 2.300% | | | | 1,500,000 | | | | 1,473,750 | |
03/01/22 | | | 3.550% | | | | 145,000 | | | | 126,513 | |
03/15/23 | | | 3.875% | | | | 543,000 | | | | 465,622 | |
11/14/24 | | | 4.550% | | | | 756,000 | | | | 661,500 | |
11/14/34 | | | 5.400% | | | | 300,000 | | | | 234,000 | |
|
Glencore Finance Canada Ltd.(a) | |
11/15/16 | | | 5.800% | | | | 3,010,000 | | | | 3,031,070 | |
|
Glencore Funding LLC(a) | |
01/15/19 | | | 2.500% | | | | 4,280,000 | | | | 4,242,550 | |
|
Novelis Corp.(a) | |
08/15/24 | | | 6.250% | | | | 171,000 | | | | 178,268 | |
|
Rio Tinto Finance USA PLC | |
03/22/22 | | | 3.500% | | | | 5,504,000 | | | | 5,861,496 | |
|
Southern Copper Corp. | |
11/08/22 | | | 3.500% | | | | 130,000 | | | | 132,251 | |
04/23/25 | | | 3.875% | | | | 600,000 | | | | 600,526 | |
11/08/42 | | | 5.250% | | | | 1,400,000 | | | | 1,332,733 | |
04/23/45 | | | 5.875% | | | | 2,603,000 | | | | 2,643,797 | |
The accompanying Notes to Financial Statements are an integral part of this statement.
| | | | | | |
| | |
| | | | ACTIVE PORTFOLIOS® MULTI-MANAGER TOTAL RETURN BOND FUND | | |
PORTFOLIO OF INVESTMENTS (continued)
August 31, 2016
| | | | | | | | | | | | |
| Corporate Bonds & Notes (continued) | |
| Issuer | | Coupon
Rate | | | Principal
Amount ($) | | | Value ($) | |
Vale Overseas Ltd. | |
01/11/22 | | | 4.375% | | | | 113,000 | | | | 110,006 | |
08/10/26 | | | 6.250% | | | | 895,000 | | | | 926,325 | |
11/10/39 | | | 6.875% | | | | 80,000 | | | | 78,600 | |
|
Vale SA | |
09/11/42 | | | 5.625% | | | | 50,000 | | | | 43,035 | |
|
Wise Metals Intermediate Holdings LLC/Finance Corp.(a) | |
06/15/19 | | | 9.750% | | | | 184,187 | | | | 116,498 | |
| | | | | | | | | | | | | |
Total | | | | | | | | | | | 40,876,539 | |
| | | |
| | | | | | | | | | | | |
MIDSTREAM 1.6% | |
Boardwalk Pipeline Partners LP | |
02/01/23 | | | 3.375% | | | | 2,000,000 | | | | 1,880,932 | |
|
Colorado Interstate Gas Co., LLC/Issuing Corp.(a) | |
08/15/26 | | | 4.150% | | | | 2,290,000 | | | | 2,283,226 | |
|
Columbia Pipeline Group, Inc. | |
06/01/45 | | | 5.800% | | | | 5,267,000 | | | | 6,343,633 | |
|
Crestwood Midstream Partners LP/Finance Corp. | |
12/15/20 | | | 6.000% | | | | 125,000 | | | | 123,125 | |
03/01/22 | | | 6.125% | | | | 50,000 | | | | 48,625 | |
04/01/23 | | | 6.250% | | | | 50,000 | | | | 48,750 | |
|
Enbridge Energy Partners LP | |
10/15/25 | | | 5.875% | | | | 1,000,000 | | | | 1,113,784 | |
|
Energy Transfer Equity LP | |
01/15/24 | | | 5.875% | | | | 575,000 | | | | 589,375 | |
06/01/27 | | | 5.500% | | | | 1,814,000 | | | | 1,818,535 | |
|
Energy Transfer Partners LP | |
06/15/18 | | | 2.500% | | | | 2,056,000 | | | | 2,075,746 | |
02/01/23 | | | 3.600% | | | | 1,000,000 | | | | 984,995 | |
10/01/43 | | | 5.950% | | | | 3,500,000 | | | | 3,631,981 | |
|
Energy Transfer Partners LP(b) | |
11/01/66 | | | 3.774% | | | | 1,030,000 | | | | 710,700 | |
|
Enterprise Products Operating LLC | |
02/15/25 | | | 3.750% | | | | 1,055,000 | | | | 1,103,192 | |
05/15/46 | | | 4.900% | | | | 1,400,000 | | | | 1,497,980 | |
|
Enterprise Products Operating LLC(b) | |
08/01/66 | | | 4.464% | | | | 2,060,000 | | | | 1,931,250 | |
|
Ferrellgas Partners LP/Finance Corp. | |
05/01/21 | | | 6.500% | | | | 350,000 | | | | 329,875 | |
01/15/22 | | | 6.750% | | | | 150,000 | | | | 140,625 | |
06/15/23 | | | 6.750% | | | | 200,000 | | | | 180,500 | |
|
Florida Gas Transmission Co. LLC(a) | |
07/15/22 | | | 3.875% | | | | 2,250,000 | | | | 2,290,693 | |
|
Holly Energy Partners LP/Finance Corp.(a) | |
08/01/24 | | | 6.000% | | | | 74,000 | | | | 75,480 | |
|
Kinder Morgan, Inc. | |
06/01/18 | | | 7.250% | | | | 390,000 | | | | 423,213 | |
|
Kinder Morgan, Inc.(a) | |
11/15/23 | | | 5.625% | | | | 3,955,000 | | | | 4,319,335 | |
|
MPLX LP(a) | |
02/15/23 | | | 5.500% | | | | 164,000 | | | | 170,295 | |
07/15/23 | | | 4.500% | | | | 353,000 | | | | 356,547 | |
12/01/24 | | | 4.875% | | | | 1,855,000 | | | | 1,897,609 | |
| | | | | | | | | | | | |
| Corporate Bonds & Notes (continued) | |
| Issuer | | Coupon
Rate | | | Principal
Amount ($) | | | Value ($) | |
06/01/25 | | | 4.875% | | | | 200,000 | | | | 204,128 | |
|
Plains All American Pipeline LP/Finance Corp. | |
01/31/23 | | | 2.850% | | | | 4,720,000 | | | | 4,491,963 | |
10/15/25 | | | 4.650% | | | | 1,146,000 | | | | 1,189,892 | |
06/01/42 | | | 5.150% | | | | 3,035,000 | | | | 2,801,460 | |
02/15/45 | | | 4.900% | | | | 1,917,000 | | | | 1,764,687 | |
|
Regency Energy Partners LP/Finance Corp. | |
03/01/22 | | | 5.875% | | | | 1,625,000 | | | | 1,783,957 | |
10/01/22 | | | 5.000% | | | | 2,680,000 | | | | 2,849,322 | |
11/01/23 | | | 4.500% | | | | 1,000,000 | | | | 1,011,468 | |
|
Rockies Express Pipeline LLC(a) | |
04/15/20 | | | 5.625% | | | | 2,220,000 | | | | 2,322,675 | |
|
Ruby Pipeline LLC(a) | |
04/01/22 | | | 6.000% | | | | 3,000,000 | | | | 3,108,936 | |
|
Sabine Pass LNG LP | |
11/30/16 | | | 7.500% | | | | 1,000,000 | | | | 1,013,750 | |
|
Sabine Pass Liquefaction LLC | |
03/01/25 | | | 5.625% | | | | 998,000 | | | | 1,055,385 | |
|
Sabine Pass Liquefaction LLC(a) | |
06/30/26 | | | 5.875% | | | | 303,000 | | | | 324,210 | |
|
Southern Natural Gas Co. LLC | |
02/15/31 | | | 7.350% | | | | 2,910,000 | | | | 3,451,446 | |
|
Spectra Energy Capital LLC | |
02/15/32 | | | 6.750% | | | | 1,740,000 | | | | 1,969,623 | |
|
Suburban Propane Partners LP/Energy Finance Corp. | |
08/01/21 | | | 7.375% | | | | 386,000 | | | | 401,440 | |
03/01/25 | | | 5.750% | | | | 225,000 | | | | 227,250 | |
|
Tallgrass Energy Partners LP/Finance Corp.(a)(c) | |
09/15/24 | | | 5.500% | | | | 243,000 | | | | 249,075 | |
|
Targa Pipeline Partners LP/Finance Corp. | |
08/01/23 | | | 5.875% | | | | 100,000 | | | | 98,253 | |
|
Targa Resources Partners LP/Finance Corp. | |
01/15/18 | | | 5.000% | | | | 124,000 | | | | 126,480 | |
11/15/19 | | | 4.125% | | | | 52,000 | | | | 52,390 | |
05/01/23 | | | 5.250% | | | | 6,000 | | | | 6,090 | |
11/15/23 | | | 4.250% | | | | 1,368,000 | | | | 1,316,700 | |
|
Targa Resources Partners LP/Finance Corp.(a) | |
03/15/24 | | | 6.750% | | | | 129,000 | | | | 137,063 | |
|
Tennessee Gas Pipeline Co. LLC | |
06/15/32 | | | 8.375% | | | | 3,465,000 | | | | 4,356,326 | |
04/01/37 | | | 7.625% | | | | 550,000 | | | | 658,338 | |
|
Tesoro Logistics LP/Finance Corp. | |
10/15/19 | | | 5.500% | | | | 27,000 | | | | 28,755 | |
10/01/20 | | | 5.875% | | | | 198,000 | | | | 203,693 | |
10/15/21 | | | 6.125% | | | | 300,000 | | | | 314,250 | |
10/15/22 | | | 6.250% | | | | 643,000 | | | | 680,616 | |
05/01/24 | | | 6.375% | | | | 233,000 | | | | 248,728 | |
|
Texas Eastern Transmission LP(a) | |
10/15/22 | | | 2.800% | | | | 3,350,000 | | | | 3,348,097 | |
|
Transcanada Trust
Junior Subordinated(b) | |
08/15/76 | | | 5.875% | | | | 2,940,000 | | | | 3,132,937 | |
The accompanying Notes to Financial Statements are an integral part of this statement.
| | | | | | |
| | |
| | | | ACTIVE PORTFOLIOS® MULTI-MANAGER TOTAL RETURN BOND FUND | | |
PORTFOLIO OF INVESTMENTS (continued)
August 31, 2016
| | | | | | | | | | | | |
| Corporate Bonds & Notes (continued) | |
| Issuer | | Coupon
Rate | | | Principal
Amount ($) | | | Value ($) | |
Transcontinental Gas Pipe Line Co. LLC(a) | |
02/01/26 | | | 7.850% | | | | 2,880,000 | | | | 3,726,458 | |
|
Western Gas Partners LP | |
07/01/22 | | | 4.000% | | | | 328,000 | | | | 334,055 | |
06/01/25 | | | 3.950% | | | | 460,000 | | | | 452,653 | |
|
Western Refining Logistics LP/Finance Corp. | |
02/15/23 | | | 7.500% | | | | 275,000 | | | | 281,875 | |
|
Williams Companies, Inc. (The) | |
01/15/23 | | | 3.700% | | | | 429,000 | | | | 416,130 | |
06/24/24 | | | 4.550% | | | | 1,040,000 | | | | 1,063,400 | |
|
Williams Partners LP/ACMP Finance Corp. | |
07/15/22 | | | 6.125% | | | | 325,000 | | | | 337,917 | |
05/15/23 | | | 4.875% | | | | 7,420,000 | | | | 7,527,160 | |
|
Williams Partners LP | |
11/15/20 | | | 4.125% | | | | 1,000,000 | | | | 1,037,521 | |
03/04/24 | | | 4.300% | | | | 2,787,000 | | | | 2,852,832 | |
01/15/25 | | | 3.900% | | | | 1,050,000 | | | | 1,044,298 | |
04/15/40 | | | 6.300% | | | | 1,510,000 | | | | 1,648,331 | |
03/04/44 | | | 5.400% | | | | 912,000 | | | | 918,278 | |
01/15/45 | | | 4.900% | | | | 1,030,000 | | | | 980,075 | |
09/15/45 | | | 5.100% | | | | 2,160,000 | | | | 2,117,586 | |
| | | | | | | | | | | | | |
Total | | | | | | | | | | | 106,037,953 | |
| | | |
| | | | | | | | | | | | |
NATURAL GAS 0.4% | |
Atmos Energy Corp. | |
10/15/44 | | | 4.125% | | | | 2,045,000 | | | | 2,271,390 | |
|
NiSource Finance Corp. | |
02/15/23 | | | 3.850% | | | | 1,175,000 | | | | 1,260,967 | |
12/15/40 | | | 6.250% | | | | 1,866,000 | | | | 2,457,600 | |
|
Sempra Energy | |
02/15/19 | | | 9.800% | | | | 1,000,000 | | | | 1,190,842 | |
03/15/20 | | | 2.400% | | | | 2,199,000 | | | | 2,241,753 | |
11/15/20 | | | 2.850% | | | | 3,455,000 | | | | 3,577,117 | |
10/01/22 | | | 2.875% | | | | 6,205,000 | | | | 6,417,503 | |
06/15/24 | | | 3.550% | | | | 1,500,000 | | | | 1,589,341 | |
11/15/25 | | | 3.750% | | | | 4,310,000 | | | | 4,656,929 | |
| | | | | | | | | | | | | |
Total | | | | | | | | | | | 25,663,442 | |
| | | |
| | | | | | | | | | | | |
OFFICE REIT 0.3% | |
Boston Properties LP | |
11/15/20 | | | 5.625% | | | | 4,590,000 | | | | 5,233,325 | |
02/01/23 | | | 3.850% | | | | 2,500,000 | | | | 2,693,173 | |
10/01/26 | | | 2.750% | | | | 4,525,000 | | | | 4,481,936 | |
|
Highwoods Realty LP | |
03/15/17 | | | 5.850% | | | | 3,069,000 | | | | 3,132,792 | |
|
SL Green Realty Corp. | |
08/15/18 | | | 5.000% | | | | 6,935,000 | | | | 7,248,975 | |
| | | | | | | | | | | | | |
Total | | | | | | | | | | | 22,790,201 | |
| | | |
| | | | | | | | | | | | |
OIL FIELD SERVICES 0.3% | |
Nabors Industries, Inc. | |
09/15/21 | | | 4.625% | | | | 3,250,000 | | | | 3,097,789 | |
| | | | | | | | | | | | |
| Corporate Bonds & Notes (continued) | |
| Issuer | | Coupon
Rate | | | Principal
Amount ($) | | | Value ($) | |
Noble Holding International Ltd. | |
03/15/17 | | | 2.500% | | | | 7,500,000 | | | | 7,434,375 | |
|
Noble Holding International Ltd.(b) | |
03/16/18 | | | 5.000% | | | | 8,115,000 | | | | 7,979,074 | |
|
SESI LLC | |
05/01/19 | | | 6.375% | | | | 250,000 | | | | 247,500 | |
12/15/21 | | | 7.125% | | | | 74,000 | | | | 72,150 | |
|
Schlumberger Holdings Corp.(a) | |
12/21/25 | | | 4.000% | | | | 2,100,000 | | | | 2,293,494 | |
|
Schlumberger Investment SA | |
12/01/23 | | | 3.650% | | | | 1,016,000 | | | | 1,106,683 | |
|
Weatherford International Ltd. | |
06/15/21 | | | 7.750% | | | | 471,000 | | | | 466,290 | |
| | | | | | | | | | | | | |
Total | | | | | | | | | | | 22,697,355 | |
| | | |
| | | | | | | | | | | | |
OTHER FINANCIAL INSTITUTIONS —% | |
PT Perusahaan Gas Negara Persero Tbk(a) | |
05/16/24 | | | 5.125% | | | | 1,300,000 | | | | 1,407,424 | |
|
Total System Services, Inc. | |
04/01/26 | | | 4.800% | | | | 1,415,000 | | | | 1,563,974 | |
| | | | | | | | | | | | | |
Total | | | | | | | | | | | 2,971,398 | |
|
| |
OTHER INDUSTRY 0.2% | |
Anixter, Inc. | |
03/01/23 | | | 5.500% | | | | 75,000 | | | | 78,938 | |
|
Belden, Inc.(a) | |
07/15/24 | | | 5.250% | | | | 350,000 | | | | 355,250 | |
|
CB Richard Ellis Services, Inc. | |
03/15/25 | | | 5.250% | | | | 161,000 | | | | 173,725 | |
|
CBRE Services, Inc. | |
03/15/23 | | | 5.000% | | | | 175,000 | | | | 184,830 | |
|
Massachusetts Institute of Technology | |
07/01/14 | | | 4.678% | | | | 2,358,000 | | | | 2,833,132 | |
07/01/16 | | | 3.885% | | | | 5,915,000 | | | | 6,112,165 | |
|
Unifrax I LLC/Holding Co.(a) | |
02/15/19 | | | 7.500% | | | | 375,000 | | | | 337,500 | |
|
University of Southern California | |
10/01/39 | | | 3.028% | | | | 4,525,000 | | | | 4,595,866 | |
| | | | | | | | | | | | | |
Total | | | | | | | | | | | 14,671,406 | |
| | | |
| | | | | | | | | | | | |
OTHER REIT 0.2% | |
CyrusOne LP/Finance Corp. | |
11/15/22 | | | 6.375% | | | | 157,000 | | | | 166,812 | |
|
Duke Realty LP | |
06/15/22 | | | 4.375% | | | | 4,290,000 | | | | 4,674,826 | |
|
Host Hotels & Resorts LP | |
06/15/25 | | | 4.000% | | | | 1,050,000 | | | | 1,076,697 | |
02/01/26 | | | 4.500% | | | | 520,000 | | | | 555,111 | |
|
Liberty Property LP | |
06/15/23 | | | 3.375% | | | | 2,500,000 | | | | 2,548,320 | |
The accompanying Notes to Financial Statements are an integral part of this statement.
| | | | | | |
| | |
| | | | ACTIVE PORTFOLIOS® MULTI-MANAGER TOTAL RETURN BOND FUND | | |
PORTFOLIO OF INVESTMENTS (continued)
August 31, 2016
| | | | | | | | | | | | |
| Corporate Bonds & Notes (continued) | |
| Issuer | | Coupon
Rate | | | Principal
Amount ($) | | | Value ($) | |
ProLogis LP | |
02/01/21 | | | 3.350% | | | | 1,000,000 | | | | 1,056,766 | |
08/15/23 | | | 4.250% | | | | 1,600,000 | | | | 1,774,997 | |
| | | | | | | | | | | | | |
Total | | | | | | | | | | | 11,853,529 | |
| | | |
| | | | | | | | | | | | |
PACKAGING 0.2% | |
Ardagh Packaging Finance PLC/Holdings USA, Inc.(a) | |
11/15/20 | | | 7.000% | | | | 52,941 | | | | 52,875 | |
01/31/21 | | | 6.750% | | | | 344,000 | | | | 356,470 | |
06/30/21 | | | 6.000% | | | | 150,000 | | | | 154,500 | |
05/15/23 | | | 4.625% | | | | 336,000 | | | | 341,880 | |
05/15/24 | | | 7.250% | | | | 791,000 | | | | 841,426 | |
|
Ardagh Packaging Finance PLC/Holdings USA, Inc.(a)(b) | |
12/15/19 | | | 3.653% | | | | 800,000 | | | | 808,000 | |
|
BWAY Holding Co.(a) | |
08/15/21 | | | 9.125% | | | | 550,000 | | | | 555,500 | |
|
Ball Corp. | |
12/15/20 | | | 4.375% | | | | 311,000 | | | | 335,491 | |
11/15/23 | | | 4.000% | | | | 275,000 | | | | 279,813 | |
07/01/25 | | | 5.250% | | | | 200,000 | | | | 216,500 | |
|
Berry Plastics Corp. | |
05/15/22 | | | 5.500% | | | | 60,000 | | | | 62,400 | |
10/15/22 | | | 6.000% | | | | 615,000 | | | | 651,900 | |
07/15/23 | | | 5.125% | | | | 400,000 | | | | 409,760 | |
|
Beverage Packaging Holdings (Luxembourg) II SA(a) | |
12/15/16 | | | 5.625% | | | | 34,000 | | | | 34,085 | |
|
Crown Americas LLC/Capital Corp. IV | |
01/15/23 | | | 4.500% | | | | 250,000 | | | | 261,250 | |
|
Owens-Brockway Glass Container, Inc.(a) | |
01/15/22 | | | 5.000% | | | | 50,000 | | | | 52,625 | |
08/15/23 | | | 5.875% | | | | 100,000 | | | | 109,500 | |
01/15/25 | | | 5.375% | | | | 150,000 | | | | 157,125 | |
08/15/25 | | | 6.375% | | | | 225,000 | | | | 249,750 | |
|
Plastipak Holdings, Inc.(a) | |
10/01/21 | | | 6.500% | | | | 599,000 | | | | 622,960 | |
|
Reynolds Group Issuer, Inc./LLC | |
10/15/20 | | | 5.750% | | | | 2,910,000 | | | | 3,000,937 | |
|
Reynolds Group Issuer, Inc./LLC(a) | |
07/15/24 | | | 7.000% | | | | 554,000 | | | | 593,473 | |
|
Signode Industrial Group Luxembourg SA/US, Inc.(a) | |
05/01/22 | | | 6.375% | | | | 56,000 | | | | 57,120 | |
| | | | | | | | | | | | | |
Total | | | | | | | | | | | 10,205,340 | |
| | | |
| | | | | | | | | | | | |
PAPER 0.1% | |
Celulosa Arauco y Constitucion SA | |
07/29/19 | | | 7.250% | | | | 150,000 | | | | 171,143 | |
|
International Paper Co. | |
11/15/39 | | | 7.300% | | | | 2,000,000 | | | | 2,704,464 | |
08/15/47 | | | 4.400% | | | | 1,090,000 | | | | 1,107,613 | |
|
Packaging Corp. of America | |
11/01/23 | | | 4.500% | | | | 1,070,000 | | | | 1,180,393 | |
|
Plum Creek Timberlands LP | |
03/15/23 | | | 3.250% | | | | 1,630,000 | | | | 1,628,137 | |
| | | | | | | | | | | | |
| Corporate Bonds & Notes (continued) | |
| Issuer | | Coupon
Rate | | | Principal
Amount ($) | | | Value ($) | |
Weyerhaeuser Co. | |
10/01/19 | | | 7.375% | | | | 1,000,000 | | | | 1,143,494 | |
03/15/32 | | | 7.375% | | | | 1,630,000 | | | | 2,218,379 | |
| | | | | | | | | | | | | |
Total | | | | | | | | | | | 10,153,623 | |
| | | |
| | | | | | | | | | | | |
PHARMACEUTICALS 1.5% | |
AbbVie, Inc. | |
05/14/20 | | | 2.500% | | | | 1,200,000 | | | | 1,228,171 | |
05/14/25 | | | 3.600% | | | | 4,995,000 | | | | 5,286,109 | |
05/14/26 | | | 3.200% | | | | 1,854,000 | | | | 1,899,681 | |
05/14/45 | | | 4.700% | | | | 2,100,000 | | | | 2,338,190 | |
05/14/46 | | | 4.450% | | | | 3,205,000 | | | | 3,442,042 | |
|
Actavis Funding SCS | |
06/15/19 | | | 2.450% | | | | 2,000,000 | | | | 2,036,532 | |
03/12/20 | | | 3.000% | | | | 10,024,000 | | | | 10,350,031 | |
03/15/22 | | | 3.450% | | | | 2,276,000 | | | | 2,383,921 | |
03/15/25 | | | 3.800% | | | | 8,815,000 | | | | 9,313,779 | |
03/15/35 | | | 4.550% | | | | 1,000,000 | | | | 1,076,983 | |
|
Actavis Funding SCS(b) | |
09/01/16 | | | 1.548% | | | | 920,000 | | | | 920,015 | |
|
Actavis, Inc. | |
10/01/42 | | | 4.625% | | | | 3,410,000 | | | | 3,696,437 | |
|
Amgen, Inc. | |
05/22/19 | | | 2.200% | | | | 5,740,000 | | | | 5,863,221 | |
05/01/45 | | | 4.400% | | | | 6,280,000 | | | | 6,750,717 | |
|
Bayer US Finance LLC(a) | |
10/08/19 | | | 2.375% | | | | 1,310,000 | | | | 1,333,127 | |
10/08/24 | | | 3.375% | | | | 520,000 | | | | 533,619 | |
|
Celgene Corp. | |
08/15/25 | | | 3.875% | | | | 690,000 | | | | 745,824 | |
08/15/45 | | | 5.000% | | | | 6,850,000 | | | | 7,922,224 | |
|
Concordia International Corp.(a) | |
04/15/23 | | | 7.000% | | | | 77,000 | | | | 59,675 | |
|
Endo Finance LLC/Finco, Inc.(a) | |
02/01/25 | | | 6.000% | | | | 882,000 | | | | 782,775 | |
|
Endo Finance LLC/Ltd./Finco, Inc.(a) | |
07/15/23 | | | 6.000% | | | | 395,000 | | | | 358,462 | |
|
Forest Laboratories LLC(a) | |
02/01/19 | | | 4.375% | | | | 3,275,000 | | | | 3,456,258 | |
|
Gilead Sciences, Inc. | |
04/01/21 | | | 4.500% | | | | 1,500,000 | | | | 1,676,820 | |
02/01/25 | | | 3.500% | | | | 1,310,000 | | | | 1,398,658 | |
02/01/45 | | | 4.500% | | | | 3,114,000 | | | | 3,483,666 | |
|
Grifols Worldwide Operations Ltd. | |
04/01/22 | | | 5.250% | | | | 1,274,000 | | | | 1,331,330 | |
|
Jaguar Holding Co. II/Pharmaceutical Product Development LLC(a) | |
08/01/23 | | | 6.375% | | | | 791,000 | | | | 828,572 | |
|
Johnson & Johnson | |
12/05/33 | | | 4.375% | | | | 3,435,000 | | | | 4,191,864 | |
|
Mallinckrodt International Finance SA/CB LLC(a) | |
04/15/20 | | | 4.875% | | | | 50,000 | | | | 51,125 | |
10/15/23 | | | 5.625% | | | | 150,000 | | | | 150,563 | |
04/15/25 | | | 5.500% | | | | 567,000 | | | | 558,495 | |
The accompanying Notes to Financial Statements are an integral part of this statement.
| | | | | | |
| | |
| | | | ACTIVE PORTFOLIOS® MULTI-MANAGER TOTAL RETURN BOND FUND | | |
PORTFOLIO OF INVESTMENTS (continued)
August 31, 2016
| | | | | | | | | | | | |
| Corporate Bonds & Notes (continued) | |
| Issuer | | Coupon
Rate | | | Principal
Amount ($) | | | Value ($) | |
Mallinckrodt International Finance SA | |
04/15/23 | | | 4.750% | | | | 375,000 | | | | 348,047 | |
|
Mylan NV(a) | |
06/15/21 | | | 3.150% | | | | 4,530,000 | | | | 4,633,687 | |
|
Quintiles Transnational Corp.(a) | |
05/15/23 | | | 4.875% | | | | 117,000 | | | | 121,680 | |
|
Teva Pharmaceutical Finance III BV | |
07/21/23 | | | 2.800% | | | | 2,660,000 | | | | 2,674,340 | |
10/01/26 | | | 3.150% | | | | 1,985,000 | | | | 1,998,633 | |
|
Valeant Pharmaceuticals International, Inc.(a) | |
07/15/21 | | | 7.500% | | | | 415,000 | | | | 407,866 | |
12/01/21 | | | 5.625% | | | | 319,000 | | | | 287,100 | |
03/01/23 | | | 5.500% | | | | 1,181,000 | | | | 1,030,422 | |
05/15/23 | | | 5.875% | | | | 1,125,000 | | | | 990,000 | |
04/15/25 | | | 6.125% | | | | 3,692,000 | | | | 3,244,345 | |
| | | | | | | | | | | | | |
Total | | | | | | | | | | | 101,185,006 | |
| | | |
| | | | | | | | | | | | |
PROPERTY & CASUALTY 0.9% | |
Alliant Holdings I LP(a) | |
08/01/23 | | | 8.250% | | | | 24,000 | | | | 24,807 | |
|
Berkshire Hathaway Finance Corp. | |
08/15/19 | | | 1.300% | | | | 1,820,000 | | | | 1,819,294 | |
05/15/42 | | | 4.400% | | | | 3,850,000 | | | | 4,467,732 | |
05/15/43 | | | 4.300% | | | | 720,000 | | | | 826,617 | |
|
Berkshire Hathaway, Inc. | |
03/15/26 | | | 3.125% | | | | 6,865,000 | | | | 7,284,795 | |
02/11/43 | | | 4.500% | | | | 917,000 | | | | 1,085,661 | |
|
CNA Financial Corp. | |
11/15/19 | | | 7.350% | | | | 3,435,000 | | | | 3,944,301 | |
08/15/21 | | | 5.750% | | | | 925,000 | | | | 1,063,885 | |
|
Chubb Corp. (The)
Junior Subordinated(b) | |
04/15/37 | | | 6.375% | | | | 3,100,000 | | | | 2,896,563 | |
|
Chubb INA Holdings, Inc. | |
05/15/24 | | | 3.350% | | | | 910,000 | | | | 975,589 | |
05/03/26 | | | 3.350% | | | | 940,000 | | | | 1,009,688 | |
|
Farmers Exchange Capital II
Subordinated(a)(b) | |
11/01/53 | | | 6.151% | | | | 2,700,000 | | | | 2,977,387 | |
|
Farmers Exchange Capital(a)
Subordinated | |
07/15/28 | | | 7.050% | | | | 1,000,000 | | | | 1,202,704 | |
07/15/48 | | | 7.200% | | | | 1,615,000 | | | | 2,035,861 | |
|
HUB International Ltd.(a) | |
02/15/21 | | | 9.250% | | | | 109,000 | | | | 114,995 | |
10/01/21 | | | 7.875% | | | | 1,311,000 | | | | 1,340,498 | |
|
Hub Holdings LLC/Finance, Inc.
PIK(a) | |
07/15/19 | | | 8.125% | | | | 29,000 | | | | 28,275 | |
|
Liberty Mutual Group, Inc.(a) | |
05/01/22 | | | 4.950% | | | | 4,365,000 | | | | 4,867,350 | |
06/15/23 | | | 4.250% | | | | 275,000 | | | | 297,867 | |
05/01/42 | | | 6.500% | | | | 1,240,000 | | | | 1,559,932 | |
| | | | | | | | | | | | |
| Corporate Bonds & Notes (continued) | |
| Issuer | | Coupon
Rate | | | Principal
Amount ($) | | | Value ($) | |
08/01/44 | | | 4.850% | | | | 1,000,000 | | | | 1,066,419 | |
|
Loews Corp. | |
04/01/26 | | | 3.750% | | | | 11,431,000 | | | | 12,210,766 | |
05/15/43 | | | 4.125% | | | | 1,389,000 | | | | 1,472,944 | |
|
Nationwide Mutual Insurance Co.
Subordinated(a)(b) | |
12/15/24 | | | 2.943% | | | | 1,725,000 | | | | 1,707,974 | |
|
Old Republic International Corp. | |
08/26/26 | | | 3.875% | | | | 4,205,000 | | | | 4,231,618 | |
|
Travelers Companies, Inc. (The) | |
05/15/46 | | | 3.750% | | | | 1,395,000 | | | | 1,495,200 | |
| | | | | | | | | | | | | |
Total | | | | | | | | | | | 62,008,722 | |
| | | |
| | | | | | | | | | | | |
RAILROADS 0.2% | |
BNSF Funding Trust I
Junior Subordinated(b) | |
12/15/55 | | | 6.613% | | | | 2,273,000 | | | | 2,620,087 | |
|
Burlington Northern Santa Fe LLC | |
09/15/21 | | | 3.450% | | | | 295,000 | | | | 318,090 | |
09/01/22 | | | 3.050% | | | | 475,000 | | | | 504,665 | |
03/15/43 | | | 4.450% | | | | 2,500,000 | | | | 2,916,000 | |
|
Canadian Pacific Railway Ltd. | |
01/15/22 | | | 4.500% | | | | 600,000 | | | | 658,489 | |
|
Kansas City Southern | |
05/15/23 | | | 3.000% | | | | 1,000,000 | | | | 1,016,508 | |
08/15/45 | | | 4.950% | | | | 1,269,000 | | | | 1,477,518 | |
|
Union Pacific Corp. | |
02/15/19 | | | 2.250% | | | | 765,000 | | | | 782,275 | |
| | | | | | | | | | | | | |
Total | | | | | | | | | | | 10,293,632 | |
| | | |
| | | | | | | | | | | | |
REFINING 0.2% | |
Marathon Petroleum Corp. | |
03/01/21 | | | 5.125% | | | | 1,000,000 | | | | 1,114,750 | |
09/15/44 | | | 4.750% | | | | 5,425,000 | | | | 4,979,342 | |
|
Northern Tier Energy LLC/Finance Corp. | |
11/15/20 | | | 7.125% | | | | 100,000 | | | | 101,750 | |
|
Phillips 66 | |
11/15/44 | | | 4.875% | | | | 1,550,000 | | | | 1,736,356 | |
|
Tesoro Corp. | |
04/01/24 | | | 5.125% | | | | 225,000 | | | | 230,625 | |
|
Valero Energy Corp. | |
03/15/19 | | | 9.375% | | | | 2,000,000 | | | | 2,366,246 | |
| | | | | | | | | | | | | |
Total | | | | | | | | | | | 10,529,069 | |
| | | |
| | | | | | | | | | | | |
RESTAURANTS —% | |
BC ULC/New Red Finance, Inc.(a) | |
01/15/22 | | | 4.625% | | | | 491,000 | | | | 508,185 | |
04/01/22 | | | 6.000% | | | | 900,000 | | | | 941,625 | |
|
KFC Holding Co./Pizza Hut Holdings LLC/Taco Bell of America LLC(a) | |
06/01/26 | | | 5.250% | | | | 672,000 | | | | 714,000 | |
The accompanying Notes to Financial Statements are an integral part of this statement.
| | | | | | |
| | |
| | | | ACTIVE PORTFOLIOS® MULTI-MANAGER TOTAL RETURN BOND FUND | | |
PORTFOLIO OF INVESTMENTS (continued)
August 31, 2016
| | | | | | | | | | | | |
| Corporate Bonds & Notes (continued) | |
| Issuer | | Coupon
Rate | | | Principal
Amount ($) | | | Value ($) | |
Yum! Brands, Inc. | |
11/01/23 | | | 3.875% | | | | 275,000 | | | | 272,250 | |
11/01/43 | | | 5.350% | | | | 962,000 | | | | 836,940 | |
| | | | | | | | | | | | | |
Total | | | | | | | | | | | 3,273,000 | |
| | | |
| | | | | | | | | | | | |
RETAIL REIT 0.1% | |
Kimco Realty Corp. | |
11/01/22 | | | 3.400% | | | | 290,000 | | | | 304,091 | |
06/01/23 | | | 3.125% | | | | 3,230,000 | | | | 3,326,839 | |
| | | | | | | | | | | | | |
Total | | | | | | | | | | | 3,630,930 | |
| | | |
| | | | | | | | | | | | |
RETAILERS 0.6% | |
Asbury Automotive Group, Inc. | |
12/15/24 | | | 6.000% | | | | 577,000 | | | | 603,686 | |
|
AutoNation, Inc. | |
01/15/21 | | | 3.350% | | | | 660,000 | | | | 677,058 | |
|
AutoZone, Inc. | |
01/13/17 | | | 1.300% | | | | 775,000 | | | | 775,898 | |
04/21/26 | | | 3.125% | | | | 415,000 | | | | 428,211 | |
|
CVS Health Corp. | |
12/01/22 | | | 4.750% | | | | 8,714,000 | | | | 9,869,398 | |
12/05/23 | | | 4.000% | | | | 515,000 | | | | 568,795 | |
07/20/25 | | | 3.875% | | | | 877,000 | | | | 966,790 | |
06/01/26 | | | 2.875% | | | | 2,320,000 | | | | 2,378,684 | |
07/20/45 | | | 5.125% | | | | 705,000 | | | | 879,062 | |
|
CVS Pass-Through Trust(a) | |
01/10/36 | | | 4.704% | | | | 131,879 | | | | 145,778 | |
08/11/36 | | | 4.163% | | | | 2,296,662 | | | | 2,430,122 | |
| | | |
Dollar General Corp. | | | | | | | | | | | | |
11/01/25 | | | 4.150% | | | | 880,000 | | | | 962,783 | |
|
Dollar Tree, Inc. | |
03/01/23 | | | 5.750% | | | | 758,000 | | | | 815,798 | |
|
Group 1 Automotive, Inc. | |
06/01/22 | | | 5.000% | | | | 152,000 | | | | 152,760 | |
|
Group 1 Automotive, Inc.(a) | |
12/15/23 | | | 5.250% | | | | 206,000 | | | | 208,575 | |
|
Hanesbrands, Inc.(a) | |
05/15/24 | | | 4.625% | | | | 216,000 | | | | 225,990 | |
05/15/26 | | | 4.875% | | | | 291,000 | | | | 304,095 | |
|
Jo-Ann Stores Holdings, Inc.
PIK(a) | |
10/15/19 | | | 9.750% | | | | 75,000 | | | | 71,250 | |
|
Jo-Ann Stores LLC(a) | |
03/15/19 | | | 8.125% | | | | 50,000 | | | | 50,000 | |
| | | |
L Brands, Inc. | | | | | | | | | | | | |
02/15/22 | | | 5.625% | | | | 4,000,000 | | | | 4,440,000 | |
|
Michaels Stores, Inc.(a) | |
12/15/20 | | | 5.875% | | | | 425,000 | | | | 440,406 | |
| | | |
O’Reilly Automotive, Inc. | | | | | | | | | | | | |
03/15/26 | | | 3.550% | | | | 680,000 | | | | 725,247 | |
|
Party City Holdings, Inc.(a) | |
08/15/23 | | | 6.125% | | | | 425,000 | | | | 451,563 | |
| | | | | | | | | | | | |
| Corporate Bonds & Notes (continued) | |
| Issuer | | Coupon
Rate | | | Principal
Amount ($) | | | Value ($) | |
Penske Automotive Group, Inc. | |
12/01/24 | | | 5.375% | | | | 711,000 | | | | 723,443 | |
05/15/26 | | | 5.500% | | | | 6,000 | | | | 6,004 | |
| | | |
PetSmart, Inc.(a) | | | | | | | | | | | | |
03/15/23 | | | 7.125% | | | | 725,000 | | | | 762,156 | |
|
Rite Aid Corp.
Junior Subordinated | |
02/15/27 | | | 7.700% | | | | 55,000 | | | | 69,850 | |
|
Rite Aid Corp.(a) | |
04/01/23 | | | 6.125% | | | | 654,000 | | | | 706,045 | |
|
Sally Holdings LLC/Capital, Inc. | |
06/01/22 | | | 5.750% | | | | 540,000 | | | | 563,625 | |
12/01/25 | | | 5.625% | | | | 116,000 | | | | 125,628 | |
|
Wal-Mart Stores, Inc. | |
04/22/24 | | | 3.300% | | | | 2,100,000 | | | | 2,297,140 | |
08/15/37 | | | 6.500% | | | | 1,275,000 | | | | 1,890,235 | |
|
Walgreens Boots Alliance, Inc. | |
05/30/18 | | | 1.750% | | | | 2,385,000 | | | | 2,400,135 | |
06/01/21 | | | 2.600% | | | | 1,970,000 | | | | 2,015,298 | |
11/18/44 | | | 4.800% | | | | 1,950,000 | | | | 2,189,624 | |
| | | | | | | | | | | | | |
Total | | | | | | | | | | | 42,321,132 | |
| | | |
| | | | | | | | | | | | |
SUPERMARKETS 0.1% | |
Albertsons Companies, LLC/Safeway, Inc.(a) | |
03/15/25 | | | 5.750% | | | | 311,000 | | | | 321,885 | |
|
Koninklijke Ahold Delhaize NV | |
10/01/40 | | | 5.700% | | | | 200,000 | | | | 245,956 | |
|
Kroger Co. (The) | |
12/15/18 | | | 6.800% | | | | 3,060,000 | | | | 3,419,776 | |
| | | | | | | | | | | | | |
Total | | | | | | | | | | | 3,987,617 | |
| | | |
| | | | | | | | | | | | |
SUPRANATIONAL —% | |
Corporación Andina de Fomento | |
06/04/19 | | | 8.125% | | | | 1,400,000 | | | | 1,662,170 | |
06/15/22 | | | 4.375% | | | | 400,000 | | | | 442,504 | |
| | | | | | | | | | | | | |
Total | | | | | | | | | | | 2,104,674 | |
| | | |
| | | | | | | | | | | | |
TECHNOLOGY 2.3% | |
Alliance Data Systems Corp.(a) | |
12/01/17 | | | 5.250% | | | | 178,000 | | | | 182,005 | |
04/01/20 | | | 6.375% | | | | 98,000 | | | | 99,715 | |
08/01/22 | | | 5.375% | | | | 466,000 | | | | 459,010 | |
|
Ancestry.com, Inc.
Junior Subordinated | |
12/15/20 | | | 11.000% | | | | 123,000 | | | | 131,918 | |
|
Apple, Inc. | |
02/09/22 | | | 2.150% | | | | 2,000,000 | | | | 2,041,346 | |
05/06/44 | | | 4.450% | | | | 550,000 | | | | 621,990 | |
| | | |
Baidu, Inc. | | | | | | | | | | | | |
06/30/25 | | | 4.125% | | | | 700,000 | | | | 755,873 | |
|
CDW LLC/Finance Corp. | |
08/15/22 | | | 6.000% | | | | 1,045,000 | | | | 1,122,069 | |
The accompanying Notes to Financial Statements are an integral part of this statement.
| | | | | | |
| | |
| | | | ACTIVE PORTFOLIOS® MULTI-MANAGER TOTAL RETURN BOND FUND | | |
PORTFOLIO OF INVESTMENTS (continued)
August 31, 2016
| | | | | | | | | | | | |
| Corporate Bonds & Notes (continued) | |
| Issuer | | Coupon
Rate | | | Principal
Amount ($) | | | Value ($) | |
09/01/23 | | | 5.000% | | | | 175,000 | | | | 181,344 | |
12/01/24 | | | 5.500% | | | | 300,000 | | | | 321,510 | |
|
CommScope Technologies Finance LLC(a) | |
06/15/25 | | | 6.000% | | | | 3,200,000 | | | | 3,396,000 | |
|
CommScope, Inc.(a) | |
06/15/24 | | | 5.500% | | | | 250,000 | | | | 262,500 | |
|
Denali International LLC/Finance Corp.(a) | |
10/15/20 | | | 5.625% | | | | 3,571,000 | | | | 3,731,695 | |
|
Diamond 1 Finance Corp./Diamond 2 Finance Corp.(a) | |
06/01/19 | | | 3.480% | | | | 6,460,000 | | | | 6,647,385 | |
06/15/21 | | | 4.420% | | | | 3,840,000 | | | | 4,015,246 | |
06/15/21 | | | 5.875% | | | | 252,000 | | | | 266,450 | |
06/15/23 | | | 5.450% | | | | 10,110,000 | | | | 10,779,090 | |
06/15/24 | | | 7.125% | | | | 280,000 | | | | 303,339 | |
06/15/26 | | | 6.020% | | | | 1,230,000 | | | | 1,316,009 | |
|
Equifax, Inc. | |
12/15/22 | | | 3.300% | | | | 375,000 | | | | 392,745 | |
|
Equinix, Inc. | |
04/01/20 | | | 4.875% | | | | 234,000 | | | | 243,360 | |
01/01/22 | | | 5.375% | | | | 581,000 | | | | 620,578 | |
01/15/26 | | | 5.875% | | | | 453,000 | | | | 493,485 | |
|
Fidelity National Information Services, Inc. | |
04/15/23 | | | 3.500% | | | | 2,500,000 | | | | 2,632,227 | |
08/15/26 | | | 3.000% | | | | 2,390,000 | | | | 2,382,017 | |
|
First Data Corp.(a) | |
08/15/23 | | | 5.375% | | | | 1,059,000 | | | | 1,098,712 | |
12/01/23 | | | 7.000% | | | | 6,786,000 | | | | 7,108,335 | |
01/15/24 | | | 5.750% | | | | 2,205,000 | | | | 2,257,369 | |
|
Flextronics International Ltd. | |
06/15/25 | | | 4.750% | | | | 385,000 | | | | 409,011 | |
|
Freescale Semiconductor, Inc.(a) | |
01/15/22 | | | 6.000% | | | | 4,000,000 | | | | 4,216,000 | |
| | | |
HP, Inc. | | | | | | | | | | | | |
06/01/21 | | | 4.300% | | | | 3,865,000 | | | | 4,172,886 | |
|
Hewlett Packard Enterprise Co.(a) | |
10/05/18 | | | 2.850% | | | | 2,000,000 | | | | 2,038,564 | |
10/15/20 | | | 3.600% | | | | 690,000 | | | | 722,562 | |
10/15/22 | | | 4.400% | | | | 1,886,000 | | | | 1,993,657 | |
10/15/25 | | | 4.900% | | | | 3,155,000 | | | | 3,372,556 | |
10/15/45 | | | 6.350% | | | | 5,430,000 | | | | 5,604,591 | |
|
Infor US, Inc. | |
05/15/22 | | | 6.500% | | | | 700,000 | | | | 709,625 | |
|
Infor US, Inc.(a) | |
08/15/20 | | | 5.750% | | | | 33,000 | | | | 34,832 | |
| | | |
Informatica LLC(a) | | | | | | | | | | | | |
07/15/23 | | | 7.125% | | | | 84,000 | | | | 79,380 | |
|
Ingram Micro, Inc. | |
12/15/24 | | | 4.950% | | | | 1,250,000 | | | | 1,264,211 | |
| | | |
Intel Corp. | | | | | | | | | | | | |
05/19/26 | | | 2.600% | | | | 2,475,000 | | | | 2,542,144 | |
|
International Business Machines Corp. | |
02/19/21 | | | 2.250% | | | | 5,846,000 | | | | 6,022,906 | |
| | | | | | | | | | | | |
| Corporate Bonds & Notes (continued) | |
| Issuer | | Coupon
Rate | | | Principal
Amount ($) | | | Value ($) | |
Jabil Circuit, Inc. | |
12/15/20 | | | 5.625% | | | | 1,000,000 | | | | 1,072,500 | |
|
MSCI, Inc.(a) | |
11/15/24 | | | 5.250% | | | | 404,000 | | | | 429,250 | |
08/15/25 | | | 5.750% | | | | 521,000 | | | | 564,634 | |
08/01/26 | | | 4.750% | | | | 1,009,000 | | | | 1,035,486 | |
|
Micron Technology, Inc. | |
02/01/25 | | | 5.500% | | | | 100,000 | | | | 96,875 | |
|
Micron Technology, Inc.(a) | |
08/01/23 | | | 5.250% | | | | 225,000 | | | | 217,688 | |
01/15/24 | | | 5.250% | | | | 125,000 | | | | 119,624 | |
| | | |
Microsemi Corp.(a) | | | | | | | | | | | | |
04/15/23 | | | 9.125% | | | | 550,000 | | | | 629,750 | |
|
Microsoft Corp. | |
08/08/21 | | | 1.550% | | | | 4,175,000 | | | | 4,169,911 | |
08/08/26 | | | 2.400% | | | | 5,615,000 | | | | 5,644,776 | |
08/08/46 | | | 3.700% | | | | 1,890,000 | | | | 1,963,827 | |
|
NCR Corp. | |
02/15/21 | | | 4.625% | | | | 600,000 | | | | 606,330 | |
07/15/22 | | | 5.000% | | | | 50,000 | | | | 50,750 | |
12/15/23 | | | 6.375% | | | | 125,000 | | | | 132,188 | |
|
NXP BV/Funding LLC(a) | |
02/15/21 | | | 5.750% | | | | 2,205,000 | | | | 2,298,712 | |
06/01/21 | | | 4.125% | | | | 850,000 | | | | 889,100 | |
06/15/22 | | | 4.625% | | | | 618,000 | | | | 650,828 | |
09/01/22 | | | 3.875% | | | | 155,000 | | | | 157,519 | |
|
Nuance Communications, Inc.(a) | |
08/15/20 | | | 5.375% | | | | 3,925,000 | | | | 4,013,312 | |
|
Oracle Corp. | |
10/08/19 | | | 2.250% | | | | 3,000,000 | | | | 3,094,803 | |
09/15/21 | | | 1.900% | | | | 8,395,000 | | | | 8,423,106 | |
09/15/23 | | | 2.400% | | | | 13,165,000 | | | | 13,284,143 | |
07/15/26 | | | 2.650% | | | | 5,525,000 | | | | 5,575,780 | |
07/08/34 | | | 4.300% | | | | 1,645,000 | | | | 1,824,680 | |
07/15/36 | | | 3.850% | | | | 1,710,000 | | | | 1,803,239 | |
| | | |
PTC, Inc. | | | | | | | | | | | | |
05/15/24 | | | 6.000% | | | | 492,000 | | | | 531,975 | |
|
Qualitytech LP/Finance Corp. | |
08/01/22 | | | 5.875% | | | | 288,000 | | | | 297,360 | |
|
Riverbed Technology, Inc.(a) | |
03/01/23 | | | 8.875% | | | | 190,000 | | | | 203,775 | |
|
SS&C Technologies Holdings, Inc. | |
07/15/23 | | | 5.875% | | | | 1,125,000 | | | | 1,184,062 | |
|
Sensata Technologies BV(a) | |
11/01/24 | | | 5.625% | | | | 175,000 | | | | 185,500 | |
10/01/25 | | | 5.000% | | | | 150,000 | | | | 155,250 | |
|
Sensata Technologies UK Financing Co. PLC(a) | |
02/15/26 | | | 6.250% | | | | 258,000 | | | | 282,833 | |
|
Solera LLC/Finance, Inc.(a) | |
03/01/24 | | | 10.500% | | | | 379,000 | | | | 419,743 | |
|
Tencent Holdings Ltd.(a) | |
02/11/25 | | | 3.800% | | | | 200,000 | | | | 213,384 | |
The accompanying Notes to Financial Statements are an integral part of this statement.
| | | | | | |
| | |
| | | | ACTIVE PORTFOLIOS® MULTI-MANAGER TOTAL RETURN BOND FUND | | |
PORTFOLIO OF INVESTMENTS (continued)
August 31, 2016
| | | | | | | | | | | | |
| Corporate Bonds & Notes (continued) | |
| Issuer | | Coupon
Rate | | | Principal
Amount ($) | | | Value ($) | |
VeriSign, Inc. | |
05/01/23 | | | 4.625% | | | | 538,000 | | | | 550,105 | |
04/01/25 | | | 5.250% | | | | 124,000 | | | | 129,270 | |
|
Xerox Corp. | |
05/15/20 | | | 2.800% | | | | 4,228,000 | | | | 4,185,813 | |
|
Zebra Technologies Corp. | |
10/15/22 | | | 7.250% | | | | 741,000 | | | | 803,985 | |
| | | | | | | | | | | | | |
Total | | | | | | | | | | | 154,938,113 | |
| | | |
| | | | | | | | | | | | |
TOBACCO 0.1% | |
Reynolds American, Inc. | |
06/12/25 | | | 4.450% | | | | 1,325,000 | | | | 1,487,210 | |
08/04/41 | | | 7.000% | | | | 1,170,000 | | | | 1,522,453 | |
08/15/45 | | | 5.850% | | | | 1,450,000 | | | | 1,885,779 | |
| | | | | | | | | | | | | |
Total | | | | | | | | | | | 4,895,442 | |
| | | |
| | | | | | | | | | | | |
TRANSPORTATION SERVICES 0.3% | |
Avis Budget Car Rental LLC/Finance, Inc. | |
04/01/23 | | | 5.500% | | | | 75,000 | | | | 77,719 | |
|
Avis Budget Car Rental LLC/Finance, Inc.(a) | |
04/01/24 | | | 6.375% | | | | 225,000 | | | | 236,812 | |
|
ERAC U.S.A. Finance LLC(a) | |
10/01/20 | | | 5.250% | | | | 2,500,000 | | | | 2,797,222 | |
11/15/24 | | | 3.850% | | | | 2,500,000 | | | | 2,698,992 | |
12/01/26 | | | 3.300% | | | | 3,950,000 | | | | 4,059,680 | |
|
FedEx Corp. | |
11/15/45 | | | 4.750% | | | | 1,853,000 | | | | 2,125,082 | |
04/01/46 | | | 4.550% | | | | 1,025,000 | | | | 1,138,662 | |
|
Hertz Corp. (The) | |
04/15/19 | | | 6.750% | | | | 175,000 | | | | 178,500 | |
10/15/20 | | | 5.875% | | | | 25,000 | | | | 25,906 | |
01/15/21 | | | 7.375% | | | | 42,000 | | | | 43,733 | |
10/15/22 | | | 6.250% | | | | 309,000 | | | | 324,944 | |
|
Penske Truck Leasing Co. LP/Finance Corp.(a) | |
04/01/21 | | | 3.300% | | | | 2,000,000 | | | | 2,066,840 | |
02/01/22 | | | 3.375% | | | | 1,200,000 | | | | 1,241,064 | |
|
Ryder System, Inc. | |
06/01/17 | | | 3.500% | | | | 1,000,000 | | | | 1,016,048 | |
11/15/18 | | | 2.450% | | | | 660,000 | | | | 669,738 | |
06/01/19 | | | 2.550% | | | | 1,500,000 | | | | 1,522,974 | |
| | | | | | | | | | | | | |
Total | | | | | | | | | | | 20,223,916 | |
| | | |
| | | | | | | | | | | | |
WIRELESS 0.4% | |
America Movil SAB de CV | |
03/30/20 | | | 5.000% | | | | 300,000 | | | | 331,476 | |
07/16/22 | | | 3.125% | | | | 200,000 | | | | 206,977 | |
| | | |
American Tower Corp. | | | | | | | | | | | | |
02/15/24 | | | 5.000% | | | | 665,000 | | | | 760,518 | |
|
Crown Castle International Corp. | |
04/15/22 | | | 4.875% | | | | 3,075,000 | | | | 3,420,630 | |
| | | |
Digicel Group Ltd.(a) | | | | | | | | | | | | |
09/30/20 | | | 8.250% | | | | 600,000 | | | | 543,000 | |
| | | | | | | | | | | | |
| Corporate Bonds & Notes (continued) | |
| Issuer | | Coupon
Rate | | | Principal
Amount ($) | | | Value ($) | |
SBA Communications Corp.(a) | |
09/01/24 | | | 4.875% | | | | 2,442,000 | | | | 2,475,577 | |
|
SFR Group SA(a) | |
05/15/22 | | | 6.000% | | | | 944,000 | | | | 964,768 | |
05/01/26 | | | 7.375% | | | | 948,000 | | | | 978,810 | |
|
Sprint Communications, Inc. | |
08/15/20 | | | 7.000% | | | | 102,000 | | | | 100,470 | |
04/15/22 | | | 9.250% | | | | 3,650,000 | | | | 3,832,500 | |
11/15/22 | | | 6.000% | | | | 44,000 | | | | 39,820 | |
|
Sprint Communications, Inc.(a) | |
11/15/18 | | | 9.000% | | | | 629,000 | | | | 690,327 | |
03/01/20 | | | 7.000% | | | | 1,138,000 | | | | 1,220,505 | |
|
Sprint Corp. | |
09/15/21 | | | 7.250% | | | | 100,000 | | | | 98,875 | |
09/15/23 | | | 7.875% | | | | 525,000 | | | | 510,295 | |
06/15/24 | | | 7.125% | | | | 1,560,000 | | | | 1,454,700 | |
02/15/25 | | | 7.625% | | | | 14,000 | | | | 13,291 | |
|
T-Mobile USA, Inc. | |
04/28/21 | | | 6.633% | | | | 2,589,000 | | | | 2,711,977 | |
01/15/22 | | | 6.125% | | | | 39,000 | | | | 41,145 | |
04/28/22 | | | 6.731% | | | | 767,000 | | | | 806,309 | |
03/01/23 | | | 6.000% | | | | 67,000 | | | | 71,023 | |
04/01/23 | | | 6.625% | | | | 1,959,000 | | | | 2,089,998 | |
04/28/23 | | | 6.836% | | | | 50,000 | | | | 53,625 | |
01/15/24 | | | 6.500% | | | | 1,689,000 | | | | 1,815,675 | |
03/01/25 | | | 6.375% | | | | 368,000 | | | | 395,600 | |
01/15/26 | | | 6.500% | | | | 786,000 | | | | 860,179 | |
|
Wind Acquisition Finance SA(a) | |
04/30/20 | | | 6.500% | | | | 136,000 | | | | 142,376 | |
07/15/20 | | | 4.750% | | | | 185,000 | | | | 187,313 | |
04/23/21 | | | 7.375% | | | | 162,000 | | | | 166,860 | |
| | | | | | | | | | | | | |
Total | | | | | | | | | | | 26,984,619 | |
| | | |
| | | | | | | | | | | | |
WIRELINES 1.3% | |
AT&T, Inc. | |
03/15/22 | | | 3.800% | | | | 1,960,000 | | | | 2,104,093 | |
02/17/23 | | | 3.600% | | | | 3,120,000 | | | | 3,296,071 | |
02/17/26 | | | 4.125% | | | | 4,085,000 | | | | 4,438,116 | |
05/15/38 | | | 6.400% | | | | 1,025,000 | | | | 1,318,033 | |
03/01/41 | | | 6.375% | | | | 1,500,000 | | | | 1,907,761 | |
03/15/42 | | | 5.150% | | | | 1,140,000 | | | | 1,270,720 | |
12/15/42 | | | 4.300% | | | | 2,260,000 | | | | 2,265,076 | |
06/15/44 | | | 4.800% | | | | 7,260,000 | | | | 7,717,017 | |
05/15/46 | | | 4.750% | | | | 1,150,000 | | | | 1,229,119 | |
02/15/47 | | | 5.650% | | | | 1,705,000 | | | | 2,053,464 | |
|
Bharti Airtel International Netherlands BV(a) | |
05/20/24 | | | 5.350% | | | | 300,000 | | | | 334,838 | |
|
CenturyLink, Inc. | |
03/15/22 | | | 5.800% | | | | 124,000 | | | | 128,290 | |
12/01/23 | | | 6.750% | | | | 597,000 | | | | 628,343 | |
04/01/24 | | | 7.500% | | | | 506,000 | | | | 548,694 | |
04/01/25 | | | 5.625% | | | | 71,000 | | | | 69,225 | |
|
Deutsche Telekom International Finance BV | |
06/01/32 | | | 9.250% | | | | 625,000 | | | | 1,033,219 | |
|
Frontier Communications Corp. | |
09/15/20 | | | 8.875% | | | | 266,000 | | | | 289,940 | |
The accompanying Notes to Financial Statements are an integral part of this statement.
| | | | | | |
| | |
| | | | ACTIVE PORTFOLIOS® MULTI-MANAGER TOTAL RETURN BOND FUND | | |
PORTFOLIO OF INVESTMENTS (continued)
August 31, 2016
| | | | | | | | | | | | |
| Corporate Bonds & Notes (continued) | |
| Issuer | | Coupon
Rate | | | Principal
Amount ($) | | | Value ($) | |
07/01/21 | | | 9.250% | | | | 43,000 | | | | 46,548 | |
09/15/22 | | | 10.500% | | | | 84,000 | | | | 91,403 | |
01/15/23 | | | 7.125% | | | | 88,000 | | | | 82,940 | |
04/15/24 | | | 7.625% | | | | 68,000 | | | | 63,920 | |
01/15/25 | | | 6.875% | | | | 82,000 | | | | 73,595 | |
09/15/25 | | | 11.000% | | | | 1,729,000 | | | | 1,867,320 | |
|
Level 3 Communications, Inc. | |
12/01/22 | | | 5.750% | | | | 390,000 | | | | 407,550 | |
|
Level 3 Financing, Inc. | |
01/15/21 | | | 6.125% | | | | 66,000 | | | | 68,475 | |
08/15/22 | | | 5.375% | | | | 146,000 | | | | 152,592 | |
02/01/23 | | | 5.625% | | | | 330,000 | | | | 345,675 | |
01/15/24 | | | 5.375% | | | | 145,000 | | | | 151,888 | |
05/01/25 | | | 5.375% | | | | 889,000 | | | | 933,450 | |
|
Level 3 Financing, Inc.(a) | |
03/15/26 | | | 5.250% | | | | 213,000 | | | | 220,721 | |
|
Orange SA(b) | |
03/01/31 | | | 9.000% | | | | 1,940,000 | | | | 3,112,716 | |
| | | |
Qwest Corp. | | | | | | | | | | | | |
09/15/25 | | | 7.250% | | | | 3,978,000 | | | | 4,304,101 | |
|
Telecom Italia SpA(a) | |
05/30/24 | | | 5.303% | | | | 381,000 | | | | 390,049 | |
|
Telefonica Emisiones SAU | |
04/27/18 | | | 3.192% | | | | 870,000 | | | | 892,510 | |
|
Verizon Communications, Inc. | |
09/15/23 | | | 5.150% | | | | 16,198,000 | | | | 18,956,033 | |
03/15/24 | | | 4.150% | | | | 750,000 | | | | 833,509 | |
03/15/34 | | | 5.050% | | | | 2,082,000 | | | | 2,374,028 | |
11/01/34 | | | 4.400% | | | | 7,065,000 | | | | 7,512,900 | |
11/01/41 | | | 4.750% | | | | 2,000,000 | | | | 2,142,658 | |
11/01/42 | | | 3.850% | | | | 1,395,000 | | | | 1,348,499 | |
09/15/43 | | | 6.550% | | | | 1,000,000 | | | | 1,358,033 | |
08/21/46 | | | 4.862% | | | | 1,399,000 | | | | 1,547,827 | |
03/15/55 | | | 4.672% | | | | 1,725,000 | | | | 1,793,940 | |
|
Zayo Group LLC/Capital, Inc. | |
04/01/23 | | | 6.000% | | | | 820,000 | | | | 852,800 | |
05/15/25 | | | 6.375% | | | | 362,000 | | | | 381,986 | |
| | | | | | | | | | | | | |
Total | | | | | | | | | | | 82,939,685 | |
| | | | | | | | | | | | | |
Total Corporate Bonds & Notes | | | | | |
(Cost: $2,464,575,527) | | | | | | | | 2,556,344,102 | |
| | | |
| | | | | | | | | | | | |
| Residential Mortgage-Backed Securities —Agency 18.9% | |
Federal Home Loan Mortgage Corp. Multifamily
Structured Pass-Through Certificates
CMO Series K151 Class A3 | |
04/25/30 | | | 3.511% | | | | 4,290,000 | | | | 4,798,012 | |
|
Federal Home Loan Mortgage Corp. | |
06/01/19 - 07/01/41 | | | 4.500% | | | | 5,182,220 | | | | 5,643,563 | |
02/01/20 - 02/01/46 | | | 4.000% | | | | 50,686,119 | | | | 54,626,772 | |
04/01/21 | | | 9.000% | | | | 548 | | | | 554 | |
01/01/22 - 09/01/39 | | | 5.500% | | | | 2,879,838 | | | | 3,246,085 | |
03/01/22 - 08/01/22 | | | 8.500% | | | | 9,410 | | | | 10,225 | |
07/01/23 - 05/01/41 | | | 5.000% | | | | 2,281,939 | | | | 2,487,196 | |
| | | | | | | | | | | | |
| Residential Mortgage-Backed Securities — Agency (continued) | |
| Issuer | | Coupon
Rate | | | Principal
Amount ($) | | | Value ($) | |
08/01/24 - 02/01/25 | | | 8.000% | | | | 32,453 | | | | 35,915 | |
10/01/28 - 07/01/32 | | | 7.000% | | | | 430,340 | | | | 512,674 | |
03/01/31 - 08/01/46 | | | 3.000% | | | | 25,388,719 | | | | 26,406,950 | |
10/01/31 - 07/01/37 | | | 6.000% | | | | 1,238,794 | | | | 1,447,203 | |
11/01/36 - 10/01/37 | | | 6.500% | | | | 550,519 | | | | 630,862 | |
05/01/43 - 08/01/46 | | | 3.500% | | | | 122,652,449 | | | | 129,981,352 | |
CMO Series 3071 Class ZP | |
11/15/35 | | | 5.500% | | | | 5,447,496 | | | | 7,223,786 | |
CMO Series 3741 Class PD | |
10/15/40 | | | 4.000% | | | | 1,855,000 | | | | 2,098,824 | |
CMO Series 3809 Class HZ | |
02/15/41 | | | 4.000% | | | | 2,196,609 | | | | 2,548,387 | |
CMO Series 4247 Class AY | |
09/15/43 | | | 4.500% | | | | 1,000,000 | | | | 1,206,211 | |
CMO Series 4396 Class PZ | |
06/15/37 | | | 3.000% | | | | 653,030 | | | | 670,512 | |
CMO Series 4496 Class PZ | |
07/15/45 | | | 2.500% | | | | 588,714 | | | | 561,232 | |
|
Federal Home Loan Mortgage Corp.(b)
CMO Series 2380 Class F | |
11/15/31 | | | 0.958% | | | | 478,093 | | | | 479,299 | |
CMO Series 2557 Class FG | |
01/15/33 | | | 0.908% | | | | 1,103,116 | | | | 1,100,398 | |
CMO Series 2962 Class PF | |
03/15/35 | | | 0.758% | | | | 694,274 | | | | 695,036 | |
CMO Series 2981 Class FU | |
05/15/30 | | | 0.708% | | | | 790,709 | | | | 786,100 | |
CMO Series 3085 Class FV | |
08/15/35 | | | 1.208% | | | | 2,129,752 | | | | 2,162,361 | |
CMO Series 3785 Class LS | |
01/15/41 | | | 8.885% | | | | 2,297,821 | | | | 2,796,832 | |
CMO Series 3973 Class FP | |
12/15/26 | | | 0.808% | | | | 925,042 | | | | 924,086 | |
CMO Series 4048 Class FJ | |
07/15/37 | | | 0.867% | | | | 1,186,269 | | | | 1,166,830 | |
CMO Series 4238 Class FD | |
02/15/42 | | | 0.808% | | | | 3,978,199 | | | | 3,972,364 | |
CMO Series 4311 Class PF | |
06/15/42 | | | 0.858% | | | | 1,368,392 | | | | 1,370,386 | |
CMO Series 4364 Class FE | |
12/15/39 | | | 0.808% | | | | 994,246 | | | | 993,607 | |
|
Federal Home Loan Mortgage Corp.(b)(g)
CMO IO Series 3404 Class AS | |
01/15/38 | | | 5.387% | | | | 6,132,963 | | | | 1,088,962 | |
|
Federal Home Loan Mortgage Corp.(c) | |
04/01/46 | | | 4.000% | | | | 10,877,940 | | | | 11,641,245 | |
08/01/46 - 09/01/46 | | | 3.000% | | | | 19,780,000 | | | | 20,548,793 | |
09/14/46 | | | 4.500% | | | | 8,000,000 | | | | 8,747,500 | |
|
Federal National Mortgage Association | |
04/01/23 | | | 8.500% | | | | 3,872 | | | | 3,972 | |
06/01/24 | | | 9.000% | | | | 7,866 | | | | 8,571 | |
02/01/25 - 08/01/27 | | | 8.000% | | | | 56,273 | | | | 64,771 | |
03/01/26 - 07/01/38 | | | 7.000% | | | | 1,264,151 | | | | 1,518,955 | |
11/01/26 - 09/01/45 | | | 3.000% | | | | 59,292,958 | | | | 61,878,942 | |
04/01/27 - 06/01/32 | | | 7.500% | | | | 111,699 | | | | 129,131 | |
09/01/27 - 01/01/31 | | | 2.500% | | | | 15,454,595 | | | | 16,009,506 | |
05/01/29 - 10/01/40 | | | 6.000% | | | | 4,338,838 | | | | 5,039,825 | |
05/01/32 - 10/01/38 | | | 6.500% | | | | 413,334 | | | | 478,260 | |
09/01/32 - 09/01/45 | | | 4.000% | | | | 83,359,265 | | | | 90,381,515 | |
The accompanying Notes to Financial Statements are an integral part of this statement.
| | | | | | |
| | |
| | | | ACTIVE PORTFOLIOS® MULTI-MANAGER TOTAL RETURN BOND FUND | | |
PORTFOLIO OF INVESTMENTS (continued)
August 31, 2016
| | | | | | | | | | | | |
| Residential Mortgage-Backed Securities — Agency (continued) | |
| Issuer | | Coupon
Rate | | | Principal
Amount ($) | | | Value ($) | |
03/01/33 - 04/01/41 | | | 5.500% | | | | 2,155,964 | | | | 2,470,618 | |
07/01/34 - 10/01/41 | | | 5.000% | | | | 11,482,677 | | | | 12,762,630 | |
10/01/40 - 12/01/43 | | | 4.500% | | | | 15,335,952 | | | | 16,801,141 | |
CMO Series 2003-82 Class Z | |
08/25/33 | | | 5.500% | | | | 253,065 | | | | 295,410 | |
CMO Series 2009-100 Class PL | |
12/25/39 | | | 5.000% | | | | 770,652 | | | | 949,592 | |
CMO Series 2009-111 Class DA | |
12/25/39 | | | 5.000% | | | | 566,762 | | | | 605,078 | |
CMO Series 2012-103 Class PY | |
09/25/42 | | | 3.000% | | | | 1,000,000 | | | | 1,033,661 | |
CMO Series 2013-15 Class BL | |
03/25/43 | | | 2.500% | | | | 2,323,879 | | | | 2,223,567 | |
CMO Series 2013-17 Class JP | |
03/25/43 | | | 3.000% | | | | 650,000 | | | | 673,015 | |
CMO Series 2015-18 Class NB | |
04/25/45 | | | 3.000% | | | | 2,002,796 | | | | 2,048,902 | |
CMO Series 2016-25 Class LB | |
05/25/46 | | | 3.000% | | | | 3,000,000 | | | | 3,123,908 | |
|
Federal National Mortgage Association(b) | |
04/01/34 | | | 2.375% | | | | 435,750 | | | | 450,112 | |
CMO Series 2003-134 Class FC | |
12/25/32 | | | 1.124% | | | | 3,158,537 | | | | 3,198,736 | |
CMO Series 2004-93 Class FC | |
12/25/34 | | | 0.724% | | | | 1,920,916 | | | | 1,909,897 | |
CMO Series 2006-71 Class SH | |
05/25/35 | | | 14.362% | | | | 308,127 | | | | 452,929 | |
CMO Series 2007-W7 Class 1A4 | |
07/25/37 | | | 36.034% | | | | 260,195 | | | | 401,089 | |
CMO Series 2008-15 Class AS | |
08/25/36 | | | 30.378% | | | | 937,386 | | | | 1,857,344 | |
CMO Series 2010-74 Class WF | |
07/25/34 | | | 1.124% | | | | 1,582,559 | | | | 1,584,017 | |
CMO Series 2010-86 Class FE | |
08/25/25 | | | 0.974% | | | | 1,968,692 | | | | 1,967,203 | |
CMO Series 2010-135 Class FD | |
06/25/39 | | | 1.024% | | | | 4,161,272 | | | | 4,174,415 | |
CMO Series 2010-142 Class HS | |
12/25/40 | | | 9.012% | | | | 1,466,479 | | | | 1,630,527 | |
CMO Series 2010-150 Class FL | |
10/25/40 | | | 1.074% | | | | 1,439,684 | | | | 1,447,340 | |
CMO Series 2011-99 Class KF | |
10/25/26 | | | 0.824% | | | | 1,772,964 | | | | 1,773,034 | |
CMO Series 2012-115 Class MT | |
10/25/42 | | | 4.500% | | | | 2,201,869 | | | | 2,292,801 | |
CMO Series 2012-1 Class FA | |
02/25/42 | | | 1.024% | | | | 3,841,544 | | | | 3,849,981 | |
CMO Series 2012-110 Class CF | |
10/25/42 | | | 1.024% | | | | 12,375,101 | | | | 12,349,113 | |
CMO Series 2012-14 Class FB | |
08/25/37 | | | 0.974% | | | | 630,139 | | | | 632,232 | |
CMO Series 2012-47 Class HF | |
05/25/27 | | | 0.924% | | | | 2,632,957 | | | | 2,633,536 | |
CMO Series 2012-73 Class LF | |
06/25/39 | | | 0.974% | | | | 3,632,669 | | | | 3,632,712 | |
CMO Series 2016-32 Class GT | |
01/25/43 | | | 4.500% | | | | 2,314,163 | | | | 2,358,784 | |
CMO Series 2016-32 Class TG | |
01/25/43 | | | 4.500% | | | | 1,938,750 | | | | 1,985,625 | |
| | | | | | | | | | | | |
| Residential Mortgage-Backed Securities — Agency (continued) | |
| Issuer | | Coupon
Rate | | | Principal
Amount ($) | | | Value ($) | |
Federal National Mortgage Association(c) | |
10/19/30 - 09/19/31 | | | 2.500% | | | | 66,920,000 | | | | 69,078,706 | |
09/19/31 - 09/14/46 | | | 3.000% | | | | 90,690,000 | | | | 94,349,572 | |
10/14/45 - 09/14/46 | | | 4.000% | | | | 48,975,000 | | | | 52,428,148 | |
09/14/46 | | | 3.500% | | | | 15,140,000 | | | | 15,954,367 | |
09/14/46 | | | 4.500% | | | | 47,510,000 | | | | 51,897,254 | |
|
Federal National Mortgage Association(h) | |
CMO PO STRIPS Series 43 Class 1 | |
09/25/18 | | | 0.000% | | | | 373 | | | | 365 | |
|
Federal National Mortgage Association(p) | |
10/01/25 - 03/01/46 | | | 3.500% | | | | 111,305,121 | | | | 118,150,863 | |
|
Government National Mortgage Association | |
05/15/40 | | | 5.000% | | | | 1,403,189 | | | | 1,569,108 | |
05/20/41 - 08/20/62 | | | 4.500% | | | | 2,396,173 | | | | 2,614,614 | |
02/15/42 - 01/20/46 | | | 4.000% | | | | 10,598,121 | | | | 11,365,367 | |
03/20/46 - 04/20/46 | | | 3.500% | | | | 14,482,880 | | | | 15,384,630 | |
06/20/46 - 07/20/46 | | | 3.000% | | | | 16,966,056 | | | | 17,798,044 | |
08/20/59 | | | 5.500% | | | | 53,312 | | | | 54,663 | |
12/20/60 | | | 4.305% | | | | 120,660 | | | | 124,248 | |
01/20/61 | | | 5.305% | | | | 78,781 | | | | 84,643 | |
04/20/61 | | | 4.345% | | | | 311,128 | | | | 319,907 | |
01/20/62 | | | 4.651% | | | | 71,087 | | | | 74,854 | |
03/20/62 | | | 4.548% | | | | 206,670 | | | | 218,174 | |
05/20/62 | | | 4.170% | | | | 2,097,309 | | | | 2,225,575 | |
05/20/62 | | | 4.510% | | | | 229,256 | | | | 243,506 | |
05/20/62 | | | 4.521% | | | | 182,826 | | | | 193,979 | |
06/20/62 | | | 4.598% | | | | 169,334 | | | | 179,580 | |
07/20/62 | | | 4.589% | | | | 115,996 | | | | 123,809 | |
08/20/62 | | | 4.518% | | | | 1,004,017 | | | | 1,070,520 | |
08/20/62 | | | 4.534% | | | | 1,952,971 | | | | 2,079,967 | |
09/20/62 | | | 4.526% | | | | 1,476,641 | | | | 1,574,421 | |
10/20/62 | | | 4.487% | | | | 1,905,248 | | | | 2,037,274 | |
10/20/62 - 03/20/63 | | | 4.490% | | | | 166,378 | | | | 178,880 | |
11/20/62 | | | 4.630% | | | | 549,295 | | | | 587,506 | |
11/20/62 | | | 4.646% | | | | 1,727,246 | | | | 1,854,805 | |
12/20/62 | | | 4.604% | | | | 1,935,021 | | | | 2,069,856 | |
02/20/63 | | | 4.287% | | | | 241,648 | | | | 260,649 | |
02/20/63 | | | 4.337% | | | | 453,857 | | | | 486,941 | |
02/20/63 | | | 4.437% | | | | 1,085,108 | | | | 1,164,649 | |
02/20/63 | | | 4.568% | | | | 244,880 | | | | 262,516 | |
03/20/63 | | | 4.556% | | | | 611,308 | | | | 658,637 | |
04/20/63 | | | 4.211% | | | | 1,703,455 | | | | 1,838,517 | |
04/20/63 | | | 4.451% | | | | 1,547,590 | | | | 1,667,634 | |
04/20/63 | | | 4.505% | | | | 103,415 | | | | 111,434 | |
04/20/63 | | | 4.511% | | | | 257,829 | | | | 277,794 | |
04/20/63 | | | 4.759% | | | | 31,832 | | | | 33,138 | |
05/20/63 | | | 4.401% | | | | 1,898,240 | | | | 2,048,351 | |
05/20/63 | | | 4.433% | | | | 2,386,172 | | | | 2,579,480 | |
06/20/63 | | | 4.404% | | | | 980,609 | | | | 1,057,477 | |
06/20/63 | | | 4.423% | | | | 4,944,597 | | | | 5,349,176 | |
06/20/63 | | | 4.543% | | | | 1,274,976 | | | | 1,383,458 | |
06/20/63 | | | 4.566% | | | | 3,177,325 | | | | 3,437,444 | |
01/20/64 | | | 4.730% | | | | 116,024 | | | | 122,287 | |
12/20/64 | | | 4.523% | | | | 1,462,092 | | | | 1,563,351 | |
02/20/66 | | | 4.476% | | | | 3,739,049 | | | | 4,257,826 | |
02/20/66 | | | 4.545% | | | | 2,509,843 | | | | 2,863,124 | |
04/20/66 | | | 4.580% | | | | 2,459,315 | | | | 2,825,149 | |
CMO Series 2013-170 Class WZ | |
11/16/43 | | | 3.000% | | | | 722,899 | | | | 726,884 | |
The accompanying Notes to Financial Statements are an integral part of this statement.
| | | | | | |
| | |
| | | | ACTIVE PORTFOLIOS® MULTI-MANAGER TOTAL RETURN BOND FUND | | |
PORTFOLIO OF INVESTMENTS (continued)
August 31, 2016
| | | | | | | | | | | | |
| Residential Mortgage-Backed Securities — Agency (continued) | |
| Issuer | | Coupon
Rate | | | Principal
Amount ($) | | | Value ($) | |
Government National Mortgage Association(b) | |
03/20/66 | | | 1.815% | | | | 1,000,290 | | | | 1,014,219 | |
04/20/66 | | | 1.376% | | | | 1,040,903 | | | | 1,043,888 | |
CMO Series 2003-60 Class GS | |
05/16/33 | | | 11.572% | | | | 542,076 | | | | 639,186 | |
CMO Series 2004-26 Class XF | |
04/16/34 | | | 0.807% | | | | 3,846,958 | | | | 3,848,458 | |
CMO Series 2010-145 Class GF | |
11/20/35 | | | 0.962% | | | | 5,642,340 | | | | 5,648,056 | |
CMO Series 2012-H21 Class CF | |
05/20/61 | | | 1.170% | | | | 622,058 | | | | 622,905 | |
CMO Series 2012-H21 Class DF | |
05/20/61 | | | 1.120% | | | | 554,657 | | | | 555,096 | |
CMO Series 2012-H22 Class FD | |
01/20/61 | | | 0.940% | | | | 695,388 | | | | 694,327 | |
CMO Series 2013-115 Class EF | |
04/16/28 | | | 0.757% | | | | 1,071,274 | | | | 1,069,015 | |
CMO Series 2013-H05 Class FB | |
02/20/62 | | | 0.870% | | | | 724,481 | | | | 722,829 | |
CMO Series 2013-H17 Class FA | |
07/20/63 | | | 1.020% | | | | 875,390 | | | | 873,556 | |
CMO Series 2013-H18 Class EA | |
07/20/63 | | | 0.970% | | | | 847,858 | | | | 844,405 | |
CMO Series 2013-H19 Class FC | |
08/20/63 | | | 1.070% | | | | 5,447,297 | | | | 5,446,411 | |
CMO Series 2016-H04 Class FG | |
12/20/61 | | | 1.170% | | | | 1,689,201 | | | | 1,686,725 | |
CMO Series 2016-H13 Class FT | |
05/20/66 | | | 1.092% | | | | 10,938,092 | | | | 10,930,984 | |
CMO Series 2016-H10 Class FJ | |
04/20/66 | | | 1.094% | | | | 9,861,208 | | | | 9,856,801 | |
|
Government National Mortgage Association(b)(g) | |
CMO IO Series 2014-H20 Class HI | |
10/20/64 | | | 1.149% | | | | 4,684,266 | | | | 289,839 | |
CMO IO Series 2015-189 Class IG | |
01/16/57 | | | 0.934% | | | | 32,324,845 | | | | 2,287,335 | |
CMO IO Series 2015-9 Class IO | |
02/16/49 | | | 1.195% | | | | 34,822,833 | | | | 2,494,520 | |
|
Government National Mortgage Association(c) | |
10/21/45 - 09/21/46 | | | 3.000% | | | | 35,720,000 | | | | 37,394,275 | |
10/21/45 - 09/21/46 | | | 3.500% | | | | 74,325,000 | | | | 78,877,245 | |
09/21/46 | | | 4.000% | | | | 3,825,000 | | | | 4,101,864 | |
09/21/46 | | | 4.500% | | | | 3,500,000 | | | | 3,850,000 | |
| | | | | | | | | | | | | |
Total Residential Mortgage-Backed Securities — Agency | |
(Cost: $1,232,536,782) | | | | | | | | 1,247,347,571 | |
| | | |
| | | | | | | | | | | | |
| Residential Mortgage-Backed Securities — Non-Agency 2.6% | |
ASG Resecuritization Trust(a)(b)
CMO Series 2009-2 Class G70 | |
05/24/36 | | | 3.135% | | | | 1,925,000 | | | | 1,922,517 | |
CMO Series 2009-2 Class G75 | |
05/24/36 | | | 3.135% | | | | 1,925,000 | | | | 1,938,660 | |
|
Asset-Backed Securities Corp. Home Equity Loan Trust
CMO Series 2006-HE1 Class A4(b) | |
01/25/36 | | | 0.824% | | | | 3,230,000 | | | | 2,822,557 | |
| | | | | | | | | | | | |
| Residential Mortgage-Backed Securities — Non-Agency (continued) | |
| Issuer | | Coupon
Rate | | | Principal
Amount ($) | | | Value ($) | |
BCAP LLC Trust(a) | |
CMO Series 2013-RR5 Class 3A1 | |
09/26/36 | | | 3.500% | | | | 1,056,950 | | | | 1,054,529 | |
CMO Series 2013-RR5 Class 1A1 | |
10/26/36 | | | 3.500% | | | | 820,026 | | | | 818,825 | |
CMO Series 2013-RR2 Class 7A1 | |
07/26/36 | | | 3.000% | | | | 502,854 | | | | 502,854 | |
|
BCAP LLC Trust(a)(b) | |
CMO Series 2012-RR11 Class 2A1 | |
08/26/36 | | | 0.608% | | | | 366,533 | | | | 363,003 | |
CMO Series 2012-RR10 Class 9A1 | |
10/26/35 | | | 3.008% | | | | 266,104 | | | | 267,748 | |
CMO Series 2015-RR2 Class 23A1 | |
03/28/37 | | | 0.662% | | | | 4,721,862 | | | | 4,589,751 | |
|
BCAP LLC Trust(b) | |
CMO Series 2007-AA1 Class 1A2 | |
02/25/47 | | | 0.684% | | | | 1,214,083 | | | | 1,161,190 | |
|
Banc of America Funding Trust
CMO Series 2006-3 Class 4A14 | |
03/25/36 | | | 6.000% | | | | 2,035,581 | | | | 1,853,872 | |
CMO Series 2006-3 Class 5A3 | |
03/25/36 | | | 5.500% | | | | 1,830,490 | | | | 1,706,377 | |
|
Banc of America Funding Trust(a)(b)
CMO Series 2012-R5 Class A | |
10/03/39 | | | 0.756% | | | | 83,967 | | | | 83,880 | |
|
Banc of America Funding Trust(b) | |
CMO Series 2006-D Class 3A1 | |
05/20/36 | | | 3.291% | | | | 2,819,581 | | | | 2,472,284 | |
|
Bayview Opportunity Master Fund Trust
CMO Series 2014-16RP Class A(a)(b) | |
11/28/29 | | | 3.844% | | | | 927,547 | | | | 932,773 | |
|
Carrington Mortgage Loan Trust
CMO Series 2006-NC3 Class A3(b) | |
08/25/36 | | | 0.674% | | | | 3,800,000 | | | | 2,508,555 | |
|
Citicorp Mortgage Securities Trust
CMO Series 2007-8 Class 1A3 | |
09/25/37 | | | 6.000% | | | | 1,248,849 | | | | 1,288,703 | |
|
Citigroup Mortgage Loan Trust, Inc.(a)
CMO Series 15-PS1 Class A1 | |
09/25/42 | | | 3.750% | | | | 2,426,376 | | | | 2,508,241 | |
|
Citigroup Mortgage Loan Trust, Inc.(a)(b)
CMO Series 2012-7 Class 12A1 | |
03/25/36 | | | 2.870% | | | | 327,919 | | | | 325,503 | |
CMO Series 2012-9 Class 1A1 | |
02/20/36 | | | 2.767% | | | | 584,861 | | | | 577,468 | |
CMO Series 2013-2 Class 1A1 | |
11/25/37 | | | 2.897% | | | | 838,070 | | | | 836,311 | |
CMO Series 2014-12 Class 3A1 | |
10/25/35 | | | 3.046% | | | | 3,156,691 | | | | 3,156,626 | |
CMO Series 2015-A Class A4 | |
06/25/58 | | | 4.250% | | | | 1,877,763 | | | | 1,944,838 | |
|
Countrywide Home Equity Loan Trust
CMO Series 2007-S2 Class A3 (NPFGC) | |
05/25/37 | | | 5.813% | | | | 343,829 | | | | 342,766 | |
CMO Series 2007-S2 Class A6 (NPFGC) | |
05/25/37 | | | 5.779% | | | | 298,046 | | | | 296,522 | |
The accompanying Notes to Financial Statements are an integral part of this statement.
| | | | | | |
| | |
| | | | ACTIVE PORTFOLIOS® MULTI-MANAGER TOTAL RETURN BOND FUND | | |
PORTFOLIO OF INVESTMENTS (continued)
August 31, 2016
| | | | | | | | | | | | |
| Residential Mortgage-Backed Securities — Non-Agency (continued) | |
| Issuer | | Coupon
Rate | | | Principal
Amount ($) | | | Value ($) | |
Countrywide Home Loan Mortgage Pass-Through Trust
CMO Series 2007-HY5 Class 1A1(b) | |
09/25/47 | | | 3.243% | | | | 1,436,367 | | | | 1,253,586 | |
|
Credit Suisse Mortgage Capital Certificates(a)(b)
CMO Series 2009-14R Class 4A9 | |
10/26/35 | | | 3.008% | | | | 3,776,000 | | | | 3,790,540 | |
CMO Series 2011-12R Class 3A1 | |
07/27/36 | | | 2.690% | | | | 4,747,957 | | | | 4,689,777 | |
CMO Series 2011-16R Class 7A3 | |
12/27/36 | | | 3.500% | | | | 177,344 | | | | 176,959 | |
CMO Series 2011-17R Class 3A1 | |
10/27/35 | | | 2.478% | | | | 71,664 | | | | 71,500 | |
CMO Series 2014-RPL4 Class A1 | |
08/25/62 | | | 3.625% | | | | 2,989,027 | | | | 3,010,262 | |
|
Credit Suisse Securities (USA) LLC
CMO Series 2014-RPL1 Class A1(a)(b) | |
02/25/54 | | | 3.250% | | | | 2,401,633 | | | | 2,379,522 | |
|
Credit-Based Asset Servicing & Securitization LLC
CMO Series 2005-CB7 Class AF3(b) | |
11/25/35 | | | 4.011% | | | | 2,121,991 | | | | 2,142,890 | |
|
Credit-Based Asset Servicing and Securitization LLC
CMO Series 2007-CB1 Class AF3(b) | |
01/25/37 | | | 3.941% | | | | 4,787,559 | | | | 2,355,329 | |
|
Downey Savings & Loan Association Mortgage Loan Trust(b)
CMO Series 2005-AR6 Class 2A1A | |
10/19/45 | | | 0.804% | | | | 2,958,560 | | | | 2,512,771 | |
CMO Series 2006-AR2 Class 2A1A | |
10/19/36 | | | 0.714% | | | | 3,548,783 | | | | 2,915,149 | |
|
Fannie Mae Connecticut Avenue Securities
CMO Series 14-C02 Class 1M2(b) | |
05/25/24 | | | 3.088% | | | | 1,390,000 | | | | 1,357,197 | |
|
Federal National Mortgage Association
CMO Series 2014-C03 Class 1M2(b) | |
07/25/24 | | | 3.488% | | | | 2,470,000 | | | | 2,460,330 | |
|
First Horizon Mortgage Pass-Through Trust
CMO Series 2007-AR1 Class 1A1(b) | |
05/25/37 | | | 3.060% | | | | 942,309 | | | | 774,836 | |
|
Freddie Mac Structured Agency Credit Risk Debt Notes
CMO Series 14-DN2 Class M2(b) | |
04/25/24 | | | 2.174% | | | | 3,850,000 | | | | 3,882,428 | |
|
GFT Mortgage Loan Trust
CMO Series 2015-GFT1 Class A(a)(b) | |
01/25/55 | | | 3.721% | | | | 15,436 | | | | 15,445 | |
|
GSR Mortgage Loan Trust
CMO Series 2006-AR2 Class 2A1(b) | |
04/25/36 | | | 2.907% | | | | 3,353,333 | | | | 2,951,168 | |
|
GreenPoint Mortgage Funding Trust
CMO Series 2006-AR8 Class 1A2A(b) | |
01/25/47 | | | 0.704% | | | | 1,290,635 | | | | 1,258,379 | |
|
JPMorgan Mortgage Trust
CMO Series 2006-S2 Class 2A2 | |
06/25/21 | | | 5.875% | | | | 1,215,264 | | | | 1,172,163 | |
CMO Series 2007-S1 Class 1A2 | |
03/25/22 | | | 5.500% | | | | 491,798 | | | | 496,535 | |
| | | | | | | | | | | | |
| Residential Mortgage-Backed Securities — Non-Agency (continued) | |
| Issuer | | Coupon
Rate | | | Principal
Amount ($) | | | Value ($) | |
JPMorgan Resecuritization Trust(a) | |
CMO Series 2014-5 Class 6A | |
09/27/36 | | | 4.000% | | | | 976,441 | | | | 974,125 | |
|
JPMorgan Resecuritization Trust(a)(b)
CMO Series 2014-1 Class 1016 | |
03/26/36 | | | 2.851% | | | | 4,000,000 | | | | 3,956,864 | |
|
Lehman XS Trust(b) | |
CMO Series 2005-4 Class 1A3 | |
10/25/35 | | | 1.324% | | | | 2,507,606 | | | | 2,433,903 | |
CMO Series 2005-5N Class 3A1A | |
11/25/35 | | | 0.824% | | | | 4,461,707 | | | | 3,812,370 | |
|
MASTR Alternative Loan Trust
CMO Series 2004-12 Class 4A1 | |
12/25/34 | | | 5.500% | | | | 1,413,057 | | | | 1,489,994 | |
|
Mill City Mortgage Trust
CMO Series 2016-1 Class A1(a) | |
04/25/57 | | | 2.500% | | | | 2,020,000 | | | | 2,032,966 | |
|
Morgan Stanley Mortgage Loan Trust
CMO Series 2005-2AR Class A(b) | |
04/25/35 | | | 0.784% | | | | 5,798,504 | | | | 5,368,810 | |
|
Morgan Stanley Re-Remic Trust(a)(b)
CMO Series 2010-R1 Class 2B | |
07/26/35 | | | 2.946% | | | | 1,730,803 | | | | 1,720,248 | |
CMO Series 2013-R3 Class 10A | |
10/26/35 | | | 3.008% | | | | 316,789 | | | | 316,112 | |
|
Morgan Stanley Resecuritization Trust(a)(b)
CMO Series 2013-R9 Class 2A | |
06/26/46 | | | 2.970% | | | | 438,093 | | | | 435,498 | |
CMO Series 2013-R9 Class 4A | |
06/26/46 | | | 2.869% | | | | 685,803 | | | | 681,589 | |
|
MortgageIT Trust
CMO Series 2005-5 Class A1(b) | |
12/25/35 | | | 0.784% | | | | 3,204,429 | | | | 2,875,133 | |
|
Nationstar Home Equity Loan Trust
CMO Series 2007-B Class 2AV3(b) | |
04/25/37 | | | 0.774% | | | | 7,509,000 | | | | 6,704,015 | |
|
Nomura Asset Acceptance Corp. Alternative Loan Trust(b)
CMO Series 2007-1 Class 1A3 (AGM) | |
03/25/47 | | | 5.957% | | | | 90,711 | | | | 90,093 | |
CMO Series 2007-1 Class 1A4 (AGM) | |
03/25/47 | | | 6.138% | | | | 574,502 | | | | 570,482 | |
|
Nomura Resecuritization Trust(a)(b)
CMO Series 2012-3R Class 1A1 | |
01/26/37 | | | 0.626% | | | | 655,236 | | | | 634,001 | |
CMO Series 2014-6R Class 3A1 | |
01/26/36 | | | 0.748% | | | | 1,932,209 | | | | 1,813,732 | |
|
RALI Trust(b)
CMO Series 2005-QA4 Class A41 | |
04/25/35 | | | 3.328% | | | | 2,029,420 | | | | 1,959,234 | |
|
RALI Trust(b)(g)
CMO IO Series 2006-QS18 Class 1AV | |
12/25/36 | | | 0.423% | | | | 72,012,947 | | | | 1,307,107 | |
CMO IO Series 2006-QS9 Class 1AV | |
07/25/36 | | | 0.610% | | | | 33,228,881 | | | | 740,845 | |
The accompanying Notes to Financial Statements are an integral part of this statement.
| | | | | | |
| | |
| | | | ACTIVE PORTFOLIOS® MULTI-MANAGER TOTAL RETURN BOND FUND | | |
PORTFOLIO OF INVESTMENTS (continued)
August 31, 2016
| | | | | | | | | | | | |
| Residential Mortgage-Backed Securities — Non-Agency (continued) | |
| Issuer | | Coupon
Rate | | | Principal
Amount ($) | | | Value ($) | |
CMO IO Series 2007-QS1 Class 2AV | |
01/25/37 | | | 0.165% | | | | 73,456,161 | | | | 516,206 | |
|
RFMSI Trust(b)
CMO Series 2005-SA5 Class 1A | |
11/25/35 | | | 3.153% | | | | 2,843,364 | | | | 2,336,935 | |
CMO Series 2006-SA4 Class 2A1 | |
11/25/36 | | | 4.034% | | | | 810,294 | | | | 710,254 | |
|
Residential Asset Mortgage Products Trust CMO Series 2006-RZ3 Class A3(b) | |
08/25/36 | | | 0.814% | | | | 4,781,000 | | | | 4,444,356 | |
|
Selene Non-Performing Loans LLC
CMO Series 2014-1A Class A(a)(b) | |
05/25/54 | | | 2.981% | | | | 149,128 | | | | 148,178 | |
|
Structured Adjustable Rate Mortgage Loan Trust(b)
CMO Series 2004-20 Class 1A2 | |
01/25/35 | | | 2.911% | | | | 1,568,104 | | | | 1,486,625 | |
CMO Series 2006-5 Class 1A1 | |
06/25/36 | | | 3.079% | | | | 3,309,463 | | | | 2,791,508 | |
|
Structured Asset Securities Corp. Mortgage Loan Trust
CMO Series 2006-GEL4 Class A3(a)(b) | |
10/25/36 | | | 0.824% | | | | 8,831,000 | | | | 8,179,771 | |
|
Structured Asset Securities Corp. Mortgage Pass-Through Certificates
CMO Series 2004-21XS Class 2A6A(b) | |
12/25/34 | | | 5.240% | | | | 6,821 | | | | 6,932 | |
|
Towd Point Mortgage Trust
CMO Series 2016-2 Class A1A(a)(b) | |
08/25/55 | | | 2.750% | | | | 2,762,504 | | | | 2,795,885 | |
| | |
Trust Company of the West(c)
CMO Series TCW-1063 | | | | | | | | | |
09/16/56 | | | 2.250% | | | | 3,710,000 | | | | 3,777,244 | |
|
VML LLC
CMO Series 2014-NPL1 Class A1(a) | |
04/27/54 | | | 3.875% | | | | 539,721 | | | | 537,277 | |
|
WaMu Asset-Backed Certificates
CMO Series 2007-HE1 Class 2A3(b) | |
01/25/37 | | | 0.674% | | | | 5,834,744 | | | | 3,192,302 | |
|
WaMu Mortgage Pass-Through Certificates(b)
CMO Series 2003-AR8 Class A | |
08/25/33 | | | 2.696% | | | | 1,120,227 | | | | 1,130,783 | |
CMO Series 2005-AR11 Class A1A | |
08/25/45 | | | 0.844% | | | | 2,661,724 | | | | 2,463,325 | |
CMO Series 2005-AR17 Class A1A1 | |
12/25/45 | | | 0.794% | | | | 6,264,003 | | | | 5,994,601 | |
CMO Series 2005-AR2 Class 2A1A | |
01/25/45 | | | 0.834% | | | | 2,786,426 | | | | 2,636,345 | |
CMO Series 2005-AR8 Class 2A1A | |
07/25/45 | | | 0.814% | | | | 2,289,950 | | | | 2,155,246 | |
CMO Series 2005-AR9 Class A1A | |
07/25/45 | | | 1.164% | | | | 2,135,712 | | | | 2,015,842 | |
CMO Series 2006-AR4 Class 1A1A | |
05/25/46 | | | 1.429% | | | | 3,906,388 | | | | 3,550,937 | |
CMO Series 2006-AR5 Class A12A | |
06/25/46 | | | 1.469% | | | | 1,208,893 | | | | 1,120,413 | |
CMO Series 2007-HY3 Class 1A1 | |
03/25/37 | | | 2.404% | | | | 1,155,930 | | | | 920,155 | |
| | | | | | | | | | | | |
| Residential Mortgage-Backed Securities — Non-Agency (continued) | |
| Issuer | | Coupon
Rate | | | Principal
Amount ($) | | | Value ($) | |
CMO Series 2007-OC2 Class A3 | |
06/25/37 | | | 0.834% | | | | 4,958,847 | | | | 3,960,872 | |
| | | | | | | | | | | | | |
Total Residential Mortgage-Backed Securities — Non-Agency | |
(Cost: $161,994,381) | | | | | | | | | | | 172,732,232 | |
| | | |
| | | | | | | | | | | | |
| Commercial Mortgage-Backed Securities — Agency 1.7% | |
FREMF Mortgage Trust(a)(b) | |
Series 2014-K714 Class B | |
01/25/47 | | | 3.981% | | | | 1,000,000 | | | | 1,040,858 | |
Series 2014-K717 Class B | |
11/25/47 | | | 3.754% | | | | 2,400,000 | | | | 2,484,983 | |
Subordinated, Series 2011-K12 Class B | |
01/25/46 | | | 4.492% | | | | 3,225,000 | | | | 3,476,947 | |
Subordinated, Series 2014-K715 Class B | |
02/25/46 | | | 4.122% | | | | 3,516,000 | | | | 3,689,316 | |
Subordinated, Series 2015-K49 Class B | |
10/25/48 | | | 3.848% | | | | 2,770,000 | | | | 2,769,339 | |
|
Federal Home Loan Mortgage Corp. Multifamily Structured Pass-Through Certificates | |
CMO Series KSCT Class A2 | |
01/25/20 | | | 4.285% | | | | 2,585,000 | | | | 2,821,344 | |
Series 20K050 Class A2 | |
08/25/25 | | | 3.334% | | | | 2,440,000 | | | | 2,691,326 | |
Series 20K720 Class A2 | |
06/25/22 | | | 2.716% | | | | 3,250,000 | | | | 3,421,512 | |
Series K055 Class A2 | |
03/25/26 | | | 2.673% | | | | 12,440,000 | | | | 13,056,162 | |
Series KP03 Class A2 | |
07/25/19 | | | 1.780% | | | | 2,075,000 | | | | 2,089,202 | |
|
Federal Home Loan Mortgage Corp. Structured Pass-Through Certificates
CMO Series K-006 Class B(a)(b) | |
12/25/46 | | | 5.533% | | | | 2,800,000 | | | | 3,055,999 | |
|
Federal Home Loan Mortgage Corp.
Series 20K050 Class A1 | |
01/25/25 | | | 2.802% | | | | 2,656,854 | | | | 2,792,665 | |
|
Federal National Mortgage Association | |
05/01/18 | | | 3.840% | | | | 2,110,000 | | | | 2,177,584 | |
07/01/20 | | | 3.950% | | | | 3,955,000 | | | | 4,276,685 | |
09/01/20 | | | 3.584% | | | | 5,087,722 | | | | 5,457,137 | |
10/01/20 | | | 3.426% | | | | 3,900,000 | | | | 4,192,871 | |
12/01/20 | | | 3.523% | | | | 4,873,701 | | | | 5,228,455 | |
12/01/20 | | | 3.763% | | | | 6,429,402 | | | | 6,941,266 | |
04/01/21 | | | 4.242% | | | | 5,297,323 | | | | 5,839,474 | |
04/01/21 | | | 4.250% | | | | 3,730,000 | | | | 4,132,895 | |
05/01/21 | | | 4.394% | | | | 1,824,468 | | | | 2,031,799 | |
03/01/24 | | | 3.550% | | | | 3,192,259 | | | | 3,526,547 | |
03/01/26 | | | 2.860% | | | | 4,325,000 | | | | 4,560,398 | |
02/01/28 | | | 3.280% | | | | 3,030,000 | | | | 3,319,684 | |
05/01/28 | | | 3.010% | | | | 3,209,450 | | | | 3,414,929 | |
08/01/29 | | | 3.580% | | | | 2,171,593 | | | | 2,405,408 | |
09/01/30 | | | 3.380% | | | | 1,645,000 | | | | 1,803,556 | |
03/01/31 | | | 3.200% | | | | 2,150,000 | | | | 2,324,985 | |
08/01/34 | | | 3.760% | | | | 2,035,000 | | | | 2,286,604 | |
02/01/35 | | | 3.330% | | | | 2,035,000 | | | | 2,205,230 | |
The accompanying Notes to Financial Statements are an integral part of this statement.
| | | | | | |
| | |
| | | | ACTIVE PORTFOLIOS® MULTI-MANAGER TOTAL RETURN BOND FUND | | |
PORTFOLIO OF INVESTMENTS (continued)
August 31, 2016
| | | | | | | | | | | | |
| Commercial Mortgage-Backed Securities — Agency (continued) | |
| Issuer | | Coupon
Rate | | | Principal
Amount ($) | | | Value ($) | |
Government National Mortgage Association
CMO Series 2013-H08 Class FA(b) | |
03/20/63 | | | 0.820% | | | | 831,575 | | | | 823,410 | |
| | | | | | | | | | | | | |
Total Commercial Mortgage-Backed Securities — Agency | |
(Cost: $107,361,722) | | | | 110,338,570 | |
| | | |
| | | | | | | | | | | | |
| Commercial Mortgage-Backed Securities — Non-Agency 5.5% | |
225 Liberty Street Trust
Series 2016-225L Class A(a) | |
02/10/36 | | | 3.597% | | | | 2,115,000 | | | | 2,313,375 | |
|
American Homes 4 Rent Trust(a)
Series 2014-SFR3 Class A | |
12/17/36 | | | 3.678% | | | | 776,737 | | | | 835,553 | |
Series 2015-SFR2 Class A | |
10/17/45 | | | 3.732% | | | | 2,193,147 | | | | 2,373,429 | |
|
BB-UBS Trust Series 2012-TFT Class A(a) | |
06/05/30 | | | 2.892% | | | | 6,260,000 | | | | 6,366,094 | |
|
BBCMS Mortgage Trust(a)
Subordinated, Series 2016-ETC Class A | |
08/14/36 | | | 2.937% | | | | 13,500,000 | | | | 13,950,556 | |
Subordinated, Series 2016-ETC Class B | |
08/14/36 | | | 3.189% | | | | 900,000 | | | | 928,422 | |
Subordinated, Series 2016-ETC Class C | |
08/14/36 | | | 3.391% | | | | 770,000 | | | | 794,336 | |
|
BBCMS Mortgage Trust(a)(b) | |
Series 2016-ETC Class D | |
08/14/36 | | | 3.729% | | | | 2,790,000 | | | | 2,811,946 | |
|
Banc of America Commercial Mortgage Trust
Series 2007-4 Class AM(b) | |
02/10/51 | | | 6.000% | | | | 2,300,000 | | | | 2,375,570 | |
|
Banc of America Merrill Lynch Commercial Mortgage Securities Trust
Series 2015-200P Class A(a) | |
04/14/33 | | | 3.218% | | | | 3,000,000 | | | | 3,189,913 | |
|
CD Mortgage Trust | |
Series 2016-CD1 Class A2 | |
08/10/49 | | | 2.453% | | | | 1,990,000 | | | | 2,041,181 | |
Series 2016-CD1 Class A3 | |
08/10/49 | | | 2.459% | | | | 17,000,000 | | | | 17,093,024 | |
|
CFCRE Commercial Mortgage Trust
Series 2016-C4 Class A4 | |
05/10/58 | | | 3.283% | | | | 5,900,000 | | | | 6,261,974 | |
|
CGGS Commercial Mortgage Trust
Series 2016-RNDA Class AFX(a) | |
02/10/33 | | | 2.757% | | | | 6,400,000 | | | | 6,498,621 | |
|
CGRBS Commercial Mortgage Trust
Series 2013-VNO5 Class A(a) | |
03/13/35 | | | 3.369% | | | | 1,445,000 | | | | 1,540,757 | |
|
Citigroup Commercial Mortgage Trust
Series 2013-GC11 Class AS | |
04/10/46 | | | 3.422% | | | | 2,200,000 | | | | 2,302,652 | |
| | | | | | | | | | | | |
| Commercial Mortgage-Backed Securities — Non-Agency (continued) | |
| Issuer | | Coupon
Rate | | | Principal
Amount ($) | | | Value ($) | |
Series 2015-GC33 Class AS | |
09/10/58 | | | 4.114% | | | | 2,000,000 | | | | 2,221,880 | |
Series 2016-C1 Class A4 | |
05/10/49 | | | 3.209% | | | | 13,500,000 | | | | 14,333,763 | |
Series 2016-GC37 Class A4 | |
04/10/49 | | | 3.314% | | | | 17,800,000 | | | | 19,008,015 | |
Series 2016-P3 Class A3 | |
04/15/49 | | | 3.063% | | | | 4,500,000 | | | | 4,747,679 | |
|
Commercial Mortgage Pass-Through Certificates
Series 2012-LTRT Class A2(a) | |
10/05/30 | | | 3.400% | | | | 3,793,000 | | | | 3,946,677 | |
|
Commercial Mortgage Trust
Series 2013-LC6 Class AM | |
01/10/46 | | | 3.282% | | | | 1,235,000 | | | | 1,301,096 | |
Series 2014-UBS4 Class A5 | |
08/10/47 | | | 3.694% | | | | 5,000,000 | | | | 5,441,841 | |
Series 2014-UBS6 Class A4 | |
12/10/47 | | | 3.378% | | | | 3,605,000 | | | | 3,853,742 | |
Series 2015-CR26 Class A4 | |
10/10/48 | | | 3.630% | | | | 2,500,000 | | | | 2,720,849 | |
Series 2015-DC1 Class A5 | |
02/10/48 | | | 3.350% | | | | 7,105,000 | | | | 7,591,432 | |
Series 2015-LC19 Class A4 | |
02/10/48 | | | 3.183% | | | | 835,000 | | | | 887,616 | |
Series 2015-PC1 Class A5 | |
07/10/50 | | | 3.902% | | | | 5,515,000 | | | | 6,109,072 | |
|
Commercial Mortgage Trust(a)
Series 2016-787S Class A | |
02/10/36 | | | 3.545% | | | | 2,115,000 | | | | 2,306,007 | |
|
Credit Suisse Commercial Mortgage Trust(b)
Series 2007-C2 Class A1A | |
01/15/49 | | | 5.526% | | | | 4,973,527 | | | | 5,035,762 | |
Series 2007-C3 Class A4 | |
06/15/39 | | | 5.889% | | | | 517,009 | | | | 523,250 | |
|
Credit Suisse Mortgage Capital Trust
Series 2014-USA Class A2(a) | |
09/17/37 | | | 3.953% | | | | 5,000,000 | | | | 5,466,791 | |
|
DBUBS Mortgage Trust
Series 2011-LC2A Class A4(a) | |
07/10/44 | | | 4.537% | | | | 11,605,000 | | | | 12,866,475 | |
|
Federal Home Loan Mortgage Corp. Multifamily Structured Pass-Through Certificates
Series K056 Class A2 | |
05/25/26 | | | 2.525% | | | | 6,137,000 | | | | 6,364,008 | |
|
Federal Home Loan Mortgage Corp. Multifamily Structured Pass-Through Certificates(b)(g)
CMO IO Series K028 Class X1 | |
02/25/23 | | | 0.472% | | | | 129,989,104 | | | | 2,346,004 | |
CMO IO Series K055 Class X1 | |
03/25/26 | | | 1.503% | | | | 2,173,528 | | | | 227,658 | |
CMO IO Series K152 Class X1 | |
01/25/31 | | | 1.097% | | | | 4,445,726 | | | | 423,507 | |
CMO IO Series K718 Class X1 | |
01/25/22 | | | 0.770% | | | | 23,766,918 | | | | 693,419 | |
The accompanying Notes to Financial Statements are an integral part of this statement.
| | | | | | |
| | |
| | | | ACTIVE PORTFOLIOS® MULTI-MANAGER TOTAL RETURN BOND FUND | | |
PORTFOLIO OF INVESTMENTS (continued)
August 31, 2016
| | | | | | | | | | | | |
| Commercial Mortgage-Backed Securities — Non-Agency (continued) | |
| Issuer | | Coupon
Rate | | | Principal
Amount ($) | | | Value ($) | |
GS Mortgage Securities Trust
Series 2015-GC34 Class A3 | |
10/10/48 | | | 3.244% | | | | 15,000,000 | | | | 15,963,235 | |
|
GS Mortgage Securities Trust(b)
Series 2007-GG10 Class A4 | |
08/10/45 | | | 5.988% | | | | 1,758,130 | | | | 1,789,095 | |
|
General Electric Capital Assurance Co.
Series 2003-1 Class A5(a) | |
05/12/35 | | | 5.743% | | | | 1,061,408 | | | | 1,142,502 | |
|
Government National Mortgage Association(b)(g)
CMO IO Series 2011-38 Class IO | |
04/16/53 | | | 0.100% | | | | 16,594,866 | | | | 361,018 | |
CMO IO Series 2013-162 Class IO | |
09/16/46 | | | 0.996% | | | | 36,619,299 | | | | 1,861,048 | |
CMO IO Series 2015-114 | |
03/15/57 | | | 1.044% | | | | 5,291,320 | | | | 380,117 | |
CMO IO Series 2015-125 Class IB | |
01/16/55 | | | 1.360% | | | | 71,888,367 | | | | 5,155,744 | |
CMO IO Series 2015-146 Class IC | |
07/16/55 | | | 0.869% | | | | 42,131,758 | | | | 2,422,054 | |
CMO IO Series 2015-171 Class IO | |
11/16/55 | | | 0.894% | | | | 14,775,294 | | | | 1,036,744 | |
CMO IO Series 2015-174 Class IO | |
11/16/55 | | | 0.953% | | | | 55,703,744 | | | | 3,762,186 | |
CMO IO Series 2015-21 Class IO | |
07/16/56 | | | 1.127% | | | | 17,378,351 | | | | 1,244,766 | |
CMO IO Series 2015-41 Class IO | |
09/16/56 | | | 1.039% | | | | 13,167,485 | | | | 975,333 | |
CMO IO Series 2015-70 Class IO | |
12/16/49 | | | 1.119% | | | | 24,385,028 | | | | 1,747,012 | |
|
Houston Galleria Mall Trust
Series 2015-HGLR Class A1A2(a) | |
03/05/37 | | | 3.087% | | | | 1,700,000 | | | | 1,754,370 | |
|
Irvine Core Office Trust
Series 2013-IRV Class A1(a) | |
05/15/48 | | | 2.068% | | | | 1,814,543 | | | | 1,827,588 | |
|
JPMBB Commercial Mortgage Securities Trust
Series 2014-C26 Class A3 | |
01/15/48 | | | 3.231% | | | | 360,000 | | | | 383,234 | |
Series 2015-C27 Class A4 | |
02/15/48 | | | 3.179% | | | | 2,220,000 | | | | 2,348,455 | |
Series 2015-C28 Class A4 | |
10/15/48 | | | 3.227% | | | | 2,925,000 | | | | 3,103,653 | |
Series 2015-C28 Class AS | |
10/15/48 | | | 3.532% | | | | 4,500,000 | | | | 4,781,614 | |
Series 2015-C30 Class A5 | |
07/15/48 | | | 3.822% | | | | 5,550,000 | | | | 6,141,532 | |
Series 2015-C31 Class A3 | |
08/15/48 | | | 3.801% | | | | 4,265,000 | | | | 4,714,609 | |
|
JPMCC Re-REMIC Trust
Series 2016-GG10 Class AMA(a)(b) | |
08/15/45 | | | 5.988% | | | | 5,600,000 | | | | 5,609,615 | |
|
JPMorgan Chase Commercial Mortgage Securities Trust
Series 2007-C1 Class A4 | |
02/15/51 | | | 5.716% | | | | 5,644,776 | | | | 5,803,343 | |
Series 2013-C13 Class A3 | |
01/15/46 | | | 3.525% | | | | 3,960,000 | | | | 4,169,281 | |
| | | | | | | | | | | | |
| Commercial Mortgage-Backed Securities — Non-Agency (continued) | |
| Issuer | | Coupon
Rate | | | Principal
Amount ($) | | | Value ($) | |
JPMorgan Chase Commercial Mortgage Securities Trust(a)
Series 2011-C3 Class A2 | |
02/15/46 | | | 3.673% | | | | 30,127 | | | | 30,143 | |
Series 2011-C3 Class A3 | |
02/15/46 | | | 4.388% | | | | 7,715,000 | | | | 7,967,636 | |
Series 2011-C4 Class A3 | |
07/15/46 | | | 4.106% | | | | 8,632,133 | | | | 8,969,765 | |
|
JPMorgan Commercial Mortgage-Backed Securities Trust
Series 2009-RR1 Class A4B1(a) | |
03/18/51 | | | 1.000% | | | | 1,250,000 | | | | 1,232,984 | |
|
LB Commercial Mortgage Trust
Series 2007-C3 Class AM(b) | |
07/15/44 | | | 6.114% | | | | 1,415,000 | | | | 1,449,115 | |
|
LB-UBS Commercial Mortgage Trust
Series 2007-C2 Class A3 | |
02/15/40 | | | 5.430% | | | | 1,290,769 | | | | 1,303,729 | |
|
Merrill Lynch Mortgage Trust
Series 2007-C1 Class A4(b) | |
06/12/50 | | | 6.023% | | | | 2,700,000 | | | | 2,764,494 | |
|
Morgan Stanley Bank of America Merrill Lynch Trust
Series 2015-C20 Class A3 | |
02/15/48 | | | 2.988% | | | | 1,125,000 | | | | 1,165,916 | |
Series 2015-C21 Class A3 | |
03/15/48 | | | 3.077% | | | | 525,000 | | | | 554,206 | |
Series 2016-C29 Class A2 | |
05/15/49 | | | 2.786% | | | | 1,340,000 | | | | 1,385,280 | |
Series 2016-C29 Class ASB | |
05/15/49 | | | 3.140% | | | | 1,000,000 | | | | 1,056,491 | |
|
Morgan Stanley Capital I Trust
Series 2007-IQ14 Class A2 | |
04/15/49 | | | 5.610% | | | | 3,080,837 | | | | 3,078,854 | |
Series 2007-IQ16 Class AM | |
12/12/49 | | | 6.256% | | | | 3,000,000 | | | | 3,112,710 | |
Series 2016-UB11 Class A3 | |
08/15/49 | | | 2.531% | | | | 8,500,000 | | | | 8,572,845 | |
|
Morgan Stanley Capital I Trust(a)
Series 2014-150E Class A | |
09/09/32 | | | 3.912% | | | | 2,325,000 | | | | 2,561,928 | |
|
Morgan Stanley Re-Remic Trust(a)(b)
Series 2009-GG10 Class A4B | |
08/12/45 | | | 5.988% | | | | 1,770,000 | | | | 1,794,207 | |
Series 2010-GG10 Class A4B | |
08/15/45 | | | 5.988% | | | | 1,410,000 | | | | 1,433,979 | |
|
ORES NPL LLC
Series 2014-LV3 Class A(a) | |
03/27/24 | | | 3.000% | | | | 96,716 | | | | 96,716 | |
|
RBS Commercial Funding, Inc., Trust
Series 2013-GSP Class A(a)(b) | |
01/13/32 | | | 3.961% | | | | 2,420,000 | | | | 2,665,310 | |
|
Rialto Real Estate Fund LLC
Series 2014-LT6 Class A(a) | |
09/15/24 | | | 2.750% | | | | 121,632 | | | | 121,632 | |
|
Rialto Real Estate Fund LP
Series 2014-LT5 Class A(a) | |
05/15/24 | | | 2.850% | | | | 143,247 | | | | 142,973 | |
The accompanying Notes to Financial Statements are an integral part of this statement.
| | | | | | |
| | |
| | | | ACTIVE PORTFOLIOS® MULTI-MANAGER TOTAL RETURN BOND FUND | | |
PORTFOLIO OF INVESTMENTS (continued)
August 31, 2016
| | | | | | | | | | | | |
| Commercial Mortgage-Backed Securities — Non-Agency (continued) | |
| Issuer | | Coupon
Rate | | | Principal
Amount ($) | | | Value ($) | |
SG Commercial Mortgage Securities Trust
Series 2016-C5 Class A4 | |
10/10/48 | | | 3.055% | | | | 5,120,000 | | | | 5,327,963 | |
|
UBS-Barclays Commercial Mortgage Trust
Series 2013-C6 Class AS | |
04/10/46 | | | 3.469% | | | | 800,000 | | | | 854,472 | |
|
UBS-Citigroup Commercial Mortgage Trust
Series 2011-C1 Class AS(a) | |
01/10/45 | | | 5.154% | | | | 3,600,000 | | | | 4,091,067 | |
|
WF-RBS Commercial Mortgage Trust
Series 2013-C18 Class A2 | |
12/15/46 | | | 3.027% | | | | 1,440,000 | | | | 1,486,590 | |
Series 2014-C24 Class A3 | |
11/15/47 | | | 3.428% | | | | 1,345,000 | | | | 1,423,434 | |
Series 2014-C24 Class A5 | |
11/15/47 | | | 3.607% | | | | 7,145,000 | | | | 7,785,115 | |
Series 2014-C25 Class AS | |
11/15/47 | | | 3.984% | | | | 1,675,000 | | | | 1,840,843 | |
|
WF-RBS Commercial Mortgage Trust(a)
Series 2011-C4 Class A3 | |
06/15/44 | | | 4.394% | | | | 5,657,583 | | | | 5,926,785 | |
|
Wells Fargo Commercial Mortgage Trust
Series 2013-LC12 Class A4 | |
07/15/46 | | | 4.218% | | | | 5,090,000 | | | | 5,745,769 | |
Series 2015-C26 Class A4 | |
02/15/48 | | | 3.166% | | | | 2,430,000 | | | | 2,571,431 | |
Series 2015-C28 Class AS | |
05/15/48 | | | 3.872% | | | | 750,000 | | | | 821,395 | |
Series 2015-LC20 Class A4 | |
04/15/50 | | | 2.925% | | | | 1,965,000 | | | | 2,042,605 | |
Series 2015-SG1 Class A4 | |
12/15/47 | | | 3.789% | | | | 7,450,000 | | | | 8,233,611 | |
Series 2016-C33 Class A4 | |
03/15/59 | | | 3.426% | | | | 1,500,000 | | | | 1,622,432 | |
|
Wells Fargo Commercial Mortgage Trust(a)
Series 2010-C1 Class A2 | |
11/15/43 | | | 4.393% | | | | 1,930,000 | | | | 2,104,771 | |
| | | | | | | | | | | | | |
Total Commercial Mortgage-Backed Securities — Non-Agency | |
(Cost: $359,700,551) | | | | 361,911,290 | |
| | | |
| | | | | | | | | | | | |
| Asset-Backed Securities — Agency 0.4% | |
United States Small Business Administration
Series 2012-20C Class 1 | |
03/01/32 | | | 2.510% | | | | 415,492 | | | | 425,488 | |
Series 2012-20G Class 1 | |
07/01/32 | | | 2.380% | | | | 1,136,296 | | | | 1,159,797 | |
Series 2012-20I Class 1 | |
09/01/32 | | | 2.200% | | | | 1,156,022 | | | | 1,172,033 | |
Series 2012-20J Class 1 | |
10/01/32 | | | 2.180% | | | | 9,850,676 | | | | 9,925,709 | |
Series 2012-20L Class 1 | |
12/01/32 | | | 1.930% | | | | 518,187 | | | | 516,309 | |
Series 2013-20C Class 1 | |
03/01/33 | | | 2.220% | | | | 392,683 | | | | 398,417 | |
| | | | | | | | | | | | |
| Asset-Backed Securities — Agency (continued) | |
| Issuer | | Coupon
Rate | | | Principal
Amount ($) | | | Value ($) | |
Series 2013-20E Class 1 | |
05/01/33 | | | 2.070% | | | | 1,499,833 | | | | 1,508,494 | |
Series 2014-20D Class 1 | |
04/01/34 | | | 3.110% | | | | 1,479,065 | | | | 1,565,239 | |
Series 2014-20F Class 1 | |
06/01/34 | | | 2.990% | | | | 1,892,155 | | | | 1,979,221 | |
Series 2014-20I Class 1 | |
09/01/34 | | | 2.920% | | | | 333,166 | | | | 347,400 | |
Series 2015-20C Class 1 | |
03/01/35 | | | 2.720% | | | | 778,717 | | | | 806,602 | |
Series 2016-20F Class 1 | |
06/01/36 | | | 2.180% | | | | 3,975,000 | | | | 4,014,360 | |
| | | | | | | | | | | | | |
Total Asset-Backed Securities — Agency | | | | | |
(Cost: $23,054,109) | | | | 23,819,069 | |
| | | |
| | | | | | | | | | | | |
| Asset-Backed Securities — Non-Agency 11.1% | |
A Voce CLO Ltd.
Series 2014-1A Class A1B(a)(b) | |
07/15/26 | | | 2.140% | | | | 2,290,000 | | | | 2,280,874 | |
|
ARI Fleet Lease Trust
Series 2014-A Class A2(a) | |
11/15/22 | | | 0.810% | | | | 135,035 | | | | 134,882 | |
|
Access Group, Inc.
Series 2005-2 Class A3(b) | |
11/22/24 | | | 0.991% | | | | 838,500 | | | | 832,057 | |
|
Adams Mill CLO Ltd.
Series 2014-1A Class A1(a)(b) | |
07/15/26 | | | 2.160% | | | | 15,000,000 | | | | 14,975,955 | |
|
Ally Auto Receivables Trust
Series 2015-SN1 Class A2B(b) | |
06/20/17 | | | 0.892% | | | | 256,334 | | | | 256,355 | |
|
Ally Master Owner Trust
Series 2014-5 Class A1(b) | |
10/15/19 | | | 0.998% | | | | 800,000 | | | | 800,206 | |
|
AmeriCredit Automobile Receivables Trust
Subordinated, Series 2016-3 Class C | |
04/08/22 | | | 2.240% | | | | 6,430,000 | | | | 6,443,579 | |
|
AmeriCredit Automobile Receivables Trust(b)
Series 2016-2 Class A2B | |
10/08/19 | | | 1.198% | | | | 1,300,000 | | | | 1,300,000 | |
|
Anchorage Capital CLO 8 Ltd.
Series 2016-8A Class A1(a)(b) | |
07/28/28 | | | 2.371% | | | | 14,000,000 | | | | 14,007,462 | |
|
Apidos CLO XVII
Series 2014-17A Class A1A(a)(b) | |
04/17/26 | | | 2.179% | | | | 4,675,000 | | | | 4,675,229 | |
|
Ares XXX CLO Ltd.
Series 2014-30A Class A2(a)(b) | |
04/20/23 | | | 1.546% | | | | 1,155,511 | | | | 1,148,046 | |
|
Ares XXXIX CLO Ltd.
Series 2016-39A Class A(a)(b) | |
07/18/28 | | | 2.218% | | | | 14,000,000 | | | | 14,014,210 | |
The accompanying Notes to Financial Statements are an integral part of this statement.
| | | | | | |
| | |
| | | | ACTIVE PORTFOLIOS® MULTI-MANAGER TOTAL RETURN BOND FUND | | |
PORTFOLIO OF INVESTMENTS (continued)
August 31, 2016
| | | | | | | | | | | | |
| Asset-Backed Securities — Non-Agency (continued) | |
| Issuer | | Coupon
Rate | | | Principal
Amount ($) | | | Value ($) | |
Ascentium Equipment Receivables LLC
Series 2015-2A Class A2(a) | |
12/11/17 | | | 1.570% | | | | 1,164,711 | | | | 1,165,048 | |
|
Avis Budget Rental Car Funding AESOP LLC(a)
Series 2013-1A Class A | |
09/20/19 | | | 1.920% | | | | 3,170,000 | | | | 3,164,908 | |
Series 2014-1A Class A | |
07/20/20 | | | 2.460% | | | | 3,140,000 | | | | 3,161,512 | |
Series 2015-2A Class A | |
12/20/21 | | | 2.630% | | | | 3,125,000 | | | | 3,153,875 | |
Series 2016-2A Class A | |
11/20/22 | | | 2.720% | | | | 8,600,000 | | | | 8,648,809 | |
|
BA Credit Card Trust
Series 2014-A2 Class A(b) | |
09/16/19 | | | 0.778% | | | | 3,660,000 | | | | 3,662,533 | |
|
BMW Vehicle Owner Trust
Series 2013-A Class A3 | |
11/27/17 | | | 0.670% | | | | 224,369 | | | | 224,333 | |
|
Babson CLO Ltd.
Series 2015-IA Class A(a)(b) | |
04/20/27 | | | 2.126% | | | | 5,000,000 | | | | 4,990,365 | |
|
Ballyrock CLO Ltd.
Series 2016-1A Class A(a)(b)(c)(f) | |
10/15/28 | | | 0.000% | | | | 16,500,000 | | | | 16,491,750 | |
|
Barclays Dryrock Issuance Trust(b)
Series 2014-1 Class A | |
12/16/19 | | | 0.868% | | | | 4,160,000 | | | | 4,161,942 | |
Series 2014-2 Class A | |
03/16/20 | | | 0.848% | | | | 3,990,000 | | | | 3,992,524 | |
|
Benefit Street Partners CLO II Ltd.
Series 2013-IIA Class A1(a)(b) | |
07/15/24 | | | 1.880% | | | | 11,200,000 | | | | 11,134,368 | |
|
Brazos Higher Education Authority, Inc.
Series 2005-1 Class 1A3(b) | |
09/26/22 | | | 0.750% | | | | 493,274 | | | | 492,682 | |
|
CIT Education Loan Trust
Series 2007-1 Class B(a)(b) | |
06/25/42 | | | 0.940% | | | | 956,304 | | | | 831,572 | |
|
CNH Equipment Trust
Series 2015-B Class A2A | |
08/15/18 | | | 0.840% | | | | 714,476 | | | | 713,674 | |
|
CNH Equipment Trust(b)
Series 2015-B Class A2B | |
08/15/18 | | | 0.798% | | | | 961,098 | | | | 960,807 | |
|
CPS Auto Receivables Trust
Subordinated, Series 2016-B Class B(a) | |
09/15/20 | | | 3.180% | | | | 1,970,000 | | | | 1,963,593 | |
|
Cabela’s Credit Card Master Note Trust
Series 2015-2 Class A1 | |
07/17/23 | | | 2.250% | | | | 2,675,000 | | | | 2,731,678 | |
|
Cabela’s Credit Card Master Note Trust(a)(b)
Series 2012-1A Class A2 | |
02/18/20 | | | 1.038% | | | | 1,570,000 | | | | 1,570,851 | |
| | | | | | | | | | | | |
| Asset-Backed Securities — Non-Agency (continued) | |
| Issuer | | Coupon
Rate | | | Principal
Amount ($) | | | Value ($) | |
Cabela’s Master Credit Card Trust
Series 2014-1 Class A(b) | |
03/16/20 | | | 0.858% | | | | 540,000 | | | | 539,738 | |
|
California Republic Auto Receivables Trust
Series 2016-2 Class A3 | |
07/15/20 | | | 1.560% | | | | 1,980,000 | | | | 1,980,337 | |
|
Capital Auto Receivables Asset Trust
Series 2015-2 Class A3 | |
09/20/19 | | | 1.730% | | | | 505,000 | | | | 506,022 | |
|
Capital Auto Receivables Asset Trust(b)
Series 2015-2 Class A1B | |
10/20/17 | | | 0.912% | | | | 418,864 | | | | 418,607 | |
|
Capital One Multi-Asset Execution Trust
Series 2016-A1(b) | |
02/15/22 | | | 0.958% | | | | 6,295,000 | | | | 6,325,578 | |
|
Carmax Auto Owner Trust
Series 2016-3 Class A3 | |
05/17/21 | | | 1.390% | | | | 4,365,000 | | | | 4,347,982 | |
|
Chancelight, Inc.
Series 2012-2 Class A(a)(b) | |
04/25/39 | | | 1.254% | | | | 1,834,794 | | | | 1,780,589 | |
|
Chase Issuance Trust
Series 2016-A4 Class A4 | |
07/15/22 | | | 1.490% | | | | 6,245,000 | | | | 6,239,486 | |
|
Chase Issuance Trust(b)
Series 2012-A10 Class A10 | |
12/16/19 | | | 0.768% | | | | 3,380,000 | | | | 3,381,283 | |
Series 2016-A1 Class A | |
05/17/21 | | | 0.918% | | | | 9,505,000 | | | | 9,544,453 | |
Series 2016-A3 Class A3 | |
06/15/23 | | | 1.058% | | | | 9,300,000 | | | | 9,317,559 | |
Subordinated, Series 2007-B1 Class B1 | |
04/15/19 | | | 0.758% | | | | 3,000,000 | | | | 2,996,246 | |
|
Chesapeake Funding II LLC
Series 2016-2A Class A2(a)(b) | |
06/15/28 | | | 1.508% | | | | 2,800,000 | | | | 2,802,799 | |
|
Chesapeake Funding LLC(a)(b)
Series 2013-1A Class A | |
01/07/25 | | | 0.948% | | | | 673,388 | | | | 673,220 | |
Series 2014-1A Class A | |
03/07/26 | | | 0.918% | | | | 3,255,590 | | | | 3,246,554 | |
Series 2015-1A Class A | |
02/07/27 | | | 0.965% | | | | 1,611,339 | | | | 1,608,671 | |
|
Citibank Credit Card Issuance Trust
Series 2014-A6 Class A6 | |
07/15/21 | | | 2.150% | | | | 1,470,000 | | | | 1,502,088 | |
|
Conn’s Receivables Funding LLC
Series 2016-A Class A(a) | |
04/16/18 | | | 4.680% | | | | 1,924,474 | | | | 1,923,813 | |
|
Credit Acceptance Auto Loan Trust
Subordinated, Series 2016-2A Class B(a) | |
05/15/24 | | | 3.180% | | | | 6,300,000 | | | | 6,308,998 | |
|
DRB Prime Student Loan Trust
Series 2016-B Class A2(a) | |
06/25/40 | | | 2.890% | | | | 2,135,724 | | | | 2,129,956 | |
The accompanying Notes to Financial Statements are an integral part of this statement.
| | | | | | |
| | |
| | | | ACTIVE PORTFOLIOS® MULTI-MANAGER TOTAL RETURN BOND FUND | | |
PORTFOLIO OF INVESTMENTS (continued)
August 31, 2016
| | | | | | | | | | | | |
| Asset-Backed Securities — Non-Agency (continued) | |
| Issuer | | Coupon
Rate | | | Principal
Amount ($) | | | Value ($) | |
DT Auto Owner Trust
Subordinated, Series 2014-1A Class D(a) | |
01/15/21 | | | 3.980% | | | | 2,700,000 | | | | 2,736,704 | |
|
Dell Equipment Finance Trust(a)
Series 2016-1 Class A2 | |
09/24/18 | | | 1.430% | | | | 880,000 | | | | 878,101 | |
|
Dell Equipment Finance Trust(a)(b)
Series 2015-2 Class A2B | |
12/22/17 | | | 1.412% | | | | 719,850 | | | | 720,671 | |
|
Discover Card Execution Note Trust
Series 2015-A2 Class A | |
10/17/22 | | | 1.900% | | | | 2,390,000 | | | | 2,426,907 | |
|
Drive Auto Receivables Trust
Subordinated, Series 2016-BA Class C(a) | |
07/15/22 | | | 3.190% | | | | 6,755,000 | | | | 6,803,942 | |
|
Dryden XXIV Senior Loan Fund
Series 2012-24RA Class AR(a)(b) | |
11/15/23 | | | 2.107% | | | | 2,560,000 | | | | 2,553,772 | |
|
EFS Volunteer No. 2 LLC
Series 2012-1 Class A2(a)(b) | |
03/25/36 | | | 1.874% | | | | 2,700,000 | | | | 2,660,189 | |
|
Earnest Student Loan Program LLC
Series 2016-C Class A1(a)(b) | |
10/27/36 | | | 2.326% | | | | 1,400,000 | | | | 1,399,969 | |
|
Education Loan Asset-Backed Trust I
Series 2013-1 Class A2(a)(b) | |
04/26/32 | | | 1.324% | | | | 4,650,000 | | | | 4,400,035 | |
|
Educational Funding of the South, Inc.
Series 2011-1 Class A2(b) | |
04/25/35 | | | 1.365% | | | | 3,925,562 | | | | 3,860,015 | |
|
Enterprise Fleet Financing LLC(a)
Series 2014-2 Class A2 | |
03/20/20 | | | 1.050% | | | | 1,330,816 | | | | 1,326,741 | |
Series 2015-1 Class A2 | |
09/20/20 | | | 1.300% | | | | 1,970,741 | | | | 1,965,338 | |
Series 2015-2 Class A2 | |
02/22/21 | | | 1.590% | | | | 2,523,745 | | | | 2,524,483 | |
Series 2016-2 Class A2 | |
02/22/22 | | | 1.740% | | | | 1,600,000 | | | | 1,594,807 | |
|
First Franklin Mortgage Loan Trust(b)
Series 2006-FF18 Class A2D | |
12/25/37 | | | 0.734% | | | | 4,261,711 | | | | 2,669,686 | |
Series 2007-FF2 Class A2B | |
03/25/37 | | | 0.624% | | | | 6,020,133 | | | | 3,386,330 | |
|
Flagship Credit Auto Trust(a)
Subordinated, Series 2015-3 Class B | |
03/15/22 | | | 3.680% | | | | 827,000 | | | | 826,706 | |
Subordinated, Series 2016-2 | |
09/15/22 | | | 3.840% | | | | 1,855,000 | | | | 1,855,986 | |
Subordinated, Series 2016-3 Class B | |
06/15/21 | | | 2.430% | | | | 2,195,000 | | | | 2,192,506 | |
|
Ford Credit Auto Owner Trust | |
12/15/18 | | | 1.120% | | | | 512,550 | | | | 512,803 | |
Series 2016-B Class A3 | |
10/15/20 | | | 1.330% | | | | 2,115,000 | | | | 2,120,534 | |
| | | | | | | | | | | | |
| Asset-Backed Securities — Non-Agency (continued) | |
| Issuer | | Coupon
Rate | | | Principal
Amount ($) | | | Value ($) | |
Ford Credit Auto Owner Trust(a)
Series 2014-2 Class A | |
04/15/26 | | | 2.310% | | | | 5,760,000 | | | | 5,881,428 | |
Series 2015-1 Class A | |
07/15/26 | | | 2.120% | | | | 8,805,000 | | | | 8,917,611 | |
Series 2015-2 Class A | |
01/15/27 | | | 2.440% | | | | 2,655,000 | | | | 2,724,301 | |
Series 2016-2 Class A | |
12/15/27 | | | 2.030% | | | | 4,840,000 | | | | 4,867,773 | |
|
Ford Credit Floorplan Master Owner Trust
Series 2013-2 Class A(a) | |
03/15/22 | | | 2.090% | | | | 3,775,000 | | | | 3,821,293 | |
|
GE Dealer Floorplan Master Note Trust(b)
Series 2012-2 Class A | |
04/22/19 | | | 1.262% | | | | 2,310,000 | | | | 2,316,918 | |
Series 2014-1 Class A | |
07/20/19 | | | 0.892% | | | | 2,770,000 | | | | 2,765,285 | |
Series 2015-1 Class A | |
01/20/20 | | | 1.012% | | | | 5,840,000 | | | | 5,826,483 | |
|
GM Financial Automobile Leasing Trust
Series 2015-1 Class A2 | |
12/20/17 | | | 1.100% | | | | 2,743,306 | | | | 2,743,274 | |
Series 2015-3 Class A3 | |
03/20/19 | | | 1.690% | | | | 1,755,000 | | | | 1,764,021 | |
Series 2016-2 Class A3 | |
09/20/19 | | | 1.620% | | | | 5,450,000 | | | | 5,463,475 | |
|
GMF Floorplan Owner Revolving Trust(a)(b)
Series 2015-1 Class A2 | |
05/15/20 | | | 1.008% | | | | 680,000 | | | | 680,000 | |
Series 2016-1 Class A2 | |
05/17/21 | | | 1.350% | | | | 1,755,000 | | | | 1,762,058 | |
|
Global SC Finance II SRL
Series 2014-1A Class A2(a) | |
07/17/29 | | | 3.090% | | | | 3,036,042 | | | | 2,844,929 | |
|
Goal Capital Funding Trust
Series 2006-1 Class B(b) | |
08/25/42 | | | 1.275% | | | | 1,243,681 | | | | 1,080,726 | |
|
Golden Credit Card Trust
Series 2015-3A Class A(a)(b) | |
07/15/19 | | | 0.928% | | | | 2,035,000 | | | | 2,036,027 | |
|
Goldentree Loan Opportunities VIII Ltd.
Series 2014-8A Class A(a)(b) | |
04/19/26 | | | 2.138% | | | | 2,475,000 | | | | 2,475,218 | |
|
GreatAmerica Leasing Receivables Funding LLC
Series 2015-1 Class A2(a) | |
06/20/17 | | | 1.120% | | | | 430,121 | | | | 430,228 | |
|
Green Tree Agency Advance Funding Trust I
Series 2015-T1 Class AT1(a) | |
10/15/46 | | | 2.302% | | | | 3,275,000 | | | | 3,273,919 | |
|
Guggenheim CLO LP
Series 2015-1A Class A1(a)(b) | |
11/25/27 | | | 2.525% | | | | 16,750,000 | | | | 16,780,552 | |
|
Harley-Davidson Motorcycle Trust
Series 2015-1 Class A3 | |
06/15/20 | | | 1.410% | | | | 910,000 | | | | 911,991 | |
The accompanying Notes to Financial Statements are an integral part of this statement.
| | | | | | |
| | |
| | | | ACTIVE PORTFOLIOS® MULTI-MANAGER TOTAL RETURN BOND FUND | | |
PORTFOLIO OF INVESTMENTS (continued)
August 31, 2016
| | | | | | | | | | | | |
| Asset-Backed Securities — Non-Agency (continued) | |
| Issuer | | Coupon
Rate | | | Principal
Amount ($) | | | Value ($) | |
Harley-Davidson Motorcycle Trust(b)
Series 2015-1 Class A2B | |
01/15/19 | | | 0.808% | | | | 2,665,815 | | | | 2,666,275 | |
|
Henderson Receivables LLC(a)
Series 2013-3A Class A | |
01/17/73 | | | 4.080% | | | | 2,528,300 | | | | 2,655,955 | |
Series 2014-2A Class A | |
01/17/73 | | | 3.610% | | | | 3,159,612 | | | | 3,161,206 | |
|
Hertz Fleet Lease Funding LP(a)(b)
Series 2013-3 Class A | |
12/10/27 | | | 1.062% | | | | 1,877,954 | | | | 1,878,928 | |
Series 2014-1 Class A | |
04/10/28 | | | 0.912% | | | | 1,471,535 | | | | 1,472,089 | |
Series 2015-1 Class A | |
07/10/29 | | | 1.082% | | | | 3,933,763 | | | | 3,942,282 | |
Series 2016-1 Class A1 | |
04/10/30 | | | 1.574% | | | | 4,760,000 | | | | 4,764,766 | |
|
Hertz Vehicle Financing II LP
Series 2015-3A Class A(a) | |
09/25/21 | | | 2.670% | | | | 1,390,000 | | | | 1,395,405 | |
|
Hertz Vehicle Financing LLC(a)
Series 2016-1A Class A | |
03/25/20 | | | 2.320% | | | | 1,620,000 | | | | 1,628,656 | |
Series 2016-3A Class A | |
07/25/20 | | | 2.270% | | | | 4,080,000 | | | | 4,081,958 | |
|
Higher Education Funding I
Series 2014-1 Class A(a)(b) | |
05/25/34 | | | 1.875% | | | | 3,818,318 | | | | 3,755,062 | |
|
Honda Auto Receivables Owner Trust
Series 2013-4 Class A3 | |
09/18/17 | | | 0.690% | | | | 62,753 | | | | 62,741 | |
Series 2015-3 Class A3 | |
04/18/19 | | | 1.270% | | | | 5,300,000 | | | | 5,302,883 | |
|
Huntington Auto Trust
Series 2015-1 Class A2 | |
10/16/17 | | | 0.760% | | | | 271,010 | | | | 271,007 | |
|
Hyundai Auto Lease Securitization Trust
Series 2015-B Class A2A(a) | |
12/15/17 | | | 0.950% | | | | 2,590,918 | | | | 2,590,856 | |
|
Hyundai Auto Receivables Trust
Series 2015-B Class A2B(b) | |
04/16/18 | | | 0.728% | | | | 739,364 | | | | 739,581 | |
|
Hyundai Floorplan Master Owner Trust
Series 2016-1A Class A1(a)(b) | |
03/15/21 | | | 1.408% | | | | 725,000 | | | | 728,646 | |
|
ICG US CLO Ltd.
Series 2014-1A Class A1(a)(b) | |
04/20/26 | | | 1.846% | | | | 13,275,000 | | | | 13,139,953 | |
|
Jackson Mill CLO Ltd.
Series 2015-1A Class A(a)(b) | |
04/15/27 | | | 2.220% | | | | 9,750,000 | | | | 9,738,407 | |
|
Jamestown CLO IX Ltd.
Series 2016-9A Class A1B(a)(b)(c)(f) | |
10/20/28 | | | 2.320% | | | | 18,400,000 | | | | 18,306,160 | |
| | | | | | | | | | | | |
| Asset-Backed Securities — Non-Agency (continued) | |
| Issuer | | Coupon
Rate | | | Principal
Amount ($) | | | Value ($) | |
John Deere Owner Trust
Series 2016-A Class A2 | |
10/15/18 | | | 1.150% | | | | 1,845,000 | | | | 1,843,265 | |
|
Kubota Credit Owner Trust
Series 2016-1A Class A2(a) | |
04/15/19 | | | 1.250% | | | | 1,380,000 | | | | 1,378,645 | |
|
Magnetite IX Ltd.
Series 2014-9A Class A1(a)(b) | |
07/25/26 | | | 2.135% | | | | 5,205,000 | | | | 5,204,745 | |
|
Magnetite XI Ltd.
Series 2014-11A Class A1(a)(b) | |
01/18/27 | | | 2.129% | | | | 5,000,000 | | | | 4,999,960 | |
|
Mercedes-Benz Master Owner Trust
Series 2015-AA Class A(a)(b) | |
04/15/19 | | | 0.828% | | | | 4,310,000 | | | | 4,311,810 | |
|
Mid-State Capital Corp. Trust
Series 2006-1 Class A(a) | |
10/15/40 | | | 5.787% | | | | 1,375,139 | | | | 1,468,777 | |
|
Mid-State Trust VII
Series 7 Class A (AMBAC) | |
10/15/36 | | | 6.340% | | | | 1,761,060 | | | | 1,871,068 | |
|
Mountain View Funding CLO
Series 2007-3A Class A1(a)(b) | |
04/16/21 | | | 0.894% | | | | 1,172,383 | | | | 1,171,468 | |
|
Navient Student Loan Trust(b)
Series 2014-2 Class A | |
03/25/83 | | | 1.164% | | | | 7,643,098 | | | | 7,389,534 | |
Series 2014-3 Class A | |
03/25/83 | | | 1.144% | | | | 7,686,660 | | | | 7,428,788 | |
Series 2014-4 Class A | |
03/25/83 | | | 1.144% | | | | 3,443,977 | | | | 3,291,859 | |
Series 2015-2 Class A3 | |
11/26/40 | | | 1.094% | | | | 5,400,000 | | | | 5,248,580 | |
|
Nelnet Student Loan Trust(a)(b)
Series 2012-5A Class A | |
10/27/36 | | | 1.124% | | | | 2,491,344 | | | | 2,396,353 | |
Series 2014-4A Class A2 | |
11/25/43 | | | 1.474% | | | | 4,210,000 | | | | 3,796,000 | |
Series 2015-1A Class A | |
04/25/41 | | | 1.114% | | | | 8,222,587 | | | | 7,718,245 | |
|
Nelnet Student Loan Trust(b)
Series 2008-3 Class A4 | |
11/25/24 | | | 2.475% | | | | 6,570,000 | | | | 6,611,315 | |
|
New York City Tax Lien Trust(a)
Series 2015-A Class A | |
11/10/28 | | | 1.340% | | | | 434,989 | | | | 433,432 | |
Series 2016-A Class A | |
11/10/29 | | | 1.470% | | | | 1,560,000 | | | | 1,560,000 | |
|
NextGear Floorplan Master Owner Trust
Series 2016-1A Class A2(a) | |
04/15/21 | | | 2.740% | | | | 3,380,000 | | | | 3,378,184 | |
|
Nissan Auto Receivables Owner Trust
Series 2016-B Class A3 | |
01/15/21 | | | 1.320% | | | | 2,105,000 | | | | 2,110,546 | |
The accompanying Notes to Financial Statements are an integral part of this statement.
| | | | | | |
| | |
| | | | ACTIVE PORTFOLIOS® MULTI-MANAGER TOTAL RETURN BOND FUND | | |
PORTFOLIO OF INVESTMENTS (continued)
August 31, 2016
| | | | | | | | | | | | |
| Asset-Backed Securities — Non-Agency (continued) | |
| Issuer | | Coupon
Rate | | | Principal
Amount ($) | | | Value ($) | |
Nissan Auto Receivables Owner Trust(b)
Series 2015-A Class A1 | |
01/15/20 | | | 0.908% | | | | 6,655,000 | | | | 6,659,107 | |
|
OZLM VII Ltd.
Series 2014-7A Class A1A(a)(b) | |
07/17/26 | | | 2.099% | | | | 700,000 | | | | 699,995 | |
|
Oak Hill Credit Partners X Ltd.
Series 2014-10A Class A(a)(b) | |
07/20/26 | | | 2.166% | | | | 2,720,000 | | | | 2,720,177 | |
|
Octagon Investment Partners 24 Ltd.
Series 2015-1A Class A1(a)(b) | |
05/21/27 | | | 2.261% | | | | 6,750,000 | | | | 6,728,150 | |
|
Octagon Investment Partners XIX Ltd.
Series 2014-A Class 1A(a)(b) | |
04/15/26 | | | 2.200% | | | | 3,460,000 | | | | 3,462,879 | |
|
Octagon Investment Partners XXI Ltd.(a)(b)
Series 2014-1A Class A1A | |
11/14/26 | | | 2.287% | | | | 3,400,000 | | | | 3,393,890 | |
Series 2014-1A Class A1B | |
11/14/26 | | | 2.567% | | | | 3,635,000 | | | | 3,632,895 | |
|
Ocwen Master Advance Receivables Trust
Series 2016-T1 Class AT1(a) | |
08/17/48 | | | 2.521% | | | | 4,300,000 | | | | 4,297,312 | |
|
OneMain Direct Auto Receivables Trust(a)
Series 2016-1A Class A | |
01/15/21 | | | 2.040% | | | | 2,612,537 | | | | 2,607,952 | |
Subordinated, Series 2016-1A Class C | |
09/15/21 | | | 4.580% | | | | 2,300,000 | | | | 2,292,627 | |
|
OneMain Financial Issuance Trust(a)
Series 2015-1A Class A | |
03/18/26 | | | 3.190% | | | | 3,195,000 | | | | 3,229,656 | |
Series 2015-2A Class A | |
07/18/25 | | | 2.570% | | | | 6,625,000 | | | | 6,613,453 | |
|
Palmer Square CLO Ltd.
Series 2015-1A Class A1(a)(b) | |
05/21/27 | | | 2.311% | | | | 15,000,000 | | | | 15,000,990 | |
|
Porsche Innovative Lease Owner Trust
Series 2015-1 Class A2(a) | |
11/21/17 | | | 0.790% | | | | 259,714 | | | | 259,559 | |
|
Regatta IV Funding Ltd.
Series 2014-1A Class A1(a)(b) | |
07/25/26 | | | 2.125% | | | | 9,000,000 | | | | 8,985,087 | |
|
Regatta V Funding Ltd.
Series 2014-1A Class A1A(a)(b) | |
10/25/26 | | | 2.275% | | | | 12,500,000 | | | | 12,500,225 | |
|
SLC Student Loan Trust
Series 2006-2 Class A5(b) | |
09/15/26 | | | 0.753% | | | | 4,000,000 | | | | 3,906,369 | |
|
SLM Student Loan Trust(a)(b)
Series 2003-12 Class A5 | |
09/15/22 | | | 0.933% | | | | 3,394,115 | | | | 3,383,207 | |
|
SLM Student Loan Trust(b)
Series 2004-8 Class B | |
01/25/40 | | | 1.175% | | | | 627,002 | | | | 540,955 | |
| | | | | | | | | | | | |
| Asset-Backed Securities — Non-Agency (continued) | |
| Issuer | | Coupon
Rate | | | Principal
Amount ($) | | | Value ($) | |
Series 2005-4 Class A3 | |
01/25/27 | | | 0.835% | | | | 7,041,442 | | | | 6,891,351 | |
Series 2007-6 Class B | |
04/27/43 | | | 1.565% | | | | 925,262 | | | | 788,109 | |
Series 2008-2 Class B | |
01/25/83 | | | 1.915% | | | | 1,165,000 | | | | 1,012,700 | |
Series 2008-3 Class B | |
04/26/83 | | | 1.915% | | | | 1,165,000 | | | | 986,524 | |
Series 2008-4 Class A4 | |
07/25/22 | | | 2.365% | | | | 4,223,130 | | | | 4,237,837 | |
Series 2008-4 Class B | |
04/25/29 | | | 2.565% | | | | 1,165,000 | | | | 1,049,120 | |
Series 2008-5 Class B | |
07/25/29 | | | 2.565% | | | | 1,165,000 | | | | 1,052,894 | |
Series 2008-6 Class B | |
07/26/83 | | | 2.565% | | | | 1,165,000 | | | | 1,084,044 | |
Series 2008-7 Class B | |
07/26/83 | | | 2.565% | | | | 1,165,000 | | | | 1,073,925 | |
Series 2008-8 Class B | |
10/25/29 | | | 2.965% | | | | 1,165,000 | | | | 1,119,882 | |
Series 2008-9 Class B | |
10/25/83 | | | 2.965% | | | | 1,165,000 | | | | 1,124,887 | |
Series 2011-1 Class A2 | |
10/25/34 | | | 1.674% | | | | 3,285,000 | | | | 3,206,874 | |
Series 2012-7 Class A3 | |
05/26/26 | | | 1.174% | | | | 4,000,000 | | | | 3,872,816 | |
Series 2013-2 Class A | |
06/25/43 | | | 0.974% | | | | 6,638,975 | | | | 6,503,760 | |
|
SMART ABS Series Trust
Series 2015-3US Class A2B(b) | |
04/16/18 | | | 1.258% | | | | 1,529,811 | | | | 1,529,415 | |
|
SPS Servicer Advance Receivables Trust
Series 2015-T2 Class AT2(a) | |
01/15/47 | | | 2.620% | | | | 1,980,000 | | | | 1,980,316 | |
|
Santander Drive Auto Receivables Trust
Subordinated, Series 2016-2 Class C | |
11/15/21 | | | 2.660% | | | | 2,775,000 | | | | 2,811,712 | |
|
Santander Drive Auto Receivables Trust(b)
Series 2015-2 Class A2B | |
09/17/18 | | | 0.958% | | | | 805,033 | | | | 804,894 | |
|
Scholar Funding Trust
Series 2011-A Class A(a)(b) | |
10/28/43 | | | 1.643% | | | | 936,346 | | | | 918,039 | |
|
Sierra Timeshare Receivables Funding LLC
Series 2016-2A Class A(a) | |
07/20/33 | | | 2.330% | | | | 2,004,261 | | | | 1,994,829 | |
|
Silver Spring CLO Ltd.
Series 2014-1A Class A(a)(b) | |
10/15/26 | | | 2.130% | | | | 13,397,930 | | | | 13,170,058 | |
|
SoFi Professional Loan Program LLC(a)
Series 2016-A | |
12/26/36 | | | 2.760% | | | | 4,170,838 | | | | 4,229,819 | |
Series 2016-B Class A2B | |
10/25/32 | | | 2.740% | | | | 2,490,000 | | | | 2,506,090 | |
Series 2016-C Class A2B | |
12/25/32 | | | 2.360% | | | | 1,405,000 | | | | 1,391,021 | |
The accompanying Notes to Financial Statements are an integral part of this statement.
| | | | | | |
| | |
| | | | ACTIVE PORTFOLIOS® MULTI-MANAGER TOTAL RETURN BOND FUND | | |
PORTFOLIO OF INVESTMENTS (continued)
August 31, 2016
| | | | | | | | | | | | |
| Asset-Backed Securities — Non-Agency (continued) | |
| Issuer | | Coupon
Rate | | | Principal
Amount ($) | | | Value ($) | |
Sound Point CLO XII Ltd.
Series 2016-2A Class A(a)(b) | |
10/20/28 | | | 2.138% | | | | 15,000,000 | | | | 15,006,195 | |
|
Springleaf Funding Trust
Series 2015-AA Class A(a) | |
11/15/24 | | | 3.160% | | | | 3,300,000 | | | | 3,328,079 | |
|
Symphony CLO V Ltd.
Series 2007-5A Class A1(a)(b) | |
01/15/24 | | | 1.430% | | | | 3,164,290 | | | | 3,140,912 | |
|
TAL Advantage V LLC
Series 2014-2A Class A1(a) | |
05/20/39 | | | 1.700% | | | | 504,461 | | | | 497,284 | |
|
Toyota Auto Receivable Owner Trust
Series 2016-B Class A3 | |
04/15/20 | | | 1.300% | | | | 1,395,000 | | | | 1,394,184 | |
|
Toyota Auto Receivables Owner Trust
Series 2015-C Class A3 | |
06/17/19 | | | 1.340% | | | | 455,000 | | | | 455,609 | |
|
Trintas CLO Ltd.
Series 2016-5A Class A(a)(b)(c)(f) | |
06/18/28 | | | 0.000% | | | | 16,175,000 | | | | 16,175,000 | |
|
USAA Auto Owner Trust
Series 2015-1 Class A2 | |
03/15/18 | | | 0.820% | | | | 1,269,732 | | | | 1,269,577 | |
|
Venture XI CLO Ltd.
Series 2012-11A Class AR(a)(b) | |
11/14/22 | | | 2.117% | | | | 4,350,000 | | | | 4,335,528 | |
|
Verizon Owner Trust
Series 2016-1A Class A(a) | |
01/20/21 | | | 1.420% | | | | 845,000 | | | | 844,988 | |
|
Volkswagen Auto Lease Trust
Series 2015-A Class A2B(b) | |
06/20/17 | | | 0.832% | | | | 374,240 | | | | 374,321 | |
|
Volkswagen Auto Loan Enhanced Trust
Series 2013-2 Class A3 | |
04/20/18 | | | 0.700% | | | | 1,007,047 | | | | 1,006,024 | |
|
Voya CLO Ltd.(a)(b)
Series 2014-2A Class A1 | |
07/17/26 | | | 2.129% | | | | 2,500,000 | | | | 2,499,953 | |
|
Voya CLO Ltd.(a)(b)(c)
Series 2012-4 Class A1 | |
10/01/23 | | | 1.390% | | | | 7,000,000 | | | | 7,000,000 | |
|
Wachovia Student Loan Trust
Series 2006-1 Class A6(a)(b) | |
04/25/40 | | | 0.885% | | | | 9,000,000 | | | | 8,047,947 | |
|
Westcott Park CLO Ltd.
Series 2016-1A Class A(a)(b) | |
07/20/28 | | | 2.187% | | | | 15,000,000 | | | | 15,026,805 | |
|
Wheels SPV 2 LLC
Series 2015-1A Class A2(a) | |
04/22/24 | | | 1.270% | | | | 1,172,479 | | | | 1,173,025 | |
|
World Financial Network Credit Card Master Trust
Series 2012-D Class A | |
04/17/23 | | | 2.150% | | | | 2,150,000 | | | | 2,180,035 | |
| | | | | | | | | | | | |
| Asset-Backed Securities — Non-Agency (continued) | |
| Issuer | | Coupon
Rate | | | Principal
Amount ($) | | | Value ($) | |
Series 2015-B Class A | |
06/17/24 | | | 2.550% | | | | 5,030,000 | | | | 5,175,159 | |
Series 2015-C Class A | |
03/15/21 | | | 1.260% | | | | 770,000 | | | | 770,768 | |
|
World Omni Automobile Lease Securitization Trust
Series 2015-A Class A3 | |
10/15/18 | | | 1.540% | | | | 3,060,000 | | | | 3,068,851 | |
|
World Omni Automobile Lease Securitization Trust(b)
Series 2015-A Class A2B | |
05/15/18 | | | 0.888% | | | | 987,628 | | | | 988,408 | |
| | | | | | | | | | | | | |
Total Asset-Backed Securities — Non-Agency | | | | | |
(Cost: $736,795,244) | | | | 736,352,836 | |
| | | |
| | | | | | | | | | | | |
| Inflation-Indexed Bonds 0.9% | |
UNITED STATES 0.9% | |
U.S. Treasury Inflation-Indexed Bond | |
01/15/25 | | | 0.250% | | | | 17,096,688 | | | | 17,257,790 | |
07/15/25 | | | 0.375% | | | | 8,004,307 | | | | 8,190,047 | |
02/15/44 | | | 1.375% | | | | 13,832,960 | | | | 16,512,128 | |
02/15/45 | | | 0.750% | | | | 14,519,766 | | | | 15,092,658 | |
| | | | | | | | | | | | | |
Total | | | | | | | | | | | 57,052,623 | |
| | | | | | | | | | | | | |
Total Inflation-Indexed Bonds | | | | | |
(Cost: $55,625,799) | | | | 57,052,623 | |
| | | |
| | | | | | | | | | | | |
| U.S. Treasury Obligations 17.0% | |
U.S. Treasury | | | | | | | | | | | | |
11/15/16 | | | 0.625% | | | | 47,250,000 | | | | 47,278,350 | |
12/31/16 | | | 0.875% | | | | 9,700,000 | | | | 9,715,753 | |
10/31/17 | | | 0.750% | | | | 6,935,000 | | | | 6,937,709 | |
03/31/18 | | | 0.875% | | | | 40,090,000 | | | | 40,151,057 | |
07/31/18 | | | 0.750% | | | | 115,770,000 | | | | 115,666,039 | |
08/31/18 | | | 0.750% | | | | 32,280,000 | | | | 32,248,462 | |
03/31/21 | | | 1.250% | | | | 41,160,000 | | | | 41,301,487 | |
04/30/21 | | | 1.375% | | | | 9,365,000 | | | | 9,446,213 | |
06/30/21 | | | 1.125% | | | | 32,425,000 | | | | 32,333,805 | |
07/31/21 | | | 1.125% | | | | 106,200,000 | | | | 105,868,125 | |
08/15/21 | | | 2.125% | | | | 27,000,000 | | | | 28,170,693 | |
06/30/22 | | | 2.125% | | | | 1,190,000 | | | | 1,243,038 | |
08/31/22 | | | 1.875% | | | | 2,030,000 | | | | 2,091,615 | |
09/30/22 | | | 1.750% | | | | 21,470,000 | | | | 21,960,632 | |
11/30/22 | | | 2.000% | | | | 3,700,000 | | | | 3,837,740 | |
08/31/23 | | | 1.375% | | | | 36,071,000 | | | | 35,916,003 | |
08/15/25 | | | 2.000% | | | | 7,120,000 | | | | 7,380,884 | |
05/15/26 | | | 1.625% | | | | 29,530,000 | | | | 29,641,889 | |
08/15/26 | | | 1.500% | | | | 91,937,000 | | | | 91,351,637 | |
02/15/36 | | | 4.500% | | | | 6,820,000 | | | | 9,749,933 | |
05/15/39 | | | 4.250% | | | | 24,610,000 | | | | 34,336,709 | |
11/15/41 | | | 3.125% | | | | 21,135,000 | | | | 25,098,637 | |
11/15/43 | | | 3.750% | | | | 13,500,000 | | | | 17,928,635 | |
05/15/44 | | | 3.375% | | | | 1,890,000 | | | | 2,353,715 | |
08/15/44 | | | 3.125% | | | | 1,510,000 | | | | 1,798,729 | |
11/15/44 | | | 3.000% | | | | 2,500,000 | | | | 2,910,155 | |
02/15/45 | | | 2.500% | | | | 27,445,000 | | | | 28,984,500 | |
08/15/45 | | | 2.875% | | | | 4,290,000 | | | | 4,878,871 | |
11/15/45 | | | 3.000% | | | | 5,750,000 | | | | 6,700,774 | |
02/15/46 | | | 2.500% | | | | 28,000,000 | | | | 29,584,856 | |
The accompanying Notes to Financial Statements are an integral part of this statement.
| | | | | | |
| | |
| | | | ACTIVE PORTFOLIOS® MULTI-MANAGER TOTAL RETURN BOND FUND | | |
PORTFOLIO OF INVESTMENTS (continued)
August 31, 2016
| | | | | | | | | | | | |
| U.S. Treasury Obligations (continued) | |
| Issuer | | Coupon
Rate | | | Principal
Amount ($) | | | Value ($) | |
05/15/46 | | | 2.500% | | | | 105,886,300 | | | | 112,069,848 | |
08/15/46 | | | 2.250% | | | | 8,455,000 | | | | 8,487,695 | |
|
U.S. Treasury(c)(p) | |
08/31/21 | | | 1.125% | | | | 65,032,300 | | | | 64,857,038 | |
|
U.S. Treasury(i)(p)
STRIPS | |
05/15/43 | | | 0.000% | | | | 33,927,000 | | | | 18,509,384 | |
| | | |
U.S. Treasury(p) | | | | | | | | | | | | |
08/15/19 | | | 0.750% | | | | 16,023,000 | | | | 15,949,775 | |
01/31/21 | | | 2.125% | | | | 15,000,000 | | | | 15,616,995 | |
01/31/23 | | | 1.750% | | | | 8,400,000 | | | | 8,581,784 | |
08/15/24 | | | 2.375% | | | | 11,850,000 | | | | 12,624,883 | |
05/15/43 | | | 2.875% | | | | 34,900,000 | | | | 39,676,938 | |
| | | | | | | | | | | | | |
Total U.S. Treasury Obligations | | | | | | | | | |
(Cost: $1,099,194,622) | | | | | | | | 1,123,240,985 | |
| | | |
| | | | | | | | | | | | |
| U.S. Government & Agency Obligations 1.8% | |
Federal Home Loan Banks Discount Notes | |
01/05/17 | | | 0.400% | | | | 49,410,000 | | | | 49,340,826 | |
01/17/17 | | | 0.400% | | | | 15,000,000 | | | | 14,977,005 | |
|
Federal Home Loan Banks | |
10/03/16 | | | 0.300% | | | | 23,000,000 | | | | 22,993,780 | |
|
Federal Home Loan Banks(b) | |
06/28/30 | | | 1.250% | | | | 10,395,000 | | | | 10,412,983 | |
|
Federal National Mortgage Association | |
10/17/16 | | | 0.290% | | | | 10,250,000 | | | | 10,246,186 | |
|
Federal National Mortgage Association(i)
STRIPS | |
05/15/30 | | | 0.000% | | | | 1,000,000 | | | | 707,776 | |
|
Residual Funding Corp.(i)
STRIPS | |
01/15/30 | | | 0.000% | | | | 10,536,000 | | | | 7,594,623 | |
04/15/30 | | | 0.000% | | | | 6,080,000 | | | | 4,365,890 | |
| | | | | | | | | | | | | |
Total U.S. Government & Agency Obligations | |
(Cost: $119,707,651) | | | | | | | | 120,639,069 | |
| | | |
| | | | | | | | | | | | |
| Foreign Government Obligations(j) 1.7% | |
ARGENTINA —% | |
Argentina Republic Government International Bond(a) | |
04/22/21 | | | 6.875% | | | | 300,000 | | | | 325,350 | |
04/22/26 | | | 7.500% | | | | 960,000 | | | | 1,070,400 | |
|
Argentina Republic Government International Bond(b) | |
12/31/33 | | | 0.000% | | | | 112,163 | | | | 128,707 | |
12/31/33 | | | 8.280% | | | | 168,245 | | | | 188,098 | |
| | | |
YPF SA(a) | | | | | | | | | | | | |
03/23/21 | | | 8.500% | | | | 120,000 | | | | 129,300 | |
| | | | | | | | | | | | | |
Total | | | | | | | | | | | 1,841,855 | |
| | | |
| | | | | | | | | | | | |
BRAZIL 0.1% | |
Banco Nacional de Desenvolvimento Economico e Social(a) | |
06/10/19 | | | 6.500% | | | | 100,000 | | | | 107,250 | |
06/10/19 | | | 6.500% | | | | 100,000 | | | | 107,620 | |
| | | | | | | | | | | | |
| Foreign Government Obligations(j) (continued) | |
| Issuer | | Coupon
Rate | | | Principal
Amount ($) | | | Value ($) | |
Brazilian Government International Bond | |
01/17/17 | | | 6.000% | | | | 4,000,000 | | | | 4,072,000 | |
01/22/21 | | | 4.875% | | | | 1,100,000 | | | | 1,171,500 | |
01/20/34 | | | 8.250% | | | | 150,000 | | | | 196,875 | |
01/07/41 | | | 5.625% | | | | 800,000 | | | | 812,000 | |
|
Petrobras Global Finance BV | |
03/15/19 | | | 7.875% | | | | 200,000 | | | | 213,440 | |
01/20/20 | | | 5.750% | | | | 100,000 | | | | 101,136 | |
05/20/23 | | | 4.375% | | | | 1,950,000 | | | | 1,700,613 | |
| | | | | | | | | | | | | |
Total | | | | | | | | | | | 8,482,434 | |
| | | |
| | | | | | | | | | | | |
CANADA 0.2% | |
CDP Financial, Inc.(a) | |
11/25/19 | | | 4.400% | | | | 10,000,000 | | | | 10,922,090 | |
|
CNOOC Nexen Finance ULC | |
04/30/24 | | | 4.250% | | | | 400,000 | | | | 436,446 | |
|
Province of Alberta Canada(a) | |
08/17/26 | | | 2.050% | | | | 2,000,000 | | | | 1,987,842 | |
| | | | | | | | | | | | | |
Total | | | | | | | | | | | 13,346,378 | |
| | | |
| | | | | | | | | | | | |
CHILE —% | |
Chile Government International Bond | |
10/30/22 | | | 2.250% | | | | 730,000 | | | | 744,600 | |
|
Corporacion Nacional del Cobre de Chile(a) | |
11/04/44 | | | 4.875% | | | | 200,000 | | | | 207,976 | |
| | | | | | | | | | | | | |
Total | | | | | | | | | | | 952,576 | |
| | | |
| | | | | | | | | | | | |
CHINA —% | |
Industrial & Commercial Bank of China Ltd.
Junior Subordinated(a)(b) | |
12/31/49 | | | 6.000% | | | | 200,000 | | | | 212,882 | |
| | | |
| | | | | | | | | | | | |
COLOMBIA 0.1% | |
Colombia Government International Bond | |
01/28/26 | | | 4.500% | | | | 700,000 | | | | 763,000 | |
01/18/41 | | | 6.125% | | | | 1,789,000 | | | | 2,170,824 | |
06/15/45 | | | 5.000% | | | | 600,000 | | | | 650,250 | |
|
Ecopetrol SA | |
09/18/18 | | | 4.250% | | | | 150,000 | | | | 156,188 | |
09/18/23 | | | 5.875% | | | | 3,010,000 | | | | 3,269,612 | |
| | | | | | | | | | | | | |
Total | | | | | | | | | | | 7,009,874 | |
| | | |
| | | | | | | | | | | | |
CROATIA —% | |
Croatia Government International Bond(a) | |
01/26/24 | | | 6.000% | | | | 500,000 | | | | 561,650 | |
01/26/24 | | | 6.000% | | | | 100,000 | | | | 112,330 | |
| | | | | | | | | | | | | |
Total | | | | | | | | | | | 673,980 | |
| | | |
| | | | | | | | | | | | |
DOMINICAN REPUBLIC 0.1% | |
Dominican Republic International Bond(a) | |
05/06/21 | | | 7.500% | | | | 4,000,000 | | | | 4,495,000 | |
05/06/21 | | | 7.500% | | | | 100,000 | | | | 112,450 | |
The accompanying Notes to Financial Statements are an integral part of this statement.
| | | | | | |
| | |
| | | | ACTIVE PORTFOLIOS® MULTI-MANAGER TOTAL RETURN BOND FUND | | |
PORTFOLIO OF INVESTMENTS (continued)
August 31, 2016
| | | | | | | | | | | | |
| Foreign Government Obligations(j) (continued) | |
| Issuer | | Coupon
Rate | | | Principal
Amount ($) | | | Value ($) | |
01/27/25 | | | 5.500% | | | | 100,000 | | | | 106,000 | |
01/27/25 | | | 5.500% | | | | 100,000 | | | | 106,000 | |
04/30/44 | | | 7.450% | | | | 435,000 | | | | 525,262 | |
01/27/45 | | | 6.850% | | | | 800,000 | | | | 908,000 | |
| | | | | | | | | | | | | |
Total | | | | | | | | | | | 6,252,712 | |
| | | |
| | | | | | | | | | | | |
FRANCE 0.2% | |
Electricite de France SA(a) | | | | | | | | | | | | |
10/13/55 | | | 5.250% | | | | 10,695,000 | | | | 11,351,780 | |
| | | |
| | | | | | | | | | | | |
HONG KONG —% | |
CITIC Ltd.(a) | | | | | | | | | | | | |
01/21/18 | | | 6.875% | | | | 200,000 | | | | 213,298 | |
| | | |
| | | | | | | | | | | | |
HUNGARY 0.2% | |
Hungary Government International Bond | |
02/19/18 | | | 4.125% | | | | 70,000 | | | | 72,275 | |
03/29/21 | | | 6.375% | | | | 546,000 | | | | 629,265 | |
02/21/23 | | | 5.375% | | | | 3,400,000 | | | | 3,853,900 | |
11/22/23 | | | 5.750% | | | | 2,000,000 | | | | 2,331,200 | |
03/25/24 | | | 5.375% | | | | 430,000 | | | | 492,887 | |
03/29/41 | | | 7.625% | | | | 1,530,000 | | | | 2,333,250 | |
|
Magyar Export-Import Bank Zrt.(a) | |
01/30/20 | | | 4.000% | | | | 1,200,000 | | | | 1,236,240 | |
| | | | | | | | | | | | | |
Total | | | | | | | | | | | 10,949,017 | |
| | | |
| | | | | | | | | | | | |
INDONESIA 0.1% | |
Indonesia Government International Bond(a) | |
04/15/23 | | | 3.375% | | | | 500,000 | | | | 515,039 | |
10/17/23 | | | 5.375% | | | | 200,000 | | | | 230,782 | |
10/12/35 | | | 8.500% | | | | 1,000,000 | | | | 1,514,704 | |
04/15/43 | | | 4.625% | | | | 200,000 | | | | 213,453 | |
01/15/45 | | | 5.125% | | | | 2,000,000 | | | | 2,284,522 | |
|
PT Pertamina Persero(a) | |
05/20/43 | | | 5.625% | | | | 250,000 | | | | 263,096 | |
05/30/44 | | | 6.450% | | | | 200,000 | | | | 230,479 | |
| | | | | | | | | | | | | |
Total | | | | | | | | | | | 5,252,075 | |
| | | |
| | | | | | | | | | | | |
ISRAEL —% | |
Israel Electric Corp., Ltd.(a) | | | | | | | | | | | | |
01/15/19 | | | 7.250% | | | | 200,000 | | | | 223,100 | |
| | | |
| | | | | | | | | | | | |
KAZAKHSTAN —% | |
Kazakhstan Government International Bond(a) | |
07/21/25 | | | 5.125% | | | | 500,000 | | | | 562,000 | |
| | | |
| | | | | | | | | | | | |
MEXICO 0.2% | |
Mexico Government International Bond | |
01/21/21 | | | 3.500% | | | | 800,000 | | | | 855,000 | |
03/15/22 | | | 3.625% | | | | 1,974,000 | | | | 2,104,777 | |
10/02/23 | | | 4.000% | | | | 200,000 | | | | 217,250 | |
01/30/25 | | | 3.600% | | | | 1,000,000 | | | | 1,060,000 | |
03/08/44 | | | 4.750% | | | | 2,667,000 | | | | 2,937,034 | |
| | | | | | | | | | | | |
| Foreign Government Obligations(j) (continued) | |
| Issuer | | Coupon
Rate | | | Principal
Amount ($) | | | Value ($) | |
Pemex Project Funding Master Trust | |
03/05/20 | | | 6.000% | | | | 3,000,000 | | | | 3,282,750 | |
06/15/38 | | | 6.625% | | | | 50,000 | | | | 53,200 | |
|
Petroleos Mexicanos | |
07/18/18 | | | 3.500% | | | | 55,000 | | | | 56,243 | |
12/20/22 | | | 1.700% | | | | 666,250 | | | | 667,289 | |
01/15/25 | | | 4.250% | | | | 300,000 | | | | 300,030 | |
01/23/46 | | | 5.625% | | | | 300,000 | | | | 289,830 | |
|
Petroleos Mexicanos(a) | |
08/04/26 | | | 6.875% | | | | 820,000 | | | | 955,157 | |
| | | | | | | | | | | | | |
Total | | | | | | | | | | | 12,778,560 | |
| | | |
| | | | | | | | | | | | |
NETHERLANDS —% | |
Petrobras Global Finance BV | |
05/23/21 | | | 8.375% | | | | 1,500,000 | | | | 1,608,750 | |
| | | |
| | | | | | | | | | | | |
PANAMA —% | |
Panama Government International Bond | |
03/16/25 | | | 3.750% | | | | 200,000 | | | | 216,500 | |
01/26/36 | | | 6.700% | | | | 840,000 | | | | 1,169,700 | |
| | | | | | | | | | | | | |
Total | | | | | | | | | | | 1,386,200 | |
| | | |
| | | | | | | | | | | | |
PERU 0.1% | |
Corporacion Financiera de Desarrollo SA(a) | |
07/15/19 | | | 3.250% | | | | 200,000 | | | | 207,000 | |
07/15/19 | | | 3.250% | | | | 920,000 | | | | 951,050 | |
|
Peruvian Government International Bond | |
03/14/37 | | | 6.550% | | | | 885,000 | | | | 1,247,850 | |
11/18/50 | | | 5.625% | | | | 150,000 | | | | 197,625 | |
| | | | | | | | | | | | | |
Total | | | | | | | | | | | 2,603,525 | |
| | | |
| | | | | | | | | | | | |
PHILIPPINES —% | |
Philippine Government International Bond | |
01/15/21 | | | 4.000% | | | | 300,000 | | | | 329,244 | |
01/21/24 | | | 4.200% | | | | 900,000 | | | | 1,031,754 | |
01/15/32 | | | 6.375% | | | | 400,000 | | | | 575,447 | |
10/23/34 | | | 6.375% | | | | 275,000 | | | | 404,882 | |
|
Power Sector Assets & Liabilities Management Corp.(a) | |
05/27/19 | | | 7.250% | | | | 100,000 | | | | 114,500 | |
| | | | | | | | | | | | | |
Total | | | | | | | | | | | 2,455,827 | |
| | | |
| | | | | | | | | | | | |
POLAND —% | |
Poland Government International Bond | |
03/17/23 | | | 3.000% | | | | 300,000 | | | | 312,750 | |
| | | |
| | | | | | | | | | | | |
QATAR —% | |
Nakilat, Inc.(a) | | | | | | | | | | | | |
12/31/33 | | | 6.067% | | | | 1,164,000 | | | | 1,405,996 | |
| | | |
| | | | | | | | | | | | |
ROMANIA 0.1% | |
Romanian Government International Bond(a) | |
08/22/23 | | | 4.375% | | | | 150,000 | | | | 165,566 | |
The accompanying Notes to Financial Statements are an integral part of this statement.
| | | | | | |
| | |
| | | | ACTIVE PORTFOLIOS® MULTI-MANAGER TOTAL RETURN BOND FUND | | |
PORTFOLIO OF INVESTMENTS (continued)
August 31, 2016
| | | | | | | | | | | | |
| Foreign Government Obligations(j) (continued) | |
| Issuer | | Coupon
Rate | | | Principal
Amount ($) | | | Value ($) | |
01/22/24 | | | 4.875% | | | | 650,000 | | | | 742,235 | |
01/22/44 | | | 6.125% | | | | 2,650,000 | | | | 3,564,383 | |
| | | | | | | | | | | | | |
Total | | | | | | | | | | | 4,472,184 | |
| | | |
| | | | | | | | | | | | |
RUSSIAN FEDERATION 0.1% | |
Gazprom OAO Via Gaz Capital SA(a) | |
04/28/34 | | | 8.625% | | | | 200,000 | | | | 261,044 | |
|
Russian Agricultural Bank OJSC Via RSHB Capital SA(a) | |
07/25/18 | | | 5.100% | | | | 200,000 | | | | 205,750 | |
|
Russian Foreign Bond — Eurobond(a) | |
04/04/22 | | | 4.500% | | | | 1,200,000 | | | | 1,285,800 | |
09/16/23 | | | 4.875% | | | | 200,000 | | | | 218,760 | |
04/04/42 | | | 5.625% | | | | 800,000 | | | | 916,000 | |
| | | | | | | | | | | | | |
Total | | | | | | | | | | | 2,887,354 | |
| | | |
| | | | | | | | | | | | |
SERBIA —% | |
Serbia International Bond(a) | |
02/25/20 | | | 4.875% | | | | 550,000 | | | | 572,000 | |
| | | |
| | | | | | | | | | | | |
SOUTH AFRICA —% | |
South Africa Government International Bond | |
05/30/22 | | | 5.875% | | | | 200,000 | | | | 223,666 | |
01/17/24 | | | 4.665% | | | | 650,000 | | | | 678,100 | |
09/16/25 | | | 5.875% | | | | 200,000 | | | | 224,250 | |
| | | | | | | | | | | | | |
Total | | | | | | | | | | | 1,126,016 | |
| | | |
| | | | | | | | | | | | |
SOUTH KOREA —% | |
Export-Import Bank of Korea | |
12/30/20 | | | 2.625% | | | | 400,000 | | | | 414,286 | |
|
Korea Development Bank (The) | |
03/11/20 | | | 2.500% | | | | 300,000 | | | | 308,464 | |
09/14/22 | | | 3.000% | | | | 200,000 | | | | 213,178 | |
| | | | | | | | | | | | | |
Total | | | | | | | | | | | 935,928 | |
| | | |
| | | | | | | | | | | | |
SRI LANKA —% | |
Sri Lanka Government International Bond(a) | |
07/27/21 | | | 6.250% | | | | 750,000 | | | | 792,201 | |
| | | |
| | | | | | | | | | | | |
TURKEY 0.1% | |
Hazine Mustesarligi Varlik Kiralam AS(a) | |
10/10/18 | | | 4.557% | | | | 950,000 | | | | 980,191 | |
|
Turkey Government International Bond | |
03/30/21 | | | 5.625% | | | | 4,360,000 | | | | 4,676,100 | |
03/23/23 | | | 3.250% | | | | 600,000 | | | | 570,750 | |
04/14/26 | | | 4.250% | | | | 700,000 | | | | 688,149 | |
| | | | | | | | | | | | | |
Total | | | | | | | | | | | 6,915,190 | |
| | | |
| | | | | | | | | | | | |
UNITED ARAB EMIRATES —% | |
DP World Ltd.(a) | | | | | | | | | | | | |
07/02/37 | | | 6.850% | | | | 300,000 | | | | 349,350 | |
| | | |
| | | | | | | | | | | | |
| | | | | | | | | | | | |
| Foreign Government Obligations(j) (continued) | |
| Issuer | | Coupon
Rate | | | Principal
Amount ($) | | | Value ($) | |
URUGUAY —% | |
Uruguay Government International Bond | |
10/27/27 | | | 4.375% | | | | 700,000 | | | | 759,500 | |
06/18/50 | | | 5.100% | | | | 200,000 | | | | 211,000 | |
| | | | | | | | | | | | | |
Total | | | | | | | | | | | 970,500 | |
| | | |
| | | | | | | | | | | | |
VENEZUELA —% | |
Venezuela Government International Bond | |
09/15/27 | | | 9.250% | | | | 370,000 | | | | 180,190 | |
| | | |
| | | | | | | | | | | | |
VIRGIN ISLANDS 0.1% | |
CNPC General Capital Ltd.(a) | |
11/25/19 | | | 2.700% | | | | 300,000 | | | | 307,252 | |
|
Franshion Brilliant Ltd.(a) | |
03/19/19 | | | 5.750% | | | | 400,000 | | | | 429,300 | |
|
Sinochem Offshore Capital Co., Ltd.(a) | |
04/29/19 | | | 3.250% | | | | 200,000 | | | | 205,226 | |
|
Sinopec Group Overseas Development 2015 Ltd.(a) | |
04/28/25 | | | 3.250% | | | | 300,000 | | | | 310,596 | |
|
Sinopec Group Overseas Development 2016 Ltd.(a) | |
05/03/19 | | | 2.125% | | | | 3,600,000 | | | | 3,625,395 | |
|
Sinopec Group Overseas Development Ltd.(a) | |
04/28/25 | | | 3.250% | | | | 400,000 | | | | 414,128 | |
| | | | | | | | | | | | | |
Total | | | | | | | | | | | 5,291,897 | |
| | | | | | | | | | | | | |
Total Foreign Government Obligations | |
(Cost: $109,254,878) | | | | | | | | 114,368,379 | |
| | | |
| | | | | | | | | | | | |
| Municipal Bonds 0.4% | |
Issue
Description | | Coupon
Rate | | | Principal
Amount ($) | | | Value ($) | |
CALIFORNIA 0.1% | |
Bay Area Toll Authority
Revenue Bonds
Series 2009 (BAM) | |
04/01/49 | | | 6.263% | | | | 420,000 | | | | 648,215 | |
|
Los Angeles Department of Water & Power
Revenue Bonds
Series 2010 (BAM) | |
07/01/45 | | | 6.574% | | | | 1,595,000 | | | | 2,485,584 | |
|
Los Angeles Unified School District
Unlimited General Obligation Bonds
Taxable Build America Bonds
Series 2009 | |
07/01/34 | | | 5.750% | | | | 655,000 | | | | 883,484 | |
|
State of California
Unlimited General Obligation Bonds
Build America Bonds
Series 2010 | |
03/01/40 | | | 7.625% | | | | 800,000 | | | | 1,292,752 | |
Taxable-Various Purpose
Series 2010 | |
03/01/19 | | | 6.200% | | | | 2,700,000 | | | | 3,031,776 | |
| | | | | | | | | | | | | |
Total | | | | | | | | | | | 8,341,811 | |
The accompanying Notes to Financial Statements are an integral part of this statement.
| | | | | | |
| | |
| | | | ACTIVE PORTFOLIOS® MULTI-MANAGER TOTAL RETURN BOND FUND | | |
PORTFOLIO OF INVESTMENTS (continued)
August 31, 2016
| | | | | | | | | | | | |
| Municipal Bonds (continued) | |
Issue
Description | | Coupon
Rate | | | Principal
Amount ($) | | | Value ($) | |
ILLINOIS 0.1% | |
City of Chicago Waterworks
Revenue Bonds
Build America Bonds
Series 2010 | |
11/01/40 | | | 6.742% | | | | 425,000 | | | | 569,853 | |
|
City of Chicago
Unlimited General Obligation Bonds
Taxable Project
Series 2011-C1 | |
01/01/35 | | | 7.781% | | | | 535,000 | | | | 616,117 | |
Unlimited General Obligation Refunding Bonds
Taxable
Series 2014B | |
01/01/44 | | | 6.314% | | | | 1,240,000 | | | | 1,252,933 | |
Unlimited General Obligation Taxable Bonds
Series 2015B | |
01/01/33 | | | 7.375% | | | | 395,000 | | | | 440,160 | |
|
State of Illinois
Revenue Bonds
Taxable Sales Tax
Series 2013 | |
06/15/28 | | | 3.350% | | | | 2,500,000 | | | | 2,590,675 | |
| | | | | | | | | | | | | |
Total | | | | | | | | | | | 5,469,738 | |
| | | |
| | | | | | | | | | | | |
KENTUCKY —% | |
Kentucky Asset Liability Commission
Taxable Revenue Bonds
Series 2010 | |
04/01/18 | | | 3.165% | | | | 2,135,376 | | | | 2,172,766 | |
| | | |
| | | | | | | | | | | | |
NEW YORK 0.2% | |
City of New York
Unlimited General Obligation Bonds
Series 2010 (BAM) | |
03/01/36 | | | 5.968% | | | | 3,100,000 | | | | 4,269,909 | |
|
New York City Water & Sewer System
Revenue Bonds
Series 2010 (BAM) | |
06/15/43 | | | 5.440% | | | | 1,550,000 | | | | 2,170,543 | |
|
New York State Urban Development Corp.
Revenue Bonds
Taxable State Personal Income Tax
Series 2013 | |
03/15/22 | | | 3.200% | | | | 2,650,000 | | | | 2,817,082 | |
| | | | | | | | | | | | | |
Total | | | | | | | | | | | 9,257,534 | |
| | | |
| | | | | | | | | | | | |
OHIO —% | |
JobsOhio Beverage System
Taxable Revenue Bonds
Series 2013B | |
01/01/35 | | | 4.532% | | | | 2,160,000 | | | | 2,561,328 | |
| | | | | | | | | | | | |
| Municipal Bonds (continued) | |
Issue
Description | | Coupon
Rate | | | Principal
Amount ($) | | | Value ($) | |
PUERTO RICO —% | |
Puerto Rico Sales Tax Financing Corp.(k)
Revenue Bonds
1st Senior Series 2009C | |
08/01/57 | | | 5.750% | | | | 500,000 | | | | 357,495 | |
Subordinated Revenue Bonds
1st Series 2009A-1 | |
08/01/43 | | | 5.250% | | | | 1,575,000 | | | | 811,125 | |
1st Series 2009B | |
08/01/44 | | | 6.500% | | | | 285,000 | | | | 152,116 | |
1st Series 2010C | |
08/01/41 | | | 5.250% | | | | 2,160,000 | | | | 1,112,422 | |
| | | | | | | | | | | | | |
Total | | | | | | | | | | | 2,433,158 | |
| | | | | | | | | | | | | |
Total Municipal Bonds | | | | | | | | | |
(Cost: $28,602,715) | | | | | | | | 30,236,335 | |
| | | |
| | | | | | | | | | | | |
| Preferred Debt 0.3% | |
| Issuer | | Coupon
Rate | | | Shares | | | Value ($) | |
BANKING 0.2% | |
M&T Bank Corp.(b) | |
12/31/49 | | | 6.375% | | | | 2,703 | | | | 2,849,138 | |
12/31/49 | | | 6.375% | | | | 435 | | | | 481,558 | |
|
State Street Corp.(b) | |
12/31/49 | | | 5.350% | | | | 76,010 | | | | 2,097,876 | |
12/31/49 | | | 5.900% | | | | 52,835 | | | | 1,503,684 | |
|
U.S. Bancorp(b) | |
12/31/49 | | | 6.500% | | | | 84,510 | | | | 2,620,655 | |
|
Wells Fargo & Co. | |
12/31/49 | | | 7.500% | | | | 3,000 | | | | 4,057,500 | |
| | | | | | | | | | | | | |
Total | | | | | | | | | | | 13,610,411 | |
| | | |
| | | | | | | | | | | | |
BROKERAGE/ASSET MANAGERS/EXCHANGES —% | |
Merrill Lynch Capital Trust I(b) | |
12/15/66 | | | 6.450% | | | | 40,000 | | | | 1,034,000 | |
| | | |
| | | | | | | | | | | | |
BUILDING MATERIALS 0.1% | |
Stanley Black & Decker, Inc. | |
07/25/52 | | | 5.750% | | | | 125,250 | | | | 3,290,317 | |
| | | |
| | | | | | | | | | | | |
PROPERTY & CASUALTY —% | |
Allstate Corp. (The)(b) | | | | | | | | | | | | |
01/15/53 | | | 5.100% | | | | 51,885 | | | | 1,450,705 | |
| | | | | | | | | | | | | |
Total Preferred Debt | | | | | |
(Cost: $18,040,160) | | | | 19,385,433 | |
The accompanying Notes to Financial Statements are an integral part of this statement.
| | | | | | |
| | |
| | | | ACTIVE PORTFOLIOS® MULTI-MANAGER TOTAL RETURN BOND FUND | | |
PORTFOLIO OF INVESTMENTS (continued)
August 31, 2016
| | | | | | | | | | | | |
| Senior Loans 0.6% | |
| Borrower | | Weighted
Average
Coupon | | | Principal
Amount ($) | | | Value ($) | |
CABLE AND SATELLITE —% | |
Quebecor Media, Inc.
Tranche B1 Term Loan(b)(l) | |
08/17/20 | | | 3.317% | | | | 748,072 | | | | 743,711 | |
| | | |
| | | | | | | | | | | | |
CHEMICALS —% | |
Axalta Coating Systems Dutch Holding B BV
Tranche B Term Loan(b)(l) | |
02/01/20 | | | 3.750% | | | | 892,938 | | | | 896,804 | |
|
MacDermid, Inc.
Tranche B3 Term Loan(b)(l) | |
06/07/20 | | | 5.500% | | | | 748,115 | | | | 747,741 | |
|
PQ Corp.
Tranche B1 Term Loan(b)(l) | |
11/04/22 | | | 5.750% | | | | 73,916 | | | | 74,365 | |
| | | | | | | | | | | | | |
Total | | | | | | | | | | | 1,718,910 | |
| | | |
| | | | | | | | | | | | |
CONSUMER PRODUCTS —% | |
Bombardier Recreational Products, Inc.
Tranche B Term Loan(b)(l) | |
06/30/23 | | | 3.750% | | | | 1,000,000 | | | | 998,750 | |
|
Sun Products Corp. (The)
Tranche B Term Loan(b)(l) | |
03/23/20 | | | 5.500% | | | | 750,000 | | | | 749,535 | |
| | | | | | | | | | | | | |
Total | | | | | | | | | | | 1,748,285 | |
| | | |
| | | | | | | | | | | | |
DIVERSIFIED MANUFACTURING —% | |
Accudyne Industries Borrower SCA/LLC
Term Loan(b)(l) | |
12/13/19 | | | 4.000% | | | | 365,000 | | | | 324,667 | |
|
Manitowoc Foodservice, Inc.
Tranche B Term Loan(b)(l) | |
03/03/23 | | | 5.750% | | | | 199,892 | | | | 202,057 | |
|
Rexnord LLC/RBS Global, Inc.
Tranche B Term Loan(b)(l) | |
08/21/20 | | | 4.000% | | | | 823,735 | | | | 823,430 | |
| | | | | | | | | | | | | |
Total | | | | | | | | | | | 1,350,154 | |
| | | |
| | | | | | | | | | | | |
ELECTRIC —% | |
Calpine Corp.
Term Loan(b)(l) | | | | | | | | | | | | |
05/31/23 | | | 3.640% | | | | 750,000 | | | | 752,498 | |
| | | |
Dynegy, Inc.
Term Loan(b)(l) | | | | | | | | | | | | |
06/27/23 | | | 5.000% | | | | 505,000 | | | | 505,081 | |
|
Texas Competitive Electric Holdings Co. LLC(b)(l)
Term Loan | |
10/31/17 | | | 5.000% | | | | 297,214 | | | | 297,883 | |
Tranche C Term Loan | |
10/31/17 | | | 5.000% | | | | 67,786 | | | | 67,938 | |
| | | | | | | | | | | | | |
Total | | | | | | | | | | | 1,623,400 | |
| | | | | | | | | | | | |
| Senior Loans (continued) | |
| Borrower | | Weighted
Average
Coupon | | | Principal
Amount ($) | | | Value ($) | |
ENVIRONMENTAL —% | |
STI Infrastructure SARL
Term Loan(b)(l) | |
08/22/20 | | | 6.250% | | | | 673,372 | | | | 542,064 | |
| | | |
| | | | | | | | | | | | |
GAMING —% | |
Golden Nugget, Inc.(b)(l)
Term Loan | |
11/21/19 | | | 5.500% | | | | 274,500 | | | | 275,702 | |
11/21/19 | | | 5.500% | | | | 640,500 | | | | 643,306 | |
|
Twin River Management Group, Inc.
Term Loan(b)(l) | |
07/10/20 | | | 5.250% | | | | 1,299,782 | | | | 1,303,850 | |
| | | | | | | | | | | | | |
Total | | | | | | | | | | | 2,222,858 | |
| | | |
| | | | | | | | | | | | |
HEALTH CARE —% | |
CHS/Community Health Systems, Inc.
Tranche H Term Loan(b)(l) | |
01/27/21 | | | 4.000% | | | | 997,481 | | | | 955,796 | |
|
Select Medical Corp.
Tranche B-F Term Loan(b)(l) | |
03/03/21 | | | 5.681% | | | | 748,125 | | | | 752,801 | |
| | | | | | | | | | | | | |
Total | | | | | | | | | | | 1,708,597 | |
| | | |
| | | | | | | | | | | | |
INDEPENDENT ENERGY 0.1% | |
Chesapeake Energy Corp.
Tranche A Term Loan(b)(c)(l) | |
08/17/21 | | | 8.500% | | | | 382,811 | | | | 394,774 | |
|
EMG Utica LLC
Term Loan(b)(l) | |
03/27/20 | | | 4.750% | | | | 1,047,294 | | | | 1,018,494 | |
|
MEG Energy Corp.
Term Loan(b)(l) | |
03/31/20 | | | 3.750% | | | | 1,458,032 | | | | 1,338,196 | |
| | | | | | | | | | | | | |
Total | | | | | | | | | | | 2,751,464 | |
| | | |
| | | | | | | | | | | | |
LEISURE —% | |
UFC Holdings LLC(b)(c)(l)
1st Lien Term Loan | |
08/18/23 | | | 5.000% | | | | 106,000 | | | | 106,212 | |
2nd Lien Term Loan | |
08/18/24 | | | 8.500% | | | | 33,000 | | | | 33,196 | |
| | | | | | | | | | | | | |
Total | | | | | | | | | | | 139,408 | |
| | | |
| | | | | | | | | | | | |
MEDIA AND ENTERTAINMENT —% | |
Univision Communications, Inc.
Tranche C4 1st Lien Term Loan(b)(l) | |
03/01/20 | | | 4.000% | | | | 1,346,416 | | | | 1,345,648 | |
| | | |
| | | | | | | | | | | | |
MIDSTREAM —% | |
Power Buyer LLC
1st Lien Term Loan(b)(l) | |
05/06/20 | | | 4.250% | | | | 1,366,496 | | | | 1,363,080 | |
The accompanying Notes to Financial Statements are an integral part of this statement.
| | | | | | |
| | |
| | | | ACTIVE PORTFOLIOS® MULTI-MANAGER TOTAL RETURN BOND FUND | | |
PORTFOLIO OF INVESTMENTS (continued)
August 31, 2016
| | | | | | | | | | | | |
| Senior Loans (continued) | |
| Borrower | | Weighted
Average
Coupon | | | Principal
Amount ($) | | | Value ($) | |
OIL FIELD SERVICES —% | |
Drillships Ocean Ventures, Inc.
Term Loan(b)(l) | |
07/25/21 | | | 5.500% | | | | 1,470,000 | | | | 989,795 | |
| | | |
| | | | | | | | | | | | |
OTHER FINANCIAL INSTITUTIONS —% | |
AlixPartners LLP
Term Loan(b)(l) | | | | | | | | | | | | |
07/28/22 | | | 4.500% | | | | 748,116 | | | | 751,856 | |
| | | |
| | | | | | | | | | | | |
OTHER INDUSTRY —% | |
EIF Channelview Cogeneration LLC Term Loan(b)(l) | |
05/08/20 | | | 4.250% | | | | 772,667 | | | | 728,238 | |
| | | |
| | | | | | | | | | | | |
PACKAGING —% | |
Reynolds Group Holdings, Inc.
Term Loan(b)(l) | |
02/05/23 | | | 4.250% | | | | 585,000 | | | | 585,550 | |
| | | |
| | | | | | | | | | | | |
PHARMACEUTICALS 0.1% | |
Concordia International Corp.
Term Loan(b)(l) | |
10/21/21 | | | 5.250% | | | | 144,275 | | | | 136,408 | |
|
Pharmaceutical Product Development, Inc.
Term Loan(b)(l) | |
08/18/22 | | | 4.250% | | | | 697,481 | | | | 699,399 | |
|
RPI Finance Trust
Tranche B4 Term Loan(b)(c)(l) | |
11/09/20 | | | 3.500% | | | | 747,468 | | | | 751,519 | |
|
Valeant Pharmaceuticals International, Inc.
Tranche B-E1 Term Loan(b)(l) | |
08/05/20 | | | 5.250% | | | | 980,580 | | | | 978,746 | |
| | | | | | | | | | | | | |
Total | | | | | | | | | | | 2,566,072 | |
| | | |
| | | | | | | | | | | | |
REFINING —% | |
Western Refining, Inc.
Term Loan(b)(l) | |
06/23/23 | | | 5.500% | | | | 750,000 | | | | 729,375 | |
| | | |
| | | | | | | | | | | | |
RETAILERS —% | |
Advantage Sales & Marketing, Inc.
1st Lien Term Loan(b)(l) | |
07/23/21 | | | 4.250% | | | | 498,731 | | | | 494,617 | |
|
Rite Aid Corp.
Tranche 1 2nd Lien Term Loan(b)(l) | |
08/21/20 | | | 5.750% | | | | 148,000 | | | | 148,324 | |
| | | | | | | | | | | | | |
Total | | | | | | | | | | | 642,941 | |
| | | |
| | | | | | | | | | | | |
| | | | | | | | | | | | |
| Senior Loans (continued) | |
| Borrower | | Weighted
Average
Coupon | | | Principal
Amount ($) | | | Value ($) | |
SUPERMARKETS —% | |
Albertsons LLC
Tranche B5 Term Loan(b)(l) | |
12/21/22 | | | 4.750% | | | | 1,250,000 | | | | 1,256,725 | |
| | | |
Supervalu, Inc.
Term Loan(b)(l) | | | | | | | | | | | | |
03/21/19 | | | 5.500% | | | | 699,227 | | | | 699,437 | |
| | | | | | | | | | | | | |
Total | | | | | | | | | | | 1,956,162 | |
| | | |
| | | | | | | | | | | | |
TECHNOLOGY 0.2% | |
Avago Technologies Ltd.
Tranche B3 Term Loan(b)(l) | |
02/01/23 | | | 3.508% | | | | 676,410 | | | | 682,234 | |
|
BMC Software Finance, Inc.
Term Loan(b)(l) | |
09/10/20 | | | 5.000% | | | | 498,674 | | | | 475,506 | |
|
Dell International LLC(b)(c)(l)
Tranche B2 Term Loan | |
07/17/23 | | | 4.000% | | | | 1,000,000 | | | | 1,005,360 | |
Tranche C Term Loan | |
12/31/18 | | | 2.436% | | | | 3,400,000 | | | | 3,335,638 | |
|
First Data Corp.(b)(l)
Term Loan | |
03/24/21 | | | 4.522% | | | | 957,608 | | | | 962,042 | |
07/08/22 | | | 4.272% | | | | 1,500,000 | | | | 1,504,125 | |
|
TransUnion LLC
Tranche B2 Term Loan(b)(l) | |
04/09/21 | | | 3.500% | | | | 448,090 | | | | 449,398 | |
|
Western Digital Corp.
Tranche B1 Term Loan(b)(l) | |
04/29/23 | | | 4.500% | | | | 600,000 | | | | 603,108 | |
| | | | | | | | | | | | | |
Total | | | | | | | | | | | 9,017,411 | |
| | | |
| | | | | | | | | | | | |
TRANSPORTATION SERVICES 0.1% | |
OSG International, Inc.
Term Loan(b)(l) | |
08/05/19 | | | 5.750% | | �� | | 1,445,334 | | | | 1,432,688 | |
|
XPO Logistics, Inc.
Term Loan(b)(c)(l) | |
10/30/21 | | | 4.250% | | | | 1,350,000 | | | | 1,355,913 | |
| | | | | | | | | | | | | |
Total | | | | | | | | | | | 2,788,601 | |
| | | |
| | | | | | | | | | | | |
WIRELESS —% | |
SBA Senior Finance II LLC
Tranche B1 Term Loan(b)(l) | |
03/24/21 | | | 3.250% | | | | 997,455 | | | | 995,650 | |
| | | |
| | | | | | | | | | | | |
WIRELINES 0.1% | |
LTS Buyer LLC
Tranche B 1st Lien Term Loan(b)(l) | |
04/13/20 | | | 4.000% | | | | 1,246,787 | | | | 1,244,842 | |
The accompanying Notes to Financial Statements are an integral part of this statement.
| | | | | | |
| | |
| | | | ACTIVE PORTFOLIOS® MULTI-MANAGER TOTAL RETURN BOND FUND | | |
PORTFOLIO OF INVESTMENTS (continued)
August 31, 2016
| | | | | | | | | | | | |
| Senior Loans (continued) | |
| Borrower | | Weighted
Average
Coupon | | | Principal
Amount ($) | | | Value ($) | |
Level 3 Financing, Inc.
Tranche B3 Term Loan(b)(l) | |
08/01/19 | | | 4.000% | | | | 1,500,000 | | | | 1,506,255 | |
| | | | | | | | | | | | | |
Total | | | | | | | | | | | 2,751,097 | |
| | | | | | | | | | | | | |
Total Senior Loans | | | | | | | | | |
(Cost: $42,449,948) | | | | | | | | 41,760,327 | |
| | | |
| | | | | | | | | | | | |
| Common Stocks —% | |
| Issuer | | | | | Shares | | | Value ($) | |
ENERGY —% | |
Oil, Gas & Consumable Fuels —% | |
Lone Pine Resources Canada Ltd.(f)(m) | | | | | | | 3,118 | | | | 5,893 | |
| | | |
Lone Pine Resources, Inc., Class A(e)(f)(m) | | | | | | | 3,118 | | | | — | |
| | | | | | | | | | | | | |
Total | | | | | | | | | | | 5,893 | |
| | | | | | | | | | | | | |
Total Energy | | | | 5,893 | |
| | | | | | | | | | | | | |
Total Common Stocks | | | | | | | | | |
(Cost: $7,499) | | | | | | | | 5,893 | |
| | | |
| | | | | | | | | | | | |
| Fixed-Income Funds 1.1% | |
| | | | | | Shares | | | Value ($) | |
INVESTMENT GRADE 1.1% | |
Columbia Mortgage Opportunities Fund, Class I Shares(n) | | | | | | | 7,407,460 | | | | 72,593,104 | |
| | | | | | | | | | | | | |
Total Fixed-Income Funds | | | | | |
(Cost: $72,571,046) | | | | | | | | 72,593,104 | |
| | | | | | | | | | | | |
| Treasury Bills 0.5% | |
| Issuer | | Effective
Yield | | | Principal
Amount ($) | | | Value ($) | |
UNITED STATES 0.5% | |
U.S. Treasury Bills(p) | | | | | | | | | | | | |
09/15/16 | | | 0.290% | | | | 871,000 | | | | 870,898 | |
09/29/16 | | | 0.230% | | | | 100,000 | | | | 99,982 | |
| | | |
U.S. Treasury Bills | | | | | | | | | | | | |
11/25/16 | | | 0.300% | | | | 20,215,000 | | | | 20,200,546 | |
01/12/17 | | | 0.360% | | | | 10,370,000 | | | | 10,356,322 | |
| | | | | | | | | | | | | |
Total | | | | | | | | | | | 31,527,748 | |
| | | | | | | | | | | | | |
Total Treasury Bills | | | | | | | | | |
(Cost: $31,520,242) | | | | | | | | 31,527,748 | |
| | | |
| | | | | | | | | | | | |
| Money Market Funds 5.6% | |
| | | | | | Shares | | | Value ($) | |
| | |
Columbia Short-Term Cash Fund, 0.415%(n)(o) | | | | 370,397,057 | | | | 370,397,057 | |
| | | | | | | | | | | | | |
Total Money Market Funds | | | | | | | | | |
(Cost: $370,397,057) | | | | | | | | 370,397,057 | |
| | | | | | | | | | | | | |
Total Investments | | | | | |
(Cost: $7,033,389,933) | | | | | | | | 7,190,052,623 | |
| | | | | | | | | | | | | |
Other Assets & Liabilities, Net | | | | (575,373,009 | ) |
| | | | | | | | | | | | | |
Net Assets | | | | | | | | | | | 6,614,679,614 | |
| | | | | | | | | | | | | |
At August 31, 2016, securities and cash totaling $48,892,251 were pledged as collateral.
Investments in Derivatives
Forward Foreign Currency Exchange Contracts Open at August 31, 2016
| | | | | | | | | | | | | | | | | | | | | | | | | | | | |
| Counterparty | | Exchange
Date | | | Currency to
be Delivered | | | Currency to
be Received | | | Unrealized
Appreciation ($) | | | Unrealized
Depreciation ($) | |
Barclays | | | 09/19/2016 | | | | 457,000 | | | | EUR | | | | 515,260 | | | | USD | | | | 5,108 | | | | — | |
The accompanying Notes to Financial Statements are an integral part of this statement.
| | | | | | |
| | |
| | | | ACTIVE PORTFOLIOS® MULTI-MANAGER TOTAL RETURN BOND FUND | | |
PORTFOLIO OF INVESTMENTS (continued)
August 31, 2016
Futures Contracts Outstanding at August 31, 2016
Long Futures Contracts Outstanding
| | | | | | | | | | | | | | | | | | | | | | | | |
| Contract Description | | Number of
Contracts | | | Trading
Currency | | | Notional Market
Value ($) | | | Expiration Date | | | Unrealized
Appreciation ($) | | | Unrealized
(Depreciation) ($) | |
U.S. Long Bond | | | 40 | | | | USD | | | | 6,815,000 | | | | 12/2016 | | | | — | | | | (19,309 | ) |
U.S. Treasury 10-Year Note | | | 1,645 | | | | USD | | | | 215,366,484 | | | | 12/2016 | | | | — | | | | (518,586 | ) |
U.S. Treasury 2-Year Note | | | 395 | | | | USD | | | | 86,233,438 | | | | 12/2016 | | | | 33,936 | | | | — | |
U.S. Treasury 2-Year Note | | | 317 | | | | USD | | | | 69,205,063 | | | | 12/2016 | | | | — | | | | (54,754 | ) |
U.S. Treasury 5-Year Note | | | 763 | | | | USD | | | | 92,513,750 | | | | 12/2016 | | | | — | | | | (287,278 | ) |
U.S. Treasury 5-Year Note | | | 1,779 | | | | USD | | | | 215,703,750 | | | | 12/2016 | | | | — | | | | (419,177 | ) |
U.S. Treasury 5-Year Note | | | 3,836 | | | | USD | | | | 465,115,000 | | | | 12/2016 | | | | — | | | | (814,423 | ) |
U.S. Ultra Bond | | | 386 | | | | USD | | | | 72,362,938 | | | | 12/2016 | | | | 140,293 | | | | — | |
| | | | | | | | | | | | | | | | | | | | | | | | | |
Total | | | | | | | | | | | 1,223,315,423 | | | | | | | | 174,229 | | | | (2,113,527 | ) |
| | | | | | | | | | | | | | | | | | | | | | | | | |
Short Futures Contracts Outstanding
| | | | | | | | | | | | | | | | | | | | | | | | |
| Contract Description | | Number of
Contracts | | | Trading
Currency | | | Notional Market
Value ($) | | | Expiration Date | | | Unrealized
Appreciation ($) | | | Unrealized
(Depreciation) ($) | |
U.S. Long Bond | | | (4 | ) | | | USD | | | | (681,500 | ) | | | 12/2016 | | | | 1,649 | | | | — | |
U.S. Treasury 10-Year Note | | | (209 | ) | | | USD | | | | (27,362,672 | ) | | | 12/2016 | | | | 8,962 | | | | — | |
U.S. Treasury 10-Year Note | | | (19 | ) | | | USD | | | | (2,487,516 | ) | | | 12/2016 | | | | 6,790 | | | | — | |
U.S. Treasury 2-Year Note | | | (50 | ) | | | USD | | | | (10,915,625 | ) | | | 12/2016 | | | | 3,893 | | | | — | |
U.S. Treasury 2-Year Note | | | (121 | ) | | | USD | | | | (26,415,813 | ) | | | 12/2016 | | | | 1,661 | | | | — | |
U.S. Treasury 2-Year Note | | | (593 | ) | | | USD | | | | (129,459,313 | ) | | | 12/2016 | | | | — | | | | (131,722 | ) |
U.S. Treasury Ultra 10-Year Note | | | (367 | ) | | | USD | | | | (52,985,625 | ) | | | 12/2016 | | | | 5,008 | | | | — | |
U.S. Treasury Ultra 10-Year Note | | | (146 | ) | | | USD | | | | (21,078,750 | ) | | | 12/2016 | | | | 3,761 | | | | — | |
U.S. Ultra Bond | | | (117 | ) | | | USD | | | | (21,933,844 | ) | | | 12/2016 | | | | — | | | | (53,617 | ) |
| | | | | | | | | | | | | | | | | | | | | | | | | |
Total | | | | | | | | | | | (293,320,658 | ) | | | | | | | 31,724 | | | | (185,339 | ) |
| | | | | | | | | | | | | | | | | | | | | | | | | |
Credit Default Swap Contracts Outstanding at August 31, 2016
Buy Protection
| | | | | | | | | | | | | | | | | | | | | | | | | | | | | | | | | | | | | | | | |
| Counterparty | | Reference
Entity | | Expiration
Date | | Pay
Fixed
Rate (%) | | | Notional
Currency | | | Notional
Amount | | | Market
Value
($) | | | Premium
Paid
($) | | | Premium
Received
($) | | | Periodic
Payments
Receivable
(Payable)
($) | | | Unrealized
Appreciation
($) | | | Unrealized
Depreciation
($) | |
Barclays | | American International Group, Inc. | | 06/20/2021 | | | 1.000 | | | | USD | | | | 4,325,000 | | | | (62,773 | ) | | | — | | | | (37,746 | ) | | | (8,770 | ) | | | — | | | | (33,797 | ) |
| | | | | | | | | | | |
Barclays | | Electricite de France SA | | 06/20/2021 | | | 1.000 | | | | USD | | | | 2,635,000 | | | | (37,740 | ) | | | — | | | | (27,841 | ) | | | (5,343 | ) | | | — | | | | (15,242 | ) |
| | | | | | | | | | | |
Barclays | | Electricite de France SA | | 06/20/2021 | | | 1.000 | | | | USD | | | | 3,515,000 | | | | (50,344 | ) | | | — | | | | (45,267 | ) | | | (7,128 | ) | | | — | | | | (12,205 | ) |
| | | | | | | | | | | |
Barclays | | Goldman Sachs Group, Inc. | | 06/20/2021 | | | 1.000 | | | | USD | | | | 1,670,000 | | | | (9,726 | ) | | | 19,573 | | | | — | | | | (3,386 | ) | | | — | | | | (32,685 | ) |
| | | | | | | | | | | |
Barclays | | Goldman Sachs Group, Inc. | | 06/20/2021 | | | 1.000 | | | | USD | | | | 4,400,000 | | | | (25,627 | ) | | | 4,006 | | | | — | | | | (8,922 | ) | | | — | | | | (38,555 | ) |
| | | | | | | | | | | |
Barclays | | Home Depot, Inc. | | 06/20/2021 | | | 1.000 | | | | USD | | | | 12,600,000 | | | | (454,728 | ) | | | — | | | | (417,588 | ) | | | (25,550 | ) | | | — | | | | (62,690 | ) |
| | | | | | | | | | | |
Barclays | | International Business Machines Corp. | | 06/20/2021 | | | 1.000 | | | | USD | | | | 1,670,000 | | | | (39,745 | ) | | | — | | | | (32,420 | ) | | | (3,386 | ) | | | — | | | | (10,711 | ) |
| | | | | | | | | | | |
Barclays | | Morgan Stanley | | 06/20/2021 | | | 1.000 | | | | USD | | | | 3,450,000 | | | | (24,933 | ) | | | — | | | | (1,571 | ) | | | (6,995 | ) | | | — | | | | (30,357 | ) |
| | | | | | | | | | | |
Barclays | | Viacom, Inc. | | 06/20/2021 | | | 1.000 | | | | USD | | | | 1,805,000 | | | | 852 | | | | 75,876 | | | | — | | | | (3,661 | ) | | | — | | | | (78,685 | ) |
| | | | | | | | | | | |
Citi | | American International Group, Inc. | | 06/20/2021 | | | 1.000 | | | | USD | | | | 4,400,000 | | | | (63,861 | ) | | | — | | | | (36,356 | ) | | | (8,922 | ) | | | — | | | | (36,427 | ) |
| | | | | | | | | | | |
Citi | | American
International
Group, Inc. | | 06/20/2021 | | | 1.000 | | | | USD | | | | 4,400,000 | | | | (63,861 | ) | | | — | | | | (38,383 | ) | | | (8,922 | ) | | | — | | | | (34,400 | ) |
| | | | | | | | | | | |
Citi | | Bank of America Corp. | | 06/20/2021 | | | 1.000 | | | | USD | | | | 3,450,000 | | | | (44,377 | ) | | | — | | | | (33,220 | ) | | | (6,996 | ) | | | — | | | | (18,153 | ) |
The accompanying Notes to Financial Statements are an integral part of this statement.
| | | | | | |
| | |
| | | | ACTIVE PORTFOLIOS® MULTI-MANAGER TOTAL RETURN BOND FUND | | |
PORTFOLIO OF INVESTMENTS (continued)
August 31, 2016
Buy Protection (continued)
| | | | | | | | | | | | | | | | | | | | | | | | | | | | | | | | | | | | | | | | |
| Counterparty | | Reference
Entity | | Expiration
Date | | Pay
Fixed
Rate (%) | | | Notional
Currency | | | Notional
Amount | | | Market
Value
($) | | | Premium
Paid
($) | | | Premium
Received
($) | | | Periodic
Payments
Receivable
(Payable)
($) | | | Unrealized
Appreciation
($) | | | Unrealized
Depreciation
($) | |
Citi | | Bank of America Corp. | | 06/20/2021 | | | 1.000 | | | | USD | | | | 3,520,000 | | | | (45,277 | ) | | | — | | | | (25,850 | ) | | | (7,138 | ) | | | — | | | | (26,565 | ) |
| | | | | | | | | | | |
Citi | | Campbell Soup Co. | | 06/20/2021 | | | 1.000 | | | | USD | | | | 4,050,000 | | | | (126,716 | ) | | | — | | | | (116,753 | ) | | | (8,213 | ) | | | — | | | | (18,176 | ) |
| | | | | | | | | | | |
Citi | | D.R. Horton, Inc. | | 06/20/2021 | | | 1.000 | | | | USD | | | | 4,850,000 | | | | (11,318 | ) | | | 13,219 | | | | — | | | | (9,835 | ) | | | — | | | | (34,372 | ) |
| | | | | | | | | | | |
Citi | | Energy Transfer
Partners, LP | | 12/20/2020 | | | 1.000 | | | | USD | | | | 810,000 | | | | 33,901 | | | | 44,833 | | | | — | | | | (1,643 | ) | | | — | | | | (12,575 | ) |
| | | | | | | | | | | |
Citi | | Goldman Sachs
Group, Inc. | | 12/20/2020 | | | 1.000 | | | | USD | | | | 1,770,000 | | | | (14,893 | ) | | | 4,318 | | | | — | | | | (3,589 | ) | | | — | | | | (22,800 | ) |
| | | | | | | | | | | |
Citi | | Home Depot, Inc. | | 06/20/2021 | | | 1.000 | | | | USD | | | | 8,990,000 | | | | (324,445 | ) | | | — | | | | (288,697 | ) | | | (18,230 | ) | | | — | | | | (53,978 | ) |
| | | | | | | | | | | |
Citi | | International
Business
Machines Corp. | | 06/20/2021 | | | 1.000 | | | | USD | | | | 1,725,000 | | | | (41,054 | ) | | | — | | | | (32,725 | ) | | | (3,498 | ) | | | — | | | | (11,827 | ) |
| | | | | | | | | | | |
Citi | | Kinder Morgan, Inc. | | 12/20/2020 | | | 1.000 | | | | USD | | | | 1,615,000 | | | | 52,448 | | | | 126,048 | | | | — | | | | (3,275 | ) | | | — | | | | (76,875 | ) |
| | | | | | | | | | | |
Citi | | Markit CDX
Emerging Markets
Index, Series 25 | | 06/20/2021 | | | 1.000 | | | | USD | | | | 16,685,000 | | | | 1,073,257 | | | | 1,285,395 | | | | — | | | | (33,833 | ) | | | — | | | | (245,971 | ) |
| | | | | | | | | | | |
Citi | | Markit CDX
Emerging Markets
Index, Series 25 | | 06/20/2021 | | | 1.000 | | | | USD | | | | 11,685,000 | | | | 751,634 | | | | 878,039 | | | | — | | | | (23,695 | ) | | | — | | | | (150,100 | ) |
| | | | | | | | | | | |
Citi | | McDonald’s Corp. | | 06/20/2021 | | | 1.000 | | | | USD | | | | 4,750,000 | | | | (140,430 | ) | | | — | | | | (151,580 | ) | | | (9,632 | ) | | | 1,518 | | | | — | |
| | | | | | | | | | | |
Citi | | Morgan Stanley | | 06/20/2021 | | | 1.000 | | | | USD | | | | 4,320,000 | | | | (31,220 | ) | | | — | | | | (15,772 | ) | | | (8,761 | ) | | | — | | | | (24,209 | ) |
| | | | | | | | | | | |
Citi | | Morgan Stanley | | 06/20/2021 | | | 1.000 | | | | USD | | | | 1,725,000 | | | | (12,466 | ) | | | — | | | | (3,929 | ) | | | (3,498 | ) | | | — | | | | (12,035 | ) |
| | | | | | | | | | | |
Citi | | Morgan Stanley | | 06/20/2021 | | | 1.000 | | | | USD | | | | 4,400,000 | | | | (31,799 | ) | | | 4,006 | | | | — | | | | (8,922 | ) | | | — | | | | (44,727 | ) |
| | | | | | | | | | | |
Citi | | Nordstrom, Inc. | | 06/20/2021 | | | 1.000 | | | | USD | | | | 4,190,000 | | | | 65,771 | | | | 167,961 | | | | — | | | | (8,496 | ) | | | — | | | | (110,686 | ) |
| | | | | | | | | | | |
Citi | | Nordstrom, Inc. | | 06/20/2021 | | | 1.000 | | | | USD | | | | 3,340,000 | | | | 52,429 | | | | 145,858 | | | | — | | | | (6,773 | ) | | | — | | | | (100,202 | ) |
| | | | | | | | | | | |
Citi | | Viacom, Inc. | | 06/20/2021 | | | 1.000 | | | | USD | | | | 5,010,000 | | | | 2,364 | | | | 111,366 | | | | — | | | | (10,159 | ) | | | — | | | | (119,161 | ) |
| | | | | | | | | | | |
Credit Suisse | | Goldman Sachs
Group, Inc. | | 12/20/2020 | | | 1.000 | | | | USD | | | | 1,785,000 | | | | (15,019 | ) | | | 44,218 | | | | — | | | | (3,620 | ) | | | — | | | | (62,857 | ) |
| | | | | | | | | | | |
Credit Suisse | | Goldman Sachs
Group, Inc. | | 06/20/2021 | | | 1.000 | | | | USD | | | | 835,000 | | | | (4,863 | ) | | | 6,791 | | | | — | | | | (1,693 | ) | | | — | | | | (13,347 | ) |
| | | | | | | | | | | |
Goldman Sachs International | | Barclays Bank, PLC | | 12/20/2020 | | | 1.000 | | | | USD | | | | 8,360,000 | | | | (40,383 | ) | | | — | | | | (144,364 | ) | | | (16,953 | ) | | | 87,028 | | | | — | |
| | | | | | | | | | | |
Goldman Sachs International | | Bank of America Corp. | | 06/20/2021 | | | 1.000 | | | | USD | | | | 8,625,000 | | | | (110,943 | ) | | | — | | | | (59,206 | ) | | | (17,490 | ) | | | — | | | | (69,227 | ) |
| | | | | | | | | | | |
Goldman Sachs International | | Citigroup, Inc. | | 06/20/2021 | | | 1.000 | | | | USD | | | | 7,210,000 | | | | (80,182 | ) | | | 13,052 | | | | — | | | | (14,620 | ) | | | — | | | | (107,854 | ) |
| | | | | | | | | | | |
Goldman Sachs International | | Citigroup, Inc. | | 06/20/2021 | | | 1.000 | | | | USD | | | | 12,940,000 | | | | (143,906 | ) | | | — | | | | (100,704 | ) | | | (26,239 | ) | | | — | | | | (69,441 | ) |
| | | | | | | | | | | |
Goldman Sachs International | | Citigroup, Inc. | | 06/20/2021 | | | 1.000 | | | | USD | | | | 8,625,000 | | | | (95,918 | ) | | | — | | | | (59,206 | ) | | | (17,490 | ) | | | — | | | | (54,202 | ) |
| | | | | | | | | | | |
Goldman Sachs International | | D.R. Horton, Inc. | | 06/20/2021 | | | 1.000 | | | | USD | | | | 9,510,000 | | | | (22,193 | ) | | | 8,644 | | | | — | | | | (19,284 | ) | | | — | | | | (50,121 | ) |
| | | | | | | | | | | |
Goldman Sachs International | | Electricite de
France SA | | 06/20/2021 | | | 1.000 | | | | USD | | | | 9,655,000 | | | | (138,284 | ) | | | — | | | | (124,388 | ) | | | (19,578 | ) | | | — | | | | (33,474 | ) |
| | | | | | | | | | | |
Goldman Sachs International | | HSBC
Holdings PLC | | 12/20/2020 | | | 1.000 | | | | USD | | | | 3,590,000 | | | | 46,832 | | | | 228,449 | | | | — | | | | (7,280 | ) | | | — | | | | (188,897 | ) |
| | | | | | | | | | | |
Goldman Sachs International | | JPMorgan | | 06/20/2021 | | | 1.000 | | | | USD | | | | 8,635,000 | | | | (180,694 | ) | | | — | | | | (159,683 | ) | | | (17,510 | ) | | | — | | | | (38,521 | ) |
| | | | | | | | | | | |
Goldman Sachs International | | JPMorgan | | 06/20/2021 | | | 1.000 | | | | USD | | | | 4,395,000 | | | | (91,969 | ) | | | — | | | | (71,061 | ) | | | (8,912 | ) | | | — | | | | (29,820 | ) |
| | | | | | | | | | | |
Goldman Sachs International | | JPMorgan | | 06/20/2021 | | | 1.000 | | | | USD | | | | 4,400,000 | | | | (92,074 | ) | | | — | | | | (65,000 | ) | | | (8,922 | ) | | | — | | | | (35,996 | ) |
The accompanying Notes to Financial Statements are an integral part of this statement.
| | | | | | |
| | |
| | | | ACTIVE PORTFOLIOS® MULTI-MANAGER TOTAL RETURN BOND FUND | | |
PORTFOLIO OF INVESTMENTS (continued)
August 31, 2016
Buy Protection (continued)
| | | | | | | | | | | | | | | | | | | | | | | | | | | | | | | | | | | | | | | | |
| Counterparty | | Reference
Entity | | Expiration
Date | | Pay
Fixed
Rate (%) | | | Notional
Currency | | | Notional
Amount | | | Market
Value
($) | | | Premium
Paid
($) | | | Premium
Received
($) | | | Periodic
Payments
Receivable
(Payable)
($) | | | Unrealized
Appreciation
($) | | | Unrealized
Depreciation
($) | |
Goldman Sachs International | | JPMorgan | | 06/20/2021 | | | 1.000 | | | | USD | | | | 4,400,000 | | | | (92,074 | ) | | | — | | | | (64,984 | ) | | | (8,922 | ) | | | — | | | | (36,012 | ) |
| | | | | | | | | | | |
Goldman Sachs International | | Lloyds Bank | | 12/20/2020 | | | 1.000 | | | | USD | | | | 1,795,000 | | | | 46,968 | | | | 96,231 | | | | — | | | | (3,639 | ) | | | — | | | | (52,902 | ) |
| | | | | | | | | | | |
Goldman Sachs International | | McDonald’s Corp. | | 06/20/2021 | | | 1.000 | | | | USD | | | | 5,840,000 | | | | (172,655 | ) | | | — | | | | (183,547 | ) | | | (11,842 | ) | | | — | | | | (950 | ) |
| | | | | | | | | | | |
Goldman Sachs International | | Morgan Stanley | | 12/20/2020 | | | 1.000 | | | | USD | | | | 1,735,000 | | | | (16,421 | ) | | | 3,508 | | | | — | | | | (3,518 | ) | | | — | | | | (23,447 | ) |
| | | | | | | | | | | |
Goldman Sachs International | | Morgan Stanley | | 12/20/2020 | | | 1.000 | | | | USD | | | | 1,770,000 | | | | (16,752 | ) | | | 4,318 | | | | — | | | | (3,589 | ) | | | — | | | | (24,659 | ) |
| | | | | | | | | | | |
Goldman Sachs International | | Morgan Stanley | | 12/20/2020 | | | 1.000 | | | | USD | | | | 3,550,000 | | | | (33,600 | ) | | | 28,816 | | | | — | | | | (7,199 | ) | | | — | | | | (69,615 | ) |
| | | | | | | | | | | |
Goldman Sachs International | | Morgan Stanley | | 12/20/2020 | | | 1.000 | | | | USD | | | | 3,580,000 | | | | (33,884 | ) | | | 40,568 | | | | — | | | | (7,259 | ) | | | — | | | | (81,711 | ) |
| | | | | | | | | | | |
Goldman Sachs International | | Morgan Stanley | | 06/20/2021 | | | 1.000 | | | | USD | | | | 8,355,000 | | | | (60,381 | ) | | | 71,692 | | | | — | | | | (16,942 | ) | | | — | | | | (149,015 | ) |
| | | | | | | | | | | |
Goldman Sachs International | | Morgan Stanley | | 06/20/2021 | | | 1.000 | | | | USD | | | | 1,670,000 | | | | (12,069 | ) | | | 12,828 | | | | — | | | | (3,387 | ) | | | — | | | | (28,284 | ) |
| | | | | | | | | | | |
Goldman Sachs International | | Morgan Stanley | | 06/20/2021 | | | 1.000 | | | | USD | | | | 8,355,000 | | | | (60,381 | ) | | | 94,193 | | | | — | | | | (16,942 | ) | | | — | | | | (171,516 | ) |
| | | | | | | | | | | |
Goldman Sachs International | | Morgan Stanley | | 06/20/2021 | | | 1.000 | | | | USD | | | | 4,400,000 | | | | (31,799 | ) | | | — | | | | — | | | | (8,922 | ) | | | — | | | | (40,721 | ) |
| | | | | | | | | | | |
Goldman Sachs International | | Morgan Stanley | | 06/20/2021 | | | 1.000 | | | | USD | | | | 7,920,000 | | | | (57,237 | ) | | | — | | | | — | | | | (16,060 | ) | | | — | | | | (73,297 | ) |
| | | | | | | | | | | |
Goldman Sachs International | | Textron, Inc. | | 06/20/2021 | | | 1.000 | | | | USD | | | | 3,595,000 | | | | (14,761 | ) | | | — | | | | — | | | | (7,290 | ) | | | — | | | | (22,051 | ) |
| | | | | | | | | | | |
Goldman Sachs International | | Textron, Inc. | | 06/20/2021 | | | 1.000 | | | | USD | | | | 4,500,000 | | | | (18,477 | ) | | | — | | | | — | | | | (9,125 | ) | | | — | | | | (27,602 | ) |
| | | | | | | | | | | |
Goldman Sachs International | | Walt Disney Co. (The) | | 06/20/2021 | | | 1.000 | | | | USD | | | | 4,170,000 | | | | (160,303 | ) | | | — | | | | (153,487 | ) | | | (8,456 | ) | | | — | | | | (15,272 | ) |
| | | | | | | | | | | |
Goldman Sachs International | | Weyerhaeuser Co. | | 06/20/2021 | | | 1.000 | | | | USD | | | | 1,755,000 | | | | (25,779 | ) | | | — | | | | (24,255 | ) | | | (3,559 | ) | | | — | | | | (5,083 | ) |
| | | | | | | | | | | |
JPMorgan | | American International Group, Inc. | | 06/20/2021 | | | 1.000 | | | | USD | | | | 3,450,000 | | | | (50,073 | ) | | | — | | | | (28,440 | ) | | | (6,996 | ) | | | — | | | | (28,629 | ) |
| | | | | | | | | | | |
JPMorgan | | Bank of America Corp. | | 06/20/2021 | | | 1.000 | | | | USD | | | | 6,045,000 | | | | (77,756 | ) | | | — | | | | (52,647 | ) | | | (12,257 | ) | | | — | | | | (37,366 | ) |
| | | | | | | | | | | |
JPMorgan | | Barclays Bank PLC | | 06/20/2021 | | | 1.000 | | | | USD | | | | 1,810,000 | | | | 86,407 | | | | 144,911 | | | | — | | | | (3,670 | ) | | | — | | | | (62,174 | ) |
| | | | | | | | | | | |
JPMorgan | | Campbell Soup Co. | | 06/20/2021 | | | 1.000 | | | | USD | | | | 4,170,000 | | | | (130,471 | ) | | | — | | | | (109,199 | ) | | | (8,456 | ) | | | — | | | | (29,728 | ) |
| | | | | | | | | | | |
JPMorgan | | Citigroup, Inc. | | 12/20/2020 | | | 1.000 | | | | USD | | | | 3,965,000 | | | | (50,001 | ) | | | 6,422 | | | | — | | | | (8,040 | ) | | | — | | | | (64,463 | ) |
| | | | | | | | | | | |
JPMorgan | | Citigroup, Inc. | | 06/20/2021 | | | 1.000 | | | | USD | | | | 6,040,000 | | | | (67,171 | ) | | | — | | | | (41,442 | ) | | | (12,247 | ) | | | — | | | | (37,976 | ) |
| | | | | | | | | | | |
JPMorgan | | Energy Transfer Partners, LP | | 06/20/2021 | | | 1.000 | | | | USD | | | | 905,000 | | | | 47,472 | | | | 132,390 | | | | — | | | | (1,834 | ) | | | — | | | | (86,752 | ) |
| | | | | | | | | | | |
JPMorgan | | General Mills, Inc. | | 06/20/2021 | | | 1.000 | | | | USD | | | | 1,675,000 | | | | (53,210 | ) | | | — | | | | (49,312 | ) | | | (3,397 | ) | | | — | | | | (7,295 | ) |
| | | | | | | | | | | |
JPMorgan | | Goldman Sachs Group, Inc. | | 12/20/2020 | | | 1.000 | | | | USD | | | | 8,315,000 | | | | (69,961 | ) | | | — | | | | (3,379 | ) | | | (16,862 | ) | | | — | | | | (83,444 | ) |
| | | | | | | | | | | |
JPMorgan | | Goldman Sachs Group, Inc. | | 06/20/2021 | | | 1.000 | | | | USD | | | | 7,255,000 | | | | (42,254 | ) | | | 45,654 | | | | — | | | | (14,712 | ) | | | — | | | | (102,620 | ) |
| | | | | | | | | | | |
JPMorgan | | Goldman Sachs Group, Inc. | | 06/20/2021 | | | 1.000 | | | | USD | | | | 4,175,000 | | | | (24,316 | ) | | | 37,694 | | | | — | | | | (8,466 | ) | | | — | | | | (70,476 | ) |
The accompanying Notes to Financial Statements are an integral part of this statement.
| | | | | | |
| | |
| | | | ACTIVE PORTFOLIOS® MULTI-MANAGER TOTAL RETURN BOND FUND | | |
PORTFOLIO OF INVESTMENTS (continued)
August 31, 2016
Buy Protection (continued)
| | | | | | | | | | | | | | | | | | | | | | | | | | | | | | | | | | | | | | | | |
| Counterparty | | Reference
Entity | | Expiration
Date | | Pay
Fixed
Rate (%) | | | Notional
Currency | | | Notional
Amount | | | Market
Value
($) | | | Premium
Paid
($) | | | Premium
Received
($) | | | Periodic
Payments
Receivable
(Payable)
($) | | | Unrealized
Appreciation
($) | | | Unrealized
Depreciation
($) | |
JPMorgan | | Goldman Sachs Group, Inc. | | 06/20/2021 | | | 1.000 | | | | USD | | | | 4,175,000 | | | | (24,316 | ) | | | 48,931 | | | | — | | | | (8,466 | ) | | | — | | | | (81,713 | ) |
| | | | | | | | | | | |
JPMorgan | | Goldman Sachs Group, Inc. | | 06/20/2021 | | | 1.000 | | | | USD | | | | 17,585,000 | | | | (102,417 | ) | | | 39,966 | | | | — | | | | (35,658 | ) | | | — | | | | (178,041 | ) |
| | | | | | | | | | | |
JPMorgan | | International Business Machines Corp. | | 06/20/2021 | | | 1.000 | | | | USD | | | | 3,450,000 | | | | (82,108 | ) | | | — | | | | (62,147 | ) | | | (6,996 | ) | | | — | | | | (26,957 | ) |
| | | | | | | | | | | |
JPMorgan | | Lloyds Bank | | 06/20/2021 | | | 1.000 | | | | USD | | | | 905,000 | | | | 30,559 | | | | 48,745 | | | | — | | | | (1,835 | ) | | | — | | | | (20,021 | ) |
| | | | | | | | | | | |
JPMorgan | | Markit CDX Emerging Markets Index, Series 25 | | 06/20/2021 | | | 1.000 | | | | USD | | | | 5,005,000 | | | | 321,945 | | | | 378,305 | | | | — | | | | (10,149 | ) | | | — | | | | (66,509 | ) |
| | | | | | | | | | | |
JPMorgan | | McDonald’s Corp. | | 06/20/2021 | | | 1.000 | | | | USD | | | | 5,005,000 | | | | (147,969 | ) | | | — | | | | (157,119 | ) | | | (10,149 | ) | | | — | | | | (999 | ) |
| | | | | | | | | | | |
JPMorgan | | Royal Bank of Scotland PLC (The) | | 06/20/2021 | | | 1.000 | | | | USD | | | | 905,000 | | | | 66,887 | | | | 73,929 | | | | — | | | | (1,835 | ) | | | — | | | | (8,877 | ) |
| | | | | | | | | | | |
JPMorgan | | Royal Bank of Scotland PLC (The) | | 06/20/2021 | | | 1.000 | | | | USD | | | | 1,685,000 | | | | 124,535 | | | | 140,301 | | | | — | | | | (3,417 | ) | | | — | | | | (19,183 | ) |
| | | | | | | | | | | |
JPMorgan | | Toll Brothers, Inc. | | 06/20/2021 | | | 1.000 | | | | USD | | | | 10,360,000 | | | | 261,581 | | | | 397,504 | | | | — | | | | (21,008 | ) | | | — | | | | (156,931 | ) |
| | | | | | | | | | | |
Morgan Stanley | | American International Group, Inc. | | 06/20/2021 | | | 1.000 | | | | USD | | | | 1,725,000 | | | | (25,036 | ) | | | — | | | | (17,417 | ) | | | (3,498 | ) | | | — | | | | (11,117 | ) |
| | | | | | | | | | | |
Morgan Stanley | | Citigroup, Inc. | | 12/20/2020 | | | 1.000 | | | | USD | | | | 1,770,000 | | | | (22,321 | ) | | | 5,035 | | | | — | | | | (3,589 | ) | | | — | | | | (30,945 | ) |
| | | | | | | | | | | |
Morgan Stanley | | Eaton Corp. PLC | | 06/20/2021 | | | 1.000 | | | | USD | | | | 1,670,000 | | | | (35,573 | ) | | | — | | | | (35,379 | ) | | | (3,386 | ) | | | — | | | | (3,580 | ) |
| | | | | | | | | | | |
Morgan Stanley | | Goldman Sachs Group, Inc. | | 12/20/2020 | | | 1.000 | | | | USD | | | | 1,910,000 | | | | (16,070 | ) | | | 8,488 | | | | — | | | | (3,873 | ) | | | — | | | | (28,431 | ) |
| | | | | | | | | | | |
Morgan Stanley | | Goldman Sachs Group, Inc. | | 06/20/2021 | | | 1.000 | | | | USD | | | | 2,505,000 | | | | (14,590 | ) | | | 29,358 | | | | — | | | | (5,080 | ) | | | — | | | | (49,028 | ) |
| | | | | | | | | | | |
Morgan Stanley | | Goldman Sachs Group, Inc. | | 06/20/2021 | | | 1.000 | | | | USD | | | | 1,760,000 | | | | (10,250 | ) | | | 802 | | | | — | | | | (3,569 | ) | | | — | | | | (14,621 | ) |
| | | | | | | | | | | |
Morgan Stanley | | International Business Machines Corp. | | 06/20/2021 | | | 1.000 | | | | USD | | | | 3,455,000 | | | | (82,227 | ) | | | — | | | | (65,546 | ) | | | (7,006 | ) | | | — | | | | (23,687 | ) |
| | | | | | | | | | | |
Morgan Stanley | | Kinder Morgan, Inc. | | 06/20/2021 | | | 1.000 | | | | USD | | | | 1,810,000 | | | | 78,392 | | | | 180,615 | | | | — | | | | (3,670 | ) | | | — | | | | (105,893 | ) |
| | | | | | | | | | | |
Morgan Stanley | | Nucor Corp. | | 06/20/2021 | | | 1.000 | | | | USD | | | | 4,780,000 | | | | (6,307 | ) | | | 53,552 | | | | — | | | | (9,693 | ) | | | — | | | | (69,552 | ) |
| | | | | | | | | | | |
Morgan Stanley | | Valero Energy Corp. | | 06/20/2021 | | | 1.000 | | | | USD | | | | 1,725,000 | | | | 38,884 | | | | 65,252 | | | | — | | | | (3,498 | ) | | | — | | | | (29,866 | ) |
| | | | | | | | | | | |
Morgan Stanley | | Valero Energy Corp. | | 06/20/2021 | | | 1.000 | | | | USD | | | | 3,520,000 | | | | 79,346 | | | | 115,218 | | | | — | | | | (7,138 | ) | | | — | | | | (43,010 | ) |
| | | | | | | | | | | |
Morgan Stanley | | Valero Energy Corp. | | 06/20/2021 | | | 1.000 | | | | USD | | | | 2,640,000 | | | | 59,510 | | | | 89,810 | | | | — | | | | (5,353 | ) | | | — | | | | (35,653 | ) |
| | | | | | | | | | | | | | | | | | | | | | | | | | | | | | | | | | | | | | | | | |
Total | | | | | | | | | | | | | | | | | | | 5,576,688 | | | | (3,137,610 | ) | | | | | | | 88,546 | | | | (4,659,597 | ) |
| | | | | | | | | | | | | | | | | | | | | | | | | | | | | | | | | | | | | |
The accompanying Notes to Financial Statements are an integral part of this statement.
| | | | | | |
| | |
| | | | ACTIVE PORTFOLIOS® MULTI-MANAGER TOTAL RETURN BOND FUND | | |
PORTFOLIO OF INVESTMENTS (continued)
August 31, 2016
Cleared Credit Default Swap Contracts Outstanding at August 31, 2016
Buy Protection
| | | | | | | | | | | | | | | | | | | | | | | | |
| Counterparty | | Reference
Entity | | Expiration
Date | | | Pay Fixed
Rate (%) | | | Notional
Currency | | Notional
Amount | | | Unrealized
Appreciation
($) | | | Unrealized
Depreciation
($) | |
Morgan Stanley | | Markit CDX North America High Yield Index, Series 26 | | | 06/20/2021 | | | | 5.000 | | | USD | | | 17,935,000 | | | | — | | | | (735,086) | |
| | | | | | | |
Morgan Stanley | | Markit CDX North America Investment Grade Index, Series 26 | | | 06/20/2021 | | | | 1.000 | | | USD | | | 52,645,000 | | | | — | | | | (393,396) | |
| | | | | | | |
Morgan Stanley | | Markit iTraxx Europe Crossover Index, Series 25 | | | 06/20/2021 | | | | 5.000 | | | EUR | | | 8,360,000 | | | | — | | | | (459,718) | |
| | | | | | | | | | | | | | | | | | | | | | | | | |
Total | | | | | | | | | | | | | — | | | | (1,588,200) | |
| | | | | | | | | | | | | | | | | | | |
Credit Default Swap Contracts Outstanding at August 31, 2016
Sell Protection
| | | | | | | | | | | | | | | | | | | | | | | | | | | | | | | | | | | | | | | | | | | | |
| Counterparty | | Reference
Entity | | Expiration
Date | | Receive
Fixed
Rate (%) | | | Implied
Credit
Spread (%)* | | | Notional
Currency | | | Notional
Amount | | | Market
Value
($) | | | Premium
Paid
($) | | | Premium
Received
($) | | | Periodic
Payments
Receivable
(Payable)
($) | | | Unrealized
Appreciation
($) | | | Unrealized
Depreciation
($) | |
Barclays | | Anadarko Petroleum Corp. | | 12/20/2020 | | | 1.000 | | | | 1.940 | | | | USD | | | | (3,615,000 | ) | | | (138,495 | ) | | | — | | | | (310,539 | ) | | | 7,330 | | | | 179,374 | | | | — | |
| | | | | | | | | | | | |
Barclays | | Anadarko Petroleum Corp. | | 06/20/2021 | | | 1.000 | | | | 2.082 | | | | USD | | | | (1,810,000 | ) | | | (87,913 | ) | | | — | | | | (191,631 | ) | | | 3,670 | | | | 107,388 | | | | — | |
| | | | | | | | | | | | |
Barclays | | Bank of America Corp. | | 06/20/2018 | | | 1.000 | | | | 0.389 | | | | USD | | | | (8,445,000 | ) | | | 93,274 | | | | 92,339 | | | | — | | | | 17,125 | | | | 18,060 | | | | — | |
| | | | | | | | | | | | |
Barclays | | Canadian Natural Resources Ltd. | | 12/20/2020 | | | 1.000 | | | | 1.913 | | | | USD | | | | (1,810,000 | ) | | | (67,572 | ) | | | — | | | | (191,606 | ) | | | 3,670 | | | | 127,704 | | | | — | |
| | | | | | | | | | | | |
Barclays | | Citigroup, Inc. | | 06/20/2018 | | | 1.000 | | | | 0.418 | | | | USD | | | | (8,355,000 | ) | | | 87,870 | | | | 76,351 | | | | — | | | | 16,942 | | | | 28,461 | | | | — | |
| | | | | | | | | | | | |
Credit Suisse | | Markit CMBX North America Index, Series 7 BBB- | | 01/17/2047 | | | 3.000 | | | | 4.496 | | | | USD | | | | (4,000,000 | ) | | | (352,500 | ) | | | — | | | | (311,193 | ) | | | 2,333 | | | | — | | | | (38,974 | ) |
| | | | | | | | | | | | |
Credit Suisse | | Markit CMBX North America Index, Series 7 BBB- | | 01/17/2047 | | | 3.000 | | | | 4.496 | | | | USD | | | | (4,500,000 | ) | | | (396,563 | ) | | | — | | | | (394,360 | ) | | | 2,626 | | | | 423 | | | | — | |
| | | | | | | | | | | | |
Goldman Sachs International | | Anadarko Petroleum Corp. | | 12/20/2020 | | | 1.000 | | | | 1.940 | | | | USD | | | | (1,800,000 | ) | | | (68,961 | ) | | | — | | | | (170,062 | ) | | | 3,650 | | | | 104,751 | | | | — | |
| | | | | | | | | | | | |
Goldman Sachs International | | Anadarko Petroleum Corp. | | 12/20/2020 | | | 1.000 | | | | 1.940 | | | | USD | | | | (1,810,000 | ) | | | (69,344 | ) | | | — | | | | (170,744 | ) | | | 3,670 | | | | 105,070 | | | | — | |
| | | | | | | | | | | | |
Goldman Sachs International | | Anadarko Petroleum Corp. | | 12/20/2020 | | | 1.000 | | | | 1.940 | | | | USD | | | | (4,525,000 | ) | | | (173,359 | ) | | | — | | | | (365,388 | ) | | | 9,176 | | | | 201,205 | | | | — | |
| | | | | | | | | | | | |
Goldman Sachs International | | Citigroup, Inc. | | 06/20/2018 | | | 1.000 | | | | 0.418 | | | | USD | | | | (4,215,000 | ) | | | 44,330 | | | | 34,673 | | | | — | | | | 8,547 | | | | 18,204 | | | | — | |
| | | | | | | | | | | | |
Goldman Sachs International | | Markit CMBX North America Index, Series 6 BBB- | | 05/11/2063 | | | 3.000 | | | | 4.661 | | | | USD | | | | (3,500,000 | ) | | | (295,313 | ) | | | — | | | | (289,995 | ) | | | 2,042 | | | | — | | | | (3,276 | ) |
The accompanying Notes to Financial Statements are an integral part of this statement.
| | | | | | |
| | |
| | | | ACTIVE PORTFOLIOS® MULTI-MANAGER TOTAL RETURN BOND FUND | | |
PORTFOLIO OF INVESTMENTS (continued)
August 31, 2016
Sell Protection (continued)
| | | | | | | | | | | | | | | | | | | | | | | | | | | | | | | | | | | | | | | | | | | | |
| Counterparty | | Reference
Entity | | Expiration
Date | | Receive
Fixed
Rate (%) | | | Implied
Credit
Spread (%)* | | | Notional
Currency | | | Notional
Amount | | | Market
Value
($) | | | Premium
Paid
($) | | | Premium
Received
($) | | | Periodic
Payments
Receivable
(Payable)
($) | | | Unrealized
Appreciation
($) | | | Unrealized
Depreciation
($) | |
Goldman Sachs International | | Markit CMBX North America Index, Series 6 BBB- | | 05/11/2063 | | | 3.000 | | | | 4.661 | | | | USD | | | | (1,700,000 | ) | | | (143,438 | ) | | | — | | | | (149,770 | ) | | | 993 | | | | 7,325 | | | | — | |
| | | | | | | | | | | | |
Goldman Sachs International | | Markit CMBX North America Index, Series 7 BBB- | | 01/17/2047 | | | 3.000 | | | | 4.496 | | | | USD | | | | (1,700,000 | ) | | | (149,813 | ) | | | — | | | | (210,502 | ) | | | 993 | | | | 61,682 | | | | — | |
| | | | | | | | | | | | |
Goldman Sachs International | | Markit CMBX North America Index, Series 7 BBB- | | 01/17/2047 | | | 3.000 | | | | 4.496 | | | | USD | | | | (1,700,000 | ) | | | (149,813 | ) | | | — | | | | (212,423 | ) | | | 992 | | | | 63,602 | | | | — | |
| | | | | | | | | | | | |
JPMorgan | | Anadarko Petroleum Corp. | | 06/20/2021 | | | 1.000 | | | | 2.082 | | | | USD | | | | (1,710,000 | ) | | | (83,056 | ) | | | — | | | | (143,010 | ) | | | 3,468 | | | | 63,422 | | | | — | |
| | | | | | | | | | | | |
JPMorgan | | Bank of America Corp. | | 06/20/2018 | | | 1.000 | | | | 0.389 | | | | USD | | | | (12,630,000 | ) | | | 139,497 | | | | 119,861 | | | | — | | | | 25,611 | | | | 45,247 | | | | — | |
| | | | | | | | | | | | |
JPMorgan | | Bank of America Corp. | | 06/20/2021 | | | 1.000 | | | | 0.725 | | | | USD | | | | (8,535,000 | ) | | | 109,785 | | | | 52,549 | | | | — | | | | 17,307 | | | | 74,543 | | | | — | |
| | | | | | | | | | | | |
JPMorgan | | Berkshire Hathaway, Inc. | | 06/20/2021 | | | 1.000 | | | | 0.762 | | | | USD | | | | (5,005,000 | ) | | | 55,854 | | | | 13,763 | | | | — | | | | 10,149 | | | | 52,240 | | | | — | |
| | | | | | | | | | | | |
JPMorgan | | Citigroup, Inc. | | 06/20/2018 | | | 1.000 | | | | 0.418 | | | | USD | | | | (4,210,000 | ) | | | 44,277 | | | | 41,476 | | | | — | | | | 8,537 | | | | 11,338 | | | | — | |
| | | | | | | | | | | | |
JPMorgan | | Citigroup, Inc. | | 06/20/2018 | | | 1.000 | | | | 0.418 | | | | USD | | | | (12,665,000 | ) | | | 133,199 | | | | 143,073 | | | | — | | | | 25,682 | | | | 15,808 | | | | — | |
| | | | | | | | | | | | |
JPMorgan | | Citigroup, Inc. | | 06/20/2018 | | | 1.000 | | | | 0.418 | | | | USD | | | | (8,535,000 | ) | | | 89,764 | | | | 88,736 | | | | — | | | | 17,307 | | | | 18,335 | | | | — | |
| | | | | | | | | | | | |
JPMorgan | | FedEx Corp. | | 06/20/2021 | | | 1.000 | | | | 0.464 | | | | USD | | | | (1,725,000 | ) | | | 43,712 | | | | 42,511 | | | | — | | | | 3,498 | | | | 4,699 | | | | — | |
| | | | | | | | | | | | |
JPMorgan | | Plains All American Pipeline LP | | 06/20/2021 | | | 1.000 | | | | 2.620 | | | | USD | | | | (840,000 | ) | | | (59,988 | ) | | | — | | | | (106,668 | ) | | | 1,703 | | | | 48,383 | | | | — | |
| | | | | | | | | | | | |
JPMorgan | | Plains All American Pipeline LP | | 06/20/2021 | | | 1.000 | | | | 2.620 | | | | USD | | | | (845,000 | ) | | | (60,345 | ) | | | — | | | | (92,321 | ) | | | 1,713 | | | | 33,689 | | | | — | |
| | | | | | | | | | | | |
JPMorgan | | Plains All American Pipeline, LP | | 06/20/2021 | | | 1.000 | | | | 2.620 | | | | USD | | | | (905,000 | ) | | | (64,630 | ) | | | — | | | | (141,105 | ) | | | 1,835 | | | | 78,310 | | | | — | |
| | | | | | | | | | | | |
Morgan Stanley | | Anadarko Petroleum Corp. | | 12/20/2020 | | | 1.000 | | | | 1.940 | | | | USD | | | | (3,345,000 | ) | | | (128,152 | ) | | | — | | | | (260,344 | ) | | | 6,783 | | | | 138,975 | | | | — | |
| | | | | | | | | | | | |
Morgan Stanley | | Anadarko Petroleum Corp. | | 12/20/2020 | | | 1.000 | | | | 1.940 | | | | USD | | | | (3,355,000 | ) | | | (128,534 | ) | | | — | | | | (312,671 | ) | | | 6,803 | | | | 190,940 | | | | — | |
| | | | | | | | | | | | |
Morgan Stanley | | Anadarko Petroleum Corp. | | 12/20/2020 | | | 1.000 | | | | 1.940 | | | | USD | | | | (2,645,000 | ) | | | (101,334 | ) | | | — | | | | (369,030 | ) | | | 5,363 | | | | 273,059 | | | | — | |
| | | | | | | | | | | | |
Morgan Stanley | | Bank of America Corp. | | 06/20/2018 | | | 1.000 | | | | 0.389 | | | | USD | | | | (4,215,000 | ) | | | 46,554 | | | | 33,912 | | | | — | | | | 8,547 | | | | 21,189 | | | | — | |
| | | | | | | | | | | | |
Morgan Stanley | | Bank of America Corp. | | 06/20/2018 | | | 1.000 | | | | 0.389 | | | | USD | | | | (4,200,000 | ) | | | 46,389 | | | | 36,827 | | | | — | | | | 8,517 | | | | 18,079 | | | | — | |
| | | | | | | | | | | | |
Morgan Stanley | | Canadian Natural Resources Ltd. | | 06/20/2021 | | | 1.000 | | | | 2.070 | | | | USD | | | | (845,000 | ) | | | (40,747 | ) | | | — | | | | (60,653 | ) | | | 1,713 | | | | 21,619 | | | | — | |
The accompanying Notes to Financial Statements are an integral part of this statement.
| | | | | | |
| | |
| | | | ACTIVE PORTFOLIOS® MULTI-MANAGER TOTAL RETURN BOND FUND | | |
PORTFOLIO OF INVESTMENTS (continued)
August 31, 2016
Sell Protection (continued)
| | | | | | | | | | | | | | | | | | | | | | | | | | | | | | | | | | | | | | | | | | | | |
| Counterparty | | Reference
Entity | | Expiration
Date | | Receive
Fixed
Rate (%) | | | Implied
Credit
Spread (%)* | | | Notional
Currency | | | Notional
Amount | | | Market
Value
($) | | | Premium
Paid
($) | | | Premium
Received
($) | | | Periodic
Payments
Receivable
(Payable)
($) | | | Unrealized
Appreciation
($) | | | Unrealized
Depreciation
($) | |
Morgan Stanley | | Enterprise Products Partners LP | | 06/20/2021 | | | 1.000 | | | | 1.650 | | | | USD | | | | (5,060,000 | ) | | | (150,148 | ) | | | — | | | | (249,463 | ) | | | 10,261 | | | | 109,576 | | | | — | |
| | | | | | | | | | | | |
Morgan Stanley | | Enterprise Products Partners, LP | | 06/20/2021 | | | 1.000 | | | | 1.650 | | | | USD | | | | (5,440,000 | ) | | | (161,424 | ) | | | — | | | | (424,275 | ) | | | 11,032 | | | | 273,883 | | | | — | |
| | | | | | | | | | | | |
Morgan Stanley | | Markit CMBX North America Index, Series 6 BBB- | | 05/11/2063 | | | 3.000 | | | | 4.661 | | | | USD | | | | (1,300,000 | ) | | | (109,688 | ) | | | — | | | | (100,768 | ) | | | 758 | | | | — | | | | (8,162 | ) |
| | | | | | | | | | | | |
Morgan Stanley | | Markit CMBX North America Index, Series 6 BBB- | | 05/11/2063 | | | 3.000 | | | | 4.661 | | | | USD | | | | (3,000,000 | ) | | | (253,125 | ) | | | — | | | | (247,950 | ) | | | 1,750 | | | | — | | | | (3,425 | ) |
Morgan Stanley | | Markit CMBX North America Index, Series 7 BBB- | | 01/17/2047 | | | 3.000 | | | | 4.496 | | | | USD | | | | (2,400,000 | ) | | | (211,500 | ) | | | — | | | | (279,224 | ) | | | 1,400 | | | | 69,124 | | | | — | |
| | | | | | | | | | | | |
Morgan Stanley | | Markit CMBX North America Index, Series 7 BBB- | | 01/17/2047 | | | 3.000 | | | | 4.496 | | | | USD | | | | (4,750,000 | ) | | | (418,594 | ) | | | — | | | | (570,921 | ) | | | 2,771 | | | | 155,098 | | | | — | |
| | | | | | | | | | | | |
Morgan Stanley | | Mondelez International, Inc. | | 06/20/2021 | | | 1.000 | | | | 0.425 | | | | USD | | | | (1,670,000 | ) | | | 45,411 | | | | 37,363 | | | | — | | | | 3,386 | | | | 11,434 | | | | — | |
| | | | | | | | | | | | |
Morgan Stanley | | Noble Energy, Inc. | | 06/20/2021 | | | 1.000 | | | | 2.343 | | | | USD | | | | (4,175,000 | ) | | | (250,725 | ) | | | — | | | | (280,614 | ) | | | 8,466 | | | | 38,355 | | | | — | |
| | | | | | | | | | | | |
Morgan Stanley | | Noble Energy, Inc. | | 12/20/2021 | | | 1.000 | | | | 2.432 | | | | USD | | | | (4,275,000 | ) | | | (298,042 | ) | | | — | | | | (371,032 | ) | | | 8,669 | | | | 81,659 | | | | — | |
| | | | | | | | | | | | |
Morgan Stanley | | Plains All American Pipeline LP | | 06/20/2021 | | | 1.000 | | | | 2.620 | | | | USD | | | | (2,715,000 | ) | | | (193,890 | ) | | | — | | | | (381,335 | ) | | | 5,505 | | | | 192,950 | | | | — | |
| | | | | | | | | | | | |
Morgan Stanley | | Plains All American Pipeline, LP | | 06/20/2021 | | | 1.000 | | | | 2.620 | | | | USD | | | | (1,810,000 | ) | | | (129,260 | ) | | | — | | | | (302,085 | ) | | | 3,670 | | | | 176,495 | | | | — | |
| | | | | | | | | | | | |
Morgan Stanley | | Plains All American Pipeline, LP | | 06/20/2021 | | | 1.000 | | | | 2.620 | | | | USD | | | | (1,815,000 | ) | | | (129,616 | ) | | | — | | | | (259,805 | ) | | | 3,680 | | | | 133,869 | | | | — | |
Total | | | | | | | | | | | | 813,434 | | | | (7,921,487 | ) | | | | | | | 3,375,567 | | | | (53,837 | ) |
| | * | Implied credit spreads, represented in absolute terms, utilized in determining the market value of credit default swap agreements on corporate or sovereign issues as of period end serve as an indicator of the current status of the payment/performance risk and represent the likelihood or risk of default for the credit derivative. The implied credit spread of a particular referenced entity reflects the cost of buying/selling protection and may include upfront payments required to be made to enter into the agreement. Wider credit spreads represent a deterioration of the referenced entity’s credit soundness and a greater likelihood or risk of default or other credit event occurring as defined under the terms of the agreement. |
Cleared Interest Rate Swap Contracts Outstanding at August 31, 2016
| | | | | | | | | | | | | | | | | | | | | | | | |
| Counterparty | | Fund Receives | | Fund Pays | | Expiration
Date | | | Notional
Currency | | | Notional
Amount | | | Unrealized
Appreciation ($) | | | Unrealized
Depreciation ($) | |
JPMorgan | | 1-Day Overnight Fed Funds Effective Rate | | Fixed rate of 0.465% | | | 02/18/2017 | | | | USD | | | | 170,000,000 | | | | 28,233 | | | | — | |
The accompanying Notes to Financial Statements are an integral part of this statement.
| | | | | | |
| | |
| | | | ACTIVE PORTFOLIOS® MULTI-MANAGER TOTAL RETURN BOND FUND | | |
PORTFOLIO OF INVESTMENTS (continued)
August 31, 2016
Cleared Interest Rate Swap Contracts Outstanding at August 31, 2016 (continued)
| | | | | | | | | | | | | | | | | | | | | | | | |
| Counterparty | | Fund Receives | | Fund Pays | | Expiration
Date | | | Notional
Currency | | | Notional
Amount | | | Unrealized
Appreciation ($) | | | Unrealized
Depreciation ($) | |
| | | | | | | |
JPMorgan | | 1-Day Overnight Fed Funds Effective Rate | | Fixed rate of 0.524% | | | 08/19/2017 | | | | USD | | | | 87,450,000 | | | | 37,922 | | | | — | |
| | | | | | | |
JPMorgan | | 3-Month USD LIBOR-BBA | | Fixed rate of 1.476% | | | 12/31/2022 | | | | USD | | | | 629,200,000 | | | | — | | | | (8,851,885 | ) |
| | | | | | | |
JPMorgan | | Fixed rate of 1.578% | | 3-Month USD LIBOR-BBA | | | 05/31/2023 | | | | USD | | | | 26,250,000 | | | | 476,809 | | | | — | |
| | | | | | | |
JPMorgan | | Fixed rate of 1.280% | | 3-Month USD LIBOR-BBA | | | 09/06/2023 | | | | USD | | | | 130,000,000 | | | | — | | | | (471,235 | ) |
| | | | | | | |
JPMorgan | | 1-Day Overnight Fed Funds Effective Rate | | Fixed rate of 0.881% | | | 09/06/2023 | | | | USD | | | | 130,000,000 | | | | 608,871 | | | | — | |
| | | | | | | |
JPMorgan | | 3-Month USD LIBOR-BBA | | Fixed rate of 1.874% | | | 11/15/2041 | | | | USD | | | | 14,100,000 | | | | — | | | | (590,159 | ) |
| | | | | | | | | | | | | | | | | | | | | | | | | |
Total | | | | | | | | | | | | | | | | | | | 1,151,835 | | | | (9,913,279 | ) |
| | | | | | | | | | | | | | | | | | | | | | | | | |
Notes to Portfolio of Investments
| (a) | Represents privately placed and other securities and instruments exempt from SEC registration (collectively, private placements), such as Section 4(a)(2) and Rule 144A eligible securities, which are often sold only to qualified institutional buyers. The Fund may invest in private placements determined to be liquid as well as those determined to be illiquid. Private placements may be determined to be liquid under guidelines established by the Fund’s Board of Trustees. At August 31, 2016, the value of these securities amounted to $1,248,935,494 or 18.88% of net assets. |
| (b) | Variable rate security. |
| (c) | Security, or a portion thereof, has been purchased on a when-issued or delayed delivery basis. |
| (d) | Represents securities that have defaulted on payment of interest. The Fund has stopped accruing interest on these securities. At August 31, 2016, the value of these securities amounted to $44,048, which represents less than 0.01% of net assets. |
| (e) | Negligible market value. |
| (f) | Represents fair value as determined in good faith under procedures approved by the Board of Trustees. At August 31, 2016, the value of these securities amounted to $50,978,803, which represents 0.77% of net assets. |
| (g) | Interest Only (IO) represents the right to receive the monthly interest payments on an underlying pool of mortgage loans. |
| (h) | Principal Only (PO) represents the right to receive the principal portion only on an underlying pool of mortgage loans. |
| (j) | Principal and interest may not be guaranteed by the government. |
| (k) | Municipal obligations include debt obligations issued by or on behalf of territories, possessions, or sovereign nations within the territorial boundaries of the United States. At August 31, 2016, the value of these securities amounted to $2,433,158 or 0.04% of net assets. |
| (l) | Senior loans have interest rates that float periodically based primarily on the London Interbank Offered Rate (“LIBOR”) and other short-term rates. The interest rate shown reflects the weighted average coupon as of August 31, 2016. The interest rate shown for senior loans purchased on a when-issued or delayed delivery basis, if any, reflects an estimated average coupon. Remaining maturities of senior loans may be less than the stated maturities shown as a result of contractual or optional prepayments by the borrower. Such prepayments cannot be predicted. |
| (m) | Non-income producing investment. |
| (n) | As defined in the Investment Company Act of 1940, an affiliated company is one in which the Fund owns 5% or more of the company’s outstanding voting securities, or a company which is under common ownership or control with the Fund. Holdings and transactions in these affiliated companies during the year ended August 31, 2016 are as follows: |
| | | | | | | | | | | | | | | | | | | | | | | | | | | | |
| Issuer | | Beginning
Cost ($) | | | Purchase
Cost ($) | | | Proceeds
From Sales ($) | | | Ending
Cost ($) | | | Capital Gain
Distributions ($) | | | Dividends —
Affiliated
Issuers ($) | | | Value ($) | |
Columbia Short-Term Cash Fund | | | 360,589,788 | | | | 4,714,168,536 | | | | (4,704,361,267 | ) | | | 370,397,057 | | | | — | | | | 936,529 | | | | 370,397,057 | |
| | | | | | | |
Columbia Mortgage Opportunities Fund, Class I | | | 32,906,862 | | | | 39,664,184 | | | | — | | | | 72,571,046 | | | | 452,368 | | | | 2,452,524 | | | | 72,593,104 | |
| | | | | | | | | | | | | | | | | | | | | | | | | | | | | |
Total | | | 393,496,650 | | | | 4,753,832,720 | | | | (4,704,361,267 | ) | | | 442,968,103 | | | | 452,368 | | | | 3,389,053 | | | | 442,990,161 | |
| | | | | | | | | | | | | | | | | | | | | | | | | | | | | |
| (o) | The rate shown is the seven-day current annualized yield at August 31, 2016. |
| (p) | This security or a portion of this security has been pledged as collateral in connection with derivative contracts. |
The accompanying Notes to Financial Statements are an integral part of this statement.
| | | | | | |
| | |
| | | | ACTIVE PORTFOLIOS® MULTI-MANAGER TOTAL RETURN BOND FUND | | |
PORTFOLIO OF INVESTMENTS (continued)
August 31, 2016
Abbreviation Legend
| | |
| AGM | | Assured Guaranty Municipal Corporation |
| AMBAC | | Ambac Assurance Corporation |
| BAM | | Build America Mutual Assurance Co. |
| CMO | | Collateralized Mortgage Obligation |
| NPFGC | | National Public Finance Guarantee Corporation |
| PIK | | Payment-in-Kind |
| STRIPS | | Separate Trading of Registered Interest and Principal Securities |
Currency Legend
Fair Value Measurements
The Fund categorizes its fair value measurements according to a three-level hierarchy that maximizes the use of observable inputs and minimizes the use of unobservable inputs by prioritizing that the most observable input be used when available. Observable inputs are those that market participants would use in pricing an investment based on market data obtained from sources independent of the reporting entity. Unobservable inputs are those that reflect the Fund’s assumptions about the information market participants would use in pricing an investment. An investment’s level within the fair value hierarchy is based on the lowest level of any input that is deemed significant to the asset’s or liability’s fair value measurement. The input levels are not necessarily an indication of the risk or liquidity associated with investments at that level. For example, certain U.S. government securities are generally high quality and liquid, however, they are reflected as Level 2 because the inputs used to determine fair value may not always be quoted prices in an active market.
Fair value inputs are summarized in the three broad levels listed below:
| n | | Level 1 — Valuations based on quoted prices for investments in active markets that the Fund has the ability to access at the measurement date (including NAV for open-end mutual funds). Valuation adjustments are not applied to Level 1 investments. |
| n | | Level 2 — Valuations based on other significant observable inputs (including quoted prices for similar securities, interest rates, prepayment speeds, credit risks, etc.). |
| n | | Level 3 — Valuations based on significant unobservable inputs (including the Fund’s own assumptions and judgment in determining the fair value of investments). |
Inputs that are used in determining fair value of an investment may include price information, credit data, volatility statistics, and other factors. These inputs can be either observable or unobservable. The availability of observable inputs can vary between investments, and is affected by various factors such as the type of investment, and the volume and level of activity for that investment or similar investments in the marketplace. The inputs will be considered by the Investment Manager, along with any other relevant factors in the calculation of an investment’s fair value. The Fund uses prices and inputs that are current as of the measurement date, which may include periods of market dislocations. During these periods, the availability of prices and inputs may be reduced for many investments. This condition could cause an investment to be reclassified between the various levels within the hierarchy.
Certain investments that have been measured at fair value using the net asset value per share (or its equivalent) are not categorized in the fair value hierarchy. The fair value amounts presented in the table are intended to reconcile the fair value hierarchy to the amounts presented in the Portfolio of Investments. The Columbia Short-Term Cash Fund seeks to provide shareholders with maximum current income consistent with liquidity and stability of principal. Investments in Columbia Short-Term Cash Fund may be redeemed on a daily basis without restriction.
Investments falling into the Level 3 category are primarily supported by quoted prices from brokers and dealers participating in the market for those investments. However, these may be classified as Level 3 investments due to lack of market transparency and corroboration to support these quoted prices. Additionally, valuation models may be used as the pricing source for any remaining investments classified as Level 3. These models may rely on one or more significant unobservable inputs and/or significant assumptions by the Investment Manager. Inputs used in valuations may include, but are not limited to, financial statement analysis, capital account balances, discount rates and estimated cash flows, and comparable company data.
Under the direction of the Fund’s Board of Trustees (the Board), the Investment Manager’s Valuation Committee (the Committee) is responsible for overseeing the valuation procedures approved by the Board. The Committee consists of voting and non-voting members from various groups within the Investment Manager’s organization, including operations and accounting, trading and investments, compliance, risk management and legal.
The Committee meets at least monthly to review and approve valuation matters, which may include a description of specific valuation determinations, data regarding pricing information received from approved pricing vendors and brokers and the results of Board-approved valuation control policies and procedures (the Policies). The Policies address, among other things, instances when market quotations are or are not readily available, including recommendations of third party pricing vendors and a determination of appropriate pricing methodologies; events that require specific valuation determinations and assessment of fair value techniques; securities with a potential for stale pricing, including those that are illiquid, restricted, or in default; and the effectiveness of third party pricing vendors, including periodic reviews of vendors. The Committee meets more frequently, as needed, to discuss additional valuation matters, which may include the need to review back-testing results, review time-sensitive information or approve related valuation actions. The Committee reports to the Board, with members of the Committee meeting with the Board at each of its regularly scheduled meetings to discuss valuation matters and actions during the period, similar to those described earlier.
For investments categorized as Level 3, the Committee monitors information similar to that described above, which may include: (i) data specific to the issuer or comparable issuers, (ii) general market or specific sector news and (iii) quoted prices and specific or similar security transactions. The Committee considers this data and any changes from prior periods in order to assess the reasonableness of observable and unobservable inputs, any assumptions or internal models used to value those securities and changes in fair value. This data is also used to corroborate, when available,
The accompanying Notes to Financial Statements are an integral part of this statement.
| | | | | | |
| | |
| | | | ACTIVE PORTFOLIOS® MULTI-MANAGER TOTAL RETURN BOND FUND | | |
PORTFOLIO OF INVESTMENTS (continued)
August 31, 2016
Fair Value Measurements (continued)
information received from approved pricing vendors and brokers. Various factors impact the frequency of monitoring this information (which may occur as often as daily). However, the Committee may determine that changes to inputs, assumptions and models are not required as a result of the monitoring procedures performed.
The following table is a summary of the inputs used to value the Fund’s investments at August 31, 2016:
| | | | | | | | | | | | | | | | |
| | | Level 1 Quoted Prices in Active
Markets for Identical
Assets ($) | | | Level 2 Other Significant
Observable Inputs ($) | | | Level 3 Significant
Unobservable Inputs ($) | | | Total ($) | |
Investments | | | | | | | | | | | | | | | | |
| | | | |
Corporate Bonds & Notes | | | — | | | | 2,556,344,102 | | | | — | | | | 2,556,344,102 | |
| | | | |
Residential Mortgage-Backed Securities — Agency | | | — | | | | 1,247,057,732 | | | | 289,839 | | | | 1,247,347,571 | |
| | | | |
Residential Mortgage-Backed Securities — Non-Agency | | | — | | | | 168,436,689 | | | | 4,295,543 | | | | 172,732,232 | |
| | | | |
Commercial Mortgage-Backed Securities — Agency | | | — | | | | 110,338,570 | | | | — | | | | 110,338,570 | |
| | | | |
Commercial Mortgage-Backed Securities — Non-Agency | | | — | | | | 356,755,546 | | | | 5,155,744 | | | | 361,911,290 | |
| | | | |
Asset-Backed Securities — Agency | | | — | | | | 23,819,069 | | | | — | | | | 23,819,069 | |
| | | | |
Asset-Backed Securities — Non-Agency | | | — | | | | 676,399,610 | | | | 59,953,226 | | | | 736,352,836 | |
| | | | |
Inflation-Indexed Bonds | | | — | | | | 57,052,623 | | | | — | | | | 57,052,623 | |
| | | | |
U.S. Treasury Obligations | | | 1,104,731,601 | | | | 18,509,384 | | | | — | | | | 1,123,240,985 | |
| | | | |
U.S. Government & Agency Obligations | | | — | | | | 120,639,069 | | | | — | | | | 120,639,069 | |
| | | | |
Foreign Government Obligations | | | — | | | | 114,368,379 | | | | — | | | | 114,368,379 | |
| | | | |
Municipal Bonds | | | — | | | | 30,236,335 | | | | — | | | | 30,236,335 | |
| | | | |
Preferred Debt | | | 19,385,433 | | | | — | | | | — | | | | 19,385,433 | |
| | | | |
Senior Loans | | | — | | | | 40,397,247 | | | | 1,363,080 | | | | 41,760,327 | |
| | | | |
Common Stocks | | | | | | | | | | | | | | | | |
| | | | |
Energy | | | — | | | | — | | | | 5,893 | | | | 5,893 | |
| | | | |
Fixed-Income Funds | | | 72,593,104 | | | | — | | | | — | | | | 72,593,104 | |
| | | | |
Treasury Bills | | | 31,527,748 | | | | — | | | | — | | | | 31,527,748 | |
| | | | | | | | | | | | | | | | | |
Investments measured at net asset value | | | | | | | | | | | | | | | | |
| | | | |
Money Market Funds | | | — | | | | — | | | | — | | | | 370,397,057 | |
| | | | | | | | | | | | | | | | | |
Total Investments | | | 1,228,237,886 | | | | 5,520,354,355 | | | | 71,063,325 | | | | 7,190,052,623 | |
| | | | | | | | | | | | | | | | | |
Derivatives | | | | | | | | | | | | | | | | |
| | | | |
Assets | | | | | | | | | | | | | | | | |
| | | | |
Forward Foreign Currency Exchange Contracts | | | — | | | | 5,108 | | | | — | | | | 5,108 | |
| | | | |
Futures Contracts | | | 205,953 | | | | — | | | | — | | | | 205,953 | |
| | | | |
Swap Contracts | | | — | | | | 4,615,948 | | | | — | | | | 4,615,948 | |
| | | | |
Liabilities | | | | | | | | | | | | | | | | |
| | | | |
Futures Contracts | | | (2,298,866 | ) | | | — | | | | — | | | | (2,298,866 | ) |
| | | | |
Swap Contracts | | | — | | | | (16,214,913 | ) | | | — | | | | (16,214,913 | ) |
| | | | | | | | | | | | | | | | | |
Total | | | 1,226,144,973 | | | | 5,508,760,498 | | | | 71,063,325 | | | | 7,176,365,853 | |
| | | | | | | | | | | | | | | | | |
See the Portfolio of Investments for all investment classifications not indicated in the table.
The Fund’s assets assigned to the Level 2 input category are generally valued using the market approach, in which a security’s value is determined through reference to prices and information from market transactions for similar or identical assets.
Derivative instruments are valued at unrealized appreciation (depreciation).
There were no transfers of financial assets between Levels 1 and 2 during the period.
The accompanying Notes to Financial Statements are an integral part of this statement.
| | | | | | |
| | |
| | | | ACTIVE PORTFOLIOS® MULTI-MANAGER TOTAL RETURN BOND FUND | | |
PORTFOLIO OF INVESTMENTS (continued)
August 31, 2016
Fair Value Measurements (continued)
The following table is a reconciliation of Level 3 assets for which significant observable and unobservable inputs were used to determine fair value:
| | | | | | | | | | | | | | | | | | | | | | | | | | | | |
| | | Residential
Mortgage-Backed
Securities —
Agency ($) | | | Residential
Mortgage-Backed
Securities —
Non-Agency ($) | | | Commercial
Mortgage-Backed
Securities —
Non-Agency ($) | | | Asset-Backed
Securities —
Non-Agency ($) | | | Senior
Loans ($) | | | Common
Stocks ($) | | | Total ($) | |
Balance as of August 31, 2015 | | | — | | | | 5,986,976 | | | | 54,883 | | | | 2,759,897 | | | | 806,010 | | | | 5,675 | | | | 9,613,441 | |
| | | | | | | |
Increase (decrease) in accrued discounts/premiums | | | (1,794 | ) | | | (10,363 | ) | | | (174,338 | ) | | | — | | | | 176 | | | | — | | | | (186,319 | ) |
| | | | | | | |
Realized gain (loss) | | | — | | | | 2,387 | | | | — | | | | 2 | | | | 2,241 | | | | — | | | | 4,630 | |
| | | | | | | |
Change in unrealized appreciation (depreciation)(a) | | | (1,134 | ) | | | (24,338 | ) | | | (96,494 | ) | | | (7,673 | ) | | | 6,579 | | | | 218 | | | | (122,842 | ) |
| | | | | | | |
Sales | | | — | | | | (5,436,362 | ) | | | (54,883 | ) | | | (2,760,000 | ) | | | (206,363 | ) | | | — | | | | (8,457,608 | ) |
| | | | | | | |
Purchases | | | 292,767 | | | | 3,777,243 | | | | 5,426,576 | | | | 59,961,000 | | | | — | | | | — | | | | 69,457,586 | |
| | | | | | | |
Transfers into Level 3 | | | — | | | | — | | | | — | | | | — | | | | 1,367,206 | | | | — | | | | 1,367,206 | |
| | | | | | | |
Transfers out of Level 3 | | | — | | | | — | | | | — | | | | — | | | | (612,769 | ) | | | — | | | | (612,769 | ) |
| | | | | | | | | | | | | | | | | | | | | | | | | | | | | |
Balance as of August 31, 2016 | | | 289,839 | | | | 4,295,543 | | | | 5,155,744 | | | | 59,953,226 | | | | 1,363,080 | | | | 5,893 | | | | 71,063,325 | |
| | | | | | | | | | | | | | | | | | | | | | | | | | | | | |
| | (a) | Change in unrealized appreciation (depreciation) relating to securities held at August 31, 2016 was $(73,006), which is comprised of Residential Mortgage-Backed Securities — Agency of $(1,134), Residential Mortgage-Backed Securities — Non-Agency of $23,108, Commercial Mortgage-Backed Securities — Non-Agency of $(96,494), Asset-Backed Securities — Non-Agency of $(7,774), Senior Loans of $9,070 and Common Stocks of $218. |
The Fund’s assets assigned to the Level 3 category are valued utilizing the valuation technique deemed the most appropriate in the circumstances.
Certain common stock classified as Level 3 securities are valued using the market approach. To determine fair value for these securities, management considered various factors which may have included, but were not limited to, the closing prices of similar securities from the issuer and quoted bids from market participants.
Certain senior loans, residential, commercial and asset backed securities classified as Level 3 securities are valued using the market approach and utilize single market quotations from broker dealers which may have included, but not limited to, observable transactions for identical or similar assets in the market and the distressed nature of the security. The appropriateness of fair values for these securities is monitored on an ongoing basis which may include results of back testing, manual price reviews and other control procedures. Significant increases (decreases) to any of these inputs would result in a significantly lower (higher) valuation measurement.
Financial Assets were transferred from Level 2 to Level 3 due to utilizing a single market quotation from a broker dealer. As a result, Management concluded that the market input(s) were generally unobservable.
Financial assets were transferred from Level 3 to Level 2 as observable market inputs were utilized and management determined that there was sufficient, reliable and observable market data to value these assets as of period end.
Transfers into and/or out of Level 3 are determined based on the fair value at the beginning of the period for security positions held throughout the period.
The accompanying Notes to Financial Statements are an integral part of this statement.
| | | | | | |
| | |
| | | | ACTIVE PORTFOLIOS® MULTI-MANAGER TOTAL RETURN BOND FUND | | |
STATEMENT OF ASSETS AND LIABILITIES
August 31, 2016
| | | | |
Assets | | | | |
| |
Investments, at value | | | | |
| |
Unaffiliated issuers (identified cost $6,590,421,830) | | | $6,747,062,462 | |
| |
Affiliated issuers (identified cost $442,968,103) | | | 442,990,161 | |
| |
Total investments (identified cost $7,033,389,933) | | | 7,190,052,623 | |
| |
Foreign currency (identified cost $45,857) | | | 30,806 | |
| |
Margin deposits | | | 945,000 | |
| |
Unrealized appreciation on forward foreign currency exchange contracts | | | 5,108 | |
| |
Unrealized appreciation on swap contracts | | | 3,464,113 | |
| |
Premiums paid on outstanding swap contracts | | | 6,390,122 | |
| |
Receivable for: | | | | |
| |
Investments sold | �� | | 133,273,468 | |
| |
Investments sold on a delayed delivery basis | | | 207,110,815 | |
| |
Capital shares sold | | | 23,279,323 | |
| |
Dividends | | | 212,295 | |
| |
Interest | | | 39,049,017 | |
| |
Foreign tax reclaims | | | 106,560 | |
| |
Variation margin | | | 1,054,878 | |
| |
Prepaid expenses | | | 57,352 | |
| |
Trustees’ deferred compensation plan | | | 83,084 | |
| |
Total assets | | | 7,605,114,564 | |
| |
| |
Liabilities | | | | |
| |
Due to custodian | | | 19,416,744 | |
| |
Unrealized depreciation on swap contracts | | | 4,713,434 | |
| |
Premiums received on outstanding swap contracts | | | 11,059,097 | |
| |
Payable for: | | | | |
| |
Investments purchased | | | 160,287,663 | |
| |
Investments purchased on a delayed delivery basis | | | 764,648,864 | |
| |
Capital shares purchased | | | 19,036,038 | |
| |
Dividend distributions to shareholders | | | 10,509,007 | |
| |
Variation margin | | | 67,438 | |
| |
Management services fees | | | 82,503 | |
| |
Distribution and/or service fees | | | 45,143 | |
| |
Transfer agent fees | | | 266,739 | |
| |
Chief compliance officer expenses | | | 479 | |
| |
Other expenses | | | 218,717 | |
| |
Trustees’ deferred compensation plan | | | 83,084 | |
| |
Total liabilities | | | 990,434,950 | |
| |
Net assets applicable to outstanding capital stock | | | $6,614,679,614 | |
| |
| |
Represented by | | | | |
| |
Paid-in capital | | | $6,395,763,344 | |
| |
Undistributed net investment income | | | 9,346,279 | |
| |
Accumulated net realized gain | | | 66,609,351 | |
| |
Unrealized appreciation (depreciation) on: | | | | |
| |
Investments — unaffiliated issuers | | | 156,640,632 | |
| |
Investments — affiliated issuers | | | 22,058 | |
| |
Foreign currency translations | | | (15,280 | ) |
| |
Forward foreign currency exchange contracts | | | 5,108 | |
| |
Futures contracts | | | (2,092,913 | ) |
| |
Swap contracts | | | (11,598,965 | ) |
| |
Total — representing net assets applicable to outstanding capital stock | | | $6,614,679,614 | |
| |
| |
Class A | | | | |
| |
Net assets | | | $6,614,679,614 | |
| |
Shares outstanding | | | 635,311,090 | |
| |
Net asset value per share | | | $10.41 | |
| |
The accompanying Notes to Financial Statements are an integral part of this statement.
| | | | | | |
| | |
| | | | ACTIVE PORTFOLIOS® MULTI-MANAGER TOTAL RETURN BOND FUND | | |
STATEMENT OF OPERATIONS
Year Ended August 31, 2016
| | | | |
Net investment income | |
| |
Income: | | | | |
| |
Dividends — unaffiliated issuers | | | $1,316,149 | |
| |
Dividends — affiliated issuers | | | 3,389,053 | |
| |
Interest | | | 155,187,265 | |
| |
Foreign taxes withheld | | | (2,708 | ) |
| |
Total income | | | 159,889,759 | |
| |
| |
Expenses: | | | | |
| |
Management services fees | | | 26,444,308 | |
| |
Distribution and/or service fees | | | | |
| |
Class A | | | 14,233,353 | |
| |
Transfer agent fees | | | | |
| |
Class A | | | 3,581,924 | |
| |
Compensation of board members | | | 117,215 | |
| |
Custodian fees | | | 141,634 | |
| |
Printing and postage fees | | | 415,269 | |
| |
Registration fees | | | 284,173 | |
| |
Audit fees | | | 47,839 | |
| |
Legal fees | | | 154,890 | |
| |
Chief compliance officer expenses | | | 2,722 | |
| |
Other | | | 130,397 | |
| |
Total expenses | | | 45,553,724 | |
| |
Fees waived or expenses reimbursed by Investment Manager and its affiliates | | | (201,700 | ) |
| |
Total net expenses | | | 45,352,024 | |
| |
Net investment income | | | 114,537,735 | |
| |
| |
Realized and unrealized gain (loss) — net | | | | |
| |
Net realized gain (loss) on: | | | | |
| |
Investments | | | 85,638,863 | |
| |
Capital gain distributions from underlying affiliated funds | | | 452,368 | |
| |
Foreign currency translations | | | 11,176 | |
| |
Forward foreign currency exchange contracts | | | (48,399 | ) |
| |
Futures contracts | | | 8,484,574 | |
| |
Swap contracts | | | (13,324,594 | ) |
| |
Net realized gain | | | 81,213,988 | |
| |
Net change in unrealized appreciation (depreciation) on: | | | | |
| |
Investments — unaffiliated issuers | | | 157,446,267 | |
| |
Investments — affiliated issuers | | | 195,195 | |
| |
Foreign currency translations | | | (5,358 | ) |
| |
Forward foreign currency exchange contracts | | | 5,032 | |
| |
Futures contracts | | | (3,094,399 | ) |
| |
Swap contracts | | | (11,482,613 | ) |
| |
Net change in unrealized appreciation | | | 143,064,124 | |
| |
Net realized and unrealized gain | | | 224,278,112 | |
| |
Net increase in net assets resulting from operations | | | $338,815,847 | |
| |
The accompanying Notes to Financial Statements are an integral part of this statement.
| | | | | | |
| | |
| | | | ACTIVE PORTFOLIOS® MULTI-MANAGER TOTAL RETURN BOND FUND | | |
STATEMENT OF CHANGES IN NET ASSETS
| | | | | | | | |
| | | Year Ended
August 31, 2016 | | | Year Ended
August 31, 2015 | |
Operations | | | | | | | | |
| | |
Net investment income | | | $114,537,735 | | | | $90,707,216 | |
| | |
Net realized gain | | | 81,213,988 | | | | 17,217,843 | |
| | |
Net change in unrealized appreciation (depreciation) | | | 143,064,124 | | | | (91,966,797 | ) |
| |
Net increase in net assets resulting from operations | | | 338,815,847 | | | | 15,958,262 | |
| |
| | |
Distributions to shareholders | | | | | | | | |
| | |
Net investment income | | | | | | | | |
| | |
Class A | | | (107,921,973 | ) | | | (95,037,479 | ) |
| | |
Net realized gains | | | | | | | | |
| | |
Class A | | | (18,209,384 | ) | | | — | |
| |
Total distributions to shareholders | | | (126,131,357 | ) | | | (95,037,479 | ) |
| |
Increase in net assets from capital stock activity | | | 1,304,537,319 | | | | 520,316,679 | |
| |
Total increase in net assets | | | 1,517,221,809 | | | | 441,237,462 | |
| | |
Net assets at beginning of year | | | 5,097,457,805 | | | | 4,656,220,343 | |
| |
Net assets at end of year | | | $6,614,679,614 | | | | $5,097,457,805 | |
| |
Undistributed net investment income | | | $9,346,279 | | | | $4,382,995 | |
| |
The accompanying Notes to Financial Statements are an integral part of this statement.
| | | | | | |
| | |
| | | | ACTIVE PORTFOLIOS® MULTI-MANAGER TOTAL RETURN BOND FUND | | |
STATEMENT OF CHANGES IN NET ASSETS (continued)
| | | | | | | | | | | | | | | | |
| | | Year Ended
August 31, 2016 | | | Year Ended
August 31, 2015 | |
| | | Shares | | | Dollars ($) | | | Shares | | | Dollars ($) | |
Capital stock activity | | | | | | | | | | | | | | | | |
| | | | |
Class A shares | | | | | | | | | | | | | | | | |
| | | | |
Subscriptions | | | 237,371,867 | | | | 2,409,831,765 | | | | 147,095,790 | | | | 1,501,600,269 | |
| | | | |
Distributions reinvested | | | 12,447,472 | | | | 126,131,125 | | | | 9,334,150 | | | | 95,037,274 | |
| | | | |
Redemptions | | | (121,192,224 | ) | | | (1,231,425,571 | ) | | | (105,705,717 | ) | | | (1,076,320,864 | ) |
| |
Net increase | | | 128,627,115 | | | | 1,304,537,319 | | | | 50,724,223 | | | | 520,316,679 | |
| |
Total net increase | | | 128,627,115 | | | | 1,304,537,319 | | | | 50,724,223 | | | | 520,316,679 | |
| |
The accompanying Notes to Financial Statements are an integral part of this statement.
| | | | | | |
| | |
| | | | ACTIVE PORTFOLIOS® MULTI-MANAGER TOTAL RETURN BOND FUND | | |
FINANCIAL HIGHLIGHTS
The following table is intended to help you understand the Fund’s financial performance. Certain information reflects financial results for a single share of a class held for the periods shown. Per share net investment income (loss) amounts are calculated based on average shares outstanding during the period. Total return assumes reinvestment of all dividends and distributions, if any. Total return does not reflect payment of sales charges, if any. Total return and portfolio turnover are not annualized for periods of less than one year. The portfolio turnover rate is calculated without regard to purchase and sales transactions of short-term instruments and certain derivatives, if any. If such transactions were included, the Fund’s portfolio turnover rate may be higher.
| | | | | | | | | | | | | | | | | | | | |
| | | Year Ended August 31, 2016 | |
Class A | | | 2016 | | | | 2015 | | | | 2014 | | | | 2013 | | | | 2012(a) | |
Per share data | | | | | | | | | | | | | | | | | | | | |
Net asset value, beginning of period | | | $10.06 | | | | $10.21 | | | | $9.87 | | | | $10.24 | | | | $10.00 | |
| | | | | | | | | | | | | | | | | | | | | |
Income from investment operations: | | | | | | | | | | | | | | | | | | | | |
| | | | | |
Net investment income | | | 0.20 | | | | 0.19 | | | | 0.21 | | | | 0.19 | | | | 0.08 | |
| | | | | | | | | | | | | | | | | | | | | |
Net realized and unrealized gain (loss) | | | 0.38 | | | | (0.14 | ) | | | 0.36 | | | | (0.30 | ) | | | 0.24 | |
| | | | | | | | | | | | | | | | | | | | | |
Total from investment operations | | | 0.58 | | | | 0.05 | | | | 0.57 | | | | (0.11 | ) | | | 0.32 | |
| | | | | | | | | | | | | | | | | | | | | |
Less distributions to shareholders: | | | | | | | | | | | | | | | | | | | | |
| | | | | |
Net investment income | | | (0.19 | ) | | | (0.20 | ) | | | (0.20 | ) | | | (0.19 | ) | | | (0.08 | ) |
| | | | | | | | | | | | | | | | | | | | | |
Net realized gains | | | (0.04 | ) | | | — | | | | (0.03 | ) | | | (0.07 | ) | | | — | |
| | | | | | | | | | | | | | | | | | | | | |
Total distributions to shareholders | | | (0.23 | ) | | | (0.20 | ) | | | (0.23 | ) | | | (0.26 | ) | | | (0.08 | ) |
| | | | | | | | | | | | | | | | | | | | | |
Net asset value, end of period | | | $10.41 | | | | $10.06 | | | | $10.21 | | | | $9.87 | | | | $10.24 | |
| | | | | | | | | | | | | | | | | | | | | |
Total return | | | 5.82 | % | | | 0.49 | % | | | 5.86 | % | | | (1.16 | %) | | | 3.17 | % |
| | | | | | | | | | | | | | | | | | | | | |
Ratios to average net assets(b) | | | | | | | | | | | | | | | | | | | | |
| | | | | |
Total gross expenses | | | 0.80 | % | | | 0.80 | % | | | 0.80 | % | | | 0.79 | % | | | 0.81 | %(c) |
| | | | | | | | | | | | | | | | | | | | | |
Total net expenses(d) | | | 0.80 | % | | | 0.80 | % | | | 0.80 | % | | | 0.79 | % | | | 0.81 | %(c) |
| | | | | | | | | | | | | | | | | | | | | |
Net investment income | | | 2.01 | % | | | 1.86 | % | | | 2.09 | % | | | 1.88 | % | | | 2.09 | %(c) |
| | | | | | | | | | | | | | | | | | | | | |
Supplemental data | | | | | | | | | | | | | | | | | | | | |
| | | | | |
Net assets, end of period (in thousands) | | | $6,614,680 | | | | $5,097,458 | | | | $4,656,220 | | | | $4,013,878 | | | | $4,741,043 | |
| | | | | | | | | | | | | | | | | | | | | |
Portfolio turnover | | | 289 | % | | | 269 | % | | | 207 | % | | | 213 | % | | | 78 | % |
| | | | | | | | | | | | | | | | | | | | | |
Notes to Financial Highlights
| (a) | Based on operations from April 20, 2012 (commencement of operations) through the stated period end. |
| (b) | In addition to the fees and expenses that the Fund bears directly, the Fund indirectly bears a pro rata share of the fees and expenses of any other funds in which it invests. Such indirect expenses are not included in the Fund’s reported expense ratios. |
| (d) | Total net expenses include the impact of certain fee waivers/expense reimbursements made by the Investment Manager and certain of its affiliates, if applicable. |
The accompanying Notes to Financial Statements are an integral part of this statement.
| | | | | | |
| | |
| | | | ACTIVE PORTFOLIOS® MULTI-MANAGER TOTAL RETURN BOND FUND | | |
NOTES TO FINANCIAL STATEMENTS
August 31, 2016
Note 1. Organization
Active Portfolios® Multi-Manager Total Return Bond Fund (the Fund), a series of Columbia Funds Series Trust I (the Trust), is a diversified fund. The Trust is registered under the Investment Company Act of 1940, as amended (the 1940 Act), as an open-end management investment company organized as a Massachusetts business trust. Effective April 11, 2016, Active Portfolios® Multi-Manager Core Plus Bond Fund was renamed Active Portfolios® Multi-Manager Total Return Bond Fund.
Fund Shares
The Trust may issue an unlimited number of shares (without par value). The Fund only offers Class A shares that are available only to certain eligible investors through certain wrap fee programs sponsored and/or managed by Ameriprise Financial, Inc. (Ameriprise Financial) or its affiliates.
Class A shares are not subject to any front-end sales charge or contingent deferred sales charge.
Note 2. Summary of Significant Accounting Policies
Basis of Preparation
The Fund is an investment company that applies the accounting and reporting guidance in the Financial Accounting Standards Board (FASB) Accounting Standards Codification Topic 946, Financial Services — Investment Companies (ASC 946). The financial statements are prepared in accordance with U.S. generally accepted accounting principles (GAAP), which requires management to make certain estimates and assumptions that affect the reported amounts of assets and liabilities, the disclosure of contingent assets and liabilities at the date of the financial statements and the reported amounts of income and expenses during the reporting period. Actual results could differ from those estimates.
The following is a summary of significant accounting policies followed by the Fund in the preparation of its financial statements.
Security Valuation
Debt securities generally are valued by pricing services approved by the Board of Trustees (the Board) based upon market transactions for normal, institutional-size trading units of similar securities. The services may use various pricing techniques that take into account, as applicable, factors such as yield, quality, coupon rate,
maturity, type of issue, trading characteristics and other data, as well as approved independent broker-dealer quotes. Debt securities for which quotations are not readily available or not believed to be reflective of market value may also be valued based upon a bid quote from an approved independent broker-dealer. Debt securities maturing in 60 days or less are valued primarily at amortized cost value, unless this method results in a valuation that management believes does not approximate market value.
Asset- and mortgage-backed securities are generally valued by pricing services, which utilize pricing models that incorporate the securities’ cash flow and loan performance data. These models also take into account available market data, including trades, market quotations, and benchmark yield curves for identical or similar securities. Factors used to identify similar securities may include, but are not limited to, issuer, collateral type, vintage, prepayment speeds, collateral performance, credit ratings, credit enhancement and expected life. Asset-backed securities for which quotations are readily available may also be valued based upon an over-the-counter or exchange bid quote from an approved independent broker-dealer.
Senior loan securities for which reliable market quotations are readily available are generally valued by pricing services at the average of the bids received.
All equity securities and exchange-traded funds are valued at the close of business of the New York Stock Exchange (NYSE). Equity securities and exchange-traded funds are valued at the last quoted sales price on the principal exchange or market on which they trade, except for securities traded on the NASDAQ Stock Market, which are valued at the NASDAQ official close price. Unlisted securities or listed securities for which there were no sales during the day are valued at the mean of the latest quoted bid and ask prices on such exchanges or markets.
Foreign equity securities are valued based on the closing price on the foreign exchange in which such securities are primarily traded. If any foreign equity security closing prices are not readily available, the securities are valued at the mean of the latest quoted bid and ask prices on such exchanges or markets. Foreign currency exchange rates are generally determined at 4:00 p.m. Eastern (U.S.) time. Many securities markets and exchanges outside the U.S. close prior to the close of the NYSE; therefore, the closing prices for securities in such markets or on such exchanges may not fully reflect events that occur after such close but before the close of
| | | | | | |
| | |
| | | | ACTIVE PORTFOLIOS® MULTI-MANAGER TOTAL RETURN BOND FUND | | |
NOTES TO FINANCIAL STATEMENTS (continued)
August 31, 2016
the NYSE. In those situations, foreign securities will be fair valued pursuant to a policy adopted by the Board, including, if available, utilizing a third party pricing service to determine these fair values. The third party pricing service takes into account multiple factors, including, but not limited to, movements in the U.S. securities markets, certain depositary receipts, futures contracts and foreign exchange rates that have occurred subsequent to the close of the foreign exchange or market, to determine a good faith estimate that reasonably reflects the current market conditions as of the close of the NYSE. The fair value of a security is likely to be different from the quoted or published price, if available.
Investments in open-end investment companies, including money market funds, are valued at their latest net asset value.
Forward foreign currency exchange contracts are marked-to-market based upon foreign currency exchange rates provided by a pricing service.
Futures and options on futures contracts are valued based upon the settlement price at the close of regular trading on their principal exchanges or, in the absence of transactions, at the mean of the latest quoted bid and ask prices.
Swap transactions are valued through an independent pricing service or broker, or if neither is available, through an internal model based upon observable inputs.
Investments for which market quotations are not readily available, or that have quotations which management believes are not reflective of market value or reliable, are valued at fair value as determined in good faith under procedures approved by and under the general supervision of the Board. If a security or class of securities (such as foreign securities) is valued at fair value, such value is likely to be different from the quoted or published price for the security.
The determination of fair value often requires significant judgment. To determine fair value, management may use assumptions including but not limited to future cash flows and estimated risk premiums. Multiple inputs from various sources may be used to determine fair value.
GAAP requires disclosure regarding the inputs and valuation techniques used to measure fair value and any changes in valuation inputs or techniques. In addition, investments shall be disclosed by major category. This information is disclosed following the Fund’s Portfolio of Investments.
Foreign Currency Transactions and Translations
The values of all assets and liabilities denominated in foreign currencies are generally translated into U.S. dollars at exchange rates determined at the close of the NYSE on any given day. Net realized and unrealized gains (losses) on foreign currency transactions and translations include gains (losses) arising from the fluctuation in exchange rates between trade and settlement dates on securities transactions, gains (losses) arising from the disposition of foreign currency and currency gains (losses) between the accrual and payment dates on dividends, interest income and foreign withholding taxes.
For financial statement purposes, the Fund does not distinguish that portion of gains (losses) on investments which is due to changes in foreign exchange rates from that which is due to changes in market prices of the investments. Such fluctuations are included with the net realized and unrealized gains (losses) on investments in the Statement of Operations.
Derivative Instruments
The Fund invests in certain derivative instruments, as detailed below, to meet its investment objectives. Derivatives are instruments whose values depend on, or are derived from, in whole or in part, the value of one or more securities, currencies, commodities, indices, or other assets or instruments. Derivatives may be used to increase investment flexibility (including to maintain cash reserves while maintaining desired exposure to certain assets), for risk management (hedging) purposes, to facilitate trading, to reduce transaction costs and to pursue higher investment returns. The Fund may also use derivative instruments to mitigate certain investment risks, such as foreign currency exchange rate risk, interest rate risk and credit risk. Derivatives may involve various risks, including the potential inability of the counterparty to fulfill its obligations under the terms of the contract, the potential for an illiquid secondary market (making it difficult for the Fund to sell or terminate, including at favorable prices) and the potential for market movements which may expose the Fund to gains or losses in excess of the amount shown in the Statement of Assets and Liabilities. The notional amounts of derivative instruments, if applicable, are not recorded in the financial statements.
A derivative instrument may suffer a marked-to-market loss if the value of the contract decreases due to an unfavorable change in the market rates or values of the underlying instrument. Losses can also occur if the counterparty does not perform its obligations under the
| | | | | | |
| | |
| | | | ACTIVE PORTFOLIOS® MULTI-MANAGER TOTAL RETURN BOND FUND | | |
NOTES TO FINANCIAL STATEMENTS (continued)
August 31, 2016
contract. The Fund’s risk of loss from counterparty credit risk on over-the-counter derivatives is generally limited to the aggregate unrealized gain netted against any collateral held by the Fund and the amount of any variation margin held by the counterparty, plus any replacement costs or related amounts. With exchange-traded or centrally cleared derivatives, there is reduced counterparty credit risk to the Fund since the clearinghouse or central counterparty (CCP) provides some protection in the case of clearing member default. The clearinghouse or CCP stands between the buyer and the seller of the contract; therefore, additional counterparty credit risk is failure of the clearinghouse or CCP. However, credit risk still exists in exchange-traded or centrally cleared derivatives with respect to initial and variation margin that is held in a broker’s customer account. While brokers are required to segregate customer margin from their own assets, in the event that a broker becomes insolvent or goes into bankruptcy and at that time there is a shortfall in the aggregate amount of margin held by the broker for all its clients, U.S. bankruptcy laws will typically allocate that shortfall on a pro-rata basis across all the broker’s customers (including the Fund), potentially resulting in losses to the Fund.
In order to better define its contractual rights and to secure rights that will help the Fund mitigate its counterparty risk, the Fund may enter into an International Swaps and Derivatives Association, Inc. Master Agreement (ISDA Master Agreement) or similar agreement with its derivatives contract counterparties. An ISDA Master Agreement is an agreement between the Fund and a counterparty that governs over-the-counter derivatives and typically contains, among other things, collateral posting terms and netting provisions in the event of a default and/or termination event. Under an ISDA Master Agreement, the Fund may, under certain circumstances, offset with the counterparty certain derivative instrument’s payables and/or receivables with collateral held and/or posted and create one single net payment. The provisions of the ISDA Master Agreement typically permit a single net payment in the event of default (close-out netting), including the bankruptcy or insolvency of the counterparty. Note, however, that bankruptcy or insolvency laws of a particular jurisdiction may impose restrictions on or prohibitions against the right of offset or netting in bankruptcy, insolvency or other events.
Collateral (margin) requirements differ by type of derivative. Margin requirements are established by the clearinghouse or CCP for exchange-traded and centrally cleared derivatives. Brokers can ask for margin in excess
of the minimum in certain circumstances. Collateral terms are contract specific for over-the-counter derivatives. For over-the-counter derivatives traded under an ISDA Master Agreement, the collateral requirements are typically calculated by netting the marked-to-market amount for each transaction under such agreement and comparing that amount to the value of any variation margin currently pledged by the Fund and/or the counterparty. Generally, the amount of collateral due from or to a party has to exceed a minimum transfer amount threshold (e.g., $250,000) before a transfer has to be made. To the extent amounts due to the Fund from its counterparties are not fully collateralized, contractually or otherwise, the Fund bears the risk of loss from counterparty nonperformance. The Fund attempts to mitigate counterparty risk by only entering into agreements with counterparties that it believes have the financial resources to honor their obligations and by monitoring the financial stability of those counterparties.
Certain ISDA Master Agreements allow counterparties to over-the-counter derivatives transactions to terminate derivatives contracts prior to maturity in the event the Fund’s net asset value declines by a stated percentage over a specified time period or if the Fund fails to meet certain terms of the ISDA Master Agreement, which would cause the Fund to accelerate payment of any net liability owed to the counterparty. The Fund also has termination rights if the counterparty fails to meet certain terms of the ISDA Master Agreement. In addition to considering counterparty credit risk, the Fund would consider terminating the derivatives contracts based on whether termination would result in a net liability owed from the counterparty.
For financial reporting purposes, the Fund does not offset derivative assets and derivative liabilities that are subject to netting arrangements in the Statement of Assets and Liabilities.
Forward Foreign Currency Exchange Contracts
Forward foreign currency exchange contracts are over-the-counter agreements between two parties to buy and sell a currency at a set price on a future date. The Fund utilized forward foreign currency exchange contracts to hedge the currency exposure associated with some or all of the Fund’s securities and to shift foreign currency exposure back to U.S. dollars. These instruments may be used for other purposes in future periods.
The values of forward foreign currency exchange contracts fluctuate daily with changes in foreign currency exchange rates. Changes in the value of these contracts
| | | | | | |
| | |
| | | | ACTIVE PORTFOLIOS® MULTI-MANAGER TOTAL RETURN BOND FUND | | |
NOTES TO FINANCIAL STATEMENTS (continued)
August 31, 2016
are recorded as unrealized appreciation or depreciation until the contract is exercised or has expired. The Fund will realize a gain or loss when the forward foreign currency exchange contract is closed or expires.
The use of forward foreign currency exchange contracts does not eliminate fluctuations in the prices of the Fund’s portfolio securities. The risks of forward foreign currency exchange contracts include movement in the values of the foreign currencies relative to the U.S. dollar (or other foreign currencies) and the possibility that counterparties will not complete their contractual obligations, which may be in excess of the amount reflected, if any, in the Statement of Assets and Liabilities.
Futures Contracts
Futures contracts are exchange-traded and represent commitments for the future purchase or sale of an asset at a specified price on a specified date. The Fund bought and sold futures contracts to manage the duration and yield curve exposure of the Fund versus the benchmark and to manage exposure to movements in interest rates. These instruments may be used for other purposes in future periods. Upon entering into futures contracts, the Fund bears risks that it may not achieve the anticipated benefits of the futures contracts and may realize a loss. Additional risks include counterparty credit risk, the possibility of an illiquid market, and that a change in the value of the contract or option may not correlate with changes in the value of the underlying asset.
Upon entering into a futures contract, the Fund deposits cash or securities with the broker, known as a futures commissions merchant (FCM), in an amount sufficient to meet the initial margin requirement. The initial margin deposit must be maintained at an established level over the life of the contract. Cash deposited as initial margin is recorded in the Statement of Assets and Liabilities as margin deposits. Securities deposited as initial margin are designated in the Portfolio of Investments. Subsequent payments (variation margin) are made or received by the Fund each day. The variation margin payments are equal to the daily change in the contract value and are recorded as variation margin receivable or payable and are offset in unrealized gains or losses. The Fund recognizes a realized gain or loss when the contract is closed or expires. Futures contracts involve, to varying degrees, risk of loss in excess of the variation margin disclosed in the Statement of Assets and Liabilities.
Swap Contracts
Swap contracts are negotiated in the over-the-counter market and may be entered into as a bilateral contract or centrally cleared (centrally cleared swap contract). In a centrally cleared swap contract, immediately following execution of the swap contract with a broker, the swap contract is novated to a central counterparty (the CCP) and the CCP becomes the Fund’s counterparty to the centrally cleared swap contract. The Fund is required to deposit initial margin with the FCM, which pledges it through to the CCP in the form of cash or securities in an amount that varies depending on the size and risk profile of the particular swap contract. Securities deposited as initial margin are designated in the Portfolio of Investments and cash deposited is recorded in the Statement of Assets and Liabilities as margin deposits. Unlike a bilateral swap contract, for centrally cleared swap contracts, the Fund has less credit exposure to the FCM because the CCP stands between the Fund and the relevant buyer/seller on the other side of the contract. Swap contracts are marked-to-market daily and changes in value are recorded as unrealized appreciation (depreciation). The daily change in valuation of centrally cleared swap contracts, if any, is recorded as a receivable or payable for variation margin in the Statement of Assets and Liabilities.
Entering into these contracts involves, to varying degrees, elements of interest, liquidity and counterparty credit risk in excess of the amounts recognized in the Statements of Assets and Liabilities. Such risks involve the possibility that there may be unfavorable changes in interest rates, market conditions or other conditions, it may be difficult to initiate a swap transaction or liquidate a position at an advantageous time or price which may result in significant losses, and that the FCM or CCP may not fulfill its obligation under the contract.
Credit Default Swap Contracts
The Fund entered into credit default swap contracts to manage credit risk exposure, to increase or decrease its credit exposure to an index and to increase or decrease its credit exposure to a single issuer of debt securities. Additionally, credit default swap contracts were used to hedge the Fund’s exposure on a debt security that it owns or in lieu of selling such debt security. These instruments may be used for other purposes in future periods. Credit default swap contracts are agreements in which one party pays fixed periodic payments to a counterparty in consideration for an agreement from the counterparty to make a specific payment should a
| | | | | | |
| | |
| | | | ACTIVE PORTFOLIOS® MULTI-MANAGER TOTAL RETURN BOND FUND | | |
NOTES TO FINANCIAL STATEMENTS (continued)
August 31, 2016
specified credit event(s) take place. Although specified credit events are contract specific, credit events are generally defined as bankruptcy, failure to pay, restructuring, obligation acceleration, obligation default, or repudiation/moratorium.
As the purchaser of a credit default swap contract, the Fund purchases protection by paying a periodic interest rate on a notional amount to the counterparty. The interest amount is accrued daily as a component of unrealized appreciation (depreciation) and is recorded as a realized loss upon payment. If a credit event as specified in the contract occurs, the Fund may have the option either to deliver the reference obligation to the seller in exchange for a cash payment of its par amount, or to receive a net cash settlement equal to the par amount less an agreed-upon value of the reference obligation as of the date of the credit event. The difference between the value of the obligation or cash delivered and the notional amount received will be recorded as a realized gain (loss).
As the seller of a credit default swap contract, the Fund sells protection to a buyer and will generally receive a periodic interest rate on a notional amount. The interest amount is accrued daily as a component of unrealized appreciation (depreciation) and is recorded as a realized gain upon receipt of the payment. If a credit event as specified in the contract with the counterparty occurs, the Fund may either be required to accept the reference obligation from the buyer in exchange for a cash payment of its notional amount, or to pay the buyer a net cash settlement equal to the notional amount less an agreed-upon value of the reference obligation (recovery value) as of the date of the credit event. The difference between the value of the obligation or cash received and the notional amount paid will be recorded as a realized gain (loss). The maximum potential amount of undiscounted future payments the Fund could be required to make as the seller of protection under a credit default swap contract is equal to the notional amount of the reference obligation. These potential amounts may be partially offset by any recovery values of the respective reference obligations or premiums received upon entering into the agreement. The notional amounts and market values of all credit default swap contracts in which the Fund is the seller of protection, if any, are disclosed in the Credit Default Swap Contracts Outstanding schedule following the Portfolio of Investments.
As a protection seller, the Fund bears the risk of loss from the credit events specified in the contract with the counterparty. For credit default swap contracts on credit
indices, quoted market prices and resulting market values serve as an indicator of the current status of the payment/performance risk. Increasing market values, in absolute terms when compared to the notional amount of the swap, represent a deterioration of the reference entity’s credit soundness and a greater likelihood or risk of default or other credit event occurring as defined under the terms of the contract.
Any premium paid or received by the Fund upon entering into a credit default swap contract is recorded as an asset or liability, respectively, and amortized daily as a component of realized gain (loss) in the Statement of Operations. Credit default swap contracts are valued daily, and the change in value is recorded as unrealized appreciation (depreciation) until the termination of the swap, at which time a realized gain (loss) is recorded.
Credit default swap contracts can involve greater risks than if a fund had invested in the reference obligation directly since, in addition to general market risks, credit default swaps are subject to counterparty credit risk, leverage risk, hedging risk, correlation risk and liquidity risk.
Interest Rate Swap Contracts
The Fund entered into interest rate swap transactions which may include inflation rate swap contracts to gain exposure to or protect itself from market rate changes and to hedge the portfolio risk associated with some or all of the Fund’s securities. These instruments may be used for other purposes in future periods. An interest rate swap is an agreement between two parties where there are two flows and payments are made between the two counterparties and the payments are dependent upon changes in an interest rate, inflation rate or inflation index calculated on a nominal amount. Interest rate swaps are agreements between two parties that involve the exchange of one type of interest rate for another type of interest rate cash flow on specified dates in the future, based on a predetermined, specified notional amount. Certain interest rate swaps are considered forward-starting, whereby the accrual for the exchange of cash flows does not begin until a specified date in the future. The net cash flow for a standard interest rate swap transaction is generally the difference between a floating market interest rate versus a fixed interest rate.
Interest rate swaps are valued daily and unrealized appreciation (depreciation) is recorded. Certain interest rate swaps may accrue periodic interest on a daily basis as a component of unrealized appreciation (depreciation); the Fund will realize a gain or loss upon the payment or receipt of accrued interest. The Fund will realize a gain or a loss when the interest rate swap is terminated.
| | | | | | |
| | |
| | | | ACTIVE PORTFOLIOS® MULTI-MANAGER TOTAL RETURN BOND FUND | | |
NOTES TO FINANCIAL STATEMENTS (continued)
August 31, 2016
Effects of Derivative Transactions in the Financial Statements
The following tables are intended to provide additional information about the effect of derivatives on the financial statements of the Fund, including: the fair value of derivatives by risk category and the location of those fair values in the Statement of Assets and Liabilities; and the impact of derivative transactions over the period in the Statement of Operations, including realized and unrealized gains (losses). The derivative instrument schedules following the Portfolio of Investments present additional information regarding derivative instruments outstanding at the end of the period, if any.
The following table is a summary of the fair value of derivative instruments (not considered to be hedging instruments for accounting disclosure purposes) at August 31, 2016:
| | | | | | |
| | | | | | | |
| | | Asset Derivatives | |
Risk Exposure
Category | | Statement of Assets and Liabilities Location | | | Fair Value ($) | |
Credit risk | | Net assets — unrealized appreciation on swap contracts | | | 3,464,113 | * |
Credit risk | | Premiums paid on outstanding swap contracts | | | 6,390,122 | |
Foreign exchange risk | | Unrealized appreciation on forward foreign currency exchange contracts | | | 5,108 | |
Interest rate risk | | Net assets — unrealized appreciation on futures contracts | | | 205,953 | * |
Interest rate risk | | Net assets — unrealized appreciation on swap contracts | | | 1,151,835 | * |
Total | | | | | 11,217,131 | |
| | Liability Derivatives | |
Risk Exposure
Category | | Statement of Assets and Liabilities Location | | | Fair Value ($) | |
Credit risk | | Net assets — unrealized depreciation on swap contracts | | | 6,301,634 | * |
Credit risk | | Premiums received on outstanding swap contracts | | | 11,059,097 | |
Interest rate risk | | Net assets — unrealized depreciation on futures contracts | | | 2,298,866 | * |
Interest rate risk | | Net assets — unrealized depreciation on swap contracts | | | 9,913,279 | * |
Total | | | | | 29,572,876 | |
| * | Includes cumulative appreciation (depreciation) as reported in the tables following the Portfolio of Investments. Only the current day’s variation margin is reported in receivables or payables in the Statement of Assets and Liabilities. |
The following table indicates the effect of derivative instruments (not considered to be hedging instruments for accounting disclosure purposes) in the Statement of Operations for the year ended August 31, 2016:
| | | | | | | | | | | | | | | | |
| | | | | | | | | | | | | | | | | |
| Amount of Realized Gain (Loss) on Derivatives Recognized in Income | |
Risk Exposure
Category | | Forward
Foreign
Currency
Exchange
Contracts
($) | | | Futures
Contracts
($) | | | Swap
Contracts
($) | | | Total
($) | |
Credit risk | | | — | | | | — | | | | (12,616,159 | ) | | | (12,616,159 | ) |
| | | | | | | | | | | | | | | | | |
Foreign exchange risk | | | (48,399 | ) | | | — | | | | — | | | | (48,399 | ) |
| | | | | | | | | | | | | | | | | |
Interest rate risk | | | — | | | | 8,484,574 | | | | (708,435 | ) | | | 7,776,139 | |
| | | | | | | | | | | | | | | | | |
Total | | | (48,399 | ) | | | 8,484,574 | | | | (13,324,594 | ) | | | (4,888,419 | ) |
| | | | | | | | | | | | | | | | | |
Change in Unrealized Appreciation (Depreciation) on Derivatives Recognized
in Income | |
Risk Exposure
Category | | Forward
Foreign
Currency
Exchange
Contracts
($) | | | Futures
Contracts
($) | | | Swap
Contracts
($) | | | Total
($) | |
Credit risk | | | — | | | | — | | | | (2,721,169 | ) | | | (2,721,169 | ) |
| | | | | | | | | | | | | | | | | |
Foreign exchange risk | | | 5,032 | | | | — | | | | — | | | | 5,032 | |
| | | | | | | | | | | | | | | | | |
Interest rate risk | | | — | | | | (3,094,399 | ) | | | (8,761,444 | ) | | | (11,855,843 | ) |
| | | | | | | | | | | | | | | | | |
Total | | | 5,032 | | | | (3,094,399 | ) | | | (11,482,613 | ) | | | (14,571,980 | ) |
| | | | | | | | | | | | | | | | | |
The following table provides a summary of the average outstanding volume by derivative instrument for the year ended August 31, 2016:
| | | | |
| Derivative Instrument | | Average Notional
Amounts ($)* | |
Futures contracts — Long | | | 955,972,643 | |
Futures contracts — Short | | | 371,558,874 | |
Credit default swap contracts — buy protection | | | 408,536,349 | |
Credit default swap contracts — sell protection | | | 91,108,750 | |
| | | | | | | | |
| Derivative Instrument | | Average
Unrealized
Appreciation ($)* | | | Average
Unrealized
Depreciation ($)* | |
Forward foreign currency exchange contracts | | | 1,277 | | | | — | |
Interest rate swap contracts | | | 287,959 | | | | (2,588,938 | ) |
| * | Based on the ending quarterly outstanding amounts for the year ended August 31, 2016. |
Investments in Senior Loans
The Fund may invest in senior loan assignments. When the Fund purchases an assignment of a senior loan, the Fund typically has direct rights against the borrower;
| | | | | | |
| | |
| | | | ACTIVE PORTFOLIOS® MULTI-MANAGER TOTAL RETURN BOND FUND | | |
NOTES TO FINANCIAL STATEMENTS (continued)
August 31, 2016
provided, however, that the Fund’s rights may be more limited than the lender from which it acquired the assignment and the Fund may be able to enforce its rights only through an administrative agent. Although certain senior loan assignments are secured by collateral, the Fund could experience delays or limitations in realizing such collateral or have its interest subordinated to other indebtedness of the obligor. In the event that the administrator or collateral agent of a loan becomes insolvent, enters into receivership or bankruptcy, the Fund may incur costs and delays in realizing payment or may suffer a loss of principal and/or interest. The risk of loss is greater for unsecured or subordinated loans. In addition, senior loan assignments are vulnerable to market, economic or other conditions or events that may reduce the demand for senior loan assignments and certain senior loan assignments which were liquid, when purchased, may become illiquid.
The Fund may enter into senior loan assignments where all or a portion of the loan may be unfunded. The Fund is obligated to fund these commitments at the borrower’s discretion. These commitments are generally traded and priced in the same manner as other senior loan securities and are disclosed as unfunded senior loan commitments in the Fund’s Portfolio of Investments with a corresponding payable for investments purchased. The Fund designates cash or liquid securities to cover these commitments.
Asset- and Mortgage-Backed Securities
The Fund may invest in asset-backed and mortgage-backed securities. The maturity dates shown represent the original maturity of the underlying obligation. Actual maturity may vary based upon prepayment activity on these obligations. All, or a portion, of the obligation may be prepaid at any time because the underlying asset may be prepaid. As a result, decreasing market interest rates could result in an increased level of prepayment. An increased prepayment rate will have the effect of shortening the maturity of the security. Unless otherwise noted, the coupon rates presented are fixed rates.
Delayed Delivery Securities
The Fund may trade securities on other than normal settlement terms, including securities purchased or sold on a “when-issued” basis. This may increase risk to the Fund since the other party to the transaction may fail to deliver, which could cause the Fund to subsequently invest at less advantageous prices. The Fund designates cash or liquid securities in an amount equal to the delayed delivery commitment.
Mortgage Dollar Roll Transactions
The Fund may enter into mortgage “dollar rolls” in which the Fund sells securities for delivery in the current month and simultaneously contracts with the same counterparty to repurchase similar but not identical securities (same type, coupon and maturity) on a specified future date. During the roll period, the Fund loses the right to receive principal and interest paid on the securities sold. However, the Fund will benefit because it receives negotiated amounts in the form of reductions of the purchase price for the future purchase plus the interest earned on the cash proceeds of the securities sold until the settlement date of the forward purchase. The Fund records the incremental difference between the forward purchase and sale of each forward roll as a realized gain or loss. Unless any realized gains exceed the income, capital appreciation, and gain or loss due to mortgage prepayments that would have been realized on the securities sold as part of the mortgage dollar roll, the use of this technique will diminish the investment performance of the Fund compared to what the performance would have been without the use of mortgage dollar rolls. All cash proceeds will be invested in instruments that are permissible investments for the Fund. The Fund identifies cash or liquid securities in an amount equal to the forward purchase price.
For financial reporting and tax purposes, the Fund treats “to be announced” mortgage dollar rolls as two separate transactions, one involving the purchase of a security and a separate transaction involving a sale. These transactions may increase the Fund’s portfolio turnover rate. The Fund does not currently enter into mortgage dollar rolls that are accounted for as financing transactions.
Mortgage dollar rolls involve the risk that the market value of the securities the Fund is obligated to repurchase may decline below the repurchase price, or that the counterparty may default on its obligations.
To Be Announced Securities
The Fund may trade securities on a To Be Announced (TBA) basis. As with other delayed-delivery transactions, a seller agrees to issue a TBA security at a future date. However, the seller does not specify the particular securities to be delivered. Instead, the Fund agrees to accept any security that meets specified terms.
In some cases, Master Securities Forward Transaction Agreements (MSFTAs) may be used to govern transactions of certain forward-settling agency mortgage-backed securities, such as delayed-delivery and TBAs,
| | | | | | |
| | |
| | | | ACTIVE PORTFOLIOS® MULTI-MANAGER TOTAL RETURN BOND FUND | | |
NOTES TO FINANCIAL STATEMENTS (continued)
August 31, 2016
between the Fund and counterparty. The MSFTA maintains provisions for, among other things, initiation and confirmation, payment and transfer, events of default, termination, and maintenance of collateral relating to such transactions.
Treasury Inflation Protected Securities
The Fund may invest in treasury inflation protected securities (TIPS). The principal amount of TIPS is adjusted periodically and is increased for inflation or decreased for deflation based on a monthly published index. These adjustments are recorded as interest income in the Statement of Operations. Coupon payments are based on the adjusted principal at the time the interest is paid.
Interest Only and Principal Only Securities
The Fund may invest in Interest Only (IO) or Principal Only (PO) securities. IOs are stripped securities entitled to receive all of the security’s interest, but none of its principal. IOs are particularly sensitive to changes in
interest rates and therefore subject to greater fluctuations in price than typical interest bearing debt securities. IOs are also subject to credit risk because the Fund may not receive all or part of the interest payments if the issuer, obligor, guarantor or counterparty defaults on its obligation. Payments received for IOs are included in interest income on the Statement of Operations. Because no principal will be received at the maturity of an IO, adjustments are made to the cost of the security on a monthly basis until maturity. POs are stripped securities entitled to receive the principal from the underlying obligation, but not the interest. POs are particularly sensitive to changes in interest rates and therefore are subject to fluctuations in price. POs are also subject to credit risk because the Fund may not receive all or part of its principal if the issuer, obligor, guarantor or counterparty defaults on its obligation. The Fund may also invest in IO or PO stripped mortgage-backed securities. Payments received for POs are treated as reductions to the cost and par value of the securities.
Offsetting of Assets and Liabilities
The following table presents the Fund’s gross and net amount of assets and liabilities available for offset under netting arrangements as well as any related collateral received or pledged by the Fund as of August 31, 2016:
| | | | | | | | | | | | | | | | | | | | | | | | | | | | | | | | | | | | |
| | | | | | | | | | | | | | | | | | | | | | | | | | | | | | | | | | | | | |
| | |
| Barclays
($) |
| |
| Citi
($ |
) | |
| Credit
Suisse
($ |
) | |
| Goldman
Sachs
International
($ |
) | |
| JPMorgan
($)(e) |
| |
| JPMorgan
($)(e) |
| |
| Morgan
Stanley
($)(e) |
| |
| Morgan
Stanley
($)(e) |
| |
| Total
($) |
|
Assets | | | | | | | | | | | | | | | | | | | | | | | | | | | | | | | | | | | | |
Centrally cleared credit default swap contracts(a) | | | — | | | | — | | | | — | | | | — | | | | — | | | | — | | | | — | | | | 92,201 | | | | 92,201 | |
Centrally cleared interest rate swap contracts(a) | | | — | | | | — | | | | — | | | | — | | | | — | | | | 660,246 | | | | — | | | | — | | | | 660,246 | |
Forward foreign currency exchange contracts | | | 5,108 | | | | — | | | | — | | | | — | | | | — | | | | — | | | | — | | | | — | | | | 5,108 | |
OTC credit default swap contracts(b) | | | 215,211 | | | | 1,951,726 | | | | — | | | | 135,758 | | | | 1,619,818 | | | | — | | | | 395,275 | | | | — | | | | 4,317,788 | |
Total Assets | | | 220,319 | | | | 1,951,726 | | | | — | | | | 135,758 | | | | 1,619,818 | | | | 660,246 | | | | 395,275 | | | | 92,201 | | | | 5,075,343 | |
Liabilities | | | | | | | | | | | | | | | | | | | | | | | | | | | | | | | | | | | | |
OTC credit default swap contracts(b) | | | 1,057,221 | | | | 1,065,667 | | | | 769,298 | | | | 3,131,655 | | | | 1,334,025 | | | | — | | | | 2,878,218 | | | | — | | | | 10,236,084 | |
Total Liabilities | | | 1,057,221 | | | | 1,065,667 | | | | 769,298 | | | | 3,131,655 | | | | 1,334,025 | | | | — | | | | 2,878,218 | | | | — | | | | 10,236,084 | |
Total Financial and Derivative Net Assets | | | (836,902 | ) | | | 886,059 | | | | (769,298 | ) | | | (2,995,897 | ) | | | 285,793 | | | | 660,246 | | | | (2,482,943 | ) | | | 92,201 | | | | (5,160,741 | ) |
Total collateral received (pledged)(c) | | | (694,038 | ) | | | 886,059 | | | | (575,065 | ) | | | (2,627,415 | ) | | | 285,793 | | | | — | | | | (2,431,285 | ) | | | — | | | | (5,155,951 | ) |
Net Amount(d) | | | (142,864 | ) | | | — | | | | (194,233 | ) | | | (368,482 | ) | | | — | | | | 660,246 | | | | (51,658 | ) | | | 92,201 | | | | (4,790 | ) |
| (a) | Centrally cleared swaps are included within payable/receivable for variation margin on the Statement of Assets and Liabilities. |
| (b) | Over-the-Counter Swap Contracts are presented at market value plus periodic payments receivable (payable), which is comprised of unrealized appreciation, unrealized depreciation, premiums paid and premiums received. |
| (c) | In some instances, the actual collateral received and/or pledged may be more than the amount shown due to overcollateralization. |
| (d) | Represents the net amount due from/(to) counterparties in the event of default. |
| (e) | Exposure can only be netted across transactions governed under the same master agreement with the same legal entity. |
| | | | | | |
| | |
| | | | ACTIVE PORTFOLIOS® MULTI-MANAGER TOTAL RETURN BOND FUND | | |
NOTES TO FINANCIAL STATEMENTS (continued)
August 31, 2016
Security Transactions
Security transactions are accounted for on the trade date. Cost is determined and gains (losses) are based upon the specific identification method for both financial statement and federal income tax purposes.
Trade date for senior loans purchased in the primary market is the date on which the loan is allocated. Trade date for senior loans purchased in the secondary market is the date on which the transaction is entered into.
Income Recognition
Interest income is recorded on an accrual basis. Market premiums and discounts, including original issue discounts, are amortized and accreted, respectively, over the expected life of the security on all debt securities, unless otherwise noted. The Fund classifies gains and losses realized on prepayments received on mortgage-backed securities as adjustments to interest income.
The Fund may place a debt security on non-accrual status and reduce related interest income when it becomes probable that the interest will not be collected and the amount of uncollectible interest can be reasonably estimated. A defaulted debt security is removed from non-accrual status when the issuer resumes interest payments or when collectibility of interest is reasonably assured.
Corporate actions and dividend income are generally recorded net of any non-reclaimable tax withholdings, on the ex-dividend date or upon receipt of ex-dividend notification in the case of certain foreign securities.
The Fund may receive distributions from holdings in equity securities, business development companies (BDCs), exchange-traded funds, other regulated investment companies (RICs), and real estate investment trusts (REITs), which report information on the tax character of their distributions annually. These distributions are allocated to dividend income, capital gain and return of capital based on actual information reported. Return of capital is recorded as a reduction of the cost basis of securities held. If the Fund no longer owns the applicable securities, return of capital is recorded as a realized gain. With respect to REITs, to the extent actual information has not yet been reported, estimates for return of capital are made by the Fund’s management. Management’s estimates are subsequently adjusted when the actual character of the distributions is disclosed by the REITs, which could result in a proportionate change in return of capital to shareholders.
Awards from class action litigation are recorded as a reduction of cost basis if the Fund still owns the applicable securities on the payment date. If the Fund no longer owns the applicable securities, the proceeds are recorded as realized gains.
The value of additional securities received as an income payment is recorded as income and increases the cost basis of such securities.
The Fund may receive other income from senior loans, including amendment fees, consent fees and commitment fees. These fees are recorded as income when received by the Fund. These amounts are included in Interest Income in the Statement of Operations.
Income and capital gain distributions from open-end investment companies, if any, are recorded on the ex-dividend date.
Expenses
General expenses of the Trust are allocated to the Fund and other funds of the Trust based upon relative net assets or other expense allocation methodologies determined by the nature of the expense. Expenses directly attributable to the Fund are charged to the Fund.
Federal Income Tax Status
The Fund intends to qualify each year as a regulated investment company under Subchapter M of the Internal Revenue Code, as amended, and will distribute substantially all of its taxable income (including net short-term capital gains), if any, for its tax year, and as such will not be subject to federal income taxes. In addition, the Fund intends to distribute in each calendar year substantially all of its net investment income, capital gains and certain other amounts, if any, such that the Fund should not be subject to federal excise tax. Therefore, no federal income or excise tax provision is recorded.
Foreign Taxes
The Fund may be subject to foreign taxes on income, gains on investments or currency repatriation, a portion of which may be recoverable. The Fund will accrue such taxes and recoveries, as applicable, based upon its current interpretation of tax rules and regulations that exist in the markets in which it invests.
Realized gains in certain countries may be subject to foreign taxes at the Fund level, based on statutory rates. The Fund accrues for such foreign taxes on realized and unrealized gains at the appropriate rate for each jurisdiction, as applicable. The amount, if any, is disclosed as a liability on the Statement of Assets and Liabilities.
| | | | | | |
| | |
| | | | ACTIVE PORTFOLIOS® MULTI-MANAGER TOTAL RETURN BOND FUND | | |
NOTES TO FINANCIAL STATEMENTS (continued)
August 31, 2016
Distributions to Shareholders
Distributions from net investment income, if any, are declared daily and paid monthly. Net realized capital gains, if any, are distributed at least annually. Income distributions and capital gain distributions are determined in accordance with federal income tax regulations, which may differ from GAAP.
Guarantees and Indemnifications
Under the Trust’s organizational documents and, in some cases, by contract, its officers and trustees are indemnified against certain liabilities arising out of the performance of their duties to the Trust or its funds. In addition, certain of the Fund’s contracts with its service providers contain general indemnification clauses. The Fund’s maximum exposure under these arrangements is unknown since the amount of any future claims that may be made against the Fund cannot be determined, and the Fund has no historical basis for predicting the likelihood of any such claims.
Note 3. Fees and Other Transactions with Affiliates
Management Services Fees
Effective January 1, 2016, the Fund entered into a Management Agreement with Columbia Management Investment Advisers, LLC (the Investment Manager), a wholly-owned subsidiary of Ameriprise Financial, Inc. (Ameriprise Financial). Under the Management Agreement, the Investment Manager provides the Fund with investment research and advice, as well as administrative and accounting services. The Investment Manager is responsible for the ultimate oversight of investments made by the Fund. The Fund’s subadvisers (see Subadvisory Agreements below) have the primary responsibility for the day-to-day portfolio management of their portion of the Fund. The management services fee is an annual fee that is equal to a percentage of the Fund’s average daily net assets that declines from 0.50% to 0.34% as the Fund’s net assets increase. Prior to January 1, 2016, the Fund paid the Investment Manager an annual fee for advisory services under an Investment Management Services Agreement and a separate annual fee for administrative and accounting services under an Administrative Services Agreement. The effective management services fee rate, net of waivers, for the year ended August 31, 2016 (reflecting all advisory and administrative services fees paid to the Investment Manager) was 0.46% of the Fund’s average daily net assets. For the period from September 1, 2015
through December 31, 2015, the investment advisory services fee paid to the Investment Manager was $7,029,420, and the administrative services fee paid to the Investment Manager was $985,615.
The Investment Manager has voluntarily agreed to waive a portion of the management services fee on Fund assets that are invested in affiliated mutual funds, exchange-traded funds and closed-end funds that pay a management services fee, or where applicable, an investment advisory fee to the Investment Manager. The Investment Manager, in its discretion, may revise or discontinue this arrangement at any time.
Subadvisory Agreement
The Investment Manager has entered into Subadvisory Agreements with Federated Investment Management Company (Federated), Loomis Sayles & Company, L.P. (Loomis Sayles), PGIM, Inc., the asset management arm of Prudential Financial (Prudential) and TCW Investment Management Company, each of which, together with the Investment Manager, manage a portion of the assets of the Fund. Loomis Sayles assumed the day-to-day management of a portion of the assets of the Fund effective April 11, 2016, and Prudential assumed the day-to-day management of a portion of the assets of the Fund effective May 16, 2016. Also effective May 16, 2016, Federated was removed as a subadviser. New investments in the Fund, net of any redemptions, are allocated in accordance with the Investment Manager’s determination, subject to the oversight of the Fund’s Board. Each subadviser’s proportionate share of investments in the Fund may also vary due to market fluctuations. The Investment Manager compensates each subadviser to manage the investment of the Fund’s assets.
Compensation of Board Members
Board members, who are not officers or employees of the Investment Manager or Ameriprise Financial, are compensated for their services to the Fund as disclosed in the Statement of Operations. These Board members may participate in a Deferred Compensation Plan (the Plan) which may be terminated at any time. Obligations of the Plan will be paid solely out of the Fund’s assets, and all amounts payable under the Plan constitute a general unsecured obligation of the Fund.
Compensation of Chief Compliance Officer
The Board has appointed a Chief Compliance Officer to the Fund in accordance with federal securities regulations. The Fund is allocated a portion of the
| | | | | | |
| | |
| | | | ACTIVE PORTFOLIOS® MULTI-MANAGER TOTAL RETURN BOND FUND | | |
NOTES TO FINANCIAL STATEMENTS (continued)
August 31, 2016
expenses associated with the Chief Compliance Officer based on relative net assets of the Trust.
Transactions with Affiliates
For the year ended August 31, 2016, the Fund engaged in purchase and/or sale transactions with affiliates and/or accounts that have a common investment manager (or affiliated investment managers), common directors/trustees, and/or common officers. Those purchase and sale transactions complied with provisions of Rule 17a-7 under the 1940 Act and were $3,170,095 and $1,477,790, respectively. The sale transactions resulted in a net realized gain of $26,583.
Transfer Agency Fees
Under a Transfer and Dividend Disbursing Agent Agreement, Columbia Management Investment Services Corp. (the Transfer Agent), an affiliate of the Investment Manager and a wholly-owned subsidiary of Ameriprise Financial, is responsible for providing transfer agency services to the Fund. The Transfer Agent has contracted with Boston Financial Data Services (BFDS) to serve as sub-transfer agent. The Transfer Agent pays the fees of BFDS for services as sub-transfer agent and BFDS is not entitled to reimbursement for such fees from the Fund (with the exception of out-of-pocket fees).
The Fund pays the Transfer Agent a monthly transfer agency fee based on the number or the average value of accounts, depending on the type of account. In addition, prior to October 1, 2016, the Transfer Agent also received sub-transfer agency fees based on a percentage of the average aggregate value of the Fund’s shares maintained in omnibus accounts (other than omnibus accounts for which American Enterprise Investment Services Inc. is the broker of record or accounts where the beneficial shareholder is a customer of Ameriprise Financial Services, Inc., for which the Transfer Agent receives a per account fee). Effective October 1, 2016, the Fund pays the Transfer Agent a fee for shareholder services based on the number of accounts or on a percentage of the average aggregate value of the Fund’s shares maintained in omnibus accounts up to the lesser of the amount charged by the servicing agent or a cap established by the Board from time to time.
The Transfer Agent also receives compensation from the Fund for various shareholder services and reimbursements for certain out-of-pocket fees.
For the year ended August 31, 2016, the Fund’s effective transfer agency fee rates as a percentage of average daily net assets of Class A shares was 0.06%.
Distribution and Service Fees
The Fund has an agreement with Columbia Management Investment Distributors, Inc. (the Distributor), an affiliate of the Investment Manager and a wholly-owned subsidiary of Ameriprise Financial, for distribution and shareholder services. The Board has approved, and the Fund has adopted, distribution and shareholder service plans (the Plans) applicable to certain share classes, which set the distribution and service fees for the Fund. These fees are calculated daily and are intended to compensate the Distributor and/or eligible selling and/or servicing agents for selling shares of the Fund and providing services to investors.
The Fund may pay a distribution fee up to 0.25% of the Fund’s average daily net assets attributable to Class A shares and a service fee of up to 0.25% of the Fund’s average daily net assets attributable to Class A shares, provided, however, that the aggregate fee shall not exceed 0.25% of the Fund’s average daily net assets attributable to Class A shares.
Expenses Waived/Reimbursed by the Investment Manager and its Affiliates
The Fund’s expense ratio is subject to an expense reimbursement arrangement pursuant to which fees will be waived and/or expenses reimbursed (excluding certain fees and expenses described below), so that the Fund’s net operating expenses, after giving effect to fees waived/expenses reimbursed and any balance credits and/or overdraft charges from the Fund’s custodian, do not exceed the annual rates of:
| | | | | | | | |
| | | Contractual Expense Cap January 1, 2016 Through December 31, 2016 | | | Voluntary Expense Cap Prior to January 1, 2016 | |
Class A | | | 0.86 | % | | | 0.86 | % |
The contractual agreement may be modified or amended only with approval from the Investment Manager, certain of its affiliates and the Fund. Under the arrangements, the following fees and expenses are excluded from the waiver/reimbursement commitment, and therefore will be paid by the Fund, if applicable: taxes (including foreign transaction taxes), expenses associated with investments in affiliated and non-affiliated pooled investment vehicles (including mutual funds and exchange-traded funds), transaction costs and brokerage commissions, costs related to any securities lending program, dividend and interest expenses associated with securities sold short, inverse floater program fees and
| | | | | | |
| | |
| | | | ACTIVE PORTFOLIOS® MULTI-MANAGER TOTAL RETURN BOND FUND | | |
NOTES TO FINANCIAL STATEMENTS (continued)
August 31, 2016
expenses, transaction charges and interest on borrowed money, interest and infrequent and/or unusual expenses. Any fees waived and/or expenses reimbursed under the expense reimbursement arrangements described above are not recoverable by the Investment Manager or its affiliates in future periods.
Note 4. Federal Tax Information
The timing and character of income and capital gain distributions are determined in accordance with income tax regulations, which may differ from GAAP because of temporary or permanent book to tax differences.
At August 31, 2016, these differences are primarily due to differing treatment for principal and/or interest from fixed income securities, deferral/reversal of wash sale losses, Trustees’ deferred compensation, distributions, foreign currency transactions, derivative investments, tax straddles, swap investments, swap reclassifications, non-deductible expenses, adjustments on certain convertible preferred securities and re-characterization of distributions for investments. To the extent these differences are permanent, reclassifications are made among the components of the Fund’s net assets in the Statement of Assets and Liabilities. Temporary differences do not require reclassifications.
In the Statement of Assets and Liabilities the following reclassifications were made:
| | | | |
Undistributed net investment income | | | $(1,652,478 | ) |
Accumulated net realized gain | | | 1,652,478 | |
Net investment income (loss) and net realized gains (losses), as disclosed in the Statement of Operations, and net assets were not affected by this reclassification.
The tax character of distributions paid during the years indicated was as follows:
| | | | | | | | |
| | | Year Ended
August 31,
2016 ($) | | | Year Ended
August 31,
2015 ($) | |
Ordinary income | | | 126,131,357 | | | | 95,037,479 | |
Short-term capital gain distributions, if any, are considered ordinary income distributions for tax purposes.
At August 31, 2016, the components of distributable earnings on a tax basis were as follows:
| | | | |
Undistributed ordinary income | | | $78,129,325 | |
Undistributed long-term capital gains | | | 20,281,230 | |
Net unrealized appreciation | | | 152,767,638 | |
At August 31, 2016, the cost of investments for federal income tax purposes was $7,037,284,985 and the aggregate gross unrealized appreciation and depreciation based on that cost was:
| | | | |
Unrealized appreciation | | | $169,033,067 | |
Unrealized depreciation | | | (16,265,429 | ) |
Net unrealized appreciation | | | 152,767,638 | |
Management of the Fund has concluded that there are no significant uncertain tax positions in the Fund that would require recognition in the financial statements. However, management’s conclusion may be subject to review and adjustment at a later date based on factors including, but not limited to, new tax laws, regulations, and administrative interpretations (including relevant court decisions). Generally, the Fund’s federal tax returns for the prior three fiscal years remain subject to examination by the Internal Revenue Service.
Note 5. Portfolio Information
The cost of purchases and proceeds from sales of securities, excluding short-term investments and derivatives, if any, aggregated to $17,765,543,574 and $16,542,135,403, respectively, for the year ended August 31, 2016, of which $12,539,817,901 and $13,202,349,481, respectively, were U.S. government securities. The amount of purchase and sale activity impacts the portfolio turnover rate reported in the Financial Highlights.
Note 6. Affiliated Money Market Fund
The Fund invests in Columbia Short-Term Cash Fund, an affiliated money market fund established for the exclusive use by the Fund and other affiliated funds (the Affiliated MMF). The income earned by the Fund from such investments is included as Dividends — affiliated issuers in the Statement of Operations. As an investing fund, the Fund indirectly bears its proportionate share of the expenses of the Affiliated MMF. Effective October 1, 2016, the Affiliated MMF prices its shares with a floating net asset value (NAV) and no longer seeks to maintain a stable NAV. In addition, the Board of the Affiliated MMF may impose a fee on redemptions (sometimes referred to as a liquidity fee) or temporarily suspend redemptions (sometimes referred to as imposing a redemption gate) in the event its liquidity falls below regulatory limits.
Note 7. Line of Credit
The Fund has access to a revolving credit facility whereby the Fund may borrow for the temporary funding of
| | | | | | |
| | |
| | | | ACTIVE PORTFOLIOS® MULTI-MANAGER TOTAL RETURN BOND FUND | | |
NOTES TO FINANCIAL STATEMENTS (continued)
August 31, 2016
shareholder redemptions or for other temporary or emergency purposes. Effective December 8, 2015, Citibank, N.A. and HSBC Bank USA, N.A. joined JPMorgan Chase Bank, N.A. (JPMorgan) as lead of a syndicate of banks under the credit facility, which is a collective agreement between the Fund and certain other funds managed by the Investment Manager, severally and not jointly, that permits collective borrowings up to $1 billion. Interest is charged to each participating fund based on its borrowings at a rate equal to the higher of (i) the overnight federal funds rate plus 1.00% or (ii) the one-month LIBOR rate plus 1.00%. Each borrowing under the credit facility matures no later than 60 days after the date of borrowing. The Fund also pays a commitment fee equal to its pro rata share of the amount of the credit facility at a rate of 0.15% per annum. The commitment fee is included in other expenses in the Statement of Operations. Prior to December 8, 2015, JPMorgan was the sole lead bank under the credit facility agreement that permitted borrowings up to $550 million under the same terms and interest rates as described above with the exception of the commitment fee which was charged at a rate of 0.075% per annum.
The Fund had no borrowings during the year ended August 31, 2016.
Note 8. Significant Risks
Shareholder Concentration Risk
At August 31, 2016, affiliated shareholders of record owned 100.0% of the outstanding shares of the Fund in one or more accounts. Subscription and redemption activity by concentrated accounts may have a significant effect on the operations of the Fund. In the case of a large redemption, the Fund may be forced to sell investments at inopportune times, including its liquid or more liquid positions, resulting in Fund losses and the Fund holding a higher percentage of less liquid or illiquid securities. Large redemptions could result in decreased economies of scale and increased operating expenses for non-redeeming Fund shareholders.
Credit Risk
Credit risk is the risk that the value of debt securities in the Fund’s portfolio may decline because the issuer may default and fail to pay interest or repay principal when due. Rating agencies assign credit ratings to debt securities to indicate their credit risk. Lower rated or unrated debt securities held by the Fund may present increased credit risk as compared to higher-rated debt securities.
Interest Rate Risk
Interest rate risk is the risk of losses attributable to changes in interest rates. In general, if prevailing interest rates rise, the values of debt securities tend to fall, and if interest rates fall, the values of debt securities tend to rise. Actions by governments and central banking authorities can result in increases in interest rates. Increasing interest rates may negatively affect the value of debt securities held by the Fund, resulting in a negative impact on the Fund’s performance and net asset value per share. In general, the longer the maturity or duration of a debt security, the greater its sensitivity to changes in interest rates.
Liquidity Risk
Liquidity risk is the risk associated with a lack of marketability of investments which may make it difficult to sell the investment at a desirable time or price. Changing regulatory, market or other conditions or environments (for example, the interest rate or credit environments) may adversely affect the liquidity of the Fund’s investments. The Fund may have to accept a lower selling price for the holding, sell other investments, or forego another, more appealing investment opportunity. Generally, the less liquid the market at the time the Fund sells a portfolio investment, the greater the risk of loss or decline of value to the Fund. A less liquid market can lead to an increase in Fund redemptions, which may negatively impact Fund performance and net asset value per share, including, for example, if the Fund is forced to sell securities in a down market.
Derivatives Risk
Losses involving derivative instruments may be substantial, because a relatively small price movement in the underlying securities, commodity, currency or index or other instrument or asset may result in a substantial loss for the Fund. In addition to the potential for increased losses, the use of derivative instruments may lead to increased volatility within the Fund. Derivatives will typically increase the Fund’s exposure to principal risks to which it is otherwise exposed, and may expose the Fund to additional risks, including correlation risk, counterparty risk, hedging risk, leverage risk and liquidity risk.
Mortgage- and Other Asset-Backed Securities Risk
The value of any mortgage-backed and other asset-backed securities held by the Fund may be affected by, among other things, changes or perceived changes in: interest rates; factors concerning the interests in and
| | | | | | |
| | |
| | | | ACTIVE PORTFOLIOS® MULTI-MANAGER TOTAL RETURN BOND FUND | | |
NOTES TO FINANCIAL STATEMENTS (continued)
August 31, 2016
structure of the issuer or the originator of the mortgages or other assets; the creditworthiness of the entities that provide any supporting letters of credit, surety bonds or other credit enhancements; or the market’s assessment of the quality of underlying assets. Payment of principal and interest on some mortgage-backed securities (but not the market value of the securities themselves) may be guaranteed by the full faith and credit of a particular U.S. Government agency, authority, enterprise or instrumentality, and some, but not all, are also insured or guaranteed by the U.S. Government. Mortgage-backed securities issued by non-governmental issuers (such as commercial banks, savings and loan institutions, private mortgage insurance companies, mortgage bankers and other secondary market issuers) may entail greater risk than obligations guaranteed by the U.S. Government. Mortgage- and other asset-backed securities are subject to prepayment risk, which is the possibility that the underlying mortgage or other asset may be refinanced or prepaid prior to maturity during periods of declining or low interest rates, causing the Fund to have to reinvest the money received in securities that have lower yields. Rising or high interest rates tend to extend the duration of mortgage- and other asset-backed securities, making their prices more volatile and more sensitive to changes in interest rates.
Note 9. Subsequent Events
Management has evaluated the events and transactions that have occurred through the date the financial statements were issued and noted no items requiring adjustment of the financial statements or additional disclosure.
Note 10. Information Regarding Pending and Settled Legal Proceedings
Ameriprise Financial and certain of its affiliates have historically been involved in a number of legal, arbitration and regulatory proceedings, including routine litigation, class actions, and governmental actions, concerning matters arising in connection with the conduct of their business activities. Ameriprise Financial believes that the Funds are not currently the subject of, and that neither Ameriprise Financial nor any of its affiliates are the subject of, any pending legal, arbitration or regulatory proceedings that are likely to have a material adverse effect on the Funds or the ability of Ameriprise Financial or its affiliates to perform under their contracts with the Funds. Ameriprise Financial is required to make quarterly (10-Q), annual (10-K) and, as necessary, 8-K filings with the Securities and Exchange Commission (SEC) on legal
and regulatory matters that relate to Ameriprise Financial and its affiliates. Copies of these filings may be obtained by accessing the SEC website at www.sec.gov.
There can be no assurance that these matters, or the adverse publicity associated with them, will not result in increased fund redemptions, reduced sale of fund shares or other adverse consequences to the Funds. Further, although we believe proceedings are not likely to have a material adverse effect on the Funds or the ability of Ameriprise Financial or its affiliates to perform under their contracts with the Funds, these proceedings are subject to uncertainties and, as such, we are unable to estimate the possible loss or range of loss that may result. An adverse outcome in one or more of these proceedings could result in adverse judgments, settlements, fines, penalties or other relief that could have a material adverse effect on the consolidated financial condition or results of operations of Ameriprise Financial.
| | | | | | |
| | |
| | | | ACTIVE PORTFOLIOS® MULTI-MANAGER TOTAL RETURN BOND FUND | | |
REPORT OF INDEPENDENT REGISTERED PUBLIC ACCOUNTING FIRM
To the Trustees of Columbia Funds Series Trust I and the Shareholders of
Active Portfolios® Multi-Manager Total Return Bond Fund (formerly
known as Active Portfolios® Multi-Manager Core Plus Bond Fund)
In our opinion, the accompanying statement of assets and liabilities, including the portfolio of investments, and the related statements of operations and of changes in net assets and the financial highlights present fairly, in all material respects, the financial position of Active Portfolios® Multi-Manager Total Return Bond Fund (formerly known as Active Portfolios® Multi-Manager Core Plus Bond Fund) (the “Fund,” a series of Columbia Funds Series Trust I) at August 31, 2016, and the results of its operations, the changes in its net assets and the financial highlights for each of the periods indicated, in conformity with accounting principles generally accepted in the United States of America. These financial statements and financial highlights (hereafter referred to as “financial statements”) are the responsibility of the Fund’s management. Our responsibility is to express an opinion on these financial statements based on our audits. We conducted our audits of these financial statements in accordance with the standards of the Public Company Accounting Oversight Board (United States). Those standards require that we plan and perform the audit to obtain reasonable assurance about whether the financial statements are free of material misstatement. An audit includes examining, on a test basis, evidence supporting the amounts and disclosures in the financial statements, assessing the accounting principles used and significant estimates made by management, and evaluating the overall financial statement presentation. We believe that our audits, which included confirmation of securities at August 31, 2016 by correspondence with the custodian, brokers and transfer agent, and the application of alternative auditing procedures where such confirmations had not been received, provide a reasonable basis for our opinion.
PricewaterhouseCoopers LLP
Minneapolis, MN
October 21, 2016
| | | | | | |
| | |
| | | | ACTIVE PORTFOLIOS® MULTI-MANAGER TOTAL RETURN BOND FUND | | |
FEDERAL INCOME TAX INFORMATION
(Unaudited)
The Fund hereby designates the following tax attributes for the fiscal year ended August 31, 2016. Shareholders will be notified in early 2017 of the amounts for use in preparing 2016 income tax returns.
Tax Designations
| | | | |
Qualified Dividend Income | | | 0.55 | % |
Dividends Received Deduction | | | 0.51 | % |
Capital Gain Dividend | | | $21,295,292 | |
Qualified Dividend Income. For taxable, non-corporate shareholders, the percentage of ordinary income distributed during the fiscal year that represents qualified dividend income subject to reduced tax rates.
Dividends Received Deduction. The percentage of ordinary income distributed during the fiscal year that qualifies for the corporate dividends received deduction.
Capital Gain Dividend. The Fund designates as a capital gain dividend the amount reflected above, or if subsequently determined to be different, the net capital gain of such fiscal period.
| | | | | | |
| | |
| | | | ACTIVE PORTFOLIOS® MULTI-MANAGER TOTAL RETURN BOND FUND | | |
TRUSTEES AND OFFICERS
Shareholders elect the Board that oversees the Fund’s operations. The Board appoints officers who are responsible for day-to-day business decisions based on policies set by the Board. The following table provides basic biographical information about the Fund’s Trustees, including their principal occupations during the past five years, although specific titles for individuals may have varied over the period. The year set forth beneath Length of Service in the table below is the year in which the Trustee was first appointed or elected as Trustee to any Fund currently in the Columbia Funds Complex or a predecessor thereof. Under current Board policy, members serve terms of indefinite duration.
Trustees
| | | | | | | | |
| Independent Trustees |
Name,
Address,
Year of Birth | | Position Held with the Trust and Length of Service | | Principal Occupation(s)
During the Past Five Years
and Other Relevant
Professional Experience | | Number of
Funds in the
Columbia Funds
Complex
Overseen | | Other Directorships Held by Trustee During the Past Five Years |
Janet Langford Carrig
c/o Columbia Management Investment Advisers, LLC, 225 Franklin Street Mail Drop BX32 05228, Boston, MA 02110 1957 | | Trustee 1996 | | Senior Vice President, General Counsel and Corporate Secretary, ConocoPhillips (integrated energy company) since September 2007 | | 56 | | None |
Douglas A. Hacker
c/o Columbia Management Investment Advisers, LLC, 225 Franklin Street Mail Drop BX32 05228, Boston, MA 02110 1955 | | Trustee and Chairman of the Board 1996 | | Independent business executive since May 2006; Executive Vice President — Strategy of United Airlines from December 2002 to May 2006; President of UAL Loyalty Services (airline marketing company) from September 2001 to December 2002; Executive Vice President and Chief Financial Officer of United Airlines from July 1999 to September 2001 | | 56 | | Spartan Nash Company (food distributor); Nash Finch Company (food distributor) from 2005 to 2013; Aircastle Limited (aircraft leasing); SeaCube Container Leasing Ltd. (container leasing) from 2010 to 2013; and Travelport Worldwide Limited (travel information technology) |
Nancy T. Lukitsh
c/o Columbia Management Investment Advisers, LLC, 225 Franklin Street Mail Drop BX32 05228, Boston, MA 02110 1956 | | Trustee 2011 | | Senior Vice President, Partner and Director of Marketing, Wellington Management Company, LLP (investment adviser) from 1997 to 2010; Chair, Wellington Management Portfolios (commingled non-U.S. investment pools) from 2007 to 2010; Director, Wellington Trust Company, NA and other Wellington affiliates from 1997 to 2010 | | 56 | | None |
William E. Mayer
c/o Columbia Management Investment Advisers, LLC, 225 Franklin Street Mail Drop BX32 05228, Boston, MA 02110 1940 | | Trustee 1991 | | Partner, Park Avenue Equity Partners (private equity) since February 1999 | | 56 | | DynaVox Inc. (speech creation); Lee Enterprises (print media); WR Hambrecht + Co. (financial service provider) from 2000 to 2012; BlackRock Capital Investment Corporation (investment company); and Premier, Inc. (healthcare) |
| | | | | | |
| | |
| | | | ACTIVE PORTFOLIOS® MULTI-MANAGER TOTAL RETURN BOND FUND | | |
TRUSTEES AND OFFICERS (continued)
| | | | | | | | |
| Independent Trustees (continued) |
Name,
Address,
Year of Birth | | Position Held with the Trust and Length of Service | | Principal Occupation(s)
During the Past Five Years
and Other Relevant
Professional Experience | | Number of
Funds in the
Columbia Funds
Complex
Overseen | | Other Directorships Held by Trustee During the Past Five Years |
David M. Moffett
c/o Columbia Management Investment Advisers, LLC, 225 Franklin Street Mail Drop BX32 05228, Boston, MA 02110 1952 | | Trustee 2011 | | Retired. Consultant to Bridgewater and Associates | | 56 | | Director of CIT Bank, CIT Group Inc. (commercial and consumer finance); eBay Inc. (online trading community); Genworth Financial, Inc. (financial and insurance products and services); Paypal Holdings Inc. (payment and data processing services); and Trustee, University of Oklahoma Foundation |
Charles R. Nelson
c/o Columbia Management Investment Advisers, LLC, 225 Franklin Street Mail Drop BX32 05228, Boston, MA 02110 1942 | | Trustee 1981 | | Retired. Professor Emeritus, University of Washington since 2011; Professor of Economics, University of Washington from 1976 to 2011; Ford and Louisa Van Voorhis Professor of Political Economy, University of Washington from 1993 to 2011; Adjunct Professor of Statistics, University of Washington from 1980 to 2011; Associate Editor, Journal of Money, Credit and Banking from September 1993 to 2008; consultant on econometric and statistical matters | | 56 | | None |
John J. Neuhauser
c/o Columbia Management Investment Advisers, LLC, 225 Franklin Street Mail Drop BX32 05228, Boston, MA 02110 1943 | | Trustee 1984 | | President, Saint Michael’s College since August 2007; Director or Trustee of several non-profit organizations, including University of Vermont Medical Center; Academic Vice President and Dean of Faculties, Boston College from August 1999 to October 2005; University Professor, Boston College from November 2005 to August 2007 | | 56 | | Liberty All-Star Equity Fund and Liberty All-Star Growth Fund (closed-end funds) |
Patrick J. Simpson
c/o Columbia Management Investment Advisers, LLC, 225 Franklin Street Mail Drop BX32 05228, Boston, MA 02110 1944 | | Trustee 2000 | | Of Counsel, Perkins Coie LLP (law firm) since 2015; Partner, Perkins Coie LLP from 1988 to 2014 | | 56 | | None |
Anne-Lee Verville
c/o Columbia Management Investment Advisers, LLC, 225 Franklin Street Mail Drop BX32 05228, Boston, MA 02110 1945 | | Trustee 1998 | | Retired. General Manager, Global Education Industry from 1994 to 1997, President — Application Systems Division from 1991 to 1994, Chief Financial Officer — US Marketing & Services from 1988 to 1991, and Chief Information Officer from 1987 to 1988, IBM Corporation (computer and technology) | | 56 | | Enesco Group, Inc. (producer of giftware and home and garden decor products) from 2001 to 2006 |
| | | | | | |
| | |
| | | | ACTIVE PORTFOLIOS® MULTI-MANAGER TOTAL RETURN BOND FUND | | |
TRUSTEES AND OFFICERS (continued)
| | | | | | | | |
| Consultant to the Trustees* |
Name,
Address,
Year of Birth
| | Position Held with the Trust and Length of Service | | Principal Occupation(s)
During the Past Five Years
and Other Relevant
Professional Experience | | Number of
Funds in the
Columbia Funds
Complex
Overseen | | Other Directorships
Held by Trustee During the Past
Five Years |
J. Kevin Connaughton
c/o Columbia Management Investment Advisers, LLC, 225 Franklin Street Mail Drop BX32 05228, Boston, MA 02110 1964 | | Trustee Consultant 2016 | | Trustee Consultant, Columbia Funds since March 2016; Managing Director and General Manager of Mutual Fund Products, Columbia Management Investment Advisers, LLC from May 2010 to February 2015; President, Columbia Funds from 2009 to 2015; and senior officer of Columbia Funds and affiliated funds from 2003 to 2015 | | 56 | | Board of Governors, Gateway Healthcare since January 2016; Trustee, New Century Portfolios since March 2015; and Director, The Autism Project since March 2015 |
| * | J. Kevin Connaughton was appointed consultant to the Trustees effective March 1, 2016. Shareholders of the Funds are expected to be asked to elect Mr. Connaughton as a Trustee at a future shareholder meeting. |
| | | | | | | | |
| Interested Trustee Affiliated with Investment Manager* |
Name,
Address,
Year of Birth | | Position Held with the Trust and Length of Service | | Principal Occupation(s)
During the Past Five Years
and Other Relevant
Professional Experience | | Number of
Funds in the
Columbia Funds
Complex
Overseen | | Other Directorships Held by Trustee During the Past Five Years |
William F. Truscott
c/o Columbia Management Investment Advisers, LLC, 225 Franklin Street Boston, MA 02110 1960 | | Trustee 2012 | | Chairman of the Board and President, Columbia Management Investment Advisers, LLC since May 2010 and February 2012, respectively; Chief Executive Officer, Global Asset Management, Ameriprise Financial, Inc. since September 2012 (previously Chief Executive Officer, U.S. Asset Management & President, Annuities, May 2010-September 2012); Director and Chief Executive Officer, Columbia Management Investment Distributors, Inc. since May 2010 and February 2012, respectively; Chairman of the Board and Chief Executive Officer, RiverSource Distributors, Inc. since 2006; Director, Threadneedle Asset Management Holdings, SARL since 2014; President and Chief Executive Officer, Ameriprise Certificate Company, 2006-August 2012. | | 184 | | Trustee to other Columbia Funds since 2001; Chairman of the Board, Columbia Management Investment Advisers, LLC since May 2010; Director, Columbia Management Investment Distributors, Inc. since May 2010; Former Director, Ameriprise Certificate Company, 2006-January 2013 |
| * | Interested person (as defined under the 1940 Act) by reason of being an officer, director, security holder and/or employee of the Investment Manager or Ameriprise Financial. |
The Statement of Additional Information has additional information about the Fund’s Board members and is available, without charge, upon request by calling 800.345.6611; contacting your financial intermediary; or
visiting investor.columbiathreadneedleus.com.
| | | | | | |
| | |
| | | | ACTIVE PORTFOLIOS® MULTI-MANAGER TOTAL RETURN BOND FUND | | |
TRUSTEES AND OFFICERS (continued)
The Board has appointed officers who are responsible for day-to-day business decisions based on policies it has established. The officers serve at the pleasure of the Board. The following table provides basic information about the Officers of the Fund, including principal occupations during the past five years, although their specific titles may have varied over the period. In addition to Mr. Truscott, who is Senior Vice President, the Fund’s other officers are:
| | | | |
| Fund Officers |
Name, Address and
Year of Birth | | Position and Year First Appointed to Position for any Fund in the Columbia Funds Complex or a Predecessor Thereof | | Principal Occupation(s) During Past Five Years |
Christopher O. Petersen 5228 Ameriprise Financial Center Minneapolis, MN 55474 Born 1970 | | President and Principal Executive Officer (2015) | | Vice President and Lead Chief Counsel, Ameriprise Financial, Inc. since January 2015 (previously, Vice President and Chief Counsel January 2010-December 2014); officer of Columbia Funds and affiliated funds since 2007. |
Michael G. Clarke 225 Franklin Street Boston, MA 02110 Born 1969 | | Treasurer (2011), Chief Financial Officer (2009) and Chief Accounting Officer (2015) | | Vice President — Mutual Fund Administration, Columbia Management Investment Advisers, LLC, since May 2010; senior officer of Columbia Funds and affiliated funds since 2002. |
Paul B. Goucher 100 Park Avenue New York, NY 10017 Born 1968 | | Senior Vice President (2011), Chief Legal Officer (2015) and Assistant Secretary (2008) | | Vice President and Lead Chief Counsel, Ameriprise Financial, Inc. since November 2008 and January 2013, respectively (previously Chief Counsel, January 2010-January 2013); Vice President, Chief Legal Officer and Assistant Secretary, Columbia Management Investment Advisers, LLC since May 2010. |
Thomas P. McGuire 225 Franklin Street Boston, MA 02110 Born 1972 | | Senior Vice President and Chief Compliance Officer (2012) | | Vice President — Asset Management Compliance, Ameriprise Financial, Inc., since May 2010; Chief Compliance Officer, Ameriprise Certificate Company since September 2010. |
Colin Moore 225 Franklin Street Boston, MA 02110 Born 1958 | | Senior Vice President (2010) | | Executive Vice President and Global Chief Investment Officer, Ameriprise Financial, Inc., since July 2013; Executive Vice President and Global Chief Investment Officer, Columbia Management Investment Advisers, LLC since July 2013 (previously Director and Global Chief Investment Officer, 2010-2013). |
Michael E. DeFao 225 Franklin Street Boston, MA 02110 Born 1968 | | Vice President (2011) and Assistant Secretary (2010) | | Vice President and Chief Counsel, Ameriprise Financial, Inc. since May 2010. |
Amy Johnson 5228 Ameriprise Financial Center Minneapolis, MN 55474 Born 1965 | | Vice President (2006) | | Managing Director and Global Head of Operations, Columbia Management Investment Advisers, LLC since April 2016 (previously Managing Director and Chief Operating Officer, 2010-2016). |
Lyn Kephart-Strong 5228 Ameriprise Financial Center Minneapolis, MN 55474 Born 1960 | | Vice President (2015) | | President, Columbia Management Investment Services Corp. since October 2014; Vice President & Resolution Officer, Ameriprise Trust Company since August 2009. |
Ryan C. Larrenaga 225 Franklin Street Boston, MA 02110 Born 1970 | | Vice President and Secretary (2015) | | Vice President and Group Counsel, Ameriprise Financial, Inc. since August 2011; officer of Columbia Funds and affiliated funds since 2005. |
| | | | | | |
| | |
| | | | ACTIVE PORTFOLIOS® MULTI-MANAGER TOTAL RETURN BOND FUND | | |
BOARD CONSIDERATION AND APPROVAL OF MANAGEMENT AGREEMENT AND SUBADVISORY AGREEMENTS
On June 10, 2016, the Board of Trustees (the Board) and the Trustees who are not interested persons (as defined in the Investment Company Act of 1940) (the Independent Trustees) of Columbia Funds Series Trust I (the Trust) unanimously approved the continuation of the Management Agreement (the Management Agreement) with Columbia Management Investment Advisers, LLC (the Investment Manager) and the Subadvisory Agreements between the Investment Manager and Loomis, Sayles & Company, L.P. (Loomis Sayles), PGIM, Inc., the asset management arm of Prudential Financial (Prudential) and TCW Investment Management Company (the Subadvisers) with respect to Active Portfolios® Multi-Manager Total Return Bond Fund (the Fund), a series of the Trust. On March 9, 2016, the Board and the Independent Trustees of the Trust also unanimously approved, for an initial two-year term, the Subadvisory Agreement, effective May 16, 2016, between the Investment Manager and Prudential. In addition, on March 9, 2016, the Board and the Independent Trustees of the Trust unanimously approved an amendment to the Subadvisory Agreement, effective April 11, 2016, between the Investment Manager and Loomis Sayles, in order to retain Loomis Sayles as a subadviser to the Fund. As detailed below, the Board’s Advisory Fees and Expenses Committee (the Committee) and the Board met on multiple occasions to review and discuss, both among themselves and with the management team of the Investment Manager, materials provided by the Investment Manager and others before determining to approve the continuation of the Management Agreement and the Subadvisory Agreements (collectively, the Agreements).
In connection with their deliberations regarding the continuation of the Management Agreement and the Subadvisory Agreements, the Committee and the Board evaluated materials requested from the Investment Manager regarding the Fund and the Agreements, and discussed these materials with representatives of the Investment Manager at Committee meetings held on March 8, 2016, April 27, 2016 and June 9, 2016 and at Board meetings held on March 9, 2016 and June 10, 2016. In connection with its deliberations regarding the Subadvisory Agreements between the Investment Manager and Loomis Sayles and Prudential (the proposed Subadvisory Agreements), the Board requested and evaluated materials from the Investment Manager and others regarding the Fund and the Subadvisory Agreements, and discussed these materials with representatives of the Investment Manager at Committee and Board meetings held on March 8 and March 9, 2016, respectively. In addition, the Board considers matters bearing on the Agreements at most of its other meetings throughout the year and meets regularly with senior management of the Trust and the Investment Manager. Through the Board’s Investment Oversight Committees, Trustees also meet with selected portfolio managers of the funds the Trustees oversee and other investment personnel at various times throughout the year. The Committee and the Board also consulted with its independent fee consultant, Fund counsel and with the Independent Trustees’ independent legal counsel, who advised on various matters with respect to the Committee’s and the Board’s considerations and otherwise assisted the Committee and the Board in their deliberations. On June 9, 2016, the Committee recommended that the Board approve the continuation of the Management Agreement and the Subadvisory Agreements. On June 10, 2016, the Board, including the Independent Trustees, voting separately, unanimously approved the continuation of the Management Agreement and the Subadvisory Agreements for the Fund.
The Committee and the Board considered all information that they, their legal counsel or the Investment Manager believed reasonably necessary to evaluate and to determine whether to recommend for approval or approve the proposed Subadvisory Agreements and the continuation of the Management Agreement and the Subadvisory Agreements. The information and factors considered by the Committee and the Board in recommending for approval or approving the proposed Subadvisory Agreements and the continuation of the Management Agreement and the Subadvisory Agreements for the Fund included the following:
| • | | Information on the investment performance of the Fund relative to the performance of a group of mutual funds determined to be comparable to the Fund by an independent third-party data provider, as well as performance relative to benchmarks; |
| • | | Information on the Fund’s management fees and total expenses, including information comparing the Fund’s expenses to those of a group of comparable mutual funds, as determined by the independent third-party data provider; |
| • | | The Investment Manager’s agreement to contractually limit or cap total operating expenses for the Fund through December 31, 2017 so that total operating expenses (excluding certain fees and expenses, such as transaction |
| | | | | | |
| | |
| | | | ACTIVE PORTFOLIOS® MULTI-MANAGER TOTAL RETURN BOND FUND | | |
BOARD CONSIDERATION AND APPROVAL OF MANAGEMENT AGREEMENT AND SUBADVISORY AGREEMENTS (continued)
| | costs and certain other investment related expenses, interest, taxes, acquired fund fees and expenses, and infrequent and/or unusual expenses) would not exceed a specified annual rate, as a percentage of the Fund’s net assets; |
| • | | The terms and conditions of the Agreements; |
| • | | The subadvisory fees to be charged to the Investment Manager under the Subadvisory Agreements; |
| • | | The current and proposed terms and conditions of other agreements and arrangements with affiliates of the Investment Manager relating to the operations of the Fund, including agreements with respect to the provision of distribution and transfer agency services to the Fund; |
| • | | Descriptions of various functions performed by the Investment Manager and the Subadvisers under the Agreements, including portfolio management and portfolio trading practices; |
| • | | Information regarding the management fees of similarly-managed portfolios of other clients of the Investment Manager, including institutional separate accounts; |
| • | | Information regarding the reputation, regulatory history and resources of the Investment Manager and the Subadvisers, including information regarding senior management, portfolio managers and other personnel; |
| • | | Information regarding the capabilities of the Investment Manager and the Subadviser with respect to compliance monitoring services, including an assessment of the Investment Manager’s and the Subadvisers’ compliance systems by the Fund’s Chief Compliance Officer; and |
| • | | The profitability to the Investment Manager and its affiliates from their relationships with the Fund. |
Nature, Extent and Quality of Services Provided under the Agreements
The Committee and the Board considered the nature, extent and quality of services provided or to be provided to the Fund by the Investment Manager, the Subadvisers and the Investment Manager’s affiliates under the Agreements and under separate agreements for the provision of transfer agency services, and the resources dedicated or to be dedicated to the Fund and the other Columbia Funds by the Investment Manager, the Subadvisers and the Investment Manager’s affiliates. The Committee and the Board considered, among other things, the Investment Manager’s ability to attract, motivate and retain highly qualified research, advisory and supervisory investment professionals (including personnel and other resources, compensation programs for personnel involved in fund management, reputation and other attributes), the portfolio management services provided by those investment professionals, and the quality of the Investment Manager’s investment research capabilities and trade execution services. The Board also considered, among other things, the Subadvisers’ ability to attract, motivate and retain highly qualified research, advisory and supervisory investment professionals (including personnel and other resources, reputation and other attributes), the portfolio management services provided by those investment professionals, and the quality of the Subadvisers’ investment research capabilities. In addition, the Committee and the Board considered the potential benefits to shareholders of investing in a mutual fund that is part of a fund complex offering exposure to a variety of asset classes and investment disciplines and providing a variety of fund and shareholder services.
The Committee and the Board also considered the professional experience and qualifications of the senior personnel of the Investment Manager and the Subadvisers, which included consideration of the Investment Manager’s and the Subadvisers’ experience with similarly-structured funds. The Committee and the Board noted the compliance programs of and the compliance-related resources provided to the Fund by the Investment Manager and its affiliates, and considered the Investment Manager’s ability to provide administrative services to the Fund and coordinate the activities of the Fund’s other service providers. The Board also noted that the Board had approved the Subadvisers’ codes of ethics and compliance programs, and that the Chief Compliance Officer of the Funds reports to the Trustees on the Subadvisers’ compliance programs.
The Committee and the Board considered the diligence and selection process undertaken by the Investment Manager to select the Subadvisers, including the Investment Manager’s rationale for recommending approval of the proposed Subadvisory Agreements and the continuation of the Subadvisory Agreements, and the process for monitoring the Subadvisers’ ongoing performance of services for the Fund. As part of these deliberations, the Committee and the
| | | | | | |
| | |
| | | | ACTIVE PORTFOLIOS® MULTI-MANAGER TOTAL RETURN BOND FUND | | |
BOARD CONSIDERATION AND APPROVAL OF MANAGEMENT AGREEMENT AND SUBADVISORY AGREEMENTS (continued)
Board considered the ability of the Investment Manager, subject to the approval of the Board, to modify or enter into new subadvisory agreements without a shareholder vote pursuant to an exemptive order of the Securities and Exchange Commission. The Committee and the Board also considered the scope of services provided to the Fund by the Investment Manager that are distinct from and in addition to those provided or to be provided by the Subadvisers, including cash flow management, treasury services, risk oversight, investment oversight and Subadviser selection, oversight and transition management. After reviewing these and related factors, the Committee and the Board concluded, within the context of their overall conclusions, that the nature, extent and quality of the services provided or to be provided to the Fund under the Agreements supported approval of the proposed Subadvisory Agreements and the continuation of the Management Agreement and the Subadvisory Agreements.
Investment Performance
The Committee and the Board reviewed information about the performance of the Fund over various time periods, including performance information relative to benchmarks and information based on reports of the independent third-party data provider that compared the performance of the Fund to the performance of a group of comparable mutual funds, and data provided by the independent fee consultant. The Committee and the Board also reviewed a description of the third party’s methodology for identifying the Fund’s peer groups for purposes of performance and expense comparisons. Although the Fund’s performance lagged that of a relevant peer group for certain (although not necessarily all) periods, the Committee and the Board concluded that other factors relevant to performance were sufficient, in light of other considerations, to warrant continuation of the Management Agreement and the Subadvisory Agreements. Those factors included one or more of the following: (i) that the Fund’s performance, although lagging in certain recent periods, was stronger over the longer term; (ii) that the underperformance was attributable, to a significant extent, to investment decisions that were reasonable and consistent with the Fund’s investment strategy and policies and that the Fund was performing within a reasonable range of expectations, given those investment decisions, market conditions and the Fund’s investment strategy; (iii) that the Fund’s performance was competitive when compared to other relevant performance benchmarks or peer groups; and (iv) that the Investment Manager had taken or was taking steps designed to help improve the Fund’s investment performance, including, but not limited to, replacing portfolio managers, enhancing the resources supporting the portfolio managers, or modifying investment strategies.
The Committee and the Board noted that, through December 31, 2015, the Fund’s performance was in the fifth-sixth percentile (where the best performance would be in the first percentile) of its category selected by the independent third-party data provider for the purposes of performance comparisons for the one- and three-year periods.
The Committee and the Board also considered the Investment Manager’s performance and reputation generally, the Investment Manager’s historical responsiveness to Board concerns about performance, and the Investment Manager’s willingness to take steps intended to improve performance. The Board also considered the Subadvisers’ investment performance, including their absolute and risk-adjusted returns, noting that Loomis Sayles and Prudential had delivered strong performance results over the one-, three- and five-year periods for the Loomis Sayles Core Fixed Income Composite and the Prudential Core Plus Fixed Income Composite, respectively. After reviewing these and related factors, the Committee and the Board concluded, within the context of their overall conclusions, that the performance of the Fund, the Investment Manager and the Subadvisers were sufficient, in light of other considerations, to warrant the approval of the proposed Subadvisory Agreements and the continuation of the Management Agreement and the Subadvisory Agreements.
Investment Management Fee Rates and Other Expenses
The Committee and the Board considered the management fees charged to the Fund under the Management Agreement and the Subadvisory Agreements, as well as the total expenses incurred and to be incurred by the Fund. In assessing the reasonableness of the fees under the Management Agreement, the Committee and the Board considered, among other information, the Fund’s management fee and its total expense ratio as a percentage of average daily net assets. The Committee and the Board considered data provided by the independent fee consultant. The Committee and the Board noted that, as of December 31, 2015, the Fund’s actual management fee and net total expense ratio are ranked in the fifth and second quintiles, respectively, (where the lowest fees and expenses would be in the first quintile) against the Fund’s expense universe as determined by the independent third-party data provider for
| | | | | | |
| | |
| | | | ACTIVE PORTFOLIOS® MULTI-MANAGER TOTAL RETURN BOND FUND | | |
BOARD CONSIDERATION AND APPROVAL OF MANAGEMENT AGREEMENT AND SUBADVISORY AGREEMENTS (continued)
purposes of expense comparison. The Committee and the Board also considered the fees that the Subadvisers charge to their other clients, and noted that the Investment Manager pays the fees of the Subadvisers. The Committee and the Board also took into account the fee waiver and expense limitation arrangements agreed to by the Investment Manager, as noted above.
The Committee and the Board also received and considered information about the management fees charged by the Investment Manager to institutional separate accounts. In considering the fees charged to those accounts, the Committee and the Board took into account, among other things, the Investment Manager’s representations about the differences between managing mutual funds as compared to other types of accounts, including differences in the services provided, differences in the risk profile of such business for the Investment Manager and the additional resources required to manage mutual funds effectively. The Committee and the Board received and considered information about the fees charged by the Investment Manager for sub-advisory services provided to comparable unaffiliated funds. In evaluating the Fund’s management fees, the Committee and the Board also took into account the demands, complexity and quality of the investment management of the Fund.
After reviewing these and related factors, the Committee and the Board concluded, within the context of their overall conclusions, that the management fee rates and expenses of the Fund were sufficient, in light of other considerations, to warrant the approval of the proposed Subadvisory Agreements and the continuation of the Management Agreement and the Subadvisory Agreements.
Costs of Services Provided and Profitability
The Committee and the Board also took note of the costs the Investment Manager and its affiliates incur in connection with the services provided (both on an absolute and relative basis) and the profitability to the Investment Manager and its affiliates in connection with their relationships with the Fund.
The Committee and the Board also considered the compensation directly or indirectly received by the Investment Manager’s affiliates in connection with their relationships with the Fund. The Committee and the Board reviewed information provided by management as to the profitability to the Investment Manager and its affiliates of their relationships with the Fund, information about the allocation of expenses used to calculate profitability, and comparisons of profitability levels realized in 2015 to profitability levels realized in 2014. When reviewing profitability, the Committee and the Board also considered court cases in which adviser profitability was an issue in whole or in part, the performance of similarly managed funds, the performance of the Fund, and the expense ratio of the Fund. In addition, the Committee and the Board considered information provided by the Investment Manager regarding its financial condition and comparing its profitability to that of other asset management firms that are, or are subsidiaries of, publicly traded companies. In this regard, the Committee and the Board also considered data provided by the independent fee consultant. Because the Subadvisory Agreements were negotiated at arms-length by the Investment Manager, which is responsible for payments to the Subadvisers thereunder, the Committee and the Board did not consider the profitability to each Subadviser of its relationship with the Fund.
After reviewing these and related factors, the Committee and the Board concluded, within the context of their overall conclusions, that the costs of services provided and the profitability to the Investment Manager and its affiliates from their relationships with the Fund supported the approval of the proposed Subadvisory Agreements and the continuation of the Management Agreement and the Subadvisory Agreements.
Economies of Scale
The Committee and the Board considered the potential existence of economies of scale in the provision by the Investment Manager of services to the Fund, to groups of related funds, and to the Investment Manager’s investment advisory clients as a whole, and whether those economies of scale were shared with the Fund through breakpoints in investment management fees or other means, such as expense limitation arrangements and additional investments by the Investment Manager in investment, trading and compliance resources. The Committee and the Board noted that the management fee schedules for the Fund contained breakpoints that would reduce the fee rate on assets above specified threshold levels.
The Committee and the Board noted that the breakpoints, if any, in the Subadvisory Agreements did not occur at the same levels as the breakpoints in the Management Agreement. The Committee and the Board noted that absent a
| | | | | | |
| | |
| | | | ACTIVE PORTFOLIOS® MULTI-MANAGER TOTAL RETURN BOND FUND | | |
BOARD CONSIDERATION AND APPROVAL OF MANAGEMENT AGREEMENT AND SUBADVISORY AGREEMENTS (continued)
shareholder vote, the Investment Manager would bear any increase in fees payable under the Subadvisory Agreements. The Committee and the Board also noted the potential challenges of seeking to tailor the Management Agreement breakpoints to those of a subadvisory agreement in this context, and the effect that capacity constraints on a subadviser’s ability to manage assets could potentially have on the ability of the Investment Manager to achieve economies of scale, as new subadvisers may need to be added as the Fund grows, increasing the Investment Manager’s cost of compensating and overseeing the Fund’s subadvisers.
In considering these matters, the Committee and the Board also considered the costs of the services provided and the profitability to the Investment Manager and its affiliates from their relationships with the Fund, as discussed above. After reviewing these and related factors, the Committee and the Board concluded, within the context of their overall conclusions, that the extent to which any economies of scale were expected to be shared with the Fund supported the approval of the proposed Subadvisory Agreements and the continuation of the Management Agreement and the Subadvisory Agreements.
Other Benefits to the Investment Manager
The Committee and the Board received and considered information regarding “fall-out” or ancillary benefits received by the Investment Manager and its affiliates as a result of their relationships with the Fund, such as the engagement of the Investment Manager’s affiliates to provide distribution and transfer agency services to the Fund. In this regard, among other matters, the Committee and the Board considered that the Fund’s distributor retains a portion of the distribution fees from the Fund and receives a portion of the sales charges on sales or redemptions of certain classes of shares of the Fund. The Committee and the Board also considered the benefits of research made available to the Investment Manager by reason of brokerage commissions generated by the Fund’s securities transactions, and reviewed information about the Investment Manager’s practices with respect to allocating portfolio transactions for brokerage and research services. The Committee and the Board considered the possible conflicts of interest associated with certain fall-out or other ancillary benefits and the reporting, disclosure and other processes that are in place to address such possible conflicts of interest. The Committee and the Board recognized that the Investment Manager’s profitability would be somewhat lower without these benefits.
Conclusion
The Committee and the Board reviewed all of the above considerations in reaching their decisions to recommend or approve the proposed Subadvisory Agreements and the continuation of the Management Agreement and the Subadvisory Agreements. In their deliberations, the Trustees did not identify any particular information that was all-important or controlling, and individual Trustees may have attributed different weights to the various factors. Based on their evaluation of all factors that they deemed to be material, including those factors described above, and assisted by the advice of independent legal counsel, the Board, including the Independent Trustees, voting separately, unanimously approved the continuation of the Management Agreement and unanimously approved the proposed Subadvisory Agreements and the continuation of the Subadvisory Agreements.
| | | | | | |
| | |
| | | | ACTIVE PORTFOLIOS® MULTI-MANAGER TOTAL RETURN BOND FUND | | |
IMPORTANT INFORMATION ABOUT THIS REPORT
Each fund mails one shareholder report to each shareholder address. If you would like more than one report, please call shareholder services at 800.345.6611 and additional reports will be sent to you.
The policy of the Board is to vote the proxies of the companies in which each fund holds investments consistent with the procedures as stated in the Statement of Additional Information (SAI). You may obtain a copy of the SAI without charge by calling 800.345.6611; contacting your financial intermediary; visiting investor.columbiathreadneedleus.com; or searching the website of the Securities and Exchange Commission (SEC) at sec.gov. Information regarding how each fund voted proxies relating to portfolio securities is filed with the SEC by August 31st for the most recent 12-month period ending June 30th of that year, and is available without charge by visiting investor.columbiathreadneedleus.com, or searching the website of the SEC at sec.gov.
Each fund files a complete schedule of portfolio holdings with the SEC for the first and third quarters of each fiscal year on Form N-Q. Each fund’s Form N-Q is available on the SEC’s website at sec.gov and may be reviewed and copied at the SEC’s Public Reference Room in Washington, D.C. Information on the operation of the Public Reference Room may be obtained by calling 800.SEC.0330. Each fund’s complete schedule of portfolio holdings, as filed on Form N-Q, can also be obtained without charge, upon request, by calling 800.345.6611.
Active Portfolios® Multi-Manager Total Return Bond Fund
P.O. Box 8081
Boston, MA 02266-8081
Please read and consider the investment objectives, risks, charges and expenses for any fund carefully before investing. For a prospectus and summary prospectus, which contains this and other important information about the Fund, go to investor.columbiathreadneedleus.com. The Fund is distributed by Columbia Management Investment Distributors, Inc., member FINRA, and managed by Columbia Management Investment Advisers, LLC.
Columbia Threadneedle Investments (Columbia Threadneedle) is the global brand name of the Columbia and Threadneedle group of companies. All rights reserved. Columbia Management Investment Distributors, Inc., 225 Franklin Street, Boston, MA 02110-2804
© 2016 Columbia Management Investment Advisers, LLC.
investor.columbiathreadneedleus.com
ANN101_08_F01_(10/16)
Item 2. Code of Ethics.
(a) The registrant has adopted a code of ethics that applies to the registrant’s principal executive officer, principal financial officer, principal accounting officer or controller, or persons performing similar functions, regardless of whether these individuals are employed by the registrant or a third party.
(b) During the period covered by this report, there were not any amendments to a provision of the code of ethics adopted in 2(a) above.
(c) During the period covered by this report, there were no waivers, including any implicit waivers, from a provision of the code of ethics described in 2(a) above that relates to one or more of the items set forth in paragraph (b) of this item’s instructions.
Item 3. Audit Committee Financial Expert.
The registrant’s Board of Trustees has determined that Douglas A. Hacker, David M. Moffett and Anne-Lee Verville, each of whom are members of the registrant’s Board of Trustees and Audit Committee, each qualify as an audit committee financial expert. Mr. Hacker, Mr. Moffett and Ms. Verville are each independent trustees, as defined in paragraph (a)(2) of this item’s instructions.
Item 4. Principal Accountant Fees and Services.
Fee information below is disclosed for the thirteen series of the registrant whose reports to stockholders are included in this annual filing. One series merged into another series on June 24, 2016 and the fees incurred by this series through its merger date are included in the response to this Item.
(a) Audit Fees. Aggregate Audit Fees billed by the principal accountant for professional services rendered during the fiscal years ended August 31, 2016 and August 31, 2015 are approximately as follows:
2016 | | 2015 | |
$ | 375,000 | | $ | 318,500 | |
| | | | | |
Audit Fees include amounts related to the audit of the registrant’s annual financial statements or services that are normally provided by the accountant in connection with statutory and regulatory filings or engagements for those fiscal years.
(b) Audit-Related Fees. Aggregate Audit-Related Fees billed to the registrant by the principal accountant for professional services rendered during the fiscal years ended August 31, 2016 and August 31, 2015 are approximately as follows:
Audit-Related Fees include amounts for assurance and related services by the principal accountant that are reasonably related to the performance of the audit of the registrant’s financial statements and are not reported in Audit Fees above. In fiscal years 2016 and 2015, Audit-Related Fees consist of agreed-upon procedures performed for semi-annual shareholder reports. Fiscal year 2016 also includes Audit-Related Fees for agreed upon procedures for a fund merger and issuance of consent related to N-14 filings.
During the fiscal years ended August 31, 2016 and August 31, 2015, there were no Audit-Related Fees billed by the registrant’s principal accountant to the registrant’s investment adviser (not including any sub-adviser whose role is primarily portfolio management and is subcontracted with or overseen by another investment adviser) and any entity controlling, controlled by, or under common control with the adviser that provides ongoing services to the registrant for an engagement that related directly to the operations and financial reporting of the registrant.
(c) Tax Fees. Aggregate Tax Fees billed by the principal accountant to the registrant for professional services rendered during the fiscal years ended August 31, 2016 and August 31, 2015 are approximately as follows:
2016 | | 2015 | |
$ | 93,800 | | $ | 83,000 | |
| | | | | |
Tax Fees include amounts for the review of annual tax returns, the review of required shareholder distribution calculations and typically include amounts for professional services by the principal accountant for tax compliance, tax advice and tax planning. Fiscal year 2016 also includes Tax Fees for agreed-upon procedures related to a fund merger and a final tax return. Fiscal years 2016 and 2015 include Tax Fees for foreign tax filings.
During the fiscal years ended August 31, 2016 and August 31, 2015, there were no Tax Fees billed by the registrant’s principal accountant to the registrant’s investment adviser (not including any sub-adviser whose role is primarily portfolio management and is subcontracted with or overseen by another investment adviser) and any entity controlling, controlled by, or under common control with the adviser that provides ongoing services
to the registrant for an engagement that related directly to the operations and financial reporting of the registrant.
(d) All Other Fees. Aggregate All Other Fees billed by the principal accountant to the registrant for professional services rendered during the fiscal years ended August 31, 2016 and August 31, 2015 are approximately as follows:
All Other Fees include amounts for products and services provided by the principal accountant, other than the services reported in paragraphs (a) through (c) above.
Aggregate All Other Fees billed by the registrant’s principal accountant to the registrant’s investment adviser (not including any sub-adviser whose role is primarily portfolio management and is subcontracted with or overseen by another investment adviser) and any entity controlling, controlled by, or under common control with the adviser that provides ongoing services to the registrant for an engagement that related directly to the operations and financial reporting of the registrant during the fiscal years ended August 31, 2016 and August 31, 2015 are approximately as follows:
2016 | | 2015 | |
$ | 242,500 | | $ | 225,000 | |
| | | | | |
In fiscal years 2016 and 2015, All Other Fees primarily consists of fees billed for internal control examinations of the registrant’s transfer agent and investment adviser.
(e)(1) Audit Committee Pre-Approval Policies and Procedures
The registrant’s Audit Committee is required to pre-approve the engagement of the registrant’s independent auditors to provide audit and non-audit services to the registrant and non-audit services to its investment adviser (excluding any sub-adviser whose role is primarily portfolio management and is sub-contracted or overseen by another investment adviser (the “Adviser”) or any entity controlling, controlled by or under common control with the Adviser that provides ongoing services to the Fund (a “Control Affiliate”) if the engagement relates directly to the operations and financial reporting of the registrant.
The Audit Committee has adopted a Policy for Engagement of Independent Auditors for Audit and Non-Audit Services (the “Policy”). The Policy sets forth the understanding of the Audit Committee regarding the engagement of the registrant’s independent accountants to provide (i) audit and permissible audit-related, tax and other services to the registrant (“Fund Services”); (ii) non-audit services to the registrant’s Adviser and any Control Affiliates, that relates directly to the operations and financial reporting of a Fund (“Fund-related Adviser Services”); and (iii) certain other audit and non-audit services to the registrant’s Adviser and its Control Affiliates. A service will require specific pre-approval by the Audit Committee if it is to be provided by the Fund’s
independent auditor; provided, however, that pre-approval of non-audit services to the Fund, the Adviser or Control Affiliates may be waived if certain de minimis requirements set forth in the SEC’s rules are met.
Under the Policy, the Audit Committee may delegate pre-approval authority to any pre-designated member or members who are independent board members. The member(s) to whom such authority is delegated must report, for informational purposes only, any pre-approval decisions to the Audit Committee at its next regular meeting. The Audit Committee’s responsibilities with respect to the pre-approval of services performed by the independent auditor may not be delegated to management.
On an annual basis, at a regularly scheduled Audit Committee meeting, the Fund’s Treasurer or other Fund officer shall submit to the Audit Committee a schedule of the types of Fund Services and Fund-related Adviser Services that are subject to specific pre-approval. This schedule will provide a description of each type of service that is subject to specific pre-approval, along with total projected fees for each service. The pre-approval will generally cover a one-year period. The Audit Committee will review and approve the types of services and the projected fees for the next one-year period and may add to, or subtract from, the list of pre-approved services from time to time, based on subsequent determinations. This specific approval acknowledges that the Audit Committee is in agreement with the specific types of services that the independent auditor will be permitted to perform and the projected fees for each service.
The Fund’s Treasurer or other Fund officer shall report to the Audit Committee at each of its regular meetings regarding all Fund Services or Fund-related Adviser Services provided since the last such report was rendered, including a description of the services, by category, with forecasted fees for the annual reporting period, proposed changes requiring specific pre-approval and a description of services provided by the independent auditor, by category, with actual fees during the current reporting period.
*****
(e)(2) 100% of the services performed for items (b) through (d) above during 2016 and 2015 were pre-approved by the registrant’s Audit Committee.
(f) Not applicable.
(g) The aggregate non-audit fees billed by the registrant’s accountant for services rendered to the registrant, and rendered to the registrant’s investment adviser (not including any sub-adviser whose role is primarily portfolio management and is subcontracted with or overseen by another investment adviser), and any entity controlling, controlled by, or under common control with the adviser that provides ongoing services to the registrant during the fiscal years ended August 31, 2016 and August 31, 2015 are approximately as follows:
2016 | | 2015 | |
$ | 351,400 | | $ | 313,600 | |
| | | | | |
(h) The registrant’s Audit Committee of the Board of Directors has considered whether the provision of non-audit services that were rendered to the registrant’s adviser (not including any sub-adviser whose role is primarily portfolio management and is subcontracted with or overseen by another investment adviser), and any entity controlling, controlled by, or under common control with the investment adviser that provides ongoing services to the registrant that were not pre-approved pursuant to paragraph (c)(7)(ii) of Rule 2-01 of Regulation S-X, is compatible with maintaining the principal accountant’s independence.
Item 5. Audit Committee of Listed Registrants.
Not applicable.
Item 6. Investments
(a) The registrant’s “Schedule I — Investments in securities of unaffiliated issuers” (as set forth in 17 CFR 210.12-12) is included in Item 1 of this Form N-CSR.
(b) Not applicable.
Item 7. Disclosure of Proxy Voting Policies and Procedures for Closed-End Management Investment Companies.
Not applicable.
Item 8. Portfolio Managers of Closed-End Management Investment Companies.
Not applicable.
Item 9. Purchases of Equity Securities by Closed-End Management Investment Company and Affiliated Purchasers.
Not applicable.
Item 10. Submission of Matters to a Vote of Security Holders.
There were no material changes to the procedures by which shareholders may recommend nominees to the registrant’s board of directors.
Item 11. Controls and Procedures.
(a) The registrant’s principal executive officer and principal financial officers, based on their evaluation of the registrant’s disclosure controls and procedures as of a date within 90 days of the filing of this report, have concluded that such controls and procedures are adequately designed to ensure that material information required to be disclosed by the registrant in Form N-CSR is accumulated and
communicated to the registrant’s management, including the principal executive officer and principal financial officer, or persons performing similar functions, as appropriate to allow timely decisions regarding required disclosure.
(b) There was no change in the registrant’s internal control over financial reporting that occurred during the registrant’s second fiscal quarter of the period covered by this report that has materially affected, or is reasonably likely to materially affect, the registrant’s internal control over financial reporting.
Item 12. Exhibits.
(a)(1) Code of ethics required to be disclosed under Item 2 of Form N-CSR attached hereto as Exhibit 99.CODE ETH.
(a)(2) Certifications pursuant to Rule 30a-2(a) under the Investment Company Act of 1940 (17 CFR 270.30a-2(a)) attached hereto as Exhibit 99.CERT.
(a)(3) Not applicable.
(b) Certification pursuant to Rule 30a-2(b) under the Investment Company Act of 1940 (17 CFR 270.30a-2(b)) attached hereto as Exhibit 99.906CERT.
SIGNATURES
Pursuant to the requirements of the Securities Exchange Act of 1934 and the Investment Company Act of 1940, the registrant has duly caused this report to be signed on its behalf by the undersigned, thereunto duly authorized.
(registrant) | | | Columbia Funds Series Trust I | |
| | | |
| | | |
By (Signature and Title) | | /s/ Christopher O. Petersen | |
| Christopher O. Petersen, President and Principal Executive Officer | |
| | | |
| | | |
Date | | | October 25, 2016 | |
| | | | | |
Pursuant to the requirements of the Securities Exchange Act of 1934 and the Investment Company Act of 1940, this report has been signed below by the following persons on behalf of the registrant and in the capacities and on the dates indicated.
By (Signature and Title) | | /s/ Christopher O. Petersen | |
| Christopher O. Petersen, President and Principal Executive Officer | |
| | | |
| | | |
Date | | | October 25, 2016 | |
| | | | |
| | | | |
By (Signature and Title) | | /s/ Michael G. Clarke | |
| | Michael G. Clarke, Treasurer and Chief Financial Officer | |
| | | |
| | | |
Date | | | October 25, 2016 | |