UNITED STATES
SECURITIES AND EXCHANGE COMMISSION
Washington, D.C. 20549
FORM N-CSR
CERTIFIED SHAREHOLDER REPORT OF REGISTERED
MANAGEMENT INVESTMENT COMPANIES
Investment Company Act file number | 811-04367 |
|
Columbia Funds Series Trust I |
(Exact name of registrant as specified in charter) |
|
225 Franklin Street, Boston, Massachusetts | | 02110 |
(Address of principal executive offices) | | (Zip code) |
|
Ryan Larrenaga
c/o Columbia Management Investment Advisers, LLC
225 Franklin Street
Boston, MA 02110 |
(Name and address of agent for service) |
|
Registrant’s telephone number, including area code: | (800) 345-6611 | |
|
Date of fiscal year end: | July 31 | |
|
Date of reporting period: | July 31, 2016 | |
| | | | | | | | |
Form N-CSR is to be used by management investment companies to file reports with the Commission not later than 10 days after the transmission to stockholders of any report that is required to be transmitted to stockholders under Rule 30e-1 under the Investment Company Act of 1940 (17 CFR 270.30e-1). The Commission may use the information provided on Form N-CSR in its regulatory, disclosure review, inspection, and policymaking roles.
A registrant is required to disclose the information specified by Form N-CSR, and the Commission will make this information public. A registrant is not required to respond to the collection of information contained in Form N-CSR unless the Form displays a currently valid Office of Management and Budget (“OMB”) control number. Please direct comments concerning the accuracy of the information collection burden estimate and any suggestions for reducing the burden to Secretary, Securities and Exchange Commission, 450 Fifth Street, NW, Washington, DC 20549-0609. The OMB has reviewed this collection of information under the clearance requirements of 44 U.S.C. § 3507.
Item 1. Reports to Stockholders.

ANNUAL REPORT
July 31, 2016

COLUMBIA AMT-FREE OREGON INTERMEDIATE
MUNI BOND FUND


ABOUT COLUMBIA THREADNEEDLE INVESTMENTS
Columbia Threadneedle Investments is a leading global asset management group that provides a broad range of investment strategies and solutions for individual, institutional and corporate clients around the world.
With more than 2,000 people, including over 450 investment professionals based in North America, Europe and Asia, we manage $460 billion* of assets across developed and emerging market equities, fixed income, asset allocation solutions and alternatives. We are the 13th largest manager of long-term mutual fund assets in the U.S.** and the 4th largest manager of retail funds in the U.K.***
Our priority is the investment success of our clients. We aim to deliver the investment outcomes they expect through an investment approach that is team-based, performance-driven and risk-aware. Our culture is dynamic and interactive. By sharing our insights across asset classes and geographies, we generate richer perspectives on global, regional and local investment landscapes. The ability to exchange and debate investment ideas in a collaborative environment enriches our teams' investment processes. More importantly, it results in better informed investment decisions for our clients.
Columbia funds are distributed by Columbia Management Investment Distributors, Inc., member FINRA, and managed by Columbia Management Investment Advisers, LLC.
Columbia Threadneedle Investments (Columbia Threadneedle) is the global brand name of the Columbia and Threadneedle group of companies.
* In U.S. dollars as of June 30, 2016. Source: Ameriprise Q2 Earnings Release. Includes all assets managed by entities in the Columbia and Threadneedle group of companies. Contact us for more current data.
** Source: ICI as of June 30, 2016 for Columbia Management Investment Advisers, LLC.
*** Source: Investment Association as of March 2016 for Threadneedle Asset Management Limited.
© 2016 Columbia Management Investment Advisers, LLC. All rights reserved.
Not part of the shareholder report
Investment strategies to help meet investor needs
We are committed to helping investors navigate financial challenges to reach their desired outcomes. The possibilities are endless.
Your success is our priority.
 Retire comfortably
 Fund college or higher education
 Leave a legacy

Generate an appropriate stream of income in retirement
Traditional approaches to income may no longer be adequate — and they may no longer provide the diversification benefits they once did. Investors need to rethink how they generate retirement income.
Worried about running out of income? You are not alone.

Navigate a changing interest rate environment
Even in today's challenging interest rate environment, it's still possible to navigate markets and achieve your goals.
Make investment choices designed specifically for this market environment.

Maximize after-tax returns
In an environment where what you keep is more important than what you earn, municipal bonds can help mitigate higher taxes while providing attractive yields compared to other investment options.
You've worked too hard building your wealth to lose it to taxes.

Grow assets to achieve financial goals
Finding growth opportunities in today's complex market environment requires strong research capabilities, creative thinking and a disciplined approach.
Do your investments deliver the portfolio growth you need?

Ease the impact of volatile markets
With increasing concerns about market volatility, investors should consider diversifying their portfolios with non-traditional holdings.
Interested in turning volatility into opportunity?
To find out more, contact your financial professional, call 800.426.3750 or visit investor.columbiathreadneedleus.com
Not part of the shareholder report
 Dear Shareholders,
Volatility comes with the territory for long-term investors. Some investors instinctively want to pull out of the market or sell underperforming investments at the first sign of increased volatility or perhaps even as soon as they perceive it on the horizon. But taking yourself out of the market could mean losing out on potential opportunities, and putting your longer term investment goals at risk.
Cumulative return is not just about achieving high returns when markets are going up; it's also about remaining invested and minimizing losses during weak or volatile markets so that you can participate on the upside. Developing a deeper understanding of the various risks your portfolio is subject to can help you balance these risks.
Diversification is critical in seeking to achieve that balance. We believe that most portfolios could be more effectively diversified either by introducing holdings with performance profiles unrelated to existing holdings (like alternative products) or by rebalancing existing holdings with an eye toward risk allocation. Over time, distributing risk more evenly may produce a more pronounced diversification benefit and may improve portfolio efficiency. We believe market volatility can create significant opportunities and, in fact, these periods may be some of the very best times to invest.
With this in mind, I thought it important to highlight excerpts from a piece written by Colin Moore, Global Chief Investment Officer, in which he touches on some of these issues emphasizing the importance of a properly constructed portfolio in seeking to effectively manage volatility and to achieve consistency of returns. I encourage you to read the article in its entirety. To access the full article and for other insights on current market, please visit blog.columbiathreadneedleus.com/latest-perspectives.
You need investments that are designed to help you ease the impact of volatile market environments and keep the savings you have worked tirelessly to amass. Columbia Threadneedle Investments provides investment solutions to help you tackle financial challenges and achieve your desired outcome.
Best regards,

Christopher O. Petersen
President, Columbia Funds
Excerpts from:
Taking the scare out of the volatility bogeyman
By Colin Moore, Global Chief Investment Officer
Colin Moore is the global chief investment officer for Columbia Threadneedle Investments. His responsibilities include ensuring that a disciplined investment process is in place across all asset classes, including equity and fixed income. Mr. Moore joined one of the Columbia Threadneedle Investments legacy firms in 2002 as head of equity and was also head of fixed income and liquidity strategies from 2009 – 2010.

n In today's low growth, higher volatility world, the emphasis is shifting from maximization of returns to consistency of returns.
PRESIDENT'S MESSAGE (continued)
n Portfolios should represent the behavioral risk-return tradeoff of investors, remembering that they won't stay invested to realize the return if we get the risk tolerance wrong.
n Holding long-term savings in cash to avoid volatility (the financial equivalent of hiding under the sheets) is detrimental to achieving long-term goals.
According to Wikipedia, "The bogeyman is a common allusion to a mythical creature in many cultures used to control behavior. This monster has no specific appearance, and conceptions about it can vary drastically from household to household within the same community; in many cases he has no set appearance in the mind of an adult or child, but is simply a non-specific embodiment of terror." Different cultures have different names and physical representations for the bogeyman, and investors are no different. We have terrible monsters that we fear may destroy our portfolios, and we call one of the scariest of them volatility.
While the bogeyman is mythical (I hope!), volatility is real and can cause serious damage. To understand why investors have such a hard time coping with volatility, we first need to define three cognitive biases at work in today's investment environment:
1) Recency bias — something that has recently come to the forefront of our attention, regardless of how long established it is, suddenly seems to appear with improbable frequency.
2) Negativity bias — we tend to have a greater recall of unpleasant memories than positive memories.
3) Loss aversion — our dissatisfaction with losing money tends to be greater than our satisfaction with making money.
The level of volatility varies dramatically, and so does investor fear and panic selling — waxing when volatility rises, waning when it falls. Recent studies have pointed to demographics as an important driver of panic selling. The theory is that as people get closer to retirement, the prospects of a large (20% – 30%) loss in financial assets can have a much more pronounced effect on their sense of well-being. Wealth preservation instincts kick in much more quickly than for younger (and typically less wealthy) savers.
The reality is that there is little opportunity for return without volatility. Therefore, the bogeyman effect of holding long-term savings in cash to avoid volatility (the financial equivalent of hiding under the sheets) is detrimental to achieving long-term goals. This effect tends to be more pronounced during the episodic spikes in volatility. The significant spike in volatility in 2008 and 2009 led to significant withdrawals from long-term investment funds over the same period. Less pronounced effects can also be seen when comparing 2001 – 2003 and 2011 – 2012. Conversely, flows picked up when volatility returned to "normal" levels. Investor behavior of this type is consistent with the three behavioral biases.
I believe average volatility will be higher over the next 10 years than the last 10 years and episodic spikes will increase in frequency because sustainable economic growth will be structurally lower and geopolitical risk higher than any time since World War II. Low growth creates uncertainty while loss aversion will make investors fear that we are one economic mishap or geopolitical event away from no growth or recession. The result will be higher volatility on average. Negativity bias will tend to exacerbate "spike" reactions to event-driven geopolitical news, and the volatility bogeyman will appear more often. Assuming the behavioral biases continue, investor returns are likely to be very disappointing regardless of the total return generated by financial markets due to the bogeyman effect.
To mitigate this effect, we need to focus on portfolio construction and an improved understanding of diversification. I accept that equities are likely to offer the highest return over the next 10 years, but they also offer the highest volatility. Many portfolio construction optimization tools use historical average volatility, which is likely to underestimate the volatility investors will face. The bogeyman emerges when individual asset class volatility spikes and cross correlations rise, the combination of which increases overall portfolio volatility far beyond expectation. Diversification is meant to protect investors against volatility, but what's the point of owning lots of investments if the volatility bogeyman has not been properly estimated?
Most importantly, portfolios should be constructed to properly represent the behavioral risk-return tradeoff of investors, remembering that they won't stay invested to realize the return if we get the risk tolerance wrong. In a low growth, higher volatility world, the emphasis is shifting to return consistency rather than return maximization,
PRESIDENT'S MESSAGE (continued)
and investors are best served through investment approaches that appreciate that distinction. Even though it's a permanent feature of financial markets, volatility is less likely to be the bogeyman we all fear if portfolios are constructed with this understanding.
Please visit blog.columbiathreadneedleus.com/latest-perspectives to read the entire article.
Investors should consider the investment objectives, risks, charges and expenses of a mutual fund carefully before investing. For a free prospectus and summary prospectus, which contains this and other important information about a fund, visit investor.columbiathreadneedleus.com. The prospectus should be read carefully before investing.
The views expressed are as of April 2016, may change as market or other conditions change, and may differ from views expressed by other Columbia Management Investment Advisers, LLC (CMIA) associates or affiliates. Actual investments or investment decisions made by CMIA and its affiliates, whether for its own account or on behalf of clients, will not necessarily reflect the views expressed. This information is not intended to provide investment advice and does not account for individual investor circumstances. Investment decisions should always be made based on an investor's specific financial needs, objectives, goals, time horizon and risk tolerance. Asset classes described may not be suitable for all investors.
Past performance does not guarantee future results, and no forecast should be considered a guarantee either. Since economic and market conditions change frequently, there can be no assurance that the trends described here will continue or that the forecasts are accurate.
Diversification does not guarantee a profit or protect against loss.
Columbia Funds are distributed by Columbia Management Investment Distributors, Inc., member FINRA, and managed by Columbia Management Investment Advisers, LLC.
© 2016 Columbia Management Investment Advisers, LLC. All rights reserved.
COLUMBIA AMT-FREE OREGON INTERMEDIATE MUNI BOND FUND
Performance Overview | | | 2 | | |
Manager Discussion of Fund Performance | | | 4 | | |
Understanding Your Fund's Expenses | | | 6 | | |
Portfolio of Investments | | | 7 | | |
Statement of Assets and Liabilities | | | 16 | | |
Statement of Operations | | | 18 | | |
Statement of Changes in Net Assets | | | 19 | | |
Financial Highlights | | | 21 | | |
Notes to Financial Statements | | | 27 | | |
Report of Independent Registered Public Accounting Firm | | | 34 | | |
Federal Income Tax Information | | | 35 | | |
Trustees and Officers | | | 36 | | |
Board Consideration and Approval of Management Agreement | | | 41 | | |
Important Information About This Report | | | 45 | | |
Fund Investment Manager
Columbia Management Investment
Advisers, LLC
225 Franklin Street
Boston, MA 02110
Fund Distributor
Columbia Management Investment
Distributors, Inc.
225 Franklin Street
Boston, MA 02110
Fund Transfer Agent
Columbia Management Investment
Services Corp.
P.O. Box 8081
Boston, MA 02266-8081
For more information about any of the funds, please visit investor.columbiathreadneedleus.com or call 800.345.6611. Customer Service Representatives are available to answer your questions Monday through Friday from 8 a.m. to 7 p.m. Eastern time.
The views expressed in this report reflect the current views of the respective parties. These views are not guarantees of future performance and involve certain risks, uncertainties and assumptions that are difficult to predict, so actual outcomes and results may differ significantly from the views expressed. These views are subject to change at any time based upon economic, market or other conditions and the respective parties disclaim any responsibility to update such views. These views may not be relied on as investment advice and, because investment decisions for a Columbia fund are based on numerous factors, may not be relied on as an indication of trading intent on behalf of any particular Columbia fund. References to specific securities should not be construed as a recommendation or investment advice.
COLUMBIA AMT-FREE OREGON INTERMEDIATE MUNI BOND FUND
Performance Summary
n Columbia AMT-Free Oregon Intermediate Muni Bond Fund (the Fund) Class A shares returned 4.92% excluding sales charges for the 12-month period that ended July 31, 2016. Class Z shares of the Fund returned 5.18% for the same 12-month period.
n The Fund underperformed its benchmark, the Barclays 3-15 Year Blend Municipal Bond Index, which returned 6.11% during the same time period.
n The Fund underperformed its benchmark due in part to its shorter average maturity and higher average credit quality
Average Annual Total Returns (%) (for period ended July 31, 2016)
| | | Inception | | 1 Year | | 5 Years | | 10 Years | |
Class A | | 11/01/02 | | | | | | | | | | | | | |
Excluding sales charges | | | | | | | 4.92 | | | | 3.55 | | | | 3.81 | | |
Including sales charges | | | | | | | 1.75 | | | | 2.92 | | | | 3.49 | | |
Class B | | 11/01/02 | | | | | | | | | | | | | |
Excluding sales charges | | | | | | | 4.13 | | | | 2.79 | | | | 3.05 | | |
Including sales charges | | | | | | | 1.13 | | | | 2.79 | | | | 3.05 | | |
Class C | | 10/13/03 | | | | | | | | | | | | | |
Excluding sales charges | | | | | | | 4.53 | | | | 3.13 | | | | 3.39 | | |
Including sales charges | | | | | | | 3.53 | | | | 3.13 | | | | 3.39 | | |
Class R4* | | 03/19/13 | | | 5.18 | | | | 3.81 | | | | 4.07 | | |
Class R5* | | 11/08/12 | | | 5.24 | | | | 3.84 | | | | 4.09 | | |
Class Z | | 07/02/84 | | | 5.18 | | | | 3.80 | | | | 4.07 | | |
Barclays 3-15 Year Blend Municipal Bond Index | | | | | | | 6.11 | | | | 4.42 | | | | 4.92 | | |
Returns for Class A are shown with and without the maximum initial sales charge of 3.00%. Returns for Class B are shown with and without the applicable contingent deferred sales charge (CDSC) of 3.00% in the first year, declining to 1.00% in the fourth year and eliminated thereafter. Returns for Class C are shown with and without the 1.00% CDSC for the first year only. The Fund's other classes are not subject to sales charges and have limited eligibility. Please see the Fund's prospectus for details. Performance for different share classes will vary based on differences in sales charges and fees associated with each class. All results shown assume reinvestment of distributions during the period. Returns do not reflect the deduction of taxes that a shareholder may pay on Fund distributions or on the redemption of Fund shares. Performance results reflect the effect of any fee waivers or reimbursements of Fund expenses by Columbia Management Investment Advisers, LLC and/or any of its affiliates. Absent these fee waivers or expense reimbursement arrangements, performance results would have been lower.
The performance information shown represents past performance and is not a guarantee of future results. The investment return and principal value of your investment will fluctuate so that your shares, when redeemed, may be worth more or less than their original cost. Current performance may be lower or higher than the performance information shown. You may obtain performance information current to the most recent month-end by contacting your financial intermediary, visiting investor.columbiathreadneedleus.com or calling 800.345.6611.
*The returns shown for periods prior to the share class inception date (including returns for the Life of the Fund, if shown, which are since Fund inception) include the returns of the Fund's oldest share class. These returns are adjusted to reflect any higher class-related operating expenses of the newer share classes, as applicable. Please visit investor.columbiathreadneedle.com/us/investment-products/mutual-funds/ appended-performance for more information.
The Barclays 3-15 Year Blend Municipal Bond Index is an unmanaged index that tracks the performance of municipal bonds issued after December 31, 1990, with remaining maturities between 2 and 17 years and at least $7 million in principal amount outstanding. Effective August 24, 2016, the Barclays 3-15 Year Blend Municipal Bond Index was rebranded as the Bloomberg Barclays 3-15 Year Blend Municipal Bond Index.
Indices are not available for investment, are not professionally managed and do not reflect sales charges, fees, brokerage commissions, taxes or other expenses of investing. Securities in the Fund may not match those in an index.
Annual Report 2016
2
COLUMBIA AMT-FREE OREGON INTERMEDIATE MUNI BOND FUND
PERFORMANCE OVERVIEW (continued)
Performance of a Hypothetical $10,000 Investment (August 1, 2006 – July 31, 2016)
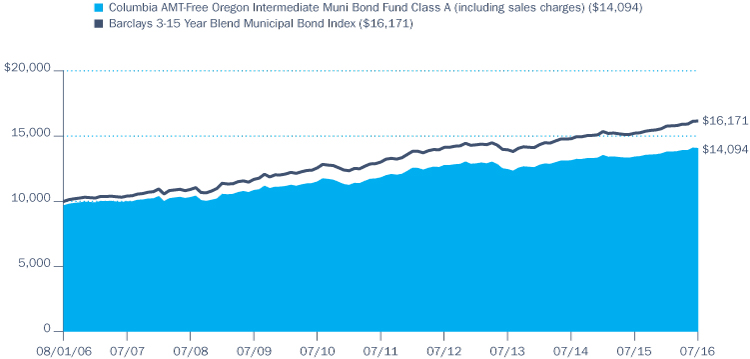
The chart above shows the change in value of a hypothetical $10,000 investment in Class A shares of Columbia AMT-Free Oregon Intermediate Muni Bond Fund during the stated time period, and does not reflect the deduction of taxes that a shareholder may pay on Fund distributions or on the redemption of Fund shares.
Annual Report 2016
3
COLUMBIA AMT-FREE OREGON INTERMEDIATE MUNI BOND FUND
MANAGER DISCUSSION OF FUND PERFORMANCE
Portfolio Management
Brian McGreevy
Quality Breakdown (%)
(at July 31, 2016) | |
AAA rating | | | 2.6 | | |
AA rating | | | 61.0 | | |
A rating | | | 22.7 | | |
BBB rating | | | 7.0 | | |
C rating | | | 1.5 | | |
Not rated | | | 5.2 | | |
Total | | | 100.0 | | |
Percentages indicated are based upon total fixed income investments (excluding Money Market Funds).
Bond ratings apply to the underlying holdings of the Fund and not the Fund itself and are divided into categories ranging from highest to lowest credit quality, determined by using the middle rating of Moody's, S&P and Fitch, after dropping the highest and lowest available ratings. When ratings are available from only two rating agencies, the lower rating is used. When a rating is available from only one rating agency, that rating is used. When a bond is not rated by any rating agency, it is designated as "Not rated." Credit quality ratings assigned by a rating agency are subjective opinions, not statements of fact, and are subject to change, including daily. The ratings assigned by credit rating agencies are but one of the considerations that the Investment Manager and/or Fund's subadviser incorporates into its credit analysis process, along with such other issuer-specific factors as cash flows, capital structure and leverage ratios, ability to de-leverage (repay) through free cash flow, quality of management, market positioning and access to capital, as well as such security-specific factors as the terms of the security (e.g., interest rate and time to maturity) and the amount and type of any collateral.
The Fund's Class A shares returned 4.92% excluding sales charges during the 12-month period that ended July 31, 2016. Class Z shares of the Fund returned 5.18% for the same time period. The Fund underperformed its benchmark, the Barclays 3-15 Year Blend Municipal Bond Index, which returned 6.11% during the 12-month period. The Fund underperformed its benchmark due in part to its shorter average maturity and higher average credit quality.
Market Overview
The U.S. municipal bond market produced a gain during the 12 months ended July 31, 2016. The combination of low-single-digit economic growth and investor confidence in the U.S. Federal Reserve's (the Fed's) ability to maintain its low-rate policy led to a meaningful decline in yields (and a corresponding rise in prices). Municipals outperformed U.S. Treasuries, thanks in part to a highly favorable balance of supply and demand in the market. Mutual fund cash flows provided a steady source of demand, with positive inflows for 40 consecutive weeks as of the close of the period. During that interval alone, inflows into municipal bond funds totaled over $40 billion. Insurance companies and banks were active buyers as well. Supply was also robust, but almost half of the new issuance came from refunding deals — rather than new issuance — as issuers sought to take advantage of the cost savings from refinancing older, higher coupon debt. We expect refunding activity can continue at a solid pace given the current low level of interest rates. However, municipalities remain reluctant to commit to new long-term capital projects due to the continued slow growth of the U.S. economy, which has helped cap new-issue supply.
The strength of state and local finances throughout the United States, with the notable exceptions of New Jersey, Illinois, the City of Chicago, and Puerto Rico, further aided the performance of municipal securities. Long-term securities generally produced higher returns than shorter term issues, leading to a flattening of the yield curve. Lower quality bonds outpaced their higher quality counterparts, as investors' hearty appetite for risk fueled a reach for yield.
Impressive Growth for Oregon's Economy
Oregon continued to demonstrate healthy growth trends that were superior to those of the United States as a whole. The state was helped by the combination of rising population growth, an unemployment rate that was below both the regional and national averages, and the presence of a vigorous technology industry. These developments, in turn, fueled strength in the consumer and housing industries. Home prices rose more rapidly than they did at the national level, due in part to the state's growing population. These favorable trends, in turn, fed through to improving credit fundamentals and positive performance for Oregon's municipal bond market. The state had no significant credit events during the period, which was an additional positive.
Annual Report 2016
4
COLUMBIA AMT-FREE OREGON INTERMEDIATE MUNI BOND FUND
MANAGER DISCUSSION OF FUND PERFORMANCE (continued)
Contributors and Detractors
The strongest contribution to Fund performance came from its investments in longer term, zero-coupon bonds with 12- to 17-year maturities. Since zero-coupon issues typically have higher durations (greater interest-rate sensitivity) than coupon bonds, they gained an outsized benefit from the overall strength in the market. Positions in the transportation and electric revenue sectors generated above-benchmark results, as well. Local general obligation issues, which tend to have longer maturities, also outperformed. The Fund's investments in the debt of continuing-care retirement communities (CCRCs) added further value, and we continued to see an opportunity in the sector on the belief that the aging U.S. population represents a source of long-term demand. The hospital sector — where the Fund had an overweight position — performed in-line with the market during the past 12 months, but the sector has been a strong performer over the longer term.
The Fund had an overweight position in pre-refunded bonds due to the heavy refinancing activity in the market. Since these issues generally have shorter maturities, this aspect of our positioning detracted from performance. The Fund had an above-average weighting in issues with maturities less than the benchmark (zero to two years) overall, which was a drag on results at a time in which longer term bonds outperformed.
Lower quality debt delivered the best results due to the elevated demand for higher yielding investments, with bonds rated A and BBB outpacing those rated AAA and A. Much of the issuance in Oregon over the past year was in higher quality bonds, such as Qualified School Construction Bonds with AA ratings, so the opportunities in lower rated debt were limited. The Fund therefore had less exposure to the lower quality credit tiers than the benchmark, which was a headwind for relative performance.
Fund Positioning
We identified value in lower coupon issues, such as those in the 4% to 4.5% range. Spreads for these bonds were wider early in the period, and we took advantage of the opportunity to add to this segment in order to pick up added yield and diversify the portfolio's coupon structure. (Diversification does not assure a profit or protect against loss.) We also added to the CCRC and utilities sectors, as well as several higher quality issues. Although we saw more value in the A and BBB rating tiers, the opportunities in this space were limited in Oregon's market. In terms of our duration strategy, we sought to stay neutral versus the benchmark by decreasing the Fund's exposure to short maturities and adding issues in the 12- to 17-year range.
Investment Risks
Fixed-income securities present issuer default risk. The Fund invests substantially in municipal securities and will be affected by tax, legislative, regulatory, demographic or political changes, as well as changes impacting a state's financial, economic or other conditions. A relatively small number of tax-exempt issuers may necessitate the Fund investing more heavily in a single issuer and, therefore, be more exposed to the risk of loss than a Fund that invests more broadly. The value of the Fund's portfolio may be more volatile than a more geographically diversified fund. Prepayment and extension risk exists because a loan, bond or other investment may be called, prepaid or redeemed before maturity and similar yielding investments may not be available for purchase. A rise in interest rates may result in a price decline of fixed-income instruments held by the Fund, negatively impacting its performance and NAV. Falling rates may result in the Fund investing in lower yielding debt instruments, lowering the Fund's income and yield. These risks may be heightened for longer maturity and duration securities. Non-investment-grade (high-yield or junk) securities present greater price volatility and more risk to principal and income than higher rated securities. Market risk may affect a single issuer, sector of the economy, industry or the market as a whole. Federal and state tax rules apply to capital gain distributions and any gains or losses on sales. Income may be subject to state or local taxes. Liquidity risk is associated with the difficulty of selling underlying investments at a desirable time or price. See the Fund's prospectus for more information on these and other risks.
Annual Report 2016
5
COLUMBIA AMT-FREE OREGON INTERMEDIATE MUNI BOND FUND
UNDERSTANDING YOUR FUND'S EXPENSES
(Unaudited)
As an investor, you incur two types of costs. There are transaction costs, which generally include sales charges on purchases and may include redemption fees. There are also ongoing costs, which generally include management fees, distribution and/or service fees, and other fund expenses. The following information is intended to help you understand your ongoing costs (in dollars) of investing in the Fund and to help you compare these costs with the ongoing costs of investing in other mutual funds.
Analyzing Your Fund's Expenses
To illustrate these ongoing costs, we have provided examples and calculated the expenses paid by investors in each share class of the Fund during the period. The actual and hypothetical information in the table is based on an initial investment of $1,000 at the beginning of the period indicated and held for the entire period. Expense information is calculated two ways and each method provides you with different information. The amount listed in the "Actual" column is calculated using the Fund's actual operating expenses and total return for the period. You may use the Actual information, together with the amount invested, to estimate the expenses that you paid over the period. Simply divide your account value by $1,000 (for example, an $8,600 account value divided by $1,000 = 8.6), then multiply the results by the expenses paid during the period under the "Actual" column. The amount listed in the "Hypothetical" column assumes a 5% annual rate of return before expenses (which is not the Fund's actual return) and then applies the Fund's actual expense ratio for the period to the hypothetical return. You should not use the hypothetical account values and expenses to estimate either your actual account balance at the end of the period or the expenses you paid during the period. See "Compare With Other Funds" below for details on how to use the hypothetical data.
Compare With Other Funds
Since all mutual funds are required to include the same hypothetical calculations about expenses in shareholder reports, you can use this information to compare the ongoing cost of investing in the Fund with other funds. To do so, compare the hypothetical example with the 5% hypothetical examples that appear in the shareholder reports of other funds. As you compare hypothetical examples of other funds, it is important to note that hypothetical examples are meant to highlight the ongoing costs of investing in a fund only and do not reflect any transaction costs, such as sales charges, or redemption or exchange fees. Therefore, the hypothetical calculations are useful in comparing ongoing costs only, and will not help you determine the relative total costs of owning different funds. If transaction costs were included in these calculations, your costs would be higher.
February 1, 2016 – July 31, 2016
| | | Account Value at the Beginning
of the Period ($) | | Account Value at the End of the
Period ($) | | Expenses Paid During the
Period ($) | | Fund's Annualized
Expense Ratio (%) | |
| | | Actual | | Hypothetical | | Actual | | Hypothetical | | Actual | | Hypothetical | | Actual | |
Class A | | | 1,000.00 | | | | 1,000.00 | | | | 1,020.70 | | | | 1,020.59 | | | | 4.32 | | | | 4.32 | | | | 0.86 | | |
Class B | | | 1,000.00 | | | | 1,000.00 | | | | 1,017.70 | | | | 1,016.81 | | | | 8.13 | | | | 8.12 | | | | 1.62 | | |
Class C | | | 1,000.00 | | | | 1,000.00 | | | | 1,019.20 | | | | 1,018.35 | | | | 6.58 | | | | 6.57 | | | | 1.31 | | |
Class R4 | | | 1,000.00 | | | | 1,000.00 | | | | 1,022.00 | | | | 1,021.83 | | | | 3.07 | | | | 3.07 | | | | 0.61 | | |
Class R5 | | | 1,000.00 | | | | 1,000.00 | | | | 1,023.10 | | | | 1,022.13 | | | | 2.77 | | | | 2.77 | | | | 0.55 | | |
Class Z | | | 1,000.00 | | | | 1,000.00 | | | | 1,022.00 | | | | 1,021.83 | | | | 3.07 | | | | 3.07 | | | | 0.61 | | |
Expenses paid during the period are equal to the annualized expense ratio for each class as indicated above, multiplied by the average account value over the period and then multiplied by the number of days in the Fund's most recent fiscal half year and divided by 366.
Expenses do not include fees and expenses incurred indirectly by the Fund from its investment in underlying funds, including affiliated and non-affiliated pooled investment vehicles, such as mutual funds and exchange-traded funds.
Had Columbia Management Investment Advisers, LLC and/or certain of its affiliates not waived/reimbursed certain fees and expenses, account value at the end of the period would have been reduced.
Annual Report 2016
6
COLUMBIA AMT-FREE OREGON INTERMEDIATE MUNI BOND FUND
PORTFOLIO OF INVESTMENTS
July 31, 2016
(Percentages represent value of investments compared to net assets)
Municipal Bonds 97.2%
Issue
Description | | Coupon
Rate | | Principal
Amount ($) | | Value ($) | |
AIRPORT 2.9% | |
Port of Portland
Refunding Revenue Bonds
Portland International Airport
Series 2015-23
07/01/28 | | | 5.000 | % | | | 1,240,000 | | | | 1,567,459 | | |
07/01/31 | | | 5.000 | % | | | 1,750,000 | | | | 2,177,035 | | |
07/01/32 | | | 5.000 | % | | | 2,000,000 | | | | 2,476,960 | | |
Revenue Bonds
Passenger Facility Charge
Series 2011
07/01/27 | | | 5.500 | % | | | 6,635,000 | | | | 7,839,584 | | |
Total | | | | | | | 14,061,038 | | |
HIGHER EDUCATION 4.6% | |
City of Forest Grove
Refunding Revenue Bonds
Campus Improvement Pacific University Project
Series 2014
05/01/34 | | | 5.250 | % | | | 1,000,000 | | | | 1,156,980 | | |
Series 2015
05/01/30 | | | 5.000 | % | | | 550,000 | | | | 662,624 | | |
Oregon Health & Science University
Revenue Bonds
Series 2012A
07/01/18 | | | 5.000 | % | | | 1,000,000 | | | | 1,080,150 | | |
Series 2012E
07/01/32 | | | 5.000 | % | | | 7,000,000 | | | | 8,352,680 | | |
Oregon Health & Science University(a)
Revenue Bonds
Capital Appreciation-Independent School District
Series 1996A (NPFGC)
07/01/21 | | | 0.000 | % | | | 9,000,000 | | | | 7,925,310 | | |
Oregon State Facilities Authority
Refunding Revenue Bonds
University Portland
Series 2015A
04/01/31 | | | 5.000 | % | | | 530,000 | | | | 638,671 | | |
University of Portland
Series 2015A
04/01/30 | | | 5.000 | % | | | 500,000 | | | | 605,030 | | |
Revenue Bonds
Linfield College Project
Series 2015A
10/01/24 | | | 5.000 | % | | | 1,390,000 | | | | 1,679,606 | | |
Total | | | | | | | 22,101,051 | | |
HOSPITAL 10.7% | |
Astoria Hospital Facilities Authority
Refunding Revenue Bonds
Columbia Memorial Hospital
Series 2012
08/01/17 | | | 4.000 | % | | | 810,000 | | | | 829,699 | | |
Municipal Bonds (continued)
Issue
Description | | Coupon
Rate | | Principal
Amount ($) | | Value ($) | |
08/01/18 | | | 4.000 | % | | | 745,000 | | | | 780,075 | | |
08/01/19 | | | 4.000 | % | | | 855,000 | | | | 913,285 | | |
08/01/20 | | | 4.000 | % | | | 915,000 | | | | 994,486 | | |
08/01/21 | | | 4.000 | % | | | 725,000 | | | | 798,580 | | |
08/01/26 | | | 5.000 | % | | | 1,200,000 | | | | 1,374,492 | | |
08/01/27 | | | 5.000 | % | | | 1,260,000 | | | | 1,436,350 | | |
08/01/31 | | | 5.000 | % | | | 2,860,000 | | | | 3,217,357 | | |
Hospital Facilities Authority of Multnomah County
Revenue Bonds
Adventist Health West
Series 2009A
09/01/21 | | | 5.000 | % | | | 3,685,000 | | | | 4,150,563 | | |
Klamath Falls Intercommunity Hospital Authority
Refunding Revenue Bonds
Sky Lakes Medical Center Project
Series 2012
09/01/18 | | | 5.000 | % | | | 1,195,000 | | | | 1,296,671 | | |
09/01/19 | | | 5.000 | % | | | 1,255,000 | | | | 1,408,524 | | |
09/01/22 | | | 5.000 | % | | | 500,000 | | | | 601,570 | | |
Series 2016
09/01/28 | | | 5.000 | % | | | 265,000 | | | | 331,075 | | |
09/01/30 | | | 5.000 | % | | | 430,000 | | | | 532,684 | | |
09/01/31 | | | 5.000 | % | | | 200,000 | | | | 246,748 | | |
09/01/32 | | | 5.000 | % | | | 270,000 | | | | 332,022 | | |
Oregon Health & Science University
Refunding Revenue Bonds
Series 2016B
07/01/34 | | | 5.000 | % | | | 4,000,000 | | | | 5,009,600 | | |
Oregon State Facilities Authority
Refunding Revenue Bonds
Legacy Health Project
Series 2011A
05/01/20 | | | 5.250 | % | | | 5,000,000 | | | | 5,795,300 | | |
PeaceHealth Project
Series 2009A
11/01/17 | | | 5.000 | % | | | 4,450,000 | | | | 4,689,677 | | |
11/01/19 | | | 5.000 | % | | | 3,695,000 | | | | 4,184,994 | | |
Series 2014A
11/15/29 | | | 5.000 | % | | | 1,600,000 | | | | 1,956,416 | | |
Samaritan Health Services
Series 2010A
10/01/22 | | | 5.000 | % | | | 3,450,000 | | | | 3,895,809 | | |
Salem Hospital Facility Authority
Revenue Bonds
Salem Hospital Project
Series 2006A
08/15/27 | | | 5.000 | % | | | 3,500,000 | | | | 3,510,430 | | |
Series 2008A
08/15/18 | | | 5.250 | % | | | 2,500,000 | | | | 2,717,150 | | |
Total | | | | | | | 51,003,557 | | |
The accompanying Notes to Financial Statements are an integral part of this statement.
Annual Report 2016
7
COLUMBIA AMT-FREE OREGON INTERMEDIATE MUNI BOND FUND
PORTFOLIO OF INVESTMENTS (continued)
July 31, 2016
Municipal Bonds (continued)
Issue
Description | | Coupon
Rate | | Principal
Amount ($) | | Value ($) | |
INDEPENDENT POWER 1.3% | |
Western Generation Agency
Revenue Bonds
Wauna Cogeneration Project
Series 2006A
01/01/20 | | | 5.000 | % | | | 3,235,000 | | | | 3,253,925 | | |
01/01/21 | | | 5.000 | % | | | 3,000,000 | | | | 3,026,160 | | |
Total | | | | | | | 6,280,085 | | |
INVESTOR OWNED 0.9% | |
Port of Morrow
Refunding Revenue Bonds
Portland General Electric
Series 1998A
05/01/33 | | | 5.000 | % | | | 3,750,000 | | | | 4,305,675 | | |
LOCAL GENERAL OBLIGATION 32.4% | |
Benton & Linn Counties Consolidated School District
No. 509J & 509A Corvallis
Unlimited General Obligation Refunding Bonds
Series 2007 (AGM)
06/15/20 | | | 5.000 | % | | | 5,000,000 | | | | 5,785,050 | | |
Blue Mountain Community College District
Unlimited General Obligation Bonds
Series 2015
06/15/29 | | | 4.000 | % | | | 1,000,000 | | | | 1,155,850 | | |
Boardman Park & Recreation District
Unlimited General Obligation Bonds
Series 2015
06/15/35 | | | 5.250 | % | | | 3,400,000 | | | | 3,886,812 | | |
Canyonville South Umpqua Rural Fire Protection District
Unlimited General Obligation Bonds
Series 2001
07/01/31 | | | 5.400 | % | | | 610,000 | | | | 610,982 | | |
Central Oregon Community College
Limited General Obligation Bonds
Series 2014
06/01/29 | | | 5.000 | % | | | 500,000 | | | | 612,110 | | |
Unlimited General Obligation Bonds
Series 2010
06/15/24 | | | 4.750 | % | | | 2,580,000 | | | | 2,962,330 | | |
Chemeketa Community College District
Unlimited General Obligation Refunding Bonds
Series 2015
06/15/26 | | | 4.000 | % | | | 1,745,000 | | | | 2,073,409 | | |
Chemeketa Community College
Unlimited General Obligation Refunding Bonds
Series 2014
06/15/26 | | | 5.000 | % | | | 1,100,000 | | | | 1,379,807 | | |
Municipal Bonds (continued)
Issue
Description | | Coupon
Rate | | Principal
Amount ($) | | Value ($) | |
City of Hillsboro
Limited General Obligation Refunding Bonds
Series 2012
06/01/25 | | | 4.000 | % | | | 1,875,000 | | | | 2,138,250 | | |
City of Lebanon
Unlimited General Obligation Refunding Bonds
Series 2015
06/01/26 | | | 5.000 | % | | | 1,675,000 | | | | 2,117,820 | | |
06/01/27 | | | 5.000 | % | | | 1,715,000 | | | | 2,161,054 | | |
City of Madras
Unlimited General Obligation Refunding Bonds
Series 2013
02/15/24 | | | 4.000 | % | | | 745,000 | | | | 833,610 | | |
02/15/27 | | | 4.500 | % | | | 500,000 | | | | 566,435 | | |
City of Portland
Limited General Obligation Bonds
Limited Tax Sellwood Bridge Project
Series 2014
06/01/24 | | | 5.000 | % | | | 1,985,000 | | | | 2,521,188 | | |
Limited Tax General Obligation Refunding Bonds
Series 2011A
06/01/23 | | | 5.000 | % | | | 6,140,000 | | | | 7,295,978 | | |
Unlimited General Obligation Refunding Bonds
Public Safety Projects and Emergency Facilities
Series 2014
06/15/24 | | | 5.000 | % | | | 1,885,000 | | | | 2,409,426 | | |
City of Portland(a)
Limited Tax General Obligation Bonds
Series 2001B
06/01/18 | | | 0.000 | % | | | 4,000,000 | | | | 3,935,440 | | |
06/01/19 | | | 0.000 | % | | | 4,000,000 | | | | 3,886,840 | | |
06/01/20 | | | 0.000 | % | | | 4,000,000 | | | | 3,823,080 | | |
City of Redmond
Limited General Obligation Bonds
Series 2014A
06/01/27 | | | 5.000 | % | | | 685,000 | | | | 841,817 | | |
City of Salem
Limited General Obligation Bonds
Series 2009
06/01/26 | | | 5.000 | % | | | 3,315,000 | | | | 3,695,164 | | |
Unlimited General Obligation Bonds
Series 2009
06/01/19 | | | 5.000 | % | | | 2,025,000 | | | | 2,267,696 | | |
06/01/20 | | | 5.000 | % | | | 880,000 | | | | 985,556 | | |
City of Sisters
Limited General Obligation Refunding Bonds
Series 2016
12/01/35 | | | 4.000 | % | | | 620,000 | | | | 700,321 | | |
Clackamas County School District No. 108 Estacada
Unlimited General Obligation Refunding Bonds
Series 2005 (AGM)
06/15/25 | | | 5.500 | % | | | 2,485,000 | | | | 3,338,573 | | |
The accompanying Notes to Financial Statements are an integral part of this statement.
Annual Report 2016
8
COLUMBIA AMT-FREE OREGON INTERMEDIATE MUNI BOND FUND
PORTFOLIO OF INVESTMENTS (continued)
July 31, 2016
Municipal Bonds (continued)
Issue
Description | | Coupon
Rate | | Principal
Amount ($) | | Value ($) | |
Clackamas County School District No. 12 North Clackamas
Unlimited General Obligation Refunding Bonds
Series 2014
06/15/29 | | | 5.000 | % | | | 1,500,000 | | | | 1,859,865 | | |
Unlimited General Obligation Refunding Notes
Series 2016
06/15/32 | | | 4.000 | % | | | 2,000,000 | | | | 2,312,240 | | |
Clackamas County School District No. 46 Oregon Trail
Unlimited General Obligation Bonds
Series 2009A
06/15/25 | | | 5.000 | % | | | 4,350,000 | | | | 4,873,783 | | |
06/15/26 | | | 5.000 | % | | | 3,000,000 | | | | 3,355,740 | | |
Clackamas County School District No. 62
Limited General Obligation Refunding Bonds
Series 2014
06/01/34 | | | 5.000 | % | | | 1,770,000 | | | | 2,146,284 | | |
Columbia Gorge Community College District
Unlimited General Obligation Refunding Bonds
Series 2012
06/15/18 | | | 3.000 | % | | | 810,000 | | | | 844,109 | | |
06/15/19 | | | 2.500 | % | | | 1,010,000 | | | | 1,059,389 | | |
County of Lane
Limited General Obligation Bonds
Series 2009A
11/01/24 | | | 5.000 | % | | | 1,000,000 | | | | 1,142,790 | | |
11/01/25 | | | 5.000 | % | | | 1,140,000 | | | | 1,299,543 | | |
Deschutes & Jefferson Counties School District No. 2J
Redmond
Unlimited General Obligation Bonds
Series 2004B (NPFGC)(a)
06/15/22 | | | 0.000 | % | | | 2,335,000 | | | | 2,156,092 | | |
Jackson County School District No. 549C Medford
Unlimited General Obligation Refunding Bonds
Series 2015
12/15/23 | | | 5.000 | % | | | 1,000,000 | | | | 1,262,240 | | |
Jackson County School District No. 9 Eagle Point
Unlimited General Obligation Refunding Bonds
Series 2005 (NPFGC)
06/15/20 | | | 5.500 | % | | | 1,000,000 | | | | 1,174,020 | | |
06/15/21 | | | 5.500 | % | | | 1,410,000 | | | | 1,707,214 | | |
Jefferson County School District No. 509J
Unlimited General Obligation Bonds
Madras
Series 2013B
06/15/28 | | | 5.000 | % | | | 2,095,000 | | | | 2,564,908 | | |
Josephine County School District
Unlimited General Obligation Refunding Bonds
Series 2005 (NPFGC)
12/15/16 | | | 5.000 | % | | | 1,000,000 | | | | 1,017,170 | | |
Klamath Falls City Schools
Unlimited General Obligation Refunding Bonds
Series 2015A
06/15/28 | | | 4.000 | % | | | 500,000 | | | | 584,630 | | |
Municipal Bonds (continued)
Issue
Description | | Coupon
Rate | | Principal
Amount ($) | | Value ($) | |
Lane & Douglas Counties School District No. 45J3
Unlimited General Obligation Refunding Bonds
South Lane
Series 2012
06/15/20 | | | 3.000 | % | | | 1,000,000 | | | | 1,081,320 | | |
06/15/21 | | | 3.000 | % | | | 1,610,000 | | | | 1,763,626 | | |
Lane & Douglas Counties School District No. 45J3(a)(b)
Unlimited General Obligation Bonds
Deferred Interest
Series 2016A
06/15/34 | | | 0.000 | % | | | 1,000,000 | | | | 573,520 | | |
06/15/36 | | | 0.000 | % | | | 1,000,000 | | | | 526,500 | | |
Lane Community College
Unlimited General Obligation Bonds
Series 2009
06/15/17 | | | 4.250 | % | | | 2,195,000 | | | | 2,268,094 | | |
06/15/18 | | | 4.250 | % | | | 2,000,000 | | | | 2,138,540 | | |
Series 2012
06/15/23 | | | 5.000 | % | | | 1,000,000 | | | | 1,224,520 | | |
Lane County School District No. 1 Pleasant Hill
Unlimited General Obligation Bonds
Series 2014B(a)
06/15/29 | | | 0.000 | % | | | 1,775,000 | | | | 1,324,345 | | |
Lane County School District No. 19 Springfield
Unlimited General Obligation Bonds
Series 2015A
06/15/31 | | | 5.000 | % | | | 2,000,000 | | | | 2,491,320 | | |
Lane County School District No. 19 Springfield(a)
Unlimited General Obligation Bonds
Series 2015B
06/15/33 | | | 0.000 | % | | | 3,770,000 | | | | 2,376,985 | | |
Unlimited General Obligation Refunding Bonds
Series 2015D
06/15/24 | | | 0.000 | % | | | 2,305,000 | | | | 1,986,403 | | |
06/15/28 | | | 0.000 | % | | | 1,480,000 | | | | 1,107,913 | | |
Marion & Clackamas Counties School District No. 4J
Silver Falls
Unlimited General Obligation Refunding Bonds
Series 2013
06/15/21 | | | 4.000 | % | | | 2,785,000 | | | | 3,175,903 | | |
Multnomah County School District No. 7 Reynolds
Unlimited General Obligation Bonds
Deferred Interest
Series 2015B(a)
06/15/30 | | | 0.000 | % | | | 4,000,000 | | | | 2,589,920 | | |
Pacific Communities Health District
Unlimited General Obligation Bonds
Series 2016
06/01/31 | | | 5.000 | % | | | 775,000 | | | | 972,253 | | |
06/01/32 | | | 5.000 | % | | | 845,000 | | | | 1,057,509 | | |
The accompanying Notes to Financial Statements are an integral part of this statement.
Annual Report 2016
9
COLUMBIA AMT-FREE OREGON INTERMEDIATE MUNI BOND FUND
PORTFOLIO OF INVESTMENTS (continued)
July 31, 2016
Municipal Bonds (continued)
Issue
Description | | Coupon
Rate | | Principal
Amount ($) | | Value ($) | |
Polk Marion & Benton Counties School District No. 13J Central
Unlimited General Obligation Refunding Bonds
Series 2015
02/01/27 | | | 4.000 | % | | | 750,000 | | | | 877,328 | | |
02/01/28 | | | 4.000 | % | | | 1,000,000 | | | | 1,159,810 | | |
Rogue Community College District
Unlimited General Obligation Bonds
Series 2016B
06/15/31 | | | 4.000 | % | | | 330,000 | | | | 383,427 | | |
06/15/32 | | | 4.000 | % | | | 455,000 | | | | 525,598 | | |
Umatilla County School District No. 16R Pendleton
Unlimited General Obligation Bonds
Series 2014A
06/15/30 | | | 5.000 | % | | | 1,110,000 | | | | 1,370,695 | | |
06/15/31 | | | 5.000 | % | | | 2,890,000 | | | | 3,554,440 | | |
Umatilla County School District No. 8R Hermiston
Unlimited General Obligation Bonds
Series 2010
06/15/29 | | | 4.500 | % | | | 2,360,000 | | | | 2,622,125 | | |
Union County School District No. 1 La Grande
Unlimited General Obligation Bonds
Series 2015
06/15/30 | | | 4.000 | % | | | 1,000,000 | | | | 1,141,830 | | |
Washington & Clackamas Counties School
District No. 23J Tigard-Tualatin
Unlimited General Obligation Refunding Bonds
Series 2005 (NPFGC)
06/15/19 | | | 5.000 | % | | | 850,000 | | | | 952,697 | | |
06/15/21 | | | 5.000 | % | | | 6,575,000 | | | | 7,813,204 | | |
Washington & Multnomah Counties School District No. 48J Beaverton
Limited General Obligation Refunding Notes
Series 2016
06/01/30 | | | 4.000 | % | | | 860,000 | | | | 1,003,715 | | |
Unlimited General Obligation Bonds
Series 2014
06/15/33 | | | 5.000 | % | | | 4,000,000 | | | | 4,886,840 | | |
Unlimited General Obligation Refunding Bonds
Series 2012-B
06/15/23 | | | 4.000 | % | | | 4,090,000 | | | | 4,741,701 | | |
Washington County School District No. 1 West Union
Unlimited General Obligation Refunding Bonds
Hillsboro
Series 2012
06/15/20 | | | 4.000 | % | | | 1,400,000 | | | | 1,569,400 | | |
Washington County School District No. 15 Forest Grove
Unlimited General Obligation Bonds
Series 2012A
06/15/24 | | | 5.000 | % | | | 1,780,000 | | | | 2,170,034 | | |
Yamhill Clackamas & Washington Counties School
District No. 29J Newberg
Unlimited General Obligation Refunding Bonds
Series 2005 (NPFGC)
06/15/21 | | | 5.500 | % | | | 1,000,000 | | | | 1,214,170 | | |
Municipal Bonds (continued)
Issue
Description | | Coupon
Rate | | Principal
Amount ($) | | Value ($) | |
Yamhill County School District No. 40 McMinnville
Unlimited General Obligation Bonds
Series 2016(b)
06/15/28 | | | 4.000 | % | | | 1,000,000 | | | | 1,182,390 | | |
Total | | | | | | | 155,172,690 | | |
MULTI-FAMILY 1.9% | |
City of Forest Grove
Revenue Bonds
Oak Tree Foundation Project
Series 2007
03/01/37 | | | 5.500 | % | | | 3,915,000 | | | | 3,971,376 | | |
City of Portland
Revenue Bonds
Headwaters Apartments Project
Series 2005A
04/01/25 | | | 5.000 | % | | | 1,440,000 | | | | 1,471,766 | | |
Oregon State Facilities Authority
Refunding Revenue Bonds
College Housing Northwest Projects
Series 2013A
10/01/18 | | | 4.000 | % | | | 740,000 | | | | 770,806 | | |
10/01/19 | | | 4.000 | % | | | 780,000 | | | | 823,758 | | |
10/01/20 | | | 4.000 | % | | | 810,000 | | | | 863,800 | | |
10/01/22 | | | 4.000 | % | | | 875,000 | | | | 946,488 | | |
Total | | | | | | | 8,847,994 | | |
MUNICIPAL POWER 1.8% | |
Central Lincoln People's Utility District JATC, Inc.
Revenue Bonds
Series 2016
12/01/33 | | | 5.000 | % | | | 350,000 | | | | 430,654 | | |
12/01/34 | | | 5.000 | % | | | 400,000 | | | | 490,288 | | |
12/01/35 | | | 5.000 | % | | | 410,000 | | | | 500,618 | | |
12/01/36 | | | 5.000 | % | | | 440,000 | | | | 535,190 | | |
City of Eugene Electric Utility System
Refunding Revenue Bonds
Series 2011A
08/01/28 | | | 5.000 | % | | | 2,200,000 | | | | 2,570,480 | | |
08/01/29 | | | 5.000 | % | | | 3,410,000 | | | | 3,973,502 | | |
Total | | | | | | | 8,500,732 | | |
PORTS 1.5% | |
Port of Morrow
Limited General Obligation Bonds
Series 2013
06/01/22 | | | 4.000 | % | | | 425,000 | | | | 441,078 | | |
06/01/23 | | | 4.000 | % | | | 440,000 | | | | 455,114 | | |
06/01/24 | | | 4.000 | % | | | 460,000 | | | | 475,005 | | |
06/01/25 | | | 4.000 | % | | | 480,000 | | | | 494,170 | | |
06/01/26 | | | 4.000 | % | | | 500,000 | | | | 513,725 | | |
06/01/27 | | | 4.000 | % | | | 515,000 | | | | 528,740 | | |
06/01/28 | | | 4.000 | % | | | 250,000 | | | | 256,325 | | |
The accompanying Notes to Financial Statements are an integral part of this statement.
Annual Report 2016
10
COLUMBIA AMT-FREE OREGON INTERMEDIATE MUNI BOND FUND
PORTFOLIO OF INVESTMENTS (continued)
July 31, 2016
Municipal Bonds (continued)
Issue
Description | | Coupon
Rate | | Principal
Amount ($) | | Value ($) | |
Limited General Obligation Refunding Bonds
Series 2016
12/01/27 | | | 5.000 | % | | | 615,000 | | | | 731,315 | | |
12/01/28 | | | 5.000 | % | | | 645,000 | | | | 763,300 | | |
12/01/29 | | | 5.000 | % | | | 340,000 | | | | 401,152 | | |
12/01/30 | | | 5.000 | % | | | 335,000 | | | | 394,710 | | |
12/01/31 | | | 5.000 | % | | | 375,000 | | | | 440,280 | | |
12/01/36 | | | 5.000 | % | | | 1,160,000 | | | | 1,344,382 | | |
Total | | | | | | | 7,239,296 | | |
PREP SCHOOL 0.2% | |
Oregon State Facilities Authority(c)
Revenue Bonds
Redmond Proficiency Academy Project
Series 2015
06/15/25 | | | 4.750 | % | | | 200,000 | | | | 207,772 | | |
06/15/35 | | | 5.500 | % | | | 540,000 | | | | 563,463 | | |
Total | | | | | | | 771,235 | | |
REFUNDED / ESCROWED 14.6% | |
City of Portland
Prerefunded 04/01/18 Revenue Bonds
Broadway Project LLC
Series 2008A
04/01/23 | | | 6.250 | % | | | 3,250,000 | | | | 3,630,250 | | |
Clackamas & Washington Counties School District No. 3
Prerefunded 06/15/19 Unlimited General Obligation Bonds
West Linn-Wilsonville
Series 2009
06/15/24 | | | 5.000 | % | | | 4,150,000 | | | | 4,657,918 | | |
Clackamas County School District No. 12 North Clackamas
Prerefunded 06/15/17 Unlimited General Obligation Bonds
Series 2007B (AGM)
06/15/22 | | | 5.000 | % | | | 4,000,000 | | | | 4,157,440 | | |
Columbia Multnomah & Washington Counties School District No. 1J
Prerefunded 06/15/19 Unlimited General Obligation Bonds
Scappoose School District 1J
Series 2009
06/15/23 | | | 5.000 | % | | | 1,000,000 | | | | 1,123,000 | | |
06/15/24 | | | 5.000 | % | | | 1,165,000 | | | | 1,308,295 | | |
06/15/25 | | | 5.000 | % | | | 1,275,000 | | | | 1,431,825 | | |
Deschutes County Administrative School District No. 1 Bend-La Pine
Prerefunded 06/15/17 Unlimited General Obligation Bonds
Series 2007 (NPFGC)
06/15/20 | | | 4.500 | % | | | 5,000,000 | | | | 5,174,950 | | |
Deschutes County Hospital Facilities Authority
Prerefunded 01/01/19 Revenue Bonds
Cascade Health Services, Inc.
Series 2008
01/01/23 | | | 7.375 | % | | | 2,000,000 | | | | 2,323,220 | | |
Municipal Bonds (continued)
Issue
Description | | Coupon
Rate | | Principal
Amount ($) | | Value ($) | |
Hospital Facilities Authority of Multnomah County
Prerefunded 12/01/16 Revenue Bonds
Terwilliger Plaza Project
Series 2006A
12/01/26 | | | 5.250 | % | | | 1,400,000 | | | | 1,422,694 | | |
Jackson County School District No. 549C Medford
Prerefunded 06/15/18 Unlimited General Obligation Bonds
Series 2008
06/15/27 | | | 4.625 | % | | | 1,500,000 | | | | 1,612,950 | | |
06/15/28 | | | 4.625 | % | | | 1,660,000 | | | | 1,784,998 | | |
Oregon State Lottery
Prerefunded 04/01/18 Revenue Bonds
Series 2008A
04/01/24 | | | 5.000 | % | | | 3,130,000 | | | | 3,359,335 | | |
Prerefunded 04/01/19 Revenue Bonds
Series 2009A
04/01/21 | | | 5.000 | % | | | 2,500,000 | | | | 2,785,500 | | |
04/01/27 | | | 5.000 | % | | | 4,000,000 | | | | 4,456,800 | | |
Puerto Rico Public Finance Corp.
Unrefunded Revenue Bonds
Commonwealth Appropriation
Series 2002E Escrowed to Maturity(d)
08/01/26 | | | 6.000 | % | | | 5,000,000 | | | | 6,843,100 | | |
State of Oregon Department of Administrative Services
Prerefunded 05/01/19 Certificate of Participation
Series 2009A
05/01/23 | | | 5.000 | % | | | 3,100,000 | | | | 3,461,646 | | |
State of Oregon Department of Transportation
Prerefunded 05/15/19 Revenue Bonds
Senior Lien
Series 2009A
11/15/27 | | | 4.750 | % | | | 7,000,000 | | | | 7,789,390 | | |
Tri-County Metropolitan Transportation District of Oregon
Prerefunded 09/01/19 Revenue Bonds
Series 2009A
09/01/21 | | | 4.250 | % | | | 1,815,000 | | | | 2,011,728 | | |
Virgin Islands Public Finance Authority
Prerefunded 10/01/18 Revenue Bonds
Series 1989A(d)
10/01/18 | | | 7.300 | % | | | 480,000 | | | | 516,024 | | |
Washington Clackamas & Yamhill Counties School District No. 88J
Prerefunded 06/15/17 Unlimited General Obligation Bonds
Sherwood
Series 2007B (NPFGC)
06/15/23 | | | 4.500 | % | | | 8,125,000 | | | | 8,409,294 | | |
Washington County School District No. 1 West Union
Prerefunded 06/15/17 Unlimited General Obligation Bonds
Capital Appreciation-Hillsboro
Series 2006 (NPFGC)(a)
06/15/25 | | | 0.000 | % | | | 2,565,000 | | | | 1,774,724 | | |
Total | | | | | | | 70,035,081 | | |
The accompanying Notes to Financial Statements are an integral part of this statement.
Annual Report 2016
11
COLUMBIA AMT-FREE OREGON INTERMEDIATE MUNI BOND FUND
PORTFOLIO OF INVESTMENTS (continued)
July 31, 2016
Municipal Bonds (continued)
Issue
Description | | Coupon
Rate | | Principal
Amount ($) | | Value ($) | |
RETIREMENT COMMUNITIES 2.7% | |
Hospital Facilities Authority of Multnomah County
Refunding Revenue Bonds
Mirabella at South Waterfront
Series 2014A
10/01/34 | | | 5.125 | % | | | 4,000,000 | | | | 4,467,360 | | |
Terwilliger Plaza, Inc.
Series 2012
12/01/20 | | | 5.000 | % | | | 1,250,000 | | | | 1,355,925 | | |
12/01/22 | | | 5.000 | % | | | 500,000 | | | | 568,050 | | |
Series 2016
12/01/30 | | | 5.000 | % | | | 325,000 | | | | 399,610 | | |
12/01/36 | | | 5.000 | % | | | 900,000 | | | | 1,085,625 | | |
Medford Hospital Facilities Authority
Refunding Revenue Bonds
Rogue Valley Manor
Series 2013
10/01/22 | | | 5.000 | % | | | 625,000 | | | | 740,825 | | |
10/01/23 | | | 5.000 | % | | | 645,000 | | | | 775,103 | | |
10/01/24 | | | 5.000 | % | | | 455,000 | | | | 542,665 | | |
Polk County Hospital Facility Authority
Revenue Bonds
Dallas Retirement Village Project
Series 2015
07/01/20 | | | 3.625 | % | | | 1,000,000 | | | | 1,004,000 | | |
Series 2015A
07/01/35 | | | 5.125 | % | | | 1,240,000 | | | | 1,303,364 | | |
Yamhill County Hospital Authority
Refunding Revenue Bonds
Friendsview Retirement Community
Series 2016(b)
11/15/26 | | | 4.000 | % | | | 500,000 | | | | 525,825 | | |
Total | | | | | | | 12,768,352 | | |
SINGLE FAMILY 0.9% | |
State of Oregon Housing & Community Services Department
Revenue Bonds
Single Family Mortgage Program
Series 2008G
07/01/28 | | | 5.200 | % | | | 405,000 | | | | 420,350 | | |
Series 2010A
07/01/27 | | | 5.250 | % | | | 305,000 | | | | 321,589 | | |
Series 2011A
07/01/25 | | | 5.250 | % | | | 2,370,000 | | | | 2,632,643 | | |
Series 2011B
07/01/28 | | | 5.250 | % | | | 925,000 | | | | 1,003,033 | | |
Total | | | | | | | 4,377,615 | | |
SPECIAL NON PROPERTY TAX 6.5% | |
Oregon State Lottery
Refunding Revenue Bonds
Series 2014B
04/01/27 | | | 5.000 | % | | | 1,750,000 | | | | 2,180,115 | | |
Series 2015D
04/01/27 | | | 5.000 | % | | | 2,500,000 | | | | 3,172,975 | | |
Municipal Bonds (continued)
Issue
Description | | Coupon
Rate | | Principal
Amount ($) | | Value ($) | |
04/01/29 | | | 5.000 | % | | | 2,000,000 | | | | 2,510,800 | | |
Revenue Bonds
Series 2012B
04/01/18 | | | 3.000 | % | | | 3,600,000 | | | | 3,748,140 | | |
State of Oregon Department of Transportation
Refunding Revenue Bonds
Series 2015A
11/15/30 | | | 5.000 | % | | | 8,000,000 | | | | 10,083,520 | | |
Territory of Guam
Revenue Bonds
Series 2011A(d)
01/01/31 | | | 5.000 | % | | | 1,100,000 | | | | 1,200,111 | | |
Tri-County Metropolitan Transportation District of Oregon
Refunding Revenue Bonds
Senior Lien
Series 2016
09/01/31 | | | 4.000 | % | | | 1,000,000 | | | | 1,175,900 | | |
09/01/32 | | | 4.000 | % | | | 1,250,000 | | | | 1,461,187 | | |
Revenue Bonds
Series 2009A
09/01/18 | | | 4.000 | % | | | 1,000,000 | | | | 1,070,750 | | |
Virgin Islands Public Finance Authority
Revenue Bonds
Matching Fund Loan Notes-Senior Lien
Series 2010A(d)
10/01/25 | | | 5.000 | % | | | 4,410,000 | | | | 4,444,707 | | |
Total | | | | | | | 31,048,205 | | |
SPECIAL PROPERTY TAX 4.4% | |
City of Keizer
Special Assessment Bonds
Keizer Station Area
Series 2008A
06/01/31 | | | 5.200 | % | | | 2,935,000 | | | | 3,133,876 | | |
City of Portland
Refunding Tax Allocation Bonds
2nd Lien-Downtown Water
Series 2011
06/15/18 | | | 5.000 | % | | | 3,095,000 | | | | 3,340,557 | | |
Senior Lien-Oregon Convention Center
Series 2011
06/15/20 | | | 5.000 | % | | | 4,305,000 | | | | 4,953,936 | | |
Series 2015
06/15/24 | | | 5.000 | % | | | 1,480,000 | | | | 1,709,252 | | |
Tax Allocation Bonds
Central Eastside
Series 2011B
06/15/26 | | | 5.000 | % | | | 1,580,000 | | | | 1,808,784 | | |
06/15/27 | | | 5.000 | % | | | 1,370,000 | | | | 1,561,512 | | |
Lents Town Center
Series 2010B
06/15/25 | | | 5.000 | % | | | 1,550,000 | | | | 1,755,080 | | |
06/15/26 | | | 5.000 | % | | | 1,440,000 | | | | 1,625,890 | | |
The accompanying Notes to Financial Statements are an integral part of this statement.
Annual Report 2016
12
COLUMBIA AMT-FREE OREGON INTERMEDIATE MUNI BOND FUND
PORTFOLIO OF INVESTMENTS (continued)
July 31, 2016
Municipal Bonds (continued)
Issue
Description | | Coupon
Rate | | Principal
Amount ($) | | Value ($) | |
Veneta Urban Renewal Agency
Revenue Bonds
Urban Renewal
Series 2001
02/15/21 | | | 5.625 | % | | | 1,100,000 | | | | 1,102,915 | | |
Total | | | | | | | 20,991,802 | | |
STATE GENERAL OBLIGATION 2.8% | |
State of Oregon
Unlimited General Obligation Bonds
Article XI-Q
Series 2016F
05/01/32 | | | 5.000 | % | | | 2,405,000 | | | | 3,070,896 | | |
Series 2015F
05/01/30 | | | 5.000 | % | | | 5,565,000 | | | | 7,068,496 | | |
Unlimited General Obligation Notes
Higher Education
Series 2016C
08/01/33 | | | 5.000 | % | | | 750,000 | | | | 958,590 | | |
Series 2016A
08/01/31 | | | 3.500 | % | | | 500,000 | | | | 555,245 | | |
08/01/32 | | | 3.500 | % | | | 500,000 | | | | 550,535 | | |
State of Oregon(a)
Unlimited General Obligation Bonds
State Board of Higher Education
Series 2001A
08/01/17 | | | 0.000 | % | | | 1,050,000 | | | | 1,043,448 | | |
Total | | | | | | | 13,247,210 | | |
TRANSPORTATION 1.9% | |
Tri-County Metropolitan Transportation District of Oregon
Revenue Bonds
Capital Grant Receipt
Series 2011A
10/01/25 | | | 5.000 | % | | | 4,775,000 | | | | 5,598,449 | | |
10/01/27 | | | 5.000 | % | | | 3,000,000 | | | | 3,484,500 | | |
Total | | | | | | | 9,082,949 | | |
WATER & SEWER 5.2% | |
City of Albany
Limited General Obligation Refunding Bonds
Series 2013
08/01/22 | | | 4.000 | % | | | 1,240,000 | | | | 1,433,279 | | |
08/01/23 | | | 4.000 | % | | | 1,290,000 | | | | 1,510,422 | | |
City of Eugene Water Utility System
Refunding Revenue Bonds
Utility System
Series 2016
08/01/31 | | | 4.000 | % | | | 165,000 | | | | 192,187 | | |
08/01/32 | | | 4.000 | % | | | 500,000 | | | | 578,000 | | |
Municipal Bonds (continued)
Issue
Description | | Coupon
Rate | | Principal
Amount ($) | | Value ($) | |
City of Portland Water System
Revenue Bonds
Series 2014A
05/01/28 | | | 4.000 | % | | | 3,390,000 | | | | 3,887,008 | | |
City of Woodburn Wastewater
Refunding Revenue Bonds
Series 2011A
03/01/18 | | | 3.000 | % | | | 1,115,000 | | | | 1,151,316 | | |
03/01/19 | | | 5.000 | % | | | 3,490,000 | | | | 3,843,677 | | |
03/01/22 | | | 5.000 | % | | | 4,620,000 | | | | 5,477,518 | | |
Clackamas River Water
Revenue Bonds
Series 2016
11/01/32 | | | 5.000 | % | | | 200,000 | | | | 247,422 | | |
11/01/33 | | | 5.000 | % | | | 265,000 | | | | 326,639 | | |
11/01/34 | | | 5.000 | % | | | 250,000 | | | | 307,027 | | |
11/01/35 | | | 5.000 | % | | | 225,000 | | | | 275,319 | | |
11/01/36 | | | 5.000 | % | | | 200,000 | | | | 244,014 | | |
Guam Government Waterworks Authority
Revenue Bonds
Series 2016(d)
07/01/36 | | | 5.000 | % | | | 700,000 | | | | 818,706 | | |
Metropolitan Wastewater Management Commission
Refunding Revenue Bonds
Series 2016
11/01/25 | | | 4.000 | % | | | 3,900,000 | | | | 4,738,929 | | |
Total | | | | | | | 25,031,463 | | |
Total Municipal Bonds
(Cost: $430,700,099) | | | | | | | 464,866,030 | | |
Money Market Funds 0.7%
| | | Shares | | Value ($) | |
Dreyfus Tax-Exempt Cash Management
Fund, Institutional Shares, 0.220%(e) | | | 3,511,470 | | | | 3,511,470 | | |
Total Money Market Funds
(Cost: $3,511,470) | | | | | 3,511,470 | | |
Total Investments
(Cost: $434,211,569) | | | | | 468,377,500 | | |
Other Assets & Liabilities, Net | | | | | 10,033,142 | | |
Net Assets | | | | | 478,410,642 | | |
The accompanying Notes to Financial Statements are an integral part of this statement.
Annual Report 2016
13
COLUMBIA AMT-FREE OREGON INTERMEDIATE MUNI BOND FUND
PORTFOLIO OF INVESTMENTS (continued)
July 31, 2016
Notes to Portfolio of Investments
(a) Zero coupon bond.
(b) Security, or a portion thereof, has been purchased on a when-issued or delayed delivery basis.
(c) Represents privately placed and other securities and instruments exempt from SEC registration (collectively, private placements), such as Section 4(a)(2) and Rule 144A eligible securities, which are often sold only to qualified institutional buyers. The Fund may invest in private placements determined to be liquid as well as those determined to be illiquid. Private placements may be determined to be liquid under guidelines established by the Fund's Board of Trustees. At July 31, 2016, the value of these securities amounted to $771,235 or 0.16% of net assets.
(d) Municipal obligations include debt obligations issued by or on behalf of territories, possessions, or sovereign nations within the territorial boundaries of the United States. At July 31, 2016, the value of these securities amounted to $13,822,648 or 2.89% of net assets.
(e) The rate shown is the seven-day current annualized yield at July 31, 2016.
Abbreviation Legend
AGM Assured Guaranty Municipal Corporation
NPFGC National Public Finance Guarantee Corporation
Fair Value Measurements
The Fund categorizes its fair value measurements according to a three-level hierarchy that maximizes the use of observable inputs and minimizes the use of unobservable inputs by prioritizing that the most observable input be used when available. Observable inputs are those that market participants would use in pricing an investment based on market data obtained from sources independent of the reporting entity. Unobservable inputs are those that reflect the Fund's assumptions about the information market participants would use in pricing an investment. An investment's level within the fair value hierarchy is based on the lowest level of any input that is deemed significant to the asset's or liability's fair value measurement. The input levels are not necessarily an indication of the risk or liquidity associated with investments at that level. For example, certain U.S. government securities are generally high quality and liquid, however, they are reflected as Level 2 because the inputs used to determine fair value may not always be quoted prices in an active market.
Fair value inputs are summarized in the three broad levels listed below:
> Level 1 — Valuations based on quoted prices for investments in active markets that the Fund has the ability to access at the measurement date (including NAV for open-end mutual funds). Valuation adjustments are not applied to Level 1 investments.
> Level 2 — Valuations based on other significant observable inputs (including quoted prices for similar securities, interest rates, prepayment speeds, credit risks, etc.).
> Level 3 — Valuations based on significant unobservable inputs (including the Fund's own assumptions and judgment in determining the fair value of investments).
Inputs that are used in determining fair value of an investment may include price information, credit data, volatility statistics, and other factors. These inputs can be either observable or unobservable. The availability of observable inputs can vary between investments, and is affected by various factors such as the type of investment, and the volume and level of activity for that investment or similar investments in the marketplace. The inputs will be considered by the Investment Manager, along with any other relevant factors in the calculation of an investment's fair value. The Fund uses prices and inputs that are current as of the measurement date, which may include periods of market dislocations. During these periods, the availability of prices and inputs may be reduced for many investments. This condition could cause an investment to be reclassified between the various levels within the hierarchy.
Investments falling into the Level 3 category are primarily supported by quoted prices from brokers and dealers participating in the market for those investments. However, these may be classified as Level 3 investments due to lack of market transparency and corroboration to support these quoted prices. Additionally, valuation models may be used as the pricing source for any remaining investments classified as Level 3. These models may rely on one or more significant unobservable inputs and/or significant assumptions by the Investment Manager. Inputs used in valuations may include, but are not limited to, financial statement analysis, capital account balances, discount rates and estimated cash flows, and comparable company data.
Under the direction of the Fund's Board of Trustees (the Board), the Investment Manager's Valuation Committee (the Committee) is responsible for overseeing the valuation procedures approved by the Board. The Committee consists of voting and non-voting members from various groups within the Investment Manager's organization, including operations and accounting, trading and investments, compliance, risk management and legal.
The accompanying Notes to Financial Statements are an integral part of this statement.
Annual Report 2016
14
COLUMBIA AMT-FREE OREGON INTERMEDIATE MUNI BOND FUND
PORTFOLIO OF INVESTMENTS (continued)
July 31, 2016
Fair Value Measurements (continued)
The Committee meets at least monthly to review and approve valuation matters, which may include a description of specific valuation determinations, data regarding pricing information received from approved pricing vendors and brokers and the results of Board-approved valuation control policies and procedures (the Policies). The Policies address, among other things, instances when market quotations are or are not readily available, including recommendations of third party pricing vendors and a determination of appropriate pricing methodologies; events that require specific valuation determinations and assessment of fair value techniques; securities with a potential for stale pricing, including those that are illiquid, restricted, or in default; and the effectiveness of third party pricing vendors, including periodic reviews of vendors. The Committee meets more frequently, as needed, to discuss additional valuation matters, which may include the need to review back-testing results, review time-sensitive information or approve related valuation actions. The Committee reports to the Board, with members of the Committee meeting with the Board at each of its regularly scheduled meetings to discuss valuation matters and actions during the period, similar to those described earlier.
For investments categorized as Level 3, the Committee monitors information similar to that described above, which may include: (i) data specific to the issuer or comparable issuers, (ii) general market or specific sector news and (iii) quoted prices and specific or similar security transactions. The Committee considers this data and any changes from prior periods in order to assess the reasonableness of observable and unobservable inputs, any assumptions or internal models used to value those securities and changes in fair value. This data is also used to corroborate, when available, information received from approved pricing vendors and brokers. Various factors impact the frequency of monitoring this information (which may occur as often as daily). However, the Committee may determine that changes to inputs, assumptions and models are not required as a result of the monitoring procedures performed.
The following table is a summary of the inputs used to value the Fund's investments at July 31, 2016:
| | | Level 1
Quoted Prices in Active
Markets for Identical
Assets ($) | | Level 2
Other Significant
Observable Inputs ($) | | Level 3
Significant
Unobservable Inputs ($) | | Total ($) | |
Investments | |
Municipal Bonds | | | — | | | | 464,866,030 | | | | — | | | | 464,866,030 | | |
Money Market Funds | | | 3,511,470 | | | | — | | | | — | | | | 3,511,470 | | |
Total Investments | | | 3,511,470 | | | | 464,866,030 | | | | — | | | | 468,377,500 | | |
See the Portfolio of Investments for all investment classifications not indicated in the table.
The Fund's assets assigned to the Level 2 input category are generally valued using the market approach, in which a security's value is determined through reference to prices and information from market transactions for similar or identical assets.
There were no transfers of financial assets between levels during the period.
The accompanying Notes to Financial Statements are an integral part of this statement.
Annual Report 2016
15
COLUMBIA AMT-FREE OREGON INTERMEDIATE MUNI BOND FUND
STATEMENT OF ASSETS AND LIABILITIES
July 31, 2016
Assets | |
Investments, at value | |
(identified cost $434,211,569) | | $ | 468,377,500 | | |
Cash | | | 8,496,797 | | |
Receivable for: | |
Capital shares sold | | | 1,812,800 | | |
Interest | | | 3,993,061 | | |
Prepaid expenses | | | 4,755 | | |
Trustees' deferred compensation plan | | | 49,541 | | |
Other assets | | | 1,333 | | |
Total assets | | | 482,735,787 | | |
Liabilities | |
Payable for: | |
Investments purchased on a delayed delivery basis | | | 2,785,640 | | |
Capital shares purchased | | | 340,952 | | |
Dividend distributions to shareholders | | | 1,074,048 | | |
Management services fees | | | 6,085 | | |
Distribution and/or service fees | | | 890 | | |
Transfer agent fees | | | 33,365 | | |
Chief compliance officer expenses | | | 21 | | |
Other expenses | | | 34,603 | | |
Trustees' deferred compensation plan | | | 49,541 | | |
Total liabilities | | | 4,325,145 | | |
Net assets applicable to outstanding capital stock | | $ | 478,410,642 | | |
Represented by | |
Paid-in capital | | $ | 444,168,516 | | |
Undistributed net investment income | | | 246,310 | | |
Accumulated net realized loss | | | (170,115 | ) | |
Unrealized appreciation (depreciation) on: | |
Investments | | | 34,165,931 | | |
Total — representing net assets applicable to outstanding capital stock | | $ | 478,410,642 | | |
The accompanying Notes to Financial Statements are an integral part of this statement.
Annual Report 2016
16
COLUMBIA AMT-FREE OREGON INTERMEDIATE MUNI BOND FUND
STATEMENT OF ASSETS AND LIABILITIES (continued)
July 31, 2016
Class A | |
Net assets | | $ | 50,750,071 | | |
Shares outstanding | | | 3,957,412 | | |
Net asset value per share | | $ | 12.82 | | |
Maximum offering price per share(a) | | $ | 13.22 | | |
Class B | |
Net assets | | $ | 11,137 | | |
Shares outstanding | | | 869 | | |
Net asset value per share | | $ | 12.82 | | |
Class C | |
Net assets | | $ | 28,437,536 | | |
Shares outstanding | | | 2,217,310 | | |
Net asset value per share | | $ | 12.83 | | |
Class R4 | |
Net assets | | $ | 306,724 | | |
Shares outstanding | | | 23,917 | | |
Net asset value per share | | $ | 12.82 | | |
Class R5 | |
Net assets | | $ | 24,843,630 | | |
Shares outstanding | | | 1,939,993 | | |
Net asset value per share | | $ | 12.81 | | |
Class Z | |
Net assets | | $ | 374,061,544 | | |
Shares outstanding | | | 29,167,552 | | |
Net asset value per share | | $ | 12.82 | | |
(a) The maximum offering price per share is calculated by dividing the net asset value per share by 1.0 minus the maximum sales charge of 3.00%.
The accompanying Notes to Financial Statements are an integral part of this statement.
Annual Report 2016
17
COLUMBIA AMT-FREE OREGON INTERMEDIATE MUNI BOND FUND
STATEMENT OF OPERATIONS
Year Ended July 31, 2016
Net investment income | |
Income: | |
Dividends | | $ | 2,247 | | |
Interest | | | 15,737,243 | | |
Total income | | | 15,739,490 | | |
Expenses: | |
Management services fees | | | 2,134,854 | | |
Distribution and/or service fees | |
Class A | | | 110,057 | | |
Class B | | | 109 | | |
Class C | | | 262,614 | | |
Transfer agent fees | |
Class A | | | 50,139 | | |
Class B | | | 14 | | |
Class C | | | 29,941 | | |
Class R4 | | | 244 | | |
Class R5 | | | 9,949 | | |
Class Z | | | 417,553 | | |
Compensation of board members | | | 23,443 | | |
Custodian fees | | | 4,014 | | |
Printing and postage fees | | | 24,999 | | |
Registration fees | | | 28,762 | | |
Audit fees | | | 25,108 | | |
Legal fees | | | 12,931 | | |
Chief compliance officer expenses | | | 223 | | |
Other | | | 16,239 | | |
Total expenses | | | 3,151,193 | | |
Fees waived or expenses reimbursed by Investment Manager and its affiliates | | | (39,812 | ) | |
Fees waived by Distributor — Class C | | | (78,724 | ) | |
Expense reductions | | | (460 | ) | |
Total net expenses | | | 3,032,197 | | |
Net investment income | | | 12,707,293 | | |
Realized and unrealized gain (loss) — net | |
Net realized gain (loss) on: | |
Investments | | | 1,208,783 | | |
Net realized gain | | | 1,208,783 | | |
Net change in unrealized appreciation (depreciation) on: | |
Investments | | | 8,962,475 | | |
Net change in unrealized appreciation | | | 8,962,475 | | |
Net realized and unrealized gain | | | 10,171,258 | | |
Net increase in net assets resulting from operations | | $ | 22,878,551 | | |
The accompanying Notes to Financial Statements are an integral part of this statement.
Annual Report 2016
18
COLUMBIA AMT-FREE OREGON INTERMEDIATE MUNI BOND FUND
STATEMENT OF CHANGES IN NET ASSETS
| | | Year Ended
July 31,
2016 | | Year Ended
July 31,
2015 | |
Operations | |
Net investment income | | $ | 12,707,293 | | | $ | 13,070,367 | | |
Net realized gain | | | 1,208,783 | | | | 1,121,220 | | |
Net change in unrealized appreciation (depreciation) | | | 8,962,475 | | | | (3,560,711 | ) | |
Net increase in net assets resulting from operations | | | 22,878,551 | | | | 10,630,876 | | |
Distributions to shareholders | |
Net investment income | |
Class A | | | (1,146,789 | ) | | | (1,077,580 | ) | |
Class B | | | (200 | ) | | | (205 | ) | |
Class C | | | (565,570 | ) | | | (549,434 | ) | |
Class R4 | | | (6,150 | ) | | | (3,765 | ) | |
Class R5 | | | (580,738 | ) | | | (359,677 | ) | |
Class Z | | | (10,465,161 | ) | | | (11,069,000 | ) | |
Total distributions to shareholders | | | (12,764,608 | ) | | | (13,059,661 | ) | |
Increase in net assets from capital stock activity | | | 17,108,359 | | | | 12,947,598 | | |
Total increase in net assets | | | 27,222,302 | | | | 10,518,813 | | |
Net assets at beginning of year | | | 451,188,340 | | | | 440,669,527 | | |
Net assets at end of year | | $ | 478,410,642 | | | $ | 451,188,340 | | |
Undistributed net investment income | | $ | 246,310 | | | $ | 303,623 | | |
The accompanying Notes to Financial Statements are an integral part of this statement.
Annual Report 2016
19
COLUMBIA AMT-FREE OREGON INTERMEDIATE MUNI BOND FUND
STATEMENT OF CHANGES IN NET ASSETS (continued)
| | | Year Ended July 31, 2016 | | Year Ended July 31, 2015 | |
| | | Shares | | Dollars ($) | | Shares | | Dollars ($) | |
Capital stock activity | |
Class A shares | |
Subscriptions | | | 1,215,360 | | | | 15,446,969 | | | | 818,404 | | | | 10,322,599 | | |
Distributions reinvested | | | 87,647 | | | | 1,112,155 | | | | 82,080 | | | | 1,037,036 | | |
Redemptions | | | (623,674 | ) | | | (7,908,027 | ) | | | (631,296 | ) | | | (7,977,617 | ) | |
Net increase | | | 679,333 | | | | 8,651,097 | | | | 269,188 | | | | 3,382,018 | | |
Class B shares | |
Subscriptions | | | — | | | | — | | | | 793 | | | | 10,001 | | |
Distributions reinvested | | | 16 | | | | 200 | | | | 16 | | | | 205 | | |
Net increase | | | 16 | | | | 200 | | | | 809 | | | | 10,206 | | |
Class C shares | |
Subscriptions | | | 523,205 | | | | 6,626,807 | | | | 328,135 | | | | 4,153,192 | | |
Distributions reinvested | | | 41,001 | | | | 520,230 | | | | 39,977 | | | | 505,125 | | |
Redemptions | | | (328,870 | ) | | | (4,161,731 | ) | | | (265,466 | ) | | | (3,353,173 | ) | |
Net increase | | | 235,336 | | | | 2,985,306 | | | | 102,646 | | | | 1,305,144 | | |
Class R4 shares | |
Subscriptions | | | 18,306 | | | | 232,028 | | | | 8,699 | | | | 109,999 | | |
Distributions reinvested | | | 484 | | | | 6,150 | | | | 298 | | | | 3,765 | | |
Redemptions | | | (5,199 | ) | | | (66,506 | ) | | | (4,762 | ) | | | (60,198 | ) | |
Net increase | | | 13,591 | | | | 171,672 | | | | 4,235 | | | | 53,566 | | |
Class R5 shares | |
Subscriptions | | | 814,584 | | | | 10,315,150 | | | | 973,339 | | | | 12,239,272 | | |
Distributions reinvested | | | 45,778 | | | | 580,443 | | | | 28,517 | | | | 359,374 | | |
Redemptions | | | (414,145 | ) | | | (5,211,523 | ) | | | (150,825 | ) | | | (1,895,620 | ) | |
Net increase | | | 446,217 | | | | 5,684,070 | | | | 851,031 | | | | 10,703,026 | | |
Class Z shares | |
Subscriptions | | | 2,807,454 | | | | 35,621,560 | | | | 2,287,978 | | | | 28,937,048 | | |
Distributions reinvested | | | 602,661 | | | | 7,643,566 | | | | 653,490 | | | | 8,257,559 | | |
Redemptions | | | (3,445,853 | ) | | | (43,649,112 | ) | | | (3,153,479 | ) | | | (39,700,969 | ) | |
Net decrease | | | (35,738 | ) | | | (383,986 | ) | | | (212,011 | ) | | | (2,506,362 | ) | |
Total net increase | | | 1,338,755 | | | | 17,108,359 | | | | 1,015,898 | | | | 12,947,598 | | |
The accompanying Notes to Financial Statements are an integral part of this statement.
Annual Report 2016
20
COLUMBIA AMT-FREE OREGON INTERMEDIATE MUNI BOND FUND
The following tables are intended to help you understand the Fund's financial performance. Certain information reflects financial results for a single share of a class held for the periods shown. Per share net investment income (loss) amounts are calculated based on average shares outstanding during the period. Total return assumes reinvestment of all dividends and distributions, if any. Total return does not reflect payment of sales charges, if any. Total return and portfolio turnover are not annualized for periods of less than one year. The portfolio turnover rate is calculated without regard to purchase and sales transactions of short-term instruments and certain derivatives, if any. If such transactions were included, the Fund's portfolio turnover rate may be higher.
| | | Year Ended July 31, | | Year Ended
August 31, | |
Class A | | 2016 | | 2015 | | 2014 | | 2013 | | 2012(a) | | 2011 | |
Per share data | |
Net asset value, beginning of period | | $ | 12.54 | | | $ | 12.61 | | | $ | 12.30 | | | $ | 12.95 | | | $ | 12.49 | | | $ | 12.67 | | |
Income from investment operations: | |
Net investment income | | | 0.33 | | | | 0.34 | | | | 0.35 | | | | 0.34 | | | | 0.34 | | | | 0.40 | | |
Net realized and unrealized gain (loss) | | | 0.28 | | | | (0.07 | ) | | | 0.31 | | | | (0.65 | ) | | | 0.46 | | | | (0.15 | ) | |
Total from investment operations | | | 0.61 | | | | 0.27 | | | | 0.66 | | | | (0.31 | ) | | | 0.80 | | | | 0.25 | | |
Less distributions to shareholders: | |
Net investment income | | | (0.33 | ) | | | (0.34 | ) | | | (0.35 | ) | | | (0.34 | ) | | | (0.34 | ) | | | (0.41 | ) | |
Net realized gains | | | — | | | | — | | | | (0.00 | )(b) | | | — | | | | — | | | | (0.02 | ) | |
Total distributions to shareholders | | | (0.33 | ) | | | (0.34 | ) | | | (0.35 | ) | | | (0.34 | ) | | | (0.34 | ) | | | (0.43 | ) | |
Net asset value, end of period | | $ | 12.82 | | | $ | 12.54 | | | $ | 12.61 | | | $ | 12.30 | | | $ | 12.95 | | | $ | 12.49 | | |
Total return | | | 4.92 | % | | | 2.17 | % | | | 5.43 | % | | | (2.47 | %) | | | 6.50 | % | | | 2.07 | % | |
Ratios to average net assets(c) | |
Total gross expenses | | | 0.86 | % | | | 0.87 | % | | | 0.86 | % | | | 0.86 | % | | | 0.86 | %(d) | | | 0.89 | % | |
Total net expenses(e) | | | 0.85 | %(f) | | | 0.83 | %(f) | | | 0.81 | %(f) | | | 0.80 | %(f) | | | 0.79 | %(d)(f) | | | 0.80 | %(f) | |
Net investment income | | | 2.60 | % | | | 2.71 | % | | | 2.81 | % | | | 2.65 | % | | | 2.92 | %(d) | | | 3.28 | % | |
Supplemental data | |
Net assets, end of period (in thousands) | | $ | 50,750 | | | $ | 41,121 | | | $ | 37,935 | | | $ | 35,438 | | | $ | 31,484 | | | $ | 24,998 | | |
Portfolio turnover | | | 9 | % | | | 11 | % | | | 9 | % | | | 15 | % | | | 9 | % | | | 13 | % | |
Notes to Financial Highlights
(a) For the period from September 1, 2011 to July 31, 2012. During the period, the Fund's fiscal year end was changed from August 31 to July 31.
(b) Rounds to zero.
(c) In addition to the fees and expenses that the Fund bears directly, the Fund indirectly bears a pro rata share of the fees and expenses of any other funds in which it invests. Such indirect expenses are not included in the Fund's reported expense ratios.
(d) Annualized.
(e) Total net expenses include the impact of certain fee waivers/expense reimbursements made by the Investment Manager and certain of its affiliates, if applicable.
(f) The benefits derived from expense reductions had an impact of less than 0.01%.
The accompanying Notes to Financial Statements are an integral part of this statement.
Annual Report 2016
21
COLUMBIA AMT-FREE OREGON INTERMEDIATE MUNI BOND FUND
FINANCIAL HIGHLIGHTS (continued)
| | | Year Ended July 31, | | Year Ended
August 31, | |
Class B | | 2016 | | 2015 | | 2014 | | 2013 | | 2012(a) | | 2011 | |
Per share data | |
Net asset value, beginning of period | | $ | 12.54 | | | $ | 12.60 | | | $ | 12.30 | | | $ | 12.95 | | | $ | 12.49 | | | $ | 12.67 | | |
Income from investment operations: | |
Net investment income | | | 0.23 | | | | 0.25 | | | | 0.26 | | | | 0.25 | | | | 0.26 | | | | 0.32 | | |
Net realized and unrealized gain (loss) | | | 0.28 | | | | (0.06 | ) | | | 0.30 | | | | (0.66 | ) | | | 0.45 | | | | (0.17 | ) | |
Total from investment operations | | | 0.51 | | | | 0.19 | | | | 0.56 | | | | (0.41 | ) | | | 0.71 | | | | 0.15 | | |
Less distributions to shareholders: | |
Net investment income | | | (0.23 | ) | | | (0.25 | ) | | | (0.26 | ) | | | (0.24 | ) | | | (0.25 | ) | | | (0.31 | ) | |
Net realized gains | | | — | | | | — | | | | (0.00 | )(b) | | | — | | | | — | | | | (0.02 | ) | |
Total distributions to shareholders | | | (0.23 | ) | | | (0.25 | ) | | | (0.26 | ) | | | (0.24 | ) | | | (0.25 | ) | | | (0.33 | ) | |
Net asset value, end of period | | $ | 12.82 | | | $ | 12.54 | | | $ | 12.60 | | | $ | 12.30 | | | $ | 12.95 | | | $ | 12.49 | | |
Total return | | | 4.13 | % | | | 1.49 | % | | | 4.63 | % | | | (3.19 | %) | | | 5.77 | % | | | 1.30 | % | |
Ratios to average net assets(c) | |
Total gross expenses | | | 1.64 | % | | | 1.64 | % | | | 1.60 | % | | | 1.61 | % | | | 1.61 | %(d) | | | 1.66 | % | |
Total net expenses(e) | | | 1.61 | %(f) | | | 1.58 | %(f) | | | 1.56 | %(f) | | | 1.55 | %(f) | | | 1.54 | %(d)(f) | | | 1.55 | %(f) | |
Net investment income | | | 1.84 | % | | | 1.96 | % | | | 2.08 | % | | | 1.91 | % | | | 2.22 | %(d) | | | 2.57 | % | |
Supplemental data | |
Net assets, end of period (in thousands) | | $ | 11 | | | $ | 11 | | | $ | 1 | | | $ | 19 | | | $ | 41 | | | $ | 79 | | |
Portfolio turnover | | | 9 | % | | | 11 | % | | | 9 | % | | | 15 | % | | | 9 | % | | | 13 | % | |
Notes to Financial Highlights
(a) For the period from September 1, 2011 to July 31, 2012. During the period, the Fund's fiscal year end was changed from August 31 to July 31.
(b) Rounds to zero.
(c) In addition to the fees and expenses that the Fund bears directly, the Fund indirectly bears a pro rata share of the fees and expenses of any other funds in which it invests. Such indirect expenses are not included in the Fund's reported expense ratios.
(d) Annualized.
(e) Total net expenses include the impact of certain fee waivers/expense reimbursements made by the Investment Manager and certain of its affiliates, if applicable.
(f) The benefits derived from expense reductions had an impact of less than 0.01%.
The accompanying Notes to Financial Statements are an integral part of this statement.
Annual Report 2016
22
COLUMBIA AMT-FREE OREGON INTERMEDIATE MUNI BOND FUND
FINANCIAL HIGHLIGHTS (continued)
| | | Year Ended July 31, | | Year Ended
August 31, | |
Class C | | 2016 | | 2015 | | 2014 | | 2013 | | 2012(a) | | 2011 | |
Per share data | |
Net asset value, beginning of period | | $ | 12.54 | | | $ | 12.61 | | | $ | 12.31 | | | $ | 12.95 | | | $ | 12.49 | | | $ | 12.67 | | |
Income from investment operations: | |
Net investment income | | | 0.27 | | | | 0.29 | | | | 0.30 | | | | 0.29 | | | | 0.29 | | | | 0.35 | | |
Net realized and unrealized gain (loss) | | | 0.29 | | | | (0.07 | ) | | | 0.30 | | | | (0.64 | ) | | | 0.46 | | | | (0.15 | ) | |
Total from investment operations | | | 0.56 | | | | 0.22 | | | | 0.60 | | | | (0.35 | ) | | | 0.75 | | | | 0.20 | | |
Less distributions to shareholders: | |
Net investment income | | | (0.27 | ) | | | (0.29 | ) | | | (0.30 | ) | | | (0.29 | ) | | | (0.29 | ) | | | (0.36 | ) | |
Net realized gains | | | — | | | | — | | | | (0.00 | )(b) | | | — | | | | — | | | | (0.02 | ) | |
Total distributions to shareholders | | | (0.27 | ) | | | (0.29 | ) | | | (0.30 | ) | | | (0.29 | ) | | | (0.29 | ) | | | (0.38 | ) | |
Net asset value, end of period | | $ | 12.83 | | | $ | 12.54 | | | $ | 12.61 | | | $ | 12.31 | | | $ | 12.95 | | | $ | 12.49 | | |
Total return | | | 4.53 | % | | | 1.73 | % | | | 4.93 | % | | | (2.78 | %) | | | 6.10 | % | | | 1.65 | % | |
Ratios to average net assets(c) | |
Total gross expenses | | | 1.61 | % | | | 1.62 | % | | | 1.61 | % | | | 1.61 | % | | | 1.61 | %(d) | | | 1.64 | % | |
Total net expenses(e) | | | 1.30 | %(f) | | | 1.26 | %(f) | | | 1.21 | %(f) | | | 1.20 | %(f) | | | 1.19 | %(d)(f) | | | 1.19 | %(f) | |
Net investment income | | | 2.15 | % | | | 2.27 | % | | | 2.41 | % | | | 2.25 | % | | | 2.51 | %(d) | | | 2.88 | % | |
Supplemental data | |
Net assets, end of period (in thousands) | | $ | 28,438 | | | $ | 24,863 | | | $ | 23,694 | | | $ | 26,055 | | | $ | 23,812 | | | $ | 18,069 | | |
Portfolio turnover | | | 9 | % | | | 11 | % | | | 9 | % | | | 15 | % | | | 9 | % | | | 13 | % | |
Notes to Financial Highlights
(a) For the period from September 1, 2011 to July 31, 2012. During the period, the Fund's fiscal year end was changed from August 31 to July 31.
(b) Rounds to zero.
(c) In addition to the fees and expenses that the Fund bears directly, the Fund indirectly bears a pro rata share of the fees and expenses of any other funds in which it invests. Such indirect expenses are not included in the Fund's reported expense ratios.
(d) Annualized.
(e) Total net expenses include the impact of certain fee waivers/expense reimbursements made by the Investment Manager and certain of its affiliates, if applicable.
(f) The benefits derived from expense reductions had an impact of less than 0.01%.
The accompanying Notes to Financial Statements are an integral part of this statement.
Annual Report 2016
23
COLUMBIA AMT-FREE OREGON INTERMEDIATE MUNI BOND FUND
FINANCIAL HIGHLIGHTS (continued)
| | | Year Ended July 31, | |
Class R4 | | 2016 | | 2015 | | 2014 | | 2013(a) | |
Per share data | |
Net asset value, beginning of period | | $ | 12.54 | | | $ | 12.60 | | | $ | 12.30 | | | $ | 12.83 | | |
Income from investment operations: | |
Net investment income | | | 0.36 | | | | 0.37 | | | | 0.38 | | | | 0.13 | | |
Net realized and unrealized gain (loss) | | | 0.28 | | | | (0.06 | ) | | | 0.30 | | | | (0.53 | ) | |
Total from investment operations | | | 0.64 | | | | 0.31 | | | | 0.68 | | | | (0.40 | ) | |
Less distributions to shareholders: | |
Net investment income | | | (0.36 | ) | | | (0.37 | ) | | | (0.38 | ) | | | (0.13 | ) | |
Net realized gains | | | — | | | | — | | | | (0.00 | )(b) | | | — | | |
Total distributions to shareholders | | | (0.36 | ) | | | (0.37 | ) | | | (0.38 | ) | | | (0.13 | ) | |
Net asset value, end of period | | $ | 12.82 | | | $ | 12.54 | | | $ | 12.60 | | | $ | 12.30 | | |
Total return | | | 5.18 | % | | | 2.50 | % | | | 5.58 | % | | | (3.13 | %) | |
Ratios to average net assets(c) | |
Total gross expenses | | | 0.61 | % | | | 0.62 | % | | | 0.62 | % | | | 0.58 | %(d) | |
Total net expenses(e) | | | 0.61 | %(f) | | | 0.58 | %(f) | | | 0.56 | %(f) | | | 0.56 | %(d) | |
Net investment income | | | 2.85 | % | | | 2.97 | % | | | 3.08 | % | | | 2.92 | %(d) | |
Supplemental data | |
Net assets, end of period (in thousands) | | $ | 307 | | | $ | 130 | | | $ | 77 | | | $ | 2 | | |
Portfolio turnover | | | 9 | % | | | 11 | % | | | 9 | % | | | 15 | % | |
Notes to Financial Highlights
(a) Based on operations from March 19, 2013 (commencement of operations) through the stated period end.
(b) Rounds to zero.
(c) In addition to the fees and expenses that the Fund bears directly, the Fund indirectly bears a pro rata share of the fees and expenses of any other funds in which it invests. Such indirect expenses are not included in the Fund's reported expense ratios.
(d) Annualized.
(e) Total net expenses include the impact of certain fee waivers/expense reimbursements made by the Investment Manager and certain of its affiliates, if applicable.
(f) The benefits derived from expense reductions had an impact of less than 0.01%.
The accompanying Notes to Financial Statements are an integral part of this statement.
Annual Report 2016
24
COLUMBIA AMT-FREE OREGON INTERMEDIATE MUNI BOND FUND
FINANCIAL HIGHLIGHTS (continued)
| | | Year Ended July 31, | |
Class R5 | | 2016 | | 2015 | | 2014 | | 2013(a) | |
Per share data | |
Net asset value, beginning of period | | $ | 12.53 | | | $ | 12.59 | | | $ | 12.29 | | | $ | 12.99 | | |
Income from investment operations: | |
Net investment income | | | 0.37 | | | | 0.38 | | | | 0.38 | | | | 0.27 | | |
Net realized and unrealized gain (loss) | | | 0.28 | | | | (0.06 | ) | | | 0.30 | | | | (0.70 | ) | |
Total from investment operations | | | 0.65 | | | | 0.32 | | | | 0.68 | | | | (0.43 | ) | |
Less distributions to shareholders: | |
Net investment income | | | (0.37 | ) | | | (0.38 | ) | | | (0.38 | ) | | | (0.27 | ) | |
Net realized gains | | | — | | | | — | | | | (0.00 | )(b) | | | — | | |
Total distributions to shareholders | | | (0.37 | ) | | | (0.38 | ) | | | (0.38 | ) | | | (0.27 | ) | |
Net asset value, end of period | | $ | 12.81 | | | $ | 12.53 | | | $ | 12.59 | | | $ | 12.29 | | |
Total return | | | 5.24 | % | | | 2.54 | % | | | 5.64 | % | | | (3.38 | %) | |
Ratios to average net assets(c) | |
Total gross expenses | | | 0.55 | % | | | 0.55 | % | | | 0.56 | % | | | 0.55 | %(d) | |
Total net expenses(e) | | | 0.55 | % | | | 0.55 | % | | | 0.53 | % | | | 0.54 | %(d) | |
Net investment income | | | 2.90 | % | | | 3.00 | % | | | 3.09 | % | | | 2.97 | %(d) | |
Supplemental data | |
Net assets, end of period (in thousands) | | $ | 24,844 | | | $ | 18,712 | | | $ | 8,092 | | | $ | 5,377 | | |
Portfolio turnover | | | 9 | % | | | 11 | % | | | 9 | % | | | 15 | % | |
Notes to Financial Highlights
(a) Based on operations from November 8, 2012 (commencement of operations) through the stated period end.
(b) Rounds to zero.
(c) In addition to the fees and expenses that the Fund bears directly, the Fund indirectly bears a pro rata share of the fees and expenses of any other funds in which it invests. Such indirect expenses are not included in the Fund's reported expense ratios.
(d) Annualized.
(e) Total net expenses include the impact of certain fee waivers/expense reimbursements made by the Investment Manager and certain of its affiliates, if applicable.
The accompanying Notes to Financial Statements are an integral part of this statement.
Annual Report 2016
25
COLUMBIA AMT-FREE OREGON INTERMEDIATE MUNI BOND FUND
FINANCIAL HIGHLIGHTS (continued)
| | | Year Ended July 31, | | Year Ended
August 31, | |
Class Z | | 2016 | | 2015 | | 2014 | | 2013 | | 2012(a) | | 2011 | |
Per share data | |
Net asset value, beginning of period | | $ | 12.54 | | | $ | 12.61 | | | $ | 12.31 | | | $ | 12.95 | | | $ | 12.49 | | | $ | 12.67 | | |
Income from investment operations: | |
Net investment income | | | 0.36 | | | | 0.37 | | | | 0.38 | | | | 0.37 | | | | 0.37 | | | | 0.43 | | |
Net realized and unrealized gain (loss) | | | 0.28 | | | | (0.07 | ) | | | 0.30 | | | | (0.64 | ) | | | 0.46 | | | | (0.15 | ) | |
Total from investment operations | | | 0.64 | | | | 0.30 | | | | 0.68 | | | | (0.27 | ) | | | 0.83 | | | | 0.28 | | |
Less distributions to shareholders: | |
Net investment income | | | (0.36 | ) | | | (0.37 | ) | | | (0.38 | ) | | | (0.37 | ) | | | (0.37 | ) | | | (0.44 | ) | |
Net realized gains | | | — | | | | — | | | | (0.00 | )(b) | | | — | | | | — | | | | (0.02 | ) | |
Total distributions to shareholders | | | (0.36 | ) | | | (0.37 | ) | | | (0.38 | ) | | | (0.37 | ) | | | (0.37 | ) | | | (0.46 | ) | |
Net asset value, end of period | | $ | 12.82 | | | $ | 12.54 | | | $ | 12.61 | | | $ | 12.31 | | | $ | 12.95 | | | $ | 12.49 | | |
Total return | | | 5.18 | % | | | 2.42 | % | | | 5.61 | % | | | (2.14 | %) | | | 6.73 | % | | | 2.31 | % | |
Ratios to average net assets(c) | |
Total gross expenses | | | 0.61 | % | | | 0.62 | % | | | 0.61 | % | | | 0.61 | % | | | 0.61 | %(d) | | | 0.64 | % | |
Total net expenses(e) | | | 0.60 | %(f) | | | 0.58 | %(f) | | | 0.56 | %(f) | | | 0.55 | %(f) | | | 0.54 | %(d)(f) | | | 0.55 | %(f) | |
Net investment income | | | 2.85 | % | | | 2.96 | % | | | 3.06 | % | | | 2.90 | % | | | 3.17 | %(d) | | | 3.53 | % | |
Supplemental data | |
Net assets, end of period (in thousands) | | $ | 374,062 | | | $ | 366,351 | | | $ | 370,871 | | | $ | 391,179 | | | $ | 437,800 | | | $ | 402,393 | | |
Portfolio turnover | | | 9 | % | | | 11 | % | | | 9 | % | | | 15 | % | | | 9 | % | | | 13 | % | |
Notes to Financial Highlights
(a) For the period from September 1, 2011 to July 31, 2012. During the period, the Fund's fiscal year end was changed from August 31 to July 31.
(b) Rounds to zero.
(c) In addition to the fees and expenses that the Fund bears directly, the Fund indirectly bears a pro rata share of the fees and expenses of any other funds in which it invests. Such indirect expenses are not included in the Fund's reported expense ratios.
(d) Annualized.
(e) Total net expenses include the impact of certain fee waivers/expense reimbursements made by the Investment Manager and certain of its affiliates, if applicable.
(f) The benefits derived from expense reductions had an impact of less than 0.01%.
The accompanying Notes to Financial Statements are an integral part of this statement.
Annual Report 2016
26
COLUMBIA AMT-FREE OREGON INTERMEDIATE MUNI BOND FUND
NOTES TO FINANCIAL STATEMENTS
July 31, 2016
Note 1. Organization
Columbia AMT-Free Oregon Intermediate Muni Bond Fund (the Fund), a series of Columbia Funds Series Trust I (the Trust), is a diversified fund. The Trust is registered under the Investment Company Act of 1940, as amended (the 1940 Act), as an open-end management investment company organized as a Massachusetts business trust.
Fund Shares
The Trust may issue an unlimited number of shares (without par value). The Fund offers Class A, Class B, Class C, Class R4, Class R5 and Class Z shares. Although all share classes generally have identical voting, dividend and liquidation rights, each share class votes separately when required by the Trust's organizational documents or by law. Different share classes pay different distribution amounts to the extent the expenses of such share classes differ, and distributions in liquidation will be proportional to the net asset value of each share class. Each share class has its own expense and sales charge structure.
Class A shares are subject to a maximum front-end sales charge of 3.00% based on the initial investment amount. In addition, Class A shares purchased on or after February 19, 2015 are subject to a contingent deferred sales charge (CDSC) of 0.75% on certain investments of $500,000 or more if redeemed within 12 months after purchase. Redemptions of Class A shares purchased prior to February 19, 2015, without an initial sales charge in accounts aggregating $1 million to $50 million at the time of purchase, are subject to a CDSC of 1.00% if redeemed within 12 months after purchase, and 0.50% if redeemed more than 12, but less than 18, months after purchase.
Class B shares may be subject to a maximum CDSC of 3.00% based upon the holding period after purchase. Class B shares will generally convert to Class A shares eight years after purchase. The Fund no longer accepts investments by new or existing investors in the Fund's Class B shares, except in connection with the reinvestment of any dividend and/or capital gain distributions in Class B shares of the Fund and exchanges by existing Class B shareholders of certain other funds within the Columbia Family of Funds.
Class C shares are subject to a 1.00% CDSC on shares redeemed within 12 months after purchase.
Class R4 shares are not subject to sales charges and are generally available only to omnibus retirement plans
and certain investors as described in the Fund's prospectus.
Class R5 shares are not subject to sales charges and are generally available only to investors purchasing through authorized investment professionals and omnibus retirement plans.
Class Z shares are not subject to sales charges and are generally available only to eligible investors, which are subject to different investment minimums as described in the Fund's prospectus.
Note 2. Summary of Significant Accounting Policies
Basis of Preparation
The Fund is an investment company that applies the accounting and reporting guidance in the Financial Accounting Standards Board (FASB) Accounting Standards Codification Topic 946, Financial Services — Investment Companies (ASC 946). The financial statements are prepared in accordance with U.S. generally accepted accounting principles (GAAP), which requires management to make certain estimates and assumptions that affect the reported amounts of assets and liabilities, the disclosure of contingent assets and liabilities at the date of the financial statements and the reported amounts of income and expenses during the reporting period. Actual results could differ from those estimates.
The following is a summary of significant accounting policies followed by the Fund in the preparation of its financial statements.
Security Valuation
Debt securities generally are valued by pricing services approved by the Board of Trustees (the Board) based upon market transactions for normal, institutional-size trading units of similar securities. The services may use various pricing techniques that take into account, as applicable, factors such as yield, quality, coupon rate, maturity, type of issue, trading characteristics and other data, as well as approved independent broker-dealer quotes. Debt securities for which quotations are not readily available or not believed to be reflective of market value may also be valued based upon a bid quote from an approved independent broker-dealer. Debt securities maturing in 60 days or less are valued primarily at amortized cost value, unless this method results in a valuation that management believes does not approximate market value.
Annual Report 2016
27
COLUMBIA AMT-FREE OREGON INTERMEDIATE MUNI BOND FUND
NOTES TO FINANCIAL STATEMENTS (continued)
July 31, 2016
Investments in open-end investment companies, including money market funds, are valued at their latest net asset value.
Investments for which market quotations are not readily available, or that have quotations which management believes are not reflective of market value or reliable, are valued at fair value as determined in good faith under procedures approved by and under the general supervision of the Board. If a security or class of securities (such as foreign securities) is valued at fair value, such value is likely to be different from the quoted or published price for the security.
The determination of fair value often requires significant judgment. To determine fair value, management may use assumptions including but not limited to future cash flows and estimated risk premiums. Multiple inputs from various sources may be used to determine fair value.
GAAP requires disclosure regarding the inputs and valuation techniques used to measure fair value and any changes in valuation inputs or techniques. In addition, investments shall be disclosed by major category. This information is disclosed following the Fund's Portfolio of Investments.
Delayed Delivery Securities
The Fund may trade securities on other than normal settlement terms, including securities purchased or sold on a "when-issued" basis. This may increase risk to the Fund since the other party to the transaction may fail to deliver, which could cause the Fund to subsequently invest at less advantageous prices. The Fund designates cash or liquid securities in an amount equal to the delayed delivery commitment.
Security Transactions
Security transactions are accounted for on the trade date. Cost is determined and gains (losses) are based upon the specific identification method for both financial statement and federal income tax purposes.
Income Recognition
Interest income is recorded on an accrual basis. Market premiums and discounts, including original issue discounts, are amortized and accreted, respectively, over the expected life of the security on all debt securities, unless otherwise noted.
The Fund may place a debt security on non-accrual status and reduce related interest income when it becomes probable that the interest will not be collected and the amount of uncollectible interest can be reasonably estimated. A defaulted debt security is
removed from non-accrual status when the issuer resumes interest payments or when collectibility of interest is reasonably assured.
Dividend income is recorded on the ex-dividend date.
Expenses
General expenses of the Trust are allocated to the Fund and other funds of the Trust based upon relative net assets or other expense allocation methodologies determined by the nature of the expense. Expenses directly attributable to the Fund are charged to the Fund. Expenses directly attributable to a specific class of shares are charged to that share class.
Determination of Class Net Asset Value
All income, expenses (other than class-specific expenses, which are charged to that share class, as shown in the Statement of Operations) and realized and unrealized gains (losses) are allocated to each class of the Fund on a daily basis, based on the relative net assets of each class, for purposes of determining the net asset value of each class.
Federal Income Tax Status
The Fund intends to qualify each year as a regulated investment company under Subchapter M of the Internal Revenue Code, as amended, and will distribute substantially all of its tax exempt and taxable income (including net short-term capital gains), if any, for its tax year, and as such will not be subject to federal income taxes. In addition, the Fund intends to distribute in each calendar year substantially all of its net investment income, capital gains and certain other amounts, if any, such that the Fund should not be subject to federal excise tax. Therefore, no federal income or excise tax provision is recorded.
Distributions to Shareholders
Distributions from net investment income, if any, are declared daily and paid monthly. Net realized capital gains, if any, are distributed at least annually. Income distributions and capital gain distributions are determined in accordance with federal income tax regulations, which may differ from GAAP.
Guarantees and Indemnifications
Under the Trust's organizational documents and, in some cases, by contract, its officers and trustees are indemnified against certain liabilities arising out of the performance of their duties to the Trust or its funds. In addition, certain of the Fund's contracts with its service providers contain general indemnification clauses. The
Annual Report 2016
28
COLUMBIA AMT-FREE OREGON INTERMEDIATE MUNI BOND FUND
NOTES TO FINANCIAL STATEMENTS (continued)
July 31, 2016
Fund's maximum exposure under these arrangements is unknown since the amount of any future claims that may be made against the Fund cannot be determined, and the Fund has no historical basis for predicting the likelihood of any such claims.
Note 3. Fees and Other Transactions with Affiliates
Management Services Fees
Effective December 1, 2015, the Fund entered into a Management Agreement with Columbia Management Investment Advisers, LLC (the Investment Manager), a wholly-owned subsidiary of Ameriprise Financial, Inc. (Ameriprise Financial). Under the Management Agreement, the Investment Manager provides the Fund with investment research and advice, as well as administrative and accounting services. The management services fee is an annual fee that is equal to a percentage of the Fund's average daily net assets that declines from 0.47% to 0.31% as the Fund's net assets increase. Prior to December 1, 2015, the Fund paid the Investment Manager an annual fee for advisory services under an Investment Management Services Agreement and a separate annual fee for administrative and accounting services under an Administrative Services Agreement. The effective management services fee rate for the year ended July 31, 2016 (reflecting all advisory and administrative services fees paid to the Investment Manager) was 0.47% of the Fund's average daily net assets. For the period from August 1, 2015 through November 30, 2015, the investment advisory services fee paid to the Investment Manager was $599,072, and the administrative services fee paid to the Investment Manager was $101,527.
Compensation of Board Members
Board members, who are not officers or employees of the Investment Manager or Ameriprise Financial, are compensated for their services to the Fund as disclosed in the Statement of Operations. These Board members may participate in a Deferred Compensation Plan (the Plan) which may be terminated at any time. Obligations of the Plan will be paid solely out of the Fund's assets, and all amounts payable under the Plan constitute a general unsecured obligation of the Fund.
Compensation of Chief Compliance Officer
The Board has appointed a Chief Compliance Officer to the Fund in accordance with federal securities regulations. The Fund is allocated a portion of the expenses associated with the Chief Compliance Officer based on relative net assets of the Trust.
Transfer Agency Fees
Under a Transfer and Dividend Disbursing Agent Agreement, Columbia Management Investment Services Corp. (the Transfer Agent), an affiliate of the Investment Manager and a wholly-owned subsidiary of Ameriprise Financial, is responsible for providing transfer agency services to the Fund. The Transfer Agent has contracted with Boston Financial Data Services (BFDS) to serve as sub-transfer agent.
The Transfer Agent receives a monthly transfer agency fee based on the number or the average value of accounts, depending on the type of account. In addition, the Transfer Agent also receives sub-transfer agency fees based on a percentage of the average aggregate value of the Fund's shares maintained in omnibus accounts (other than omnibus accounts for which American Enterprise Investment Services Inc. is the broker of record or accounts where the beneficial shareholder is a customer of Ameriprise Financial Services, Inc., for which the Transfer Agent receives a per account fee). The Transfer Agent pays the fees of BFDS for services as sub-transfer agent and BFDS is not entitled to reimbursement for such fees from the Fund (with the exception of out-of-pocket fees).
The Transfer Agent also receives compensation from the Fund for various shareholder services and reimbursements for certain out-of-pocket fees. Total transfer agency fees for Class R5 shares are subject to an annual limitation of not more than 0.05% of the average daily net assets attributable to Class R5 shares.
For the year ended July 31, 2016, the Fund's effective transfer agency fee rates as a percentage of average daily net assets of each class were as follows:
Class A | | | 0.11 | % | |
Class B | | | 0.13 | | |
Class C | | | 0.11 | | |
Class R4 | | | 0.11 | | |
Class R5 | | | 0.05 | | |
Class Z | | | 0.11 | | |
An annual minimum account balance fee of $20 may apply to certain accounts with a value below the applicable share class's initial minimum investment requirements to reduce the impact of small accounts on transfer agency fees. These minimum account balance fees are remitted to the Fund and recorded as part of expense reductions in the Statement of Operations. For the year ended July 31, 2016, these minimum account balance fees reduced total expenses of the Fund by $460.
Annual Report 2016
29
COLUMBIA AMT-FREE OREGON INTERMEDIATE MUNI BOND FUND
NOTES TO FINANCIAL STATEMENTS (continued)
July 31, 2016
Distribution and Service Fees
The Fund has an agreement with Columbia Management Investment Distributors, Inc. (the Distributor), an affiliate of the Investment Manager and a wholly-owned subsidiary of Ameriprise Financial, for distribution and shareholder services. The Board has approved, and the Fund has adopted, distribution and shareholder service plans (the Plans) applicable to certain share classes, which set the distribution and service fees for the Fund. These fees are calculated daily and are intended to compensate the Distributor and/or eligible selling and/or servicing agents for selling shares of the Fund and providing services to investors.
Under the Plans, the Fund pays a monthly service fee to the Distributor at the maximum annual rate of 0.25% of the average daily net assets attributable to Class A, Class B and Class C shares of the Fund. Also under the Plans, the Fund pays a monthly distribution fee to the Distributor at the maximum annual rates of 0.10%, 0.75% and 0.75% of the average daily net assets attributable to Class A, Class B and Class C shares of the Fund, respectively.
Although the Fund may pay distribution and service fees up to a maximum annual rate of 0.35% of the Fund's average daily net assets attributable to Class A shares (comprised of up to 0.10% for distribution services and up to 0.25% for shareholder liaison services), the Fund currently limits such fees to an aggregate fee of not more than 0.25% of the Fund's average daily net assets attributable to Class A shares.
The Distributor has voluntarily agreed to waive a portion of the distribution fee for Class C shares so that the distribution fee does not exceed 0.45% annually of the average daily net assets attributable to Class C shares. This arrangement may be modified or terminated by the Distributor at any time.
Sales Charges
Sales charges, including front-end charges and CDSCs, received by the Distributor for distributing Fund shares were $92,674 for Class A and $1,389 for Class C shares for the year ended July 31, 2016.
Expenses Waived/Reimbursed by the Investment Manager and its Affiliates
The Fund's expense ratio is subject to an expense reimbursement arrangement pursuant to which fees will be waived and/or expenses reimbursed (excluding certain fees and expenses described below), so that the Fund's net operating expenses, after giving effect to fees
waived/expenses reimbursed and any balance credits and/or overdraft charges from the Fund's custodian, do not exceed the annual rates of:
| | | Contractual
Expense Cap
December 1, 2015
through
November 30, 2016 | | Voluntary
Expense Cap
Prior to
December 1, 2015 | |
Class A | | | 0.87 | % | | | 0.84 | % | |
Class B | | | 1.62 | | | | 1.59 | | |
Class C | | | 1.62 | | | | 1.59 | | |
Class R4 | | | 0.62 | | | | 0.59 | | |
Class R5 | | | 0.58 | | | | 0.55 | | |
Class Z | | | 0.62 | | | | 0.59 | | |
The contractual agreement may be modified or amended only with approval from the Investment Manager, certain of its affiliates and the Fund. Under the arrangements, the following fees and expenses are excluded from the waiver/reimbursement commitment, and therefore will be paid by the Fund, if applicable: taxes (including foreign transaction taxes), expenses associated with investments in affiliated and non-affiliated pooled investment vehicles (including mutual funds and exchange-traded funds), transaction costs and brokerage commissions, costs related to any securities lending program, dividend and interest expenses associated with securities sold short, inverse floater program fees and expenses, transaction charges and interest on borrowed money, interest and infrequent and/or unusual expenses. Any fees waived and/or expenses reimbursed under the expense reimbursement arrangements described above are not recoverable by the Investment Manager or its affiliates in future periods. Class C distribution fees waived by the Distributor, as discussed above, are in addition to the waiver/reimbursement commitment under the agreement.
Note 4. Federal Tax Information
The timing and character of income and capital gain distributions are determined in accordance with income tax regulations, which may differ from GAAP because of temporary or permanent book to tax differences.
At July 31, 2016, these differences are primarily due to differing treatment for capital loss carryforwards, Trustees' deferred compensation, distributions. To the extent these differences are permanent, reclassifications are made among the components of the Fund's net assets in the Statement of Assets and Liabilities. Temporary differences do not require reclassifications.
Annual Report 2016
30
COLUMBIA AMT-FREE OREGON INTERMEDIATE MUNI BOND FUND
NOTES TO FINANCIAL STATEMENTS (continued)
July 31, 2016
In the Statement of Assets and Liabilities the following reclassifications were made:
Undistributed net investment income | | $ | 2 | | |
Paid-in capital | | | (2 | ) | |
Net investment income (loss) and net realized gains (losses), as disclosed in the Statement of Operations, and net assets were not affected by this reclassification.
The tax character of distributions paid during the years indicated was as follows:
Year Ended July 31, | | 2016 | | 2015 | |
Tax-exempt income | | $ | 12,764,608 | | | $ | 13,059,661 | | |
Total | | $ | 12,764,608 | | | $ | 13,059,661 | | |
At July 31, 2016, the components of distributable earnings on a tax basis were as follows:
Undistributed tax-exempt income | | $ | 1,335,395 | | |
Capital loss carryforwards | | | (170,115 | ) | |
Net unrealized appreciation | | | 34,200,435 | | |
At July 31, 2016, the cost of investments for federal income tax purposes was $434,177,065 and the aggregate gross unrealized appreciation and depreciation based on that cost was:
Unrealized appreciation | | $ | 34,207,340 | | |
Unrealized depreciation | | | (6,905 | ) | |
Net unrealized appreciation | | $ | 34,200,435 | | |
The following capital loss carryforwards, determined at July 31, 2016, may be available to reduce taxable income arising from future net realized gains on investments, if any, to the extent permitted by the Internal Revenue Code:
Year of Expiration | | Amount ($) | |
No expiration — short-term | | | 170,115 | | |
For the year ended July 31, 2016, $1,208,783 of capital loss carryforward was utilized.
Management of the Fund has concluded that there are no significant uncertain tax positions in the Fund that would require recognition in the financial statements. However, management's conclusion may be subject to review and adjustment at a later date based on factors including, but not limited to, new tax laws, regulations, and administrative interpretations (including relevant court decisions). Generally, the Fund's federal tax returns for the prior three fiscal years remain subject to examination by the Internal Revenue Service.
Note 5. Portfolio Information
The cost of purchases and proceeds from sales of securities, excluding short-term investments and derivatives, if any, aggregated to $53,738,084 and $40,820,777, respectively, for the year ended July 31, 2016. The amount of purchase and sale activity impacts the portfolio turnover rate reported in the Financial Highlights.
Note 6. Line of Credit
The Fund has access to a revolving credit facility whereby the Fund may borrow for the temporary funding of shareholder redemptions or for other temporary or emergency purposes. Effective December 8, 2015, Citibank, N.A. and HSBC Bank USA, N.A. joined JPMorgan Chase Bank, N.A. (JPMorgan) as lead of a syndicate of banks under the credit facility, which is a collective agreement between the Fund and certain other funds managed by the Investment Manager, severally and not jointly, that permits collective borrowings up to $1 billion. Interest is charged to each participating fund based on its borrowings at a rate equal to the higher of (i) the overnight federal funds rate plus 1.00% or (ii) the one-month LIBOR rate plus 1.00%. Each borrowing under the credit facility matures no later than 60 days after the date of borrowing. The Fund also pays a commitment fee equal to its pro rata share of the amount of the credit facility at a rate of 0.15% per annum. The commitment fee is included in other expenses in the Statement of Operations. Prior to December 8, 2015, JPMorgan was the sole lead bank under the credit facility agreement that permitted borrowings up to $550 million under the same terms and interest rates as described above with the exception of the commitment fee which was charged at a rate of 0.075% per annum.
The Fund had no borrowings during the year ended July 31, 2016.
Note 7. Significant Risks
Shareholder Concentration Risk
At July 31, 2016, one unaffiliated shareholder of record owned 14.7% of the outstanding shares of the Fund in one or more accounts. The Fund has no knowledge about whether any portion of those shares was owned beneficially. Subscription and redemption activity by concentrated accounts may have a significant effect on the operations of the Fund. In the case of a large redemption, the Fund may be forced to sell investments at inopportune times, including its liquid or more liquid
Annual Report 2016
31
COLUMBIA AMT-FREE OREGON INTERMEDIATE MUNI BOND FUND
NOTES TO FINANCIAL STATEMENTS (continued)
July 31, 2016
positions, resulting in Fund losses and the Fund holding a higher percentage of less liquid or illiquid securities. Large redemptions could result in decreased economies of scale and increased operating expenses for non-redeeming Fund shareholders.
Credit Risk
Credit risk is the risk that the value of debt securities in the Fund's portfolio may decline because the issuer may default and fail to pay interest or repay principal when due. Rating agencies assign credit ratings to debt securities to indicate their credit risk. Lower rated or unrated debt securities held by the Fund may present increased credit risk as compared to higher-rated debt securities.
Interest Rate Risk
Interest rate risk is the risk of losses attributable to changes in interest rates. In general, if prevailing interest rates rise, the values of debt securities tend to fall, and if interest rates fall, the values of debt securities tend to rise. Actions by governments and central banking authorities can result in increases in interest rates. Increasing interest rates may negatively affect the value of debt securities held by the Fund, resulting in a negative impact on the Fund's performance and net asset value per share. In general, the longer the maturity or duration of a debt security, the greater its sensitivity to changes in interest rates.
Liquidity Risk
Liquidity risk is the risk associated with a lack of marketability of investments which may make it difficult to sell the investment at a desirable time or price. Changing regulatory, market or other conditions or environments (for example, the interest rate or credit environments) may adversely affect the liquidity of the Fund's investments. The Fund may have to accept a lower selling price for the holding, sell other investments, or forego another, more appealing investment opportunity. Generally, the less liquid the market at the time the Fund sells a portfolio investment, the greater the risk of loss or decline of value to the Fund. A less liquid market can lead to an increase in Fund redemptions, which may negatively impact Fund performance and net asset value per share, including, for example, if the Fund is forced to sell securities in a down market.
Geographic Concentration Risk
Because the Fund invests substantially in municipal securities issued by the state identified in the Fund's name and political sub-divisions of that state, the Fund will be particularly affected by adverse tax, legislative, regulatory, demographic or political changes as well as changes impacting the state's financial, economic or other condition and prospects. In addition, because of the relatively small number of issuers of tax-exempt securities in the state, the Fund may invest a higher percentage of assets in a single issuer and, therefore, be more exposed to the risk of loss than a fund that invests more broadly. The value of municipal and other securities owned by the Fund also may be adversely affected by future changes in federal or state income tax laws.
Note 8. Subsequent Events
Management has evaluated the events and transactions that have occurred through the date the financial statements were issued and noted no items requiring adjustment of the financial statements or additional disclosure.
Note 9. Information Regarding Pending and Settled Legal Proceedings
Ameriprise Financial and certain of its affiliates have historically been involved in a number of legal, arbitration and regulatory proceedings, including routine litigation, class actions, and governmental actions, concerning matters arising in connection with the conduct of their business activities. Ameriprise Financial believes that the Funds are not currently the subject of, and that neither Ameriprise Financial nor any of its affiliates are the subject of, any pending legal, arbitration or regulatory proceedings that are likely to have a material adverse effect on the Funds or the ability of Ameriprise Financial or its affiliates to perform under their contracts with the Funds. Ameriprise Financial is required to make quarterly (10-Q), annual (10-K) and, as necessary, 8-K filings with the Securities and Exchange Commission (SEC) on legal and regulatory matters that relate to Ameriprise Financial and its affiliates. Copies of these filings may be obtained by accessing the SEC website at www.sec.gov.
There can be no assurance that these matters, or the adverse publicity associated with them, will not result in increased fund redemptions, reduced sale of fund shares or other adverse consequences to the Funds. Further, although we believe proceedings are not likely to have a
Annual Report 2016
32
COLUMBIA AMT-FREE OREGON INTERMEDIATE MUNI BOND FUND
NOTES TO FINANCIAL STATEMENTS (continued)
July 31, 2016
material adverse effect on the Funds or the ability of Ameriprise Financial or its affiliates to perform under their contracts with the Funds, these proceedings are subject to uncertainties and, as such, we are unable to estimate the possible loss or range of loss that may result. An adverse outcome in one or more of these proceedings could result in adverse judgments, settlements, fines, penalties or other relief that could have a material adverse effect on the consolidated financial condition or results of operations of Ameriprise Financial.
Annual Report 2016
33
COLUMBIA AMT-FREE OREGON INTERMEDIATE MUNI BOND FUND
REPORT OF INDEPENDENT REGISTERED PUBLIC ACCOUNTING FIRM
To the Trustees of Columbia Funds Series Trust I and the Shareholders of
Columbia AMT-Free Oregon Intermediate Muni Bond Fund
In our opinion, the accompanying statement of assets and liabilities, including the portfolio of investments, and the related statements of operations and of changes in net assets and the financial highlights present fairly, in all material respects, the financial position of Columbia AMT-Free Oregon Intermediate Muni Bond Fund (the "Fund", a series of Columbia Funds Series Trust I) at July 31, 2016, and the results of its operations, the changes in its net assets and the financial highlights for each of the periods indicated, in conformity with accounting principles generally accepted in the United States of America. These financial statements and financial highlights (hereafter referred to as "financial statements") are the responsibility of the Fund's management. Our responsibility is to express an opinion on these financial statements based on our audits. We conducted our audits of these financial statements in accordance with the standards of the Public Company Accounting Oversight Board (United States). Those standards require that we plan and perform the audit to obtain reasonable assurance about whether the financial statements are free of material misstatement. An audit includes examining, on a test basis, evidence supporting the amounts and disclosures in the financial statements, assessing the accounting principles used and significant estimates made by management, and evaluating the overall financial statement presentation. We believe that our audits, which included confirmation of securities at July 31, 2016 by correspondence with the custodian, brokers and transfer agent, and the application of alternative auditing procedures where such confirmations had not been received, provide a reasonable basis for our opinion.
PricewaterhouseCoopers LLP
Minneapolis, MN
September 21, 2016
Annual Report 2016
34
COLUMBIA AMT-FREE OREGON INTERMEDIATE MUNI BOND FUND
FEDERAL INCOME TAX INFORMATION
(Unaudited)
The Fund hereby designates the following tax attributes for the fiscal year ended July 31, 2016. Shareholders will be notified in early 2017 of the amounts for use in preparing 2016 income tax returns.
Tax Designations
Exempt-Interest Dividends | | | 100.00 | % | |
Exempt-Interest Dividends. The percentage of net investment income distributed during the fiscal year that qualifies as exempt-interest dividends for federal income tax purposes.
Annual Report 2016
35
COLUMBIA AMT-FREE OREGON INTERMEDIATE MUNI BOND FUND
Shareholders elect the Board that oversees the Fund's operations. The Board appoints officers who are responsible for day-to-day business decisions based on policies set by the Board. The following table provides basic biographical information about the Fund's Trustees, including their principal occupations during the past five years, although specific titles for individuals may have varied over the period. The year set forth beneath Length of Service in the table below is the year in which the Trustee was first appointed or elected as Trustee to any Fund currently in the Columbia Funds Complex or a predecessor thereof. Under current Board policy, members serve terms of indefinite duration.
Trustees
Independent Trustees
Name,
Address,
Year of Birth | | Position Held With
the Trust and Length of
Service | | Principal Occupation(s)
During the Past Five Years
and Other Relevant
Professional Experience | | Number of
Funds in the
Columbia Funds
Complex
Overseen | | Other Directorships
Held by Trustee During
the Past Five Years | |
Janet Langford Carrig
c/o Columbia
Management Investment Advisers, LLC,
225 Franklin Street
Mail Drop BX32 05228,
Boston, MA 02110
1957 | | Trustee 1996 | | Senior Vice President, General Counsel and Corporate Secretary, ConocoPhillips (integrated energy company) since September 2007 | | | 56 | | | None | |
Douglas A. Hacker
c/o Columbia Management Investment Advisers, LLC,
225 Franklin Street
Mail Drop BX32 05228,
Boston, MA 02110
1955 | | Trustee and Chairman of the Board 1996 | | Independent business executive since May 2006; Executive Vice President — Strategy of United Airlines from December 2002 to May 2006; President of UAL Loyalty Services (airline marketing company) from September 2001 to December 2002; Executive Vice President and Chief Financial Officer of United Airlines from July 1999 to September 2001 | | | 56 | | | Spartan Nash Company (food distributor); Nash Finch Company (food distributor) from 2005 to 2013; Aircastle Limited (aircraft leasing); SeaCube Container Leasing Ltd. (container leasing) from 2010 to 2013; and Travelport Worldwide Limited (travel information technology) | |
Nancy T. Lukitsh
c/o Columbia Management Investment Advisers, LLC,
225 Franklin Street
Mail Drop BX32 05228,
Boston, MA 02110
1956 | | Trustee 2011 | | Senior Vice President, Partner and Director of Marketing, Wellington Management Company, LLP (investment adviser) from 1997 to 2010; Chair, Wellington Management Portfolios (commingled non-U.S. investment pools) from 2007 to 2010; Director, Wellington Trust Company, NA and other Wellington affiliates from 1997 to 2010 | | | 56 | | | None | |
Annual Report 2016
36
COLUMBIA AMT-FREE OREGON INTERMEDIATE MUNI BOND FUND
TRUSTEES AND OFFICERS (continued)
Independent Trustees (continued)
Name,
Address,
Year of Birth | | Position Held With
the Trust and Length of
Service | | Principal Occupation(s)
During the Past Five Years
and Other Relevant
Professional Experience | | Number of
Funds in the
Columbia Funds
Complex
Overseen | | Other Directorships
Held by Trustee During
the Past Five Years | |
William E. Mayer
c/o Columbia Management Investment Advisers, LLC,
225 Franklin Street
Mail Drop BX32 05228,
Boston, MA 02110
1940 | | Trustee 1991 | | Partner, Park Avenue Equity Partners (private equity) since February 1999 | | | 56 | | | DynaVox Inc. (speech creation); Lee Enterprises (print media); WR Hambrecht + Co. (financial service provider) from 2000 to 2012; BlackRock Capital Investment Corporation (investment company); and Premier, Inc. (healthcare) | |
David M. Moffett
c/o Columbia Management Investment Advisers, LLC,
225 Franklin Street
Mail Drop BX32 05228,
Boston, MA 02110
1952 | | Trustee 2011 | | Retired. Consultant to Bridgewater and Associates | | | 56 | | | Director of CIT Bank, CIT Group Inc. (commercial and consumer finance); eBay Inc. (online trading community); Genworth Financial, Inc. (financial and insurance products and services); Paypal Holdings Inc. (payment and data processing services); and Trustee University of Oklahoma Foundation | |
Charles R. Nelson
c/o Columbia Management Investment Advisers, LLC,
225 Franklin Street
Mail Drop BX32 05228,
Boston, MA 02110
1942 | | Trustee 1981 | | Retired. Professor Emeritus, University of Washington since 2011; Professor of Economics, University of Washington from 1976 to 2011; Ford and Louisa Van Voorhis Professor of Political Economy, University of Washington from 1993 to 2011; Adjunct Professor of Statistics, University of Washington from 1980 to 2011; Associate Editor, Journal of Money, Credit and Banking from September 1993 to 2008; consultant on econometric and statistical matters | | | 56 | | | None | |
John J. Neuhauser
c/o Columbia Management Investment Advisers, LLC,
225 Franklin Street
Mail Drop BX32 05228,
Boston, MA 02110
1943 | | Trustee 1984 | | President, Saint Michael's College since August 2007; Director or Trustee of several non-profit organizations, including University of Vermont Medical Center; Academic Vice President and Dean of Faculties, Boston College from August 1999 to October 2005; University Professor, Boston College from November 2005 to August 2007 | | | 56 | | | Liberty All-Star Equity Fund and Liberty All-Star Growth Fund (closed-end funds) | |
Annual Report 2016
37
COLUMBIA AMT-FREE OREGON INTERMEDIATE MUNI BOND FUND
TRUSTEES AND OFFICERS (continued)
Independent Trustees (continued)
Name,
Address,
Year of Birth | | Position Held With
the Trust and Length of
Service | | Principal Occupation(s)
During the Past Five Years
and Other Relevant
Professional Experience | | Number of
Funds in the
Columbia Funds
Complex
Overseen | | Other Directorships
Held by Trustee During
the Past Five Years | |
Patrick J. Simpson
c/o Columbia Management Investment Advisers, LLC,
225 Franklin Street
Mail Drop BX32 05228,
Boston, MA 02110
1944 | | Trustee 2000 | | Of Counsel, Perkins Coie LLP (law firm) since 2015; Partner, Perkins Coie LLP from 1988 to 2014 | | | 56 | | | None | |
Anne-Lee Verville
c/o Columbia Management Investment Advisers, LLC,
225 Franklin Street
Mail Drop BX32 05228,
Boston, MA 02110
1945 | | Trustee 1998 | | Retired. General Manager, Global Education Industry from 1994 to 1997, President — Application Systems Division from 1991 to 1994, Chief Financial Officer — US Marketing & Services from 1988 to 1991, and Chief Information Officer from 1987 to 1988, IBM Corporation (computer and technology) | | | 56 | | | Enesco Group, Inc. (producer of giftware and home and garden decor products) from 2001 to 2006 | |
Consultant to the Trustees*
Name,
Address,
Year of Birth | | Position Held With
the Trust and Length of
Service | | Principal Occupation(s)
During the Past Five Years
and Other Relevant
Professional Experience | | Number of
Funds in the
Columbia Funds
Complex
Overseen | | Other Directorships
Held by Trustee During
the Past Five Years | |
J. Kevin Connaughton
c/o Columbia
Management Investment Advisers, LLC,
225 Franklin Street
Mail Drop BX32 05228,
Boston, MA 02110
1964 | | Trustee Consultant 2016 | | Trustee Consultant, Columbia Funds since March 2016; Managing Director and General Manager of Mutual Fund Products, Columbia Management Investment Advisers, LLC from May 2010 to February 2015; President, Columbia Funds from 2009 to 2015; and senior officer of Columbia Funds and affiliated funds from 2003 to 2015 | | | 56 | | | Board of Governors, Gateway Healthcare since January 2016; Trustee, New Century Portfolios since March 2015; and Director, The Autism Project since March 2015 | |
* J. Kevin Connaughton was appointed consultant to the Trustees effective March 1, 2016. Shareholders of the Funds are expected to be asked to elect Mr. Connaughton as a Trustee at a future shareholder meeting.
Annual Report 2016
38
COLUMBIA AMT-FREE OREGON INTERMEDIATE MUNI BOND FUND
TRUSTEES AND OFFICERS (continued)
Interested Trustee Affiliated with Investment Manager*
Name,
Address,
Year of Birth | | Position Held With
the Trust and Length of
Service | | Principal Occupation(s)
During the Past Five Years
and Other Relevant
Professional Experience | | Number of
Funds in the
Columbia Funds
Complex
Overseen | | Other Directorships
Held by Trustee During
the Past Five Years | |
William F. Truscott
c/o Columbia Management Investment Advisers, LLC,
225 Franklin Street
Boston, MA 02110
1960 | | Trustee 2012 | | Chairman of the Board and President, Columbia Management Investment Advisers, LLC since May 2010 and February 2012, respectively; Chief Executive Officer, Global Asset Management, Ameriprise Financial, Inc. since September 2012 (previously Chief Executive Officer, U.S. Asset Management & President, Annuities, May 2010- September 2012); Director and Chief Executive Officer, Columbia Management Investment Distributors, Inc. since May 2010 and February 2012, respectively; Chairman of the Board and Chief Executive Officer, RiverSource Distributors, Inc. since 2006; Director, Threadneedle Asset Management Holdings, SARL since 2014; President and Chief Executive Officer, Ameriprise Certificate Company, 2006-August 2012. | | | 175 | | | Chairman of the Board, Columbia Management Investment Advisers, LLC since May 2010; Director, Columbia Management Investment Distributors, Inc. since May 2010; Former Director, Ameriprise Certificate Company, 2006-January 2013 | |
* Interested person (as defined under the 1940 Act) by reason of being an officer, director, security holder and/or employee of the Investment Manager or Ameriprise Financial.
The Statement of Additional Information has additional information about the Fund's Board members and is available, without charge, upon request by calling 800.345.6611; contacting your financial intermediary; or visiting investor.columbiathreadneedleus.com.
Annual Report 2016
39
COLUMBIA AMT-FREE OREGON INTERMEDIATE MUNI BOND FUND
TRUSTEES AND OFFICERS (continued)
The Board has appointed officers who are responsible for day-to-day business decisions based on policies it has established. The officers serve at the pleasure of the Board. The following table provides basic information about the Officers of the Fund, including principal occupations during the past five years, although their specific titles may have varied over the period. In addition to Mr. Truscott, who is Senior Vice President, the Fund's other officers are:
Fund Officers
Name,
Address and
Year of Birth | | Position and Year
First Appointed to
Position for any Fund
in the Columbia
Funds Complex or a
Predecessor Thereof | |
Principal Occupation(s) During Past Five Years | |
Christopher O. Petersen
5228 Ameriprise Financial Center
Minneapolis, MN 55474
Born 1970 | | President and Principal Executive Officer (2015) | | Vice President and Lead Chief Counsel, Ameriprise Financial, Inc. since January 2015 (previously, Vice President and Chief Counsel January 2010-December 2014; officer of Columbia Funds and affiliated funds since 2007. | |
Michael G. Clarke
225 Franklin Street
Boston, MA 02110
Born 1969 | | Treasurer (2011), Chief Financial Officer (2009) and Chief Accounting Officer (2015) | | Vice President — Mutual Fund Administration, Columbia Management Investment Advisers, LLC, since May 2010; senior officer of Columbia Funds and affiliated funds since 2002. | |
Paul B. Goucher
100 Park Avenue
New York, NY 10017
Born 1968 | | Senior Vice President (2011), Chief Legal Officer (2015) and Assistant Secretary (2008) | | Vice President and Lead Chief Counsel, Ameriprise Financial, Inc. since November 2008 and January 2013, respectively (previously Chief Counsel, January 2010-January 2013); Vice President, Chief Legal Officer and Assistant Secretary, Columbia Management Investment Advisers, LLC since May 2010. | |
Thomas P. McGuire
225 Franklin Street
Boston, MA 02110
Born 1972 | | Senior Vice President and Chief Compliance Officer (2012) | | Vice President — Asset Management Compliance, Ameriprise Financial, Inc., since May 2010; Chief Compliance Officer, Ameriprise Certificate Company since September 2010. | |
Colin Moore
225 Franklin Street
Boston, MA 02110
Born 1958 | | Senior Vice President (2010) | | Executive Vice President and Global Chief Investment Officer, Ameriprise Financial, Inc., since July 2013; Executive Vice President and Global Chief Investment Officer, Columbia Management Investment Advisers, LLC since July 2013 (previously Director and Global Chief Investment Officer, 2010-2013). | |
Michael E. DeFao
225 Franklin Street
Boston, MA 02110
Born 1968 | | Vice President (2011) and Assistant Secretary (2010) | | Vice President and Chief Counsel, Ameriprise Financial, Inc. since May 2010. | |
Amy Johnson
5228 Ameriprise Financial Center
Minneapolis, MN 55474
Born 1965 | | Vice President (2006) | | Managing Director and Global Head of Operations, Columbia Management Investment Advisers, LLC since April 2016 (previously Managing Director and Chief Operating Officer, 2010-2016). | |
Lyn Kephart-Strong
5228 Ameriprise
Financial Center
Minneapolis, MN 55474
Born 1960 | | Vice President (2015) | | President, Columbia Management Investment Services Corp. since October 2014; Vice President & Resolution Officer, Ameriprise Trust Company since August 2009. | |
Ryan C. Larrenaga
225 Franklin Street
Boston, MA 02110
Born 1970 | | Vice President and Secretary (2015) | | Vice President and Group Counsel, Ameriprise Financial, Inc. since August 2011 (previously, Counsel from May 2010 to August 2011); officer of Columbia Funds and affiliated funds since 2005. | |
Annual Report 2016
40
COLUMBIA AMT-FREE OREGON INTERMEDIATE MUNI BOND FUND
BOARD CONSIDERATION AND APPROVAL OF MANAGEMENT
AGREEMENT
On June 10, 2016, the Board of Trustees (the Board) and the Trustees who are not interested persons (as defined in the Investment Company Act of 1940) (the Independent Trustees) of Columbia Funds Series Trust I (the Trust) unanimously approved the continuation of the Management Agreement (the Management Agreement) with Columbia Management Investment Advisers, LLC (the Investment Manager) with respect to Columbia AMT-Free Oregon Intermediate Muni Bond Fund (the Fund), a series of the Trust. As detailed below, the Board's Advisory Fees and Expenses Committee (the Committee) and the Board met on multiple occasions to review and discuss, both among themselves and with the management team of the Investment Manager, materials provided by the Investment Manager and others before determining to approve the continuation of the Management Agreement.
In connection with their deliberations regarding the continuation of the Management Agreement, the Committee and the Board evaluated materials requested from the Investment Manager regarding the Fund and the Management Agreement, and discussed these materials with representatives of the Investment Manager at Committee meetings held on March 8, 2016, April 27, 2016 and June 9, 2016 and at Board meetings held on March 9, 2016 and June 10, 2016. In addition, the Board considers matters bearing on the Management Agreement at most of its other meetings throughout the year and meets regularly with senior management of the Trust and the Investment Manager. Through the Board's Investment Oversight Committees, Trustees also meet with selected portfolio managers of the funds the Trustees oversee and other investment personnel at various times throughout the year. The Committee and the Board also consulted with its independent fee consultant, Fund counsel and with the Independent Trustees' independent legal counsel, who advised on various matters with respect to the Committee's and the Board's considerations and otherwise assisted the Committee and the Board in their deliberations. On June 9, 2016, the Committee recommended that the Board approve the continuation of the Management Agreement. On June 10, 2016, the Board, including the Independent Trustees, voting separately, unanimously approved the continuation of the Management Agreement for the Fund.
The Committee and the Board considered all information that they, their legal counsel or the Investment Manager believed reasonably necessary to evaluate and to determine whether to approve the continuation of the Management Agreement. The information and factors considered by the Committee and the Board in recommending for approval or approving the continuation of the Management Agreement for the Fund included the following:
• Information on the investment performance of the Fund relative to the performance of a group of mutual funds determined to be comparable to the Fund by an independent third-party data provider, as well as performance relative to benchmarks;
• Information on the Fund's management fees and total expenses, including information comparing the Fund's expenses to those of a group of comparable mutual funds, as determined by the independent third-party data provider;
• The Investment Manager's agreement to contractually limit or cap total operating expenses for the Fund through November 30, 2017 so that total operating expenses (excluding certain fees and expenses, such as transaction costs and certain other investment related expenses, interest, taxes, acquired fund fees and expenses, and infrequent and/or unusual expenses) would not exceed a specified annual rate, as a percentage of the Fund's net assets;
• The terms and conditions of the Management Agreement;
• The current and proposed terms and conditions of other agreements and arrangements with affiliates of the Investment Manager relating to the operations of the Fund, including agreements with respect to the provision of distribution and transfer agency services to the Fund;
• Descriptions of various functions performed by the Investment Manager under the Management Agreement, including portfolio management and portfolio trading practices;
• Information regarding the management fees of similarly-managed portfolios of other clients of the Investment Manager, including institutional separate accounts;
Annual Report 2016
41
COLUMBIA AMT-FREE OREGON INTERMEDIATE MUNI BOND FUND
BOARD CONSIDERATION AND APPROVAL OF MANAGEMENT
AGREEMENT (continued)
• Information regarding the reputation, regulatory history and resources of the Investment Manager, including information regarding senior management, portfolio managers and other personnel;
• Information regarding the capabilities of the Investment Manager with respect to compliance monitoring services, including an assessment of the Investment Manager's compliance system by the Fund's Chief Compliance Officer; and
• The profitability to the Investment Manager and its affiliates from their relationships with the Fund.
Nature, Extent and Quality of Services Provided under the Management Agreement
The Committee and the Board considered the nature, extent and quality of services provided to the Fund by the Investment Manager and its affiliates under the Management Agreement and under separate agreements for the provision of transfer agency services, and the resources dedicated to the Fund and the other Columbia Funds by the Investment Manager and its affiliates. The Committee and the Board considered, among other things, the Investment Manager's ability to attract, motivate and retain highly qualified research, advisory and supervisory investment professionals (including personnel and other resources, compensation programs for personnel involved in fund management, reputation and other attributes), the portfolio management services provided by those investment professionals, and the quality of the Investment Manager's investment research capabilities and trade execution services. The Committee and the Board also considered the potential benefits to shareholders of investing in a mutual fund that is part of a fund complex offering exposure to a variety of asset classes and investment disciplines and providing a variety of fund and shareholder services.
The Committee and the Board also considered the professional experience and qualifications of the senior personnel of the Investment Manager, which included consideration of the Investment Manager's experience with similarly-structured funds. The Committee and the Board noted the compliance programs of and the compliance-related resources provided to the Fund by the Investment Manager and its affiliates, and considered the Investment Manager's ability to provide administrative services to the Fund and coordinate the activities of the Fund's other service providers. After reviewing these and related factors, the Committee and the Board concluded, within the context of their overall conclusions, that the nature, extent and quality of the services provided to the Fund under the Management Agreement supported the continuation of the Management Agreement.
Investment Performance
The Committee and the Board reviewed information about the performance of the Fund over various time periods, including performance information relative to benchmarks and information based on reports of the independent third-party data provider that compared the performance of the Fund to the performance of a group of comparable mutual funds, and data provided by the independent fee consultant. The Committee and the Board also reviewed a description of the third party's methodology for identifying the Fund's peer groups for purposes of performance and expense comparisons.
The Committee and the Board noted that, through December 31, 2015, the Fund's performance was in the thirty-fourth, twenty-third and twenty-third percentile (where the best performance would be in the first percentile) of its category selected by the independent third-party data provider for the purposes of performance comparisons for the one-, three- and five- year periods, respectively.
The Committee and the Board also considered the Investment Manager's performance and reputation generally, the Investment Manager's historical responsiveness to Board concerns about performance, and the Investment Manager's willingness to take steps intended to improve performance. After reviewing these and related factors, the Committee and the Board concluded, within the context of their overall conclusions, that the performance of the Fund and the Investment Manager was sufficient, in light of other considerations, to warrant the continuation of the Management Agreement.
Investment Management Fee Rates and Other Expenses
The Committee and the Board considered the management fees charged to the Fund under the Management Agreement as well as the total expenses incurred by the Fund. In assessing the reasonableness of the fees
Annual Report 2016
42
COLUMBIA AMT-FREE OREGON INTERMEDIATE MUNI BOND FUND
BOARD CONSIDERATION AND APPROVAL OF MANAGEMENT
AGREEMENT (continued)
under the Management Agreement, the Committee and the Board considered, among other information, the Fund's management fee and its total expense ratio as a percentage of average daily net assets. The Committee and the Board considered data provided by the independent fee consultant. The Committee and the Board noted that, as of December 31, 2015, the Fund's actual management fee and net total expense ratio are both ranked in the fourth quintile (where the lowest fees and expenses would be in the first quintile) against the Fund's expense universe as determined by the independent third-party data provider for purposes of expense comparison. The Committee and the Board also took into account the fee waiver and expense limitation arrangements agreed to by the Investment Manager, as noted above.
The Committee and the Board also received and considered information about the management fees charged by the Investment Manager to institutional separate accounts. In considering the fees charged to those accounts, the Committee and the Board took into account, among other things, the Investment Manager's representations about the differences between managing mutual funds as compared to other types of accounts, including differences in the services provided, differences in the risk profile of such business for the Investment Manager and the additional resources required to manage mutual funds effectively. The Committee and the Board also received and considered information about the fees charged by the Investment Manager for sub-advisory services provided to comparable unaffiliated funds. In evaluating the Fund's management fees, the Committee and the Board also took into account the demands, complexity and quality of the investment management of the Fund.
After reviewing these and related factors, the Committee and the Board concluded, within the context of their overall conclusions, that the management fee rates and expenses of the Fund were sufficient, in light of other considerations, to warrant the continuation of the Management Agreement.
Costs of Services Provided and Profitability
The Committee and the Board also took note of the costs the Investment Manager and its affiliates incur in connection with the services provided (both on an absolute and relative basis) and the profitability to the Investment Manager and its affiliates in connection with their relationships with the Fund.
The Committee and the Board also considered the compensation directly or indirectly received by the Investment Manager's affiliates in connection with their relationships with the Fund. The Committee and the Board reviewed information provided by management as to the profitability to the Investment Manager and its affiliates of their relationships with the Fund, information about the allocation of expenses used to calculate profitability, and comparisons of profitability levels realized in 2015 to profitability levels realized in 2014. When reviewing profitability, the Committee and the Board also considered court cases in which adviser profitability was an issue in whole or in part, the performance of similarly managed funds, the performance of the Fund, and the expense ratio of the Fund. In addition, the Committee and the Board considered information provided by the Investment Manager regarding the Investment Manager's financial condition and comparing its profitability to that of other asset management firms that are, or are subsidiaries of, publicly traded companies. In this regard, the Committee and the Board also considered data provided by the independent fee consultant.
After reviewing these and related factors, the Committee and the Board concluded, within the context of their overall conclusions, that the costs of services provided and the profitability to the Investment Manager and its affiliates from their relationships with the Fund supported the continuation of the Management Agreement.
Economies of Scale
The Committee and the Board considered the potential existence of economies of scale in the provision by the Investment Manager of services to the Fund, to groups of related funds, and to the Investment Manager's investment advisory clients as a whole, and whether those economies of scale were shared with the Fund through breakpoints in investment management fees or other means, such as expense limitation arrangements and additional investments by the Investment Manager in investment, trading and compliance resources. The Committee and the Board noted that the management fee schedules for the Fund contained breakpoints that would reduce the fee rate on assets above specified threshold levels.
Annual Report 2016
43
COLUMBIA AMT-FREE OREGON INTERMEDIATE MUNI BOND FUND
BOARD CONSIDERATION AND APPROVAL OF MANAGEMENT
AGREEMENT (continued)
In considering these matters, the Committee and the Board also considered the costs of the services provided and the profitability to the Investment Manager and its affiliates from their relationships with the Fund, as discussed above. After reviewing these and related factors, the Committee and the Board concluded, within the context of their overall conclusions, that the extent to which any economies of scale were expected to be shared with the Fund supported the continuation of the Management Agreement.
Other Benefits to the Investment Manager
The Committee and the Board received and considered information regarding "fall-out" or ancillary benefits received by the Investment Manager and its affiliates as a result of their relationships with the Fund, such as the engagement of the Investment Manager's affiliates to provide distribution and transfer agency services to the Fund. In this regard, among other matters, the Committee and the Board considered that the Fund's distributor retains a portion of the distribution fees from the Fund and receives a portion of the sales charges on sales or redemptions of certain classes of shares of the Fund. The Committee and the Board also considered the benefits of research made available to the Investment Manager by reason of brokerage commissions generated by the Fund's securities transactions, and reviewed information about the Investment Manager's practices with respect to allocating portfolio transactions for brokerage and research services. The Committee and the Board considered the possible conflicts of interest associated with certain fall-out or other ancillary benefits and the reporting, disclosure and other processes that are in place to address such possible conflicts of interest. The Committee and the Board recognized that the Investment Manager's profitability would be somewhat lower without these benefits.
Conclusion
The Committee and the Board reviewed all of the above considerations in reaching their decisions to recommend or approve the continuation of the Management Agreement. In their deliberations, the Trustees did not identify any particular information that was all-important or controlling, and individual Trustees may have attributed different weights to the various factors. Based on their evaluation of all factors that they deemed to be material, including those factors described above, and assisted by the advice of independent legal counsel, the Board, including the Independent Trustees, voting separately, unanimously approved the continuation of the Management Agreement.
Annual Report 2016
44
COLUMBIA AMT-FREE OREGON INTERMEDIATE MUNI BOND FUND
IMPORTANT INFORMATION ABOUT THIS REPORT
Each fund mails one shareholder report to each shareholder address. If you would like more than one report, please call shareholder services at 800.345.6611 and additional reports will be sent to you.
The policy of the Board is to vote the proxies of the companies in which each fund holds investments consistent with the procedures as stated in the Statement of Additional Information (SAI). You may obtain a copy of the SAI without charge by calling 800.345.6611; contacting your financial intermediary; visiting investor.columbiathreadneedleus.com; or searching the website of the Securities and Exchange Commission (SEC) at sec.gov. Information regarding how each fund voted proxies relating to portfolio securities is filed with the SEC by August 31st for the most recent 12-month period ending June 30th of that year, and is available without charge by visiting investor.columbiathreadneedleus.com, or searching the website of the SEC at sec.gov.
Each fund files a complete schedule of portfolio holdings with the SEC for the first and third quarters of each fiscal year on Form N-Q. Each fund's Form N-Q is available on the SEC's website at sec.gov and may be reviewed and copied at the SEC's Public Reference Room in Washington, D.C. Information on the operation of the Public Reference Room may be obtained by calling 800.SEC.0330. Each fund's complete schedule of portfolio holdings, as filed on Form N-Q, can also be obtained without charge, upon request, by calling 800.345.6611.
Annual Report 2016
45
Columbia AMT-Free Oregon Intermediate Muni Bond Fund
P.O. Box 8081
Boston, MA 02266-8081

This information is for use with concurrent or prior delivery of a fund prospectus. Please read and consider the investment objectives, risks, charges and expenses for any fund carefully before investing. For a prospectus and summary prospectus, which contains this and other important information about the Fund, go to investor.columbiathreadneedleus.com. The Fund is distributed by Columbia Management Investment Distributors, Inc., member FINRA, and managed by Columbia Management Investment Advisers, LLC.
Columbia Threadneedle Investments (Columbia Threadneedle) is the global brand name of the Columbia and Threadneedle group of companies.
All rights reserved. Columbia Management Investment Distributors, Inc., 225 Franklin Street, Boston, MA 02110-2804
© 2016 Columbia Management Investment Advisers, LLC.
investor.columbiathreadneedleus.com
ANN207_07_F01_(09/16)

ANNUAL REPORT
July 31, 2016

COLUMBIA LARGE CAP GROWTH FUND

ABOUT COLUMBIA THREADNEEDLE INVESTMENTS
Columbia Threadneedle Investments is a leading global asset management group that provides a broad range of investment strategies and solutions for individual, institutional and corporate clients around the world.
With more than 2,000 people, including over 450 investment professionals based in North America, Europe and Asia, we manage $460 billion* of assets across developed and emerging market equities, fixed income, asset allocation solutions and alternatives. We are the 13th largest manager of long-term mutual fund assets in the U.S.** and the 4th largest manager of retail funds in the U.K.***
Our priority is the investment success of our clients. We aim to deliver the investment outcomes they expect through an investment approach that is team-based, performance-driven and risk-aware. Our culture is dynamic and interactive. By sharing our insights across asset classes and geographies, we generate richer perspectives on global, regional and local investment landscapes. The ability to exchange and debate investment ideas in a collaborative environment enriches our teams' investment processes. More importantly, it results in better informed investment decisions for our clients.
Columbia funds are distributed by Columbia Management Investment Distributors, Inc., member FINRA, and managed by Columbia Management Investment Advisers, LLC.
Columbia Threadneedle Investments (Columbia Threadneedle) is the global brand name of the Columbia and Threadneedle group of companies.
* In U.S. dollars as of June 30, 2016. Source: Ameriprise Q2 Earnings Release. Includes all assets managed by entities in the Columbia and Threadneedle group of companies. Contact us for more current data.
** Source: ICI as of June 30, 2016 for Columbia Management Investment Advisers, LLC.
*** Source: Investment Association as of March 2016 for Threadneedle Asset Management Limited.
© 2016 Columbia Management Investment Advisers, LLC. All rights reserved.
Not part of the shareholder report
Investment strategies to help meet investor needs
We are committed to helping investors navigate financial challenges to reach their desired outcomes. The possibilities are endless.
Your success is our priority.
Retire comfortably
Fund college or higher education
Leave a legacy
Generate an appropriate stream of income in retirement
Traditional approaches to income may no longer be adequate — and they may no longer provide the diversification benefits they once did. Investors need to rethink how they generate retirement income.
Worried about running out of income? You are not alone.
Navigate a changing interest rate environment
Even in today's challenging interest rate environment, it's still possible to navigate markets and achieve your goals.
Make investment choices designed specifically for this market environment.
Maximize after-tax returns
In an environment where what you keep is more important than what you earn, municipal bonds can help mitigate higher taxes while providing attractive yields compared to other investment options.
You've worked too hard building your wealth to lose it to taxes.
Grow assets to achieve financial goals
Finding growth opportunities in today's complex market environment requires strong research capabilities, creative thinking and a disciplined approach.
Do your investments deliver the portfolio growth you need?
Ease the impact of volatile markets
With increasing concerns about market volatility, investors should consider diversifying their portfolios with non-traditional holdings.
Interested in turning volatility into opportunity?
To find out more, contact your financial professional, call 800.426.3750 or visit investor.columbiathreadneedleus.com
Not part of the shareholder report
 Dear Shareholders,
Volatility comes with the territory for long-term investors. Some investors instinctively want to pull out of the market or sell underperforming investments at the first sign of increased volatility or perhaps even as soon as they perceive it on the horizon. But taking yourself out of the market could mean losing out on potential opportunities, and putting your longer term investment goals at risk.
Cumulative return is not just about achieving high returns when markets are going up; it's also about remaining invested and minimizing losses during weak or volatile markets so that you can participate on the upside. Developing a deeper understanding of the various risks your portfolio is subject to can help you balance these risks.
Diversification is critical in seeking to achieve that balance. We believe that most portfolios could be more effectively diversified either by introducing holdings with performance profiles unrelated to existing holdings (like alternative products) or by rebalancing existing holdings with an eye toward risk allocation. Over time, distributing risk more evenly may produce a more pronounced diversification benefit and may improve portfolio efficiency. We believe market volatility can create significant opportunities and, in fact, these periods may be some of the very best times to invest.
With this in mind, I thought it important to highlight excerpts from a piece written by Colin Moore, Global Chief Investment Officer, in which he touches on some of these issues emphasizing the importance of a properly constructed portfolio in seeking to effectively manage volatility and to achieve consistency of returns. I encourage you to read the article in its entirety. To access the full article and for other insights on current market, please visit blog.columbiathreadneedleus.com/latest-perspectives.
You need investments that are designed to help you ease the impact of volatile market environments and keep the savings you have worked tirelessly to amass. Columbia Threadneedle Investments provides investment solutions to help you tackle financial challenges and achieve your desired outcome.
Best regards,

Christopher O. Petersen
President, Columbia Funds
Excerpts from:
Taking the scare out of the volatility bogeyman
By Colin Moore, Global Chief Investment Officer
Colin Moore is the global chief investment officer for Columbia Threadneedle Investments. His responsibilities include ensuring that a disciplined investment process is in place across all asset classes, including equity and fixed income. Mr. Moore joined one of the Columbia Threadneedle Investments legacy firms in 2002 as head of equity and was also head of fixed income and liquidity strategies from 2009 – 2010.

n In today's low growth, higher volatility world, the emphasis is shifting from maximization of returns to consistency of returns.
PRESIDENT'S MESSAGE (continued)
n Portfolios should represent the behavioral risk-return tradeoff of investors, remembering that they won't stay invested to realize the return if we get the risk tolerance wrong.
n Holding long-term savings in cash to avoid volatility (the financial equivalent of hiding under the sheets) is detrimental to achieving long-term goals.
According to Wikipedia, "The bogeyman is a common allusion to a mythical creature in many cultures used to control behavior. This monster has no specific appearance, and conceptions about it can vary drastically from household to household within the same community; in many cases he has no set appearance in the mind of an adult or child, but is simply a non-specific embodiment of terror." Different cultures have different names and physical representations for the bogeyman, and investors are no different. We have terrible monsters that we fear may destroy our portfolios, and we call one of the scariest of them volatility.
While the bogeyman is mythical (I hope!), volatility is real and can cause serious damage. To understand why investors have such a hard time coping with volatility, we first need to define three cognitive biases at work in today's investment environment:
1) Recency bias — something that has recently come to the forefront of our attention, regardless of how long established it is, suddenly seems to appear with improbable frequency.
2) Negativity bias — we tend to have a greater recall of unpleasant memories than positive memories.
3) Loss aversion — our dissatisfaction with losing money tends to be greater than our satisfaction with making money.
The level of volatility varies dramatically, and so does investor fear and panic selling — waxing when volatility rises, waning when it falls. Recent studies have pointed to demographics as an important driver of panic selling. The theory is that as people get closer to retirement, the prospects of a large (20% – 30%) loss in financial assets can have a much more pronounced effect on their sense of well-being. Wealth preservation instincts kick in much more quickly than for younger (and typically less wealthy) savers.
The reality is that there is little opportunity for return without volatility. Therefore, the bogeyman effect of holding long-term savings in cash to avoid volatility (the financial equivalent of hiding under the sheets) is detrimental to achieving long-term goals. This effect tends to be more pronounced during the episodic spikes in volatility. The significant spike in volatility in 2008 and 2009 led to significant withdrawals from long-term investment funds over the same period. Less pronounced effects can also be seen when comparing 2001 – 2003 and 2011 – 2012. Conversely, flows picked up when volatility returned to "normal" levels. Investor behavior of this type is consistent with the three behavioral biases.
I believe average volatility will be higher over the next 10 years than the last 10 years and episodic spikes will increase in frequency because sustainable economic growth will be structurally lower and geopolitical risk higher than any time since World War II. Low growth creates uncertainty while loss aversion will make investors fear that we are one economic mishap or geopolitical event away from no growth or recession. The result will be higher volatility on average. Negativity bias will tend to exacerbate "spike" reactions to event-driven geopolitical news, and the volatility bogeyman will appear more often. Assuming the behavioral biases continue, investor returns are likely to be very disappointing regardless of the total return generated by financial markets due to the bogeyman effect.
To mitigate this effect, we need to focus on portfolio construction and an improved understanding of diversification. I accept that equities are likely to offer the highest return over the next 10 years, but they also offer the highest volatility. Many portfolio construction optimization tools use historical average volatility, which is likely to underestimate the volatility investors will face. The bogeyman emerges when individual asset class volatility spikes and cross correlations rise, the combination of which increases overall portfolio volatility far beyond expectation. Diversification is meant to protect investors against volatility, but what's the point of owning lots of investments if the volatility bogeyman has not been properly estimated?
Most importantly, portfolios should be constructed to properly represent the behavioral risk-return trade off of investors, remembering that they won't stay invested to realize the return if we get the risk tolerance wrong. In a low growth, higher volatility world, the emphasis is shifting to return consistency rather than return maximization,
PRESIDENT'S MESSAGE (continued)
and investors are best served through investment approaches that appreciate that distinction. Even though it's a permanent feature of financial markets, volatility is less likely to be the bogeyman we all fear if portfolios are constructed with this understanding.
Please visit blog.columbiathreadneedleus.com/latest-perspectives to read the entire article.
Investors should consider the investment objectives, risks, charges and expenses of a mutual fund carefully before investing. For a free prospectus and summary prospectus, which contains this and other important information about a fund, visit investor.columbiathreadneedleus.com. The prospectus should be read carefully before investing.
The views expressed are as of April 2016, may change as market or other conditions change, and may differ from views expressed by other Columbia Management Investment Advisers, LLC (CMIA) associates or affiliates. Actual investments or investment decisions made by CMIA and its affiliates, whether for its own account or on behalf of clients, will not necessarily reflect the views expressed. This information is not intended to provide investment advice and does not account for individual investor circumstances. Investment decisions should always be made based on an investor's specific financial needs, objectives, goals, time horizon and risk tolerance. Asset classes described may not be suitable for all investors.
Past performance does not guarantee future results, and no forecast should be considered a guarantee either. Since economic and market conditions change frequently, there can be no assurance that the trends described here will continue or that the forecasts are accurate.
Diversification does not guarantee a profit or protect against loss.
Columbia Funds are distributed by Columbia Management Investment Distributors, Inc., member FINRA, and managed by Columbia Management Investment Advisers, LLC.
© 2016 Columbia Management Investment Advisers, LLC. All rights reserved.
COLUMBIA LARGE CAP GROWTH FUND
Performance Overview | | | 2 | | |
Manager Discussion of Fund Performance | | | 4 | | |
Understanding Your Fund's Expenses | | | 6 | | |
Portfolio of Investments | | | 7 | | |
Statement of Assets and Liabilities | | | 11 | | |
Statement of Operations | | | 14 | | |
Statement of Changes in Net Assets | | | 15 | | |
Financial Highlights | | | 19 | | |
Notes to Financial Statements | | | 33 | | |
Report of Independent Registered Public Accounting Firm | | | 42 | | |
Federal Income Tax Information | | | 43 | | |
Trustees and Officers | | | 44 | | |
Board Consideration and Approval of Management Agreement | | | 49 | | |
Important Information About This Report | | | 53 | | |
Fund Investment Manager
Columbia Management Investment
Advisers, LLC
225 Franklin Street
Boston, MA 02110
Fund Distributor
Columbia Management Investment
Distributors, Inc.
225 Franklin Street
Boston, MA 02110
Fund Transfer Agent
Columbia Management Investment
Services Corp.
P.O. Box 8081
Boston, MA 02266-8081
For more information about any of the funds, please visit investor.columbiathreadneedleus.com or call 800.345.6611. Customer Service Representatives are available to answer your questions Monday through Friday from 8 a.m. to 7 p.m. Eastern time.
The views expressed in this report reflect the current views of the respective parties. These views are not guarantees of future performance and involve certain risks, uncertainties and assumptions that are difficult to predict, so actual outcomes and results may differ significantly from the views expressed. These views are subject to change at any time based upon economic, market or other conditions and the respective parties disclaim any responsibility to update such views. These views may not be relied on as investment advice and, because investment decisions for a Columbia fund are based on numerous factors, may not be relied on as an indication of trading intent on behalf of any particular Columbia fund. References to specific securities should not be construed as a recommendation or investment advice.
COLUMBIA LARGE CAP GROWTH FUND
Performance Summary
n Columbia Large Cap Growth Fund (the Fund) Class A shares returned -0.99% excluding sales charges for the 12-month period that ended July 31, 2016.
n The Fund underperformed its benchmark, the Russell 1000 Growth Index, which returned 4.35% for the same time period.
n Some of the Fund's previous best performers pulled back during the most recent 12-month period, with particular underperformance in biotechnology and information technology.
Average Annual Total Returns (%) (for period ended July 31, 2016)
| | | Inception | | 1 Year | | 5 Years | | 10 Years | |
Class A | | 11/01/98 | | | | | | | | | | | | | |
Excluding sales charges | | | | | | | -0.99 | | | | 12.67 | | | | 8.67 | | |
Including sales charges | | | | | | | -6.69 | | | | 11.34 | | | | 8.03 | | |
Class B | | 11/01/98 | | | | | | | | | | | | | |
Excluding sales charges | | | | | | | -1.73 | | | | 11.82 | | | | 7.86 | | |
Including sales charges | | | | | | | -6.11 | | | | 11.56 | | | | 7.86 | | |
Class C | | 11/18/02 | | | | | | | | | | | | | |
Excluding sales charges | | | | | | | -1.73 | | | | 11.83 | | | | 7.85 | | |
Including sales charges | | | | | | | -2.60 | | | | 11.83 | | | | 7.85 | | |
Class E* | | 09/22/06 | | | | | | | | | | | | | |
Excluding sales charges | | | | | | | -1.08 | | | | 12.56 | | | | 8.56 | | |
Including sales charges | | | | | | | -5.53 | | | | 11.53 | | | | 8.07 | | |
Class F* | | 09/22/06 | | | | | | | | | | | | | |
Excluding sales charges | | | | | | | -1.70 | | | | 11.83 | | | | 7.86 | | |
Including sales charges | | | | | | | -6.09 | | | | 11.57 | | | | 7.86 | | |
Class I* | | 09/27/10 | | | -0.58 | | | | 13.17 | | | | 9.06 | | |
Class K* | | 03/07/11 | | | -0.86 | | | | 12.84 | | | | 8.82 | | |
Class R* | | 09/27/10 | | | -1.22 | | | | 12.39 | | | | 8.38 | | |
Class R4* | | 11/08/12 | | | -0.76 | | | | 12.96 | | | | 8.94 | | |
Class R5* | | 03/07/11 | | | -0.64 | | | | 13.12 | | | | 9.03 | | |
Class T | | 12/14/90 | | | | | | | | | | | | | |
Excluding sales charges | | | | | | | -0.97 | | | | 12.64 | | | | 8.62 | | |
Including sales charges | | | | | | | -6.66 | | | | 11.31 | | | | 7.98 | | |
Class W* | | 09/27/10 | | | -0.96 | | | | 12.69 | | | | 8.71 | | |
Class Y* | | 07/15/09 | | | -0.58 | | | | 13.18 | | | | 9.09 | | |
Class Z | | 12/14/90 | | | -0.74 | | | | 12.95 | | | | 8.94 | | |
Russell 1000 Growth Index | | | | | | | 4.35 | | | | 13.62 | | | | 9.50 | | |
Returns for Class A and T are shown with and without the maximum initial sales charge of 5.75%. Returns for Class E are shown with and without the maximum sales charge of 4.50%. Returns for Class B and Class F are shown with and without the applicable contingent deferred sales charge (CDSC) of 5.00% in the first year, declining to 1.00% in the sixth year and eliminated thereafter. Returns for Class C are shown with and without the 1.00% CDSC for the first year only. The Fund's other classes are not subject to sales charges and have limited eligibility. Please see the Fund's prospectus for details. Performance for different share classes will vary based on differences in sales charges and fees associated with each class. All results shown assume reinvestment of distributions during the period. Returns do not reflect the deduction of taxes that a shareholder may pay on Fund distributions or on the redemption of Fund shares. Performance results reflect the effect of any fee waivers or reimbursements of Fund expenses by Columbia Management Investment Advisers, LLC and/or any of its affiliates. Absent these fee waivers or expense reimbursement arrangements, performance results would have been lower.
Annual Report 2016
2
COLUMBIA LARGE CAP GROWTH FUND
PERFORMANCE OVERVIEW (continued)
The performance information shown represents past performance and is not a guarantee of future results. The investment return and principal value of your investment will fluctuate so that your shares, when redeemed, may be worth more or less than their original cost. Current performance may be lower or higher than the performance information shown. You may obtain performance information current to the most recent month-end by contacting your financial intermediary, visiting investor.columbiathreadneedleus.com or calling 800.345.6611.
*The returns shown for periods prior to the share class inception date (including returns for the Life of the Fund, if shown, which are since Fund inception) include the returns of the Fund's oldest share class. Since the Fund launched more than one share class at its inception, Class Z shares were used. These returns are adjusted to reflect any higher class-related operating expenses of the newer share classes, as applicable. Please visit investor.columbiathreadneedle.com/us/investment-products/mutual-funds/appended-performance for more information.
The Russell 1000 Growth Index, an unmanaged index, measures the performance of those Russell 1000 Index companies with higher price-to-book ratios and higher forecasted growth values.
Indices are not available for investment, are not professionally managed and do not reflect sales charges, fees, brokerage commissions, taxes, which reflects reinvested dividends net of withholding taxes) or other expenses of investing. Securities in the Fund may not match those in an index.
Performance of a Hypothetical $10,000 Investment (August 1, 2006 – July 31, 2016)
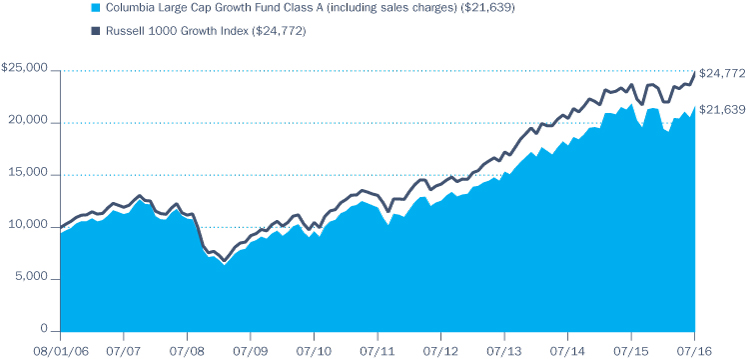
The chart above shows the change in value of a hypothetical $10,000 investment in Class A shares of Columbia Large Cap Growth Fund during the stated time period, and does not reflect the deduction of taxes that a shareholder may pay on Fund distributions or on the redemption of Fund shares.
Annual Report 2016
3
COLUMBIA LARGE CAP GROWTH FUND
MANAGER DISCUSSION OF FUND PERFORMANCE
Portfolio Management
John Wilson, CFA
Peter Deininger, CFA, CAIA
Tchintcia Barros, CFA
Morningstar Style BoxTM
The Morningstar Style BoxTM is based on a fund's portfolio holdings. For equity funds, the vertical axis shows the market capitalization of the stocks owned, and the horizontal axis shows investment style (value, blend, or growth). Information shown is based on the most recent data provided by Morningstar.
© 2016 Morningstar, Inc. All rights reserved. The Morningstar information contained herein: (1) is proprietary to Morningstar and/or its content providers; (2) may not be copied or distributed; and (3) is not warranted to be accurate, complete or timely. Neither Morningstar nor its content providers are responsible for any damages or losses arising from any use of this information.
Top Ten Holdings (%)
(at July 31, 2016) | |
Amazon.com, Inc. | | | 4.0 | | |
Microsoft Corp. | | | 3.9 | | |
Facebook, Inc., Class A | | | 3.9 | | |
Apple, Inc. | | | 3.3 | | |
Comcast Corp., Class A | | | 3.1 | | |
Alphabet, Inc., Class A | | | 3.0 | | |
Visa, Inc., Class A | | | 2.8 | | |
Lowe's Companies, Inc. | | | 2.7 | | |
Alphabet, Inc., Class C | | | 2.4 | | |
PepsiCo, Inc. | | | 2.3 | | |
Percentages indicated are based upon total investments (excluding Money Market Funds).
For further detail about these holdings, please refer to the section entitled "Portfolio of Investments."
For the 12-month period that ended July 31, 2016, the Fund's Class A shares returned -0.99%, excluding sales charge. The Fund underperformed its benchmark, the Russell 1000 Growth Index, which returned 4.35% over the same period. Some of the Fund's best performers over the past two years pulled back during the most recent 12-month period, with underperformance concentrated in the biotechnology segment of health care and the information technology sector. Financials and consumer staples stocks also detracted from relative results.
Uncertainty Weighed on Investors in Volatile Market
Lackluster economic growth, contentious geopolitical conflicts and expectations of a shift in U.S. monetary policy weighed on investors in the first half of the 12-month period ended July 31, 2016. In December 2015, the Federal Reserve (the Fed) raised the target range of its benchmark interest rate by a quarter of a point. But the Fed took no further action during the period as subpar global economic growth continued, with China's slowdown heading the list of disappointments. Conflicts in the Middle East and terrorism, both at home and abroad, heightened security fears. Plummeting oil prices and a rising U.S. dollar rounded the list of mounting pressures in 2015.
However, both oil and the U.S. dollar reversed course in the first seven months of 2016. The U.S. economy continued to expand modestly, and economic growth in Europe picked up, if ever so slightly. The U.S. manufacturing sector regained some traction in the spring, and the U.S. labor markets recovered to full employment for the first time since the Great Recession. The U.K'.s vote to exit the European Union gave markets a jolt in mid-June, but that downdraft was short lived.
Against this backdrop, stocks pulled back three times during the 12-month period. Despite these major downdrafts, the S&P 500 Index rose 5.61% for the 12 months ended July 31, 2016. Bond markets drew cautious investors and prices rose across all sectors as yields fell on bonds with maturities between two and 30 years. Bonds with the longest maturities defied expectations as yields declined sharply. The Barclays U.S. Aggregate Bond Index, a broad measure of investment-grade bond performance, rose 5.94% for the period.
Contributors and Detractors
In the consumer discretionary sector, overweight positions in Amazon.com, Lowe's Companies and Comcast aided performance relative to the benchmark. Amazon.com experienced strong growth across many financial metrics: revenues, cash flow, new users of Prime and the company's cloud hosting services, called Amazon Web Services. Comcast continued to experience solid customer acquisition growth, stable revenues and cash flow in their core video and broadband services. Cash flow from the company's Universal theme parks, including new Harry Potter attractions, also aided results. Lowe's Companies reported solid same-store sales figures and improved margins. The home improvement category has been more internet-resistant than most other retail categories because of the nature much of its product offerings. The Fund also gained ground against the benchmark because it had no exposure
Annual Report 2016
4
COLUMBIA LARGE CAP GROWTH FUND
MANAGER DISCUSSION OF FUND PERFORMANCE (continued)
to either Disney or Netflix, both of which lost considerable ground during the 12-month period.
These strong performances were not enough to offset significant disappointments from certain biotechnology and information technology names that had been performance leaders in the two previous years. Biotechnology holdings Alkermes, Alexion Pharmaceuticals and Celgene were down sharply for the year. Alkermes, a biopharmaceutical company that focuses on central nervous system diseases, took a significant hit after one of the company's most promising drugs suffered an unexpected trial failure. We sold the stock. Alexion Pharmaceuticals, which develops therapies for patients with rare diseases, was another weak performer. Concerns about the pace of new product adoption hurt Celgene. Early in 2016, we reduced the Fund's weight in health care to bring it more in line with the benchmark, a move that limited the impact of the health care downturn on the Fund's results. In the information technology sector, shares of Palo Alto Networks, a network security company, fell on concerns about technology spending in light of a global slowdown in growth. Skyworks Solutions and Qorvo, companies tied to Apple handset production, also detracted from relative results. Strong returns from overweight positions in Facebook and NVIDIA were not enough to offset these disappointments. NVIDIA makes semiconductor chips for emerging growth applications, such as data centers, car automation and virtual reality. The company has delivered above-consensus revenues and earnings growth.
Within financials, an overweight in asset managers also detracted from relative results. In particular, a position in Invesco was a drag on returns as the company had disproportionate exposure to the United Kingdom and took a hit late in the period as the United Kingdom voted to exit the European Union. Despite owning Simon Property Group, a large mall-based real estate investment trust (REIT), the Fund's underexposure to REITs detracted from results as the category did well in an environment of falling interest rates. Within the consumer staples sector, CVS Health Corp. was a laggard after some very strong performance in 2015. Investors questioned the sustainability of the company's growth rate. We trimmed the Fund's position.
At Period End
During the fiscal year, we added to selected health care names with investments in Abbvie, Zimmer Biomet Holdings and Edwards Lifesciences. Abbvie is a spin-off of Abbott Laboratories that discovers, develops, and markets both biopharmaceuticals and small molecule drugs. Investments in Zimmer Biomet Holdings and Edwards Lifesciences augmented the Fund's overweight in medical technology companies. We believed that consolidation in the industry has led to modestly improved pricing and the potential for margin expansion. At the end of the period, the Fund remained modestly overweight in health care and overweight in information technology stocks, where we continued to find good ideas in semiconductor, software and internet-related stocks. Overall, our strategy has remained unchanged: We continue to look for ideas where our internal research conviction is high and we can find a differentiated research view, and we seek opportunities in companies that have the potential to consistently drive organic revenue and earnings growth in an environment of slow economic growth and earnings scarcity.
Fund holdings are as of the date given, are subject to change at any time, and are not recommendations to buy or sell any security.
Portfolio Breakdown (%)
(at July 31, 2016) | |
Common Stocks | | | 96.7 | | |
Money Market Funds | | | 3.3 | | |
Warrants | | | 0.0 | (a) | |
Total | | | 100.0 | | |
Percentages indicated are based upon total investments. The Fund's portfolio composition is subject to change.
(a) Rounds to zero.
Equity Sector Breakdown (%)
(at July 31, 2016) | |
Consumer Discretionary | | | 21.9 | | |
Consumer Staples | | | 9.5 | | |
Energy | | | 0.9 | | |
Financials | | | 5.9 | | |
Health Care | | | 18.3 | | |
Industrials | | | 8.5 | | |
Information Technology | | | 33.8 | | |
Materials | | | 1.2 | | |
Total | | | 100.0 | | |
Percentages indicated are based upon total equity investments. The Fund's portfolio composition is subject to change.
Investment Risks
Market risk may affect a single issuer, sector of the economy, industry or the market as a whole. Growth securities, at times, may not perform as well as value securities or the stock market in general and may be out of favor with investors. Foreign investments subject the Fund to risks, including political, economic, market, social and others within a particular country, as well as to currency instabilities and less stringent financial and accounting standards generally applicable to U.S. issuers. The Fund may invest significantly in issuers within a particular sector, which may be negatively affected by market, economic or other conditions, making the Fund more vulnerable to unfavorable developments in the sector. See the Fund's prospectus for more information on these and other risks.
Annual Report 2016
5
COLUMBIA LARGE CAP GROWTH FUND
UNDERSTANDING YOUR FUND'S EXPENSES
(Unaudited)
As an investor, you incur two types of costs. There are transaction costs, which generally include sales charges on purchases and may include redemption fees. There are also ongoing costs, which generally include management fees, distribution and/or service fees, and other fund expenses. The following information is intended to help you understand your ongoing costs (in dollars) of investing in the Fund and to help you compare these costs with the ongoing costs of investing in other mutual funds.
Analyzing Your Fund's Expenses
To illustrate these ongoing costs, we have provided examples and calculated the expenses paid by investors in each share class of the Fund during the period. The actual and hypothetical information in the table is based on an initial investment of $1,000 at the beginning of the period indicated and held for the entire period. Expense information is calculated two ways and each method provides you with different information. The amount listed in the "Actual" column is calculated using the Fund's actual operating expenses and total return for the period. You may use the Actual information, together with the amount invested, to estimate the expenses that you paid over the period. Simply divide your account value by $1,000 (for example, an $8,600 account value divided by $1,000 = 8.6), then multiply the results by the expenses paid during the period under the "Actual" column. The amount listed in the "Hypothetical" column assumes a 5% annual rate of return before expenses (which is not the Fund's actual return) and then applies the Fund's actual expense ratio for the period to the hypothetical return. You should not use the hypothetical account values and expenses to estimate either your actual account balance at the end of the period or the expenses you paid during the period. See "Compare With Other Funds" below for details on how to use the hypothetical data.
Compare With Other Funds
Since all mutual funds are required to include the same hypothetical calculations about expenses in shareholder reports, you can use this information to compare the ongoing cost of investing in the Fund with other funds. To do so, compare the hypothetical example with the 5% hypothetical examples that appear in the shareholder reports of other funds. As you compare hypothetical examples of other funds, it is important to note that hypothetical examples are meant to highlight the ongoing costs of investing in a fund only and do not reflect any transaction costs, such as sales charges, or redemption or exchange fees. Therefore, the hypothetical calculations are useful in comparing ongoing costs only, and will not help you determine the relative total costs of owning different funds. If transaction costs were included in these calculations, your costs would be higher.
February 1, 2016 – July 31, 2016
| | | Account Value at the Beginning
of the Period ($) | | Account Value at the End of the
Period ($) | | Expenses Paid During the
Period ($) | | Fund's Annualized
Expense Ratio (%) | |
| | | Actual | | Hypothetical | | Actual | | Hypothetical | | Actual | | Hypothetical | | Actual | |
Class A | | | 1,000.00 | | | | 1,000.00 | | | | 1,114.00 | | | | 1,019.34 | | | | 5.83 | | | | 5.57 | | | | 1.11 | | |
Class B | | | 1,000.00 | | | | 1,000.00 | | | | 1,109.70 | | | | 1,015.61 | | | | 9.76 | | | | 9.32 | | | | 1.86 | | |
Class C | | | 1,000.00 | | | | 1,000.00 | | | | 1,110.00 | | | | 1,015.61 | | | | 9.76 | | | | 9.32 | | | | 1.86 | | |
Class E | | | 1,000.00 | | | | 1,000.00 | | | | 1,113.30 | | | | 1,018.85 | | | | 6.36 | | | | 6.07 | | | | 1.21 | | |
Class F | | | 1,000.00 | | | | 1,000.00 | | | | 1,110.10 | | | | 1,015.61 | | | | 9.76 | | | | 9.32 | | | | 1.86 | | |
Class I | | | 1,000.00 | | | | 1,000.00 | | | | 1,116.10 | | | | 1,021.43 | | | | 3.63 | | | | 3.47 | | | | 0.69 | | |
Class K | | | 1,000.00 | | | | 1,000.00 | | | | 1,114.80 | | | | 1,019.94 | | | | 5.21 | | | | 4.97 | | | | 0.99 | | |
Class R | | | 1,000.00 | | | | 1,000.00 | | | | 1,112.80 | | | | 1,018.10 | | | | 7.14 | | | | 6.82 | | | | 1.36 | | |
Class R4 | | | 1,000.00 | | | | 1,000.00 | | | | 1,115.30 | | | | 1,020.59 | | | | 4.52 | | | | 4.32 | | | | 0.86 | | |
Class R5 | | | 1,000.00 | | | | 1,000.00 | | | | 1,116.00 | | | | 1,021.03 | | | | 4.05 | | | | 3.87 | | | | 0.77 | | |
Class T | | | 1,000.00 | | | | 1,000.00 | | | | 1,114.20 | | | | 1,019.34 | | | | 5.83 | | | | 5.57 | | | | 1.11 | | |
Class W | | | 1,000.00 | | | | 1,000.00 | | | | 1,114.10 | | | | 1,019.34 | | | | 5.83 | | | | 5.57 | | | | 1.11 | | |
Class Y | | | 1,000.00 | | | | 1,000.00 | | | | 1,116.40 | | | | 1,021.43 | | | | 3.63 | | | | 3.47 | | | | 0.69 | | |
Class Z | | | 1,000.00 | | | | 1,000.00 | | | | 1,115.40 | | | | 1,020.59 | | | | 4.52 | | | | 4.32 | | | | 0.86 | | |
Expenses paid during the period are equal to the annualized expense ratio for each class as indicated above, multiplied by the average account value over the period and then multiplied by the number of days in the Fund's most recent fiscal half year and divided by 366.
Expenses do not include fees and expenses incurred indirectly by the Fund from its investment in underlying funds, including affiliated and non-affiliated pooled investment vehicles, such as mutual funds and exchange-traded funds.
Annual Report 2016
6
COLUMBIA LARGE CAP GROWTH FUND
PORTFOLIO OF INVESTMENTS
July 31, 2016
(Percentages represent value of investments compared to net assets)
Common Stocks 96.9%
Issuer | | Shares | | Value ($) | |
CONSUMER DISCRETIONARY 21.2% | |
Hotels, Restaurants & Leisure 2.3% | |
Norwegian Cruise Line Holdings Ltd.(a) | | | 710,250 | | | | 30,256,650 | | |
Yum! Brands, Inc. | | | 552,770 | | | | 49,428,693 | | |
Total | | | | | 79,685,343 | | |
Household Durables 1.7% | |
Newell Brands, Inc. | | | 1,119,702 | | | | 58,739,567 | | |
Internet & Catalog Retail 6.4% | |
Amazon.com, Inc.(a) | | | 174,305 | | | | 132,264,377 | | |
Ctrip.com International Ltd., ADR(a) | | | 556,406 | | | | 24,298,250 | | |
Expedia, Inc. | | | 187,951 | | | | 21,924,484 | | |
Priceline Group, Inc. (The)(a) | | | 31,594 | | | | 42,677,491 | | |
Total | | | | | 221,164,602 | | |
Media 4.1% | |
Comcast Corp., Class A | | | 1,552,273 | | | | 104,390,359 | | |
DISH Network Corp., Class A(a) | | | 684,148 | | | | 36,547,186 | | |
Total | | | | | 140,937,545 | | |
Multiline Retail 1.8% | |
Dollar General Corp. | | | 427,912 | | | | 40,540,383 | | |
Hudson's Bay Co. | | | 1,545,522 | | | | 19,424,820 | | |
Total | | | | | 59,965,203 | | |
Specialty Retail 4.3% | |
Lowe's Companies, Inc. | | | 1,091,409 | | | | 89,801,133 | | |
TJX Companies, Inc. (The) | | | 711,121 | | | | 58,112,808 | | |
Total | | | | | 147,913,941 | | |
Textiles, Apparel & Luxury Goods 0.6% | |
lululemon athletica, Inc.(a) | | | 280,083 | | | | 21,748,445 | | |
Total Consumer Discretionary | | | | | 730,154,646 | | |
CONSUMER STAPLES 9.2% | |
Beverages 4.4% | |
Coca-Cola European Partners PLC | | | 479,700 | | | | 17,907,201 | | |
Constellation Brands, Inc., Class A | | | 161,108 | | | | 26,523,210 | | |
Molson Coors Brewing Co., Class B | | | 289,200 | | | | 29,544,672 | | |
PepsiCo, Inc. | | | 713,491 | | | | 77,713,440 | | |
Total | | | | | 151,688,523 | | |
Food & Staples Retailing 3.2% | |
CVS Health Corp. | | | 691,081 | | | | 64,077,030 | | |
SYSCO Corp. | | | 871,628 | | | | 45,141,614 | | |
Total | | | | | 109,218,644 | | |
Common Stocks (continued)
Issuer | | Shares | | Value ($) | |
Tobacco 1.6% | |
Philip Morris International, Inc. | | | 542,842 | | | | 54,425,339 | | |
Total Consumer Staples | | | | | 315,332,506 | | |
ENERGY 0.9% | |
Oil, Gas & Consumable Fuels 0.9% | |
Hess Corp. | | | 553,440 | | | | 29,692,056 | | |
Total Energy | | | | | 29,692,056 | | |
FINANCIALS 5.7% | |
Capital Markets 3.4% | |
Bank of New York Mellon Corp. (The) | | | 1,042,070 | | | | 41,057,558 | | |
BlackRock, Inc. | | | 71,839 | | | | 26,311,034 | | |
Goldman Sachs Group, Inc. (The) | | | 134,681 | | | | 21,388,689 | | |
Invesco Ltd. | | | 1,000,704 | | | | 29,200,543 | | |
Total | | | | | 117,957,824 | | |
Real Estate Investment Trusts (REITs) 2.3% | |
American Tower Corp. | | | 299,800 | | | | 34,707,846 | | |
Simon Property Group, Inc. | | | 191,911 | | | | 43,571,474 | | |
Total | | | | | 78,279,320 | | |
Total Financials | | | | | 196,237,144 | | |
HEALTH CARE 17.7% | |
Biotechnology 8.4% | |
AbbVie, Inc. | | | 898,026 | | | | 59,476,262 | | |
Alexion Pharmaceuticals, Inc.(a) | | | 319,934 | | | | 41,143,512 | | |
Biogen, Inc.(a) | | | 178,270 | | | | 51,685,821 | | |
BioMarin Pharmaceutical, Inc.(a) | | | 271,880 | | | | 27,030,310 | | |
Celgene Corp.(a) | | | 403,813 | | | | 45,303,781 | | |
Incyte Corp.(a) | | | 233,207 | | | | 21,037,603 | | |
Novavax, Inc.(a) | | | 1,268,614 | | | | 9,286,255 | | |
Vertex Pharmaceuticals, Inc.(a) | | | 343,365 | | | | 33,306,405 | | |
Total | | | | | 288,269,949 | | |
Health Care Equipment & Supplies 4.6% | |
Edwards Lifesciences Corp.(a) | | | 431,667 | | | | 49,434,505 | | |
Medtronic PLC | | | 628,300 | | | | 55,057,929 | | |
Zimmer Biomet Holdings, Inc. | | | 400,373 | | | | 52,504,915 | | |
Total | | | | | 156,997,349 | | |
Health Care Providers & Services 1.0% | |
Aetna, Inc. | | | 309,442 | | | | 35,650,813 | | |
Life Sciences Tools & Services 1.6% | |
Thermo Fisher Scientific, Inc. | | | 342,248 | | | | 54,362,672 | | |
The accompanying Notes to Financial Statements are an integral part of this statement.
Annual Report 2016
7
COLUMBIA LARGE CAP GROWTH FUND
PORTFOLIO OF INVESTMENTS (continued)
July 31, 2016
Common Stocks (continued)
Issuer | | Shares | | Value ($) | |
Pharmaceuticals 2.1% | |
Bristol-Myers Squibb Co. | | | 990,520 | | | | 74,100,801 | | |
Total Health Care | | | | | 609,381,584 | | |
INDUSTRIALS 8.3% | |
Aerospace & Defense 1.2% | |
L-3 Communications Holdings, Inc. | | | 283,500 | | | | 42,987,105 | | |
Air Freight & Logistics 1.6% | |
FedEx Corp. | | | 334,250 | | | | 54,115,075 | | |
Airlines 1.0% | |
Delta Air Lines, Inc. | | | 880,209 | | | | 34,108,099 | | |
Industrial Conglomerates 0.9% | |
Carlisle Companies, Inc. | | | 313,500 | | | | 32,381,415 | | |
Machinery 2.3% | |
Ingersoll-Rand PLC | | | 589,594 | | | | 39,066,498 | | |
Stanley Black & Decker, Inc. | | | 318,090 | | | | 38,711,553 | | |
Total | | | | | 77,778,051 | | |
Professional Services —% | |
Nielsen Holdings PLC | | | 10,845 | | | | 584,112 | | |
Road & Rail 1.3% | |
Kansas City Southern | | | 447,551 | | | | 43,014,126 | | |
Total Industrials | | | | | 284,967,983 | | |
INFORMATION TECHNOLOGY 32.7% | |
Communications Equipment 0.8% | |
Palo Alto Networks, Inc.(a) | | | 218,316 | | | | 28,575,381 | | |
Internet Software & Services 10.4% | |
Akamai Technologies, Inc.(a) | | | 364,100 | | | | 18,397,973 | | |
Alibaba Group Holding Ltd., ADR(a) | | | 357,342 | | | | 29,473,568 | | |
Alphabet, Inc., Class A(a) | | | 124,719 | | | | 98,695,133 | | |
Alphabet, Inc., Class C(a) | | | 106,073 | | | | 81,547,862 | | |
Facebook, Inc., Class A(a) | | | 1,036,573 | | | | 128,472,858 | | |
Total | | | | | 356,587,394 | | |
IT Services 3.7% | |
Leidos Holdings, Inc. | | | 259,200 | | | | 12,962,592 | | |
PayPal Holdings, Inc.(a) | | | 546,760 | | | | 20,361,343 | | |
Visa, Inc., Class A | | | 1,196,326 | | | | 93,373,244 | | |
Total | | | | | 126,697,179 | | |
Semiconductors & Semiconductor Equipment 4.4% | |
Broadcom Ltd. | | | 325,731 | | | | 52,761,908 | | |
Lam Research Corp. | | | 348,200 | | | | 31,257,914 | | |
Common Stocks (continued)
Issuer | | Shares | | Value ($) | |
NVIDIA Corp. | | | 739,860 | | | | 42,246,006 | | |
NXP Semiconductors NV(a) | | | 288,882 | | | | 24,292,087 | | |
Total | | | | | 150,557,915 | | |
Software 10.3% | |
Electronic Arts, Inc.(a) | | | 924,405 | | | | 70,550,589 | | |
Microsoft Corp. | | | 2,285,738 | | | | 129,555,630 | | |
Mobileye NV(a) | | | 324,500 | | | | 15,546,795 | | |
Red Hat, Inc.(a) | | | 648,760 | | | | 48,845,140 | | |
Salesforce.com, Inc.(a) | | | 702,105 | | | | 57,432,189 | | |
ServiceNow, Inc.(a) | | | 440,767 | | | | 33,022,264 | | |
Total | | | | | 354,952,607 | | |
Technology Hardware, Storage & Peripherals 3.1% | |
Apple, Inc. | | | 1,042,262 | | | | 108,614,123 | | |
Total Information Technology | | | | | 1,125,984,599 | | |
MATERIALS 1.2% | |
Chemicals 1.2% | |
Eastman Chemical Co. | | | 636,959 | | | | 41,548,836 | | |
Total Materials | | | | | 41,548,836 | | |
Total Common Stocks
(Cost: $2,546,497,636) | | | | | 3,333,299,354 | | |
Warrants —%
HEALTH CARE —% | |
Health Care Providers & Services —% | |
HealthSouth Corp.(a) | | | 9,070 | | | | 30,566 | | |
Total Health Care | | | | | 30,566 | | |
Total Warrants
(Cost: $—) | | | | | 30,566 | | |
Money Market Funds 3.3%
| | | Shares | | Value ($) | |
Columbia Short-Term Cash Fund,
0.439%(b)(c) | | | 112,336,461 | | | | 112,336,461 | | |
Total Money Market Funds
(Cost: $112,336,461) | | | | | 112,336,461 | | |
Total Investments
(Cost: $2,658,834,097) | | | | | 3,445,666,381 | | |
Other Assets & Liabilities, Net | | | | | (7,753,607 | ) | |
Net Assets | | | | | 3,437,912,774 | | |
The accompanying Notes to Financial Statements are an integral part of this statement.
Annual Report 2016
8
COLUMBIA LARGE CAP GROWTH FUND
PORTFOLIO OF INVESTMENTS (continued)
July 31, 2016
Notes to Portfolio of Investments
(a) Non-income producing investment.
(b) The rate shown is the seven-day current annualized yield at July 31, 2016.
(c) As defined in the Investment Company Act of 1940, an affiliated company is one in which the Fund owns 5% or more of the company's outstanding voting securities, or a company which is under common ownership or control with the Fund. Holdings and transactions in these affiliated companies during the year ended July 31, 2016 are as follows:
Issuer | | Beginning
Cost ($) | | Received in
Reorganization ($) | | Purchase
Cost ($) | | Proceeds
From Sales ($) | | Ending
Cost ($) | | Dividends —
Affiliated
Issuers ($) | | Value ($) | |
Columbia Short-Term
Cash Fund | | | 152,443,896 | | | | 3,062,475 | | | | 784,989,306 | | | | (828,159,216 | ) | | | 112,336,461 | | | | 382,601 | | | | 112,336,461 | | |
Abbreviation Legend
ADR American Depositary Receipt
Fair Value Measurements
The Fund categorizes its fair value measurements according to a three-level hierarchy that maximizes the use of observable inputs and minimizes the use of unobservable inputs by prioritizing that the most observable input be used when available. Observable inputs are those that market participants would use in pricing an investment based on market data obtained from sources independent of the reporting entity. Unobservable inputs are those that reflect the Fund's assumptions about the information market participants would use in pricing an investment. An investment's level within the fair value hierarchy is based on the lowest level of any input that is deemed significant to the asset's or liability's fair value measurement. The input levels are not necessarily an indication of the risk or liquidity associated with investments at that level. For example, certain U.S. government securities are generally high quality and liquid, however, they are reflected as Level 2 because the inputs used to determine fair value may not always be quoted prices in an active market.
Fair value inputs are summarized in the three broad levels listed below:
> Level 1 — Valuations based on quoted prices for investments in active markets that the Fund has the ability to access at the measurement date (including NAV for open-end mutual funds). Valuation adjustments are not applied to Level 1 investments.
> Level 2 — Valuations based on other significant observable inputs (including quoted prices for similar securities, interest rates, prepayment speeds, credit risks, etc.).
> Level 3 — Valuations based on significant unobservable inputs (including the Fund's own assumptions and judgment in determining the fair value of investments).
Inputs that are used in determining fair value of an investment may include price information, credit data, volatility statistics, and other factors. These inputs can be either observable or unobservable. The availability of observable inputs can vary between investments, and is affected by various factors such as the type of investment, and the volume and level of activity for that investment or similar investments in the marketplace. The inputs will be considered by the Investment Manager, along with any other relevant factors in the calculation of an investment's fair value. The Fund uses prices and inputs that are current as of the measurement date, which may include periods of market dislocations. During these periods, the availability of prices and inputs may be reduced for many investments. This condition could cause an investment to be reclassified between the various levels within the hierarchy.
Certain investments that have been measured at fair value using the net asset value per share (or its equivalent) are not categorized in the fair value hierarchy. The fair value amounts presented in the table are intended to reconcile the fair value hierarchy to the amounts presented in the Portfolio of Investments. The Columbia Short-Term Cash Fund seeks to provide shareholders with maximum current income consistent with liquidity and stability of principal. Investments in Columbia Short-Term Cash Fund may be redeemed on a daily basis without restriction.
Investments falling into the Level 3 category are primarily supported by quoted prices from brokers and dealers participating in the market for those investments. However, these may be classified as Level 3 investments due to lack of market transparency and corroboration to support these quoted prices. Additionally, valuation models may be used as the pricing source for any remaining investments classified as Level 3. These models may rely on one or more significant unobservable inputs and/or significant assumptions by the Investment Manager. Inputs used in valuations may include, but are not limited to, financial statement analysis, capital account balances, discount rates and estimated cash flows, and comparable company data.
Under the direction of the Fund's Board of Trustees (the Board), the Investment Manager's Valuation Committee (the Committee) is responsible for overseeing the valuation procedures approved by the Board. The Committee consists of voting and non-voting members from various groups within the Investment Manager's organization, including operations and accounting, trading and investments, compliance, risk management and legal.
The accompanying Notes to Financial Statements are an integral part of this statement.
Annual Report 2016
9
COLUMBIA LARGE CAP GROWTH FUND
PORTFOLIO OF INVESTMENTS (continued)
July 31, 2016
Fair Value Measurements (continued)
The Committee meets at least monthly to review and approve valuation matters, which may include a description of specific valuation determinations, data regarding pricing information received from approved pricing vendors and brokers and the results of Board-approved valuation control policies and procedures (the Policies). The Policies address, among other things, instances when market quotations are or are not readily available, including recommendations of third party pricing vendors and a determination of appropriate pricing methodologies; events that require specific valuation determinations and assessment of fair value techniques; securities with a potential for stale pricing, including those that are illiquid, restricted, or in default; and the effectiveness of third party pricing vendors, including periodic reviews of vendors. The Committee meets more frequently, as needed, to discuss additional valuation matters, which may include the need to review back-testing results, review time-sensitive information or approve related valuation actions. The Committee reports to the Board, with members of the Committee meeting with the Board at each of its regularly scheduled meetings to discuss valuation matters and actions during the period, similar to those described earlier.
For investments categorized as Level 3, the Committee monitors information similar to that described above, which may include: (i) data specific to the issuer or comparable issuers, (ii) general market or specific sector news and (iii) quoted prices and specific or similar security transactions. The Committee considers this data and any changes from prior periods in order to assess the reasonableness of observable and unobservable inputs, any assumptions or internal models used to value those securities and changes in fair value. This data is also used to corroborate, when available, information received from approved pricing vendors and brokers. Various factors impact the frequency of monitoring this information (which may occur as often as daily). However, the Committee may determine that changes to inputs, assumptions and models are not required as a result of the monitoring procedures performed.
The following table is a summary of the inputs used to value the Fund's investments at July 31, 2016:
| | | Level 1
Quoted Prices in Active
Markets for Identical
Assets ($) | |
Level 2
Other Significant
Observable Inputs ($) | |
Level 3
Significant
Unobservable Inputs ($) | |
Total ($) | |
Investments | |
Common Stocks | |
Consumer Discretionary | | | 730,154,646 | | | | — | | | | — | | | | 730,154,646 | | |
Consumer Staples | | | 315,332,506 | | | | — | | | | — | | | | 315,332,506 | | |
Energy | �� | | 29,692,056 | | | | — | | | | — | | | | 29,692,056 | | |
Financials | | | 196,237,144 | | | | — | | | | — | | | | 196,237,144 | | |
Health Care | | | 609,381,584 | | | | — | | | | — | | | | 609,381,584 | | |
Industrials | | | 284,967,983 | | | | — | | | | — | | | | 284,967,983 | | |
Information Technology | | | 1,125,984,599 | | | | — | | | | — | | | | 1,125,984,599 | | |
Materials | | | 41,548,836 | | | | — | | | | — | | | | 41,548,836 | | |
Total Common Stocks | | | 3,333,299,354 | | | | — | | | | — | | | | 3,333,299,354 | | |
Warrants | |
Health Care | | | 30,566 | | | | — | | | | — | | | | 30,566 | | |
Investments measured at net asset value | |
Money Market Funds | | | — | | | | — | | | | — | | | | 112,336,461 | | |
Total Investments | | | 3,333,329,920 | | | | — | | | | — | | | | 3,445,666,381 | | |
See the Portfolio of Investments for all investment classifications not indicated in the table.
There were no transfers of financial assets between levels during the period.
The accompanying Notes to Financial Statements are an integral part of this statement.
Annual Report 2016
10
COLUMBIA LARGE CAP GROWTH FUND
STATEMENT OF ASSETS AND LIABILITIES
July 31, 2016
Assets | |
Investments, at value | |
Unaffiliated issuers (identified cost $2,546,497,636) | | $ | 3,333,329,920 | | |
Affiliated issuers (identified cost $112,336,461) | | | 112,336,461 | | |
Total investments (identified cost $2,658,834,097) | | | 3,445,666,381 | | |
Cash | | | 50,719 | | |
Receivable for: | |
Investments sold | | | 16,614,415 | | |
Capital shares sold | | | 921,936 | | |
Dividends | | | 2,043,986 | | |
Foreign tax reclaims | | | 69,662 | | |
Prepaid expenses | | | 33,632 | | |
Trustees' deferred compensation plan | | | 195,982 | | |
Other assets | | | 43,170 | | |
Total assets | | | 3,465,639,883 | | |
Liabilities | |
Payable for: | |
Investments purchased | | | 23,668,278 | | |
Capital shares purchased | | | 3,225,684 | | |
Management services fees | | | 62,016 | | |
Distribution and/or service fees | | | 18,176 | | |
Transfer agent fees | | | 281,951 | | |
Plan administration fees | | | 1 | | |
Compensation of board members | | | 13,745 | | |
Chief compliance officer expenses | | | 140 | | |
Other expenses | | | 261,136 | | |
Trustees' deferred compensation plan | | | 195,982 | | |
Total liabilities | | | 27,727,109 | | |
Net assets applicable to outstanding capital stock | | $ | 3,437,912,774 | | |
Represented by | |
Paid-in capital | | $ | 2,623,216,931 | | |
Undistributed net investment income | | | 2,481,733 | | |
Accumulated net realized gain | | | 25,387,511 | | |
Unrealized appreciation (depreciation) on: | |
Investments | | | 786,832,284 | | |
Foreign currency translations | | | (5,685 | ) | |
Total — representing net assets applicable to outstanding capital stock | | $ | 3,437,912,774 | | |
The accompanying Notes to Financial Statements are an integral part of this statement.
Annual Report 2016
11
COLUMBIA LARGE CAP GROWTH FUND
STATEMENT OF ASSETS AND LIABILITIES (continued)
July 31, 2016
Class A | |
Net assets | | $ | 1,809,727,051 | | |
Shares outstanding | | | 53,509,530 | | |
Net asset value per share | | $ | 33.82 | | |
Maximum offering price per share(a) | | $ | 35.88 | | |
Class B | |
Net assets | | $ | 9,750,882 | | |
Shares outstanding | | | 335,892 | | |
Net asset value per share | | $ | 29.03 | | |
Class C | |
Net assets | | $ | 109,091,624 | | |
Shares outstanding | | | 3,753,748 | | |
Net asset value per share | | $ | 29.06 | | |
Class E | |
Net assets | | $ | 14,797,316 | | |
Shares outstanding | | | 439,047 | | |
Net asset value per share | | $ | 33.70 | | |
Maximum offering price per share(b) | | $ | 35.29 | | |
Class F | |
Net assets | | $ | 806,278 | | |
Shares outstanding | | | 27,777 | | |
Net asset value per share | | $ | 29.03 | | |
Class I | |
Net assets | | $ | 149,954,943 | | |
Shares outstanding | | | 4,274,282 | | |
Net asset value per share | | $ | 35.08 | | |
Class K | |
Net assets | | $ | 85,976 | | |
Shares outstanding | | | 2,467 | | |
Net asset value per share | | $ | 34.85 | | |
Class R | |
Net assets | | $ | 24,919,894 | | |
Shares outstanding | | | 740,658 | | |
Net asset value per share | | $ | 33.65 | | |
Class R4 | |
Net assets | | $ | 9,216,606 | | |
Shares outstanding | | | 258,234 | | |
Net asset value per share | | $ | 35.69 | | |
Class R5 | |
Net assets | | $ | 21,788,643 | | |
Shares outstanding | | | 622,167 | | |
Net asset value per share | | $ | 35.02 | | |
The accompanying Notes to Financial Statements are an integral part of this statement.
Annual Report 2016
12
COLUMBIA LARGE CAP GROWTH FUND
STATEMENT OF ASSETS AND LIABILITIES (continued)
July 31, 2016
Class T | |
Net assets | | $ | 179,934,949 | | |
Shares outstanding | | | 5,363,966 | | |
Net asset value per share | | $ | 33.55 | | |
Maximum offering price per share(a) | | $ | 35.60 | | |
Class W | |
Net assets | | $ | 125,353,735 | | |
Shares outstanding | | | 3,699,196 | | |
Net asset value per share | | $ | 33.89 | | |
Class Y | |
Net assets | | $ | 24,529,675 | | |
Shares outstanding | | | 698,875 | | |
Net asset value per share | | $ | 35.10 | | |
Class Z | |
Net assets | | $ | 957,955,202 | | |
Shares outstanding | | | 27,370,625 | | |
Net asset value per share | | $ | 35.00 | | |
(a) The maximum offering price per share is calculated by dividing the net asset value per share by 1.0 minus the maximum sales charge of 5.75%.
(b) The maximum offering price per share is calculated by dividing the net asset value per share by 1.0 minus the maximum sales charge of 4.50%.
The accompanying Notes to Financial Statements are an integral part of this statement.
Annual Report 2016
13
COLUMBIA LARGE CAP GROWTH FUND
STATEMENT OF OPERATIONS
Year Ended July 31, 2016
Net investment income | |
Income: | |
Dividends — unaffiliated issuers | | $ | 36,805,163 | | |
Dividends — affiliated issuers | | | 382,601 | | |
Interest | | | 13 | | |
Foreign taxes withheld | | | (34,805 | ) | |
Total income | | | 37,152,972 | | |
Expenses: | |
Management services fees | | | 22,070,920 | | |
Distribution and/or service fees | |
Class A | | | 4,363,946 | | |
Class B | | | 125,631 | | |
Class C | | | 906,736 | | |
Class E | | | 51,563 | | |
Class F | | | 8,125 | | |
Class R | | | 86,669 | | |
Class T | | | 440,986 | | |
Class W | | | 325,462 | | |
Transfer agent fees | |
Class A | | | 2,859,433 | | |
Class B | | | 20,556 | | |
Class C | | | 148,454 | | |
Class E | | | 24,130 | | |
Class F | | | 1,332 | | |
Class K | | | 52 | | |
Class R | | | 28,522 | | |
Class R4 | | | 11,686 | | |
Class R5 | | | 3,084 | | |
Class T | | | 288,938 | | |
Class W | | | 213,192 | | |
Class Z | | | 1,565,817 | | |
Plan administration fees | |
Class K | | | 262 | | |
Compensation of board members | | | 79,398 | | |
Custodian fees | | | 31,416 | | |
Printing and postage fees | | | 357,448 | | |
Registration fees | | | 205,002 | | |
Audit fees | | | 29,553 | | |
Legal fees | | | 96,489 | | |
Chief compliance officer expenses | | | 1,650 | | |
Other | | | 111,046 | | |
Total expenses | | | 34,457,498 | | |
Expense reductions | | | (30,722 | ) | |
Total net expenses | | | 34,426,776 | | |
Net investment income | | | 2,726,196 | | |
Realized and unrealized gain (loss) — net | |
Net realized gain (loss) on: | |
Investments | | | 54,042,450 | | |
Foreign currency translations | | | 712 | | |
Net realized gain | | | 54,043,162 | | |
Net change in unrealized appreciation (depreciation) on: | |
Investments | | | (94,216,259 | ) | |
Foreign currency translations | | | 1,276 | | |
Net change in unrealized depreciation | | | (94,214,983 | ) | |
Net realized and unrealized loss | | | (40,171,821 | ) | |
Net decrease in net assets from operations | | $ | (37,445,625 | ) | |
The accompanying Notes to Financial Statements are an integral part of this statement.
Annual Report 2016
14
COLUMBIA LARGE CAP GROWTH FUND
STATEMENT OF CHANGES IN NET ASSETS
| | | Year Ended
July 31,
2016 | | Year Ended
July 31,
2015 | |
Operations | |
Net investment income | | $ | 2,726,196 | | | $ | 5,444,189 | | |
Net realized gain | | | 54,043,162 | | | | 402,034,388 | | |
Net change in unrealized appreciation (depreciation) | | | (94,214,983 | ) | | | 254,665,312 | | |
Net increase (decrease) in net assets resulting from operations | | | (37,445,625 | ) | | | 662,143,889 | | |
Distributions to shareholders | |
Net investment income | |
Class A | | | — | | | | (4,224,160 | ) | |
Class E | | | — | | | | (25,566 | ) | |
Class I | | | — | | | | (1,053,124 | ) | |
Class K | | | — | | | | (688 | ) | |
Class R | | | — | | | | (422 | ) | |
Class R4 | | | — | | | | (4,872 | ) | |
Class R5 | | | — | | | | (1,227 | ) | |
Class T | | | — | | | | (380,969 | ) | |
Class W | | | — | | | | (339,410 | ) | |
Class Y | | | — | | | | (18 | ) | |
Class Z | | | — | | | | (4,420,247 | ) | |
Net realized gains | |
Class A | | | (176,100,584 | ) | | | (178,378,477 | ) | |
Class B | | | (1,569,397 | ) | | | (2,682,748 | ) | |
Class C | | | (9,955,129 | ) | | | (8,102,561 | ) | |
Class E | | | (1,496,760 | ) | | | (1,702,793 | ) | |
Class F | | | (92,248 | ) | | | (99,906 | ) | |
Class I | | | (15,622,651 | ) | | | (17,279,907 | ) | |
Class K | | | (10,885 | ) | | | (19,688 | ) | |
Class R | | | (1,563,397 | ) | | | (209,809 | ) | |
Class R4 | | | (684,994 | ) | | | (107,449 | ) | |
Class R5 | | | (493,535 | ) | | | (22,019 | ) | |
Class T | | | (17,926,315 | ) | | | (19,688,881 | ) | |
Class W | | | (13,727,878 | ) | | | (14,332,809 | ) | |
Class Y | | | (880,687 | ) | | | (297 | ) | |
Class Z | | | (95,054,593 | ) | | | (97,491,407 | ) | |
Total distributions to shareholders | | | (335,179,053 | ) | | | (350,569,454 | ) | |
Increase in net assets from capital stock activity | | | 231,083,612 | | | | 208,308,213 | | |
Total increase (decrease) in net assets | | | (141,541,066 | ) | | | 519,882,648 | | |
Net assets at beginning of year | | | 3,579,453,840 | | | | 3,059,571,192 | | |
Net assets at end of year | | $ | 3,437,912,774 | | | $ | 3,579,453,840 | | |
Undistributed (excess of distributions over) net investment income | | $ | 2,481,733 | | | $ | (206,886 | ) | |
The accompanying Notes to Financial Statements are an integral part of this statement.
Annual Report 2016
15
COLUMBIA LARGE CAP GROWTH FUND
STATEMENT OF CHANGES IN NET ASSETS (continued)
| | | Year Ended July 31, 2016 | | Year Ended July 31, 2015 | |
| | | Shares | | Dollars ($) | | Shares | | Dollars ($) | |
Capital stock activity | |
Class A shares | |
Subscriptions(a) | | | 4,613,748 | | | | 155,291,412 | | | | 3,615,277 | | | | 130,987,958 | | |
Fund reorganization | | | 1,462,001 | | | | 46,928,343 | | | | — | | | | — | | |
Distributions reinvested | | | 4,914,876 | | | | 166,712,581 | | | | 5,129,835 | | | | 172,465,036 | | |
Redemptions | | | (7,111,670 | ) | | | (233,158,171 | ) | | | (4,927,952 | ) | | | (176,147,559 | ) | |
Net increase | | | 3,878,955 | | | | 135,774,165 | | | | 3,817,160 | | | | 127,305,435 | | |
Class B shares | |
Subscriptions | | | 14,726 | | | | 434,587 | | | | 17,489 | | | | 557,246 | | |
Distributions reinvested | | | 52,582 | | | | 1,538,539 | | | | 88,438 | | | | 2,622,192 | | |
Redemptions(a) | | | (255,564 | ) | | | (7,325,007 | ) | | | (362,855 | ) | | | (11,407,278 | ) | |
Net decrease | | | (188,256 | ) | | | (5,351,881 | ) | | | (256,928 | ) | | | (8,227,840 | ) | |
Class C shares | |
Subscriptions | | | 937,651 | | | | 27,319,402 | | | | 694,398 | | | | 21,993,332 | | |
Fund reorganization | | | 682,164 | | | | 18,850,494 | | | | — | | | | — | | |
Distributions reinvested | | | 275,189 | | | | 8,060,285 | | | | 214,542 | | | | 6,367,599 | | |
Redemptions | | | (730,303 | ) | | | (20,542,131 | ) | | | (365,117 | ) | | | (11,529,982 | ) | |
Net increase | | | 1,164,701 | | | | 33,688,050 | | | | 543,823 | | | | 16,830,949 | | |
Class E shares | |
Subscriptions(b) | | | 4,323 | | | | 142,437 | | | | 4,677 | | | | 167,093 | | |
Distributions reinvested | | | 44,244 | | | | 1,496,760 | | | | 51,398 | | | | 1,725,434 | | |
Redemptions | | | (49,352 | ) | | | (1,623,621 | ) | | | (61,396 | ) | | | (2,169,645 | ) | |
Net increase/decrease | | | (785 | ) | | | 15,576 | | | | (5,321 | ) | | | (277,118 | ) | |
Class F shares | |
Subscriptions | | | 2,264 | | | | 60,050 | | | | 1,977 | | | | 60,075 | | |
Distributions reinvested | | | 3,153 | | | | 92,248 | | | | 3,370 | | | | 99,906 | | |
Redemptions(b) | | | (3,975 | ) | | | (110,539 | ) | | | (4,620 | ) | | | (145,647 | ) | |
Net increase | | | 1,442 | | | | 41,759 | | | | 727 | | | | 14,334 | | |
Class I shares | |
Subscriptions | | | 35,732 | | | | 1,197,543 | | | | 491,870 | | | | 18,865,971 | | |
Fund reorganization | | | 57 | | | | 1,909 | | | | — | | | | — | | |
Distributions reinvested | | | 445,082 | | | | 15,622,367 | | | | 530,921 | | | | 18,332,686 | | |
Redemptions | | | (822,327 | ) | | | (28,542,209 | ) | | | (1,623,790 | ) | | | (59,746,672 | ) | |
Net decrease | | | (341,456 | ) | | | (11,720,390 | ) | | | (600,999 | ) | | | (22,548,015 | ) | |
Class K shares | |
Distributions reinvested | | | 303 | | | | 10,593 | | | | 581 | | | | 20,031 | | |
Redemptions | | | (2,391 | ) | | | (84,855 | ) | | | (1,744 | ) | | | (63,352 | ) | |
Net decrease | | | (2,088 | ) | | | (74,262 | ) | | | (1,163 | ) | | | (43,321 | ) | |
The accompanying Notes to Financial Statements are an integral part of this statement.
Annual Report 2016
16
COLUMBIA LARGE CAP GROWTH FUND
STATEMENT OF CHANGES IN NET ASSETS (continued)
| | | Year Ended July 31, 2016 | | Year Ended July 31, 2015 | |
| | | Shares | | Dollars ($) | | Shares | | Dollars ($) | |
Capital stock activity (continued) | |
Class R shares | |
Subscriptions | | | 736,094 | | | | 24,428,710 | | | | 107,187 | | | | 3,931,268 | | |
Fund reorganization | | | 8,726 | | | | 278,844 | | | | — | | | | — | | |
Distributions reinvested | | | 7,553 | | | | 255,279 | | | | 3,652 | | | | 122,670 | | |
Redemptions | | | (155,908 | ) | | | (4,944,658 | ) | | | (11,188 | ) | | | (400,351 | ) | |
Net increase | | | 596,465 | | | | 20,018,175 | | | | 99,651 | | | | 3,653,587 | | |
Class R4 shares | |
Subscriptions | | | 183,110 | | | | 6,461,665 | | | | 167,063 | | | | 6,337,410 | | |
Fund reorganization | | | 32,783 | | | | 1,109,895 | | | | — | | | | — | | |
Distributions reinvested | | | 16,895 | | | | 603,811 | | | | 3,186 | | | | 112,015 | | |
Redemptions | | | (139,333 | ) | | | (4,796,960 | ) | | | (26,767 | ) | | | (1,019,257 | ) | |
Net increase | | | 93,455 | | | | 3,378,411 | | | | 143,482 | | | | 5,430,168 | | |
Class R5 shares | |
Subscriptions | | | 558,753 | | | | 18,752,637 | | | | 94,827 | | | | 3,653,684 | | |
Fund reorganization | | | 7,632 | | | | 253,682 | | | | — | | | | — | | |
Distributions reinvested | | | 14,073 | | | | 493,263 | | | | 664 | | | | 22,918 | | |
Redemptions | | | (58,352 | ) | | | (1,989,524 | ) | | | (937 | ) | | | (34,558 | ) | |
Net increase | | | 522,106 | | | | 17,510,058 | | | | 94,554 | | | | 3,642,044 | | |
Class T shares | |
Subscriptions | | | 146,686 | | | | 4,903,647 | | | | 166,177 | | | | 5,626,315 | | |
Distributions reinvested | | | 395,079 | | | | 13,294,402 | | | | 447,540 | | | | 14,934,411 | | |
Redemptions | | | (444,629 | ) | | | (14,713,593 | ) | | | (389,375 | ) | | | (13,869,887 | ) | |
Net increase | | | 97,136 | | | | 3,484,456 | | | | 224,342 | | | | 6,690,839 | | |
Class W shares | |
Subscriptions | | | 828,201 | | | | 28,209,126 | | | | 503,370 | | | | 18,076,640 | | |
Distributions reinvested | | | 403,872 | | | | 13,727,609 | | | | 435,627 | | | | 14,671,906 | | |
Redemptions | | | (1,353,684 | ) | | | (44,175,075 | ) | | | (749,188 | ) | | | (26,937,846 | ) | |
Net increase (decrease) | | | (121,611 | ) | | | (2,238,340 | ) | | | 189,809 | | | | 5,810,700 | | |
Class Y shares | |
Subscriptions | | | 670,208 | | | | 23,098,478 | | | | 71,064 | | | | 2,690,256 | | |
Distributions reinvested | | | 25,076 | | | | 880,426 | | | | — | | | | — | | |
Redemptions | | | (67,229 | ) | | | (2,303,768 | ) | | | (318 | ) | | | (12,230 | ) | |
Net increase | | | 628,055 | | | | 21,675,136 | | | | 70,746 | | | | 2,678,026 | | |
The accompanying Notes to Financial Statements are an integral part of this statement.
Annual Report 2016
17
COLUMBIA LARGE CAP GROWTH FUND
STATEMENT OF CHANGES IN NET ASSETS (continued)
| | | Year Ended July 31, 2016 | | Year Ended July 31, 2015 | |
| | | Shares | | Dollars ($) | | Shares | | Dollars ($) | |
Capital stock activity (continued) | |
Class Z shares | |
Subscriptions | | | 3,416,276 | | | | 117,565,383 | | | | 2,959,312 | | | | 109,067,852 | | |
Fund reorganization | | | 201,114 | | | | 6,678,195 | | | | — | | | | — | | |
Distributions reinvested | | | 1,794,198 | | | | 62,886,686 | | | | 1,979,931 | | | | 68,406,606 | | |
Redemptions | | | (5,092,805 | ) | | | (172,247,565 | ) | | | (2,998,161 | ) | | | (110,126,033 | ) | |
Net increase | | | 318,783 | | | | 14,882,699 | | | | 1,941,082 | | | | 67,348,425 | | |
Total net increase | | | 6,646,902 | | | | 231,083,612 | | | | 6,260,965 | | | | 208,308,213 | | |
(a) Includes conversions of Class B shares to Class A shares, if any.
(b) Includes conversions of Class F shares to Class E shares, if any.
The accompanying Notes to Financial Statements are an integral part of this statement.
Annual Report 2016
18
COLUMBIA LARGE CAP GROWTH FUND
The following tables are intended to help you understand the Fund's financial performance. Certain information reflects financial results for a single share of a class held for the periods shown. Per share net investment income (loss) amounts are calculated based on average shares outstanding during the period. Total return assumes reinvestment of all dividends and distributions, if any. Total return does not reflect payment of sales charges, if any. Total return and portfolio turnover are not annualized for periods of less than one year. The portfolio turnover rate is calculated without regard to purchase and sales transactions of short-term instruments and certain derivatives, if any. If such transactions were included, the Fund's portfolio turnover rate may be higher.
| | | Year Ended July 31, | | Year Ended
September 30, | |
Class A | | 2016 | | 2015 | | 2014 | | 2013 | | 2012(a) | | 2011 | |
Per share data | |
Net asset value, beginning of period | | $ | 37.69 | | | $ | 34.51 | | | $ | 31.25 | | | $ | 25.65 | | | $ | 20.84 | | | $ | 20.64 | | |
Income from investment operations: | |
Net investment income (loss) | | | 0.00 | (b) | | | 0.03 | | | | 0.06 | | | | 0.11 | | | | 0.02 | | | | (0.01 | ) | |
Net realized and unrealized gain (loss) | | | (0.36 | ) | | | 7.24 | | | | 4.90 | | | | 5.55 | | | | 4.82 | | | | 0.25 | (c) | |
Total from investment operations | | | (0.36 | ) | | | 7.27 | | | | 4.96 | | | | 5.66 | | | | 4.84 | | | | 0.24 | | |
Less distributions to shareholders: | |
Net investment income | | | — | | | | (0.09 | ) | | | (0.08 | ) | | | (0.06 | ) | | | (0.03 | ) | | | (0.04 | ) | |
Net realized gains | | | (3.51 | ) | | | (4.00 | ) | | | (1.62 | ) | | | — | | | | — | | | | — | | |
Total distributions to shareholders | | | (3.51 | ) | | | (4.09 | ) | | | (1.70 | ) | | | (0.06 | ) | | | (0.03 | ) | | | (0.04 | ) | |
Proceeds from regulatory settlements | | | — | | | | — | | | | — | | | | — | | | | 0.00 | (b) | | | — | | |
Net asset value, end of period | | $ | 33.82 | | | $ | 37.69 | | | $ | 34.51 | | | $ | 31.25 | | | $ | 25.65 | | | $ | 20.84 | | |
Total return | | | (0.99 | %) | | | 22.51 | % | | | 16.29 | % | | | 22.09 | % | | | 23.22 | % | | | 1.16 | % | |
Ratios to average net assets(d) | |
Total gross expenses | | | 1.10 | % | | | 1.11 | % | | | 1.14 | % | | | 1.18 | % | | | 1.16 | %(e) | | | 1.15 | %(f) | |
Total net expenses(g) | | | 1.10 | %(h) | | | 1.11 | %(h) | | | 1.14 | %(h) | | | 1.18 | %(h) | | | 1.16 | %(e)(h) | | | 1.14 | %(f)(i) | |
Net investment income (loss) | | | 0.01 | % | | | 0.09 | % | | | 0.18 | % | | | 0.40 | % | | | 0.10 | %(e) | | | (0.06 | %) | |
Supplemental data | |
Net assets, end of period (in thousands) | | $ | 1,809,727 | | | $ | 1,870,452 | | | $ | 1,581,112 | | | $ | 1,459,893 | | | $ | 1,316,211 | | | $ | 1,187,715 | | |
Portfolio turnover | | | 45 | % | | | 59 | % | | | 88 | % | | | 104 | % | | | 80 | % | | | 116 | % | |
Notes to Financial Highlights
(a) For the period from October 1, 2011 to July 31, 2012. During the period, the Fund's fiscal year end was changed from September 30 to July 31.
(b) Rounds to zero.
(c) Calculation of the net gain (loss) per share (both realized and unrealized) does not correlate to the aggregate realized and unrealized gain (loss) presented in the Statement of Operations due to the timing of subscriptions and redemptions of Fund shares in relation to fluctuations in the market value of the portfolio.
(d) In addition to the fees and expenses that the Fund bears directly, the Fund indirectly bears a pro rata share of the fees and expenses of any other funds in which it invests. Such indirect expenses are not included in the Fund's reported expense ratios.
(e) Annualized.
(f) Ratios include line of credit interest expense which is less than 0.01%.
(g) Total net expenses include the impact of certain fee waivers/expense reimbursements made by the Investment Manager and certain of its affiliates, if applicable.
(h) The benefits derived from expense reductions had an impact of less than 0.01%.
(i) The benefits derived from expense reductions had an impact of 0.01%.
The accompanying Notes to Financial Statements are an integral part of this statement.
Annual Report 2016
19
COLUMBIA LARGE CAP GROWTH FUND
FINANCIAL HIGHLIGHTS (continued)
| | | Year Ended July 31, | | Year Ended
September 30, | |
Class B | | 2016 | | 2015 | | 2014 | | 2013 | | 2012(a) | | 2011 | |
Per share data | |
Net asset value, beginning of period | | $ | 33.08 | | | $ | 30.88 | | | $ | 28.25 | | | $ | 23.32 | | | $ | 19.04 | | | $ | 18.97 | | |
Income from investment operations: | |
Net investment loss | | | (0.21 | ) | | | (0.20 | ) | | | (0.17 | ) | | | (0.09 | ) | | | (0.12 | ) | | | (0.18 | ) | |
Net realized and unrealized gain (loss) | | | (0.33 | ) | | | 6.40 | | | | 4.42 | | | | 5.02 | | | | 4.40 | | | | 0.25 | (b) | |
Total from investment operations | | | (0.54 | ) | | | 6.20 | | | | 4.25 | | | | 4.93 | | | | 4.28 | | | | 0.07 | | |
Less distributions to shareholders: | |
Net realized gains | | | (3.51 | ) | | | (4.00 | ) | | | (1.62 | ) | | | — | | | | — | | | | — | | |
Total distributions to shareholders | | | (3.51 | ) | | | (4.00 | ) | | | (1.62 | ) | | | — | | | | — | | | | — | | |
Proceeds from regulatory settlements | | | — | | | | — | | | | — | | | | — | | | | 0.00 | (c) | | | — | | |
Net asset value, end of period | | $ | 29.03 | | | $ | 33.08 | | | $ | 30.88 | | | $ | 28.25 | | | $ | 23.32 | | | $ | 19.04 | | |
Total return | | | (1.73 | %) | | | 21.57 | % | | | 15.46 | % | | | 21.14 | % | | | 22.48 | % | | | 0.37 | % | |
Ratios to average net assets(d) | |
Total gross expenses | | | 1.85 | % | | | 1.86 | % | | | 1.89 | % | | | 1.93 | % | | | 1.91 | %(e) | | | 1.90 | %(f) | |
Total net expenses(g) | | | 1.85 | %(h) | | | 1.86 | %(h) | | | 1.89 | %(h) | | | 1.93 | %(h) | | | 1.91 | %(e)(h) | | | 1.89 | %(f)(i) | |
Net investment loss | | | (0.74 | %) | | | (0.62 | %) | | | (0.56 | %) | | | (0.34 | %) | | | (0.64 | %)(e) | | | (0.82 | %) | |
Supplemental data | |
Net assets, end of period (in thousands) | | $ | 9,751 | | | $ | 17,338 | | | $ | 24,117 | | | $ | 34,085 | | | $ | 39,046 | | | $ | 49,290 | | |
Portfolio turnover | | | 45 | % | | | 59 | % | | | 88 | % | | | 104 | % | | | 80 | % | | | 116 | % | |
Notes to Financial Highlights
(a) For the period from October 1, 2011 to July 31, 2012. During the period, the Fund's fiscal year end was changed from September 30 to July 31.
(b) Calculation of the net gain (loss) per share (both realized and unrealized) does not correlate to the aggregate realized and unrealized gain (loss) presented in the Statement of Operations due to the timing of subscriptions and redemptions of Fund shares in relation to fluctuations in the market value of the portfolio.
(c) Rounds to zero.
(d) In addition to the fees and expenses that the Fund bears directly, the Fund indirectly bears a pro rata share of the fees and expenses of any other funds in which it invests. Such indirect expenses are not included in the Fund's reported expense ratios.
(e) Annualized.
(f) Ratios include line of credit interest expense which is less than 0.01%.
(g) Total net expenses include the impact of certain fee waivers/expense reimbursements made by the Investment Manager and certain of its affiliates, if applicable.
(h) The benefits derived from expense reductions had an impact of less than 0.01%.
(i) The benefits derived from expense reductions had an impact of 0.01%.
The accompanying Notes to Financial Statements are an integral part of this statement.
Annual Report 2016
20
COLUMBIA LARGE CAP GROWTH FUND
FINANCIAL HIGHLIGHTS (continued)
| | | Year Ended July 31, | | Year Ended
September 30, | |
Class C | | 2016 | | 2015 | | 2014 | | 2013 | | 2012(a) | | 2011 | |
Per share data | |
Net asset value, beginning of period | | $ | 33.11 | | | $ | 30.90 | | | $ | 28.27 | | | $ | 23.34 | | | $ | 19.06 | | | $ | 18.98 | | |
Income from investment operations: | |
Net investment loss | | | (0.21 | ) | | | (0.21 | ) | | | (0.17 | ) | | | (0.09 | ) | | | (0.12 | ) | | | (0.17 | ) | |
Net realized and unrealized gain (loss) | | | (0.33 | ) | | | 6.42 | | | | 4.42 | | | | 5.02 | | | | 4.40 | | | | 0.25 | (b) | |
Total from investment operations | | | (0.54 | ) | | | 6.21 | | | | 4.25 | | | | 4.93 | | | | 4.28 | | | | 0.08 | | |
Less distributions to shareholders: | |
Net realized gains | | | (3.51 | ) | | | (4.00 | ) | | | (1.62 | ) | | | — | | | | — | | | | — | | |
Total distributions to shareholders | | | (3.51 | ) | | | (4.00 | ) | | | (1.62 | ) | | | — | | | | — | | | | — | | |
Proceeds from regulatory settlements | | | — | | | | — | | | | — | | | | — | | | | 0.00 | (c) | | | — | | |
Net asset value, end of period | | $ | 29.06 | | | $ | 33.11 | | | $ | 30.90 | | | $ | 28.27 | | | $ | 23.34 | | | $ | 19.06 | | |
Total return | | | (1.73 | %) | | | 21.59 | % | | | 15.45 | % | | | 21.12 | % | | | 22.46 | % | | | 0.42 | % | |
Ratios to average net assets(d) | |
Total gross expenses | | | 1.86 | % | | | 1.86 | % | | | 1.89 | % | | | 1.93 | % | | | 1.91 | %(e) | | | 1.88 | %(f) | |
Total net expenses(g) | | | 1.86 | %(h) | | | 1.86 | %(h) | | | 1.89 | %(h) | | | 1.93 | %(h) | | | 1.91 | %(h)(e) | | | 1.87 | %(f)(i) | |
Net investment loss | | | (0.74 | %) | | | (0.67 | %) | | | (0.57 | %) | | | (0.36 | %) | | | (0.65 | %)(e) | | | (0.77 | %) | |
Supplemental data | |
Net assets, end of period (in thousands) | | $ | 109,092 | | | $ | 85,724 | | | $ | 63,200 | | | $ | 52,885 | | | $ | 39,542 | | | $ | 36,860 | | |
Portfolio turnover | | | 45 | % | | | 59 | % | | | 88 | % | | | 104 | % | | | 80 | % | | | 116 | % | |
Notes to Financial Highlights
(a) For the period from October 1, 2011 to July 31, 2012. During the period, the Fund's fiscal year end was changed from September 30 to July 31.
(b) Calculation of the net gain (loss) per share (both realized and unrealized) does not correlate to the aggregate realized and unrealized gain (loss) presented in the Statement of Operations due to the timing of subscriptions and redemptions of Fund shares in relation to fluctuations in the market value of the portfolio.
(c) Rounds to zero.
(d) In addition to the fees and expenses that the Fund bears directly, the Fund indirectly bears a pro rata share of the fees and expenses of any other funds in which it invests. Such indirect expenses are not included in the Fund's reported expense ratios.
(e) Annualized.
(f) Ratios include line of credit interest expense which is less than 0.01%.
(g) Total net expenses include the impact of certain fee waivers/expense reimbursements made by the Investment Manager and certain of its affiliates, if applicable.
(h) The benefits derived from expense reductions had an impact of less than 0.01%.
(i) The benefits derived from expense reductions had an impact of 0.01%.
The accompanying Notes to Financial Statements are an integral part of this statement.
Annual Report 2016
21
COLUMBIA LARGE CAP GROWTH FUND
FINANCIAL HIGHLIGHTS (continued)
| | | Year Ended July 31, | | Year Ended
September 30, | |
Class E | | 2016 | | 2015 | | 2014 | | 2013 | | 2012(a) | | 2011 | |
Per share data | |
Net asset value, beginning of period | | $ | 37.60 | | | $ | 34.44 | | | $ | 31.19 | | | $ | 25.61 | | | $ | 20.80 | | | $ | 20.60 | | |
Income from investment operations: | |
Net investment income (loss) | | | (0.03 | ) | | | (0.00 | )(b) | | | 0.03 | | | | 0.08 | | | | (0.00 | )(b) | | | (0.02 | ) | |
Net realized and unrealized gain (loss) | | | (0.36 | ) | | | 7.22 | | | | 4.89 | | | | 5.53 | | | | 4.81 | | | | 0.24 | (c) | |
Total from investment operations | | | (0.39 | ) | | | 7.22 | | | | 4.92 | | | | 5.61 | | | | 4.81 | | | | 0.22 | | |
Less distributions to shareholders: | |
Net investment income | | | — | | | | (0.06 | ) | | | (0.05 | ) | | | (0.03 | ) | | | — | | | | (0.02 | ) | |
Net realized gains | | | (3.51 | ) | | | (4.00 | ) | | | (1.62 | ) | | | — | | | | — | | | | — | | |
Total distributions to shareholders | | | (3.51 | ) | | | (4.06 | ) | | | (1.67 | ) | | | (0.03 | ) | | | — | | | | (0.02 | ) | |
Proceeds from regulatory settlements | | | — | | | | — | | | | — | | | | — | | | | 0.00 | (b) | | | — | | |
Net asset value, end of period | | $ | 33.70 | | | $ | 37.60 | | | $ | 34.44 | | | $ | 31.19 | | | $ | 25.61 | | | $ | 20.80 | | |
Total return | | | (1.08 | %) | | | 22.37 | % | | | 16.18 | % | | | 21.93 | % | | | 23.13 | % | | | 1.07 | % | |
Ratios to average net assets(d) | |
Total gross expenses | | | 1.20 | % | | | 1.21 | % | | | 1.24 | % | | | 1.28 | % | | | 1.26 | %(e) | | | 1.20 | %(f) | |
Total net expenses(g) | | | 1.20 | %(h) | | | 1.21 | %(h) | | | 1.24 | %(h) | | | 1.28 | %(h) | | | 1.26 | %(h)(e) | | | 1.19 | %(f)(i) | |
Net investment income (loss) | | | (0.09 | %) | | | (0.00 | %)(b) | | | 0.08 | % | | | 0.30 | % | | | (0.00 | %)(b)(e) | | | (0.08 | %) | |
Supplemental data | |
Net assets, end of period (in thousands) | | $ | 14,797 | | | $ | 16,539 | | | $ | 15,333 | | | $ | 14,853 | | | $ | 13,437 | | | $ | 11,784 | | |
Portfolio turnover | | | 45 | % | | | 59 | % | | | 88 | % | | | 104 | % | | | 80 | % | | | 116 | % | |
Notes to Financial Highlights
(a) For the period from October 1, 2011 to July 31, 2012. During the period, the Fund's fiscal year end was changed from September 30 to July 31.
(b) Rounds to zero.
(c) Calculation of the net gain (loss) per share (both realized and unrealized) does not correlate to the aggregate realized and unrealized gain (loss) presented in the Statement of Operations due to the timing of subscriptions and redemptions of Fund shares in relation to fluctuations in the market value of the portfolio.
(d) In addition to the fees and expenses that the Fund bears directly, the Fund indirectly bears a pro rata share of the fees and expenses of any other funds in which it invests. Such indirect expenses are not included in the Fund's reported expense ratios.
(e) Annualized.
(f) Ratios include line of credit interest expense which is less than 0.01%.
(g) Total net expenses include the impact of certain fee waivers/expense reimbursements made by the Investment Manager and certain of its affiliates, if applicable.
(h) The benefits derived from expense reductions had an impact of less than 0.01%.
(i) The benefits derived from expense reductions had an impact of 0.01%.
The accompanying Notes to Financial Statements are an integral part of this statement.
Annual Report 2016
22
COLUMBIA LARGE CAP GROWTH FUND
FINANCIAL HIGHLIGHTS (continued)
| | | Year Ended July 31, | | Year Ended
September 30, | |
Class F | | 2016 | | 2015 | | 2014 | | 2013 | | 2012(a) | | 2011 | |
Per share data | |
Net asset value, beginning of period | | $ | 33.07 | | | $ | 30.87 | | | $ | 28.25 | | | $ | 23.32 | | | $ | 19.04 | | | $ | 18.96 | | |
Income from investment operations: | |
Net investment loss | | | (0.21 | ) | | | (0.21 | ) | | | (0.17 | ) | | | (0.09 | ) | | | (0.12 | ) | | | (0.16 | ) | |
Net realized and unrealized gain (loss) | | | (0.32 | ) | | | 6.41 | | | | 4.41 | | | | 5.02 | | | | 4.40 | | | | 0.24 | (b) | |
Total from investment operations | | | (0.53 | ) | | | 6.20 | | | | 4.24 | | | | 4.93 | | | | 4.28 | | | | 0.08 | | |
Less distributions to shareholders: | |
Net realized gains | | | (3.51 | ) | | | (4.00 | ) | | | (1.62 | ) | | | — | | | | — | | | | — | | |
Total distributions to shareholders | | | (3.51 | ) | | | (4.00 | ) | | | (1.62 | ) | | | — | | | | — | | | | — | | |
Proceeds from regulatory settlements | | | — | | | | — | | | | — | | | | — | | | | 0.00 | (c) | | | — | | |
Net asset value, end of period | | $ | 29.03 | | | $ | 33.07 | | | $ | 30.87 | | | $ | 28.25 | | | $ | 23.32 | | | $ | 19.04 | | |
Total return | | | (1.70 | %) | | | 21.57 | % | | | 15.43 | % | | | 21.14 | % | | | 22.48 | % | | | 0.42 | % | |
Ratios to average net assets(d) | |
Total gross expenses | | | 1.86 | % | | | 1.86 | % | | | 1.89 | % | | | 1.93 | % | | | 1.91 | %(e) | | | 1.85 | %(f) | |
Total net expenses(g) | | | 1.86 | %(h) | | | 1.86 | %(h) | | | 1.89 | %(h) | | | 1.93 | %(h) | | | 1.91 | %(e)(h) | | | 1.84 | %(f)(i) | |
Net investment loss | | | (0.74 | %) | | | (0.66 | %) | | | (0.57 | %) | | | (0.36 | %) | | | (0.65 | %)(e) | | | (0.73 | %) | |
Supplemental data | |
Net assets, end of period (in thousands) | | $ | 806 | | | $ | 871 | | | $ | 791 | | | $ | 859 | | | $ | 655 | | | $ | 484 | | |
Portfolio turnover | | | 45 | % | | | 59 | % | | | 88 | % | | | 104 | % | | | 80 | % | | | 116 | % | |
Notes to Financial Highlights
(a) For the period from October 1, 2011 to July 31, 2012. During the period, the Fund's fiscal year end was changed from September 30 to July 31.
(b) Calculation of the net gain (loss) per share (both realized and unrealized) does not correlate to the aggregate realized and unrealized gain (loss) presented in the Statement of Operations due to the timing of subscriptions and redemptions of Fund shares in relation to fluctuations in the market value of the portfolio.
(c) Rounds to zero.
(d) In addition to the fees and expenses that the Fund bears directly, the Fund indirectly bears a pro rata share of the fees and expenses of any other funds in which it invests. Such indirect expenses are not included in the Fund's reported expense ratios.
(e) Annualized.
(f) Ratios include line of credit interest expense which is less than 0.01%.
(g) Total net expenses include the impact of certain fee waivers/expense reimbursements made by the Investment Manager and certain of its affiliates, if applicable.
(h) The benefits derived from expense reductions had an impact of less than 0.01%.
(i) The benefits derived from expense reductions had an impact of 0.01%.
The accompanying Notes to Financial Statements are an integral part of this statement.
Annual Report 2016
23
COLUMBIA LARGE CAP GROWTH FUND
FINANCIAL HIGHLIGHTS (continued)
| | | Year Ended July 31, | | Year Ended
September 30, | |
Class I | | 2016 | | 2015 | | 2014 | | 2013 | | 2012(a) | | 2011 | |
Per share data | |
Net asset value, beginning of period | | $ | 38.81 | | | $ | 35.43 | | | $ | 32.02 | | | $ | 26.29 | | | $ | 21.37 | | | $ | 21.14 | | |
Income from investment operations: | |
Net investment income | | | 0.15 | | | | 0.19 | | | | 0.21 | | | | 0.25 | | | | 0.11 | | | | 0.11 | | |
Net realized and unrealized gain (loss) | | | (0.37 | ) | | | 7.43 | | | | 5.04 | | | | 5.66 | | | | 4.94 | | | | 0.24 | (b) | |
Total from investment operations | | | (0.22 | ) | | | 7.62 | | | | 5.25 | | | | 5.91 | | | | 5.05 | | | | 0.35 | | |
Less distributions to shareholders: | |
Net investment income | | | — | | | | (0.24 | ) | | | (0.22 | ) | | | (0.18 | ) | | | (0.13 | ) | | | (0.12 | ) | |
Net realized gains | | | (3.51 | ) | | | (4.00 | ) | | | (1.62 | ) | | | — | | | | — | | | | — | | |
Total distributions to shareholders | | | (3.51 | ) | | | (4.24 | ) | | | (1.84 | ) | | | (0.18 | ) | | | (0.13 | ) | | | (0.12 | ) | |
Proceeds from regulatory settlements | | | — | | | | — | | | | — | | | | — | | | | 0.00 | (c) | | | — | | |
Net asset value, end of period | | $ | 35.08 | | | $ | 38.81 | | | $ | 35.43 | | | $ | 32.02 | | | $ | 26.29 | | | $ | 21.37 | | |
Total return | | | (0.58 | %) | | | 23.00 | % | | | 16.84 | % | | | 22.60 | % | | | 23.71 | % | | | 1.61 | % | |
Ratios to average net assets(d) | |
Total gross expenses | | | 0.69 | % | | | 0.69 | % | | | 0.70 | % | | | 0.71 | % | | | 0.72 | %(e) | | | 0.68 | %(f) | |
Total net expenses(g) | | | 0.69 | % | | | 0.69 | % | | | 0.70 | % | | | 0.71 | % | | | 0.72 | %(e) | | | 0.68 | %(f)(h) | |
Net investment income | | | 0.43 | % | | | 0.52 | % | | | 0.62 | % | | | 0.87 | % | | | 0.54 | %(e) | | | 0.46 | % | |
Supplemental data | |
Net assets, end of period (in thousands) | | $ | 149,955 | | | $ | 179,142 | | | $ | 184,811 | | | $ | 220,421 | | | $ | 203,848 | | | $ | 279,510 | | |
Portfolio turnover | | | 45 | % | | | 59 | % | | | 88 | % | | | 104 | % | | | 80 | % | | | 116 | % | |
Notes to Financial Highlights
(a) For the period from October 1, 2011 to July 31, 2012. During the period, the Fund's fiscal year end was changed from September 30 to July 31.
(b) Calculation of the net gain (loss) per share (both realized and unrealized) does not correlate to the aggregate realized and unrealized gain (loss) presented in the Statement of Operations due to the timing of subscriptions and redemptions of Fund shares in relation to fluctuations in the market value of the portfolio.
(c) Rounds to zero.
(d) In addition to the fees and expenses that the Fund bears directly, the Fund indirectly bears a pro rata share of the fees and expenses of any other funds in which it invests. Such indirect expenses are not included in the Fund's reported expense ratios.
(e) Annualized.
(f) Ratios include line of credit interest expense which is less than 0.01%.
(g) Total net expenses include the impact of certain fee waivers/expense reimbursements made by the Investment Manager and certain of its affiliates, if applicable.
(h) The benefits derived from expense reductions had an impact of less than 0.01%.
The accompanying Notes to Financial Statements are an integral part of this statement.
Annual Report 2016
24
COLUMBIA LARGE CAP GROWTH FUND
FINANCIAL HIGHLIGHTS (continued)
| | | Year Ended July 31, | | Year Ended
September 30, | |
Class K | | 2016 | | 2015 | | 2014 | | 2013 | | 2012(a) | | 2011(b) | |
Per share data | |
Net asset value, beginning of period | | $ | 38.68 | | | $ | 35.32 | | | $ | 31.94 | | | $ | 26.24 | | | $ | 21.33 | | | $ | 24.86 | | |
Income from investment operations: | |
Net investment income | | | 0.05 | | | | 0.09 | | | | 0.11 | | | | 0.18 | | | | 0.08 | | | | 0.02 | | |
Net realized and unrealized gain (loss) | | | (0.37 | ) | | | 7.41 | | | | 5.01 | | | | 5.64 | | | | 4.90 | | | | (3.55 | ) | |
Total from investment operations | | | (0.32 | ) | | | 7.50 | | | | 5.12 | | | | 5.82 | | | | 4.98 | | | | (3.53 | ) | |
Less distributions to shareholders: | |
Net investment income | | | — | | | | (0.14 | ) | | | (0.12 | ) | | | (0.12 | ) | | | (0.07 | ) | | | — | | |
Net realized gains | | | (3.51 | ) | | | (4.00 | ) | | | (1.62 | ) | | | — | | | | — | | | | — | | |
Total distributions to shareholders | | | (3.51 | ) | | | (4.14 | ) | | | (1.74 | ) | | | (0.12 | ) | | | (0.07 | ) | | | — | | |
Proceeds from regulatory settlements | | | — | | | | — | | | | — | | | | — | | | | 0.00 | (c) | | | — | | |
Net asset value, end of period | | $ | 34.85 | | | $ | 38.68 | | | $ | 35.32 | | | $ | 31.94 | | | $ | 26.24 | | | $ | 21.33 | | |
Total return | | | (0.86 | %) | | | 22.66 | % | | | 16.47 | % | | | 22.25 | % | | | 23.38 | % | | | (14.20 | %) | |
Ratios to average net assets(d) | |
Total gross expenses | | | 0.99 | % | | | 0.99 | % | | | 1.00 | % | | | 0.96 | % | | | 0.97 | %(e) | | | 0.95 | %(e)(f) | |
Total net expenses(g) | | | 0.99 | % | | | 0.99 | % | | | 1.00 | % | | | 0.96 | % | | | 0.97 | %(e) | | | 0.95 | %(e)(f)(h) | |
Net investment income | | | 0.16 | % | | | 0.23 | % | | | 0.32 | % | | | 0.64 | % | | | 0.40 | %(e) | | | 0.12 | %(e) | |
Supplemental data | |
Net assets, end of period (in thousands) | | $ | 86 | | | $ | 176 | | | $ | 202 | | | $ | 191 | | | $ | 4,270 | | | $ | 46,696 | | |
Portfolio turnover | | | 45 | % | | | 59 | % | | | 88 | % | | | 104 | % | | | 80 | % | | | 116 | % | |
Notes to Financial Highlights
(a) For the period from October 1, 2011 to July 31, 2012. During the period, the Fund's fiscal year end was changed from September 30 to July 31.
(b) Based on operations from March 7, 2011 (commencement of operations) through the stated period end.
(c) Rounds to zero.
(d) In addition to the fees and expenses that the Fund bears directly, the Fund indirectly bears a pro rata share of the fees and expenses of any other funds in which it invests. Such indirect expenses are not included in the Fund's reported expense ratios.
(e) Annualized.
(f) Ratios include line of credit interest expense which is less than 0.01%.
(g) Total net expenses include the impact of certain fee waivers/expense reimbursements made by the Investment Manager and certain of its affiliates, if applicable.
(h) The benefits derived from expense reductions had an impact of less than 0.01%.
The accompanying Notes to Financial Statements are an integral part of this statement.
Annual Report 2016
25
COLUMBIA LARGE CAP GROWTH FUND
FINANCIAL HIGHLIGHTS (continued)
| | | Year Ended July 31, | | Year Ended
September 30, | |
Class R | | 2016 | | 2015 | | 2014 | | 2013 | | 2012(a) | | 2011 | |
Per share data | |
Net asset value, beginning of period | | $ | 37.60 | | | $ | 34.44 | | | $ | 31.18 | | | $ | 25.61 | | | $ | 20.83 | | | $ | 20.64 | | |
Income from investment operations: | |
Net investment income (loss) | | | (0.07 | ) | | | (0.07 | ) | | | (0.02 | ) | | | 0.05 | | | | (0.01 | ) | | | (0.07 | ) | |
Net realized and unrealized gain (loss) | | | (0.37 | ) | | | 7.24 | | | | 4.89 | | | | 5.52 | | | | 4.79 | | | | 0.26 | (b) | |
Total from investment operations | | | (0.44 | ) | | | 7.17 | | | | 4.87 | | | | 5.57 | | | | 4.78 | | | | 0.19 | | |
Less distributions to shareholders: | |
Net investment income | | | — | | | | (0.01 | ) | | | (0.00 | )(c) | | | — | | | | — | | | | — | | |
Net realized gains | | | (3.51 | ) | | | (4.00 | ) | | | (1.62 | ) | | | — | | | | — | | | | — | | |
Total distributions to shareholders | | | (3.51 | ) | | | (4.01 | ) | | | (1.62 | ) | | | — | | | | — | | | | — | | |
Proceeds from regulatory settlements | | | — | | | | — | | | | — | | | | — | | | | 0.00 | (c) | | | — | | |
Increase from payment by affiliate | | | — | | | | — | | | | 0.01 | | | | — | | | | — | | | | — | | |
Net asset value, end of period | | $ | 33.65 | | | $ | 37.60 | | | $ | 34.44 | | | $ | 31.18 | | | $ | 25.61 | | | $ | 20.83 | | |
Total return | | | (1.22 | %) | | | 22.20 | % | | | 16.06 | %(d) | | | 21.75 | % | | | 22.95 | % | | | 0.92 | % | |
Ratios to average net assets(e) | |
Total gross expenses | | | 1.36 | % | | | 1.36 | % | | | 1.39 | % | | | 1.43 | % | | | 1.40 | %(f) | | | 1.41 | %(g) | |
Total net expenses(h) | | | 1.36 | %(i) | | | 1.36 | %(i) | | | 1.39 | %(i) | | | 1.43 | %(i) | | | 1.40 | %(f)(i) | | | 1.40 | %(g)(j) | |
Net investment income (loss) | | | (0.22 | %) | | | (0.20 | %) | | | (0.06 | %) | | | 0.17 | % | | | (0.07 | %)(f) | | | (0.32 | %) | |
Supplemental data | |
Net assets, end of period (in thousands) | | $ | 24,920 | | | $ | 5,421 | | | $ | 1,534 | | | $ | 1,643 | | | $ | 726 | | | $ | 2,002 | | |
Portfolio turnover | | | 45 | % | | | 59 | % | | | 88 | % | | | 104 | % | | | 80 | % | | | 116 | % | |
Notes to Financial Highlights
(a) For the period from October 1, 2011 to July 31, 2012. During the period, the Fund's fiscal year end was changed from September 30 to July 31.
(b) Calculation of the net gain (loss) per share (both realized and unrealized) does not correlate to the aggregate realized and unrealized gain (loss) presented in the Statement of Operations due to the timing of subscriptions and redemptions of Fund shares in relation to fluctuations in the market value of the portfolio.
(c) Rounds to zero.
(d) The Fund received a payment from an affiliate. Had the Fund not received this payment, the total return would have been lower by 0.02%.
(e) In addition to the fees and expenses that the Fund bears directly, the Fund indirectly bears a pro rata share of the fees and expenses of any other funds in which it invests. Such indirect expenses are not included in the Fund's reported expense ratios.
(f) Annualized.
(g) Ratios include line of credit interest expense which is less than 0.01%.
(h) Total net expenses include the impact of certain fee waivers/expense reimbursements made by the Investment Manager and certain of its affiliates, if applicable.
(i) The benefits derived from expense reductions had an impact of less than 0.01%.
(j) The benefits derived from expense reductions had an impact of 0.01%.
The accompanying Notes to Financial Statements are an integral part of this statement.
Annual Report 2016
26
COLUMBIA LARGE CAP GROWTH FUND
FINANCIAL HIGHLIGHTS (continued)
| | | Year Ended July 31, | |
Class R4 | | 2016 | | 2015 | | 2014 | | 2013(a) | |
Per share data | |
Net asset value, beginning of period | | $ | 39.49 | | | $ | 35.98 | | | $ | 32.48 | | | $ | 26.79 | | |
Income from investment operations: | |
Net investment income | | | 0.07 | | | | 0.06 | | | | 0.15 | | | | 0.11 | | |
Net realized and unrealized gain (loss) | | | (0.36 | ) | | | 7.63 | | | | 5.10 | | | | 5.69 | | |
Total from investment operations | | | (0.29 | ) | | | 7.69 | | | | 5.25 | | | | 5.80 | | |
Less distributions to shareholders: | |
Net investment income | | | — | | | | (0.18 | ) | | | (0.15 | ) | | | (0.11 | ) | |
Net realized gains | | | (3.51 | ) | | | (4.00 | ) | | | (1.62 | ) | | | — | | |
Total distributions to shareholders | | | (3.51 | ) | | | (4.18 | ) | | | (1.77 | ) | | | (0.11 | ) | |
Increase from payment by affiliate | | | — | | | | — | | | | 0.02 | | | | — | | |
Net asset value, end of period | | $ | 35.69 | | | $ | 39.49 | | | $ | 35.98 | | | $ | 32.48 | | |
Total return | | | (0.76 | %) | | | 22.80 | % | | | 16.67 | %(b) | | | 21.70 | % | |
Ratios to average net assets(c) | |
Total gross expenses | | | 0.85 | % | | | 0.86 | % | | | 0.89 | % | | | 0.93 | %(d) | |
Total net expenses(e) | | | 0.85 | %(f) | | | 0.86 | %(f) | | | 0.89 | %(f) | | | 0.93 | %(d)(f) | |
Net investment income | | | 0.21 | % | | | 0.17 | % | | | 0.42 | % | | | 0.49 | %(d) | |
Supplemental data | |
Net assets, end of period (in thousands) | | $ | 9,217 | | | $ | 6,506 | | | $ | 766 | | | $ | 33 | | |
Portfolio turnover | | | 45 | % | | | 59 | % | | | 88 | % | | | 104 | % | |
Notes to Financial Highlights
(a) Based on operations from November 8, 2012 (commencement of operations) through the stated period end.
(b) The Fund received a payment from an affiliate. Had the Fund not received this payment, the total return would have been lower by 0.05%.
(c) In addition to the fees and expenses that the Fund bears directly, the Fund indirectly bears a pro rata share of the fees and expenses of any other funds in which it invests. Such indirect expenses are not included in the Fund's reported expense ratios.
(d) Annualized.
(e) Total net expenses include the impact of certain fee waivers/expense reimbursements made by the Investment Manager and certain of its affiliates, if applicable.
(f) The benefits derived from expense reductions had an impact of less than 0.01%.
The accompanying Notes to Financial Statements are an integral part of this statement.
Annual Report 2016
27
COLUMBIA LARGE CAP GROWTH FUND
FINANCIAL HIGHLIGHTS (continued)
| | | Year Ended July 31, | | Year Ended
September 30, | |
Class R5 | | 2016 | | 2015 | | 2014 | | 2013 | | 2012(a) | | 2011(b) | |
Per share data | |
Net asset value, beginning of period | | $ | 38.77 | | | $ | 35.39 | | | $ | 32.00 | | | $ | 26.28 | | | $ | 21.36 | | | $ | 24.86 | | |
Income from investment operations: | |
Net investment income | | | 0.09 | | | | 0.09 | | | | 0.19 | | | | 0.26 | | | | 0.11 | | | | 0.05 | | |
Net realized and unrealized gain (loss) | | | (0.33 | ) | | | 7.51 | | | | 5.02 | | | | 5.64 | | | | 4.94 | | | | (3.55 | ) | |
Total from investment operations | | | (0.24 | ) | | | 7.60 | | | | 5.21 | | | | 5.90 | | | | 5.05 | | | | (3.50 | ) | |
Less distributions to shareholders: | |
Net investment income | | | — | | | | (0.22 | ) | | | (0.20 | ) | | | (0.18 | ) | | | (0.13 | ) | | | — | | |
Net realized gains | | | (3.51 | ) | | | (4.00 | ) | | | (1.62 | ) | | | — | | | | — | | | | — | | |
Total distributions to shareholders | | | (3.51 | ) | | | (4.22 | ) | | | (1.82 | ) | | | (0.18 | ) | | | (0.13 | ) | | | — | | |
Proceeds from regulatory settlements | | | — | | | | — | | | | — | | | | — | | | | 0.00 | (c) | | | — | | |
Net asset value, end of period | | $ | 35.02 | | | $ | 38.77 | | | $ | 35.39 | | | $ | 32.00 | | | $ | 26.28 | | | $ | 21.36 | | |
Total return | | | (0.64 | %) | | | 22.95 | % | | | 16.74 | % | | | 22.59 | % | | | 23.70 | % | | | (14.08 | %) | |
Ratios to average net assets(d) | |
Total gross expenses | | | 0.76 | % | | | 0.75 | % | | | 0.75 | % | | | 0.72 | % | | | 0.73 | %(e) | | | 0.70 | %(e)(f) | |
Total net expenses(g) | | | 0.76 | % | | | 0.75 | % | | | 0.75 | % | | | 0.72 | % | | | 0.73 | %(e) | | | 0.70 | %(e)(f)(h) | |
Net investment income | | | 0.28 | % | | | 0.25 | % | | | 0.57 | % | | | 0.89 | % | | | 0.53 | %(e) | | | 0.37 | %(e) | |
Supplemental data | |
Net assets, end of period (in thousands) | | $ | 21,789 | | | $ | 3,879 | | | $ | 195 | | | $ | 36 | | | $ | 497 | | | $ | 407 | | |
Portfolio turnover | | | 45 | % | | | 59 | % | | | 88 | % | | | 104 | % | | | 80 | % | | | 116 | % | |
Notes to Financial Highlights
(a) For the period from October 1, 2011 to July 31, 2012. During the period, the Fund's fiscal year end was changed from September 30 to July 31.
(b) Based on operations from March 7, 2011 (commencement of operations) through the stated period end.
(c) Rounds to zero.
(d) In addition to the fees and expenses that the Fund bears directly, the Fund indirectly bears a pro rata share of the fees and expenses of any other funds in which it invests. Such indirect expenses are not included in the Fund's reported expense ratios.
(e) Annualized.
(f) Ratios include line of credit interest expense which is less than 0.01%.
(g) Total net expenses include the impact of certain fee waivers/expense reimbursements made by the Investment Manager and certain of its affiliates, if applicable.
(h) The benefits derived from expense reductions had an impact of less than 0.01%.
The accompanying Notes to Financial Statements are an integral part of this statement.
Annual Report 2016
28
COLUMBIA LARGE CAP GROWTH FUND
FINANCIAL HIGHLIGHTS (continued)
| | | Year Ended July 31, | | Year Ended
September 30, | |
Class T | | 2016 | | 2015 | | 2014 | | 2013 | | 2012(a) | | 2011 | |
Per share data | |
Net asset value, beginning of period | | $ | 37.41 | | | $ | 34.27 | | | $ | 31.05 | | | $ | 25.49 | | | $ | 20.69 | | | $ | 20.49 | | |
Income from investment operations: | |
Net investment income (loss) | | | 0.00 | (b) | | | 0.03 | | | | 0.04 | | | | 0.10 | | | | 0.01 | | | | (0.01 | ) | |
Net realized and unrealized gain (loss) | | | (0.35 | ) | | | 7.19 | | | | 4.87 | | | | 5.50 | | | | 4.79 | | | | 0.24 | (c) | |
Total from investment operations | | | (0.35 | ) | | | 7.22 | | | | 4.91 | | | | 5.60 | | | | 4.80 | | | | 0.23 | | |
Less distributions to shareholders: | |
Net investment income | | | — | | | | (0.08 | ) | | | (0.07 | ) | | | (0.04 | ) | | | — | | | | (0.03 | ) | |
Net realized gains | | | (3.51 | ) | | | (4.00 | ) | | | (1.62 | ) | | | — | | | | — | | | | — | | |
Total distributions to shareholders | | | (3.51 | ) | | | (4.08 | ) | | | (1.69 | ) | | | (0.04 | ) | | | — | | | | (0.03 | ) | |
Proceeds from regulatory settlements | | | — | | | | — | | | | — | | | | — | | | | 0.00 | (b) | | | — | | |
Net asset value, end of period | | $ | 33.55 | | | $ | 37.41 | | | $ | 34.27 | | | $ | 31.05 | | | $ | 25.49 | | | $ | 20.69 | | |
Total return | | | (0.97 | %) | | | 22.49 | % | | | 16.21 | % | | | 22.01 | % | | | 23.20 | % | | | 1.12 | % | |
Ratios to average net assets(d) | |
Total gross expenses | | | 1.11 | % | | | 1.13 | % | | | 1.19 | % | | | 1.23 | % | | | 1.21 | %(e) | | | 1.15 | %(f) | |
Total net expenses(g) | | | 1.11 | %(h) | | | 1.13 | %(h) | | | 1.19 | %(h) | | | 1.23 | %(h) | | | 1.21 | %(e)(h) | | | 1.14 | %(f)(i) | |
Net investment income | | | 0.01 | % | | | 0.08 | % | | | 0.13 | % | | | 0.35 | % | | | 0.05 | %(e) | | | (0.03 | %) | |
Supplemental data | |
Net assets, end of period (in thousands) | | $ | 179,935 | | | $ | 197,026 | | | $ | 172,830 | | | $ | 160,462 | | | $ | 146,207 | | | $ | 130,081 | | |
Portfolio turnover | | | 45 | % | | | 59 | % | | | 88 | % | | | 104 | % | | | 80 | % | | | 116 | % | |
Notes to Financial Highlights
(a) For the period from October 1, 2011 to July 31, 2012. During the period, the Fund's fiscal year end was changed from September 30 to July 31.
(b) Rounds to zero.
(c) Calculation of the net gain (loss) per share (both realized and unrealized) does not correlate to the aggregate realized and unrealized gain (loss) presented in the Statement of Operations due to the timing of subscriptions and redemptions of Fund shares in relation to fluctuations in the market value of the portfolio.
(d) In addition to the fees and expenses that the Fund bears directly, the Fund indirectly bears a pro rata share of the fees and expenses of any other funds in which it invests. Such indirect expenses are not included in the Fund's reported expense ratios.
(e) Annualized.
(f) Ratios include line of credit interest expense which is less than 0.01%.
(g) Total net expenses include the impact of certain fee waivers/expense reimbursements made by the Investment Manager and certain of its affiliates, if applicable.
(h) The benefits derived from expense reductions had an impact of less than 0.01%.
(i) The benefits derived from expense reductions had an impact of 0.01%.
The accompanying Notes to Financial Statements are an integral part of this statement.
Annual Report 2016
29
COLUMBIA LARGE CAP GROWTH FUND
FINANCIAL HIGHLIGHTS (continued)
| | | Year Ended July 31, | | Year Ended
September 30, | |
Class W | | 2016 | | 2015 | | 2014 | | 2013 | | 2012(a) | | 2011 | |
Per share data | |
Net asset value, beginning of period | | $ | 37.75 | | | $ | 34.57 | | | $ | 31.26 | | | $ | 25.66 | | | $ | 20.85 | | | $ | 20.64 | | |
Income from investment operations: | |
Net investment income | | | 0.01 | | | | 0.03 | | | | 0.06 | | | | 0.12 | | | | 0.01 | | | | 0.02 | | |
Net realized and unrealized gain (loss) | | | (0.36 | ) | | | 7.24 | | | | 4.91 | | | | 5.54 | | | | 4.82 | | | | 0.23 | (b) | |
Total from investment operations | | | (0.35 | ) | | | 7.27 | | | | 4.97 | | | | 5.66 | | | | 4.83 | | | | 0.25 | | |
Less distributions to shareholders: | |
Net investment income | | | — | | | | (0.09 | ) | | | (0.06 | ) | | | (0.06 | ) | | | (0.02 | ) | | | (0.04 | ) | |
Net realized gains | | | (3.51 | ) | | | (4.00 | ) | | | (1.62 | ) | | | — | | | | — | | | | — | | |
Total distributions to shareholders | | | (3.51 | ) | | | (4.09 | ) | | | (1.68 | ) | | | (0.06 | ) | | | (0.02 | ) | | | (0.04 | ) | |
Proceeds from regulatory settlements | | | — | | | | — | | | | — | | | | — | | | | 0.00 | (c) | | | — | | |
Increase from payment by affiliate | | | — | | | | — | | | | 0.02 | | | | — | | | | — | | | | — | | |
Net asset value, end of period | | $ | 33.89 | | | $ | 37.75 | | | $ | 34.57 | | | $ | 31.26 | | | $ | 25.66 | | | $ | 20.85 | | |
Total return | | | (0.96 | %) | | | 22.47 | % | | | 16.39 | %(d) | | | 22.12 | % | | | 23.19 | % | | | 1.21 | % | |
Ratios to average net assets(e) | |
Total gross expenses | | | 1.10 | % | | | 1.11 | % | | | 1.14 | % | | | 1.14 | % | | | 1.19 | %(f) | | | 1.05 | %(g) | |
Total net expenses(h) | | | 1.10 | %(i) | | | 1.11 | %(i) | | | 1.14 | %(i) | | | 1.14 | %(i) | | | 1.19 | %(f)(i) | | | 1.04 | %(g)(j) | |
Net investment income | | | 0.02 | % | | | 0.09 | % | | | 0.18 | % | | | 0.43 | % | | | 0.07 | %(f) | | | 0.07 | % | |
Supplemental data | |
Net assets, end of period (in thousands) | | $ | 125,354 | | | $ | 144,250 | | | $ | 125,509 | | | $ | 4 | | | $ | 3 | | | $ | 3 | | |
Portfolio turnover | | | 45 | % | | | 59 | % | | | 88 | % | | | 104 | % | | | 80 | % | | | 116 | % | |
Notes to Financial Highlights
(a) For the period from October 1, 2011 to July 31, 2012. During the period, the Fund's fiscal year end was changed from September 30 to July 31.
(b) Calculation of the net gain (loss) per share (both realized and unrealized) does not correlate to the aggregate realized and unrealized gain (loss) presented in the Statement of Operations due to the timing of subscriptions and redemptions of Fund shares in relation to fluctuations in the market value of the portfolio.
(c) Rounds to zero.
(d) The Fund received a payment from an affiliate. Had the Fund not received this payment, the total return would have been lower by 0.06%.
(e) In addition to the fees and expenses that the Fund bears directly, the Fund indirectly bears a pro rata share of the fees and expenses of any other funds in which it invests. Such indirect expenses are not included in the Fund's reported expense ratios.
(f) Annualized.
(g) Ratios include line of credit interest expense which is less than 0.01%.
(h) Total net expenses include the impact of certain fee waivers/expense reimbursements made by the Investment Manager and certain of its affiliates, if applicable.
(i) The benefits derived from expense reductions had an impact of less than 0.01%.
(j) The benefits derived from expense reductions had an impact of 0.01%.
The accompanying Notes to Financial Statements are an integral part of this statement.
Annual Report 2016
30
COLUMBIA LARGE CAP GROWTH FUND
FINANCIAL HIGHLIGHTS (continued)
| | | Year Ended July 31, | | Year Ended
September 30, | |
Class Y | | 2016 | | 2015 | | 2014 | | 2013 | | 2012(a) | | 2011 | |
Per share data | |
Net asset value, beginning of period | | $ | 38.83 | | | $ | 35.44 | | | $ | 32.03 | | | $ | 26.29 | | | $ | 21.36 | | | $ | 21.14 | | |
Income from investment operations: | |
Net investment income | | | 0.13 | | | | 0.07 | | | | 0.22 | | | | 0.25 | | | | 0.11 | | | | 0.11 | | |
Net realized and unrealized gain (loss) | | | (0.35 | ) | | | 7.57 | | | | 5.03 | | | | 5.67 | | | | 4.94 | | | | 0.23 | (b) | |
Total from investment operations | | | (0.22 | ) | | | 7.64 | | | | 5.25 | | | | 5.92 | | | | 5.05 | | | | 0.34 | | |
Less distributions to shareholders: | |
Net investment income | | | — | | | | (0.25 | ) | | | (0.22 | ) | | | (0.18 | ) | | | (0.12 | ) | | | (0.12 | ) | |
Net realized gains | | | (3.51 | ) | | | (4.00 | ) | | | (1.62 | ) | | | — | | | | — | | | | — | | |
Total distributions to shareholders | | | (3.51 | ) | | | (4.25 | ) | | | (1.84 | ) | | | (0.18 | ) | | | (0.12 | ) | | | (0.12 | ) | |
Proceeds from regulatory settlements | | | — | | | | — | | | | — | | | | — | | | | 0.00 | (c) | | | — | | |
Net asset value, end of period | | $ | 35.10 | | | $ | 38.83 | | | $ | 35.44 | | | $ | 32.03 | | | $ | 26.29 | | | $ | 21.36 | | |
Total return | | | (0.58 | %) | | | 23.03 | % | | | 16.84 | % | | | 22.64 | % | | | 23.72 | % | | | 1.56 | % | |
Ratios to average net assets(d) | |
Total gross expenses | | | 0.69 | % | | | 0.71 | % | | | 0.70 | % | | | 0.71 | % | | | 0.72 | %(e) | | | 0.67 | %(f) | |
Total net expenses(g) | | | 0.69 | % | | | 0.71 | % | | | 0.70 | % | | | 0.71 | % | | | 0.72 | %(e) | | | 0.67 | %(f)(h) | |
Net investment income | | | 0.39 | % | | | 0.19 | % | | | 0.66 | % | | | 0.90 | % | | | 0.55 | %(e) | | | 0.48 | % | |
Supplemental data | |
Net assets, end of period (in thousands) | | $ | 24,530 | | | $ | 2,750 | | | $ | 3 | | | $ | 3,826 | | | $ | 14,446 | | | $ | 15,311 | | |
Portfolio turnover | | | 45 | % | | | 59 | % | | | 88 | % | | | 104 | % | | | 80 | % | | | 116 | % | |
Notes to Financial Highlights
(a) For the period from October 1, 2011 to July 31, 2012. During the period, the Fund's fiscal year end was changed from September 30 to July 31.
(b) Calculation of the net gain (loss) per share (both realized and unrealized) does not correlate to the aggregate realized and unrealized gain (loss) presented in the Statement of Operations due to the timing of subscriptions and redemptions of Fund shares in relation to fluctuations in the market value of the portfolio.
(c) Rounds to zero.
(d) In addition to the fees and expenses that the Fund bears directly, the Fund indirectly bears a pro rata share of the fees and expenses of any other funds in which it invests. Such indirect expenses are not included in the Fund's reported expense ratios.
(e) Annualized.
(f) Ratios include line of credit interest expense which is less than 0.01%.
(g) Total net expenses include the impact of certain fee waivers/expense reimbursements made by the Investment Manager and certain of its affiliates, if applicable.
(h) The benefits derived from expense reductions had an impact of less than 0.01%.
The accompanying Notes to Financial Statements are an integral part of this statement.
Annual Report 2016
31
COLUMBIA LARGE CAP GROWTH FUND
FINANCIAL HIGHLIGHTS (continued)
| | | Year Ended July 31, | | Year Ended
September 30, | |
Class Z | | 2016 | | 2015 | | 2014 | | 2013 | | 2012(a) | | 2011 | |
Per share data | |
Net asset value, beginning of period | | $ | 38.79 | | | $ | 35.41 | | | $ | 32.01 | | | $ | 26.28 | | | $ | 21.33 | | | $ | 21.12 | | |
Income from investment operations: | |
Net investment income | | | 0.09 | | | | 0.13 | | | | 0.15 | | | | 0.19 | | | | 0.07 | | | | 0.07 | | |
Net realized and unrealized gain (loss) | | | (0.37 | ) | | | 7.43 | | | | 5.03 | | | | 5.66 | | | | 4.94 | | | | 0.24 | (b) | |
Total from investment operations | | | (0.28 | ) | | | 7.56 | | | | 5.18 | | | | 5.85 | | | | 5.01 | | | | 0.31 | | |
Less distributions to shareholders: | |
Net investment income | | | — | | | | (0.18 | ) | | | (0.16 | ) | | | (0.12 | ) | | | (0.06 | ) | | | (0.10 | ) | |
Net realized gains | | | (3.51 | ) | | | (4.00 | ) | | | (1.62 | ) | | | — | | | | — | | | | — | | |
Total distributions to shareholders | | | (3.51 | ) | | | (4.18 | ) | | | (1.78 | ) | | | (0.12 | ) | | | (0.06 | ) | | | (0.10 | ) | |
Proceeds from regulatory settlements | | | — | | | | — | | | | — | | | | — | | | | 0.00 | (c) | | | — | | |
Net asset value, end of period | | $ | 35.00 | | | $ | 38.79 | | | $ | 35.41 | | | $ | 32.01 | | | $ | 26.28 | | | $ | 21.33 | | |
Total return | | | (0.74 | %) | | | 22.80 | % | | | 16.61 | % | | | 22.34 | % | | | 23.52 | % | | | 1.41 | % | |
Ratios to average net assets(d) | |
Total gross expenses | | | 0.85 | % | | | 0.86 | % | | | 0.89 | % | | | 0.93 | % | | | 0.91 | %(e) | | | 0.85 | %(f) | |
Total net expenses(g) | | | 0.85 | %(h) | | | 0.86 | %(h) | | | 0.89 | %(h) | | | 0.93 | %(h) | | | 0.91 | %(e)(h) | | | 0.84 | %(f)(i) | |
Net investment income | | | 0.26 | % | | | 0.34 | % | | | 0.43 | % | | | 0.65 | % | | | 0.35 | %(e) | | | 0.28 | % | |
Supplemental data | |
Net assets, end of period (in thousands) | | $ | 957,955 | | | $ | 1,049,380 | | | $ | 889,169 | | | $ | 850,041 | | | $ | 735,315 | | | $ | 683,738 | | |
Portfolio turnover | | | 45 | % | | | 59 | % | | | 88 | % | | | 104 | % | | | 80 | % | | | 116 | % | |
Notes to Financial Highlights
(a) For the period from October 1, 2011 to July 31, 2012. During the period, the Fund's fiscal year end was changed from September 30 to July 31.
(b) Calculation of the net gain (loss) per share (both realized and unrealized) does not correlate to the aggregate realized and unrealized gain (loss) presented in the Statement of Operations due to the timing of subscriptions and redemptions of Fund shares in relation to fluctuations in the market value of the portfolio.
(c) Rounds to zero.
(d) In addition to the fees and expenses that the Fund bears directly, the Fund indirectly bears a pro rata share of the fees and expenses of any other funds in which it invests. Such indirect expenses are not included in the Fund's reported expense ratios.
(e) Annualized.
(f) Ratios include line of credit interest expense which is less than 0.01%.
(g) Total net expenses include the impact of certain fee waivers/expense reimbursements made by the Investment Manager and certain of its affiliates, if applicable.
(h) The benefits derived from expense reductions had an impact of less than 0.01%.
(i) The benefits derived from expense reductions had an impact of 0.01%
The accompanying Notes to Financial Statements are an integral part of this statement.
Annual Report 2016
32
COLUMBIA LARGE CAP GROWTH FUND
NOTES TO FINANCIAL STATEMENTS
July 31, 2016
Note 1. Organization
Columbia Large Cap Growth Fund (the Fund), a series of Columbia Funds Series Trust I (the Trust), is a diversified fund. The Trust is registered under the Investment Company Act of 1940, as amended (the 1940 Act), as an open-end management investment company organized as a Massachusetts business trust.
Fund Shares
The Trust may issue an unlimited number of shares (without par value). The Fund offers Class A, Class B, Class C, Class E, Class F, Class I, Class K, Class R, Class R4, Class R5, Class T, Class W, Class Y and Class Z shares. Although all share classes generally have identical voting, dividend and liquidation rights, each share class votes separately when required by the Trust's organizational documents or by law. Different share classes pay different distribution amounts to the extent the expenses of such share classes differ, and distributions in liquidation will be proportional to the net asset value of each share class. Each share class has its own expense and sales charge structure.
Class A shares are subject to a maximum front-end sales charge of 5.75% based on the initial investment amount. Class A shares purchased without an initial sales charge in accounts aggregating $1 million to $50 million at the time of purchase are subject to a contingent deferred sales charge (CDSC) if the shares are sold within 18 months after purchase, charged as follows: 1.00% CDSC if redeemed within 12 months after purchase, and 0.50% CDSC if redeemed more than 12, but less than 18, months after purchase.
Class B shares may be subject to a maximum CDSC of 5.00% based upon the holding period after purchase. Class B shares will generally convert to Class A shares eight years after purchase. The Fund no longer accepts investments by new or existing investors in the Fund's Class B shares, except in connection with the reinvestment of any dividend and/or capital gain distributions in Class B shares of the Fund and exchanges by existing Class B shareholders of certain other funds within the Columbia Family of Funds.
Class C shares are subject to a 1.00% CDSC on shares redeemed within 12 months after purchase.
Class E shares are trust shares which are held in an irrevocable trust until the specified trust termination date. Class E shares are subject to a maximum front-end sales charge of 4.50% based on the investment amount.
Class E shares purchased without an initial sales charge in accounts aggregating $1 million to $5 million at the time of purchase are subject to a 1.00% contingent deferred sales charge (CDSC) if the shares are sold within one year after purchase. Class E shares are closed to new investors and new accounts.
Class F shares are trust shares which are held in an irrevocable trust until the specified trust termination date. Class F shares are subject to a maximum CDSC of 5.00% based upon the holding period after purchase. Class F shares will generally convert to Class E shares eight years after purchase. Class F shares are closed to new investors and new accounts.
Class I shares are not subject to sales charges and are available only to the Columbia Family of Funds.
Class K shares are not subject to sales charges, however this share class is closed to new investors.
Class R shares are not subject to sales charges and are generally available only to certain retirement plans and other investors as described in the Fund's prospectus.
Class R4 shares are not subject to sales charges and are generally available only to omnibus retirement plans and certain investors as described in the Fund's prospectus.
Class R5 shares are not subject to sales charges and are generally available only to investors purchasing through authorized investment professionals and omnibus retirement plans.
Class T shares are subject to a maximum front-end sales charge of 5.75% based on the investment amount. Class T shares purchased without an initial sales charge in accounts aggregating $1 million to $50 million at the time of purchase are subject to a CDSC if the shares are sold within 18 months after purchase, charged as follows: 1.00% CDSC if redeemed within 12 months after purchase, and 0.50% CDSC if redeemed more than 12, but less than 18, months after purchase, with certain limitations. Class T shares are available only to investors who received (and who have continuously held) Class T shares in connection with previous fund reorganizations.
Class W shares are not subject to sales charges and are generally available only to investors purchasing through authorized investment programs managed by investment professionals, including discretionary managed account programs.
Annual Report 2016
33
COLUMBIA LARGE CAP GROWTH FUND
NOTES TO FINANCIAL STATEMENTS (continued)
July 31, 2016
Class Y shares are not subject to sales charges and are generally available only to certain retirement plans as described in the Fund's prospectus.
Class Z shares are not subject to sales charges and are generally available only to eligible investors, which are subject to different investment minimums as described in the Fund's prospectus.
Note 2. Summary of Significant Accounting Policies
Basis of Preparation
The Fund is an investment company that applies the accounting and reporting guidance in the Financial Accounting Standards Board (FASB) Accounting Standards Codification Topic 946, Financial Services — Investment Companies (ASC 946). The financial statements are prepared in accordance with U.S. generally accepted accounting principles (GAAP), which requires management to make certain estimates and assumptions that affect the reported amounts of assets and liabilities, the disclosure of contingent assets and liabilities at the date of the financial statements and the reported amounts of income and expenses during the reporting period. Actual results could differ from those estimates.
The following is a summary of significant accounting policies followed by the Fund in the preparation of its financial statements.
Security Valuation
All equity securities are valued at the close of business of the New York Stock Exchange (NYSE). Equity securities are valued at the last quoted sales price on the principal exchange or market on which they trade, except for securities traded on the NASDAQ Stock Market, which are valued at the NASDAQ official close price. Unlisted securities or listed securities for which there were no sales during the day are valued at the mean of the latest quoted bid and ask prices on such exchanges or markets.
Foreign equity securities are valued based on the closing price on the foreign exchange in which such securities are primarily traded. If any foreign equity security closing prices are not readily available, the securities are valued at the mean of the latest quoted bid and ask prices on such exchanges or markets. Foreign currency exchange rates are generally determined at 4:00 p.m. Eastern (U.S.) time. Many securities markets and exchanges outside the U.S. close prior to the close of the NYSE;
therefore, the closing prices for securities in such markets or on such exchanges may not fully reflect events that occur after such close but before the close of the NYSE. In those situations, foreign securities will be fair valued pursuant to a policy adopted by the Board of Trustees (the Board), including, if available, utilizing a third party pricing service to determine these fair values. The third party pricing service takes into account multiple factors, including, but not limited to, movements in the U.S. securities markets, certain depositary receipts, futures contracts and foreign exchange rates that have occurred subsequent to the close of the foreign exchange or market, to determine a good faith estimate that reasonably reflects the current market conditions as of the close of the NYSE. The fair value of a security is likely to be different from the quoted or published price, if available.
Investments in open-end investment companies, including money market funds, are valued at their latest net asset value.
Investments for which market quotations are not readily available, or that have quotations which management believes are not reflective of market value or reliable, are valued at fair value as determined in good faith under procedures approved by and under the general supervision of the Board. If a security or class of securities (such as foreign securities) is valued at fair value, such value is likely to be different from the quoted or published price for the security.
The determination of fair value often requires significant judgment. To determine fair value, management may use assumptions including but not limited to future cash flows and estimated risk premiums. Multiple inputs from various sources may be used to determine fair value.
GAAP requires disclosure regarding the inputs and valuation techniques used to measure fair value and any changes in valuation inputs or techniques. In addition, investments shall be disclosed by major category. This information is disclosed following the Fund's Portfolio of Investments.
Foreign Currency Transactions and Translations
The values of all assets and liabilities denominated in foreign currencies are generally translated into U.S. dollars at exchange rates determined at the close of the NYSE on any given day. Net realized and unrealized gains (losses) on foreign currency transactions and translations include gains (losses) arising from the fluctuation in exchange rates between trade and
Annual Report 2016
34
COLUMBIA LARGE CAP GROWTH FUND
NOTES TO FINANCIAL STATEMENTS (continued)
July 31, 2016
settlement dates on securities transactions, gains (losses) arising from the disposition of foreign currency and currency gains (losses) between the accrual and payment dates on dividends, interest income and foreign withholding taxes.
For financial statement purposes, the Fund does not distinguish that portion of gains (losses) on investments which is due to changes in foreign exchange rates from that which is due to changes in market prices of the investments. Such fluctuations are included with the net realized and unrealized gains (losses) on investments in the Statement of Operations.
Security Transactions
Security transactions are accounted for on the trade date. Cost is determined and gains (losses) are based upon the specific identification method for both financial statement and federal income tax purposes.
Income Recognition
Corporate actions and dividend income are generally recorded net of any non-reclaimable tax withholdings, on the ex-dividend date or upon receipt of ex-dividend notification in the case of certain foreign securities.
The Fund may receive distributions from holdings in equity securities, business development companies (BDCs), exchange-traded funds, other regulated investment companies (RICs), and real estate investment trusts (REITs), which report information on the tax character of their distributions annually. These distributions are allocated to dividend income, capital gain and return of capital based on actual information reported. Return of capital is recorded as a reduction of the cost basis of securities held. If the Fund no longer owns the applicable securities, return of capital is recorded as a realized gain. With respect to REITs, to the extent actual information has not yet been reported, estimates for return of capital are made by the Fund's management. Management's estimates are subsequently adjusted when the actual character of the distributions is disclosed by the REITs, which could result in a proportionate change in return of capital to shareholders.
Awards from class action litigation are recorded as a reduction of cost basis if the Fund still owns the applicable securities on the payment date. If the Fund no longer owns the applicable securities, the proceeds are recorded as realized gains.
Expenses
General expenses of the Trust are allocated to the Fund and other funds of the Trust based upon relative net assets or other expense allocation methodologies determined by the nature of the expense. Expenses directly attributable to the Fund are charged to the Fund. Expenses directly attributable to a specific class of shares are charged to that share class.
Determination of Class Net Asset Value
All income, expenses (other than class-specific expenses, which are charged to that share class, as shown in the Statement of Operations) and realized and unrealized gains (losses) are allocated to each class of the Fund on a daily basis, based on the relative net assets of each class, for purposes of determining the net asset value of each class.
Federal Income Tax Status
The Fund intends to qualify each year as a regulated investment company under Subchapter M of the Internal Revenue Code, as amended, and will distribute substantially all of its taxable income (including net short-term capital gains), if any, for its tax year, and as such will not be subject to federal income taxes. In addition, the Fund intends to distribute in each calendar year substantially all of its net investment income, capital gains and certain other amounts, if any, such that the Fund should not be subject to federal excise tax. Therefore, no federal income or excise tax provision is recorded.
Foreign Taxes
The Fund may be subject to foreign taxes on income, gains on investments or currency repatriation, a portion of which may be recoverable. The Fund will accrue such taxes and recoveries, as applicable, based upon its current interpretation of tax rules and regulations that exist in the markets in which it invests.
Realized gains in certain countries may be subject to foreign taxes at the Fund level, based on statutory rates. The Fund accrues for such foreign taxes on realized and unrealized gains at the appropriate rate for each jurisdiction, as applicable. The amount, if any, is disclosed as a liability on the Statement of Assets and Liabilities.
Distributions to Shareholders
Distributions from net investment income, if any, are declared and paid annually. Net realized capital gains, if
Annual Report 2016
35
COLUMBIA LARGE CAP GROWTH FUND
NOTES TO FINANCIAL STATEMENTS (continued)
July 31, 2016
any, are distributed along with the income distribution. Income distributions and capital gain distributions are determined in accordance with federal income tax regulations, which may differ from GAAP.
Guarantees and Indemnifications
Under the Trust's organizational documents and, in some cases, by contract, its officers and trustees are indemnified against certain liabilities arising out of the performance of their duties to the Trust or its funds. In addition, certain of the Fund's contracts with its service providers contain general indemnification clauses. The Fund's maximum exposure under these arrangements is unknown since the amount of any future claims that may be made against the Fund cannot be determined, and the Fund has no historical basis for predicting the likelihood of any such claims.
Note 3. Fees and Other Transactions with Affiliates
Management Services Fees
Effective December 1, 2015, the Fund entered into a Management Agreement with Columbia Management Investment Advisers, LLC (the Investment Manager), a wholly-owned subsidiary of Ameriprise Financial, Inc. (Ameriprise Financial). Under the Management Agreement, the Investment Manager provides the Fund with investment research and advice, as well as administrative and accounting services. The management services fee is an annual fee that is equal to a percentage of the Fund's average daily net assets that declines from 0.77% to 0.57% as the Fund's net assets increase. Prior to December 1, 2015, the Fund paid the Investment Manager an annual fee for advisory services under an Investment Management Services Agreement and a separate annual fee for administrative and accounting services under an Administrative Services Agreement. The effective management services fee rate for the year ended July 31, 2016 (reflecting all advisory and administrative services fees paid to the Investment Manager) was 0.66% of the Fund's average daily net assets. For the period from August 1, 2015 through November 30, 2015, the investment advisory services fee paid to the Investment Manager was $6,999,213 and the administrative services fee paid to the Investment Manager was $584,102.
Compensation of Board Members
Board members, who are not officers or employees of the Investment Manager or Ameriprise Financial, are
compensated for their services to the Fund as disclosed in the Statement of Operations. These Board members may participate in a Deferred Compensation Plan (the Plan) which may be terminated at any time. Obligations of the Plan will be paid solely out of the Fund's assets, and all amounts payable under the Plan constitute a general unsecured obligation of the Fund.
Compensation of Chief Compliance Officer
The Board has appointed a Chief Compliance Officer to the Fund in accordance with federal securities regulations. The Fund is allocated a portion of the expenses associated with the Chief Compliance Officer based on relative net assets of the Trust.
Transfer Agency Fees
Under a Transfer and Dividend Disbursing Agent Agreement, Columbia Management Investment Services Corp. (the Transfer Agent), an affiliate of the Investment Manager and a wholly-owned subsidiary of Ameriprise Financial, is responsible for providing transfer agency services to the Fund. The Transfer Agent has contracted with Boston Financial Data Services (BFDS) to serve as sub-transfer agent.
The Transfer Agent receives a monthly transfer agency fee based on the number or the average value of accounts, depending on the type of account. In addition, the Transfer Agent also receives sub-transfer agency fees based on a percentage of the average aggregate value of the Fund's shares maintained in omnibus accounts (other than omnibus accounts for which American Enterprise Investment Services Inc. is the broker of record or accounts where the beneficial shareholder is a customer of Ameriprise Financial Services, Inc., for which the Transfer Agent receives a per account fee). The Transfer Agent pays the fees of BFDS for services as sub-transfer agent and BFDS is not entitled to reimbursement for such fees from the Fund (with the exception of out-of-pocket fees).
The Transfer Agent also receives compensation from the Fund for various shareholder services and reimbursements for certain out-of-pocket fees. Total transfer agency fees for Class K and Class R5 shares are subject to an annual limitation of not more than 0.05% of the average daily net assets attributable to each share class. Class I and Class Y shares do not pay transfer agency fees.
Annual Report 2016
36
COLUMBIA LARGE CAP GROWTH FUND
NOTES TO FINANCIAL STATEMENTS (continued)
July 31, 2016
For the year ended July 31, 2016, the Fund's effective transfer agency fee rates as a percentage of average daily net assets of each class were as follows:
Class A | | | 0.16 | % | |
Class B | | | 0.16 | | |
Class C | | | 0.16 | | |
Class E | | | 0.16 | | |
Class F | | | 0.16 | | |
Class K | | | 0.05 | | |
Class R | | | 0.16 | | |
Class R4 | | | 0.16 | | |
Class R5 | | | 0.05 | | |
Class T | | | 0.16 | | |
Class W | | | 0.16 | | |
Class Z | | | 0.16 | | |
The Fund and certain other associated investment companies have severally, but not jointly, guaranteed the performance and observance of all the terms and conditions of a lease entered into by Seligman Data Corp. (SDC), the former transfer agent, including the payment of rent by SDC (the Guaranty). SDC was the legacy Seligman funds' former transfer agent.
The lease and the Guaranty expire in January 2019. At July 31, 2016, the Fund's total potential future obligation over the life of the Guaranty is $107,666. The liability remaining at July 31, 2016 for non-recurring charges associated with the lease amounted to $59,242 and is recorded as a part of the payable for other expenses in the Statement of Assets and Liabilities. SDC is owned by six associated investment companies, including the Fund. The Fund's ownership interest in SDC at July 31, 2016 is recorded as a part of other assets in the Statement of Assets and Liabilities at a cost of $43,170, which approximates the fair value of the ownership interest.
An annual minimum account balance fee of $20 may apply to certain accounts with a value below the applicable share class's initial minimum investment requirements to reduce the impact of small accounts on transfer agency fees. These minimum account balance fees are remitted to the Fund and recorded as part of expense reductions in the Statement of Operations. For the year ended July 31, 2016, these minimum account balances fees reduced total expenses of the fund by $30,722.
Plan Administration Fees
Under a Plan Administration Services Agreement with the Transfer Agent, the Fund pays an annual fee at a rate of
0.25% of the Fund's average daily net assets attributable to Class K shares for the provision of various administrative, recordkeeping, communication and educational services.
Distribution and Service Fees
The Fund has an agreement with Columbia Management Investment Distributors, Inc. (the Distributor), an affiliate of the Investment Manager and a wholly-owned subsidiary of Ameriprise Financial, for distribution and shareholder services. The Board has approved, and the Fund has adopted, distribution and shareholder service plans (the Plans) applicable to certain share classes, which set the distribution and service fees for the Fund. These fees are calculated daily and are intended to compensate the Distributor and/or eligible selling and/or servicing agents for selling shares of the Fund and providing services to investors.
Under the Plans, the Fund pays a monthly service fee to the Distributor at the maximum annual rate of 0.25% of the average daily net assets attributable to Class A, Class B, Class C, Class E, Class F and Class W shares of the Fund. Also under the Plans, the Fund pays a monthly distribution fee to the Distributor at the maximum annual rates of 0.10%, 0.75%, 0.75%, 0.10%, 0.75%, 0.50% and 0.25% of the average daily net assets attributable to Class A, Class B, Class C, Class E, Class F, Class R and Class W shares of the Fund, respectively.
Although the Fund may pay distribution and service fees up to a maximum annual rate of 0.35% of the Fund's average daily net assets attributable to Class A shares (comprised of up to 0.10% for distribution services and up to 0.25% for shareholder liaison services), the Fund currently limits such fees to an aggregate fee of not more than 0.25% of the Fund's average daily net assets attributable to Class A shares.
Although the Fund may pay a distribution fee up to 0.25% of the Fund's average daily net assets attributable to Class W shares and a service fee of up to 0.25% of the Fund's average daily net assets attributable to Class W shares, the aggregate fee shall not exceed 0.25% of the Fund's average daily net assets attributable to Class W shares.
Shareholder Services Fees
The Fund has adopted a shareholder services plan that permits it to pay for certain services provided to Class T shareholders by their selling and/or servicing agents. The Fund may pay shareholder servicing fees up to an aggregate annual rate of 0.50% of the Fund's average
Annual Report 2016
37
COLUMBIA LARGE CAP GROWTH FUND
NOTES TO FINANCIAL STATEMENTS (continued)
July 31, 2016
daily net assets attributable to Class T shares (comprised of up to 0.25% for shareholder liaison services and up to 0.25% for administrative support services). These fees are currently limited to an aggregate annual rate of not more than 0.25% of the Fund's average daily net assets attributable to Class T shares.
Sales Charges
Sales charges, including front-end charges and CDSCs, received by the Distributor for distributing Fund shares were $1,051,222 for Class A, $477 for Class B, $9,260 for Class C, $303 for Class E and $23,100 for Class T shares for the year ended July 31, 2016.
Expenses Waived/Reimbursed by the Investment Manager and its Affiliates
The Fund's expense ratio is subject to an expense reimbursement arrangement pursuant to which fees will be waived and/or expenses reimbursed (excluding certain fees and expenses described below as well as any reorganization costs allocated to the Fund), so that the Fund's net operating expenses, after giving effect to fees waived/expenses reimbursed and any balance credits and/or overdraft charges from the Fund's custodian, do not exceed the annual rates of:
| | | Contractual
Expense Cap
December 1, 2015
through
November 30, 2016 | | Voluntary
Expense Cap
Prior to
December 1, 2015 | |
Class A | | | 1.23 | % | | | 1.22 | % | |
Class B | | | 1.98 | | | | 1.97 | | |
Class C | | | 1.98 | | | | 1.97 | | |
Class E | | | 1.33 | | | | 1.32 | | |
Class F | | | 1.98 | | | | 1.97 | | |
Class I | | | 0.86 | | | | 0.83 | | |
Class K | | | 1.16 | | | | 1.13 | | |
Class R | | | 1.48 | | | | 1.47 | | |
Class R4 | | | 0.98 | | | | 0.97 | | |
Class R5 | | | 0.91 | | | | 0.88 | | |
Class T | | | 1.23 | | | | 1.22 | | |
Class W | | | 1.23 | | | | 1.22 | | |
Class Y | | | 0.86 | | | | 0.83 | | |
Class Z | | | 0.98 | | | | 0.97 | | |
The contractual agreement may be modified or amended only with approval from the Investment Manager, certain of its affiliates and the Fund. Under the arrangements, the following fees and expenses are excluded from the waiver/reimbursement commitment, and therefore will be paid by the Fund, if applicable: taxes (including foreign
transaction taxes), expenses associated with investments in affiliated and non-affiliated pooled investment vehicles (including mutual funds and exchange-traded funds), transaction costs and brokerage commissions, costs related to any securities lending program, dividend and interest expenses associated with securities sold short, inverse floater program fees and expenses, transaction charges and interest on borrowed money, interest and infrequent and/or unusual expenses. Any fees waived and/or expenses reimbursed under the expense reimbursement arrangements described above are not recoverable by the Investment Manager or its affiliates in future periods. Reorganization (see Note 7) costs were allocated to the Fund only to the extent they are expected to be offset by the anticipated reduction in expenses borne by the Fund's shareholders during the first year following the reorganization.
Note 4. Federal Tax Information
The timing and character of income and capital gain distributions are determined in accordance with income tax regulations, which may differ from GAAP because of temporary or permanent book to tax differences.
At July 31, 2016, these differences are primarily due to differing treatment for deferral/reversal of wash sale losses, Trustees' deferred compensation, distribution reclassifications, foreign currency transactions, non-deductible expenses and re-characterization of distributions for investments. To the extent these differences are permanent, reclassifications are made among the components of the Fund's net assets in the Statement of Assets and Liabilities. Temporary differences do not require reclassifications.
In the Statement of Assets and Liabilities the following reclassifications were made:
Undistributed net investment income | | $ | (37,577 | ) | |
Accumulated net realized gain | | | 2,125 | | |
Paid-in capital | | | 35,452 | | |
Net investment income (loss) and net realized gains (losses), as disclosed in the Statement of Operations, and net assets were not affected by this reclassification.
The tax character of distributions paid during the years indicated was as follows:
Year Ended July 31, | | 2016 | | 2015 | |
Ordinary income | | $ | 1,791,601 | | | $ | 10,450,703 | | |
Long-term capital gains | | | 333,387,452 | | | | 340,118,751 | | |
Total | | $ | 335,179,053 | | | $ | 350,569,454 | | |
Annual Report 2016
38
COLUMBIA LARGE CAP GROWTH FUND
NOTES TO FINANCIAL STATEMENTS (continued)
July 31, 2016
Short-term capital gain distributions, if any, are considered ordinary income distributions for tax purposes.
At July 31, 2016, the components of distributable earnings on a tax basis were as follows:
Undistributed ordinary income | | $ | 2,532,191 | | |
Undistributed long-term capital gains | | | 30,738,181 | | |
Net unrealized appreciation | | | 781,648,085 | | |
At July 31, 2016, the cost of investments for federal income tax purposes was $2,664,018,296 and the aggregate gross unrealized appreciation and depreciation based on that cost was:
Unrealized appreciation | | $ | 869,823,035 | | |
Unrealized depreciation | | | (88,174,950 | ) | |
Net unrealized appreciation | | $ | 781,648,085 | | |
Management of the Fund has concluded that there are no significant uncertain tax positions in the Fund that would require recognition in the financial statements. However, management's conclusion may be subject to review and adjustment at a later date based on factors including, but not limited to, new tax laws, regulations, and administrative interpretations (including relevant court decisions). Generally, the Fund's federal tax returns for the prior three fiscal years remain subject to examination by the Internal Revenue Service.
Note 5. Portfolio Information
The cost of purchases and proceeds from sales of securities, excluding short-term investments and derivatives, if any, aggregated to $1,462,327,522 and $1,585,478,315, respectively, for the year ended July 31, 2016. The amount of purchase and sale activity impacts the portfolio turnover rate reported in the Financial Highlights.
Transactions to realign the Fund's portfolio following the reorganization as described in Note 7 are excluded for purposes of calculating the Fund's portfolio turnover rate. These realignment transactions amounted to cost of purchases and proceeds from sales of $0 and $769,409, respectively.
Note 6. Affiliated Money Market Fund
The Fund invests in Columbia Short-Term Cash Fund, an affiliated money market fund established for the exclusive use by the Fund and other affiliated funds. The income earned by the Fund from such investments is included as Dividends — affiliated issuers in the Statement of Operations. As an investing fund, the Fund
indirectly bears its proportionate share of the expenses of Columbia Short-Term Cash Fund.
Note 7. Fund Reorganization
At the close of business on May 20, 2016, the Fund acquired the assets and assumed the identified liabilities of Columbia Large Cap Growth Fund IV, a series of Columbia Funds Series Trust II (the acquired fund). The reorganization was completed after shareholders of the acquired fund approved a plan of reorganization on April 15, 2016. The purpose of the transaction was to combine two funds managed by the Investment Manager with comparable investment objectives and strategies.
The aggregate net assets of the Fund immediately before the reorganization were $3,280,915,910 and the combined net assets immediately after the reorganization were $3,355,017,272.
The reorganization was accomplished by a tax-free exchange of 2,394,477 shares of the acquired fund valued at $74,101,362 (including $2,664,848 of unrealized appreciation).
In exchange for the acquired fund's shares, the Fund issued the following number of shares:
| | | | Shares | | |
Class A | | | 1,462,001 | | |
Class C | | | 682,164 | | |
Class I | | | 57 | | |
Class K | | | 8,726 | | |
Class R4 | | | 32,783 | | |
Class R5 | | | 7,632 | | |
Class Z | | | 201,114 | | |
For financial reporting purposes, net assets received and shares issued by the Fund were recorded at fair value; however, the acquired fund's cost of investments was carried forward.
The financial statements reflect the operations of the Fund for the period prior to the reorganization and the combined fund for the period subsequent to the reorganization. Because the combined investment portfolios have been managed as a single integrated portfolio since the reorganization was completed, it is not practicable to separate the amounts of revenue and earnings of the acquired fund that have been included in the combined Fund's Statement of Operations since the reorganization was completed.
Annual Report 2016
39
COLUMBIA LARGE CAP GROWTH FUND
NOTES TO FINANCIAL STATEMENTS (continued)
July 31, 2016
Assuming the reorganization had been completed on August 1, 2015, the Fund's pro-forma net investment income, net gain on investments, net change in unrealized appreciation (depreciation) and net decrease in net assets from operations for the year ended July 31, 2016 would have been approximately $2.9 million, $61.3 million, $(115.1) million and $(50.9) million, respectively.
Note 8. Line of Credit
The Fund has access to a revolving credit facility whereby the Fund may borrow for the temporary funding of shareholder redemptions or for other temporary or emergency purposes. Effective December 8, 2015, Citibank, N.A. and HSBC Bank USA, N.A. joined JPMorgan Chase Bank, N.A. (JPMorgan) as lead of a syndicate of banks under the credit facility, which is a collective agreement between the Fund and certain other funds managed by the Investment Manager, severally and not jointly, that permits collective borrowings up to $1 billion. Interest is charged to each participating fund based on its borrowings at a rate equal to the higher of (i) the overnight federal funds rate plus 1.00% or (ii) the one-month LIBOR rate plus 1.00%. Each borrowing under the credit facility matures no later than 60 days after the date of borrowing. The Fund also pays a commitment fee equal to its pro rata share of the amount of the credit facility at a rate of 0.15% per annum. The commitment fee is included in other expenses in the Statement of Operations. Prior to December 8, 2015, JPMorgan was the sole lead bank under the credit facility agreement that permitted borrowings up to $550 million under the same terms and interest rates as described above with the exception of the commitment fee which was charged at a rate of 0.075% per annum.
The Fund had no borrowings during the year ended July 31, 2016.
Note 9. Significant Risks
Shareholder Concentration Risk
At July 31, 2016, one unaffiliated shareholder of record owned 11.7% of the outstanding shares of the Fund in one or more accounts. The Fund has no knowledge about whether any portion of those shares was owned beneficially. Affiliated shareholders of record owned 45.1% of the outstanding shares of the Fund in one or more accounts. Subscription and redemption activity by concentrated accounts may have a significant effect on
the operations of the Fund. In the case of a large redemption, the Fund may be forced to sell investments at inopportune times, including its liquid or more liquid positions, resulting in Fund losses and the Fund holding a higher percentage of less liquid or illiquid securities. Large redemptions could result in decreased economies of scale and increased operating expenses for non-redeeming Fund shareholders.
Consumer Discretionary Sector Risk
The Fund may be more susceptible to the particular risks that may affect companies in the consumer discretionary sector than if it were invested in a wider variety of companies in unrelated sectors. Companies in the consumer discretionary sector are subject to certain risks, including fluctuations in the performance of the overall domestic and international economy, interest rate changes, increased competition and consumer confidence. Performance of such companies may be affected by factors including reduced disposable household income, reduced consumer spending, changing demographics and consumer tastes.
Technology and Technology-related Investment Risk
The Fund may be more susceptible to the particular risks that may affect companies in the information technology sector, as well as other technology-related sectors (collectively, the technology sectors) than if it were invested in a wider variety of companies in unrelated sectors. Companies in the technology sectors are subject to certain risks, including the risk that new services, equipment or technologies will not be accepted by consumers and businesses or will become rapidly obsolete. Performance of such companies may be affected by factors including obtaining and protecting patents (or the failure to do so) and significant competitive pressures, including aggressive pricing of their products or services, new market entrants, competition for market share and short product cycles due to an accelerated rate of technological developments. Such competitive pressures may lead to limited earnings and/or falling profit margins. As a result, the value of their securities may fall or fail to rise. In addition, many technology sector companies have limited operating histories and prices of these companies' securities historically have been more volatile than other securities, especially over the short term.
Annual Report 2016
40
COLUMBIA LARGE CAP GROWTH FUND
NOTES TO FINANCIAL STATEMENTS (continued)
July 31, 2016
Note 10. Subsequent Events
Management has evaluated the events and transactions that have occurred through the date the financial statements were issued and noted no items requiring adjustment of the financial statements or additional disclosure.
Note 11. Information Regarding Pending and Settled Legal Proceedings
Ameriprise Financial and certain of its affiliates have historically been involved in a number of legal, arbitration and regulatory proceedings, including routine litigation, class actions, and governmental actions, concerning matters arising in connection with the conduct of their business activities. Ameriprise Financial believes that the Funds are not currently the subject of, and that neither Ameriprise Financial nor any of its affiliates are the subject of, any pending legal, arbitration or regulatory proceedings that are likely to have a material adverse effect on the Funds or the ability of Ameriprise Financial or its affiliates to perform under their contracts with the Funds. Ameriprise Financial is required to make quarterly (10-Q), annual (10-K) and, as necessary, 8-K filings with the Securities and Exchange Commission (SEC) on legal and regulatory matters that relate to Ameriprise Financial and its affiliates. Copies of these filings may be obtained by accessing the SEC website at www.sec.gov.
There can be no assurance that these matters, or the adverse publicity associated with them, will not result in increased fund redemptions, reduced sale of fund shares or other adverse consequences to the Funds. Further, although we believe proceedings are not likely to have a material adverse effect on the Funds or the ability of Ameriprise Financial or its affiliates to perform under their contracts with the Funds, these proceedings are subject to uncertainties and, as such, we are unable to estimate the possible loss or range of loss that may result. An adverse outcome in one or more of these proceedings could result in adverse judgments, settlements, fines, penalties or other relief that could have a material adverse effect on the consolidated financial condition or results of operations of Ameriprise Financial.
Annual Report 2016
41
COLUMBIA LARGE CAP GROWTH FUND
REPORT OF INDEPENDENT REGISTERED PUBLIC ACCOUNTING FIRM
To the Trustees of Columbia Funds Series Trust I and the Shareholders of
Columbia Large Cap Growth Fund
In our opinion, the accompanying statement of assets and liabilities, including the portfolio of investments, and the related statements of operations and of changes in net assets and the financial highlights present fairly, in all material respects, the financial position of Columbia Large Cap Growth Fund (the "Fund", a series of Columbia Funds Series Trust I) at July 31, 2016, and the results of its operations, the changes in its net assets and the financial highlights for each of the periods indicated, in conformity with accounting principles generally accepted in the United States of America. These financial statements and financial highlights (hereafter referred to as "financial statements") are the responsibility of the Fund's management. Our responsibility is to express an opinion on these financial statements based on our audits. We conducted our audits of these financial statements in accordance with the standards of the Public Company Accounting Oversight Board (United States). Those standards require that we plan and perform the audit to obtain reasonable assurance about whether the financial statements are free of material misstatement. An audit includes examining, on a test basis, evidence supporting the amounts and disclosures in the financial statements, assessing the accounting principles used and significant estimates made by management, and evaluating the overall financial statement presentation. We believe that our audits, which included confirmation of securities at July 31, 2016 by correspondence with the custodian, brokers and transfer agent, and the application of alternative auditing procedures where such confirmations had not been received, provide a reasonable basis for our opinion.
PricewaterhouseCoopers LLP
Minneapolis, MN
September 21, 2016
Annual Report 2016
42
COLUMBIA LARGE CAP GROWTH FUND
FEDERAL INCOME TAX INFORMATION
(Unaudited)
The Fund hereby designates the following tax attributes for the fiscal year ended July 31, 2016. Shareholders will be notified in early 2017 of the amounts for use in preparing 2016 income tax returns.
Tax Designations:
Qualified Dividend Income | | | 100.00 | % | |
Dividends Received Deduction | | | 100.00 | % | |
Capital Gain Dividend | | $ | 57,169,887 | | |
Qualified Dividend Income. For taxable, non-corporate shareholders, the percentage of ordinary income distributed during the fiscal year that represents qualified dividend income subject to reduced tax rates.
Dividends Received Deduction. The percentage of ordinary income distributed during the fiscal year that qualifies for the corporate dividends received deduction.
Capital Gain Dividend. The Fund designates as a capital gain dividend the amount reflected above, or if subsequently determined to be different, the net capital gain of such fiscal period.
Annual Report 2016
43
COLUMBIA LARGE CAP GROWTH FUND
Shareholders elect the Board that oversees the Fund's operations. The Board appoints officers who are responsible for day-to-day business decisions based on policies set by the Board. The following table provides basic biographical information about the Fund's Trustees, including their principal occupations during the past five years, although specific titles for individuals may have varied over the period. The year set forth beneath Length of Service in the table below is the year in which the Trustee was first appointed or elected as Trustee to any Fund currently in the Columbia Funds Complex or a predecessor thereof. Under current Board policy, members serve terms of indefinite duration.
Trustees
Independent Trustees
Name,
Address,
Year of Birth | | Position Held With
the Trust and Length of
Service | | Principal Occupation(s)
During the Past Five Years
and Other Relevant
Professional Experience | | Number of
Funds in the
Columbia Funds
Complex
Overseen | | Other Directorships
Held by Trustee During
the Past Five Years | |
Janet Langford Carrig
c/o Columbia
Management Investment Advisers, LLC,
225 Franklin Street
Mail Drop BX32 05228,
Boston, MA 02110
1957 | | Trustee 1996 | | Senior Vice President, General Counsel and Corporate Secretary, ConocoPhillips (integrated energy company) since September 2007 | | | 56 | | | None | |
Douglas A. Hacker
c/o Columbia Management Investment Advisers, LLC,
225 Franklin Street
Mail Drop BX32 05228,
Boston, MA 02110
1955 | | Trustee and Chairman of the Board 1996 | | Independent business executive since May 2006; Executive Vice President — Strategy of United Airlines from December 2002 to May 2006; President of UAL Loyalty Services (airline marketing company) from September 2001 to December 2002; Executive Vice President and Chief Financial Officer of United Airlines from July 1999 to September 2001 | | | 56 | | | Spartan Nash Company (food distributor); Nash Finch Company (food distributor) from 2005 to 2013; Aircastle Limited (aircraft leasing); SeaCube Container Leasing Ltd. (container leasing) from 2010 to 2013; and Travelport Worldwide Limited (travel information technology) | |
Nancy T. Lukitsh
c/o Columbia Management Investment Advisers, LLC,
225 Franklin Street
Mail Drop BX32 05228,
Boston, MA 02110
1956 | | Trustee 2011 | | Senior Vice President, Partner and Director of Marketing, Wellington Management Company, LLP (investment adviser) from 1997 to 2010; Chair, Wellington Management Portfolios (commingled non-U.S. investment pools) from 2007 to 2010; Director, Wellington Trust Company, NA and other Wellington affiliates from 1997 to 2010 | | | 56 | | | None | |
Annual Report 2016
44
COLUMBIA LARGE CAP GROWTH FUND
TRUSTEES AND OFFICERS (continued)
Independent Trustees (continued)
Name,
Address,
Year of Birth | | Position Held With
the Trust and Length of
Service | | Principal Occupation(s)
During the Past Five Years
and Other Relevant
Professional Experience | | Number of
Funds in the
Columbia Funds
Complex
Overseen | | Other Directorships
Held by Trustee During
the Past Five Years | |
William E. Mayer
c/o Columbia Management Investment Advisers, LLC,
225 Franklin Street
Mail Drop BX32 05228,
Boston, MA 02110
1940 | | Trustee 1991 | | Partner, Park Avenue Equity Partners (private equity) since February 1999 | | | 56 | | | DynaVox Inc. (speech creation); Lee Enterprises (print media); WR Hambrecht + Co. (financial service provider) from 2000 to 2012; BlackRock Capital Investment Corporation (investment company); and Premier, Inc. (healthcare) | |
David M. Moffett
c/o Columbia Management Investment Advisers, LLC,
225 Franklin Street
Mail Drop BX32 05228,
Boston, MA 02110
1952 | | Trustee 2011 | | Retired. Consultant to Bridgewater and Associates | | | 56 | | | Director of CIT Bank, CIT Group Inc. (commercial and consumer finance); eBay Inc. (online trading community); Genworth Financial, Inc. (financial and insurance products and services); Paypal Holdings Inc. (payment and data processing services); and Trustee University of Oklahoma Foundation | |
Charles R. Nelson
c/o Columbia Management Investment Advisers, LLC,
225 Franklin Street
Mail Drop BX32 05228,
Boston, MA 02110
1942 | | Trustee 1981 | | Retired. Professor Emeritus, University of Washington since 2011; Professor of Economics, University of Washington from 1976 to 2011; Ford and Louisa Van Voorhis Professor of Political Economy, University of Washington from 1993 to 2011; Adjunct Professor of Statistics, University of Washington from 1980 to 2011; Associate Editor, Journal of Money, Credit and Banking from September 1993 to 2008; consultant on econometric and statistical matters | | | 56 | | | None | |
John J. Neuhauser
c/o Columbia Management Investment Advisers, LLC,
225 Franklin Street
Mail Drop BX32 05228,
Boston, MA 02110
1943 | | Trustee 1984 | | President, Saint Michael's College since August 2007; Director or Trustee of several non-profit organizations, including University of Vermont Medical Center; Academic Vice President and Dean of Faculties, Boston College from August 1999 to October 2005; University Professor, Boston College from November 2005 to August 2007 | | | 56 | | | Liberty All-Star Equity Fund and Liberty All-Star Growth Fund (closed-end funds) | |
Annual Report 2016
45
COLUMBIA LARGE CAP GROWTH FUND
TRUSTEES AND OFFICERS (continued)
Independent Trustees (continued)
Name,
Address,
Year of Birth | | Position Held With
the Trust and Length of
Service | | Principal Occupation(s)
During the Past Five Years
and Other Relevant
Professional Experience | | Number of
Funds in the
Columbia Funds
Complex
Overseen | | Other Directorships
Held by Trustee During
the Past Five Years | |
Patrick J. Simpson
c/o Columbia Management Investment Advisers, LLC,
225 Franklin Street
Mail Drop BX32 05228,
Boston, MA 02110
1944 | | Trustee 2000 | | Of Counsel, Perkins Coie LLP (law firm) since 2015; Partner, Perkins Coie LLP from 1988 to 2014 | | | 56 | | | None | |
Anne-Lee Verville
c/o Columbia Management Investment Advisers, LLC,
225 Franklin Street
Mail Drop BX32 05228,
Boston, MA 02110
1945 | | Trustee 1998 | | Retired. General Manager, Global Education Industry from 1994 to 1997, President — Application Systems Division from 1991 to 1994, Chief Financial Officer — US Marketing & Services from 1988 to 1991, and Chief Information Officer from 1987 to 1988, IBM Corporation (computer and technology) | | | 56 | | | Enesco Group, Inc. (producer of giftware and home and garden decor products) from 2001 to 2006 | |
Consultant to the Trustees*
Name,
Address,
Year of Birth | | Position Held With
the Trust and Length of
Service | | Principal Occupation(s)
During the Past Five Years
and Other Relevant
Professional Experience | | Number of
Funds in the
Columbia Funds
Complex
Overseen | | Other Directorships
Held by Trustee During
the Past Five Years | |
J. Kevin Connaughton
c/o Columbia
Management Investment Advisers, LLC,
225 Franklin Street
Mail Drop BX32 05228,
Boston, MA 02110
1964 | | Trustee Consultant 2016 | | Trustee Consultant, Columbia Funds since March 2016; Managing Director and General Manager of Mutual Fund Products, Columbia Management Investment Advisers, LLC from May 2010 to February 2015; President, Columbia Funds from 2009 to 2015; and senior officer of Columbia Funds and affiliated funds from 2003 to 2015 | | | 56 | | | Board of Governors, Gateway Healthcare since January 2016; Trustee, New Century Portfolios since March 2015; and Director, The Autism Project since March 2015 | |
* J. Kevin Connaughton was appointed consultant to the Trustees effective March 1, 2016. Shareholders of the Funds are expected to be asked to elect Mr. Connaughton as a Trustee at a future shareholder meeting.
Annual Report 2016
46
COLUMBIA LARGE CAP GROWTH FUND
TRUSTEES AND OFFICERS (continued)
Interested Trustee Affiliated with Investment Manager*
Name,
Address,
Year of Birth | | Position Held With
the Trust and Length of
Service | | Principal Occupation(s)
During the Past Five Years
and Other Relevant
Professional Experience | | Number of
Funds in the
Columbia Funds
Complex
Overseen | | Other Directorships
Held by Trustee During
the Past Five Years | |
William F. Truscott
c/o Columbia Management Investment Advisers, LLC,
225 Franklin Street
Boston, MA 02110
1960 | | Trustee 2012 | | Chairman of the Board and President, Columbia Management Investment Advisers, LLC since May 2010 and February 2012, respectively; Chief Executive Officer, Global Asset Management, Ameriprise Financial, Inc. since September 2012 (previously Chief Executive Officer, U.S. Asset Management & President, Annuities, May 2010- September 2012); Director and Chief Executive Officer, Columbia Management Investment Distributors, Inc. since May 2010 and February 2012, respectively; Chairman of the Board and Chief Executive Officer, RiverSource Distributors, Inc. since 2006; Director, Threadneedle Asset Management Holdings, SARL since 2014; President and Chief Executive Officer, Ameriprise Certificate Company, 2006-August 2012. | | | 175 | | | Chairman of the Board, Columbia Management Investment Advisers, LLC since May 2010; Director, Columbia Management Investment Distributors, Inc. since May 2010; Former Director, Ameriprise Certificate Company, 2006-January 2013 | |
* Interested person (as defined under the 1940 Act) by reason of being an officer, director, security holder and/or employee of the Investment Manager or Ameriprise Financial.
The Statement of Additional Information has additional information about the Fund's Board members and is available, without charge, upon request by calling 800.345.6611; contacting your financial intermediary; or visiting investor.columbiathreadneedleus.com.
Annual Report 2016
47
COLUMBIA LARGE CAP GROWTH FUND
TRUSTEES AND OFFICERS (continued)
The Board has appointed officers who are responsible for day-to-day business decisions based on policies it has established. The officers serve at the pleasure of the Board. The following table provides basic information about the Officers of the Fund, including principal occupations during the past five years, although their specific titles may have varied over the period. In addition to Mr. Truscott, who is Senior Vice President, the Fund's other officers are:
Fund Officers
Name,
Address and
Year of Birth | | Position and Year
First Appointed to
Position for any Fund
in the Columbia
Funds Complex or a
Predecessor Thereof | |
Principal Occupation(s) During Past Five Years | |
Christopher O. Petersen
5228 Ameriprise Financial Center
Minneapolis, MN 55474
Born 1970 | | President and Principal Executive Officer (2015) | | Vice President and Lead Chief Counsel, Ameriprise Financial, Inc. since January 2015 (previously, Vice President and Chief Counsel January 2010-December 2014; officer of Columbia Funds and affiliated funds since 2007. | |
Michael G. Clarke
225 Franklin Street
Boston, MA 02110
Born 1969 | | Treasurer (2011), Chief Financial Officer (2009) and Chief Accounting Officer (2015) | | Vice President — Mutual Fund Administration, Columbia Management Investment Advisers, LLC, since May 2010; senior officer of Columbia Funds and affiliated funds since 2002. | |
Paul B. Goucher
100 Park Avenue
New York, NY 10017
Born 1968 | | Senior Vice President (2011), Chief Legal Officer (2015) and Assistant Secretary (2008) | | Vice President and Lead Chief Counsel, Ameriprise Financial, Inc. since November 2008 and January 2013, respectively (previously Chief Counsel, January 2010-January 2013); Vice President, Chief Legal Officer and Assistant Secretary, Columbia Management Investment Advisers, LLC since May 2010. | |
Thomas P. McGuire
225 Franklin Street
Boston, MA 02110
Born 1972 | | Senior Vice President and Chief Compliance Officer (2012) | | Vice President — Asset Management Compliance, Ameriprise Financial, Inc., since May 2010; Chief Compliance Officer, Ameriprise Certificate Company since September 2010. | |
Colin Moore
225 Franklin Street
Boston, MA 02110
Born 1958 | | Senior Vice President (2010) | | Executive Vice President and Global Chief Investment Officer, Ameriprise Financial, Inc., since July 2013; Executive Vice President and Global Chief Investment Officer, Columbia Management Investment Advisers, LLC since July 2013 (previously Director and Global Chief Investment Officer, 2010-2013). | |
Michael E. DeFao
225 Franklin Street
Boston, MA 02110
Born 1968 | | Vice President (2011) and Assistant Secretary (2010) | | Vice President and Chief Counsel, Ameriprise Financial, Inc. since May 2010. | |
Amy Johnson
5228 Ameriprise Financial Center
Minneapolis, MN 55474
Born 1965 | | Vice President (2006) | | Managing Director and Global Head of Operations, Columbia Management Investment Advisers, LLC since April 2016 (previously Managing Director and Chief Operating Officer, 2010-2016). | |
Lyn Kephart-Strong
5228 Ameriprise
Financial Center
Minneapolis, MN 55474
Born 1960 | | Vice President (2015) | | President, Columbia Management Investment Services Corp. since October 2014; Vice President & Resolution Officer, Ameriprise Trust Company since August 2009. | |
Ryan C. Larrenaga
225 Franklin Street
Boston, MA 02110
Born 1970 | | Vice President and Secretary (2015) | | Vice President and Group Counsel, Ameriprise Financial, Inc. since August 2011 (previously, Counsel from May 2010 to August 2011); officer of Columbia Funds and affiliated funds since 2005. | |
Annual Report 2016
48
COLUMBIA LARGE CAP GROWTH FUND
BOARD CONSIDERATION AND APPROVAL OF MANAGEMENT
AGREEMENT
On June 10, 2016, the Board of Trustees (the Board) and the Trustees who are not interested persons (as defined in the Investment Company Act of 1940) (the Independent Trustees) of Columbia Funds Series Trust I (the Trust) unanimously approved the continuation of the Management Agreement (the Management Agreement) with Columbia Management Investment Advisers, LLC (the Investment Manager) with respect to Columbia Large Cap Growth Fund (the Fund), a series of the Trust. As detailed below, the Board's Advisory Fees and Expenses Committee (the Committee) and the Board met on multiple occasions to review and discuss, both among themselves and with the management team of the Investment Manager, materials provided by the Investment Manager and others before determining to approve the continuation of the Management Agreement.
In connection with their deliberations regarding the continuation of the Management Agreement, the Committee and the Board evaluated materials requested from the Investment Manager regarding the Fund and the Management Agreement, and discussed these materials with representatives of the Investment Manager at Committee meetings held on March 8, 2016, April 27, 2016 and June 9, 2016 and at Board meetings held on March 9, 2016 and June 10, 2016. In addition, the Board considers matters bearing on the Management Agreement at most of its other meetings throughout the year and meets regularly with senior management of the Trust and the Investment Manager. Through the Board's Investment Oversight Committees, Trustees also meet with selected portfolio managers of the funds the Trustees oversee and other investment personnel at various times throughout the year. The Committee and the Board also consulted with its independent fee consultant, Fund counsel and with the Independent Trustees' independent legal counsel, who advised on various matters with respect to the Committee's and the Board's considerations and otherwise assisted the Committee and the Board in their deliberations. On June 9, 2016, the Committee recommended that the Board approve the continuation of the Management Agreement. On June 10, 2016, the Board, including the Independent Trustees, voting separately, unanimously approved the continuation of the Management Agreement for the Fund.
The Committee and the Board considered all information that they, their legal counsel or the Investment Manager believed reasonably necessary to evaluate and to determine whether to approve the continuation of the Management Agreement. The information and factors considered by the Committee and the Board in recommending for approval or approving the continuation of the Management Agreement for the Fund included the following:
• Information on the investment performance of the Fund relative to the performance of a group of mutual funds determined to be comparable to the Fund by an independent third-party data provider, as well as performance relative to benchmarks;
• Information on the Fund's management fees and total expenses, including information comparing the Fund's expenses to those of a group of comparable mutual funds, as determined by the independent third-party data provider;
• The Investment Manager's agreement to contractually limit or cap total operating expenses for the Fund through November 30, 2017 so that total operating expenses (excluding certain fees and expenses, such as transaction costs and certain other investment related expenses, interest, taxes, acquired fund fees and expenses, and infrequent and/or unusual expenses) would not exceed a specified annual rate, as a percentage of the Fund's net assets;
• The terms and conditions of the Management Agreement;
• The current and proposed terms and conditions of other agreements and arrangements with affiliates of the Investment Manager relating to the operations of the Fund, including agreements with respect to the provision of distribution and transfer agency services to the Fund;
• Descriptions of various functions performed by the Investment Manager under the Management Agreement, including portfolio management and portfolio trading practices;
• Information regarding the management fees of similarly-managed portfolios of other clients of the Investment Manager, including institutional separate accounts;
Annual Report 2016
49
COLUMBIA LARGE CAP GROWTH FUND
BOARD CONSIDERATION AND APPROVAL OF MANAGEMENT
AGREEMENT (continued)
• Information regarding the reputation, regulatory history and resources of the Investment Manager, including information regarding senior management, portfolio managers and other personnel;
• Information regarding the capabilities of the Investment Manager with respect to compliance monitoring services, including an assessment of the Investment Manager's compliance system by the Fund's Chief Compliance Officer; and
• The profitability to the Investment Manager and its affiliates from their relationships with the Fund.
Nature, Extent and Quality of Services Provided under the Management Agreement
The Committee and the Board considered the nature, extent and quality of services provided to the Fund by the Investment Manager and its affiliates under the Management Agreement and under separate agreements for the provision of transfer agency services, and the resources dedicated to the Fund and the other Columbia Funds by the Investment Manager and its affiliates. The Committee and the Board considered, among other things, the Investment Manager's ability to attract, motivate and retain highly qualified research, advisory and supervisory investment professionals (including personnel and other resources, compensation programs for personnel involved in fund management, reputation and other attributes), the portfolio management services provided by those investment professionals, and the quality of the Investment Manager's investment research capabilities and trade execution services. The Committee and the Board also considered the potential benefits to shareholders of investing in a mutual fund that is part of a fund complex offering exposure to a variety of asset classes and investment disciplines and providing a variety of fund and shareholder services.
The Committee and the Board also considered the professional experience and qualifications of the senior personnel of the Investment Manager, which included consideration of the Investment Manager's experience with similarly-structured funds. The Committee and the Board noted the compliance programs of and the compliance-related resources provided to the Fund by the Investment Manager and its affiliates, and considered the Investment Manager's ability to provide administrative services to the Fund and coordinate the activities of the Fund's other service providers. After reviewing these and related factors, the Committee and the Board concluded, within the context of their overall conclusions, that the nature, extent and quality of the services provided to the Fund under the Management Agreement supported the continuation of the Management Agreement.
Investment Performance
The Committee and the Board reviewed information about the performance of the Fund over various time periods, including performance information relative to benchmarks and information based on reports of the independent third-party data provider that compared the performance of the Fund to the performance of a group of comparable mutual funds, and data provided by the independent fee consultant. The Committee and the Board also reviewed a description of the third party's methodology for identifying the Fund's peer groups for purposes of performance and expense comparisons.
The Committee and the Board noted that, through December 31, 2015, the Fund's performance was in the eighteenth, twenty-sixth and twenty-third percentile (where the best performance would be in the first percentile) of its category selected by the independent third-party data provider for the purposes of performance comparisons for the one-, three- and five-year periods, respectively.
The Committee and the Board also considered the Investment Manager's performance and reputation generally, the Investment Manager's historical responsiveness to Board concerns about performance, and the Investment Manager's willingness to take steps intended to improve performance. After reviewing these and related factors, the Committee and the Board concluded, within the context of their overall conclusions, that the performance of the Fund and the Investment Manager was sufficient, in light of other considerations, to warrant the continuation of the Management Agreement.
Investment Management Fee Rates and Other Expenses
The Committee and the Board considered the management fees charged to the Fund under the Management Agreement as well as the total expenses incurred by the Fund. In assessing the reasonableness of the fees
Annual Report 2016
50
COLUMBIA LARGE CAP GROWTH FUND
BOARD CONSIDERATION AND APPROVAL OF MANAGEMENT
AGREEMENT (continued)
under the Management Agreement, the Committee and the Board considered, among other information, the Fund's management fee and its total expense ratio as a percentage of average daily net assets. The Committee and the Board considered data provided by the independent fee consultant. The Committee and the Board noted that, as of December 31, 2015, the Fund's actual management fee and net total expense ratio are ranked in the third and second quintiles, respectively, (where the lowest fees and expenses would be in the first quintile) against the Fund's expense universe as determined by the independent third-party data provider for purposes of expense comparison. The Committee and the Board also took into account the fee waiver and expense limitation arrangements agreed to by the Investment Manager, as noted above.
The Committee and the Board also received and considered information about the management fees charged by the Investment Manager to institutional separate accounts. In considering the fees charged to those accounts, the Committee and the Board took into account, among other things, the Investment Manager's representations about the differences between managing mutual funds as compared to other types of accounts, including differences in the services provided, differences in the risk profile of such business for the Investment Manager and the additional resources required to manage mutual funds effectively. The Committee and the Board also received and considered information about the fees charged by the Investment Manager for sub-advisory services provided to comparable unaffiliated funds. In evaluating the Fund's management fees, the Committee and the Board also took into account the demands, complexity and quality of the investment management of the Fund.
After reviewing these and related factors, the Committee and the Board concluded, within the context of their overall conclusions, that the management fee rates and expenses of the Fund were sufficient, in light of other considerations, to warrant the continuation of the Management Agreement.
Costs of Services Provided and Profitability
The Committee and the Board also took note of the costs the Investment Manager and its affiliates incur in connection with the services provided (both on an absolute and relative basis) and the profitability to the Investment Manager and its affiliates in connection with their relationships with the Fund.
The Committee and the Board also considered the compensation directly or indirectly received by the Investment Manager's affiliates in connection with their relationships with the Fund. The Committee and the Board reviewed information provided by management as to the profitability to the Investment Manager and its affiliates of their relationships with the Fund, information about the allocation of expenses used to calculate profitability, and comparisons of profitability levels realized in 2015 to profitability levels realized in 2014. When reviewing profitability, the Committee and the Board also considered court cases in which adviser profitability was an issue in whole or in part, the performance of similarly managed funds, the performance of the Fund, and the expense ratio of the Fund. In addition, the Committee and the Board considered information provided by the Investment Manager regarding the Investment Manager's financial condition and comparing its profitability to that of other asset management firms that are, or are subsidiaries of, publicly traded companies. In this regard, the Committee and the Board also considered data provided by the independent fee consultant.
After reviewing these and related factors, the Committee and the Board concluded, within the context of their overall conclusions, that the costs of services provided and the profitability to the Investment Manager and its affiliates from their relationships with the Fund supported the continuation of the Management Agreement.
Economies of Scale
The Committee and the Board considered the potential existence of economies of scale in the provision by the Investment Manager of services to the Fund, to groups of related funds, and to the Investment Manager's investment advisory clients as a whole, and whether those economies of scale were shared with the Fund through breakpoints in investment management fees or other means, such as expense limitation arrangements and additional investments by the Investment Manager in investment, trading and compliance resources. The Committee and the Board noted that the management fee schedules for the Fund contained breakpoints that would reduce the fee rate on assets above specified threshold levels.
Annual Report 2016
51
COLUMBIA LARGE CAP GROWTH FUND
BOARD CONSIDERATION AND APPROVAL OF MANAGEMENT
AGREEMENT (continued)
In considering these matters, the Committee and the Board also considered the costs of the services provided and the profitability to the Investment Manager and its affiliates from their relationships with the Fund, as discussed above. After reviewing these and related factors, the Committee and the Board concluded, within the context of their overall conclusions, that the extent to which any economies of scale were expected to be shared with the Fund supported the continuation of the Management Agreement.
Other Benefits to the Investment Manager
The Committee and the Board received and considered information regarding "fall-out" or ancillary benefits received by the Investment Manager and its affiliates as a result of their relationships with the Fund, such as the engagement of the Investment Manager's affiliates to provide distribution, transfer agency and shareholder services to the Fund. In this regard, among other matters, the Committee and the Board considered that the Fund's distributor retains a portion of the distribution fees from the Fund and receives a portion of the sales charges on sales or redemptions of certain classes of shares of the Fund. The Committee and the Board also considered the benefits of research made available to the Investment Manager by reason of brokerage commissions generated by the Fund's securities transactions, and reviewed information about the Investment Manager's practices with respect to allocating portfolio transactions for brokerage and research services. The Committee and the Board considered the possible conflicts of interest associated with certain fall-out or other ancillary benefits and the reporting, disclosure and other processes that are in place to address such possible conflicts of interest. The Committee and the Board recognized that the Investment Manager's profitability would be somewhat lower without these benefits.
Conclusion
The Committee and the Board reviewed all of the above considerations in reaching their decisions to recommend or approve the continuation of the Management Agreement. In their deliberations, the Trustees did not identify any particular information that was all-important or controlling, and individual Trustees may have attributed different weights to the various factors. Based on their evaluation of all factors that they deemed to be material, including those factors described above, and assisted by the advice of independent legal counsel, the Board, including the Independent Trustees, voting separately, unanimously approved the continuation of the Management Agreement.
Annual Report 2016
52
COLUMBIA LARGE CAP GROWTH FUND
IMPORTANT INFORMATION ABOUT THIS REPORT
Each fund mails one shareholder report to each shareholder address. If you would like more than one report, please call shareholder services at 800.345.6611 and additional reports will be sent to you.
The policy of the Board is to vote the proxies of the companies in which each fund holds investments consistent with the procedures as stated in the Statement of Additional Information (SAI). You may obtain a copy of the SAI without charge by calling 800.345.6611; contacting your financial intermediary; visiting investor.columbiathreadneedleus.com; or searching the website of the Securities and Exchange Commission (SEC) at sec.gov. Information regarding how each fund voted proxies relating to portfolio securities is filed with the SEC by August 31st for the most recent 12-month period ending June 30th of that year, and is available without charge by visiting investor.columbiathreadneedleus.com, or searching the website of the SEC at sec.gov.
Each fund files a complete schedule of portfolio holdings with the SEC for the first and third quarters of each fiscal year on Form N-Q. Each fund's Form N-Q is available on the SEC's website at sec.gov and may be reviewed and copied at the SEC's Public Reference Room in Washington, D.C. Information on the operation of the Public Reference Room may be obtained by calling 800.SEC.0330. Each fund's complete schedule of portfolio holdings, as filed on Form N-Q, can also be obtained without charge, upon request, by calling 800.345.6611.
Annual Report 2016
53
Columbia Large Cap Growth Fund
P.O. Box 8081
Boston, MA 02266-8081

This information is for use with concurrent or prior delivery of a fund prospectus. Please read and consider the investment objectives, risks, charges and expenses for any fund carefully before investing. For a prospectus and summary prospectus, which contains this and other important information about the Fund, go to investor.columbiathreadneedleus.com. The Fund is distributed by Columbia Management Investment Distributors, Inc., member FINRA, and managed by Columbia Management Investment Advisers, LLC.
Columbia Threadneedle Investments (Columbia Threadneedle) is the global brand name of the Columbia and Threadneedle group of companies.
All rights reserved. Columbia Management Investment Distributors, Inc., 225 Franklin Street, Boston, MA 02110-2804
© 2016 Columbia Management Investment Advisers, LLC.
investor.columbiathreadneedleus.com
ANN174_07_F01_(09/16)

ANNUAL REPORT
July 31, 2016


 Dear Shareholders,
Volatility comes with the territory for long-term investors. Some investors instinctively want to pull out of the market or sell underperforming investments at the first sign of increased volatility or perhaps even as soon as they perceive it on the horizon. But taking yourself out of the market could mean losing out on potential opportunities, and putting your longer term investment goals at risk.
Cumulative return is not just about achieving high returns when markets are going up; it's also about remaining invested and minimizing losses during weak or volatile markets so that you can participate on the upside. Developing a deeper understanding of the various risks your portfolio is subject to can help you balance these risks.
Diversification is critical in seeking to achieve that balance. We believe that most portfolios could be more effectively diversified either by introducing holdings with performance profiles unrelated to existing holdings (like alternative products) or by rebalancing existing holdings with an eye toward risk allocation. Over time, distributing risk more evenly may produce a more pronounced diversification benefit and may improve portfolio efficiency. We believe market volatility can create significant opportunities and, in fact, these periods may be some of the very best times to invest.
With this in mind, I thought it important to highlight excerpts from a piece written by Colin Moore, Global Chief Investment Officer, in which he touches on some of these issues emphasizing the importance of a properly constructed portfolio in seeking to effectively manage volatility and to achieve consistency of returns. I encourage you to read the article in its entirety. To access the full article and for other insights on current market, please visit blog.columbiathreadneedleus.com/latest-perspectives.
You need investments that are designed to help you ease the impact of volatile market environments and keep the savings you have worked tirelessly to amass. Columbia Threadneedle Investments provides investment solutions to help you tackle financial challenges and achieve your desired outcome.
Best regards,

Christopher O. Petersen
President, Columbia Funds
Excerpts from:
Taking the scare out of the volatility bogeyman
By Colin Moore, Global Chief Investment Officer
Colin Moore is the global chief investment officer for Columbia Threadneedle Investments. His responsibilities include ensuring that a disciplined investment process is in place across all asset classes, including equity and fixed income. Mr. Moore joined one of the Columbia Threadneedle Investments legacy firms in 2002 as head of equity and was also head of fixed income and liquidity strategies from 2009 – 2010.

n In today's low growth, higher volatility world, the emphasis is shifting from maximization of returns to consistency of returns.
PRESIDENT'S MESSAGE (continued)
n Portfolios should represent the behavioral risk-return tradeoff of investors, remembering that they won't stay invested to realize the return if we get the risk tolerance wrong.
n Holding long-term savings in cash to avoid volatility (the financial equivalent of hiding under the sheets) is detrimental to achieving long-term goals.
According to Wikipedia, "The bogeyman is a common allusion to a mythical creature in many cultures used to control behavior. This monster has no specific appearance, and conceptions about it can vary drastically from household to household within the same community; in many cases he has no set appearance in the mind of an adult or child, but is simply a non-specific embodiment of terror." Different cultures have different names and physical representations for the bogeyman, and investors are no different. We have terrible monsters that we fear may destroy our portfolios, and we call one of the scariest of them volatility.
While the bogeyman is mythical (I hope!), volatility is real and can cause serious damage. To understand why investors have such a hard time coping with volatility, we first need to define three cognitive biases at work in today's investment environment:
1) Recency bias — something that has recently come to the forefront of our attention, regardless of how long established it is, suddenly seems to appear with improbable frequency.
2) Negativity bias — we tend to have a greater recall of unpleasant memories than positive memories.
3) Loss aversion — our dissatisfaction with losing money tends to be greater than our satisfaction with making money.
The level of volatility varies dramatically, and so does investor fear and panic selling — waxing when volatility rises, waning when it falls. Recent studies have pointed to demographics as an important driver of panic selling. The theory is that as people get closer to retirement, the prospects of a large (20% – 30%) loss in financial assets can have a much more pronounced effect on their sense of well-being. Wealth preservation instincts kick in much more quickly than for younger (and typically less wealthy) savers.
The reality is that there is little opportunity for return without volatility. Therefore, the bogeyman effect of holding long-term savings in cash to avoid volatility (the financial equivalent of hiding under the sheets) is detrimental to achieving long-term goals. This effect tends to be more pronounced during the episodic spikes in volatility. The significant spike in volatility in 2008 and 2009 led to significant withdrawals from long-term investment funds over the same period. Less pronounced effects can also be seen when comparing 2001 – 2003 and 2011 – 2012. Conversely, flows picked up when volatility returned to "normal" levels. Investor behavior of this type is consistent with the three behavioral biases.
I believe average volatility will be higher over the next 10 years than the last 10 years and episodic spikes will increase in frequency because sustainable economic growth will be structurally lower and geopolitical risk higher than any time since World War II. Low growth creates uncertainty while loss aversion will make investors fear that we are one economic mishap or geopolitical event away from no growth or recession. The result will be higher volatility on average. Negativity bias will tend to exacerbate "spike" reactions to event-driven geopolitical news, and the volatility bogeyman will appear more often. Assuming the behavioral biases continue, investor returns are likely to be very disappointing regardless of the total return generated by financial markets due to the bogeyman effect.
To mitigate this effect, we need to focus on portfolio construction and an improved understanding of diversification. I accept that equities are likely to offer the highest return over the next 10 years, but they also offer the highest volatility. Many portfolio construction optimization tools use historical average volatility, which is likely to underestimate the volatility investors will face. The bogeyman emerges when individual asset class volatility spikes and cross correlations rise, the combination of which increases overall portfolio volatility far beyond expectation. Diversification is meant to protect investors against volatility, but what's the point of owning lots of investments if the volatility bogeyman has not been properly estimated?
Most importantly, portfolios should be constructed to properly represent the behavioral risk-return tradeoff of investors, remembering that they won't stay invested to realize the return if we get the risk tolerance wrong. In a low growth, higher volatility world, the emphasis is shifting to return consistency rather than return maximization,
PRESIDENT'S MESSAGE (continued)
and investors are best served through investment approaches that appreciate that distinction. Even though it's a permanent feature of financial markets, volatility is less likely to be the bogeyman we all fear if portfolios are constructed with this understanding.
Please visit blog.columbiathreadneedleus.com/latest-perspectives to read the entire article.
Investors should consider the investment objectives, risks, charges and expenses of a mutual fund carefully before investing. For a free prospectus and summary prospectus, which contains this and other important information about a fund, visit investor.columbiathreadneedleus.com. The prospectus should be read carefully before investing.
The views expressed are as of April 2016, may change as market or other conditions change, and may differ from views expressed by other Columbia Management Investment Advisers, LLC (CMIA) associates or affiliates. Actual investments or investment decisions made by CMIA and its affiliates, whether for its own account or on behalf of clients, will not necessarily reflect the views expressed. This information is not intended to provide investment advice and does not account for individual investor circumstances. Investment decisions should always be made based on an investor's specific financial needs, objectives, goals, time horizon and risk tolerance. Asset classes described may not be suitable for all investors.
Past performance does not guarantee future results, and no forecast should be considered a guarantee either. Since economic and market conditions change frequently, there can be no assurance that the trends described here will continue or that the forecasts are accurate.
Diversification does not guarantee a profit or protect against loss.
Columbia Funds are distributed by Columbia Management Investment Distributors, Inc., member FINRA, and managed by Columbia Management Investment Advisers, LLC.
© 2016 Columbia Management Investment Advisers, LLC. All rights reserved.
Performance Overview | | | 2 | | |
Manager Discussion of Fund Performance | | | 4 | | |
Understanding Your Fund's Expenses | | | 6 | | |
Portfolio of Investments | | | 7 | | |
Statement of Assets and Liabilities | | | 34 | | |
Statement of Operations | | | 36 | | |
Statement of Changes in Net Assets | | | 37 | | |
Financial Highlights | | | 39 | | |
Notes to Financial Statements | | | 45 | | |
Report of Independent Registered Public Accounting Firm | | | 52 | | |
Federal Income Tax Information | | | 53 | | |
Trustees and Officers | | | 54 | | |
Board Consideration and Approval of Management Agreement | | | 59 | | |
Important Information About This Report | | | 63 | | |
Fund Investment Manager
Columbia Management Investment
Advisers, LLC
225 Franklin Street
Boston, MA 02110
Fund Distributor
Columbia Management Investment
Distributors, Inc.
225 Franklin Street
Boston, MA 02110
Fund Transfer Agent
Columbia Management Investment
Services Corp.
P.O. Box 8081
Boston, MA 02266-8081
For more information about any of the funds, please visit investor.columbiathreadneedleus.com or call 800.345.6611. Customer Service Representatives are available to answer your questions Monday through Friday from 8 a.m. to 7 p.m. Eastern time.
The views expressed in this report reflect the current views of the respective parties. These views are not guarantees of future performance and involve certain risks, uncertainties and assumptions that are difficult to predict, so actual outcomes and results may differ significantly from the views expressed. These views are subject to change at any time based upon economic, market or other conditions and the respective parties disclaim any responsibility to update such views. These views may not be relied on as investment advice and, because investment decisions for a Columbia fund are based on numerous factors, may not be relied on as an indication of trading intent on behalf of any particular Columbia fund. References to specific securities should not be construed as a recommendation or investment advice.
Performance Summary
n Columbia Tax-Exempt Fund (the Fund) Class A shares returned 7.19% excluding sales charges for the 12-month period that ended July 31, 2016. Class Z shares returned 7.40% for the same time period.
n The Fund outperformed its benchmark, the Barclays Municipal Bond Index, which returned 6.94% for the same time period.
n The Fund's bias toward bonds with longer maturities and medium to lower credit quality ratings generally accounted for its modest outperformance over its benchmark. Security selection also aided relative results.
Average Annual Total Returns (%) (for period ended July 31, 2016)
| | | Inception | | 1 Year | | 5 Years | | 10 Years | |
Class A | | 11/21/78 | | | | | | | | | | | | | |
Excluding sales charges | | | | | | | 7.19 | | | | 5.80 | | | | 4.99 | | |
Including sales charges | | | | | | | 3.96 | | | | 5.16 | | | | 4.67 | | |
Class B | | 05/05/92 | | | | | | | | | | | |
Excluding sales charges | | | | | | | 6.39 | | | | 5.02 | | | | 4.21 | | |
Including sales charges | | | | | | | 1.39 | | | | 4.69 | | | | 4.21 | | |
Class C | | 08/01/97 | | | | | | | | | | | | | |
Excluding sales charges | | | | | | | 6.42 | | | | 5.20 | | | | 4.38 | | |
Including sales charges | | | | | | | 5.42 | | | | 5.20 | | | | 4.38 | | |
Class R4* | | 03/19/13 | | | 7.40 | | | | 5.96 | | | | 5.07 | | |
Class R5* | | 12/11/13 | | | 7.47 | | | | 5.95 | | | | 5.06 | | |
Class Z | | 09/16/05 | | | 7.40 | | | | 6.02 | | | | 5.19 | | |
Barclays Municipal Bond Index | | | | | | | 6.94 | | | | 5.13 | | | | 5.01 | | |
Returns for Class A are shown with and without the maximum initial sales charge of 3.00%. Returns for Class B are shown with and without the applicable contingent deferred sales charge (CDSC) of 5.00% in the first year, declining to 1.00% in the sixth year and eliminated thereafter. Returns for Class C are shown with and without the 1.00% CDSC for the first year only. The Fund's other classes are not subject to sales charges and have limited eligibility. Please see the Fund's prospectus for details. Performance for different share classes will vary based on differences in sales charges and fees associated with each class. All results shown assume reinvestment of distributions during the period. Returns do not reflect the deduction of taxes that a shareholder may pay on Fund distributions or on the redemption of Fund shares. Performance results reflect the effect of any fee waivers or reimbursements of Fund expenses by Columbia Management Investment Advisers, LLC and/or any of its affiliates. Absent these fee waivers or expense reimbursement arrangements, performance results would have been lower.
The performance information shown represents past performance and is not a guarantee of future results. The investment return and principal value of your investment will fluctuate so that your shares, when redeemed, may be worth more or less than their original cost. Current performance may be lower or higher than the performance information shown. You may obtain performance information current to the most recent month-end by contacting your financial intermediary, visiting investor.columbiathreadneedleus.com or calling 800.345.6611.
*The returns shown for periods prior to the share class inception date (including returns for the Life of the Fund, if shown, which are since Fund inception) include the returns of the Fund's oldest share class. These returns are adjusted to reflect any higher class-related operating expenses of the newer share classes, as applicable. Please visit investor.columbiathreadneedle.com/us/investment-products/mutual-funds/appended-performance for more information.
The Barclays Municipal Bond Index is an unmanaged index considered representative of the broad market for investment-grade, tax-exempt bonds with a maturity of at least one year. Effective August 24, 2016, the Barclays Municipal Bond Index was rebranded as the Bloomberg Barclays Municipal Bond Index.
Indices are not available for investment, are not professionally managed and do not reflect sales charges, fees, brokerage commissions, taxes or other expenses of investing. Securities in the Fund may not match those in an index.
Annual Report 2016
2
PERFORMANCE OVERVIEW (continued)
Performance of a Hypothetical $10,000 Investment (August 1, 2006 – July 31, 2016)
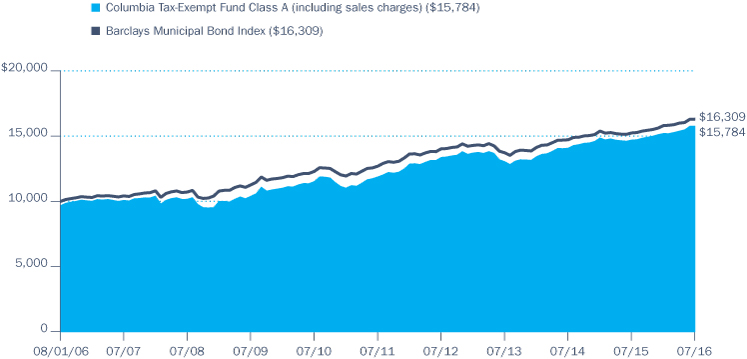
The chart above shows the change in value of a hypothetical $10,000 investment in Class A shares of Columbia Tax-Exempt Fund during the stated time period, and does not reflect the deduction of taxes that a shareholder may pay on Fund distributions or on the redemption of Fund shares.
Annual Report 2016
3
MANAGER DISCUSSION OF FUND PERFORMANCE
Portfolio Management
Kimberly Campbell
Top Ten States/Territories (%)
(at July 31, 2016) | |
Illinois | | | 14.1 | | |
California | | | 10.8 | | |
Texas | | | 10.7 | | |
Florida | | | 5.1 | | |
Massachusetts | | | 4.6 | | |
Pennsylvania | | | 4.4 | | |
New York | | | 4.3 | | |
Wisconsin | | | 3.5 | | |
Minnesota | | | 3.2 | | |
Louisiana | | | 3.1 | | |
Percentages indicated are based upon total investments (excluding Money Market Funds).
For further detail about these holdings, please refer to the section entitled "Portfolio of Investments."
Fund holdings are as of the date given, are subject to change at any time, and are not recommendations to buy or sell any security.
Quality Breakdown (%)
(at July 31, 2016) | |
AAA rating | | | 3.8 | | |
AA rating | | | 19.5 | | |
A rating | | | 33.7 | | |
BBB rating | | | 25.9 | | |
BB rating | | | 1.3 | | |
B rating | | | 0.6 | | |
CC rating | | | 0.1 | | |
C rating | | | 0.1 | | |
Not rated | | | 15.0 | | |
Total | | | 100.0 | | |
Percentages indicated are based upon total fixed income investments (excluding Money Market Funds).
Bond ratings apply to the underlying holdings of the Fund and not the Fund itself and are divided into categories ranging from highest to lowest credit quality, determined by using the middle rating of Moody's, S&P and Fitch, after dropping the highest and lowest available ratings. When ratings are available from only two rating agencies, the lower rating is used. When a rating is available from only one rating agency, that rating is used. When a bond is not rated by
For the 12-month period that ended July 31, 2016, the Fund's Class A shares returned 7.19% excluding sales charges. Class Z shares of the Fund returned 7.40%. The Fund outperformed its benchmark, the Barclays Municipal Bond Index, which returned 6.94% over the same 12-month period. Overweight positions in bonds with longer maturities and medium to lower credit quality ratings helped the Fund outperform its benchmark.
Strong Advance for Municipal Bonds
Municipal bonds benefited from a favorable backdrop during the 12 months ended July 31, 2016. The U.S. economy grew at a moderate pace, with positive trends in employment and housing. Improved economic growth, in turn, aided tax revenues, generally helping the credit outlook for municipal bond issuers. The default rate was relatively low, despite some negative headlines related to fiscal problems in Illinois and Puerto Rico. In December 2015, the Federal Reserve raised its target short-term rate for the first time since 2006 but took no further action during the period, as U.S. growth was mixed, inflation modest and subpar global economic growth continued. Yields remained at low levels during the period while government bonds were at or near negative yields. In June, the United Kingdom voted to leave the European Union, raising uncertainty that we believe further delayed prospects for another hike in U.S. short-term interest rates. In July, yields on 10- and 30-year U.S. Treasury bonds fell to record lows of 1.37% and 2.18%, respectively. Bond prices, which move in the opposite direction of yields, benefited.
Volatility in equity markets and low yields on government bonds helped push investors toward municipal issues, which offered attractive relative income and total return potential. Inflows into municipal bond funds turned positive in November 2015 and remained so for the remainder of the period, while new issue volume in the municipal market modestly declined.
Yield Curve Positioning and Duration Were Primary Contributors
The Fund was well positioned along the yield curve — a graph that plots bond yields from short to long maturities — with an overweight in long (15- to 30-year) maturity bonds and underweight in short (10-year and under) maturity issues. Long-term bonds significantly outperformed, as their yields declined and their prices rose much more than those on short-term issues. Within the benchmark, municipal bonds with maturities of 25 years and longer returned more than 11% this past year, while those in the five- to 10-year range gained approximately 6%. The Fund also benefited from having a longer duration (or more sensitivity to interest rate changes) than the benchmark, which helped as yields declined.
Quality Allocation Aided Performance
The Fund's overweight allocations to bonds rated between BBB and A helped drive it ahead of the benchmark, as both categories outperformed higher quality (AA and AAA) bonds. Within the benchmark, BBB and A rated bonds gained more than 8.0%, compared to 6.4% or less for AAA and AA bonds. The Fund's strong security selection in the BBB and A
Annual Report 2016
4
MANAGER DISCUSSION OF FUND PERFORMANCE (continued)
rated segments further aided relative performance, as did issue selection in the hospitals, transportation and education sectors. Overweight positions in the hospitals and transportation sectors, both of which offer a preponderance of BBB and A rated issues, posted strong gains and also helped relative performance.
A Few Disappointments
Positions in two resource recovery bonds that were not included in the benchmark detracted from relative performance. Both issuers rated below BBB, experienced severe financial and management problems that affected their production and maintenance activities, which led to a restructuring that began during the period. Resource recovery issuers typically recover a partially-used resource and recycle it into something useful.
Underweights in two strong-performing sectors, the leasing sector and the water and sewer sector hampered relative results. However, the water and sewer shortfall was partially offset by positive security selection within the group. During the period, we added modestly to the Fund's water and sewer stake; however, we did not find many compelling valuation opportunities relative to other sectors. A small overweight in pre-refunded bonds also detracted from results, as the sector had muted performance. Pre-refunding occurs when an issuer sells new bonds and invests the proceeds in U.S. Treasury securities that are pledged to pay off the older debt. The old bonds move into the "pre-refunded" sector until they are paid off, boosting their credit quality. However, when pre-refunding occurs, a bond's maturity shortens to its call date (the date the issuer can redeem it), a headwind during this period as shorter-maturity issues significantly underperformed longer-maturity ones.
Positioning at Period End
At period end, more than half of the Fund's assets were in A and BBB rated bonds. These medium quality issues typically offer more income than higher quality bonds and tend to be less sensitive to interest-rate fluctuations than higher quality issues. The Fund also remained overweight in the hospital and transportation sectors, both of which historically have had strong credit fundamentals and a preponderance of A and BBB rated bond issuance. In addition, we continued to favor bonds with 15-year and longer maturities, given their yield advantage over shorter-maturity issues.
During the period, positioning changes were relatively minor. Throughout the period, we added to bonds with 5% coupons, which offer a large cushion if yields should increase. As yields declined, we selectively purchased 4% coupon premium bonds that generally were of the same credit quality but which had a dollar price not as high as the issues with 5% coupons. We believed the 4% coupon bonds offer attractive risk adjusted returns (attractive yield for the credit quality). By period end, we had trimmed exposure to bonds with maturities under 10 years, including pre-refunded issues. As we found what we viewed as attractive valuation opportunities, we added to hospital, airport, transportation education and local general obligation bonds.
any rating agency, it is designated as "Not rated." Credit quality ratings assigned by a rating agency are subjective opinions, not statements of fact, and are subject to change, including daily. The ratings assigned by credit rating agencies are but one of the considerations that the Investment Manager and/or Fund's subadviser incorporates into its credit analysis process, along with such other issuer-specific factors as cash flows, capital structure and leverage ratios, ability to de-leverage (repay) through free cash flow, quality of management, market positioning and access to capital, as well as such security-specific factors as the terms of the security (e.g., interest rate and time to maturity) and the amount and type of any collateral.
Investment Risks
Fixed-income securities present issuer default risk. The Fund invests substantially in municipal securities and will be affected by tax, legislative, regulatory, demographic or political changes, as well as changes impacting a state's financial, economic or other conditions. A relatively small number of tax-exempt issuers may necessitate the Fund investing more heavily in a single issuer and, therefore, be more exposed to the risk of loss than a Fund that invests more broadly. Prepayment and extension risk exists because a loan, bond or other investment may be called, prepaid or redeemed before maturity and similar yielding investments may not be available for purchase. Market risk may affect a single issuer, sector of the economy, industry or the market as a whole. A rise in interest rates may result in a price decline of fixed-income instruments held by the Fund, negatively impacting its performance and NAV. Falling rates may result in the Fund investing in lower yielding debt instruments, lowering the Fund's income and yield. These risks may be heightened for longer maturity and duration securities. Federal and state tax rules apply to capital gain distributions and any gains or losses on sales. Income may be subject to state, local or alternative minimum taxes. See the Fund's prospectus for more information on these and other risks.
Annual Report 2016
5
UNDERSTANDING YOUR FUND'S EXPENSES
(Unaudited)
As an investor, you incur two types of costs. There are transaction costs, which generally include sales charges on purchases and may include redemption fees. There are also ongoing costs, which generally include management fees, distribution and/or service fees, and other fund expenses. The following information is intended to help you understand your ongoing costs (in dollars) of investing in the Fund and to help you compare these costs with the ongoing costs of investing in other mutual funds.
Analyzing Your Fund's Expenses
To illustrate these ongoing costs, we have provided examples and calculated the expenses paid by investors in each share class of the Fund during the period. The actual and hypothetical information in the table is based on an initial investment of $1,000 at the beginning of the period indicated and held for the entire period. Expense information is calculated two ways and each method provides you with different information. The amount listed in the "Actual" column is calculated using the Fund's actual operating expenses and total return for the period. You may use the Actual information, together with the amount invested, to estimate the expenses that you paid over the period. Simply divide your account value by $1,000 (for example, an $8,600 account value divided by $1,000 = 8.6), then multiply the results by the expenses paid during the period under the "Actual" column. The amount listed in the "Hypothetical" column assumes a 5% annual rate of return before expenses (which is not the Fund's actual return) and then applies the Fund's actual expense ratio for the period to the hypothetical return. You should not use the hypothetical account values and expenses to estimate either your actual account balance at the end of the period or the expenses you paid during the period. See "Compare With Other Funds" below for details on how to use the hypothetical data.
Compare With Other Funds
Since all mutual funds are required to include the same hypothetical calculations about expenses in shareholder reports, you can use this information to compare the ongoing cost of investing in the Fund with other funds. To do so, compare the hypothetical example with the 5% hypothetical examples that appear in the shareholder reports of other funds. As you compare hypothetical examples of other funds, it is important to note that hypothetical examples are meant to highlight the ongoing costs of investing in a fund only and do not reflect any transaction costs, such as sales charges, or redemption or exchange fees. Therefore, the hypothetical calculations are useful in comparing ongoing costs only, and will not help you determine the relative total costs of owning different funds. If transaction costs were included in these calculations, your costs would be higher.
February 1, 2016 – July 31, 2016
| | | Account Value at the Beginning
of the Period ($) | | Account Value at the End of the
Period ($) | | Expenses Paid During the
Period ($) | | Fund's Annualized
Expense Ratio (%) | |
| | | Actual | | Hypothetical | | Actual | | Hypothetical | | Actual | | Hypothetical | | Actual | |
Class A | | | 1,000.00 | | | | 1,000.00 | | | | 1,036.50 | | | | 1,021.08 | | | | 3.85 | | | | 3.82 | | | | 0.76 | | |
Class B | | | 1,000.00 | | | | 1,000.00 | | | | 1,032.70 | | | | 1,017.35 | | | | 7.63 | | | | 7.57 | | | | 1.51 | | |
Class C | | | 1,000.00 | | | | 1,000.00 | | | | 1,033.20 | | | | 1,017.85 | | | | 7.13 | | | | 7.07 | | | | 1.41 | | |
Class R4 | | | 1,000.00 | | | | 1,000.00 | | | | 1,038.30 | | | | 1,022.08 | | | | 2.84 | | | | 2.82 | | | | 0.56 | | |
Class R5 | | | 1,000.00 | | | | 1,000.00 | | | | 1,037.90 | | | | 1,022.38 | | | | 2.53 | | | | 2.51 | | | | 0.50 | | |
Class Z | | | 1,000.00 | | | | 1,000.00 | | | | 1,037.60 | | | | 1,022.08 | | | | 2.84 | | | | 2.82 | | | | 0.56 | | |
Expenses paid during the period are equal to the annualized expense ratio for each class as indicated above, multiplied by the average account value over the period and then multiplied by the number of days in the Fund's most recent fiscal half year and divided by 366.
Expenses do not include fees and expenses incurred indirectly by the Fund from its investment in underlying funds, including affiliated and non-affiliated pooled investment vehicles, such as mutual funds and exchange-traded funds.
Had Columbia Management Investment Advisers, LLC and/or certain of its affiliates not waived/reimbursed certain fees and expenses, account value at the end of the period would have been reduced.
Annual Report 2016
6
PORTFOLIO OF INVESTMENTS
July 31, 2016
(Percentages represent value of investments compared to net assets)
Municipal Bonds 98.6%
Issue
Description | | Coupon
Rate | | Principal
Amount ($) | |
Value ($) | |
ALABAMA 1.0% | |
County of Jefferson
Revenue Bonds
Series 2004A
01/01/23 | | | 5.250 | % | | | 7,500,000 | | | | 7,543,725 | | |
Lower Alabama Gas District (The)
Revenue Bonds
Series 2016A
09/01/46 | | | 5.000 | % | | | 24,385,000 | | | | 33,407,206 | | |
Total | | | | | | | 40,950,931 | | |
ALASKA 0.6% | |
City of Koyukuk
Prerefunded 10/01/19 Revenue Bonds
Tanana Chiefs Conference Health Care
Series 2011
10/01/32 | | | 7.500 | % | | | 18,330,000 | | | | 22,082,151 | | |
10/01/41 | | | 7.750 | % | | | 4,350,000 | | | | 5,274,375 | | |
Total | | | | | | | 27,356,526 | | |
ARIZONA 1.9% | |
Arizona Health Facilities Authority
Refunding Revenue Bonds
Scottsdale Lincoln Hospital Project
Series 2014
12/01/42 | | | 5.000 | % | | | 7,000,000 | | | | 8,321,250 | | |
Revenue Bonds
Banner Health
Series 2008D
01/01/32 | | | 5.375 | % | | | 7,800,000 | | | | 8,290,932 | | |
Series 2014A
01/01/44 | | | 5.000 | % | | | 15,000,000 | | | | 17,737,500 | | |
Glendale Industrial Development Authority
Revenue Bonds
Midwestern University
Series 2010
05/15/35 | | | 5.000 | % | | | 13,750,000 | | | | 15,485,387 | | |
Industrial Development Authority of the County of Pima (The)(a)
Revenue Bonds
GNMA Mortgage-Backed Securities
Series 1989 Escrowed to Maturity AMT
09/01/21 | | | 8.200 | % | | | 8,085,000 | | | | 9,958,780 | | |
Industrial Development Authority of the County of Pima (The)(b)
Refunding Revenue Bonds
American Leadership Academy
Series 2015
06/15/45 | | | 5.625 | % | | | 2,680,000 | | | | 2,846,106 | | |
Maricopa County Pollution Control Corp.
Refunding Revenue Bonds
Southern California Edison Co.
Series 2000B
06/01/35 | | | 5.000 | % | | | 9,775,000 | | | | 11,044,186 | | |
Municipal Bonds (continued)
Issue
Description | | Coupon
Rate | | Principal
Amount ($) | |
Value ($) | |
Salt Verde Financial Corp.
Revenue Bonds
Senior Series 2007
12/01/32 | | | 5.000 | % | | | 5,400,000 | | | | 6,762,744 | | |
Total | | | | | | | 80,446,885 | | |
ARKANSAS 0.3% | |
Pulaski County Public Facilities Board
Revenue Bonds
Series 2014
12/01/39 | | | 5.000 | % | | | 8,725,000 | | | | 10,285,466 | | |
12/01/42 | | | 5.000 | % | | | 2,000,000 | | | | 2,362,640 | | |
Total | | | | | | | 12,648,106 | | |
CALIFORNIA 10.8% | |
ABAG Finance Authority for Nonprofit Corps.
Refunding Revenue Bonds
Episcopal Senior Communities
Series 2011
07/01/26 | | | 6.125 | % | | | 3,420,000 | | | | 4,056,975 | | |
07/01/41 | | | 6.125 | % | | | 7,015,000 | | | | 8,171,563 | | |
Revenue Bonds
Sharp Healthcare
Series 2009
08/01/39 | | | 6.250 | % | | | 4,000,000 | | | | 4,639,640 | | |
Agua Caliente Band of Cahuilla Indians
Revenue Bonds
Series 2003(b)(c)
07/01/18 | | | 6.000 | % | | | 865,000 | | | | 864,931 | | |
Cabazon Band Mission Indians(b)(c)(d)
Revenue Bonds
Mortgage Notes
Series 2004
10/01/11 | | | 0.000 | % | | | 379,550 | | | | 127,145 | | |
01/01/16 | | | 8.375 | % | | | 1,740,000 | | | | 582,883 | | |
10/01/19 | | | 0.000 | % | | | 8,670,000 | | | | 2,904,363 | | |
Series 2010
10/01/20 | | | 0.000 | % | | | 1,415,000 | | | | 474,011 | | |
California Health Facilities Financing Authority
Prerefunded 10/01/18 Revenue Bonds
Providence Health
Series 2008
10/01/38 | | | 6.500 | % | | | 110,000 | | | | 123,996 | | |
Providence Health & Services
Series 2008C
10/01/28 | | | 6.250 | % | | | 2,000,000 | | | | 2,246,040 | | |
California Municipal Finance Authority
Revenue Bonds
Biola University
Series 2008
10/01/34 | | | 5.875 | % | | | 4,000,000 | | | | 4,305,680 | | |
The accompanying Notes to Financial Statements are an integral part of this statement.
Annual Report 2016
7
PORTFOLIO OF INVESTMENTS (continued)
July 31, 2016
Municipal Bonds (continued)
Issue
Description | | Coupon
Rate | | Principal
Amount ($) | |
Value ($) | |
California Municipal Finance Authority(a)(b)(d)
Revenue Bonds
UTS Renewable Energy-Waste Water Facilities
Series 2011 AMT
12/01/32 | | | 7.500 | % | | | 1,830,000 | | | | 1,372,500 | | |
California Pollution Control Financing Authority
Revenue Bonds
Aemerge Redpak Services Southern California, LLC
Project
Series 2016 AMT(a)(b)
12/01/27 | | | 7.000 | % | | | 2,000,000 | | | | 2,043,140 | | |
California School Finance Authority(b)
Revenue Bonds
River Springs Charter School Project
Series 2015
07/01/46 | | | 6.375 | % | | | 3,000,000 | | | | 3,246,720 | | |
07/01/46 | | | 6.375 | % | | | 415,000 | | | | 449,130 | | |
California State Public Works Board
Revenue Bonds
Various Capital Projects
Series 2012A
04/01/37 | | | 5.000 | % | | | 4,660,000 | | | | 5,452,340 | | |
Subordinated Series 2009I-1
11/01/29 | | | 6.125 | % | | | 6,000,000 | | | | 7,035,540 | | |
Various Correctional Facilities
Series 2014A
09/01/39 | | | 5.000 | % | | | 7,000,000 | | | | 8,497,020 | | |
California Statewide Communities Development Authority
Prerefunded 01/01/19 Revenue Bonds
Aspire Public Schools
Series 2010
07/01/30 | | | 6.000 | % | | | 3,555,000 | | | | 4,005,810 | | |
Prerefunded 05/15/18 Revenue Bonds
University of California Irvine East Campus Apartments
Series 2008
05/15/32 | | | 5.750 | % | | | 5,500,000 | | | | 6,010,180 | | |
Refunding Revenue Bonds
899 Charleston Project
Series 2014A
11/01/29 | | | 5.000 | % | | | 1,650,000 | | | | 1,841,070 | | |
11/01/34 | | | 5.000 | % | | | 3,700,000 | | | | 4,114,400 | | |
Revenue Bonds
California Baptist University
Series 2014A
11/01/33 | | | 6.125 | % | | | 1,560,000 | | | | 1,801,909 | | |
11/01/43 | | | 6.375 | % | | | 1,035,000 | | | | 1,205,040 | | |
John Muir Health
Series 2006A
08/15/32 | | | 5.000 | % | | | 1,000,000 | | | | 1,002,040 | | |
Lancer Plaza Project
Series 2013
11/01/43 | | | 5.875 | % | | | 1,875,000 | | | | 2,023,912 | | |
Loma Linda University Medical Center
Series 2014
12/01/44 | | | 5.250 | % | | | 3,500,000 | | | | 4,026,890 | | |
Municipal Bonds (continued)
Issue
Description | | Coupon
Rate | | Principal
Amount ($) | |
Value ($) | |
Castaic Lake Water Agency
Certificate of Participation
Capital Appreciation-Water System Improvement Project
Series 1999 (AMBAC)(e)
08/01/24 | | | 0.000 | % | | | 9,445,000 | | | | 8,103,054 | | |
Chino Public Financing Authority
Refunding Special Tax Bonds
Series 2012
09/01/22 | | | 4.000 | % | | | 1,500,000 | | | | 1,682,730 | | |
09/01/24 | | | 5.000 | % | | | 1,110,000 | | | | 1,298,112 | | |
09/01/25 | | | 5.000 | % | | | 790,000 | | | | 915,065 | | |
09/01/26 | | | 5.000 | % | | | 1,230,000 | | | | 1,417,157 | | |
09/01/27 | | | 5.000 | % | | | 1,280,000 | | | | 1,465,626 | | |
City of Pomona
Refunding Revenue Bonds
Mortgage-Backed Securities
Series 1990A Escrowed to Maturity (GNMA/FNMA)
05/01/23 | | | 7.600 | % | | | 5,575,000 | | | | 6,864,776 | | |
City of Vernon Electric System
Prerefunded 08/01/19 Revenue Bonds
Series 2009A
08/01/21 | | | 5.125 | % | | | 640,000 | | | | 696,755 | | |
Unrefunded Revenue Bonds
Series 2009A
08/01/21 | | | 5.125 | % | | | 1,490,000 | | | | 1,664,315 | | |
County of Sacramento Airport System
Revenue Bonds
Senior Series 2009B
07/01/39 | | | 5.750 | % | | | 4,000,000 | | | | 4,372,480 | | |
Foothill-Eastern Transportation Corridor Agency
Refunding Revenue Bonds
Junior Lien
Series 2014C
01/15/33 | | | 6.250 | % | | | 3,845,000 | | | | 4,660,448 | | |
Series 2014A
01/15/46 | | | 5.750 | % | | | 19,005,000 | | | | 22,727,889 | | |
Foothill-Eastern Transportation Corridor Agency(e)
Revenue Bonds
Capital Appreciation-Senior Lien
Series 1995A Escrowed to Maturity
01/01/18 | | | 0.000 | % | | | 10,000,000 | | | | 9,885,700 | | |
Los Angeles County Schools Regionalized Business
Services Corp.
Certificate of Participation
Capital Appreciation-Pooled Financing
Series 1999A (AMBAC)(e)
08/01/22 | | | 0.000 | % | | | 2,180,000 | | | | 1,924,962 | | |
Los Angeles Unified School District
Unlimited General Obligation Bonds
Series 2009I
07/01/29 | | | 5.000 | % | | | 4,800,000 | | | | 5,380,416 | | |
The accompanying Notes to Financial Statements are an integral part of this statement.
Annual Report 2016
8
PORTFOLIO OF INVESTMENTS (continued)
July 31, 2016
Municipal Bonds (continued)
Issue
Description | | Coupon
Rate | | Principal
Amount ($) | |
Value ($) | |
Norwalk-La Mirada Unified School District
Unlimited General Obligation Bonds
Capital Appreciation
Series 2005B (NPFGC)(e)
08/01/23 | | | 0.000 | % | | | 9,790,000 | | | | 8,529,342 | | |
Perris Community Facilities District
Special Tax Bonds
Series 1991-90-2 Escrowed to Maturity
10/01/21 | | | 8.750 | % | | | 6,165,000 | | | | 8,500,734 | | |
San Francisco City & County Airports Commission-San
Francisco International Airport
Revenue Bonds
Series 2014A AMT(a)
05/01/44 | | | 5.000 | % | | | 24,000,000 | | | | 27,966,000 | | |
San Francisco City & County Redevelopment Agency
Prerefunded 08/01/19 Tax Allocation Bonds
Mission Bay South Redevelopment Project
Series 2009D
08/01/31 | | | 6.500 | % | | | 500,000 | | | | 586,945 | | |
08/01/39 | | | 6.625 | % | | | 1,500,000 | | | | 1,766,400 | | |
State of California
Prerefunded 10/01/16 Unlimited General Obligation Bonds
Series 2006
10/01/36 | | | 4.500 | % | | | 755,000 | | | | 760,376 | | |
Unlimited General Obligation Bonds
Various Purpose
Series 2007
12/01/32 | | | 5.000 | % | | | 8,000,000 | | | | 8,450,880 | | |
11/01/37 | | | 5.000 | % | | | 18,000,000 | | | | 18,928,440 | | |
12/01/37 | | | 5.000 | % | | | 10,200,000 | | | | 10,760,796 | | |
Series 2008
03/01/27 | | | 5.500 | % | | | 1,000,000 | | | | 1,075,790 | | |
03/01/38 | | | 5.250 | % | | | 8,250,000 | | | | 8,820,240 | | |
Series 2009
04/01/31 | | | 5.750 | % | | | 32,500,000 | | | | 36,716,875 | | |
04/01/35 | | | 6.000 | % | | | 15,000,000 | | | | 17,031,300 | | |
04/01/38 | | | 6.000 | % | | | 22,500,000 | | | | 25,546,950 | | |
11/01/39 | | | 5.500 | % | | | 15,520,000 | | | | 17,767,451 | | |
Series 2010
03/01/30 | | | 5.250 | % | | | 3,000,000 | | | | 3,430,050 | | |
03/01/33 | | | 6.000 | % | | | 5,000,000 | | | | 5,900,450 | | |
03/01/40 | | | 5.500 | % | | | 17,200,000 | | | | 19,744,396 | | |
Series 2011
09/01/30 | | | 5.250 | % | | | 8,750,000 | | | | 10,513,387 | | |
Series 2012
04/01/35 | | | 5.250 | % | | | 19,275,000 | | | | 23,225,797 | | |
Series 2016
09/01/35 | | | 4.000 | % | | | 3,895,000 | | | | 4,446,649 | | |
Unlimited General Obligation Refunding Bonds
Series 2007
08/01/30 | | | 4.500 | % | | | 34,950,000 | | | | 35,592,031 | | |
Unlimited General Obligation Refunding Notes
Various Purpose
Series 2016
09/01/36 | | | 4.000 | % | | | 2,000,000 | | | | 2,277,500 | | |
Municipal Bonds (continued)
Issue
Description | | Coupon
Rate | | Principal
Amount ($) | |
Value ($) | |
Unrefunded Unlimited General Obligation Bonds
Series 2004
04/01/29 | | | 5.300 | % | | | 6,000 | | | | 6,024 | | |
Temecula Public Financing Authority
Refunding Special Tax Bonds
Wolf Creek Community Facilities District
Series 2012
09/01/27 | | | 5.000 | % | | | 1,275,000 | | | | 1,475,532 | | |
09/01/28 | | | 5.000 | % | | | 1,315,000 | | | | 1,516,432 | | |
09/01/29 | | | 5.000 | % | | | 1,405,000 | | | | 1,612,476 | | |
09/01/30 | | | 5.000 | % | | | 1,480,000 | | | | 1,694,926 | | |
09/01/31 | | | 5.000 | % | | | 1,555,000 | | | | 1,774,208 | | |
West Contra Costa Unified School District
Unlimited General Obligation Refunding Bonds
Series 2001B (NPFGC)
08/01/24 | | | 6.000 | % | | | 2,320,000 | | | | 2,774,906 | | |
Total | | | | | | | 464,877,636 | | |
COLORADO 2.3% | |
City & County of Denver
Refunding Revenue Bonds
United Air Lines Project
Series 2007A AMT(a)
10/01/32 | | | 5.250 | % | | | 5,000,000 | | | | 5,189,750 | | |
Colorado Educational & Cultural Facilities Authority
Refunding Revenue Bonds
Student Housing-Campus Village Apartments LLC
Series 2008
06/01/33 | | | 5.500 | % | | | 2,000,000 | | | | 2,154,480 | | |
06/01/38 | | | 5.500 | % | | | 6,000,000 | | | | 6,463,440 | | |
Colorado Educational & Cultural Facilities Authority(b)
Improvement Refunding Revenue Bonds
Skyview Charter School
Series 2014
07/01/34 | | | 5.125 | % | | | 1,525,000 | | | | 1,666,978 | | |
07/01/44 | | | 5.375 | % | | | 2,100,000 | | | | 2,302,545 | | |
07/01/49 | | | 5.500 | % | | | 925,000 | | | | 1,016,076 | | |
Colorado Health Facilities Authority
Refunding Revenue Bonds
Covenant Retirement Communities
Series 2012A
12/01/33 | | | 5.000 | % | | | 5,500,000 | | | | 6,184,530 | | |
Series 2015
12/01/35 | | | 5.000 | % | | | 3,800,000 | | | | 4,382,882 | | |
Valley View Hospital Association
Series 2008
05/15/28 | | | 5.500 | % | | | 5,745,000 | | | | 6,184,952 | | |
Revenue Bonds
Catholic Health Initiatives
Series 2013A
01/01/45 | | | 5.250 | % | | | 10,000,000 | | | | 11,481,400 | | |
Unrefunded Revenue Bonds
Health Facilities Evangelical Lutheran
Series 2005
06/01/23 | | | 5.250 | % | | | 310,000 | | | | 311,094 | | |
The accompanying Notes to Financial Statements are an integral part of this statement.
Annual Report 2016
9
PORTFOLIO OF INVESTMENTS (continued)
July 31, 2016
Municipal Bonds (continued)
Issue
Description | | Coupon
Rate | | Principal
Amount ($) | |
Value ($) | |
E-470 Public Highway Authority
Revenue Bonds
Series 2010C
09/01/26 | | | 5.375 | % | | | 5,000,000 | | | | 5,672,250 | | |
E-470 Public Highway Authority(e)
Revenue Bonds
Capital Appreciation
Senior Series 1997B (NPFGC)
09/01/22 | | | 0.000 | % | | | 6,515,000 | | | | 5,838,026 | | |
Senior Series 2000B (NPFGC)
09/01/18 | | | 0.000 | % | | | 18,600,000 | | | | 18,073,248 | | |
Foothills Metropolitan District
Special Assessment Bonds
Series 2014
12/01/30 | | | 5.750 | % | | | 1,500,000 | | | | 1,652,790 | | |
North Range Metropolitan District No. 2
Limited Tax General Obligation Bonds
Series 2007
12/15/27 | | | 5.500 | % | | | 2,765,000 | | | | 2,812,005 | | |
12/15/37 | | | 5.500 | % | | | 3,100,000 | | | | 3,144,516 | | |
University of Colorado Hospital Authority
Refunding Revenue Bonds
Series 2009A
11/15/29 | | | 6.000 | % | | | 5,000,000 | | | | 5,752,700 | | |
Revenue Bonds
Series 2012A
11/15/42 | | | 5.000 | % | | | 7,325,000 | | | | 8,608,926 | | |
Total | | | | | | | 98,892,588 | | |
CONNECTICUT 0.8% | |
Bridgeport Housing Authority
Revenue Bonds
Custodial Receipts Energy Performance
Series 2009
06/01/30 | | | 5.600 | % | | | 1,000,000 | | | | 1,009,330 | | |
City of New Haven
Unlimited General Obligation Bonds
Series 2002C Escrowed to Maturity (NPFGC)
11/01/20 | | | 5.000 | % | | | 10,000 | | | | 10,356 | | |
Connecticut Housing Finance Authority
Revenue Bonds
State Supported Special Obligation
Series 2009-10
06/15/28 | | | 5.000 | % | | | 750,000 | | | | 824,948 | | |
Connecticut State Development Authority
Refunding Revenue Bonds
Connecticut Light & Power Co. Project
Series 2011
09/01/28 | | | 4.375 | % | | | 1,500,000 | | | | 1,692,705 | | |
Municipal Bonds (continued)
Issue
Description | | Coupon
Rate | | Principal
Amount ($) | |
Value ($) | |
Connecticut State Health & Educational Facility Authority
Revenue Bonds
Connecticut College
Series 2011H-1
07/01/41 | | | 5.000 | % | | | 1,625,000 | | | | 1,873,024 | | |
Danbury Hospital
Series 2006H (AMBAC)
07/01/33 | | | 4.500 | % | | | 2,000,000 | | | | 2,003,020 | | |
Loomis Chaffe School
Series 2005F (AMBAC)
07/01/25 | | | 5.250 | % | | | 2,035,000 | | | | 2,620,999 | | |
07/01/26 | | | 5.250 | % | | | 1,045,000 | | | | 1,366,285 | | |
Middlesex Hospital
Series 2011N
07/01/24 | | | 5.000 | % | | | 425,000 | | | | 489,974 | | |
07/01/26 | | | 5.000 | % | | | 900,000 | | | | 1,027,323 | | |
Sacred Heart University
Series 2011G
07/01/31 | | | 5.375 | % | | | 500,000 | | | | 573,665 | | |
Stamford Hospital
Series 2012J
07/01/37 | | | 5.000 | % | | | 1,000,000 | | | | 1,126,250 | | |
State Supported Child Care
Series 2011
07/01/28 | | | 5.000 | % | | | 1,030,000 | | | | 1,175,714 | | |
07/01/29 | | | 5.000 | % | | | 860,000 | | | | 979,497 | | |
Western Connecticut Health
Series 2011M
07/01/41 | | | 5.375 | % | | | 1,500,000 | | | | 1,714,965 | | |
Western Connecticut Health Network
Series 2011
07/01/29 | | | 5.000 | % | | | 1,000,000 | | | | 1,135,930 | | |
Connecticut State Health & Educational Facility Authority(b)
Revenue Bonds
Church Home of Hartford, Inc.
Series 2016
09/01/46 | | | 5.000 | % | | | 1,250,000 | | | | 1,384,450 | | |
Harbor Point Infrastructure Improvement District
Tax Allocation Bonds
Harbor Point Project
Series 2010A
04/01/39 | | | 7.875 | % | | | 8,750,000 | | | | 10,339,262 | | |
New Haven Solid Waste Authority
Revenue Bonds
Series 2008
06/01/28 | | | 5.375 | % | | | 1,750,000 | | | | 1,864,625 | | |
University of Connecticut
Revenue Bonds
Series 2009A
02/15/28 | | | 5.000 | % | | | 500,000 | | | | 550,670 | | |
Total | | | | | | | 33,762,992 | | |
The accompanying Notes to Financial Statements are an integral part of this statement.
Annual Report 2016
10
PORTFOLIO OF INVESTMENTS (continued)
July 31, 2016
Municipal Bonds (continued)
Issue
Description | | Coupon
Rate | | Principal
Amount ($) | |
Value ($) | |
DELAWARE 0.2% | |
Delaware State Economic Development Authority
Refunding Revenue Bonds
Gas Facilities-Delmarva Power
Series 2010
02/01/31 | | | 5.400 | % | | | 5,000,000 | | | | 5,650,450 | | |
Revenue Bonds
Newark Charter School
Series 2012
09/01/32 | | | 4.625 | % | | | 2,000,000 | | | | 2,167,100 | | |
09/01/42 | | | 5.000 | % | | | 1,350,000 | | | | 1,495,273 | | |
Total | | | | | | | 9,312,823 | | |
DISTRICT OF COLUMBIA 0.6% | |
District of Columbia
Refunding Revenue Bonds
Children's Hospital
Series 2015
07/15/44 | | | 5.000 | % | | | 9,090,000 | | | | 10,917,726 | | |
Friendship Public Charter School
Series 2016
06/01/46 | | | 5.000 | % | | | 1,385,000 | | | | 1,570,175 | | |
Revenue Bonds
KIPP Charter School
Series 2013
07/01/33 | | | 6.000 | % | | | 250,000 | | | | 301,695 | | |
07/01/48 | | | 6.000 | % | | | 1,150,000 | | | | 1,376,642 | | |
Metropolitan Washington Airports Authority
Refunding Revenue Bonds
Series 2016 AMT(a)
10/01/36 | | | 4.000 | % | | | 12,500,000 | | | | 13,761,250 | | |
Total | | | | | | | 27,927,488 | | |
FLORIDA 5.1% | |
Brevard County Housing Finance Authority
Revenue Bonds
Compound Interest
Series 1985 (FGIC/MGIC)(e)
04/01/17 | | | 0.000 | % | | | 375,000 | | | | 350,066 | | |
Capital Trust Agency, Inc.(b)
Revenue Bonds
1st Mortgage Tallahassee Tapestry Senior Housing Project
Series 2015
12/01/45 | | | 7.000 | % | | | 1,665,000 | | | | 1,748,550 | | |
Capital Trust Agency, Inc.(d)
Revenue Bonds
Atlantic Housing Foundation
Subordinated Series 2008B
07/15/32 | | | 0.000 | % | | | 1,820,000 | | | | 909,982 | | |
City of Lakeland
Revenue Bonds
Lakeland Regional Health
Series 2015
11/15/45 | | | 5.000 | % | | | 22,000,000 | | | | 25,719,100 | | |
Municipal Bonds (continued)
Issue
Description | | Coupon
Rate | | Principal
Amount ($) | |
Value ($) | |
County of Broward Airport System(a)
Refunding Revenue Bonds
Series 2012P-1 AMT
10/01/25 | | | 5.000 | % | | | 6,000,000 | | | | 7,070,640 | | |
Revenue Bonds
Series 2015A AMT
10/01/45 | | | 5.000 | % | | | 14,000,000 | | | | 16,488,080 | | |
County of Miami-Dade Aviation(a)
Refunding Revenue Bonds
Series 2014A AMT
10/01/33 | | | 5.000 | % | | | 10,000,000 | | | | 11,804,800 | | |
10/01/36 | | | 5.000 | % | | | 21,400,000 | | | | 24,935,922 | | |
County of Seminole Water & Sewer
Revenue Bonds
Series 1992 Escrowed to Maturity (NPFGC)
10/01/19 | | | 6.000 | % | | | 930,000 | | | | 1,008,074 | | |
Florida Development Finance Corp.
Revenue Bonds
Renaissance Charter School
Series 2012A
06/15/22 | | | 5.500 | % | | | 1,240,000 | | | | 1,376,226 | | |
06/15/32 | | | 6.000 | % | | | 4,000,000 | | | | 4,430,600 | | |
06/15/43 | | | 6.125 | % | | | 5,000,000 | | | | 5,545,850 | | |
Renaissance Charter School Projects
Series 2013A
06/15/44 | | | 8.500 | % | | | 15,000,000 | | | | 17,744,550 | | |
Florida Development Finance Corp.(b)
Revenue Bonds
Miami Arts Charter School Project
Series 2014A
06/15/34 | | | 5.875 | % | | | 420,000 | | | | 446,611 | | |
06/15/44 | | | 6.000 | % | | | 3,100,000 | | | | 3,291,332 | | |
Renaissance Charter School
Series 2015
06/15/46 | | | 6.125 | % | | | 4,000,000 | | | | 4,244,240 | | |
Renaissance Charter School Inc. Projects
Series 2015
06/15/35 | | | 6.000 | % | | | 4,000,000 | | | | 4,245,400 | | |
Highlands County Health Facilities Authority
Prerefunded 11/15/16 Revenue Bonds
Adventist Health
Series 2006G
11/15/21 | | | 5.125 | % | | | 70,000 | | | | 70,949 | | |
Hillsborough County Aviation Authority
Revenue Bonds
Tampa International Airport
Series 2015A
10/01/44 | | | 5.000 | % | | | 11,115,000 | | | | 13,247,635 | | |
Jacksonville Health Facilities Authority
Revenue Bonds
Brooks Health System
Series 2007
11/01/38 | | | 5.250 | % | | | 5,000,000 | | | | 5,209,850 | | |
The accompanying Notes to Financial Statements are an integral part of this statement.
Annual Report 2016
11
PORTFOLIO OF INVESTMENTS (continued)
July 31, 2016
Municipal Bonds (continued)
Issue
Description | | Coupon
Rate | | Principal
Amount ($) | |
Value ($) | |
Miami-Dade County Expressway Authority
Revenue Bonds
Series 2014A
07/01/44 | | | 5.000 | % | | | 5,000,000 | | | | 5,877,550 | | |
Mid-Bay Bridge Authority
Prerefunded 10/01/21 Revenue Bonds
Series 2011A
10/01/40 | | | 7.250 | % | | | 7,000,000 | | | | 9,162,650 | | |
Refunding Revenue Bonds
Series 2015A
10/01/35 | | | 5.000 | % | | | 3,765,000 | | | | 4,450,832 | | |
Revenue Bonds
Series 1991A Escrowed to Maturity
10/01/22 | | | 6.875 | % | | | 2,000,000 | | | | 2,486,840 | | |
Orange County Industrial Development Authority
Revenue Bonds
VITAG Florida LLC Project
Series 2014 AMT(a)(b)
07/01/36 | | | 8.000 | % | | | 12,000,000 | | | | 12,720,000 | | |
Palm Beach County Health Facilities Authority
Refunding Revenue Bonds
Boca Raton Community Hospital Obligation Group
Series 2014
12/01/31 | | | 5.000 | % | | | 1,500,000 | | | | 1,770,735 | | |
Revenue Bonds
Sinai Residences of Boca Raton
Series 2014
06/01/34 | | | 7.250 | % | | | 685,000 | | | | 841,584 | | |
Sarasota County Public Hospital District
Refunding Revenue Bonds
Sarasota Memorial Hospital
Series 1998B (NPFGC)
07/01/28 | | | 5.500 | % | | | 6,980,000 | | | | 8,787,960 | | |
Seminole Tribe of Florida, Inc.
Revenue Bonds
Series 2007A(b)(c)
10/01/27 | | | 5.250 | % | | | 9,750,000 | | | | 10,145,167 | | |
State of Florida
Unlimited General Obligation Bonds
Capital Outlay 2008
Series 2009B
06/01/26 | | | 5.000 | % | | | 5,525,000 | | | | 6,008,272 | | |
Tampa Sports Authority
Sales Tax Revenue Bonds
Tampa Bay Arena Project
Series 1995 (NPFGC)
10/01/25 | | | 5.750 | % | | | 2,500,000 | | | | 3,052,925 | | |
Waterset North Community Development District
Special Assessment Bonds
Series 2007A
05/01/39 | | | 6.600 | % | | | 2,705,000 | | | | 2,713,629 | | |
Total | | | | | | | 217,906,601 | | |
Municipal Bonds (continued)
Issue
Description | | Coupon
Rate | | Principal
Amount ($) | |
Value ($) | |
GEORGIA 1.3% | |
Barnesville-Lamar County Industrial Development Authority
Revenue Bonds
Gordon College Properties
Series 2004A
08/01/25 | | | 5.000 | % | | | 1,250,000 | | | | 1,254,550 | | |
DeKalb County Hospital Authority
Revenue Bonds
DeKalb Medical Center, Inc. Project
Series 2010
09/01/40 | | | 6.125 | % | | | 6,250,000 | | | | 7,201,438 | | |
Gainesville & Hall County Hospital Authority
Revenue Bonds
Northeast Georgia Healthcare
Series 2010A
02/15/45 | | | 5.500 | % | | | 30,000,000 | | | | 33,971,400 | | |
Georgia State Road & Tollway Authority
Revenue Bonds
I-75 S Express Lanes Project
Series 2014(b)(e)
06/01/24 | | | 0.000 | % | | | 625,000 | | | | 412,231 | | |
Metropolitan Atlanta Rapid Transit Authority
Refunding Revenue Bonds
Series 1992N
07/01/18 | | | 6.250 | % | | | 155,000 | | | | 166,106 | | |
Series 1992P (AMBAC)
07/01/20 | | | 6.250 | % | | | 1,865,000 | | | | 2,093,257 | | |
Series 2007A (AMBAC)
07/01/26 | | | 5.250 | % | | | 1,000,000 | | | | 1,309,570 | | |
Municipal Electric Authority of Georgia
Revenue Bonds
Series 1991V Escrowed to Maturity (NPFGC IBC)
01/01/18 | | | 6.600 | % | | | 1,880,000 | | | | 1,979,208 | | |
Unrefunded Revenue Bonds
Series 1991V (NPFGC)
01/01/18 | | | 6.600 | % | | | 4,610,000 | | | | 4,818,095 | | |
Rockdale County Development Authority
Revenue Bonds
Visy Paper Project
Series 2007A AMT(a)
01/01/34 | | | 6.125 | % | | | 3,000,000 | | | | 3,040,320 | | |
Total | | | | | | | 56,246,175 | | |
GUAM 0.1% | |
Territory of Guam
Revenue Bonds
Section 30
Series 2009A(c)
12/01/34 | | | 5.750 | % | | | 4,150,000 | | | | 4,641,526 | | |
The accompanying Notes to Financial Statements are an integral part of this statement.
Annual Report 2016
12
PORTFOLIO OF INVESTMENTS (continued)
July 31, 2016
Municipal Bonds (continued)
Issue
Description | | Coupon
Rate | | Principal
Amount ($) | |
Value ($) | |
HAWAII 0.7% | |
Hawaii Pacific Health
Revenue Bonds
Series 2010A
07/01/40 | | | 5.500 | % | | | 6,500,000 | | | | 7,348,770 | | |
Series 2010B
07/01/30 | | | 5.625 | % | | | 1,220,000 | | | | 1,402,927 | | |
07/01/40 | | | 5.750 | % | | | 1,630,000 | | | | 1,862,764 | | |
State of Hawaii Airports System
Certificate of Participation
Series 2013 AMT(a)
08/01/28 | | | 5.000 | % | | | 1,775,000 | | | | 2,082,820 | | |
State of Hawaii Department of Budget & Finance
Refunding Revenue Bonds
Special Purpose - Kahala Nui
Series 2012
11/15/21 | | | 5.000 | % | | | 1,000,000 | | | | 1,143,560 | | |
11/15/27 | | | 5.000 | % | | | 1,400,000 | | | | 1,601,208 | | |
11/15/32 | | | 5.125 | % | | | 1,300,000 | | | | 1,463,670 | | |
11/15/37 | | | 5.250 | % | | | 1,945,000 | | | | 2,188,300 | | |
Revenue Bonds
15 Craigside Project
Series 2009A
11/15/29 | | | 8.750 | % | | | 965,000 | | | | 1,177,300 | | |
11/15/44 | | | 9.000 | % | | | 3,000,000 | | | | 3,660,570 | | |
Hawaii Pacific University
Series 2013A
07/01/33 | | | 6.625 | % | | | 1,430,000 | | | | 1,635,677 | | |
07/01/43 | | | 6.875 | % | | | 2,795,000 | | | | 3,221,377 | | |
Total | | | | | | | 28,788,943 | | |
IDAHO 0.6% | |
Idaho Health Facilities Authority
Prerefunded 12/01/18 Revenue Bonds
Trinity Health Group
Series 2008B
12/01/23 | | | 6.000 | % | | | 1,000,000 | | | | 1,123,850 | | |
12/01/33 | | | 6.250 | % | | | 6,000,000 | | | | 6,777,840 | | |
Revenue Bonds
Terraces of Boise Project
Series 2014A
10/01/34 | | | 7.750 | % | | | 9,135,000 | | | | 10,245,542 | | |
10/01/44 | | | 8.000 | % | | | 3,635,000 | | | | 4,110,058 | | |
10/01/49 | | | 8.125 | % | | | 4,365,000 | | | | 4,940,176 | | |
Total | | | | | | | 27,197,466 | | |
ILLINOIS 14.0% | |
Chicago Midway International Airport(a)
Refunding Revenue Bonds
2nd Lien
Series 2014A AMT
01/01/41 | | | 5.000 | % | | | 10,000,000 | | | | 11,436,100 | | |
Series 2016A AMT
01/01/32 | | | 4.000 | % | | | 3,000,000 | | | | 3,283,260 | | |
01/01/33 | | | 4.000 | % | | | 3,500,000 | | | | 3,812,340 | | |
Municipal Bonds (continued)
Issue
Description | | Coupon
Rate | | Principal
Amount ($) | |
Value ($) | |
Chicago O'Hare International Airport
Revenue Bonds
Series 2015D
01/01/46 | | | 5.000 | % | | | 7,310,000 | | | | 8,677,847 | | |
Chicago O'Hare International Airport(a)
Revenue Bonds
Series 2015C AMT
01/01/46 | | | 5.000 | % | | | 6,500,000 | | | | 7,481,890 | | |
City of Chicago Wastewater Transmission
Refunding Revenue Bonds
2nd Lien
Series 2015C
01/01/34 | | | 5.000 | % | | | 1,250,000 | | | | 1,443,875 | | |
01/01/39 | | | 5.000 | % | | | 2,970,000 | | | | 3,404,363 | | |
Revenue Bonds
2nd Lien
Series 2014
01/01/39 | | | 5.000 | % | | | 4,000,000 | | | | 4,511,680 | | |
01/01/44 | | | 5.000 | % | | | 4,000,000 | | | | 4,500,360 | | |
City of Chicago Wastewater Transmission(e)
Refunding Revenue Bonds
Capital Appreciation
Series 1998A (NPFGC)
01/01/20 | | | 0.000 | % | | | 7,275,000 | | | | 6,567,943 | | |
City of Chicago Waterworks
Refunding Revenue Bonds
2nd Lien
Series 2016
11/01/26 | | | 5.000 | % | | | 935,000 | | | | 1,151,611 | | |
Revenue Bonds
2nd Lien
Series 2014
11/01/34 | | | 5.000 | % | | | 1,000,000 | | | | 1,159,520 | | |
11/01/39 | | | 5.000 | % | | | 2,000,000 | | | | 2,299,960 | | |
11/01/44 | | | 5.000 | % | | | 2,850,000 | | | | 3,268,437 | | |
Series 2016
11/01/28 | | | 5.000 | % | | | 865,000 | | | | 1,045,007 | | |
11/01/29 | | | 5.000 | % | | | 1,750,000 | | | | 2,107,525 | | |
11/01/30 | | | 5.000 | % | | | 1,000,000 | | | | 1,199,840 | | |
City of Chicago
Revenue Bonds
Asphalt Operating Services - Recovery Zone Facility
Series 2010
12/01/18 | | | 6.125 | % | | | 2,665,000 | | | | 2,726,029 | | |
Unlimited General Obligation Bonds
Project
Series 2011A
01/01/40 | | | 5.000 | % | | | 27,625,000 | | | | 27,808,982 | | |
Series 2012A
01/01/33 | | | 5.000 | % | | | 7,450,000 | | | | 7,591,326 | | |
01/01/34 | | | 5.000 | % | | | 10,510,000 | | | | 10,699,285 | | |
Series 2009C
01/01/34 | | | 5.000 | % | | | 1,890,000 | | | | 1,906,821 | | |
01/01/40 | | | 5.000 | % | | | 26,730,000 | | | | 26,959,343 | | |
The accompanying Notes to Financial Statements are an integral part of this statement.
Annual Report 2016
13
PORTFOLIO OF INVESTMENTS (continued)
July 31, 2016
Municipal Bonds (continued)
Issue
Description | | Coupon
Rate | | Principal
Amount ($) | |
Value ($) | |
Series 2015A
01/01/33 | | | 5.500 | % | | | 8,350,000 | | | | 8,738,943 | | |
01/01/39 | | | 5.500 | % | | | 1,500,000 | | | | 1,553,055 | | |
Unlimited General Obligation Refunding Bonds
Project
Series 2014A
01/01/30 | | | 5.250 | % | | | 4,200,000 | | | | 4,385,976 | | |
01/01/33 | | | 5.250 | % | | | 10,250,000 | | | | 10,631,915 | | |
01/01/34 | | | 5.000 | % | | | 5,000,000 | | | | 5,118,050 | | |
01/01/35 | | | 5.000 | % | | | 3,000,000 | | | | 3,063,270 | | |
01/01/36 | | | 5.000 | % | | | 21,360,000 | | | | 21,756,869 | | |
Series 2005D
01/01/40 | | | 5.500 | % | | | 2,000,000 | | | | 2,067,960 | | |
Series 2007E
01/01/42 | | | 5.500 | % | | | 1,000,000 | | | | 1,032,600 | | |
County of Champaign
Unlimited General Obligation Bonds
Public Safety Sales Tax
Series 1999 (NPFGC)
01/01/20 | | | 8.250 | % | | | 1,015,000 | | | | 1,252,662 | | |
01/01/23 | | | 8.250 | % | | | 1,420,000 | | | | 1,966,856 | | |
DeKalb County Community Unit School District No. 424 Genoa-Kingston
Unlimited General Obligation Bonds
Capital Appreciation
Series 2001 (AMBAC)(e)
01/01/21 | | | 0.000 | % | | | 2,675,000 | | | | 2,441,071 | | |
Illinois Finance Authority
Prerefunded 05/01/19 Revenue Bonds
Rush University Medical Center
Series 2009C
11/01/39 | | | 6.625 | % | | | 8,000,000 | | | | 9,299,280 | | |
Prerefunded 08/15/19 Revenue Bonds
Silver Cross & Medical Centers
Series 2009
08/15/38 | | | 6.875 | % | | | 39,300,000 | | | | 46,515,480 | | |
Refunding Revenue Bonds
Mercy Health System Obligation
Series 2016
12/01/46 | | | 5.000 | % | | | 14,000,000 | | | | 16,395,680 | | |
Northwest Community Hospital
Series 2016A
07/01/37 | | | 4.000 | % | | | 5,000,000 | | | | 5,355,250 | | |
07/01/38 | | | 4.000 | % | | | 5,000,000 | | | | 5,377,300 | | |
Rush University Medical Center
Series 2015A
11/15/38 | | | 5.000 | % | | | 20,145,000 | | | | 23,905,870 | | |
Series 2015B
11/15/39 | | | 5.000 | % | | | 6,590,000 | | | | 7,803,219 | | |
Silver Cross Hospital & Medical Centers
Series 2015C
08/15/44 | | | 5.000 | % | | | 9,400,000 | | | | 10,855,214 | | |
Swedish Covenant
Series 2010A
08/15/38 | | | 6.000 | % | | | 12,505,000 | | | | 14,071,126 | | |
Municipal Bonds (continued)
Issue
Description | | Coupon
Rate | | Principal
Amount ($) | |
Value ($) | |
Revenue Bonds
CHF-Normal LLC-Illinois State University
Series 2011
04/01/43 | | | 7.000 | % | | | 5,550,000 | | | | 6,426,845 | | |
Northwestern Memorial Hospital
Series 2009A
08/15/30 | | | 5.750 | % | | | 2,000,000 | | | | 2,297,820 | | |
Series 2009B
08/15/30 | | | 5.750 | % | | | 10,000,000 | | | | 11,489,100 | | |
Riverside Health System
Series 2009
11/15/35 | | | 6.250 | % | | | 8,200,000 | | | | 9,478,708 | | |
South Suburban
Series 1992 Escrowed to Maturity
02/15/18 | | | 7.000 | % | | | 840,000 | | | | 891,089 | | |
Illinois Finance Authority(e)
Subordinated Revenue Bonds
Regency
Series 1990-RMK Escrowed to Maturity
04/15/20 | | | 0.000 | % | | | 68,000,000 | | | | 65,104,560 | | |
Illinois State Toll Highway Authority
Revenue Bonds
Series 2014C
01/01/36 | | | 5.000 | % | | | 5,000,000 | | | | 5,960,700 | | |
01/01/38 | | | 5.000 | % | | | 6,650,000 | | | | 7,922,145 | | |
01/01/39 | | | 5.000 | % | | | 5,000,000 | | | | 5,956,500 | | |
Lake County School District No. 56 Gurnee
Unlimited General Obligation Bonds
Series 1997 Escrowed to Maturity (NPFGC)
01/01/17 | | | 9.000 | % | | | 1,235,000 | | | | 1,279,151 | | |
Unrefunded Unlimited General Obligation Bonds
Series 1997 (NPFGC)
01/01/17 | | | 9.000 | % | | | 155,000 | | | | 160,298 | | |
Metropolitan Water Reclamation District of Greater
Chicago
Limited General Obligation Refunding Bonds
Series 2007C
12/01/33 | | | 5.250 | % | | | 13,210,000 | | | | 17,183,964 | | |
Railsplitter Tobacco Settlement Authority
Revenue Bonds
Series 2010
06/01/28 | | | 6.000 | % | | | 15,000,000 | | | | 17,987,400 | | |
Regional Transportation Authority
Revenue Bonds
Series 1994C (NPFGC)
06/01/20 | | | 7.750 | % | | | 3,585,000 | | | | 4,133,828 | | |
Series 2002A (NPFGC)
07/01/31 | | | 6.000 | % | | | 5,400,000 | | | | 7,851,546 | | |
State of Illinois
Revenue Bonds
1st Series 2002 (NPFGC)
06/15/23 | | | 6.000 | % | | | 4,000,000 | | | | 5,126,600 | | |
Unlimited General Obligation Bonds
1st Series 2001 (NPFGC)
11/01/26 | | | 6.000 | % | | | 3,000,000 | | | | 3,647,790 | | |
The accompanying Notes to Financial Statements are an integral part of this statement.
Annual Report 2016
14
PORTFOLIO OF INVESTMENTS (continued)
July 31, 2016
Municipal Bonds (continued)
Issue
Description | | Coupon
Rate | | Principal
Amount ($) | |
Value ($) | |
Series 2006
01/01/31 | | | 5.500 | % | | | 7,985,000 | | | | 9,649,793 | | |
Series 2012
03/01/35 | | | 5.000 | % | | | 2,725,000 | | | | 2,903,706 | | |
03/01/36 | | | 5.000 | % | | | 2,000,000 | | | | 2,125,980 | | |
Series 2013
07/01/38 | | | 5.500 | % | | | 4,125,000 | | | | 4,595,951 | | |
Series 2013A
04/01/36 | | | 5.000 | % | | | 8,000,000 | | | | 8,589,920 | | |
Series 2014
05/01/36 | | | 5.000 | % | | | 2,300,000 | | | | 2,493,407 | | |
02/01/39 | | | 5.000 | % | | | 23,000,000 | | | | 24,834,480 | | |
04/01/39 | | | 5.000 | % | | | 10,000,000 | | | | 10,812,400 | | |
05/01/39 | | | 5.000 | % | | | 6,175,000 | | | | 6,681,288 | | |
Series 2016
01/01/41 | | | 5.000 | % | | | 9,580,000 | | | | 10,530,815 | | |
Total | | | | | | | 604,746,774 | | |
INDIANA 1.5% | |
County of Jasper
Refunding Revenue Bonds
Northern Indiana Public Services
Series 1994C (NPFGC)
04/01/19 | | | 5.850 | % | | | 3,000,000 | | | | 3,338,610 | | |
Series 2003-RMKT (AMBAC)
07/01/17 | | | 5.700 | % | | | 2,000,000 | | | | 2,087,580 | | |
Crown Point Multi School Building Corp.
Revenue Bonds
1st Mortgage
Series 2000 (NPFGC)(e)
01/15/19 | | | 0.000 | % | | | 8,165,000 | | | | 7,938,993 | | |
Hospital Authority of Vigo County
Revenue Bonds
Union Hospital, Inc.
Series 2007(b)
09/01/37 | | | 5.700 | % | | | 3,950,000 | | | | 4,061,153 | | |
Indiana Finance Authority
Refunding Revenue Bonds
Series 2007A (NPFGC)
06/01/29 | | | 4.500 | % | | | 10,000,000 | | | | 10,132,000 | | |
Sisters of St. Francis Health
Series 2008
11/01/32 | | | 5.375 | % | | | 4,000,000 | | | | 4,369,960 | | |
Revenue Bonds
1st Lien-CWA Authority, Inc.
Series 2011A
10/01/31 | | | 5.250 | % | | | 8,335,000 | | | | 9,962,742 | | |
BHI Senior Living
Series 2011
11/15/31 | | | 5.500 | % | | | 1,175,000 | | | | 1,333,143 | | |
11/15/41 | | | 5.750 | % | | | 5,655,000 | | | | 6,428,604 | | |
Parkview Health System
Series 2009A
05/01/31 | | | 5.750 | % | | | 6,500,000 | | | | 7,357,935 | | |
Municipal Bonds (continued)
Issue
Description | | Coupon
Rate | | Principal
Amount ($) | |
Value ($) | |
Indiana Finance Authority(a)
Revenue Bonds
I-69 Development Partners LLC
Series 2014 AMT
09/01/40 | | | 5.250 | % | | | 8,000,000 | | | | 8,907,040 | | |
Indianapolis Airport Authority
Revenue Bonds
Special Facilities-United Air Lines Project
Series 1995A AMT(a)(d)
11/15/31 | | | 0.000 | % | | | 1,022,832 | | | | 6,342 | | |
Total | | | | | | | 65,924,102 | | |
IOWA 0.4% | |
Iowa Finance Authority
Refunding Revenue Bonds
Sunrise Retirement Community
Series 2012
09/01/32 | | | 5.500 | % | | | 1,500,000 | | | | 1,570,185 | | |
09/01/37 | | | 5.500 | % | | | 2,500,000 | | | | 2,603,650 | | |
09/01/43 | | | 5.750 | % | | | 2,630,000 | | | | 2,757,266 | | |
Iowa Student Loan Liquidity Corp.(a)
Revenue Bonds
Senior Series 2011A-2 AMT
12/01/26 | | | 5.600 | % | | | 4,945,000 | | | | 5,344,853 | | |
12/01/27 | | | 5.700 | % | | | 3,405,000 | | | | 3,657,753 | | |
Total | | | | | | | 15,933,707 | | |
KANSAS 1.0% | |
City of Overland Park
Revenue Bonds
Prairiefire Lionsgate Project
Series 2012
12/15/29 | | | 5.250 | % | | | 11,000,000 | | | | 10,234,290 | | |
University of Kansas Hospital Authority
Improvement Refunding Revenue Bonds
Kansas University Health System
Series 2015
09/01/45 | | | 5.000 | % | | | 29,000,000 | | | | 34,549,440 | | |
Total | | | | | | | 44,783,730 | | |
KENTUCKY 2.1% | |
Kentucky Economic Development Finance Authority
Refunding Revenue Bonds
Owensboro Medical Health System
Series 2010B
03/01/40 | | | 6.375 | % | | | 5,800,000 | | | | 6,698,130 | | |
Revenue Bonds
Louisville Arena
Subordinated Series 2008A-1 (AGM)
12/01/33 | | | 6.000 | % | | | 3,200,000 | | | | 3,445,728 | | |
12/01/38 | | | 6.000 | % | | | 2,850,000 | | | | 3,064,007 | | |
Owensboro Medical Health System
Series 2010A
03/01/45 | | | 6.500 | % | | | 14,550,000 | | | | 16,846,426 | | |
The accompanying Notes to Financial Statements are an integral part of this statement.
Annual Report 2016
15
PORTFOLIO OF INVESTMENTS (continued)
July 31, 2016
Municipal Bonds (continued)
Issue
Description | | Coupon
Rate | | Principal
Amount ($) | |
Value ($) | |
Kentucky Municipal Power Agency
Refunding Revenue Bonds
Series 2015A
09/01/42 | | | 5.000 | % | | | 6,600,000 | | | | 7,769,454 | | |
Louisville & Jefferson County Metropolitan Government
Prerefunded 02/01/18 Revenue Bonds
Jewish Hospital St. Mary's Healthcare
Series 2008
02/01/27 | | | 5.750 | % | | | 14,000,000 | | | | 15,090,740 | | |
Louisville/Jefferson County Metropolitan Government
Refunding Revenue Bonds
Norton Healthcare, Inc.
Series 2016(f)
10/01/35 | | | 4.000 | % | | | 31,565,000 | | | | 34,770,110 | | |
Paducah Electric Plant Board
Refunding Revenue Bonds
Series 2016A (AGM)
10/01/33 | | | 5.000 | % | | | 2,045,000 | | | | 2,450,789 | | |
Total | | | | | | | 90,135,384 | | |
LOUISIANA 3.1% | |
Louisiana Housing Corp.
Revenue Bonds
Homeownership Program
Series 2008A (GNMA/FHLMC)
12/01/23 | | | 4.875 | % | | | 445,000 | | | | 469,951 | | |
Louisiana Local Government Environmental Facilities &
Community Development Authority
Revenue Bonds
Westlake Chemical Corp.
Series 2010A-2
11/01/35 | | | 6.500 | % | | | 6,250,000 | | | | 7,522,000 | | |
Louisiana Public Facilities Authority
Refunding Revenue Bonds
Ochsner Clinic Foundation
Series 2016
05/15/35 | | | 4.000 | % | | | 2,500,000 | | | | 2,717,350 | | |
05/15/41 | | | 4.000 | % | | | 2,500,000 | | | | 2,721,800 | | |
05/15/47 | | | 5.000 | % | | | 1,200,000 | | | | 1,429,848 | | |
Unrefunded Revenue Bonds
Tulane University Project
Series 2007 (NPFGC)
02/15/26 | | | 5.000 | % | | | 905,000 | | | | 925,824 | | |
Louisiana Public Facilities Authority(a)
Revenue Bonds
Impala Warehousing LLC Project
Series 2013 AMT
07/01/36 | | | 6.500 | % | | | 25,000,000 | | | | 28,322,500 | | |
Louisiana Pellets, Inc. Project
Series 2013 AMT
07/01/39 | | | 10.500 | % | | | 10,000,000 | | | | 5,763,200 | | |
Municipal Bonds (continued)
Issue
Description | | Coupon
Rate | | Principal
Amount ($) | |
Value ($) | |
Louisiana Public Facilities Authority(a)(b)
Revenue Bonds
Louisiana Pellets, Inc. Project
Series 2015 AMT
07/01/39 | | | 7.750 | % | | | 10,000,000 | | | | 5,765,200 | | |
New Orleans Aviation Board
Revenue Bonds
Consolidated Rental Car
Series 2009A
01/01/30 | | | 6.250 | % | | | 5,250,000 | | | | 5,815,740 | | |
01/01/40 | | | 6.500 | % | | | 20,400,000 | | | | 22,811,892 | | |
New Orleans Aviation Board(a)
Revenue Bonds
Series 2015B AMT
01/01/45 | | | 5.000 | % | | | 21,150,000 | | | | 24,498,680 | | |
Parish of St. Charles
Revenue Bonds
Valero Energy Corp.
Series 2010
12/01/40 | | | 4.000 | % | | | 7,900,000 | | | | 8,788,592 | | |
Parish of St. John the Baptist
Revenue Bonds
Marathon Oil Corp.
Series 2007A
06/01/37 | | | 5.125 | % | | | 14,600,000 | | | | 14,929,522 | | |
Total | | | | | | | 132,482,099 | | |
MARYLAND 1.4% | |
City of Brunswick
Special Tax Bonds
Brunswick Crossing Special Taxing
Series 2006
07/01/36 | | | 5.500 | % | | | 6,493,000 | | | | 6,500,142 | | |
County of Baltimore
Revenue Bonds
Oak Crest Village, Inc. Facility
Series 2007A
01/01/37 | | | 5.000 | % | | | 5,000,000 | | | | 5,071,800 | | |
Maryland Economic Development Corp.
Prerefunded 06/01/18 Revenue Bonds
University of Maryland College Park Projects
Series 2008
06/01/33 | | | 5.750 | % | | | 1,600,000 | | | | 1,750,960 | | |
Refunding Revenue Bonds
CNX Marine Terminals, Inc.
Series 2010
09/01/25 | | | 5.750 | % | | | 2,000,000 | | | | 1,987,320 | | |
Revenue Bonds
Salisbury University Project
Series 2012
06/01/30 | | | 5.000 | % | | | 400,000 | | | | 444,580 | | |
Towson University Project
Senior Series 2012
07/01/29 | | | 5.000 | % | | | 650,000 | | | | 752,096 | | |
The accompanying Notes to Financial Statements are an integral part of this statement.
Annual Report 2016
16
PORTFOLIO OF INVESTMENTS (continued)
July 31, 2016
Municipal Bonds (continued)
Issue
Description | | Coupon
Rate | | Principal
Amount ($) | |
Value ($) | |
Maryland Economic Development Corp.(a)
Revenue Bonds
Purple Line Light Rail Project
Series 2016 AMT
03/31/46 | | | 5.000 | % | | | 2,700,000 | | | | 3,264,948 | | |
03/31/51 | | | 5.000 | % | | | 2,200,000 | | | | 2,653,750 | | |
Maryland Health & Higher Educational Facilities Authority
Prerefunded 01/01/18 Revenue Bonds
Washington County Hospital
Series 2008
01/01/33 | | | 5.750 | % | | | 3,495,000 | | | | 3,752,092 | | |
Prerefunded 07/01/19 Revenue Bonds
Anne Arundel Health System
Series 2009A
07/01/39 | | | 6.750 | % | | | 5,000,000 | | | | 5,876,650 | | |
Refunding Revenue Bonds
Mercy Medical Center
Series 2016A
07/01/42 | | | 4.000 | % | | | 5,250,000 | | | | 5,641,545 | | |
Meritus Medical Center Issue
Series 2015
07/01/45 | | | 5.000 | % | | | 3,000,000 | | | | 3,517,830 | | |
Western Maryland Health System
Series 2014
07/01/34 | | | 5.250 | % | | | 6,885,000 | | | | 8,199,829 | | |
Revenue Bonds
University of Maryland Medical System
Series 2005 (AMBAC)
07/01/28 | | | 5.250 | % | | | 3,000,000 | | | | 3,221,850 | | |
Resolution Trust Corp.
Pass-Through Certificates
Series 1993A
12/01/16 | | | 8.500 | % | | | 6,615,222 | | | | 6,610,327 | | |
Total | | | | | | | 59,245,719 | | |
MASSACHUSETTS 4.1% | |
Berkshire Wind Power Cooperative Corp.
Revenue Bonds
Series 2010-1
07/01/30 | | | 5.250 | % | | | 1,000,000 | | | | 1,120,000 | | |
Boston Water & Sewer Commission
Revenue Bonds
General
Senior Series 1993A
11/01/19 | | | 5.250 | % | | | 2,900,000 | | | | 3,106,248 | | |
Commonwealth of Massachusetts
Refunding Revenue Bonds
Series 2005 (NPFGC)
01/01/27 | | | 5.500 | % | | | 4,500,000 | | | | 6,005,025 | | |
01/01/30 | | | 5.500 | % | | | 2,500,000 | | | | 3,443,725 | | |
Municipal Bonds (continued)
Issue
Description | | Coupon
Rate | | Principal
Amount ($) | |
Value ($) | |
Massachusetts Bay Transportation Authority
Refunding Revenue Bonds
General Transportation System
Series 1994C (AGM)
03/01/19 | | | 7.000 | % | | | 915,000 | | | | 966,249 | | |
Revenue Bonds
Senior Series 2005B (NPFGC)
07/01/26 | | | 5.500 | % | | | 1,500,000 | | | | 2,030,670 | | |
Senior Series 2008B
07/01/27 | | | 5.250 | % | | | 710,000 | | | | 954,829 | | |
Unrefunded Revenue Bonds
General Transportation
Series 1991 (NPFGC)
03/01/21 | | | 7.000 | % | | | 625,000 | | | | 734,806 | | |
Massachusetts Clean Water Trust (The)
Refunding Revenue Bonds
Pool Program
Series 2006
08/01/30 | | | 5.250 | % | | | 1,000,000 | | | | 1,384,910 | | |
Revenue Bonds
MWRA Program
Subordinated Series 1999A
08/01/17 | | | 6.000 | % | | | 12,445,000 | | | | 13,131,342 | | |
Massachusetts Department of Transportation
Revenue Bonds
Capital Appreciation
Senior Series 1997C (NPFGC)(e)
01/01/18 | | | 0.000 | % | | | 4,700,000 | | | | 4,639,699 | | |
Massachusetts Development Finance Agency
Prerefunded 07/01/22 Revenue Bonds
Boston Medical Center
Series 2012
07/01/29 | | | 5.000 | % | | | 80,000 | | | | 97,944 | | |
Refunding Revenue Bonds
1st Mortgage-VOA Concord
Series 2007
11/01/41 | | | 5.200 | % | | | 1,145,000 | | | | 1,153,736 | | |
South Shore Hospital
Series 2016I
07/01/36 | | | 4.000 | % | | | 1,250,000 | | | | 1,353,212 | | |
Revenue Bonds
Adventcare Project
Series 2007A
10/15/28 | | | 6.650 | % | | | 5,000,000 | | | | 5,161,350 | | |
Boston College
Series 2009Q-2
07/01/29 | | | 5.000 | % | | | 1,455,000 | | | | 1,630,488 | | |
Covenant Health System Obligation Group
Series 2012
07/01/31 | | | 5.000 | % | | | 1,000,000 | | | | 1,137,980 | | |
Evergreen Center, Inc.
Series 2005
01/01/35 | | | 5.500 | % | | | 750,000 | | | | 751,065 | | |
Foxborough Regional Charter School
Series 2010A
07/01/42 | | | 7.000 | % | | | 1,000,000 | | | | 1,145,740 | | |
The accompanying Notes to Financial Statements are an integral part of this statement.
Annual Report 2016
17
PORTFOLIO OF INVESTMENTS (continued)
July 31, 2016
Municipal Bonds (continued)
Issue
Description | | Coupon
Rate | | Principal
Amount ($) | |
Value ($) | |
Linden Ponds, Inc. Facility
Series 2011A-2
11/15/46 | | | 5.500 | % | | | 154,325 | | | | 149,688 | | |
Partners Healthcare
Series 2012L
07/01/36 | | | 5.000 | % | | | 1,000,000 | | | | 1,167,530 | | |
WGBH Educational Foundation
Series 2002A (AMBAC)
01/01/42 | | | 5.750 | % | | | 2,000,000 | | | | 2,937,080 | | |
Unrefunded Revenue Bonds
Boston Medical Center
Series 2012
07/01/29 | | | 5.000 | % | | | 425,000 | | | | 485,150 | | |
Education-Dexter School Project
Series 2007
05/01/26 | | | 4.500 | % | | | 190,000 | | | | 193,430 | | |
Massachusetts Development Finance Agency(e)
Revenue Bonds
Linden Ponds, Inc. Facility
Series 2011B
11/15/56 | | | 0.000 | % | | | 767,588 | | | | 4,275 | | |
Massachusetts Educational Financing Authority
Revenue Bonds
Series 2009I
01/01/28 | | | 6.000 | % | | | 445,000 | | | | 474,837 | | |
Massachusetts Educational Financing Authority(a)
Refunding Revenue Bonds
Series 2016J AMT
07/01/33 | | | 3.500 | % | | | 15,000,000 | | | | 15,291,300 | | |
Revenue Bonds
Education Loan
Series 2014-I AMT
01/01/25 | | | 5.000 | % | | | 12,450,000 | | | | 14,769,186 | | |
01/01/27 | | | 5.000 | % | | | 3,000,000 | | | | 3,573,900 | | |
Issue I
Series 2010B AMT
01/01/31 | | | 5.700 | % | | | 4,445,000 | | | | 4,847,584 | | |
Series 2008H (AGM) AMT
01/01/30 | | | 6.350 | % | | | 4,190,000 | | | | 4,403,690 | | |
Series 2011J AMT
07/01/33 | | | 5.625 | % | | | 1,500,000 | | | | 1,680,360 | | |
Series 2012J AMT
07/01/25 | | | 4.625 | % | | | 4,890,000 | | | | 5,175,234 | | |
07/01/28 | | | 4.900 | % | | | 640,000 | | | | 672,755 | | |
Massachusetts Health & Educational Facilities Authority
Prerefunded 10/15/19 Revenue Bonds
Springfield College
Series 2010
10/15/40 | | | 5.625 | % | | | 4,500,000 | | | | 5,186,160 | | |
Revenue Bonds
Harvard University
Series 2009A
11/15/36 | | | 5.500 | % | | | 1,000,000 | | | | 1,113,220 | | |
Massachusetts Eye & Ear Infirmary
Series 2010C
07/01/35 | | | 5.375 | % | | | 1,000,000 | | | | 1,125,480 | | |
Municipal Bonds (continued)
Issue
Description | | Coupon
Rate | | Principal
Amount ($) | |
Value ($) | |
Milford Regional Medical Center
Series 2007E
07/15/22 | | | 5.000 | % | | | 1,250,000 | | | | 1,300,063 | | |
07/15/32 | | | 5.000 | % | | | 4,720,000 | | | | 4,888,079 | | |
07/15/37 | | | 5.000 | % | | | 500,000 | | | | 517,025 | | |
Partners Healthcare
Series 2010J-1
07/01/34 | | | 5.000 | % | | | 11,400,000 | | | | 12,757,398 | | |
Suffolk University
Series 2009A
07/01/30 | | | 6.250 | % | | | 1,000,000 | | | | 1,141,320 | | |
Tufts University
Series 2009M
02/15/28 | | | 5.500 | % | | | 1,000,000 | | | | 1,353,370 | | |
Massachusetts Housing Finance Agency(a)
Revenue Bonds
Housing
Series 2011A AMT
12/01/36 | | | 5.250 | % | | | 1,185,000 | | | | 1,262,345 | | |
Series 2010C AMT
12/01/30 | | | 5.000 | % | | | 825,000 | | | | 873,617 | | |
Massachusetts Port Authority(a)
Revenue Bonds
Bosfuel Project
Series 2007 (NPFGC) AMT
07/01/32 | | | 5.000 | % | | | 2,000,000 | | | | 2,063,380 | | |
Series 2016B AMT
07/01/46 | | | 4.000 | % | | | 28,000,000 | | | | 30,237,200 | | |
Massachusetts State College Building Authority
Revenue Bonds
Capital Appreciation
Senior Series 1999A Escrowed to Maturity (NPFGC)(e)
05/01/23 | | | 0.000 | % | | | 3,000,000 | | | | 2,705,910 | | |
Massachusetts Water Resources Authority
Revenue Bonds
Series 1992A Escrowed to Maturity
07/15/19 | | | 6.500 | % | | | 2,355,000 | | | | 2,563,394 | | |
Metropolitan Boston Transit Parking Corp.
Revenue Bonds
Series 2011
07/01/36 | | | 5.250 | % | | | 3,000,000 | | | | 3,541,230 | | |
Total | | | | | | | 178,404,208 | | |
MICHIGAN 2.9% | |
Allen Academy
Refunding Revenue Bonds
Public School Academy
Series 2013(d)
06/01/22 | | | 5.500 | % | | | 2,000,000 | | | | 1,399,940 | | |
City of Detroit Sewage Disposal System
Refunding Revenue Bonds
Senior Lien
Series 2012A
07/01/39 | | | 5.250 | % | | | 11,925,000 | | | | 13,670,104 | | |
The accompanying Notes to Financial Statements are an integral part of this statement.
Annual Report 2016
18
PORTFOLIO OF INVESTMENTS (continued)
July 31, 2016
Municipal Bonds (continued)
Issue
Description | | Coupon
Rate | | Principal
Amount ($) | |
Value ($) | |
City of Detroit Water Supply System
Revenue Bonds
Senior Lien
Series 2011A
07/01/36 | | | 5.000 | % | | | 4,105,000 | | | | 4,551,337 | | |
07/01/41 | | | 5.250 | % | | | 8,765,000 | | | | 9,844,410 | | |
Unrefunded Revenue Bonds
Senior Lien
Series 2003A (NPFGC)
07/01/34 | | | 5.000 | % | | | 5,000 | | | | 5,016 | | |
Grand Traverse Academy
Refunding Revenue Bonds
Series 2007
11/01/17 | | | 5.000 | % | | | 390,000 | | | | 397,055 | | |
11/01/22 | | | 5.000 | % | | | 750,000 | | | | 759,690 | | |
11/01/32 | | | 4.750 | % | | | 1,170,000 | | | | 1,169,918 | | |
Grand Traverse County Hospital Finance Authority
Revenue Bonds
Munson Healthcare
Series 2014A
07/01/47 | | | 5.000 | % | | | 1,200,000 | | | | 1,395,024 | | |
Michigan Finance Authority
Refunding Revenue Bonds
Senior Lien-Detroit Water & Sewer
Series 2014C-6
07/01/33 | | | 5.000 | % | | | 1,070,000 | | | | 1,250,263 | | |
Revenue Bonds
Beaumont Health Credit Group
Series 2016S
11/01/44 | | | 5.000 | % | | | 16,760,000 | | | | 19,973,395 | | |
Local Government Loan Program - Detroit
Series 2015
07/01/34 | | | 5.000 | % | | | 1,595,000 | | | | 1,879,963 | | |
07/01/35 | | | 5.000 | % | | | 4,830,000 | | | | 5,672,014 | | |
Senior Lien-Detroit Water & Sewer
Series 2014C-1
07/01/44 | | | 5.000 | % | | | 2,000,000 | | | | 2,253,660 | | |
Michigan Finance Authority(a)
Revenue Bonds
Senior Lien-Detroit Water & Sewer
Series 2014C-2 AMT
07/01/44 | | | 5.000 | % | | | 1,500,000 | | | | 1,653,075 | | |
Michigan Strategic Fund
Refunding Revenue Bonds
Collateral Detroit Fund-Pollution
Series 1991BB (AMBAC)
05/01/21 | | | 7.000 | % | | | 2,505,000 | | | | 3,150,363 | | |
Paw Paw Public Schools
Unlimited General Obligation Refunding Bonds
Series 1998 (NPFGC) (Qualified School Board Loan
Fund)
05/01/25 | | | 5.000 | % | | | 1,020,000 | | | | 1,304,519 | | |
Municipal Bonds (continued)
Issue
Description | | Coupon
Rate | | Principal
Amount ($) | |
Value ($) | |
Royal Oak Hospital Finance Authority
Refunding Revenue Bonds
William Beaumont Hospital
Series 2014D
09/01/39 | | | 5.000 | % | | | 9,425,000 | | | | 10,959,484 | | |
St. Johns Public Schools
Unlimited General Obligation Refunding Bonds
Series 1998 (NPFGC) (Qualified School Bond Loan Fund)
05/01/25 | | | 5.100 | % | | | 1,790,000 | | | | 2,186,324 | | |
Wayne County Airport Authority
Revenue Bonds
Series 2015D
12/01/45 | | | 5.000 | % | | | 21,445,000 | | | | 25,258,993 | | |
Wayne County Airport Authority(a)
Refunding Revenue Bonds
Series 2015F AMT
12/01/33 | | | 5.000 | % | | | 11,495,000 | | | | 13,601,574 | | |
Williamston Community School District
Unlimited General Obligation Bonds
Series 1996 (NPFGC) (Qualified School Bond Loan Fund)
05/01/25 | | | 5.500 | % | | | 905,000 | | | | 1,058,732 | | |
Total | | | | | | | 123,394,853 | | |
MINNESOTA 3.2% | |
City of Blaine
Refunding Revenue Bonds
Crest View Senior Community Project
Series 2015
07/01/45 | | | 6.125 | % | | | 11,775,000 | | | | 12,882,556 | | |
City of Minneapolis
Prerefunded 11/15/18 Revenue Bonds
Fairview Health Services
Series 2008A
11/15/32 | | | 6.750 | % | | | 7,500,000 | | | | 8,543,400 | | |
City of St. Louis Park
Prerefunded 07/01/18 Revenue Bonds
Park Nicollet Health Services
Series 2008C
07/01/23 | | | 5.500 | % | | | 10,775,000 | | | | 11,789,035 | | |
07/01/30 | | | 5.750 | % | | | 3,200,000 | | | | 3,516,416 | | |
Prerefunded 07/01/19 Revenue Bonds
Park Nicollet Health Services
Series 2009
07/01/39 | | | 5.750 | % | | | 16,825,000 | | | | 19,294,237 | | |
County of Meeker
Revenue Bonds
Hospital Facilities Memorial Hospital Project
Series 2007
11/01/37 | | | 5.750 | % | | | 1,750,000 | | | | 1,813,840 | | |
The accompanying Notes to Financial Statements are an integral part of this statement.
Annual Report 2016
19
PORTFOLIO OF INVESTMENTS (continued)
July 31, 2016
Municipal Bonds (continued)
Issue
Description | | Coupon
Rate | | Principal
Amount ($) | |
Value ($) | |
Housing & Redevelopment Authority of The City of St. Paul
Refunding Revenue Bonds
HealthEast Care System Project
Series 2015
11/15/30 | | | 5.000 | % | | | 900,000 | | | | 1,088,037 | | |
11/15/40 | | | 5.000 | % | | | 935,000 | | | | 1,109,004 | | |
Perham Hospital District
Revenue Bonds
Perham Memorial Hospital & Home
Series 2010
03/01/35 | | | 6.350 | % | | | 4,000,000 | | | | 4,357,240 | | |
03/01/40 | | | 6.500 | % | | | 2,800,000 | | | | 3,066,028 | | |
Southern Minnesota Municipal Power Agency(e)
Revenue Bonds
Capital Appreciation
Series 1994A (NPFGC)
01/01/22 | | | 0.000 | % | | | 27,500,000 | | | | 25,237,025 | | |
01/01/23 | | | 0.000 | % | | | 26,500,000 | | | | 23,769,970 | | |
01/01/25 | | | 0.000 | % | | | 17,500,000 | | | | 14,985,775 | | |
St. Cloud Housing & Redevelopment Authority
Revenue Bonds
Sanctuary St. Cloud Project
Series 2016A(f)
08/01/36 | | | 5.250 | % | | | 7,135,000 | | | | 7,134,715 | | |
Total | | | | | | | 138,587,278 | | |
MISSISSIPPI 0.4% | |
County of Lowndes
Refunding Revenue Bonds
Weyerhaeuser Co. Project
Series 1992A
04/01/22 | | | 6.800 | % | | | 2,470,000 | | | | 3,089,896 | | |
Medical Center Educational Building Corp.
Refunding Revenue Bonds
University of Mississippi Medical Center
Series 1998B (AMBAC)
12/01/23 | | | 5.500 | % | | | 5,300,000 | | | | 6,205,770 | | |
Mississippi Business Finance Corp.
Revenue Bonds
Series 2009A
05/01/24 | | | 4.700 | % | | | 5,515,000 | | | | 5,966,127 | | |
Total | | | | | | | 15,261,793 | | |
MISSOURI 2.0% | |
City of Manchester
Refunding Tax Allocation Bonds
Highway 141/Manchester Road Project
Series 2010
11/01/25 | | | 6.000 | % | | | 1,430,000 | | | | 1,497,868 | | |
11/01/39 | | | 6.875 | % | | | 1,500,000 | | | | 1,595,460 | | |
Municipal Bonds (continued)
Issue
Description | | Coupon
Rate | | Principal
Amount ($) | |
Value ($) | |
Health & Educational Facilities Authority of the State of Missouri
Revenue Bonds
Lutheran Senior Services
Senior Series 2010
02/01/42 | | | 5.500 | % | | | 2,000,000 | | | | 2,193,140 | | |
Series 2011
02/01/31 | | | 5.750 | % | | | 1,730,000 | | | | 2,004,136 | | |
02/01/41 | | | 6.000 | % | | | 2,600,000 | | | | 3,003,468 | | |
Series 2014
02/01/35 | | | 5.000 | % | | | 7,350,000 | | | | 8,268,309 | | |
02/01/44 | | | 5.000 | % | | | 12,725,000 | | | | 14,296,665 | | |
Industrial Development Authority of the City of St. Louis
(The)
Revenue Bonds
Convention Center Hotel
Series 2000 (AMBAC)(e)
07/15/18 | | | 0.000 | % | | | 2,000,000 | | | | 1,941,100 | | |
Kirkwood Industrial Development Authority
Revenue Bonds
Aberdeen Heights
Series 2010A
05/15/39 | | | 8.250 | % | | | 12,000,000 | | | | 13,626,240 | | |
Missouri Development Finance Board
Revenue Bonds
Procter & Gamble Paper Products
Series 1999 AMT(a)
03/15/29 | | | 5.200 | % | | | 6,385,000 | | | | 8,290,028 | | |
Missouri Joint Municipal Electric Utility Commission
Refunding Revenue Bonds
Series 2016A
12/01/41 | | | 4.000 | % | | | 17,485,000 | | | | 19,278,087 | | |
St. Louis Area Housing Finance Corp.
Revenue Bonds
Wellington Arms III Project
Series 1979
01/01/21 | | | 7.375 | % | | | 699,206 | | | | 700,647 | | |
St. Louis County Industrial Development Authority
Prerefunded 12/01/17 Revenue Bonds
St. Andrews Residence for Seniors
Series 2007A
12/01/41 | | | 6.375 | % | | | 7,000,000 | | | | 7,544,250 | | |
Revenue Bonds
Friendship Village Sunset Hills
Series 2013A
09/01/33 | | | 5.500 | % | | | 2,750,000 | | | | 3,170,832 | | |
Total | | | | | | | 87,410,230 | | |
NEBRASKA 1.2% | |
Douglas County Hospital Authority No. 2
Revenue Bonds
Health Facilities-Immanuel Obligation Group
Series 2010
01/01/40 | | | 5.625 | % | | | 875,000 | | | | 971,425 | | |
The accompanying Notes to Financial Statements are an integral part of this statement.
Annual Report 2016
20
PORTFOLIO OF INVESTMENTS (continued)
July 31, 2016
Municipal Bonds (continued)
Issue
Description | | Coupon
Rate | | Principal
Amount ($) | |
Value ($) | |
Madonna Rehabilitation Hospital
Series 2014
05/15/28 | | | 5.000 | % | | | 2,025,000 | | | | 2,387,131 | | |
05/15/29 | | | 5.000 | % | | | 2,125,000 | | | | 2,495,748 | | |
05/15/30 | | | 5.000 | % | | | 2,000,000 | | | | 2,342,760 | | |
05/15/36 | | | 5.000 | % | | | 1,000,000 | | | | 1,145,520 | | |
05/15/44 | | | 5.000 | % | | | 6,400,000 | | | | 7,326,528 | | |
Douglas County Hospital Authority No. 3
Refunding Revenue Bonds
Health Facilities - Nebraska Methodist Health System
Series 2015
11/01/45 | | | 5.000 | % | | | 12,500,000 | | | | 14,705,750 | | |
Madison County Hospital Authority No. 1
Revenue Bonds
Faith Regional Health Services Project
Series 2008A-1
07/01/33 | | | 6.000 | % | | | 11,500,000 | | | | 12,630,565 | | |
Nebraska Elementary & Secondary School Finance Authority
Revenue Bonds
Boys Town Project
Series 2008
09/01/28 | | | 4.750 | % | | | 6,800,000 | | | | 7,303,744 | | |
Total | | | | | | | 51,309,171 | | |
NEVADA 1.2% | |
Carson City
Refunding Revenue Bonds
Carson Tahoe Regional Medical Center
Series 2012
09/01/33 | | | 5.000 | % | | | 2,500,000 | | | | 2,799,925 | | |
City of Sparks
Tax Anticipation Revenue Bonds
Senior Sales
Series 2008A(b)
06/15/28 | | | 6.750 | % | | | 2,000,000 | | | | 2,121,540 | | |
Clark County Water Reclamation District
Limited General Obligation Bonds
Series 2009A
07/01/34 | | | 5.250 | % | | | 12,000,000 | | | | 13,515,120 | | |
County of Clark
Revenue Bonds
Las Vegas-McCarran International Airport
Series 2010A
07/01/34 | | | 5.125 | % | | | 18,750,000 | | | | 21,015,562 | | |
Henderson Local Improvement Districts
Special Assessment Bonds
No. T-18
Series 2006T-18
09/01/35 | | | 5.300 | % | | | 7,610,000 | | | | 6,841,390 | | |
Municipal Bonds (continued)
Issue
Description | | Coupon
Rate | | Principal
Amount ($) | |
Value ($) | |
State of Nevada Department of Business & Industry(a)
Revenue Bonds
Republic Services, Inc. Project
Series 2003 AMT
12/01/26 | | | 5.625 | % | | | 2,000,000 | | | | 2,133,980 | | |
State of Nevada Department of Business & Industry(b)
Revenue Bonds
Somerset Academy
Series 2015A
12/15/35 | | | 5.000 | % | | | 1,025,000 | | | | 1,070,992 | | |
Total | | | | | | | 49,498,509 | | |
NEW JERSEY 2.8% | |
Middlesex County Improvement Authority(d)
Revenue Bonds
Heldrich Center Hotel
Series 2005C
01/01/37 | | | 0.000 | % | | | 1,500,000 | | | | 44,895 | | |
Subordinated Revenue Bonds
Heldrich Center Hotel
Series 2005B
01/01/37 | | | 0.000 | % | | | 4,000,000 | | | | 157,720 | | |
New Jersey Economic Development Authority
Refunding Revenue Bonds
School Facilities Construction
Series 2005N-1 (AGM)
09/01/25 | | | 5.500 | % | | | 14,500,000 | | | | 18,088,025 | | |
Series 2005N-1 (NPFGC)
09/01/27 | | | 5.500 | % | | | 5,000,000 | | | | 6,288,150 | | |
Revenue Bonds
Lions Gate Project
Series 2014
01/01/34 | | | 5.000 | % | | | 1,000,000 | | | | 1,070,930 | | |
01/01/44 | | | 5.250 | % | | | 2,000,000 | | | | 2,153,800 | | |
MSU Student Housing Project-Provident
Series 2010
06/01/31 | | | 5.750 | % | | | 4,350,000 | | | | 4,927,375 | | |
06/01/42 | | | 5.875 | % | | | 14,500,000 | | | | 16,379,490 | | |
Provident Group-Rowan Properties LLC
Series 2015
01/01/48 | | | 5.000 | % | | | 7,200,000 | | | | 8,110,368 | | |
Series 2015WW
06/15/40 | | | 5.250 | % | | | 2,750,000 | | | | 3,121,140 | | |
New Jersey Economic Development Authority(a)
Revenue Bonds
Continental Airlines, Inc. Project
Series 1999 AMT
09/15/23 | | | 5.125 | % | | | 5,000,000 | | | | 5,638,100 | | |
09/15/29 | | | 5.250 | % | | | 2,500,000 | | | | 2,799,325 | | |
New Jersey Environmental Infrastructure Trust
Prerefunded 09/01/16 Revenue Bonds
Environmental
Series 2007
09/01/22 | | | 5.000 | % | | | 35,000 | | | | 35,141 | | |
The accompanying Notes to Financial Statements are an integral part of this statement.
Annual Report 2016
21
PORTFOLIO OF INVESTMENTS (continued)
July 31, 2016
Municipal Bonds (continued)
Issue
Description | | Coupon
Rate | | Principal
Amount ($) | |
Value ($) | |
Series 2007A
09/01/22 | | | 5.000 | % | | | 10,000 | | | | 10,041 | | |
09/01/22 | | | 5.000 | % | | | 5,000 | | | | 5,020 | | |
New Jersey Health Care Facilities Financing Authority
Revenue Bonds
St. Josephs Healthcare Systems
Series 2008
07/01/38 | | | 6.625 | % | | | 4,000,000 | | | | 4,376,520 | | |
Virtua Health
Series 2009
07/01/33 | | | 5.750 | % | | | 750,000 | | | | 847,463 | | |
New Jersey Transportation Trust Fund Authority
Revenue Bonds
Transportation Program
Series 2015AA
06/15/45 | | | 5.000 | % | | | 10,000,000 | | | | 11,095,500 | | |
Transportation System
Series 2006A
12/15/23 | | | 5.500 | % | | | 3,000,000 | | | | 3,563,310 | | |
Series 2011B
06/15/31 | | | 5.500 | % | | | 7,250,000 | | | | 8,221,355 | | |
New Jersey Turnpike Authority
Refunding Revenue Bonds
Series 2005A (AGM)
01/01/30 | | | 5.250 | % | | | 2,000,000 | | | | 2,727,900 | | |
Revenue Bonds
Series 2004C-2 (AMBAC)
01/01/25 | | | 5.500 | % | | | 2,500,000 | | | | 3,206,325 | | |
Union County Utilities Authority
Refunding Revenue Bonds
Covanta Union
Series 2011 AMT(a)
12/01/31 | | | 5.250 | % | | | 15,000,000 | | | | 16,913,250 | | |
Total | | | | | | | 119,781,143 | | |
NEW MEXICO 0.4% | |
New Mexico Hospital Equipment Loan Council
Prerefunded 08/01/18 Revenue Bonds
Presbyterian Healthcare Services
Series 2008
08/01/32 | | | 6.375 | % | | | 2,730,000 | | | | 3,040,619 | | |
08/01/32 | | | 6.375 | % | | | 5,920,000 | | | | 6,593,578 | | |
Revenue Bonds
Presbyterian Healthcare Services
Series 2009
08/01/39 | | | 5.000 | % | | | 6,500,000 | | | | 7,158,060 | | |
Total | | | | | | | 16,792,257 | | |
NEW YORK 3.4% | |
Brooklyn Arena Local Development Corp.
Revenue Bonds
Barclays Center Project
Series 2009
07/15/30 | | | 6.000 | % | | | 6,500,000 | | | | 7,449,715 | | |
Municipal Bonds (continued)
Issue
Description | | Coupon
Rate | | Principal
Amount ($) | |
Value ($) | |
Build NYC Resource Corp.
Refunding Revenue Bonds
Pratt Paper, Inc. Project
Series 2014 AMT(a)(b)
01/01/25 | | | 4.500 | % | | | 500,000 | | | | 555,560 | | |
Long Island Power Authority
Prerefunded 05/01/19 Revenue Bonds
Series 2008A
05/01/33 | | | 6.000 | % | | | 2,725,000 | | | | 3,118,190 | | |
Refunding Revenue Bonds
Series 2014A
09/01/44 | | | 5.000 | % | | | 2,250,000 | | | | 2,677,725 | | |
Metropolitan Transportation Authority
Prerefunded 11/15/17 Revenue Bonds
Transportation
Series 2007A (AGM)
11/15/33 | | | 5.000 | % | | | 12,000,000 | | | | 12,691,320 | | |
New York City Industrial Development Agency
Revenue Bonds
Pilot-Queens Baseball Stadium
Series 2006 (AMBAC)
01/01/24 | | | 5.000 | % | | | 3,000,000 | | | | 3,045,660 | | |
Pilot-Yankee Stadium-Payment I
Series 2006I (FGIC)
03/01/46 | | | 5.000 | % | | | 2,000,000 | | | | 2,006,120 | | |
New York City Transitional Finance Authority Building Aid
Revenue Bonds
Fiscal 2009
Series 2009S-4
01/15/25 | | | 5.125 | % | | | 2,000,000 | | | | 2,219,580 | | |
New York State Dormitory Authority
Prerefunded 05/01/19 Revenue Bonds
North Shore-Long Island Jewish Obligation Group
Series 2009A
05/01/37 | | | 5.500 | % | | | 6,250,000 | | | | 7,075,812 | | |
Revenue Bonds
Consolidated City University System 2nd Generation
Series 1993A
07/01/18 | | | 5.750 | % | | | 2,380,000 | | | | 2,526,632 | | |
07/01/20 | | | 6.000 | % | | | 13,350,000 | | | | 15,475,453 | | |
Independent School District-Educational Housing Services
Series 2005 (AMBAC)
07/01/30 | | | 5.250 | % | | | 3,000,000 | | | | 3,878,760 | | |
Orange Regional Medical Center
Series 2008
12/01/29 | | | 6.125 | % | | | 2,250,000 | | | | 2,455,560 | | |
New York State Environmental Facilities Corp.
Revenue Bonds
Revolving Funds-New York City Municipal Water
Series 2008A
06/15/28 | | | 5.000 | % | | | 1,000,000 | | | | 1,080,000 | | |
The accompanying Notes to Financial Statements are an integral part of this statement.
Annual Report 2016
22
PORTFOLIO OF INVESTMENTS (continued)
July 31, 2016
Municipal Bonds (continued)
Issue
Description | | Coupon
Rate | | Principal
Amount ($) | |
Value ($) | |
New York Transportation Development Corp.(a)
Revenue Bonds
LaGuardia Airport Terminal B Redevelopment Project
Series 2016 AMT
07/01/46 | | | 4.000 | % | | | 7,000,000 | | | | 7,282,450 | | |
Laguardia Airport Terminal B Redevelopment
Series 2016 AMT
07/01/41 | | | 4.000 | % | | | 10,000,000 | | | | 10,463,000 | | |
Laguardia Airport Terminal B Redevelopment Project
Series 2016 AMT
01/01/50 | | | 5.250 | % | | | 7,500,000 | | | | 8,687,550 | | |
Port Authority of New York & New Jersey
Revenue Bonds
JFK International Air Terminal
Series 2010
12/01/36 | | | 6.000 | % | | | 7,000,000 | | | | 8,257,830 | | |
Port Authority of New York & New Jersey(a)
Revenue Bonds
5th Installment-Special Project
Series 1996-4 AMT
10/01/19 | | | 6.750 | % | | | 4,000,000 | | | | 4,001,360 | | |
JFK International Air Terminal Special Project
Series 1997 (NPFGC) AMT
12/01/22 | | | 5.750 | % | | | 6,500,000 | | | | 6,643,065 | | |
Suffolk County Industrial Development Agency
Revenue Bonds
Nissequogue Cogen Partners Facility
Series 1998 AMT(a)
01/01/23 | | | 5.500 | % | | | 6,085,000 | | | | 6,088,347 | | |
Triborough Bridge & Tunnel Authority
Revenue Bonds
General Purpose
Series 1992Y Escrowed to Maturity
01/01/21 | | | 6.125 | % | | | 11,000,000 | | | | 12,698,400 | | |
Ulster County Capital Resource Corp.(b)
Refunding Revenue Bonds
Alliance Senior Living Co.
Series 2014B
09/15/44 | | | 7.000 | % | | | 2,765,000 | | | | 2,926,891 | | |
Ulster County Capital Resource Corp.(b)(e)
Refunding Revenue Bonds
Alliance Senior Living Co.
Series 2014A
09/15/44 | | | 0.000 | % | | | 545,000 | | | | 487,470 | | |
Ulster County Industrial Development Agency
Revenue Bonds
Series 2007A
09/15/37 | | | 6.000 | % | | | 2,000,000 | | | | 2,035,700 | | |
09/15/42 | | | 6.000 | % | | | 7,000,000 | | | | 7,117,250 | | |
Municipal Bonds (continued)
Issue
Description | | Coupon
Rate | | Principal
Amount ($) | |
Value ($) | |
Westchester County Local Development Corp.
Refunding Revenue Bonds
Westchester Medical Center
Series 2016
11/01/46 | | | 5.000 | % | | | 4,000,000 | | | | 4,695,160 | | |
Total | | | | | | | 147,640,560 | | |
NORTH CAROLINA 0.9% | |
City of High Point Combined Water & Sewer System
Revenue Bonds
Series 2008 (AGM)
11/01/28 | | | 5.000 | % | | | 350,000 | | | | 383,163 | | |
Durham Housing Authority
Revenue Bonds
Magnolia Pointe Apartments
Series 2005 AMT(a)
02/01/38 | | | 5.650 | % | | | 3,070,007 | | | | 3,236,186 | | |
North Carolina Capital Facilities Finance Agency
Refunding Revenue Bonds
Wake Forest University
Series 2016
01/01/37 | | | 4.000 | % | | | 1,000,000 | | | | 1,133,890 | | |
01/01/38 | | | 4.000 | % | | | 2,500,000 | | | | 2,834,725 | | |
North Carolina Department of Transportation
Revenue Bonds
I-77 Hot Lanes Project
Series 2015 AMT(a)
06/30/54 | | | 5.000 | % | | | 10,000,000 | | | | 11,230,100 | | |
North Carolina Eastern Municipal Power Agency
Prerefunded 01/01/19 Revenue Bonds
Series 2009A
01/01/26 | | | 5.500 | % | | | 300,000 | | | | 335,064 | | |
Prerefunded 01/01/22 Revenue Bonds
Series 1988A
01/01/26 | | | 6.000 | % | | | 1,940,000 | | | | 2,454,197 | | |
Unrefunded Revenue Bonds
Series 1991A Escrowed to Maturity
01/01/18 | | | 6.500 | % | | | 2,185,000 | | | | 2,369,239 | | |
North Carolina Medical Care Commission
Refunding Revenue Bonds
1st Mortgage-Givens Estates
Series 2007
07/01/33 | | | 5.000 | % | | | 5,000,000 | | | | 5,190,250 | | |
Revenue Bonds
1st Mortgage-Deerfield Episcopal
Series 2008A
11/01/33 | | | 6.000 | % | | | 4,060,000 | | | | 4,435,144 | | |
1st Mortgage-Presbyterian Homes
Series 2006
10/01/31 | | | 5.500 | % | | | 2,500,000 | | | | 2,511,800 | | |
Health Care Housing-Arc Projects
Series 2004A
10/01/34 | | | 5.800 | % | | | 1,400,000 | | | | 1,404,018 | | |
Total | | | | | | | 37,517,776 | | |
The accompanying Notes to Financial Statements are an integral part of this statement.
Annual Report 2016
23
PORTFOLIO OF INVESTMENTS (continued)
July 31, 2016
Municipal Bonds (continued)
Issue
Description | | Coupon
Rate | | Principal
Amount ($) | |
Value ($) | |
NORTH DAKOTA 0.3% | |
County of McLean
Revenue Bonds
Great River Energy
Series 2010B
07/01/40 | | | 5.150 | % | | | 7,900,000 | | | | 8,614,950 | | |
County of Ward
Revenue Bonds
Trinity Obligated Group
Series 2006
07/01/29 | | | 5.125 | % | | | 4,490,000 | | | | 4,504,278 | | |
Total | | | | | | | 13,119,228 | | |
OHIO 1.5% | |
American Municipal Power, Inc.
Revenue Bonds
AMP Fremont Energy Center Project
Series 2012
02/15/37 | | | 5.000 | % | | | 13,220,000 | | | | 15,366,796 | | |
Greenup Hydroelectric Project
Series 2016A
02/15/35 | | | 4.000 | % | | | 1,370,000 | | | | 1,516,522 | | |
02/15/36 | | | 4.000 | % | | | 500,000 | | | | 552,150 | | |
City of Lakewood Water System
Revenue Bonds
Mortgage
Series 1995 (AMBAC)
07/01/20 | | | 5.850 | % | | | 865,000 | | | | 957,071 | | |
City of Middleburg Heights
Revenue Bonds
Southwest General Facilities
Series 2011
08/01/36 | | | 5.250 | % | | | 2,380,000 | | | | 2,688,543 | | |
08/01/41 | | | 5.250 | % | | | 6,900,000 | | | | 7,784,097 | | |
Cleveland Department of Public Utilities Division of Public
Power
Revenue Bonds
Series 2008B-1 (NPFGC)
11/15/28 | | | 5.000 | % | | | 500,000 | | | | 534,445 | | |
Cleveland Department of Public Utilities Division of Water
Refunding Revenue Bonds
1st Mortgage
Series 1993G (NPFGC)
01/01/21 | | | 5.500 | % | | | 3,400,000 | | | | 3,770,260 | | |
Ohio Higher Educational Facility Commission
Revenue Bonds
University of Dayton Project
Series 2009
12/01/24 | | | 5.500 | % | | | 3,000,000 | | | | 3,321,780 | | |
Ohio State Turnpike Commission
Refunding Revenue Bonds
Series 1998A (NPFGC)
02/15/26 | | | 5.500 | % | | | 3,000,000 | | | | 3,944,220 | | |
Municipal Bonds (continued)
Issue
Description | | Coupon
Rate | | Principal
Amount ($) | |
Value ($) | |
State of Ohio
Revenue Bonds
Portsmouth Bypass Project
Series 2015 AMT(a)
06/30/53 | | | 5.000 | % | | | 9,835,000 | | | | 11,116,992 | | |
Toledo-Lucas County Port Authority
Refunding Revenue Bonds
CSX Transportation, Inc. Project
Series 1992
12/15/21 | | | 6.450 | % | | | 3,950,000 | | | | 4,953,260 | | |
Revenue Bonds
University of Toledo Project
Series 2014
07/01/46 | | | 5.000 | % | | | 5,000,000 | | | | 5,485,850 | | |
Special Assessment Bonds
Town Square at Levi Commons
Series 2007
11/01/36 | | | 5.400 | % | | | 2,605,000 | | | | 1,822,406 | | |
Total | | | | | | | 63,814,392 | | |
OREGON 0.3% | |
Benton County Hospital Facilities Authority
Unrefunded Revenue Bonds
Samaritan Health
Series 1998
10/01/28 | | | 5.125 | % | | | 655,000 | | | | 657,181 | | |
City of Forest Grove
Refunding Revenue Bonds
Campus Improvement Pacific University Project
Series 2014
05/01/40 | | | 5.000 | % | | | 1,500,000 | | | | 1,703,250 | | |
Cow Creek Band of Umpqua Tribe of Indians
Revenue Bonds
Series 2006C(b)(c)
10/01/26 | | | 5.625 | % | | | 3,500,000 | | | | 3,514,630 | | |
Hospital Facilities Authority of Multnomah County
Refunding Revenue Bonds
Mirabella at South Waterfront
Series 2014A
10/01/44 | | | 5.400 | % | | | 3,225,000 | | | | 3,633,866 | | |
Oregon Health & Science University
Prerefunded 06/01/19 Revenue Bonds
Series 2009A
07/01/39 | | | 5.750 | % | | | 4,500,000 | | | | 5,151,915 | | |
Total | | | | | | | 14,660,842 | | |
PENNSYLVANIA 4.4% | |
Butler County Hospital Authority
Prerefunded 07/01/19 Revenue Bonds
Butler Health Systems Project
Series 2009
07/01/39 | | | 7.250 | % | | | 7,000,000 | | | | 8,314,880 | | |
The accompanying Notes to Financial Statements are an integral part of this statement.
Annual Report 2016
24
PORTFOLIO OF INVESTMENTS (continued)
July 31, 2016
Municipal Bonds (continued)
Issue
Description | | Coupon
Rate | | Principal
Amount ($) | |
Value ($) | |
Cumberland County Municipal Authority
Refunding Revenue Bonds
Diakon Lutheran Ministries
Series 2015
01/01/38 | | | 5.000 | % | | | 8,490,000 | | | | 9,917,254 | | |
Dauphin County Industrial Development Authority
Revenue Bonds
Dauphin Consolidated Water Supply
Series 1992A AMT(a)
06/01/24 | | | 6.900 | % | | | 3,400,000 | | | | 4,400,552 | | |
Delaware Valley Regional Finance Authority
Revenue Bonds
Series 1997C (AMBAC)
07/01/27 | | | 7.750 | % | | | 1,000,000 | | | | 1,490,570 | | |
Montgomery County Industrial Development Authority
Refunding Revenue Bonds
Albert Einstein HealthCare Network
Series 2015
01/15/45 | | | 5.250 | % | | | 11,150,000 | | | | 12,779,015 | | |
Northampton County General Purpose Authority
Prerefunded 08/15/18 Revenue Bonds
Saint Luke's Hospital Project
Series 2008A
08/15/28 | | | 5.375 | % | | | 4,000,000 | | | | 4,384,280 | | |
Pennsylvania Convention Center Authority
Revenue Bonds
Series 1989A Escrowed to Maturity (FGIC)
09/01/19 | | | 6.000 | % | | | 14,010,000 | | | | 15,466,339 | | |
Pennsylvania Economic Development Financing Authority
Revenue Bonds
Philadelphia Biosolids Facility
Series 2009
01/01/32 | | | 6.250 | % | | | 5,325,000 | | | | 5,893,816 | | |
Pennsylvania Economic Development Financing Authority(a)
Revenue Bonds
PA Bridges Finco LP
Series 2015 AMT
06/30/42 | | | 5.000 | % | | | 23,700,000 | | | | 27,851,292 | | |
Proctor & Gamble Paper Project
Series 2001 AMT
03/01/31 | | | 5.375 | % | | | 1,000,000 | | | | 1,337,990 | | |
Pennsylvania Higher Educational Facilities Authority
Revenue Bonds
Edinboro University Foundation
Series 2008
07/01/28 | | | 5.750 | % | | | 3,000,000 | | | | 3,154,620 | | |
Series 2010
07/01/43 | | | 6.000 | % | | | 4,750,000 | | | | 5,207,093 | | |
Pennsylvania Turnpike Commission
Refunding Subordinated Revenue Bonds
Series 2015A-1
12/01/45 | | | 5.250 | % | | | 25,295,000 | | | | 30,332,752 | | |
Series 2016A-1
12/01/46 | | | 5.000 | % | | | 10,000,000 | | | | 11,653,500 | | |
Municipal Bonds (continued)
Issue
Description | | Coupon
Rate | | Principal
Amount ($) | |
Value ($) | |
Revenue Bonds
Series 2014B
12/01/44 | | | 5.250 | % | | | 10,000,000 | | | | 11,802,300 | | |
Subordinated Revenue Bonds
Series 2014A-1
12/01/43 | | | 5.000 | % | | | 16,940,000 | | | | 19,639,220 | | |
Philadelphia Authority for Industrial Development
Revenue Bonds
First Philadelphia Preparatory Charter School
Series 2014
06/15/43 | | | 7.250 | % | | | 5,475,000 | | | | 6,613,417 | | |
Philadelphia Municipal Authority
Revenue Bonds
Lease
Series 2009
04/01/34 | | | 6.500 | % | | | 2,500,000 | | | | 2,816,875 | | |
Redevelopment Authority of the City of Philadelphia
Subordinated Revenue Bonds
Series 1986B Escrowed to Maturity (GNMA)
06/01/17 | | | 9.000 | % | | | 450,000 | | | | 481,658 | | |
Washington County Industrial Development Authority
Revenue Bonds
Washington Jefferson College
Series 2010
11/01/36 | | | 5.000 | % | | | 4,850,000 | | | | 5,458,723 | | |
Westmoreland County Municipal Authority
Revenue Bonds
Capital Appreciation
Series 1999A (NPFGC)(e)
08/15/22 | | | 0.000 | % | | | 2,000,000 | | | | 1,787,780 | | |
Total | | | | | | | 190,783,926 | | |
PUERTO RICO 0.6% | |
Puerto Rico Electric Power Authority(c)
Refunding Revenue Bonds
Series 2007UU (AGM)
07/01/23 | | | 5.000 | % | | | 1,000,000 | | | | 1,009,160 | | |
Revenue Bonds
Series 2003NN (NPFGC)
07/01/21 | | | 5.250 | % | | | 3,500,000 | | | | 3,699,710 | | |
Puerto Rico Highways & Transportation Authority(c)
Refunding Revenue Bonds
Series 2003AA (NPFGC)
07/01/20 | | | 5.500 | % | | | 180,000 | | | | 191,317 | | |
Puerto Rico Highways & Transportation Authority(c)(d)
Revenue Bonds
Series 2005K
07/01/20 | | | 5.000 | % | | | 5,000,000 | | | | 1,275,000 | | |
Puerto Rico Public Buildings Authority(c)(d)
Refunding Revenue Bonds
Government Facilities
Series 2002F
07/01/20 | | | 5.250 | % | | | 2,000,000 | | | | 1,203,760 | | |
The accompanying Notes to Financial Statements are an integral part of this statement.
Annual Report 2016
25
PORTFOLIO OF INVESTMENTS (continued)
July 31, 2016
Municipal Bonds (continued)
Issue
Description | | Coupon
Rate | | Principal
Amount ($) | |
Value ($) | |
Series 2007M
07/01/31 | | | 6.250 | % | | | 19,000,000 | | | | 11,518,750 | | |
Puerto Rico Public Finance Corp.(c)
Revenue Bonds
Commonwealth Appropriation
Series 2002E Escrowed to Maturity (AMBAC)
08/01/27 | | | 5.500 | % | | | 450,000 | | | | 603,360 | | |
Unrefunded Revenue Bonds
Commonwealth Appropriation
Series 2002E Escrowed to Maturity
08/01/26 | | | 6.000 | % | | | 2,470,000 | | | | 3,380,491 | | |
Series 2002E Escrowed to Maturity (AMBAC)
08/01/27 | | | 5.500 | % | | | 1,050,000 | | | | 1,407,840 | | |
Total | | | | | | | 24,289,388 | | |
SOUTH CAROLINA 1.5% | |
City of Myrtle Beach
Tax Allocation Bonds
Myrtle Beach Air Force Base
Series 2006A
10/01/26 | | | 5.250 | % | | | 1,495,000 | | | | 1,496,525 | | |
Piedmont Municipal Power Agency
Refunding Revenue Bonds
Electric
Series 1991 (NPFGC)
01/01/21 | | | 6.250 | % | | | 1,250,000 | | | | 1,525,138 | | |
Unrefunded Revenue Bonds
Series 1993 (NPFGC)
01/01/25 | | | 5.375 | % | | | 11,280,000 | | | | 13,894,591 | | |
South Carolina Jobs-Economic Development Authority
Refunding Revenue Bonds
The Woodlands at Furman Project
Series 2012
11/15/42 | | | 6.000 | % | | | 5,133,239 | | | | 5,362,798 | | |
Revenue Bonds
York Preparatory Academy Project
Series 2014A
11/01/23 | | | 5.750 | % | | | 1,160,000 | | | | 1,244,367 | | |
11/01/33 | | | 7.000 | % | | | 910,000 | | | | 1,024,569 | | |
11/01/45 | | | 7.250 | % | | | 3,935,000 | | | | 4,467,602 | | |
South Carolina Jobs-Economic Development Authority(e)
Refunding Revenue Bonds
The Woodlands at Furman Project
Subordinated Series 2012
11/15/47 | | | 0.000 | % | | | 1,266,810 | | | | 142,592 | | |
South Carolina Ports Authority
Revenue Bonds
Series 2015 AMT(a)
07/01/50 | | | 5.250 | % | | | 13,675,000 | | | | 16,032,570 | | |
South Carolina Public Service Authority
Prerefunded 01/01/19 Revenue Bonds
Series 2008A
01/01/28 | | | 5.375 | % | | | 10,000 | | | | 11,141 | | |
Municipal Bonds (continued)
Issue
Description | | Coupon
Rate | | Principal
Amount ($) | |
Value ($) | |
Refunding Revenue Bonds
Series 2016B
12/01/56 | | | 5.000 | % | | | 12,500,000 | | | | 14,744,250 | | |
Revenue Bonds
Series 2015E
12/01/55 | | | 5.250 | % | | | 5,415,000 | | | | 6,547,872 | | |
Total | | | | | | | 66,494,015 | | |
SOUTH DAKOTA 0.3% | |
South Dakota Health & Educational Facilities Authority
Refunding Revenue Bonds
Sanford Obligated Group
Series 2015
11/01/35 | | | 5.000 | % | | | 2,500,000 | | | | 2,988,375 | | |
11/01/45 | | | 5.000 | % | | | 6,920,000 | | | | 8,209,265 | | |
State of South Dakota
Revenue Bonds
Series 1993A Escrowed to Maturity (AGM)
09/01/17 | | | 6.700 | % | | | 1,630,000 | | | | 1,684,132 | | |
Total | | | | | | | 12,881,772 | | |
TENNESSEE 0.2% | |
Chattanooga Health Educational & Housing Facility Board
Refunding Revenue Bonds
Student Housing - CDFI Phase I
Series 2015
10/01/32 | | | 5.000 | % | | | 1,300,000 | | | | 1,548,430 | | |
10/01/35 | | | 5.000 | % | | | 645,000 | | | | 760,203 | | |
Metropolitan Government Nashville & Davidson County
Health & Educational Facilities Board
Revenue Bonds
Vanderbilt University Medical Center
Series 2016
07/01/46 | | | 5.000 | % | | | 6,800,000 | | | | 8,166,392 | | |
Total | | | | | | | 10,475,025 | | |
TEXAS 10.7% | |
Bexar County Health Facilities Development Corp.
Revenue Bonds
Army Retirement Residence Project
Series 2010
07/01/30 | | | 5.875 | % | | | 1,370,000 | | | | 1,546,072 | | |
07/01/45 | | | 6.200 | % | | | 7,200,000 | | | | 8,244,288 | | |
Capital Area Cultural Education Facilities Finance Corp.
Revenue Bonds
Roman Catholic Diocese
Series 2005B
04/01/45 | | | 6.125 | % | | | 13,450,000 | | | | 15,476,780 | | |
Central Texas Regional Mobility Authority
Prerefunded 01/01/21 Revenue Bonds
Senior Lien
Series 2011
01/01/41 | | | 6.000 | % | | | 8,620,000 | | | | 10,521,658 | | |
The accompanying Notes to Financial Statements are an integral part of this statement.
Annual Report 2016
26
PORTFOLIO OF INVESTMENTS (continued)
July 31, 2016
Municipal Bonds (continued)
Issue
Description | | Coupon
Rate | | Principal
Amount ($) | |
Value ($) | |
Refunding Revenue Bonds
Senior Lien
Series 2013A
01/01/33 | | | 5.000 | % | | | 2,700,000 | | | | 3,108,510 | | |
Series 2016
01/01/46 | | | 5.000 | % | | | 5,000,000 | | | | 5,909,900 | | |
Revenue Bonds
Senior Lien
Series 2015A
01/01/45 | | | 5.000 | % | | | 3,000,000 | | | | 3,546,390 | | |
Central Texas Regional Mobility Authority(e)
Revenue Bonds
Capital Appreciation
Series 2010
01/01/25 | | | 0.000 | % | | | 2,000,000 | | | | 1,538,400 | | |
Central Texas Turnpike System
Refunding Revenue Bonds
1st Tier
Series 2012A
08/15/41 | | | 5.000 | % | | | 16,075,000 | | | | 18,708,085 | | |
Subordinated Refunding Revenue Bonds
Series 2015C
08/15/37 | | | 5.000 | % | | | 10,000,000 | | | | 11,653,000 | | |
08/15/42 | | | 5.000 | % | | | 14,730,000 | | | | 17,164,869 | | |
City of Austin Electric Utility
Refunding Revenue Bonds
Series 2008A
11/15/35 | | | 5.250 | % | | | 8,000,000 | | | | 8,759,920 | | |
City of Houston Airport System
Refunding Revenue Bonds
Senior Lien
Series 2009A
07/01/34 | | | 5.500 | % | | | 10,500,000 | | | | 11,455,290 | | |
City of Houston Airport System(a)
Refunding Revenue Bonds
Special Facilities-Continental Airlines
Series 2011A AMT
07/15/30 | | | 6.500 | % | | | 5,555,000 | | | | 6,503,572 | | |
United Airlines, Inc.
Series 2014 AMT
07/01/29 | | | 5.000 | % | | | 4,000,000 | | | | 4,524,120 | | |
Subordinated Refunding Revenue Bonds
Lien
Series 2012A AMT
07/01/31 | | | 5.000 | % | | | 5,000,000 | | | | 5,707,650 | | |
Clifton Higher Education Finance Corp.
Revenue Bonds
Idea Public Schools
Series 2011
08/15/41 | | | 5.750 | % | | | 2,000,000 | | | | 2,263,660 | | |
Series 2012
08/15/32 | | | 5.000 | % | | | 2,165,000 | | | | 2,433,265 | | |
08/15/42 | | | 5.000 | % | | | 5,575,000 | | | | 6,200,125 | | |
Series 2013
08/15/33 | | | 6.000 | % | | | 990,000 | | | | 1,208,948 | | |
Municipal Bonds (continued)
Issue
Description | | Coupon
Rate | | Principal
Amount ($) | |
Value ($) | |
International Leadership
Series 2015
08/15/38 | | | 5.750 | % | | | 5,810,000 | | | | 6,518,936 | | |
International Leadership of Texas
Series 2015
08/15/45 | | | 5.750 | % | | | 10,500,000 | | | | 11,730,705 | | |
Series 2015A
12/01/35 | | | 5.000 | % | | | 2,200,000 | | | | 2,531,936 | | |
12/01/45 | | | 5.000 | % | | | 1,100,000 | | | | 1,253,164 | | |
Dallas/Fort Worth International Airport
Refunding Revenue Bonds
Series 2012B
11/01/35 | | | 5.000 | % | | | 10,000,000 | | | | 11,525,900 | | |
Dallas/Fort Worth International Airport(a)
Refunding Revenue Bonds
Series 2014A AMT
11/01/32 | | | 5.000 | % | | | 3,400,000 | | | | 4,002,650 | | |
Deaf Smith County Hospital District
Limited General Obligation Bonds
Series 2010A
03/01/40 | | | 6.500 | % | | | 4,000,000 | | | | 4,504,800 | | |
Harris County Health Facilities Development Corp.
Prerefunded 12/01/18 Revenue Bonds
Memorial Hermann Healthcare System
Series 2008B
12/01/35 | | | 7.250 | % | | | 8,800,000 | | | | 10,140,240 | | |
Revenue Bonds
St. Luke's Episcopal Hospital Project
Series 1991 Escrowed to Maturity
02/15/21 | | | 6.750 | % | | | 1,955,000 | | | | 2,133,179 | | |
Houston Higher Education Finance Corp.
Prerefunded 05/15/21 Revenue Bonds
Harmony Public Schools
Series 2011A
05/15/41 | | | 6.875 | % | | | 4,045,000 | | | | 5,179,987 | | |
La Vernia Higher Education Finance Corp.
Prerefunded 08/15/19 Revenue Bonds
Kipp, Inc.
Series 2009A
08/15/44 | | | 6.375 | % | | | 7,500,000 | | | | 8,754,525 | | |
Matagorda County Navigation District No. 1
Refunding Revenue Bonds
Central Power & Light Co. Project
Series 2001A
11/01/29 | | | 6.300 | % | | | 2,800,000 | | | | 3,184,832 | | |
Mission Economic Development Corp.
Revenue Bonds
Senior Lien - Natgasoline Project
Series 2016 AMT(a)(b)
10/01/31 | | | 5.750 | % | | | 500,000 | | | | 534,045 | | |
The accompanying Notes to Financial Statements are an integral part of this statement.
Annual Report 2016
27
PORTFOLIO OF INVESTMENTS (continued)
July 31, 2016
Municipal Bonds (continued)
Issue
Description | | Coupon
Rate | | Principal
Amount ($) | |
Value ($) | |
Mission Economic Development Corp
Revenue Bonds
Dallas Clean Energy McCommas
Series 2011 AMT(a)
12/01/24 | | | 6.875 | % | | | 15,000,000 | | | | 15,540,000 | | |
New Hope Cultural Education Facilities Finance Corp.
Revenue Bonds
Cardinal Bay, Inc. - Village on the Park
Series 2016
07/01/31 | | | 4.000 | % | | | 1,000,000 | | | | 1,064,900 | | |
07/01/46 | | | 5.000 | % | | | 1,750,000 | | | | 1,982,523 | | |
07/01/51 | | | 4.750 | % | | | 2,250,000 | | | | 2,436,390 | | |
Collegiate Housing College Station
Series 2014
04/01/46 | | | 5.000 | % | | | 7,250,000 | | | | 8,011,757 | | |
Collegiate Housing Tarleton State University
Series 2015
04/01/47 | | | 5.000 | % | | | 2,995,000 | | | | 3,385,788 | | |
NCCD-College Station Properties LLC
Series 2015A
07/01/47 | | | 5.000 | % | | | 23,360,000 | | | | 26,138,672 | | |
North Texas Tollway Authority
Prerefunded 01/01/18 Revenue Bonds
Toll 2nd Tier
Series 2008F (GNMA/FNMA)
01/01/38 | | | 5.750 | % | | | 11,355,000 | | | | 12,181,871 | | |
Refunding Revenue Bonds
1st Tier
Series 2009C
01/01/44 | | | 5.250 | % | | | 5,000,000 | | | | 5,434,350 | | |
Series 2011
01/01/38 | | | 5.000 | % | | | 5,500,000 | | | | 6,180,020 | | |
Series 2012B
01/01/42 | | | 5.000 | % | | | 12,845,000 | | | | 14,751,583 | | |
2nd Tier
Series 2015A
01/01/38 | | | 5.000 | % | | | 9,230,000 | | | | 10,957,118 | | |
Series 2016A
01/01/39 | | | 4.000 | % | | | 875,000 | | | | 968,293 | | |
01/01/39 | | | 5.000 | % | | | 2,500,000 | | | | 3,021,725 | | |
Red River Health Facilities Development Corp.
Revenue Bonds
MRC Crossings Project
Series 2014A
11/15/34 | | | 7.500 | % | | | 2,000,000 | | | | 2,386,100 | | |
11/15/44 | | | 7.750 | % | | | 2,800,000 | | | | 3,356,220 | | |
San Juan Higher Education Finance Authority
Revenue Bonds
Idea Public Schools
Series 2010A
08/15/40 | | | 6.700 | % | | | 2,700,000 | | | | 3,171,096 | | |
Sanger Industrial Development Corp.
Revenue Bonds
Texas Pellets Project
Series 2012B AMT(a)
07/01/38 | | | 8.000 | % | | | 34,645,000 | | | | 30,146,693 | | |
Municipal Bonds (continued)
Issue
Description | | Coupon
Rate | | Principal
Amount ($) | |
Value ($) | |
Tarrant County Cultural Education Facilities Finance Corp.
Refunding Revenue Bonds
Barton Creek Senior Living Center
Series 2015
11/15/25 | | | 5.000 | % | | | 1,675,000 | | | | 1,955,077 | | |
11/15/30 | | | 5.000 | % | | | 2,345,000 | | | | 2,700,267 | | |
11/15/35 | | | 5.000 | % | | | 1,750,000 | | | | 1,992,393 | | |
11/15/40 | | | 5.000 | % | | | 1,195,000 | | | | 1,363,603 | | |
Baylor Scott & White Health
Series 2016
11/15/42 | | | 4.000 | % | | | 10,000,000 | | | | 10,940,600 | | |
Trinity Terrace Project
Series 2014
10/01/44 | | | 5.000 | % | | | 2,500,000 | | | | 2,840,500 | | |
10/01/49 | | | 5.000 | % | | | 1,870,000 | | | | 2,112,202 | | |
Revenue Bonds
Air Force Villages, Inc. Obligation Group
Series 2007
05/15/27 | | | 5.125 | % | | | 2,000,000 | | | | 2,016,560 | | |
05/15/37 | | | 5.125 | % | | | 2,000,000 | | | | 2,003,460 | | |
CC Young Memorial Home
Series 2009A
02/15/38 | | | 8.000 | % | | | 4,000,000 | | | | 4,505,440 | | |
Stayton at Museum Way
Series 2009A
11/15/44 | | | 8.250 | % | | | 12,000,000 | | | | 12,779,880 | | |
Texas City Industrial Development Corp.
Refunding Revenue Bonds
Arco Pipe Line Co. Project
Series 1990
10/01/20 | | | 7.375 | % | | | 2,000,000 | | | | 2,467,480 | | |
Texas Municipal Gas Acquisition & Supply Corp. III
Revenue Bonds
Series 2012
12/15/29 | | | 5.000 | % | | | 8,300,000 | | | | 9,579,528 | | |
12/15/32 | | | 5.000 | % | | | 7,500,000 | | | | 8,494,800 | | |
Texas Private Activity Bond Surface Transportation Corp.(a)
Revenue Bonds
Senior Lien - Blueridge Transportation
Series 2016 AMT
12/31/50 | | | 5.000 | % | | | 7,750,000 | | | | 9,020,380 | | |
12/31/55 | | | 5.000 | % | | | 13,250,000 | | | | 15,351,185 | | |
Uptown Development Authority
Tax Allocation Bonds
Infrastructure Improvement Facilities
Series 2009
09/01/29 | | | 5.500 | % | | | 500,000 | | | | 552,685 | | |
Total | | | | | | | 460,260,540 | | |
VIRGINIA 0.6% | |
City of Chesapeake Expressway Toll Road
Revenue Bonds
Transportation System
Senior Series 2012A
07/15/47 | | | 5.000 | % | | | 7,505,000 | | | | 8,479,600 | | |
The accompanying Notes to Financial Statements are an integral part of this statement.
Annual Report 2016
28
PORTFOLIO OF INVESTMENTS (continued)
July 31, 2016
Municipal Bonds (continued)
Issue
Description | | Coupon
Rate | | Principal
Amount ($) | |
Value ($) | |
Fairfax County Industrial Development Authority
Refunding Revenue Bonds
Inova Health System Project
Series 1993
08/15/23 | | | 5.000 | % | | | 10,000,000 | | | | 11,915,500 | | |
Fredericksburg Economic Development Authority
Refunding Revenue Bonds
Mary Washington Healthcare Obligation
Series 2014
06/15/30 | | | 5.000 | % | | | 1,000,000 | | | | 1,184,010 | | |
06/15/31 | | | 5.000 | % | | | 800,000 | | | | 944,064 | | |
06/15/33 | | | 5.000 | % | | | 500,000 | | | | 585,745 | | |
Mosaic District Community Development Authority
Special Assessment Bonds
Series 2011A
03/01/26 | | | 6.625 | % | | | 2,145,000 | | | | 2,488,929 | | |
Total | | | | | | | 25,597,848 | | |
WASHINGTON 2.1% | |
Greater Wenatchee Regional Events Center Public Facilities District
Revenue Bonds
Series 2012A
09/01/27 | | | 5.000 | % | | | 1,540,000 | | | | 1,669,591 | | |
09/01/32 | | | 5.250 | % | | | 1,000,000 | | | | 1,069,430 | | |
King County Public Hospital District No. 4
Revenue Bonds
Series 2015A
12/01/35 | | | 6.000 | % | | | 1,300,000 | | | | 1,345,708 | | |
12/01/45 | | | 6.250 | % | | | 2,500,000 | | | | 2,594,600 | | |
Skagit County Public Hospital District No. 1
Revenue Bonds
Skagit Valley Hospital
Series 2005
12/01/30 | | | 5.500 | % | | | 1,235,000 | | | | 1,239,137 | | |
Series 2007
12/01/28 | | | 5.750 | % | | | 1,500,000 | | | | 1,588,590 | | |
12/01/32 | | | 5.750 | % | | | 2,000,000 | | | | 2,105,360 | | |
Snohomish County Public Utility District No. 1
Refunding Revenue Bonds
Generation System
Series 1986A Escrowed to Maturity
01/01/20 | | | 5.000 | % | | | 12,000,000 | | | | 13,724,280 | | |
Washington Health Care Facilities Authority
Revenue Bonds
Overlake Hospital Medical Center
Series 2010
07/01/30 | | | 5.500 | % | | | 3,000,000 | | | | 3,452,910 | | |
Washington Higher Education Facilities Authority
Refunding Revenue Bonds
Whitworth University Project
Series 2009
10/01/40 | | | 5.625 | % | | | 4,685,000 | | | | 5,213,890 | | |
Municipal Bonds (continued)
Issue
Description | | Coupon
Rate | | Principal
Amount ($) | |
Value ($) | |
Washington State Housing Finance Commission
Refunding Revenue Bonds
Nonprofit Housing-Mirabella
Series 2012
10/01/32 | | | 6.500 | % | | | 9,800,000 | | | | 10,862,026 | | |
10/01/47 | | | 6.750 | % | | | 1,000,000 | | | | 1,105,860 | | |
Presbyterian Retirement
Series 2013
01/01/23 | | | 5.000 | % | | | 1,200,000 | | | | 1,323,000 | | |
01/01/28 | | | 5.000 | % | | | 2,015,000 | | | | 2,157,521 | | |
01/01/33 | | | 5.000 | % | | | 2,570,000 | | | | 2,720,191 | | |
01/01/43 | | | 5.250 | % | | | 7,550,000 | | | | 8,022,479 | | |
Revenue Bonds
Heron's Key
Series 2015A
07/01/30 | | | 6.500 | % | | | 480,000 | | | | 513,638 | | |
07/01/35 | | | 6.750 | % | | | 550,000 | | | | 592,108 | | |
07/01/45 | | | 7.000 | % | | | 1,800,000 | | | | 1,955,880 | | |
Skyline at First Hill Project
Series 2007A
01/01/27 | | | 5.625 | % | | | 2,500,000 | | | | 2,521,900 | | |
01/01/38 | | | 5.625 | % | | | 19,450,000 | | | | 19,592,374 | | |
Washington State Housing Finance Commission(b)
Refunding Revenue Bonds
Skyline 1st Hill Project
Series 2015
01/01/20 | | | 4.125 | % | | | 490,000 | | | | 499,878 | | |
01/01/25 | | | 5.000 | % | | | 770,000 | | | | 803,903 | | |
01/01/35 | | | 5.750 | % | | | 575,000 | | | | 599,507 | | |
01/01/45 | | | 6.000 | % | | | 2,325,000 | | | | 2,423,068 | | |
Washington State Housing Finance Commission(b)(f)
Refunding Revenue Bonds
Bayview Manor Homes
Series 2016A
07/01/46 | | | 5.000 | % | | | 1,275,000 | | | | 1,362,287 | | |
Total | | | | | | | 91,059,116 | | |
WEST VIRGINIA 0.1% | |
West Virginia Economic Development Authority
Refunding Revenue Bonds
Appalachian Power Co.-Amos Project
Series 2010A
12/01/38 | | | 5.375 | % | | | 3,850,000 | | | | 4,388,461 | | |
WISCONSIN 3.5% | |
City of La Crosse
Refunding Revenue Bonds
Northern States Power Co. Project
Series 1996 AMT(a)
11/01/21 | | | 6.000 | % | | | 6,000,000 | | | | 7,357,020 | | |
Monroe Redevelopment Authority
Prerefunded 02/15/19 Revenue Bonds
Monroe Clinic, Inc.
Series 2009
02/15/39 | | | 5.875 | % | | | 5,000,000 | | | | 5,654,100 | | |
The accompanying Notes to Financial Statements are an integral part of this statement.
Annual Report 2016
29
PORTFOLIO OF INVESTMENTS (continued)
July 31, 2016
Municipal Bonds (continued)
Issue
Description | | Coupon
Rate | | Principal
Amount ($) | |
Value ($) | |
Public Finance Authority(a)
Refunding Revenue Bonds
Celanese Project
Series 2016B AMT
12/01/25 | | | 5.000 | % | | | 4,500,000 | | | | 5,268,510 | | |
TRIPS Senior Obligation Group
Series 2012B AMT
07/01/28 | | | 5.250 | % | | | 4,000,000 | | | | 4,503,400 | | |
07/01/42 | | | 5.000 | % | | | 2,000,000 | | | | 2,151,400 | | |
Waste Management, Inc. Project
Series 2016 AMT
05/01/27 | | | 2.875 | % | | | 2,370,000 | | | | 2,437,971 | | |
State of Wisconsin
Revenue Bonds
Series 2009A
05/01/33 | | | 5.750 | % | | | 17,700,000 | | | | 20,000,115 | | |
Wisconsin Health & Educational Facilities Authority
Prerefunded 02/15/19 Revenue Bonds
ProHealth Care, Inc. Obligation Group
Series 2009
02/15/39 | | | 6.625 | % | | | 25,150,000 | | | | 28,935,829 | | |
Prerefunded 04/01/18 Revenue Bonds
Riverview Hospital Association
Series 2008
04/01/38 | | | 5.750 | % | | | 4,000,000 | | | | 4,345,040 | | |
Prerefunded 09/15/19 Revenue Bonds
St. John's Community, Inc.
Series 2009A
09/15/29 | | | 7.250 | % | | | 1,000,000 | | | | 1,182,760 | | |
09/15/39 | | | 7.625 | % | | | 1,000,000 | | | | 1,205,870 | | |
Refunding Revenue Bonds
Ascension Health Credit Group
Series 2016
11/15/36 | | | 4.000 | % | | | 8,225,000 | | | | 9,109,681 | | |
11/15/46 | | | 4.000 | % | | | 20,000,000 | | | | 21,935,000 | | |
Revenue Bonds
Aurora Health Care, Inc.
Series 2010A
04/15/39 | | | 5.625 | % | | | 6,100,000 | | | | 6,889,218 | | |
Beaver Dam Community Hospitals
Series 2013A
08/15/28 | | | 5.125 | % | | | 6,750,000 | | | | 7,587,945 | | |
08/15/34 | | | 5.250 | % | | | 8,000,000 | | | | 8,957,280 | | |
ProHealth Care, Inc.
Series 2012
08/15/28 | | | 5.000 | % | | | 1,570,000 | | | | 1,811,121 | | |
ThedaCare, Inc.
Series 2015
12/15/44 | | | 5.000 | % | | | 6,725,000 | | | | 7,938,392 | | |
Unrefunded Revenue Bonds
Medical College of Wisconsin
Series 2008A
12/01/35 | | | 5.250 | % | | | 1,365,000 | | | | 1,488,369 | | |
Total | | | | | | | 148,759,021 | | |
Municipal Bonds (continued)
Issue
Description | | Coupon
Rate | | Principal
Amount ($) | |
Value ($) | |
WYOMING 0.2% | |
County of Campbell
Revenue Bonds
Basin Electric Power Cooperative
Series 2009A
07/15/39 | | | 5.750 | % | | | 7,900,000 | | | | 8,920,838 | | |
Total Municipal Bonds
(Cost: $3,856,110,142) | | | | | | | 4,245,310,391 | | |
Municipal Bonds Held in Trust 0.4% | |
MASSACHUSETTS 0.4% | |
Massachusetts Health & Educational Facilities Authority
Revenue Bonds
Harvard University
Series 2009A(b)(g)(h)
11/15/36 | | | 5.500 | % | | | 16,000,000 | | | | 17,811,520 | | |
Total Municipal Bonds Held in Trust
(Cost: $17,423,814) | | | | | | | 17,811,520 | | |
Floating Rate Notes 0.9% | |
Issue
Description | | Effective
Yield | | Principal
Amount ($) | | Value ($) | |
NEW YORK 0.9% | |
City of New York
Unlimited General Obligation Bonds
Series 2013I-4(g)
04/01/36 | | | 0.400 | % | | | 13,000,000 | | | | 13,000,000 | | |
New York City Transitional Finance Authority
Subordinated Revenue Bonds
Future Tax Secured
Series 2016(g)
02/01/45 | | | 0.390 | % | | | 10,000,000 | | | | 10,000,000 | | |
New York City Water & Sewer System
Revenue Bonds
2nd General Resolution
Series 2013DD-2(g)
06/15/43 | | | 0.390 | % | | | 14,300,000 | | | | 14,300,000 | | |
Total | | | | | | | 37,300,000 | | |
Total Floating Rate Notes
(Cost: $37,300,000) | | | | | | | 37,300,000 | | |
The accompanying Notes to Financial Statements are an integral part of this statement.
Annual Report 2016
30
PORTFOLIO OF INVESTMENTS (continued)
July 31, 2016
Money Market Funds 0.5%
| | | Shares | | Value ($) | |
Dreyfus Tax-Exempt Cash Management Fund,
Institutional Shares, 0.220%(i) | | | 13,074,940 | | | | 13,074,940 | | |
JPMorgan Municipal Money Market Fund,
Agency Shares, 0.210%(i) | | | 10,551,091 | | | | 10,551,091 | | |
Total Money Market Funds
(Cost: $23,626,031) | | | | | 23,626,031 | | |
Total Investments
(Cost: $3,934,459,987) | | | | | 4,324,047,942 | | |
Other Assets & Liabilities, Net | | | | | (15,257,678 | ) | |
Net Assets | | | | | 4,308,790,264 | | |
Notes to Portfolio of Investments
(a) Income from this security may be subject to alternative minimum tax.
(b) Represents privately placed and other securities and instruments exempt from SEC registration (collectively, private placements), such as Section 4(a)(2) and Rule 144A eligible securities, which are often sold only to qualified institutional buyers. The Fund may invest in private placements determined to be liquid as well as those determined to be illiquid. Private placements may be determined to be liquid under guidelines established by the Fund's Board of Trustees. At July 31, 2016, the value of these securities amounted to $103,072,153 or 2.39% of net assets.
(c) Municipal obligations include debt obligations issued by or on behalf of territories, possessions, or sovereign nations within the territorial boundaries of the United States. At July 31, 2016, the value of these securities amounted to $47,544,044 or 1.10% of net assets.
(d) Represents securities that have defaulted on payment of interest. The Fund has stopped accruing interest on these securities. At July 31, 2016, the value of these securities amounted to $21,977,291, which represents 0.51% of net assets.
(e) Zero coupon bond.
(f) Security, or a portion thereof, has been purchased on a when-issued or delayed delivery basis.
(g) Variable rate security.
(h) The Fund entered into transactions in which it transfers to trusts fixed rate municipal bonds in exchange for cash and residual interests in the trusts' assets and cash flows, which are in the form of inverse floating rate securities. The trust funds the purchases of the municipal bonds by issuing short-term floating rate notes to third parties. The municipal bonds transferred to the trusts remain in the Fund's Portfolio of Investments.
(i) The rate shown is the seven-day current annualized yield at July 31, 2016.
Abbreviation Legend
AGM Assured Guaranty Municipal Corporation
AMBAC Ambac Assurance Corporation
AMT Alternative Minimum Tax
FGIC Financial Guaranty Insurance Company
FHLMC Federal Home Loan Mortgage Corporation
FNMA Federal National Mortgage Association
GNMA Government National Mortgage Association
IBC Insurance Bond Certificate
MGIC Mortgage Guaranty Insurance Corporation
NPFGC National Public Finance Guarantee Corporation
The accompanying Notes to Financial Statements are an integral part of this statement.
Annual Report 2016
31
PORTFOLIO OF INVESTMENTS (continued)
July 31, 2016
Fair Value Measurements
The Fund categorizes its fair value measurements according to a three-level hierarchy that maximizes the use of observable inputs and minimizes the use of unobservable inputs by prioritizing that the most observable input be used when available. Observable inputs are those that market participants would use in pricing an investment based on market data obtained from sources independent of the reporting entity. Unobservable inputs are those that reflect the Fund's assumptions about the information market participants would use in pricing an investment. An investment's level within the fair value hierarchy is based on the lowest level of any input that is deemed significant to the asset's or liability's fair value measurement. The input levels are not necessarily an indication of the risk or liquidity associated with investments at that level. For example, certain U.S. government securities are generally high quality and liquid, however, they are reflected as Level 2 because the inputs used to determine fair value may not always be quoted prices in an active market.
Fair value inputs are summarized in the three broad levels listed below:
> Level 1 — Valuations based on quoted prices for investments in active markets that the Fund has the ability to access at the measurement date (including NAV for open-end mutual funds). Valuation adjustments are not applied to Level 1 investments.
> Level 2 — Valuations based on other significant observable inputs (including quoted prices for similar securities, interest rates, prepayment speeds, credit risks, etc.).
> Level 3 — Valuations based on significant unobservable inputs (including the Fund's own assumptions and judgment in determining the fair value of investments).
Inputs that are used in determining fair value of an investment may include price information, credit data, volatility statistics, and other factors. These inputs can be either observable or unobservable. The availability of observable inputs can vary between investments, and is affected by various factors such as the type of investment, and the volume and level of activity for that investment or similar investments in the marketplace. The inputs will be considered by the Investment Manager, along with any other relevant factors in the calculation of an investment's fair value. The Fund uses prices and inputs that are current as of the measurement date, which may include periods of market dislocations. During these periods, the availability of prices and inputs may be reduced for many investments. This condition could cause an investment to be reclassified between the various levels within the hierarchy.
Investments falling into the Level 3 category are primarily supported by quoted prices from brokers and dealers participating in the market for those investments. However, these may be classified as Level 3 investments due to lack of market transparency and corroboration to support these quoted prices. Additionally, valuation models may be used as the pricing source for any remaining investments classified as Level 3. These models may rely on one or more significant unobservable inputs and/or significant assumptions by the Investment Manager. Inputs used in valuations may include, but are not limited to, financial statement analysis, capital account balances, discount rates and estimated cash flows, and comparable company data.
Under the direction of the Fund's Board of Trustees (the Board), the Investment Manager's Valuation Committee (the Committee) is responsible for overseeing the valuation procedures approved by the Board. The Committee consists of voting and non-voting members from various groups within the Investment Manager's organization, including operations and accounting, trading and investments, compliance, risk management and legal.
The Committee meets at least monthly to review and approve valuation matters, which may include a description of specific valuation determinations, data regarding pricing information received from approved pricing vendors and brokers and the results of Board-approved valuation control policies and procedures (the Policies). The Policies address, among other things, instances when market quotations are or are not readily available, including recommendations of third party pricing vendors and a determination of appropriate pricing methodologies; events that require specific valuation determinations and assessment of fair value techniques; securities with a potential for stale pricing, including those that are illiquid, restricted, or in default; and the effectiveness of third party pricing vendors, including periodic reviews of vendors. The Committee meets more frequently, as needed, to discuss additional valuation matters, which may include the need to review back-testing results, review time-sensitive information or approve related valuation actions. The Committee reports to the Board, with members of the Committee meeting with the Board at each of its regularly scheduled meetings to discuss valuation matters and actions during the period, similar to those described earlier.
For investments categorized as Level 3, the Committee monitors information similar to that described above, which may include: (i) data specific to the issuer or comparable issuers, (ii) general market or specific sector news and (iii) quoted prices and specific or similar security transactions. The Committee considers this data and any changes from prior periods in order to assess the reasonableness of observable and unobservable inputs, any assumptions or internal models used to value those securities and changes in fair value. This data is also used to corroborate, when available, information received from approved pricing vendors and brokers. Various factors impact the frequency of monitoring this information (which may occur as often as daily). However, the Committee may determine that changes to inputs, assumptions and models are not required as a result of the monitoring procedures performed.
The accompanying Notes to Financial Statements are an integral part of this statement.
Annual Report 2016
32
PORTFOLIO OF INVESTMENTS (continued)
July 31, 2016
Fair Value Measurements (continued)
The following table is a summary of the inputs used to value the Fund's investments at July 31, 2016:
| | | Level 1
Quoted Prices in Active
Markets for Identical
Assets ($) | | Level 2
Other Significant
Observable Inputs ($) | | Level 3
Significant
Unobservable Inputs ($) | | Total ($) | |
Investments | |
Municipal Bonds | | | — | | | | 4,245,310,391 | | | | — | | | | 4,245,310,391 | | |
Municipal Bonds Held in Trust | | | — | | | | 17,811,520 | | | | — | | | | 17,811,520 | | |
Floating Rate Notes | | | — | | | | 37,300,000 | | | | — | | | | 37,300,000 | | |
Money Market Funds | | | 23,626,031 | | | | — | | | | — | | | | 23,626,031 | | |
Total Investments | | | 23,626,031 | | | | 4,300,421,911 | | | | — | | | | 4,324,047,942 | | |
See the Portfolio of Investments for all investment classifications not indicated in the table.
The Fund's assets assigned to the Level 2 input category are generally valued using the market approach, in which a security's value is determined through reference to prices and information from market transactions for similar or identical assets.
There were no transfers of financial assets between levels during the period.
The accompanying Notes to Financial Statements are an integral part of this statement.
Annual Report 2016
33
STATEMENT OF ASSETS AND LIABILITIES
July 31, 2016
Assets | |
Investments, at value | |
(identified cost $3,934,459,987) | | $ | 4,324,047,942 | | |
Receivable for: | |
Investments sold | | | 1,965,904 | | |
Capital shares sold | | | 14,739,354 | | |
Interest | | | 42,143,706 | | |
Prepaid expenses | | | 43,020 | | |
Trustees' deferred compensation plan | | | 341,236 | | |
Total assets | | | 4,383,281,162 | | |
Liabilities | |
Short-term floating rate notes outstanding | | | 12,000,000 | | |
Payable for: | |
Investments purchased on a delayed delivery basis | | | 43,082,921 | | |
Capital shares purchased | | | 4,234,888 | | |
Dividend distributions to shareholders | | | 14,057,947 | | |
Management services fees | | | 50,357 | | |
Distribution and/or service fees | | | 21,037 | | |
Transfer agent fees | | | 353,260 | | |
Compensation of board members | | | 33,105 | | |
Chief compliance officer expenses | | | 197 | | |
Other expenses | | | 315,950 | | |
Trustees' deferred compensation plan | | | 341,236 | | |
Total liabilities | | | 74,490,898 | | |
Net assets applicable to outstanding capital stock | | $ | 4,308,790,264 | | |
Represented by | |
Paid-in capital | | $ | 3,911,353,729 | | |
Undistributed net investment income | | | 21,617,895 | | |
Accumulated net realized loss | | | (13,769,315 | ) | |
Unrealized appreciation (depreciation) on: | |
Investments | | | 389,587,955 | | |
Total — representing net assets applicable to outstanding capital stock | | $ | 4,308,790,264 | | |
The accompanying Notes to Financial Statements are an integral part of this statement.
Annual Report 2016
34
STATEMENT OF ASSETS AND LIABILITIES (continued)
July 31, 2016
Class A | |
Net assets | | $ | 3,344,273,983 | | |
Shares outstanding | | | 234,681,915 | | |
Net asset value per share | | $ | 14.25 | | |
Maximum offering price per share(a) | | $ | 14.69 | | |
Class B | |
Net assets | | $ | 1,049,464 | | |
Shares outstanding | | | 73,713 | | |
Net asset value per share | | $ | 14.24 | | |
Class C | |
Net assets | | $ | 120,031,314 | | |
Shares outstanding | | | 8,426,413 | | |
Net asset value per share | | $ | 14.24 | | |
Class R4 | |
Net assets | | $ | 5,303,284 | | |
Shares outstanding | | | 372,282 | | |
Net asset value per share | | $ | 14.25 | | |
Class R5 | |
Net assets | | $ | 892,753 | | |
Shares outstanding | | | 62,656 | | |
Net asset value per share | | $ | 14.25 | | |
Class Z | |
Net assets | | $ | 837,239,466 | | |
Shares outstanding | | | 58,745,283 | | |
Net asset value per share | | $ | 14.25 | | |
(a) The maximum offering price per share is calculated by dividing the net asset value per share by 1.0 minus the maximum sales charge of 3.00%.
The accompanying Notes to Financial Statements are an integral part of this statement.
Annual Report 2016
35
STATEMENT OF OPERATIONS
Year Ended July 31, 2016
Net investment income | |
Income: | |
Dividends | | $ | 29,014 | | |
Interest | | | 199,348,363 | | |
Total income | | | 199,377,377 | | |
Expenses: | |
Management services fees | | | 17,878,811 | | |
Distribution and/or service fees | |
Class A | | | 6,518,006 | | |
Class B | | | 13,895 | | |
Class C | | | 1,020,347 | | |
Transfer agent fees | |
Class A | | | 3,591,354 | | |
Class B | | | 1,613 | | |
Class C | | | 118,356 | | |
Class R4 | | | 2,658 | | |
Class R5 | | | 379 | | |
Class Z | | | 868,293 | | |
Compensation of board members | | | 90,752 | | |
Custodian fees | | | 28,761 | | |
Printing and postage fees | | | 175,123 | | |
Registration fees | | | 132,996 | | |
Audit fees | | | 38,909 | | |
Legal fees | | | 117,818 | | |
Interest expense | | | 82,987 | | |
Chief compliance officer expenses | | | 2,038 | | |
Other | | | 128,802 | | |
Total expenses | | | 30,811,898 | | |
Fees waived by Distributor — Class C | | | (107,301 | ) | |
Expense reductions | | | (3,000 | ) | |
Total net expenses | | | 30,701,597 | | |
Net investment income | | | 168,675,780 | | |
Realized and unrealized gain (loss) — net | |
Net realized gain (loss) on: | |
Investments | | | 40,827,132 | | |
Net realized gain | | | 40,827,132 | | |
Net change in unrealized appreciation (depreciation) on: | |
Investments | | | 82,171,308 | | |
Net change in unrealized appreciation | | | 82,171,308 | | |
Net realized and unrealized gain | | | 122,998,440 | | |
Net increase in net assets resulting from operations | | $ | 291,674,220 | | |
The accompanying Notes to Financial Statements are an integral part of this statement.
Annual Report 2016
36
STATEMENT OF CHANGES IN NET ASSETS
| | | Year Ended
July 31,
2016 | | Year Ended
July 31,
2015 | |
Operations | |
Net investment income | | $ | 168,675,780 | | | $ | 170,845,160 | | |
Net realized gain | | | 40,827,132 | | | | 39,508,642 | | |
Net change in unrealized appreciation (depreciation) | | | 82,171,308 | | | | (37,400,245 | ) | |
Net increase in net assets resulting from operations | | | 291,674,220 | | | | 172,953,557 | | |
Distributions to shareholders | |
Net investment income | |
Class A | | | (131,973,218 | ) | | | (138,541,543 | ) | |
Class B | | | (48,212 | ) | | | (96,524 | ) | |
Class C | | | (3,643,444 | ) | | | (3,512,467 | ) | |
Class R4 | | | (102,852 | ) | | | (66,353 | ) | |
Class R5 | | | (32,702 | ) | | | (17,129 | ) | |
Class Z | | | (33,486,512 | ) | | | (27,232,176 | ) | |
Total distributions to shareholders | | | (169,286,940 | ) | | | (169,466,192 | ) | |
Increase in net assets from capital stock activity | | | 91,507,214 | | | | 108,986,662 | | |
Proceeds from regulatory settlements (Note 6) | | | — | | | | 1,138,577 | | |
Total increase in net assets | | | 213,894,494 | | | | 113,612,604 | | |
Net assets at beginning of year | | | 4,094,895,770 | | | | 3,981,283,166 | | |
Net assets at end of year | | $ | 4,308,790,264 | | | $ | 4,094,895,770 | | |
Undistributed net investment income | | $ | 21,617,895 | | | $ | 21,311,418 | | |
The accompanying Notes to Financial Statements are an integral part of this statement.
Annual Report 2016
37
STATEMENT OF CHANGES IN NET ASSETS (continued)
| | | Year Ended July 31, 2016 | | Year Ended July 31, 2015 | |
| | | Shares | | Dollars ($) | | Shares | | Dollars ($) | |
Capital stock activity | |
Class A shares | |
Subscriptions(a) | | | 13,438,078 | | | | 188,427,421 | | | | 9,167,141 | | | | 128,420,367 | | |
Distributions reinvested | | | 7,779,661 | | | | 109,026,786 | | | | 8,086,782 | | | | 113,294,556 | | |
Redemptions | | | (20,509,344 | ) | | | (287,199,931 | ) | | | (23,038,191 | ) | | | (322,256,213 | ) | |
Net increase (decrease) | | | 708,395 | | | | 10,254,276 | | | | (5,784,268 | ) | | | (80,541,290 | ) | |
Class B shares | |
Subscriptions | | | 3,853 | | | | 53,820 | | | | 8,859 | | | | 123,601 | | |
Distributions reinvested | | | 2,826 | | | | 39,509 | | | | 5,815 | | | | 81,431 | | |
Redemptions(a) | | | (80,574 | ) | | | (1,124,452 | ) | | | (116,342 | ) | | | (1,627,299 | ) | |
Net decrease | | | (73,895 | ) | | | (1,031,123 | ) | | | (101,668 | ) | | | (1,422,267 | ) | |
Class C shares | |
Subscriptions | | | 2,043,579 | | | | 28,662,997 | | | | 1,189,363 | | | | 16,642,965 | | |
Distributions reinvested | | | 217,637 | | | | 3,049,505 | | | | 206,104 | | | | 2,885,662 | | |
Redemptions | | | (1,009,055 | ) | | | (14,139,204 | ) | | | (929,181 | ) | | | (12,981,541 | ) | |
Net increase | | | 1,252,161 | | | | 17,573,298 | | | | 466,286 | | | | 6,547,086 | | |
Class R4 shares | |
Subscriptions | | | 290,792 | | | | 4,099,216 | | | | 39,946 | | | | 558,043 | | |
Distributions reinvested | | | 7,283 | | | | 102,413 | | | | 4,707 | | | | 65,898 | | |
Redemptions | | | (43,878 | ) | | | (611,382 | ) | | | (23,563 | ) | | | (330,615 | ) | |
Net increase | | | 254,197 | | | | 3,590,247 | | | | 21,090 | | | | 293,326 | | |
Class R5 shares | |
Subscriptions | | | 60,158 | | | | 842,014 | | | | 23,203 | | | | 322,245 | | |
Distributions reinvested | | | 2,301 | | | | 32,258 | | | | 1,191 | | | | 16,669 | | |
Redemptions | | | (44,768 | ) | | | (626,368 | ) | | | (2,002 | ) | | | (27,880 | ) | |
Net increase | | | 17,691 | | | | 247,904 | | | | 22,392 | | | | 311,034 | | |
Class Z shares | |
Subscriptions | | | 23,630,385 | | | | 329,968,407 | | | | 16,880,119 | | | | 235,743,464 | | |
Distributions reinvested | | | 660,466 | | | | 9,257,482 | | | | 683,300 | | | | 9,573,139 | | |
Redemptions | | | (19,889,227 | ) | | | (278,353,277 | ) | | | (4,396,012 | ) | | | (61,517,830 | ) | |
Net increase | | | 4,401,624 | | | | 60,872,612 | | | | 13,167,407 | | | | 183,798,773 | | |
Total net increase | | | 6,560,173 | | | | 91,507,214 | | | | 7,791,239 | | | | 108,986,662 | | |
(a) Includes conversions of Class B shares to Class A shares, if any.
The accompanying Notes to Financial Statements are an integral part of this statement.
Annual Report 2016
38
The following tables are intended to help you understand the Fund's financial performance. Certain information reflects financial results for a single share of a class held for the periods shown. Per share net investment income (loss) amounts are calculated based on average shares outstanding during the period. Total return assumes reinvestment of all dividends and distributions, if any. Total return does not reflect payment of sales charges, if any. Total return and portfolio turnover are not annualized for periods of less than one year. The portfolio turnover rate is calculated without regard to purchase and sales transactions of short-term instruments and certain derivatives, if any. If such transactions were included, the Fund's portfolio turnover rate may be higher.
| | | Year Ended July 31, | | Year Ended
November 30, | |
Class A | | 2016 | | 2015 | | 2014 | | 2013 | | 2012(a) | | 2011 | |
Per share data | |
Net asset value, beginning of period | | $ | 13.84 | | | $ | 13.82 | | | $ | 13.38 | | | $ | 14.27 | | | $ | 13.43 | | | $ | 13.13 | | |
Income from investment operations: | |
Net investment income | | | 0.56 | | | | 0.59 | | | | 0.60 | | | | 0.57 | | | | 0.39 | | | | 0.58 | | |
Net realized and unrealized gain (loss) | | | 0.41 | | | | 0.02 | | | | 0.43 | | | | (0.89 | ) | | | 0.83 | | | | 0.31 | | |
Total from investment operations | | | 0.97 | | | | 0.61 | | | | 1.03 | | | | (0.32 | ) | | | 1.22 | | | | 0.89 | | |
Less distributions to shareholders: | |
Net investment income | | | (0.56 | ) | | | (0.59 | ) | | | (0.59 | ) | | | (0.57 | ) | | | (0.38 | ) | | | (0.59 | ) | |
Total distributions to shareholders | | | (0.56 | ) | | | (0.59 | ) | | | (0.59 | ) | | | (0.57 | ) | | | (0.38 | ) | | | (0.59 | ) | |
Proceeds from regulatory
settlements | | | — | | | | 0.00 | (b) | | | — | | | | — | | | | 0.00 | (b) | | | — | | |
Net asset value, end of period | | $ | 14.25 | | | $ | 13.84 | | | $ | 13.82 | | | $ | 13.38 | | | $ | 14.27 | | | $ | 13.43 | | |
Total return | | | 7.19 | % | | | 4.41 | %(c) | | | 7.89 | % | | | (2.42 | %) | | | 9.18 | % | | | 7.00 | % | |
Ratios to average net assets(d) | |
Total gross expenses | | | 0.76 | %(e) | | | 0.77 | %(e) | | | 0.77 | %(e) | | | 0.76 | %(e) | | | 0.76 | %(e)(f) | | | 0.76 | %(e) | |
Total net expenses(g) | | | 0.76 | %(e)(h) | | | 0.77 | %(e)(h) | | | 0.77 | %(e)(h) | | | 0.76 | %(e)(h) | | | 0.76 | %(e)(f)(h) | | | 0.75 | %(e)(h) | |
Net investment income | | | 4.04 | % | | | 4.21 | % | | | 4.44 | % | | | 4.02 | % | | | 4.17 | %(f) | | | 4.41 | % | |
Supplemental data | |
Net assets, end of period
(in thousands) | | $ | 3,344,274 | | | $ | 3,238,956 | | | $ | 3,314,256 | | | $ | 3,546,639 | | | $ | 3,848,957 | | | $ | 3,708,744 | | |
Portfolio turnover | | | 14 | % | | | 13 | % | | | 10 | % | | | 8 | % | | | 5 | % | | | 11 | % | |
Notes to Financial Highlights
(a) For the period from December 1, 2011 to July 31, 2012. During the period, the Fund's fiscal year end was changed from November 30 to July 31.
(b) Rounds to zero.
(c) The Fund received proceeds from regulatory settlements. Had the Fund not received these proceeds, the total return would have been lower by 0.03%.
(d) In addition to the fees and expenses that the Fund bears directly, the Fund indirectly bears a pro rata share of the fees and expenses of any other funds in which it invests. Such indirect expenses are not included in the Fund's reported expense ratios.
(e) Ratios include interest and fee expense related to the participation in certain inverse floater programs which is less than 0.01%. Due to an equal increase in interest income from fixed rate municipal bonds held in trust, there is no impact on the Fund's net assets, net asset value per share, total return or net investment income.
(f) Annualized.
(g) Total net expenses include the impact of certain fee waivers/expense reimbursements made by the Investment Manager and certain of its affiliates, if applicable.
(h) The benefits derived from expense reductions had an impact of less than 0.01%.
The accompanying Notes to Financial Statements are an integral part of this statement.
Annual Report 2016
39
FINANCIAL HIGHLIGHTS (continued)
| | | Year Ended July 31, | | Year Ended
November 30, | |
Class B | | 2016 | | 2015 | | 2014 | | 2013 | | 2012(a) | | 2011 | |
Per share data | |
Net asset value, beginning of period | | $ | 13.83 | | | $ | 13.81 | | | $ | 13.37 | | | $ | 14.26 | | | $ | 13.42 | | | $ | 13.13 | | |
Income from investment operations: | |
Net investment income | | | 0.46 | | | | 0.48 | | | | 0.50 | | | | 0.46 | | | | 0.32 | | | | 0.48 | | |
Net realized and unrealized gain (loss) | | | 0.41 | | | | 0.02 | | | | 0.43 | | | | (0.89 | ) | | | 0.84 | | | | 0.30 | | |
Total from investment operations | | | 0.87 | | | | 0.50 | | | | 0.93 | | | | (0.43 | ) | | | 1.16 | | | | 0.78 | | |
Less distributions to shareholders: | |
Net investment income | | | (0.46 | ) | | | (0.48 | ) | | | (0.49 | ) | | | (0.46 | ) | | | (0.32 | ) | | | (0.49 | ) | |
Total distributions to shareholders | | | (0.46 | ) | | | (0.48 | ) | | | (0.49 | ) | | | (0.46 | ) | | | (0.32 | ) | | | (0.49 | ) | |
Proceeds from regulatory settlements | | | — | | | | 0.00 | (b) | | | — | | | | — | | | | 0.00 | (b) | | | — | | |
Net asset value, end of period | | $ | 14.24 | | | $ | 13.83 | | | $ | 13.81 | | | $ | 13.37 | | | $ | 14.26 | | | $ | 13.42 | | |
Total return | | | 6.39 | % | | | 3.63 | %(c) | | | 7.09 | % | | | (3.15 | %) | | | 8.68 | % | | | 6.12 | % | |
Ratios to average net assets(d) | |
Total gross expenses | | | 1.51 | %(e) | | | 1.52 | %(e) | | | 1.52 | %(e) | | | 1.51 | %(e) | | | 1.51 | %(e)(f) | | | 1.51 | %(e) | |
Total net expenses(g) | | | 1.51 | %(e)(h) | | | 1.52 | %(e)(h) | | | 1.52 | %(e)(h) | | | 1.51 | %(e)(h) | | | 1.51 | %(e)(f)(h) | | | 1.50 | %(e)(h) | |
Net investment income | | | 3.30 | % | | | 3.46 | % | | | 3.69 | % | | | 3.26 | % | | | 3.41 | %(f) | | | 3.65 | % | |
Supplemental data | |
Net assets, end of period (in thousands) | | $ | 1,049 | | | $ | 2,041 | | | $ | 3,442 | | | $ | 5,836 | | | $ | 9,008 | | | $ | 12,630 | | |
Portfolio turnover | | | 14 | % | | | 13 | % | | | 10 | % | | | 8 | % | | | 5 | % | | | 11 | % | |
Notes to Financial Highlights
(a) For the period from December 1, 2011 to July 31, 2012. During the period, the Fund's fiscal year end was changed from November 30 to July 31.
(b) Rounds to zero.
(c) The Fund received proceeds from regulatory settlements. Had the Fund not received these proceeds, the total return would have been lower by 0.03%.
(d) In addition to the fees and expenses that the Fund bears directly, the Fund indirectly bears a pro rata share of the fees and expenses of any other funds in which it invests. Such indirect expenses are not included in the Fund's reported expense ratios.
(e) Ratios include interest and fee expense related to the participation in certain inverse floater programs which is less than 0.01%. Due to an equal increase in interest income from fixed rate municipal bonds held in trust, there is no impact on the Fund's net assets, net asset value per share, total return or net investment income.
(f) Annualized.
(g) Total net expenses include the impact of certain fee waivers/expense reimbursements made by the Investment Manager and certain of its affiliates, if applicable.
(h) The benefits derived from expense reductions had an impact of less than 0.01%.
The accompanying Notes to Financial Statements are an integral part of this statement.
Annual Report 2016
40
FINANCIAL HIGHLIGHTS (continued)
| | | Year Ended July 31, | | Year Ended
November 30, | |
Class C | | 2016 | | 2015 | | 2014 | | 2013 | | 2012(a) | | 2011 | |
Per share data | |
Net asset value, beginning of period | | $ | 13.84 | | | $ | 13.82 | | | $ | 13.37 | | | $ | 14.26 | | | $ | 13.43 | | | $ | 13.13 | | |
Income from investment operations: | |
Net investment income | | | 0.47 | | | | 0.51 | | | | 0.54 | | | | 0.49 | | | | 0.33 | | | | 0.50 | | |
Net realized and unrealized gain (loss) | | | 0.40 | | | | 0.01 | | | | 0.44 | | | | (0.89 | ) | | | 0.83 | | | | 0.31 | | |
Total from investment operations | | | 0.87 | | | | 0.52 | | | | 0.98 | | | | (0.40 | ) | | | 1.16 | | | | 0.81 | | |
Less distributions to shareholders: | |
Net investment income | | | (0.47 | ) | | | (0.50 | ) | | | (0.53 | ) | | | (0.49 | ) | | | (0.33 | ) | | | (0.51 | ) | |
Total distributions to shareholders | | | (0.47 | ) | | | (0.50 | ) | | | (0.53 | ) | | | (0.49 | ) | | | (0.33 | ) | | | (0.51 | ) | |
Proceeds from regulatory settlements | | | — | | | | 0.00 | (b) | | | — | | | | — | | | | 0.00 | (b) | | | — | | |
Net asset value, end of period | | $ | 14.24 | | | $ | 13.84 | | | $ | 13.82 | | | $ | 13.37 | | | $ | 14.26 | | | $ | 13.43 | | |
Total return | | | 6.42 | % | | | 3.80 | %(c) | | | 7.48 | % | | | (2.97 | %) | | | 8.70 | % | | | 6.36 | % | |
Ratios to average net assets(d) | |
Total gross expenses | | | 1.51 | %(e) | | | 1.52 | %(e) | | | 1.52 | %(e) | | | 1.51 | %(e) | | | 1.51 | %(e)(f) | | | 1.52 | %(e) | |
Total net expenses(g) | | | 1.41 | %(e)(h) | | | 1.36 | %(e)(h) | | | 1.22 | %(e)(h) | | | 1.31 | %(e)(h) | | | 1.36 | %(e)(f)(h) | | | 1.36 | %(e)(h) | |
Net investment income | | | 3.38 | % | | | 3.63 | % | | | 3.99 | % | | | 3.47 | % | | | 3.57 | %(f) | | | 3.82 | % | |
Supplemental data | |
Net assets, end of period (in thousands) | | $ | 120,031 | | | $ | 99,273 | | | $ | 92,689 | | | $ | 105,414 | | | $ | 93,117 | | | $ | 81,742 | | |
Portfolio turnover | | | 14 | % | | | 13 | % | | | 10 | % | | | 8 | % | | | 5 | % | | | 11 | % | |
Notes to Financial Highlights
(a) For the period from December 1, 2011 to July 31, 2012. During the period, the Fund's fiscal year end was changed from November 30 to July 31.
(b) Rounds to zero.
(c) The Fund received proceeds from regulatory settlements. Had the Fund not received these proceeds, the total return would have been lower by 0.03%.
(d) In addition to the fees and expenses that the Fund bears directly, the Fund indirectly bears a pro rata share of the fees and expenses of any other funds in which it invests. Such indirect expenses are not included in the Fund's reported expense ratios.
(e) Ratios include interest and fee expense related to the participation in certain inverse floater programs which is less than 0.01%. Due to an equal increase in interest income from fixed rate municipal bonds held in trust, there is no impact on the Fund's net assets, net asset value per share, total return or net investment income.
(f) Annualized.
(g) Total net expenses include the impact of certain fee waivers/expense reimbursements made by the Investment Manager and certain of its affiliates, if applicable.
(h) The benefits derived from expense reductions had an impact of less than 0.01%.
The accompanying Notes to Financial Statements are an integral part of this statement.
Annual Report 2016
41
FINANCIAL HIGHLIGHTS (continued)
| | | Year Ended July 31, | |
Class R4 | | 2016 | | 2015 | | 2014 | | 2013(a) | |
Per share data | |
Net asset value, beginning of period | | $ | 13.84 | | | $ | 13.82 | | | $ | 13.37 | | | $ | 14.23 | | |
Income from investment operations: | |
Net investment income | | | 0.59 | | | | 0.62 | | | | 0.63 | | | | 0.22 | | |
Net realized and unrealized gain (loss) | | | 0.41 | | | | 0.01 | | | | 0.44 | | | | (0.86 | ) | |
Total from investment operations | | | 1.00 | | | | 0.63 | | | | 1.07 | | | | (0.64 | ) | |
Less distributions to shareholders: | |
Net investment income | | | (0.59 | ) | | | (0.61 | ) | | | (0.62 | ) | | | (0.22 | ) | |
Total distributions to shareholders | | | (0.59 | ) | | | (0.61 | ) | | | (0.62 | ) | | | (0.22 | ) | |
Proceeds from regulatory settlements | | | — | | | | 0.00 | (b) | | | — | | | | — | | |
Net asset value, end of period | | $ | 14.25 | | | $ | 13.84 | | | $ | 13.82 | | | $ | 13.37 | | |
Total return | | | 7.40 | % | | | 4.62 | %(c) | | | 8.18 | % | | | (4.56 | %) | |
Ratios to average net assets(d) | |
Total gross expenses | | | 0.56 | %(e) | | | 0.57 | %(e) | | | 0.57 | %(e) | | | 0.56 | %(e)(f) | |
Total net expenses(g) | | | 0.56 | %(e)(h) | | | 0.57 | %(e)(h) | | | 0.57 | %(e)(h) | | | 0.56 | %(e)(f)(h) | |
Net investment income | | | 4.23 | % | | | 4.42 | % | | | 4.63 | % | | | 4.39 | %(f) | |
Supplemental data | |
Net assets, end of period (in thousands) | | $ | 5,303 | | | $ | 1,634 | | | $ | 1,340 | | | $ | 104 | | |
Portfolio turnover | | | 14 | % | | | 13 | % | | | 10 | % | | | 8 | % | |
Notes to Financial Highlights
(a) Based on operations from March 19, 2013 (commencement of operations) through the stated period end.
(b) Rounds to zero.
(c) The Fund received proceeds from regulatory settlements. Had the Fund not received these proceeds, the total return would have been lower by 0.03%.
(d) In addition to the fees and expenses that the Fund bears directly, the Fund indirectly bears a pro rata share of the fees and expenses of any other funds in which it invests. Such indirect expenses are not included in the Fund's reported expense ratios.
(e) Ratios include interest and fee expense related to the participation in certain inverse floater programs which is less than 0.01%. Due to an equal increase in interest income from fixed rate municipal bonds held in trust, there is no impact on the Fund's net assets, net asset value per share, total return or net investment income.
(f) Annualized.
(g) Total net expenses include the impact of certain fee waivers/expense reimbursements made by the Investment Manager and certain of its affiliates, if applicable.
(h) The benefits derived from expense reductions had an impact of less than 0.01%.
The accompanying Notes to Financial Statements are an integral part of this statement.
Annual Report 2016
42
FINANCIAL HIGHLIGHTS (continued)
| | | Year Ended July 31, | |
Class R5 | | 2016 | | 2015 | | 2014(a) | |
Per share data | |
Net asset value, beginning of period | | $ | 13.84 | | | $ | 13.82 | | | $ | 13.27 | | |
Income from investment operations: | |
Net investment income | | | 0.60 | | | | 0.63 | | | | 0.41 | | |
Net realized and unrealized gain | | | 0.41 | | | | 0.01 | | | | 0.54 | | |
Total from investment operations | | | 1.01 | | | | 0.64 | | | | 0.95 | | |
Less distributions to shareholders: | |
Net investment income | | | (0.60 | ) | | | (0.62 | ) | | | (0.40 | ) | |
Total distributions to shareholders | | | (0.60 | ) | | | (0.62 | ) | | | (0.40 | ) | |
Proceeds from regulatory settlements | | | — | | | | 0.00 | (b) | | | — | | |
Net asset value, end of period | | $ | 14.25 | | | $ | 13.84 | | | $ | 13.82 | | |
Total return | | | 7.47 | % | | | 4.69 | %(c) | | | 7.24 | % | |
Ratios to average net assets(d) | |
Total gross expenses | | | 0.50 | %(e) | | | 0.50 | %(e) | | | 0.51 | %(e)(f) | |
Total net expenses(g) | | | 0.50 | %(e) | | | 0.50 | %(e) | | | 0.51 | %(e)(f) | |
Net investment income | | | 4.30 | % | | | 4.51 | % | | | 4.69 | %(f) | |
Supplemental data | |
Net assets, end of period (in thousands) | | $ | 893 | | | $ | 622 | | | $ | 312 | | |
Portfolio turnover | | | 14 | % | | | 13 | % | | | 10 | % | |
Notes to Financial Highlights
(a) Based on operations from December 11, 2013 (commencement of operations) through the stated period end.
(b) Rounds to zero.
(c) The Fund received proceeds from regulatory settlements. Had the Fund not received these proceeds, the total return would have been lower by 0.03%.
(d) In addition to the fees and expenses that the Fund bears directly, the Fund indirectly bears a pro rata share of the fees and expenses of any other funds in which it invests. Such indirect expenses are not included in the Fund's reported expense ratios.
(e) Ratios include interest and fee expense related to the participation in certain inverse floater programs which is less than 0.01%. Due to an equal increase in interest income from fixed rate municipal bonds held in trust, there is no impact on the Fund's net assets, net asset value per share, total return or net investment income.
(f) Annualized.
(g) Total net expenses include the impact of certain fee waivers/expense reimbursements made by the Investment Manager and certain of its affiliates, if applicable.
The accompanying Notes to Financial Statements are an integral part of this statement.
Annual Report 2016
43
FINANCIAL HIGHLIGHTS (continued)
| | | Year Ended July 31, | | Year Ended
November 30, | |
Class Z | | 2016 | | 2015 | | 2014 | | 2013 | | 2012(a) | | 2011 | |
Per share data | |
Net asset value, beginning of period | | $ | 13.84 | | | $ | 13.82 | | | $ | 13.38 | | | $ | 14.27 | | | $ | 13.43 | | | $ | 13.13 | | |
Income from investment operations: | |
Net investment income | | | 0.59 | | | | 0.62 | | | | 0.63 | | | | 0.60 | | | | 0.41 | | | | 0.61 | | |
Net realized and unrealized gain (loss) | | | 0.41 | | | | 0.01 | | | | 0.43 | | | | (0.90 | ) | | | 0.83 | | | | 0.30 | | |
Total from investment operations | | | 1.00 | | | | 0.63 | | | | 1.06 | | | | (0.30 | ) | | | 1.24 | | | | 0.91 | | |
Less distributions to shareholders: | |
Net investment income | | | (0.59 | ) | | | (0.61 | ) | | | (0.62 | ) | | | (0.59 | ) | | | (0.40 | ) | | | (0.61 | ) | |
Total distributions to shareholders | | | (0.59 | ) | | | (0.61 | ) | | | (0.62 | ) | | | (0.59 | ) | | | (0.40 | ) | | | (0.61 | ) | |
Proceeds from regulatory settlements | | | — | | | | 0.00 | (b) | | | — | | | | — | | | | 0.00 | (b) | | | — | | |
Net asset value, end of period | | $ | 14.25 | | | $ | 13.84 | | | $ | 13.82 | | | $ | 13.38 | | | $ | 14.27 | | | $ | 13.43 | | |
Total return | | | 7.40 | % | | | 4.62 | %(c) | | | 8.10 | % | | | (2.22 | %) | | | 9.32 | % | | | 7.16 | % | |
Ratios to average net assets(d) | |
Total gross expenses | | | 0.56 | %(e) | | | 0.57 | %(e) | | | 0.57 | %(e) | | | 0.56 | %(e) | | | 0.56 | %(e)(f) | | | 0.59 | %(e) | |
Total net expenses(g) | | | 0.56 | %(e)(h) | | | 0.57 | %(e)(h) | | | 0.57 | %(e)(h) | | | 0.56 | %(e)(h) | | | 0.56 | %(e)(f)(h) | | | 0.56 | %(e)(h) | |
Net investment income | | | 4.24 | % | | | 4.41 | % | | | 4.63 | % | | | 4.21 | % | | | 4.37 | %(f) | | | 4.68 | % | |
Supplemental data | |
Net assets, end of period (in thousands) | | $ | 837,239 | | | $ | 752,369 | | | $ | 569,243 | | | $ | 652,839 | | | $ | 780,836 | | | $ | 716,844 | | |
Portfolio turnover | | | 14 | % | | | 13 | % | | | 10 | % | | | 8 | % | | | 5 | % | | | 11 | % | |
Notes to Financial Highlights
(a) For the period from December 1, 2011 to July 31, 2012. During the period, the Fund's fiscal year end was changed from November 30 to July 31.
(b) Rounds to zero.
(c) The Fund received proceeds from regulatory settlements. Had the Fund not received these proceeds, the total return would have been lower by 0.03%.
(d) In addition to the fees and expenses that the Fund bears directly, the Fund indirectly bears a pro rata share of the fees and expenses of any other funds in which it invests. Such indirect expenses are not included in the Fund's reported expense ratios.
(e) Ratios include interest and fee expense related to the participation in certain inverse floater programs which is less than 0.01%. Due to an equal increase in interest income from fixed rate municipal bonds held in trust, there is no impact on the Fund's net assets, net asset value per share, total return or net investment income.
(f) Annualized.
(g) Total net expenses include the impact of certain fee waivers/expense reimbursements made by the Investment Manager and certain of its affiliates, if applicable.
(h) The benefits derived from expense reductions had an impact of less than 0.01%.
The accompanying Notes to Financial Statements are an integral part of this statement.
Annual Report 2016
44
NOTES TO FINANCIAL STATEMENTS
July 31, 2016
Note 1. Organization
Columbia Tax-Exempt Fund (the Fund), a series of Columbia Funds Series Trust I (the Trust), is a diversified fund. The Trust is registered under the Investment Company Act of 1940, as amended (the 1940 Act), as an open-end management investment company organized as a Massachusetts business trust.
Fund Shares
The Trust may issue an unlimited number of shares (without par value). The Fund offers Class A, Class B, Class C, Class R4, Class R5 and Class Z shares. Although all share classes generally have identical voting, dividend and liquidation rights, each share class votes separately when required by the Trust's organizational documents or by law. Different share classes pay different distribution amounts to the extent the expenses of such share classes differ, and distributions in liquidation will be proportional to the net asset value of each share class. Each share class has its own expense and sales charge structure.
Class A shares are subject to a maximum front-end sales charge of 3.00% based on the initial investment amount. In addition, Class A shares purchased on or after February 19, 2015 are subject to a contingent deferred sales charge (CDSC) of 0.75% on certain investments of $500,000 or more if redeemed within 12 months after purchase. Redemptions of Class A shares purchased prior to February 19, 2015, without an initial sales charge in accounts aggregating $1 million to $50 million at the time of purchase, are subject to a CDSC of 1.00% if redeemed within 12 months after purchase, and 0.50% if redeemed more than 12, but less than 18, months after purchase.
Class B shares may be subject to a maximum CDSC of 5.00% based upon the holding period after purchase. Class B shares will generally convert to Class A shares eight years after purchase. The Fund no longer accepts investments by new or existing investors in the Fund's Class B shares, except in connection with the reinvestment of any dividend and/or capital gain distributions in Class B shares of the Fund and exchanges by existing Class B shareholders of certain other funds within the Columbia Family of Funds.
Class C shares are subject to a 1.00% CDSC on shares redeemed within 12 months after purchase.
Class R4 shares are not subject to sales charges and are generally available only to omnibus retirement plans and certain investors as described in the Fund's prospectus.
Class R5 shares are not subject to sales charges and are generally available only to investors purchasing through authorized investment professionals and omnibus retirement plans.
Class Z shares are not subject to sales charges and are generally available only to eligible investors, which are subject to different investment minimums as described in the Fund's prospectus.
Note 2. Summary of Significant Accounting Policies
Basis of Preparation
The Fund is an investment company that applies the accounting and reporting guidance in the Financial Accounting Standards Board (FASB) Accounting Standards Codification Topic 946, Financial Services — Investment Companies (ASC 946). The financial statements are prepared in accordance with U.S. generally accepted accounting principles (GAAP), which requires management to make certain estimates and assumptions that affect the reported amounts of assets and liabilities, the disclosure of contingent assets and liabilities at the date of the financial statements and the reported amounts of income and expenses during the reporting period. Actual results could differ from those estimates.
The following is a summary of significant accounting policies followed by the Fund in the preparation of its financial statements.
Security Valuation
Debt securities generally are valued by pricing services approved by the Board of Trustees (the Board) based upon market transactions for normal, institutional-size trading units of similar securities. The services may use various pricing techniques that take into account, as applicable, factors such as yield, quality, coupon rate, maturity, type of issue, trading characteristics and other data, as well as approved independent broker-dealer quotes. Debt securities for which quotations are not readily available or not believed to be reflective of market value may also be valued based upon a bid quote from an approved independent broker-dealer. Debt securities maturing in 60 days or less are valued primarily at amortized cost value, unless this method results in a valuation that management believes does not approximate market value.
Investments in open-end investment companies, including money market funds, are valued at their latest net asset value.
Annual Report 2016
45
NOTES TO FINANCIAL STATEMENTS (continued)
July 31, 2016
Investments for which market quotations are not readily available, or that have quotations which management believes are not reflective of market value or reliable, are valued at fair value as determined in good faith under procedures approved by and under the general supervision of the Board. If a security or class of securities (such as foreign securities) is valued at fair value, such value is likely to be different from the quoted or published price for the security.
The determination of fair value often requires significant judgment. To determine fair value, management may use assumptions including but not limited to future cash flows and estimated risk premiums. Multiple inputs from various sources may be used to determine fair value.
GAAP requires disclosure regarding the inputs and valuation techniques used to measure fair value and any changes in valuation inputs or techniques. In addition, investments shall be disclosed by major category. This information is disclosed following the Fund's Portfolio of Investments.
Delayed Delivery Securities
The Fund may trade securities on other than normal settlement terms, including securities purchased or sold on a "when-issued" basis. This may increase risk to the Fund since the other party to the transaction may fail to deliver, which could cause the Fund to subsequently invest at less advantageous prices. The Fund designates cash or liquid securities in an amount equal to the delayed delivery commitment.
Inverse Floater Program Transactions
The Fund may enter into transactions in which it transfers to trusts fixed rate municipal bonds in exchange for cash and residual interests in the trusts' assets and cash flows, which are in the form of inverse floating rate securities. The trusts fund the purchases of the municipal bonds by issuing short-term floating rate notes to third parties. The residual interests held by the Fund (inverse floating rate securities) include the right of the Fund (i) to cause the holders of the short-term floating rate notes to tender their notes at par, and (ii) to transfer the municipal bonds from the trusts to the Fund, thereby collapsing the trusts. The municipal bonds transferred to the trusts, if any, remain in the Fund's investments in securities and the related short-term floating rate notes are reflected as Fund liabilities under the caption "Short-term floating rate notes outstanding" in the Statement of Assets and Liabilities. The liability approximates the fair market value of the short-term notes. The notes issued by the trusts have interest rates
that are multi-modal, which means that they can be reset to a new or different mode at the reset date (e.g., mode can be daily, weekly, monthly, or a fixed specific date) at the discretion of the holder of the inverse floating rate security. The floating rate note holders have the option to tender their notes to the trusts for redemption at par at each reset date. The income received by the inverse floating rate security holder varies inversely with the short-term rate paid to the floating rate note holders, and in most circumstances the inverse floating rate security holder bears substantially all of the underlying bond's downside investment risk and also benefits disproportionately from any potential appreciation of the underlying bond's value. The inverse floating rate security holder will be subject to greater interest rate risk than if they were to hold the underlying bond because the interest rate is dependent on both the fixed coupon rate of the underlying bond and the short-term interest rate paid on the floating rate notes. The inverse floating rate security holder is also subject to the credit risk, liquidity risk and market risk associated with the underlying bond. The bonds held by the trusts serve as collateral for the short-term floating rate notes outstanding. Contractual maturities and interest rates of the municipal bonds held in trusts, if any, at July 31, 2016 are presented in the Portfolio of Investments. Interest and fee expense related to the short-term floating rate notes, which is accrued daily, is presented in the Statement of Operations and corresponds to an equal increase in interest income from the fixed rate municipal bonds held in trust. For the year ended July 31, 2016, the average value of short-term floating rate notes outstanding was $12,000,000 and the average interest rate and fees related to these short-term floating rate notes were 0.18% and 0.52%, respectively.
Security Transactions
Security transactions are accounted for on the trade date. Cost is determined and gains (losses) are based upon the specific identification method for both financial statement and federal income tax purposes.
Income Recognition
Interest income is recorded on an accrual basis. Market premiums and discounts, including original issue discounts, are amortized and accreted, respectively, over the expected life of the security on all debt securities, unless otherwise noted.
The Fund may place a debt security on non-accrual status and reduce related interest income when it becomes probable that the interest will not be collected
Annual Report 2016
46
NOTES TO FINANCIAL STATEMENTS (continued)
July 31, 2016
and the amount of uncollectible interest can be reasonably estimated. A defaulted debt security is removed from non-accrual status when the issuer resumes interest payments or when collectibility of interest is reasonably assured.
Dividend income is recorded on the ex-dividend date.
Expenses
General expenses of the Trust are allocated to the Fund and other funds of the Trust based upon relative net assets or other expense allocation methodologies determined by the nature of the expense. Expenses directly attributable to the Fund are charged to the Fund. Expenses directly attributable to a specific class of shares are charged to that share class.
Determination of Class Net Asset Value
All income, expenses (other than class-specific expenses, which are charged to that share class, as shown in the Statement of Operations) and realized and unrealized gains (losses) are allocated to each class of the Fund on a daily basis, based on the relative net assets of each class, for purposes of determining the net asset value of each class.
Federal Income Tax Status
The Fund intends to qualify each year as a regulated investment company under Subchapter M of the Internal Revenue Code, as amended, and will distribute substantially all of its tax exempt and taxable income (including net short-term capital gains), if any, for its tax year, and as such will not be subject to federal income taxes. In addition, the Fund intends to distribute in each calendar year substantially all of its net investment income, capital gains and certain other amounts, if any, such that the Fund should not be subject to federal excise tax. Therefore, no federal income or excise tax provision is recorded.
Distributions to Shareholders
Distributions from net investment income, if any, are declared daily and paid monthly. Net realized capital gains, if any, are distributed at least annually. Income distributions and capital gain distributions are determined in accordance with federal income tax regulations, which may differ from GAAP.
Guarantees and Indemnifications
Under the Trust's organizational documents and, in some cases, by contract, its officers and trustees are
indemnified against certain liabilities arising out of the performance of their duties to the Trust or its funds. In addition, certain of the Fund's contracts with its service providers contain general indemnification clauses. The Fund's maximum exposure under these arrangements is unknown since the amount of any future claims that may be made against the Fund cannot be determined, and the Fund has no historical basis for predicting the likelihood of any such claims.
Note 3. Fees and Other Transactions with Affiliates
Management Services Fees
Effective December 1, 2015, the Fund entered into a Management Agreement with Columbia Management Investment Advisers, LLC (the Investment Manager), a wholly-owned subsidiary of Ameriprise Financial, Inc. (Ameriprise Financial). Under the Management Agreement, the Investment Manager provides the Fund with investment research and advice, as well as administrative and accounting services. The management services fee is an annual fee that is equal to a percentage of the Fund's average daily net assets that declines from 0.48% to 0.29% as the Fund's net assets increase. Prior to December 1, 2015, the Fund paid the Investment Manager an annual fee for advisory services under an Investment Management Services Agreement and a separate annual fee for administrative and accounting services under an Administrative Services Agreement. The effective management services fee rate for the year ended July 31, 2016 (reflecting all advisory and administrative services fees paid to the Investment Manager) was 0.43% of the Fund's average daily net assets. For the period from August 1, 2015 through November 30, 2015, the investment advisory services fee paid to the Investment Manager was $5,125,319, and the administrative services fee paid to the Investment Manager was $815,484.
Compensation of Board Members
Board members, who are not officers or employees of the Investment Manager or Ameriprise Financial, are compensated for their services to the Fund as disclosed in the Statement of Operations. These Board members may participate in a Deferred Compensation Plan (the Plan) which may be terminated at any time. Obligations of the Plan will be paid solely out of the Fund's assets, and all amounts payable under the Plan constitute a general unsecured obligation of the Fund.
Annual Report 2016
47
NOTES TO FINANCIAL STATEMENTS (continued)
July 31, 2016
Compensation of Chief Compliance Officer
The Board has appointed a Chief Compliance Officer to the Fund in accordance with federal securities regulations. The Fund is allocated a portion of the expenses associated with the Chief Compliance Officer based on relative net assets of the Trust.
Transactions with Affiliates
For the year ended July 31, 2016, the Fund engaged in purchase and/or sale transactions with affiliates and/or accounts that have a common investment manager (or affiliated investment managers), common directors/trustees, and/or common officers. Those purchase and sale transactions complied with provisions of Rule 17a-7 under the 1940 Act and were $0 and $10,126,300, respectively. The sale transactions resulted in a net realized gain of $896,533.
Transfer Agency Fees
Under a Transfer and Dividend Disbursing Agent Agreement, Columbia Management Investment Services Corp. (the Transfer Agent), an affiliate of the Investment Manager and a wholly-owned subsidiary of Ameriprise Financial, is responsible for providing transfer agency services to the Fund. The Transfer Agent has contracted with Boston Financial Data Services (BFDS) to serve as sub-transfer agent.
The Transfer Agent receives a monthly transfer agency fee based on the number or the average value of accounts, depending on the type of account. In addition, the Transfer Agent also receives sub-transfer agency fees based on a percentage of the average aggregate value of the Fund's shares maintained in omnibus accounts (other than omnibus accounts for which American Enterprise Investment Services Inc. is the broker of record or accounts where the beneficial shareholder is a customer of Ameriprise Financial Services, Inc., for which the Transfer Agent receives a per account fee). The Transfer Agent pays the fees of BFDS for services as sub-transfer agent and BFDS is not entitled to reimbursement for such fees from the Fund (with the exception of out-of-pocket fees).
The Transfer Agent also receives compensation from the Fund for various shareholder services and reimbursements for certain out-of-pocket fees. Total transfer agency fees for Class R5 shares are subject to an annual limitation of not more than 0.05% of the average daily net assets attributable to Class R5 shares.
For the year ended July 31, 2016, the Fund's effective transfer agency fee rates as a percentage of average daily net assets of each class were as follows:
Class A | | | 0.11 | % | |
Class B | | | 0.11 | | |
Class C | | | 0.11 | | |
Class R4 | | | 0.11 | | |
Class R5 | | | 0.05 | | |
Class Z | | | 0.11 | | |
The Fund and certain other associated investment companies have severally, but not jointly, guaranteed the performance and observance of all the terms and conditions of a lease entered into by Seligman Data Corp. (SDC), the former transfer agent, including the payment of rent by SDC (the Guaranty). SDC was the legacy Seligman funds' former transfer agent.
The lease and the Guaranty expire in January 2019. At July 31, 2016, the Fund's total potential future obligation over the life of the Guaranty is $295,576. The liability remaining at July 31, 2016 for non-recurring charges associated with the lease amounted to $173,809 and is recorded as a part of the payable for other expenses in the Statement of Assets and Liabilities.
An annual minimum account balance fee of $20 may apply to certain accounts with a value below the applicable share class's initial minimum investment requirements to reduce the impact of small accounts on transfer agency fees. These minimum account balance fees are remitted to the Fund and recorded as part of expense reductions in the Statement of Operations. For the year ended July 31, 2016, these minimum account balance fees reduced total expenses of the Fund by $3,000.
Distribution and Service Fees
The Fund has an agreement with Columbia Management Investment Distributors, Inc. (the Distributor), an affiliate of the Investment Manager and a wholly-owned subsidiary of Ameriprise Financial, for distribution and shareholder services. The Board has approved, and the Fund has adopted, distribution and shareholder service plans (the Plans) applicable to certain share classes, which set the distribution and service fees for the Fund. These fees are calculated daily and are intended to compensate the Distributor and/or eligible selling and/or servicing agents for selling shares of the Fund and providing services to investors.
Annual Report 2016
48
NOTES TO FINANCIAL STATEMENTS (continued)
July 31, 2016
Under the Plans, the Fund pays a monthly service fee to the Distributor at the maximum annual rate of 0.20% of the average daily net assets attributable to Class A, Class B and Class C shares of the Fund. Also under the Plans, the Fund pays a monthly distribution fee to the Distributor at the maximum annual rates of 0.75% of the average daily net assets attributable to Class B and Class C shares of the Fund, respectively.
The Distributor has voluntarily agreed to waive a portion of the distribution fee for Class C shares so that the distribution fee does not exceed 0.65% annually of the average daily net assets attributable to Class C shares. This arrangement may be modified or terminated by the Distributor at any time.
Sales Charges
Sales charges, including front-end charges and CDSCs, received by the Distributor for distributing Fund shares were $1,252,737 for Class A, $14 for Class B and $8,472 for Class C shares for the year ended July 31, 2016.
Expenses Waived/Reimbursed by the Investment Manager and its Affiliates
The Fund's expense ratio is subject to an expense reimbursement arrangement pursuant to which fees will be waived and/or expenses reimbursed (excluding certain fees and expenses described below), so that the Fund's net operating expenses, after giving effect to fees waived/expenses reimbursed and any balance credits and/or overdraft charges from the Fund's custodian, do not exceed the annual rates of:
| | | Contractual
Expense Cap
December 1, 2015
through
November 30, 2016 | | Voluntary
Expense Cap
Prior to
December 1, 2015 | |
Class A | | | 0.81 | % | | | 0.80 | % | |
Class B | | | 1.56 | | | | 1.55 | | |
Class C | | | 1.56 | | | | 1.55 | | |
Class R4 | | | 0.61 | | | | 0.60 | | |
Class R5 | | | 0.58 | | | | 0.56 | | |
Class Z | | | 0.61 | | | | 0.60 | | |
The contractual agreement may be modified or amended only with approval from the Investment Manager, certain of its affiliates and the Fund. Under the arrangements, the following fees and expenses are excluded from the waiver/reimbursement commitment, and therefore will be paid by the Fund, if applicable: taxes (including foreign transaction taxes), expenses associated with investments in affiliated and non-affiliated pooled
investment vehicles (including mutual funds and exchange-traded funds), transaction costs and brokerage commissions, costs related to any securities lending program, dividend and interest expenses associated with securities sold short, inverse floater program fees and expenses, transaction charges and interest on borrowed money, interest and infrequent and/or unusual expenses. Any fees waived and/or expenses reimbursed under the expense reimbursement arrangements described above are not recoverable by the Investment Manager or its affiliates in future periods. Class C distribution fees waived by the Distributor, as discussed above, are in addition to the waiver/reimbursement commitment under the agreement.
Note 4. Federal Tax Information
The timing and character of income and capital gain distributions are determined in accordance with income tax regulations, which may differ from GAAP because of temporary or permanent book to tax differences.
At July 31, 2016, these differences are primarily due to differing treatment for capital loss carryforwards, principal and/or interest from fixed income securities, Trustees' deferred compensation, distributions and tax straddles. To the extent these differences are permanent, reclassifications are made among the components of the Fund's net assets in the Statement of Assets and Liabilities. Temporary differences do not require reclassifications.
In the Statement of Assets and Liabilities the following reclassifications were made:
Undistributed net investment income | | $ | 917,637 | | |
Accumulated net realized loss | | | (917,637 | ) | |
Net investment income (loss) and net realized gains (losses), as disclosed in the Statement of Operations, and net assets were not affected by this reclassification.
The tax character of distributions paid during the years indicated was as follows:
Year Ended July 31, | | 2016 | | 2015 | |
Ordinary income | | $ | 1,239,737 | | | $ | 2,312,779 | | |
Tax-exempt income | | | 168,047,203 | | | | 167,153,413 | | |
Total | | $ | 169,286,940 | | | $ | 169,466,192 | | |
Short-term capital gain distributions, if any, are considered ordinary income distributions for tax purposes.
Annual Report 2016
49
NOTES TO FINANCIAL STATEMENTS (continued)
July 31, 2016
At July 31, 2016, the components of distributable earnings on a tax basis were as follows:
Undistributed tax-exempt income | | | 26,421,728 | | |
Capital loss carryforwards | | | (7,286,973 | ) | |
Net unrealized appreciation | | | 406,501,174 | | |
At July 31, 2016, the cost of investments for federal income tax purposes was $3,917,546,768 and the aggregate gross unrealized appreciation and depreciation based on that cost was:
Unrealized appreciation | | $ | 453,210,604 | | |
Unrealized depreciation | | | (46,709,430 | ) | |
Net unrealized appreciation | | $ | 406,501,174 | | |
The following capital loss carryforwards, determined at July 31, 2016, may be available to reduce taxable income arising from future net realized gains on investments, if any, to the extent permitted by the Internal Revenue Code:
Year of Expiration | | Amount ($) | |
| | 2019 | | | | 7,286,973 | | |
For the year ended July 31, 2016, $38,219,845 of capital loss carryforward was utilized.
Management of the Fund has concluded that there are no significant uncertain tax positions in the Fund that would require recognition in the financial statements. However, management's conclusion may be subject to review and adjustment at a later date based on factors including, but not limited to, new tax laws, regulations, and administrative interpretations (including relevant court decisions). Generally, the Fund's federal tax returns for the prior three fiscal years remain subject to examination by the Internal Revenue Service.
Note 5. Portfolio Information
The cost of purchases and proceeds from sales of securities, excluding short-term investments and derivatives, if any, aggregated to $683,271,381 and $551,539,813, respectively, for the year ended July 31, 2016. The amount of purchase and sale activity impacts the portfolio turnover rate reported in the Financial Highlights.
Note 6. Regulatory Settlements
During the year ended July 31, 2015, the Fund received $1,138,577 as a result of a regulatory settlement proceeding brought by the Securities and Exchange Commission against an unaffiliated third party relating to
market timing and/or late trading of mutual funds. This amount represented the Fund's portion of the proceeds from the settlement (neither the Fund nor the Investment Manager were a party to the proceeding). The payments have been included in Proceeds from regulatory settlements in the Statement of Changes in Net Assets.
Note 7. Line of Credit
The Fund has access to a revolving credit facility whereby the Fund may borrow for the temporary funding of shareholder redemptions or for other temporary or emergency purposes. Effective December 8, 2015, Citibank, N.A. and HSBC Bank USA, N.A. joined JPMorgan Chase Bank, N.A. (JPMorgan) as lead of a syndicate of banks under the credit facility, which is a collective agreement between the Fund and certain other funds managed by the Investment Manager, severally and not jointly, that permits collective borrowings up to $1 billion. Interest is charged to each participating fund based on its borrowings at a rate equal to the higher of (i) the overnight federal funds rate plus 1.00% or (ii) the one-month LIBOR rate plus 1.00%. Each borrowing under the credit facility matures no later than 60 days after the date of borrowing. The Fund also pays a commitment fee equal to its pro rata share of the amount of the credit facility at a rate of 0.15% per annum. The commitment fee is included in other expenses in the Statement of Operations. Prior to December 8, 2015, JPMorgan was the sole lead bank under the credit facility agreement that permitted borrowings up to $550 million under the same terms and interest rates as described above with the exception of the commitment fee which was charged at a rate of 0.075% per annum.
The Fund had no borrowings during the year ended July 31, 2016.
Note 8. Significant Risks
Shareholder Concentration Risk
At July 31, 2016, one unaffiliated shareholder of record owned 12.1% of the outstanding shares of the Fund in one or more accounts. The Fund has no knowledge about whether any portion of those shares was owned beneficially. Affiliated shareholders of record owned 40.8% of the outstanding shares of the Fund in one or more accounts. Subscription and redemption activity by concentrated accounts may have a significant effect on the operations of the Fund. In the case of a large redemption, the Fund may be forced to sell investments at inopportune times, including its liquid or more liquid positions, resulting in Fund losses and the Fund holding a
Annual Report 2016
50
NOTES TO FINANCIAL STATEMENTS (continued)
July 31, 2016
higher percentage of less liquid or illiquid securities. Large redemptions could result in decreased economies of scale and increased operating expenses for non-redeeming Fund shareholders.
Credit Risk
Credit risk is the risk that the value of debt securities in the Fund's portfolio may decline because the issuer may default and fail to pay interest or repay principal when due. Rating agencies assign credit ratings to debt securities to indicate their credit risk. Lower rated or unrated debt securities held by the Fund may present increased credit risk as compared to higher-rated debt securities.
Interest Rate Risk
Interest rate risk is the risk of losses attributable to changes in interest rates. In general, if prevailing interest rates rise, the values of debt securities tend to fall, and if interest rates fall, the values of debt securities tend to rise. Actions by governments and central banking authorities can result in increases in interest rates. Increasing interest rates may negatively affect the value of debt securities held by the Fund, resulting in a negative impact on the Fund's performance and net asset value per share. In general, the longer the maturity or duration of a debt security, the greater its sensitivity to changes in interest rates.
Liquidity Risk
Liquidity risk is the risk associated with a lack of marketability of investments which may make it difficult to sell the investment at a desirable time or price. Changing regulatory, market or other conditions or environments (for example, the interest rate or credit environments) may adversely affect the liquidity of the Fund's investments. The Fund may have to accept a lower selling price for the holding, sell other investments, or forego another, more appealing investment opportunity. Generally, the less liquid the market at the time the Fund sells a portfolio investment, the greater the risk of loss or decline of value to the Fund. A less liquid market can lead to an increase in Fund redemptions, which may negatively impact Fund performance and net asset value per share, including, for example, if the Fund is forced to sell securities in a down market.
Note 9. Subsequent Events
Management has evaluated the events and transactions that have occurred through the date the financial statements were issued and noted no items requiring adjustment of the financial statements or additional disclosure.
Note 10. Information Regarding Pending and Settled Legal Proceedings
Ameriprise Financial and certain of its affiliates have historically been involved in a number of legal, arbitration and regulatory proceedings, including routine litigation, class actions, and governmental actions, concerning matters arising in connection with the conduct of their business activities. Ameriprise Financial believes that the Funds are not currently the subject of, and that neither Ameriprise Financial nor any of its affiliates are the subject of, any pending legal, arbitration or regulatory proceedings that are likely to have a material adverse effect on the Funds or the ability of Ameriprise Financial or its affiliates to perform under their contracts with the Funds. Ameriprise Financial is required to make quarterly (10-Q), annual (10-K) and, as necessary, 8-K filings with the Securities and Exchange Commission (SEC) on legal and regulatory matters that relate to Ameriprise Financial and its affiliates. Copies of these filings may be obtained by accessing the SEC website at www.sec.gov.
There can be no assurance that these matters, or the adverse publicity associated with them, will not result in increased fund redemptions, reduced sale of fund shares or other adverse consequences to the Funds. Further, although we believe proceedings are not likely to have a material adverse effect on the Funds or the ability of Ameriprise Financial or its affiliates to perform under their contracts with the Funds, these proceedings are subject to uncertainties and, as such, we are unable to estimate the possible loss or range of loss that may result. An adverse outcome in one or more of these proceedings could result in adverse judgments, settlements, fines, penalties or other relief that could have a material adverse effect on the consolidated financial condition or results of operations of Ameriprise Financial.
Annual Report 2016
51
REPORT OF INDEPENDENT REGISTERED PUBLIC ACCOUNTING FIRM
To the Trustees of Columbia Funds Series Trust I and the Shareholders of
Columbia Tax-Exempt Fund
In our opinion, the accompanying statement of assets and liabilities, including the portfolio of investments, and the related statements of operations and of changes in net assets and the financial highlights present fairly, in all material respects, the financial position of Columbia Tax-Exempt Fund (the "Fund", a series of Columbia Funds Series Trust I) at July 31, 2016, and the results of its operations, the changes in its net assets and the financial highlights for each of the periods indicated, in conformity with accounting principles generally accepted in the United States of America. These financial statements and financial highlights (hereafter referred to as "financial statements") are the responsibility of the Fund's management. Our responsibility is to express an opinion on these financial statements based on our audits. We conducted our audits of these financial statements in accordance with the standards of the Public Company Accounting Oversight Board (United States). Those standards require that we plan and perform the audit to obtain reasonable assurance about whether the financial statements are free of material misstatement. An audit includes examining, on a test basis, evidence supporting the amounts and disclosures in the financial statements, assessing the accounting principles used and significant estimates made by management, and evaluating the overall financial statement presentation. We believe that our audits, which included confirmation of securities at July 31, 2016 by correspondence with the custodian, brokers and transfer agent, and the application of alternative auditing procedures where such confirmations had not been received, provide a reasonable basis for our opinion.
PricewaterhouseCoopers LLP
Minneapolis, MN
September 21, 2016
Annual Report 2016
52
FEDERAL INCOME TAX INFORMATION
(Unaudited)
The Fund hereby designates the following tax attributes for the fiscal year ended July 31, 2016. Shareholders will be notified in early 2017 of the amounts for use in preparing 2016 income tax returns.
Tax Designations:
| Exempt-Interest Dividends | | | 99.27 | % | |
Exempt-Interest Dividends. The percentage of net investment income distributed during the fiscal year that qualifies as exempt-interest dividends for federal income tax purposes. A portion of the income may be subject to federal alternative minimum tax.
Annual Report 2016
53
Shareholders elect the Board that oversees the Fund's operations. The Board appoints officers who are responsible for day-to-day business decisions based on policies set by the Board. The following table provides basic biographical information about the Fund's Trustees, including their principal occupations during the past five years, although specific titles for individuals may have varied over the period. The year set forth beneath Length of Service in the table below is the year in which the Trustee was first appointed or elected as Trustee to any Fund currently in the Columbia Funds Complex or a predecessor thereof. Under current Board policy, members serve terms of indefinite duration.
Trustees
Independent Trustees
Name,
Address,
Year of Birth | | Position Held With
the Trust and Length of
Service | | Principal Occupation(s)
During the Past Five Years
and Other Relevant
Professional Experience | | Number of
Funds in the
Columbia Funds
Complex
Overseen | | Other Directorships
Held by Trustee During
the Past Five Years | |
Janet Langford Carrig
c/o Columbia
Management Investment Advisers, LLC,
225 Franklin Street
Mail Drop BX32 05228,
Boston, MA 02110
1957 | | Trustee 1996 | | Senior Vice President, General Counsel and Corporate Secretary, ConocoPhillips (integrated energy company) since September 2007 | | | 56 | | | None | |
Douglas A. Hacker
c/o Columbia Management Investment Advisers, LLC,
225 Franklin Street
Mail Drop BX32 05228,
Boston, MA 02110
1955 | | Trustee and Chairman of the Board 1996 | | Independent business executive since May 2006; Executive Vice President — Strategy of United Airlines from December 2002 to May 2006; President of UAL Loyalty Services (airline marketing company) from September 2001 to December 2002; Executive Vice President and Chief Financial Officer of United Airlines from July 1999 to September 2001 | | | 56 | | | Spartan Nash Company (food distributor); Nash Finch Company (food distributor) from 2005 to 2013; Aircastle Limited (aircraft leasing); SeaCube Container Leasing Ltd. (container leasing) from 2010 to 2013; and Travelport Worldwide Limited (travel information technology) | |
Nancy T. Lukitsh
c/o Columbia Management Investment Advisers, LLC,
225 Franklin Street
Mail Drop BX32 05228,
Boston, MA 02110
1956 | | Trustee 2011 | | Senior Vice President, Partner and Director of Marketing, Wellington Management Company, LLP (investment adviser) from 1997 to 2010; Chair, Wellington Management Portfolios (commingled non-U.S. investment pools) from 2007 to 2010; Director, Wellington Trust Company, NA and other Wellington affiliates from 1997 to 2010 | | | 56 | | | None | |
Annual Report 2016
54
TRUSTEES AND OFFICERS (continued)
Independent Trustees (continued)
Name,
Address,
Year of Birth | | Position Held With
the Trust and Length of
Service | | Principal Occupation(s)
During the Past Five Years
and Other Relevant
Professional Experience | | Number of
Funds in the
Columbia Funds
Complex
Overseen | | Other Directorships
Held by Trustee During
the Past Five Years | |
William E. Mayer
c/o Columbia Management Investment Advisers, LLC,
225 Franklin Street
Mail Drop BX32 05228,
Boston, MA 02110
1940 | | Trustee 1991 | | Partner, Park Avenue Equity Partners (private equity) since February 1999 | | | 56 | | | DynaVox Inc. (speech creation); Lee Enterprises (print media); WR Hambrecht + Co. (financial service provider) from 2000 to 2012; BlackRock Capital Investment Corporation (investment company); and Premier, Inc. (healthcare) | |
David M. Moffett
c/o Columbia Management Investment Advisers, LLC,
225 Franklin Street
Mail Drop BX32 05228,
Boston, MA 02110
1952 | | Trustee 2011 | | Retired. Consultant to Bridgewater and Associates | | | 56 | | | Director of CIT Bank, CIT Group Inc. (commercial and consumer finance); eBay Inc. (online trading community); Genworth Financial, Inc. (financial and insurance products and services); Paypal Holdings Inc. (payment and data processing services); and Trustee University of Oklahoma Foundation | |
Charles R. Nelson
c/o Columbia Management Investment Advisers, LLC,
225 Franklin Street
Mail Drop BX32 05228,
Boston, MA 02110
1942 | | Trustee 1981 | | Retired. Professor Emeritus, University of Washington since 2011; Professor of Economics, University of Washington from 1976 to 2011; Ford and Louisa Van Voorhis Professor of Political Economy, University of Washington from 1993 to 2011; Adjunct Professor of Statistics, University of Washington from 1980 to 2011; Associate Editor, Journal of Money, Credit and Banking from September 1993 to 2008; consultant on econometric and statistical matters | | | 56 | | | None | |
John J. Neuhauser
c/o Columbia Management Investment Advisers, LLC,
225 Franklin Street
Mail Drop BX32 05228,
Boston, MA 02110
1943 | | Trustee 1984 | | President, Saint Michael's College since August 2007; Director or Trustee of several non-profit organizations, including University of Vermont Medical Center; Academic Vice President and Dean of Faculties, Boston College from August 1999 to October 2005; University Professor, Boston College from November 2005 to August 2007 | | | 56 | | | Liberty All-Star Equity Fund and Liberty All-Star Growth Fund (closed-end funds) | |
Annual Report 2016
55
TRUSTEES AND OFFICERS (continued)
Independent Trustees (continued)
Name,
Address,
Year of Birth | | Position Held With
the Trust and Length of
Service | | Principal Occupation(s)
During the Past Five Years
and Other Relevant
Professional Experience | | Number of
Funds in the
Columbia Funds
Complex
Overseen | | Other Directorships
Held by Trustee During
the Past Five Years | |
Patrick J. Simpson
c/o Columbia Management Investment Advisers, LLC,
225 Franklin Street
Mail Drop BX32 05228,
Boston, MA 02110
1944 | | Trustee 2000 | | Of Counsel, Perkins Coie LLP (law firm) since 2015; Partner, Perkins Coie LLP from 1988 to 2014 | | | 56 | | | None | |
Anne-Lee Verville
c/o Columbia Management Investment Advisers, LLC,
225 Franklin Street
Mail Drop BX32 05228,
Boston, MA 02110
1945 | | Trustee 1998 | | Retired. General Manager, Global Education Industry from 1994 to 1997, President — Application Systems Division from 1991 to 1994, Chief Financial Officer — US Marketing & Services from 1988 to 1991, and Chief Information Officer from 1987 to 1988, IBM Corporation (computer and technology) | | | 56 | | | Enesco Group, Inc. (producer of giftware and home and garden decor products) from 2001 to 2006 | |
Consultant to the Trustees*
Name,
Address,
Year of Birth | | Position Held With
the Trust and Length of
Service | | Principal Occupation(s)
During the Past Five Years
and Other Relevant
Professional Experience | | Number of
Funds in the
Columbia Funds
Complex
Overseen | | Other Directorships
Held by Trustee During
the Past Five Years | |
J. Kevin Connaughton
c/o Columbia
Management Investment Advisers, LLC,
225 Franklin Street
Mail Drop BX32 05228,
Boston, MA 02110
1964 | | Trustee Consultant 2016 | | Trustee Consultant, Columbia Funds since March 2016; Managing Director and General Manager of Mutual Fund Products, Columbia Management Investment Advisers, LLC from May 2010 to February 2015; President, Columbia Funds from 2009 to 2015; and senior officer of Columbia Funds and affiliated funds from 2003 to 2015 | | | 56 | | | Board of Governors, Gateway Healthcare since January 2016; Trustee, New Century Portfolios since March 2015; and Director, The Autism Project since March 2015 | |
* J. Kevin Connaughton was appointed consultant to the Trustees effective March 1, 2016. Shareholders of the Funds are expected to be asked to elect Mr. Connaughton as a Trustee at a future shareholder meeting.
Annual Report 2016
56
TRUSTEES AND OFFICERS (continued)
Interested Trustee Affiliated with Investment Manager*
Name,
Address,
Year of Birth | | Position Held With
the Trust and Length of
Service | | Principal Occupation(s)
During the Past Five Years
and Other Relevant
Professional Experience | | Number of
Funds in the
Columbia Funds
Complex
Overseen | | Other Directorships
Held by Trustee During
the Past Five Years | |
William F. Truscott
c/o Columbia Management Investment Advisers, LLC,
225 Franklin Street
Boston, MA 02110
1960 | | Trustee 2012 | | Chairman of the Board and President, Columbia Management Investment Advisers, LLC since May 2010 and February 2012, respectively; Chief Executive Officer, Global Asset Management, Ameriprise Financial, Inc. since September 2012 (previously Chief Executive Officer, U.S. Asset Management & President, Annuities, May 2010- September 2012); Director and Chief Executive Officer, Columbia Management Investment Distributors, Inc. since May 2010 and February 2012, respectively; Chairman of the Board and Chief Executive Officer, RiverSource Distributors, Inc. since 2006; Director, Threadneedle Asset Management Holdings, SARL since 2014; President and Chief Executive Officer, Ameriprise Certificate Company, 2006-August 2012. | | | 175 | | | Chairman of the Board, Columbia Management Investment Advisers, LLC since May 2010; Director, Columbia Management Investment Distributors, Inc. since May 2010; Former Director, Ameriprise Certificate Company, 2006-January 2013 | |
* Interested person (as defined under the 1940 Act) by reason of being an officer, director, security holder and/or employee of the Investment Manager or Ameriprise Financial.
The Statement of Additional Information has additional information about the Fund's Board members and is available, without charge, upon request by calling 800.345.6611; contacting your financial intermediary; or visiting investor.columbiathreadneedleus.com.
Annual Report 2016
57
TRUSTEES AND OFFICERS (continued)
The Board has appointed officers who are responsible for day-to-day business decisions based on policies it has established. The officers serve at the pleasure of the Board. The following table provides basic information about the Officers of the Fund, including principal occupations during the past five years, although their specific titles may have varied over the period. In addition to Mr. Truscott, who is Senior Vice President, the Fund's other officers are:
Fund Officers
Name,
Address and
Year of Birth | | Position and Year
First Appointed to
Position for any Fund
in the Columbia
Funds Complex or a
Predecessor Thereof | |
Principal Occupation(s) During Past Five Years | |
Christopher O. Petersen
5228 Ameriprise Financial Center
Minneapolis, MN 55474
Born 1970 | | President and Principal Executive Officer (2015) | | Vice President and Lead Chief Counsel, Ameriprise Financial, Inc. since January 2015 (previously, Vice President and Chief Counsel January 2010-December 2014; officer of Columbia Funds and affiliated funds since 2007. | |
Michael G. Clarke
225 Franklin Street
Boston, MA 02110
Born 1969 | | Treasurer (2011), Chief Financial Officer (2009) and Chief Accounting Officer (2015) | | Vice President — Mutual Fund Administration, Columbia Management Investment Advisers, LLC, since May 2010; senior officer of Columbia Funds and affiliated funds since 2002. | |
Paul B. Goucher
100 Park Avenue
New York, NY 10017
Born 1968 | | Senior Vice President (2011), Chief Legal Officer (2015) and Assistant Secretary (2008) | | Vice President and Lead Chief Counsel, Ameriprise Financial, Inc. since November 2008 and January 2013, respectively (previously Chief Counsel, January 2010-January 2013); Vice President, Chief Legal Officer and Assistant Secretary, Columbia Management Investment Advisers, LLC since May 2010. | |
Thomas P. McGuire
225 Franklin Street
Boston, MA 02110
Born 1972 | | Senior Vice President and Chief Compliance Officer (2012) | | Vice President — Asset Management Compliance, Ameriprise Financial, Inc., since May 2010; Chief Compliance Officer, Ameriprise Certificate Company since September 2010. | |
Colin Moore
225 Franklin Street
Boston, MA 02110
Born 1958 | | Senior Vice President (2010) | | Executive Vice President and Global Chief Investment Officer, Ameriprise Financial, Inc., since July 2013; Executive Vice President and Global Chief Investment Officer, Columbia Management Investment Advisers, LLC since July 2013 (previously Director and Global Chief Investment Officer, 2010-2013). | |
Michael E. DeFao
225 Franklin Street
Boston, MA 02110
Born 1968 | | Vice President (2011) and Assistant Secretary (2010) | | Vice President and Chief Counsel, Ameriprise Financial, Inc. since May 2010. | |
Amy Johnson
5228 Ameriprise Financial Center
Minneapolis, MN 55474
Born 1965 | | Vice President (2006) | | Managing Director and Global Head of Operations, Columbia Management Investment Advisers, LLC since April 2016 (previously Managing Director and Chief Operating Officer, 2010-2016). | |
Lyn Kephart-Strong
5228 Ameriprise
Financial Center
Minneapolis, MN 55474
Born 1960 | | Vice President (2015) | | President, Columbia Management Investment Services Corp. since October 2014; Vice President & Resolution Officer, Ameriprise Trust Company since August 2009. | |
Ryan C. Larrenaga
225 Franklin Street
Boston, MA 02110
Born 1970 | | Vice President and Secretary (2015) | | Vice President and Group Counsel, Ameriprise Financial, Inc. since August 2011 (previously, Counsel from May 2010 to August 2011); officer of Columbia Funds and affiliated funds since 2005. | |
Annual Report 2016
58
BOARD CONSIDERATION AND APPROVAL OF MANAGEMENT
AGREEMENT
On June 10, 2016, the Board of Trustees (the Board) and the Trustees who are not interested persons (as defined in the Investment Company Act of 1940) (the Independent Trustees) of Columbia Funds Series Trust I (the Trust) unanimously approved the continuation of the Management Agreement (the Management Agreement) with Columbia Management Investment Advisers, LLC (the Investment Manager) with respect to Columbia Tax-Exempt Fund (the Fund), a series of the Trust. As detailed below, the Board's Advisory Fees and Expenses Committee (the Committee) and the Board met on multiple occasions to review and discuss, both among themselves and with the management team of the Investment Manager, materials provided by the Investment Manager and others before determining to approve the continuation of the Management Agreement.
In connection with their deliberations regarding the continuation of the Management Agreement, the Committee and the Board evaluated materials requested from the Investment Manager regarding the Fund and the Management Agreement, and discussed these materials with representatives of the Investment Manager at Committee meetings held on March 8, 2016, April 27, 2016 and June 9, 2016 and at Board meetings held on March 9, 2016 and June 10, 2016. In addition, the Board considers matters bearing on the Management Agreement at most of its other meetings throughout the year and meets regularly with senior management of the Trust and the Investment Manager. Through the Board's Investment Oversight Committees, Trustees also meet with selected portfolio managers of the funds the Trustees oversee and other investment personnel at various times throughout the year. The Committee and the Board also consulted with its independent fee consultant, Fund counsel and with the Independent Trustees' independent legal counsel, who advised on various matters with respect to the Committee's and the Board's considerations and otherwise assisted the Committee and the Board in their deliberations. On June 9, 2016, the Committee recommended that the Board approve the continuation of the Management Agreement. On June 10, 2016, the Board, including the Independent Trustees, voting separately, unanimously approved the continuation of the Management Agreement for the Fund.
The Committee and the Board considered all information that they, their legal counsel or the Investment Manager believed reasonably necessary to evaluate and to determine whether to approve the continuation of the Management Agreement. The information and factors considered by the Committee and the Board in recommending for approval or approving the continuation of the Management Agreement for the Fund included the following:
• Information on the investment performance of the Fund relative to the performance of a group of mutual funds determined to be comparable to the Fund by an independent third-party data provider, as well as performance relative to benchmarks;
• Information on the Fund's management fees and total expenses, including information comparing the Fund's expenses to those of a group of comparable mutual funds, as determined by the independent third-party data provider;
• The Investment Manager's agreement to contractually limit or cap total operating expenses for the Fund through November 30, 2017 so that total operating expenses (excluding certain fees and expenses, such as transaction costs and certain other investment related expenses, interest, taxes, acquired fund fees and expenses, and infrequent and/or unusual expenses) would not exceed a specified annual rate, as a percentage of the Fund's net assets;
• The terms and conditions of the Management Agreement;
• The current and proposed terms and conditions of other agreements and arrangements with affiliates of the Investment Manager relating to the operations of the Fund, including agreements with respect to the provision of distribution and transfer agency services to the Fund;
• Descriptions of various functions performed by the Investment Manager under the Management Agreement, including portfolio management and portfolio trading practices;
• Information regarding the management fees of similarly-managed portfolios of other clients of the Investment Manager, including institutional separate accounts;
Annual Report 2016
59
BOARD CONSIDERATION AND APPROVAL OF MANAGEMENT
AGREEMENT (continued)
• Information regarding the reputation, regulatory history and resources of the Investment Manager, including information regarding senior management, portfolio managers and other personnel;
• Information regarding the capabilities of the Investment Manager with respect to compliance monitoring services, including an assessment of the Investment Manager's compliance system by the Fund's Chief Compliance Officer; and
• The profitability to the Investment Manager and its affiliates from their relationships with the Fund.
Nature, Extent and Quality of Services Provided under the Management Agreement
The Committee and the Board considered the nature, extent and quality of services provided to the Fund by the Investment Manager and its affiliates under the Management Agreement and under separate agreements for the provision of transfer agency services, and the resources dedicated to the Fund and the other Columbia Funds by the Investment Manager and its affiliates. The Committee and the Board considered, among other things, the Investment Manager's ability to attract, motivate and retain highly qualified research, advisory and supervisory investment professionals (including personnel and other resources, compensation programs for personnel involved in fund management, reputation and other attributes), the portfolio management services provided by those investment professionals, and the quality of the Investment Manager's investment research capabilities and trade execution services. The Committee and the Board also considered the potential benefits to shareholders of investing in a mutual fund that is part of a fund complex offering exposure to a variety of asset classes and investment disciplines and providing a variety of fund and shareholder services.
The Committee and the Board also considered the professional experience and qualifications of the senior personnel of the Investment Manager, which included consideration of the Investment Manager's experience with similarly-structured funds. The Committee and the Board noted the compliance programs of and the compliance-related resources provided to the Fund by the Investment Manager and its affiliates, and considered the Investment Manager's ability to provide administrative services to the Fund and coordinate the activities of the Fund's other service providers. After reviewing these and related factors, the Committee and the Board concluded, within the context of their overall conclusions, that the nature, extent and quality of the services provided to the Fund under the Management Agreement supported the continuation of the Management Agreement.
Investment Performance
The Committee and the Board reviewed information about the performance of the Fund over various time periods, including performance information relative to benchmarks and information based on reports of the independent third-party data provider that compared the performance of the Fund to the performance of a group of comparable mutual funds, and data provided by the independent fee consultant. The Committee and the Board also reviewed a description of the third party's methodology for identifying the Fund's peer groups for purposes of performance and expense comparisons.
The Committee and the Board noted that, through December 31, 2015, the Fund's performance was in the twenty-ninth, nineteenth and twenty-third percentile (where the best performance would be in the first percentile) of its category selected by the independent third-party data provider for the purposes of performance comparisons for the one-, three- and five-year periods, respectively.
The Committee and the Board also considered the Investment Manager's performance and reputation generally, the Investment Manager's historical responsiveness to Board concerns about performance, and the Investment Manager's willingness to take steps intended to improve performance. After reviewing these and related factors, the Committee and the Board concluded, within the context of their overall conclusions, that the performance of the Fund and the Investment Manager was sufficient, in light of other considerations, to warrant the continuation of the Management Agreement.
Investment Management Fee Rates and Other Expenses
The Committee and the Board considered the management fees charged to the Fund under the Management Agreement as well as the total expenses incurred by the Fund. In assessing the reasonableness of the fees
Annual Report 2016
60
BOARD CONSIDERATION AND APPROVAL OF MANAGEMENT
AGREEMENT (continued)
under the Management Agreement, the Committee and the Board considered, among other information, the Fund's management fee and its total expense ratio as a percentage of average daily net assets. The Committee and the Board considered data provided by the independent fee consultant. The Committee and the Board noted that, as of December 31, 2015, the Fund's actual management fee and net total expense ratio are ranked in the third and second quintiles, respectively, (where the lowest fees and expenses would be in the first quintile) against the Fund's expense universe as determined by the independent third-party data provider for purposes of expense comparison. The Committee and the Board also took into account the fee waiver and expense limitation arrangements agreed to by the Investment Manager, as noted above.
The Committee and the Board also received and considered information about the management fees charged by the Investment Manager to institutional separate accounts. In considering the fees charged to those accounts, the Committee and the Board took into account, among other things, the Investment Manager's representations about the differences between managing mutual funds as compared to other types of accounts, including differences in the services provided, differences in the risk profile of such business for the Investment Manager and the additional resources required to manage mutual funds effectively. The Committee and the Board also received and considered information about the fees charged by the Investment Manager for sub-advisory services provided to comparable unaffiliated funds. In evaluating the Fund's management fees, the Committee and the Board also took into account the demands, complexity and quality of the investment management of the Fund.
After reviewing these and related factors, the Committee and the Board concluded, within the context of their overall conclusions, that the management fee rates and expenses of the Fund were sufficient, in light of other considerations, to warrant the continuation of the Management Agreement.
Costs of Services Provided and Profitability
The Committee and the Board also took note of the costs the Investment Manager and its affiliates incur in connection with the services provided (both on an absolute and relative basis) and the profitability to the Investment Manager and its affiliates in connection with their relationships with the Fund.
The Committee and the Board also considered the compensation directly or indirectly received by the Investment Manager's affiliates in connection with their relationships with the Fund. The Committee and the Board reviewed information provided by management as to the profitability to the Investment Manager and its affiliates of their relationships with the Fund, information about the allocation of expenses used to calculate profitability, and comparisons of profitability levels realized in 2015 to profitability levels realized in 2014. When reviewing profitability, the Committee and the Board also considered court cases in which adviser profitability was an issue in whole or in part, the performance of similarly managed funds, the performance of the Fund, and the expense ratio of the Fund. In addition, the Committee and the Board considered information provided by the Investment Manager regarding the Investment Manager's financial condition and comparing its profitability to that of other asset management firms that are, or are subsidiaries of, publicly traded companies. In this regard, the Committee and the Board also considered data provided by the independent fee consultant.
After reviewing these and related factors, the Committee and the Board concluded, within the context of their overall conclusions, that the costs of services provided and the profitability to the Investment Manager and its affiliates from their relationships with the Fund supported the continuation of the Management Agreement.
Economies of Scale
The Committee and the Board considered the potential existence of economies of scale in the provision by the Investment Manager of services to the Fund, to groups of related funds, and to the Investment Manager's investment advisory clients as a whole, and whether those economies of scale were shared with the Fund through breakpoints in investment management fees or other means, such as expense limitation arrangements and additional investments by the Investment Manager in investment, trading and compliance resources. The Committee and the Board noted that the management fee schedules for the Fund contained breakpoints that would reduce the fee rate on assets above specified threshold levels.
Annual Report 2016
61
BOARD CONSIDERATION AND APPROVAL OF MANAGEMENT
AGREEMENT (continued)
In considering these matters, the Committee and the Board also considered the costs of the services provided and the profitability to the Investment Manager and its affiliates from their relationships with the Fund, as discussed above. After reviewing these and related factors, the Committee and the Board concluded, within the context of their overall conclusions, that the extent to which any economies of scale were expected to be shared with the Fund supported the continuation of the Management Agreement.
Other Benefits to the Investment Manager
The Committee and the Board received and considered information regarding "fall-out" or ancillary benefits received by the Investment Manager and its affiliates as a result of their relationships with the Fund, such as the engagement of the Investment Manager's affiliates to provide distribution and transfer agency services to the Fund. In this regard, among other matters, the Committee and the Board considered that the Fund's distributor retains a portion of the distribution fees from the Fund and receives a portion of the sales charges on sales or redemptions of certain classes of shares of the Fund. The Committee and the Board also considered the benefits of research made available to the Investment Manager by reason of brokerage commissions generated by the Fund's securities transactions, and reviewed information about the Investment Manager's practices with respect to allocating portfolio transactions for brokerage and research services. The Committee and the Board considered the possible conflicts of interest associated with certain fall-out or other ancillary benefits and the reporting, disclosure and other processes that are in place to address such possible conflicts of interest. The Committee and the Board recognized that the Investment Manager's profitability would be somewhat lower without these benefits.
Conclusion
The Committee and the Board reviewed all of the above considerations in reaching their decisions to recommend or approve the continuation of the Management Agreement. In their deliberations, the Trustees did not identify any particular information that was all-important or controlling, and individual Trustees may have attributed different weights to the various factors. Based on their evaluation of all factors that they deemed to be material, including those factors described above, and assisted by the advice of independent legal counsel, the Board, including the Independent Trustees, voting separately, unanimously approved the continuation of the Management Agreement.
Annual Report 2016
62
IMPORTANT INFORMATION ABOUT THIS REPORT
Each fund mails one shareholder report to each shareholder address. If you would like more than one report, please call shareholder services at 800.345.6611 and additional reports will be sent to you.
The policy of the Board is to vote the proxies of the companies in which each fund holds investments consistent with the procedures as stated in the Statement of Additional Information (SAI). You may obtain a copy of the SAI without charge by calling 800.345.6611; contacting your financial intermediary; visiting investor.columbiathreadneedleus.com; or searching the website of the Securities and Exchange Commission (SEC) at sec.gov. Information regarding how each fund voted proxies relating to portfolio securities is filed with the SEC by August 31st for the most recent 12-month period ending June 30th of that year, and is available without charge by visiting investor.columbiathreadneedleus.com, or searching the website of the SEC at sec.gov.
Each fund files a complete schedule of portfolio holdings with the SEC for the first and third quarters of each fiscal year on Form N-Q. Each fund's Form N-Q is available on the SEC's website at sec.gov and may be reviewed and copied at the SEC's Public Reference Room in Washington, D.C. Information on the operation of the Public Reference Room may be obtained by calling 800.SEC.0330. Each fund's complete schedule of portfolio holdings, as filed on Form N-Q, can also be obtained without charge, upon request, by calling 800.345.6611.
Annual Report 2016
63
Columbia Tax-Exempt Fund
P.O. Box 8081
Boston, MA 02266-8081

This information is for use with concurrent or prior delivery of a fund prospectus. Please read and consider the investment objectives, risks, charges and expenses for any fund carefully before investing. For a prospectus and summary prospectus, which contains this and other important information about the Fund, go to investor.columbiathreadneedleus.com. The Fund is distributed by Columbia Management Investment Distributors, Inc., member FINRA, and managed by Columbia Management Investment Advisers, LLC.
Columbia Threadneedle Investments (Columbia Threadneedle) is the global brand name of the Columbia and Threadneedle group of companies.
All rights reserved. Columbia Management Investment Distributors, Inc., 225 Franklin Street, Boston, MA 02110-2804
© 2016 Columbia Management Investment Advisers, LLC.
investor.columbiathreadneedleus.com
ANN233_07_F01_(09/16)

ANNUAL REPORT
July 31, 2016

CMG ULTRA SHORT TERM BOND FUND

ABOUT COLUMBIA THREADNEEDLE INVESTMENTS
Columbia Threadneedle Investments is a leading global asset management group that provides a broad range of investment strategies and solutions for individual, institutional and corporate clients around the world.
With more than 2,000 people, including over 450 investment professionals based in North America, Europe and Asia, we manage $460 billion* of assets across developed and emerging market equities, fixed income, asset allocation solutions and alternatives. We are the 13th largest manager of long-term mutual fund assets in the U.S.** and the 4th largest manager of retail funds in the U.K.***
Our priority is the investment success of our clients. We aim to deliver the investment outcomes they expect through an investment approach that is team-based, performance-driven and risk-aware. Our culture is dynamic and interactive. By sharing our insights across asset classes and geographies, we generate richer perspectives on global, regional and local investment landscapes. The ability to exchange and debate investment ideas in a collaborative environment enriches our teams' investment processes. More importantly, it results in better informed investment decisions for our clients.
Columbia funds are distributed by Columbia Management Investment Distributors, Inc., member FINRA, and managed by Columbia Management Investment Advisers, LLC.
Columbia Threadneedle Investments (Columbia Threadneedle) is the global brand name of the Columbia and Threadneedle group of companies.
* In U.S. dollars as of June 30, 2016. Source: Ameriprise Q2 Earnings Release. Includes all assets managed by entities in the Columbia and Threadneedle group of companies. Contact us for more current data.
** Source: ICI as of June 30, 2016 for Columbia Management Investment Advisers, LLC.
*** Source: Investment Association as of March 2016 for Threadneedle Asset Management Limited.
© 2016 Columbia Management Investment Advisers, LLC. All rights reserved.
Not part of the shareholder report
Investment strategies to help meet investor needs
We are committed to helping investors navigate financial challenges to reach their desired outcomes. The possibilities are endless.
Your success is our priority.
Retire comfortably
Fund college or higher education
Leave a legacy
Generate an appropriate stream of income in retirement
Traditional approaches to income may no longer be adequate — and they may no longer provide the diversification benefits they once did. Investors need to rethink how they generate retirement income.
Worried about running out of income? You are not alone.
Navigate a changing interest rate environment
Even in today's challenging interest rate environment, it's still possible to navigate markets and achieve your goals.
Make investment choices designed specifically for this market environment.
Maximize after-tax returns
In an environment where what you keep is more important than what you earn, municipal bonds can help mitigate higher taxes while providing attractive yields compared to other investment options.
You've worked too hard building your wealth to lose it to taxes.
Grow assets to achieve financial goals
Finding growth opportunities in today's complex market environment requires strong research capabilities, creative thinking and a disciplined approach.
Do your investments deliver the portfolio growth you need?
Ease the impact of volatile markets
With increasing concerns about market volatility, investors should consider diversifying their portfolios with non-traditional holdings.
Interested in turning volatility into opportunity?
To find out more, contact your financial professional, call 800.426.3750 or visit investor.columbiathreadneedleus.com
Not part of the shareholder report
 Dear Shareholders,
Volatility comes with the territory for long-term investors. Some investors instinctively want to pull out of the market or sell underperforming investments at the first sign of increased volatility or perhaps even as soon as they perceive it on the horizon. But taking yourself out of the market could mean losing out on potential opportunities, and putting your longer term investment goals at risk.
Cumulative return is not just about achieving high returns when markets are going up; it's also about remaining invested and minimizing losses during weak or volatile markets so that you can participate on the upside. Developing a deeper understanding of the various risks your portfolio is subject to can help you balance these risks.
Diversification is critical in seeking to achieve that balance. We believe that most portfolios could be more effectively diversified either by introducing holdings with performance profiles unrelated to existing holdings (like alternative products) or by rebalancing existing holdings with an eye toward risk allocation. Over time, distributing risk more evenly may produce a more pronounced diversification benefit and may improve portfolio efficiency. We believe market volatility can create significant opportunities and, in fact, these periods may be some of the very best times to invest.
With this in mind, I thought it important to highlight excerpts from a piece written by Colin Moore, Global Chief Investment Officer, in which he touches on some of these issues emphasizing the importance of a properly constructed portfolio in seeking to effectively manage volatility and to achieve consistency of returns. I encourage you to read the article in its entirety. To access the full article and for other insights on current market, please visit blog.columbiathreadneedleus.com/latest-perspectives.
You need investments that are designed to help you ease the impact of volatile market environments and keep the savings you have worked tirelessly to amass. Columbia Threadneedle Investments provides investment solutions to help you tackle financial challenges and achieve your desired outcome.
Best regards,

Christopher O. Petersen
President, Columbia Funds
Excerpts from:
Taking the scare out of the volatility bogeyman
By Colin Moore, Global Chief Investment Officer
Colin Moore is the global chief investment officer for Columbia Threadneedle Investments. His responsibilities include ensuring that a disciplined investment process is in place across all asset classes, including equity and fixed income. Mr. Moore joined one of the Columbia Threadneedle Investments legacy firms in 2002 as head of equity and was also head of fixed income and liquidity strategies from 2009 – 2010.

n In today's low growth, higher volatility world, the emphasis is shifting from maximization of returns to consistency of returns.
PRESIDENT'S MESSAGE (continued)
n Portfolios should represent the behavioral risk-return tradeoff of investors, remembering that they won't stay invested to realize the return if we get the risk tolerance wrong.
n Holding long-term savings in cash to avoid volatility (the financial equivalent of hiding under the sheets) is detrimental to achieving long-term goals.
According to Wikipedia, "The bogeyman is a common allusion to a mythical creature in many cultures used to control behavior. This monster has no specific appearance, and conceptions about it can vary drastically from household to household within the same community; in many cases he has no set appearance in the mind of an adult or child, but is simply a non-specific embodiment of terror." Different cultures have different names and physical representations for the bogeyman, and investors are no different. We have terrible monsters that we fear may destroy our portfolios, and we call one of the scariest of them volatility.
While the bogeyman is mythical (I hope!), volatility is real and can cause serious damage. To understand why investors have such a hard time coping with volatility, we first need to define three cognitive biases at work in today's investment environment:
1) Recency bias — something that has recently come to the forefront of our attention, regardless of how long established it is, suddenly seems to appear with improbable frequency.
2) Negativity bias — we tend to have a greater recall of unpleasant memories than positive memories.
3) Loss aversion — our dissatisfaction with losing money tends to be greater than our satisfaction with making money.
The level of volatility varies dramatically, and so does investor fear and panic selling — waxing when volatility rises, waning when it falls. Recent studies have pointed to demographics as an important driver of panic selling. The theory is that as people get closer to retirement, the prospects of a large (20% – 30%) loss in financial assets can have a much more pronounced effect on their sense of well-being. Wealth preservation instincts kick in much more quickly than for younger (and typically less wealthy) savers.
The reality is that there is little opportunity for return without volatility. Therefore, the bogeyman effect of holding long-term savings in cash to avoid volatility (the financial equivalent of hiding under the sheets) is detrimental to achieving long-term goals. This effect tends to be more pronounced during the episodic spikes in volatility. The significant spike in volatility in 2008 and 2009 led to significant withdrawals from long-term investment funds over the same period. Less pronounced effects can also be seen when comparing 2001 – 2003 and 2011 – 2012. Conversely, flows picked up when volatility returned to "normal" levels. Investor behavior of this type is consistent with the three behavioral biases.
I believe average volatility will be higher over the next 10 years than the last 10 years and episodic spikes will increase in frequency because sustainable economic growth will be structurally lower and geopolitical risk higher than any time since World War II. Low growth creates uncertainty while loss aversion will make investors fear that we are one economic mishap or geopolitical event away from no growth or recession. The result will be higher volatility on average. Negativity bias will tend to exacerbate "spike" reactions to event-driven geopolitical news, and the volatility bogeyman will appear more often. Assuming the behavioral biases continue, investor returns are likely to be very disappointing regardless of the total return generated by financial markets due to the bogeyman effect.
To mitigate this effect, we need to focus on portfolio construction and an improved understanding of diversification. I accept that equities are likely to offer the highest return over the next 10 years, but they also offer the highest volatility. Many portfolio construction optimization tools use historical average volatility, which is likely to underestimate the volatility investors will face. The bogeyman emerges when individual asset class volatility spikes and cross correlations rise, the combination of which increases overall portfolio volatility far beyond expectation. Diversification is meant to protect investors against volatility, but what's the point of owning lots of investments if the volatility bogeyman has not been properly estimated?
Most importantly, portfolios should be constructed to properly represent the behavioral risk-return tradeoff of investors, remembering that they won't stay invested to realize the return if we get the risk tolerance wrong. In a low growth, higher volatility world, the emphasis is shifting to return consistency rather than return maximization,
PRESIDENT'S MESSAGE (continued)
and investors are best served through investment approaches that appreciate that distinction. Even though it's a permanent feature of financial markets, volatility is less likely to be the bogeyman we all fear if portfolios are constructed with this understanding.
Please visit blog.columbiathreadneedleus.com/latest-perspectives to read the entire article.
Investors should consider the investment objectives, risks, charges and expenses of a mutual fund carefully before investing. For a free prospectus and summary prospectus, which contains this and other important information about a fund, visit columbiathreadneedleus.com/institutional. The prospectus should be read carefully before investing.
The views expressed are as of April 2016, may change as market or other conditions change, and may differ from views expressed by other Columbia Management Investment Advisers, LLC (CMIA) associates or affiliates. Actual investments or investment decisions made by CMIA and its affiliates, whether for its own account or on behalf of clients, will not necessarily reflect the views expressed. This information is not intended to provide investment advice and does not account for individual investor circumstances. Investment decisions should always be made based on an investor's specific financial needs, objectives, goals, time horizon and risk tolerance. Asset classes described may not be suitable for all investors.
Past performance does not guarantee future results, and no forecast should be considered a guarantee either. Since economic and market conditions change frequently, there can be no assurance that the trends described here will continue or that the forecasts are accurate.
Diversification does not guarantee a profit or protect against loss.
Columbia Funds are distributed by Columbia Management Investment Distributors, Inc., member FINRA, and managed by Columbia Management Investment Advisers, LLC.
© 2016 Columbia Management Investment Advisers, LLC. All rights reserved.
CMG ULTRA SHORT TERM BOND FUND
Performance Overview | | | 2 | | |
Manager Discussion of Fund Performance | | | 4 | | |
Understanding Your Fund's Expenses | | | 6 | | |
Portfolio of Investments | | | 7 | | |
Statement of Assets and Liabilities | | | 16 | | |
Statement of Operations | | | 17 | | |
Statement of Changes in Net Assets | | | 18 | | |
Financial Highlights | | | 20 | | |
Notes to Financial Statements | | | 21 | | |
Report of Independent Registered Public Accounting Firm | | | 27 | | |
Trustees and Officers | | | 28 | | |
Board Consideration and Approval of Management
Agreement | | | 33 | | |
Important Information About This Report | | | 37 | | |
Fund Investment Manager
Columbia Management Investment
Advisers, LLC
225 Franklin Street
Boston, MA 02110
Fund Distributor
Columbia Management Investment
Distributors, Inc.
225 Franklin Street
Boston, MA 02110
Fund Transfer Agent
Columbia Management Investment
Services Corp.
P.O. Box 8081
Boston, MA 02266-8081
For more information about any of the funds, please visit investor.columbiathreadneedleus.com or call 800.345.6611. Customer Service Representatives are available to answer your questions Monday through Friday from 8 a.m. to 7 p.m. Eastern time.
The views expressed in this report reflect the current views of the respective parties. These views are not guarantees of future performance and involve certain risks, uncertainties and assumptions that are difficult to predict, so actual outcomes and results may differ significantly from the views expressed. These views are subject to change at any time based upon economic, market or other conditions and the respective parties disclaim any responsibility to update such views. These views may not be relied on as investment advice and, because investment decisions for a Columbia fund are based on numerous factors, may not be relied on as an indication of trading intent on behalf of any particular Columbia fund. References to specific securities should not be construed as a recommendation or investment advice.
CMG ULTRA SHORT TERM BOND FUND
Performance Summary
n CMG Ultra Short Term Bond Fund (the Fund) returned 0.77% for the 12-month period that ended July 31, 2016.
n The Fund outperformed its benchmark, the Barclays U.S. Short-Term Government/Corporate Index, which returned 0.62% during the same time period.
n Overweight positions in the corporate and securitized bond sectors aided relative performance as did duration positioning relative to the benchmark.
Average Annual Total Returns (%) (for period ended July 31, 2016)
| | | Inception | | 1 Year | | 5 Years | | 10 Years | |
CMG Ultra Short Term Bond Fund | | 03/08/04 | | | 0.77 | | | | 0.63 | | | | 1.48 | | |
Barclays U.S. Short-Term Government/Corporate Index | | | | | | | 0.62 | | | | 0.35 | | | | 1.53 | | |
The Fund commenced operations on November 23, 2009. The returns shown for periods prior to November 23, 2009 are the returns of CMG Ultra Short Term Bond Fund, the predecessor to the Fund and a portfolio of Columbia Funds Institutional Trust. Performance results reflect the effect of any fee waivers or reimbursements of Fund expenses by Columbia Management Investment Advisers, LLC and/or any of its affiliates. Absent these fee waivers or expense reimbursement arrangements, performance results would have been lower. All results shown assume reinvestment of distributions. The table does not reflect the deduction of taxes that a shareholder may pay on fund distributions or on the redemption of shares.
The performance information shown represents past performance and is not a guarantee of future results. The investment return and principal value of your investment will fluctuate so that your shares, when redeemed, may be worth more or less than their original cost. Current performance may be lower or higher than the performance information shown. You may obtain performance information current to the most recent month-end by contacting your financial intermediary, visiting columbiathreadneedleus.com/institutional or calling 800.345.6611.
The Barclays U.S. Short-Term Government/Corporate Index tracks the performance of U.S. Government and corporate bonds rated investment grade or better, with maturities of less than one year. Effective August 24, 2016, the Barclays U.S. Short-Term Government/Corporate Index was rebranded as the Bloomberg Barclays U.S. Short-Term Government/Corporate Index.
Indices are not available for investment, are not professionally managed and do not reflect sales charges, fees, brokerage commissions, taxes or other expenses of investing. Securities in the Fund may not match those in an index.
Annual Report 2016
2
CMG ULTRA SHORT TERM BOND FUND
PERFORMANCE OVERVIEW (continued)
Performance of a Hypothetical $3,000,000 Investment (August 1, 2006 – July 31, 2016)
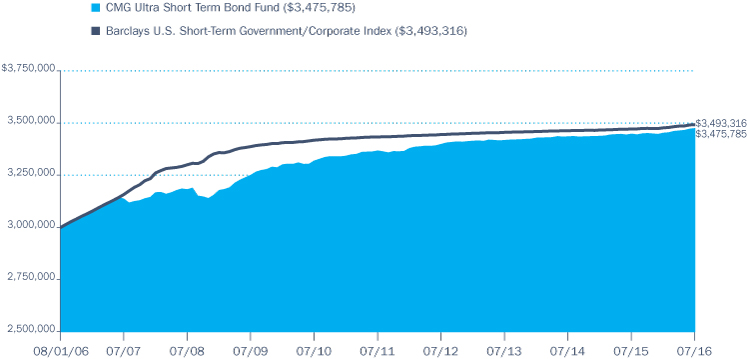
The chart above shows the change in value of a hypothetical $3,000,000 investment in CMG Ultra Short Term Bond Fund during the stated time period, and does not reflect the deduction of taxes that a shareholder may pay on Fund distributions or on the redemption of Fund shares.
Annual Report 2016
3
CMG ULTRA SHORT TERM BOND FUND
MANAGER DISCUSSION OF FUND PERFORMANCE
Portfolio Management
Leonard Aplet, CFA
Gregory Liechty
Ronald Stahl, CFA
Portfolio Breakdown (%)
(at July 31, 2016) | |
Asset-Backed Securities —
Non-Agency | | | 25.7 | | |
Commercial Mortgage-Backed
Securities — Non-Agency | | | 2.8 | | |
Corporate Bonds & Notes | | | 48.7 | | |
Foreign Government
Obligations | | | 2.1 | | |
Money Market Funds | | | 6.7 | | |
Municipal Bonds | | | 0.7 | | |
Residential Mortgage-Backed
Securities — Agency | | | 0.0 | (a) | |
Residential Mortgage-Backed
Securities — Non-Agency | | | 0.4 | | |
U.S. Government & Agency
Obligations | | | 7.0 | | |
U.S. Treasury Obligations | | | 5.9 | | |
Total | | | 100.0 | | |
Percentages indicated are based upon total investments. The Fund's portfolio composition is subject to change.
(a) Rounds to zero.
Quality Breakdown (%)
(at July 31, 2016) | |
AAA rating | | | 43.4 | | |
AA rating | | | 10.1 | | |
A rating | | | 27.1 | | |
BBB rating | | | 19.4 | | |
Total | | | 100.0 | | |
Percentages indicated are based upon total fixed income investments (excluding Money Market Funds).
Bond ratings apply to the underlying holdings of the Fund and not the Fund itself and are divided into categories ranging from highest to lowest credit quality, determined by using the middle rating of Moody's, S&P and Fitch, after dropping the highest and lowest available ratings. When ratings are available from only two rating agencies, the lower rating is used. When a rating is available from only one rating agency, that rating is used. When a bond is not rated by any rating agency, it is designated as "Not rated." Credit quality ratings assigned by a rating agency are subjective opinions, not
For the 12-month period that ended July 31, 2016, CMG Ultra Short Term Bond Fund returned 0.77%. The Fund outperformed its benchmark, the Barclays U.S. Short-Term Government/Corporate Index, which returned 0.62% for the same time period. Overweight positions in the corporate and securitized bond sectors aided performance relative to the benchmark. The Fund's barbelled duration positioning (weighted toward longer and shorter durations, rather than moderate durations) also contributed to its performance advantage over its benchmark.
Uncertainty Drove Market Volatility
Lackluster economic growth, contentious geopolitical conflicts and expectations of a shift in U.S. monetary policy weighed on investors in the first half of the one-year period ended July 31, 2016. In December 2015, the Federal Reserve (the Fed) raised the target range of its benchmark interest rate by a quarter of a point. But the Fed took no further action during the period as subpar global economic growth continued, with China's slowdown heading the list of disappointments. Conflicts in the Middle East and terrorism, both at home and abroad, heightened security fears. Plummeting oil prices and a rising U.S. dollar rounded the list of mounting pressures in 2015. Against this backdrop, prices generally weakened for credit sensitive segments of the bond market. Materials and energy-related issues were particularly hard hit as prices for oil and other commodities came under pressure.
However, both the U.S. dollar and the price of oil reversed course early in 2016. The U.S. economy continued to expand modestly, and economic growth in Europe picked up, if ever so slightly. The U.S. manufacturing sector regained some traction in the spring of 2016, and the U.S. labor markets recovered to full employment for the first time since the Great Recession. The United Kingdom's vote to exit the European Union gave markets a jolt in mid June and led to an investor flight to safety that pushed U.S. Treasury yields to historically low levels. Even though credit-sensitive areas of the market wavered in the days immediately following the "Brexit" vote, they nonetheless outperformed on the strength of central bank support and a continued rebound in oil and other commodities.
Spread Sector Overweights and Duration Barbell Drove Performance
The Fund's underweight position in Treasury securities, which accounted for only 6% of assets, aided performance during the period, as spread sectors (non-governmental fixed-income investments with higher yields at greater risk than governmental investments) generally outperformed similar-maturity Treasuries. An overweight in asset-backed securities (ABS) made a significant contribution to results. Approximately 27% of the Fund's assets were invested in ABS, which outperformed similar duration Treasuries by 47 basis points, as measured by the Barclays Asset-Backed Securities AAA Index. Returns from short-term corporate securities were even stronger; they outperformed similar duration Treasuries by 78 basis points, as measured by the Barclay's Short-Term Corporate Index. Basic industry, energy, electric utility and wireless communications subsectors
Annual Report 2016
4
CMG ULTRA SHORT TERM BOND FUND
MANAGER DISCUSSION OF FUND PERFORMANCE (continued)
were among the largest contributors to performance among corporate bonds. An overweight to BBB rated credits was also a plus for the Fund, as lower rated credits outperformed. The Fund's duration was barbelled relative to the benchmark. The barbelled structure allowed the Fund to generate relatively higher yields without significantly raising overall duration and contributed to the Fund's outperformance.
At Period End
During the year, the fixed-income market continued to assess the strength of the global economic recovery. Interest rate policy remained data-dependent, and investors have closely monitored inflation expectations, commodity prices, global economic concerns and unemployment. The new issue market for corporates and ABS remained active and there has been strong demand for short-term fixed paper. Against this backdrop, we reduced the Fund's allocation to commercial mortgage-backed securities (CMBS) and increased our allocation to ABS. Although we continue to see value in CMBS, we believe valuations are not as attractive as they were at the beginning of the period and we have seen some attractive opportunities in the new issue market for ABS.
We finished the year with a duration target equal to the benchmark. However, investing further out past 12 months allowed the Fund to pick up yield. About a third of the Fund was invested in floating-rate paper in the agency, corporate and asset-backed sectors. As short-term Treasury and swap yields increased over the year, the higher reset rates on floaters helped performance.
Fund Strategy
The Fund is managed with a focus on seeking a high level of current income consistent with the maintenance of liquidity and preservation of capital. We take a conservative approach and apply it aggressively in an effort to achieve superior risk-adjusted returns. The portfolio managers and analysts perform an in-depth qualitative and quantitative assessment of individual issues and issuers to build a highly diversified fund. Ongoing monitoring and risk management is a valued part of the investment process.
statements of fact, and are subject to change, including daily. The ratings assigned by credit rating agencies are but one of the considerations that the Investment Manager and/or Fund's subadviser incorporates into its credit analysis process, along with such other issuer-specific factors as cash flows, capital structure and leverage ratios, ability to de-leverage (repay) through free cash flow, quality of management, market positioning and access to capital, as well as such security-specific factors as the terms of the security (e.g., interest rate and time to maturity) and the amount and type of any collateral.
Investment Risks
Market risk may affect a single issuer, sector of the economy, industry or the market as a whole. Mortgage- and asset-backed securities are affected by interest rates, financial health of issuers/originators, creditworthiness of entities providing credit enhancements and the value of underlying assets. Fixed-income securities present issuer default risk. A rise in interest rates may result in a price decline of fixed-income instruments held by the Fund, negatively impacting its performance and NAV. Falling rates may result in the Fund investing in lower yielding debt instruments, lowering the Fund's income and yield. These risks may be heightened for longer maturity and duration securities. Prepayment and extension risk exists because a loan, bond or other investment may be called, prepaid or redeemed before maturity and similar yielding investments may not be available for purchase. Investing in derivatives is a specialized activity involves special risks, which may result in significant losses. Market or other (e.g., interest rate) environments may adversely affect the liquidity of Fund investments, negatively impacting their price. Generally, the less liquid the market at the time the Fund sells a holding, the greater the risk of loss or decline of value to the Fund. See the Fund's prospectus for more information on these and other risks.
Annual Report 2016
5
CMG ULTRA SHORT TERM BOND FUND
UNDERSTANDING YOUR FUND'S EXPENSES
(Unaudited)
As an investor, you incur two types of costs. There are transaction costs, which generally include sales charges on purchases and may include redemption fees. There are also ongoing costs, which generally include management fees, distribution and/or service fees, and other fund expenses. The following information is intended to help you understand your ongoing costs (in dollars) of investing in the Fund and to help you compare these costs with the ongoing costs of investing in other mutual funds.
Analyzing Your Fund's Expenses
To illustrate these ongoing costs, we have provided examples and calculated the expenses paid by investors of the Fund during the period. The actual and hypothetical information in the table is based on an initial investment of $1,000 at the beginning of the period indicated and held for the entire period. Expense information is calculated two ways and each method provides you with different information. The amount listed in the "Actual" column is calculated using the Fund's actual operating expenses and total return for the period. You may use the Actual information, together with the amount invested, to estimate the expenses that you paid over the period. Simply divide your account value by $1,000 (for example, an $8,600 account value divided by $1,000 = 8.6), then multiply the results by the expenses paid during the period under the "Actual" column. The amount listed in the "Hypothetical" column assumes a 5% annual rate of return before expenses (which is not the Fund's actual return) and then applies the Fund's actual expense ratio for the period to the hypothetical return. You should not use the hypothetical account values and expenses to estimate either your actual account balance at the end of the period or the expenses you paid during the period. See "Compare With Other Funds" below for details on how to use the hypothetical data.
Compare With Other Funds
Since all mutual funds are required to include the same hypothetical calculations about expenses in shareholder reports, you can use this information to compare the ongoing cost of investing in the Fund with other funds. To do so, compare the hypothetical example with the 5% hypothetical examples that appear in the shareholder reports of other funds. As you compare hypothetical examples of other funds, it is important to note that hypothetical examples are meant to highlight the ongoing costs of investing in a fund only and do not reflect any transaction costs, such as sales charges, or redemption or exchange fees. Therefore, the hypothetical calculations are useful in comparing ongoing costs only, and will not help you determine the relative total costs of owning different funds. If transaction costs were included in these calculations, your costs would be higher.
February 1, 2016 – July 31, 2016
Account Value at the Beginning
of the Period ($) | | Account Value at the End of the
Period ($) | | Expenses Paid During the
Period ($) | | Fund's Annualized
Expense Ratio (%) | |
| Actual | | Hypothetical | | Actual | | Hypothetical | | Actual | | Hypothetical | | Actual | |
| | 1,000.00 | | | | 1,000.00 | | | | 1,006.40 | | | | 1,023.62 | | | | 1.25 | | | | 1.26 | | | | 0.25 | | |
Expenses paid during the period are equal to the annualized expense ratio as indicated above, multiplied by the average account value over the period and then multiplied by the number of days in the Fund's most recent fiscal half year and divided by 366.
Expenses do not include fees and expenses incurred indirectly by the Fund from its investment in underlying funds, including affiliated and non-affiliated pooled investment vehicles, such as mutual funds and exchange-traded funds.
Had Columbia Management Investment Advisers, LLC and/or certain of its affiliates not waived/reimbursed certain fees and expenses, account value at the end of the period would have been reduced.
Annual Report 2016
6
CMG ULTRA SHORT TERM BOND FUND
PORTFOLIO OF INVESTMENTS
July 31, 2016
(Percentages represent value of investments compared to net assets)
Corporate Bonds & Notes 49.2%
Issuer | | Coupon
Rate | | Principal
Amount ($) | | Value ($) | |
AEROSPACE & DEFENSE 0.7% | |
L-3 Communications Corp.
05/28/17 | | | 1.500 | % | | | 3,197,000 | | | | 3,202,540 | | |
Lockheed Martin Corp.
09/15/16 | | | 2.125 | % | | | 7,000,000 | | | | 7,011,573 | | |
Total | | | | | | | 10,214,113 | | |
AUTOMOTIVE 1.0% | |
Daimler Finance North America LLC(a)(b)
08/01/17 | | | 1.097 | % | | | 7,500,000 | | | | 7,483,410 | | |
Ford Motor Credit Co. LLC
02/03/17 | | | 4.250 | % | | | 7,000,000 | | | | 7,102,690 | | |
Total | | | | | | | 14,586,100 | | |
BANKING 14.4% | |
American Express Credit Corp.
03/18/19 | | | 1.197 | % | | | 10,000,000 | | | | 10,019,540 | | |
Australia and New Zealand Banking Group Ltd.(a)(b)
01/10/17 | | | 1.045 | % | | | 7,000,000 | | | | 7,003,381 | | |
BB&T Corp.
12/01/16 | | | 1.050 | % | | | 9,000,000 | | | | 9,003,564 | | |
Bank of America Corp.(a)
03/22/18 | | | 1.717 | % | | | 13,000,000 | | | | 13,094,549 | | |
Bank of Montreal(a)
07/18/19 | | | 1.329 | % | | | 10,000,000 | | | | 10,015,890 | | |
Bank of New York Mellon Corp. (The)(a)
05/22/18 | | | 1.034 | % | | | 9,000,000 | | | | 8,998,524 | | |
Bank of Nova Scotia (The)(a)
06/11/18 | | | 1.126 | % | | | 3,815,000 | | | | 3,814,622 | | |
Barclays Bank PLC(a)
02/17/17 | | | 1.208 | % | | | 3,542,000 | | | | 3,541,309 | | |
Capital One NA(a)
02/05/18 | | | 1.313 | % | | | 7,500,000 | | | | 7,486,883 | | |
Citigroup, Inc.
03/10/17 | | | 1.350 | % | | | 10,000,000 | | | | 10,011,720 | | |
DNB Bank ASA(b)
04/03/17 | | | 3.200 | % | | | 3,975,000 | | | | 4,027,315 | | |
Fifth Third Bank
11/18/16 | | | 1.150 | % | | | 8,950,000 | | | | 8,955,692 | | |
Goldman Sachs Group, Inc. (The)(a)
11/15/18 | | | 1.726 | % | | | 10,000,000 | | | | 10,071,000 | | |
HSBC USA, Inc
06/23/17 | | | 1.300 | % | | | 7,000,000 | | | | 6,994,050 | | |
Huntington National Bank (The)
08/02/16 | | | 1.350 | % | | | 9,035,000 | | | | 9,035,180 | | |
Corporate Bonds & Notes (continued)
Issuer | | Coupon
Rate | | Principal
Amount ($) | | Value ($) | |
JPMorgan Chase & Co.(a)
03/22/19 | | | 1.487 | % | | | 14,000,000 | | | | 14,086,744 | | |
KeyBank NA
11/25/16 | | | 1.100 | % | | | 7,950,000 | | | | 7,952,488 | | |
Morgan Stanley
01/24/19 | | | 1.565 | % | | | 10,000,000 | | | | 10,025,820 | | |
PNC Bank NA
10/03/16 | | | 1.300 | % | | | 8,925,000 | | | | 8,927,660 | | |
Royal Bank of Canada(a)
02/03/17 | | | 0.897 | % | | | 10,000,000 | | | | 10,005,560 | | |
State Street Corp.
04/30/17 | | | 5.375 | % | | | 8,000,000 | | | | 8,263,432 | | |
Toronto-Dominion Bank (The)(a)
09/09/16 | | | 1.117 | % | | | 7,500,000 | | | | 7,503,558 | | |
01/22/19 | | | 1.542 | % | | | 2,336,000 | | | | 2,349,369 | | |
U.S. Bancorp
05/15/17 | | | 1.650 | % | | | 5,000,000 | | | | 5,026,230 | | |
US Bank NA(a)
01/30/17 | | | 0.982 | % | | | 5,000,000 | | | | 5,000,475 | | |
Wells Fargo & Co.(a)
04/23/18 | | | 1.345 | % | | | 10,000,000 | | | | 10,027,600 | | |
Total | | | | | | | 211,242,155 | | |
CABLE AND SATELLITE 0.6% | |
Comcast Corp.
01/15/17 | | | 6.500 | % | | | 8,090,000 | | | | 8,295,988 | | |
CHEMICALS 0.5% | |
Eastman Chemical Co.
06/01/17 | | | 2.400 | % | | | 6,599,000 | | | | 6,659,592 | | |
CONSTRUCTION MACHINERY 1.2% | |
Caterpillar Financial Services Corp.(a)
02/23/18 | | | 1.354 | % | | | 9,125,000 | | | | 9,183,948 | | |
John Deere Capital Corp.
01/13/17 | | | 2.000 | % | | | 8,000,000 | | | | 8,043,336 | | |
Total | | | | | | | 17,227,284 | | |
DIVERSIFIED MANUFACTURING 1.0% | |
General Electric Co.(a)
01/09/17 | | | 0.945 | % | | | 14,000,000 | | | | 14,007,322 | | |
ELECTRIC 3.5% | |
Berkshire Hathaway Energy Co.
05/15/17 | | | 1.100 | % | | | 5,000,000 | | | | 5,008,800 | | |
Dominion Resources, Inc.
03/15/17 | | | 1.250 | % | | | 7,170,000 | | | | 7,174,460 | | |
The accompanying Notes to Financial Statements are an integral part of this statement.
Annual Report 2016
7
CMG ULTRA SHORT TERM BOND FUND
PORTFOLIO OF INVESTMENTS (continued)
July 31, 2016
Corporate Bonds & Notes (continued)
Issuer | | Coupon
Rate | | Principal
Amount ($) | | Value ($) | |
Duke Energy Progress LLC(a)
03/06/17 | | | 0.880 | % | | | 6,250,000 | | | | 6,241,931 | | |
Exelon Corp.
06/09/17 | | | 1.550 | % | | | 5,000,000 | | | | 5,009,535 | | |
National Rural Utilities Cooperative Finance Corp.(a)
11/23/16 | | | 0.954 | % | | | 7,000,000 | | | | 7,005,131 | | |
NextEra Energy Capital Holdings, Inc.
06/01/17 | | | 1.586 | % | | | 5,000,000 | | | | 5,015,980 | | |
Southern California Edison Co.
11/01/17 | | | 1.250 | % | | | 2,000,000 | | | | 2,006,316 | | |
Southern Co. (The)
08/15/17 | | | 1.300 | % | | | 7,250,000 | | | | 7,263,195 | | |
WEC Energy Group, Inc.
06/15/18 | | | 1.650 | % | | | 7,307,000 | | | | 7,353,056 | | |
Total | | | | | | | 52,078,404 | | |
FOOD AND BEVERAGE 3.5% | |
Anheuser-Busch InBev Finance, Inc.(a)
01/27/17 | | | 0.924 | % | | | 5,000,000 | | | | 4,995,445 | | |
Anheuser-Busch InBev Worldwide, Inc.
07/15/17 | | | 1.375 | % | | | 5,000,000 | | | | 5,014,755 | | |
ConAgra Foods, Inc.
06/15/17 | | | 5.819 | % | | | 1,196,000 | | | | 1,240,638 | | |
01/25/18 | | | 1.900 | % | | | 5,000,000 | | | | 5,042,475 | | |
Diageo Capital PLC
05/11/17 | | | 1.500 | % | | | 7,000,000 | | | | 7,028,840 | | |
General Mills, Inc.
02/15/17 | | | 5.700 | % | | | 5,000,000 | | | | 5,123,930 | | |
Kraft Heinz Co. (The)(b)
06/30/17 | | | 1.600 | % | | | 5,000,000 | | | | 5,021,475 | | |
Molson Coors Brewing Co.
05/01/17 | | | 2.000 | % | | | 3,401,000 | | | | 3,419,240 | | |
PepsiCo, Inc.(a)
07/17/17 | | | 0.929 | % | | | 7,000,000 | | | | 7,008,932 | | |
SABMiller Holdings, Inc.(b)
01/15/17 | | | 2.450 | % | | | 7,605,000 | | | | 7,658,341 | | |
Total | | | | | | | 51,554,071 | | |
HEALTH CARE 2.2% | |
AmerisourceBergen Corp.
05/15/17 | | | 1.150 | % | | | 7,500,000 | | | | 7,507,500 | | |
Becton Dickinson and Co.
12/15/17 | | | 1.800 | % | | | 6,000,000 | | | | 6,041,628 | | |
Cardinal Health, Inc.
06/15/18 | | | 1.950 | % | | | 2,000,000 | | | | 2,022,556 | | |
Express Scripts Holding Co.
06/02/17 | | | 1.250 | % | | | 5,000,000 | | | | 5,005,825 | | |
Corporate Bonds & Notes (continued)
Issuer | | Coupon
Rate | | Principal
Amount ($) | | Value ($) | |
McKesson Corp.
03/10/17 | | | 1.292 | % | | | 5,000,000 | | | | 5,008,455 | | |
Medtronic, Inc.(a)
02/27/17 | | | 0.757 | % | | | 7,000,000 | | | | 6,996,773 | | |
Total | | | | | | | 32,582,737 | | |
HEALTHCARE INSURANCE 1.3% | |
Aetna, Inc.(a)
12/08/17 | | | 0.000 | % | | | 7,500,000 | | | | 7,519,020 | | |
Anthem, Inc.
02/15/17 | | | 2.375 | % | | | 5,000,000 | | | | 5,031,785 | | |
UnitedHealth Group, Inc.(a)
01/17/17 | | | 1.129 | % | | | 7,000,000 | | | | 7,005,677 | | |
Total | | | | | | | 19,556,482 | | |
INTEGRATED ENERGY 0.9% | |
BP Capital Markets PLC(a)
05/10/18 | | | 1.140 | % | | | 6,044,000 | | | | 6,051,452 | | |
Total Capital International SA
01/10/17 | | | 1.000 | % | | | 7,500,000 | | | | 7,504,380 | | |
Total | | | | | | | 13,555,832 | | |
LIFE INSURANCE 2.4% | |
American International Group, Inc.
05/18/17 | | | 5.450 | % | | | 7,000,000 | | | | 7,231,588 | | |
Metropolitan Life Global Funding I(a)(b)
04/10/17 | | | 1.045 | % | | | 10,000,000 | | | | 10,012,010 | | |
New York Life Global Funding(a)(b)
09/06/16 | | | 0.780 | % | | | 10,000,000 | | | | 10,001,145 | | |
Pricoa Global Funding I(b)
11/25/16 | | | 1.150 | % | | | 7,310,000 | | | | 7,313,940 | | |
Total | | | | | | | 34,558,683 | | |
MEDIA AND ENTERTAINMENT 1.4% | |
21st Century Fox America, Inc.
10/17/16 | | | 8.000 | % | | | 1,815,000 | | | | 1,840,408 | | |
British Sky Broadcasting Group PLC(b)
02/15/18 | | | 6.100 | % | | | 5,000,000 | | | | 5,325,275 | | |
Scripps Networks Interactive, Inc.
12/15/16 | | | 2.700 | % | | | 6,727,000 | | | | 6,765,748 | | |
Thomson Reuters Corp.
09/29/17 | | | 1.650 | % | | | 7,000,000 | | | | 7,026,691 | | |
Total | | | | | | | 20,958,122 | | |
MIDSTREAM 1.5% | |
Columbia Pipeline Group, Inc.
06/01/18 | | | 2.450 | % | | | 5,000,000 | | | | 5,036,855 | | |
The accompanying Notes to Financial Statements are an integral part of this statement.
Annual Report 2016
8
CMG ULTRA SHORT TERM BOND FUND
PORTFOLIO OF INVESTMENTS (continued)
July 31, 2016
Corporate Bonds & Notes (continued)
Issuer | | Coupon
Rate | | Principal
Amount ($) | | Value ($) | |
Plains All American Pipeline LP
01/15/17 | | | 6.125 | % | | | 4,803,000 | | | | 4,895,103 | | |
Southern Natural Gas Co. LLC(b)
04/01/17 | | | 5.900 | % | | | 4,614,000 | | | | 4,747,003 | | |
TransCanada PipeLines Ltd.(a)
01/12/18 | | | 1.457 | % | | | 7,500,000 | | | | 7,471,875 | | |
Total | | | | | | | 22,150,836 | | |
NATURAL GAS 0.8% | |
NiSource Finance Corp.
03/15/18 | | | 6.400 | % | | | 5,000,000 | | | | 5,399,180 | | |
Sempra Energy
06/15/18 | | | 6.150 | % | | | 6,500,000 | | | | 7,039,728 | | |
Total | | | | | | | 12,438,908 | | |
PHARMACEUTICALS 2.8% | |
AbbVie, Inc.
11/06/17 | | | 1.750 | % | | | 7,250,000 | | | | 7,289,273 | | |
Actavis Funding SCS(a)
03/12/18 | | | 1.736 | % | | | 5,000,000 | | | | 5,027,005 | | |
Amgen, Inc.
11/15/16 | | | 2.500 | % | | | 7,500,000 | | | | 7,539,465 | | |
Gilead Sciences, Inc.
12/01/16 | | | 3.050 | % | | | 7,000,000 | | | | 7,053,473 | | |
Merck & Co., Inc.(a)
05/18/18 | | | 0.986 | % | | | 6,935,000 | | | | 6,962,400 | | |
Roche Holdings, Inc.(b)
09/29/17 | | | 1.350 | % | | | 7,500,000 | | | | 7,537,815 | | |
Total | | | | | | | 41,409,431 | | |
PROPERTY & CASUALTY 1.6% | |
Berkshire Hathaway Finance Corp.(a)
01/12/18 | | | 0.967 | % | | | 10,000,000 | | | | 10,017,570 | | |
Chubb INA Holdings, Inc.
02/15/17 | | | 5.700 | % | | | 6,351,000 | | | | 6,511,966 | | |
Liberty Mutual Group, Inc.(b)
08/15/16 | | | 6.700 | % | | | 5,000,000 | | | | 5,012,095 | | |
Travelers Companies, Inc. (The)
05/15/18 | | | 5.800 | % | | | 1,720,000 | | | | 1,859,444 | | |
Total | | | | | | | 23,401,075 | | |
RAILROADS 0.3% | |
Canadian National Railway Co.(a)
11/14/17 | | | 0.796 | % | | | 5,000,000 | | | | 5,002,155 | | |
RETAIL REIT 0.8% | |
Kimco Realty Corp.
05/01/17 | | | 5.700 | % | | | 4,220,000 | | | | 4,360,074 | | |
Corporate Bonds & Notes (continued)
Issuer | | Coupon
Rate | | Principal
Amount ($) | | Value ($) | |
Simon Property Group LP
01/30/17 | | | 2.800 | % | | | 7,500,000 | | | | 7,531,538 | | |
Total | | | | | | | 11,891,612 | | |
RETAILERS 1.7% | |
CVS Health Corp.
12/05/16 | | | 1.200 | % | | | 7,000,000 | | | | 7,009,758 | | |
Lowes Companies, Inc.(a)
09/14/18 | | | 1.256 | % | | | 7,000,000 | | | | 7,055,986 | | |
Target Corp.
05/01/17 | | | 5.375 | % | | | 3,834,000 | | | | 3,959,859 | | |
Wal-Mart Stores, Inc.
04/21/17 | | | 1.000 | % | | | 7,500,000 | | | | 7,518,712 | | |
Total | | | | | | | 25,544,315 | | |
TECHNOLOGY 2.7% | |
Apple, Inc.
05/05/17 | | | 1.050 | % | | | 10,000,000 | | | | 10,018,050 | | |
Cisco Systems, Inc.(a)
03/01/19 | | | 1.173 | % | | | 8,440,000 | | | | 8,476,105 | | |
Hewlett Packard Enterprise Co.(a)(b)
10/05/17 | | | 2.393 | % | | | 5,000,000 | | | | 5,043,130 | | |
International Business Machines Corp.
09/14/17 | | | 5.700 | % | | | 7,500,000 | | | | 7,900,927 | | |
Oracle Corp.(a)
01/15/19 | | | 1.260 | % | | | 8,330,000 | | | | 8,385,170 | | |
Total | | | | | | | 39,823,382 | | |
TRANSPORTATION SERVICES 0.4% | |
ERAC U.S.A. Finance LLC(b)
03/15/17 | | | 2.750 | % | | | 570,000 | | | | 575,265 | | |
10/15/17 | | | 6.375 | % | | | 5,100,000 | | | | 5,390,797 | | |
Total | | | | | | | 5,966,062 | | |
WIRELINES 2.0% | |
AT&T, Inc.
03/15/17 | | | 2.400 | % | | | 5,350,000 | | | | 5,394,528 | | |
AT&T, Inc.(a)
03/30/17 | | | 1.051 | % | | | 9,000,000 | | | | 9,004,464 | | |
Orange SA
09/14/16 | | | 2.750 | % | | | 5,000,000 | | | | 5,010,714 | | |
Verizon Communications, Inc.
06/09/17 | | | 1.350 | % | | | 5,000,000 | | | | 5,013,150 | | |
Verizon Communications, Inc.(a)
06/09/17 | | | 1.057 | % | | | 5,000,000 | | | | 5,007,155 | | |
Total | | | | | | | 29,430,011 | | |
Total Corporate Bonds & Notes
(Cost: $722,990,218) | | | | | | | 724,134,672 | | |
The accompanying Notes to Financial Statements are an integral part of this statement.
Annual Report 2016
9
CMG ULTRA SHORT TERM BOND FUND
PORTFOLIO OF INVESTMENTS (continued)
July 31, 2016
Residential Mortgage-Backed Securities — Agency —%
Issuer | | Coupon
Rate | | Principal
Amount ($) | | Value ($) | |
Federal Home Loan Mortgage Corp.(a)
02/01/36 | | | 2.660 | % | | | 191,535 | | | | 203,498 | | |
Federal National Mortgage Association(a)
03/01/34 | | | 3.255 | % | | | 139,273 | | | | 142,355 | | |
Total Residential Mortgage-Backed
Securities — Agency
(Cost: $329,600) | | | | | | | 345,853 | | |
Residential Mortgage-Backed Securities —
Non-Agency 0.4%
Mill City Mortgage Trust
Series 2015-2 Class A1(b)
09/25/57 | | | 3.000 | % | | | 6,132,046 | | | | 6,158,241 | | |
Total Residential Mortgage-Backed
Securities — Non-Agency
(Cost: $6,161,841) | | | | | | | 6,158,241 | | |
Commercial Mortgage-Backed Securities —
Non-Agency 2.8%
CFCRE Commercial Mortgage Trust
Series 2016-C4 Class A1
05/10/58 | | | 1.501 | % | | | 3,025,069 | | | | 3,032,786 | | |
Commercial Mortgage Pass Through Certificates
Series 2014-CR14 Class A1
02/10/47 | | | 1.330 | % | | | 1,605,459 | | | | 1,606,990 | | |
Commercial Mortgage Pass-Through Certificates
Series 2013-LC6 Class A2
01/10/46 | | | 1.906 | % | | | 4,600,000 | | | | 4,625,852 | | |
Commercial Mortgage Trust
Series 2013-CR10 Class A1
08/10/46 | | | 1.278 | % | | | 1,468,814 | | | | 1,468,717 | | |
Series 2013-CR7 Class A1
03/10/46 | | | 0.716 | % | | | 2,641,595 | | | | 2,636,138 | | |
Series 2013-LC6 Class A1
01/10/46 | | | 0.724 | % | | | 1,699,054 | | | | 1,695,079 | | |
Series 2014-CR19 Class A1
08/10/47 | | | 1.415 | % | | | 5,594,581 | | | | 5,601,113 | | |
JPMBB Commercial Mortgage Securities Trust
Series 2013-C14 Class A1
08/15/46 | | | 1.260 | % | | | 3,777,086 | | | | 3,776,777 | | |
Series 2014-C19 Class A1
04/15/47 | | | 1.266 | % | | | 4,163,913 | | | | 4,164,396 | | |
Morgan Stanley Bank of America Merrill Lynch Trust
Series 2014-C17 Class A1
08/15/47 | | | 1.551 | % | | | 1,157,053 | | | | 1,162,709 | | |
Commercial Mortgage-Backed Securities —
Non-Agency (continued)
Issuer | | Coupon
Rate | | Principal
Amount ($) | | Value ($) | |
WF-RBS Commercial Mortgage Trust
Series 2012-C8 Class A1
08/15/45 | | | 0.864 | % | | | 7,332,831 | | | | 7,327,336 | | |
Series 2014-C20 Class A1
05/15/47 | | | 1.283 | % | | | 3,853,098 | | | | 3,855,319 | | |
Total Commercial Mortgage-Backed
Securities — Non-Agency
(Cost: $40,807,189) | | | | | | | 40,953,212 | | |
Asset-Backed Securities — Non-Agency 25.9%
ARI Fleet Lease Trust(b)
Series 2014-A Class A2
11/15/22 | | | 0.810 | % | | | 787,914 | | | | 787,000 | | |
Series 2016-A Class A2
07/15/24 | | | 1.820 | % | | | 6,960,000 | | | | 6,993,131 | | |
Academic Loan Funding Trust
Series 2012-1A Class A1(a)(b)
12/27/22 | | | 1.288 | % | | | 1,786,836 | | | | 1,787,571 | | |
Access Group, Inc.
Series 2004A Class A2(a)
04/25/29 | | | 0.975 | % | | | 3,292,543 | | | | 3,247,527 | | |
Ally Auto Receivables Trust
Series 2015-1 Class A2
02/15/18 | | | 0.920 | % | | | 2,329,756 | | | | 2,329,764 | | |
Series 2016-2 Class A2
10/15/18 | | | 1.170 | % | | | 6,500,000 | | | | 6,505,548 | | |
Ally Master Owner Trust
Series 2012-5 Class A
09/15/19 | | | 1.540 | % | | | 5,683,000 | | | | 5,696,181 | | |
Series 2014-5 Class A2
10/15/19 | | | 1.600 | % | | | 10,850,000 | | | | 10,867,267 | | |
Ally Master Owner Trust(a)
Series 2013-3 Class A
09/15/18 | | | 1.001 | % | | | 5,000,000 | | | | 5,001,205 | | |
Series 2014-1 Class A1
01/15/19 | | | 0.951 | % | | | 3,370,000 | | | | 3,371,434 | | |
AmeriCredit Automobile Receivables Trust
Series 2015-1 Class A2A
04/09/18 | | | 0.770 | % | | | 142,431 | | | | 142,419 | | |
Series 2015-3 Class A2A
01/08/19 | | | 1.070 | % | | | 4,455,305 | | | | 4,450,133 | | |
AmeriCredit Automobile Receivables
Series 2016-1 Class A2A
06/10/19 | | | 1.520 | % | | | 2,100,000 | | | | 2,100,658 | | |
American Credit Acceptance Receivables Trust(b)
Series 2015-2 Class A
06/12/19 | | | 1.570 | % | | | 1,787,639 | | | | 1,783,539 | | |
Series 2015-3 Class A
09/12/19 | | | 1.950 | % | | | 1,924,639 | | | | 1,919,757 | | |
Series 2016-1A Class A
05/12/20 | | | 2.370 | % | | | 2,153,465 | | | | 2,151,859 | | |
The accompanying Notes to Financial Statements are an integral part of this statement.
Annual Report 2016
10
CMG ULTRA SHORT TERM BOND FUND
PORTFOLIO OF INVESTMENTS (continued)
July 31, 2016
Asset-Backed Securities — Non-Agency (continued)
Issuer | | Coupon
Rate | | Principal
Amount ($) | | Value ($) | |
American Credit Acceptance Receivables Trust(b)(c)
Series 2016-3 Class A
11/12/20 | | | 1.700 | % | | | 4,400,000 | | | | 4,399,837 | | |
Ascentium Equipment Receivables LLC
Series 2015-2A Class A2(b)
12/11/17 | | | 1.570 | % | | | 6,171,210 | | | | 6,175,405 | | |
Bank of the West Auto Trust
Series 2015-1 Class A2A(b)
04/16/18 | | | 0.870 | % | | | 2,005,867 | | | | 2,005,677 | | |
Barclays Dryrock Issuance Trust
Series 2014-1 Class A(a)
12/16/19 | | | 0.841 | % | | | 7,500,000 | | | | 7,500,080 | | |
CCG Receivables Trust(b)
Series 2014-1 Class A2
11/15/21 | | | 1.060 | % | | | 2,348,167 | | | | 2,346,118 | | |
Series 2015-1 Class A2
11/14/18 | | | 1.460 | % | | | 7,745,325 | | | | 7,738,756 | | |
CIT Equipment Collateral
Series 2014-VT1 Class A2(b)
05/22/17 | | | 0.860 | % | | | 817,303 | | | | 817,308 | | |
CNH Equipment Trust
Series 2014-C Class A3
11/15/19 | | | 1.050 | % | | | 8,771,947 | | | | 8,754,390 | | |
Series 2015-B Class A2A
08/15/18 | | | 0.840 | % | | | 735,884 | | | | 734,959 | | |
Series 2015-B Class A3
07/15/20 | | | 1.370 | % | | | 4,000,000 | | | | 4,004,743 | | |
Series 2015-C Class A2A
12/17/18 | | | 1.100 | % | | | 4,598,081 | | | | 4,595,105 | | |
Series 2016-B Class A2A
10/15/19 | | | 1.310 | % | | | 3,400,000 | | | | 3,403,042 | | |
CNH Wholesale Master Note Trust
Series 2013-2A Class A(a)(b)
08/15/19 | | | 1.081 | % | | | 2,865,000 | | | | 2,867,864 | | |
California Republic Auto Receivables Trust
Series 2013-2 Class A2
03/15/19 | | | 1.230 | % | | | 1,536,277 | | | | 1,536,231 | | |
Series 2015-2 Class A2
02/15/18 | | | 0.880 | % | | | 1,219,920 | | | | 1,219,700 | | |
Series 2015-3 Class A2
07/16/18 | | | 1.140 | % | | | 6,933,297 | | | | 6,937,958 | | |
Series 2016-1 Class A2
12/17/18 | | | 1.500 | % | | | 11,000,000 | | | | 11,025,934 | | |
California Republic Auto Receivables Trust(b)
Series 2015-4 Class A2
09/17/18 | | | 1.600 | % | | | 1,941,488 | | | | 1,946,799 | | |
Subordinated, Series 2012-1 Class B
01/16/18 | | | 1.760 | % | | | 2,371,124 | | | | 2,372,928 | | |
Capital Auto Receivables Asset Trust
Series 2013-4 Class A3
03/20/18 | | | 1.090 | % | | | 1,238,671 | | | | 1,238,325 | | |
Series 2015-2 Class A1A
10/20/17 | | | 0.990 | % | | | 2,011,183 | | | | 2,008,912 | | |
Asset-Backed Securities — Non-Agency (continued)
Issuer | | Coupon
Rate | | Principal
Amount ($) | | Value ($) | |
Capital Auto Receivables Asset Trust(a)
Series 2015-2 Class A1B
10/20/17 | | | 0.887 | % | | | 1,391,822 | | | | 1,390,734 | | |
CarMax Auto Owner Trust
Series 2013-3 Class A3
04/16/18 | | | 0.970 | % | | | 965,844 | | | | 965,743 | | |
Series 2015-3 Class A2A
11/15/18 | | | 1.100 | % | | | 2,920,380 | | | | 2,919,285 | | |
Chesapeake Funding II LLC(b)
Series 2016-1A Class A1
03/15/28 | | | 2.110 | % | | | 4,625,000 | | | | 4,641,222 | | |
Series 2016-2A Class A1
06/15/28 | | | 1.880 | % | | | 5,150,000 | | | | 5,149,932 | | |
Chesapeake Funding LLC(a)(b)
Series 2011-2A Class A
04/07/24 | | | 1.720 | % | | | 382,975 | | | | 384,155 | | |
Series 2014-1A Class A
03/07/26 | | | 0.890 | % | | | 5,846,564 | | | | 5,828,187 | | |
Conn's Receivables Funding LLC
Series 2016-A Class A(b)
04/16/18 | | | 4.680 | % | | | 2,165,548 | | | | 2,165,777 | | |
DT Auto Owner Trust(b)
Series 2015-2A Class A
09/17/18 | | | 1.240 | % | | | 1,485,810 | | | | 1,485,836 | | |
Series 2016-1A Class A
09/16/19 | | | 2.000 | % | | | 4,201,847 | | | | 4,202,750 | | |
Series 2016-2A Class A
08/15/19 | | | 1.730 | % | | | 5,145,672 | | | | 5,141,159 | | |
Dell Equipment Finance Trust(b)
Series 2015-1 Class A2
07/24/17 | | | 1.010 | % | | | 1,039,759 | | | | 1,039,515 | | |
Series 2015-2 Class A2A
12/22/17 | | | 1.420 | % | | | 2,000,000 | | | | 2,000,825 | | |
Series 2016-1 Class A2
09/24/18 | | | 1.430 | % | | | 1,800,000 | | | | 1,798,540 | | |
Drive Auto Receivables Trust(b)
Series 2015-DA Class A2A
06/15/18 | | | 1.230 | % | | | 1,031,489 | | | | 1,031,356 | | |
Series 2015-DA Class A3
12/17/18 | | | 1.590 | % | | | 4,000,000 | | | | 4,000,833 | | |
Series 2016-AA Class A2A
03/15/18 | | | 1.500 | % | | | 2,376,903 | | | | 2,376,809 | | |
Series 2016-BA Class A2
08/15/18 | | | 1.380 | % | | | 5,420,000 | | | | 5,418,457 | | |
Enterprise Fleet Financing LLC(b)
Series 2014-1 Class A2
09/20/19 | | | 0.870 | % | | | 1,712,236 | | | | 1,708,951 | | |
Series 2014-2 Class A2
03/20/20 | | | 1.050 | % | | | 2,873,843 | | | | 2,862,029 | | |
Series 2015-1 Class A2
09/20/20 | | | 1.300 | % | | | 10,535,027 | | | | 10,512,693 | | |
Series 2015-2 Class A2
02/22/21 | | | 1.590 | % | | | 5,656,640 | | | | 5,655,299 | | |
The accompanying Notes to Financial Statements are an integral part of this statement.
Annual Report 2016
11
CMG ULTRA SHORT TERM BOND FUND
PORTFOLIO OF INVESTMENTS (continued)
July 31, 2016
Asset-Backed Securities — Non-Agency (continued)
Issuer | | Coupon
Rate | | Principal
Amount ($) | | Value ($) | |
Series 2016-2 Class A2
02/22/22 | | | 1.740 | % | | | 2,825,000 | | | | 2,822,577 | | |
Exeter Automobile Receivables Trust(b)
Series 2014-2A Class A
08/15/18 | | | 1.060 | % | | | 298,159 | | | | 298,054 | | |
Series 2014-3A Class A
01/15/19 | | | 1.320 | % | | | 1,132,946 | | | | 1,130,287 | | |
Series 2015-1A Class A
06/17/19 | | | 1.600 | % | | | 1,505,029 | | | | 1,503,270 | | |
Series 2015-2A Class A
11/15/19 | | | 1.540 | % | | | 3,138,116 | | | | 3,126,143 | | |
Series 2015-3A Class A
03/16/20 | | | 2.000 | % | | | 3,978,334 | | | | 3,963,592 | | |
Series 2016-1A Class A
07/15/20 | | | 2.350 | % | | | 3,246,718 | | | | 3,241,950 | | |
First Investors Auto Owner Trust(b)
Series 2014-3A Class A2
11/15/18 | | | 1.060 | % | | | 237,155 | | | | 237,072 | | |
Series 2015-1A Class A3
11/16/20 | | | 1.710 | % | | | 2,570,000 | | | | 2,563,666 | | |
Series 2015-2A Class A1
12/16/19 | | | 1.590 | % | | | 5,343,616 | | | | 5,348,540 | | |
Ford Credit Floorplan Master Owner Trust A
Series 2012-2 Class 2
01/15/19 | | | 1.920 | % | | | 3,970,000 | | | | 3,985,801 | | |
Series 2014-1 Class A1
02/15/19 | | | 1.200 | % | | | 4,440,000 | | | | 4,439,944 | | |
GE Dealer Floorplan Master Note Trust
Series 2014-1 Class A(a)
07/20/19 | | | 0.867 | % | | | 5,000,000 | | | | 4,991,252 | | |
GM Financial Automobile Leasing Trust
Series 2015-1 Class A2
12/20/17 | | | 1.100 | % | | | 4,101,506 | | | | 4,102,435 | | |
Harley-Davidson Motorcycle Trust
Series 2015-1 Class A2A
01/15/19 | | | 0.800 | % | | | 1,174,724 | | | | 1,174,164 | | |
Series 2015-2 Class A3
03/16/20 | | | 1.300 | % | | | 5,210,000 | | | | 5,209,734 | | |
Hertz Fleet Lease Funding LP(a)(b)
Series 2013-3 Class A
12/10/27 | | | 1.024 | % | | | 3,537,447 | | | | 3,539,637 | | |
Series 2014-1 Class A
04/10/28 | | | 0.874 | % | | | 5,766,695 | | | | 5,769,110 | | |
Series 2015-1 Class A
07/10/29 | | | 1.044 | % | | | 7,289,218 | | | | 7,305,957 | | |
John Deere Owner Trust
Series 2015-B Class A2
06/15/18 | | | 0.980 | % | | | 2,652,934 | | | | 2,650,894 | | |
MMAF Equipment Finance LLC(b)
Series 2015-AA Class A2
09/18/17 | | | 0.960 | % | | | 840,039 | | | | 839,282 | | |
Series 2016-AA Class A1
05/15/17 | | | 0.750 | % | | | 1,929,731 | | | | 1,929,147 | | |
Asset-Backed Securities — Non-Agency (continued)
Issuer | | Coupon
Rate | | Principal
Amount ($) | | Value ($) | |
New York City Tax Lien Trust(b)
Series 2015-A Class A
11/10/28 | | | 1.340 | % | | | 1,952,721 | | | | 1,943,376 | | |
New York City Tax Lien Trust(b)(c)(d)
Series 2016-A Class A
11/10/29 | | | 1.470 | % | | | 2,800,000 | | | | 2,799,631 | | |
OneMain Direct Auto Receivables Trust
Series 2016-1A Class A(b)
01/15/21 | | | 2.040 | % | | | 1,850,000 | | | | 1,848,537 | | |
Prestige Auto Receivables Trust(b)
Series 2015-1 Class A2
02/15/19 | | | 1.090 | % | | | 374,308 | | | | 374,172 | | |
Series 2016-1A Class A3
06/15/20 | | | 1.990 | % | | | 3,250,000 | | | | 3,262,357 | | |
SLM Private Education Loan Trust(a)(b)
Series 2013-A Class A1
08/15/22 | | | 1.081 | % | | | 4,762,180 | | | | 4,760,829 | | |
Series 2013-B Class A1
07/15/22 | | | 1.131 | % | | | 5,877,002 | | | | 5,866,130 | | |
Series 2013-C Class A1
02/15/22 | | | 1.331 | % | | | 3,184,638 | | | | 3,187,822 | | |
Series 2014-A Class A1
07/15/22 | | | 1.081 | % | | | 737,922 | | | | 737,362 | | |
SLM Student Loan Trust(a)
Series 2006-1 Class A4
07/25/19 | | | 0.805 | % | | | 3,433,026 | | | | 3,421,157 | | |
Series 2012-6 Class A2
09/25/19 | | | 0.768 | % | | | 610,006 | | | | 609,608 | | |
SMB Private Education Loan Trust(a)(b)
Series 2015-B Class A1
02/15/23 | | | 1.181 | % | | | 2,470,008 | | | | 2,470,436 | | |
Series 2016-A Class A1
05/15/23 | | | 1.181 | % | | | 3,211,803 | | | | 3,211,808 | | |
Series 2016-B Class A1
11/15/23 | | | 1.135 | % | | | 3,650,000 | | | | 3,650,000 | | |
Santander Drive Auto Receivables Trust
Series 2015-3 Class A2A
09/17/18 | | | 1.020 | % | | | 1,011,514 | | | | 1,010,862 | | |
Series 2015-4 Class A2A
12/17/18 | | | 1.200 | % | | | 4,559,226 | | | | 4,553,760 | | |
Series 2016-2 Class A2A
07/15/19 | | | 1.380 | % | | | 2,775,000 | | | | 2,773,320 | | |
SoFi Professional Loan Program LLC(b)
Series 2016-B Class A2A
03/25/31 | | | 1.680 | % | | | 9,564,004 | | | | 9,562,155 | | |
Series 2016-C Class A2A
05/25/31 | | | 1.480 | % | | | 3,500,000 | | | | 3,498,633 | | |
SunTrust Auto Receivables Trust
Series 2015-1A Class A2(b)
06/15/18 | | | 0.990 | % | | | 3,359,427 | | | | 3,357,657 | | |
TCF Auto Receivables Owner Trust(b)
Series 2015-1A Class A2
08/15/18 | | | 1.020 | % | | | 3,082,430 | | | | 3,081,339 | | |
The accompanying Notes to Financial Statements are an integral part of this statement.
Annual Report 2016
12
CMG ULTRA SHORT TERM BOND FUND
PORTFOLIO OF INVESTMENTS (continued)
July 31, 2016
Asset-Backed Securities — Non-Agency (continued)
Issuer | | Coupon
Rate | | Principal
Amount ($) | | Value ($) | |
Series 2015-2A Class A2
01/15/19 | | | 1.640 | % | | | 2,317,564 | | | | 2,316,173 | | |
Volkswagen Auto Lease Trust
Series 2015-A Class A2A
06/20/17 | | | 0.870 | % | | | 2,130,308 | | | | 2,130,302 | | |
Volvo Financial Equipment LLC
Series 2016-1A Class A2(b)
10/15/18 | | | 1.440 | % | | | 2,100,000 | | | | 2,100,523 | | |
Westlake Automobile Receivables Trust(b)
Series 2015-2A Class A2A
07/16/18 | | | 1.280 | % | | | 2,619,777 | | | | 2,615,689 | | |
Series 2016-1A Class A2A
01/15/19 | | | 1.820 | % | | | 6,417,549 | | | | 6,416,274 | | |
Wheels SPV 2 LLC(b)
Series 2014-1A Class A2
03/20/23 | | | 0.840 | % | | | 1,984,863 | | | | 1,983,581 | | |
Series 2015-1A Class A2
04/22/24 | | | 1.270 | % | | | 4,093,944 | | | | 4,099,924 | | |
World Omni Automobile Lease Securitization Trust
Series 2015-A Class A2A
05/15/18 | | | 1.060 | % | | | 4,225,460 | | | | 4,222,277 | | |
World Omni Automobile Lease Securitization Trust(a)
Series 2016-A Class A2B
02/15/19 | | | 0.889 | % | | | 4,525,000 | | | | 4,525,000 | | |
Total Asset-Backed Securities —
Non-Agency
(Cost: $381,928,152) | | | | | | | 382,008,353 | | |
U.S. Treasury Obligations 6.0%
U.S. Treasury
10/31/16 | | | 0.375 | % | | | 43,400,000 | | | | 43,406,781 | | |
01/31/17 | | | 0.875 | % | | | 44,280,000 | | | | 44,378,612 | | |
Total U.S. Treasury Obligations
(Cost: $87,739,967) | | | | | | | 87,785,393 | | |
U.S. Government & Agency Obligations 7.0%
Federal Farm Credit Banks(a)
06/11/18 | | | 0.519 | % | | | 3,925,000 | | | | 3,918,053 | | |
06/18/18 | | | 0.682 | % | | | 9,265,000 | | | | 9,275,386 | | |
10/22/18 | | | 0.552 | % | | | 16,755,000 | | | | 16,710,231 | | |
02/25/19 | | | 0.758 | % | | | 24,735,000 | | | | 24,789,021 | | |
Federal Home Loan Mortgage Corp.
03/08/17 | | | 1.000 | % | | | 43,000,000 | | | | 43,121,905 | | |
Federal National Mortgage Association(a)
08/26/16 | | | 0.510 | % | | | 6,000,000 | | | | 6,000,451 | | |
Total U.S. Government & Agency Obligations
(Cost: $103,761,779) | | | | | | | 103,815,047 | | |
Foreign Government Obligations 2.1%
Issuer | | Coupon
Rate | | Principal
Amount ($) | | Value ($) | |
CANADA 2.1% | |
Province of Nova Scotia
01/26/17 | | | 5.125 | % | | | 10,000,000 | | | | 10,207,450 | | |
Province of Ontario
12/15/17 | | | 3.150 | % | | | 10,000,000 | | | | 10,311,920 | | |
Province of Quebec
11/14/16 | | | 5.125 | % | | | 10,000,000 | | | | 10,126,200 | | |
Total | | | | | | | 30,645,570 | | |
Total Foreign Government Obligations
(Cost: $30,580,787) | | | | | | | 30,645,570 | | |
Municipal Bonds 0.7%
Issue
Description | | Coupon
Rate | | Principal
Amount ($) | | Value ($) | |
CALIFORNIA 0.3% | |
University of California
Revenue Bonds
Taxable
Series 2011Y-1(a)
07/01/41 | | | 0.967 | % | | | 5,000,000 | | | | 5,001,200 | | |
ILLINOIS 0.4% | |
State of Illinois
Unlimited General Obligation Bonds
Taxable
Series 2011
03/01/17 | | | 5.365 | % | | | 5,000,000 | | | | 5,108,050 | | |
Total Municipal Bonds
(Cost: $10,083,521) | | | | | | | 10,109,250 | | |
Money Market Funds 6.8%
| | | Shares | | Value ($) | |
Columbia Short-Term Cash Fund,
0.439%(e)(f) | | | 100,312,375 | | | | 100,312,375 | | |
Total Money Market Funds
(Cost: $100,312,375) | | | | | 100,312,375 | | |
Total Investments
(Cost: $1,484,695,429) | | | | | 1,486,267,966 | | |
Other Assets & Liabilities, Net | | | | | (13,907,620 | ) | |
Net Assets | | | | | 1,472,360,346 | | |
The accompanying Notes to Financial Statements are an integral part of this statement.
Annual Report 2016
13
CMG ULTRA SHORT TERM BOND FUND
PORTFOLIO OF INVESTMENTS (continued)
July 31, 2016
Notes to Portfolio of Investments
(a) Variable rate security.
(b) Represents privately placed and other securities and instruments exempt from SEC registration (collectively, private placements), such as Section 4(a)(2) and Rule 144A eligible securities, which are often sold only to qualified institutional buyers. The Fund may invest in private placements determined to be liquid as well as those determined to be illiquid. Private placements may be determined to be liquid under guidelines established by the Fund's Board of Trustees. At July 31, 2016, the value of these securities amounted to $328,571,204 or 22.32% of net assets.
(c) Security, or a portion thereof, has been purchased on a when-issued or delayed delivery basis.
(d) Represents fair value as determined in good faith under procedures approved by the Board of Trustees. At July 31, 2016, the value of these securities amounted to $2,799,631, which represents 0.19% of net assets.
(e) The rate shown is the seven-day current annualized yield at July 31, 2016.
(f) As defined in the Investment Company Act of 1940, an affiliated company is one in which the Fund owns 5% or more of the company's outstanding voting securities, or a company which is under common ownership or control with the Fund. Holdings and transactions in these affiliated companies during the year ended July 31, 2016 are as follows:
Issuer | | Beginning
Cost ($) | | Purchase
Cost ($) | | Proceeds
From Sales ($) | | Ending
Cost ($) | | Dividends —
Affiliated
Issuers ($) | | Value ($) | |
Columbia Short-Term Cash Fund | | | 71,337,227 | | | | 1,093,536,355 | | | | (1,064,561,207 | ) | | | 100,312,375 | | | | 268,895 | | | | 100,312,375 | | |
Fair Value Measurements
The Fund categorizes its fair value measurements according to a three-level hierarchy that maximizes the use of observable inputs and minimizes the use of unobservable inputs by prioritizing that the most observable input be used when available. Observable inputs are those that market participants would use in pricing an investment based on market data obtained from sources independent of the reporting entity. Unobservable inputs are those that reflect the Fund's assumptions about the information market participants would use in pricing an investment. An investment's level within the fair value hierarchy is based on the lowest level of any input that is deemed significant to the asset's or liability's fair value measurement. The input levels are not necessarily an indication of the risk or liquidity associated with investments at that level. For example, certain U.S. government securities are generally high quality and liquid, however, they are reflected as Level 2 because the inputs used to determine fair value may not always be quoted prices in an active market.
Fair value inputs are summarized in the three broad levels listed below:
> Level 1 — Valuations based on quoted prices for investments in active markets that the Fund has the ability to access at the measurement date (including NAV for open-end mutual funds). Valuation adjustments are not applied to Level 1 investments.
> Level 2 — Valuations based on other significant observable inputs (including quoted prices for similar securities, interest rates, prepayment speeds, credit risks, etc.).
> Level 3 — Valuations based on significant unobservable inputs (including the Fund's own assumptions and judgment in determining the fair value of investments).
Inputs that are used in determining fair value of an investment may include price information, credit data, volatility statistics, and other factors. These inputs can be either observable or unobservable. The availability of observable inputs can vary between investments, and is affected by various factors such as the type of investment, and the volume and level of activity for that investment or similar investments in the marketplace. The inputs will be considered by the Investment Manager, along with any other relevant factors in the calculation of an investment's fair value. The Fund uses prices and inputs that are current as of the measurement date, which may include periods of market dislocations. During these periods, the availability of prices and inputs may be reduced for many investments. This condition could cause an investment to be reclassified between the various levels within the hierarchy.
Certain investments that have been measured at fair value using the net asset value per share (or its equivalent) are not categorized in the fair value hierarchy. The fair value amounts presented in the table are intended to reconcile the fair value hierarchy to the amounts presented in the Portfolio of Investments. The Columbia Short-Term Cash Fund seeks to provide shareholders with maximum current income consistent with liquidity and stability of principal. Investments in Columbia Short-Term Cash Fund may be redeemed on a daily basis without restriction.
Investments falling into the Level 3 category are primarily supported by quoted prices from brokers and dealers participating in the market for those investments. However, these may be classified as Level 3 investments due to lack of market transparency and corroboration to support these quoted prices. Additionally, valuation models may be used as the pricing source for any remaining investments classified as Level 3. These models may rely on one or more significant unobservable inputs and/or significant assumptions by the Investment Manager. Inputs used in valuations may include, but are not limited to, financial statement analysis, capital account balances, discount rates and estimated cash flows, and comparable company data.
Under the direction of the Fund's Board of Trustees (the Board), the Investment Manager's Valuation Committee (the Committee) is responsible for overseeing the valuation procedures approved by the Board. The Committee consists of voting and non-voting members from various groups within the Investment Manager's organization, including operations and accounting, trading and investments, compliance, risk management and legal.
The accompanying Notes to Financial Statements are an integral part of this statement.
Annual Report 2016
14
CMG ULTRA SHORT TERM BOND FUND
PORTFOLIO OF INVESTMENTS (continued)
July 31, 2016
Fair Value Measurements (continued)
The Committee meets at least monthly to review and approve valuation matters, which may include a description of specific valuation determinations, data regarding pricing information received from approved pricing vendors and brokers and the results of Board-approved valuation control policies and procedures (the Policies). The Policies address, among other things, instances when market quotations are or are not readily available, including recommendations of third party pricing vendors and a determination of appropriate pricing methodologies; events that require specific valuation determinations and assessment of fair value techniques; securities with a potential for stale pricing, including those that are illiquid, restricted, or in default; and the effectiveness of third party pricing vendors, including periodic reviews of vendors. The Committee meets more frequently, as needed, to discuss additional valuation matters, which may include the need to review back-testing results, review time-sensitive information or approve related valuation actions. The Committee reports to the Board, with members of the Committee meeting with the Board at each of its regularly scheduled meetings to discuss valuation matters and actions during the period, similar to those described earlier.
For investments categorized as Level 3, the Committee monitors information similar to that described above, which may include: (i) data specific to the issuer or comparable issuers, (ii) general market or specific sector news and (iii) quoted prices and specific or similar security transactions. The Committee considers this data and any changes from prior periods in order to assess the reasonableness of observable and unobservable inputs, any assumptions or internal models used to value those securities and changes in fair value. This data is also used to corroborate, when available, information received from approved pricing vendors and brokers. Various factors impact the frequency of monitoring this information (which may occur as often as daily). However, the Committee may determine that changes to inputs, assumptions and models are not required as a result of the monitoring procedures performed.
The following table is a summary of the inputs used to value the Fund's investments at July 31, 2016:
| | | Level 1
Quoted Prices in Active
Markets for Identical
Assets ($) | | Level 2
Other Significant
Observable Inputs ($) | | Level 3
Significant
Unobservable Inputs ($) | | Total ($) | |
Investments | |
Corporate Bonds & Notes | | | — | | | | 724,134,672 | | | | — | | | | 724,134,672 | | |
Residential Mortgage-Backed
Securities — Agency | | | — | | | | 345,853 | | | | — | | | | 345,853 | | |
Residential Mortgage-Backed
Securities — Non-Agency | | | — | | | | 6,158,241 | | | | — | | | | 6,158,241 | | |
Commercial Mortgage-Backed
Securities — Non-Agency | | | — | | | | 40,953,212 | | | | — | | | | 40,953,212 | | |
Asset-Backed Securities —
Non-Agency | | | — | | | | 379,208,722 | | | | 2,799,631 | | | | 382,008,353 | | |
U.S. Treasury Obligations | | | 87,785,393 | | | | — | | | | — | | | | 87,785,393 | | |
U.S. Government &
Agency Obligations | | | — | | | | 103,815,047 | | | | — | | | | 103,815,047 | | |
Foreign Government Obligations | | | — | | | | 30,645,570 | | | | — | | | | 30,645,570 | | |
Municipal Bonds | | | — | | | | 10,109,250 | | | | — | | | | 10,109,250 | | |
Investments measured at net
asset value | |
Money Market Funds | | | — | | | | — | | | | — | | | | 100,312,375 | | |
Total Investments | | | 87,785,393 | | | | 1,295,370,567 | | | | 2,799,631 | | | | 1,486,267,966 | | |
See the Portfolio of Investments for all investment classifications not indicated in the table.
The Fund's assets assigned to the Level 2 input category are generally valued using the market approach, in which a security's value is determined through reference to prices and information from market transactions for similar or identical assets.
There were no transfers of financial assets between levels during the period.
The Fund does not hold any significant investments (greater than one percent of net assets) categorized as Level 3.
The Fund's assets assigned to the Level 3 category are valued utilizing the valuation technique deemed the most appropriate in the circumstances. Certain asset backed securities classified as Level 3 securities are valued using the market approach and utilize single market quotations from broker dealers which may have included, but were not limited to, observable transactions for identical or similar assets in the market and the distressed nature of the security. The appropriateness of fair values for these securities is monitored on an ongoing basis which may include results of back testing, manual price reviews and other control procedures. Significant increases (decreases) to any of these inputs would result in a significantly lower (higher) fair value measurement.
The accompanying Notes to Financial Statements are an integral part of this statement.
Annual Report 2016
15
CMG ULTRA SHORT TERM BOND FUND
STATEMENT OF ASSETS AND LIABILITIES
July 31, 2016
Assets | |
Investments, at value | |
Unaffiliated issuers (identified cost $1,384,383,054) | | $ | 1,385,955,591 | | |
Affiliated issuers (identified cost $100,312,375) | | | 100,312,375 | | |
Total investments (identified cost $1,484,695,429) | | | 1,486,267,966 | | |
Receivable for: | |
Investments sold | | | 837 | | |
Capital shares sold | | | 6,013,907 | | |
Dividends | | | 29,538 | | |
Interest | | | 4,195,161 | | |
Expense reimbursement due from Investment Manager | | | 86 | | |
Trustees' deferred compensation plan | | | 59,659 | | |
Total assets | | | 1,496,567,154 | | |
Liabilities | |
Due to custodian | | | 349 | | |
Payable for: | |
Investments purchased | | | 11,982,697 | | |
Investments purchased on a delayed delivery basis | | | 7,199,468 | | |
Capital shares purchased | | | 3,829,154 | | |
Dividend distributions to shareholders | | | 1,099,619 | | |
Management services fees | | | 10,012 | | |
Other expenses | | | 25,850 | | |
Trustees' deferred compensation plan | | | 59,659 | | |
Total liabilities | | | 24,206,808 | | |
Net assets applicable to outstanding capital stock | | $ | 1,472,360,346 | | |
Represented by | |
Paid-in capital | | $ | 1,498,873,786 | | |
Excess of distributions over net investment income | | | (155,124 | ) | |
Accumulated net realized loss | | | (27,930,853 | ) | |
Unrealized appreciation (depreciation) on: | |
Investments | | | 1,572,537 | | |
Total — representing net assets applicable to outstanding capital stock | | $ | 1,472,360,346 | | |
Shares outstanding | | | 163,421,699 | | |
Net asset value per share | | $ | 9.01 | | |
The accompanying Notes to Financial Statements are an integral part of this statement.
Annual Report 2016
16
CMG ULTRA SHORT TERM BOND FUND
STATEMENT OF OPERATIONS
Year Ended July 31, 2016
Net investment income | |
Income: | |
Dividends — affiliated issuers | | $ | 268,895 | | |
Interest | | | 12,777,482 | | |
Total income | | | 13,046,377 | | |
Expenses: | |
Management services fees | | | 3,611,713 | | |
Compensation of board members | | | 41,001 | | |
Audit fees | | | 27,780 | | |
Legal fees | | | 10,802 | | |
Total expenses | | | 3,691,296 | | |
Fees waived or expenses reimbursed by Investment Manager and its affiliates | | | (83,758 | ) | |
Total net expenses | | | 3,607,538 | | |
Net investment income | | | 9,438,839 | | |
Realized and unrealized gain (loss) — net | |
Net realized gain (loss) on: | |
Investments | | | (3,436,171 | ) | |
Net realized loss | | | (3,436,171 | ) | |
Net change in unrealized appreciation (depreciation) on: | |
Investments | | | 5,847,180 | | |
Net change in unrealized appreciation | | | 5,847,180 | | |
Net realized and unrealized gain | | | 2,411,009 | | |
Net increase in net assets resulting from operations | | $ | 11,849,848 | | |
The accompanying Notes to Financial Statements are an integral part of this statement.
Annual Report 2016
17
CMG ULTRA SHORT TERM BOND FUND
STATEMENT OF CHANGES IN NET ASSETS
| | | Year Ended
July 31,
2016 | | Year Ended
July 31,
2015 | |
Operations | |
Net investment income | | $ | 9,438,839 | | | $ | 6,031,272 | | |
Net realized gain (loss) | | | (3,436,171 | ) | | | 347,586 | | |
Net change in unrealized appreciation (depreciation) | | | 5,847,180 | | | | (848,079 | ) | |
Net increase in net assets resulting from operations | | | 11,849,848 | | | | 5,530,779 | | |
Distributions to shareholders | |
Net investment income | | | (9,508,316 | ) | | | (6,031,234 | ) | |
Total distributions to shareholders | | | (9,508,316 | ) | | | (6,031,234 | ) | |
Decrease in net assets from capital stock activity | | | (49,161,602 | ) | | | (272,945,627 | ) | |
Total decrease in net assets | | | (46,820,070 | ) | | | (273,446,082 | ) | |
Net assets at beginning of year | | | 1,519,180,416 | | | | 1,792,626,498 | | |
Net assets at end of year | | $ | 1,472,360,346 | | | $ | 1,519,180,416 | | |
Excess of distributions over net investment income | | $ | (155,124 | ) | | $ | (189,846 | ) | |
The accompanying Notes to Financial Statements are an integral part of this statement.
Annual Report 2016
18
CMG ULTRA SHORT TERM BOND FUND
STATEMENT OF CHANGES IN NET ASSETS (continued)
| | | Year Ended July 31, 2016 | | Year Ended July 31, 2015 | |
| | | Shares | | Dollars ($) | | Shares | | Dollars ($) | |
Capital stock activity | |
Subscriptions | | | 93,609,529 | | | | 842,162,488 | | | | 98,244,384 | | | | 883,570,711 | | |
Distributions reinvested | | | 93,397 | | | | 840,333 | | | | 43,948 | | | | 395,275 | | |
Redemptions | | | (99,165,225 | ) | | | (892,164,423 | ) | | | (128,629,269 | ) | | | (1,156,911,613 | ) | |
Total decrease | | | (5,462,299 | ) | | | (49,161,602 | ) | | | (30,340,937 | ) | | | (272,945,627 | ) | |
Total net decrease | | | (5,462,299 | ) | | | (49,161,602 | ) | | | (30,340,937 | ) | | | (272,945,627 | ) | |
The accompanying Notes to Financial Statements are an integral part of this statement.
Annual Report 2016
19
CMG ULTRA SHORT TERM BOND FUND
The following table is intended to help you understand the Fund's financial performance. Certain information reflects financial results for a single share of a class held for the periods shown. Per share net investment income (loss) amounts are calculated based on average shares outstanding during the period. Total return assumes reinvestment of all dividends and distributions, if any. Total return does not reflect payment of sales charges, if any. Total return and portfolio turnover are not annualized for periods of less than one year. The portfolio turnover rate is calculated without regard to purchase and sales transactions of short-term instruments and certain derivatives, if any. If such transactions were included, the Fund's portfolio turnover rate may be higher.
| | | Year Ended July 31, | |
| | | 2016 | | 2015 | | 2014 | | 2013 | | 2012 | |
Per share data | |
Net asset value, beginning of period | | $ | 9.00 | | | $ | 9.00 | | | $ | 8.99 | | | $ | 9.01 | | | $ | 9.02 | | |
Income from investment operations: | |
Net investment income | | | 0.06 | | | | 0.03 | | | | 0.04 | | | | 0.07 | | | | 0.08 | | |
Net realized and unrealized gain (loss) | | | 0.01 | | | | (0.00 | )(a) | | | 0.01 | | | | (0.02 | ) | | | 0.00 | (a) | |
Total from investment operations | | | 0.07 | | | | 0.03 | | | | 0.05 | | | | 0.05 | | | | 0.08 | | |
Less distributions to shareholders from: | |
Net investment income | | | (0.06 | ) | | | (0.03 | ) | | | (0.04 | ) | | | (0.07 | ) | | | (0.09 | ) | |
Total distributions to shareholders | | | (0.06 | ) | | | (0.03 | ) | | | (0.04 | ) | | | (0.07 | ) | | | (0.09 | ) | |
Net asset value, end of period | | $ | 9.01 | | | $ | 9.00 | | | $ | 9.00 | | | $ | 8.99 | | | $ | 9.01 | | |
Total return | | | 0.77 | % | | | 0.37 | % | | | 0.52 | % | | | 0.55 | % | | | 0.93 | % | |
Ratios to average net assets(b) | |
Total gross expenses | | | 0.26 | % | | | 0.26 | % | | | 0.26 | % | | | 0.26 | % | | | 0.26 | % | |
Total net expenses(c) | | | 0.25 | % | | | 0.25 | % | | | 0.25 | % | | | 0.25 | % | | | 0.25 | % | |
Net investment income | | | 0.65 | % | | | 0.37 | % | | | 0.40 | % | | | 0.76 | % | | | 0.93 | % | |
Supplemental data | |
Net assets, end of period (in thousands) | | $ | 1,472,360 | | | $ | 1,519,180 | | | $ | 1,792,626 | | | $ | 1,836,456 | | | $ | 1,365,792 | | |
Portfolio turnover | | | 82 | % | | | 62 | % | | | 68 | % | | | 67 | % | | | 66 | % | |
Notes to Financial Highlights
(a) Rounds to zero.
(b) In addition to the fees and expenses that the Fund bears directly, the Fund indirectly bears a pro rata share of the fees and expenses of any other funds in which it invests. Such indirect expenses are not included in the Fund's reported expense ratios.
(c) Total net expenses include the impact of certain fee waivers/expense reimbursements made by the Investment Manager and certain of its affiliates, if applicable.
The accompanying Notes to Financial Statements are an integral part of this statement.
Annual Report 2016
20
CMG ULTRA SHORT TERM BOND FUND
NOTES TO FINANCIAL STATEMENTS
July 31, 2016
Note 1. Organization
CMG Ultra Short Term Bond Fund (the Fund), a series of Columbia Funds Series Trust I (the Trust), is a diversified fund. The Trust is registered under the Investment Company Act of 1940, as amended (the 1940 Act), as an open-end management investment company organized as a Massachusetts business trust.
Shares of the Fund are available for purchase by institutional entities, including corporations, partnerships, trusts, foundations, endowments, affiliated funds, government entities or other similar organizations, and to certain qualifying advisory clients of Bank of America. Please see the Fund's prospectus for further details, including applicable investment minimums.
Fund Shares
The Trust may issue an unlimited number of shares (without par value), which are offered continuously at net asset value.
Note 2. Summary of Significant Accounting Policies
Basis of Preparation
The Fund is an investment company that applies the accounting and reporting guidance in the Financial Accounting Standards Board (FASB) Accounting Standards Codification Topic 946, Financial Services — Investment Companies (ASC 946). The financial statements are prepared in accordance with U.S. generally accepted accounting principles (GAAP), which requires management to make certain estimates and assumptions that affect the reported amounts of assets and liabilities, the disclosure of contingent assets and liabilities at the date of the financial statements and the reported amounts of income and expenses during the reporting period. Actual results could differ from those estimates.
The following is a summary of significant accounting policies followed by the Fund in the preparation of its financial statements.
Security Valuation
Debt securities generally are valued by pricing services approved by the Board of Trustees (the Board) based upon market transactions for normal, institutional-size trading units of similar securities. The services may use various pricing techniques that take into account, as applicable, factors such as yield, quality, coupon rate,
maturity, type of issue, trading characteristics and other data, as well as approved independent broker-dealer quotes. Debt securities for which quotations are not readily available or not believed to be reflective of market value may also be valued based upon a bid quote from an approved independent broker-dealer. Debt securities maturing in 60 days or less are valued primarily at amortized cost value, unless this method results in a valuation that management believes does not approximate market value.
Asset- and mortgage-backed securities are generally valued by pricing services, which utilize pricing models that incorporate the securities' cash flow and loan performance data. These models also take into account available market data, including trades, market quotations, and benchmark yield curves for identical or similar securities. Factors used to identify similar securities may include, but are not limited to, issuer, collateral type, vintage, prepayment speeds, collateral performance, credit ratings, credit enhancement and expected life. Asset-backed securities for which quotations are readily available may also be valued based upon an over-the-counter or exchange bid quote from an approved independent broker-dealer.
Investments in open-end investment companies, including money market funds, are valued at their latest net asset value.
Investments for which market quotations are not readily available, or that have quotations which management believes are not reflective of market value or reliable, are valued at fair value as determined in good faith under procedures approved by and under the general supervision of the Board. If a security or class of securities (such as foreign securities) is valued at fair value, such value is likely to be different from the quoted or published price for the security.
The determination of fair value often requires significant judgment. To determine fair value, management may use assumptions including but not limited to future cash flows and estimated risk premiums. Multiple inputs from various sources may be used to determine fair value.
GAAP requires disclosure regarding the inputs and valuation techniques used to measure fair value and any changes in valuation inputs or techniques. In addition, investments shall be disclosed by major category. This information is disclosed following the Fund's Portfolio of Investments.
Annual Report 2016
21
CMG ULTRA SHORT TERM BOND FUND
NOTES TO FINANCIAL STATEMENTS (continued)
July 31, 2016
Asset- and Mortgage-Backed Securities
The Fund may invest in asset-backed and mortgage-backed securities. The maturity dates shown represent the original maturity of the underlying obligation. Actual maturity may vary based upon prepayment activity on these obligations. All, or a portion, of the obligation may be prepaid at any time because the underlying asset may be prepaid. As a result, decreasing market interest rates could result in an increased level of prepayment. An increased prepayment rate will have the effect of shortening the maturity of the security. Unless otherwise noted, the coupon rates presented are fixed rates.
Delayed Delivery Securities
The Fund may trade securities on other than normal settlement terms, including securities purchased or sold on a "when-issued" basis. This may increase risk to the Fund since the other party to the transaction may fail to deliver, which could cause the Fund to subsequently invest at less advantageous prices. The Fund designates cash or liquid securities in an amount equal to the delayed delivery commitment.
Security Transactions
Security transactions are accounted for on the trade date. Cost is determined and gains (losses) are based upon the specific identification method for both financial statement and federal income tax purposes.
Income Recognition
Interest income is recorded on an accrual basis. Market premiums and discounts, including original issue discounts, are amortized and accreted, respectively, over the expected life of the security on all debt securities, unless otherwise noted. The Fund classifies gains and losses realized on prepayments received on mortgage-backed securities as adjustments to interest income.
The Fund may place a debt security on non-accrual status and reduce related interest income when it becomes probable that the interest will not be collected and the amount of uncollectible interest can be reasonably estimated. A defaulted debt security is removed from non-accrual status when the issuer resumes interest payments or when collectability of interest is reasonably assured.
Dividend income is recorded on the ex-dividend date.
Expenses
General expenses of the Trust are allocated to the Fund and other funds of the Trust based upon relative net assets or other expense allocation methodologies
determined by the nature of the expense. Expenses directly attributable to the Fund are charged to the Fund.
Federal Income Tax Status
The Fund intends to qualify each year as a regulated investment company under Subchapter M of the Internal Revenue Code, as amended, and will distribute substantially all of its taxable income (including net short-term capital gains), if any, for its tax year, and as such will not be subject to federal income taxes. In addition, the Fund intends to distribute in each calendar year substantially all of its net investment income, capital gains and certain other amounts, if any, such that the Fund should not be subject to federal excise tax. Therefore, no federal income or excise tax provision is recorded.
Distributions to Shareholders
Distributions from net investment income, if any, are declared daily and paid monthly. Net realized capital gains, if any, are distributed at least annually. Income distributions and capital gain distributions are determined in accordance with federal income tax regulations, which may differ from GAAP.
Guarantees and Indemnifications
Under the Trust's organizational documents and, in some cases, by contract, its officers and trustees are indemnified against certain liabilities arising out of the performance of their duties to the Trust or its funds. In addition, certain of the Fund's contracts with its service providers contain general indemnification clauses. The Fund's maximum exposure under these arrangements is unknown since the amount of any future claims that may be made against the Fund cannot be determined, and the Fund has no historical basis for predicting the likelihood of any such claims.
Note 3. Fees and Other Transactions with Affiliates
Management Services Fees
Effective December 1, 2015, the Fund entered into a Management Agreement with Columbia Management Investment Advisers, LLC (the Investment Manager), a wholly-owned subsidiary of Ameriprise Financial, Inc. (Ameriprise Financial). Under the Management Agreement, the Investment Manager determines which securities will be purchased, held or sold. The Fund's management fee is a unified fee. The Investment Manager, out of the unified fee it receives from the Fund, pays all operating costs and expenses of the Fund (other than the expenses described below or in the Fund's
Annual Report 2016
22
CMG ULTRA SHORT TERM BOND FUND
NOTES TO FINANCIAL STATEMENTS (continued)
July 31, 2016
prospectus), including accounting expenses (other than audit fees), legal fees for the Fund, transfer agent and custodian fees, and other expenses. The Fund pays the following expenses: disinterested trustees fees and expenses, including their legal counsel, auditing expense, interest on borrowings by the Fund, if any, portfolio transaction expenses, taxes and extraordinary expenses of the Fund. The unified fee is paid monthly to the Investment Manager at the annual rate of 0.25% of the Fund's average net assets.
Compensation of Board Members
Board members, who are not officers or employees of the Investment Manager or Ameriprise Financial, are compensated for their services to the Fund as disclosed in the Statement of Operations. These Board members may participate in a Deferred Compensation Plan (the Plan) which may be terminated at any time. Obligations of the Plan will be paid solely out of the Fund's assets, and all amounts payable under the Plan constitute a general unsecured obligation of the Fund.
Compensation of Chief Compliance Officer
The Board has appointed a Chief Compliance Officer to the Fund in accordance with federal securities regulations. The Fund is allocated a portion of the expenses associated with the Chief Compliance Officer based on relative net assets of the Trust. The expenses of the Chief Compliance Officer allocated to the Fund are payable by the Investment Manager.
Transfer Agency Fees
Under a Transfer and Dividend Disbursing Agent Agreement, Columbia Management Investment Services Corp. (the Transfer Agent), an affiliate of the Investment Manager and a wholly-owned subsidiary of Ameriprise Financial, is responsible for providing transfer agency services to the Fund. The Transfer Agent has contracted with Boston Financial Data Services (BFDS) to serve as sub-transfer agent. The Transfer Agent pays the fees of BFDS for services as sub-transfer agent and BFDS is not entitled to reimbursement for such fees from the Fund.
Expenses Waived/Reimbursed by the Investment Manager and its Affiliates
The Investment Manager and certain of its affiliates have contractually agreed to waive fees and/or reimburse expenses (excluding certain fees and expenses described below), through November 30, 2016, unless sooner terminated at the sole discretion of the Board, so that the Fund's net operating expenses, after giving effect to fees waived/expenses reimbursed and any
balance credits and/or overdraft charges from the Fund's custodian, do not exceed the annual rate of 0.25% of the Fund's average daily net assets.
Under the agreement governing this fee waiver and/or expense reimbursement arrangement, the following fees and expenses are excluded from the waiver/reimbursement commitment, and therefore will be paid by the Fund, if applicable: taxes (including foreign transaction taxes), expenses associated with investments in affiliated and non-affiliated pooled investment vehicles (including mutual funds and exchange-traded funds), transaction costs and brokerage commissions, costs related to any securities lending program, dividend and interest expenses associated with securities sold short, inverse floater program fees and expenses, transaction charges and interest on borrowed money, interest, infrequent and/or unusual expenses and any other expenses the exclusion of which is specifically approved by the Board. This agreement may be modified or amended only with approval from the Investment Manager, certain of its affiliates and the Fund. Any fees waived and/or expenses reimbursed under the expense reimbursement arrangements described above are not recoverable by the Investment Manager or its affiliates in future periods.
Note 4. Federal Tax Information
The timing and character of income and capital gain distributions are determined in accordance with income tax regulations, which may differ from GAAP because of temporary or permanent book to tax differences.
At July 31, 2016, these differences are primarily due to differing treatment for capital loss carryforwards, principal and/or interest from fixed income securities, deferral/reversal of wash sale losses, Trustees' deferred compensation, distributions. To the extent these differences are permanent, reclassifications are made among the components of the Fund's net assets in the Statement of Assets and Liabilities. Temporary differences do not require reclassifications.
In the Statement of Assets and Liabilities the following reclassifications were made:
Excess of distributions over net investment income | | $ | 104,199 | | |
Accumulated net realized loss | | | 109,500 | | |
Paid-in capital | | | (213,699 | ) | |
Net investment income (loss) and net realized gains (losses), as disclosed in the Statement of Operations, and net assets were not affected by this reclassification.
Annual Report 2016
23
CMG ULTRA SHORT TERM BOND FUND
NOTES TO FINANCIAL STATEMENTS (continued)
July 31, 2016
The tax character of distributions paid during the years indicated was as follows:
Year Ended July 31, | | 2016 | | 2015 | |
Ordinary income | | $ | 9,508,316 | | | $ | 6,031,234 | | |
Short-term capital gain distributions, if any, are considered ordinary income distributions for tax purposes.
At July 31, 2016, the components of distributable earnings on a tax basis were as follows:
Undistributed ordinary income | | $ | 1,004,154 | | |
Capital loss carryforwards | | | (27,930,203 | ) | |
Net unrealized appreciation | | | 1,571,887 | | |
At July 31, 2016, the cost of investments for federal income tax purposes was $1,484,696,079 and the aggregate gross unrealized appreciation and depreciation based on that cost was:
Unrealized appreciation | | $ | 1,879,215 | | |
Unrealized depreciation | | | (307,328 | ) | |
Net unrealized appreciation | | $ | 1,571,887 | | |
The following capital loss carryforwards, determined at July 31, 2016, may be available to reduce taxable income arising from future net realized gains on investments, if any, to the extent permitted by the Internal Revenue Code:
Year of Expiration | | Amount ($) | |
2017 | | | 2,249,159 | | |
2018 | | | 1,023,617 | | |
2019 | | | 11,369,928 | | |
No expiration — short-term | | | 5,015,515 | | |
No expiration — long-term | | | 8,271,984 | | |
Total | | | 27,930,203 | | |
Capital loss carryforwards with no expiration are required to be utilized prior to any capital losses which carry an expiration date. As a result of this ordering rule, capital loss carryforwards which carry an expiration date may be more likely to expire unused.
For the year ended July 31, 2016, $213,699 expired unused.
Management of the Fund has concluded that there are no significant uncertain tax positions in the Fund that would require recognition in the financial statements. However, management's conclusion may be subject to review and adjustment at a later date based on factors including, but not limited to, new tax laws, regulations,
and administrative interpretations (including relevant court decisions). Generally, the Fund's federal tax returns for the prior three fiscal years remain subject to examination by the Internal Revenue Service.
Note 5. Portfolio Information
The cost of purchases and proceeds from sales of securities, excluding short-term investments and derivatives, if any, aggregated to $1,125,990,954 and $1,153,364,311, respectively, for the year ended July 31, 2016, of which $211,555,497 and $202,040,004, respectively, were U.S. government securities. The amount of purchase and sale activity impacts the portfolio turnover rate reported in the Financial Highlights.
Note 6. Affiliated Money Market Fund
The Fund invests in Columbia Short-Term Cash Fund, an affiliated money market fund established for the exclusive use by the Fund and other affiliated funds. The income earned by the Fund from such investments is included as Dividends — affiliated issuers in the Statement of Operations. As an investing fund, the Fund indirectly bears its proportionate share of the expenses of Columbia Short-Term Cash Fund.
Note 7. Line of Credit
The Fund has access to a revolving credit facility whereby the Fund may borrow for the temporary funding of shareholder redemptions or for other temporary or emergency purposes. Effective December 8, 2015, Citibank, N.A. and HSBC Bank USA, N.A. joined JPMorgan Chase Bank, N.A. (JPMorgan) as lead of a syndicate of banks under the credit facility, which is a collective agreement between the Fund and certain other funds managed by the Investment Manager, severally and not jointly, that permits collective borrowings up to $1 billion. Interest is charged to each participating fund based on its borrowings at a rate equal to the higher of (i) the overnight federal funds rate plus 1.00% or (ii) the one-month LIBOR rate plus 1.00%. Each borrowing under the credit facility matures no later than 60 days after the date of borrowing. The Fund also pays a commitment fee equal to its pro rata share of the amount of the credit facility at a rate of 0.15% per annum. The commitment fee is included in other expenses in the Statement of Operations. Prior to December 8, 2015, JPMorgan was the sole lead bank under the credit facility agreement that permitted borrowings up to $550 million under the same terms and interest rates as described above with
Annual Report 2016
24
CMG ULTRA SHORT TERM BOND FUND
NOTES TO FINANCIAL STATEMENTS (continued)
July 31, 2016
the exception of the commitment fee which was charged at a rate of 0.075% per annum.
The Fund had no borrowings during the year ended July 31, 2016.
Note 8. Significant Risks
Shareholder Concentration Risk
At July 31, 2016, one unaffiliated shareholder of record owned 92.2% of the outstanding shares of the Fund in one or more accounts. The Fund has no knowledge about whether any portion of those shares was owned beneficially. Subscription and redemption activity by concentrated accounts may have a significant effect on the operations of the Fund. In the case of a large redemption, the Fund may be forced to sell investments at inopportune times, including its liquid or more liquid positions, resulting in Fund losses and the Fund holding a higher percentage of less liquid or illiquid securities. Large redemptions could result in decreased economies of scale and increased operating expenses for non-redeeming Fund shareholders.
Credit Risk
Credit risk is the risk that the value of debt securities in the Fund's portfolio may decline because the issuer may default and fail to pay interest or repay principal when due. Rating agencies assign credit ratings to debt securities to indicate their credit risk. Lower rated or unrated debt securities held by the Fund may present increased credit risk as compared to higher-rated debt securities.
Interest Rate Risk
Interest rate risk is the risk of losses attributable to changes in interest rates. In general, if prevailing interest rates rise, the values of debt securities tend to fall, and if interest rates fall, the values of debt securities tend to rise. Actions by governments and central banking authorities can result in increases in interest rates. Increasing interest rates may negatively affect the value of debt securities held by the Fund, resulting in a negative impact on the Fund's performance and net asset value per share. In general, the longer the maturity or duration of a debt security, the greater its sensitivity to changes in interest rates.
Liquidity Risk
Liquidity risk is the risk associated with a lack of marketability of investments which may make it difficult to sell the investment at a desirable time or price.
Changing regulatory, market or other conditions or environments (for example, the interest rate or credit environments) may adversely affect the liquidity of the Fund's investments. The Fund may have to accept a lower selling price for the holding, sell other investments, or forego another, more appealing investment opportunity. Generally, the less liquid the market at the time the Fund sells a portfolio investment, the greater the risk of loss or decline of value to the Fund. A less liquid market can lead to an increase in Fund redemptions, which may negatively impact Fund performance and net asset value per share, including, for example, if the Fund is forced to sell securities in a down market.
Mortgage- and Other Asset-Backed Securities Risk
The value of any mortgage-backed and other asset-backed securities held by the Fund may be affected by, among other things, changes or perceived changes in: interest rates; factors concerning the interests in and structure of the issuer or the originator of the mortgages or other assets; the creditworthiness of the entities that provide any supporting letters of credit, surety bonds or other credit enhancements; or the market's assessment of the quality of underlying assets. Payment of principal and interest on some mortgage-backed securities (but not the market value of the securities themselves) may be guaranteed by the full faith and credit of a particular U.S. Government agency, authority, enterprise or instrumentality, and some, but not all, are also insured or guaranteed by the U.S. Government. Mortgage-backed securities issued by non-governmental issuers (such as commercial banks, savings and loan institutions, private mortgage insurance companies, mortgage bankers and other secondary market issuers) may entail greater risk than obligations guaranteed by the U.S. Government. Mortgage- and other asset-backed securities are subject to prepayment risk, which is the possibility that the underlying mortgage or other asset may be refinanced or prepaid prior to maturity during periods of declining or low interest rates, causing the Fund to have to reinvest the money received in securities that have lower yields. Rising or high interest rates tend to extend the duration of mortgage- and other asset-backed securities, making their prices more volatile and more sensitive to changes in interest rates.
Note 9. Subsequent Events
Management has evaluated the events and transactions that have occurred through the date the financial statements were issued and noted no items requiring
Annual Report 2016
25
CMG ULTRA SHORT TERM BOND FUND
NOTES TO FINANCIAL STATEMENTS (continued)
July 31, 2016
adjustment of the financial statements or additional disclosure.
Note 10. Information Regarding Pending and Settled Legal Proceedings
Ameriprise Financial and certain of its affiliates have historically been involved in a number of legal, arbitration and regulatory proceedings, including routine litigation, class actions, and governmental actions, concerning matters arising in connection with the conduct of their business activities. Ameriprise Financial believes that the Funds are not currently the subject of, and that neither Ameriprise Financial nor any of its affiliates are the subject of, any pending legal, arbitration or regulatory proceedings that are likely to have a material adverse effect on the Funds or the ability of Ameriprise Financial or its affiliates to perform under their contracts with the Funds. Ameriprise Financial is required to make quarterly (10-Q), annual (10-K) and, as necessary, 8-K filings with the Securities and Exchange Commission (SEC) on legal and regulatory matters that relate to Ameriprise Financial and its affiliates. Copies of these filings may be obtained by accessing the SEC website at www.sec.gov.
There can be no assurance that these matters, or the adverse publicity associated with them, will not result in increased fund redemptions, reduced sale of fund shares or other adverse consequences to the Funds. Further, although we believe proceedings are not likely to have a material adverse effect on the Funds or the ability of Ameriprise Financial or its affiliates to perform under their contracts with the Funds, these proceedings are subject to uncertainties and, as such, we are unable to estimate the possible loss or range of loss that may result. An adverse outcome in one or more of these proceedings could result in adverse judgments, settlements, fines, penalties or other relief that could have a material adverse effect on the consolidated financial condition or results of operations of Ameriprise Financial.
Annual Report 2016
26
CMG ULTRA SHORT TERM BOND FUND
REPORT OF INDEPENDENT REGISTERED PUBLIC ACCOUNTING FIRM
To the Trustees of Columbia Funds Series Trust I and the Shareholders of
CMG Ultra Short Term Bond Fund
In our opinion, the accompanying statement of assets and liabilities, including the portfolio of investments, and the related statements of operations and of changes in net assets and the financial highlights present fairly, in all material respects, the financial position of CMG Ultra Short Term Bond Fund (the "Fund", a series of Columbia Funds Series Trust I) at July 31, 2016, and the results of its operations, the changes in its net assets and the financial highlights for each of the periods indicated, in conformity with accounting principles generally accepted in the United States of America. These financial statements and financial highlights (hereafter referred to as "financial statements") are the responsibility of the Fund's management. Our responsibility is to express an opinion on these financial statements based on our audits. We conducted our audits of these financial statements in accordance with the standards of the Public Company Accounting Oversight Board (United States). Those standards require that we plan and perform the audit to obtain reasonable assurance about whether the financial statements are free of material misstatement. An audit includes examining, on a test basis, evidence supporting the amounts and disclosures in the financial statements, assessing the accounting principles used and significant estimates made by management, and evaluating the overall financial statement presentation. We believe that our audits, which included confirmation of securities at July 31, 2016 by correspondence with the custodian, brokers and transfer agent, and the application of alternative auditing procedures where such confirmations had not been received, provide a reasonable basis for our opinion.
PricewaterhouseCoopers LLP
Minneapolis, MN
September 21, 2016
Annual Report 2016
27
CMG ULTRA SHORT TERM BOND FUND
Shareholders elect the Board that oversees the Fund's operations. The Board appoints officers who are responsible for day-to-day business decisions based on policies set by the Board. The following table provides basic biographical information about the Fund's Trustees, including their principal occupations during the past five years, although specific titles for individuals may have varied over the period. The year set forth beneath Length of Service in the table below is the year in which the Trustee was first appointed or elected as Trustee to any Fund currently in the Columbia Funds Complex or a predecessor thereof. Under current Board policy, members serve terms of indefinite duration.
Trustees
Independent Trustees
Name,
Address,
Year of Birth | | Position Held With
the Trust and Length of
Service | | Principal Occupation(s)
During the Past Five Years
and Other Relevant
Professional Experience | | Number of
Funds in the
Columbia Funds
Complex
Overseen | | Other Directorships
Held by Trustee During
the Past Five Years | |
Janet Langford Carrig
c/o Columbia
Management Investment Advisers, LLC,
225 Franklin Street
Mail Drop BX32 05228,
Boston, MA 02110
1957 | | Trustee 1996 | | Senior Vice President, General Counsel and Corporate Secretary, ConocoPhillips (integrated energy company) since September 2007 | | | 56 | | | None | |
Douglas A. Hacker
c/o Columbia Management Investment Advisers, LLC,
225 Franklin Street
Mail Drop BX32 05228,
Boston, MA 02110
1955 | | Trustee and Chairman of the Board 1996 | | Independent business executive since May 2006; Executive Vice President — Strategy of United Airlines from December 2002 to May 2006; President of UAL Loyalty Services (airline marketing company) from September 2001 to December 2002; Executive Vice President and Chief Financial Officer of United Airlines from July 1999 to September 2001 | | | 56 | | | Spartan Nash Company (food distributor); Nash Finch Company (food distributor) from 2005 to 2013; Aircastle Limited (aircraft leasing); SeaCube Container Leasing Ltd. (container leasing) from 2010 to 2013; and Travelport Worldwide Limited (travel information technology) | |
Nancy T. Lukitsh
c/o Columbia Management Investment Advisers, LLC,
225 Franklin Street
Mail Drop BX32 05228,
Boston, MA 02110
1956 | | Trustee 2011 | | Senior Vice President, Partner and Director of Marketing, Wellington Management Company, LLP (investment adviser) from 1997 to 2010; Chair, Wellington Management Portfolios (commingled non-U.S. investment pools) from 2007 to 2010; Director, Wellington Trust Company, NA and other Wellington affiliates from 1997 to 2010 | | | 56 | | | None | |
Annual Report 2016
28
CMG ULTRA SHORT TERM BOND FUND
TRUSTEES AND OFFICERS (continued)
Independent Trustees (continued)
Name,
Address,
Year of Birth | | Position Held With
the Trust and Length of
Service | | Principal Occupation(s)
During the Past Five Years
and Other Relevant
Professional Experience | | Number of
Funds in the
Columbia Funds
Complex
Overseen | | Other Directorships
Held by Trustee During
the Past Five Years | |
William E. Mayer
c/o Columbia Management Investment Advisers, LLC,
225 Franklin Street
Mail Drop BX32 05228,
Boston, MA 02110
1940 | | Trustee 1991 | | Partner, Park Avenue Equity Partners (private equity) since February 1999 | | | 56 | | | DynaVox Inc. (speech creation); Lee Enterprises (print media); WR Hambrecht + Co. (financial service provider) from 2000 to 2012; BlackRock Capital Investment Corporation (investment company); and Premier, Inc. (healthcare) | |
David M. Moffett
c/o Columbia Management Investment Advisers, LLC,
225 Franklin Street
Mail Drop BX32 05228,
Boston, MA 02110
1952 | | Trustee 2011 | | Retired. Consultant to Bridgewater and Associates | | | 56 | | | Director of CIT Bank, CIT Group Inc. (commercial and consumer finance); eBay Inc. (online trading community); Genworth Financial, Inc. (financial and insurance products and services); Paypal Holdings Inc. (payment and data processing services); and Trustee University of Oklahoma Foundation | |
Charles R. Nelson
c/o Columbia Management Investment Advisers, LLC,
225 Franklin Street
Mail Drop BX32 05228,
Boston, MA 02110
1942 | | Trustee 1981 | | Retired. Professor Emeritus, University of Washington since 2011; Professor of Economics, University of Washington from 1976 to 2011; Ford and Louisa Van Voorhis Professor of Political Economy, University of Washington from 1993 to 2011; Adjunct Professor of Statistics, University of Washington from 1980 to 2011; Associate Editor, Journal of Money, Credit and Banking from September 1993 to 2008; consultant on econometric and statistical matters | | | 56 | | | None | |
John J. Neuhauser
c/o Columbia Management Investment Advisers, LLC,
225 Franklin Street
Mail Drop BX32 05228,
Boston, MA 02110
1943 | | Trustee 1984 | | President, Saint Michael's College since August 2007; Director or Trustee of several non-profit organizations, including University of Vermont Medical Center; Academic Vice President and Dean of Faculties, Boston College from August 1999 to October 2005; University Professor, Boston College from November 2005 to August 2007 | | | 56 | | | Liberty All-Star Equity Fund and Liberty All-Star Growth Fund (closed-end funds) | |
Annual Report 2016
29
CMG ULTRA SHORT TERM BOND FUND
TRUSTEES AND OFFICERS (continued)
Independent Trustees (continued)
Name,
Address,
Year of Birth | | Position Held With
the Trust and Length of
Service | | Principal Occupation(s)
During the Past Five Years
and Other Relevant
Professional Experience | | Number of
Funds in the
Columbia Funds
Complex
Overseen | | Other Directorships
Held by Trustee During
the Past Five Years | |
Patrick J. Simpson
c/o Columbia Management Investment Advisers, LLC,
225 Franklin Street
Mail Drop BX32 05228,
Boston, MA 02110
1944 | | Trustee 2000 | | Of Counsel, Perkins Coie LLP (law firm) since 2015; Partner, Perkins Coie LLP from 1988 to 2014 | | | 56 | | | None | |
Anne-Lee Verville
c/o Columbia Management Investment Advisers, LLC,
225 Franklin Street
Mail Drop BX32 05228,
Boston, MA 02110
1945 | | Trustee 1998 | | Retired. General Manager, Global Education Industry from 1994 to 1997, President — Application Systems Division from 1991 to 1994, Chief Financial Officer — US Marketing & Services from 1988 to 1991, and Chief Information Officer from 1987 to 1988, IBM Corporation (computer and technology) | | | 56 | | | Enesco Group, Inc. (producer of giftware and home and garden decor products) from 2001 to 2006 | |
Consultant to the Trustees*
Name,
Address,
Year of Birth | | Position Held With
the Trust and Length of
Service | | Principal Occupation(s)
During the Past Five Years
and Other Relevant
Professional Experience | | Number of
Funds in the
Columbia Funds
Complex
Overseen | | Other Directorships
Held by Trustee During
the Past Five Years | |
J. Kevin Connaughton
c/o Columbia
Management Investment Advisers, LLC,
225 Franklin Street
Mail Drop BX32 05228,
Boston, MA 02110
1964 | | Trustee Consultant 2016 | | Trustee Consultant, Columbia Funds since March 2016; Managing Director and General Manager of Mutual Fund Products, Columbia Management Investment Advisers, LLC from May 2010 to February 2015; President, Columbia Funds from 2009 to 2015; and senior officer of Columbia Funds and affiliated funds from 2003 to 2015 | | | 56 | | | Board of Governors, Gateway Healthcare since January 2016; Trustee, New Century Portfolios since March 2015; and Director, The Autism Project since March 2015 | |
* J. Kevin Connaughton was appointed consultant to the Trustees effective March 1, 2016. Shareholders of the Funds are expected to be asked to elect Mr. Connaughton as a Trustee at a future shareholder meeting.
Annual Report 2016
30
CMG ULTRA SHORT TERM BOND FUND
TRUSTEES AND OFFICERS (continued)
Interested Trustee Affiliated with Investment Manager*
Name,
Address,
Year of Birth | | Position Held With
the Trust and Length of
Service | | Principal Occupation(s)
During the Past Five Years
and Other Relevant
Professional Experience | | Number of
Funds in the
Columbia Funds
Complex
Overseen | | Other Directorships
Held by Trustee During
the Past Five Years | |
William F. Truscott
c/o Columbia Management Investment Advisers, LLC,
225 Franklin Street
Boston, MA 02110
1960 | | Trustee 2012 | | Chairman of the Board and President, Columbia Management Investment Advisers, LLC since May 2010 and February 2012, respectively; Chief Executive Officer, Global Asset Management, Ameriprise Financial, Inc. since September 2012 (previously Chief Executive Officer, U.S. Asset Management & President, Annuities, May 2010- September 2012); Director and Chief Executive Officer, Columbia Management Investment Distributors, Inc. since May 2010 and February 2012, respectively; Chairman of the Board and Chief Executive Officer, RiverSource Distributors, Inc. since 2006; Director, Threadneedle Asset Management Holdings, SARL since 2014; President and Chief Executive Officer, Ameriprise Certificate Company, 2006-August 2012. | | | 175 | | | Chairman of the Board, Columbia Management Investment Advisers, LLC since May 2010; Director, Columbia Management Investment Distributors, Inc. since May 2010; Former Director, Ameriprise Certificate Company, 2006-January 2013 | |
* Interested person (as defined under the 1940 Act) by reason of being an officer, director, security holder and/or employee of the Investment Manager or Ameriprise Financial.
The Statement of Additional Information has additional information about the Fund's Board members and is available, without charge, upon request by calling 800.345.6611; contacting your financial intermediary; or visiting investor.columbiathreadneedleus.com.
Annual Report 2016
31
CMG ULTRA SHORT TERM BOND FUND
TRUSTEES AND OFFICERS (continued)
The Board has appointed officers who are responsible for day-to-day business decisions based on policies it has established. The officers serve at the pleasure of the Board. The following table provides basic information about the Officers of the Fund, including principal occupations during the past five years, although their specific titles may have varied over the period. In addition to Mr. Truscott, who is Senior Vice President, the Fund's other officers are:
Fund Officers
Name,
Address and
Year of Birth | | Position and Year
First Appointed to
Position for any Fund
in the Columbia
Funds Complex or a
Predecessor Thereof | |
Principal Occupation(s) During Past Five Years | |
Christopher O. Petersen
5228 Ameriprise Financial Center
Minneapolis, MN 55474
Born 1970 | | President and Principal Executive Officer (2015) | | Vice President and Lead Chief Counsel, Ameriprise Financial, Inc. since January 2015 (previously, Vice President and Chief Counsel January 2010-December 2014; officer of Columbia Funds and affiliated funds since 2007. | |
Michael G. Clarke
225 Franklin Street
Boston, MA 02110
Born 1969 | | Treasurer (2011), Chief Financial Officer (2009) and Chief Accounting Officer (2015) | | Vice President — Mutual Fund Administration, Columbia Management Investment Advisers, LLC, since May 2010; senior officer of Columbia Funds and affiliated funds since 2002. | |
Paul B. Goucher
100 Park Avenue
New York, NY 10017
Born 1968 | | Senior Vice President (2011), Chief Legal Officer (2015) and Assistant Secretary (2008) | | Vice President and Lead Chief Counsel, Ameriprise Financial, Inc. since November 2008 and January 2013, respectively (previously Chief Counsel, January 2010-January 2013); Vice President, Chief Legal Officer and Assistant Secretary, Columbia Management Investment Advisers, LLC since May 2010. | |
Thomas P. McGuire
225 Franklin Street
Boston, MA 02110
Born 1972 | | Senior Vice President and Chief Compliance Officer (2012) | | Vice President — Asset Management Compliance, Ameriprise Financial, Inc., since May 2010; Chief Compliance Officer, Ameriprise Certificate Company since September 2010. | |
Colin Moore
225 Franklin Street
Boston, MA 02110
Born 1958 | | Senior Vice President (2010) | | Executive Vice President and Global Chief Investment Officer, Ameriprise Financial, Inc., since July 2013; Executive Vice President and Global Chief Investment Officer, Columbia Management Investment Advisers, LLC since July 2013 (previously Director and Global Chief Investment Officer, 2010-2013). | |
Michael E. DeFao
225 Franklin Street
Boston, MA 02110
Born 1968 | | Vice President (2011) and Assistant Secretary (2010) | | Vice President and Chief Counsel, Ameriprise Financial, Inc. since May 2010. | |
Amy Johnson
5228 Ameriprise Financial Center
Minneapolis, MN 55474
Born 1965 | | Vice President (2006) | | Managing Director and Global Head of Operations, Columbia Management Investment Advisers, LLC since April 2016 (previously Managing Director and Chief Operating Officer, 2010-2016). | |
Lyn Kephart-Strong
5228 Ameriprise
Financial Center
Minneapolis, MN 55474
Born 1960 | | Vice President (2015) | | President, Columbia Management Investment Services Corp. since October 2014; Vice President & Resolution Officer, Ameriprise Trust Company since August 2009. | |
Ryan C. Larrenaga
225 Franklin Street
Boston, MA 02110
Born 1970 | | Vice President and Secretary (2015) | | Vice President and Group Counsel, Ameriprise Financial, Inc. since August 2011 (previously, Counsel from May 2010 to August 2011); officer of Columbia Funds and affiliated funds since 2005. | |
Annual Report 2016
32
CMG ULTRA SHORT TERM BOND FUND
BOARD CONSIDERATION AND APPROVAL OF MANAGEMENT AGREEMENT
On June 10, 2016, the Board of Trustees (the Board) and the Trustees who are not interested persons (as defined in the Investment Company Act of 1940) (the Independent Trustees) of Columbia Funds Series Trust I (the Trust) unanimously approved the continuation of the Management Agreement (the Management Agreement) with Columbia Management Investment Advisers, LLC (the Investment Manager) with respect to CMG Ultra Short Term Bond Fund (the Fund), a series of the Trust. As detailed below, the Board's Advisory Fees and Expenses Committee (the Committee) and the Board met on multiple occasions to review and discuss, both among themselves and with the management team of the Investment Manager, materials provided by the Investment Manager and others before determining to approve the continuation of the Management Agreement.
In connection with their deliberations regarding the continuation of the Management Agreement, the Committee and the Board evaluated materials requested from the Investment Manager regarding the Fund and the Management Agreement, and discussed these materials with representatives of the Investment Manager at Committee meetings held on March 8, 2016, April 27, 2016 and June 9, 2016 and at Board meetings held on March 9, 2016 and June 10, 2016. In addition, the Board considers matters bearing on the Management Agreement at most of its other meetings throughout the year and meets regularly with senior management of the Trust and the Investment Manager. Through the Board's Investment Oversight Committees, Trustees also meet with selected portfolio managers of the funds the Trustees oversee and other investment personnel at various times throughout the year. The Committee and the Board also consulted with its independent fee consultant, Fund counsel and with the Independent Trustees' independent legal counsel, who advised on various matters with respect to the Committee's and the Board's considerations and otherwise assisted the Committee and the Board in their deliberations. On June 9, 2016, the Committee recommended that the Board approve the continuation of the Management Agreement. On June 10, 2016, the Board, including the Independent Trustees, voting separately, unanimously approved the continuation of the Management Agreement for the Fund.
The Committee and the Board considered all information that they, their legal counsel or the Investment Manager believed reasonably necessary to evaluate and to determine whether to approve the continuation of the Management Agreement. The information and factors considered by the Committee and the Board in recommending for approval or approving the continuation of the Management Agreement for the Fund included the following:
• Information on the investment performance of the Fund relative to the performance of a group of mutual funds determined to be comparable to the Fund by an independent third-party data provider, as well as performance relative to benchmarks;
• Information on the Fund's management fees and total expenses, including information comparing the Fund's expenses to those of a group of comparable mutual funds, as determined by the independent third-party data provider;
• The Investment Manager's agreement to contractually limit or cap total operating expenses for the Fund through November 30, 2017 so that total operating expenses (excluding certain fees and expenses, such as transaction costs and certain other investment related expenses, interest, taxes, acquired fund fees and expenses, and infrequent and/or unusual expenses) would not exceed a specified annual rate, as a percentage of the Fund's net assets;
• The terms and conditions of the Management Agreement;
• The current and proposed terms and conditions of other agreements and arrangements with affiliates of the Investment Manager relating to the operations of the Fund, including agreements with respect to the provision of distribution and transfer agency services to the Fund;
• Descriptions of various functions performed by the Investment Manager under the Management Agreement, including portfolio management and portfolio trading practices;
• Information regarding the management fees of similarly-managed portfolios of other clients of the Investment Manager, including institutional separate accounts;
Annual Report 2016
33
CMG ULTRA SHORT TERM BOND FUND
BOARD CONSIDERATION AND APPROVAL OF MANAGEMENT AGREEMENT (continued)
• Information regarding the reputation, regulatory history and resources of the Investment Manager, including information regarding senior management, portfolio managers and other personnel;
• Information regarding the capabilities of the Investment Manager with respect to compliance monitoring services, including an assessment of the Investment Manager's compliance system by the Fund's Chief Compliance Officer; and
• The profitability to the Investment Manager and its affiliates from their relationships with the Fund.
Nature, Extent and Quality of Services Provided under the Management Agreement
The Committee and the Board considered the nature, extent and quality of services provided to the Fund by the Investment Manager and its affiliates under the Management Agreement and under separate agreements for the provision of transfer agency services, and the resources dedicated to the Fund and the other Columbia Funds by the Investment Manager and its affiliates. The Committee and the Board considered, among other things, the Investment Manager's ability to attract, motivate and retain highly qualified research, advisory and supervisory investment professionals (including personnel and other resources, compensation programs for personnel involved in fund management, reputation and other attributes), the portfolio management services provided by those investment professionals, and the quality of the Investment Manager's investment research capabilities and trade execution services. The Committee and the Board also considered the potential benefits to shareholders of investing in a mutual fund that is part of a fund complex offering exposure to a variety of asset classes and investment disciplines and providing a variety of fund and shareholder services.
The Committee and the Board also considered the professional experience and qualifications of the senior personnel of the Investment Manager, which included consideration of the Investment Manager's experience with similarly-structured funds. The Committee and the Board noted the compliance programs of and the compliance-related resources provided to the Fund by the Investment Manager and its affiliates, and considered the Investment Manager's ability to provide administrative services to the Fund and coordinate the activities of the Fund's other service providers. After reviewing these and related factors, the Committee and the Board concluded, within the context of their overall conclusions, that the nature, extent and quality of the services provided to the Fund under the Management Agreement supported the continuation of the Management Agreement.
Investment Performance
The Committee and the Board reviewed information about the performance of the Fund over various time periods, including performance information relative to benchmarks and information based on reports of the independent third-party data provider that compared the performance of the Fund to the performance of a group of comparable mutual funds, and data provided by the independent fee consultant. The Committee and the Board also reviewed a description of the third party's methodology for identifying the Fund's peer groups for purposes of performance and expense comparisons. Although the Fund's performance lagged that of a relevant peer group for certain (although not necessarily all) periods, the Committee and the Board concluded that other factors relevant to performance were sufficient, in light of other considerations, to warrant continuation of the Management Agreement. Those factors included one or more of the following: (i) that the Fund's performance, although lagging in certain recent periods, was stronger over the longer term; (ii) that the underperformance was attributable, to a significant extent, to investment decisions that were reasonable and consistent with the Fund's investment strategy and policies and that the Fund was performing within a reasonable range of expectations, given those investment decisions, market conditions and the Fund's investment strategy; (iii) that the Fund's performance was competitive when compared to other relevant performance benchmarks or peer groups; and (iv) that the Investment Manager had taken or was taking steps designed to help improve the Fund's investment performance, including, but not limited to, replacing portfolio managers, enhancing the resources supporting the portfolio managers, or modifying investment strategies.
The Committee and the Board noted that, through December 31, 2015, the Fund's performance was in the fifty-sixth, sixty-first and sixtieth percentile (where the best performance would be in the first percentile) of its category
Annual Report 2016
34
CMG ULTRA SHORT TERM BOND FUND
BOARD CONSIDERATION AND APPROVAL OF MANAGEMENT AGREEMENT (continued)
selected by the independent third-party data provider for the purposes of performance comparisons for the one-, three- and five-year periods, respectively.
The Committee and the Board also considered the Investment Manager's performance and reputation generally, the Investment Manager's historical responsiveness to Board concerns about performance, and the Investment Manager's willingness to take steps intended to improve performance. After reviewing these and related factors, the Committee and the Board concluded, within the context of their overall conclusions, that the performance of the Fund and the Investment Manager was sufficient, in light of other considerations, to warrant the continuation of the Management Agreement.
Investment Management Fee Rates and Other Expenses
The Committee and the Board considered the management fees charged to the Fund under the Management Agreement as well as the total expenses incurred by the Fund. In assessing the reasonableness of the fees under the Management Agreement, the Committee and the Board considered, among other information, the Fund's management fee and its total expense ratio as a percentage of average daily net assets. The Committee and the Board considered data provided by the independent fee consultant. The Committee and the Board noted that, as of December 31, 2015, the Fund's actual management fee and net total expense ratio are ranked in the third and first quintiles, respectively, (where the lowest fees and expenses would be in the first quintile) against the Fund's expense universe as determined by the independent third-party data provider for purposes of expense comparison. The Committee and the Board also took into account the fee waiver and expense limitation arrangements agreed to by the Investment Manager, as noted above.
The Committee and the Board also received and considered information about the management fees charged by the Investment Manager to institutional separate accounts. In considering the fees charged to those accounts, the Committee and the Board took into account, among other things, the Investment Manager's representations about the differences between managing mutual funds as compared to other types of accounts, including differences in the services provided, differences in the risk profile of such business for the Investment Manager and the additional resources required to manage mutual funds effectively. The Committee and the Board also received and considered information about the fees charged by the Investment Manager for sub-advisory services provided to comparable unaffiliated funds. In evaluating the Fund's management fees, the Committee and the Board also took into account the demands, complexity and quality of the investment management of the Fund.
After reviewing these and related factors, the Committee and the Board concluded, within the context of their overall conclusions, that the management fee rates and expenses of the Fund were sufficient, in light of other considerations, to warrant the continuation of the Management Agreement.
Costs of Services Provided and Profitability
The Committee and the Board also took note of the costs the Investment Manager and its affiliates incur in connection with the services provided (both on an absolute and relative basis) and the profitability to the Investment Manager and its affiliates in connection with their relationships with the Fund.
The Committee and the Board also considered the compensation directly or indirectly received by the Investment Manager's affiliates in connection with their relationships with the Fund. The Committee and the Board reviewed information provided by management as to the profitability to the Investment Manager and its affiliates of their relationships with the Fund, information about the allocation of expenses used to calculate profitability, and comparisons of profitability levels realized in 2015 to profitability levels realized in 2014. When reviewing profitability, the Committee and the Board also considered court cases in which adviser profitability was an issue in whole or in part, the performance of similarly managed funds, the performance of the Fund, and the expense ratio of the Fund. In addition, the Committee and the Board considered information provided by the Investment Manager regarding the Investment Manager's financial condition and comparing its profitability to that of other asset management firms that are, or are subsidiaries of, publicly traded companies. In this regard, the Committee and the Board also considered data provided by the independent fee consultant.
Annual Report 2016
35
CMG ULTRA SHORT TERM BOND FUND
BOARD CONSIDERATION AND APPROVAL OF MANAGEMENT AGREEMENT (continued)
After reviewing these and related factors, the Committee and the Board concluded, within the context of their overall conclusions, that the costs of services provided and the profitability to the Investment Manager and its affiliates from their relationships with the Fund supported the continuation of the Management Agreement.
Economies of Scale
The Committee and the Board considered the potential existence of economies of scale in the provision by the Investment Manager of services to the Fund, to groups of related funds, and to the Investment Manager's investment advisory clients as a whole, and whether those economies of scale were shared with the Fund through breakpoints in investment management fees or other means, such as expense limitation arrangements and additional investments by the Investment Manager in investment, trading and compliance resources.
In considering these matters, the Committee and the Board also considered the costs of the services provided and the profitability to the Investment Manager and its affiliates from their relationships with the Fund, as discussed above. After reviewing these and related factors, the Committee and the Board concluded, within the context of their overall conclusions, that the extent to which any economies of scale were expected to be shared with the Fund supported the continuation of the Management Agreement.
Other Benefits to the Investment Manager
The Committee and the Board received and considered information regarding "fall-out" or ancillary benefits received by the Investment Manager and its affiliates as a result of their relationships with the Fund, such as the engagement of the Investment Manager's affiliates to provide distribution and transfer agency services to the Fund. In this regard, among other matters, the Committee and the Board considered that the Fund's distributor retains a portion of the distribution fees from the Fund and receives a portion of the sales charges on sales or redemptions of certain classes of shares of the Fund. The Committee and the Board also considered the benefits of research made available to the Investment Manager by reason of brokerage commissions generated by the Fund's securities transactions, and reviewed information about the Investment Manager's practices with respect to allocating portfolio transactions for brokerage and research services. The Committee and the Board considered the possible conflicts of interest associated with certain fall-out or other ancillary benefits and the reporting, disclosure and other processes that are in place to address such possible conflicts of interest. The Committee and the Board recognized that the Investment Manager's profitability would be somewhat lower without these benefits.
Conclusion
The Committee and the Board reviewed all of the above considerations in reaching their decisions to recommend or approve the continuation of the Management Agreement. In their deliberations, the Trustees did not identify any particular information that was all-important or controlling, and individual Trustees may have attributed different weights to the various factors. Based on their evaluation of all factors that they deemed to be material, including those factors described above, and assisted by the advice of independent legal counsel, the Board, including the Independent Trustees, voting separately, unanimously approved the continuation of the Management Agreement.
Annual Report 2016
36
CMG ULTRA SHORT TERM BOND FUND
IMPORTANT INFORMATION ABOUT THIS REPORT
Each fund mails one shareholder report to each shareholder address. If you would like more than one report, please call shareholder services at 800.345.6611 and additional reports will be sent to you.
The policy of the Board is to vote the proxies of the companies in which each fund holds investments consistent with the procedures as stated in the Statement of Additional Information (SAI). You may obtain a copy of the SAI without charge by calling 800.345.6611; contacting your financial intermediary; visiting investor.columbiathreadneedleus.com; or searching the website of the Securities and Exchange Commission (SEC) at sec.gov. Information regarding how each fund voted proxies relating to portfolio securities is filed with the SEC by August 31st for the most recent 12-month period ending June 30th of that year, and is available without charge by visiting investor.columbiathreadneedleus.com, or searching the website of the SEC at sec.gov.
Each fund files a complete schedule of portfolio holdings with the SEC for the first and third quarters of each fiscal year on Form N-Q. Each fund's Form N-Q is available on the SEC's website at sec.gov and may be reviewed and copied at the SEC's Public Reference Room in Washington, D.C. Information on the operation of the Public Reference Room may be obtained by calling 800.SEC.0330. Each fund's complete schedule of portfolio holdings, as filed on Form N-Q, can also be obtained without charge, upon request, by calling 800.345.6611.
Annual Report 2016
37
CMG Ultra Short Term Bond Fund
P.O. Box 8081
Boston, MA 02266-8081

This information is for use with concurrent or prior delivery of a fund prospectus. Please read and consider the investment objectives, risks, charges and expenses for any fund carefully before investing. For a prospectus and summary prospectus, which contains this and other important information about the Fund, go to columbiathreadneedleus.com/institutional. The Fund is distributed by Columbia Management Investment Distributors, Inc., member FINRA, and managed by Columbia Management Investment Advisers, LLC.
Columbia Threadneedle Investments (Columbia Threadneedle) is the global brand name of the Columbia and Threadneedle group of companies.
All rights reserved. Columbia Management Investment Distributors, Inc., 225 Franklin Street, Boston, MA 02110-2804
© 2016 Columbia Management Investment Advisers, LLC.
columbiathreadneedleus.com/institutional
ANN103_07_F01_(09/16)

ANNUAL REPORT
July 31, 2016

COLUMBIA U.S. SOCIAL BOND FUND

ABOUT COLUMBIA THREADNEEDLE INVESTMENTS
Columbia Threadneedle Investments is a leading global asset management group that provides a broad range of investment strategies and solutions for individual, institutional and corporate clients around the world.
With more than 2,000 people, including over 450 investment professionals based in North America, Europe and Asia, we manage $460 billion* of assets across developed and emerging market equities, fixed income, asset allocation solutions and alternatives. We are the 13th largest manager of long-term mutual fund assets in the U.S.** and the 4th largest manager of retail funds in the U.K.***
Our priority is the investment success of our clients. We aim to deliver the investment outcomes they expect through an investment approach that is team-based, performance-driven and risk-aware. Our culture is dynamic and interactive. By sharing our insights across asset classes and geographies, we generate richer perspectives on global, regional and local investment landscapes. The ability to exchange and debate investment ideas in a collaborative environment enriches our teams' investment processes. More importantly, it results in better informed investment decisions for our clients.
Columbia funds are distributed by Columbia Management Investment Distributors, Inc., member FINRA, and managed by Columbia Management Investment Advisers, LLC.
Columbia Threadneedle Investments (Columbia Threadneedle) is the global brand name of the Columbia and Threadneedle group of companies.
* In U.S. dollars as of June 30, 2016. Source: Ameriprise Q2 Earnings Release. Includes all assets managed by entities in the Columbia and Threadneedle group of companies. Contact us for more current data.
** Source: ICI as of June 30, 2016 for Columbia Management Investment Advisers, LLC.
*** Source: Investment Association as of March 2016 for Threadneedle Asset Management Limited.
© 2016 Columbia Management Investment Advisers, LLC. All rights reserved.
Not part of the shareholder report
 Dear Shareholders,
Volatility comes with the territory for long-term investors. Some investors instinctively want to pull out of the market or sell underperforming investments at the first sign of increased volatility or perhaps even as soon as they perceive it on the horizon. But taking yourself out of the market could mean losing out on potential opportunities, and putting your longer term investment goals at risk.
Cumulative return is not just about achieving high returns when markets are going up; it's also about remaining invested and minimizing losses during weak or volatile markets so that you can participate on the upside. Developing a deeper understanding of the various risks your portfolio is subject to can help you balance these risks.
Diversification is critical in seeking to achieve that balance. We believe that most portfolios could be more effectively diversified either by introducing holdings with performance profiles unrelated to existing holdings (like alternative products) or by rebalancing existing holdings with an eye toward risk allocation. Over time, distributing risk more evenly may produce a more pronounced diversification benefit and may improve portfolio efficiency. We believe market volatility can create significant opportunities and, in fact, these periods may be some of the very best times to invest.
With this in mind, I thought it important to highlight excerpts from a piece written by Colin Moore, Global Chief Investment Officer, in which he touches on some of these issues emphasizing the importance of a properly constructed portfolio in seeking to effectively manage volatility and to achieve consistency of returns. I encourage you to read the article in its entirety. To access the full article and for other insights on current market, please visit blog.columbiathreadneedleus.com/latest-perspectives.
You need investments that are designed to help you ease the impact of volatile market environments and keep the savings you have worked tirelessly to amass. Columbia Threadneedle Investments provides investment solutions to help you tackle financial challenges and achieve your desired outcome.
Best regards,

Christopher O. Petersen
President, Columbia Funds
Excerpts from:
Taking the scare out of the volatility bogeyman
By Colin Moore, Global Chief Investment Officer
Colin Moore is the global chief investment officer for Columbia Threadneedle Investments. His responsibilities include ensuring that a disciplined investment process is in place across all asset classes, including equity and fixed income. Mr. Moore joined one of the Columbia Threadneedle Investments legacy firms in 2002 as head of equity and was also head of fixed income and liquidity strategies from 2009 – 2010.

n In today's low growth, higher volatility world, the emphasis is shifting from maximization of returns to consistency of returns.
PRESIDENT'S MESSAGE (continued)
n Portfolios should represent the behavioral risk-return tradeoff of investors, remembering that they won't stay invested to realize the return if we get the risk tolerance wrong.
n Holding long-term savings in cash to avoid volatility (the financial equivalent of hiding under the sheets) is detrimental to achieving long-term goals.
According to Wikipedia, "The bogeyman is a common allusion to a mythical creature in many cultures used to control behavior. This monster has no specific appearance, and conceptions about it can vary drastically from household to household within the same community; in many cases he has no set appearance in the mind of an adult or child, but is simply a non-specific embodiment of terror." Different cultures have different names and physical representations for the bogeyman, and investors are no different. We have terrible monsters that we fear may destroy our portfolios, and we call one of the scariest of them volatility.
While the bogeyman is mythical (I hope!), volatility is real and can cause serious damage. To understand why investors have such a hard time coping with volatility, we first need to define three cognitive biases at work in today's investment environment:
1) Recency bias — something that has recently come to the forefront of our attention, regardless of how long established it is, suddenly seems to appear with improbable frequency.
2) Negativity bias — we tend to have a greater recall of unpleasant memories than positive memories.
3) Loss aversion — our dissatisfaction with losing money tends to be greater than our satisfaction with making money.
The level of volatility varies dramatically, and so does investor fear and panic selling — waxing when volatility rises, waning when it falls. Recent studies have pointed to demographics as an important driver of panic selling. The theory is that as people get closer to retirement, the prospects of a large (20% – 30%) loss in financial assets can have a much more pronounced effect on their sense of well-being. Wealth preservation instincts kick in much more quickly than for younger (and typically less wealthy) savers.
The reality is that there is little opportunity for return without volatility. Therefore, the bogeyman effect of holding long-term savings in cash to avoid volatility (the financial equivalent of hiding under the sheets) is detrimental to achieving long-term goals. This effect tends to be more pronounced during the episodic spikes in volatility. The significant spike in volatility in 2008 and 2009 led to significant withdrawals from long-term investment funds over the same period. Less pronounced effects can also be seen when comparing 2001 – 2003 and 2011 – 2012. Conversely, flows picked up when volatility returned to "normal" levels. Investor behavior of this type is consistent with the three behavioral biases.
I believe average volatility will be higher over the next 10 years than the last 10 years and episodic spikes will increase in frequency because sustainable economic growth will be structurally lower and geopolitical risk higher than any time since World War II. Low growth creates uncertainty while loss aversion will make investors fear that we are one economic mishap or geopolitical event away from no growth or recession. The result will be higher volatility on average. Negativity bias will tend to exacerbate "spike" reactions to event-driven geopolitical news, and the volatility bogeyman will appear more often. Assuming the behavioral biases continue, investor returns are likely to be very disappointing regardless of the total return generated by financial markets due to the bogeyman effect.
To mitigate this effect, we need to focus on portfolio construction and an improved understanding of diversification. I accept that equities are likely to offer the highest return over the next 10 years, but they also offer the highest volatility. Many portfolio construction optimization tools use historical average volatility, which is likely to underestimate the volatility investors will face. The bogeyman emerges when individual asset class volatility spikes and cross correlations rise, the combination of which increases overall portfolio volatility far beyond expectation. Diversification is meant to protect investors against volatility, but what's the point of owning lots of investments if the volatility bogeyman has not been properly estimated?
Most importantly, portfolios should be constructed to properly represent the behavioral risk-return tradeoff of investors, remembering that they won't stay invested to realize the return if we get the risk tolerance wrong. In a low growth, higher volatility world, the emphasis is shifting to return consistency rather than return maximization,
PRESIDENT'S MESSAGE (continued)
and investors are best served through investment approaches that appreciate that distinction. Even though it's a permanent feature of financial markets, volatility is less likely to be the bogeyman we all fear if portfolios are constructed with this understanding.
Please visit blog.columbiathreadneedleus.com/latest-perspectives to read the entire article.
Investors should consider the investment objectives, risks, charges and expenses of a mutual fund carefully before investing. For a free prospectus and summary prospectus, which contains this and other important information about a fund, visit investor.columbiathreadneedleus.com. The prospectus should be read carefully before investing.
The views expressed are as of April 2016, may change as market or other conditions change, and may differ from views expressed by other Columbia Management Investment Advisers, LLC (CMIA) associates or affiliates. Actual investments or investment decisions made by CMIA and its affiliates, whether for its own account or on behalf of clients, will not necessarily reflect the views expressed. This information is not intended to provide investment advice and does not account for individual investor circumstances. Investment decisions should always be made based on an investor's specific financial needs, objectives, goals, time horizon and risk tolerance. Asset classes described may not be suitable for all investors.
Past performance does not guarantee future results, and no forecast should be considered a guarantee either. Since economic and market conditions change frequently, there can be no assurance that the trends described here will continue or that the forecasts are accurate.
Diversification does not guarantee a profit or protect against loss.
Columbia Funds are distributed by Columbia Management Investment Distributors, Inc., member FINRA, and managed by Columbia Management Investment Advisers, LLC.
© 2016 Columbia Management Investment Advisers, LLC. All rights reserved.
COLUMBIA U.S. SOCIAL BOND FUND
Fund Investment Manager
Columbia Management Investment
Advisers, LLC
225 Franklin Street
Boston, MA 02110
Fund Distributor
Columbia Management Investment
Distributors, Inc.
225 Franklin Street
Boston, MA 02110
Fund Transfer Agent
Columbia Management Investment
Services Corp.
P.O. Box 8081
Boston, MA 02266-8081
For more information about any of the funds, please visit investor.columbiathreadneedleus.com or call 800.345.6611. Customer Service Representatives are available to answer your questions Monday through Friday from 8 a.m. to 7 p.m. Eastern time.
The views expressed in this report reflect the current views of the respective parties. These views are not guarantees of future performance and involve certain risks, uncertainties and assumptions that are difficult to predict, so actual outcomes and results may differ significantly from the views expressed. These views are subject to change at any time based upon economic, market or other conditions and the respective parties disclaim any responsibility to update such views. These views may not be relied on as investment advice and, because investment decisions for a Columbia fund are based on numerous factors, may not be relied on as an indication of trading intent on behalf of any particular Columbia fund. References to specific securities should not be construed as a recommendation or investment advice.
Performance Overview | | | 3 | | |
Manager Discussion of Fund Performance | | | 5 | | |
Understanding Your Fund's Expenses | | | 7 | | |
Portfolio of Investments | | | 8 | | |
Statement of Assets and Liabilities | | | 17 | | |
Statement of Operations | | | 19 | | |
Statement of Changes in Net Assets | | | 20 | | |
Financial Highlights | | | 22 | | |
Notes to Financial Statements | | | 27 | | |
Report of Independent Registered Public Accounting Firm | | | 35 | | |
Federal Income Tax Information | | | 36 | | |
Trustees and Officers | | | 37 | | |
Board Consideration and Approval of Management
Agreement and Subadvisory Agreement | | | 42 | | |
Important Information About This Report | | | 47 | | |
COLUMBIA U.S. SOCIAL BOND FUND
Performance Summary
n Columbia U.S. Social Bond Fund (the Fund) Class A shares returned 6.60% excluding sales charges, for the 12-month period that ended July 31, 2016. Class Z shares of the Fund returned 6.86% for the same time period.
n The Fund slightly underperformed its benchmark, the Barclays Municipal Bond Index, which returned 6.94% during the 12-month period.
n The Fund's performance versus its benchmark was aided by its above-benchmark duration positioning during a period when market interest rates were declining, as well as by an overweight to BBB securities as lower-quality securities generally outperformed during the period. A default by a wood pellet manufacturer and the Fund's cash position acted as constraints on relative return.
Average Annual Total Returns (%) (for period ended July 31, 2016)
| | | Inception | | 1 Year | | Life | |
Class A | | 03/26/15 | | | | | | | | | |
Excluding sales charges | | | | | | | 6.60 | | | | 4.56 | | |
Including sales charges | | | | | | | 3.37 | | | | 2.21 | | |
Class C | | 03/26/15 | | | | | | | | | |
Excluding sales charges | | | | | | | 5.80 | | | | 3.85 | | |
Including sales charges | | | | | | | 4.80 | | | | 3.85 | | |
Class R4 | | 03/26/15 | | | 6.87 | | | | 4.82 | | |
Class R5 | | 03/26/15 | | | 6.82 | | | | 4.77 | | |
Class Z | | 03/26/15 | | | 6.86 | | | | 4.82 | | |
Barclays Municipal Bond Index | | | | | | | 6.94 | | | | 4.97 | | |
Returns for Class A are shown with and without the maximum initial sales charge of 3.00%. Returns for Class C are shown with and without the applicable contingent deferred sales charge (CDSC) of 1.00% in the first year. The Fund's other classes are not subject to sales charges and have limited eligibility. Please see the Fund's prospectus for details. Performance for different share classes will vary based on differences in sales charges and fees associated with each class. All results shown assume reinvestment of distributions during the period. Returns do not reflect the deduction of taxes that a shareholder may pay on Fund distributions or on the redemption of Fund shares. Performance results reflect the effect of any fee waivers or reimbursements of Fund expenses by Columbia Management Investment Advisers, LLC and/or any of its affiliates. Absent these fee waivers or expense reimbursement arrangements, performance results would have been lower.
The performance information shown represents past performance and is not a guarantee of future results. The investment return and principal value of your investment will fluctuate so that your shares, when redeemed, may be worth more or less than their original cost. Current performance may be lower or higher than the performance information shown. You may obtain performance information current to the most recent month-end by contacting your financial intermediary, visiting investor.columbiathreadneedleus.com or calling 800.345.6611.
The Barclays Municipal Bond Index is an unmanaged index considered representative of the broad market for investment-grade, tax-exempt bonds with a maturity of at least one year. Effective August 24, 2016, the Barclays Municipal Bond Index was rebranded as the Bloomberg Barclays Municipal Bond Index.
Indices are not available for investment, are not professionally managed and do not reflect sales charges, fees, brokerage commissions, taxes or other expenses of investing. Securities in the Fund may not match those in an index.
Annual Report 2016
3
COLUMBIA U.S. SOCIAL BOND FUND
PERFORMANCE OVERVIEW (continued)
Performance of a Hypothetical $10,000 Investment (March 26, 2015 – July 31, 2016)
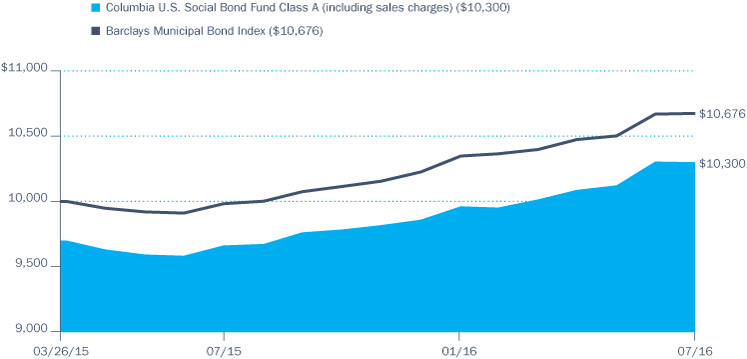
The chart above shows the change in value of a hypothetical $10,000 investment in Class A shares of Columbia U.S. Social Bond Fund during the stated time period, and does not reflect the deduction of taxes that a shareholder may pay on Fund distributions or on the redemption of Fund shares.
Annual Report 2016
4
COLUMBIA U.S. SOCIAL BOND FUND
MANAGER DISCUSSION OF FUND PERFORMANCE
The Fund's Class A shares returned 6.60% excluding sales charges during the 12-month period that ended July 31, 2016. Class Z shares of the Fund returned 6.86% for the same time period. The Fund slightly underperformed its benchmark, the Barclays Municipal Bond Index, which returned 6.94% during the same time period. A default by a wood pellet manufacturer and the Fund's cash position acted as constraints on relative return.
Market Overview
The U.S. municipal bond market produced a gain during the past year. The combination of low-single-digit economic growth and investor confidence in the U.S. Federal Reserve's ability to maintain its low-rate policy led to a meaningful decline in yields (and a corresponding rise in prices). Municipal bonds outperformed U.S. Treasuries, thanks in part to a highly favorable balance of supply and demand in the market. Mutual fund cash flows provided a steady source of demand, with positive inflows for 40 consecutive weeks as of the close of the period. During that interval alone, inflows into municipal bond funds totaled over $40 billion. Insurance companies and banks were active buyers, as well. Supply was also robust, but almost half of the new issuance came from refunding deals — rather than new issuance — as issuers sought to take advantage of the cost savings from refinancing older, higher coupon debt. We expect refunding activity can continue at a solid pace given the low level of interest rates. However, municipalities remained reluctant to commit to new long-term capital projects due to the continued slow growth in the U.S. economy, which helped cap new-issue supply.
The strength of state and local finances throughout the United States, with the notable exceptions of New Jersey, Illinois, the City of Chicago, and Puerto Rico, further aided municipals' performance. Long-term securities generally produced higher returns than shorter term issues, leading to a flattening of the yield curve. Lower quality bonds outpaced their higher quality counterparts, as investors' enthusiasm for risk fueled a reach for yield.
Contributors and Detractors
The Fund was focused on investing initial capital in an environment where attractive supply was somewhat limited. Due to the social and environmental impact focus of the Fund, there are natural overweights to sectors like healthcare, housing, education and water/sewer. The strongest contribution to Fund performance came from overweight exposure to bonds with longer dated calls, as additional duration was beneficial in a market where rates were declining. An overweight to the hospital sector also contributed to relative performance. In particular, the Fund's weighting to A and BBB rated hospitals helped drive outperformance versus the benchmark as credit spreads tightened. Security selection within almost all sectors outperformed the benchmark, principally driven by the lower quality positioning of the portfolio. Lower quality debt delivered the best results due to the elevated demand for higher yielding investments, with bonds rated A and BBB outpacing those rated AAA and A.
Portfolio Management
James Dearborn
Chad Farrington, CFA
Tom Murphy, CFA
Portfolio Breakdown (%)
(at July 31, 2016) | |
Corporate Bonds & Notes | | | 9.6 | | |
Floating Rate Notes | | | 3.6 | | |
Money Market Funds | | | 4.7 | | |
Municipal Bonds | | | 82.1 | | |
Total | | | 100.0 | | |
Percentages indicated are based upon total investments. The Fund's portfolio composition is subject to change.
Quality Breakdown (%)
(at July 31, 2016) | |
AAA rating | | | 9.1 | | |
AA rating | | | 33.1 | | |
A rating | | | 23.6 | | |
BBB rating | | | 26.5 | | |
BB rating | | | 1.9 | | |
Not rated | | | 5.8 | | |
Total | | | 100.0 | | |
Percentages indicated are based upon total fixed income investments (excluding Money Market Funds).
Bond ratings apply to the underlying holdings of the Fund and not the Fund itself and are divided into categories ranging from highest to lowest credit quality, determined by using the middle rating of Moody's, S&P and Fitch, after dropping the highest and lowest available ratings. When ratings are available from only two rating agencies, the lower rating is used. When a rating is available from only one rating agency, that rating is used. When a bond is not rated by any rating agency, it is designated as "Not rated." Credit quality ratings assigned by a rating agency are subjective opinions, not statements of fact, and are subject to change, including daily. The ratings assigned by credit rating agencies are but one of the considerations that the Investment Manager and/or Fund's subadviser incorporates into its credit analysis process, along with such other issuer-specific factors as cash flows, capital structure and leverage ratios, ability to de-leverage (repay) through free cash flow, quality of management, market positioning and access to capital, as well as such security-specific factors as the terms of the security (e.g., interest rate and time to maturity) and the amount and type of any collateral.
Annual Report 2016
5
COLUMBIA U.S. SOCIAL BOND FUND
MANAGER DISCUSSION OF FUND PERFORMANCE (continued)
Investment Risks
Market risk may affect a single issuer, sector of the economy, industry or the market as a whole. Social impact investing may increase risk due to the limitations and constraints involved in investment selection and, as a result, the Fund may underperform other funds that do not consider the social impact. Fixed-income securities present issuer default risk. A rise in interest rates may result in a price decline of fixed-income instruments held by the Fund, negatively impacting its performance and NAV. Falling rates may result in the Fund investing in lower yielding debt instruments, lowering the Fund's income and yield. These risks may be heightened for longer maturity and duration securities. Non-investment-grade (high-yield or junk) securities present greater price volatility and more risk to principal and income than higher rated securities. Prepayment and extension risk exists as a loan, bond or other investment may be called, prepaid or redeemed before maturity and that similar yielding investments may not be available for purchase. The Fund invests substantially in municipal securities and will be affected by tax, legislative, regulatory, demographic or political changes, as well as changes impacting a state's financial, economic or other conditions. A relatively small number of tax-exempt issuers may necessitate the fund investing more heavily in a single issuer and, therefore, be more exposed to the risk of loss than a fund that invests more broadly. The Fund may invest significantly in issuers within a particular sector which may be negatively affected by market, economic or other conditions, making the Fund more vulnerable to unfavorable developments in the sector. Market or other (e.g., interest rate) environments may adversely affect the liquidity of fund investments, negatively impacting their price. Generally, the less liquid the market at the time the Fund sells a holding, the greater the risk of loss or decline of value to the Fund. As a non-diversified fund, fewer investments could have a greater effect on performance. See the Fund's prospectus for information on these and other risks.
On the downside, the default of a Louisiana-based wood pellet manufacturing facility detracted from performance. Wood pellets are considered to be a "carbon-neutral" source of energy and are deployed by electric utilities seeking to comply with renewable energy mandates. The Fund's somewhat elevated cash position was also a drag on performance as the municipal market rallied.
The Fund had a small U.S. Treasury short position that was put on prior to the late-June United Kingdom referendum on leaving the European Union. This position was taken as a hedge against the portfolio's overall above-benchmark positioning with respect to duration and corresponding interest rate sensitivity. The Treasury short detracted from performance as Treasury yields declined following the "Brexit" vote.
Fund Positioning
The Fund's strategy continues to be to create a diversified portfolio with a competitive yield while maintaining overall portfolio duration near that of the benchmark in this low rate environment. The market environment continues to be challenging for investors with market interest rates near historical lows, credit spreads tight, and investor demand outstripping market supply. At period end, the Fund maintained a slightly longer duration positioning given our interest rate outlook and focus on increasing the Fund's yield. Due to limited opportunities in lower quality credits, the Fund generally focused purchases on higher quality securities.
Annual Report 2016
6
COLUMBIA U.S. SOCIAL BOND FUND
UNDERSTANDING YOUR FUND'S EXPENSES
(Unaudited)
As an investor, you incur two types of costs. There are transaction costs, which generally include sales charges on purchases and may include redemption fees. There are also ongoing costs, which generally include management fees, distribution and/or service fees, and other fund expenses. The following information is intended to help you understand your ongoing costs (in dollars) of investing in the Fund and to help you compare these costs with the ongoing costs of investing in other mutual funds.
Analyzing Your Fund's Expenses
To illustrate these ongoing costs, we have provided examples and calculated the expenses paid by investors in each share class of the Fund during the period. The actual and hypothetical information in the table is based on an initial investment of $1,000 at the beginning of the period indicated and held for the entire period. Expense information is calculated two ways and each method provides you with different information. The amount listed in the "Actual" column is calculated using the Fund's actual operating expenses and total return for the period. You may use the Actual information, together with the amount invested, to estimate the expenses that you paid over the period. Simply divide your account value by $1,000 (for example, an $8,600 account value divided by $1,000 = 8.6), then multiply the results by the expenses paid during the period under the "Actual" column. The amount listed in the "Hypothetical" column assumes a 5% annual rate of return before expenses (which is not the Fund's actual return) and then applies the Fund's actual expense ratio for the period to the hypothetical return. You should not use the hypothetical account values and expenses to estimate either your actual account balance at the end of the period or the expenses you paid during the period. See "Compare With Other Funds" below for details on how to use the hypothetical data.
Compare With Other Funds
Since all mutual funds are required to include the same hypothetical calculations about expenses in shareholder reports, you can use this information to compare the ongoing cost of investing in the Fund with other funds. To do so, compare the hypothetical example with the 5% hypothetical examples that appear in the shareholder reports of other funds. As you compare hypothetical examples of other funds, it is important to note that hypothetical examples are meant to highlight the ongoing costs of investing in a fund only and do not reflect any transaction costs, such as sales charges, or redemption or exchange fees. Therefore, the hypothetical calculations are useful in comparing ongoing costs only, and will not help you determine the relative total costs of owning different funds. If transaction costs were included in these calculations, your costs would be higher.
February 1, 2016 – July 31, 2016
| | | Account Value at the Beginning
of the Period ($) | | Account Value at the End of the
Period ($) | | Expenses Paid During the
Period ($) | | Fund's Annualized
Expense Ratio (%) | |
| | | Actual | | Hypothetical | | Actual | | Hypothetical | | Actual | | Hypothetical | | Actual | |
Class A | | | 1,000.00 | | | | 1,000.00 | | | | 1,034.00 | | | | 1,020.84 | | | | 4.10 | | | | 4.07 | | | | 0.81 | | |
Class C | | | 1,000.00 | | | | 1,000.00 | | | | 1,030.00 | | | | 1,017.11 | | | | 7.87 | | | | 7.82 | | | | 1.56 | | |
Class R4 | | | 1,000.00 | | | | 1,000.00 | | | | 1,034.30 | | | | 1,022.08 | | | | 2.83 | | | | 2.82 | | | | 0.56 | | |
Class R5 | | | 1,000.00 | | | | 1,000.00 | | | | 1,034.00 | | | | 1,021.88 | | | | 3.03 | | | | 3.02 | | | | 0.60 | | |
Class Z | | | 1,000.00 | | | | 1,000.00 | | | | 1,035.20 | | | | 1,022.08 | | | | 2.83 | | | | 2.82 | | | | 0.56 | | |
Expenses paid during the period are equal to the annualized expense ratio for each class as indicated above, multiplied by the average account value over the period and then multiplied by the number of days in the Fund's most recent fiscal half year and divided by 366.
Expenses do not include fees and expenses incurred indirectly by the Fund from its investment in underlying funds, including affiliated and non-affiliated pooled investment vehicles, such as mutual funds and exchange-traded funds.
Had Columbia Management Investment Advisers, LLC and/or certain of its affiliates not waived/reimbursed certain fees and expenses, account value at the end of the period would have been reduced.
Columbia Management Investment Advisors, LLC (the Investment Manager) and/or certain of its affiliates have contractually agreed to waive certain fees and/or to reimburse certain expenses until November 30, 2016, unless sooner terminated at the sole discretion of the Fund's Board, such that net expenses, subject to applicable exclusions, will not exceed 0.95% for Class A, 1.70% for Class C, 0.70% for Class R4 and 0.70% for Class Z. In addition to the contractual agreement, the Investment Manager and certain of its affiliates have voluntarily agreed to waive certain fees and/or reimburse certain Fund expenses so that Fund level expenses (expenses directly attributable to the Fund and not to a specific share class) are waived proportionately across all share classes. If this voluntary arrangement, which may be revised or discontinued at any time, had not been in place for six months ended July 31, 2016, the actual expenses paid would have been $4.80 for Class A, $8.58 for Class C, $3.54 for Class R4 and $3.54 for Class Z; and the hypothetical expenses paid would have been $4.77 for Class A, $8.52 for Class C, $3.52 for Class R4 and $3.52 for Class Z.
Annual Report 2016
7
COLUMBIA U.S. SOCIAL BOND FUND
PORTFOLIO OF INVESTMENTS
July 31, 2016
(Percentages represent value of investments compared to net assets)
Municipal Bonds 82.9%
Issue
Description | | Coupon
Rate | | Principal
Amount ($) | | Value ($) | |
ALABAMA 2.9% | |
Alabama Special Care Facilities Financing Authority
Refunding Revenue Bonds
Children's Hospital of Alabama
Series 2015
06/01/27 | | | 5.000 | % | | | 250,000 | | | | 310,425 | | |
Butler County Board of Education
Refunding Revenue Bonds
Series 2015 (AGM)
07/01/26 | | | 5.000 | % | | | 250,000 | | | | 306,455 | | |
Calhoun County Board of Education
Special Tax
School Warrants
Series 2016 (BAM)
02/01/29 | | | 5.000 | % | | | 250,000 | | | | 306,537 | | |
Total | | | | | | | 923,417 | | |
ARIZONA 2.2% | |
Industrial Development Authority of the County of Pima (The)
Refunding Revenue Bonds
American Leadership Academy
Series 2015(a)
06/15/35 | | | 5.375 | % | | | 250,000 | | | | 265,193 | | |
La Paz County Industrial Development Authority
Revenue Bonds
Charter School Solutions — Harmony Public
Series 2016
02/15/36 | | | 5.000 | % | | | 100,000 | | | | 112,253 | | |
Pinal County Union High School District No. 82 Casa Grande
Unlimited General Obligation Refunding Bonds
Series 2015 (AGM)
07/01/26 | | | 5.000 | % | | | 250,000 | | | | 313,212 | | |
Total | | | | | | | 690,658 | | |
ARKANSAS 0.9% | |
Springdale Public Facilities Board
Revenue Bonds
Arkansas Children's Northwest
Series 2016
03/01/36 | | | 4.000 | % | | | 250,000 | | | | 276,435 | | |
CALIFORNIA 10.2% | |
California Municipal Finance Authority
Refunding Revenue Bonds
Community Medical Centers
Series 2015A
02/01/22 | | | 5.000 | % | | | 215,000 | | | | 254,672 | | |
Harbor Regional Center Project
Series 2015
11/01/24 | | | 5.000 | % | | | 250,000 | | | | 313,102 | | |
Municipal Bonds (continued)
Issue
Description | | Coupon
Rate | | Principal
Amount ($) | | Value ($) | |
California School Finance Authority(a)
Refunding Revenue Bonds
Aspire Public Schools
Series 2016
08/01/36 | | | 5.000 | % | | | 250,000 | | | | 289,630 | | |
Revenue Bonds
Green Dot Public School Project
Series 2015A
08/01/25 | | | 4.000 | % | | | 250,000 | | | | 274,778 | | |
California Statewide Communities Development Authority
Refunding Revenue Bonds
Adventist Health System West
Series 2015
03/01/25 | | | 5.000 | % | | | 250,000 | | | | 316,320 | | |
Revenue Bonds
Loma Linda University Medical Center
Series 2014
12/01/34 | | | 5.250 | % | | | 250,000 | | | | 288,625 | | |
City of Riverside Sewer
Refunding Revenue Bonds
Series 2015A
08/01/21 | | | 5.000 | % | | | 250,000 | | | | 298,388 | | |
Jurupa Unified School District
Unlimited General Obligation Bonds
Series 2015A
08/01/23 | | | 5.000 | % | | | 225,000 | | | | 282,170 | | |
Monterey Regional Waste Management Authority
Revenue Bonds
Series 2015B AMT(b)
04/01/21 | | | 4.000 | % | | | 250,000 | | | | 279,898 | | |
Pajaro Valley Water Management Agency
Refunding Revenue Bonds
Series 2015 (AGM)
03/01/22 | | | 5.000 | % | | | 250,000 | | | | 301,162 | | |
West Kern Community College District
Unlimited General Obligation Refunding Bonds
Series 2015A (AGM)
11/01/24 | | | 5.000 | % | | | 250,000 | | | | 317,767 | | |
Total | | | | | | | 3,216,512 | | |
COLORADO 1.0% | |
Colorado Health Facilities Authority
Refunding Revenue Bonds
Parkview Medical Center
Series 2015B
09/01/26 | | | 5.000 | % | | | 250,000 | | | | 305,453 | | |
CONNECTICUT 0.9% | |
State of Connecticut Clean Water Fund-State Revolving Fund
Revenue Bonds
Green Bonds
Series 2015A
03/01/19 | | | 5.000 | % | | | 250,000 | | | | 278,103 | | |
The accompanying Notes to Financial Statements are an integral part of this statement.
Annual Report 2016
8
COLUMBIA U.S. SOCIAL BOND FUND
PORTFOLIO OF INVESTMENTS (continued)
July 31, 2016
Municipal Bonds (continued)
Issue
Description | | Coupon
Rate | | Principal
Amount ($) | | Value ($) | |
DISTRICT OF COLUMBIA 1.9% | |
District of Columbia
Refunding Revenue Bonds
Children's Hospital
Series 2015
07/15/23 | | | 5.000 | % | | | 250,000 | | | | 310,377 | | |
Friendship Public Charter School
Series 2016
06/01/41 | | | 5.000 | % | | | 250,000 | | | | 284,773 | | |
Total | | | | | | | 595,150 | | |
FLORIDA 2.7% | |
City of Tallahassee
Revenue Bonds
Tallahassee Memorial Healthcare, Inc. Project
Series 2016
12/01/55 | | | 5.000 | % | | | 250,000 | | | | 290,672 | | |
Florida Development Finance Corp.
Revenue Bonds
Renaissance Charter School Inc. Projects
Series 2015(a)
06/15/25 | | | 5.000 | % | | | 250,000 | | | | 261,100 | | |
School District of Broward County
Refunding Certificate of Participation
Series 2016A
07/01/32 | | | 5.000 | % | | | 250,000 | | | | 308,325 | | |
Total | | | | | | | 860,097 | | |
GEORGIA 2.6% | |
Cedartown Polk County Hospital Authority
Revenue Bonds
RAC Series 2016
07/01/39 | | | 5.000 | % | | | 250,000 | | | | 295,452 | | |
Georgia Housing & Finance Authority
Refunding Revenue Bonds
Series 2015A-2 AMT(b)
06/01/20 | | | 2.000 | % | | | 500,000 | | | | 512,460 | | |
Total | | | | | | | 807,912 | | |
GUAM 0.9% | |
Guam Government Waterworks Authority(c)
Refunding Revenue Bonds
Series 2014A
07/01/35 | | | 5.000 | % | | | 150,000 | | | | 171,351 | | |
Revenue Bonds
Series 2016
07/01/36 | | | 5.000 | % | | | 100,000 | | | | 116,958 | | |
Total | | | | | | | 288,309 | | |
Municipal Bonds (continued)
Issue
Description | | Coupon
Rate | | Principal
Amount ($) | | Value ($) | |
IDAHO 1.7% | |
Idaho Health Facilities Authority
Refunding Revenue Bonds
Madison Memorial Hospital
Series 2016
09/01/28 | | | 5.000 | % | | | 250,000 | | | | 295,390 | | |
Idaho Housing & Finance Association
Revenue Bonds
Series 2015A-1
07/01/25 | | | 3.200 | % | | | 230,000 | | | | 249,251 | | |
Total | | | | | | | 544,641 | | |
ILLINOIS 4.5% | |
Chicago Transit Authority
Refunding Revenue Bonds
Series 2015
06/01/21 | | | 5.000 | % | | | 250,000 | | | | 287,012 | | |
City of Chicago Waterworks
Revenue Bonds
2nd Lien
Series 2014
11/01/32 | | | 4.000 | % | | | 250,000 | | | | 266,455 | | |
Cook County Community High School District No. 212 Leyden
Revenue Bonds
Series 2016C (BAM)
12/01/34 | | | 5.000 | % | | | 250,000 | | | | 292,060 | | |
Illinois Housing Development Authority
Revenue Bonds
Series 2016A
10/01/36 | | | 3.450 | % | | | 250,000 | | | | 259,363 | | |
Metropolitan Water Reclamation District of Greater Chicago
Green Unlimited General Obligation Bonds
Series 2016E
12/01/33 | | | 5.000 | % | | | 250,000 | | | | 307,392 | | |
Total | | | | | | | 1,412,282 | | |
INDIANA 2.8% | |
Indiana Finance Authority
Taxable Revenue Bonds
Series 2016A
07/01/27 | | | 2.816 | % | | | 250,000 | | | | 259,078 | | |
Ivy Tech Community College
Refunding Revenue Bonds
Student Fee
Series 2015T
07/01/24 | | | 5.000 | % | | | 250,000 | | | | 313,642 | | |
Northern Indiana Commuter Transportation District
Revenue Bonds
Series 2016
07/01/32 | | | 5.000 | % | | | 250,000 | | | | 307,082 | | |
Total | | | | | | | 879,802 | | |
The accompanying Notes to Financial Statements are an integral part of this statement.
Annual Report 2016
9
COLUMBIA U.S. SOCIAL BOND FUND
PORTFOLIO OF INVESTMENTS (continued)
July 31, 2016
Municipal Bonds (continued)
Issue
Description | | Coupon
Rate | | Principal
Amount ($) | | Value ($) | |
KENTUCKY 0.8% | |
Kentucky Housing Corp.
Taxable Refunding Revenue Bonds
Series 2016A
07/01/31 | | | 3.499 | % | | | 250,000 | | | | 262,298 | | |
LOUISIANA 0.9% | |
Louisiana Public Facilities Authority
Refunding Revenue Bonds
Ochsner Clinic Foundation
Series 2016
05/15/34 | | | 5.000 | % | | | 100,000 | | | | 121,016 | | |
Louisiana Public Facilities Authority(a)(b) | |
Revenue Bonds
Louisiana Pellets, Inc. Project
Series 2015 AMT
07/01/24 | | | 7.000 | % | | | 250,000 | | | | 144,840 | | |
Total | | | | | | | 265,856 | | |
MAINE 0.8% | |
Maine State Housing Authority
Revenue Bonds
Series 2016A
11/15/35 | | | 3.300 | % | | | 250,000 | | | | 256,240 | | |
MARYLAND 3.7% | |
Maryland Economic Development Corp.
Revenue Bonds
Purple Line Light Rail Project
Series 2016 AMT(b)
03/31/36 | | | 5.000 | % | | | 250,000 | | | | 304,302 | | |
Maryland Health & Higher Educational Facilities Authority
Refunding Revenue Bonds
Meritus Medical Center Issue
Series 2015
07/01/23 | | | 5.000 | % | | | 250,000 | | | | 302,210 | | |
The John Hopkins Health System
Series 2015
05/15/19 | | | 5.000 | % | | | 250,000 | | | | 280,215 | | |
University of Maryland Medical System | |
Series 2015
07/01/19 | | | 4.000 | % | | | 250,000 | | | | 271,998 | | |
Total | | | | | | | 1,158,725 | | |
MASSACHUSETTS 2.7% | |
Massachusetts Development Finance Agency
Refunding Revenue Bonds
South Shore Hospital
Series 2016I
07/01/31 | | | 5.000 | % | | | 250,000 | | | | 305,107 | | |
Revenue Bonds
Green Bonds — Boston Medical Center
Series 2015
07/01/44 | | | 5.000 | % | | | 250,000 | | | | 290,792 | | |
Municipal Bonds (continued)
Issue
Description | | Coupon
Rate | | Principal
Amount ($) | | Value ($) | |
Massachusetts Housing Finance Agency
Refunding Revenue Bonds
Series 2016-181
12/01/36 | | | 3.600 | % | | | 250,000 | | | | 260,773 | | |
Total | | | | | | | 856,672 | | |
MICHIGAN 0.9% | |
Michigan Finance Authority
Revenue Bonds
Local Government Loan Program-Detroit
Series 2015
07/01/32 | | | 5.000 | % | | | 250,000 | | | | 296,843 | | |
MINNESOTA 2.9% | |
Dakota County Community Development Agency
Refunding Revenue Bonds
Series 2015B
01/01/21 | | | 5.000 | % | | | 250,000 | | | | 295,770 | | |
Revenue Bonds
Sanctuary at West St. Paul Project
Series 2015
08/01/30 | | | 5.750 | % | | | 100,000 | | | | 105,302 | | |
Northwest Multi-County Housing & Redevelopment Authority
Refunding Revenue Bonds
Pooled Housing Program
Series 2015
07/01/24 | | | 4.000 | % | | | 250,000 | | | | 254,537 | | |
St. Cloud Housing & Redevelopment Authority
Taxable Revenue Bonds
Sanctuary St. Cloud Project
Series 2016(d)
08/01/36 | | | 6.000 | % | | | 250,000 | | | | 249,988 | | |
Total | | | | | | | 905,597 | | |
MISSISSIPPI 1.9% | |
Biloxi Public School District
Revenue Bonds
Trust Certificates
Series 2016 (BAM)
04/01/29 | | | 5.000 | % | | | 250,000 | | | | 309,210 | | |
City of Gulfport
Unlimited General Obligation Refunding Bonds
Water & Sewer
Series 2015
07/01/21 | | | 5.000 | % | | | 250,000 | | | | 295,535 | | |
Total | | | | | | | 604,745 | | |
MISSOURI 0.8% | |
Missouri Housing Development Commission
Revenue Bonds
1st Place Homeownership Loan Project
Series 2015
11/01/27 | | | 3.250 | % | | | 230,000 | | | | 246,348 | | |
The accompanying Notes to Financial Statements are an integral part of this statement.
Annual Report 2016
10
COLUMBIA U.S. SOCIAL BOND FUND
PORTFOLIO OF INVESTMENTS (continued)
July 31, 2016
Municipal Bonds (continued)
Issue
Description | | Coupon
Rate | | Principal
Amount ($) | | Value ($) | |
NEBRASKA 0.9% | |
Nebraska Investment Finance Authority
Single Family Housing Revenue Bonds
Series 2015 (GNMA/FNMA)
09/01/30 | | | 3.450 | % | | | 250,000 | | | | 266,348 | | |
NEVADA 1.0% | |
Las Vegas Valley Water District
Limited General Obligation Refunding Bonds
Water Improvement
Series 2016A
06/01/41 | | | 5.000 | % | | | 250,000 | | | | 307,393 | | |
NEW MEXICO 0.9% | |
New Mexico Hospital Equipment Loan Council
Revenue Bonds
Presbyterian Healthcare Services
Series 2015
08/01/21 | | | 5.000 | % | | | 250,000 | | | | 296,395 | | |
NEW YORK 8.3% | |
Build NYC Resource Corp.
Revenue Bonds
Series 2015
07/01/28 | | | 5.000 | % | | | 250,000 | | | | 306,197 | | |
Housing Development Corp.
Refunding Revenue Bonds
Series 2015A-1
11/01/18 | | | 1.150 | % | | | 250,000 | | | | 251,153 | | |
Sustainable Neighborhood
Series 2015S
05/01/26 | | | 3.400 | % | | | 500,000 | | | | 543,310 | | |
Metropolitan Transportation Authority
Refunding Revenue Bonds
Series 2015D-1
11/15/26 | | | 5.000 | % | | | 250,000 | | | | 318,460 | | |
Revenue Bonds
Green Bonds
Series 2016A-1
11/15/33 | | | 5.000 | % | | | 250,000 | | | | 308,885 | | |
Onondaga Civic Development Corp.
Refunding Revenue Bonds
Community College Housing Bonds
Series 2015
10/01/23 | | | 5.000 | % | | | 250,000 | | | | 301,217 | | |
State of New York Mortgage Agency
Refunding Revenue Bonds
Series 2016-196 AMT(b)
10/01/35 | | | 3.650 | % | | | 250,000 | | | | 262,125 | | |
Municipal Bonds (continued)
Issue
Description | | Coupon
Rate | | Principal
Amount ($) | | Value ($) | |
Westchester County Local Development Corp.
Refunding Revenue Bonds
Westchester Medical Center
Series 2016
11/01/34 | | | 5.000 | % | | | 250,000 | | | | 300,433 | | |
Total | | | | | | | 2,591,780 | | |
OHIO 3.0% | |
American Municipal Power, Inc.
Green Revenue Bonds
Meldahl Hydroelectric Project
Series 2016
02/15/27 | | | 5.000 | % | | | 250,000 | | | | 315,150 | | |
City of Cleveland Water Pollution Control
Revenue Bonds
Green Bonds
Series 2016
11/15/41 | | | 5.000 | % | | | 250,000 | | | | 301,540 | | |
Columbus City School District
Unlimited General Obligation Refunding Bonds
School Facilities Construction & Improvement
Series 2016(d)
12/01/32 | | | 5.000 | % | | | 250,000 | | | | 312,467 | | |
Total | | | | | | | 929,157 | | |
PENNSYLVANIA 3.6% | |
Capital Region Water
Refunding Revenue Bonds
Series 2016A (BAM)
07/15/29 | | | 5.000 | % | | | 250,000 | | | | 310,000 | | |
Montgomery County Industrial Development Authority
Refunding Revenue Bonds
Albert Einstein HealthCare Network
Series 2015
01/15/22 | | | 5.000 | % | | | 250,000 | | | | 287,183 | | |
Pennsylvania Turnpike Commission
Refunding Subordinated Revenue Bonds
Mass Transit Projects
Series 2016A-1
12/01/41 | | | 5.000 | % | | | 200,000 | | | | 234,316 | | |
Redevelopment Authority of the City of Philadelphia
Refunding Revenue Bonds
Series 2015A
04/15/28 | | | 5.000 | % | | | 250,000 | | | | 298,362 | | |
Total | | | | | | | 1,129,861 | | |
RHODE ISLAND 0.9% | |
Rhode Island Housing & Mortgage Finance Corp.
Refunding Revenue Bonds
Homeownership Opportunity
Series 2015 AMT(b)
10/01/25 | | | 3.550 | % | | | 250,000 | | | | 267,315 | | |
The accompanying Notes to Financial Statements are an integral part of this statement.
Annual Report 2016
11
COLUMBIA U.S. SOCIAL BOND FUND
PORTFOLIO OF INVESTMENTS (continued)
July 31, 2016
Municipal Bonds (continued)
Issue
Description | | Coupon
Rate | | Principal
Amount ($) | | Value ($) | |
SOUTH CAROLINA 1.9% | |
SCAGO Educational Facilities Corp. for Colleton School District
Refunding Revenue Bonds
Series 2015
12/01/20 | | | 5.000 | % | | | 250,000 | | | | 288,305 | | |
Sumter Two School Facilities, Inc.
Refunding Revenue Bonds
Sumter School District Projects
Series 2016 (BAM)
12/01/26 | | | 5.000 | % | | | 250,000 | | | | 310,365 | | |
Total | | | | | | | 598,670 | | |
TENNESSEE 1.8% | |
Metropolitan Government Nashville & Davidson County Health & Educational Facilities Board
Revenue Bonds
Vanderbilt University Medical Center
Series 2016
07/01/31 | | | 5.000 | % | | | 250,000 | | | | 308,575 | | |
Tennessee Housing Development Agency
Revenue Bonds
Series 2015-1C
01/01/22 | | | 2.450 | % | | | 245,000 | | | | 256,684 | | |
Total | | | | | | | 565,259 | | |
TEXAS 6.8% | |
Arlington Higher Education Finance Corp.
Revenue Bonds
Harmony Public Schools
Series 2016A
02/15/31 | | | 5.000 | % | | | 250,000 | | | | 311,182 | | |
Austin Community College District Public Facility Corp.
Refunding Revenue Bonds
Series 2015
08/01/19 | | | 5.000 | % | | | 250,000 | | | | 279,863 | | |
Cotulla Independent School District
Unlimited General Obligation Bonds
School Building
Series 2015
02/15/19 | | | 5.000 | % | | | 250,000 | | | | 276,963 | | |
Harris County Cultural Education Facilities Finance Corp.
Refunding Revenue Bonds
Texas Children's Hospital
Series 2015
10/01/21 | | | 5.000 | % | | | 250,000 | | | | 298,537 | | |
New Hope Cultural Education Facilities Finance Corp.
Revenue Bonds
Cardinal Bay, Inc. — Village on the Park
Series 2016
07/01/46 | | | 5.000 | % | | | 50,000 | | | | 56,644 | | |
Municipal Bonds (continued)
Issue
Description | | Coupon
Rate | | Principal
Amount ($) | | Value ($) | |
San Antonio Independent School District
Unlimited General Obligation Refunding Bonds
Series 2015 (Permenant School Fund Guarantee)
02/15/22 | | | 5.000 | % | | | 250,000 | | | | 303,467 | | |
Tarrant County Cultural Education Facilities Finance Corp.
Revenue Bonds
Cook Children's Medical Center
Series 2014
12/01/39 | | | 5.000 | % | | | 280,000 | | | | 328,916 | | |
Texas State Technical College
Refunding Revenue Bonds
Improvements
Series 2016 (AGM)
10/15/30 | | | 4.000 | % | | | 250,000 | | | | 283,602 | | |
Total | | | | | | | 2,139,174 | | |
WASHINGTON 1.6% | |
Energy Northwest
Wind Project Refunding Revenue Bonds
Series 2015
07/01/29 | | | 4.000 | % | | | 250,000 | | | | 279,185 | | |
King County Public Hospital District No. 4
Revenue Bonds
Series 2015A
12/01/35 | | | 6.000 | % | | | 200,000 | | | | 207,032 | | |
Total | | | | | | | 486,217 | | |
WEST VIRGINIA 0.8% | |
West Virginia Housing Development Fund
Refunding Revenue Bonds
Series 2015A AMT(b)
11/01/18 | | | 1.500 | % | | | 250,000 | | | | 253,453 | | |
WISCONSIN 0.8% | |
Public Finance Authority
Revenue Bonds
FFAH NC & MO Portfolio
Series 2015
12/01/35 | | | 4.750 | % | | | 250,000 | | | | 265,483 | | |
Total Municipal Bonds
(Cost: $24,951,908) | | | | | | | 26,028,600 | | |
The accompanying Notes to Financial Statements are an integral part of this statement.
Annual Report 2016
12
COLUMBIA U.S. SOCIAL BOND FUND
PORTFOLIO OF INVESTMENTS (continued)
July 31, 2016
Corporate Bonds & Notes 9.7%
Issuer | | Coupon
Rate | | Principal
Amount ($) | | Value ($) | |
BANKING 1.6% | |
Bank of America Corp.
Green Bond
05/12/18 | | | 1.950 | % | | | 250,000 | | | | 251,633 | | |
Morgan Stanley
Green Bond
12/07/18 | | | 2.200 | % | | | 250,000 | | | | 252,789 | | |
Total | | | | | | | 504,422 | | |
ELECTRIC 0.8% | |
NextEra Energy Capital Holdings, Inc.
06/01/17 | | | 1.586 | % | | | 250,000 | | | | 250,799 | | |
FOOD AND BEVERAGE 0.7% | |
ConAgra Foods, Inc.
01/25/23 | | | 3.200 | % | | | 196,000 | | | | 204,535 | | |
LIFE INSURANCE 0.9% | |
Five Corners Funding Trust(a)
11/15/23 | | | 4.419 | % | | | 250,000 | | | | 271,541 | | |
MEDIA AND ENTERTAINMENT 2.5% | |
Scripps Networks Interactive, Inc.
06/15/20 | | | 2.800 | % | | | 500,000 | | | | 508,316 | | |
Time Warner, Inc.
03/15/20 | | | 4.875 | % | | | 250,000 | | | | 277,751 | | |
Total | | | | | | | 786,067 | | |
PHARMACEUTICALS 0.8% | |
AbbVie, Inc.
05/14/18 | | | 1.800 | % | | | 250,000 | | | | 252,020 | | |
TECHNOLOGY 0.8% | |
Apple, Inc.
Green Bond
02/23/23 | | | 2.850 | % | | | 250,000 | | | | 263,912 | | |
WIRELINES 1.6% | |
AT&T, Inc.
06/30/22 | | | 3.000 | % | | | 250,000 | | | | 259,256 | | |
Verizon Communications, Inc.
11/01/22 | | | 2.450 | % | | | 250,000 | | | | 255,843 | | |
Total | | | | | | | 515,099 | | |
Total Corporate Bonds & Notes
(Cost: $2,959,068) | | | | | | | 3,048,395 | | |
Floating Rate Notes 3.6%
Issue
Description | | Effective
Yield | | Principal
Amount ($) | | Value ($) | |
MICHIGAN 1.2% | |
Michigan State Housing Development Authority
Revenue Bonds
VRDN Series 2008A (JPMorgan Chase Bank) AMT(b)(e)(f)
10/01/37 | | | 0.620 | % | | | 395,000 | | | | 395,000 | | |
NEW YORK 2.4% | |
New York City Water & Sewer System
Revenue Bonds
VRDN Series 2010 (U.S. Bank)(e)(f)
06/15/43 | | | 0.400 | % | | | 250,000 | | | | 250,000 | | |
State of New York Mortgage Agency
Revenue Bonds
VRDN Series 2006-139 (JPMorgan Chase Bank) AMT(b)(e)(f)
10/01/37 | | | 0.440 | % | | | 500,000 | | | | 500,000 | | |
Total | | | | | | | 750,000 | | |
Total Floating Rate Notes
(Cost: $1,145,000) | | | | | | | 1,145,000 | | |
Money Market Funds 4.8% | |
| | | Shares | | Value ($) | |
JPMorgan Tax-Free Money Market Fund,
Agency Shares, 0.180%(g) | | | 1,497,226 | | | | 1,497,226 | | |
Total Money Market Funds
(Cost: $1,497,226) | | | | | 1,497,226 | | |
Total Investments
(Cost: $30,553,202) | | | | | 31,719,221 | | |
Other Assets & Liabilities, Net | | | | | (320,466 | ) | |
Net Assets | | | | | 31,398,755 | | |
The accompanying Notes to Financial Statements are an integral part of this statement.
Annual Report 2016
13
COLUMBIA U.S. SOCIAL BOND FUND
PORTFOLIO OF INVESTMENTS (continued)
July 31, 2016
At July 31, 2016, cash totaling $9,450 was pledged as collateral.
Investments in Derivatives
Short Futures Contracts Outstanding
Contract Description | | Number of
Contracts | | Trading
Currency | | Notional
Market
Value ($) | | Expiration
Date | | Unrealized
Appreciation ($) | | Unrealized
(Depreciation) ($) | |
U.S. Treasury 10-Year Note | | | (7 | ) | | USD | | | | | (931,328 | ) | | 09/2016 | | | — | | | | (23,310 | ) | |
Notes to Portfolio of Investments
(a) Represents privately placed and other securities and instruments exempt from SEC registration (collectively, private placements), such as Section 4(a)(2) and Rule 144A eligible securities, which are often sold only to qualified institutional buyers. The Fund may invest in private placements determined to be liquid as well as those determined to be illiquid. Private placements may be determined to be liquid under guidelines established by the Fund's Board of Trustees. At July 31, 2016, the value of these securities amounted to $1,507,082 or 4.80% of net assets.
(b) Income from this security may be subject to alternative minimum tax.
(c) Municipal obligations include debt obligations issued by or on behalf of territories, possessions, or sovereign nations within the territorial boundaries of the United States. At July 31, 2016, the value of these securities amounted to $288,309 or 0.92% of net assets.
(d) Security, or a portion thereof, has been purchased on a when-issued or delayed delivery basis.
(e) Variable rate security.
(f) The Fund is entitled to receive principal and interest from the guarantor after a day or a week's notice or upon maturity. The maturity date disclosed represents the final maturity.
(g) The rate shown is the seven-day current annualized yield at July 31, 2016.
Abbreviation Legend
AGM Assured Guaranty Municipal Corporation
AMT Alternative Minimum Tax
BAM Build America Mutual Assurance Co.
FNMA Federal National Mortgage Association
GNMA Government National Mortgage Association
RAC Revenue Anticipation Certificate
VRDN Variable Rate Demand Note
Currency Legend
USD US Dollar
Fair Value Measurements
The Fund categorizes its fair value measurements according to a three-level hierarchy that maximizes the use of observable inputs and minimizes the use of unobservable inputs by prioritizing that the most observable input be used when available. Observable inputs are those that market participants would use in pricing an investment based on market data obtained from sources independent of the reporting entity. Unobservable inputs are those that reflect the Fund's assumptions about the information market participants would use in pricing an investment. An investment's level within the fair value hierarchy is based on the lowest level of any input that is deemed significant to the asset's or liability's fair value measurement. The input levels are not necessarily an indication of the risk or liquidity associated with investments at that level. For example, certain U.S. government securities are generally high quality and liquid, however, they are reflected as Level 2 because the inputs used to determine fair value may not always be quoted prices in an active market.
The accompanying Notes to Financial Statements are an integral part of this statement.
Annual Report 2016
14
COLUMBIA U.S. SOCIAL BOND FUND
PORTFOLIO OF INVESTMENTS (continued)
July 31, 2016
Fair Value Measurements (continued)
Fair value inputs are summarized in the three broad levels listed below:
> Level 1 — Valuations based on quoted prices for investments in active markets that the Fund has the ability to access at the measurement date (including NAV for open-end mutual funds). Valuation adjustments are not applied to Level 1 investments.
> Level 2 — Valuations based on other significant observable inputs (including quoted prices for similar securities, interest rates, prepayment speeds, credit risks, etc.).
> Level 3 — Valuations based on significant unobservable inputs (including the Fund's own assumptions and judgment in determining the fair value of investments).
Inputs that are used in determining fair value of an investment may include price information, credit data, volatility statistics, and other factors. These inputs can be either observable or unobservable. The availability of observable inputs can vary between investments, and is affected by various factors such as the type of investment, and the volume and level of activity for that investment or similar investments in the marketplace. The inputs will be considered by the Investment Manager, along with any other relevant factors in the calculation of an investment's fair value. The Fund uses prices and inputs that are current as of the measurement date, which may include periods of market dislocations. During these periods, the availability of prices and inputs may be reduced for many investments. This condition could cause an investment to be reclassified between the various levels within the hierarchy.
Investments falling into the Level 3 category are primarily supported by quoted prices from brokers and dealers participating in the market for those investments. However, these may be classified as Level 3 investments due to lack of market transparency and corroboration to support these quoted prices. Additionally, valuation models may be used as the pricing source for any remaining investments classified as Level 3. These models may rely on one or more significant unobservable inputs and/or significant assumptions by the Investment Manager. Inputs used in valuations may include, but are not limited to, financial statement analysis, capital account balances, discount rates and estimated cash flows, and comparable company data.
Under the direction of the Fund's Board of Trustees (the Board), the Investment Manager's Valuation Committee (the Committee) is responsible for overseeing the valuation procedures approved by the Board. The Committee consists of voting and non-voting members from various groups within the Investment Manager's organization, including operations and accounting, trading and investments, compliance, risk management and legal.
The Committee meets at least monthly to review and approve valuation matters, which may include a description of specific valuation determinations, data regarding pricing information received from approved pricing vendors and brokers and the results of Board-approved valuation control policies and procedures (the Policies). The Policies address, among other things, instances when market quotations are or are not readily available, including recommendations of third party pricing vendors and a determination of appropriate pricing methodologies; events that require specific valuation determinations and assessment of fair value techniques; securities with a potential for stale pricing, including those that are illiquid, restricted, or in default; and the effectiveness of third party pricing vendors, including periodic reviews of vendors. The Committee meets more frequently, as needed, to discuss additional valuation matters, which may include the need to review back-testing results, review time-sensitive information or approve related valuation actions. The Committee reports to the Board, with members of the Committee meeting with the Board at each of its regularly scheduled meetings to discuss valuation matters and actions during the period, similar to those described earlier.
For investments categorized as Level 3, the Committee monitors information similar to that described above, which may include: (i) data specific to the issuer or comparable issuers, (ii) general market or specific sector news and (iii) quoted prices and specific or similar security transactions. The Committee considers this data and any changes from prior periods in order to assess the reasonableness of observable and unobservable inputs, any assumptions or internal models used to value those securities and changes in fair value. This data is also used to corroborate, when available, information received from approved pricing vendors and brokers. Various factors impact the frequency of monitoring this information (which may occur as often as daily). However, the Committee may determine that changes to inputs, assumptions and models are not required as a result of the monitoring procedures performed.
The accompanying Notes to Financial Statements are an integral part of this statement.
Annual Report 2016
15
COLUMBIA U.S. SOCIAL BOND FUND
PORTFOLIO OF INVESTMENTS (continued)
July 31, 2016
Fair Value Measurements (continued)
The following table is a summary of the inputs used to value the Fund's investments at July 31, 2016:
| | | Level 1
Quoted Prices in Active
Markets for Identical
Assets ($) | | Level 2
Other Significant
Observable Inputs ($) | | Level 3
Significant
Unobservable Inputs ($) | | Total ($) | |
Investments | |
Municipal Bonds | | | — | | | | 26,028,600 | | | | — | | | | 26,028,600 | | |
Corporate Bonds & Notes | | | — | | | | 3,048,395 | | | | — | | | | 3,048,395 | | |
Floating Rate Notes | | | — | | | | 1,145,000 | | | | — | | | | 1,145,000 | | |
Money Market Funds | | | 1,497,226 | | | | — | | | | — | | | | 1,497,226 | | |
Total Investments | | | 1,497,226 | | | | 30,221,995 | | | | — | | | | 31,719,221 | | |
Derivatives | |
Liabilities | |
Futures Contracts | | | (23,310 | ) | | | — | | | | — | | | | (23,310 | ) | |
Total | | | 1,473,916 | | | | 30,221,995 | | | | — | | | | 31,695,911 | | |
See the Portfolio of Investments for all investment classifications not indicated in the table.
The Fund's assets assigned to the Level 2 input category are generally valued using the market approach, in which a security's value is determined through reference to prices and information from market transactions for similar or identical assets.
Derivative instruments are valued at unrealized appreciation (depreciation).
There were no transfers of financial assets between levels during the period.
The accompanying Notes to Financial Statements are an integral part of this statement.
Annual Report 2016
16
COLUMBIA U.S. SOCIAL BOND FUND
STATEMENT OF ASSETS AND LIABILITIES
July 31, 2016
Assets | |
Investments, at value | |
(identified cost $30,553,202) | | $ | 31,719,221 | | |
Margin deposits | | | 9,450 | | |
Receivable for: | |
Investments sold | | | 5,041 | | |
Capital shares sold | | | 75,905 | | |
Interest | | | 232,640 | | |
Expense reimbursement due from Investment Manager | | | 261 | | |
Prepaid expenses | | | 299 | | |
Trustees' deferred compensation plan | | | 3,890 | | |
Total assets | | | 32,046,707 | | |
Liabilities | |
Payable for: | |
Investments purchased on a delayed delivery basis | | | 543,724 | | |
Capital shares purchased | | | 2,591 | | |
Dividend distributions to shareholders | | | 52,059 | | |
Variation margin | | | 3,391 | | |
Management services fees | | | 487 | | |
Distribution and/or service fees | | | 26 | | |
Transfer agent fees | | | 242 | | |
Chief compliance officer expenses | | | 1 | | |
Other expenses | | | 41,541 | | |
Trustees' deferred compensation plan | | | 3,890 | | |
Total liabilities | | | 647,952 | | |
Net assets applicable to outstanding capital stock | | $ | 31,398,755 | | |
Represented by | |
Paid-in capital | | $ | 30,272,403 | | |
Excess of distributions over net investment income | | | (1,657 | ) | |
Accumulated net realized loss | | | (14,700 | ) | |
Unrealized appreciation (depreciation) on: | |
Investments | | | 1,166,019 | | |
Futures contracts | | | (23,310 | ) | |
Total — representing net assets applicable to outstanding capital stock | | $ | 31,398,755 | | |
The accompanying Notes to Financial Statements are an integral part of this statement.
Annual Report 2016
17
COLUMBIA U.S. SOCIAL BOND FUND
STATEMENT OF ASSETS AND LIABILITIES (continued)
July 31, 2016
Class A | |
Net assets | | $ | 2,901,180 | | |
Shares outstanding | | | 278,155 | | |
Net asset value per share | | $ | 10.43 | | |
Maximum offering price per share(a) | | $ | 10.75 | | |
Class C | |
Net assets | | $ | 238,357 | | |
Shares outstanding | | | 22,851 | | |
Net asset value per share | | $ | 10.43 | | |
Class R4 | |
Net assets | | $ | 10,432 | | |
Shares outstanding | | | 1,000 | | |
Net asset value per share | | $ | 10.43 | | |
Class R5 | |
Net assets | | $ | 72,677 | | |
Shares outstanding | | | 6,966 | | |
Net asset value per share | | $ | 10.43 | | |
Class Z | |
Net assets | | $ | 28,176,109 | | |
Shares outstanding | | | 2,701,296 | | |
Net asset value per share | | $ | 10.43 | | |
(a) The maximum offering price per share is calculated by dividing the net asset value per share by 1.0 minus the maximum sales charge of 3.00%.
The accompanying Notes to Financial Statements are an integral part of this statement.
Annual Report 2016
18
COLUMBIA U.S. SOCIAL BOND FUND
STATEMENT OF OPERATIONS
Year Ended July 31, 2016
Net investment income | |
Income: | |
Dividends | | $ | 809 | | |
Interest | | | 577,283 | | |
Total income | | | 578,092 | | |
Expenses: | |
Management services fees | | | 136,682 | | |
Distribution and/or service fees | |
Class A | | | 2,077 | | |
Class C | | | 422 | | |
Transfer agent fees | |
Class A | | | 129 | | |
Class C | | | 7 | | |
Class R5 | | | 22 | | |
Class Z | | | 1,992 | | |
Compensation of board members | | | 16,427 | | |
Custodian fees | | | 16,235 | | |
Printing and postage fees | | | 17,336 | | |
Registration fees | | | 66,331 | | |
Audit fees | | | 29,748 | | |
Legal fees | | | 560 | | |
Offering costs | | | 56,676 | | |
Chief compliance officer expenses | | | 11 | | |
Other | | | 9,073 | | |
Total expenses | | | 353,728 | | |
Fees waived or expenses reimbursed by Investment Manager and its affiliates | | | (217,320 | ) | |
Total net expenses | | | 136,408 | | |
Net investment income | | | 441,684 | | |
Realized and unrealized gain (loss) — net | |
Net realized gain (loss) on: | |
Investments | | | (4,822 | ) | |
Net realized loss | | | (4,822 | ) | |
Net change in unrealized appreciation (depreciation) on: | |
Investments | | | 1,208,091 | | |
Futures contracts | | | (23,310 | ) | |
Net change in unrealized appreciation | | | 1,184,781 | | |
Net realized and unrealized gain | | | 1,179,959 | | |
Net increase in net assets resulting from operations | | $ | 1,621,643 | | |
The accompanying Notes to Financial Statements are an integral part of this statement.
Annual Report 2016
19
COLUMBIA U.S. SOCIAL BOND FUND
STATEMENT OF CHANGES IN NET ASSETS
| | | Year Ended
July 31,
2016 | | Year Ended
July 31,
2015(a) | |
Operations | |
Net investment income | | $ | 441,684 | | | $ | 61,570 | | |
Net realized loss | | | (4,822 | ) | | | (9,878 | ) | |
Net change in unrealized appreciation (depreciation) | | | 1,184,781 | | | | (42,072 | ) | |
Net increase in net assets resulting from operations | | | 1,621,643 | | | | 9,620 | | |
Distributions to shareholders | |
Net investment income | |
Class A | | | (14,420 | ) | | | (22 | ) | |
Class C | | | (396 | ) | | | (6 | ) | |
Class R4 | | | (187 | ) | | | (31 | ) | |
Class R5 | | | (805 | ) | | | (29 | ) | |
Class Z | | | (427,709 | ) | | | (61,306 | ) | |
Total distributions to shareholders | | | (443,517 | ) | | | (61,394 | ) | |
Increase in net assets from capital stock activity | | | 10,232,273 | | | | 17,540,130 | | |
Total increase in net assets | | | 11,410,399 | | | | 17,488,356 | | |
Net assets at beginning of year | | | 19,988,356 | | | | 2,500,000 | | |
Net assets at end of year | | $ | 31,398,755 | | | $ | 19,988,356 | | |
Undistributed (excess of distributions over) net investment income | | $ | (1,657 | ) | | $ | 176 | | |
(a) Based on operations from March 26, 2015 (commencement of operations) through the stated period end.
The accompanying Notes to Financial Statements are an integral part of this statement.
Annual Report 2016
20
COLUMBIA U.S. SOCIAL BOND FUND
STATEMENT OF CHANGES IN NET ASSETS (continued)
| | | Year Ended July 31, 2016 | | Year Ended July 31, 2015(a) | |
| | | Shares | | Dollars ($) | | Shares | | Dollars ($) | |
Capital stock activity | |
Class A shares | |
Subscriptions | | | 287,239 | | | | 2,947,532 | | | | — | | | | — | | |
Distributions reinvested | | | 1,380 | | | | 14,260 | | | | — | | | | — | | |
Redemptions | | | (11,464 | ) | | | (118,097 | ) | | | — | | | | — | | |
Net increase | | | 277,155 | | | | 2,843,695 | | | | — | | | | — | | |
Class C shares | |
Subscriptions | | | 21,847 | | | | 226,123 | | | | — | | | | — | | |
Distributions reinvested | | | 30 | | | | 315 | | | | 1 | | | | 6 | | |
Redemptions | | | (27 | ) | | | (282 | ) | | | — | | | | — | | |
Net increase | | | 21,850 | | | | 226,156 | | | | 1 | | | | 6 | | |
Class R5 shares | |
Subscriptions | | | 5,905 | | | | 60,000 | | | | — | | | | — | | |
Distributions reinvested | | | 61 | | | | 623 | | | | — | | | | — | | |
Net increase | | | 5,966 | | | | 60,623 | | | | — | | | | — | | |
Class Z shares | |
Subscriptions | | | 694,458 | | | | 7,105,050 | | | | 1,761,135 | | | | 17,540,000 | | |
Distributions reinvested | | | 869 | | | | 9,011 | | | | 12 | | | | 124 | | |
Redemptions | | | (1,178 | ) | | | (12,262 | ) | | | — | | | | — | | |
Net increase | | | 694,149 | | | | 7,101,799 | | | | 1,761,147 | | | | 17,540,124 | | |
Total net increase | | | 999,120 | | | | 10,232,273 | | | | 1,761,148 | | | | 17,540,130 | | |
(a) Based on operations from March 26, 2015 (commencement of operations) through the stated period end.
The accompanying Notes to Financial Statements are an integral part of this statement.
Annual Report 2016
21
COLUMBIA U.S. SOCIAL BOND FUND
The following tables are intended to help you understand the Fund's financial performance. Certain information reflects financial results for a single share of a class held for the periods shown. Per share net investment income (loss) amounts are calculated based on average shares outstanding during the period. Total return assumes reinvestment of all dividends and distributions, if any. Total return does not reflect payment of sales charges, if any. Total return and portfolio turnover are not annualized for periods of less than one year. The portfolio turnover rate is calculated without regard to purchase and sales transactions of short-term instruments and certain derivatives, if any. If such transactions were included, the Fund's portfolio turnover rate may be higher.
| | | Year Ended July 31, | |
Class A | | 2016 | | 2015(a) | |
Per share data | |
Net asset value, beginning of period | | $ | 9.94 | | | $ | 10.00 | | |
Income from investment operations: | |
Net investment income | | | 0.17 | | | | 0.02 | | |
Net realized and unrealized gain (loss) | | | 0.48 | | | | (0.06 | ) | |
Total from investment operations | | | 0.65 | | | | (0.04 | ) | |
Less distributions to shareholders: | |
Net investment income | | | (0.16 | ) | | | (0.02 | ) | |
Total distributions to shareholders | | | (0.16 | ) | | | (0.02 | ) | |
Net asset value, end of period | | $ | 10.43 | | | $ | 9.94 | | |
Total return | | | 6.60 | % | | | (0.38 | %) | |
Ratios to average net assets(b) | |
Total gross expenses | | | 1.72 | % | | | 1.72 | %(c) | |
Total net expenses(d) | | | 0.81 | % | | | 0.80 | %(c) | |
Net investment income | | | 1.72 | % | | | 0.67 | %(c) | |
Supplemental data | |
Net assets, end of period (in thousands) | | $ | 2,901 | | | $ | 10 | | |
Portfolio turnover | | | 26 | % | | | 11 | % | |
Notes to Financial Highlights
(a) Based on operations from March 26, 2015 (commencement of operations) through the stated period end.
(b) In addition to the fees and expenses that the Fund bears directly, the Fund indirectly bears a pro rata share of the fees and expenses of any other funds in which it invests. Such indirect expenses are not included in the Fund's reported expense ratios.
(c) Annualized.
(d) Total net expenses include the impact of certain fee waivers/expense reimbursements made by the Investment Manager and certain of its affiliates, if applicable.
The accompanying Notes to Financial Statements are an integral part of this statement.
Annual Report 2016
22
COLUMBIA U.S. SOCIAL BOND FUND
FINANCIAL HIGHLIGHTS (continued)
| | | Year Ended July 31, | |
Class C | | 2016 | | 2015(a) | |
Per share data | |
Net asset value, beginning of period | | $ | 9.94 | | | $ | 10.00 | | |
Income from investment operations: | |
Net investment income | | | 0.09 | | | | 0.01 | | |
Net realized and unrealized gain (loss) | | | 0.48 | | | | (0.06 | ) | |
Total from investment operations | | | 0.57 | | | | (0.05 | ) | |
Less distributions to shareholders: | |
Net investment income | | | (0.08 | ) | | | (0.01 | ) | |
Total distributions to shareholders | | | (0.08 | ) | | | (0.01 | ) | |
Net asset value, end of period | | $ | 10.43 | | | $ | 9.94 | | |
Total return | | | 5.80 | % | | | (0.54 | %) | |
Ratios to average net assets(b) | |
Total gross expenses | | | 2.47 | % | | | 2.47 | %(c) | |
Total net expenses(d) | | | 1.56 | % | | | 1.45 | %(c) | |
Net investment income | | | 0.93 | % | | | 0.02 | %(c) | |
Supplemental data | |
Net assets, end of period (in thousands) | | $ | 238 | | | $ | 10 | | |
Portfolio turnover | | | 26 | % | | | 11 | % | |
Notes to Financial Highlights
(a) Based on operations from March 26, 2015 (commencement of operations) through the stated period end.
(b) In addition to the fees and expenses that the Fund bears directly, the Fund indirectly bears a pro rata share of the fees and expenses of any other funds in which it invests. Such indirect expenses are not included in the Fund's reported expense ratios.
(c) Annualized.
(d) Total net expenses include the impact of certain fee waivers/expense reimbursements made by the Investment Manager and certain of its affiliates, if applicable.
The accompanying Notes to Financial Statements are an integral part of this statement.
Annual Report 2016
23
COLUMBIA U.S. SOCIAL BOND FUND
FINANCIAL HIGHLIGHTS (continued)
| | | Year Ended July 31, | |
Class R4 | | 2016 | | 2015(a) | |
Per share data | |
Net asset value, beginning of period | | $ | 9.94 | | | $ | 10.00 | | |
Income from investment operations: | |
Net investment income | | | 0.19 | | | | 0.03 | | |
Net realized and unrealized gain (loss) | | | 0.49 | | | | (0.06 | ) | |
Total from investment operations | | | 0.68 | | | | (0.03 | ) | |
Less distributions to shareholders: | |
Net investment income | | | (0.19 | ) | | | (0.03 | ) | |
Total distributions to shareholders | | | (0.19 | ) | | | (0.03 | ) | |
Net asset value, end of period | | $ | 10.43 | | | $ | 9.94 | | |
Total return | | | 6.87 | % | | | (0.29 | %) | |
Ratios to average net assets(b) | |
Total gross expenses | | | 1.47 | % | | | 1.47 | %(c) | |
Total net expenses(d) | | | 0.56 | % | | | 0.55 | %(c) | |
Net investment income | | | 1.83 | % | | | 0.92 | %(c) | |
Supplemental data | |
Net assets, end of period (in thousands) | | $ | 10 | | | $ | 10 | | |
Portfolio turnover | | | 26 | % | | | 11 | % | |
Notes to Financial Highlights
(a) Based on operations from March 26, 2015 (commencement of operations) through the stated period end.
(b) In addition to the fees and expenses that the Fund bears directly, the Fund indirectly bears a pro rata share of the fees and expenses of any other funds in which it invests. Such indirect expenses are not included in the Fund's reported expense ratios.
(c) Annualized.
(d) Total net expenses include the impact of certain fee waivers/expense reimbursements made by the Investment Manager and certain of its affiliates, if applicable.
The accompanying Notes to Financial Statements are an integral part of this statement.
Annual Report 2016
24
COLUMBIA U.S. SOCIAL BOND FUND
FINANCIAL HIGHLIGHTS (continued)
| | | Year Ended July 31, | |
Class R5 | | 2016 | | 2015(a) | |
Per share data | |
Net asset value, beginning of period | | $ | 9.94 | | | $ | 10.00 | | |
Income from investment operations: | |
Net investment income | | | 0.19 | | | | 0.03 | | |
Net realized and unrealized gain (loss) | | | 0.48 | | | | (0.06 | ) | |
Total from investment operations | | | 0.67 | | | | (0.03 | ) | |
Less distributions to shareholders: | |
Net investment income | | | (0.18 | ) | | | (0.03 | ) | |
Total distributions to shareholders | | | (0.18 | ) | | | (0.03 | ) | |
Net asset value, end of period | | $ | 10.43 | | | $ | 9.94 | | |
Total return | | | 6.82 | % | | | (0.31 | %) | |
Ratios to average net assets(b) | |
Total gross expenses | | | 1.51 | % | | | 1.52 | %(c) | |
Total net expenses(d) | | | 0.60 | % | | | 0.60 | %(c) | |
Net investment income | | | 1.85 | % | | | 0.87 | %(c) | |
Supplemental data | |
Net assets, end of period (in thousands) | | $ | 73 | | | $ | 10 | | |
Portfolio turnover | | | 26 | % | | | 11 | % | |
Notes to Financial Highlights
(a) Based on operations from March 26, 2015 (commencement of operations) through the stated period end.
(b) In addition to the fees and expenses that the Fund bears directly, the Fund indirectly bears a pro rata share of the fees and expenses of any other funds in which it invests. Such indirect expenses are not included in the Fund's reported expense ratios.
(c) Annualized.
(d) Total net expenses include the impact of certain fee waivers/expense reimbursements made by the Investment Manager and certain of its affiliates, if applicable.
The accompanying Notes to Financial Statements are an integral part of this statement.
Annual Report 2016
25
COLUMBIA U.S. SOCIAL BOND FUND
FINANCIAL HIGHLIGHTS (continued)
| | | Year Ended July 31, | |
Class Z | | 2016 | | 2015(a) | |
Per share data | |
Net asset value, beginning of period | | $ | 9.94 | | | $ | 10.00 | | |
Income from investment operations: | |
Net investment income | | | 0.19 | | | | 0.04 | | |
Net realized and unrealized gain (loss) | | | 0.49 | | | | (0.07 | ) | |
Total from investment operations | | | 0.68 | | | | (0.03 | ) | |
Less distributions to shareholders: | |
Net investment income | | | (0.19 | ) | | | (0.03 | ) | |
Total distributions to shareholders | | | (0.19 | ) | | | (0.03 | ) | |
Net asset value, end of period | | $ | 10.43 | | | $ | 9.94 | | |
Total return | | | 6.86 | % | | | (0.29 | %) | |
Ratios to average net assets(b) | |
Total gross expenses | | | 1.48 | % | | | 1.47 | %(c) | |
Total net expenses(d) | | | 0.56 | % | | | 0.55 | %(c) | |
Net investment income | | | 1.85 | % | | | 1.14 | %(c) | |
Supplemental data | |
Net assets, end of period (in thousands) | | $ | 28,176 | | | $ | 19,949 | | |
Portfolio turnover | | | 26 | % | | | 11 | % | |
Notes to Financial Highlights
(a) Based on operations from March 26, 2015 (commencement of operations) through the stated period end.
(b) In addition to the fees and expenses that the Fund bears directly, the Fund indirectly bears a pro rata share of the fees and expenses of any other funds in which it invests. Such indirect expenses are not included in the Fund's reported expense ratios.
(c) Annualized.
(d) Total net expenses include the impact of certain fee waivers/expense reimbursements made by the Investment Manager and certain of its affiliates, if applicable.
The accompanying Notes to Financial Statements are an integral part of this statement.
Annual Report 2016
26
COLUMBIA U.S. SOCIAL BOND FUND
NOTES TO FINANCIAL STATEMENTS
July 31, 2016
Note 1. Organization
Columbia U.S. Social Bond Fund (the Fund), a series of Columbia Funds Series Trust I (the Trust), is a non-diversified fund. The Trust is registered under the Investment Company Act of 1940, as amended (the 1940 Act), as an open-end management investment company organized as a Massachusetts business trust.
Fund Shares
The Trust may issue an unlimited number of shares (without par value). The Fund offers Class A, Class C, Class R4, Class R5 and Class Z shares. Although all share classes generally have identical voting, dividend and liquidation rights, each share class votes separately when required by the Trust's organizational documents or by law. Different share classes pay different distribution amounts to the extent the expenses of such share classes differ, and distributions in liquidation will be proportional to the net asset value of each share class. Each share class has its own expense and sales charge structure.
Class A shares are subject to a maximum front-end sales charge of 3.00% based on the initial investment amount. Class A shares purchased on or after August 8, 2016 are subject to a contingent deferred sales charge (CDSC) of 0.75% on certain investments of $500,000 or more if redeemed within 12 months after purchase. Redemptions of Class A shares purchased prior to August 8, 2016, without an initial sales charge in accounts aggregating $1 million to $50 million at the time of purchase are subject to a CDSC if the shares are sold within 18 months after purchase, charged as follows: 1.00% CDSC if redeemed within 12 months after purchase, and 0.50% CDSC if redeemed more than 12, but less than 18, months after purchase.
Class C shares are subject to a 1.00% CDSC on shares redeemed within 12 months after purchase.
Class R4 shares are not subject to sales charges and are generally available only to omnibus retirement plans and certain investors as described in the Fund's prospectus.
Class R5 shares are not subject to sales charges and are generally available only to investors purchasing through authorized investment professionals and omnibus retirement plans.
Class Z shares are not subject to sales charges and are generally available only to eligible investors, which are
subject to different investment minimums as described in the Fund's prospectus.
Note 2. Summary of Significant Accounting Policies
Basis of Preparation
The Fund is an investment company that applies the accounting and reporting guidance in the Financial Accounting Standards Board (FASB) Accounting Standards Codification Topic 946, Financial Services — Investment Companies (ASC 946). The financial statements are prepared in accordance with U.S. generally accepted accounting principles (GAAP), which requires management to make certain estimates and assumptions that affect the reported amounts of assets and liabilities, the disclosure of contingent assets and liabilities at the date of the financial statements and the reported amounts of income and expenses during the reporting period. Actual results could differ from those estimates.
The following is a summary of significant accounting policies followed by the Fund in the preparation of its financial statements.
Security Valuation
Debt securities generally are valued by pricing services approved by the Board of Trustees (the Board) based upon market transactions for normal, institutional-size trading units of similar securities. The services may use various pricing techniques that take into account, as applicable, factors such as yield, quality, coupon rate, maturity, type of issue, trading characteristics and other data, as well as approved independent broker-dealer quotes. Debt securities for which quotations are not readily available or not believed to be reflective of market value may also be valued based upon a bid quote from an approved independent broker-dealer. Debt securities maturing in 60 days or less are valued primarily at amortized cost value, unless this method results in a valuation that management believes does not approximate market value.
Investments in open-end investment companies, including money market funds, are valued at their latest net asset value.
Futures and options on futures contracts are valued based upon the settlement price at the close of regular trading on their principal exchanges or, in the absence of transactions, at the mean of the latest quoted bid and ask prices.
Annual Report 2016
27
COLUMBIA U.S. SOCIAL BOND FUND
NOTES TO FINANCIAL STATEMENTS (continued)
July 31, 2016
Investments for which market quotations are not readily available, or that have quotations which management believes are not reflective of market value or reliable, are valued at fair value as determined in good faith under procedures approved by and under the general supervision of the Board. If a security or class of securities (such as foreign securities) is valued at fair value, such value is likely to be different from the quoted or published price for the security.
The determination of fair value often requires significant judgment. To determine fair value, management may use assumptions including but not limited to future cash flows and estimated risk premiums. Multiple inputs from various sources may be used to determine fair value.
GAAP requires disclosure regarding the inputs and valuation techniques used to measure fair value and any changes in valuation inputs or techniques. In addition, investments shall be disclosed by major category. This information is disclosed following the Fund's Portfolio of Investments.
Derivative Instruments
The Fund invests in certain derivative instruments, as detailed below, to meet its investment objectives. Derivatives are instruments whose values depend on, or are derived from, in whole or in part, the value of one or more securities, currencies, commodities, indices, or other assets or instruments. Derivatives may be used to increase investment flexibility (including to maintain cash reserves while maintaining desired exposure to certain assets), for risk management (hedging) purposes, to facilitate trading, to reduce transaction costs and to pursue higher investment returns. The Fund may also use derivative instruments to mitigate certain investment risks, such as foreign currency exchange rate risk, interest rate risk and credit risk. Derivatives may involve various risks, including the potential inability of the counterparty to fulfill its obligation under the terms of the contract, the potential for an illiquid secondary market (making it difficult for the Fund to sell, including at favorable prices) and the potential for market movements which may expose the Fund to gains or losses in excess of the amount shown in the Statement of Assets and Liabilities. The notional amounts of derivative instruments, if applicable, are not recorded in the financial statements.
A derivative instrument may suffer a marked-to-market loss if the value of the contract decreases due to an unfavorable change in the market rates or values of the underlying instrument. Losses can also occur if the
counterparty does not perform under the contract. The Fund's risk of loss from counterparty credit risk on over-the-counter derivatives is generally limited to the aggregate unrealized gain netted against any collateral held by the Fund and the amount of any variation margin held by the counterparty. With exchange-traded or centrally cleared derivatives, there is reduced counterparty credit risk to the Fund since the exchange's clearinghouse, as counterparty to such instruments, guarantees against a possible default. The clearinghouse stands between the buyer and the seller of the contract; therefore, the counterparty credit risk is failure of the clearinghouse. However, credit risk still exists in exchange-traded or centrally cleared derivatives with respect to initial and variation margin that is held in a broker's customer account. While brokers are required to segregate customer margin from their own assets, in the event that a broker becomes insolvent or goes into bankruptcy and at that time there is a shortfall in the aggregate amount of margin held by the broker for all its clients, U.S. bankruptcy laws will typically allocate that shortfall on a pro-rata basis across all the broker's customers (including the Fund), potentially resulting in losses to the Fund.
In order to better define its contractual rights and to secure rights that will help the Fund mitigate its counterparty risk, the Fund may enter into an International Swaps and Derivatives Association, Inc. Master Agreement (ISDA Master Agreement) or similar agreement with its derivatives contract counterparties. An ISDA Master Agreement is an agreement between the Fund and a counterparty that governs over-the-counter derivatives and forward foreign currency exchange contracts and typically contains, among other things, collateral posting terms and netting provisions in the event of a default and/or termination event. Under an ISDA Master Agreement, the Fund may, under certain circumstances, offset with the counterparty certain derivative instrument's payables and/or receivables with collateral held and/or posted and create one single net payment. The provisions of the ISDA Master Agreement typically permit a single net payment in the event of default (close-out netting) including the bankruptcy or insolvency of the counterparty. Note, however, that bankruptcy or insolvency laws of a particular jurisdiction may impose restrictions on or prohibitions against the right of offset in bankruptcy, insolvency or other events.
Collateral (margin) requirements differ by type of derivative. Margin requirements are established by the exchange or clearinghouse for exchange-traded and
Annual Report 2016
28
COLUMBIA U.S. SOCIAL BOND FUND
NOTES TO FINANCIAL STATEMENTS (continued)
July 31, 2016
centrally cleared derivatives. Brokers can ask for margin in excess of the minimum in certain circumstances. Collateral terms are contract specific for over-the-counter derivatives. For over-the-counter derivatives traded under an ISDA Master Agreement, the collateral requirements are typically calculated by netting the marked-to-market amount for each transaction under such agreement and comparing that amount to the value of any variation margin currently pledged by the Fund and/or the counterparty. Generally, the amount of collateral due from or to a party has to exceed a minimum transfer amount threshold (e.g., $500,000) before a transfer has to be made. To the extent amounts due to the Fund from its counterparties are not fully collateralized, contractually or otherwise, the Fund bears the risk of loss from counterparty nonperformance. The Fund attempts to mitigate counterparty risk by only entering into agreements with counterparties that it believes have the financial resources to honor their obligations and by monitoring the financial stability of those counterparties.
Certain ISDA Master Agreements allow counterparties to over-the-counter derivatives transactions to terminate derivatives contracts prior to maturity in the event the Fund's net asset value declines by a stated percentage over a specified time period or if the Fund fails to meet certain terms of the ISDA Master Agreement, which would cause the Fund to accelerate payment of any net liability owed to the counterparty. The Fund also has termination rights if the counterparty fails to meet certain terms of the ISDA Master Agreement. In addition to considering counterparty credit risk, the Fund would consider terminating the derivatives contracts based on whether termination would result in a net liability owed from the counterparty.
For financial reporting purposes, the Fund does not offset derivative assets and derivative liabilities that are subject to netting arrangements in the Statement of Assets and Liabilities.
Futures Contracts
Futures contracts are exchange traded and represent commitments for the future purchase or sale of an asset at a specified price on a specified date. The Fund bought and sold futures contracts to manage the duration and yield curve exposure of the Fund versus the benchmark. These instruments may be used for other purposes in future periods. Upon entering into futures contracts, the Fund bears risks that it may not achieve the anticipated benefits of the futures contracts and may realize a loss. Additional risks include counterparty credit risk, the
possibility of an illiquid market, and that a change in the value of the contract or option may not correlate with changes in the value of the underlying asset.
Upon entering into a futures contract, the Fund pledges cash or securities with the broker in an amount sufficient to meet the initial margin requirement. The initial margin deposit must be maintained at an established level over the life of the contract. Cash deposited as initial margin is recorded in the Statement of Assets and Liabilities as margin deposits. Securities deposited as initial margin are designated in the Portfolio of Investments. Subsequent payments (variation margin) are made or received by the Fund each day. The variation margin payments are equal to the daily change in the contract value and are recorded as variation margin receivable or payable and are offset in unrealized gains or losses. The Fund recognizes a realized gain or loss when the contract is closed or expires. Futures contracts involve, to varying degrees, risk of loss in excess of the variation margin disclosed in the Statement of Assets and Liabilities.
Effects of Derivative Transactions in the Financial Statements
The following tables are intended to provide additional information about the effect of derivatives on the financial statements of the Fund, including: the fair value of derivatives by risk category and the location of those fair values in the Statement of Assets and Liabilities; and the impact of derivative transactions over the period in the Statement of Operations, including realized and unrealized gains (losses). The derivative instrument schedules following the Portfolio of Investments present additional information regarding derivative instruments outstanding at the end of the period, if any.
The following table is a summary of the fair value of derivative instruments (not considered to be hedging instruments for accounting disclosure purposes) at July 31, 2016:
Liability Derivatives | |
Risk Exposure
Category | | Statement of Assets and
Liabilities Location | | Fair Value ($) | |
Interest rate risk
| | Net assets — unrealized
depreciation on futures
contracts | | | 23,310 | * | |
*Includes cumulative appreciation (depreciation) as reported in the tables following the Portfolio of Investments. Only the current day's variation margin is reported in receivables or payables in the Statement of Assets and Liabilities.
Annual Report 2016
29
COLUMBIA U.S. SOCIAL BOND FUND
NOTES TO FINANCIAL STATEMENTS (continued)
July 31, 2016
The following table indicates the effect of derivative instruments (not considered to be hedging instruments for accounting disclosure purposes) in the Statement of Operations for the year ended July 31, 2016:
Change in Unrealized Appreciation (Depreciation) on
Derivatives Recognized in Income | |
Risk Exposure Category | | Futures Contracts ($) | |
Interest rate risk | | | (23,310 | ) | |
The following table provides a summary of the average outstanding volume by derivative instrument for the year ended July 31, 2016:
Derivative Instrument | | Average Notional
Amounts ($)* | |
Futures contracts — Short | | | 151,743 | | |
*Based on the daily outstanding amounts for the year ended July 31, 2016.
Delayed Delivery Securities
The Fund may trade securities on other than normal settlement terms, including securities purchased or sold on a "when-issued" basis. This may increase risk to the Fund since the other party to the transaction may fail to deliver, which could cause the Fund to subsequently invest at less advantageous prices. The Fund designates cash or liquid securities in an amount equal to the delayed delivery commitment.
Security Transactions
Security transactions are accounted for on the trade date. Cost is determined and gains (losses) are based upon the specific identification method for both financial statement and federal income tax purposes.
Income Recognition
Interest income is recorded on an accrual basis. Market premiums and discounts, including original issue discounts, are amortized and accreted, respectively, over the expected life of the security on all debt securities, unless otherwise noted.
The Fund may place a debt security on non-accrual status and reduce related interest income when it becomes probable that the interest will not be collected and the amount of uncollectible interest can be reasonably estimated. A defaulted debt security is removed from non-accrual status when the issuer resumes interest payments or when collectability of interest is reasonably assured.
Dividend income is recorded on the ex-dividend date.
Expenses
General expenses of the Trust are allocated to the Fund and other funds of the Trust based upon relative net assets or other expense allocation methodologies determined by the nature of the expense. Expenses directly attributable to the Fund are charged to the Fund. Expenses directly attributable to a specific class of shares are charged to that share class.
Determination of Class Net Asset Value
All income, expenses (other than class-specific expenses, which are charged to that share class, as shown in the Statement of Operations) and realized and unrealized gains (losses) are allocated to each class of the Fund on a daily basis, based on the relative net assets of each class, for purposes of determining the net asset value of each class.
Federal Income Tax Status
The Fund intends to qualify each year as a regulated investment company under Subchapter M of the Internal Revenue Code, as amended, and will distribute substantially all of its tax exempt and taxable income (including net short-term capital gains), if any, for its tax year, and as such will not be subject to federal income taxes. In addition, the Fund intends to distribute in each calendar year substantially all of its net investment income, capital gains and certain other amounts, if any, such that the Fund should not be subject to federal excise tax. Therefore, no federal income or excise tax provision is recorded.
Distributions to Shareholders
Distributions from net investment income, if any, are declared daily and paid monthly. Net realized capital gains, if any, are distributed at least annually. Income distributions and capital gain distributions are determined in accordance with federal income tax regulations, which may differ from GAAP.
Guarantees and Indemnifications
Under the Trust's organizational documents and, in some cases, by contract, its officers and trustees are indemnified against certain liabilities arising out of the performance of their duties to the Trust or its funds. In addition, certain of the Fund's contracts with its service providers contain general indemnification clauses. The Fund's maximum exposure under these arrangements is unknown since the amount of any future claims that may be made against the Fund cannot be determined, and
Annual Report 2016
30
COLUMBIA U.S. SOCIAL BOND FUND
NOTES TO FINANCIAL STATEMENTS (continued)
July 31, 2016
the Fund has no historical basis for predicting the likelihood of any such claims.
Note 3. Fees and Other Transactions with Affiliates
Management Services Fees
Effective December 1, 2015, the Fund entered into a Management Agreement with Columbia Management Investment Advisers, LLC (the Investment Manager), a wholly-owned subsidiary of Ameriprise Financial, Inc. (Ameriprise Financial). Under the Management Agreement, the Investment Manager provides the Fund with investment research and advice, as well as administrative and accounting services. The management services fee is an annual fee that is equal to a percentage of the Fund's average daily net assets that declines from 0.57% to 0.54% as the Fund's net assets increase. Prior to December 1, 2015, the Fund paid the Investment Manager an annual fee for advisory services under an Investment Management Services Agreement and a separate annual fee for administrative and accounting services under an Administrative Services Agreement. The effective management services fee rate for the year ended July 31, 2016 (reflecting all advisory and administrative services fees paid to the Investment Manager) was 0.57% of the Fund's average daily net assets. For the period from August 1, 2015 through November 30, 2015, the investment advisory services fee paid to the Investment Manager was $33,567, and the administrative services fee paid to the Investment Manager was $4,699.
Subadvisory Agreement
The Fund's Board has approved a subadvisory agreement between the Investment Manager and Threadneedle International Limited (Threadneedle), an affiliate of the Investment Manager and an indirect wholly-owned subsidiary of Ameriprise Financial. As of July 31, 2016, Threadneedle is not providing services to the Fund pursuant to the subadvisory agreement.
Offering Costs
Offering costs were incurred prior to the shares of the Fund being offered. Offering costs include, among other things, state registration filing fees and printing costs. The Fund amortizes offering costs over a period of 12 months from the commencement of operations.
Compensation of Board Members
Board members, who are not officers or employees of the Investment Manager or Ameriprise Financial, are compensated for their services to the Fund as disclosed in the Statement of Operations. These Board members may participate in a Deferred Compensation Plan (the Plan) which may be terminated at any time. Obligations of the Plan will be paid solely out of the Fund's assets, and all amounts payable under the Plan constitute a general unsecured obligation of the Fund.
Compensation of Chief Compliance Officer
The Board has appointed a Chief Compliance Officer to the Fund in accordance with federal securities regulations. The Fund is allocated a portion of the expenses associated with the Chief Compliance Officer based on relative net assets of the Trust.
Transfer Agency Fees
Under a Transfer and Dividend Disbursing Agent Agreement, Columbia Management Investment Services Corp. (the Transfer Agent), an affiliate of the Investment Manager and a wholly-owned subsidiary of Ameriprise Financial, is responsible for providing transfer agency services to the Fund. The Transfer Agent has contracted with Boston Financial Data Services (BFDS) to serve as sub-transfer agent.
The Transfer Agent receives a monthly transfer agency fee based on the number or the average value of accounts, depending on the type of account. In addition, the Transfer Agent also receives sub-transfer agency fees based on a percentage of the average aggregate value of the Fund's shares maintained in omnibus accounts (other than omnibus accounts for which American Enterprise Investment Services Inc. is the broker of record or accounts where the beneficial shareholder is a customer of Ameriprise Financial Services, Inc., for which the Transfer Agent receives a per account fee). The Transfer Agent pays the fees of BFDS for services as sub-transfer agent and BFDS is not entitled to reimbursement for such fees from the Fund (with the exception of out-of-pocket fees).
The Transfer Agent also receives compensation from the Fund for various shareholder services and reimbursements for certain out-of-pocket fees. Total transfer agency fees for Class R5 shares are subject to an annual limitation of not more than 0.05% of the average daily net assets attributable to Class R5 shares.
Annual Report 2016
31
COLUMBIA U.S. SOCIAL BOND FUND
NOTES TO FINANCIAL STATEMENTS (continued)
July 31, 2016
For the year ended July 31, 2016, the Fund's effective transfer agency fee rates as a percentage of average daily net assets of each class were as follows:
Class A | | | 0.01 | % | |
Class C | | | 0.01 | | |
Class R4 | | | 0.01 | | |
Class R5 | | | 0.05 | | �� |
Class Z | | | 0.01 | | |
An annual minimum account balance fee of $20 may apply to certain accounts with a value below the applicable share class's initial minimum investment requirements to reduce the impact of small accounts on transfer agency fees. These minimum account balance fees are remitted to the Fund and recorded as part of expense reductions in the Statement of Operations. For the year ended July 31, 2016, no minimum account balance fees were charged by the Fund.
Distribution and Service Fees
The Fund has an agreement with Columbia Management Investment Distributors, Inc. (the Distributor), an affiliate of the Investment Manager and a wholly-owned subsidiary of Ameriprise Financial, for distribution and shareholder services. The Board has approved, and the Fund has adopted, distribution and shareholder service plans (the Plans) applicable to certain share classes, which set the distribution and service fees for the Fund. These fees are calculated daily and are intended to compensate the Distributor and/or eligible selling and/or servicing agents for selling shares of the Fund and providing services to investors.
Under the Plans, the Fund pays a monthly service fee to the Distributor at the maximum annual rate of 0.25% of the average daily net assets attributable to Class A and Class C shares of the Fund. Also under the Plans, the Fund pays a monthly distribution fee to the Distributor at the maximum annual rates of 0.75% of the average daily net assets attributable to Class C shares of the Fund.
Sales Charges
Sales charges, including front-end charges and CDSCs, received by the Distributor for distributing Fund shares were $11,261 for Class A shares for the year ended July 31, 2016.
Expenses Waived/Reimbursed by the Investment Manager and its Affiliates
The Investment Manager and certain of its affiliates have contractually agreed to waive fees and/or reimburse expenses (excluding certain fees and expenses
described below) for the period disclosed below, unless sooner terminated at the sole discretion of the Board, so that the Fund's net operating expenses, after giving effect to fees waived/expenses reimbursed and any balance credits and/or overdraft charges from the Fund's custodian, do not exceed the following annual rates as a percentage of the class' average daily net assets:
| | | Fee Rates Contractual
through
November 30, 2016 | |
Class A | | | 0.95 | % | |
Class C | | | 1.70 | | |
Class R4 | | | 0.70 | | |
Class R5 | | | 0.60 | | |
Class Z | | | 0.70 | | |
Under the agreement, the following fees and expenses are excluded from the waiver/reimbursement commitment, and therefore will be paid by the Fund, if applicable: taxes (including foreign transaction taxes), expenses associated with investments in affiliated and non-affiliated pooled investment vehicles (including mutual funds and exchange-traded funds), transaction costs and brokerage commissions, costs related to any securities lending program, dividend and interest expenses associated with securities sold short, inverse floater program fees and expenses, transaction charges and interest on borrowed money, interest, infrequent and/or unusual expenses and any other expenses the exclusion of which is specifically approved by the Board. This agreement may be modified or amended only with approval from the Investment Manager, certain of its affiliates and the Fund. In addition to the contractual agreement, the Investment Manager and certain of its affiliates have voluntarily agreed to waive fees and/or reimburse Fund expenses (excluding certain fees and expenses described above) so that Fund level expenses (expenses directly attributable to the Fund and not to a specific share class) are waived proportionately across all share classes, but the Fund's net operating expenses shall not exceed the contractual annual rates listed in the table above. This arrangement may be revised or discontinued at any time. Any fees waived and/or expenses reimbursed under the expense reimbursement arrangements described above are not recoverable by the Investment Manager or its affiliates in future periods.
Note 4. Federal Tax Information
The timing and character of income and capital gain distributions are determined in accordance with income tax regulations, which may differ from GAAP because of temporary or permanent book to tax differences.
Annual Report 2016
32
COLUMBIA U.S. SOCIAL BOND FUND
NOTES TO FINANCIAL STATEMENTS (continued)
July 31, 2016
At July 31, 2016, these differences are primarily due to differing treatment for capital loss carryforwards, Trustees' deferred compensation, distributions, derivative investments and principal and/or interest of fixed income securities. To the extent these differences are permanent, reclassifications are made among the components of the Fund's net assets in the Statement of Assets and Liabilities. Temporary differences do not require reclassifications.
The Fund did not have any permanent differences; therefore, no reclassifications were made to the Statement of Assets and Liabilities.
The tax character of distributions paid during the years indicated was as follows:
Year Ended July 31, | | 2016 | | 2015 | |
Ordinary income | | $ | 46,676 | | | $ | 8,074 | | |
Tax-exempt income | | | 396,841 | | | | 53,320 | | |
Total | | $ | 443,517 | | | $ | 61,394 | | |
Short-term capital gain distributions, if any, are considered ordinary income distributions for tax purposes.
At July 31, 2016, the components of distributable earnings on a tax basis were as follows:
Undistributed tax-exempt income | | | 55,426 | | |
Capital loss carryforwards | | | (38,010 | ) | |
Net unrealized appreciation | | | 1,168,488 | | |
At July 31, 2016, the cost of investments for federal income tax purposes was $30,550,733 and the aggregate gross unrealized appreciation and depreciation based on that cost was:
Unrealized appreciation | | $ | 1,273,660 | | |
Unrealized depreciation | | | (105,172 | ) | |
Net unrealized appreciation | | $ | 1,168,488 | | |
The following capital loss carryforwards, determined at July 31, 2016, may be available to reduce taxable income arising from future net realized gains on investments, if any, to the extent permitted by the Internal Revenue Code:
Year of Expiration | | Amount ($) | |
No expiration — short-term | | | 38,010 | | |
Management of the Fund has concluded that there are no significant uncertain tax positions in the Fund that would require recognition in the financial statements. However, management's conclusion may be subject to review and adjustment at a later date based on factors
including, but not limited to, new tax laws, regulations, and administrative interpretations (including relevant court decisions). Generally, the Fund's federal tax returns for the prior three fiscal years remain subject to examination by the Internal Revenue Service.
Note 5. Portfolio Information
The cost of purchases and proceeds from sales of securities, excluding short-term investments and derivatives, if any, aggregated to $15,643,609 and $5,517,222, respectively, for the year ended July 31, 2016. The amount of purchase and sale activity impacts the portfolio turnover rate reported in the Financial Highlights.
Note 6. Line of Credit
The Fund has access to a revolving credit facility whereby the Fund may borrow for the temporary funding of shareholder redemptions or for other temporary or emergency purposes. Effective December 8, 2015, Citibank, N.A. and HSBC Bank USA, N.A. joined JPMorgan Chase Bank, N.A. (JPMorgan) as lead of a syndicate of banks under the credit facility, which is a collective agreement between the Fund and certain other funds managed by the Investment Manager, severally and not jointly, that permits collective borrowings up to $1 billion. Interest is charged to each participating fund based on its borrowings at a rate equal to the higher of (i) the overnight federal funds rate plus 1.00% or (ii) the one-month LIBOR rate plus 1.00%. Each borrowing under the credit facility matures no later than 60 days after the date of borrowing. The Fund also pays a commitment fee equal to its pro rata share of the amount of the credit facility at a rate of 0.15% per annum. The commitment fee is included in other expenses in the Statement of Operations. Prior to December 8, 2015, JPMorgan was the sole lead bank under the credit facility agreement that permitted borrowings up to $550 million under the same terms and interest rates as described above with the exception of the commitment fee which was charged at a rate of 0.075% per annum.
The Fund had no borrowings during the year ended July 31, 2016.
Note 7. Significant Risks
Shareholder Concentration Risk
At July 31, 2016, affiliated shareholders of record owned 91.2% of the outstanding shares of the Fund in one or more accounts. Subscription and redemption activity by concentrated accounts may have a significant effect on the operations of the Fund. In the case of a large
Annual Report 2016
33
COLUMBIA U.S. SOCIAL BOND FUND
NOTES TO FINANCIAL STATEMENTS (continued)
July 31, 2016
redemption, the Fund may be forced to sell investments at inopportune times, including its liquid or more liquid positions, resulting in Fund losses and the Fund holding a higher percentage of less liquid or illiquid securities. Large redemptions could result in decreased economies of scale and increased operating expenses for non-redeeming Fund shareholders.
Credit Risk
Credit risk is the risk that the value of debt securities in the Fund's portfolio may decline because the issuer may default and fail to pay interest or repay principal when due. Rating agencies assign credit ratings to debt securities to indicate their credit risk. Lower rated or unrated debt securities held by the Fund may present increased credit risk as compared to higher-rated debt securities.
Interest Rate Risk
Interest rate risk is the risk of losses attributable to changes in interest rates. In general, if prevailing interest rates rise, the values of debt securities tend to fall, and if interest rates fall, the values of debt securities tend to rise. Actions by governments and central banking authorities can result in increases in interest rates. Increasing interest rates may negatively affect the value of debt securities held by the Fund, resulting in a negative impact on the Fund's performance and net asset value per share. In general, the longer the maturity or duration of a debt security, the greater its sensitivity to changes in interest rates.
Liquidity Risk
Liquidity risk is the risk associated with a lack of marketability of investments which may make it difficult to sell the investment at a desirable time or price. Changing regulatory, market or other conditions or environments (for example, the interest rate or credit environments) may adversely affect the liquidity of the Fund's investments. The Fund may have to accept a lower selling price for the holding, sell other investments, or forego another, more appealing investment opportunity. Generally, the less liquid the market at the time the Fund sells a portfolio investment, the greater the risk of loss or decline of value to the Fund. A less liquid market can lead to an increase in Fund redemptions, which may negatively impact Fund performance and net asset value per share, including, for example, if the Fund is forced to sell securities in a down market.
Non-Diversification Risk
A non-diversified fund is permitted to invest a greater percentage of its total assets in fewer issuers than a diversified fund. The Fund may, therefore, have a greater
risk of loss from a few issuers than a similar fund that invests more broadly.
Social Impact Risk
Social impact investing may increase risk due to the limitations and constraints involved in investment selection and, as a result, the Fund may underperform other funds that do not consider the social impact.
Note 8. Subsequent Events
Management has evaluated the events and transactions that have occurred through the date the financial statements were issued and noted no items requiring adjustment of the financial statements or additional disclosure.
Note 9. Information Regarding Pending and Settled Legal Proceedings
Ameriprise Financial and certain of its affiliates have historically been involved in a number of legal, arbitration and regulatory proceedings, including routine litigation, class actions, and governmental actions, concerning matters arising in connection with the conduct of their business activities. Ameriprise Financial believes that the Funds are not currently the subject of, and that neither Ameriprise Financial nor any of its affiliates are the subject of, any pending legal, arbitration or regulatory proceedings that are likely to have a material adverse effect on the Funds or the ability of Ameriprise Financial or its affiliates to perform under their contracts with the Funds. Ameriprise Financial is required to make quarterly (10-Q), annual (10-K) and, as necessary, 8-K filings with the Securities and Exchange Commission (SEC) on legal and regulatory matters that relate to Ameriprise Financial and its affiliates. Copies of these filings may be obtained by accessing the SEC website at www.sec.gov.
There can be no assurance that these matters, or the adverse publicity associated with them, will not result in increased fund redemptions, reduced sale of fund shares or other adverse consequences to the Funds. Further, although we believe proceedings are not likely to have a material adverse effect on the Funds or the ability of Ameriprise Financial or its affiliates to perform under their contracts with the Funds, these proceedings are subject to uncertainties and, as such, we are unable to estimate the possible loss or range of loss that may result. An adverse outcome in one or more of these proceedings could result in adverse judgments, settlements, fines, penalties or other relief that could have a material adverse effect on the consolidated financial condition or results of operations of Ameriprise Financial.
Annual Report 2016
34
COLUMBIA U.S. SOCIAL BOND FUND
REPORT OF INDEPENDENT REGISTERED PUBLIC ACCOUNTING FIRM
To the Trustees of Columbia Funds Series Trust I and the Shareholders of
Columbia U.S. Social Bond Fund
In our opinion, the accompanying statement of assets and liabilities, including the portfolio of investments, and the related statements of operations and of changes in net assets and the financial highlights present fairly, in all material respects, the financial position of Columbia U.S. Social Bond Fund (the "Fund", a series of Columbia Funds Series Trust I) at July 31, 2016, and the results of its operations, the changes in its net assets and the financial highlights for each of the periods indicated, in conformity with accounting principles generally accepted in the United States of America. These financial statements and financial highlights (hereafter referred to as "financial statements") are the responsibility of the Fund's management. Our responsibility is to express an opinion on these financial statements based on our audits. We conducted our audits of these financial statements in accordance with the standards of the Public Company Accounting Oversight Board (United States). Those standards require that we plan and perform the audit to obtain reasonable assurance about whether the financial statements are free of material misstatement. An audit includes examining, on a test basis, evidence supporting the amounts and disclosures in the financial statements, assessing the accounting principles used and significant estimates made by management, and evaluating the overall financial statement presentation. We believe that our audits, which included confirmation of securities at July 31, 2016 by correspondence with the custodian and brokers, and the application of alternative auditing procedures where such confirmations had not been received, provide a reasonable basis for our opinion.
PricewaterhouseCoopers LLP
Minneapolis, MN
September 21, 2016
Annual Report 2016
35
COLUMBIA U.S. SOCIAL BOND FUND
FEDERAL INCOME TAX INFORMATION
(Unaudited)
The Fund hereby designates the following tax attributes for the fiscal year ended July 31, 2016. Shareholders will be notified in early 2017 of the amounts for use in preparing 2016 income tax returns.
Tax Designations:
Exempt-Interest Dividends | | | 89.48 | % | |
Exempt-Interest Dividends. The percentage of net investment income distributed during the fiscal year that qualifies as exempt-interest dividends for federal income tax purposes. A portion of the income may be subject to federal alternative minimum tax.
Annual Report 2016
36
COLUMBIA U.S. SOCIAL BOND FUND
Shareholders elect the Board that oversees the Fund's operations. The Board appoints officers who are responsible for day-to-day business decisions based on policies set by the Board. The following table provides basic biographical information about the Fund's Trustees, including their principal occupations during the past five years, although specific titles for individuals may have varied over the period. The year set forth beneath Length of Service in the table below is the year in which the Trustee was first appointed or elected as Trustee to any Fund currently in the Columbia Funds Complex or a predecessor thereof. Under current Board policy, members serve terms of indefinite duration.
Trustees
Independent Trustees
Name,
Address,
Year of Birth | | Position Held With
the Trust and Length of
Service | | Principal Occupation(s)
During the Past Five Years
and Other Relevant
Professional Experience | | Number of
Funds in the
Columbia Funds
Complex
Overseen | | Other Directorships
Held by Trustee During
the Past Five Years | |
Janet Langford Carrig
c/o Columbia
Management Investment Advisers, LLC,
225 Franklin Street
Mail Drop BX32 05228,
Boston, MA 02110
1957 | | Trustee 1996 | | Senior Vice President, General Counsel and Corporate Secretary, ConocoPhillips (integrated energy company) since September 2007 | | | 56 | | | None | |
Douglas A. Hacker
c/o Columbia Management Investment Advisers, LLC,
225 Franklin Street
Mail Drop BX32 05228,
Boston, MA 02110
1955 | | Trustee and Chairman of the Board 1996 | | Independent business executive since May 2006; Executive Vice President — Strategy of United Airlines from December 2002 to May 2006; President of UAL Loyalty Services (airline marketing company) from September 2001 to December 2002; Executive Vice President and Chief Financial Officer of United Airlines from July 1999 to September 2001 | | | 56 | | | Spartan Nash Company (food distributor); Nash Finch Company (food distributor) from 2005 to 2013; Aircastle Limited (aircraft leasing); SeaCube Container Leasing Ltd. (container leasing) from 2010 to 2013; and Travelport Worldwide Limited (travel information technology) | |
Nancy T. Lukitsh
c/o Columbia Management Investment Advisers, LLC,
225 Franklin Street
Mail Drop BX32 05228,
Boston, MA 02110
1956 | | Trustee 2011 | | Senior Vice President, Partner and Director of Marketing, Wellington Management Company, LLP (investment adviser) from 1997 to 2010; Chair, Wellington Management Portfolios (commingled non-U.S. investment pools) from 2007 to 2010; Director, Wellington Trust Company, NA and other Wellington affiliates from 1997 to 2010 | | | 56 | | | None | |
Annual Report 2016
37
COLUMBIA U.S. SOCIAL BOND FUND
TRUSTEES AND OFFICERS (continued)
Independent Trustees (continued)
Name,
Address,
Year of Birth | | Position Held With
the Trust and Length of
Service | | Principal Occupation(s)
During the Past Five Years
and Other Relevant
Professional Experience | | Number of
Funds in the
Columbia Funds
Complex
Overseen | | Other Directorships
Held by Trustee During
the Past Five Years | |
William E. Mayer
c/o Columbia Management Investment Advisers, LLC,
225 Franklin Street
Mail Drop BX32 05228,
Boston, MA 02110
1940 | | Trustee 1991 | | Partner, Park Avenue Equity Partners (private equity) since February 1999 | | | 56 | | | DynaVox Inc. (speech creation); Lee Enterprises (print media); WR Hambrecht + Co. (financial service provider) from 2000 to 2012; BlackRock Capital Investment Corporation (investment company); and Premier, Inc. (healthcare) | |
David M. Moffett
c/o Columbia Management Investment Advisers, LLC,
225 Franklin Street
Mail Drop BX32 05228,
Boston, MA 02110
1952 | | Trustee 2011 | | Retired. Consultant to Bridgewater and Associates | | | 56 | | | Director of CIT Bank, CIT Group Inc. (commercial and consumer finance); eBay Inc. (online trading community); Genworth Financial, Inc. (financial and insurance products and services); Paypal Holdings Inc. (payment and data processing services); and Trustee University of Oklahoma Foundation | |
Charles R. Nelson
c/o Columbia Management Investment Advisers, LLC,
225 Franklin Street
Mail Drop BX32 05228,
Boston, MA 02110
1942 | | Trustee 1981 | | Retired. Professor Emeritus, University of Washington since 2011; Professor of Economics, University of Washington from 1976 to 2011; Ford and Louisa Van Voorhis Professor of Political Economy, University of Washington from 1993 to 2011; Adjunct Professor of Statistics, University of Washington from 1980 to 2011; Associate Editor, Journal of Money, Credit and Banking from September 1993 to 2008; consultant on econometric and statistical matters | | | 56 | | | None | |
John J. Neuhauser
c/o Columbia Management Investment Advisers, LLC,
225 Franklin Street
Mail Drop BX32 05228,
Boston, MA 02110
1943 | | Trustee 1984 | | President, Saint Michael's College since August 2007; Director or Trustee of several non-profit organizations, including University of Vermont Medical Center; Academic Vice President and Dean of Faculties, Boston College from August 1999 to October 2005; University Professor, Boston College from November 2005 to August 2007 | | | 56 | | | Liberty All-Star Equity Fund and Liberty All-Star Growth Fund (closed-end funds) | |
Annual Report 2016
38
COLUMBIA U.S. SOCIAL BOND FUND
TRUSTEES AND OFFICERS (continued)
Independent Trustees (continued)
Name,
Address,
Year of Birth | | Position Held With
the Trust and Length of
Service | | Principal Occupation(s)
During the Past Five Years
and Other Relevant
Professional Experience | | Number of
Funds in the
Columbia Funds
Complex
Overseen | | Other Directorships
Held by Trustee During
the Past Five Years | |
Patrick J. Simpson
c/o Columbia Management Investment Advisers, LLC,
225 Franklin Street
Mail Drop BX32 05228,
Boston, MA 02110
1944 | | Trustee 2000 | | Of Counsel, Perkins Coie LLP (law firm) since 2015; Partner, Perkins Coie LLP from 1988 to 2014 | | | 56 | | | None | |
Anne-Lee Verville
c/o Columbia Management Investment Advisers, LLC,
225 Franklin Street
Mail Drop BX32 05228,
Boston, MA 02110
1945 | | Trustee 1998 | | Retired. General Manager, Global Education Industry from 1994 to 1997, President — Application Systems Division from 1991 to 1994, Chief Financial Officer — US Marketing & Services from 1988 to 1991, and Chief Information Officer from 1987 to 1988, IBM Corporation (computer and technology) | | | 56 | | | Enesco Group, Inc. (producer of giftware and home and garden decor products) from 2001 to 2006 | |
Consultant to the Trustees*
Name,
Address,
Year of Birth | | Position Held With
the Trust and Length of
Service | | Principal Occupation(s)
During the Past Five Years
and Other Relevant
Professional Experience | | Number of
Funds in the
Columbia Funds
Complex
Overseen | | Other Directorships
Held by Trustee During
the Past Five Years | |
J. Kevin Connaughton
c/o Columbia
Management Investment Advisers, LLC,
225 Franklin Street
Mail Drop BX32 05228,
Boston, MA 02110
1964 | | Trustee Consultant 2016 | | Trustee Consultant, Columbia Funds since March 2016; Managing Director and General Manager of Mutual Fund Products, Columbia Management Investment Advisers, LLC from May 2010 to February 2015; President, Columbia Funds from 2009 to 2015; and senior officer of Columbia Funds and affiliated funds from 2003 to 2015 | | | 56 | | | Board of Governors, Gateway Healthcare since January 2016; Trustee, New Century Portfolios since March 2015; and Director, The Autism Project since March 2015 | |
* J. Kevin Connaughton was appointed consultant to the Trustees effective March 1, 2016. Shareholders of the Funds are expected to be asked to elect Mr. Connaughton as a Trustee at a future shareholder meeting.
Annual Report 2016
39
COLUMBIA U.S. SOCIAL BOND FUND
TRUSTEES AND OFFICERS (continued)
Interested Trustee Affiliated with Investment Manager*
Name,
Address,
Year of Birth | | Position Held With
the Trust and Length of
Service | | Principal Occupation(s)
During the Past Five Years
and Other Relevant
Professional Experience | | Number of
Funds in the
Columbia Funds
Complex
Overseen | | Other Directorships
Held by Trustee During
the Past Five Years | |
William F. Truscott
c/o Columbia Management Investment Advisers, LLC,
225 Franklin Street
Boston, MA 02110
1960 | | Trustee 2012 | | Chairman of the Board and President, Columbia Management Investment Advisers, LLC since May 2010 and February 2012, respectively; Chief Executive Officer, Global Asset Management, Ameriprise Financial, Inc. since September 2012 (previously Chief Executive Officer, U.S. Asset Management & President, Annuities, May 2010- September 2012); Director and Chief Executive Officer, Columbia Management Investment Distributors, Inc. since May 2010 and February 2012, respectively; Chairman of the Board and Chief Executive Officer, RiverSource Distributors, Inc. since 2006; Director, Threadneedle Asset Management Holdings, SARL since 2014; President and Chief Executive Officer, Ameriprise Certificate Company, 2006-August 2012. | | | 175 | | | Chairman of the Board, Columbia Management Investment Advisers, LLC since May 2010; Director, Columbia Management Investment Distributors, Inc. since May 2010; Former Director, Ameriprise Certificate Company, 2006-January 2013 | |
* Interested person (as defined under the 1940 Act) by reason of being an officer, director, security holder and/or employee of the Investment Manager or Ameriprise Financial.
The Statement of Additional Information has additional information about the Fund's Board members and is available, without charge, upon request by calling 800.345.6611; contacting your financial intermediary; or visiting investor.columbiathreadneedle.com/us.
Annual Report 2016
40
COLUMBIA U.S. SOCIAL BOND FUND
TRUSTEES AND OFFICERS (continued)
The Board has appointed officers who are responsible for day-to-day business decisions based on policies it has established. The officers serve at the pleasure of the Board. The following table provides basic information about the Officers of the Fund, including principal occupations during the past five years, although their specific titles may have varied over the period. In addition to Mr. Truscott, who is Senior Vice President, the Fund's other officers are:
Fund Officers
Name,
Address and
Year of Birth | | Position and Year
First Appointed to
Position for any Fund
in the Columbia
Funds Complex or a
Predecessor Thereof | |
Principal Occupation(s) During Past Five Years | |
Christopher O. Petersen
5228 Ameriprise Financial Center
Minneapolis, MN 55474
Born 1970 | | President and Principal Executive Officer (2015) | | Vice President and Lead Chief Counsel, Ameriprise Financial, Inc. since January 2015 (previously, Vice President and Chief Counsel January 2010-December 2014; officer of Columbia Funds and affiliated funds since 2007. | |
Michael G. Clarke
225 Franklin Street
Boston, MA 02110
Born 1969 | | Treasurer (2011), Chief Financial Officer (2009) and Chief Accounting Officer (2015) | | Vice President — Mutual Fund Administration, Columbia Management Investment Advisers, LLC, since May 2010; senior officer of Columbia Funds and affiliated funds since 2002. | |
Paul B. Goucher
100 Park Avenue
New York, NY 10017
Born 1968 | | Senior Vice President (2011), Chief Legal Officer (2015) and Assistant Secretary (2008) | | Vice President and Lead Chief Counsel, Ameriprise Financial, Inc. since November 2008 and January 2013, respectively (previously Chief Counsel, January 2010-January 2013); Vice President, Chief Legal Officer and Assistant Secretary, Columbia Management Investment Advisers, LLC since May 2010. | |
Thomas P. McGuire
225 Franklin Street
Boston, MA 02110
Born 1972 | | Senior Vice President and Chief Compliance Officer (2012) | | Vice President — Asset Management Compliance, Ameriprise Financial, Inc., since May 2010; Chief Compliance Officer, Ameriprise Certificate Company since September 2010. | |
Colin Moore
225 Franklin Street
Boston, MA 02110
Born 1958 | | Senior Vice President (2010) | | Executive Vice President and Global Chief Investment Officer, Ameriprise Financial, Inc., since July 2013; Executive Vice President and Global Chief Investment Officer, Columbia Management Investment Advisers, LLC since July 2013 (previously Director and Global Chief Investment Officer, 2010-2013). | |
Michael E. DeFao
225 Franklin Street
Boston, MA 02110
Born 1968 | | Vice President (2011) and Assistant Secretary (2010) | | Vice President and Chief Counsel, Ameriprise Financial, Inc. since May 2010. | |
Amy Johnson
5228 Ameriprise Financial Center
Minneapolis, MN 55474
Born 1965 | | Vice President (2006) | | Managing Director and Global Head of Operations, Columbia Management Investment Advisers, LLC since April 2016 (previously Managing Director and Chief Operating Officer, 2010-2016). | |
Lyn Kephart-Strong
5228 Ameriprise
Financial Center
Minneapolis, MN 55474
Born 1960 | | Vice President (2015) | | President, Columbia Management Investment Services Corp. since October 2014; Vice President & Resolution Officer, Ameriprise Trust Company since August 2009. | |
Ryan C. Larrenaga
225 Franklin Street
Boston, MA 02110
Born 1970 | | Vice President and Secretary (2015) | | Vice President and Group Counsel, Ameriprise Financial, Inc. since August 2011 (previously, Counsel from May 2010 to August 2011); officer of Columbia Funds and affiliated funds since 2005. | |
Annual Report 2016
41
COLUMBIA U.S. SOCIAL BOND FUND
BOARD CONSIDERATION AND APPROVAL OF MANAGEMENT AGREEMENT AND SUBADVISORY AGREEMENT
On June 10, 2016, the Board of Trustees (the Board) and the Trustees who are not interested persons (as defined in the Investment Company Act of 1940) (the Independent Trustees) of Columbia Funds Series Trust I (the Trust) unanimously approved the continuation of the Management Agreement (the Management Agreement) with Columbia Management Investment Advisers, LLC (the Investment Manager) and the Subadvisory Agreement (the Subadvisory Agreement) between the Investment Manager and Threadneedle International Limited (the Subadviser) with respect to Columbia U.S. Social Bond Fund (the Fund), a series of the Trust. As detailed below, the Board's Advisory Fees and Expenses Committee (the Committee) and the Board met on multiple occasions to review and discuss, both among themselves and with the management team of the Investment Manager, materials provided by the Investment Manager and others before determining to approve the continuation of the Management Agreement and the Subadvisory Agreement (collectively, the Agreements).
In connection with their deliberations regarding the continuation of the Management Agreement and the Subadvisory Agreement, the Committee and the Board evaluated materials requested from the Investment Manager regarding the Fund and the Agreements, and discussed these materials with representatives of the Investment Manager at Committee meetings held on March 8, 2016, April 27, 2016 and June 9, 2016 and at Board meetings held on March 9, 2016 and June 10, 2016. In addition, the Board considers matters bearing on the Agreements at most of its other meetings throughout the year and meets regularly with senior management of the Trust and the Investment Manager. Through the Board's Investment Oversight Committees, Trustees also meet with selected portfolio managers of the funds the Trustees oversee and other investment personnel at various times throughout the year. The Committee and the Board also consulted with its independent fee consultant, Fund counsel and with the Independent Trustees' independent legal counsel, who advised on various matters with respect to the Committee's and the Board's considerations and otherwise assisted the Committee and the Board in their deliberations. On June 9, 2016, the Committee recommended that the Board approve the continuation of the Management Agreement and the Subadvisory Agreement. On June 10, 2016, the Board, including the Independent Trustees, voting separately, unanimously approved the continuation of the Management Agreement and the Subadvisory Agreement for the Fund.
The Committee and the Board considered all information that they, their legal counsel or the Investment Manager believed reasonably necessary to evaluate and to determine whether to approve the continuation of the Management Agreement and the Subadvisory Agreement. The information and factors considered by the Committee and the Board in recommending for approval or approving the continuation of the Management Agreement and the Subadvisory Agreement for the Fund included the following:
• Information on the investment performance of the Fund relative to the performance of a group of mutual funds determined to be comparable to the Fund by an independent third-party data provider, as well as performance relative to benchmarks;
• Information on the Fund's management fees and total expenses, including information comparing the Fund's expenses to those of a group of comparable mutual funds, as determined by the independent third-party data provider;
• The Investment Manager's agreement to contractually limit or cap total operating expenses for the Fund through November 30, 2017 so that total operating expenses (excluding certain fees and expenses, such as transaction costs and certain other investment related expenses, interest, taxes, acquired fund fees and expenses, and infrequent and/or unusual expenses) would not exceed a specified annual rate, as a percentage of the Fund's net assets;
• The terms and conditions of the Agreements;
• The subadvisory fees to be charged, if any, to the Investment Manager under the Subadvisory Agreement;
• The current and proposed terms and conditions of other agreements and arrangements with affiliates of the Investment Manager relating to the operations of the Fund, including agreements with respect to the provision of distribution and transfer agency services to the Fund;
• Descriptions of various functions performed by the Investment Manager and the Subadviser under the Agreements, including portfolio management and portfolio trading practices;
Annual Report 2016
42
COLUMBIA U.S. SOCIAL BOND FUND
BOARD CONSIDERATION AND APPROVAL OF MANAGEMENT AGREEMENT AND SUBADVISORY AGREEMENT (continued)
• Information regarding the management fees of similarly-managed portfolios of other clients of the Investment Manager, including institutional separate accounts;
• Information regarding the reputation, regulatory history and resources of the Investment Manager, including information regarding senior management, portfolio managers and other personnel;
• Information regarding the capabilities of the Investment Manager with respect to compliance monitoring services, including an assessment of the Investment Manager's and the Subadviser's compliance system by the Fund's Chief Compliance Officer; and
• The profitability to the Investment Manager and its affiliates from their relationships with the Fund.
Nature, Extent and Quality of Services Provided under the Agreements
The Committee and the Board considered the nature, extent and quality of services provided to the Fund by the Investment Manager, the Subadviser and the Investment Manager's affiliates under the Agreements and under separate agreements for the provision of transfer agency services, and the resources dedicated to the Fund and the other Columbia Funds by the Investment Manager, the Subadviser and the Investment Manager's affiliates. The Committee and the Board considered, among other things, the Investment Manager's ability to attract, motivate and retain highly qualified research, advisory and supervisory investment professionals (including personnel and other resources, compensation programs for personnel involved in fund management, reputation and other attributes), the portfolio management services provided by those investment professionals, and the quality of the Investment Manager's investment research capabilities and trade execution services. The Committee and the Board also considered the potential benefits to shareholders of investing in a mutual fund that is part of a fund complex offering exposure to a variety of asset classes and investment disciplines and providing a variety of fund and shareholder services.
The Committee and the Board also considered the professional experience and qualifications of the senior personnel of the Investment Manager and the Subadviser, which included consideration of the Investment Manager's and the Subadviser's experience with similarly-structured funds. The Committee and the Board noted the compliance programs of and the compliance-related resources provided to the Fund by the Investment Manager and its affiliates, and considered the Investment Manager's ability to provide administrative services to the Fund and coordinate the activities of the Fund's other service providers. The Board also noted that the Board had approved the Subadviser's code of ethics and compliance program, and that the Chief Compliance Officer of the Funds reports to the Trustees on the Subadviser's compliance program.
The Committee and the Board considered the diligence and selection process undertaken by the Investment Manager to select the Subadviser, including the Investment Manager's rationale for recommending the continuation of the Subadvisory Agreement, and the process for monitoring the Subadviser's ongoing performance of services for the Fund. As part of these deliberations, the Committee and the Board considered the ability of the Investment Manager, subject to the approval of the Board, to modify or enter into new subadvisory agreements without a shareholder vote pursuant to an exemptive order of the Securities and Exchange Commission. The Committee and the Board also considered the scope of services provided to the Fund by the Investment Manager that are distinct from and in addition to those provided by the Subadviser, including cash flow management, treasury services, risk oversight, investment oversight and Subadviser selection, oversight and transition management. After reviewing these and related factors, the Committee and the Board concluded, within the context of their overall conclusions, that the nature, extent and quality of the services provided to the Fund under the Agreements supported the continuation of the Management Agreement and the Subadvisory Agreement.
Investment Performance
The Committee and the Board reviewed information about the performance of the Fund over various time periods, including performance information relative to benchmarks and information based on reports of the independent third-party data provider that compared the performance of the Fund to the performance of a group of comparable mutual funds, and data provided by the independent fee consultant. The Committee and the Board also reviewed
Annual Report 2016
43
COLUMBIA U.S. SOCIAL BOND FUND
BOARD CONSIDERATION AND APPROVAL OF MANAGEMENT AGREEMENT AND SUBADVISORY AGREEMENT (continued)
a description of the third party's methodology for identifying the Fund's peer groups for purposes of performance and expense comparisons. Although the Fund's performance lagged that of a relevant peer group for certain (although not necessarily all) periods, the Committee and the Board concluded that other factors relevant to performance were sufficient, in light of other considerations, to warrant continuation of the Management Agreement and the Subadvisory Agreement. Those factors included one or more of the following: (i) that the Fund's performance, although lagging in certain recent periods, was stronger over the longer term; (ii) that the underperformance was attributable, to a significant extent, to investment decisions that were reasonable and consistent with the Fund's investment strategy and policies and that the Fund was performing within a reasonable range of expectations, given those investment decisions, market conditions and the Fund's investment strategy; (iii) that the Fund's performance was competitive when compared to other relevant performance benchmarks or peer groups; and (iv) that the Investment Manager had taken or was taking steps designed to help improve the Fund's investment performance, including, but not limited to, replacing portfolio managers, enhancing the resources supporting the portfolio managers, or modifying investment strategies.
The Committee and the Board noted that, through December 31, 2015, the Fund's performance was in the seventy-third percentile (where the best performance would be in the first percentile) of its category selected by the independent third-party data provider for the purposes of performance comparisons since inception.
The Committee and the Board also considered the Investment Manager's performance and reputation generally, the Investment Manager's historical responsiveness to Board concerns about performance, and the Investment Manager's willingness to take steps intended to improve performance. After reviewing these and related factors, the Committee and the Board concluded, within the context of their overall conclusions, that the performance of the Fund, the Investment Manager and the Subadviser were sufficient, in light of other considerations, to warrant the continuation of the Management Agreement and the Subadvisory Agreement.
Investment Management Fee Rates and Other Expenses
The Committee and the Board considered the management fees charged to the Fund under the Management Agreement and the Subadvisory Agreement, as well as the total expenses incurred by the Fund. In assessing the reasonableness of the fees under the Management Agreement, the Committee and the Board considered, among other information, the Fund's management fee and its total expense ratio as a percentage of average daily net assets. The Committee and the Board considered data provided by the independent fee consultant. The Committee and the Board noted that, as of December 31, 2015, the Fund's actual management fee and net total expense ratio are ranked in the first and third quintiles, respectively, (where the lowest fees and expenses would be in the first quintile) against the Fund's expense universe as determined by the independent third-party data provider for purposes of expense comparison. The Committee and the Board also considered that the Investment Manager pays the fees of the Subadviser. The Committee and the Board noted that the Subadviser was not currently managing any assets under the Subadvisory Agreement, but that the Investment Manager could, in the future, allocate investments to be managed by the Subadviser. The Committee and the Board also took into account the fee waiver and expense limitation arrangements agreed to by the Investment Manager, as noted above.
The Committee and the Board also received and considered information about the management fees charged by the Investment Manager to institutional separate accounts. In considering the fees charged to those accounts, the Committee and the Board took into account, among other things, the Investment Manager's representations about the differences between managing mutual funds as compared to other types of accounts, including differences in the services provided, differences in the risk profile of such business for the Investment Manager and the additional resources required to manage mutual funds effectively. The Committee and the Board received and considered information about the fees charged by the Investment Manager for sub-advisory services provided to comparable unaffiliated funds. In evaluating the Fund's management fees, the Committee and the Board also took into account the demands, complexity and quality of the investment management of the Fund.
Annual Report 2016
44
COLUMBIA U.S. SOCIAL BOND FUND
BOARD CONSIDERATION AND APPROVAL OF MANAGEMENT AGREEMENT AND SUBADVISORY AGREEMENT (continued)
After reviewing these and related factors, the Committee and the Board concluded, within the context of their overall conclusions, that the management fee rates and expenses of the Fund were sufficient, in light of other considerations, to warrant the continuation of the Management Agreement and the Subadvisory Agreement.
Costs of Services Provided and Profitability
The Committee and the Board also took note of the costs the Investment Manager and its affiliates incur in connection with the services provided (both on an absolute and relative basis) and the profitability to the Investment Manager and its affiliates in connection with their relationships with the Fund.
The Committee and the Board also considered the compensation directly or indirectly received by the Investment Manager's affiliates in connection with their relationships with the Fund. The Committee and the Board reviewed information provided by management as to the profitability to the Investment Manager and its affiliates of their relationships with the Fund, information about the allocation of expenses used to calculate profitability, and comparisons of profitability levels realized in 2015 to profitability levels realized in 2014. When reviewing profitability, the Committee and the Board also considered court cases in which adviser profitability was an issue in whole or in part, the performance of similarly managed funds, the performance of the Fund, and the expense ratio of the Fund. In addition, the Committee and the Board considered information provided by the Investment Manager regarding its financial condition and comparing its profitability to that of other asset management firms that are, or are subsidiaries of, publicly traded companies. In this regard, the Committee and the Board also considered data provided by the independent fee consultant. Because the Subadvisory Agreement was negotiated at arms-length by the Investment Manager, which is responsible for payments to the Subadviser thereunder, the Committee and the Board did not consider the profitability to the Subadviser of its relationship with the Fund.
After reviewing these and related factors, the Committee and the Board concluded, within the context of their overall conclusions, that the costs of services provided and the profitability to the Investment Manager and its affiliates from their relationships with the Fund supported the continuation of the Management Agreement and the Subadvisory Agreement.
Economies of Scale
The Committee and the Board considered the potential existence of economies of scale in the provision by the Investment Manager of services to the Fund, to groups of related funds, and to the Investment Manager's investment advisory clients as a whole, and whether those economies of scale were shared with the Fund through breakpoints in investment management fees or other means, such as expense limitation arrangements and additional investments by the Investment Manager in investment, trading and compliance resources. The Committee and the Board noted that the management fee schedules for the Fund contained breakpoints that would reduce the fee rate on assets above specified threshold levels.
The Committee and the Board noted that the Subadvisory Agreement did not contain breakpoints. The Committee and the Board noted that absent a shareholder vote, the Investment Manager would bear any increase in fees payable under the Subadvisory Agreement. The Committee and the Board also noted the potential challenges of seeking to tailor the Management Agreement breakpoints to those of a subadvisory agreement in this context, and the effect that capacity constraints on a subadviser's ability to manage assets could potentially have on the ability of the Investment Manager to achieve economies of scale, as new subadvisers may need to be added as the Fund grows, increasing the Investment Manager's cost of compensating and overseeing the Fund's subadvisers.
In considering these matters, the Committee and the Board also considered the costs of the services provided and the profitability to the Investment Manager and its affiliates from their relationships with the Fund, as discussed above. After reviewing these and related factors, the Committee and the Board concluded, within the context of their overall conclusions, that the extent to which any economies of scale were expected to be shared with the Fund supported the continuation of the Management Agreement and the Subadvisory Agreement.
Annual Report 2016
45
COLUMBIA U.S. SOCIAL BOND FUND
BOARD CONSIDERATION AND APPROVAL OF MANAGEMENT AGREEMENT AND SUBADVISORY AGREEMENT (continued)
Other Benefits to the Investment Manager
The Committee and the Board received and considered information regarding "fall-out" or ancillary benefits received by the Investment Manager and its affiliates as a result of their relationships with the Fund, such as the engagement of the Investment Manager's affiliates to provide distribution and transfer agency services to the Fund. In this regard, among other matters, the Committee and the Board considered that the Fund's distributor retains a portion of the distribution fees from the Fund and receives a portion of the sales charges on sales or redemptions of certain classes of shares of the Fund. The Committee and the Board also considered the benefits of research made available to the Investment Manager by reason of brokerage commissions generated by the Fund's securities transactions, and reviewed information about the Investment Manager's practices with respect to allocating portfolio transactions for brokerage and research services. The Committee and the Board considered the possible conflicts of interest associated with certain fall-out or other ancillary benefits and the reporting, disclosure and other processes that are in place to address such possible conflicts of interest. The Committee and the Board recognized that the Investment Manager's profitability would be somewhat lower without these benefits.
Conclusion
The Committee and the Board reviewed all of the above considerations in reaching their decisions to recommend or approve the continuation of the Management Agreement and the Subadvisory Agreement. In their deliberations, the Trustees did not identify any particular information that was all-important or controlling, and individual Trustees may have attributed different weights to the various factors. Based on their evaluation of all factors that they deemed to be material, including those factors described above, and assisted by the advice of independent legal counsel, the Board, including the Independent Trustees, voting separately, unanimously approved the continuation of the Management Agreement and the Subadvisory Agreement.
Annual Report 2016
46
COLUMBIA U.S. SOCIAL BOND FUND
IMPORTANT INFORMATION ABOUT THIS REPORT
Each fund mails one shareholder report to each shareholder address. If you would like more than one report, please call shareholder services at 800.345.6611 and additional reports will be sent to you.
The policy of the Board is to vote the proxies of the companies in which each fund holds investments consistent with the procedures as stated in the Statement of Additional Information (SAI). You may obtain a copy of the SAI without charge by calling 800.345.6611; contacting your financial intermediary; visiting investor.columbiathreadneedleus.com; or searching the website of the Securities and Exchange Commission (SEC) at sec.gov. Information regarding how each fund voted proxies relating to portfolio securities is filed with the SEC by August 31st for the most recent 12-month period ending June 30th of that year, and is available without charge by visiting investor.columbiathreadneedleus.com, or searching the website of the SEC at sec.gov.
Each fund files a complete schedule of portfolio holdings with the SEC for the first and third quarters of each fiscal year on Form N-Q. Each fund's Form N-Q is available on the SEC's website at sec.gov and may be reviewed and copied at the SEC's Public Reference Room in Washington, D.C. Information on the operation of the Public Reference Room may be obtained by calling 800.SEC.0330. Each fund's complete schedule of portfolio holdings, as filed on Form N-Q, can also be obtained without charge, upon request, by calling 800.345.6611.
Annual Report 2016
47
Columbia U.S. Social Bond Fund
P.O. Box 8081
Boston, MA 02266-8081

This information is for use with concurrent or prior delivery of a fund prospectus. Please read and consider the investment objectives, risks, charges and expenses for any fund carefully before investing. For a prospectus and summary prospectus, which contains this and other important information about the Fund, go to investor.columbiathreadneedleus.com. The Fund is distributed by Columbia Management Investment Distributors, Inc., member FINRA, and managed by Columbia Management Investment Advisers, LLC.
Columbia Threadneedle Investments (Columbia Threadneedle) is the global brand name of the Columbia and Threadneedle group of companies.
All rights reserved. Columbia Management Investment Distributors, Inc., 225 Franklin Street, Boston, MA 02110-2804
© 2016 Columbia Management Investment Advisers, LLC.
investor.columbiathreadneedleus.com
ANN262_07_F01_(09/16)
Item 2. Code of Ethics.
(a) The registrant has adopted a code of ethics that applies to the registrant’s principal executive officer, principal financial officer, principal accounting officer or controller, or persons performing similar functions, regardless of whether these individuals are employed by the registrant or a third party.
(b) During the period covered by this report, there were not any amendments to a provision of the code of ethics adopted in 2(a) above.
(c) During the period covered by this report, there were no waivers, including any implicit waivers, from a provision of the code of ethics described in 2(a) above that relates to one or more of the items set forth in paragraph (b) of this item’s instructions.
Item 3. Audit Committee Financial Expert.
The registrant’s Board of Trustees has determined that Douglas A. Hacker, David M. Moffett and Anne-Lee Verville, each of whom are members of the registrant’s Board of Trustees and Audit Committee, each qualify as an audit committee financial expert. Mr. Hacker, Mr. Moffett and Ms. Verville are each independent trustees, as defined in paragraph (a)(2) of this item’s instructions.
Item 4. Principal Accountant Fees and Services.
Fee information below is disclosed for the five series of the registrant whose reports to stockholders are included in this annual filing. One series liquidated on January 29, 2016 and the fees incurred by this series through its liquidation date are included in the response to this Item.
(a) Audit Fees. Aggregate Audit Fees billed by the principal accountant for professional services rendered during the fiscal years ended July 31, 2016 and July 31, 2015 are approximately as follows:
2016 | | 2015 | |
$ | 131,500 | | $ | 145,100 | |
| | | | | |
Audit Fees include amounts related to the audit of the registrant’s annual financial statements or services that are normally provided by the accountant in connection with statutory and regulatory filings or engagements for those fiscal years.
(b) Audit-Related Fees. Aggregate Audit-Related Fees billed to the registrant by the principal accountant for professional services rendered during the fiscal years ended July 31, 2016 and July 31, 2015 are approximately as follows:
Audit-Related Fees include amounts for assurance and related services by the principal accountant that are reasonably related to the performance of the audit of the registrant’s financial statements and are not reported in Audit Fees above. In fiscal years 2016 and 2015, Audit-Related Fees consist of agreed-upon procedures performed for semi-annual shareholder reports.
During the fiscal years ended July 31, 2016 and July 31, 2015, there were no Audit-Related Fees billed by the registrant’s principal accountant to the registrant’s investment adviser (not including any sub-adviser whose role is primarily portfolio management and is subcontracted with or overseen by another investment adviser) and any entity controlling, controlled by, or under common control with the adviser that provides ongoing services to the registrant for an engagement that related directly to the operations and financial reporting of the registrant.
(c) Tax Fees. Aggregate Tax Fees billed by the principal accountant to the registrant for professional services rendered during the fiscal years ended July 31, 2016 and July 31, 2015 are approximately as follows:
2016 | | 2015 | |
$ | 29,500 | | $ | 24,400 | |
| | | | | |
Tax Fees include amounts for the review of annual tax returns, the review of required shareholder distribution calculations and typically include amounts for professional services by the principal accountant for tax compliance, tax advice and tax planning. Fiscal year 2016 also includes Tax Fees for agreed-upon procedures related to a fund liquidation and a final tax return.
During the fiscal years ended July 31, 2016 and July 31, 2015, there were no Tax Fees billed by the registrant’s principal accountant to the registrant’s investment adviser (not including any sub-adviser whose role is primarily portfolio management and is subcontracted with or overseen by another investment adviser) and any entity controlling, controlled by, or under common control with the adviser that provides ongoing services to the registrant for an engagement that related directly to the operations and financial reporting of the registrant.
(d) All Other Fees. Aggregate All Other Fees billed by the principal accountant to the registrant for professional services rendered during the fiscal years ended July 31, 2016 and July 31, 2015 are approximately as follows:
All Other Fees include amounts for products and services provided by the principal accountant, other than the services reported in paragraphs (a) through (c) above.
Aggregate All Other Fees billed by the registrant’s principal accountant to the registrant’s investment adviser (not including any sub-adviser whose role is primarily portfolio management and is subcontracted with or overseen by another investment adviser) and any entity controlling, controlled by, or under common control with the adviser that provides ongoing services to the registrant for an engagement that related directly to the operations and financial reporting of the registrant during the fiscal years ended July 31, 2016 and July 31, 2015 are approximately as follows:
2016 | | 2015 | |
$ | 225,000 | | $ | 225,000 | |
| | | | | |
In fiscal years 2016 and 2015, All Other Fees primarily consists of fees billed for internal control examinations of the registrant’s transfer agent and investment adviser.
(e)(1) Audit Committee Pre-Approval Policies and Procedures
The registrant’s Audit Committee is required to pre-approve the engagement of the registrant’s independent auditors to provide audit and non-audit services to the registrant and non-audit services to its investment adviser (excluding any sub-adviser whose role is primarily portfolio management and is sub-contracted or overseen by another investment adviser (the “Adviser”) or any entity controlling, controlled by or under common control with the Adviser that provides ongoing services to the Fund (a “Control Affiliate”) if the engagement relates directly to the operations and financial reporting of the registrant.
The Audit Committee has adopted a Policy for Engagement of Independent Auditors for Audit and Non-Audit Services (the “Policy”). The Policy sets forth the understanding of the Audit Committee regarding the engagement of the registrant’s independent accountants to provide (i) audit and permissible audit-related, tax and other services to the registrant (“Fund Services”); (ii) non-audit services to the registrant’s Adviser and any Control Affiliates, that relates directly to the operations and financial reporting of a Fund (“Fund-related Adviser Services”); and (iii) certain other audit and non-audit services to the registrant’s Adviser and its Control Affiliates. A service will require specific pre-approval by the Audit Committee if it is to be provided by the Fund’s independent auditor; provided, however, that pre-approval of non-audit services to the Fund, the Adviser or Control Affiliates may be waived if certain de minimis requirements set forth in the SEC’s rules are met.
Under the Policy, the Audit Committee may delegate pre-approval authority to any pre-designated member or members who are independent board members. The member(s) to whom such authority is delegated must report, for informational purposes only, any pre-approval decisions to the Audit Committee at its next regular meeting. The Audit Committee’s responsibilities with respect to the pre-approval of services performed by the independent auditor may not be delegated to management.
On an annual basis, at a regularly scheduled Audit Committee meeting, the Fund’s Treasurer or other Fund officer shall submit to the Audit Committee a schedule of the types of Fund Services and Fund-related Adviser Services that are subject to specific pre-approval. This schedule will provide a description of each type of service that is subject to specific pre-approval, along with total projected fees for each service. The pre-approval will generally cover a one-year period. The Audit Committee will review and approve the types of services and the projected fees for the next one-year period and may add to, or subtract from, the list of pre-approved services from time to time, based on subsequent determinations. This specific approval acknowledges that the Audit Committee is in agreement with the specific types of services that the independent auditor will be permitted to perform and the projected fees for each service.
The Fund’s Treasurer or other Fund officer shall report to the Audit Committee at each of its regular meetings regarding all Fund Services or Fund-related Adviser Services provided since the last such report was rendered, including a description of the services, by category, with forecasted fees for the annual reporting period, proposed changes requiring specific pre-approval and a description of services provided by the independent auditor, by category, with actual fees during the current reporting period.
*****
(e)(2) 100% of the services performed for items (b) through (d) above during 2016 and 2015 were pre-approved by the registrant’s Audit Committee.
(f) Not applicable.
(g) The aggregate non-audit fees billed by the registrant’s accountant for services rendered to the registrant, and rendered to the registrant’s investment adviser (not including any sub-adviser whose role is primarily portfolio management and is subcontracted with or overseen by another investment adviser), and any entity controlling, controlled by, or under common control with the adviser that provides ongoing services to the registrant during the fiscal years ended July 31, 2016 and July 31, 2015 are approximately as follows:
2016 | | 2015 | |
$ | 256,500 | | $ | 251,400 | |
| | | | | |
(h) The registrant’s Audit Committee of the Board of Directors has considered whether the provision of non-audit services that were rendered to the registrant’s adviser (not including any sub-adviser whose role is primarily portfolio management and is
subcontracted with or overseen by another investment adviser), and any entity controlling, controlled by, or under common control with the investment adviser that provides ongoing services to the registrant that were not pre-approved pursuant to paragraph (c)(7)(ii) of Rule 2-01 of Regulation S-X, is compatible with maintaining the principal accountant’s independence.
Item 5. Audit Committee of Listed Registrants.
Not applicable.
Item 6. Investments
(a) The registrant’s “Schedule I — Investments in securities of unaffiliated issuers” (as set forth in 17 CFR 210.12-12) is included in Item 1 of this Form N-CSR.
(b) Not applicable.
Item 7. Disclosure of Proxy Voting Policies and Procedures for Closed-End Management Investment Companies.
Not applicable.
Item 8. Portfolio Managers of Closed-End Management Investment Companies.
Not applicable.
Item 9. Purchases of Equity Securities by Closed-End Management Investment Company and Affiliated Purchasers.
Not applicable.
Item 10. Submission of Matters to a Vote of Security Holders.
There were no material changes to the procedures by which shareholders may recommend nominees to the registrant’s board of directors.
Item 11. Controls and Procedures.
(a) The registrant’s principal executive officer and principal financial officers, based on their evaluation of the registrant’s disclosure controls and procedures as of a date within 90 days of the filing of this report, have concluded that such controls and procedures are adequately designed to ensure that material information required to be disclosed by the registrant in Form N-CSR is accumulated and communicated to the registrant’s management, including the principal executive officer and principal financial officer, or persons performing similar functions, as appropriate to allow timely decisions regarding required disclosure.
(b) There was no change in the registrant’s internal control over financial reporting that occurred during the registrant’s second fiscal quarter of the period covered by this report that has materially affected, or is reasonably likely to materially affect, the registrant’s internal control over financial reporting.
Item 12. Exhibits.
(a)(1) Code of ethics required to be disclosed under Item 2 of Form N-CSR attached hereto as Exhibit 99.CODE ETH.
(a)(2) Certifications pursuant to Rule 30a-2(a) under the Investment Company Act of 1940 (17 CFR 270.30a-2(a)) attached hereto as Exhibit 99.CERT.
(a)(3) Not applicable.
(b) Certification pursuant to Rule 30a-2(b) under the Investment Company Act of 1940 (17 CFR 270.30a-2(b)) attached hereto as Exhibit 99.906CERT.
SIGNATURES
Pursuant to the requirements of the Securities Exchange Act of 1934 and the Investment Company Act of 1940, the registrant has duly caused this report to be signed on its behalf by the undersigned, thereunto duly authorized.
(registrant) | | Columbia Funds Series Trust I |
|
|
By (Signature and Title) | /s/ Christopher O. Petersen |
| Christopher O. Petersen, President and Principal Executive Officer |
|
|
Date | | September 21, 2016 |
| |
Pursuant to the requirements of the Securities Exchange Act of 1934 and the Investment Company Act of 1940, this report has been signed below by the following persons on behalf of the registrant and in the capacities and on the dates indicated. |
| |
By (Signature and Title) | /s/ Christopher O. Petersen |
| Christopher O. Petersen, President and Principal Executive Officer |
|
|
Date | | September 21, 2016 |
|
|
By (Signature and Title) | /s/ Michael G. Clarke |
| Michael G. Clarke, Treasurer and Chief Financial Officer |
|
|
Date | | September 21, 2016 |
| | | | | |