UNITED STATES
SECURITIES AND EXCHANGE COMMISSION
Washington, D.C. 20549
FORM N-CSR
CERTIFIED SHAREHOLDER REPORT OF REGISTERED
MANAGEMENT INVESTMENT COMPANIES
Investment Company Act file number | 811-04367 |
|
Columbia Funds Series Trust I |
(Exact name of registrant as specified in charter) |
|
225 Franklin Street, Boston, Massachusetts | | 02110 |
(Address of principal executive offices) | | (Zip code) |
|
Ryan Larrenaga c/o Columbia Management Investment Advisers, LLC 225 Franklin Street Boston, MA 02110 |
(Name and address of agent for service) |
|
Registrant’s telephone number, including area code: | (800) 345-6611 | |
|
Date of fiscal year end: | April 30 | |
|
Date of reporting period: | April 30, 2016 | |
| | | | | | | | |
Form N-CSR is to be used by management investment companies to file reports with the Commission not later than 10 days after the transmission to stockholders of any report that is required to be transmitted to stockholders under Rule 30e-1 under the Investment Company Act of 1940 (17 CFR 270.30e-1). The Commission may use the information provided on Form N-CSR in its regulatory, disclosure review, inspection, and policymaking roles.
A registrant is required to disclose the information specified by Form N-CSR, and the Commission will make this information public. A registrant is not required to respond to the collection of information contained in Form N-CSR unless the Form displays a currently valid Office of Management and Budget (“OMB”) control number. Please direct comments concerning the accuracy of the information collection burden estimate and any suggestions for reducing the burden to Secretary, Securities and Exchange Commission, 450 Fifth Street, NW, Washington, DC 20549-0609. The OMB has reviewed this collection of information under the clearance requirements of 44 U.S.C. § 3507.
Item 1. Reports to Stockholders.

ANNUAL REPORT
April 30, 2016

COLUMBIA CORPORATE INCOME FUND

 Dear Shareholders,
Volatility comes with the territory for long-term investors. Some investors instinctively want to pull out of the market or sell underperforming investments at the first sign of increased volatility or perhaps even as soon as they perceive it on the horizon. But taking yourself out of the market could mean losing out on potential opportunities, and putting your longer-term investment goals at risk.
Cumulative return is not just about achieving high returns when markets are going up; it's also about remaining invested and minimizing losses during weak or volatile markets so that you can participate on the upside. Developing a deeper understanding of the various risks your portfolio is subject to can help you balance these risks.
Diversification is critical in seeking to achieve that balance. We believe that most portfolios could be more effectively diversified either by introducing holdings with performance profiles unrelated to existing holdings (like alternative products) or by rebalancing existing holdings with an eye toward risk allocation. Over time, distributing risk more evenly may produce a more pronounced diversification benefit and may improve portfolio efficiency. We believe market volatility can create significant opportunities and, in fact, these periods may be some of the very best times to invest.
With this in mind, I thought it important to highlight excerpts from a piece written by Colin Moore, Global Chief Investment Officer, in which he touches on some of these issues emphasizing the importance of a properly constructed portfolio in seeking to effectively manage volatility and to achieve consistency of returns. I encourage you to read the article in its entirety. To access the full article and for other insights on current market, please visit blog.columbiathreadneedleus.com/latest-perspectives.
You need investments that are designed to help you ease the impact of volatile market environments and keep the savings you have worked tirelessly to amass. Columbia Threadneedle Investments provides investment solutions to help you tackle financial challenges and achieve your desired outcome.
Best regards,

Christopher O. Petersen
President, Columbia Funds
Excerpts from:
Taking the scare out of the volatility bogeyman
By Colin Moore, Global Chief Investment Officer
Colin Moore is the global chief investment officer for Columbia Threadneedle Investments. His responsibilities include ensuring that a disciplined investment process is in place across all asset classes, including equity and fixed income. Mr. Moore joined one of the Columbia Threadneedle Investments legacy firms in 2002 as head of equity and was also head of fixed income and liquidity strategies from 2009 – 2010.

n In today's low growth, higher volatility world, the emphasis is shifting from maximization of returns to consistency of returns.
PRESIDENT'S MESSAGE (continued)
n Portfolios should represent the behavioral risk-return tradeoff of investors, remembering that they won't stay invested to realize the return if we get the risk tolerance wrong.
n Holding long-term savings in cash to avoid volatility (the financial equivalent of hiding under the sheets) is detrimental to achieving long-term goals.
According to Wikipedia, "The bogeyman is a common allusion to a mythical creature in many cultures used to control behavior. This monster has no specific appearance, and conceptions about it can vary drastically from household to household within the same community; in many cases he has no set appearance in the mind of an adult or child, but is simply a non-specific embodiment of terror." Different cultures have different names and physical representations for the bogeyman, and investors are no different. We have terrible monsters that we fear may destroy our portfolios, and we call one of the scariest of them volatility.
While the bogeyman is mythical (I hope!), volatility is real and can cause serious damage. To understand why investors have such a hard time coping with volatility, we first need to define three cognitive biases at work in today's investment environment:
1) Recency bias — something that has recently come to the forefront of our attention, regardless of how long established it is, suddenly seems to appear with improbable frequency.
2) Negativity bias — we tend to have a greater recall of unpleasant memories than positive memories.
3) Loss aversion — our dissatisfaction with losing money tends to be greater than our satisfaction with making money.
The level of volatility varies dramatically, and so does investor fear and panic selling — waxing when volatility rises, waning when it falls. Recent studies have pointed to demographics as an important driver of panic selling. The theory is that as people get closer to retirement, the prospects of a large (20% – 30%) loss in financial assets can have a much more pronounced effect on their sense of well-being. Wealth preservation instincts kick in much more quickly than for younger (and typically less wealthy) savers.
The reality is that there is little opportunity for return without volatility. Therefore, the bogeyman effect of holding long-term savings in cash to avoid volatility (the financial equivalent of hiding under the sheets) is detrimental to achieving long-term goals. This effect tends to be more pronounced during the episodic spikes in volatility. The significant spike in volatility in 2008 and 2009 led to significant withdrawals from long-term investment funds over the same period. Less pronounced effects can also be seen when comparing 2001 – 2003 and 2011 – 2012. Conversely, flows picked up when volatility returned to "normal" levels. Investor behavior of this type is consistent with the three behavioral biases.
I believe average volatility will be higher over the next 10 years than the last 10 years and episodic spikes will increase in frequency because sustainable economic growth will be structurally lower and geopolitical risk higher than any time since World War II. Low growth creates uncertainty while loss aversion will make investors fear that we are one economic mishap or geopolitical event away from no growth or recession. The result will be higher volatility on average. Negativity bias will tend to exacerbate "spike" reactions to event-driven geopolitical news, and the volatility bogeyman will appear more often. Assuming the behavioral biases continue, investor returns are likely to be very disappointing regardless of the total return generated by financial markets due to the bogeyman effect.
To mitigate this effect, we need to focus on portfolio construction and an improved understanding of diversification. I accept that equities are likely to offer the highest return over the next 10 years, but they also offer the highest volatility. Many portfolio construction optimization tools use historical average volatility, which is likely to underestimate the volatility investors will face. The bogeyman emerges when individual asset class volatility spikes and cross correlations rise, the combination of which increases overall portfolio volatility far beyond expectation. Diversification is meant to protect investors against volatility, but what's the point of owning lots of investments if the volatility bogeyman has not been properly estimated?
Most importantly, portfolios should be constructed to properly represent the behavioral risk-return tradeoff of investors, remembering that they won't stay invested to realize the return if we get the risk tolerance wrong. In a low growth, higher volatility world, the emphasis is shifting to return consistency rather than return maximization,
PRESIDENT'S MESSAGE (continued)
and investors are best served through investment approaches that appreciate that distinction. Even though it's a permanent feature of financial markets, volatility is less likely to be the bogeyman we all fear if portfolios are constructed with this understanding.
Please visit blog.columbiathreadneedleus.com/latest-perspectives to read the entire article.
Investors should consider the investment objectives, risks, charges and expenses of a mutual fund carefully before investing. For a free prospectus and summary prospectus, which contains this and other important information about a fund, visit columbiathreadneedle.com/us. The prospectus should be read carefully before investing.
The views expressed are as of April 2016, may change as market or other conditions change, and may differ from views expressed by other Columbia Management Investment Advisers, LLC (CMIA) associates or affiliates. Actual investments or investment decisions made by CMIA and its affiliates, whether for its own account or on behalf of clients, will not necessarily reflect the views expressed. This information is not intended to provide investment advice and does not account for individual investor circumstances. Investment decisions should always be made based on an investor's specific financial needs, objectives, goals, time horizon and risk tolerance. Asset classes described may not be suitable for all investors.
Past performance does not guarantee future results, and no forecast should be considered a guarantee either. Since economic and market conditions change frequently, there can be no assurance that the trends described here will continue or that the forecasts are accurate.
Diversification does not guarantee a profit or protect against loss.
Columbia Funds are distributed by Columbia Management Investment Distributors, Inc., member FINRA, and managed by Columbia Management Investment Advisers, LLC.
© 2016 Columbia Management Investment Advisers, LLC. All rights reserved
COLUMBIA CORPORATE INCOME FUND
Performance Overview | | | 2 | | |
Manager Discussion of Fund Performance | | | 4 | | |
Understanding Your Fund's Expenses | | | 6 | | |
Portfolio of Investments | | | 7 | | |
Statement of Assets and Liabilities | | | 20 | �� | |
Statement of Operations | | | 22 | | |
Statement of Changes in Net Assets | | | 23 | | |
Financial Highlights | | | 26 | | |
Notes to Financial Statements | | | 35 | | |
Report of Independent Registered Public Accounting Firm | | | 45 | | |
Trustees and Officers | | | 46 | | |
Important Information About This Report | | | 51 | | |
Fund Investment Manager
Columbia Management Investment
Advisers, LLC
225 Franklin Street
Boston, MA 02110
Fund Distributor
Columbia Management Investment
Distributors, Inc.
225 Franklin Street
Boston, MA 02110
Fund Transfer Agent
Columbia Management Investment
Services Corp.
P.O. Box 8081
Boston, MA 02266-8081
For more information about any of the funds, please visit columbiathreadneedle.com/us or call 800.345.6611. Customer Service Representatives are available to answer your questions Monday through Friday from 8 a.m. to 7 p.m. Eastern time.
The views expressed in this report reflect the current views of the respective parties. These views are not guarantees of future performance and involve certain risks, uncertainties and assumptions that are difficult to predict, so actual outcomes and results may differ significantly from the views expressed. These views are subject to change at any time based upon economic, market or other conditions and the respective parties disclaim any responsibility to update such views. These views may not be relied on as investment advice and, because investment decisions for a Columbia fund are based on numerous factors, may not be relied on as an indication of trading intent on behalf of any particular Columbia fund. References to specific securities should not be construed as a recommendation or investment advice.
COLUMBIA CORPORATE INCOME FUND
Performance Summary
n Columbia Corporate Income Fund (the Fund) Class A shares returned 1.38% excluding sales charges for 12-month period that ended April 30, 2016.
n During the same time period, the Fund underperformed its Blended Benchmark, which returned 2.40%, as well as the Barclays U.S. Corporate Index, which returned 3.03%.
n The Fund's performance was constrained by its below-benchmark stance with respect to interest rate risk and energy-related security selection. Security selection within high-yield corporates and the utility sector benefited performance.
Average Annual Total Returns (%) (for period ended April 30, 2016)
| | | Inception | | 1 Year | | 5 Years | | 10 Years | |
Class A | | 07/31/00 | | | | | | | | | | | | | |
Excluding sales charges | | | | | | | 1.38 | | | | 4.52 | | | | 5.50 | | |
Including sales charges | | | | | | | -3.45 | | | | 3.51 | | | | 4.98 | | |
Class B | | 07/15/02 | | | | | | | | | | | | | |
Excluding sales charges | | | | | | | 0.62 | | | | 3.74 | | | | 4.72 | | |
Including sales charges | | | | | | | -4.29 | | | | 3.39 | | | | 4.72 | | |
Class C | | 07/15/02 | | | | | | | | | | | | | |
Excluding sales charges | | | | | | | 0.78 | | | | 3.89 | | | | 4.87 | | |
Including sales charges | | | | | | | -0.20 | | | | 3.89 | | | | 4.87 | | |
Class I* | | 09/27/10 | | | 1.81 | | | | 4.95 | | | | 5.86 | | |
Class R4* | | 11/08/12 | | | 1.73 | | | | 4.80 | | | | 5.77 | | |
Class R5* | | 11/08/12 | | | 1.76 | | | | 4.87 | | | | 5.81 | | |
Class W* | | 09/27/10 | | | 1.39 | | | | 4.51 | | | | 5.50 | | |
Class Y* | | 11/08/12 | | | 1.81 | | | | 4.92 | | | | 5.84 | | |
Class Z | | 03/05/86 | | | 1.64 | | | | 4.78 | | | | 5.76 | | |
Blended Benchmark | | | | | | | 2.40 | | | | 5.13 | | | | 6.22 | | |
Barclays U.S. Corporate Index | | | | | | | 3.03 | | | | 5.10 | | | | 6.00 | | |
Returns for Class A are shown with and without the maximum initial sales charge of 4.75%. Returns for Class B are shown with and without the applicable contingent deferred sales charge (CDSC) of 5.00% in the first year, declining to 1.00% in the sixth year and eliminated thereafter. Returns for Class C are shown with and without the 1.00% CDSC for the first year only. The Fund's other classes are not subject to sales charges and have limited eligibility. Please see the Fund's prospectus for details. Performance for different share classes will vary based on differences in sales charges and fees associated with each class. All results shown assume reinvestment of distributions during the period. Returns do not reflect the deduction of taxes that a shareholder may pay on Fund distributions or on the redemption of Fund shares. Performance results reflect the effect of any fee waivers or reimbursements of Fund expenses by Columbia Management Investment Advisers, LLC and/or any of its affiliates. Absent these fee waivers or expense reimbursement arrangements, performance results would have been lower.
The performance information shown represents past performance and is not a guarantee of future results. The investment return and principal value of your investment will fluctuate so that your shares, when redeemed, may be worth more or less than their original cost. Current performance may be lower or higher than the performance information shown. You may obtain performance information current to the most recent month-end by contacting your financial intermediary, visiting columbiathreadneedle.com/us or calling 800.345.6611.
*The returns shown for periods prior to the share class inception date (including returns for the Life of the Fund, if shown, which are since Fund inception) include the returns of the Fund's oldest share class. These returns are adjusted to reflect any higher class-related operating expenses of the newer share classes, as applicable. Please visit columbiathreadneedle.com/us/investment-products/mutual-funds/
appended-performance for more information.
The Blended Benchmark is a weighted custom benchmark, established by the Investment Manager, consisting of an 85% weighting in the Barclays U.S. Corporate Index and a 15% weighting in the Bank of America Merrill Lynch (BofAML) U.S. Cash Pay High Yield Constrained Index, which tracks the performance of U.S. dollar-denominated below investment grade corporate debt, currently in a coupon paying period that is publicly issued in the U.S. domestic market.
The Barclays U.S. Corporate Index measures the investment-grade, fixed-rate, taxable, corporate bond market.
Indices are not available for investment, are not professionally managed and do not reflect sales charges, fees, brokerage commissions, taxes or other expenses of investing. Securities in the Fund may not match those in an index.
Annual Report 2016
2
COLUMBIA CORPORATE INCOME FUND
PERFORMANCE OVERVIEW (continued)
Performance of a Hypothetical $10,000 Investment (May 1, 2006 – April 30, 2016)
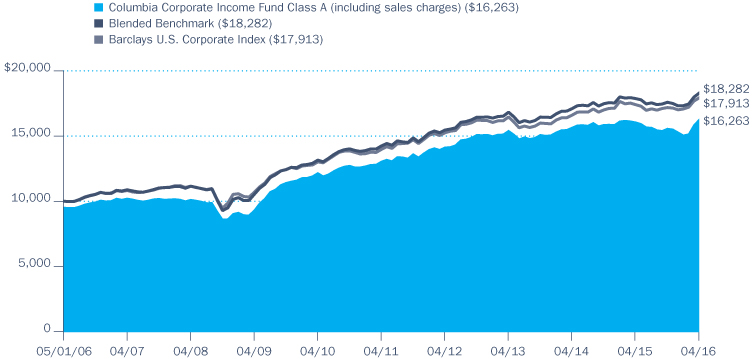
The chart above shows the change in value of a hypothetical $10,000 investment in Class A shares of Columbia Corporate Income Fund during the stated time period, and does not reflect the deduction of taxes that a shareholder may pay on Fund distributions or on the redemption of Fund shares.
Annual Report 2016
3
COLUMBIA CORPORATE INCOME FUND
MANAGER DISCUSSION OF FUND PERFORMANCE
Portfolio Management
Tom Murphy, CFA
Timothy Doubek, CFA
Brian Lavin, CFA
Portfolio Breakdown (%)
(at April 30, 2016) | |
Common Stocks | | | 0.0 | (a) | |
Corporate Bonds & Notes | | | 83.6 | | |
Foreign Government
Obligations | | | 0.1 | | |
Money Market Funds | | | 16.3 | | |
Senior Loans | | | 0.0 | (a) | |
Warrants | | | 0.0 | (a) | |
Total | | | 100.0 | | |
Percentages indicated are based upon total investments. The Fund's portfolio composition is subject to change.
(a) Rounds to zero.
Quality Breakdown (%)
(at April 30, 2016) | |
AA rating | | | 4.7 | | |
A rating | | | 8.2 | | |
BBB rating | | | 72.7 | | |
BB rating | | | 7.2 | | |
B rating | | | 5.8 | | |
CCC rating | | | 1.3 | | |
CC rating | | | 0.0 | (a) | |
Not rated | | | 0.1 | | |
Total | | | 100.0 | | |
Percentages indicated are based upon total fixed income investments (excluding Money Market Funds).
(a) Rounds to zero.
Bond ratings apply to the underlying holdings of the Fund and not the Fund itself and are divided into categories ranging from highest to lowest credit quality, determined by using the middle rating of Moody's, S&P and Fitch, after dropping the highest and lowest available ratings. When ratings are available from only two rating agencies, the lower rating is used. When a rating is available from only one rating agency, that rating is used. When a bond is not rated by any rating agency, it is designated as "Not rated." Credit quality ratings assigned by a rating agency are subjective opinions, not statements of fact, and are subject to change, including daily. The ratings assigned by credit rating agencies are but one of the
At April 30, 2016, approximately 52.9% of the Fund's shares were owned in the aggregate by affiliated funds-of-funds managed by Columbia Management Investment Advisers, LLC (the Investment Manager). As a result of asset allocation decisions by the Investment Manager, it is possible that the Fund may experience relatively large purchases or redemptions from affiliated funds-of-funds. The Investment Manager seeks to minimize the impact of these transactions by structuring them over a reasonable period of time. The Fund may experience increased expenses as it buys and sells securities as a result of purchases or redemptions by affiliated funds-of-funds.
For the 12-month period that ended April 30, 2016, the Fund's Class A shares returned 1.38% excluding sales charges. During the same 12-month period, the Fund underperformed its Blended Benchmark, which returned 2.40%, as well as the Barclays U.S. Corporate Index, which returned 3.03%. The most significant detractor from the Fund's relative performance was a below-benchmark stance with respect to interest rate risk against a backdrop of declining U.S. Treasury yields. Security selection within high-yield corporates and utilities benefited performance.
Markets Monitored Fed Policy, China Growth, Energy Prices
For much of the 12-month period, sentiment with respect to corporate bonds wavered as markets anticipated the end of the U.S. Federal Reserve's (the Fed's) zero interest rate policy. As the period progressed, credit-oriented assets reacted negatively to slowing growth in China, supply-demand imbalances for oil and other commodities, and fears of a domestic U.S. recession. Following a brief period of relative stability, December saw oil prices resume their decline, and the beginning of 2016 saw a sharp decline in global risk sentiment as plummeting Chinese stocks triggered trading halts in that market and the price of oil fell to below $30 a barrel. Credit-based assets would remain under pressure through the early part of February.
Credit sectors rebounded strongly over the last several weeks of the period, as the Fed signaled that it was prepared to push back the timetable for further rate hikes and central banks overseas engaged in unprecedented measures designed to stimulate growth. A meaningful recovery in oil prices from their January 2016 lows also helped to boost sentiment. Credit spreads (the yield premium provided by corporate bonds versus Treasuries) widened for the full period despite the late rally.
The U.S. Treasury yield curve flattened over the 12-month period ended April 30, 2016, as rates rose modestly on shorter maturities while experiencing declines farther out along the curve. While changes in interest rates from the beginning of the period to the end of the period were relatively modest, there was considerable volatility during the period. To illustrate, the 10-year Treasury yield reached a high of 2.48% in June and traded as low as 1.64% in February, before closing April at 1.84%.
Contributors and Detractors
Throughout the period, the Fund was positioned with a meaningfully shorter duration (and corresponding sensitivity to interest rates) than the
Annual Report 2016
4
COLUMBIA CORPORATE INCOME FUND
MANAGER DISCUSSION OF FUND PERFORMANCE (continued)
benchmark. In executing this strategy, the Fund sold Treasury futures contracts in order to keep the Fund's duration below that of the benchmark. These futures contracts and the Fund's duration stance detracted from relative returns as longer term interest rates declined over the 12-month period.
The Fund was positioned with a higher sensitivity to credit risk versus the benchmark, and this positioning detracted from relative performance as credit spreads widened for the full 12 months. In particular, we had a meaningfully above-benchmark position in energy issues, which were negatively impacted by sentiment regarding the sharp decline in oil prices during the period.
We have maintained a preference for asset-rich companies with the ability to generate strong cash flow, which translates into above-benchmark positions in the industrials and utility sectors. This positioning detracted modestly from relative performance over the period. With respect to security selection, an overweight to midstream pipeline companies within energy detracted from relative performance, while selection within utilities added to relative performance.
Selection within below-investment-grade securities was a positive contributor to performance over the period. High-yield issues were approximately 9% of net assets at the end of April 2016, versus approximately 13% at the beginning of the period and the Fund's neutral target of 15%.
considerations that the Investment Manager and/or Fund's subadviser incorporates into its credit analysis process, along with such other issuer-specific factors as cash flows, capital structure and leverage ratios, ability to de-leverage (repay) through free cash flow, quality of management, market positioning and access to capital, as well as such security-specific factors as the terms of the security (e.g., interest rate and time to maturity) and the amount and type of any collateral.
Investment Risks
Market risk may affect a single issuer, sector of the economy, industry or the market as a whole. Fixed-income securities present issuer default risk. A rise in interest rates may result in a price decline of fixed-income instruments held by the Fund, negatively impacting its performance and NAV. Falling rates may result in the Fund investing in lower yielding debt instruments, lowering the Fund's income and yield. These risks may be heightened for longer maturity and duration securities. Non-investment-grade (high-yield or junk) securities present greater price volatility and more risk to principal and income than higher rated securities. Prepayment and extension risk exists because a loan, bond or other investment may be called, prepaid or redeemed before maturity and similar yielding investments may not be available for purchase. Investing in derivatives is a specialized activity that involves special risks that subject the Fund to significant loss potential, including when used as leverage, and may result in greater fluctuation in Fund value. Liquidity risk is associated with the difficulty of selling underlying investments at a desirable time or price. See the Fund's prospectus for more information on these and other risks.
Annual Report 2016
5
COLUMBIA CORPORATE INCOME FUND
UNDERSTANDING YOUR FUND'S EXPENSES
(Unaudited)
As an investor, you incur two types of costs. There are transaction costs, which generally include sales charges on purchases and may include redemption fees. There are also ongoing costs, which generally include management fees, distribution and/or service fees, and other fund expenses. The following information is intended to help you understand your ongoing costs (in dollars) of investing in the Fund and to help you compare these costs with the ongoing costs of investing in other mutual funds.
Analyzing Your Fund's Expenses
To illustrate these ongoing costs, we have provided examples and calculated the expenses paid by investors in each share class of the Fund during the period. The actual and hypothetical information in the table is based on an initial investment of $1,000 at the beginning of the period indicated and held for the entire period. Expense information is calculated two ways and each method provides you with different information. The amount listed in the "Actual" column is calculated using the Fund's actual operating expenses and total return for the period. You may use the Actual information, together with the amount invested, to estimate the expenses that you paid over the period. Simply divide your account value by $1,000 (for example, an $8,600 account value divided by $1,000 = 8.6), then multiply the results by the expenses paid during the period under the "Actual" column. The amount listed in the "Hypothetical" column assumes a 5% annual rate of return before expenses (which is not the Fund's actual return) and then applies the Fund's actual expense ratio for the period to the hypothetical return. You should not use the hypothetical account values and expenses to estimate either your actual account balance at the end of the period or the expenses you paid during the period. See "Compare With Other Funds" below for details on how to use the hypothetical data.
Compare With Other Funds
Since all mutual funds are required to include the same hypothetical calculations about expenses in shareholder reports, you can use this information to compare the ongoing cost of investing in the Fund with other funds. To do so, compare the hypothetical example with the 5% hypothetical examples that appear in the shareholder reports of other funds. As you compare hypothetical examples of other funds, it is important to note that hypothetical examples are meant to highlight the ongoing costs of investing in a fund only and do not reflect any transaction costs, such as sales charges, or redemption or exchange fees. Therefore, the hypothetical calculations are useful in comparing ongoing costs only, and will not help you determine the relative total costs of owning different funds. If transaction costs were included in these calculations, your costs would be higher.
November 1, 2015 – April 30, 2016
| | | Account Value at the Beginning
of the Period ($) | | Account Value at the End of the
Period ($) | | Expenses Paid During the
Period ($) | | Fund's Annualized
Expense Ratio (%) | |
| | | Actual | | Hypothetical | | Actual | | Hypothetical | | Actual | | Hypothetical | | Actual | |
Class A | | | 1,000.00 | | | | 1,000.00 | | | | 1,045.50 | | | | 1,020.29 | | | | 4.68 | | | | 4.62 | | | | 0.92 | | |
Class B | | | 1,000.00 | | | | 1,000.00 | | | | 1,041.60 | | | | 1,016.56 | | | | 8.48 | | | | 8.37 | | | | 1.67 | | |
Class C | | | 1,000.00 | | | | 1,000.00 | | | | 1,042.40 | | | | 1,017.30 | | | | 7.72 | | | | 7.62 | | | | 1.52 | | |
Class I | | | 1,000.00 | | | | 1,000.00 | | | | 1,047.60 | | | | 1,022.33 | | | | 2.60 | | | | 2.56 | | | | 0.51 | | |
Class R4 | | | 1,000.00 | | | | 1,000.00 | | | | 1,046.80 | | | | 1,021.53 | | | | 3.41 | | | | 3.37 | | | | 0.67 | | |
Class R5 | | | 1,000.00 | | | | 1,000.00 | | | | 1,047.40 | | | | 1,022.08 | | | | 2.85 | | | | 2.82 | | | | 0.56 | | |
Class W | | | 1,000.00 | | | | 1,000.00 | | | | 1,045.50 | | | | 1,020.29 | | | | 4.68 | | | | 4.62 | | | | 0.92 | | |
Class Y | | | 1,000.00 | | | | 1,000.00 | | | | 1,047.60 | | | | 1,022.33 | | | | 2.60 | | | | 2.56 | | | | 0.51 | | |
Class Z | | | 1,000.00 | | | | 1,000.00 | | | | 1,046.80 | | | | 1,021.53 | | | | 3.41 | | | | 3.37 | | | | 0.67 | | |
Expenses paid during the period are equal to the annualized expense ratio for each class as indicated above, multiplied by the average account value over the period and then multiplied by the number of days in the Fund's most recent fiscal half year and divided by 366.
Expenses do not include fees and expenses incurred indirectly by the Fund from its investment in underlying funds, including affiliated and non-affiliated pooled investment vehicles, such as mutual funds and exchange-traded funds.
Had Columbia Management Investment Advisers, LLC and/or certain of its affiliates not waived/reimbursed certain fees and expenses, account value at the end of the period would have been reduced.
Annual Report 2016
6
COLUMBIA CORPORATE INCOME FUND
PORTFOLIO OF INVESTMENTS
April 30, 2016
(Percentages represent value of investments compared to net assets)
Corporate Bonds & Notes 82.9%
Issuer | | Coupon
Rate | | Principal
Amount ($) | | Value ($) | |
AEROSPACE & DEFENSE 1.3% | |
L-3 Communications Corp.
02/15/21 | | | 4.950 | % | | | 5,098,000 | | | | 5,483,144 | | |
05/28/24 | | | 3.950 | % | | | 7,186,000 | | | | 7,249,711 | | |
Northrop Grumman Corp.
08/01/23 | | | 3.250 | % | | | 2,546,000 | | | | 2,682,221 | | |
TransDigm, Inc.
07/15/21 | | | 7.500 | % | | | 278,000 | | | | 290,649 | | |
05/15/25 | | | 6.500 | % | | | 250,000 | | | | 251,250 | | |
Total | | | | | | | 15,956,975 | | |
AUTOMOTIVE 0.1% | |
Schaeffler Finance BV(a)
05/15/21 | | | 4.250 | % | | | 625,000 | | | | 642,188 | | |
BANKING 0.8% | |
Ally Financial, Inc.
05/19/22 | | | 4.625 | % | | | 964,000 | | | | 988,100 | | |
09/30/24 | | | 5.125 | % | | | 603,000 | | | | 631,643 | | |
Citigroup, Inc.(b)
05/01/26 | | | 3.400 | % | | | 5,825,000 | | | | 5,845,638 | | |
Morgan Stanley
04/21/21 | | | 2.500 | % | | | 1,590,000 | | | | 1,593,005 | | |
Washington Mutual Bank
Subordinated(c)(d)(e)
01/15/15 | | | 5.125 | % | | | 6,350,000 | | | | 9,525 | | |
Total | | | | | | | 9,067,911 | | |
BROKERAGE/ASSET MANAGERS/EXCHANGES 0.1% | |
E*TRADE Financial Corp.
11/15/22 | | | 5.375 | % | | | 427,000 | | | | 453,265 | | |
09/15/23 | | | 4.625 | % | | | 358,000 | | | | 362,367 | | |
National Financial Partners Corp.(a)
07/15/21 | | | 9.000 | % | | | 138,000 | | | | 137,310 | | |
Total | | | | | | | 952,942 | | |
BUILDING MATERIALS 0.3% | |
Allegion PLC
09/15/23 | | | 5.875 | % | | | 111,000 | | | | 117,660 | | |
Allegion US Holding Co., Inc.
10/01/21 | | | 5.750 | % | | | 327,000 | | | | 341,715 | | |
American Builders & Contractors Supply Co., Inc.(a)
04/15/21 | | | 5.625 | % | | | 627,000 | | | | 648,945 | | |
Beacon Roofing Supply, Inc.
10/01/23 | | | 6.375 | % | | | 112,000 | | | | 119,000 | | |
HD Supply, Inc.
07/15/20 | | | 7.500 | % | | | 617,000 | | | | 654,791 | | |
Corporate Bonds & Notes (continued)
Issuer | | Coupon
Rate | | Principal
Amount ($) | | Value ($) | |
HD Supply, Inc.(a)
12/15/21 | | | 5.250 | % | | | 315,000 | | | | 330,750 | | |
04/15/24 | | | 5.750 | % | | | 209,000 | | | | 219,189 | | |
Masco Corp.
04/01/21 | | | 3.500 | % | | | 57,000 | | | | 57,855 | | |
Nortek, Inc.
04/15/21 | | | 8.500 | % | | | 747,000 | | | | 776,880 | | |
Ply Gem Industries, Inc.
02/01/22 | | | 6.500 | % | | | 4,000 | | | | 3,970 | | |
RSI Home Products, Inc.(a)
03/15/23 | | | 6.500 | % | | | 264,000 | | | | 274,560 | | |
Total | | | | | | | 3,545,315 | | |
CABLE AND SATELLITE 0.7% | |
Altice U.S. Finance I Corp.(a)
05/15/26 | | | 5.500 | % | | | 427,000 | | | | 431,270 | | |
Altice US Finance I Corp.(a)
07/15/23 | | | 5.375 | % | | | 321,000 | | | | 327,757 | | |
CCO Holdings LLC/Capital Corp.(a)
04/01/24 | | | 5.875 | % | | | 689,000 | | | | 721,727 | | |
05/01/25 | | | 5.375 | % | | | 341,000 | | | | 349,099 | | |
05/01/26 | | | 5.500 | % | | | 39,000 | | | | 39,780 | | |
CCOH Safari LLC(a)
02/15/26 | | | 5.750 | % | | | 481,000 | | | | 496,633 | | |
CSC Holdings LLC
02/15/19 | | | 8.625 | % | | | 425,000 | | | | 471,750 | | |
06/01/24 | | | 5.250 | % | | | 420,000 | | | | 382,200 | | |
Cequel Communications Holdings I LLC/Capital Corp.(a)
09/15/20 | | | 6.375 | % | | | 413,000 | | | | 422,821 | | |
12/15/21 | | | 5.125 | % | | | 182,000 | | | | 171,535 | | |
07/15/25 | | | 7.750 | % | | | 251,000 | | | | 254,765 | | |
DISH DBS Corp.
11/15/24 | | | 5.875 | % | | | 805,000 | | | | 755,492 | | |
DigitalGlobe, Inc.(a)
02/01/21 | | | 5.250 | % | | | 276,000 | | | | 249,435 | | |
Intelsat Jackson Holdings SA
10/15/20 | | | 7.250 | % | | | 280,000 | | | | 204,400 | | |
Neptune Finco Corp.(a)
10/15/25 | | | 6.625 | % | | | 562,000 | | | | 606,258 | | |
10/15/25 | | | 10.875 | % | | | 344,000 | | | | 382,700 | | |
UPCB Finance IV Ltd.(a)
01/15/25 | | | 5.375 | % | | | 343,000 | | | | 349,003 | | |
Unitymedia GmbH(a)
01/15/25 | | | 6.125 | % | | | 368,000 | | | | 379,040 | | |
Unitymedia Hessen GmbH & Co. KG NRW(a)
01/15/25 | | | 5.000 | % | | | 439,000 | | | | 441,195 | | |
Videotron Ltd.
07/15/22 | | | 5.000 | % | | | 286,000 | | | | 296,725 | | |
The accompanying Notes to Financial Statements are an integral part of this statement.
Annual Report 2016
7
COLUMBIA CORPORATE INCOME FUND
PORTFOLIO OF INVESTMENTS (continued)
April 30, 2016
Corporate Bonds & Notes (continued)
Issuer | | Coupon
Rate | | Principal
Amount ($) | | Value ($) | |
Virgin Media Finance PLC(a)
01/15/25 | | | 5.750 | % | | | 681,000 | | | | 686,107 | | |
Virgin Media Secured Finance PLC(a)
01/15/26 | | | 5.250 | % | | | 506,000 | | | | 507,457 | | |
Total | | | | | | | 8,927,149 | | |
CHEMICALS 0.7% | |
Angus Chemical Co.(a)
02/15/23 | | | 8.750 | % | | | 437,000 | | | | 416,242 | | |
Axalta Coating Systems Dutch Holding B BV/U.S. Holdings, Inc.(a)
05/01/21 | | | 7.375 | % | | | 290,000 | | | | 306,675 | | |
Celanese U.S. Holdings LLC
06/15/21 | | | 5.875 | % | | | 293,000 | | | | 315,707 | | |
Chemours Co. LLC (The)(a)
05/15/23 | | | 6.625 | % | | | 637,000 | | | | 557,375 | | |
05/15/25 | | | 7.000 | % | | | 185,000 | | | | 160,488 | | |
Eco Services Operations LLC/Finance Corp.(a)
11/01/22 | | | 8.500 | % | | | 398,000 | | | | 384,070 | | |
INEOS Group Holdings SA(a)
02/15/19 | | | 5.875 | % | | | 363,000 | | | | 368,445 | | |
LYB International Finance BV
03/15/44 | | | 4.875 | % | | | 4,255,000 | | | | 4,443,586 | | |
PQ Corp.(a)
11/01/18 | | | 8.750 | % | | | 904,000 | | | | 940,160 | | |
PQ Corp.(a)(b)
11/15/22 | | | 6.750 | % | | | 250,000 | | | | 258,125 | | |
Platform Specialty Products Corp.(a)
05/01/21 | | | 10.375 | % | | | 142,000 | | | | 142,000 | | |
02/01/22 | | | 6.500 | % | | | 147,000 | | | | 129,360 | | |
WR Grace & Co.(a)
10/01/21 | | | 5.125 | % | | | 331,000 | | | | 346,557 | | |
Total | | | | | | | 8,768,790 | | |
CONSTRUCTION MACHINERY 0.1% | |
United Rentals North America, Inc.
05/15/20 | | | 7.375 | % | | | 503,000 | | | | 523,120 | | |
United Rentals North America, Inc.(b)
09/15/26 | | | 5.875 | % | | | 326,000 | | | | 329,260 | | |
Total | | | | | | | 852,380 | | |
CONSUMER CYCLICAL SERVICES 0.1% | |
APX Group, Inc.
12/01/19 | | | 6.375 | % | | �� | 231,000 | | | | 231,000 | | |
12/01/20 | | | 8.750 | % | | | 339,000 | | | | 317,812 | | |
IHS, Inc.
11/01/22 | | | 5.000 | % | | | 594,000 | | | | 620,730 | | |
Corporate Bonds & Notes (continued)
Issuer | | Coupon
Rate | | Principal
Amount ($) | | Value ($) | |
Interval Acquisition Corp.(a)
04/15/23 | | | 5.625 | % | | | 483,000 | | | | 492,660 | | |
Total | | | | | | | 1,662,202 | | |
CONSUMER PRODUCTS 0.2% | |
Newell Brands, Inc.(a)
11/15/23 | | | 5.000 | % | | | 105,000 | | | | 110,796 | | |
Prestige Brands, Inc.(a)
03/01/24 | | | 6.375 | % | | | 284,000 | | | | 298,200 | | |
Scotts Miracle-Gro Co. (The)(a)
10/15/23 | | | 6.000 | % | | | 266,000 | | | | 281,295 | | |
Serta Simmons Bedding LLC(a)
10/01/20 | | | 8.125 | % | | | 369,000 | | | | 387,450 | | |
Spectrum Brands, Inc.
11/15/22 | | | 6.625 | % | | | 385,000 | | | | 415,800 | | |
07/15/25 | | | 5.750 | % | | | 422,000 | | | | 447,594 | | |
Springs Industries, Inc.
06/01/21 | | | 6.250 | % | | | 201,000 | | | | 204,518 | | |
Tempur Sealy International, Inc.
10/15/23 | | | 5.625 | % | | | 187,000 | | | | 194,480 | | |
Total | | | | | | | 2,340,133 | | |
DIVERSIFIED MANUFACTURING 0.3% | |
Entegris, Inc.(a)
04/01/22 | | | 6.000 | % | | | 350,000 | | | | 360,500 | | |
Manitowoc Foodservice, Inc.(a)
02/15/24 | | | 9.500 | % | | | 68,000 | | | | 75,140 | | |
United Technologies Corp.
12/15/17 | | | 5.375 | % | | | 3,062,000 | | | | 3,273,685 | | |
Total | | | | | | | 3,709,325 | | |
ELECTRIC 17.8% | |
Appalachian Power Co.
05/15/44 | | | 4.400 | % | | | 3,740,000 | | | | 3,859,732 | | |
06/01/45 | | | 4.450 | % | | | 4,330,000 | | | | 4,482,520 | | |
Berkshire Hathaway Energy Co.
11/15/23 | | | 3.750 | % | | | 7,440,000 | | | | 7,991,460 | | |
11/15/43 | | | 5.150 | % | | | 400,000 | | | | 476,603 | | |
02/01/45 | | | 4.500 | % | | | 804,000 | | | | 892,078 | | |
CMS Energy Corp.
03/15/22 | | | 5.050 | % | | | 3,150,000 | | | | 3,553,865 | | |
03/31/43 | | | 4.700 | % | | | 2,450,000 | | | | 2,647,852 | | |
03/01/44 | | | 4.875 | % | | | 6,190,000 | | | | 6,957,684 | | |
Calpine Corp.(a)
01/15/22 | | | 6.000 | % | | | 441,000 | | | | 465,806 | | |
Connecticut Light & Power Co. (The)
01/15/23 | | | 2.500 | % | | | 5,088,000 | | | | 5,087,451 | | |
The accompanying Notes to Financial Statements are an integral part of this statement.
Annual Report 2016
8
COLUMBIA CORPORATE INCOME FUND
PORTFOLIO OF INVESTMENTS (continued)
April 30, 2016
Corporate Bonds & Notes (continued)
Issuer | | Coupon
Rate | | Principal
Amount ($) | | Value ($) | |
DTE Energy Co.
12/01/23 | | | 3.850 | % | | | 1,470,000 | | | | 1,561,340 | | |
06/01/24 | | | 3.500 | % | | | 14,233,000 | | | | 14,805,964 | | |
DTE Energy Co.(a)
06/15/22 | | | 3.300 | % | | | 8,715,000 | | | | 9,034,082 | | |
Dominion Resources, Inc.
10/01/25 | | | 3.900 | % | | | 10,941,000 | | | | 11,509,538 | | |
09/15/42 | | | 4.050 | % | | | 1,821,000 | | | | 1,752,978 | | |
Duke Energy Corp.
08/15/22 | | | 3.050 | % | | | 10,000,000 | | | | 10,273,000 | | |
10/15/23 | | | 3.950 | % | | | 10,203,000 | | | | 11,003,140 | | |
Indiana Michigan Power Co.
03/15/23 | | | 3.200 | % | | | 10,265,000 | | | | 10,449,678 | | |
NRG Energy, Inc.
07/15/22 | | | 6.250 | % | | | 335,000 | | | | 328,407 | | |
05/01/24 | | | 6.250 | % | | | 185,000 | | | | 180,375 | | |
NRG Yield Operating LLC
08/15/24 | | | 5.375 | % | | | 596,000 | | | | 560,240 | | |
Oncor Electric Delivery Co. LLC
09/30/17 | | | 5.000 | % | | | 4,000,000 | | | | 4,188,980 | | |
04/01/45 | | | 3.750 | % | | | 4,357,000 | | | | 4,144,997 | | |
PPL Capital Funding, Inc.
12/01/22 | | | 3.500 | % | | | 750,000 | | | | 786,267 | | |
06/01/23 | | | 3.400 | % | | | 23,617,000 | | | | 24,410,059 | | |
03/15/24 | | | 3.950 | % | | | 1,565,000 | | | | 1,681,319 | | |
PSEG Power LLC
11/15/18 | | | 2.450 | % | | | 1,295,000 | | | | 1,298,714 | | |
11/15/23 | | | 4.300 | % | | | 1,605,000 | | | | 1,648,804 | | |
Pacific Gas & Electric Co.
06/15/23 | | | 3.250 | % | | | 5,128,000 | | | | 5,383,697 | | |
02/15/24 | | | 3.750 | % | | | 6,570,000 | | | | 7,104,154 | | |
02/15/44 | | | 4.750 | % | | | 943,000 | | | | 1,086,217 | | |
Progress Energy, Inc.
04/01/22 | | | 3.150 | % | | | 25,595,000 | | | | 26,286,321 | | |
Sierra Pacific Power Co.(a)
05/01/26 | | | 2.600 | % | | | 4,900,000 | | | | 4,890,866 | | |
TransAlta Corp.
06/03/17 | | | 1.900 | % | | | 15,885,000 | | | | 15,623,835 | | |
WEC Energy Group, Inc.
06/15/25 | | | 3.550 | % | | | 6,515,000 | | | | 6,868,615 | | |
Total | | | | | | | 213,276,638 | | |
FINANCE COMPANIES 0.5% | |
AerCap Ireland Capital Ltd./Global Aviation Trust
05/15/21 | | | 4.500 | % | | | 1,604,000 | | | | 1,656,130 | | |
10/01/21 | | | 5.000 | % | | | 669,000 | | | | 705,795 | | |
Aircastle Ltd.
03/15/21 | | | 5.125 | % | | | 198,000 | | | | 209,385 | | |
04/01/23 | | | 5.000 | % | | | 61,000 | | | | 62,108 | | |
Corporate Bonds & Notes (continued)
Issuer | | Coupon
Rate | | Principal
Amount ($) | | Value ($) | |
Navient Corp.
03/25/20 | | | 8.000 | % | | | 34,000 | | | | 35,700 | | |
10/26/20 | | | 5.000 | % | | | 91,000 | | | | 86,905 | | |
10/25/24 | | | 5.875 | % | | | 575,000 | | | | 504,562 | | |
OneMain Financial Holdings LLC(a)
12/15/19 | | | 6.750 | % | | | 271,000 | | | | 277,775 | | |
12/15/21 | | | 7.250 | % | | | 287,000 | | | | 298,480 | | |
Provident Funding Associates LP/Finance Corp.(a)
06/15/21 | | | 6.750 | % | | | 698,000 | | | | 661,355 | | |
Quicken Loans, Inc.(a)
05/01/25 | | | 5.750 | % | | | 297,000 | | | | 279,180 | | |
Springleaf Finance Corp.
12/15/20 | | | 8.250 | % | | | 45,000 | | | | 46,406 | | |
10/01/21 | | | 7.750 | % | | | 266,000 | | | | 262,675 | | |
10/01/23 | | | 8.250 | % | | | 226,000 | | | | 225,294 | | |
iStar, Inc.
07/01/19 | | | 5.000 | % | | | 147,000 | | | | 142,590 | | |
Total | | | | | | | 5,454,340 | | |
FOOD AND BEVERAGE 5.0% | |
Anheuser-Busch InBev Finance, Inc.
02/01/46 | | | 4.900 | % | | | 3,775,000 | | | | 4,281,069 | | |
ConAgra Foods, Inc.
01/25/23 | | | 3.200 | % | | | 10,029,000 | | | | 10,129,290 | | |
Constellation Brands, Inc.
11/15/24 | | | 4.750 | % | | | 412,000 | | | | 436,720 | | |
12/01/25 | | | 4.750 | % | | | 60,000 | | | | 63,675 | | |
Grupo Bimbo SAB de CV(a)
06/27/44 | | | 4.875 | % | | | 8,335,000 | | | | 8,002,400 | | |
Molson Coors Brewing Co.
05/01/42 | | | 5.000 | % | | | 10,104,000 | | | | 10,963,487 | | |
Pinnacle Foods Finance LLC/Corp.(a)
01/15/24 | | | 5.875 | % | | | 42,000 | | | | 44,415 | | |
Post Holdings, Inc.
02/15/22 | | | 7.375 | % | | | 133,000 | | | | 140,149 | | |
Post Holdings, Inc.(a)
03/15/24 | | | 7.750 | % | | | 392,000 | | | | 426,300 | | |
SABMiller Holdings, Inc.(a)
01/15/22 | | | 3.750 | % | | | 22,190,000 | | | | 23,707,286 | | |
Sysco Corp.
07/15/21 | | | 2.500 | % | | | 2,055,000 | | | | 2,080,003 | | |
Treehouse Foods, Inc.(a)
02/15/24 | | | 6.000 | % | | | 63,000 | | | | 67,016 | | |
Total | | | | | | | 60,341,810 | | |
GAMING 0.3% | |
Boyd Gaming Corp.
05/15/23 | | | 6.875 | % | | | 297,000 | | | | 308,137 | | |
The accompanying Notes to Financial Statements are an integral part of this statement.
Annual Report 2016
9
COLUMBIA CORPORATE INCOME FUND
PORTFOLIO OF INVESTMENTS (continued)
April 30, 2016
Corporate Bonds & Notes (continued)
Issuer | | Coupon
Rate | | Principal
Amount ($) | | Value ($) | |
Boyd Gaming Corp.(a)
04/01/26 | | | 6.375 | % | | | 103,000 | | | | 105,317 | | |
GLP Capital LP/Financing II, Inc.
11/01/23 | | | 5.375 | % | | | 292,000 | | | | 304,045 | | |
04/15/26 | | | 5.375 | % | | | 61,000 | | | | 63,593 | | |
International Game Technology PLC(a)
02/15/22 | | | 6.250 | % | | | 542,000 | | | | 551,593 | | |
MGM Resorts International
03/01/18 | | | 11.375 | % | | | 233,000 | | | | 267,950 | | |
10/01/20 | | | 6.750 | % | | | 616,000 | | | | 657,580 | | |
03/15/23 | | | 6.000 | % | | | 281,000 | | | | 291,889 | | |
MGP Escrow Issuer LLC/Co-Issuer, Inc.(a)
05/01/24 | | | 5.625 | % | | | 104,000 | | | | 108,420 | | |
Pinnacle Entertainment, Inc.(a)
05/01/24 | | | 5.625 | % | | | 85,000 | | | | 84,894 | | |
Scientific Games International, Inc.(a)
01/01/22 | | | 7.000 | % | | | 800,000 | | | | 815,500 | | |
Seminole Tribe of Florida, Inc.(a)
10/01/20 | | | 6.535 | % | | | 191,000 | | | | 200,550 | | |
10/01/20 | | | 7.804 | % | | | 300,000 | | | | 317,640 | | |
Tunica-Biloxi Gaming Authority(a)(d)
08/15/16 | | | 0.000 | % | | | 203,000 | | | | 104,038 | | |
Total | | | | | | | 4,181,146 | | |
HEALTH CARE 1.3% | |
Acadia Healthcare Co., Inc.
02/15/23 | | | 5.625 | % | | | 159,000 | | | | 162,578 | | |
Acadia Healthcare Co., Inc.(a)
03/01/24 | | | 6.500 | % | | | 188,000 | | | | 198,340 | | |
Alere, Inc.(a)
07/01/23 | | | 6.375 | % | | | 350,000 | | | | 357,000 | | |
Amsurg Corp.
11/30/20 | | | 5.625 | % | | | 276,000 | | | | 282,900 | | |
CHS/Community Health Systems, Inc.
02/01/22 | | | 6.875 | % | | | 502,000 | | | | 454,310 | | |
Change Healthcare Holdings, Inc.
12/31/19 | | | 11.000 | % | | | 392,000 | | | | 415,520 | | |
Change Healthcare Holdings, Inc.(a)
02/15/21 | | | 6.000 | % | | | 298,000 | | | | 300,980 | | |
ConvaTec Finance International SA
Junior Subordinated PIK(a)
01/15/19 | | | 8.250 | % | | | 353,000 | | | | 353,882 | | |
DaVita HealthCare Partners, Inc.
07/15/24 | | | 5.125 | % | | | 608,000 | | | | 618,774 | | |
ExamWorks Group, Inc.
04/15/23 | | | 5.625 | % | | | 198,000 | | | | 212,355 | | |
Corporate Bonds & Notes (continued)
Issuer | | Coupon
Rate | | Principal
Amount ($) | | Value ($) | |
HCA, Inc.
02/01/25 | | | 5.375 | % | | | 1,009,000 | | | | 1,031,702 | | |
04/15/25 | | | 5.250 | % | | | 560,000 | | | | 579,600 | | |
02/15/26 | | | 5.875 | % | | | 160,000 | | | | 166,000 | | |
Healthsouth Corp.
09/15/25 | | | 5.750 | % | | | 181,000 | | | | 187,245 | | |
Hologic, Inc.(a)
07/15/22 | | | 5.250 | % | | | 341,000 | | | | 357,197 | | |
Kinetic Concepts, Inc./KCI U.S.A., Inc.
11/01/18 | | | 10.500 | % | | | 263,000 | | | | 264,973 | | |
Kinetic Concepts, Inc./KCI U.S.A., Inc.(a)
02/15/21 | | | 7.875 | % | | | 49,000 | | | | 52,981 | | |
LifePoint Health, Inc.
12/01/21 | | | 5.500 | % | | | 406,000 | | | | 422,240 | | |
MEDNAX, Inc.(a)
12/01/23 | | | 5.250 | % | | | 177,000 | | | | 183,195 | | |
MPH Acquisition Holdings LLC(a)
04/01/22 | | | 6.625 | % | | | 380,000 | | | | 397,100 | | |
McKesson Corp.
03/15/23 | | | 2.850 | % | | | 6,845,000 | | | | 6,888,486 | | |
Sterigenics-Nordion Holdings LLC(a)
05/15/23 | | | 6.500 | % | | | 449,000 | | | | 455,735 | | |
Surgical Care Affiliates, Inc.(a)
04/01/23 | | | 6.000 | % | | | 206,000 | | | | 208,060 | | |
Tenet Healthcare Corp.
06/01/20 | | | 4.750 | % | | | 638,000 | | | | 657,140 | | |
04/01/22 | | | 8.125 | % | | | 684,000 | | | | 709,650 | | |
Total | | | | | | | 15,917,943 | | |
HEALTHCARE INSURANCE 0.1% | |
Centene Corp.
05/15/22 | | | 4.750 | % | | | 440,000 | | | | 450,450 | | |
Centene Corp.(a)
02/15/24 | | | 6.125 | % | | | 396,000 | | | | 417,780 | | |
Molina Healthcare, Inc.(a)
11/15/22 | | | 5.375 | % | | | 295,000 | | | | 304,588 | | |
Total | | | | | | | 1,172,818 | | |
HOME CONSTRUCTION 0.1% | |
CalAtlantic Group, Inc.
12/15/21 | | | 6.250 | % | | | 271,000 | | | | 290,648 | | |
Meritage Homes Corp.
06/01/25 | | | 6.000 | % | | | 515,000 | | | | 525,300 | | |
Taylor Morrison Communities, Inc./Monarch, Inc.(a)
04/15/21 | | | 5.250 | % | | | 355,000 | | | | 354,112 | | |
The accompanying Notes to Financial Statements are an integral part of this statement.
Annual Report 2016
10
COLUMBIA CORPORATE INCOME FUND
PORTFOLIO OF INVESTMENTS (continued)
April 30, 2016
Corporate Bonds & Notes (continued)
Issuer | | Coupon
Rate | | Principal
Amount ($) | | Value ($) | |
Toll Brothers Finance Corp.
11/15/25 | | | 4.875 | % | | | 152,000 | | | | 153,140 | | |
Total | | | | | | | 1,323,200 | | |
INDEPENDENT ENERGY 6.1% | |
Anadarko Petroleum Corp.
03/15/40 | | | 6.200 | % | | | 1,984,000 | | | | 2,094,981 | | |
Antero Resources Corp.
12/01/22 | | | 5.125 | % | | | 440,000 | | | | 422,400 | | |
Canadian Natural Resources Ltd.
02/01/35 | | | 5.850 | % | | | 2,615,000 | | | | 2,448,401 | | |
03/15/38 | | | 6.250 | % | | | 6,676,000 | | | | 6,725,182 | | |
Canadian Oil Sands Ltd.(a)
04/01/22 | | | 4.500 | % | | | 3,780,000 | | | | 3,782,722 | | |
04/01/42 | | | 6.000 | % | | | 3,625,000 | | | | 3,267,361 | | |
Carrizo Oil & Gas, Inc.
04/15/23 | | | 6.250 | % | | | 670,000 | | | | 643,200 | | |
Cimarex Energy Co.
05/01/22 | | | 5.875 | % | | | 9,800,000 | | | | 10,219,734 | | |
06/01/24 | | | 4.375 | % | | | 2,240,000 | | | | 2,282,036 | | |
Concho Resources, Inc.
04/01/23 | | | 5.500 | % | | | 881,000 | | | | 887,607 | | |
Continental Resources, Inc.
09/15/22 | | | 5.000 | % | | | 12,841,000 | | | | 11,990,284 | | |
06/01/44 | | | 4.900 | % | | | 740,000 | | | | 595,700 | | |
CrownRock LP/Finance, Inc.(a)
02/15/23 | | | 7.750 | % | | | 432,000 | | | | 440,640 | | |
Diamondback Energy, Inc.
10/01/21 | | | 7.625 | % | | | 122,000 | | | | 130,083 | | |
Laredo Petroleum, Inc.
01/15/22 | | | 5.625 | % | | | 1,441,000 | | | | 1,325,720 | | |
Marathon Oil Corp.
06/01/45 | | | 5.200 | % | | | 2,855,000 | | | | 2,419,278 | | |
Newfield Exploration Co.
07/01/24 | | | 5.625 | % | | | 210,000 | | | | 213,675 | | |
Noble Energy, Inc.
11/15/43 | | | 5.250 | % | | | 4,713,000 | | | | 4,462,127 | | |
Parsley Energy LLC/Finance Corp.(a)
02/15/22 | | | 7.500 | % | | | 794,000 | | | | 839,655 | | |
RSP Permian, Inc.
10/01/22 | | | 6.625 | % | | | 491,000 | | | | 506,957 | | |
WPX Energy, Inc.
Senior Unsecured
01/15/22 | | | 6.000 | % | | | 173,000 | | | | 155,700 | | |
Woodside Finance Ltd.(a)
03/05/25 | | | 3.650 | % | | | 17,728,000 | | | | 16,738,689 | | |
Total | | | | | | | 72,592,132 | | |
Corporate Bonds & Notes (continued)
Issuer | | Coupon
Rate | | Principal
Amount ($) | | Value ($) | |
INTEGRATED ENERGY 1.1% | |
Cenovus Energy, Inc.
09/15/23 | | | 3.800 | % | | | 3,276,000 | | | | 2,954,139 | | |
09/15/42 | | | 4.450 | % | | | 7,256,000 | | | | 5,618,575 | | |
09/15/43 | | | 5.200 | % | | | 5,070,000 | | | | 4,201,773 | | |
Total | | | | | | | 12,774,487 | | |
LEISURE —% | |
LTF Merger Sub, Inc.(a)
06/15/23 | | | 8.500 | % | | | 281,000 | | | | 276,083 | | |
LIFE INSURANCE 8.4% | |
Five Corners Funding Trust(a)
11/15/23 | | | 4.419 | % | | | 39,880,000 | | | | 42,371,144 | | |
Guardian Life Insurance Co. of America (The)
Subordinated(a)
06/19/64 | | | 4.875 | % | | | 10,176,000 | | | | 9,969,885 | | |
MetLife, Inc.
09/15/23 | | | 4.368 | % | | | 3,482,000 | | | | 3,819,388 | | |
03/01/45 | | | 4.050 | % | | | 1,500,000 | | | | 1,436,843 | | |
05/13/46 | | | 4.600 | % | | | 3,688,000 | | | | 3,880,702 | | |
Northwestern Mutual Life Insurance Co. (The)
Subordinated(a)
03/30/40 | | | 6.063 | % | | | 3,492,000 | | | | 4,253,109 | | |
Peachtree Corners Funding Trust(a)
02/15/25 | | | 3.976 | % | | | 12,368,000 | | | | 12,502,440 | | |
TIAA Asset Management Finance Co. LLC(a)
11/01/19 | | | 2.950 | % | | | 7,890,000 | | | | 8,047,887 | | |
Teachers Insurance & Annuity Association of America
Subordinated(a)
09/15/44 | | | 4.900 | % | | | 13,060,000 | | | | 14,057,745 | | |
Total | | | | | | | 100,339,143 | | |
LODGING 0.1% | |
Hilton Worldwide Finance LLC/Corp.
10/15/21 | | | 5.625 | % | | | 641,000 | | | | 667,634 | | |
Playa Resorts Holding BV(a)
08/15/20 | | | 8.000 | % | | | 566,000 | | | | 570,245 | | |
Total | | | | | | | 1,237,879 | | |
MEDIA AND ENTERTAINMENT 5.9% | |
21st Century Fox America, Inc.
09/15/44 | | | 4.750 | % | | | 9,890,000 | | | | 10,564,538 | | |
AMC Networks, Inc.
04/01/24 | | | 5.000 | % | | | 147,000 | | | | 147,184 | | |
Lamar Media Corp.(a)
02/01/26 | | | 5.750 | % | | | 89,000 | | | | 94,117 | | |
MDC Partners, Inc.(a)
05/01/24 | | | 6.500 | % | | | 703,000 | | | | 728,027 | | |
The accompanying Notes to Financial Statements are an integral part of this statement.
Annual Report 2016
11
COLUMBIA CORPORATE INCOME FUND
PORTFOLIO OF INVESTMENTS (continued)
April 30, 2016
Corporate Bonds & Notes (continued)
Issuer | | Coupon
Rate | | Principal
Amount ($) | | Value ($) | |
Netflix, Inc.
02/15/25 | | | 5.875 | % | | | 756,000 | | | | 792,288 | | |
Outfront Media Capital LLC/Corp.
03/15/25 | | | 5.875 | % | | | 366,000 | | | | 382,470 | | |
Scripps Networks Interactive, Inc.
11/15/24 | | | 3.900 | % | | | 15,841,000 | | | | 16,240,938 | | |
Sky PLC(a)
11/26/22 | | | 3.125 | % | | | 17,718,000 | | | | 17,946,385 | | |
09/16/24 | | | 3.750 | % | | | 3,850,000 | | | | 3,988,727 | | |
Thomson Reuters Corp.
05/23/43 | | | 4.500 | % | | | 11,719,000 | | | | 11,060,334 | | |
Time Warner, Inc.
03/29/41 | | | 6.250 | % | | | 6,360,000 | | | | 7,747,866 | | |
Univision Communications, Inc.(a)
02/15/25 | | | 5.125 | % | | | 994,000 | | | | 982,817 | | |
Total | | | | | | | 70,675,691 | | |
METALS 1.1% | |
ArcelorMittal(f)
08/05/20 | | | 6.250 | % | | | 15,000 | | | | 15,375 | | |
03/01/21 | | | 6.500 | % | | | 250,000 | | | | 255,625 | | |
02/25/22 | | | 7.250 | % | | | 335,000 | | | | 351,750 | | |
Barrick Gold Corp.
04/01/42 | | | 5.250 | % | | | 5,552,000 | | | | 5,421,139 | | |
Freeport-McMoRan, Inc.
03/01/22 | | | 3.550 | % | | | 79,000 | | | | 65,965 | | |
11/14/24 | | | 4.550 | % | | | 112,000 | | | | 94,220 | | |
Newmont Mining Corp.
03/15/42 | | | 4.875 | % | | | 4,306,000 | | | | 4,024,525 | | |
Teck Resources Ltd.
03/01/42 | | | 5.200 | % | | | 4,261,000 | | | | 3,055,947 | | |
Total | | | | | | | 13,284,546 | | |
MIDSTREAM 9.6% | |
Columbia Pipeline Group, Inc.(a)
06/01/45 | | | 5.800 | % | | | 6,756,000 | | | | 7,123,243 | | |
Energy Transfer Equity LP
06/01/27 | | | 5.500 | % | | | 638,000 | | | | 547,576 | | |
Enterprise Products Operating LLC
02/15/45 | | | 5.100 | % | | | 9,435,000 | | | | 9,923,412 | | |
05/15/46 | | | 4.900 | % | | | 3,785,000 | | | | 3,831,060 | | |
Kinder Morgan Energy Partners LP
09/01/22 | | | 3.950 | % | | | 778,000 | | | | 768,367 | | |
02/15/23 | | | 3.450 | % | | | 2,000 | | | | 1,891 | | |
09/01/23 | | | 3.500 | % | | | 500,000 | | | | 469,998 | | |
05/01/24 | | | 4.300 | % | | | 16,621,000 | | | | 16,213,453 | | |
03/01/43 | | | 5.000 | % | | | 10,199,000 | | | | 8,814,720 | | |
Northwest Pipeline LLC
04/15/17 | | | 5.950 | % | | | 8,479,000 | | | | 8,738,262 | | |
Corporate Bonds & Notes (continued)
Issuer | | Coupon
Rate | | Principal
Amount ($) | | Value ($) | |
Plains All American Pipeline LP/Finance Corp.
01/31/23 | | | 2.850 | % | | | 20,031,000 | | | | 17,806,057 | | |
10/15/23 | | | 3.850 | % | | | 2,880,000 | | | | 2,681,579 | | |
11/01/24 | | | 3.600 | % | | | 855,000 | | | | 766,681 | | |
06/15/44 | | | 4.700 | % | | | 4,134,000 | | | | 3,330,417 | | |
Regency Energy Partners LP/Finance Corp.
07/15/21 | | | 6.500 | % | | | 812,000 | | | | 829,239 | | |
Sabine Pass Liquefaction LLC
03/01/25 | | | 5.625 | % | | | 809,000 | | | | 788,775 | | |
Southern Natural Gas Co. LLC(a)
04/01/17 | | | 5.900 | % | | | 16,345,000 | | | | 16,812,549 | | |
Targa Resources Partners LP/Finance Corp.
11/15/23 | | | 4.250 | % | | | 554,000 | | | | 510,722 | | |
Targa Resources Partners LP/Finance Corp.(a)
03/15/24 | | | 6.750 | % | | | 267,000 | | | | 271,672 | | |
Tesoro Logistics LP/Finance Corp.
10/15/22 | | | 6.250 | % | | | 720,000 | | | | 738,000 | | |
Transcontinental Gas Pipe Line Co. LLC(a)
02/01/26 | | | 7.850 | % | | | 3,805,000 | | | | 4,593,738 | | |
Western Gas Partners LP
07/01/22 | | | 4.000 | % | | | 205,000 | | | | 196,588 | | |
06/01/25 | | | 3.950 | % | | | 163,000 | | | | 146,549 | | |
Williams Companies, Inc. (The)
01/15/23 | | | 3.700 | % | | | 244,000 | | | | 204,909 | | |
06/24/24 | | | 4.550 | % | | | 698,000 | | | | 601,585 | | |
Williams Partners LP
09/15/45 | | | 5.100 | % | | | 10,743,000 | | | | 8,765,353 | | |
Total | | | | | | | 115,476,395 | | |
NATURAL GAS 3.9% | |
CenterPoint Energy Resources Corp.
11/01/17 | | | 6.125 | % | | | 7,966,000 | | | | 8,421,369 | | |
NiSource Finance Corp.
02/15/43 | | | 5.250 | % | | | 5,620,000 | | | | 6,481,574 | | |
Sempra Energy
12/01/23 | | | 4.050 | % | | | 22,650,000 | | | | 24,266,734 | | |
06/15/24 | | | 3.550 | % | | | 7,480,000 | | | | 7,734,933 | | |
Total | | | | | | | 46,904,610 | | |
OIL FIELD SERVICES 1.0% | |
Noble Holding International Ltd.
03/15/22 | | | 3.950 | % | | | 10,115,000 | | | | 7,712,687 | | |
03/15/42 | | | 5.250 | % | | | 4,578,000 | | | | 2,838,360 | | |
Weatherford International Ltd.
03/15/38 | | | 7.000 | % | | | 1,520,000 | | | | 1,193,200 | | |
Total | | | | | | | 11,744,247 | | |
The accompanying Notes to Financial Statements are an integral part of this statement.
Annual Report 2016
12
COLUMBIA CORPORATE INCOME FUND
PORTFOLIO OF INVESTMENTS (continued)
April 30, 2016
Corporate Bonds & Notes (continued)
Issuer | | Coupon
Rate | | Principal
Amount ($) | | Value ($) | |
PACKAGING 0.2% | |
Ardagh Packaging Finance PLC/Holdings U.S.A., Inc.(a)(b)
05/15/23 | | | 4.625 | % | | | 213,000 | | | | 213,000 | | |
05/15/24 | | | 7.250 | % | | | 110,000 | | | | 110,000 | | |
Ardagh Packaging Finance PLC/Holdings USA, Inc.(a)
01/31/21 | | | 6.750 | % | | | 249,000 | | | | 249,623 | | |
Berry Plastics Corp.
07/15/23 | | | 5.125 | % | | | 480,000 | | | | 484,800 | | |
Berry Plastics Corp.(a)
10/15/22 | | | 6.000 | % | | | 205,000 | | | | 214,225 | | |
Plastipak Holdings, Inc.(a)
10/01/21 | | | 6.500 | % | | | 397,000 | | | | 402,955 | | |
Reynolds Group Issuer, Inc./LLC
10/15/20 | | | 5.750 | % | | | 645,000 | | | | 669,187 | | |
Signode Industrial Group Luxembourg SA/US, Inc.(a)
05/01/22 | | | 6.375 | % | | | 125,000 | | | | 121,875 | | |
Total | | | | | | | 2,465,665 | | |
PHARMACEUTICALS 1.0% | |
Actavis Funding
03/15/45 | | | 4.750 | % | | | 1,730,000 | | | | 1,749,943 | | |
Amgen, Inc.
05/15/43 | | | 5.375 | % | | | 5,083,000 | | | | 5,950,516 | | |
Concordia Healthcare Corp.(a)
04/15/23 | | | 7.000 | % | | | 264,000 | | | | 244,860 | | |
Endo Finance LLC/Ltd./Finco, Inc.(a)
07/15/23 | | | 6.000 | % | | | 671,000 | | | | 658,419 | | |
Grifols Worldwide Operations Ltd.
04/01/22 | | | 5.250 | % | | | 445,000 | | | | 458,350 | | |
Jaguar Holding Co. II/Pharmaceutical Product Development LLC(a)
08/01/23 | | | 6.375 | % | | | 818,000 | | | | 849,902 | | |
Mallinckrodt International Finance SA/CB LLC(a)
10/15/23 | | | 5.625 | % | | | 255,000 | | | | 239,062 | | |
04/15/25 | | | 5.500 | % | | | 163,000 | | | | 147,108 | | |
Valeant Pharmaceuticals International, Inc.(a)
10/15/20 | | | 6.375 | % | | | 535,000 | | | | 484,844 | | |
05/15/23 | | | 5.875 | % | | | 633,000 | | | | 530,137 | | |
04/15/25 | | | 6.125 | % | | | 844,000 | | | | 705,061 | | |
Total | | | | | | | 12,018,202 | | |
PROPERTY & CASUALTY 4.7% | |
Alleghany Corp.
06/27/22 | | | 4.950 | % | | | 12,743,000 | | | | 14,028,769 | | |
Alliant Holdings I LP(a)
08/01/23 | | | 8.250 | % | | | 24,000 | | | | 23,880 | | |
Berkshire Hathaway Finance Corp.
05/15/42 | | | 4.400 | % | | | 5,775,000 | | | | 6,302,061 | | |
Corporate Bonds & Notes (continued)
Issuer | | Coupon
Rate | | Principal
Amount ($) | | Value ($) | |
CNA Financial Corp.
05/15/24 | | | 3.950 | % | | | 7,416,000 | | | | 7,502,715 | | |
HUB International Ltd.(a)
02/15/21 | | | 9.250 | % | | | 59,000 | | | | 61,508 | | |
10/01/21 | | | 7.875 | % | | | 1,165,000 | | | | 1,141,700 | | |
Liberty Mutual Group, Inc.(a)
05/01/22 | | | 4.950 | % | | | 11,581,000 | | | | 12,593,006 | | |
06/15/23 | | | 4.250 | % | | | 7,524,000 | | | | 7,883,233 | | |
Loews Corp.
04/01/26 | | | 3.750 | % | | | 4,435,000 | | | | 4,592,123 | | |
05/15/43 | | | 4.125 | % | | | 2,550,000 | | | | 2,464,850 | | |
Total | | | | | | | 56,593,845 | | |
REFINING 0.5% | |
Marathon Petroleum Corp.
09/15/44 | | | 4.750 | % | | | 6,885,000 | | | | 5,754,621 | | |
Valero Energy Corp.
03/15/45 | | | 4.900 | % | | | 640,000 | | | | 596,747 | | |
Total | | | | | | | 6,351,368 | | |
RESTAURANTS 0.4% | |
Yum! Brands, Inc.
11/01/43 | | | 5.350 | % | | | 6,680,000 | | | | 5,360,700 | | |
RETAILERS 0.5% | |
Asbury Automotive Group, Inc.
12/15/24 | | | 6.000 | % | | | 359,000 | | | | 370,667 | | |
CVS Health Corp.
07/20/45 | | | 5.125 | % | | | 3,115,000 | | | | 3,640,339 | | |
Dollar Tree, Inc.(a)
03/01/23 | | | 5.750 | % | | | 509,000 | | | | 543,510 | | |
Group 1 Automotive, Inc.
06/01/22 | | | 5.000 | % | | | 157,000 | | | | 155,430 | | |
Group 1 Automotive, Inc.(a)
12/15/23 | | | 5.250 | % | | | 127,000 | | | | 126,365 | | |
Penske Automotive Group, Inc.
12/01/24 | | | 5.375 | % | | | 270,000 | | | | 272,025 | | |
Rite Aid Corp.
Junior Subordinated
02/15/27 | | | 7.700 | % | | | 198,000 | | | | 240,570 | | |
Rite Aid Corp.(a)
04/01/23 | | | 6.125 | % | | | 440,000 | | | | 468,877 | | |
Sally Holdings LLC/Capital, Inc.
12/01/25 | | | 5.625 | % | | | 87,000 | | | | 92,873 | | |
Total | | | | | | | 5,910,656 | | |
The accompanying Notes to Financial Statements are an integral part of this statement.
Annual Report 2016
13
COLUMBIA CORPORATE INCOME FUND
PORTFOLIO OF INVESTMENTS (continued)
April 30, 2016
Corporate Bonds & Notes (continued)
Issuer | | Coupon
Rate | | Principal
Amount ($) | | Value ($) | |
TECHNOLOGY 2.1% | |
Alliance Data Systems Corp.(a)
08/01/22 | | | 5.375 | % | | | 1,048,000 | | | | 1,008,700 | | |
Apple, Inc.
02/09/45 | | | 3.450 | % | | | 8,127,000 | | | | 7,405,420 | | |
05/13/45 | | | 4.375 | % | | | 4,948,000 | | | | 5,242,035 | | |
Equinix, Inc.
01/15/26 | | | 5.875 | % | | | 84,000 | | | | 88,882 | | |
First Data Corp.(a)
08/15/23 | | | 5.375 | % | | | 574,000 | | | | 593,372 | | |
12/01/23 | | | 7.000 | % | | | 770,000 | | | | 791,175 | | |
01/15/24 | | | 5.750 | % | | | 895,000 | | | | 908,425 | | |
Hewlett Packard Enterprise Co.(a)
10/15/45 | | | 6.350 | % | | | 5,624,000 | | | | 5,607,167 | | |
MSCI, Inc.(a)
11/15/24 | | | 5.250 | % | | | 447,000 | | | | 467,115 | | |
08/15/25 | | | 5.750 | % | | | 268,000 | | | | 285,085 | | |
Microsemi Corp.(a)
04/15/23 | | | 9.125 | % | | | 244,000 | | | | 268,400 | | |
NCR Corp.
12/15/23 | | | 6.375 | % | | | 185,000 | | | | 192,400 | | |
Riverbed Technology, Inc.(a)
03/01/23 | | | 8.875 | % | | | 439,000 | | | | 442,293 | | |
Sensata Technologies UK Financing Co. PLC(a)
02/15/26 | | | 6.250 | % | | | 200,000 | | | | 213,500 | | |
Solera LLC/Finance, Inc.(a)
03/01/24 | | | 10.500 | % | | | 153,000 | | | | 160,268 | | |
VeriSign, Inc.
05/01/23 | | | 4.625 | % | | | 382,000 | | | | 392,505 | | |
Zebra Technologies Corp.
10/15/22 | | | 7.250 | % | | | 524,000 | | | | 567,282 | | |
Total | | | | | | | 24,634,024 | | |
TRANSPORTATION SERVICES 1.2% | |
ERAC U.S.A. Finance LLC(a)
11/01/25 | | | 3.800 | % | | | 2,895,000 | | | | 3,021,512 | | |
02/15/45 | | | 4.500 | % | | | 7,805,000 | | | | 7,881,473 | | |
FedEx Corp.
04/01/46 | | | 4.550 | % | | | 3,440,000 | | | | 3,663,652 | | |
Hertz Corp. (The)
01/15/21 | | | 7.375 | % | | | 27,000 | | | | 27,844 | | |
10/15/22 | | | 6.250 | % | | | 54,000 | | | | 54,377 | | |
Total | | | | | | | 14,648,858 | | |
WIRELESS 1.0% | |
CC Holdings GS V LLC/Crown Castle GS III Corp.
12/15/17 | | | 2.381 | % | | | 3,465,000 | | | | 3,506,531 | | |
Corporate Bonds & Notes (continued)
Issuer | | Coupon
Rate | | Principal
Amount ($) | | Value ($) | |
Numericable-SFR SA(a)
05/15/22 | | | 6.000 | % | | | 333,000 | | | | 333,433 | | |
05/01/26 | | | 7.375 | % | | | 639,000 | | | | 648,585 | | |
Rogers Communications, Inc.
03/15/44 | | | 5.000 | % | | | 2,844,000 | | | | 3,171,276 | | |
Sprint Communications, Inc.
11/15/22 | | | 6.000 | % | | | 518,000 | | | | 380,994 | | |
Sprint Communications, Inc.(a)
11/15/18 | | | 9.000 | % | | | 1,214,000 | | | | 1,283,805 | | |
Sprint Corp.
09/15/21 | | | 7.250 | % | | | 679,000 | | | | 548,292 | | |
02/15/25 | | | 7.625 | % | | | 17,000 | | | | 12,814 | | |
T-Mobile USA, Inc.
04/28/21 | | | 6.633 | % | | | 457,000 | | | | 481,564 | | |
01/15/24 | | | 6.500 | % | | | 395,000 | | | | 420,675 | | |
01/15/26 | | | 6.500 | % | | | 681,000 | | | | 721,860 | | |
Wind Acquisition Finance SA(a)
07/15/20 | | | 4.750 | % | | | 313,000 | | | | 298,759 | | |
04/23/21 | | | 7.375 | % | | | 133,000 | | | | 118,370 | | |
Total | | | | | | | 11,926,958 | | |
WIRELINES 4.3% | |
AT&T, Inc.
06/15/45 | | | 4.350 | % | | | 24,143,000 | | | | 22,629,886 | | |
CenturyLink, Inc.
12/01/23 | | | 6.750 | % | | | 687,000 | | | | 676,695 | | |
04/01/24 | | | 7.500 | % | | | 46,000 | | | | 46,115 | | |
Frontier Communications Corp.
04/15/24 | | | 7.625 | % | | | 245,000 | | | | 217,486 | | |
01/15/25 | | | 6.875 | % | | | 527,000 | | | | 438,727 | | |
Frontier Communications Corp.(a)
09/15/20 | | | 8.875 | % | | | 101,000 | | | | 106,934 | | |
09/15/22 | | | 10.500 | % | | | 254,000 | | | | 261,333 | | |
09/15/25 | | | 11.000 | % | | | 709,000 | | | | 716,090 | | |
Level 3 Communications, Inc.
12/01/22 | | | 5.750 | % | | | 363,000 | | | | 373,168 | | |
Level 3 Financing, Inc.
08/15/22 | | | 5.375 | % | | | 422,000 | | | | 431,495 | | |
Level 3 Financing, Inc.(a)
01/15/24 | | | 5.375 | % | | | 77,000 | | | | 78,155 | | |
03/15/26 | | | 5.250 | % | | | 33,000 | | | | 33,495 | | |
Telecom Italia SpA(a)
05/30/24 | | | 5.303 | % | | | 171,000 | | | | 179,122 | | |
Verizon Communications, Inc.
11/01/42 | | | 3.850 | % | | | 10,274,000 | | | | 9,388,741 | | |
03/15/55 | | | 4.672 | % | | | 15,736,000 | | | | 15,217,971 | | |
The accompanying Notes to Financial Statements are an integral part of this statement.
Annual Report 2016
14
COLUMBIA CORPORATE INCOME FUND
PORTFOLIO OF INVESTMENTS (continued)
April 30, 2016
Corporate Bonds & Notes (continued)
Issuer | | Coupon
Rate | | Principal
Amount ($) | | Value ($) | |
Zayo Group LLC/Capital, Inc.
04/01/23 | | | 6.000 | % | | | 680,000 | | | | 698,700 | | |
Zayo Group LLC/Capital, Inc.(a)
05/15/25 | | | 6.375 | % | | | 181,000 | | | | 188,240 | | |
Total | | | | | | | 51,682,353 | | |
Total Corporate Bonds & Notes
(Cost: $976,355,925) | | | | | | | 994,991,047 | | |
Foreign Government Obligations(g) 0.1% | |
MEXICO 0.1% | |
Petroleos Mexicanos
06/27/44 | | | 5.500 | % | | | 1,045,000 | | | | 919,600 | | |
Total Foreign Government Obligations
(Cost: $934,711) | | | | | | | 919,600 | | |
Senior Loans —%
Borrower | | Weighted
Average
Coupon | | Principal
Amount ($) | | Value ($) | |
CHEMICALS —% | |
PQ Corp.
Term Loan(f)(h)
10/27/22 | | | 5.750 | % | | | 46,829 | | | | 47,055 | | |
DIVERSIFIED MANUFACTURING —% | |
Manitowoc Foodservice, Inc.
Tranche B Term Loan(f)(h)
03/03/23 | | | 5.750 | % | | | 141,785 | | | | 143,292 | | |
TECHNOLOGY —% | |
Microsemi Corp.
Tranche B Term Loan(f)(h)
01/15/23 | | | 5.250 | % | | | 329,860 | | | | 331,922 | | |
Total Senior Loans
(Cost: $505,818) | | | | | | | 522,269 | | |
Common Stocks —%
Issuer | | Shares | | Value ($) | |
FINANCIALS —% | |
Insurance —% | |
WMI Holdings Corp. Escrow(c)(e)(i)(j) | | | 1,075 | | | | — | | |
WMIH Corp.(j) | | | 21,388 | | | | 47,695 | | |
Total | | | | | 47,695 | | |
Total Financials | | | | | 47,695 | | |
Total Common Stocks
(Cost: $1,077,672) | | | | | 47,695 | | |
Warrants —% | |
HEALTH CARE —% | |
Health Care Providers & Services —% | |
HealthSouth Corp.(j) | | | 8,151 | | | | 29,425 | | |
Total Warrants
(Cost: $—) | | | | | 29,425 | | |
Money Market Funds 16.2%
| | | Shares | | Value ($) | |
Columbia Short-Term Cash Fund,
0.422%(k)(l) | | | 193,913,794 | | | | 193,913,794 | | |
Total Money Market Funds
(Cost: $193,913,794) | | | | | 193,913,794 | | |
Total Investments
(Cost: $1,172,787,920) | | | | | 1,190,423,830 | | |
Other Assets & Liabilities, Net | | | | | 9,002,975 | | |
Net Assets | | | | | 1,199,426,805 | | |
The accompanying Notes to Financial Statements are an integral part of this statement.
Annual Report 2016
15
COLUMBIA CORPORATE INCOME FUND
PORTFOLIO OF INVESTMENTS (continued)
April 30, 2016
At April 30, 2016, cash totaling $4,913,300 was pledged as collateral.
Investments in Derivatives
Futures Contracts Outstanding at April 30, 2016
Long Futures Contracts Outstanding
Contract Description | | Number of
Contracts | | Trading
Currency | | Notional
Market
Value ($) | | Expiration
Date | | Unrealized
Appreciation ($) | | Unrealized
(Depreciation) ($) | |
U.S. Treasury Ultra 10-Year Note | | | 249 | | | | | | 35,000,063 | | | 06/2016 | | | 349,621 | | | | — | | |
U.S. Ultra Bond | | | 379 | | | USD | | | | | 64,939,281 | | | 06/2016 | | | — | | | | (432,876 | ) | |
Total | | | | | | | 99,939,344 | | | | | | 349,621 | | | | (432,876 | ) | |
Short Futures Contracts Outstanding
Contract Description | | Number of
Contracts | | Trading
Currency | | Notional
Market
Value ($) | | Expiration
Date | | Unrealized
Appreciation ($) | | Unrealized
(Depreciation) ($) | |
U.S. Long Bond | | | (937 | ) | | USD | | | | | (153,023,813 | ) | | 06/2016 | | | 1,440,509 | | | | — | | |
U.S. Treasury 10-Year Note | | | (2,063 | ) | | USD | | | | | (268,318,938 | ) | | 06/2016 | | | 713,942 | | | | — | | |
U.S. Treasury 5-Year Note | | | (146 | ) | | USD | | | | | (17,653,453 | ) | | 06/2016 | | | 935 | | | | — | | |
Total | | | | | | | (438,996,204 | ) | | | | | 2,155,386 | | | | — | | |
Notes to Portfolio of Investments
(a) Represents privately placed and other securities and instruments exempt from SEC registration (collectively, private placements), such as Section 4(a)(2) and Rule 144A eligible securities, which are often sold only to qualified institutional buyers. The Fund may invest in private placements determined to be liquid as well as those determined to be illiquid. Private placements may be determined to be liquid under guidelines established by the Fund's Board of Trustees. At April 30, 2016, the value of these securities amounted to $293,035,761 or 24.43% of net assets.
(b) Security, or a portion thereof, has been purchased on a when-issued or delayed delivery basis.
(c) Identifies securities considered by the Investment Manager to be illiquid and may be difficult to sell. The aggregate value of such securities at April 30, 2016 was $9,525, which represents less than 0.01% of net assets. Information concerning such security holdings at April 30, 2016 is as follows:
Security Description | | Acquisition Dates | | Cost ($) | |
Washington Mutual Bank
Subordinated 01/15/15 5.125% | | 03/10/2006 - 05/14/2008 | | | 5,688,448 | | |
WMI Holdings Corp. Escrow | | 03/05/2007 | | | — | | |
(d) Represents securities that have defaulted on payment of interest. The Fund has stopped accruing interest on these securities. At April 30, 2016, the value of these securities amounted to $113,563, which represents 0.01% of net assets.
(e) Represents fair value as determined in good faith under procedures approved by the Board of Trustees. At April 30, 2016, the value of these securities amounted to $9,525, which represents less than 0.01% of net assets.
(f) Variable rate security.
(g) Principal and interest may not be guaranteed by the government.
(h) Senior loans have interest rates that float periodically based primarily on the London Interbank Offered Rate ("LIBOR") and other short-term rates. The interest rate shown reflects the weighted average coupon as of April 30, 2016. The interest rate shown for senior loans purchased on a when-issued or delayed delivery basis, if any, reflects an estimated average coupon. Remaining maturities of senior loans may be less than the stated maturities shown as a result of contractual or optional prepayments by the borrower. Such prepayments cannot be predicted.
The accompanying Notes to Financial Statements are an integral part of this statement.
Annual Report 2016
16
COLUMBIA CORPORATE INCOME FUND
PORTFOLIO OF INVESTMENTS (continued)
April 30, 2016
Notes to Portfolio of Investments (continued)
(i) Negligible market value.
(j) Non-income producing investment.
(k) The rate shown is the seven-day current annualized yield at April 30, 2016.
(l) As defined in the Investment Company Act of 1940, an affiliated company is one in which the Fund owns 5% or more of the company's outstanding voting securities, or a company which is under common ownership or control with the Fund. Holdings and transactions in these affiliated companies during the year ended April 30, 2016 are as follows:
Issuer | | Beginning
Cost ($) | | Purchase
Cost ($) | | Proceeds
From Sales ($) | | Ending
Cost ($) | | Dividends —
Affiliated
Issuers ($) | | Value ($) | |
Columbia Short-Term Cash Fund | | | 154,937,095 | | | | 621,781,604 | | | | (582,804,905 | ) | | | 193,913,794 | | | | 154,474 | | | | 193,913,794 | | |
Abbreviation Legend
PIK Payment-in-Kind
Currency Legend
USD US Dollar
Fair Value Measurements
The Fund categorizes its fair value measurements according to a three-level hierarchy that maximizes the use of observable inputs and minimizes the use of unobservable inputs by prioritizing that the most observable input be used when available. Observable inputs are those that market participants would use in pricing an investment based on market data obtained from sources independent of the reporting entity. Unobservable inputs are those that reflect the Fund's assumptions about the information market participants would use in pricing an investment. An investment's level within the fair value hierarchy is based on the lowest level of any input that is deemed significant to the asset's or liability's fair value measurement. The input levels are not necessarily an indication of the risk or liquidity associated with investments at that level. For example, certain U.S. government securities are generally high quality and liquid, however, they are reflected as Level 2 because the inputs used to determine fair value may not always be quoted prices in an active market.
Fair value inputs are summarized in the three broad levels listed below:
> Level 1 — Valuations based on quoted prices for investments in active markets that the Fund has the ability to access at the measurement date (including NAV for open-end mutual funds). Valuation adjustments are not applied to Level 1 investments.
> Level 2 — Valuations based on other significant observable inputs (including quoted prices for similar securities, interest rates, prepayment speeds, credit risks, etc.).
> Level 3 — Valuations based on significant unobservable inputs (including the Fund's own assumptions and judgment in determining the fair value of investments).
Inputs that are used in determining fair value of an investment may include price information, credit data, volatility statistics, and other factors. These inputs can be either observable or unobservable. The availability of observable inputs can vary between investments, and is affected by various factors such as the type of investment, and the volume and level of activity for that investment or similar investments in the marketplace. The inputs will be considered by the Investment Manager, along with any other relevant factors in the calculation of an investment's fair value. The Fund uses prices and inputs that are current as of the measurement date, which may include periods of market dislocations. During these periods, the availability of prices and inputs may be reduced for many investments. This condition could cause an investment to be reclassified between the various levels within the hierarchy.
Certain investments that have been measured at fair value using the net asset value per share (or its equivalent) are not categorized in the fair value hierarchy. The fair value amounts presented in the table are intended to reconcile the fair value hierarchy to the amounts presented in the Portfolio of Investments.
The Columbia Short-Term Cash Fund seeks to provide shareholders with maximum current income consistent with liquidity and stability of principal. Investments in Columbia Short-Term Cash Fund may be redeemed on a daily basis without restriction.
Investments falling into the Level 3 category are primarily supported by quoted prices from brokers and dealers participating in the market for those investments. However, these may be classified as Level 3 investments due to lack of market transparency and corroboration to support these quoted prices. Additionally, valuation models may be used as the pricing source for any remaining investments classified as Level 3. These models may rely on one or more significant unobservable inputs and/or significant assumptions by the Investment Manager. Inputs
The accompanying Notes to Financial Statements are an integral part of this statement.
Annual Report 2016
17
COLUMBIA CORPORATE INCOME FUND
PORTFOLIO OF INVESTMENTS (continued)
April 30, 2016
Fair Value Measurements (continued)
used in valuations may include, but are not limited to, financial statement analysis, capital account balances, discount rates and estimated cash flows, and comparable company data.
Under the direction of the Fund's Board of Trustees (the Board), the Investment Manager's Valuation Committee (the Committee) is responsible for overseeing the valuation procedures approved by the Board. The Committee consists of voting and non-voting members from various groups within the Investment Manager's organization, including operations and accounting, trading and investments, compliance, risk management and legal.
The Committee meets at least monthly to review and approve valuation matters, which may include a description of specific valuation determinations, data regarding pricing information received from approved pricing vendors and brokers and the results of Board-approved valuation control policies and procedures (the Policies). The Policies address, among other things, instances when market quotations are or are not readily available, including recommendations of third party pricing vendors and a determination of appropriate pricing methodologies; events that require specific valuation determinations and assessment of fair value techniques; securities with a potential for stale pricing, including those that are illiquid, restricted, or in default; and the effectiveness of third party pricing vendors, including periodic reviews of vendors. The Committee meets more frequently, as needed, to discuss additional valuation matters, which may include the need to review back-testing results, review time-sensitive information or approve related valuation actions. The Committee reports to the Board, with members of the Committee meeting with the Board at each of its regularly scheduled meetings to discuss valuation matters and actions during the period, similar to those described earlier.
For investments categorized as Level 3, the Committee monitors information similar to that described above, which may include: (i) data specific to the issuer or comparable issuers, (ii) general market or specific sector news and (iii) quoted prices and specific or similar security transactions. The Committee considers this data and any changes from prior periods in order to assess the reasonableness of observable and unobservable inputs, any assumptions or internal models used to value those securities and changes in fair value. This data is also used to corroborate, when available, information received from approved pricing vendors and brokers. Various factors impact the frequency of monitoring this information (which may occur as often as daily). However, the Committee may determine that changes to inputs, assumptions and models are not required as a result of the monitoring procedures performed.
The following table is a summary of the inputs used to value the Fund's investments at April 30, 2016:
| | | Level 1
Quoted Prices in Active
Markets for Identical
Assets ($) | | Level 2
Other Significant
Observable Inputs ($) | | Level 3
Significant
Unobservable Inputs ($) | | Total ($) | |
Investments | |
Corporate Bonds & Notes | | | — | | | | 994,981,522 | | | | 9,525 | | | | 994,991,047 | | |
Foreign Government Obligations | | | — | | | | 919,600 | | | | — | | | | 919,600 | | |
Senior Loans | | | — | | | | 522,269 | | | | — | | | | 522,269 | | |
Common Stocks | |
Financials | | | 47,695 | | | | — | | | | — | | | | 47,695 | | |
Warrants | |
Health Care | | | 29,425 | | | | — | | | | — | | | | 29,425 | | |
Investments measured at net asset value | |
Money Market Funds | | | — | | | | — | | | | — | | | | 193,913,794 | | |
Total Investments | | | 77,120 | | | | 996,423,391 | | | | 9,525 | | | | 1,190,423,830 | | |
Derivatives | |
Assets | |
Futures Contracts | | | 2,505,007 | | | | — | | | | — | | | | 2,505,007 | | |
Liabilities | |
Futures Contracts | | | (432,876 | ) | | | — | | | | — | | | | (432,876 | ) | |
Total | | | 2,149,251 | | | | 996,423,391 | | | | 9,525 | | | | 1,192,495,961 | | |
See the Portfolio of Investments for all investment classifications not indicated in the table.
The accompanying Notes to Financial Statements are an integral part of this statement.
Annual Report 2016
18
COLUMBIA CORPORATE INCOME FUND
PORTFOLIO OF INVESTMENTS (continued)
April 30, 2016
Fair Value Measurements (continued)
The Fund's assets assigned to the Level 2 input category are generally valued using the market approach, in which a security's value is determined through reference to prices and information from market transactions for similar or identical assets.
Derivative instruments are valued at unrealized appreciation (depreciation).
There were no transfers of financial assets between levels during the period.
The Fund does not hold any significant investments (greater than one percent of net assets) categorized as Level 3.
The Fund's assets assigned to the Level 3 category are valued utilizing the valuation technique deemed the most appropriate in the circumstances. Certain corporate bonds and common stocks classified as Level 3 are valued using an income approach. To determine fair value for these securities, management considered estimates of future distributions from the liquidation of company assets or potential actions related to the respective company's bankruptcy filing. Significant increases (decreases) to any of these inputs would result in a significantly lower (higher) fair value measurement. Generally, a change in the bankruptcy filings would result in a directionally similar change to estimates of future distributions.
The accompanying Notes to Financial Statements are an integral part of this statement.
Annual Report 2016
19
COLUMBIA CORPORATE INCOME FUND
STATEMENT OF ASSETS AND LIABILITIES
April 30, 2016
Assets | |
Investments, at value | |
Unaffiliated issuers (identified cost $978,874,126) | | $ | 996,510,036 | | |
Affiliated issuers (identified cost $193,913,794) | | | 193,913,794 | | |
Total investments (identified cost $1,172,787,920) | | | 1,190,423,830 | | |
Cash | | | 2,118 | | |
Margin deposits | | | 4,913,300 | | |
Receivable for: | |
Investments sold | | | 10,196,726 | | |
Investments sold on a delayed delivery basis | | | 169,080 | | |
Capital shares sold | | | 2,621,675 | | |
Dividends | | | 39,579 | | |
Interest | | | 12,062,748 | | |
Foreign tax reclaims | | | 9,244 | | |
Variation margin | | | 363,766 | | |
Expense reimbursement due from Investment Manager | | | 1,250 | | |
Prepaid expenses | | | 2,862 | | |
Trustees' deferred compensation plan | | | 77,266 | | |
Other assets | | | 10,429 | | |
Total assets | | | 1,220,893,873 | | |
Liabilities | |
Payable for: | |
Investments purchased | | | 9,016,432 | | |
Investments purchased on a delayed delivery basis | | | 6,937,281 | | |
Capital shares purchased | | | 1,214,347 | | |
Dividend distributions to shareholders | | | 3,245,346 | | |
Variation margin | | | 778,755 | | |
Investment management fees | | | 16,206 | | |
Distribution and/or service fees | | | 1,175 | | |
Transfer agent fees | | | 114,169 | | |
Chief compliance officer expenses | | | 57 | | |
Other expenses | | | 66,034 | | |
Trustees' deferred compensation plan | | | 77,266 | | |
Total liabilities | | | 21,467,068 | | |
Net assets applicable to outstanding capital stock | | $ | 1,199,426,805 | | |
Represented by | |
Paid-in capital | | $ | 1,216,126,083 | | |
Excess of distributions over net investment income | | | (753,511 | ) | |
Accumulated net realized loss | | | (35,190,694 | ) | |
Unrealized appreciation (depreciation) on: | |
Investments | | | 17,635,910 | | |
Futures contracts | | | 2,072,131 | | |
Swap contracts | | | (463,114 | ) | |
Total — representing net assets applicable to outstanding capital stock | | $ | 1,199,426,805 | | |
The accompanying Notes to Financial Statements are an integral part of this statement.
Annual Report 2016
20
COLUMBIA CORPORATE INCOME FUND
STATEMENT OF ASSETS AND LIABILITIES (continued)
April 30, 2016
Class A | |
Net assets | | $ | 98,149,355 | | |
Shares outstanding | | | 9,816,667 | | |
Net asset value per share | | $ | 10.00 | | |
Maximum offering price per share(a) | | $ | 10.50 | | |
Class B | |
Net assets | | $ | 289,841 | | |
Shares outstanding | | | 28,991 | | |
Net asset value per share | | $ | 10.00 | | |
Class C | |
Net assets | | $ | 11,739,646 | | |
Shares outstanding | | | 1,174,308 | | |
Net asset value per share | | $ | 10.00 | | |
Class I | |
Net assets | | $ | 539,754,277 | | |
Shares outstanding | | | 53,982,901 | | |
Net asset value per share | | $ | 10.00 | | |
Class R4 | |
Net assets | | $ | 15,459,447 | | |
Shares outstanding | | | 1,548,248 | | |
Net asset value per share | | $ | 9.99 | | |
Class R5 | |
Net assets | | $ | 1,459,498 | | |
Shares outstanding | | | 146,196 | | |
Net asset value per share | | $ | 9.98 | | |
Class W | |
Net assets | | $ | 33,249,792 | | |
Shares outstanding | | | 3,326,260 | | |
Net asset value per share | | $ | 10.00 | | |
Class Y | |
Net assets | | $ | 18,311,880 | | |
Shares outstanding | | | 1,831,709 | | |
Net asset value per share | | $ | 10.00 | | |
Class Z | |
Net assets | | $ | 481,013,069 | | |
Shares outstanding | | | 48,114,113 | | |
Net asset value per share | | $ | 10.00 | | |
(a) The maximum offering price per share is calculated by dividing the net asset value per share by 1.0 minus the maximum sales charge of 4.75%.
The accompanying Notes to Financial Statements are an integral part of this statement.
Annual Report 2016
21
COLUMBIA CORPORATE INCOME FUND
STATEMENT OF OPERATIONS
Year Ended April 30, 2016
Net investment income | |
Income: | |
Dividends — affiliated issuers | | $ | 154,474 | | |
Interest | | | 53,506,454 | | |
Foreign taxes withheld | | | (1,899 | ) | |
Total income | | | 53,659,029 | | |
Expenses: | |
Investment management fees | | | 6,492,390 | | |
Distribution and/or service fees | |
Class A | | | 266,084 | | |
Class B | | | 3,840 | | |
Class C | | | 130,648 | | |
Class W | | | 139,545 | | |
Transfer agent fees | |
Class A | | | 237,862 | | |
Class B | | | 853 | | |
Class C | | | 29,205 | | |
Class R4 | | | 43,915 | | |
Class R5 | | | 831 | | |
Class W | | | 123,749 | | |
Class Z | | | 1,153,209 | | |
Compensation of board members | | | 40,636 | | |
Custodian fees | | | 17,130 | | |
Printing and postage fees | | | 76,575 | | |
Registration fees | | | 113,939 | | |
Audit fees | | | 28,639 | | |
Legal fees | | | 42,776 | | |
Chief compliance officer expenses | | | 657 | | |
Other | | | 38,867 | | |
Total expenses | | | 8,981,350 | | |
Fees waived or expenses reimbursed by Investment Manager and its affiliates | | | (476,459 | ) | |
Fees waived by Distributor — Class C | | | (19,565 | ) | |
Expense reductions | | | (1,140 | ) | |
Total net expenses | | | 8,484,186 | | |
Net investment income | | | 45,174,843 | | |
Realized and unrealized gain (loss) — net | |
Net realized gain (loss) on: | |
Investments | | | (3,927,543 | ) | |
Futures contracts | | | (28,661,445 | ) | |
Net realized loss | | | (32,588,988 | ) | |
Net change in unrealized appreciation (depreciation) on: | |
Investments | | | (7,947,839 | ) | |
Futures contracts | | | 6,796,558 | | |
Net change in unrealized depreciation | | | (1,151,281 | ) | |
Net realized and unrealized loss | | | (33,740,269 | ) | |
Net increase in net assets resulting from operations | | $ | 11,434,574 | | |
The accompanying Notes to Financial Statements are an integral part of this statement.
Annual Report 2016
22
COLUMBIA CORPORATE INCOME FUND
STATEMENT OF CHANGES IN NET ASSETS
| | | Year Ended
April 30,
2016 | | Year Ended
April 30,
2015 | |
Operations | |
Net investment income | | $ | 45,174,843 | | | $ | 43,935,835 | | |
Net realized gain (loss) | | | (32,588,988 | ) | | | 245,741 | | |
Net change in unrealized depreciation | | | (1,151,281 | ) | | | (4,274,685 | ) | |
Net increase in net assets resulting from operations | | | 11,434,574 | | | | 39,906,891 | | |
Distributions to shareholders | |
Net investment income | |
Class A | | | (3,353,086 | ) | | | (3,485,939 | ) | |
Class B | | | (9,055 | ) | | | (18,173 | ) | |
Class C | | | (333,742 | ) | | | (322,947 | ) | |
Class I | | | (20,991,202 | ) | | | (20,476,155 | ) | |
Class R4 | | | (671,248 | ) | | | (466,740 | ) | |
Class R5 | | | (58,735 | ) | | | (51,503 | ) | |
Class W | | | (1,725,776 | ) | | | (3,524,253 | ) | |
Class Y | | | (590,408 | ) | | | (303,367 | ) | |
Class Z | | | (17,541,312 | ) | | | (15,320,629 | ) | |
Total distributions to shareholders | | | (45,274,564 | ) | | | (43,969,706 | ) | |
Increase (decrease) in net assets from capital stock activity | | | (295,017,836 | ) | | | 111,252,844 | | |
Total increase (decrease) in net assets | | | (328,857,826 | ) | | | 107,190,029 | | |
Net assets at beginning of year | | | 1,528,284,631 | | | | 1,421,094,602 | | |
Net assets at end of year | | $ | 1,199,426,805 | | | $ | 1,528,284,631 | | |
Excess of distributions over net investment income | | $ | (753,511 | ) | | $ | (660,718 | ) | |
The accompanying Notes to Financial Statements are an integral part of this statement.
Annual Report 2016
23
COLUMBIA CORPORATE INCOME FUND
STATEMENT OF CHANGES IN NET ASSETS (continued)
| | | Year Ended April 30, 2016 | | Year Ended April 30, 2015 | |
| | | Shares | | Dollars ($) | | Shares | | Dollars ($) | |
Capital stock activity | |
Class A shares | |
Subscriptions(a) | | | 1,412,250 | | | | 13,676,283 | | | | 3,948,583 | | | | 40,363,430 | | |
Distributions reinvested | | | 314,528 | | | | 3,050,265 | | | | 308,611 | | | | 3,158,666 | | |
Redemptions | | | (4,674,183 | ) | | | (45,520,121 | ) | | | (3,313,567 | ) | | | (33,927,809 | ) | |
Net increase (decrease) | | | (2,947,405 | ) | | | (28,793,573 | ) | | | 943,627 | | | | 9,594,287 | | |
Class B shares | |
Subscriptions | | | 1,761 | | | | 17,314 | | | | 9,546 | | | | 97,551 | | |
Distributions reinvested | | | 652 | | | | 6,344 | | | | 1,287 | | | | 13,173 | | |
Redemptions(a) | | | (36,495 | ) | | | (358,412 | ) | | | (71,219 | ) | | | (728,513 | ) | |
Net decrease | | | (34,082 | ) | | | (334,754 | ) | | | (60,386 | ) | | | (617,789 | ) | |
Class C shares | |
Subscriptions | | | 158,912 | | | | 1,532,883 | | | | 372,720 | | | | 3,807,021 | | |
Distributions reinvested | | | 30,088 | | | | 291,619 | | | | 26,940 | | | | 275,720 | | |
Redemptions | | | (524,015 | ) | | | (5,061,927 | ) | | | (418,148 | ) | | | (4,275,314 | ) | |
Net decrease | | | (335,015 | ) | | | (3,237,425 | ) | | | (18,488 | ) | | | (192,573 | ) | |
Class I shares | |
Subscriptions | | | 4,176,878 | | | | 39,537,190 | | | | 2,791,189 | | | | 28,630,130 | | |
Distributions reinvested | | | 2,165,499 | | | | 20,990,857 | | | | 2,000,545 | | | | 20,475,830 | | |
Redemptions | | | (14,029,743 | ) | | | (136,028,520 | ) | | | (9,383,289 | ) | | | (96,230,806 | ) | |
Net decrease | | | (7,687,366 | ) | | | (75,500,473 | ) | | | (4,591,555 | ) | | | (47,124,846 | ) | |
Class R4 shares | |
Subscriptions | | | 1,039,548 | | | | 10,103,217 | | | | 823,887 | | | | 8,416,778 | | |
Distributions reinvested | | | 69,390 | | | | 670,898 | | | | 45,632 | | | | 466,310 | | |
Redemptions | | | (1,369,440 | ) | | | (13,067,778 | ) | | | (184,854 | ) | | | (1,885,195 | ) | |
Net increase (decrease) | | | (260,502 | ) | | | (2,293,663 | ) | | | 684,665 | | | | 6,997,893 | | |
Class R5 shares | |
Subscriptions | | | 39,896 | | | | 394,301 | | | | 92,420 | | | | 939,625 | | |
Distributions reinvested | | | 6,034 | | | | 58,379 | | | | 5,007 | | | | 51,182 | | |
Redemptions | | | (75,850 | ) | | | (728,843 | ) | | | (81,303 | ) | | | (827,209 | ) | |
Net increase (decrease) | | | (29,920 | ) | | | (276,163 | ) | | | 16,124 | | | | 163,598 | | |
Class W shares | |
Subscriptions | | | 710,742 | | | | 6,941,685 | | | | 1,650,706 | | | | 16,887,311 | | |
Distributions reinvested | | | 176,959 | | | | 1,725,471 | | | | 344,305 | | | | 3,523,972 | | |
Redemptions | | | (9,847,164 | ) | | | (97,148,500 | ) | | | (2,662,764 | ) | | | (27,226,255 | ) | |
Net decrease | | | (8,959,463 | ) | | | (88,481,344 | ) | | | (667,753 | ) | | | (6,814,972 | ) | |
The accompanying Notes to Financial Statements are an integral part of this statement.
Annual Report 2016
24
COLUMBIA CORPORATE INCOME FUND
STATEMENT OF CHANGES IN NET ASSETS (continued)
| | | Year Ended April 30, 2016 | | Year Ended April 30, 2015 | |
| | | Shares | | Dollars ($) | | Shares | | Dollars ($) | |
Capital stock activity (continued) | |
Class Y shares | |
Subscriptions | | | 768,450 | | | | 7,587,732 | | | | 1,354,424 | | | | 13,911,427 | | |
Distributions reinvested | | | 58,102 | | | | 562,736 | | | | 29,638 | | | | 303,043 | | |
Redemptions | | | (231,102 | ) | | | (2,252,483 | ) | | | (150,561 | ) | | | (1,539,846 | ) | |
Net increase | | | 595,450 | | | | 5,897,985 | | | | 1,233,501 | | | | 12,674,624 | | |
Class Z shares | |
Subscriptions | | | 9,548,773 | | | | 92,787,837 | | | | 21,908,738 | | | | 223,960,059 | | |
Distributions reinvested | | | 690,470 | | | | 6,695,978 | | | | 588,948 | | | | 6,026,767 | | |
Redemptions | | | (20,781,782 | ) | | | (201,482,241 | ) | | | (9,147,738 | ) | | | (93,414,204 | ) | |
Net increase (decrease) | | | (10,542,539 | ) | | | (101,998,426 | ) | | | 13,349,948 | | | | 136,572,622 | | |
Total net increase (decrease) | | | (30,200,842 | ) | | | (295,017,836 | ) | | | 10,889,683 | | | | 111,252,844 | | |
(a) Includes conversions of Class B shares to Class A shares, if any.
The accompanying Notes to Financial Statements are an integral part of this statement.
Annual Report 2016
25
COLUMBIA CORPORATE INCOME FUND
The following tables are intended to help you understand the Fund's financial performance. Certain information reflects financial results for a single share of a class held for the periods shown. Per share net investment income (loss) amounts are calculated based on average shares outstanding during the period. Total return assumes reinvestment of all dividends and distributions, if any. Total return does not reflect payment of sales charges, if any. Total return and portfolio turnover are not annualized for periods of less than one year. The portfolio turnover rate is calculated without regard to purchase and sales transactions of short-term instruments and certain derivatives, if any. If such transactions were included, the Fund's portfolio turnover rate may be higher.
| | | Year Ended April 30, | | Year Ended
March 31, | |
Class A | | 2016 | | 2015 | | 2014 | | 2013 | | 2012(a) | | 2012 | |
Per share data | |
Net asset value, beginning of period | | $ | 10.18 | | | $ | 10.20 | | | $ | 10.67 | | | $ | 10.30 | | | $ | 10.19 | | | $ | 9.71 | | |
Income from investment operations: | |
Net investment income | | | 0.31 | | | | 0.28 | | | | 0.29 | | | | 0.32 | | | | 0.03 | | | | 0.35 | | |
Net realized and unrealized gain (loss) | | | (0.18 | ) | | | (0.02 | ) | | | (0.14 | ) | | | 0.59 | | | | 0.11 | | | | 0.49 | | |
Total from investment operations | | | 0.13 | | | | 0.26 | | | | 0.15 | | | | 0.91 | | | | 0.14 | | | | 0.84 | | |
Less distributions to shareholders: | |
Net investment income | | | (0.31 | ) | | | (0.28 | ) | | | (0.29 | ) | | | (0.32 | ) | | | (0.03 | ) | | | (0.36 | ) | |
Net realized gains | | | — | | | | — | | | | (0.33 | ) | | | (0.22 | ) | | | — | | | | — | | |
Total distributions to shareholders | | | (0.31 | ) | | | (0.28 | ) | | | (0.62 | ) | | | (0.54 | ) | | | (0.03 | ) | | | (0.36 | ) | |
Net asset value, end of period | | $ | 10.00 | | | $ | 10.18 | | | $ | 10.20 | | | $ | 10.67 | | | $ | 10.30 | | | $ | 10.19 | | |
Total return | | | 1.38 | % | | | 2.59 | % | | | 1.60 | % | | | 8.97 | % | | | 1.35 | % | | | 8.83 | % | |
Ratios to average net assets(b) | |
Total gross expenses | | | 1.00 | % | | | 0.97 | % | | | 0.96 | % | | | 0.96 | % | | | 0.97 | %(c) | | | 0.98 | %(d) | |
Total net expenses(e) | | | 0.93 | %(f) | | | 0.96 | %(f) | | | 0.96 | %(f) | | | 0.95 | %(f) | | | 0.92 | %(c) | | | 0.93 | %(d)(f) | |
Net investment income | | | 3.15 | % | | | 2.75 | % | | | 2.80 | % | | | 3.04 | % | | | 3.30 | %(c) | | | 3.54 | % | |
Supplemental data | |
Net assets, end of period (in thousands) | | $ | 98,149 | | | $ | 129,902 | | | $ | 120,603 | | | $ | 140,322 | | | $ | 123,974 | | | $ | 119,473 | | |
Portfolio turnover | | | 50 | % | | | 78 | % | | | 105 | % | | | 109 | % | | | 6 | % | | | 183 | % | |
Notes to Financial Highlights
(a) For the period from April 1, 2012 to April 30, 2012. During the period, the Fund's fiscal year end was changed from March 31 to April 30.
(b) In addition to the fees and expenses that the Fund bears directly, the Fund indirectly bears a pro rata share of the fees and expenses of any other funds in which it invests. Such indirect expenses are not included in the Fund's reported expense ratios.
(c) Annualized.
(d) Ratios include line of credit interest expense which is less than 0.01%.
(e) Total net expenses include the impact of certain fee waivers/expense reimbursements made by the Investment Manager and certain of its affiliates, if applicable.
(f) The benefits derived from expense reductions had an impact of less than 0.01%.
The accompanying Notes to Financial Statements are an integral part of this statement.
Annual Report 2016
26
COLUMBIA CORPORATE INCOME FUND
FINANCIAL HIGHLIGHTS (continued)
| | | Year Ended April 30, | | Year Ended
March 31, | |
Class B | | 2016 | | 2015 | | 2014 | | 2013 | | 2012(a) | | 2012 | |
Per share data | |
Net asset value, beginning of period | | $ | 10.18 | | | $ | 10.20 | | | $ | 10.67 | | | $ | 10.30 | | | $ | 10.19 | | | $ | 9.71 | | |
Income from investment operations: | |
Net investment income | | | 0.23 | | | | 0.20 | | | | 0.21 | | | | 0.24 | | | | 0.02 | | | | 0.28 | | |
Net realized and unrealized gain (loss) | | | (0.18 | ) | | | (0.01 | ) | | | (0.14 | ) | | | 0.59 | | | | 0.11 | | | | 0.49 | | |
Total from investment operations | | | 0.05 | | | | 0.19 | | | | 0.07 | | | | 0.83 | | | | 0.13 | | | | 0.77 | | |
Less distributions to shareholders: | |
Net investment income | | | (0.23 | ) | | | (0.21 | ) | | | (0.21 | ) | | | (0.24 | ) | | | (0.02 | ) | | | (0.29 | ) | |
Net realized gains | | | — | | | | — | | | | (0.33 | ) | | | (0.22 | ) | | | — | | | | — | | |
Total distributions to shareholders | | | (0.23 | ) | | | (0.21 | ) | | | (0.54 | ) | | | (0.46 | ) | | | (0.02 | ) | | | (0.29 | ) | |
Net asset value, end of period | | $ | 10.00 | | | $ | 10.18 | | | $ | 10.20 | | | $ | 10.67 | | | $ | 10.30 | | | $ | 10.19 | | |
Total return | | | 0.62 | % | | | 1.82 | % | | | 0.84 | % | | | 8.16 | % | | | 1.29 | % | | | 8.02 | % | |
Ratios to average net assets(b) | |
Total gross expenses | | | 1.74 | % | | | 1.72 | % | | | 1.71 | % | | | 1.71 | % | | | 1.72 | %(c) | | | 1.75 | %(d) | |
Total net expenses(e) | | | 1.69 | %(f) | | | 1.71 | %(f) | | | 1.71 | %(f) | | | 1.70 | %(f) | | | 1.67 | %(c) | | | 1.68 | %(d)(f) | |
Net investment income | | | 2.36 | % | | | 1.99 | % | | | 2.04 | % | | | 2.32 | % | | | 2.55 | %(c) | | | 2.84 | % | |
Supplemental data | |
Net assets, end of period (in thousands) | | $ | 290 | | | $ | 642 | | | $ | 1,259 | | | $ | 2,455 | | | $ | 3,129 | | | $ | 3,173 | | |
Portfolio turnover | | | 50 | % | | | 78 | % | | | 105 | % | | | 109 | % | | | 6 | % | | | 183 | % | |
Notes to Financial Highlights
(a) For the period from April 1, 2012 to April 30, 2012. During the period, the Fund's fiscal year end was changed from March 31 to April 30.
(b) In addition to the fees and expenses that the Fund bears directly, the Fund indirectly bears a pro rata share of the fees and expenses of any other funds in which it invests. Such indirect expenses are not included in the Fund's reported expense ratios.
(c) Annualized.
(d) Ratios include line of credit interest expense which is less than 0.01%.
(e) Total net expenses include the impact of certain fee waivers/expense reimbursements made by the Investment Manager and certain of its affiliates, if applicable.
(f) The benefits derived from expense reductions had an impact of less than 0.01%.
The accompanying Notes to Financial Statements are an integral part of this statement.
Annual Report 2016
27
COLUMBIA CORPORATE INCOME FUND
FINANCIAL HIGHLIGHTS (continued)
| | | Year Ended April 30, | | Year Ended
March 31, | |
Class C | | 2016 | | 2015 | | 2014 | | 2013 | | 2012(a) | | 2012 | |
Per share data | |
Net asset value, beginning of period | | $ | 10.18 | | | $ | 10.20 | | | $ | 10.67 | | | $ | 10.30 | | | $ | 10.19 | | | $ | 9.71 | | |
Income from investment operations: | |
Net investment income | | | 0.25 | | | | 0.22 | | | | 0.22 | | | | 0.26 | | | | 0.02 | | | | 0.29 | | |
Net realized and unrealized gain (loss) | | | (0.18 | ) | | | (0.02 | ) | | | (0.13 | ) | | | 0.58 | | | | 0.11 | | | | 0.49 | | |
Total from investment operations | | | 0.07 | | | | 0.20 | | | | 0.09 | | | | 0.84 | | | | 0.13 | | | | 0.78 | | |
Less distributions to shareholders: | |
Net investment income | | | (0.25 | ) | | | (0.22 | ) | | | (0.23 | ) | | | (0.25 | ) | | | (0.02 | ) | | | (0.30 | ) | |
Net realized gains | | | — | | | | — | | | | (0.33 | ) | | | (0.22 | ) | | | — | | | | — | | |
Total distributions to shareholders | | | (0.25 | ) | | | (0.22 | ) | | | (0.56 | ) | | | (0.47 | ) | | | (0.02 | ) | | | (0.30 | ) | |
Net asset value, end of period | | $ | 10.00 | | | $ | 10.18 | | | $ | 10.20 | | | $ | 10.67 | | | $ | 10.30 | | | $ | 10.19 | | |
Total return | | | 0.78 | % | | | 1.98 | % | | | 0.99 | % | | | 8.32 | % | | | 1.30 | % | | | 8.18 | % | |
Ratios to average net assets(b) | |
Total gross expenses | | | 1.75 | % | | | 1.72 | % | | | 1.71 | % | | | 1.71 | % | | | 1.72 | %(c) | | | 1.73 | %(d) | |
Total net expenses(e) | | | 1.53 | %(f) | | | 1.56 | %(f) | | | 1.56 | %(f) | | | 1.55 | %(f) | | | 1.52 | %(c) | | | 1.53 | %(d)(f) | |
Net investment income | | | 2.55 | % | | | 2.15 | % | | | 2.20 | % | | | 2.42 | % | | | 2.69 | %(c) | | | 2.93 | % | |
Supplemental data | |
Net assets, end of period (in thousands) | | $ | 11,740 | | | $ | 15,359 | | | $ | 15,587 | | | $ | 24,821 | | | $ | 17,062 | | | $ | 16,074 | | |
Portfolio turnover | | | 50 | % | | | 78 | % | | | 105 | % | | | 109 | % | | | 6 | % | | | 183 | % | |
Notes to Financial Highlights
(a) For the period from April 1, 2012 to April 30, 2012. During the period, the Fund's fiscal year end was changed from March 31 to April 30.
(b) In addition to the fees and expenses that the Fund bears directly, the Fund indirectly bears a pro rata share of the fees and expenses of any other funds in which it invests. Such indirect expenses are not included in the Fund's reported expense ratios.
(c) Annualized.
(d) Ratios include line of credit interest expense which is less than 0.01%.
(e) Total net expenses include the impact of certain fee waivers/expense reimbursements made by the Investment Manager and certain of its affiliates, if applicable.
(f) The benefits derived from expense reductions had an impact of less than 0.01%.
The accompanying Notes to Financial Statements are an integral part of this statement.
Annual Report 2016
28
COLUMBIA CORPORATE INCOME FUND
FINANCIAL HIGHLIGHTS (continued)
| | | Year Ended April 30, | | Year Ended
March 31, | |
Class I | | 2016 | | 2015 | | 2014 | | 2013 | | 2012(a) | | 2012 | |
Per share data | |
Net asset value, beginning of period | | $ | 10.18 | | | $ | 10.20 | | | $ | 10.67 | | | $ | 10.30 | | | $ | 10.19 | | | $ | 9.71 | | |
Income from investment operations: | |
Net investment income | | | 0.35 | | | | 0.33 | | | | 0.33 | | | | 0.37 | | | | 0.03 | | | | 0.38 | | |
Net realized and unrealized gain (loss) | | | (0.18 | ) | | | (0.02 | ) | | | (0.14 | ) | | | 0.58 | | | | 0.11 | | | | 0.50 | | |
Total from investment operations | | | 0.17 | | | | 0.31 | | | | 0.19 | | | | 0.95 | | | | 0.14 | | | | 0.88 | | |
Less distributions to shareholders: | |
Net investment income | | | (0.35 | ) | | | (0.33 | ) | | | (0.33 | ) | | | (0.36 | ) | | | (0.03 | ) | | | (0.40 | ) | |
Net realized gains | | | — | | | | — | | | | (0.33 | ) | | | (0.22 | ) | | | — | | | | — | | |
Total distributions to shareholders | | | (0.35 | ) | | | (0.33 | ) | | | (0.66 | ) | | | (0.58 | ) | | | (0.03 | ) | | | (0.40 | ) | |
Net asset value, end of period | | $ | 10.00 | | | $ | 10.18 | | | $ | 10.20 | | | $ | 10.67 | | | $ | 10.30 | | | $ | 10.19 | | |
Total return | | | 1.81 | % | | | 3.04 | % | | | 2.04 | % | | | 9.43 | % | | | 1.38 | % | | | 9.23 | % | |
Ratios to average net assets(b) | |
Total gross expenses | | | 0.52 | % | | | 0.52 | % | | | 0.52 | % | | | 0.53 | % | | | 0.55 | %(c) | | | 0.54 | %(d) | |
Total net expenses(e) | | | 0.51 | % | | | 0.52 | % | | | 0.52 | % | | | 0.53 | % | | | 0.55 | %(c) | | | 0.54 | %(d)(f) | |
Net investment income | | | 3.58 | % | | | 3.19 | % | | | 3.25 | % | | | 3.47 | % | | | 3.68 | %(c) | | | 3.81 | % | |
Supplemental data | |
Net assets, end of period (in thousands) | | $ | 539,754 | | | $ | 627,684 | | | $ | 676,153 | | | $ | 608,842 | | | $ | 576,449 | | | $ | 560,564 | | |
Portfolio turnover | | | 50 | % | | | 78 | % | | | 105 | % | | | 109 | % | | | 6 | % | | | 183 | % | |
Notes to Financial Highlights
(a) For the period from April 1, 2012 to April 30, 2012. During the period, the Fund's fiscal year end was changed from March 31 to April 30.
(b) In addition to the fees and expenses that the Fund bears directly, the Fund indirectly bears a pro rata share of the fees and expenses of any other funds in which it invests. Such indirect expenses are not included in the Fund's reported expense ratios.
(c) Annualized.
(d) Ratios include line of credit interest expense which is less than 0.01%.
(e) Total net expenses include the impact of certain fee waivers/expense reimbursements made by the Investment Manager and certain of its affiliates, if applicable.
(f) The benefits derived from expense reductions had an impact of less than 0.01%.
The accompanying Notes to Financial Statements are an integral part of this statement.
Annual Report 2016
29
COLUMBIA CORPORATE INCOME FUND
FINANCIAL HIGHLIGHTS (continued)
| | | Year Ended April 30, | |
Class R4 | | 2016 | | 2015 | | 2014 | | 2013(a) | |
Per share data | |
Net asset value, beginning of period | | $ | 10.16 | | | $ | 10.19 | | | $ | 10.65 | | | $ | 10.81 | | |
Income from investment operations: | |
Net investment income | | | 0.33 | | | | 0.31 | | | | 0.31 | | | | 0.14 | | |
Net realized and unrealized gain (loss) | | | (0.17 | ) | | | (0.03 | ) | | | (0.13 | ) | | | 0.07 | | |
Total from investment operations | | | 0.16 | | | | 0.28 | | | | 0.18 | | | | 0.21 | | |
Less distributions to shareholders: | |
Net investment income | | | (0.33 | ) | | | (0.31 | ) | | | (0.31 | ) | | | (0.15 | ) | |
Net realized gains | | | — | | | | — | | | | (0.33 | ) | | | (0.22 | ) | |
Total distributions to shareholders | | | (0.33 | ) | | | (0.31 | ) | | | (0.64 | ) | | | (0.37 | ) | |
Net asset value, end of period | | $ | 9.99 | | | $ | 10.16 | | | $ | 10.19 | | | $ | 10.65 | | |
Total return | | | 1.73 | % | | | 2.74 | % | | | 1.95 | % | | | 2.03 | % | |
Ratios to average net assets(b) | |
Total gross expenses | | | 0.75 | % | | | 0.72 | % | | | 0.72 | % | | | 0.74 | %(c) | |
Total net expenses(d) | | | 0.68 | %(e) | | | 0.71 | %(e) | | | 0.71 | %(e) | | | 0.71 | %(c) | |
Net investment income | | | 3.42 | % | | | 3.01 | % | | | 3.13 | % | | | 2.97 | %(c) | |
Supplemental data | |
Net assets, end of period (in thousands) | | $ | 15,459 | | | $ | 18,384 | | | $ | 11,454 | | | $ | 865 | | |
Portfolio turnover | | | 50 | % | | | 78 | % | | | 105 | % | | | 109 | % | |
Notes to Financial Highlights
(a) Based on operations from November 8, 2012 (commencement of operations) through the stated period end.
(b) In addition to the fees and expenses that the Fund bears directly, the Fund indirectly bears a pro rata share of the fees and expenses of any other funds in which it invests. Such indirect expenses are not included in the Fund's reported expense ratios.
(c) Annualized.
(d) Total net expenses include the impact of certain fee waivers/expense reimbursements made by the Investment Manager and certain of its affiliates, if applicable.
(e) The benefits derived from expense reductions had an impact of less than 0.01%.
The accompanying Notes to Financial Statements are an integral part of this statement.
Annual Report 2016
30
COLUMBIA CORPORATE INCOME FUND
FINANCIAL HIGHLIGHTS (continued)
| | | Year Ended April 30, | |
Class R5 | | 2016 | | 2015 | | 2014 | | 2013(a) | |
Per share data | |
Net asset value, beginning of period | | $ | 10.16 | | | $ | 10.19 | | | $ | 10.65 | | | $ | 10.81 | | |
Income from investment operations: | |
Net investment income | | | 0.34 | | | | 0.32 | | | | 0.33 | | | | 0.14 | | |
Net realized and unrealized gain (loss) | | | (0.18 | ) | | | (0.03 | ) | | | (0.13 | ) | | | 0.08 | | |
Total from investment operations | | | 0.16 | | | | 0.29 | | | | 0.20 | | | | 0.22 | | |
Less distributions to shareholders: | |
Net investment income | | | (0.34 | ) | | | (0.32 | ) | | | (0.33 | ) | | | (0.16 | ) | |
Net realized gains | | | — | | | | — | | | | (0.33 | ) | | | (0.22 | ) | |
Total distributions to shareholders | | | (0.34 | ) | | | (0.32 | ) | | | (0.66 | ) | | | (0.38 | ) | |
Net asset value, end of period | | $ | 9.98 | | | $ | 10.16 | | | $ | 10.19 | | | $ | 10.65 | | |
Total return | | | 1.76 | % | | | 2.89 | % | | | 2.09 | % | | | 2.08 | % | |
Ratios to average net assets(b) | |
Total gross expenses | | | 0.57 | % | | | 0.57 | % | | | 0.57 | % | | | 0.58 | %(c) | |
Total net expenses(d) | | | 0.56 | % | | | 0.57 | % | | | 0.57 | % | | | 0.58 | %(c) | |
Net investment income | | | 3.53 | % | | | 3.14 | % | | | 3.17 | % | | | 3.05 | %(c) | |
Supplemental data | |
Net assets, end of period (in thousands) | | $ | 1,459 | | | $ | 1,790 | | | $ | 1,630 | | | $ | 117 | | |
Portfolio turnover | | | 50 | % | | | 78 | % | | | 105 | % | | | 109 | % | |
Notes to Financial Highlights
(a) Based on operations from November 8, 2012 (commencement of operations) through the stated period end.
(b) In addition to the fees and expenses that the Fund bears directly, the Fund indirectly bears a pro rata share of the fees and expenses of any other funds in which it invests. Such indirect expenses are not included in the Fund's reported expense ratios.
(c) Annualized.
(d) Total net expenses include the impact of certain fee waivers/expense reimbursements made by the Investment Manager and certain of its affiliates, if applicable.
The accompanying Notes to Financial Statements are an integral part of this statement.
Annual Report 2016
31
COLUMBIA CORPORATE INCOME FUND
FINANCIAL HIGHLIGHTS (continued)
| | | Year Ended April 30, | | Year Ended
March 31, | |
Class W | | 2016 | | 2015 | | 2014 | | 2013 | | 2012(a) | | 2012 | |
Per share data | |
Net asset value, beginning of period | | $ | 10.18 | | | $ | 10.20 | | | $ | 10.67 | | | $ | 10.30 | | | $ | 10.19 | | | $ | 9.71 | | |
Income from investment operations: | |
Net investment income | | | 0.30 | | | | 0.28 | | | | 0.29 | | | | 0.32 | | | | 0.03 | | | | 0.35 | | |
Net realized and unrealized gain (loss) | | | (0.17 | ) | | | (0.02 | ) | | | (0.14 | ) | | | 0.59 | | | | 0.11 | | | | 0.49 | | |
Total from investment operations | | | 0.13 | | | | 0.26 | | | | 0.15 | | | | 0.91 | | | | 0.14 | | | | 0.84 | | |
Less distributions to shareholders: | |
Net investment income | | | (0.31 | ) | | | (0.28 | ) | | | (0.29 | ) | | | (0.32 | ) | | | (0.03 | ) | | | (0.36 | ) | |
Net realized gains | | | — | | | | — | | | | (0.33 | ) | | | (0.22 | ) | | | — | | | | — | | |
Total distributions to shareholders | | | (0.31 | ) | | | (0.28 | ) | | | (0.62 | ) | | | (0.54 | ) | | | (0.03 | ) | | | (0.36 | ) | |
Net asset value, end of period | | $ | 10.00 | | | $ | 10.18 | | | $ | 10.20 | | | $ | 10.67 | | | $ | 10.30 | | | $ | 10.19 | | |
Total return | | | 1.39 | % | | | 2.59 | % | | | 1.60 | % | | | 8.97 | % | | | 1.35 | % | | | 8.83 | % | |
Ratios to average net assets(b) | |
Total gross expenses | | | 1.00 | % | | | 0.97 | % | | | 0.96 | % | | | 0.96 | % | | | 0.97 | %(c) | | | 0.98 | %(d) | |
Total net expenses(e) | | | 0.94 | %(f) | | | 0.96 | %(f) | | | 0.96 | %(f) | | | 0.95 | %(f) | | | 0.92 | %(c) | | | 0.93 | %(d)(f) | |
Net investment income | | | 3.09 | % | | | 2.75 | % | | | 2.81 | % | | | 3.06 | % | | | 3.30 | %(c) | | | 3.50 | % | |
Supplemental data | |
Net assets, end of period (in thousands) | | $ | 33,250 | | | $ | 125,035 | | | $ | 132,166 | | | $ | 159,179 | | | $ | 162,775 | | | $ | 159,553 | | |
Portfolio turnover | | | 50 | % | | | 78 | % | | | 105 | % | | | 109 | % | | | 6 | % | | | 183 | % | |
Notes to Financial Highlights
(a) For the period from April 1, 2012 to April 30, 2012. During the period, the Fund's fiscal year end was changed from March 31 to April 30.
(b) In addition to the fees and expenses that the Fund bears directly, the Fund indirectly bears a pro rata share of the fees and expenses of any other funds in which it invests. Such indirect expenses are not included in the Fund's reported expense ratios.
(c) Annualized.
(d) Ratios include line of credit interest expense which is less than 0.01%.
(e) Total net expenses include the impact of certain fee waivers/expense reimbursements made by the Investment Manager and certain of its affiliates, if applicable.
(f) The benefits derived from expense reductions had an impact of less than 0.01%.
The accompanying Notes to Financial Statements are an integral part of this statement.
Annual Report 2016
32
COLUMBIA CORPORATE INCOME FUND
FINANCIAL HIGHLIGHTS (continued)
| | | Year Ended April 30, | |
Class Y | | 2016 | | 2015 | | 2014 | | 2013(a) | |
Per share data | |
Net asset value, beginning of period | | $ | 10.18 | | | $ | 10.20 | | | $ | 10.66 | | | $ | 10.82 | | |
Income from investment operations: | |
Net investment income | | | 0.35 | | | | 0.33 | | | | 0.33 | | | | 0.17 | | |
Net realized and unrealized gain (loss) | | | (0.18 | ) | | | (0.02 | ) | | | (0.13 | ) | | | 0.05 | | |
Total from investment operations | | | 0.17 | | | | 0.31 | | | | 0.20 | | | | 0.22 | | |
Less distributions to shareholders: | |
Net investment income | | | (0.35 | ) | | | (0.33 | ) | | | (0.33 | ) | | | (0.16 | ) | |
Net realized gains | | | — | | | | — | | | | (0.33 | ) | | | (0.22 | ) | |
Total distributions to shareholders | | | (0.35 | ) | | | (0.33 | ) | | | (0.66 | ) | | | (0.38 | ) | |
Net asset value, end of period | | $ | 10.00 | | | $ | 10.18 | | | $ | 10.20 | | | $ | 10.66 | | |
Total return | | | 1.81 | % | | | 3.04 | % | | | 2.14 | % | | | 2.09 | % | |
Ratios to average net assets(b) | |
Total gross expenses | | | 0.52 | % | | | 0.52 | % | | | 0.51 | % | | | 0.45 | %(c) | |
Total net expenses(d) | | | 0.51 | % | | | 0.52 | % | | | 0.51 | % | | | 0.45 | %(c) | |
Net investment income | | | 3.60 | % | | | 3.24 | % | | | 3.30 | % | | | 3.35 | %(c) | |
Supplemental data | |
Net assets, end of period (in thousands) | | $ | 18,312 | | | $ | 12,581 | | | $ | 28 | | | $ | 2 | | |
Portfolio turnover | | | 50 | % | | | 78 | % | | | 105 | % | | | 109 | % | |
Notes to Financial Highlights
(a) Based on operations from November 8, 2012 (commencement of operations) through the stated period end.
(b) In addition to the fees and expenses that the Fund bears directly, the Fund indirectly bears a pro rata share of the fees and expenses of any other funds in which it invests. Such indirect expenses are not included in the Fund's reported expense ratios.
(c) Annualized.
(d) Total net expenses include the impact of certain fee waivers/expense reimbursements made by the Investment Manager and certain of its affiliates, if applicable.
The accompanying Notes to Financial Statements are an integral part of this statement.
Annual Report 2016
33
COLUMBIA CORPORATE INCOME FUND
FINANCIAL HIGHLIGHTS (continued)
| | | Year Ended April 30, | | Year Ended
March 31, | |
Class Z | | 2016 | | 2015 | | 2014 | | 2013 | | 2012(a) | | 2012 | |
Per share data | |
Net asset value, beginning of period | | $ | 10.18 | | | $ | 10.20 | | | $ | 10.67 | | | $ | 10.30 | | | $ | 10.19 | | | $ | 9.71 | | |
Income from investment operations: | |
Net investment income | | | 0.33 | | | | 0.31 | | | | 0.31 | | | | 0.35 | | | | 0.03 | | | | 0.38 | | |
Net realized and unrealized gain (loss) | | | (0.18 | ) | | | (0.02 | ) | | | (0.14 | ) | | | 0.58 | | | | 0.11 | | | | 0.49 | | |
Total from investment operations | | | 0.15 | | | | 0.29 | | | | 0.17 | | | | 0.93 | | | | 0.14 | | | | 0.87 | | |
Less distributions to shareholders: | |
Net investment income | | | (0.33 | ) | | | (0.31 | ) | | | (0.31 | ) | | | (0.34 | ) | | | (0.03 | ) | | | (0.39 | ) | |
Net realized gains | | | — | | | | — | | | | (0.33 | ) | | | (0.22 | ) | | | — | | | | — | | |
Total distributions to shareholders | | | (0.33 | ) | | | (0.31 | ) | | | (0.64 | ) | | | (0.56 | ) | | | (0.03 | ) | | | (0.39 | ) | |
Net asset value, end of period | | $ | 10.00 | | | $ | 10.18 | | | $ | 10.20 | | | $ | 10.67 | | | $ | 10.30 | | | $ | 10.19 | | |
Total return | | | 1.64 | % | | | 2.84 | % | | | 1.85 | % | | | 9.24 | % | | | 1.37 | % | | | 9.10 | % | |
Ratios to average net assets(b) | |
Total gross expenses | | | 0.75 | % | | | 0.72 | % | | | 0.71 | % | | | 0.71 | % | | | 0.72 | %(c) | | | 0.73 | %(d) | |
Total net expenses(e) | | | 0.68 | %(f) | | | 0.71 | %(f) | | | 0.71 | %(f) | | | 0.70 | %(f) | | | 0.67 | %(c) | | | 0.68 | %(d)(f) | |
Net investment income | | | 3.40 | % | | | 3.01 | % | | | 3.05 | % | | | 3.30 | % | | | 3.55 | %(c) | | | 3.80 | % | |
Supplemental data | |
Net assets, end of period (in thousands) | | $ | 481,013 | | | $ | 596,908 | | | $ | 462,215 | | | $ | 537,860 | | | $ | 524,432 | | | $ | 515,700 | | |
Portfolio turnover | | | 50 | % | | | 78 | % | | | 105 | % | | | 109 | % | | | 6 | % | | | 183 | % | |
Notes to Financial Highlights
(a) For the period from April 1, 2012 to April 30, 2012. During the period, the Fund's fiscal year end was changed from March 31 to April 30.
(b) In addition to the fees and expenses that the Fund bears directly, the Fund indirectly bears a pro rata share of the fees and expenses of any other funds in which it invests. Such indirect expenses are not included in the Fund's reported expense ratios.
(c) Annualized.
(d) Ratios include line of credit interest expense which is less than 0.01%.
(e) Total net expenses include the impact of certain fee waivers/expense reimbursements made by the Investment Manager and certain of its affiliates, if applicable.
(f) The benefits derived from expense reductions had an impact of less than 0.01%.
The accompanying Notes to Financial Statements are an integral part of this statement.
Annual Report 2016
34
COLUMBIA CORPORATE INCOME FUND
NOTES TO FINANCIAL STATEMENTS
April 30, 2016
Note 1. Organization
Columbia Corporate Income Fund (the Fund), a series of Columbia Funds Series Trust I (the Trust), is a diversified fund. The Trust is registered under the Investment Company Act of 1940, as amended (the 1940 Act), as an open-end management investment company organized as a Massachusetts business trust.
Fund Shares
The Trust may issue an unlimited number of shares (without par value). The Fund offers Class A, Class B, Class C, Class I, Class R4, Class R5, Class W, Class Y and Class Z shares. Although all share classes generally have identical voting, dividend and liquidation rights, each share class votes separately when required by the Trust's organizational documents or by law. Different share classes pay different distribution amounts to the extent the expenses of such share classes differ, and distributions in liquidation will be proportional to the net asset value of each share class. Each share class has its own expense and sales charge structure.
Class A shares are subject to a maximum front-end sales charge of 4.75% based on the initial investment amount. Class A shares purchased without an initial sales charge in accounts aggregating $1 million to $50 million at the time of purchase are subject to a contingent deferred sales charge (CDSC) if the shares are sold within 18 months after purchase, charged as follows: 1.00% CDSC if redeemed within 12 months after purchase, and 0.50% CDSC if redeemed more than 12, but less than 18, months after purchase.
Class B shares may be subject to a maximum CDSC of 5.00% based upon the holding period after purchase. Class B shares will generally convert to Class A shares eight years after purchase. The Fund no longer accepts investments by new or existing investors in the Fund's Class B shares, except in connection with the reinvestment of any dividend and/or capital gain distributions in Class B shares of the Fund and exchanges by existing Class B shareholders of certain other funds within the Columbia Family of Funds.
Class C shares are subject to a 1.00% CDSC on shares redeemed within 12 months after purchase.
Class I shares are not subject to sales charges and are available only to the Columbia Family of Funds.
Class R4 shares are not subject to sales charges and are generally available only to omnibus retirement plans
and certain investors as described in the Fund's prospectus.
Class R5 shares are not subject to sales charges and are generally available only to investors purchasing through authorized investment professionals and omnibus retirement plans.
Class W shares are not subject to sales charges and are available only to investors purchasing through authorized investment programs managed by investment professionals, including discretionary managed account programs.
Class Y shares are not subject to sales charges and are generally available only to certain retirement plans as described in the Fund's prospectus.
Class Z shares are not subject to sales charges and are available only to eligible investors, which are subject to different investment minimums as described in the Fund's prospectus.
Note 2. Summary of Significant Accounting Policies
Basis of Preparation
The Fund is an investment company that applies the accounting and reporting guidance in the Financial Accounting Standards Board (FASB) Accounting Standards Codification Topic 946, Financial Services — Investment Companies (ASC 946). The financial statements are prepared in accordance with U.S. generally accepted accounting principles (GAAP), which requires management to make certain estimates and assumptions that affect the reported amounts of assets and liabilities, the disclosure of contingent assets and liabilities at the date of the financial statements and the reported amounts of income and expenses during the reporting period. Actual results could differ from those estimates.
The following is a summary of significant accounting policies followed by the Fund in the preparation of its financial statements.
Security Valuation
Debt securities generally are valued by pricing services approved by the Board of Trustees (the Board) based upon market transactions for normal, institutional-size trading units of similar securities. The services may use various pricing techniques that take into account, as applicable, factors such as yield, quality, coupon rate, maturity, type of issue, trading characteristics and other
Annual Report 2016
35
COLUMBIA CORPORATE INCOME FUND
NOTES TO FINANCIAL STATEMENTS (continued)
April 30, 2016
data, as well as broker quotes. Debt securities for which quotations are not readily available or not believed to be reflective of market value may also be valued based upon a bid quote from an approved independent broker-dealer. Debt securities maturing in 60 days or less are valued primarily at amortized cost value, unless this method results in a valuation that management believes does not approximate market value.
All equity securities are valued at the close of business of the New York Stock Exchange (NYSE). Equity securities are valued at the last quoted sales price on the principal exchange or market on which they trade, except for securities traded on the NASDAQ Stock Market, which are valued at the NASDAQ official close price. Unlisted securities or listed securities for which there were no sales during the day are valued at the mean of the latest quoted bid and ask prices on such exchanges or markets.
Senior loan securities for which reliable market quotations are readily available are generally valued by pricing services at the average of the bids received.
Investments in open-end investment companies, including money market funds, are valued at their latest net asset value.
Futures and options on futures contracts are valued based upon the settlement price at the close of regular trading on their principal exchanges or, in the absence of transactions, at the mean of the latest quoted bid and ask prices.
Investments for which market quotations are not readily available, or that have quotations which management believes are not reflective of market value or reliable, are valued at fair value as determined in good faith under procedures approved by and under the general supervision of the Board. If a security or class of securities (such as foreign securities) is valued at fair value, such value is likely to be different from the quoted or published price for the security.
The determination of fair value often requires significant judgment. To determine fair value, management may use assumptions including but not limited to future cash flows and estimated risk premiums. Multiple inputs from various sources may be used to determine fair value.
GAAP requires disclosure regarding the inputs and valuation techniques used to measure fair value and any changes in valuation inputs or techniques. In addition, investments shall be disclosed by major category. This information is disclosed following the Fund's Portfolio of Investments.
Derivative Instruments
The Fund invests in certain derivative instruments, as detailed below, to meet its investment objectives. Derivatives are instruments whose values depend on, or are derived from, in whole or in part, the value of one or more securities, currencies, commodities, indices, or other assets or instruments. Derivatives may be used to increase investment flexibility (including to maintain cash reserves while maintaining desired exposure to certain assets), for risk management (hedging) purposes, to facilitate trading, to reduce transaction costs and to pursue higher investment returns. The Fund may also use derivative instruments to mitigate certain investment risks, such as foreign currency exchange rate risk, interest rate risk and credit risk. Derivatives may involve various risks, including the potential inability of the counterparty to fulfill its obligation under the terms of the contract, the potential for an illiquid secondary market (making it difficult for the Fund to sell, including at favorable prices) and the potential for market movements which may expose the Fund to gains or losses in excess of the amount shown in the Statement of Assets and Liabilities. The notional amounts of derivative instruments, if applicable, are not recorded in the financial statements.
A derivative instrument may suffer a marked-to-market loss if the value of the contract decreases due to an unfavorable change in the market rates or values of the underlying instrument. Losses can also occur if the counterparty does not perform under the contract. The Fund's risk of loss from counterparty credit risk on over-the-counter derivatives is generally limited to the aggregate unrealized gain netted against any collateral held by the Fund and the amount of any variation margin held by the counterparty. With exchange-traded or centrally cleared derivatives, there is reduced counterparty credit risk to the Fund since the exchange's clearinghouse, as counterparty to such instruments, guarantees against a possible default. The clearinghouse stands between the buyer and the seller of the contract; therefore, the counterparty credit risk is failure of the clearinghouse. However, credit risk still exists in exchange-traded or centrally cleared derivatives with respect to initial and variation margin that is held in a broker's customer account. While brokers are required to segregate customer margin from their own assets, in the event that a broker becomes insolvent or goes into bankruptcy and at that time there is a shortfall in the aggregate amount of margin held by the broker for all its clients, U.S. bankruptcy laws will typically allocate that shortfall on a pro-rata basis across all the broker's
Annual Report 2016
36
COLUMBIA CORPORATE INCOME FUND
NOTES TO FINANCIAL STATEMENTS (continued)
April 30, 2016
customers (including the Fund), potentially resulting in losses to the Fund.
In order to better define its contractual rights and to secure rights that will help the Fund mitigate its counterparty risk, the Fund may enter into an International Swaps and Derivatives Association, Inc. Master Agreement (ISDA Master Agreement) or similar agreement with its derivatives contract counterparties. An ISDA Master Agreement is an agreement between the Fund and a counterparty that governs over-the-counter derivatives and forward foreign currency exchange contracts and typically contains, among other things, collateral posting terms and netting provisions in the event of a default and/or termination event. Under an ISDA Master Agreement, the Fund may, under certain circumstances, offset with the counterparty certain derivative instrument's payables and/or receivables with collateral held and/or posted and create one single net payment. The provisions of the ISDA Master Agreement typically permit a single net payment in the event of default (close-out netting) including the bankruptcy or insolvency of the counterparty. Note, however, that bankruptcy or insolvency laws of a particular jurisdiction may impose restrictions on or prohibitions against the right of offset in bankruptcy, insolvency or other events.
Collateral (margin) requirements differ by type of derivative. Margin requirements are established by the exchange or clearinghouse for exchange-traded and centrally cleared derivatives. Brokers can ask for margin in excess of the minimum in certain circumstances. Collateral terms are contract specific for over-the-counter derivatives. For over-the-counter derivatives traded under an ISDA Master Agreement, the collateral requirements are typically calculated by netting the marked-to-market amount for each transaction under such agreement and comparing that amount to the value of any variation margin currently pledged by the Fund and/or the counterparty. Generally, the amount of collateral due from or to a party has to exceed a minimum transfer amount threshold (e.g., $500,000) before a transfer has to be made. To the extent amounts due to the Fund from its counterparties are not fully collateralized, contractually or otherwise, the Fund bears the risk of loss from counterparty nonperformance. The Fund attempts to mitigate counterparty risk by only entering into agreements with counterparties that it believes have the financial resources to honor their obligations and by monitoring the financial stability of those counterparties.
Certain ISDA Master Agreements allow counterparties to over-the-counter derivatives transactions to terminate
derivatives contracts prior to maturity in the event the Fund's net asset value declines by a stated percentage over a specified time period or if the Fund fails to meet certain terms of the ISDA Master Agreement, which would cause the Fund to accelerate payment of any net liability owed to the counterparty. The Fund also has termination rights if the counterparty fails to meet certain terms of the ISDA Master Agreement. In addition to considering counterparty credit risk, the Fund would consider terminating the derivatives contracts based on whether termination would result in a net liability owed from the counterparty.
For financial reporting purposes, the Fund does not offset derivative assets and derivative liabilities that are subject to netting arrangements in the Statement of Assets and Liabilities.
Futures Contracts
Futures contracts are exchange traded and represent commitments for the future purchase or sale of an asset at a specified price on a specified date. The Fund bought and sold futures contracts to manage the duration and yield curve exposure of the Fund versus the benchmark and manage exposure to movements in interest rates These instruments may be used for other purposes in future periods. Upon entering into futures contracts, the Fund bears risks that it may not achieve the anticipated benefits of the futures contracts and may realize a loss. Additional risks include counterparty credit risk, the possibility of an illiquid market, and that a change in the value of the contract or option may not correlate with changes in the value of the underlying asset.
Upon entering into a futures contract, the Fund pledges cash or securities with the broker in an amount sufficient to meet the initial margin requirement. The initial margin deposit must be maintained at an established level over the life of the contract. Cash deposited as initial margin is recorded in the Statement of Assets and Liabilities as margin deposits. Securities deposited as initial margin are designated in the Portfolio of Investments. Subsequent payments (variation margin) are made or received by the Fund each day. The variation margin payments are equal to the daily change in the contract value and are recorded as variation margin receivable or payable and are offset in unrealized gains or losses. The Fund recognizes a realized gain or loss when the contract is closed or expires. Futures contracts involve, to varying degrees, risk of loss in excess of the variation margin disclosed in the Statement of Assets and Liabilities.
Annual Report 2016
37
COLUMBIA CORPORATE INCOME FUND
NOTES TO FINANCIAL STATEMENTS (continued)
April 30, 2016
Effects of Derivative Transactions in the Financial Statements
The following tables are intended to provide additional information about the effect of derivatives on the financial statements of the Fund, including: the fair value of derivatives by risk category and the location of those fair values in the Statement of Assets and Liabilities; and the impact of derivative transactions over the period in the Statement of Operations, including realized and unrealized gains (losses). The derivative instrument schedules following the Portfolio of Investments present additional information regarding derivative instruments outstanding at the end of the period, if any.
The following table is a summary of the fair value of derivative instruments (not considered to be hedging instruments for accounting disclosure purposes) at April 30, 2016:
Asset Derivatives | |
Risk Exposure
Category | | Statement of Assets and
Liabilities Location | | Fair Value ($) | |
Interest rate
risk
| | Net assets — unrealized
appreciation on futures
contracts | | | 2,505,007
| * | |
Liability Derivatives | |
Risk Exposure
Category | | Statement of Assets and
Liabilities Location | | Fair Value ($) | |
Interest rate
risk
| | Net assets — unrealized
depreciation on futures
contracts | | | 432,876 | * | |
*Includes cumulative appreciation (depreciation) as reported in the tables following the Portfolio of Investments. Only the current day's variation margin is reported in receivables or payables in the Statement of Assets and Liabilities.
The following table indicates the effect of derivative instruments (not considered to be hedging instruments for accounting disclosure purposes) in the Statement of Operations for the year ended April 30, 2016:
Amount of Realized Gain (Loss) on Derivatives Recognized in Income | |
Risk Exposure Category | | Futures Contracts ($) | |
Interest rate risk | | | (28,661,445 | ) | |
Change in Unrealized Appreciation (Depreciation) on
Derivatives Recognized in Income | |
Risk Exposure Category | | Futures Contracts ($) | |
Interest rate risk | | | 6,796,558 | | |
The following table provides a summary of the average outstanding volume by derivative instrument for the year ended April 30, 2016:
Derivative Instrument | | Average notional amounts ($)* | |
Futures contracts — Long | | | 44,129,055 | | |
Futures contracts — Short | | | 545,365,422 | | |
*Based on the ending quarterly outstanding amounts for the year ended April 30, 2016.
Investments in Senior Loans
The Fund may invest in senior loan assignments. When the Fund purchases an assignment of a senior loan, the Fund typically has direct rights against the borrower; provided, however, that the Fund's rights may be more limited than the lender from which it acquired the assignment and the Fund may be able to enforce its rights only through an administrative agent. Although certain senior loan assignments are secured by collateral, the Fund could experience delays or limitations in realizing such collateral or have its interest subordinated to other indebtedness of the obligor. In the event that the administrator or collateral agent of a loan becomes insolvent, enters into receivership or bankruptcy, the Fund may incur costs and delays in realizing payment or may suffer a loss of principal and/or interest. The risk of loss is greater for unsecured or subordinated loans. In addition, senior loan assignments are vulnerable to market, economic or other conditions or events that may reduce the demand for senior loan assignments and certain senior loan assignments which were liquid, when purchased, may become illiquid.
The Fund may enter into senior loan assignments where all or a portion of the loan may be unfunded. The Fund is obligated to fund these commitments at the borrower's discretion. These commitments are generally traded and priced in the same manner as other senior loan securities and are disclosed as unfunded senior loan commitments in the Fund's Portfolio of Investments with a corresponding payable for investments purchased. The Fund designates cash or liquid securities to cover these commitments.
Delayed Delivery Securities
The Fund may trade securities on other than normal settlement terms, including securities purchased or sold on a "when-issued" basis. This may increase risk to the Fund since the other party to the transaction may fail to deliver, which could cause the Fund to subsequently invest at less advantageous prices. The Fund designates
Annual Report 2016
38
COLUMBIA CORPORATE INCOME FUND
NOTES TO FINANCIAL STATEMENTS (continued)
April 30, 2016
cash or liquid securities in an amount equal to the delayed delivery commitment.
Security Transactions
Security transactions are accounted for on the trade date. Cost is determined and gains (losses) are based upon the specific identification method for both financial statement and federal income tax purposes.
Trade date for senior loans purchased in the primary market is the date on which the loan is allocated. Trade date for senior loans purchased in the secondary market is the date on which the transaction is entered into.
Income Recognition
Interest income is recorded on an accrual basis. Market premiums and discounts, including original issue discounts, are amortized and accreted, respectively, over the expected life of the security on all debt securities, unless otherwise noted. The Fund classifies gains and losses realized on prepayments received on mortgage-backed securities as adjustments to interest income.
The Fund may place a debt security on non-accrual status and reduce related interest income when it becomes probable that the interest will not be collected and the amount of uncollectible interest can be reasonably estimated. A defaulted debt security is removed from non-accrual status when the issuer resumes interest payments or when collectibility of interest is reasonably assured.
Dividend income is recorded on the ex-dividend date.
The value of additional securities received as an income payment is recorded as income and increases the cost basis of such securities.
The Fund may receive other income from senior loans, including amendment fees, consent fees and commitment fees. These fees are recorded as income when received by the Fund. These amounts are included in Interest Income in the Statement of Operations.
Expenses
General expenses of the Trust are allocated to the Fund and other funds of the Trust based upon relative net assets or other expense allocation methodologies determined by the nature of the expense. Expenses directly attributable to the Fund are charged to the Fund. Expenses directly attributable to a specific class of shares are charged to that share class.
Determination of Class Net Asset Value
All income, expenses (other than class-specific expenses, which are charged to that share class, as shown in the Statement of Operations) and realized and unrealized gains (losses) are allocated to each class of the Fund on a daily basis, based on the relative net assets of each class, for purposes of determining the net asset value of each class.
Federal Income Tax Status
The Fund intends to qualify each year as a regulated investment company under Subchapter M of the Internal Revenue Code, as amended, and will distribute substantially all of its taxable income (including net short-term capital gains), if any, for its tax year, and as such will not be subject to federal income taxes. In addition, the Fund intends to distribute in each calendar year substantially all of its net investment income, capital gains and certain other amounts, if any, such that the Fund should not be subject to federal excise tax. Therefore, no federal income or excise tax provision is recorded.
Foreign Taxes
The Fund may be subject to foreign taxes on income, gains on investments or currency repatriation, a portion of which may be recoverable. The Fund will accrue such taxes and recoveries, as applicable, based upon its current interpretation of tax rules and regulations that exist in the markets in which it invests.
Realized gains in certain countries may be subject to foreign taxes at the Fund level, based on statutory rates. The Fund accrues for such foreign taxes on realized and unrealized gains at the appropriate rate for each jurisdiction, as applicable. The amount, if any, is disclosed as a liability on the Statement of Assets and Liabilities.
Distributions to Shareholders
Distributions from net investment income, if any, are declared daily and paid monthly. Net realized capital gains, if any, are distributed at least annually. Income distributions and capital gain distributions are determined in accordance with federal income tax regulations, which may differ from GAAP.
Guarantees and Indemnifications
Under the Trust's organizational documents and, in some cases, by contract, its officers and trustees are indemnified against certain liabilities arising out of the performance of their duties to the Trust or its funds. In
Annual Report 2016
39
COLUMBIA CORPORATE INCOME FUND
NOTES TO FINANCIAL STATEMENTS (continued)
April 30, 2016
addition, certain of the Fund's contracts with its service providers contain general indemnification clauses. The Fund's maximum exposure under these arrangements is unknown since the amount of any future claims that may be made against the Fund cannot be determined, and the Fund has no historical basis for predicting the likelihood of any such claims.
Note 3. Fees and Other Transactions with Affiliates
Management Fees
Effective September 1, 2015, the Fund entered into a Management Agreement with Columbia Management Investment Advisers, LLC (the Investment Manager), a wholly-owned subsidiary of Ameriprise Financial, Inc. (Ameriprise Financial). Under the Management Agreement, the Investment Manager provides the Fund with investment research and advice, as well as administrative and accounting services. The management services fee is an annual fee that is equal to a percentage of the Fund's average daily net assets that declines from 0.50% to 0.34% as the Fund's net assets increase. The effective management services fee rate for the year ended April 30, 2016 was 0.49% of the Fund's average daily net assets.
Prior to September 1, 2015, the Fund paid the Investment Manager an annual fee for advisory services under an Investment Management Services Agreement and a separate annual fee for administrative and accounting services under an Administrative Services Agreement. For the period from May 1, 2015 through August 31, 2015, the investment advisory services fee paid to the Investment Manager was $2,057,083, and the administrative services fee paid to the Investment Manager was $314,329.
Compensation of Board Members
Board members, who are not officers or employees of the Investment Manager or Ameriprise Financial, are compensated for their services to the Fund as disclosed in the Statement of Operations. These Board members may participate in a Deferred Compensation Plan (the Plan) which may be terminated at any time. Obligations of the Plan will be paid solely out of the Fund's assets, and all amounts payable under the Plan constitute a general unsecured obligation of the Fund.
Compensation of Chief Compliance Officer
The Board has appointed a Chief Compliance Officer to the Fund in accordance with federal securities regulations. The Fund is allocated a portion of the expenses associated with the Chief Compliance Officer based on relative net assets of the Trust.
Transactions with Affiliated Funds
For the year ended April 30, 2016, the Fund engaged in purchase and/or sale transactions with funds that have a common investment manager (or affiliated investment managers), common directors/trustees, and/or common officers. Those purchase and sale transactions complied with provisions of Rule 17a-7 under the 1940 Act and were $0 and $1,977,141, respectively. The sale transactions resulted in a net realized gain of $47,727.
Transfer Agency Fees
Under a Transfer and Dividend Disbursing Agent Agreement, Columbia Management Investment Services Corp. (the Transfer Agent), an affiliate of the Investment Manager and a wholly-owned subsidiary of Ameriprise Financial, is responsible for providing transfer agency services to the Fund. The Transfer Agent has contracted with Boston Financial Data Services (BFDS) to serve as sub-transfer agent.
The Transfer Agent receives a monthly transfer agency fee based on the number or the average value of accounts, depending on the type of account. In addition, the Transfer Agent also receives sub-transfer agency fees based on a percentage of the average aggregate value of the Fund's shares maintained in omnibus accounts (other than omnibus accounts for which American Enterprise Investment Services Inc. is the broker of record or accounts where the beneficial shareholder is a customer of Ameriprise Financial Services, Inc., for which the Transfer Agent receives a per account fee). The Transfer Agent pays the fees of BFDS for services as sub-transfer agent and is not entitled to reimbursement for such fees from the Fund (with the exception of out-of-pocket fees).
The Transfer Agent also receives compensation from the Fund for various shareholder services and reimbursements for certain out-of-pocket fees. Total transfer agency fees for Class R5 shares are subject to an annual limitation of not more than 0.05% of the average daily net assets attributable to Class R5 shares. Class I and Class Y shares do not pay transfer agency fees.
Annual Report 2016
40
COLUMBIA CORPORATE INCOME FUND
NOTES TO FINANCIAL STATEMENTS (continued)
April 30, 2016
For the year ended April 30, 2016, the Fund's effective transfer agency fee rates as a percentage of average daily net assets of each class were as follows:
Class A | | | 0.22 | % | |
Class B | | | 0.22 | | |
Class C | | | 0.22 | | |
Class R4 | | | 0.22 | | |
Class R5 | | | 0.05 | | |
Class W | | | 0.22 | | |
Class Z | | | 0.22 | | |
An annual minimum account balance fee of $20 may apply to certain accounts with a value below the applicable share class's initial minimum investment requirements to reduce the impact of small accounts on transfer agency fees. These minimum account balance fees are remitted to the Fund and recorded as part of expense reductions in the Statement of Operations. For the year ended April 30, 2016, these minimum account balance fees reduced total expenses of the Fund by $1,140.
Distribution and Service Fees
The Fund has an agreement with Columbia Management Investment Distributors, Inc. (the Distributor), an affiliate of the Investment Manager and a wholly-owned subsidiary of Ameriprise Financial, for distribution and shareholder services. The Board has approved, and the Fund has adopted, distribution and shareholder service plans (the Plans) applicable to certain share classes, which set the distribution and service fees for the Fund. These fees are calculated daily and are intended to compensate the Distributor and/or eligible selling and/or servicing agents for selling shares of the Fund and providing services to investors.
Under the Plans, the Fund pays a monthly service fee to the Distributor at the maximum annual rate of 0.25% of the average daily net assets attributable to Class A, Class B, Class C and Class W shares of the Fund. Also under the Plans, the Fund pays a monthly distribution fee to the Distributor at the maximum annual rates of 0.75%, 0.75% and 0.25% of the average daily net assets attributable to Class B, Class C and Class W shares of the Fund, respectively.
The Distributor has voluntarily agreed to waive a portion of the distribution fee for Class C shares so that the distribution fee does not exceed 0.60% annually of the average daily net assets attributable to Class C shares.
This arrangement may be modified or terminated by the Distributor at any time.
Although the Fund may pay a distribution fee up to 0.25% of the Fund's average daily net assets attributable to Class W shares and a service fee of up to 0.25% of the Fund's average daily net assets attributable to Class W shares, the aggregate fee shall not exceed 0.25% of the Fund's average daily net assets attributable to Class W shares.
Sales Charges
Sales charges, including front-end charges and CDSCs, received by the Distributor for distributing Fund shares were $35,453 for Class A, $50 for Class B and $1,388 for Class C shares for the year ended April 30, 2016.
Expenses Waived/Reimbursed by the Investment Manager and its Affiliates
The Fund's expense ratio is subject to an expense reimbursement arrangement pursuant to which fees will be waived and/or expenses reimbursed (excluding certain fees and expenses described below), so that the Fund's net operating expenses, after giving effect to fees waived/expenses reimbursed and any balance credits and/or overdraft charges from the Fund's custodian, do not exceed the annual rates of:
| | | Contractual
Expense Cap
September 1, 2015
through
August 31, 2016 | | Voluntary
Expense Cap
Prior to
September 1, 2015 | |
Class A | | | 0.92 | % | | | 0.96 | % | |
Class B | | | 1.67 | | | | 1.71 | | |
Class C | | | 1.67 | | | | 1.71 | | |
Class I | | | 0.51 | | | | 0.57 | | |
Class R4 | | | 0.67 | | | | 0.71 | | |
Class R5 | | | 0.56 | | | | 0.62 | | |
Class W | | | 0.92 | | | | 0.96 | | |
Class Y | | | 0.51 | | | | 0.57 | | |
Class Z | | | 0.67 | | | | 0.71 | | |
The contractual agreement may be modified or amended only with approval from the Investment Manager, certain of its affiliates and the Fund. Under the arrangements, the following fees and expenses are excluded from the waiver/reimbursement commitment, and therefore will be paid by the Fund, if applicable: taxes (including foreign transaction taxes), expenses associated with investments in affiliated and non-affiliated pooled investment vehicles (including mutual funds and exchange-traded funds), transaction costs and brokerage
Annual Report 2016
41
COLUMBIA CORPORATE INCOME FUND
NOTES TO FINANCIAL STATEMENTS (continued)
April 30, 2016
commissions, costs related to any securities lending program, dividend and interest expenses associated with securities sold short, inverse floater program fees and expenses, transaction charges and interest on borrowed money, interest and extraordinary expenses. Any fees waived and/or expenses reimbursed under the expense reimbursement arrangements described above are not recoverable by the Investment Manager or its affiliates in future periods. Class C distribution fees waived by the Distributor, as discussed above, are in addition to the waiver/reimbursement commitment under the agreement.
Note 4. Federal Tax Information
The timing and character of income and capital gain distributions are determined in accordance with income tax regulations, which may differ from GAAP because of temporary or permanent book to tax differences.
At April 30, 2016, these differences are primarily due to differing treatment for capital loss carryforwards, principal and/or interest from fixed income securities, deferral/reversal of wash sale losses, Trustees' deferred compensation, distributions and derivative investments. To the extent these differences are permanent, reclassifications are made among the components of the Fund's net assets in the Statement of Assets and Liabilities. Temporary differences do not require reclassifications.
In the Statement of Assets and Liabilities the following reclassifications were made:
Excess of distributions over net investment income | | $ | 6,928 | | |
Accumulated net realized loss | | | (6,928 | ) | |
Net investment income (loss) and net realized gains (losses), as disclosed in the Statement of Operations, and net assets were not affected by this reclassification.
The tax character of distributions paid during the years indicated was as follows:
Year Ended April 30, | | 2016 | | 2015 | |
Ordinary income | | $ | 45,274,564 | | | $ | 43,969,706 | | |
Short-term capital gain distributions, if any, are considered ordinary income distributions for tax purposes.
At April 30, 2016, the components of distributable earnings on a tax basis were as follows:
Undistributed ordinary income | | $ | 3,124,159 | | |
Capital loss carryforwards | | | (31,534,840 | ) | |
Net unrealized appreciation | | | 16,049,939 | | |
At April 30, 2016, the cost of investments for federal income tax purposes was $1,174,373,891 and the aggregate gross unrealized appreciation and depreciation based on that cost was:
Unrealized appreciation | | $ | 38,747,228 | | |
Unrealized depreciation | | | (22,697,289 | ) | |
Net unrealized appreciation | | | 16,049,939 | | |
The following capital loss carryforwards, determined at April 30, 2016, may be available to reduce taxable income arising from future net realized gains on investments, if any, to the extent permitted by the Internal Revenue Code:
Year of Expiration | | Amount ($) | |
No expiration — short-term | | | 12,564,309 | | |
No expiration — long-term | | | 18,970,531 | | |
Total | | | 31,534,840 | | |
Management of the Fund has concluded that there are no significant uncertain tax positions in the Fund that would require recognition in the financial statements. However, management's conclusion may be subject to review and adjustment at a later date based on factors including, but not limited to, new tax laws, regulations, and administrative interpretations (including relevant court decisions). Generally, the Fund's federal tax returns for the prior three fiscal years remain subject to examination by the Internal Revenue Service.
Note 5. Portfolio Information
The cost of purchases and proceeds from sales of securities, excluding short-term investments and derivatives, if any, aggregated to $622,691,932 and $992,693,901, respectively, for the year ended April 30, 2016, of which $1,361,250 and $128,195,308, respectively, were U.S. government securities. The amount of purchase and sale activity impacts the portfolio turnover rate reported in the Financial Highlights.
Note 6. Affiliated Money Market Fund
The Fund invests in Columbia Short-Term Cash Fund, an affiliated money market fund established for the exclusive use by the Fund and other affiliated funds. The
Annual Report 2016
42
COLUMBIA CORPORATE INCOME FUND
NOTES TO FINANCIAL STATEMENTS (continued)
April 30, 2016
income earned by the Fund from such investments is included as Dividends — affiliated issuers in the Statement of Operations. As an investing fund, the Fund indirectly bears its proportionate share of the expenses of Columbia Short-Term Cash Fund.
Note 7. Line of Credit
The Fund has access to a revolving credit facility whereby the Fund may borrow for the temporary funding of shareholder redemptions or for other temporary or emergency purposes. Effective December 8, 2015, Citibank, N.A. and HSBC Bank USA, N.A. joined JPMorgan Chase Bank, N.A. (JPMorgan) as lead of a syndicate of banks under the credit facility, which is a collective agreement between the Fund and certain other funds managed by the Investment Manager, severally and not jointly, that permits collective borrowings up to $1 billion. Interest is charged to each participating fund based on its borrowings at a rate equal to the higher of (i) the overnight federal funds rate plus 1.00% or (ii) the one-month LIBOR rate plus 1.00%. Each borrowing under the credit facility matures no later than 60 days after the date of borrowing. The Fund also pays a commitment fee equal to its pro rata share of the amount of the credit facility at a rate of 0.15% per annum. The commitment fee is included in other expenses in the Statement of Operations. Prior to December 8, 2015, JPMorgan was the sole lead bank under the credit facility agreement that permitted borrowings up to $550 million under the same terms and interest rates as described above with the exception of the commitment fee which was charged at a rate of 0.075% per annum.
The Fund had no borrowings during the year ended April 30, 2016.
Note 8. Significant Risks
Shareholder Concentration Risk
At April 30, 2016, one unaffiliated shareholder of record owned 15.3% of the outstanding shares of the Fund in one or more accounts. The Fund has no knowledge about whether any portion of those shares was owned beneficially. Affiliated shareholders of record owned 59.3% of the outstanding shares of the Fund in one or more accounts. Subscription and redemption activity by concentrated accounts may have a significant effect on the operations of the Fund. In the case of a large redemption, the Fund may be forced to sell investments at inopportune times, including its liquid or more liquid positions, resulting in Fund losses and the Fund holding a higher percentage of less liquid or illiquid securities.
Large redemptions could result in decreased economies of scale and increased operating expenses for non-redeeming Fund shareholders.
Credit Risk
Credit risk is the risk that the value of debt securities in the Fund's portfolio may decline because the issuer may default and fail to pay interest or repay principal when due. Rating agencies assign credit ratings to debt securities to indicate their credit risk. Lower rated or unrated debt securities held by the Fund may present increased credit risk as compared to higher-rated debt securities.
Interest Rate Risk
Interest rate risk is the risk of losses attributable to changes in interest rates. In general, if prevailing interest rates rise, the values of debt securities tend to fall, and if interest rates fall, the values of debt securities tend to rise. Actions by governments and central banking authorities can result in increases in interest rates. Increasing interest rates may negatively affect the value of debt securities held by the Fund, resulting in a negative impact on the Fund's performance and net asset value per share. In general, the longer the maturity or duration of a debt security, the greater its sensitivity to changes in interest rates.
Liquidity Risk
Liquidity risk is the risk associated with a lack of marketability of investments which may make it difficult to sell the investment at a desirable time or price. Changing regulatory, market or other conditions or environments (for example, the interest rate or credit environments) may adversely affect the liquidity of the Fund's investments. The Fund may have to accept a lower selling price for the holding, sell other investments, or forego another, more appealing investment opportunity. Generally, the less liquid the market at the time the Fund sells a portfolio investment, the greater the risk of loss or decline of value to the Fund. A less liquid market can lead to an increase in Fund redemptions, which may negatively impact Fund performance and net asset value per share, including, for example, if the Fund is forced to sell securities in a down market.
Note 9. Subsequent Events
Management has evaluated the events and transactions that have occurred through the date the financial statements were issued and noted no items requiring
Annual Report 2016
43
COLUMBIA CORPORATE INCOME FUND
NOTES TO FINANCIAL STATEMENTS (continued)
April 30, 2016
adjustment of the financial statements or additional disclosure.
Note 10. Information Regarding Pending and Settled Legal Proceedings
In December 2005, without admitting or denying the allegations, American Express Financial Corporation (AEFC, which is now known as Ameriprise Financial, Inc. (Ameriprise Financial)) entered into settlement agreements with the Securities and Exchange Commission (SEC) and Minnesota Department of Commerce (MDOC) related to market timing activities. As a result, AEFC was censured and ordered to cease and desist from committing or causing any violations of certain provisions of the Investment Advisers Act of 1940, the Investment Company Act of 1940, and various Minnesota laws. AEFC agreed to pay disgorgement of $10 million and civil money penalties of $7 million. AEFC also agreed to retain an independent distribution consultant to assist in developing a plan for distribution of all disgorgement and civil penalties ordered by the SEC in accordance with various undertakings detailed at http://www.sec.gov/litigation/admin/ia-2451.pdf. Ameriprise Financial and its affiliates have cooperated with the SEC and the MDOC in these legal proceedings, and have made regular reports to the Funds' Boards of Trustees.
Ameriprise Financial and certain of its affiliates have historically been involved in a number of legal, arbitration and regulatory proceedings, including routine litigation, class actions, and governmental actions, concerning matters arising in connection with the conduct of their business activities. Ameriprise Financial believes that the Funds are not currently the subject of, and that neither Ameriprise Financial nor any of its affiliates are the subject of, any pending legal, arbitration or regulatory proceedings that are likely to have a material adverse effect on the Funds or the ability of Ameriprise Financial or its affiliates to perform under their contracts with the Funds. Ameriprise Financial is required to make quarterly (10-Q), annual (10-K) and, as necessary, 8-K filings with the SEC on legal and regulatory matters that relate to Ameriprise Financial and its affiliates. Copies of these filings may be obtained by accessing the SEC website at www.sec.gov.
There can be no assurance that these matters, or the adverse publicity associated with them, will not result in increased fund redemptions, reduced sale of fund shares or other adverse consequences to the Funds. Further, although we believe proceedings are not likely to have a
material adverse effect on the Funds or the ability of Ameriprise Financial or its affiliates to perform under their contracts with the Funds, these proceedings are subject to uncertainties and, as such, we are unable to estimate the possible loss or range of loss that may result. An adverse outcome in one or more of these proceedings could result in adverse judgments, settlements, fines, penalties or other relief that could have a material adverse effect on the consolidated financial condition or results of operations of Ameriprise Financial.
Annual Report 2016
44
COLUMBIA CORPORATE INCOME FUND
REPORT OF INDEPENDENT REGISTERED PUBLIC ACCOUNTING FIRM
To the Trustees of Columbia Funds Series Trust I and the Shareholders of
Columbia Corporate Income Fund
In our opinion, the accompanying statement of assets and liabilities, including the portfolio of investments, and the related statements of operations and of changes in net assets and the financial highlights present fairly, in all material respects, the financial position of Columbia Corporate Income Fund (the "Fund", a series of Columbia Funds Series Trust I) at April 30, 2016, and the results of its operations, the changes in its net assets and the financial highlights for each of the periods indicated, in conformity with accounting principles generally accepted in the United States of America. These financial statements and financial highlights (hereafter referred to as "financial statements") are the responsibility of the Fund's management. Our responsibility is to express an opinion on these financial statements based on our audits. We conducted our audits of these financial statements in accordance with the standards of the Public Company Accounting Oversight Board (United States). Those standards require that we plan and perform the audit to obtain reasonable assurance about whether the financial statements are free of material misstatement. An audit includes examining, on a test basis, evidence supporting the amounts and disclosures in the financial statements, assessing the accounting principles used and significant estimates made by management, and evaluating the overall financial statement presentation. We believe that our audits, which included confirmation of securities at April 30, 2016 by correspondence with the custodian, brokers, agent banks and transfer agent, and the application of alternative auditing procedures where such confirmations had not been received, provide a reasonable basis for our opinion.
PricewaterhouseCoopers LLP
Minneapolis, MN
June 21, 2016
Annual Report 2016
45
COLUMBIA CORPORATE INCOME FUND
Shareholders elect the Board that oversees the Fund's operations. The Board appoints officers who are responsible for day-to-day business decisions based on policies set by the Board. The following table provides basic biographical information about the Fund's Trustees, including their principal occupations during the past five years, although specific titles for individuals may have varied over the period. The year set forth beneath Length of Service in the table below is the year in which the Trustee was first appointed or elected as Trustee to any Fund currently in the Columbia Funds Complex or a predecessor thereof. Under current Board policy, members serve terms of indefinite duration.
Trustees
Independent Trustees
Name,
Address,
Year of Birth | | Position Held With
the Funds and Length of
Service | | Principal Occupation(s)
During the Past Five Years
and Other Relevant
Professional Experience | | Number of
Funds in the
Columbia Funds
Complex
Overseen | | Other Directorships
Held by Trustee During
the Past Five Years | |
Janet Langford Carrig
c/o Columbia
Management Investment Advisers, LLC,
225 Franklin Street
Mail Drop BX32 05228,
Boston, MA 02110
1957 | | Trustee 1996 | | Senior Vice President, General Counsel and Corporate Secretary, ConocoPhillips (integrated energy company) since September 2007 | | | 58 | | | None | |
Douglas A. Hacker
c/o Columbia Management Investment Advisers, LLC,
225 Franklin Street
Mail Drop BX32 05228,
Boston, MA 02110
1955 | | Trustee and Chairman of the Board 1996 | | Independent business executive since May 2006; Executive Vice President — Strategy of United Airlines from December 2002 to May 2006; President of UAL Loyalty Services (airline marketing company) from September 2001 to December 2002; Executive Vice President and Chief Financial Officer of United Airlines from July 1999 to September 2001 | | | 58 | | | Spartan Nash Company (food distributor); Nash Finch Company (food distributor) from 2005 to 2013; Aircastle Limited (aircraft leasing); SeaCube Container Leasing Ltd. (container leasing) from 2010 to 2013; and Travelport Worldwide Limited (travel information technology) | |
Nancy T. Lukitsh
c/o Columbia Management Investment Advisers, LLC,
225 Franklin Street
Mail Drop BX32 05228,
Boston, MA 02110
1956 | | Trustee 2011 | | Senior Vice President, Partner and Director of Marketing, Wellington Management Company, LLP (investment adviser) from 1997 to 2010; Chair, Wellington Management Portfolios (commingled non-U.S. investment pools) from 2007 to 2010; Director, Wellington Trust Company, NA and other Wellington affiliates from 1997 to 2010 | | | 58 | | | None | |
Annual Report 2016
46
COLUMBIA CORPORATE INCOME FUND
TRUSTEES AND OFFICERS (continued)
Independent Trustees (continued)
Name,
Address,
Year of Birth | | Position Held With
the Funds and Length of
Service | | Principal Occupation(s)
During the Past Five Years
and Other Relevant
Professional Experience | | Number of
Funds in the
Columbia Funds
Complex
Overseen | | Other Directorships
Held by Trustee During
the Past Five Years | |
William E. Mayer
c/o Columbia Management Investment Advisers, LLC,
225 Franklin Street
Mail Drop BX32 05228,
Boston, MA 02110
1940 | | Trustee 1991 | | Partner, Park Avenue Equity Partners (private equity) since February 1999 | | | 58 | | | DynaVox Inc. (speech creation); Lee Enterprises (print media); WR Hambrecht + Co. (financial service provider) from 2000 to 2012; BlackRock Capital Investment Corporation (investment company); and Premier, Inc. (healthcare) | |
David M. Moffett
c/o Columbia Management Investment Advisers, LLC,
225 Franklin Street
Mail Drop BX32 05228,
Boston, MA 02110
1952 | | Trustee 2011 | | Retired. Consultant to Bridgewater and Associates | | | 58 | | | Director of CIT Bank, CIT Group Inc. (commercial and consumer finance); eBay Inc. (online trading community); Genworth Financial, Inc. (financial and insurance products and services); Paypal Holdings Inc. (payment and data processing services); and Trustee University of Oklahoma Foundation | |
Charles R. Nelson
c/o Columbia Management Investment Advisers, LLC,
225 Franklin Street
Mail Drop BX32 05228,
Boston, MA 02110
1942 | | Trustee 1981 | | Retired. Professor Emeritus, University of Washington since 2011; Professor of Economics, University of Washington from 1976 to 2011; Ford and Louisa Van Voorhis Professor of Political Economy, University of Washington from 1993 to 2011; Adjunct Professor of Statistics, University of Washington from 1980 to 2011; Associate Editor, Journal of Money, Credit and Banking from September 1993 to 2008; consultant on econometric and statistical matters | | | 58 | | | None | |
John J. Neuhauser
c/o Columbia Management Investment Advisers, LLC,
225 Franklin Street
Mail Drop BX32 05228,
Boston, MA 02110
1943 | | Trustee 1984 | | President, Saint Michael's College since August 2007; Director or Trustee of several non-profit organizations, including University of Vermont Medical Center; Academic Vice President and Dean of Faculties, Boston College from August 1999 to October 2005; University Professor, Boston College from November 2005 to August 2007 | | | 58 | | | Liberty All-Star Equity Fund and Liberty All-Star Growth Fund (closed-end funds) | |
Annual Report 2016
47
COLUMBIA CORPORATE INCOME FUND
TRUSTEES AND OFFICERS (continued)
Independent Trustees (continued)
Name,
Address,
Year of Birth | | Position Held With
the Funds and Length of
Service | | Principal Occupation(s)
During the Past Five Years
and Other Relevant
Professional Experience | | Number of
Funds in the
Columbia Funds
Complex
Overseen | | Other Directorships
Held by Trustee During
the Past Five Years | |
Patrick J. Simpson
c/o Columbia Management Investment Advisers, LLC,
225 Franklin Street
Mail Drop BX32 05228,
Boston, MA 02110
1944 | | Trustee 2000 | | Of Counsel, Perkins Coie LLP (law firm) since 2015; Partner, Perkins Coie LLP from 1988 to 2014 | | | 58 | | | None | |
Anne-Lee Verville
c/o Columbia Management Investment Advisers, LLC,
225 Franklin Street
Mail Drop BX32 05228,
Boston, MA 02110
1945 | | Trustee 1998 | | Retired. General Manager, Global Education Industry from 1994 to 1997, President — Application Systems Division from 1991 to 1994, Chief Financial Officer — US Marketing & Services from 1988 to 1991, and Chief Information Officer from 1987 to 1988, IBM Corporation (computer and technology) | | | 58 | | | Enesco Group, Inc. (producer of giftware and home and garden decor products) from 2001 to 2006 | |
Annual Report 2016
48
COLUMBIA CORPORATE INCOME FUND
TRUSTEES AND OFFICERS (continued)
Interested Trustee Affiliated with Investment Manager*
Name,
Address,
Year of Birth | | Position Held With
the Funds and Length of
Service | | Principal Occupation(s)
During the Past Five Years
and Other Relevant
Professional Experience | | Number of
Funds in the
Columbia Funds
Complex
Overseen | | Other Directorships
Held by Trustee During
the Past Five Years | |
William F. Truscott
c/o Columbia Management Investment Advisers, LLC,
225 Franklin Street
Boston, MA 02110
1960 | | Trustee 2012 | | Chairman of the Board and President, Columbia Management Investment Advisers, LLC since May 2010 and February 2012, respectively (previously President and Chief Investment Officer, 2001-April 2010); Chief Executive Officer, Global Asset Management, Ameriprise Financial, Inc. since September 2012 (previously Chief Executive Officer, U.S. Asset Management & President, Annuities, May 2010- September 2012 and President — U.S. Asset Management and Chief Investment Officer, 2005-April 2010); Director and Chief Executive Officer, Columbia Management Investment Distributors, Inc. since May 2010 and February 2012, respectively (previously Chairman of the Board and Chief Executive Officer, 2006-April 2010); Chairman of the Board and Chief Executive Officer, RiverSource Distributors, Inc. since 2006; Director, Threadneedle Asset Management Holdings, SARL since 2014; President and Chief Executive Officer, Ameriprise Certificate Company, 2006-August 2012. | | | 178 | | | Chairman of the Board, Columbia Management Investment Advisers, LLC since May 2010; Director, Columbia Management Investment Distributors, Inc. since May 2010; Former Director, Ameriprise Certificate Company, 2006-January 2013 | |
* Interested person (as defined under the 1940 Act) by reason of being an officer, director, security holder and/or employee of the Investment Manager or Ameriprise Financial.
The Statement of Additional Information has additional information about the Fund's Board members and is available, without charge, upon request by calling 800.345.6611; contacting your financial intermediary; or visiting columbiathreadneedle.com/us.
Annual Report 2016
49
COLUMBIA CORPORATE INCOME FUND
TRUSTEES AND OFFICERS (continued)
The Board has appointed officers who are responsible for day-to-day business decisions based on policies it has established. The officers serve at the pleasure of the Board. The following table provides basic information about the Officers of the Fund, including principal occupations during the past five years, although their specific titles may have varied over the period. In addition to Mr. Truscott, who is Senior Vice President, the Fund's other officers are:
Fund Officers
Name,
Address and
Year of Birth | | Position and Year
First Appointed to
Position for any Fund
in the Columbia
Funds Complex or a
Predecessor Thereof | |
Principal Occupation(s) During Past Five Years | |
Christopher O. Petersen
5228 Ameriprise Financial Center
Minneapolis, MN 55474
Born 1970 | | President and Principal Executive Officer (2015) | | Vice President and Lead Chief Counsel, Ameriprise Financial, Inc. since January 2015 (previously, Vice President and Chief Counsel January 2010-December 2014; and Vice President and Group Counsel or Counsel 2004-January 2010); officer of Columbia Funds and affiliated funds since 2007. | |
Michael G. Clarke
225 Franklin Street
Boston, MA 02110
Born 1969 | | Treasurer (2011), Chief Financial Officer (2009) and Chief Accounting Officer (2015) | | Vice President — Mutual Fund Administration, Columbia Management Investment Advisers, LLC, since May 2010; Managing Director of Fund Administration, Columbia Management Advisors, LLC, September 2004-April 2010; senior officer of Columbia Funds and affiliated funds since 2002. | |
Paul B. Goucher
100 Park Avenue
New York, NY 10017
Born 1968 | | Senior Vice President (2011), Chief Legal Officer (2015) and Assistant Secretary (2008) | | Vice President and Lead Chief Counsel, Ameriprise Financial, Inc. since November 2008 and January 2013, respectively (previously Chief Counsel, January 2010-January 2013 and Group Counsel, November 2008-January 2010). | |
Thomas P. McGuire
225 Franklin Street
Boston, MA 02110
Born 1972 | | Senior Vice President and Chief Compliance Officer (2012) | | Vice President — Asset Management Compliance, Ameriprise Financial, Inc., since May 2010; Chief Compliance Officer, Ameriprise Certificate Company since September 2010; Compliance Executive, Bank of America, 2005-April 2010. | |
Colin Moore
225 Franklin Street
Boston, MA 02110
Born 1958 | | Senior Vice President (2010) | | Executive Vice President and Global Chief Investment Officer, Ameriprise Financial, Inc., since July 2013; Director and Global Chief Investment Officer, Columbia Management Investment Advisers, LLC since May 2010; Manager, Managing Director and Chief Investment Officer, Columbia Management Advisors, LLC, 2007-April 2010. | |
Michael E. DeFao
225 Franklin Street
Boston, MA 02110
Born 1968 | | Vice President (2011) and Assistant Secretary (2010) | | Vice President and Chief Counsel, Ameriprise Financial, Inc. since May 2010; Associate General Counsel, Bank of America, 2005-April 2010. | |
Amy Johnson
5228 Ameriprise Financial Center
Minneapolis, MN 55474
Born 1965 | | Vice President (2006) | | Managing Director and Chief Operating Officer, Columbia Management Investment Advisers, LLC since May 2010 (previously Chief Administrative Officer, 2009-April 2010, and Vice President — Asset Management and Trust Company Services, 2006-2009). | |
Lyn Kephart-Strong
5228 Ameriprise
Financial Center
Minneapolis, MN 55474
Born 1960 | | Vice President (2015) | | President, Columbia Management Investment Services Corp. since October 2014; Vice President & Resolution Officer, Ameriprise Trust Company since August 2009; President, RiverSource Service Corporation 2004-2010. | |
Ryan C. Larrenaga
225 Franklin Street
Boston, MA 02110
Born 1970 | | Vice President and Secretary (2015) | | Vice President and Group Counsel, Ameriprise Financial, Inc. since August 2011 (previously, Counsel from May 2010 to August 2011); Assistant General Counsel, Bank of America, 2005-April 2010; officer of Columbia Funds and affiliated funds since 2005. | |
Annual Report 2016
50
COLUMBIA CORPORATE INCOME FUND
IMPORTANT INFORMATION ABOUT THIS REPORT
Each fund mails one shareholder report to each shareholder address. If you would like more than one report, please call shareholder services at 800.345.6611 and additional reports will be sent to you.
The policy of the Board is to vote the proxies of the companies in which each fund holds investments consistent with the procedures as stated in the Statement of Additional Information (SAI). You may obtain a copy of the SAI without charge by calling 800.345.6611; contacting your financial intermediary; visiting columbiathreadneedle.com/us; or searching the website of the Securities and Exchange Commission (SEC) at sec.gov. Information regarding how each fund voted proxies relating to portfolio securities is filed with the SEC by August 31st for the most recent 12-month period ending June 30th of that year, and is available without charge by visiting columbiathreadneedle.com/us, or searching the website of the SEC at sec.gov.
Each fund files a complete schedule of portfolio holdings with the SEC for the first and third quarters of each fiscal year on Form N-Q. Each fund's Form N-Q is available on the SEC's website at sec.gov and may be reviewed and copied at the SEC's Public Reference Room in Washington, D.C. Information on the operation of the Public Reference Room may be obtained by calling 800.SEC.0330. Each fund's complete schedule of portfolio holdings, as filed on Form N-Q, can also be obtained without charge, upon request, by calling 800.345.6611.
Annual Report 2016
51
Columbia Corporate Income Fund
P.O. Box 8081
Boston, MA 02266-8081

This information is for use with concurrent or prior delivery of a fund prospectus. Please read and consider the investment objectives, risks, charges and expenses for any fund carefully before investing. For a prospectus and summary prospectus, which contains this and other important information about the Fund, go to columbiathreadneedle.com/us. The Fund is distributed by Columbia Management Investment Distributors, Inc., member FINRA, and managed by Columbia Management Investment Advisers, LLC.
Columbia Threadneedle Investments (Columbia Threadneedle) is the global brand name of the Columbia and Threadneedle group of companies.
All rights reserved. Columbia Management Investment Distributors, Inc., 225 Franklin Street, Boston, MA 02110-2804
© 2016 Columbia Management Investment Advisers, LLC.
columbiathreadneedle.com/us
ANN136_04_F01_(06/16)

ANNUAL REPORT
April 30, 2016

COLUMBIA MULTI-ASSET INCOME FUND

 Dear Shareholders,
Volatility comes with the territory for long-term investors. Some investors instinctively want to pull out of the market or sell underperforming investments at the first sign of increased volatility or perhaps even as soon as they perceive it on the horizon. But taking yourself out of the market could mean losing out on potential opportunities, and putting your longer-term investment goals at risk.
Cumulative return is not just about achieving high returns when markets are going up; it's also about remaining invested and minimizing losses during weak or volatile markets so that you can participate on the upside. Developing a deeper understanding of the various risks your portfolio is subject to can help you balance these risks.
Diversification is critical in seeking to achieve that balance. We believe that most portfolios could be more effectively diversified either by introducing holdings with performance profiles unrelated to existing holdings (like alternative products) or by rebalancing existing holdings with an eye toward risk allocation. Over time, distributing risk more evenly may produce a more pronounced diversification benefit and may improve portfolio efficiency. We believe market volatility can create significant opportunities and, in fact, these periods may be some of the very best times to invest.
With this in mind, I thought it important to highlight excerpts from a piece written by Colin Moore, Global Chief Investment Officer, in which he touches on some of these issues emphasizing the importance of a properly constructed portfolio in seeking to effectively manage volatility and to achieve consistency of returns. I encourage you to read the article in its entirety. To access the full article and for other insights on current market, please visit blog.columbiathreadneedleus.com/latest-perspectives.
You need investments that are designed to help you ease the impact of volatile market environments and keep the savings you have worked tirelessly to amass. Columbia Threadneedle Investments provides investment solutions to help you tackle financial challenges and achieve your desired outcome.
Best regards,

Christopher O. Petersen
President, Columbia Funds
Excerpts from:
Taking the scare out of the volatility bogeyman
By Colin Moore, Global Chief Investment Officer
Colin Moore is the global chief investment officer for Columbia Threadneedle Investments. His responsibilities include ensuring that a disciplined investment process is in place across all asset classes, including equity and fixed income. Mr. Moore joined one of the Columbia Threadneedle Investments legacy firms in 2002 as head of equity and was also head of fixed income and liquidity strategies from 2009 – 2010.

n In today's low growth, higher volatility world, the emphasis is shifting from maximization of returns to consistency of returns.
PRESIDENT'S MESSAGE (continued)
n Portfolios should represent the behavioral risk-return tradeoff of investors, remembering that they won't stay invested to realize the return if we get the risk tolerance wrong.
n Holding long-term savings in cash to avoid volatility (the financial equivalent of hiding under the sheets) is detrimental to achieving long-term goals.
According to Wikipedia, "The bogeyman is a common allusion to a mythical creature in many cultures used to control behavior. This monster has no specific appearance, and conceptions about it can vary drastically from household to household within the same community; in many cases he has no set appearance in the mind of an adult or child, but is simply a non-specific embodiment of terror." Different cultures have different names and physical representations for the bogeyman, and investors are no different. We have terrible monsters that we fear may destroy our portfolios, and we call one of the scariest of them volatility.
While the bogeyman is mythical (I hope!), volatility is real and can cause serious damage. To understand why investors have such a hard time coping with volatility, we first need to define three cognitive biases at work in today's investment environment:
1) Recency bias — something that has recently come to the forefront of our attention, regardless of how long established it is, suddenly seems to appear with improbable frequency.
2) Negativity bias — we tend to have a greater recall of unpleasant memories than positive memories.
3) Loss aversion — our dissatisfaction with losing money tends to be greater than our satisfaction with making money.
The level of volatility varies dramatically, and so does investor fear and panic selling — waxing when volatility rises, waning when it falls. Recent studies have pointed to demographics as an important driver of panic selling. The theory is that as people get closer to retirement, the prospects of a large (20% – 30%) loss in financial assets can have a much more pronounced effect on their sense of well-being. Wealth preservation instincts kick in much more quickly than for younger (and typically less wealthy) savers.
The reality is that there is little opportunity for return without volatility. Therefore, the bogeyman effect of holding long-term savings in cash to avoid volatility (the financial equivalent of hiding under the sheets) is detrimental to achieving long-term goals. This effect tends to be more pronounced during the episodic spikes in volatility. The significant spike in volatility in 2008 and 2009 led to significant withdrawals from long-term investment funds over the same period. Less pronounced effects can also be seen when comparing 2001 – 2003 and 2011 – 2012. Conversely, flows picked up when volatility returned to "normal" levels. Investor behavior of this type is consistent with the three behavioral biases.
I believe average volatility will be higher over the next 10 years than the last 10 years and episodic spikes will increase in frequency because sustainable economic growth will be structurally lower and geopolitical risk higher than any time since World War II. Low growth creates uncertainty while loss aversion will make investors fear that we are one economic mishap or geopolitical event away from no growth or recession. The result will be higher volatility on average. Negativity bias will tend to exacerbate "spike" reactions to event-driven geopolitical news, and the volatility bogeyman will appear more often. Assuming the behavioral biases continue, investor returns are likely to be very disappointing regardless of the total return generated by financial markets due to the bogeyman effect.
To mitigate this effect, we need to focus on portfolio construction and an improved understanding of diversification. I accept that equities are likely to offer the highest return over the next 10 years, but they also offer the highest volatility. Many portfolio construction optimization tools use historical average volatility, which is likely to underestimate the volatility investors will face. The bogeyman emerges when individual asset class volatility spikes and cross correlations rise, the combination of which increases overall portfolio volatility far beyond expectation. Diversification is meant to protect investors against volatility, but what's the point of owning lots of investments if the volatility bogeyman has not been properly estimated?
Most importantly, portfolios should be constructed to properly represent the behavioral risk-return tradeoff of investors, remembering that they won't stay invested to realize the return if we get the risk tolerance wrong. In a low growth, higher volatility world, the emphasis is shifting to return consistency rather than return maximization,
PRESIDENT'S MESSAGE (continued)
and investors are best served through investment approaches that appreciate that distinction. Even though it's a permanent feature of financial markets, volatility is less likely to be the bogeyman we all fear if portfolios are constructed with this understanding.
Please visit blog.columbiathreadneedleus.com/latest-perspectives to read the entire article.
Investors should consider the investment objectives, risks, charges and expenses of a mutual fund carefully before investing. For a free prospectus and summary prospectus, which contains this and other important information about a fund, visit columbiathreadneedle.com/us. The prospectus should be read carefully before investing.
The views expressed are as of April 2016, may change as market or other conditions change, and may differ from views expressed by other Columbia Management Investment Advisers, LLC (CMIA) associates or affiliates. Actual investments or investment decisions made by CMIA and its affiliates, whether for its own account or on behalf of clients, will not necessarily reflect the views expressed. This information is not intended to provide investment advice and does not account for individual investor circumstances. Investment decisions should always be made based on an investor's specific financial needs, objectives, goals, time horizon and risk tolerance. Asset classes described may not be suitable for all investors.
Past performance does not guarantee future results, and no forecast should be considered a guarantee either. Since economic and market conditions change frequently, there can be no assurance that the trends described here will continue or that the forecasts are accurate.
Diversification does not guarantee a profit or protect against loss.
Columbia Funds are distributed by Columbia Management Investment Distributors, Inc., member FINRA, and managed by Columbia Management Investment Advisers, LLC.
© 2016 Columbia Management Investment Advisers, LLC. All rights reserved
COLUMBIA MULTI-ASSET INCOME FUND
Performance Overview | | | 2 | | |
Manager Discussion of Fund Performance | | | 4 | | |
Understanding Your Fund's Expenses | | | 7 | | |
Portfolio of Investments | | | 8 | | |
Statement of Assets and Liabilities | | | 25 | | |
Statement of Operations | | | 27 | | |
Statement of Changes in Net Assets | | | 28 | | |
Financial Highlights | | | 30 | | |
Notes to Financial Statements | | | 37 | | |
Report of Independent Registered Public Accounting Firm | | | 48 | | |
Federal Income Tax Information | | | 49 | | |
Trustees and Officers | | | 50 | | |
Important Information About This Report | | | 55 | | |
Fund Investment Manager
Columbia Management Investment
Advisers, LLC
225 Franklin Street
Boston, MA 02110
Fund Distributor
Columbia Management Investment
Distributors, Inc.
225 Franklin Street
Boston, MA 02110
Fund Transfer Agent
Columbia Management Investment
Services Corp.
P.O. Box 8081
Boston, MA 02266-8081
For more information about any of the funds, please visit columbiathreadneedle.com/us or call 800.345.6611. Customer Service Representatives are available to answer your questions Monday through Friday from 8 a.m. to 7 p.m. Eastern time.
The views expressed in this report reflect the current views of the respective parties. These views are not guarantees of future performance and involve certain risks, uncertainties and assumptions that are difficult to predict, so actual outcomes and results may differ significantly from the views expressed. These views are subject to change at any time based upon economic, market or other conditions and the respective parties disclaim any responsibility to update such views. These views may not be relied on as investment advice and, because investment decisions for a Columbia fund are based on numerous factors, may not be relied on as an indication of trading intent on behalf of any particular Columbia fund. References to specific securities should not be construed as a recommendation or investment advice.
COLUMBIA MULTI-ASSET INCOME FUND
Performance Summary
n Columbia Multi-Asset Income Fund (the Fund) Class A shares returned -0.62% excluding sales charges for the 12-month period that ended April 30, 2016.
n During the same time period, the Fund underperformed its Blended Index, which returned 2.35%, as well as the Barclays U.S. Aggregate Bond Index, which returned 2.72%.
n The Fund's performance is primarily attributable to a combination of asset allocation decisions and underlying fund results across the asset class spectrum.
Average Annual Total Returns (%) (for period ended April 30, 2016)
| | | Inception | | 1 Year | | Life | |
Class A | | 03/27/15 | | | | | | | | | |
Excluding sales charges | | | | | | | -0.62 | | | | 0.05 | | |
Including sales charges | | | | | | | -5.33 | | | | -4.31 | | |
Class C | | 03/27/15 | | | | | | | | | |
Excluding sales charges | | | | | | | -1.37 | | | | -0.71 | | |
Including sales charges | | | | | | | -2.31 | | | | -0.71 | | |
Class I | | 03/27/15 | | | -0.29 | | | | 0.40 | | |
Class R4 | | 03/27/15 | | | -0.36 | | | | 0.32 | | |
Class R5 | | 03/27/15 | | | -0.34 | | | | 0.35 | | |
Class W | | 03/27/15 | | | -0.62 | | | | 0.06 | | |
Class Z | | 03/27/15 | | | -0.47 | | | | 0.32 | | |
Blended Index | | | | | | | 2.35 | | | | 2.50 | | |
Barclays U.S. Aggregate Bond Index | | | | | | | 2.72 | | | | 2.26 | | |
Returns for Class A are shown with and without the maximum initial sales charge of 4.75%. Returns for Class C are shown with and without the 1.00% contingent deferred sales charge for the first year only. The Fund's other classes are not subject to sales charges and have limited eligibility. Please see the Fund's prospectus for details. Performance for different share classes will vary based on differences in sales charges and fees associated with each class. All results shown assume reinvestment of distributions during the period. Returns do not reflect the deduction of taxes that a shareholder may pay on Fund distributions or on the redemption of Fund shares. Performance results reflect the effect of any fee waivers or reimbursements of Fund expenses by Columbia Management Investment Advisers, LLC and/or any of its affiliates. Absent these fee waivers or expense reimbursement arrangements, performance results would have been lower.
The performance information shown represents past performance and is not a guarantee of future results. The investment return and principal value of your investment will fluctuate so that your shares, when redeemed, may be worth more or less than their original cost. Current performance may be lower or higher than the performance information shown. You may obtain performance information current to the most recent month-end by contacting your financial intermediary, visiting columbiathreadneedle.com/us or calling 800.345.6611.
The Blended Index is a weighted custom composite consisting of 60% Barclays U.S. Aggregate Bond Index and 40% S&P 500 Index. The S&P 500 Index, an unmanaged index, measures the performance of 500 widely held, large-capitalization U.S. stocks and is frequently used as a general measure of market performance.
The Barclays U.S. Aggregate Bond Index is a broad-based benchmark that measures the investment-grade, U.S. dollar denominated, fixed-rate taxable bond market, including Treasuries, government-related and corporate securities, mortgage-backed securities (agency fixed-rate and hybrid adjustable-rate mortgage passthroughs), asset-backed securities, and commercial mortgage-backed securities.
Indices are not available for investment, are not professionally managed and do not reflect sales charges, fees, brokerage commissions, taxes or other expenses of investing. Securities in the Fund may not match those in an index.
Annual Report 2016
2
COLUMBIA MULTI-ASSET INCOME FUND
PERFORMANCE OVERVIEW (continued)
Performance of a Hypothetical $10,000 Investment (March 27, 2015 – April 30, 2016)
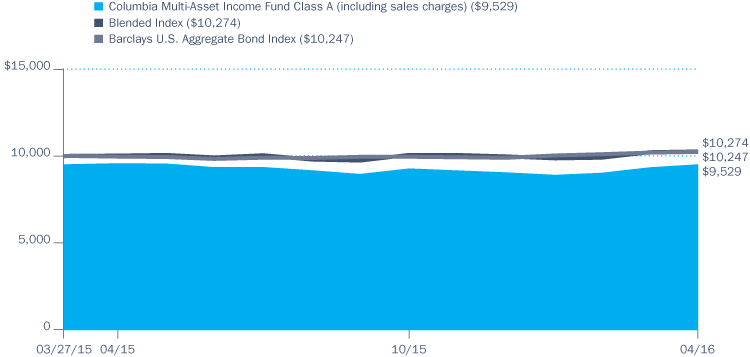
The chart above shows the change in value of a hypothetical $10,000 investment in Class A shares of Columbia Multi-Asset Income Fund during the stated time period, and does not reflect the deduction of taxes that a shareholder may pay on Fund distributions or on the redemption of Fund shares.
Annual Report 2016
3
COLUMBIA MULTI-ASSET INCOME FUND
MANAGER DISCUSSION OF FUND PERFORMANCE
Portfolio Management
Jeffrey Knight, CFA
Anwiti Bahuguna, Ph.D.
Dan Boncarosky, CFA
Joshua Kutin, CFA
Top Ten Holdings (%)
(at April 30, 2016) | |
SPDR Blackstone/
GSO Senior Loan ETF | | | 4.5 | | |
BNP Paribas Arbitrage Issuance BV
11/07/16 13.260% | | | 3.5 | | |
Deutsche Bank AG
08/05/16 14.200% | | | 3.5 | | |
Morgan Stanley BV
09/09/16 13.620% | | | 3.4 | | |
JPMorgan Chase Bank NA
10/03/16 12.100% | | | 3.4 | | |
Credit Suisse First Boston
International AG
07/07/16 14.070% | | | 3.4 | | |
UBS AG
06/09/16 12.900% | | | 3.4 | | |
SPDR Barclays Long Term
Corporate Bond ETF | | | 3.1 | | |
Credit Suisse Mortgage Capital Certificates
08/25/62 4.664% | | | 1.1 | | |
Federal Home Loan Mortgage Corp.
08/15/43 5.517% | | | 0.9 | | |
Percentages indicated are based upon total investments (excluding Money Market Funds).
For further detail about these holdings, please refer to the section entitled "Portfolio of Investments."
Fund holdings are as of the date given, are subject to change at any time, and are not recommendations to buy or sell any security.
At April 30, 2016, approximately 99.4% of the Fund's shares were owned in the aggregate by affiliated funds-of-funds managed by Columbia Management Investment Advisers, LLC (the Investment Manager). As a result of asset allocation decisions by the Investment Manager, it is possible that the Fund may experience relatively large purchases or redemptions from affiliated funds-of-funds. The Investment Manager seeks to minimize the impact of these transactions by structuring them over a reasonable period of time. The Fund may experience increased expenses as it buys and sells securities as a result of purchases or redemptions by affiliated funds-of-funds.
For the 12-month period that ended April 30, the Fund's Class A shares returned -0.62% excluding sales charges. During the same time period, the Fund underperformed its Blended Index, which returned 2.35%, as well as the Barclays U.S. Aggregate Bond Index, which returned 2.72%. To compare, the S&P 500 Index returned 1.21% for the same period. The Fund's performance is primarily attributable to a combination of asset allocation decisions and underlying fund results across the asset class spectrum.
Fixed-Income Markets Outpaced Equities Amid Heightened Volatility
The 12-month period ended April 30, 2016 saw a market environment with muted returns across the capital markets given heightened volatility. Lackluster economic growth, contentious geopolitical conflicts and a long-awaited shift in U.S. monetary policy were among those factors that weighed on investor confidence. Amid such volatility and caution, fixed income generally outpaced equities. Within the fixed-income market, U.S. Treasuries and emerging market bonds performed well, as represented by the 5.54% return of the Barclays U.S. Treasury Long Index and the 4.30% return of the JPMorgan Emerging Markets Bond Index-Global. Long-maturity investment-grade corporate bonds also posted strong returns, as represented by the 3.58% return of the Barclays U.S. Corporate Investment Grade Long Index. Securitized bonds, as represented by the 2.58% return of the Barclays U.S. Securitized Index, also fared well. High-yield corporate bonds were somewhat of an outlier in the fixed-income market, with the Bank of America Merrill Lynch (BofAML) U.S. Cash Pay High Yield Constrained Index posting a return of -1.24%.
The equity market overall did not fare as well as the fixed-income market. Within the broader equity market, the biggest winner was the U.S. equity market. U.S. equities performed better, ticking upward while their global counterparts mostly generated negative returns. More specifically, the S&P 500 Index, representing the U.S. equity market, returned 1.21% for the 12-month period, while the MSCI USA High Dividend Yield Index, representing dividend-paying U.S. equities, performed even better, posting a return of 5.14% for the same period. In stark contrast, the MSCI ACWI ex-USA Index (in U.S. dollar terms), representing international equities, returned -11.28% for the same period.
Among alternative asset classes, real estate investment trusts (REITs) and preferred stocks fared well, with the FTSE NAREIT Equity REITs Index
Annual Report 2016
4
COLUMBIA MULTI-ASSET INCOME FUND
MANAGER DISCUSSION OF FUND PERFORMANCE (continued)
and the BofAML U.S. Preferred Stock Fixed Rate Index, returning 7.86% and 8.29%, respectively, for the 12-month period. Master limited partnerships (MLPs), on the other hand, lost significant ground, with the Alerian MLP Index posting a return of -28.71%.
Positioning Generated Mixed Results
Overall, asset allocation decisions detracted, albeit modestly, from the Fund's relative results during the period. The Fund had a slight underweight to fixed income and a slight overweight to equities, which hurt as fixed income outperformed equities during the period. Within the Fund's fixed-income allocation, positions in securitized bonds, U.S. Treasuries and investment-grade corporate bonds contributed positively. However, despite posting positive absolute returns, high-yield corporate bonds detracted from relative performance, as there were better income opportunities elsewhere. Performance in the bank loan and emerging market bond sectors also detracted from relative results.
Within the Fund's equity allocation, positions in dividend-paying equities and covered call-writing strategies detracted from relative results due primarily to poor security selection within these spaces. Preferred stocks contributed positively to the Fund's relative results.
Among non-traditional income sources, MLPs were the biggest detractor from the Fund's relative results as strong performance was not enough to mute the significant sell-off in the asset class. Similarly, though to a lesser extent, exposure to convertible securities detracted, as the asset class overall struggled during the period, posting negative returns. REITs overall performed well during the period. However, our performance within the asset class was weak, and thus hurt the Fund's relative results.
Portfolio Changes
Asset class changes within the Fund can be driven by active trading, by tactically adjusting allocations to select asset classes or by market appreciation or depreciation within a given asset class. During the period, we increased the Fund's weighting to emerging market debt, as our opinion of the asset class improved. We also increased the Fund's exposure to our covered call writing strategy, as we believe it offers potential sources of return and income beyond those available in owning stocks directly. We decreased the Fund's allocation to U.S. equities, as we had grown cautious about their upside potential given our view that late-cycle dynamics may be a constraint.
During the period, we used equity linked notes to implement our covered call writing strategy. These equity linked notes detracted from the Fund's relative performance. We used equity futures for hedging purposes and to manage the Fund's investment exposures. The futures added value to the Fund's relative results during the period. Also, the Fund used derivatives during the period to attempt to enhance portfolio return and for hedging purposes as market conditions warranted.
A Flexible Approach
We believe the best tool to influence portfolio efficiency is diversification, as we observe a negative correlation between stocks and bonds, a
Portfolio Breakdown (%)
(at April 30, 2016) | |
Asset-Backed Securities —
Non-Agency | | | 2.3 | | |
Commercial Mortgage-Backed Securities — Non-Agency | | | 2.3 | | |
Common Stocks | | | 8.3 | | |
Corporate Bonds & Notes | | | 28.3 | | |
Equity-Linked Notes | | | 20.1 | | |
Exchange-Traded Funds | | | 7.2 | | |
Foreign Government
Obligations | | | 9.8 | | |
Limited Partnerships | | | 5.2 | | |
Money Market Funds | | | 3.7 | | |
Residential Mortgage-Backed
Securities — Agency | | | 4.3 | | |
Residential Mortgage-Backed
Securities — Non-Agency | | | 4.8 | | |
U.S. Treasury Obligations | | | 3.7 | | |
Total | | | 100.0 | | |
Percentages indicated are based upon total investments. The Fund's portfolio composition is subject to change.
Annual Report 2016
5
COLUMBIA MULTI-ASSET INCOME FUND
MANAGER DISCUSSION OF FUND PERFORMANCE (continued)
Investment Risks
Market risk may affect a single issuer, sector of the economy, industry or the market as a whole. The Fund's investment in other funds subjects it to the investment performance (positive or negative), risks and expenses of these underlying funds. Fixed-income securities present issuer default risk. A rise in interest rates may result in a price decline of fixed-income instruments held by the Fund, negatively impacting its performance and NAV. Falling rates may result in the Fund investing in lower yielding debt instruments, lowering the Fund's income and yield. These risks may be heightened for longer maturity and duration securities. Non-investment-grade (high-yield or junk) securities present greater price volatility and more risk to principal and income than higher rated securities. Prepayment and extension risk exists because a loan, bond or other investment may be called, prepaid or redeemed before maturity and similar yielding investments may not be available for purchase. Investing in derivatives is a specialized activity that involves special risks that subject the Fund to significant loss potential, including when used as leverage, and may result in greater fluctuation in fund value. Asset allocation does not assure a profit or protect against loss. International investing involves certain risks and volatility due to potential political, economic or currency instabilities and different financial and accounting standards. Risks are enhanced for emerging market issuers. Market or other (e.g., interest rate) environments may adversely affect the liquidity of Fund investments, negatively impacting their price. Generally, the less liquid the market at the time the fund sells a holding, the greater the risk of loss or decline of value to the Fund. See the Fund's prospectus for more information on these and other risks.
dynamic sorely missed during much of 2015. In our view, broad diversification may not only provide a more stable return than a concentrated portfolio but also exposure to asset classes that underperformed for some time, and, therefore, may offer attractive returns prospectively. It is important to note, however, that diversification does not guarantee a profit or protect against loss. As has been the case since the inception of the Fund in March 2015, our investment process will seek high levels of monthly income throughout a changing interest rate environment by investing in a diversified set of income-generating asset classes that provide multiple drivers of income and return. We continue to utilize a flexible approach that allows us to tactically adjust for changing market conditions to generate attractive income while minimizing downside risk.
Annual Report 2016
6
COLUMBIA MULTI-ASSET INCOME FUND
UNDERSTANDING YOUR FUND'S EXPENSES
(Unaudited)
As an investor, you incur two types of costs. There are transaction costs, which generally include sales charges on purchases and may include redemption fees. There are also ongoing costs, which generally include management fees, distribution and/or service fees, and other fund expenses. The following information is intended to help you understand your ongoing costs (in dollars) of investing in the Fund and to help you compare these costs with the ongoing costs of investing in other mutual funds.
Analyzing Your Fund's Expenses
To illustrate these ongoing costs, we have provided examples and calculated the expenses paid by investors in each share class of the Fund during the period. The actual and hypothetical information in the table is based on an initial investment of $1,000 at the beginning of the period indicated and held for the entire period. Expense information is calculated two ways and each method provides you with different information. The amount listed in the "Actual" column is calculated using the Fund's actual operating expenses and total return for the period. You may use the Actual information, together with the amount invested, to estimate the expenses that you paid over the period. Simply divide your account value by $1,000 (for example, an $8,600 account value divided by $1,000 = 8.6), then multiply the results by the expenses paid during the period under the "Actual" column. The amount listed in the "Hypothetical" column assumes a 5% annual rate of return before expenses (which is not the Fund's actual return) and then applies the Fund's actual expense ratio for the period to the hypothetical return. You should not use the hypothetical account values and expenses to estimate either your actual account balance at the end of the period or the expenses you paid during the period. See "Compare With Other Funds" below for details on how to use the hypothetical data.
Compare With Other Funds
Since all mutual funds are required to include the same hypothetical calculations about expenses in shareholder reports, you can use this information to compare the ongoing cost of investing in the Fund with other funds. To do so, compare the hypothetical example with the 5% hypothetical examples that appear in the shareholder reports of other funds. As you compare hypothetical examples of other funds, it is important to note that hypothetical examples are meant to highlight the ongoing costs of investing in a fund only and do not reflect any transaction costs, such as sales charges, or redemption or exchange fees. Therefore, the hypothetical calculations are useful in comparing ongoing costs only, and will not help you determine the relative total costs of owning different funds. If transaction costs were included in these calculations, your costs would be higher.
November 1, 2015 – April 30, 2016
| | | Account Value at the Beginning
of the Period ($) | | Account Value at the End of the
Period ($) | | Expenses Paid During the
Period ($) | | Fund's Annualized
Expense Ratio (%) | |
| | | Actual | | Hypothetical | | Actual | | Hypothetical | | Actual | | Hypothetical | | Actual | |
Class A | | | 1,000.00 | | | | 1,000.00 | | | | 1,025.90 | | | | 1,020.29 | | | | 4.63 | | | | 4.62 | | | | 0.92 | | |
Class C | | | 1,000.00 | | | | 1,000.00 | | | | 1,022.10 | | | | 1,016.56 | | | | 8.40 | | | | 8.37 | | | | 1.67 | | |
Class I | | | 1,000.00 | | | | 1,000.00 | | | | 1,027.70 | | | | 1,022.08 | | | | 2.82 | | | | 2.82 | | | | 0.56 | | |
Class R4 | | | 1,000.00 | | | | 1,000.00 | | | | 1,027.30 | | | | 1,021.58 | | | | 3.33 | | | | 3.32 | | | | 0.66 | | |
Class R5 | | | 1,000.00 | | | | 1,000.00 | | | | 1,027.50 | | | | 1,021.83 | | | | 3.08 | | | | 3.07 | | | | 0.61 | | |
Class W | | | 1,000.00 | | | | 1,000.00 | | | | 1,026.00 | | | | 1,020.34 | | | | 4.58 | | | | 4.57 | | | | 0.91 | | |
Class Z | | | 1,000.00 | | | | 1,000.00 | | | | 1,027.30 | | | | 1,021.53 | | | | 3.38 | | | | 3.37 | | | | 0.67 | | |
Expenses paid during the period are equal to the annualized expense ratio for each class as indicated above, multiplied by the average account value over the period and then multiplied by the number of days in the Fund's most recent fiscal half year and divided by 366.
Expenses do not include fees and expenses incurred indirectly by the Fund from its investment in underlying funds, including affiliated and non-affiliated pooled investment vehicles, such as mutual funds and exchange-traded funds.
Had Columbia Management Investment Advisers, LLC and/or certain of its affiliates not waived/reimbursed certain fees and expenses, account value at the end of the period would have been reduced.
Annual Report 2016
7
COLUMBIA MULTI-ASSET INCOME FUND
PORTFOLIO OF INVESTMENTS
April 30, 2016
(Percentages represent value of investments compared to net assets)
Common Stocks 8.2%
Issuer | | Shares | | Value ($) | |
CONSUMER DISCRETIONARY 0.3% | |
Automobiles —% | |
Daimler AG, Registered Shares | | | 337 | | | | 23,419 | | |
Ford Motor Co. | | | 940 | | | | 12,747 | | |
Total | | | | | 36,166 | | |
Hotels, Restaurants & Leisure 0.1% | |
McDonald's Corp. | | | 558 | | | | 70,581 | | |
Leisure Products 0.1% | |
Mattel, Inc. | | | 1,821 | | | | 56,615 | | |
Media 0.1% | |
Pearson PLC | | | 1,365 | | | | 16,056 | | |
Viacom, Inc., Class B | | | 338 | | | | 13,824 | | |
Vivendi SA | | | 1,121 | | | | 21,513 | | |
Total | | | | | 51,393 | | |
Multiline Retail —% | |
Macy's, Inc. | | | 595 | | | | 23,556 | | |
Specialty Retail —% | |
Staples, Inc. | | | 1,838 | | | | 18,748 | | |
Total Consumer Discretionary | | | | | 257,059 | | |
CONSUMER STAPLES 0.8% | |
Food & Staples Retailing —% | |
Wesfarmers Ltd. | | | 858 | | | | 27,783 | | |
Food Products —% | |
Archer-Daniels-Midland Co. | | | 256 | | | | 10,224 | | |
Kraft Heinz Co. (The) | | | 184 | | | | 14,365 | | |
Total | | | | | 24,589 | | |
Household Products 0.1% | |
Procter & Gamble Co. (The) | | | 1,087 | | | | 87,090 | | |
Tobacco 0.7% | |
Altria Group, Inc. | | | 4,267 | | | | 267,584 | | |
British American Tobacco PLC | | | 1,350 | | | | 82,255 | | |
Philip Morris International, Inc. | | | 2,865 | | | | 281,114 | | |
Reynolds American, Inc. | | | 403 | | | | 19,989 | | |
Total | | | | | 650,942 | | |
Total Consumer Staples | | | | | 790,404 | | |
ENERGY 1.6% | |
Oil, Gas & Consumable Fuels 1.6% | |
| BP PLC, ADR | | | 2,947 | | | | 98,960 | | |
Common Stocks (continued)
Issuer | | Shares | | Value ($) | |
Chevron Corp. | | | 2,155 | | | | 220,198 | | |
ENI SpA | | | 1,623 | | | | 26,389 | | |
Exxon Mobil Corp. | | | 2,229 | | | | 197,044 | | |
Kinder Morgan, Inc. | | | 16,303 | | | | 289,541 | | |
Occidental Petroleum Corp. | | | 1,832 | | | | 140,423 | | |
Royal Dutch Shell PLC, Class A | | | 3,579 | | | | 93,058 | | |
Spectra Energy Corp. | | | 855 | | | | 26,736 | | |
Suncor Energy, Inc. | | | 535 | | | | 15,713 | | |
Targa Resources Corp. | | | 8,156 | | | | 329,992 | | |
Total SA | | | 539 | | | | 27,113 | | |
Total | | | | | 1,465,167 | | |
Total Energy | | | | | 1,465,167 | | |
FINANCIALS 2.7% | |
Banks 0.1% | |
Bank of Montreal | | | 428 | | | | 27,888 | | |
JPMorgan Chase & Co. | | | 341 | | | | 21,551 | | |
PacWest Bancorp | | | 416 | | | | 16,632 | | |
Total | | | | | 66,071 | | |
Capital Markets —% | |
Invesco Ltd. | | | 906 | | | | 28,095 | | |
Insurance 0.1% | |
AXA SA | | | 1,032 | | | | 26,015 | | |
Swiss Re AG | | | 271 | | | | 24,041 | | |
Total | | | | | 50,056 | | |
Real Estate Investment Trusts (REITs) 2.5% | |
Alexandria Real Estate Equities, Inc. | | | 1,249 | | | | 116,094 | | |
Altisource Residential Corp. | | | 2,393 | | | | 27,807 | | |
Armada Hoffler Properties, Inc. | | | 1,160 | | | | 13,572 | | |
Ashford Hospitality Trust, Inc. | | | 2,582 | | | | 14,433 | | |
Brandywine Realty Trust | | | 1,675 | | | | 25,041 | | |
CBL & Associates Properties, Inc. | | | 5,074 | | | | 59,264 | | |
Chesapeake Lodging Trust | | | 1,290 | | | | 31,773 | | |
Colony Capital, Inc. | | | 2,878 | | | | 50,883 | | |
Coresite Realty Corp. | | | 369 | | | | 27,649 | | |
Digital Realty Trust, Inc. | | | 1,680 | | | | 147,806 | | |
Duke Realty Corp. | | | 4,006 | | | | 87,611 | | |
DuPont Fabros Technology, Inc. | | | 762 | | | | 30,343 | | |
EastGroup Properties, Inc. | | | 841 | | | | 50,250 | | |
Education Realty Trust, Inc. | | | 1,080 | | | | 42,952 | | |
The accompanying Notes to Financial Statements are an integral part of this statement.
Annual Report 2016
8
COLUMBIA MULTI-ASSET INCOME FUND
PORTFOLIO OF INVESTMENTS (continued)
April 30, 2016
Common Stocks (continued)
Issuer | | Shares | | Value ($) | |
EPR Properties | | | 1,475 | | | | 97,173 | | |
Gaming and Leisure Properties, Inc. | | | 2,378 | | | | 77,975 | | |
Geo Group, Inc. (The) | | | 1,683 | | | | 53,906 | | |
Getty Realty Corp. | | | 1,617 | | | | 31,822 | | |
Gladstone Commercial Corp. | | | 1,002 | | | | 16,864 | | |
Government Properties Income Trust | | | 1,649 | | | | 31,199 | | |
HCP, Inc. | | | 2,914 | | | | 98,581 | | |
Healthcare Trust of America, Inc., Class A | | | 2,230 | | | | 64,425 | | |
Highwoods Properties, Inc. | | | 1,647 | | | | 76,964 | | |
Host Hotels & Resorts, Inc. | | | 3,672 | | | | 58,091 | | |
LaSalle Hotel Properties | | | 1,053 | | | | 25,167 | | |
Lexington Realty Trust | | | 7,562 | | | | 66,394 | | |
Medical Properties Trust, Inc. | | | 4,131 | | | | 54,984 | | |
Mid-America Apartment Communities, Inc. | | | 518 | | | | 49,578 | | |
NorthStar Realty Finance Corp. | | | 1,720 | | | | 21,999 | | |
One Liberty Properties, Inc. | | | 1,523 | | | | 35,669 | | |
Pebblebrook Hotel Trust | | | 200 | | | | 5,528 | | |
Physicians Realty Trust | | | 2,815 | | | | 51,036 | | |
Ramco-Gershenson Properties Trust | | | 2,682 | | | | 47,498 | | |
Retail Properties of America, Inc., Class A | | | 2,410 | | | | 38,536 | | |
RLJ Lodging Trust | | | 2,409 | | | | 50,758 | | |
Sabra Health Care REIT, Inc. | | | 942 | | | | 19,867 | | |
Select Income REIT | | | 1,983 | | | | 45,906 | | |
Senior Housing Properties Trust | | | 1,118 | | | | 19,654 | | |
Sovran Self Storage, Inc. | | | 467 | | | | 49,605 | | |
Spirit Realty Capital, Inc. | | | 7,396 | | | | 84,536 | | |
STAG Industrial, Inc. | | | 5,231 | | | | 104,411 | | |
Sun Communities, Inc. | | | 1,111 | | | | 75,404 | | |
UDR, Inc. | | | 1,473 | | | | 51,437 | | |
Ventas, Inc. | | | 489 | | | | 30,377 | | |
WP Carey, Inc. | | | 1,082 | | | | 66,099 | | |
WP Glimcher, Inc. | | | 3,117 | | | | 32,697 | | |
Total | | | | | 2,359,618 | | |
Total Financials | | | | | 2,503,840 | | |
HEALTH CARE 0.6% | |
Biotechnology 0.1% | |
AbbVie, Inc. | | | 885 | | | | 53,985 | | |
Pharmaceuticals 0.5% | |
Bristol-Myers Squibb Co. | | | 1,132 | | | | 81,708 | | |
Common Stocks (continued)
Issuer | | Shares | | Value ($) | |
GlaxoSmithKline PLC | | | 1,367 | | | | 29,142 | | |
Johnson & Johnson | | | 1,305 | | | | 146,264 | | |
Merck & Co., Inc. | | | 1,896 | | | | 103,977 | | |
Pfizer, Inc. | | | 6,083 | | | | 198,975 | | |
Total | | | | | 560,066 | | |
Total Health Care | | | | | 614,051 | | |
INDUSTRIALS 0.3% | |
Aerospace & Defense 0.2% | |
BAE Systems PLC | | | 3,828 | | | | 26,697 | | |
Lockheed Martin Corp. | | | 660 | | | | 153,371 | | |
Total | | | | | 180,068 | | |
Commercial Services & Supplies —% | |
RR Donnelley & Sons Co. | | | 1,998 | | | | 34,765 | | |
Industrial Conglomerates 0.1% | |
General Electric Co. | | | 1,146 | | | | 35,239 | | |
Total Industrials | | | | | 250,072 | | |
INFORMATION TECHNOLOGY 0.7% | |
Communications Equipment 0.2% | |
Cisco Systems, Inc. | | | 6,201 | | | | 170,465 | | |
Telefonaktiebolaget LM Ericsson, Class B | | | 2,607 | | | | 21,102 | | |
Total | | | | | 191,567 | | |
IT Services 0.1% | |
International Business Machines Corp. | | | 505 | | | | 73,700 | | |
Leidos Holdings, Inc. | | | 274 | | | | 13,593 | | |
Paychex, Inc. | | | 454 | | | | 23,662 | | |
Total | | | | | 110,955 | | |
Semiconductors & Semiconductor Equipment 0.1% | |
Intel Corp. | | | 2,800 | | | | 84,784 | | |
Maxim Integrated Products, Inc. | | | 404 | | | | 14,431 | | |
QUALCOMM, Inc. | | | 527 | | | | 26,624 | | |
Total | | | | | 125,839 | | |
Software 0.2% | |
Microsoft Corp. | | | 3,590 | | | | 179,033 | | |
Technology Hardware, Storage & Peripherals 0.1% | |
Seagate Technology PLC | | | 1,536 | | | | 33,439 | | |
Total Information Technology | | | | | 640,833 | | |
The accompanying Notes to Financial Statements are an integral part of this statement.
Annual Report 2016
9
COLUMBIA MULTI-ASSET INCOME FUND
PORTFOLIO OF INVESTMENTS (continued)
April 30, 2016
Common Stocks (continued)
Issuer | | Shares | | Value ($) | |
MATERIALS 0.2% | |
Chemicals 0.2% | |
BASF SE | | | 419 | | | | 34,616 | | |
Dow Chemical Co. (The) | | | 1,818 | | | | 95,645 | | |
Eastman Chemical Co. | | | 88 | | | | 6,721 | | |
PPG Industries, Inc. | | | 68 | | | | 7,507 | | |
Total | | | | | 144,489 | | |
Containers & Packaging —% | |
International Paper Co. | | | 514 | | | | 22,241 | | |
Packaging Corp. of America | | | 184 | | | | 11,938 | | |
Total | | | | | 34,179 | | |
Metals & Mining —% | |
Nucor Corp. | | | 476 | | | | 23,695 | | |
Total Materials | | | | | 202,363 | | |
TELECOMMUNICATION SERVICES 0.6% | |
Diversified Telecommunication Services 0.5% | |
AT&T, Inc. | | | 7,224 | | | | 280,436 | | |
BCE, Inc. | | | 930 | | | | 43,626 | | |
CenturyLink, Inc. | | | 2,379 | | | | 73,630 | | |
Orange SA | | | 1,888 | | | | 31,304 | | |
Swisscom AG | | | 47 | | | | 23,835 | | |
Telia Co. AB | | | 4,936 | | | | 23,572 | | |
Total | | | | | 476,403 | | |
Wireless Telecommunication Services 0.1% | |
Vodafone Group PLC | | | 4,686 | | | | 15,009 | | |
Vodafone Group PLC, ADR | | | 1,046 | | | | 34,246 | | |
Total | | | | | 49,255 | | |
Total Telecommunication Services | | | | | 525,658 | | |
UTILITIES 0.4% | |
Electric Utilities 0.3% | |
American Electric Power Co., Inc. | | | 703 | | | | 44,641 | | |
Duke Energy Corp. | | | 741 | | | | 58,376 | | |
Exelon Corp. | | | 1,367 | | | | 47,968 | | |
PG&E Corp. | | | 529 | | | | 30,788 | | |
PPL Corp. | | | 1,117 | | | | 42,044 | | |
Xcel Energy, Inc. | | | 1,347 | | | | 53,920 | | |
Total | | | | | 277,737 | | |
Common Stocks (continued)
Issuer | | Shares | | Value ($) | |
Multi-Utilities 0.1% | |
Ameren Corp. | | | 862 | | | | 41,376 | | |
DTE Energy Co. | | | 244 | | | | 21,755 | | |
Sempra Energy | | | 412 | | | | 42,580 | | |
Total | | | | | 105,711 | | |
Total Utilities | | | | | 383,448 | | |
Total Common Stocks
(Cost: $7,636,422) | | | | | 7,632,895 | | |
Exchange-Traded Funds 7.2%
| | | Shares | | Value ($) | |
SPDR Barclays Long Term Corporate
Bond ETF | | | 66,642 | | | | 2,726,990 | | |
SPDR Blackstone/GSO Senior
Loan ETF | | | 84,585 | | | | 3,960,270 | | |
Total Exchange-Traded Funds
(Cost: $6,919,596) | | | | | 6,687,260 | | |
Corporate Bonds & Notes 28.1%
Issuer | | Coupon
Rate | | Principal
Amount ($) | | Value ($) | |
Aerospace & Defense 0.2% | |
Huntington Ingalls Industries, Inc.(a)
12/15/21 | | | 5.000 | % | | | 80,000 | | | | 83,850 | | |
TransDigm, Inc.
07/15/24 | | | 6.500 | % | | | 102,000 | | | | 102,765 | | |
05/15/25 | | | 6.500 | % | | | 45,000 | | | | 45,225 | | |
Total | | | | | | | 231,840 | | |
Automotive 0.3% | |
American Axle & Manufacturing, Inc.
03/15/21 | | | 6.250 | % | | | 80,000 | | | | 83,200 | | |
Schaeffler Finance BV(a)
05/15/21 | | | 4.250 | % | | | 94,000 | | | | 96,585 | | |
ZF North America Capital, Inc.(a)
04/29/25 | | | 4.750 | % | | | 95,000 | | | | 96,306 | | |
Total | | | | | | | 276,091 | | |
Banking 3.9% | |
Ally Financial, Inc.
05/19/22 | | | 4.625 | % | | | 50,000 | | | | 51,250 | | |
03/30/25 | | | 4.625 | % | | | 262,000 | | | | 264,620 | | |
Subordinated
11/20/25 | | | 5.750 | % | | | 51,000 | | | | 51,638 | | |
The accompanying Notes to Financial Statements are an integral part of this statement.
Annual Report 2016
10
COLUMBIA MULTI-ASSET INCOME FUND
PORTFOLIO OF INVESTMENTS (continued)
April 30, 2016
Corporate Bonds & Notes (continued)
Issuer | | Coupon
Rate | | Principal
Amount ($) | | Value ($) | |
BNP Paribas SA
Junior Subordinated(a)(b)
12/31/49 | | | 7.375 | % | | | 200,000 | | | | 197,500 | | |
Bank of New York Mellon Corp. (The)
Junior Subordinated(b)
12/29/49 | | | 4.500 | % | | | 275,000 | | | | 258,500 | | |
Barclays Bank PLC
Junior Subordinated(b)
12/31/49 | | | 6.625 | % | | | 265,000 | | | | 242,475 | | |
Citigroup, Inc.
Junior Subordinated(b)
12/31/49 | | | 6.300 | % | | | 255,000 | | | | 249,900 | | |
Fifth Third Bancorp
Junior Subordinated(b)
12/31/49 | | | 5.100 | % | | | 275,000 | | | | 250,594 | | |
HSBC Holdings PLC
Junior Subordinated(b)
12/31/49 | | | 6.375 | % | | | 360,000 | | | | 347,850 | | |
JPMorgan Chase & Co.
Junior Subordinated(b)
12/31/49 | | | 6.100 | % | | | 345,000 | | | | 354,487 | | |
Lloyds Banking Group PLC(a)(b)
Junior Subordinated
12/31/49 | | | 6.657 | % | | | 230,000 | | | | 249,550 | | |
Lloyds Banking Group PLC(b)
Junior Subordinated
12/31/49 | | | 7.500 | % | | | 250,000 | | | | 247,875 | | |
PNC Financial Services Group, Inc. (The)
Junior Subordinated(b)
12/31/49 | | | 4.850 | % | | | 25,000 | | | | 23,938 | | |
Royal Bank of Scotland Group PLC
Subordinated
05/28/24 | | | 5.125 | % | | | 110,000 | | | | 107,670 | | |
Royal Bank of Scotland Group PLC(b)
Junior Subordinated
12/31/49 | | | 8.000 | % | | | 200,000 | | | | 191,687 | | |
Wells Fargo & Co.
Junior Subordinated(b)
12/31/49 | | | 5.900 | % | | | 250,000 | | | | 255,937 | | |
Wells Fargo Capital X
Junior Subordinated
12/15/36 | | | 5.950 | % | | | 250,000 | | | | 256,500 | | |
Total | | | | | | | 3,601,971 | | |
Brokerage/Asset Managers/Exchanges 0.1% | |
E*TRADE Financial Corp.
09/15/23 | | | 4.625 | % | | | 112,000 | | | | 113,366 | | |
National Financial Partners Corp.(a)
07/15/21 | | | 9.000 | % | | | 14,000 | | | | 13,930 | | |
Total | | | | | | | 127,296 | | |
Corporate Bonds & Notes (continued)
Issuer | | Coupon
Rate | | Principal
Amount ($) | | Value ($) | |
Building Materials 1.2% | |
Allegion PLC
09/15/23 | | | 5.875 | % | | | 32,000 | | | | 33,920 | | |
Allegion US Holding Co., Inc.
10/01/21 | | | 5.750 | % | | | 40,000 | | | | 41,800 | | |
American Builders & Contractors Supply Co., Inc.(a)
04/15/21 | | | 5.625 | % | | | 72,000 | | | | 74,520 | | |
12/15/23 | | | 5.750 | % | | | 15,000 | | | | 15,675 | | |
Beacon Roofing Supply, Inc.
10/01/23 | | | 6.375 | % | | | 56,000 | | | | 59,500 | | |
Cemex SAB de CV(a)
01/15/21 | | | 7.250 | % | | | 200,000 | | | | 213,500 | | |
Elementia SAB de CV(a)
01/15/25 | | | 5.500 | % | | | 200,000 | | | | 198,000 | | |
HD Supply, Inc.
07/15/20 | | | 7.500 | % | | | 146,000 | | | | 154,942 | | |
HD Supply, Inc.(a)
12/15/21 | | | 5.250 | % | | | 50,000 | | | | 52,500 | | |
04/15/24 | | | 5.750 | % | | | 42,000 | | | | 44,048 | | |
Masco Corp.
04/01/21 | | | 3.500 | % | | | 11,000 | | | | 11,165 | | |
Nortek, Inc.
04/15/21 | | | 8.500 | % | | | 48,000 | | | | 49,920 | | |
Ply Gem Industries, Inc.
02/01/22 | | | 6.500 | % | | | 2,000 | | | | 1,985 | | |
Union Andina de Cementos SAA(a)
10/30/21 | | | 5.875 | % | | | 200,000 | | | | 205,500 | | |
Total | | | | | | | 1,156,975 | | |
Cable and Satellite 1.8% | |
Altice U.S. Finance I Corp.(a)
05/15/26 | | | 5.500 | % | | | 84,000 | | | | 84,840 | | |
Altice US Finance I Corp.(a)
07/15/23 | | | 5.375 | % | | | 33,000 | | | | 33,695 | | |
CCO Holdings LLC/Capital Corp.(a)
05/01/23 | | | 5.125 | % | | | 178,000 | | | | 181,560 | | |
04/01/24 | | | 5.875 | % | | | 60,000 | | | | 62,850 | | |
05/01/26 | | | 5.500 | % | | | 12,000 | | | | 12,240 | | |
CCOH Safari LLC(a)
02/15/26 | | | 5.750 | % | | | 47,000 | | | | 48,528 | | |
CSC Holdings LLC
06/01/24 | | | 5.250 | % | | | 124,000 | | | | 112,840 | | |
Cable One, Inc.(a)
06/15/22 | | | 5.750 | % | | | 24,000 | | | | 24,660 | | |
Cequel Communications Holdings I LLC/Capital Corp.(a)
12/15/21 | | | 5.125 | % | | | 26,000 | | | | 24,505 | | |
12/15/21 | | | 5.125 | % | | | 76,000 | | | | 71,630 | | |
The accompanying Notes to Financial Statements are an integral part of this statement.
Annual Report 2016
11
COLUMBIA MULTI-ASSET INCOME FUND
PORTFOLIO OF INVESTMENTS (continued)
April 30, 2016
Corporate Bonds & Notes (continued)
Issuer | | Coupon
Rate | | Principal
Amount ($) | | Value ($) | |
DISH DBS Corp.
06/01/21 | | | 6.750 | % | | | 166,000 | | | | 171,015 | | |
11/15/24 | | | 5.875 | % | | | 21,000 | | | | 19,709 | | |
DigitalGlobe, Inc.(a)
02/01/21 | | | 5.250 | % | | | 48,000 | | | | 43,380 | | |
Intelsat Jackson Holdings SA
10/15/20 | | | 7.250 | % | | | 56,000 | | | | 40,880 | | |
Neptune Finco Corp.(a)
10/15/25 | | | 6.625 | % | | | 83,000 | | | | 89,536 | | |
10/15/25 | | | 10.875 | % | | | 59,000 | | | | 65,637 | | |
Quebecor Media, Inc.
01/15/23 | | | 5.750 | % | | | 40,000 | | | | 41,400 | | |
Sirius XM Radio, Inc.(a)
04/15/25 | | | 5.375 | % | | | 52,000 | | | | 53,040 | | |
UPCB Finance IV Ltd.(a)
01/15/25 | | | 5.375 | % | | | 72,000 | | | | 73,260 | | |
Unitymedia GmbH(a)
01/15/25 | | | 6.125 | % | | | 148,000 | | | | 152,440 | | |
Videotron Ltd.
07/15/22 | | | 5.000 | % | | | 55,000 | | | | 57,062 | | |
Virgin Media Finance PLC(a)
10/15/24 | | | 6.000 | % | | | 200,000 | | | | 204,000 | | |
Total | | | | | | | 1,668,707 | | |
Chemicals 1.0% | |
Angus Chemical Co.(a)
02/15/23 | | | 8.750 | % | | | 74,000 | | | | 70,485 | | |
Celanese U.S. Holdings LLC
06/15/21 | | | 5.875 | % | | | 66,000 | | | | 71,115 | | |
Chemours Co. LLC (The)(a)
05/15/23 | | | 6.625 | % | | | 64,000 | | | | 56,000 | | |
05/15/25 | | | 7.000 | % | | | 75,000 | | | | 65,062 | | |
Eco Services Operations LLC/Finance Corp.(a)
11/01/22 | | | 8.500 | % | | | 62,000 | | | | 59,830 | | |
Huntsman International LLC
11/15/22 | | | 5.125 | % | | | 20,000 | | | | 20,100 | | |
INEOS Group Holdings SA(a)
02/15/19 | | | 5.875 | % | | | 74,000 | | | | 75,110 | | |
Mexichem SAB de CV(a)
09/17/44 | | | 5.875 | % | | | 200,000 | | | | 181,250 | | |
PQ Corp.(a)
11/01/18 | | | 8.750 | % | | | 184,000 | | | | 191,360 | | |
PQ Corp.(a)(c)
11/15/22 | | | 6.750 | % | | | 50,000 | | | | 51,625 | | |
Platform Specialty Products Corp.(a)
05/01/21 | | | 10.375 | % | | | 26,000 | | | | 26,000 | | |
02/01/22 | | | 6.500 | % | | | 25,000 | | | | 22,000 | | |
Corporate Bonds & Notes (continued)
Issuer | | Coupon
Rate | | Principal
Amount ($) | | Value ($) | |
WR Grace & Co.(a)
10/01/21 | | | 5.125 | % | | | 60,000 | | | | 62,820 | | |
Total | | | | | | | 952,757 | | |
Construction Machinery 0.1% | |
United Rentals North America, Inc.
06/15/23 | | | 6.125 | % | | | 60,000 | | | | 62,250 | | |
Consumer Cyclical Services 0.3% | |
APX Group, Inc.
12/01/19 | | | 6.375 | % | | | 55,000 | | | | 55,000 | | |
12/01/20 | | | 8.750 | % | | | 58,000 | | | | 54,375 | | |
IHS, Inc.
11/01/22 | | | 5.000 | % | | | 82,000 | | | | 85,690 | | |
Interval Acquisition Corp.(a)
04/15/23 | | | 5.625 | % | | | 94,000 | | | | 95,880 | | |
Total | | | | | | | 290,945 | | |
Consumer Products 0.6% | |
Prestige Brands, Inc.(a)
03/01/24 | | | 6.375 | % | | | 55,000 | | | | 57,750 | | |
Scotts Miracle-Gro Co. (The)(a)
10/15/23 | | | 6.000 | % | | | 44,000 | | | | 46,530 | | |
Serta Simmons Bedding LLC(a)
10/01/20 | | | 8.125 | % | | | 80,000 | | | | 84,000 | | |
Spectrum Brands, Inc.
11/15/22 | | | 6.625 | % | | | 20,000 | | | | 21,600 | | |
12/15/24 | | | 6.125 | % | | | 117,000 | | | | 125,044 | | |
07/15/25 | | | 5.750 | % | | | 44,000 | | | | 46,669 | | |
Springs Industries, Inc.
06/01/21 | | | 6.250 | % | | | 47,000 | | | | 47,822 | | |
Tempur Sealy International, Inc.
12/15/20 | | | 6.875 | % | | | 61,000 | | | | 64,279 | | |
10/15/23 | | | 5.625 | % | | | 32,000 | | | | 33,280 | | |
Total | | | | | | | 526,974 | | |
Diversified Manufacturing 0.8% | |
General Electric Co.
Junior Subordinated(b)
12/31/49 | | | 5.000 | % | | | 695,000 | | | | 723,669 | | |
Manitowoc Foodservice, Inc.(a)
02/15/24 | | | 9.500 | % | | | 23,000 | | | | 25,415 | | |
Total | | | | | | | 749,084 | | |
Electric 0.3% | |
AES Corp. (The)
07/01/21 | | | 7.375 | % | | | 94,000 | | | | 107,865 | | |
NRG Energy, Inc.
07/15/22 | | | 6.250 | % | | | 100,000 | | | | 98,032 | | |
05/01/24 | | | 6.250 | % | | | 4,000 | | | | 3,900 | | |
The accompanying Notes to Financial Statements are an integral part of this statement.
Annual Report 2016
12
COLUMBIA MULTI-ASSET INCOME FUND
PORTFOLIO OF INVESTMENTS (continued)
April 30, 2016
Corporate Bonds & Notes (continued)
Issuer | | Coupon
Rate | | Principal
Amount ($) | | Value ($) | |
NRG Yield Operating LLC
08/15/24 | | | 5.375 | % | | | 102,000 | | | | 95,880 | | |
Total | | | | | | | 305,677 | | |
Finance Companies 1.4% | |
AerCap Ireland Capital Ltd./Global Aviation Trust
10/30/20 | | | 4.625 | % | | | 61,000 | | | | 63,440 | | |
10/01/21 | | | 5.000 | % | | | 384,000 | | | | 405,120 | | |
Aircastle Ltd.
03/15/21 | | | 5.125 | % | | | 60,000 | | | | 63,450 | | |
04/01/23 | | | 5.000 | % | | | 8,000 | | | | 8,145 | | |
CIT Group, Inc.
05/15/20 | | | 5.375 | % | | | 128,000 | | | | 134,240 | | |
08/01/23 | | | 5.000 | % | | | 38,000 | | | | 39,520 | | |
Navient Corp.
03/25/20 | | | 8.000 | % | | | 7,000 | | | | 7,350 | | |
10/26/20 | | | 5.000 | % | | | 194,000 | | | | 185,270 | | |
OneMain Financial Holdings LLC(a)
12/15/21 | | | 7.250 | % | | | 100,000 | | | | 104,000 | | |
Provident Funding Associates LP/Finance Corp.(a)
06/15/21 | | | 6.750 | % | | | 110,000 | | | | 104,225 | | |
Quicken Loans, Inc.(a)
05/01/25 | | | 5.750 | % | | | 51,000 | | | | 47,940 | | |
Springleaf Finance Corp.
12/15/20 | | | 8.250 | % | | | 10,000 | | | | 10,313 | | |
10/01/23 | | | 8.250 | % | | | 120,000 | | | | 119,625 | | |
iStar, Inc.
07/01/19 | | | 5.000 | % | | | 23,000 | | | | 22,310 | | |
Total | | | | | | | 1,314,948 | | |
Food and Beverage 0.8% | |
Aramark Services, Inc.
01/15/24 | | | 5.125 | % | | | 22,000 | | | | 23,265 | | |
B&G Foods, Inc.
06/01/21 | | | 4.625 | % | | | 30,000 | | | | 30,487 | | |
Constellation Brands, Inc.
11/15/24 | | | 4.750 | % | | | 70,000 | | | | 74,200 | | |
12/01/25 | | | 4.750 | % | | | 10,000 | | | | 10,613 | | |
JBS Investments GmbH(a)
04/03/24 | | | 7.250 | % | | | 200,000 | | | | 193,500 | | |
MHP SA(a)
04/02/20 | | | 8.250 | % | | | 200,000 | | | | 179,000 | | |
Pinnacle Foods Finance LLC/Corp.(a)
01/15/24 | | | 5.875 | % | | | 7,000 | | | | 7,403 | | |
Post Holdings, Inc.(a)
12/15/22 | | | 6.000 | % | | | 53,000 | | | | 54,424 | | |
03/15/24 | | | 7.750 | % | | | 56,000 | | | | 60,900 | | |
Treehouse Foods, Inc.(a)
02/15/24 | | | 6.000 | % | | | 10,000 | | | | 10,637 | | |
Corporate Bonds & Notes (continued)
Issuer | | Coupon
Rate | | Principal
Amount ($) | | Value ($) | |
WhiteWave Foods Co. (The)
10/01/22 | | | 5.375 | % | | | 66,000 | | | | 70,582 | | |
Total | | | | | | | 715,011 | | |
Gaming 0.9% | |
Boyd Gaming Corp.
05/15/23 | | | 6.875 | % | | | 31,000 | | | | 32,162 | | |
Boyd Gaming Corp.(a)
04/01/26 | | | 6.375 | % | | | 20,000 | | | | 20,450 | | |
GLP Capital LP/Financing II, Inc.
11/01/18 | | | 4.375 | % | | | 97,000 | | | | 99,910 | | |
11/01/20 | | | 4.875 | % | | | 72,000 | | | | 75,960 | | |
04/15/26 | | | 5.375 | % | | | 7,000 | | | | 7,298 | | |
International Game Technology PLC(a)
02/15/22 | | | 6.250 | % | | | 106,000 | | | | 107,876 | | |
MGM Resorts International
12/15/21 | | | 6.625 | % | | | 98,000 | | | | 104,370 | | |
03/15/23 | | | 6.000 | % | | | 92,000 | | | | 95,565 | | |
MGP Escrow Issuer LLC/Co-Issuer, Inc.(a)
05/01/24 | | | 5.625 | % | | | 21,000 | | | | 21,893 | | |
Pinnacle Entertainment, Inc.(a)
05/01/24 | | | 5.625 | % | | | 17,000 | | | | 16,979 | | |
Scientific Games International, Inc.
12/01/22 | | | 10.000 | % | | | 110,000 | | | | 90,915 | | |
Scientific Games International, Inc.(a)
01/01/22 | | | 7.000 | % | | | 100,000 | | | | 101,937 | | |
SugarHouse HSP Gaming LP/Finance Corp.(a)
06/01/21 | | | 6.375 | % | | | 44,000 | | | | 43,120 | | |
Total | | | | | | | 818,435 | | |
Health Care 2.1% | |
Acadia Healthcare Co., Inc.
07/01/22 | | | 5.125 | % | | | 32,000 | | | | 32,440 | | |
Acadia Healthcare Co., Inc.(a)
03/01/24 | | | 6.500 | % | | | 32,000 | | | | 33,760 | | |
Alere, Inc.(a)
07/01/23 | | | 6.375 | % | | | 37,000 | | | | 37,740 | | |
Amsurg Corp.
11/30/20 | | | 5.625 | % | | | 50,000 | | | | 51,250 | | |
CHS/Community Health Systems, Inc.
08/01/21 | | | 5.125 | % | | | 100,000 | | | | 100,291 | | |
02/01/22 | | | 6.875 | % | | | 101,000 | | | | 91,405 | | |
Change Healthcare Holdings, Inc.
12/31/19 | | | 11.000 | % | | | 58,000 | | | | 61,480 | | |
Change Healthcare Holdings, Inc.(a)
02/15/21 | | | 6.000 | % | | | 31,000 | | | | 31,310 | | |
ConvaTec Finance International SA
Junior Subordinated PIK(a)
01/15/19 | | | 8.250 | % | | | 32,000 | | | | 32,080 | | |
The accompanying Notes to Financial Statements are an integral part of this statement.
Annual Report 2016
13
COLUMBIA MULTI-ASSET INCOME FUND
PORTFOLIO OF INVESTMENTS (continued)
April 30, 2016
Corporate Bonds & Notes (continued)
Issuer | | Coupon
Rate | | Principal
Amount ($) | | Value ($) | |
DaVita HealthCare Partners, Inc.
08/15/22 | | | 5.750 | % | | | 138,000 | | | | 144,555 | | |
ExamWorks Group, Inc.
04/15/23 | | | 5.625 | % | | | 40,000 | | | | 42,900 | | |
Fresenius Medical Care U.S. Finance II, Inc.(a)
01/31/22 | | | 5.875 | % | | | 132,000 | | | | 145,200 | | |
HCA Holdings, Inc.
Junior Subordinated
02/15/21 | | | 6.250 | % | | | 192,000 | | | | 208,608 | | |
HCA, Inc.
02/15/20 | | | 6.500 | % | | | 179,000 | | | | 198,242 | | |
02/01/25 | | | 5.375 | % | | | 107,000 | | | | 109,407 | | |
HealthSouth Corp.
11/01/24 | | | 5.750 | % | | | 19,000 | | | | 19,618 | | |
Healthsouth Corp.
09/15/25 | | | 5.750 | % | | | 11,000 | | | | 11,380 | | |
Hologic, Inc.(a)
07/15/22 | | | 5.250 | % | | | 36,000 | | | | 37,710 | | |
Kinetic Concepts, Inc./KCI U.S.A., Inc.(a)
02/15/21 | | | 7.875 | % | | | 9,000 | | | | 9,731 | | |
LifePoint Health, Inc.
12/01/21 | | | 5.500 | % | | | 60,000 | | | | 62,400 | | |
MEDNAX, Inc.(a)
12/01/23 | | | 5.250 | % | | | 30,000 | | | | 31,050 | | |
MPH Acquisition Holdings LLC(a)
04/01/22 | | | 6.625 | % | | | 70,000 | | | | 73,150 | | |
Sterigenics-Nordion Holdings LLC(a)
05/15/23 | | | 6.500 | % | | | 22,000 | | | | 22,330 | | |
Surgical Care Affiliates, Inc.(a)
04/01/23 | | | 6.000 | % | | | 30,000 | | | | 30,300 | | |
Tenet Healthcare Corp.
04/01/21 | | | 4.500 | % | | | 148,000 | | | | 149,850 | | |
04/01/22 | | | 8.125 | % | | | 110,000 | | | | 114,125 | | |
06/15/23 | | | 6.750 | % | | | 5,000 | | | | 4,938 | | |
Universal Health Services, Inc.(a)
08/01/22 | | | 4.750 | % | | | 80,000 | | | | 81,600 | | |
Total | | | | | | | 1,968,850 | | |
Healthcare Insurance 0.2% | |
Centene Corp.(a)
02/15/24 | | | 6.125 | % | | | 121,000 | | | | 127,655 | | |
Molina Healthcare, Inc.(a)
11/15/22 | | | 5.375 | % | | | 50,000 | | | | 51,625 | | |
Total | | | | | | | 179,280 | | |
Home Construction 0.4% | |
CalAtlantic Group, Inc.
11/15/24 | | | 5.875 | % | | | 82,000 | | | | 86,715 | | |
Corporate Bonds & Notes (continued)
Issuer | | Coupon
Rate | | Principal
Amount ($) | | Value ($) | |
D.R. Horton, Inc.
02/15/20 | | | 4.000 | % | | | 42,000 | | | | 43,575 | | |
02/15/23 | | | 4.750 | % | | | 19,000 | | | | 19,665 | | |
Meritage Homes Corp.
04/01/22 | | | 7.000 | % | | | 127,000 | | | | 136,207 | | |
Taylor Morrison Communities, Inc./Monarch, Inc.(a)
04/15/21 | | | 5.250 | % | | | 59,000 | | | | 58,853 | | |
Toll Brothers Finance Corp.
11/15/25 | | | 4.875 | % | | | 25,000 | | | | 25,188 | | |
Total | | | | | | | 370,203 | | |
Independent Energy 1.3% | |
Antero Resources Corp.
12/01/22 | | | 5.125 | % | | | 88,000 | | | | 84,480 | | |
Carrizo Oil & Gas, Inc.
04/15/23 | | | 6.250 | % | | | 156,000 | | | | 149,760 | | |
Concho Resources, Inc.
04/01/23 | | | 5.500 | % | | | 150,000 | | | | 151,125 | | |
Continental Resources, Inc.
04/15/23 | | | 4.500 | % | | | 55,000 | | | | 49,122 | | |
CrownRock LP/Finance, Inc.(a)
02/15/23 | | | 7.750 | % | | | 77,000 | | | | 78,540 | | |
Diamondback Energy, Inc.
10/01/21 | | | 7.625 | % | | | 50,000 | | | | 53,312 | | |
Laredo Petroleum, Inc.
01/15/22 | | | 5.625 | % | | | 9,000 | | | | 8,280 | | |
03/15/23 | | | 6.250 | % | | | 232,000 | | | | 216,340 | | |
Newfield Exploration Co.
07/01/24 | | | 5.625 | % | | | 42,000 | | | | 42,735 | | |
Parsley Energy LLC/Finance Corp.(a)
02/15/22 | | | 7.500 | % | | | 212,000 | | | | 224,190 | | |
RSP Permian, Inc.
10/01/22 | | | 6.625 | % | | | 58,000 | | | | 59,885 | | |
Range Resources Corp.
08/15/22 | | | 5.000 | % | | | 52,000 | | | | 48,555 | | |
WPX Energy, Inc.
Senior Unsecured
01/15/22 | | | 6.000 | % | | | 34,000 | | | | 30,600 | | |
Total | | | | | | | 1,196,924 | | |
Leisure 0.1% | |
AMC Entertainment, Inc.
06/15/25 | | | 5.750 | % | | | 8,000 | | | | 8,200 | | |
Cinemark USA, Inc.
12/15/22 | | | 5.125 | % | | | 30,000 | | | | 31,050 | | |
LTF Merger Sub, Inc.(a)
06/15/23 | | | 8.500 | % | | | 41,000 | | | | 40,283 | | |
Total | | | | | | | 79,533 | | |
The accompanying Notes to Financial Statements are an integral part of this statement.
Annual Report 2016
14
COLUMBIA MULTI-ASSET INCOME FUND
PORTFOLIO OF INVESTMENTS (continued)
April 30, 2016
Corporate Bonds & Notes (continued)
Issuer | | Coupon
Rate | | Principal
Amount ($) | | Value ($) | |
Life Insurance 0.3% | |
MetLife, Inc.
Junior Subordinated
08/01/39 | | | 10.750 | % | | | 155,000 | | | | 236,375 | | |
Prudential Financial, Inc.
Junior Subordinated(b)
09/15/42 | | | 5.875 | % | | | 20,000 | | | | 21,615 | | |
Total | | | | | | | 257,990 | | |
Lodging 0.4% | |
Choice Hotels International, Inc.
07/01/22 | | | 5.750 | % | | | 96,000 | | | | 103,200 | | |
Hilton Worldwide Finance LLC/Corp.
10/15/21 | | | 5.625 | % | | | 80,000 | | | | 83,324 | | |
Playa Resorts Holding BV(a)
08/15/20 | | | 8.000 | % | | | 102,000 | | | | 102,765 | | |
RHP Hotel Properties LP/Finance Corp.
04/15/23 | | | 5.000 | % | | | 45,000 | | | | 46,238 | | |
Total | | | | | | | 335,527 | | |
Media and Entertainment 1.0% | |
AMC Networks, Inc.
12/15/22 | | | 4.750 | % | | | 33,000 | | | | 33,248 | | |
04/01/24 | | | 5.000 | % | | | 29,000 | | | | 29,036 | | |
Activision Blizzard, Inc.(a)
09/15/23 | | | 6.125 | % | | | 190,000 | | | | 206,862 | | |
Lamar Media Corp.(a)
02/01/26 | | | 5.750 | % | | | 14,000 | | | | 14,805 | | |
MDC Partners, Inc.(a)
05/01/24 | | | 6.500 | % | | | 141,000 | | | | 146,020 | | |
Netflix, Inc.
02/15/22 | | | 5.500 | % | | | 119,000 | | | | 124,355 | | |
02/15/25 | | | 5.875 | % | | | 82,000 | | | | 85,936 | | |
Nielsen Finance Co. SARL (The)(a)
10/01/21 | | | 5.500 | % | | | 40,000 | | | | 41,700 | | |
Outfront Media Capital LLC/Corp.
02/15/24 | | | 5.625 | % | | | 72,000 | | | | 75,240 | | |
Univision Communications, Inc.(a)
02/15/25 | | | 5.125 | % | | | 168,000 | | | | 166,110 | | |
Total | | | | | | | 923,312 | | |
Metals 0.4% | |
ArcelorMittal(b)
08/05/20 | | | 6.250 | % | | | 8,000 | | | | 8,200 | | |
03/01/21 | | | 6.500 | % | | | 108,000 | | | | 110,430 | | |
BHP Billiton Finance USA Ltd.
Junior Subordinated(a)(b)
10/19/75 | | | 6.750 | % | | | 200,000 | | | | 207,450 | | |
Corporate Bonds & Notes (continued)
Issuer | | Coupon
Rate | | Principal
Amount ($) | | Value ($) | |
Freeport-McMoRan, Inc.
03/01/22 | | | 3.550 | % | | | 16,000 | | | | 13,360 | | |
11/14/24 | | | 4.550 | % | | | 23,000 | | | | 19,349 | | |
Total | | | | | | | 358,789 | | |
Midstream 1.0% | |
Energy Transfer Equity LP
06/01/27 | | | 5.500 | % | | | 110,000 | | | | 94,410 | | |
MPLX LP(a)
12/01/24 | | | 4.875 | % | | | 244,000 | | | | 237,820 | | |
06/01/25 | | | 4.875 | % | | | 16,000 | | | | 15,461 | | |
Sabine Pass Liquefaction LLC
03/01/25 | | | 5.625 | % | | | 124,000 | | | | 120,900 | | |
Targa Resources Partners LP/Finance Corp.
05/01/23 | | | 5.250 | % | | | 52,000 | | | | 49,920 | | |
11/15/23 | | | 4.250 | % | | | 68,000 | | | | 62,688 | | |
Targa Resources Partners LP/Finance Corp.(a)
03/15/24 | | | 6.750 | % | | | 46,000 | | | | 46,805 | | |
Tesoro Logistics LP/Finance Corp.
10/15/22 | | | 6.250 | % | | | 103,000 | | | | 105,575 | | |
Western Gas Partners LP
07/01/22 | | | 4.000 | % | | | 39,000 | | | | 37,399 | | |
06/01/25 | | | 3.950 | % | | | 32,000 | | | | 28,770 | | |
Williams Companies, Inc. (The)
01/15/23 | | | 3.700 | % | | | 50,000 | | | | 41,989 | | |
06/24/24 | | | 4.550 | % | | | 139,000 | | | | 119,800 | | |
Total | | | | | | | 961,537 | | |
Other Financial Institutions 0.1% | |
Icahn Enterprises LP/Finance Corp.
08/01/20 | | | 6.000 | % | | | 47,000 | | | | 46,887 | | |
Other Industry —% | |
CB Richard Ellis Services, Inc.
03/15/25 | | | 5.250 | % | | | 39,000 | | | | 40,581 | | |
Other REIT 0.1% | |
CyrusOne LP/Finance Corp.
11/15/22 | | | 6.375 | % | | | 70,000 | | | | 73,893 | | |
Packaging 0.7% | |
Ardagh Packaging Finance PLC/Holdings U.S.A., Inc.(a)(c)
05/15/24 | | | 7.250 | % | | | 26,000 | | | | 26,000 | | |
Ardagh Packaging Finance PLC/Holdings USA, Inc.(a)
01/31/21 | | | 6.750 | % | | | 42,000 | | | | 42,105 | | |
Ball Corp.
12/15/20 | | | 4.375 | % | | | 94,000 | | | | 97,760 | | |
Berry Plastics Corp.
05/15/22 | | | 5.500 | % | | | 30,000 | | | | 30,956 | | |
07/15/23 | | | 5.125 | % | | | 56,000 | | | | 56,560 | | |
The accompanying Notes to Financial Statements are an integral part of this statement.
Annual Report 2016
15
COLUMBIA MULTI-ASSET INCOME FUND
PORTFOLIO OF INVESTMENTS (continued)
April 30, 2016
Corporate Bonds & Notes (continued)
Issuer | | Coupon
Rate | | Principal
Amount ($) | | Value ($) | |
Berry Plastics Corp.(a)
10/15/22 | | | 6.000 | % | | | 57,000 | | | | 59,565 | | |
Plastipak Holdings, Inc.(a)
10/01/21 | | | 6.500 | % | | | 82,000 | | | | 83,230 | | |
Reynolds Group Issuer, Inc./LLC
10/15/20 | | | 5.750 | % | | | 90,000 | | | | 93,375 | | |
02/15/21 | | | 6.875 | % | | | 47,000 | | | | 48,821 | | |
Reynolds Group Issuer, Inc./LLC(b)
02/15/21 | | | 8.250 | % | | | 98,000 | | | | 101,430 | | |
Signode Industrial Group Luxembourg SA/US, Inc.(a)
05/01/22 | | | 6.375 | % | | | 19,000 | | | | 18,525 | | |
Total | | | | | | | 658,327 | | |
Paper 0.2% | |
Inversiones CMPC SA(a)
09/15/24 | | | 4.750 | % | | | 200,000 | | | | 204,394 | | |
Pharmaceuticals 0.8% | |
Concordia Healthcare Corp.(a)
04/15/23 | | | 7.000 | % | | | 40,000 | | | | 37,100 | | |
Endo Finance LLC/Finco, Inc.(a)
02/01/25 | | | 6.000 | % | | | 117,000 | | | | 111,735 | | |
Grifols Worldwide Operations Ltd.
04/01/22 | | | 5.250 | % | | | 52,000 | | | | 53,560 | | |
Jaguar Holding Co. II/Pharmaceutical Product
Development LLC(a)
08/01/23 | | | 6.375 | % | | | 85,000 | | | | 88,315 | | |
Mallinckrodt International Finance SA/CB LLC(a)
10/15/23 | | | 5.625 | % | | | 44,000 | | | | 41,250 | | |
04/15/25 | | | 5.500 | % | | | 20,000 | | | | 18,050 | | |
Quintiles Transnational Corp.(a)
05/15/23 | | | 4.875 | % | | | 42,000 | | | | 42,997 | | |
Valeant Pharmaceuticals International, Inc.(a)
04/15/25 | | | 6.125 | % | | | 420,000 | | | | 350,860 | | |
Total | | | | | | | 743,867 | | |
Property & Casualty 0.2% | |
Alliant Holdings I LP(a)
08/01/23 | | | 8.250 | % | | | 4,000 | | | | 3,980 | | |
HUB International Ltd.(a)
02/15/21 | | | 9.250 | % | | | 14,000 | | | | 14,595 | | |
10/01/21 | | | 7.875 | % | | | 172,000 | | | | 168,560 | | |
Total | | | | | | | 187,135 | | |
Railroads 0.4% | |
BNSF Funding Trust I
Junior Subordinated(b)
12/15/55 | | | 6.613 | % | | | 315,000 | | | | 354,375 | | |
Corporate Bonds & Notes (continued)
Issuer | | Coupon
Rate | | Principal
Amount ($) | | Value ($) | |
Restaurants 0.1% | |
BC ULC/New Red Finance, Inc.(a)
01/15/22 | | | 4.625 | % | | | 76,000 | | | | 77,900 | | |
04/01/22 | | | 6.000 | % | | | 36,000 | | | | 37,170 | | |
Total | | | | | | | 115,070 | | |
Retailers 0.6% | |
Asbury Automotive Group, Inc.
12/15/24 | | | 6.000 | % | | | 69,000 | | | | 71,242 | | |
Dollar Tree, Inc.(a)
03/01/23 | | | 5.750 | % | | | 80,000 | | | | 85,424 | | |
Group 1 Automotive, Inc.
06/01/22 | | | 5.000 | % | | | 52,000 | | | | 51,480 | | |
Group 1 Automotive, Inc.(a)
12/15/23 | | | 5.250 | % | | | 5,000 | | | | 4,975 | | |
Penske Automotive Group, Inc.
12/01/24 | | | 5.375 | % | | | 100,000 | | | | 100,750 | | |
Rite Aid Corp.(a)
04/01/23 | | | 6.125 | % | | | 132,000 | | | | 140,663 | | |
Sally Holdings LLC/Capital, Inc.
06/01/22 | | | 5.750 | % | | | 40,000 | | | | 41,900 | | |
12/01/25 | | | 5.625 | % | | | 15,000 | | | | 16,013 | | |
Total | | | | | | | 512,447 | | |
Supermarkets 0.2% | |
Cencosud SA(a)
02/12/45 | | | 6.625 | % | | | 200,000 | | | | 191,046 | | |
Technology 1.5% | |
Alliance Data Systems Corp.(a)
08/01/22 | | | 5.375 | % | | | 208,000 | | | | 200,200 | | |
Equinix, Inc.
01/01/22 | | | 5.375 | % | | | 120,000 | | | | 125,400 | | |
01/15/26 | | | 5.875 | % | | | 34,000 | | | | 35,976 | | |
First Data Corp.(a)
08/15/23 | | | 5.375 | % | | | 60,000 | | | | 62,025 | | |
12/01/23 | | | 7.000 | % | | | 129,000 | | | | 132,547 | | |
01/15/24 | | | 5.000 | % | | | 48,000 | | | | 48,480 | | |
01/15/24 | | | 5.750 | % | | | 150,000 | | | | 152,250 | | |
Infor US, Inc.(a)
08/15/20 | | | 5.750 | % | | | 12,000 | | | | 12,645 | | |
Iron Mountain, Inc.(a)
10/01/20 | | | 6.000 | % | | | 47,000 | | | | 49,703 | | |
MSCI, Inc.(a)
11/15/24 | | | 5.250 | % | | | 70,000 | | | | 73,150 | | |
08/15/25 | | | 5.750 | % | | | 35,000 | | | | 37,231 | | |
Microsemi Corp.(a)
04/15/23 | | | 9.125 | % | | | 42,000 | | | | 46,200 | | |
NCR Corp.
12/15/23 | | | 6.375 | % | | | 31,000 | | | | 32,240 | | |
The accompanying Notes to Financial Statements are an integral part of this statement.
Annual Report 2016
16
COLUMBIA MULTI-ASSET INCOME FUND
PORTFOLIO OF INVESTMENTS (continued)
April 30, 2016
Corporate Bonds & Notes (continued)
Issuer | | Coupon
Rate | | Principal
Amount ($) | | Value ($) | |
NXP BV/Funding LLC(a)
06/15/22 | | | 4.625 | % | | | 41,000 | | | | 42,538 | | |
Qualitytech LP/Finance Corp.
08/01/22 | | | 5.875 | % | | | 62,000 | | | | 63,550 | | |
Riverbed Technology, Inc.(a)
03/01/23 | | | 8.875 | % | | | 66,000 | | | | 66,495 | | |
Sensata Technologies UK Financing Co. PLC(a)
02/15/26 | | | 6.250 | % | | | 34,000 | | | | 36,295 | | |
Solera LLC/Finance, Inc.(a)
03/01/24 | | | 10.500 | % | | | 30,000 | | | | 31,425 | | |
VeriSign, Inc.
05/01/23 | | | 4.625 | % | | | 104,000 | | | | 106,860 | | |
Zebra Technologies Corp.
10/15/22 | | | 7.250 | % | | | 78,000 | | | | 84,443 | | |
Total | | | | | | | 1,439,653 | | |
Transportation Services —% | |
Hertz Corp. (The)
01/15/21 | | | 7.375 | % | | | 5,000 | | | | 5,156 | | |
10/15/22 | | | 6.250 | % | | | 11,000 | | | | 11,077 | | |
Total | | | | | | | 16,233 | | |
Wireless 1.3% | |
Comcel Trust(a)
02/06/24 | | | 6.875 | % | | | 200,000 | | | | 189,000 | | |
Numericable-SFR SA(a)
05/01/26 | | | 7.375 | % | | | 175,000 | | | | 177,625 | | |
Sprint Communications, Inc.(a)
03/01/20 | | | 7.000 | % | | | 208,000 | | | | 213,460 | | |
Sprint Corp.
06/15/24 | | | 7.125 | % | | | 214,000 | | | | 160,500 | | |
T-Mobile USA, Inc.
04/01/23 | | | 6.625 | % | | | 240,000 | | | | 256,500 | | |
01/15/24 | | | 6.500 | % | | | 19,000 | | | | 20,235 | | |
01/15/26 | | | 6.500 | % | | | 77,000 | | | | 81,620 | | |
Wind Acquisition Finance SA(a)
07/15/20 | | | 4.750 | % | | | 44,000 | | | | 41,998 | | |
04/23/21 | | | 7.375 | % | | | 24,000 | | | | 21,360 | | |
Total | | | | | | | 1,162,298 | | |
Wirelines 1.0% | |
CenturyLink, Inc.
04/01/25 | | | 5.625 | % | | | 166,000 | | | | 150,768 | | |
Frontier Communications Corp.
01/15/23 | | | 7.125 | % | | | 228,000 | | | | 201,780 | | |
Frontier Communications Corp.(a)
09/15/20 | | | 8.875 | % | | | 59,000 | | | | 62,466 | | |
09/15/22 | | | 10.500 | % | | | 25,000 | | | | 25,722 | | |
09/15/25 | | | 11.000 | % | | | 50,000 | | | | 50,500 | | |
Level 3 Communications, Inc.
12/01/22 | | | 5.750 | % | | | 62,000 | | | | 63,737 | | |
Corporate Bonds & Notes (continued)
Issuer | | Coupon
Rate | | Principal
Amount ($) | | Value ($) | |
Level 3 Financing, Inc.
08/15/22 | | | 5.375 | % | | | 100,000 | | | | 102,250 | | |
Level 3 Financing, Inc.(a)
01/15/24 | | | 5.375 | % | | | 13,000 | | | | 13,195 | | |
03/15/26 | | | 5.250 | % | | | 6,000 | | | | 6,090 | | |
Telecom Italia SpA(a)
05/30/24 | | | 5.303 | % | | | 85,000 | | | | 89,037 | | |
Zayo Group LLC/Capital, Inc.
04/01/23 | | | 6.000 | % | | | 116,000 | | | | 119,190 | | |
05/15/25 | | | 6.375 | % | | | 24,000 | | | | 24,960 | | |
Zayo Group LLC/Capital, Inc.(a)
05/15/25 | | | 6.375 | % | | | 34,000 | | | | 35,360 | | |
Total | | | | | | | 945,055 | | |
Total Corporate Bonds & Notes
(Cost: $26,480,059) | | | | | | | 26,122,167 | | |
Residential Mortgage-Backed Securities — Agency 4.3%
Federal Home Loan Mortgage Corp.
01/01/45 | | | 3.500 | % | | | 631,448 | | | | 666,438 | | |
Federal Home Loan Mortgage Corp.(b)(d)
CMO IO Series 311 Class S1
08/15/43 | | | 5.517 | % | | | 3,807,103 | | | | 776,611 | | |
CMO IO Series 326 Class S2
03/15/44 | | | 5.517 | % | | | 2,948,652 | | | | 672,922 | | |
Federal Home Loan Mortgage Corp.(d)
CMO IO Series 4098 Class AI
05/15/39 | | | 3.500 | % | | | 3,369,362 | | | | 322,303 | | |
CMO IO Series 4121 Class IA
01/15/41 | | | 3.500 | % | | | 2,227,574 | | | | 282,598 | | |
Federal National Mortgage Association(b)(d)
CMO IO Series 2013-101 Class CS
10/25/43 | | | 5.461 | % | | | 1,696,345 | | | | 414,763 | | |
Federal National Mortgage Association(d)
CMO IO Series 2012-121 Class GI
08/25/39 | | | 3.500 | % | | | 476,677 | | | | 51,668 | | |
Government National Mortgage Association
CMO IO Series 2015-53 Class EI(d)
04/16/45 | | | 3.500 | % | | | 3,694,973 | | | | 758,810 | | |
Total Residential Mortgage-Backed Securities — Agency
(Cost: $4,167,802) | | | | | | | 3,946,113 | | |
Residential Mortgage-Backed Securities —
Non-Agency 4.8%
Bayview Opportunity Master Fund Trust
Series 2014-16RP Class A(a)(b)
11/28/29 | | | 3.844 | % | | | 110,962 | | | | 110,915 | | |
The accompanying Notes to Financial Statements are an integral part of this statement.
Annual Report 2016
17
COLUMBIA MULTI-ASSET INCOME FUND
PORTFOLIO OF INVESTMENTS (continued)
April 30, 2016
Residential Mortgage-Backed Securities —
Non-Agency (continued)
Issuer | | Coupon
Rate | | Principal
Amount ($) | | Value ($) | |
Citigroup Mortgage Loan Trust, Inc.(a)(b)
CMO Series 2014-C Class A
02/25/54 | | | 3.250 | % | | | 821,129 | | | | 776,108 | | |
Series 2013-11 Class 3A3
09/25/34 | | | 2.632 | % | | | 215,935 | | | | 206,087 | | |
Citigroup Mortgage Loan Trust, Inc.(b)
CMO Series 2015-A Class B3
06/25/58 | | | 4.500 | % | | | 245,096 | | | | 236,012 | | |
Citigroup Mortgage Loan Trust, Inc.(d)
CMO IO Series 2015-A Class A1IO
06/25/58 | | | 1.000 | % | | | 8,136,373 | | | | 272,104 | | |
Credit Suisse Mortgage Capital Certificates(a)
CMO Series 2010-9R Class 1A5
08/27/37 | | | 4.000 | % | | | 200,000 | | | | 195,182 | | |
Series 2010-9R Class 1A3
08/27/37 | | | 3.750 | % | | | 261,875 | | | | 262,710 | | |
Credit Suisse Mortgage Capital Certificates(a)(b)
CMO Series 2014-RPL4 Class A1
08/25/62 | | | 3.625 | % | | | 221,076 | | | | 218,164 | | |
CMO Series 2014-RPL4 Class A2
08/25/62 | | | 4.664 | % | | | 1,000,000 | | | | 968,087 | | |
Pretium Mortgage Credit Partners I
Series 2015-NPL1 Class A1(a)(b)
05/27/30 | | | 3.625 | % | | | 467,058 | | | | 462,557 | | |
RBSSP Resecuritization Trust
CMO Series 2010-1 Class 3A2(a)(b)
08/26/35 | | | 2.790 | % | | | 250,000 | | | | 241,927 | | |
VOLT XLIV LLC
CMO Series 2016-NPL4 Class A1(a)(b)
04/25/46 | | | 4.250 | % | | | 500,000 | | | | 499,559 | | |
Total Residential Mortgage-Backed Securities — Non-Agency
(Cost: $4,471,770) | | | | | | | 4,449,412 | | |
Commercial Mortgage-Backed Securities —
Non-Agency 2.3%
American Homes 4 Rent(a)(b)
Series 2014-SFR1 Class E
06/17/31 | | | 2.933 | % | | | 250,000 | | | | 238,617 | | |
Series 2014-SFR1 Class F
06/17/31 | | | 3.683 | % | | | 250,000 | | | | 237,091 | | |
BHMS Mortgage Trust
Series 2014-ATLS Class DFX(a)(b)
07/05/33 | | | 4.847 | % | | | 500,000 | | | | 480,965 | | |
Rialto Real Estate Fund LLC
Subordinated, Series 2015-LT7 Class B(a)
12/25/32 | | | 5.071 | % | | | 350,000 | | | | 349,937 | | |
Rialto Real Estate Fund LP
Series 2014-LT6 Class B(a)
09/15/24 | | | 5.486 | % | | | 625,000 | | | | 624,853 | | |
Commercial Mortgage-Backed Securities —
Non-Agency (continued)
Issuer | | Coupon
Rate | | Principal
Amount ($) | | Value ($) | |
VFC LLC
Subordinated, Series 2015-3 Class B(a)
12/20/31 | | | 4.750 | % | | | 250,000 | | | | 249,916 | | |
Total Commercial Mortgage-Backed Securities — Non-Agency
(Cost: $2,228,767) | | | | | | | 2,181,379 | | |
Asset-Backed Securities — Non-Agency 2.3%
ALM XIV Ltd.
Series 2014-14A Class C(a)(b)
07/28/26 | | | 4.084 | % | | | 500,000 | | | | 469,160 | | |
Apidos CLO XXII
Series 2015-22A Class D(a)(b)
10/20/27 | | | 6.634 | % | | | 500,000 | | | | 441,635 | | |
Carlyle Global Market Strategies CLO
Series 2015-4A Class C(a)(b)
10/20/27 | | | 4.394 | % | | | 250,000 | | | | 239,562 | | |
GFT Mortgage Loan Trust
CMO Series 2015-GFT1 Class A(a)(b)
01/25/55 | | | 3.721 | % | | | 325,368 | | | | 321,464 | | |
OZLM VII Ltd.
Series 2014-7A Class C(a)(b)
07/17/26 | | | 4.233 | % | | | 250,000 | | | | 225,591 | | |
Octagon Investment Partners XXII Ltd.
Series 2014-1A Class E1(a)(b)
11/25/25 | | | 5.885 | % | | | 250,000 | | | | 208,658 | | |
Selene Non-Performing Loans LLC
Series 2014-1A Class A(a)(b)
05/25/54 | | | 2.981 | % | | | 204,391 | | | | 202,683 | | |
Total Asset-Backed Securities — Non-Agency
(Cost: $2,196,424) | | | | | | | 2,108,753 | | |
U.S. Treasury Obligations 3.7%
U.S. Treasury
02/15/26 | | | 6.000 | % | | | 112,000 | | | | 154,494 | | |
02/15/29 | | | 5.250 | % | | | 256,000 | | | | 349,690 | | |
02/15/36 | | | 4.500 | % | | | 57,000 | | | | 77,545 | | |
02/15/38 | | | 4.375 | % | | | 170,000 | | | | 227,840 | | |
02/15/39 | | | 3.500 | % | | | 236,000 | | | | 278,646 | | |
11/15/39 | | | 4.375 | % | | | 284,000 | | | | 379,451 | | |
02/15/41 | | | 4.750 | % | | | 73,000 | | | | 102,933 | | |
08/15/42 | | | 2.750 | % | | | 397,000 | | | | 407,033 | | |
05/15/43 | | | 2.875 | % | | | 361,000 | | | | 377,809 | | |
05/15/44 | | | 3.375 | % | | | 594,000 | | | | 682,706 | | |
08/15/44 | | | 3.125 | % | | | 163,000 | | | | 178,797 | | |
11/15/44 | | | 3.000 | % | | | 163,000 | | | | 174,454 | | |
02/15/45 | | | 2.500 | % | | | 62,000 | | | | 59,898 | | |
Total U.S. Treasury Obligations
(Cost: $3,481,948) | | | | | | | 3,451,296 | | |
The accompanying Notes to Financial Statements are an integral part of this statement.
Annual Report 2016
18
COLUMBIA MULTI-ASSET INCOME FUND
PORTFOLIO OF INVESTMENTS (continued)
April 30, 2016
Foreign Government Obligations(e) 9.7%
Issuer | | Coupon
Rate | | Principal
Amount ($) | | Value ($) | |
ARGENTINA 0.5% | |
Argentina Republic Government International Bond(a)
04/22/21 | | | 6.875 | % | | | 200,000 | | | | 206,000 | | |
Provincia de Buenos Aires(a)
06/09/21 | | | 9.950 | % | | | 150,000 | | | | 163,261 | | |
Provincia de Cordoba(a)
08/17/17 | | | 12.375 | % | | | 100,000 | | | | 106,750 | | |
Total | | | | | | | 476,011 | | |
BRAZIL 0.7% | |
Brazilian Government International Bond
01/07/41 | | | 5.625 | % | | | 250,000 | | | | 219,687 | | |
01/07/25 | | | 4.250 | % | | | 300,000 | | | | 279,000 | | |
Petrobras Global Finance BV
01/27/21 | | | 5.375 | % | | | 200,000 | | | | 177,250 | | |
Total | | | | | | | 675,937 | | |
COLOMBIA 0.6% | |
Ecopetrol SA
01/16/25 | | | 4.125 | % | | | 100,000 | | | | 87,500 | | |
09/18/43 | | | 7.375 | % | | | 260,000 | | | | 241,312 | | |
06/26/26 | | | 5.375 | % | | | 200,000 | | | | 183,500 | | |
Total | | | | | | | 512,312 | | |
COSTA RICA 0.2% | |
Costa Rica Government International Bond(a)
03/12/45 | | | 7.158 | % | | | 200,000 | | | | 186,000 | | |
CROATIA 0.2% | |
Hrvatska Elektroprivreda(a)
10/23/22 | | | 5.875 | % | | | 200,000 | | | | 206,555 | | |
DOMINICAN REPUBLIC 0.7% | |
Banco de Reservas de la Republica Dominicana(a)
Subordinated
02/01/23 | | | 7.000 | % | | | 150,000 | | | | 148,500 | | |
02/01/23 | | | 7.000 | % | | | 150,000 | | | | 148,500 | | |
Dominican Republic International Bond(a)
04/20/27 | | | 8.625 | % | | | 300,000 | | | | 345,000 | | |
Total | | | | | | | 642,000 | | |
EL SALVADOR 0.1% | |
El Salvador Government International Bond(a)
01/18/27 | | | 6.375 | % | | | 120,000 | | | | 105,600 | | |
GABON 0.2% | |
Gabon Government International Bond(a)
12/12/24 | | | 6.375 | % | | | 200,000 | | | | 174,724 | | |
GEORGIA 0.2% | |
Georgian Railway JSC(a)
07/11/22 | | | 7.750 | % | | | 200,000 | | | | 216,000 | | |
Foreign Government Obligations(e) (continued)
Issuer | | Coupon
Rate | | Principal
Amount ($) | | Value ($) | |
GHANA 0.2% | |
Ghana Government International Bond(a)
01/18/26 | | | 8.125 | % | | | 200,000 | | | | 158,040 | | |
HONDURAS 0.2% | |
Honduras Government International Bond(a)
03/15/24 | | | 7.500 | % | | | 200,000 | | | | 212,000 | | |
HUNGARY 0.4% | |
Hungary Government International Bond
03/29/41 | | | 7.625 | % | | | 100,000 | | | | 141,235 | | |
MFB Magyar Fejlesztesi Bank Zrt.(a)
10/21/20 | | | 6.250 | % | | | 200,000 | | | | 221,060 | | |
Total | | | | | | | 362,295 | | |
INDONESIA 1.1% | |
PT Pertamina Persero(a)
05/27/41 | | | 6.500 | % | | | 500,000 | | | | 507,500 | | |
PT Perusahaan Listrik Negara(a)
11/22/21 | | | 5.500 | % | | | 500,000 | | | | 537,730 | | |
Total | | | | | | | 1,045,230 | | |
IVORY COAST 0.2% | |
Ivory Coast Government International Bond(a)
03/03/28 | | | 6.375 | % | | | 200,000 | | | | 190,040 | | |
KAZAKHSTAN 0.1% | |
KazMunayGas National Co. JSC(a)
07/02/18 | | | 9.125 | % | | | 100,000 | | | | 109,500 | | |
MEXICO 0.7% | |
Petroleos Mexicanos
06/02/41 | | | 6.500 | % | | | 600,000 | | | | 598,800 | | |
PAKISTAN 0.2% | |
Pakistan Government International Bond(a)
04/15/24 | | | 8.250 | % | | | 200,000 | | | | 210,627 | | |
RUSSIAN FEDERATION 1.1% | |
Gazprom Neft OAO Via GPN Capital SA(a)
09/19/22 | | | 4.375 | % | | | 200,000 | | | | 191,000 | | |
Gazprom OAO Via Gaz Capital SA(a)
02/06/28 | | | 4.950 | % | | | 200,000 | | | | 188,976 | | |
03/07/22 | | | 6.510 | % | | | 200,000 | | | | 216,386 | | |
Russian Foreign Bond — Eurobond(a)
04/04/22 | | | 4.500 | % | | | 400,000 | | | | 417,000 | | |
Total | | | | | | | 1,013,362 | | |
SENEGAL 0.2% | |
Senegal Government International Bond(a)
07/30/24 | | | 6.250 | % | | | 200,000 | | | | 188,020 | | |
The accompanying Notes to Financial Statements are an integral part of this statement.
Annual Report 2016
19
COLUMBIA MULTI-ASSET INCOME FUND
PORTFOLIO OF INVESTMENTS (continued)
April 30, 2016
Foreign Government Obligations(e) (continued)
Issuer | | Coupon
Rate | | Principal
Amount ($) | | Value ($) | |
SERBIA 0.2% | |
Serbia International Bond(a)
12/03/18 | | | 5.875 | % | | | 200,000 | | | | 211,250 | | |
TRINIDAD AND TOBAGO 0.4% | |
Petroleum Co. of Trinidad & Tobago Ltd.(a)
08/14/19 | | | 9.750 | % | | | 250,000 | | | | 260,750 | | |
08/14/19 | | | 9.750 | % | | | 100,000 | | | | 104,300 | | |
Total | | | | | | | 365,050 | | |
TURKEY 0.9% | |
Export Credit Bank of Turkey(a)
09/23/21 | | | 5.000 | % | | | 300,000 | | | | 303,000 | | |
Turkey Government International Bond
03/17/36 | | | 6.875 | % | | | 400,000 | | | | 476,500 | | |
Total | | | | | | | 779,500 | | |
VENEZUELA 0.4% | |
Petroleos de Venezuela SA(a)
05/16/24 | | | 6.000 | % | | | 700,000 | | | | 238,000 | | |
Venezuela Government International Bond(a)
10/13/19 | | | 7.750 | % | | | 100,000 | | | | 40,125 | | |
05/07/23 | | | 9.000 | % | | | 250,000 | | | | 95,313 | | |
Total | | | | | | | 373,438 | | |
Total Foreign Government Obligations
(Cost: $9,182,096) | | | | | | | 9,012,291 | | |
Equity-Linked Notes 19.9%
Issuer | | Coupon
Rate | | Shares | | Value ($) | |
BNP Paribas Arbitrage Issuance BV(a)
(linked to a basket of 40 common stocks)
11/07/16 | | | 13.260 | % | | | 3,100 | | | | 3,100,000 | | |
(linked to common stock of Archer-Daniels-Midland Co.)
07/29/16 | | | 8.350 | % | | | 248 | | | | 9,838 | | |
BNP Paribas
(linked to common stock of Intel Corp.)(a)
06/21/16 | | | 7.740 | % | | | 1,005 | | | | 30,401 | | |
Credit Suisse First Boston International AG
(linked to a basket of 40 US common stocks)(a)
07/07/16 | | | 14.070 | % | | | 3,000 | | | | 3,022,230 | | |
Deutsche Bank AG(a)
(linked to a basket of 40 common stocks)
08/05/16 | | | 14.200 | % | | | 3,000 | | | | 3,069,000 | | |
(linked to common stock of Anadarko Petroleum Corp.)
06/17/16 | | | 20.000 | % | | | 508 | | | | 26,317 | | |
(linked to common stock of CSX Corp.)
06/16/16 | | | 9.920 | % | | | 1,057 | | | | 28,235 | | |
Equity-Linked Notes (continued)
Issuer | | Coupon
Rate | | Shares | | Value ($) | |
(linked to common stock of Devon Energy Corp.)
06/17/16 | | | 29.250 | % | | | 921 | | | | 28,454 | | |
Goldman Sachs International
(linked to common stock of Eastman Chemical Co.)(a)
06/08/16 | | | 9.000 | % | | | 256 | | | | 18,268 | | |
JPMorgan Chase Bank NA
(linked to a basket of 40 common stocks)(a)
10/03/16 | | | 12.100 | % | | | 3,000 | | | | 3,035,460 | | |
Morgan Stanley BV
(linked to a basket of 40 common stocks)(a)
09/09/16 | | | 13.620 | % | | | 3,000 | | | | 3,065,220 | | |
Royal Bank of Canada(a)
(linked to common stock of Chevron Corp.)
06/03/16 | | | 11.750 | % | | | 278 | | | | 26,385 | | |
(linked to common stock of PPG Industries, Inc.)
06/03/16 | | | 5.180 | % | | | 171 | | | | 18,318 | | |
Societe Generale SA(a)
(linked to common stock of Bristol-Myers Squibb Co.)
06/20/16 | | | 6.900 | % | | | 70 | | | | 76,230 | | |
UBS AG
(linked to a basket of 40 US common stocks)(a)
06/09/16 | | | 12.900 | % | | | 3,000 | | | | 2,982,570 | | |
Total Equity-Linked Notes
(Cost: $18,346,187) | | | | | | | 18,536,926 | | |
Limited Partnerships 5.1%
Issuer | | Shares | | Value | |
ENERGY 4.8% | |
Oil, Gas & Consumable Fuels 4.8% | |
Buckeye Partners LP | | | 2,620 | | | | 188,640 | | |
Cheniere Energy Partners LP | | | 6,620 | | | | 193,105 | | |
DCP Midstream Partners LP | | | 10,835 | | | | 353,979 | | |
Energy Transfer Partners LP | | | 13,813 | | | | 489,395 | | |
Enterprise Products Partners LP | | | 23,915 | | | | 638,291 | | |
| MPLX LP | | | 11,308 | | | | 364,005 | | |
PBF Logistics LP | | | 18,293 | | | | 394,214 | | |
Phillips 66 Partners LP | | | 4,000 | | | | 228,960 | | |
Plains All American Pipeline LP | | | 12,500 | | | | 286,750 | | |
Sunoco Logistics Partners LP | | | 6,198 | | | | 181,477 | | |
Tesoro Logistics LP | | | 6,298 | | | | 291,220 | | |
Valero Energy Partners LP | | | 4,713 | | | | 224,763 | | |
Western Gas Partners LP | | | 6,171 | | | | 301,515 | | |
The accompanying Notes to Financial Statements are an integral part of this statement.
Annual Report 2016
20
COLUMBIA MULTI-ASSET INCOME FUND
PORTFOLIO OF INVESTMENTS (continued)
April 30, 2016
Limited Partnerships (continued)
Issuer | | Shares | | Value ($) | |
Williams Partners LP | | | 11,481 | | | | 347,071 | | |
Total | | | | | 4,483,385 | | |
Total Energy | | | | | 4,483,385 | | |
UTILITIES 0.3% | |
Gas Utilities 0.3% | |
AmeriGas Partners LP | | | 6,986 | | | | 302,843 | | |
Total Utilities | | | | | 302,843 | | |
Total Limited Partnerships
(Cost: $5,697,540) | | | | | 4,786,228 | | |
Money Market Funds 3.6%
| | | Shares | | Value ($) | |
Columbia Short-Term Cash Fund,
0.422%(f)(g) | | | 3,386,008 | | | | 3,386,008 | | |
Total Money Market Funds
(Cost: $3,386,008) | | | | | 3,386,008 | | |
Total Investments
(Cost: $94,194,619) | | | | | 92,300,728 | | |
Other Assets & Liabilities, Net | | | | | 698,354 | | |
Net Assets | | | | | 92,999,082 | | |
At April 30, 2016, cash totaling $296,500 was pledged as collateral.
Investments in Derivatives
Futures Contracts Outstanding at April 30, 2016
Long Futures Contracts Outstanding
Contract Description | | Number of
Contracts | | Trading
Currency | | Notional
Market
Value ($) | | Expiration
Date | | Unrealized
Appreciation ($) | | Unrealized
(Depreciation) ($) | |
S&P 500 E-mini | | | 57 | | | USD | | | | | 5,868,435 | | | 06/2016 | | | 37,657 | | | | — | | |
U.S. Treasury 10-Year Note | | | 32 | | | USD | | | | | 4,162,000 | | | 06/2016 | | | — | | | | (11,053 | ) | |
Total | | | | | | | 10,030,435 | | | | | | 37,657 | | | | (11,053 | ) | |
Notes to Portfolio of Investments
(a) Represents privately placed and other securities and instruments exempt from SEC registration (collectively, private placements), such as Section 4(a)(2) and Rule 144A eligible securities, which are often sold only to qualified institutional buyers. The Fund may invest in private placements determined to be liquid as well as those determined to be illiquid. Private placements may be determined to be liquid under guidelines established by the Fund's Board of Trustees. At April 30, 2016, the value of these securities amounted to $44,486,868 or 47.84% of net assets.
(b) Variable rate security.
(c) Security, or a portion thereof, has been purchased on a when-issued or delayed delivery basis.
(d) Interest Only (IO) represents the right to receive the monthly interest payments on an underlying pool of mortgage loans.
(e) Principal and interest may not be guaranteed by the government.
(f) The rate shown is the seven-day current annualized yield at April 30, 2016.
(g) As defined in the Investment Company Act of 1940, an affiliated company is one in which the Fund owns 5% or more of the company's outstanding voting securities, or a company which is under common ownership or control with the Fund. Holdings and transactions in these affiliated companies during the year ended April 30, 2016 are as follows:
Issuer | | Beginning
Cost ($) | | Purchase
Cost ($) | | Proceeds
From Sales ($) | | Ending
Cost ($) | | Dividends —
Affiliated
Issuers ($) | | Value ($) | |
Columbia Short-Term Cash Fund | | | 4,177,778 | | | | 61,078,216 | | | | (61,869,986 | ) | | | 3,386,008 | | | | 7,854 | | | | 3,386,008 | | |
The accompanying Notes to Financial Statements are an integral part of this statement.
Annual Report 2016
21
COLUMBIA MULTI-ASSET INCOME FUND
PORTFOLIO OF INVESTMENTS (continued)
April 30, 2016
ADR American Depositary Receipt
CMO Collateralized Mortgage Obligation
PIK Payment-in-Kind
Currency Legend
USD US Dollar
Fair Value Measurements
The Fund categorizes its fair value measurements according to a three-level hierarchy that maximizes the use of observable inputs and minimizes the use of unobservable inputs by prioritizing that the most observable input be used when available. Observable inputs are those that market participants would use in pricing an investment based on market data obtained from sources independent of the reporting entity. Unobservable inputs are those that reflect the Fund's assumptions about the information market participants would use in pricing an investment. An investment's level within the fair value hierarchy is based on the lowest level of any input that is deemed significant to the asset's or liability's fair value measurement. The input levels are not necessarily an indication of the risk or liquidity associated with investments at that level. For example, certain U.S. government securities are generally high quality and liquid, however, they are reflected as Level 2 because the inputs used to determine fair value may not always be quoted prices in an active market.
Fair value inputs are summarized in the three broad levels listed below:
> Level 1 — Valuations based on quoted prices for investments in active markets that the Fund has the ability to access at the measurement date (including NAV for open-end mutual funds). Valuation adjustments are not applied to Level 1 investments.
> Level 2 — Valuations based on other significant observable inputs (including quoted prices for similar securities, interest rates, prepayment speeds, credit risks, etc.).
> Level 3 — Valuations based on significant unobservable inputs (including the Fund's own assumptions and judgment in determining the fair value of investments).
Inputs that are used in determining fair value of an investment may include price information, credit data, volatility statistics, and other factors. These inputs can be either observable or unobservable. The availability of observable inputs can vary between investments, and is affected by various factors such as the type of investment, and the volume and level of activity for that investment or similar investments in the marketplace. The inputs will be considered by the Investment Manager, along with any other relevant factors in the calculation of an investment's fair value. The Fund uses prices and inputs that are current as of the measurement date, which may include periods of market dislocations. During these periods, the availability of prices and inputs may be reduced for many investments. This condition could cause an investment to be reclassified between the various levels within the hierarchy.
Foreign equity securities actively traded in markets where there is a significant delay in the local close relative to the New York Stock Exchange (NYSE) are classified as Level 2. The values of these securities may include an adjustment to reflect the impact of significant market movements following the close of local trading, as described in Note 2 to the financial statements — Security Valuation.
Certain investments that have been measured at fair value using the net asset value per share (or its equivalent) are not categorized in the fair value hierarchy. The fair value amounts presented in the table are intended to reconcile the fair value hierarchy to the amounts presented in the Portfolio of Investments. The Columbia Short-Term Cash Fund seeks to provide shareholders with maximum current income consistent with liquidity and stability of principal. Investments in Columbia Short-Term Cash Fund may be redeemed on a daily basis without restriction.
Investments falling into the Level 3 category are primarily supported by quoted prices from brokers and dealers participating in the market for those investments. However, these may be classified as Level 3 investments due to lack of market transparency and corroboration to support these quoted prices. Additionally, valuation models may be used as the pricing source for any remaining investments classified as Level 3. These models may rely on one or more significant unobservable inputs and/or significant assumptions by the Investment Manager. Inputs used in valuations may include, but are not limited to, financial statement analysis, capital account balances, discount rates and estimated cash flows, and comparable company data.
Under the direction of the Fund's Board of Trustees (the Board), the Investment Manager's Valuation Committee (the Committee) is responsible for overseeing the valuation procedures approved by the Board. The Committee consists of voting and non-voting members from various groups within the Investment Manager's organization, including operations and accounting, trading and investments, compliance, risk management and legal.
The Committee meets at least monthly to review and approve valuation matters, which may include a description of specific valuation determinations, data regarding pricing information received from approved pricing vendors and brokers and the results of Board-approved valuation control policies and procedures (the Policies). The Policies address, among other things, instances when market quotations are or are not readily available, including recommendations of third party pricing vendors and a determination of appropriate pricing methodologies; events that require specific valuation determinations and assessment of fair value techniques; securities with a potential for stale pricing,
The accompanying Notes to Financial Statements are an integral part of this statement.
Annual Report 2016
22
COLUMBIA MULTI-ASSET INCOME FUND
PORTFOLIO OF INVESTMENTS (continued)
April 30, 2016
Fair Value Measurements (continued)
including those that are illiquid, restricted, or in default; and the effectiveness of third party pricing vendors, including periodic reviews of vendors. The Committee meets more frequently, as needed, to discuss additional valuation matters, which may include the need to review back-testing results, review time-sensitive information or approve related valuation actions. The Committee reports to the Board, with members of the Committee meeting with the Board at each of its regularly scheduled meetings to discuss valuation matters and actions during the period, similar to those described earlier.
For investments categorized as Level 3, the Committee monitors information similar to that described above, which may include: (i) data specific to the issuer or comparable issuers, (ii) general market or specific sector news and (iii) quoted prices and specific or similar security transactions. The Committee considers this data and any changes from prior periods in order to assess the reasonableness of observable and unobservable inputs, any assumptions or internal models used to value those securities and changes in fair value. This data is also used to corroborate, when available, information received from approved pricing vendors and brokers. Various factors impact the frequency of monitoring this information (which may occur as often as daily). However, the Committee may determine that changes to inputs, assumptions and models are not required as a result of the monitoring procedures performed.
The following table is a summary of the inputs used to value the Fund's investments at April 30, 2016:
| | | Level 1
Quoted Prices in Active
Markets for Identical
Assets ($) | | Level 2
Other Significant
Observable Inputs ($) | | Level 3
Significant
Unobservable Inputs ($) | | Total ($) | |
Investments | |
Common Stocks | |
Consumer Discretionary | | | 196,071 | | | | 60,988 | | | | — | | | | 257,059 | | |
Consumer Staples | | | 680,366 | | | | 110,038 | | | | — | | | | 790,404 | | |
Energy | | | 1,318,607 | | | | 146,560 | | | | — | | | | 1,465,167 | | |
Financials | | | 2,453,784 | | | | 50,056 | | | | — | | | | 2,503,840 | | |
Health Care | | | 584,909 | | | | 29,142 | | | | — | | | | 614,051 | | |
Industrials | | | 223,375 | | | | 26,697 | | | | — | | | | 250,072 | | |
Information Technology | | | 619,731 | | | | 21,102 | | | | — | | | | 640,833 | | |
Materials | | | 167,747 | | | | 34,616 | | | | — | | | | 202,363 | | |
Telecommunication Services | | | 431,938 | | | | 93,720 | | | | — | | | | 525,658 | | |
Utilities | | | 383,448 | | | | — | | | | — | | | | 383,448 | | |
Total Common Stocks | | | 7,059,976 | | | | 572,919 | | | | — | | | | 7,632,895 | | |
Exchange-Traded Funds | | | 6,687,260 | | | | — | | | | — | | | | 6,687,260 | | |
Corporate Bonds & Notes | | | — | | | | 26,122,167 | | | | — | | | | 26,122,167 | | |
Residential Mortgage-Backed
Securities — Agency | | | — | | | | 3,946,113 | | | | — | | | | 3,946,113 | | |
Residential Mortgage-Backed
Securities — Non-Agency | | | — | | | | 4,449,412 | | | | — | | | | 4,449,412 | | |
Commercial Mortgage-Backed
Securities — Non-Agency | | | — | | | | 2,181,379 | | | | — | | | | 2,181,379 | | |
Asset-Backed Securities — Non-Agency | | | — | | | | 1,787,289 | | | | 321,464 | | | | 2,108,753 | | |
U.S. Treasury Obligations | | | 3,451,296 | | | | — | | | | — | | | | 3,451,296 | | |
Foreign Government Obligations | | | — | | | | 9,012,291 | | | | — | | | | 9,012,291 | | |
Equity-Linked Notes | | | — | | | | 18,536,926 | | | | — | | | | 18,536,926 | | |
Limited Partnerships | |
Energy | | | 4,483,385 | | | | — | | | | — | | | | 4,483,385 | | |
Utilities | | | 302,843 | | | | — | | | | — | | | | 302,843 | | |
Total Limited Partnerships | | | 4,786,228 | | | | — | | | | — | | | | 4,786,228 | | |
The accompanying Notes to Financial Statements are an integral part of this statement.
Annual Report 2016
23
COLUMBIA MULTI-ASSET INCOME FUND
PORTFOLIO OF INVESTMENTS (continued)
April 30, 2016
Fair Value Measurements (continued)
| | | Level 1
Quoted Prices in Active
Markets for Identical
Assets ($) | | Level 2
Other Significant
Observable Inputs ($) | | Level 3
Significant
Unobservable Inputs ($) | | Total ($) | |
Investments measured at net asset value | |
Money Market Funds | | | — | | | | — | | | | — | | | | 3,386,008 | | |
Total Investments | | | 21,984,760 | | | | 66,608,496 | | | | 321,464 | | | | 92,300,728 | | |
Derivatives | |
Assets | |
Futures Contracts | | | 37,657 | | | | — | | | | — | | | | 37,657 | | |
Liabilities | |
Futures Contracts | | | (11,053 | ) | | | — | | | | — | | | | (11,053 | ) | |
Total | | | 22,011,364 | | | | 66,608,496 | | | | 321,464 | | | | 92,327,332 | | |
See the Portfolio of Investments for all investment classifications not indicated in the table.
The Fund's assets assigned to the Level 2 input category are generally valued using the market approach, in which a security's value is determined through reference to prices and information from market transactions for similar or identical assets. These assets include certain foreign securities for which a third party statistical pricing service may be employed for purposes of fair market valuation. The model utilized by such third party statistical pricing service takes into account a security's correlation to available market data including, but not limited to, intraday index, ADR, and exchange-traded fund movements.
Derivative instruments are valued at unrealized appreciation (depreciation).
There were no transfers of financial assets between Levels 1 and 2 during the period.
The Fund does not hold any significant investments (greater than one percent of net assets) categorized as Level 3.
The Fund's assets assigned to the Level 3 category are valued utilizing the valuation technique deemed the most appropriate in the circumstances. Certain asset backed securities classified as Level 3 securities are valued using the market approach and utilize single market quotations from broker dealers which may have included, but were not limited to, observable transactions for identical or similar assets in the market and the distressed nature of the security. The appropriateness of fair values for these securities is monitored on an ongoing basis which may include results of back testing, manual price reviews and other control procedures. Significant increases (decreases) to any of these inputs would result in a significantly lower (higher) fair value measurement.
Financial assets were transferred from Level 3 to Level 2 as observable market inputs were utilized and management determined that there was sufficient, reliable and observable market data to value these assets as of period end.
Transfers In | | Transfers Out | |
| Level 2 ($) | | Level 3 ($) | | Level 2 ($) | | Level 3 ($) | |
| | 780,000 | | | | — | | | | — | | | | 780,000 | | |
Transfers into and/or out of Level 3 are determined based on the fair value at the beginning of the period for security positions held throughout the period.
The accompanying Notes to Financial Statements are an integral part of this statement.
Annual Report 2016
24
COLUMBIA MULTI-ASSET INCOME FUND
STATEMENT OF ASSETS AND LIABILITIES
April 30, 2016
Assets | |
Investments, at value | |
Unaffiliated issuers (identified cost $90,808,611) | | $ | 88,914,720 | | |
Affiliated issuers (identified cost $3,386,008) | | | 3,386,008 | | |
Total investments (identified cost $94,194,619) | | | 92,300,728 | | |
Margin deposits | | | 296,500 | | |
Receivable for: | |
Investments sold | | | 2,962,246 | | |
Investments sold on a delayed delivery basis | | | 34,223 | | |
Dividends | | | 65,662 | | |
Interest | | | 899,215 | | |
Foreign tax reclaims | | | 5,537 | | |
Variation margin | | | 3,500 | | |
Expense reimbursement due from Investment Manager | | | 1,039 | | |
Prepaid expenses | | | 200 | | |
Trustees' deferred compensation plan | | | 3,175 | | |
Total assets | | | 96,572,025 | | |
Liabilities | |
Payable for: | |
Investments purchased | | | 3,365,605 | | |
Investments purchased on a delayed delivery basis | | | 110,495 | | |
Variation margin | | | 37,905 | | |
Investment management fees | | | 1,679 | | |
Distribution and/or service fees | | | 4 | | |
Transfer agent fees | | | 35 | | |
Chief compliance officer expenses | | | 3 | | |
Other expenses | | | 54,042 | | |
Trustees' deferred compensation plan | | | 3,175 | | |
Total liabilities | | | 3,572,943 | | |
Net assets applicable to outstanding capital stock | | $ | 92,999,082 | | |
Represented by | |
Paid-in capital | | $ | 98,176,487 | | |
Undistributed net investment income | | | 375,985 | | |
Accumulated net realized loss | | | (3,686,239 | ) | |
Unrealized appreciation (depreciation) on: | |
Investments | | | (1,893,891 | ) | |
Foreign currency translations | | | 136 | | |
Futures contracts | | | 26,604 | | |
Total — representing net assets applicable to outstanding capital stock | | $ | 92,999,082 | | |
The accompanying Notes to Financial Statements are an integral part of this statement.
Annual Report 2016
25
COLUMBIA MULTI-ASSET INCOME FUND
STATEMENT OF ASSETS AND LIABILITIES (continued)
April 30, 2016
Class A | |
Net assets | | $ | 137,713 | | |
Shares outstanding | | | 14,601 | | |
Net asset value per share | | $ | 9.43 | | |
Maximum offering price per share(a) | | $ | 9.90 | | |
Class C | |
Net assets | | $ | 101,369 | | |
Shares outstanding | | | 10,746 | | |
Net asset value per share | | $ | 9.43 | | |
Class I | |
Net assets | | $ | 92,418,789 | | |
Shares outstanding | | | 9,796,596 | | |
Net asset value per share | | $ | 9.43 | | |
Class R4 | |
Net assets | | $ | 9,433 | | |
Shares outstanding | | | 1,000 | | |
Net asset value per share | | $ | 9.43 | | |
Class R5 | |
Net assets | | $ | 9,434 | | |
Shares outstanding | | | 1,000 | | |
Net asset value per share | | $ | 9.43 | | |
Class W | |
Net assets | | $ | 9,434 | | |
Shares outstanding | | | 1,000 | | |
Net asset value per share | | $ | 9.43 | | |
Class Z | |
Net assets | | $ | 312,910 | | |
Shares outstanding | | | 33,167 | | |
Net asset value per share | | $ | 9.43 | | |
(a) The maximum offering price per share is calculated by dividing the net asset value per share by 1.0 minus the maximum sales charge of 4.75%.
The accompanying Notes to Financial Statements are an integral part of this statement.
Annual Report 2016
26
COLUMBIA MULTI-ASSET INCOME FUND
STATEMENT OF OPERATIONS
Year Ended April 30, 2016
Net investment income | |
Income: | |
Dividends — unaffiliated issuers | | $ | 1,068,798 | | |
Dividends — affiliated issuers | | | 7,854 | | |
Interest | | | 4,867,457 | | |
Foreign taxes withheld | | | (6,029 | ) | |
Total income | | | 5,938,080 | | |
Expenses: | |
Investment management fees | | | 591,217 | | |
Distribution and/or service fees | |
Class A | | | 120 | | |
Class C | | | 657 | | |
Class W | | | 23 | | |
Transfer agent fees | |
Class A | | | 53 | | |
Class C | | | 69 | | |
Class R4 | | | 8 | | |
Class R5 | | | 5 | | |
Class W | | | 8 | | |
Class Z | | | 297 | | |
Compensation of board members | | | 15,941 | | |
Custodian fees | | | 47,483 | | |
Printing and postage fees | | | 17,778 | | |
Registration fees | | | 67,999 | | |
Audit fees | | | 39,171 | | |
Legal fees | | | 2,682 | | |
Offering costs | | | 93,237 | | |
Chief compliance officer expenses | | | 43 | | |
Other | | | 25,514 | | |
Total expenses | | | 902,305 | | |
Fees waived or expenses reimbursed by Investment Manager and its affiliates | | | (411,083 | ) | |
Total net expenses | | | 491,222 | | |
Net investment income | | | 5,446,858 | | |
Realized and unrealized gain (loss) — net | |
Net realized gain (loss) on: | |
Investments | | | (3,868,005 | ) | |
Foreign currency translations | | | (886 | ) | |
Futures contracts | | | 190,209 | | |
Net realized loss | | | (3,678,682 | ) | |
Net change in unrealized appreciation (depreciation) on: | |
Investments | | | (2,051,503 | ) | |
Foreign currency translations | | | (44 | ) | |
Futures contracts | | | 26,604 | | |
Net change in unrealized depreciation | | | (2,024,943 | ) | |
Net realized and unrealized loss | | | (5,703,625 | ) | |
Net decrease in net assets from operations | | $ | (256,767 | ) | |
The accompanying Notes to Financial Statements are an integral part of this statement.
Annual Report 2016
27
COLUMBIA MULTI-ASSET INCOME FUND
STATEMENT OF CHANGES IN NET ASSETS
| | | Year Ended
April 30,
2016 | | Year Ended
April 30,
2015(a) | |
Operations | |
Net investment income | | $ | 5,446,858 | | | $ | 277,235 | | |
Net realized gain (loss) | | | (3,678,682 | ) | | | 268,944 | | |
Net change in unrealized appreciation (depreciation) | | | (2,024,943 | ) | | | 157,792 | | |
Net increase (decrease) in net assets resulting from operations | | | (256,767 | ) | | | 703,971 | | |
Distributions to shareholders | |
Net investment income | |
Class A | | | (2,908 | ) | | | (19 | ) | |
Class C | | | (3,416 | ) | | | (11 | ) | |
Class I | | | (5,385,064 | ) | | | (213,117 | ) | |
Class R4 | | | (561 | ) | | | (22 | ) | |
Class R5 | | | (564 | ) | | | (23 | ) | |
Class W | | | (537 | ) | | | (19 | ) | |
Class Z | | | (18,023 | ) | | | (701 | ) | |
Total distributions to shareholders | | | (5,411,073 | ) | | | (213,912 | ) | |
Increase in net assets from capital stock activity | | | 5,620,509 | | | | 92,486,354 | | |
Total increase (decrease) in net assets | | | (47,331 | ) | | | 92,976,413 | | |
Net assets at beginning of year | | | 93,046,413 | | | | 70,000 | | |
Net assets at end of year | | $ | 92,999,082 | | | $ | 93,046,413 | | |
Undistributed net investment income | | $ | 375,985 | | | $ | 61,516 | | |
(a) Based on operations from March 27, 2015 (commencement of operations) through the stated period end.
The accompanying Notes to Financial Statements are an integral part of this statement.
Annual Report 2016
28
COLUMBIA MULTI-ASSET INCOME FUND
STATEMENT OF CHANGES IN NET ASSETS (continued)
| | | Year Ended April 30, 2016 | | Year Ended April 30, 2015(a) | |
| | | Shares | | Dollars ($) | | Shares | | Dollars ($) | |
Capital stock activity | |
Class A shares | |
Subscriptions | | | 19,017 | | | | 177,010 | | | | — | | | | — | | |
Distributions reinvested | | | 256 | | | | 2,371 | | | | — | | | | — | | |
Redemptions | | | (5,672 | ) | | | (53,313 | ) | | | — | | | | — | | |
Net increase | | | 13,601 | | | | 126,068 | | | | — | | | | — | | |
Class C shares | |
Subscriptions | | | 9,746 | | | | 92,484 | | | | — | | | | — | | |
Distributions reinvested | | | 319 | | | | 2,950 | | | | — | | | | — | | |
Redemptions | | | (319 | ) | | | (2,950 | ) | | | — | | | | — | | |
Net increase | | | 9,746 | | | | 92,484 | | | | — | | | | — | | |
Class I shares | |
Subscriptions | | | — | | | | — | | | | 9,197,000 | | | | 91,970,001 | | |
Distributions reinvested | | | 577,518 | | | | 5,384,495 | | | | 21,078 | | | | 213,094 | | |
Net increase | | | 577,518 | | | | 5,384,495 | | | | 9,218,078 | | | | 92,183,095 | | |
Class Z shares | |
Subscriptions | | | — | | | | — | | | | 30,228 | | | | 302,581 | | |
Distributions reinvested | | | 1,872 | | | | 17,462 | | | | 67 | | | | 678 | | |
Net increase | | | 1,872 | | | | 17,462 | | | | 30,295 | | | | 303,259 | | |
Total net increase | | | 602,737 | | | | 5,620,509 | | | | 9,248,373 | | | | 92,486,354 | | |
(a) Based on operations from March 27, 2015 (commencement of operations) through the stated period end.
The accompanying Notes to Financial Statements are an integral part of this statement.
Annual Report 2016
29
COLUMBIA MULTI-ASSET INCOME FUND
The following tables are intended to help you understand the Fund's financial performance. Certain information reflects financial results for a single share of a class held for the periods shown. Per share net investment income (loss) amounts are calculated based on average shares outstanding during the period. Total return assumes reinvestment of all dividends and distributions, if any. Total return does not reflect payment of sales charges, if any. Total return and portfolio turnover are not annualized for periods of less than one year. The portfolio turnover rate is calculated without regard to purchase and sales transactions of short-term instruments and certain derivatives, if any. If such transactions were included, the Fund's portfolio turnover rate may be higher.
| | | Year Ended April 30, | |
Class A | | 2016 | | 2015(a) | |
Per share data | |
Net asset value, beginning of period | | $ | 10.05 | | | $ | 10.00 | | |
Income from investment operations: | |
Net investment income | | | 0.57 | | | | 0.03 | | |
Net realized and unrealized gain (loss) | | | (0.65 | ) | | | 0.04 | | |
Total from investment operations | | | (0.08 | ) | | | 0.07 | | |
Less distributions to shareholders: | |
Net investment income | | | (0.54 | ) | | | (0.02 | ) | |
Total distributions to shareholders | | | (0.54 | ) | | | (0.02 | ) | |
Net asset value, end of period | | $ | 9.43 | | | $ | 10.05 | | |
Total return | | | (0.62 | %) | | | 0.69 | % | |
Ratios to average net assets(b) | |
Total gross expenses | | | 1.34 | % | | | 1.24 | %(c) | |
Total net expenses(d) | | | 0.91 | % | | | 0.75 | %(c) | |
Net investment income | | | 6.15 | % | | | 2.70 | %(c) | |
Supplemental data | |
Net assets, end of period (in thousands) | | $ | 138 | | | $ | 10 | | |
Portfolio turnover | | | 70 | % | | | 30 | % | |
Notes to Financial Highlights
(a) Based on operations from March 27, 2015 (commencement of operations) through the stated period end.
(b) In addition to the fees and expenses that the Fund bears directly, the Fund indirectly bears a pro rata share of the fees and expenses of any other funds in which it invests. Such indirect expenses are not included in the Fund's reported expense ratios.
(c) Annualized.
(d) Total net expenses include the impact of certain fee waivers/expense reimbursements made by the Investment Manager and certain of its affiliates, if applicable.
The accompanying Notes to Financial Statements are an integral part of this statement.
Annual Report 2016
30
COLUMBIA MULTI-ASSET INCOME FUND
FINANCIAL HIGHLIGHTS (continued)
| | | Year Ended April 30, | |
Class C | | 2016 | | 2015(a) | |
Per share data | |
Net asset value, beginning of period | | $ | 10.05 | | | $ | 10.00 | | |
Income from investment operations: | |
Net investment income | | | 0.48 | | | | 0.02 | | |
Net realized and unrealized gain (loss) | | | (0.63 | ) | | | 0.04 | | |
Total from investment operations | | | (0.15 | ) | | | 0.06 | | |
Less distributions to shareholders: | |
Net investment income | | | (0.47 | ) | | | (0.01 | ) | |
Total distributions to shareholders | | | (0.47 | ) | | | (0.01 | ) | |
Net asset value, end of period | | $ | 9.43 | | | $ | 10.05 | | |
Total return | | | (1.37 | %) | | | 0.61 | % | |
Ratios to average net assets(b) | |
Total gross expenses | | | 2.12 | % | | | 1.99 | %(c) | |
Total net expenses(d) | | | 1.65 | % | | | 1.50 | %(c) | |
Net investment income | | | 5.24 | % | | | 2.00 | %(c) | |
Supplemental data | |
Net assets, end of period (in thousands) | | $ | 101 | | | $ | 10 | | |
Portfolio turnover | | | 70 | % | | | 30 | % | |
Notes to Financial Highlights
(a) Based on operations from March 27, 2015 (commencement of operations) through the stated period end.
(b) In addition to the fees and expenses that the Fund bears directly, the Fund indirectly bears a pro rata share of the fees and expenses of any other funds in which it invests. Such indirect expenses are not included in the Fund's reported expense ratios.
(c) Annualized.
(d) Total net expenses include the impact of certain fee waivers/expense reimbursements made by the Investment Manager and certain of its affiliates, if applicable.
The accompanying Notes to Financial Statements are an integral part of this statement.
Annual Report 2016
31
COLUMBIA MULTI-ASSET INCOME FUND
FINANCIAL HIGHLIGHTS (continued)
| | | Year Ended April 30, | |
Class I | | 2016 | | 2015(a) | |
Per share data | |
Net asset value, beginning of period | | $ | 10.05 | | | $ | 10.00 | | |
Income from investment operations: | |
Net investment income | | | 0.57 | | | | 0.03 | | |
Net realized and unrealized gain (loss) | | | (0.62 | ) | | | 0.04 | | |
Total from investment operations | | | (0.05 | ) | | | 0.07 | | |
Less distributions to shareholders: | |
Net investment income | | | (0.57 | ) | | | (0.02 | ) | |
Total distributions to shareholders | | | (0.57 | ) | | | (0.02 | ) | |
Net asset value, end of period | | $ | 9.43 | | | $ | 10.05 | | |
Total return | | | (0.29 | %) | | | 0.73 | % | |
Ratios to average net assets(b) | |
Total gross expenses | | | 1.01 | % | | | 0.92 | %(c) | |
Total net expenses(d) | | | 0.55 | % | | | 0.42 | %(c) | |
Net investment income | | | 6.09 | % | | | 3.50 | %(c) | |
Supplemental data | |
Net assets, end of period (in thousands) | | $ | 92,419 | | | $ | 92,681 | | |
Portfolio turnover | | | 70 | % | | | 30 | % | |
Notes to Financial Highlights
(a) Based on operations from March 27, 2015 (commencement of operations) through the stated period end.
(b) In addition to the fees and expenses that the Fund bears directly, the Fund indirectly bears a pro rata share of the fees and expenses of any other funds in which it invests. Such indirect expenses are not included in the Fund's reported expense ratios.
(c) Annualized.
(d) Total net expenses include the impact of certain fee waivers/expense reimbursements made by the Investment Manager and certain of its affiliates, if applicable.
The accompanying Notes to Financial Statements are an integral part of this statement.
Annual Report 2016
32
COLUMBIA MULTI-ASSET INCOME FUND
FINANCIAL HIGHLIGHTS (continued)
| | | Year Ended April 30, | |
Class R4 | | 2016 | | 2015(a) | |
Per share data | |
Net asset value, beginning of period | | $ | 10.05 | | | $ | 10.00 | | |
Income from investment operations: | |
Net investment income | | | 0.56 | | | | 0.03 | | |
Net realized and unrealized gain (loss) | | | (0.62 | ) | | | 0.04 | | |
Total from investment operations | | | (0.06 | ) | | | 0.07 | | |
Less distributions to shareholders: | |
Net investment income | | | (0.56 | ) | | | (0.02 | ) | |
Total distributions to shareholders | | | (0.56 | ) | | | (0.02 | ) | |
Net asset value, end of period | | $ | 9.43 | | | $ | 10.05 | | |
Total return | | | (0.36 | %) | | | 0.71 | % | |
Ratios to average net assets(b) | |
Total gross expenses | | | 1.10 | % | | | 0.99 | %(c) | |
Total net expenses(d) | | | 0.64 | % | | | 0.50 | %(c) | |
Net investment income | | | 5.99 | % | | | 3.00 | %(c) | |
Supplemental data | |
Net assets, end of period (in thousands) | | $ | 9 | | | $ | 10 | | |
Portfolio turnover | | | 70 | % | | | 30 | % | |
Notes to Financial Highlights
(a) Based on operations from March 27, 2015 (commencement of operations) through the stated period end.
(b) In addition to the fees and expenses that the Fund bears directly, the Fund indirectly bears a pro rata share of the fees and expenses of any other funds in which it invests. Such indirect expenses are not included in the Fund's reported expense ratios.
(c) Annualized.
(d) Total net expenses include the impact of certain fee waivers/expense reimbursements made by the Investment Manager and certain of its affiliates, if applicable.
The accompanying Notes to Financial Statements are an integral part of this statement.
Annual Report 2016
33
COLUMBIA MULTI-ASSET INCOME FUND
FINANCIAL HIGHLIGHTS (continued)
| | | Year Ended April 30, | |
Class R5 | | 2016 | | 2015(a) | |
Per share data | |
Net asset value, beginning of period | | $ | 10.05 | | | $ | 10.00 | | |
Income from investment operations: | |
Net investment income | | | 0.57 | | | | 0.03 | | |
Net realized and unrealized gain (loss) | | | (0.63 | ) | | | 0.04 | | |
Total from investment operations | | | (0.06 | ) | | | 0.07 | | |
Less distributions to shareholders: | |
Net investment income | | | (0.56 | ) | | | (0.02 | ) | |
Total distributions to shareholders | | | (0.56 | ) | | | (0.02 | ) | |
Net asset value, end of period | | $ | 9.43 | | | $ | 10.05 | | |
Total return | | | (0.34 | %) | | | 0.73 | % | |
Ratios to average net assets(b) | |
Total gross expenses | | | 1.06 | % | | | 0.97 | %(c) | |
Total net expenses(d) | | | 0.60 | % | | | 0.47 | %(c) | |
Net investment income | | | 6.03 | % | | | 3.02 | %(c) | |
Supplemental data | |
Net assets, end of period (in thousands) | | $ | 9 | | | $ | 10 | | |
Portfolio turnover | | | 70 | % | | | 30 | % | |
Notes to Financial Highlights
(a) Based on operations from March 27, 2015 (commencement of operations) through the stated period end.
(b) In addition to the fees and expenses that the Fund bears directly, the Fund indirectly bears a pro rata share of the fees and expenses of any other funds in which it invests. Such indirect expenses are not included in the Fund's reported expense ratios.
(c) Annualized.
(d) Total net expenses include the impact of certain fee waivers/expense reimbursements made by the Investment Manager and certain of its affiliates, if applicable.
The accompanying Notes to Financial Statements are an integral part of this statement.
Annual Report 2016
34
COLUMBIA MULTI-ASSET INCOME FUND
FINANCIAL HIGHLIGHTS (continued)
| | | Year Ended April 30, | |
Class W | | 2016 | | 2015(a) | |
Per share data | |
Net asset value, beginning of period | | $ | 10.05 | | | $ | 10.00 | | |
Income from investment operations: | |
Net investment income | | | 0.54 | | | | 0.03 | | |
Net realized and unrealized gain (loss) | | | (0.62 | ) | | | 0.04 | | |
Total from investment operations | | | (0.08 | ) | | | 0.07 | | |
Less distributions to shareholders: | |
Net investment income | | | (0.54 | ) | | | (0.02 | ) | |
Total distributions to shareholders | | | (0.54 | ) | | | (0.02 | ) | |
Net asset value, end of period | | $ | 9.43 | | | $ | 10.05 | | |
Total return | | | (0.62 | %) | | | 0.69 | % | |
Ratios to average net assets(b) | |
Total gross expenses | | | 1.35 | % | | | 1.24 | %(c) | |
Total net expenses(d) | | | 0.89 | % | | | 0.75 | %(c) | |
Net investment income | | | 5.75 | % | | | 2.75 | %(c) | |
Supplemental data | |
Net assets, end of period (in thousands) | | $ | 9 | | | $ | 10 | | |
Portfolio turnover | | | 70 | % | | | 30 | % | |
Notes to Financial Highlights
(a) Based on operations from March 27, 2015 (commencement of operations) through the stated period end.
(b) In addition to the fees and expenses that the Fund bears directly, the Fund indirectly bears a pro rata share of the fees and expenses of any other funds in which it invests. Such indirect expenses are not included in the Fund's reported expense ratios.
(c) Annualized.
(d) Total net expenses include the impact of certain fee waivers/expense reimbursements made by the Investment Manager and certain of its affiliates, if applicable.
The accompanying Notes to Financial Statements are an integral part of this statement.
Annual Report 2016
35
COLUMBIA MULTI-ASSET INCOME FUND
FINANCIAL HIGHLIGHTS (continued)
| | | Year Ended April 30, | |
Class Z | | 2016 | | 2015(a) | |
Per share data | |
Net asset value, beginning of period | | $ | 10.06 | | | $ | 10.00 | | |
Income from investment operations: | |
Net investment income | | | 0.56 | | | | 0.03 | | |
Net realized and unrealized gain (loss) | | | (0.63 | ) | | | 0.05 | | |
Total from investment operations | | | (0.07 | ) | | | 0.08 | | |
Less distributions to shareholders: | |
Net investment income | | | (0.56 | ) | | | (0.02 | ) | |
Total distributions to shareholders | | | (0.56 | ) | | | (0.02 | ) | |
Net asset value, end of period | | $ | 9.43 | | | $ | 10.06 | | |
Total return | | | (0.47 | %) | | | 0.82 | % | |
Ratios to average net assets(b) | |
Total gross expenses | | | 1.11 | % | | | 0.99 | %(c) | |
Total net expenses(d) | | | 0.65 | % | | | 0.50 | %(c) | |
Net investment income | | | 5.99 | % | | | 3.61 | %(c) | |
Supplemental data | |
Net assets, end of period (in thousands) | | $ | 313 | | | $ | 315 | | |
Portfolio turnover | | | 70 | % | | | 30 | % | |
Notes to Financial Highlights
(a) Based on operations from March 27, 2015 (commencement of operations) through the stated period end.
(b) In addition to the fees and expenses that the Fund bears directly, the Fund indirectly bears a pro rata share of the fees and expenses of any other funds in which it invests. Such indirect expenses are not included in the Fund's reported expense ratios.
(c) Annualized.
(d) Total net expenses include the impact of certain fee waivers/expense reimbursements made by the Investment Manager and certain of its affiliates, if applicable.
The accompanying Notes to Financial Statements are an integral part of this statement.
Annual Report 2016
36
COLUMBIA MULTI-ASSET INCOME FUND
NOTES TO FINANCIAL STATEMENTS
April 30, 2016
Note 1. Organization
Columbia Multi-Asset Income Fund (the Fund), a series of Columbia Funds Series Trust I (the Trust), is a diversified fund. The Trust is registered under the Investment Company Act of 1940, as amended (the 1940 Act), as an open-end management investment company organized as a Massachusetts business trust.
Fund Shares
The Trust may issue an unlimited number of shares (without par value). The Fund offers Class A, Class C, Class I, Class R4, Class R5, Class W and Class Z shares. Although all share classes generally have identical voting, dividend and liquidation rights, each share class votes separately when required by the Trust's organizational documents or by law. Different share classes pay different distribution amounts to the extent the expenses of such share classes differ, and distributions in liquidation will be proportional to the net asset value of each share class. Each share class has its own expense and sales charge structure.
Class A shares are subject to a maximum front-end sales charge of 4.75% based on the initial investment amount. Class A shares purchased without an initial sales charge in accounts aggregating $1 million to $50 million at the time of purchase are subject to a contingent deferred sales charge (CDSC) if the shares are sold within 18 months after purchase, charged as follows: 1.00% CDSC if redeemed within 12 months after purchase, and 0.50% CDSC if redeemed more than 12, but less than 18, months after purchase.
Class C shares are subject to a 1.00% CDSC on shares redeemed within 12 months after purchase.
Class I shares are not subject to sales charges and are available only to the Columbia Family of Funds.
Class R4 shares are not subject to sales charges and are generally available only to omnibus retirement plans and certain investors as described in the Fund's prospectus.
Class R5 shares are not subject to sales charges and are generally available only to investors purchasing through authorized investment professionals and omnibus retirement plans.
Class W shares are not subject to sales charges and are available only to investors purchasing through authorized investment programs managed by investment professionals, including discretionary managed account programs.
Class Z shares are not subject to sales charges and are available only to eligible investors, which are subject to different investment minimums as described in the Fund's prospectus.
Note 2. Summary of Significant Accounting Policies
Basis of Preparation
The Fund is an investment company that applies the accounting and reporting guidance in the Financial Accounting Standards Board (FASB) Accounting Standards Codification Topic 946, Financial Services — Investment Companies (ASC 946). The financial statements are prepared in accordance with U.S. generally accepted accounting principles (GAAP), which requires management to make certain estimates and assumptions that affect the reported amounts of assets and liabilities, the disclosure of contingent assets and liabilities at the date of the financial statements and the reported amounts of income and expenses during the reporting period. Actual results could differ from those estimates.
The following is a summary of significant accounting policies followed by the Fund in the preparation of its financial statements.
Security Valuation
All equity securities and exchange-traded funds are valued at the close of business of the New York Stock Exchange (NYSE). Equity securities and exchange-traded funds are valued at the last quoted sales price on the principal exchange or market on which they trade, except for securities traded on the NASDAQ Stock Market, which are valued at the NASDAQ official close price. Unlisted securities or listed securities for which there were no sales during the day are valued at the mean of the latest quoted bid and ask prices on such exchanges or markets.
Debt securities generally are valued by pricing services approved by the Board of Trustees (the Board) based upon market transactions for normal, institutional-size trading units of similar securities. The services may use various pricing techniques that take into account, as applicable, factors such as yield, quality, coupon rate, maturity, type of issue, trading characteristics and other data, as well as broker quotes. Debt securities for which quotations are not readily available or not believed to be reflective of market value may also be valued based upon a bid quote from an approved independent broker-dealer. Debt securities maturing in 60 days or less are
Annual Report 2016
37
COLUMBIA MULTI-ASSET INCOME FUND
NOTES TO FINANCIAL STATEMENTS (continued)
April 30, 2016
valued primarily at amortized cost value, unless this method results in a valuation that management believes does not approximate market value.
Foreign equity securities are valued based on the closing price on the foreign exchange in which such securities are primarily traded. If any foreign equity security closing prices are not readily available, the securities are valued at the mean of the latest quoted bid and ask prices on such exchanges or markets. Foreign currency exchange rates are generally determined at 4:00 p.m. Eastern (U.S.) time. Many securities markets and exchanges outside the U.S. close prior to the close of the NYSE; therefore, the closing prices for securities in such markets or on such exchanges may not fully reflect events that occur after such close but before the close of the NYSE. In those situations, foreign securities will be fair valued pursuant to a policy adopted by the Board, including, if available, utilizing a third party pricing service to determine these fair values. The third party pricing service takes into account multiple factors, including, but not limited to, movements in the U.S. securities markets, certain depositary receipts, futures contracts and foreign exchange rates that have occurred subsequent to the close of the foreign exchange or market, to determine a good faith estimate that reasonably reflects the current market conditions as of the close of the NYSE. The fair value of a security is likely to be different from the quoted or published price, if available.
Asset- and mortgage-backed securities are generally valued by pricing services, which utilize pricing models that incorporate the securities' cash flow and loan performance data. These models also take into account available market data, including trades, market quotations, and benchmark yield curves for identical or similar securities. Factors used to identify similar securities may include, but are not limited to, issuer, collateral type, vintage, prepayment speeds, collateral performance, credit ratings, credit enhancement and expected life. Asset-backed securities for which quotations are readily available may also be valued based upon an over-the-counter or exchange bid quote from an approved independent broker-dealer.
Investments in open-end investment companies, including money market funds, are valued at their latest net asset value.
Futures and options on futures contracts are valued based upon the settlement price at the close of regular trading on their principal exchanges or, in the absence of
transactions, at the mean of the latest quoted bid and ask prices.
Investments for which market quotations are not readily available, or that have quotations which management believes are not reflective of market value or reliable, are valued at fair value as determined in good faith under procedures approved by and under the general supervision of the Board. If a security or class of securities (such as foreign securities) is valued at fair value, such value is likely to be different from the quoted or published price for the security.
The determination of fair value often requires significant judgment. To determine fair value, management may use assumptions including but not limited to future cash flows and estimated risk premiums. Multiple inputs from various sources may be used to determine fair value.
GAAP requires disclosure regarding the inputs and valuation techniques used to measure fair value and any changes in valuation inputs or techniques. In addition, investments shall be disclosed by major category. This information is disclosed following the Fund's Portfolio of Investments.
Foreign Currency Transactions and Translations
The values of all assets and liabilities denominated in foreign currencies are generally translated into U.S. dollars at exchange rates determined at the close of the NYSE on any given day. Net realized and unrealized gains (losses) on foreign currency transactions and translations include gains (losses) arising from the fluctuation in exchange rates between trade and settlement dates on securities transactions, gains (losses) arising from the disposition of foreign currency and currency gains (losses) between the accrual and payment dates on dividends, interest income and foreign withholding taxes.
For financial statement purposes, the Fund does not distinguish that portion of gains (losses) on investments which is due to changes in foreign exchange rates from that which is due to changes in market prices of the investments. Such fluctuations are included with the net realized and unrealized gains (losses) on investments in the Statement of Operations.
Derivative Instruments
The Fund invests in certain derivative instruments, as detailed below, to meet its investment objectives. Derivatives are instruments whose values depend on, or are derived from, in whole or in part, the value of one or more securities, currencies, commodities, indices, or
Annual Report 2016
38
COLUMBIA MULTI-ASSET INCOME FUND
NOTES TO FINANCIAL STATEMENTS (continued)
April 30, 2016
other assets or instruments. Derivatives may be used to increase investment flexibility (including to maintain cash reserves while maintaining desired exposure to certain assets), for risk management (hedging) purposes, to facilitate trading, to reduce transaction costs and to pursue higher investment returns. The Fund may also use derivative instruments to mitigate certain investment risks, such as foreign currency exchange rate risk, interest rate risk and credit risk. Derivatives may involve various risks, including the potential inability of the counterparty to fulfill its obligation under the terms of the contract, the potential for an illiquid secondary market (making it difficult for the Fund to sell, including at favorable prices) and the potential for market movements which may expose the Fund to gains or losses in excess of the amount shown in the Statement of Assets and Liabilities. The notional amounts of derivative instruments, if applicable, are not recorded in the financial statements.
A derivative instrument may suffer a marked-to-market loss if the value of the contract decreases due to an unfavorable change in the market rates or values of the underlying instrument. Losses can also occur if the counterparty does not perform under the contract. The Fund's risk of loss from counterparty credit risk on over-the-counter derivatives is generally limited to the aggregate unrealized gain netted against any collateral held by the Fund and the amount of any variation margin held by the counterparty. With exchange-traded or centrally cleared derivatives, there is reduced counterparty credit risk to the Fund since the exchange's clearinghouse, as counterparty to such instruments, guarantees against a possible default. The clearinghouse stands between the buyer and the seller of the contract; therefore, the counterparty credit risk is failure of the clearinghouse. However, credit risk still exists in exchange-traded or centrally cleared derivatives with respect to initial and variation margin that is held in a broker's customer account. While brokers are required to segregate customer margin from their own assets, in the event that a broker becomes insolvent or goes into bankruptcy and at that time there is a shortfall in the aggregate amount of margin held by the broker for all its clients, U.S. bankruptcy laws will typically allocate that shortfall on a pro-rata basis across all the broker's customers (including the Fund), potentially resulting in losses to the Fund.
In order to better define its contractual rights and to secure rights that will help the Fund mitigate its counterparty risk, the Fund may enter into an
International Swaps and Derivatives Association, Inc. Master Agreement (ISDA Master Agreement) or similar agreement with its derivatives contract counterparties. An ISDA Master Agreement is an agreement between the Fund and a counterparty that governs over-the-counter derivatives and forward foreign currency exchange contracts and typically contains, among other things, collateral posting terms and netting provisions in the event of a default and/or termination event. Under an ISDA Master Agreement, the Fund may, under certain circumstances, offset with the counterparty certain derivative instrument's payables and/or receivables with collateral held and/or posted and create one single net payment. The provisions of the ISDA Master Agreement typically permit a single net payment in the event of default (close-out netting) including the bankruptcy or insolvency of the counterparty. Note, however, that bankruptcy or insolvency laws of a particular jurisdiction may impose restrictions on or prohibitions against the right of offset in bankruptcy, insolvency or other events.
Collateral (margin) requirements differ by type of derivative. Margin requirements are established by the exchange or clearinghouse for exchange-traded and centrally cleared derivatives. Brokers can ask for margin in excess of the minimum in certain circumstances. Collateral terms are contract specific for over-the-counter derivatives. For over-the-counter derivatives traded under an ISDA Master Agreement, the collateral requirements are typically calculated by netting the marked-to-market amount for each transaction under such agreement and comparing that amount to the value of any variation margin currently pledged by the Fund and/or the counterparty. Generally, the amount of collateral due from or to a party has to exceed a minimum transfer amount threshold (e.g., $500,000) before a transfer has to be made. To the extent amounts due to the Fund from its counterparties are not fully collateralized, contractually or otherwise, the Fund bears the risk of loss from counterparty nonperformance. The Fund attempts to mitigate counterparty risk by only entering into agreements with counterparties that it believes have the financial resources to honor their obligations and by monitoring the financial stability of those counterparties.
Certain ISDA Master Agreements allow counterparties to over-the-counter derivatives transactions to terminate derivatives contracts prior to maturity in the event the Fund's net asset value declines by a stated percentage over a specified time period or if the Fund fails to meet certain terms of the ISDA Master Agreement, which would cause the Fund to accelerate payment of any net
Annual Report 2016
39
COLUMBIA MULTI-ASSET INCOME FUND
NOTES TO FINANCIAL STATEMENTS (continued)
April 30, 2016
liability owed to the counterparty. The Fund also has termination rights if the counterparty fails to meet certain terms of the ISDA Master Agreement. In addition to considering counterparty credit risk, the Fund would consider terminating the derivatives contracts based on whether termination would result in a net liability owed from the counterparty.
For financial reporting purposes, the Fund does not offset derivative assets and derivative liabilities that are subject to netting arrangements in the Statement of Assets and Liabilities.
Futures Contracts
Futures contracts are exchange traded and represent commitments for the future purchase or sale of an asset at a specified price on a specified date. The Fund bought and sold futures contracts to produce incremental earnings, to manage the duration and yield curve exposure of the Fund versus the benchmark, to manage exposure to movements in interest rates and to manage exposure to the securities market. These instruments may be used for other purposes in future periods. Upon entering into futures contracts, the Fund bears risks that it may not achieve the anticipated benefits of the futures contracts and may realize a loss. Additional risks include counterparty credit risk, the possibility of an illiquid market, and that a change in the value of the contract or option may not correlate with changes in the value of the underlying asset.
Upon entering into a futures contract, the Fund pledges cash or securities with the broker in an amount sufficient to meet the initial margin requirement. The initial margin deposit must be maintained at an established level over the life of the contract. Cash deposited as initial margin is recorded in the Statement of Assets and Liabilities as margin deposits. Securities deposited as initial margin are designated in the Portfolio of Investments. Subsequent payments (variation margin) are made or received by the Fund each day. The variation margin payments are equal to the daily change in the contract value and are recorded as variation margin receivable or payable and are offset in unrealized gains or losses. The Fund recognizes a realized gain or loss when the contract is closed or expires. Futures contracts involve, to varying degrees, risk of loss in excess of the variation margin disclosed in the Statement of Assets and Liabilities.
Effects of Derivative Transactions in the Financial Statements
The following tables are intended to provide additional information about the effect of derivatives on the financial statements of the Fund, including: the fair value of derivatives by risk category and the location of those fair values in the Statement of Assets and Liabilities; and the impact of derivative transactions over the period in the Statement of Operations, including realized and unrealized gains (losses). The derivative instrument schedules following the Portfolio of Investments present additional information regarding derivative instruments outstanding at the end of the period, if any.
The following table is a summary of the fair value of derivative instruments (not considered to be hedging instruments for accounting disclosure purposes) at April 30, 2016:
Asset Derivatives | |
Risk Exposure
Category | | Statement of Assets and
Liabilities Location | | Fair Value ($) | |
Equity risk
| | Net assets — unrealized
appreciation on
futures contracts | | | 37,657
| * | |
Liability Derivatives | |
Risk Exposure
Category | | Statement of Assets and
Liabilities Location | | Fair Value ($) | |
Interest rate risk
| | Net assets — unrealized
depreciation on
futures contracts | | | 11,053
| * | |
*Includes cumulative appreciation (depreciation) as reported in the tables following the Portfolio of Investments. Only the current day's variation margin is reported in receivables or payables in the Statement of Assets and Liabilities.
The following table indicates the effect of derivative instruments (not considered to be hedging instruments for accounting disclosure purposes) in the Statement of Operations for the year ended April 30, 2016:
Amount of Realized Gain (Loss) on Derivatives Recognized in Income | |
Risk Exposure Category | | Futures Contracts ($) | |
Equity risk | | | 48,657 | | |
Interest rate risk | | | 141,552 | | |
Total | | | 190,209 | | |
Change in Unrealized Appreciation (Depreciation) on
Derivatives Recognized in Income | |
Risk Exposure Category | | Futures Contracts ($) | |
Equity risk | | | 37,657 | | |
Interest rate risk | | | (11,053 | ) | |
Total | | | 26,604 | | |
Annual Report 2016
40
COLUMBIA MULTI-ASSET INCOME FUND
NOTES TO FINANCIAL STATEMENTS (continued)
April 30, 2016
The following table provides a summary of the average outstanding volume by derivative instrument for the year ended April 30, 2016:
Derivative Instrument | | Average notional amounts($)* | |
Futures contracts — Long | | | 6,933,327 | | |
Futures contracts — Short | | | 1,785,875 | | |
*Based on the ending quarterly outstanding amounts for the year ended April 30, 2016.
Asset- and Mortgage-Backed Securities
The Fund may invest in asset-backed and mortgage-backed securities. The maturity dates shown represent the original maturity of the underlying obligation. Actual maturity may vary based upon prepayment activity on these obligations. All, or a portion, of the obligation may be prepaid at any time because the underlying asset may be prepaid. As a result, decreasing market interest rates could result in an increased level of prepayment. An increased prepayment rate will have the effect of shortening the maturity of the security. Unless otherwise noted, the coupon rates presented are fixed rates.
Delayed Delivery Securities
The Fund may trade securities on other than normal settlement terms, including securities purchased or sold on a "when-issued" basis. This may increase risk to the Fund since the other party to the transaction may fail to deliver, which could cause the Fund to subsequently invest at less advantageous prices. The Fund designates cash or liquid securities in an amount equal to the delayed delivery commitment.
Equity-Linked Notes
The Fund may invest in equity-linked notes (ELNs). An ELN is a debt instrument, generally valued based on a quotation received from a counterparty, which is based on the value of a single equity security, basket of equity securities or an index of equity securities (each, an Underlying Equity). An ELN typically provides interest income, thereby offering a yield advantage over investing directly in an Underlying Equity. However, the holder of an ELN may have limited or no benefit from any appreciation in the Underlying Equity, but is exposed to various risks, including, without limitation, volatility, issuer and market risk. The Fund may purchase ELNs that trade on a securities exchange or those that trade on the over-the-counter markets, including securities offered and sold under Rule 144A of the Securities Act of 1933, as amended. The Fund may also purchase an ELN in a
privately negotiated transaction with the issuer of the ELN (or its broker-dealer affiliate).
Interest Only and Principal Only Securities
The Fund may invest in Interest Only (IO) or Principal Only (PO) securities. IOs are stripped securities entitled to receive all of the security's interest, but none of its principal. IOs are particularly sensitive to changes in interest rates and therefore subject to greater fluctuations in price than typical interest bearing debt securities. IOs are also subject to credit risk because the Fund may not receive all or part of the interest payments if the issuer, obligor, guarantor or counterparty defaults on its obligation. Payments received for IOs are included in interest income on the Statement of Operations. Because no principal will be received at the maturity of an IO, adjustments are made to the cost of the security on a monthly basis until maturity. POs are stripped securities entitled to receive the principal from the underlying obligation, but not the interest. POs are particularly sensitive to changes in interest rates and therefore are subject to fluctuations in price. POs are also subject to credit risk because the Fund may not receive all or part of its principal if the issuer, obligor, guarantor or counterparty defaults on its obligation. The Fund may also invest in IO or PO stripped mortgage-backed securities. Payments received for POs are treated as reductions to the cost and par value of the securities.
Security Transactions
Security transactions are accounted for on the trade date. Cost is determined and gains (losses) are based upon the specific identification method for both financial statement and federal income tax purposes.
Income Recognition
Interest income is recorded on an accrual basis. Market premiums and discounts, including original issue discounts, are amortized and accreted, respectively, over the expected life of the security on all debt securities, unless otherwise noted. The Fund classifies gains and losses realized on prepayments received on mortgage-backed securities as adjustments to interest income.
The Fund may place a debt security on non-accrual status and reduce related interest income when it becomes probable that the interest will not be collected and the amount of uncollectible interest can be reasonably estimated. A defaulted debt security is removed from non-accrual status when the issuer resumes interest payments or when collectibility of interest is reasonably assured.
Annual Report 2016
41
COLUMBIA MULTI-ASSET INCOME FUND
NOTES TO FINANCIAL STATEMENTS (continued)
April 30, 2016
Corporate actions and dividend income are generally recorded net of any non-reclaimable tax withholdings, on the ex-dividend date or upon receipt of ex-dividend notification in the case of certain foreign securities.
The Fund may receive distributions from holdings in equity securities, business development companies (BDCs), exchange-traded funds, other regulated investment companies (RICs), and real estate investment trusts (REITs), which report information on the tax character of their distributions annually. These distributions are allocated to dividend income, capital gain and return of capital based on actual information reported. Return of capital is recorded as a reduction of the cost basis of securities held. If the Fund no longer owns the applicable securities, return of capital is recorded as a realized gain. With respect to REITs, to the extent actual information has not yet been reported, estimates for return of capital are made by the Fund's management. Management's estimates are subsequently adjusted when the actual character of the distributions is disclosed by the REITs, which could result in a proportionate change in return of capital to shareholders.
Awards from class action litigation are recorded as a reduction of cost basis if the Fund still owns the applicable securities on the payment date. If the Fund no longer owns the applicable securities, the proceeds are recorded as realized gains.
The value of additional securities received as an income payment is recorded as income and increases the cost basis of such securities.
Expenses
General expenses of the Trust are allocated to the Fund and other funds of the Trust based upon relative net assets or other expense allocation methodologies determined by the nature of the expense. Expenses directly attributable to the Fund are charged to the Fund. Expenses directly attributable to a specific class of shares are charged to that share class.
Determination of Class Net Asset Value
All income, expenses (other than class-specific expenses, which are charged to that share class, as shown in the Statement of Operations) and realized and unrealized gains (losses) are allocated to each class of the Fund on a daily basis, based on the relative net assets of each class, for purposes of determining the net asset value of each class.
Federal Income Tax Status
The Fund intends to qualify each year as a regulated investment company under Subchapter M of the Internal Revenue Code, as amended, and will distribute substantially all of its taxable income (including net short-term capital gains), if any, for its tax year, and as such will not be subject to federal income taxes. In addition, the Fund intends to distribute in each calendar year substantially all of its net investment income, capital gains and certain other amounts, if any, such that the Fund should not be subject to federal excise tax. Therefore, no federal income or excise tax provision is recorded.
Foreign Taxes
The Fund may be subject to foreign taxes on income, gains on investments or currency repatriation, a portion of which may be recoverable. The Fund will accrue such taxes and recoveries, as applicable, based upon its current interpretation of tax rules and regulations that exist in the markets in which it invests.
Realized gains in certain countries may be subject to foreign taxes at the Fund level, based on statutory rates. The Fund accrues for such foreign taxes on realized and unrealized gains at the appropriate rate for each jurisdiction, as applicable. The amount, if any, is disclosed as a liability on the Statement of Assets and Liabilities.
Distributions to Shareholders
Distributions from net investment income, if any, are declared and paid monthly. Net realized capital gains, if any, are distributed at least annually. Income distributions and capital gain distributions are determined in accordance with federal income tax regulations, which may differ from GAAP.
Guarantees and Indemnifications
Under the Trust's organizational documents and, in some cases, by contract, its officers and trustees are indemnified against certain liabilities arising out of the performance of their duties to the Trust or its funds. In addition, certain of the Fund's contracts with its service providers contain general indemnification clauses. The Fund's maximum exposure under these arrangements is unknown since the amount of any future claims that may be made against the Fund cannot be determined, and the Fund has no historical basis for predicting the likelihood of any such claims.
Annual Report 2016
42
COLUMBIA MULTI-ASSET INCOME FUND
NOTES TO FINANCIAL STATEMENTS (continued)
April 30, 2016
Note 3. Fees and Other Transactions with Affiliates
Management Fees
Effective September 1, 2015, the Fund entered into a Management Agreement with Columbia Management Investment Advisers, LLC (the Investment Manager), a wholly-owned subsidiary of Ameriprise Financial, Inc. (Ameriprise Financial). Under the Management Agreement, the Investment Manager provides the Fund with investment research and advice, as well as administrative and accounting services. The management services fee is an annual fee that is equal to a percentage of the Fund's average daily net assets that declines from 0.66% to 0.51% as the Fund's net assets increase. The effective management services fee rate for the year ended April 30, 2016 was 0.66% of the Fund's average daily net assets.
Prior to September 1, 2015, the Fund paid the Investment Manager an annual fee for advisory services under an Investment Management Services Agreement and a separate annual fee for administrative and accounting services under an Administrative Services Agreement. For the period from May 1, 2015 through August 31, 2015, the investment advisory services fee paid to the Investment Manager was $184,801, and the administrative services fee paid to the Investment Manager was $18,480.
Offering Costs
Offering costs were incurred prior to the shares of the Fund being offered. Offering costs include, among other things, state registration filing fees and printing costs. The Fund amortizes offering costs over a period of 12 months from the commencement of operations.
Compensation of Board Members
Board members, who are not officers or employees of the Investment Manager or Ameriprise Financial, are compensated for their services to the Fund as disclosed in the Statement of Operations. These Board members may participate in a Deferred Compensation Plan (the Plan) which may be terminated at any time. Obligations of the Plan will be paid solely out of the Fund's assets, and all amounts payable under the Plan constitute a general unsecured obligation of the Fund.
Compensation of Chief Compliance Officer
The Board has appointed a Chief Compliance Officer to the Fund in accordance with federal securities regulations. The Fund is allocated a portion of the expenses associated with the Chief Compliance Officer based on relative net assets of the Trust.
Transactions with Affiliates
For the year ended April 30, 2016, the Fund engaged in purchase and/or sale transactions with affiliates and/or accounts that have a common investment manager (or affiliated investment managers), common directors/trustees, and/or common officers. Those purchase and sale transactions complied with provisions of Rule 17a-7 under the 1940 Act and were $180,963 and $0, respectively.
Transfer Agency Fees
Under a Transfer and Dividend Disbursing Agent Agreement, Columbia Management Investment Services Corp. (the Transfer Agent), an affiliate of the Investment Manager and a wholly-owned subsidiary of Ameriprise Financial, is responsible for providing transfer agency services to the Fund. The Transfer Agent has contracted with Boston Financial Data Services (BFDS) to serve as sub-transfer agent.
The Transfer Agent receives a monthly transfer agency fee based on the number or the average value of accounts, depending on the type of account. In addition, the Transfer Agent also receives sub-transfer agency fees based on a percentage of the average aggregate value of the Fund's shares maintained in omnibus accounts (other than omnibus accounts for which American Enterprise Investment Services Inc. is the broker of record or accounts where the beneficial shareholder is a customer of Ameriprise Financial Services, Inc., for which the Transfer Agent receives a per account fee). The Transfer Agent pays the fees of BFDS for services as sub-transfer agent and is not entitled to reimbursement for such fees from the Fund (with the exception of out-of-pocket fees).
The Transfer Agent also receives compensation from the Fund for various shareholder services and reimbursements for certain out-of-pocket fees. Total transfer agency fees for Class R5 shares are subject to an annual limitation of not more than 0.05% of the average daily net assets attributable to Class R5 shares. Class I shares do not pay transfer agency fees.
Annual Report 2016
43
COLUMBIA MULTI-ASSET INCOME FUND
NOTES TO FINANCIAL STATEMENTS (continued)
April 30, 2016
For the year ended April 30, 2016, the Fund's effective transfer agency fee rates as a percentage of average daily net assets of each class were as follows:
Class A | | | 0.11 | % | |
Class C | | | 0.10 | | |
Class R4 | | | 0.09 | | |
Class R5 | | | 0.05 | | |
Class W | | | 0.09 | | |
Class Z | | | 0.10 | | |
An annual minimum account balance fee of $20 may apply to certain accounts with a value below the applicable share class's initial minimum investment requirements to reduce the impact of small accounts on transfer agency fees. These minimum account balance fees are remitted to the Fund and recorded as part of expense reductions in the Statement of Operations. For the year ended April 30, 2016, no minimum account balance fees were charged by the Fund.
Distribution and Service Fees
The Fund has an agreement with Columbia Management Investment Distributors, Inc. (the Distributor), an affiliate of the Investment Manager and a wholly-owned subsidiary of Ameriprise Financial, for distribution and shareholder services. The Board has approved, and the Fund has adopted, distribution and shareholder service plans (the Plans) applicable to certain share classes, which set the distribution and service fees for the Fund. These fees are calculated daily and are intended to compensate the Distributor and/or eligible selling and/or servicing agents for selling shares of the Fund and providing services to investors.
Under the Plans, the Fund pays a monthly service fee to the Distributor at the maximum annual rate of 0.25% of the average daily net assets attributable to Class A, Class C and Class W shares of the Fund. Also under the Plans, the Fund pays a monthly distribution fee to the Distributor at the maximum annual rates of 0.75% and 0.25% of the average daily net assets attributable to Class C and Class W shares of the Fund, respectively.
Although the Fund may pay a distribution fee up to 0.25% of the Fund's average daily net assets attributable to Class W shares and a service fee of up to 0.25% of the Fund's average daily net assets attributable to Class W shares, the aggregate fee shall not exceed 0.25% of the Fund's average daily net assets attributable to Class W shares.
Sales Charges
Sales charges, including front-end charges and CDSCs, received by the Distributor for distributing Fund shares were $471 for Class A and $0 for Class C shares for the year ended April 30, 2016.
Expenses Waived/Reimbursed by the Investment Manager and its Affiliates
The Investment Manager and certain of its affiliates have contractually agreed to waive fees and/or reimburse expenses (excluding certain fees and expenses described below) for the period disclosed below, so that the Fund's net operating expenses, including indirect expenses of the Underlying Funds, after giving effect to fees waived/expenses reimbursed and any balance credits and/or overdraft charges from the Fund's custodian, do not exceed the following annual rates as a percentage of the class' average daily net assets:
| | | Fee Rates Contractual
through
August 31, 2016 | |
Class A | | | 0.99 | % | |
Class C | | | 1.74 | | |
Class I | | | 0.59 | | |
Class R4 | | | 0.74 | | |
Class R5 | | | 0.64 | | |
Class W | | | 0.99 | | |
Class Z | | | 0.74 | | |
Under the agreement governing these fee waivers and/or expense reimbursement arrangements, the following fees and expenses are excluded from the waiver/reimbursement commitment, and therefore will be paid by the Fund, if applicable: taxes (including foreign transaction taxes), transaction costs and brokerage commissions, costs related to any securities lending program, dividend and interest expenses associated with securities sold short, inverse floater program fees and expenses, transaction charges and interest on borrowed money, interest, extraordinary expenses and any other expenses the exclusion of which is specifically approved by the Board. This agreement may be modified or amended only with approval from the Investment Manager, certain of its affiliates and the Fund. In addition to the contractual agreement, the Investment Manager and certain of its affiliates have voluntarily agreed to waive fees and/or reimburse Fund expenses (excluding certain fees and expenses described above) so that Fund level expenses (expenses directly attributable to the Fund and not to a
Annual Report 2016
44
COLUMBIA MULTI-ASSET INCOME FUND
NOTES TO FINANCIAL STATEMENTS (continued)
April 30, 2016
specific share class) are waived proportionately across all share classes, but the Fund's net operating expenses shall not exceed the contractual annual rates listed in the table above. This arrangement may be revised or discontinued at any time. Any fees waived and/or expenses reimbursed under the expense reimbursement arrangements described above are not recoverable by the Investment Manager or its affiliates in future periods.
Note 4. Federal Tax Information
The timing and character of income and capital gain distributions are determined in accordance with income tax regulations, which may differ from GAAP because of temporary or permanent book to tax differences.
At April 30, 2016, these differences are primarily due to differing treatment for capital loss carryforwards, principal and/or interest from fixed income securities, deferral/reversal of wash sale losses, Trustees' deferred compensation, distribution reclassifications, foreign currency transactions, investments in partnerships, derivative investments and tax straddles. To the extent these differences are permanent, reclassifications are made among the components of the Fund's net assets in the Statement of Assets and Liabilities. Temporary differences do not require reclassifications.
In the Statement of Assets and Liabilities the following reclassifications were made:
Undistributed net investment income | | $ | 278,684 | | |
Accumulated net realized loss | | | (278,308 | ) | |
Paid-in capital | | | (376 | ) | |
Net investment income (loss) and net realized gains (losses), as disclosed in the Statement of Operations, and net assets were not affected by this reclassification.
The tax character of distributions paid during the years indicated was as follows:
Year Ended April 30, | | 2016 | | 2015 | |
Ordinary income | | $ | 5,411,073 | | | $ | 213,912 | | |
Short-term capital gain distributions, if any, are considered ordinary income distributions for tax purposes.
At April 30, 2016, the components of distributable earnings on a tax basis were as follows:
Undistributed ordinary income | | $ | 94,727 | | |
Capital loss carryforwards | | | (3,628,691 | ) | |
Net unrealized depreciation | | | (1,628,980 | ) | |
At April 30, 2016, the cost of investments for federal income tax purposes was $93,929,708 and the aggregate gross unrealized appreciation and depreciation based on that cost was:
Unrealized appreciation | | $ | 1,868,674 | | |
Unrealized depreciation | | | (3,497,654 | ) | |
Net unrealized depreciation | | $ | (1,628,980 | ) | |
The following capital loss carryforwards, determined at April 30, 2016, may be available to reduce taxable income arising from future net realized gains on investments, if any, to the extent permitted by the Internal Revenue Code:
Year of Expiration | | Amount ($) | |
No expiration — short-term | | | 3,628,691 | | |
Management of the Fund has concluded that there are no significant uncertain tax positions in the Fund that would require recognition in the financial statements. However, management's conclusion may be subject to review and adjustment at a later date based on factors including, but not limited to, new tax laws, regulations, and administrative interpretations (including relevant court decisions). Generally, the Fund's federal tax returns for the prior three fiscal years remain subject to examination by the Internal Revenue Service.
Note 5. Portfolio Information
The cost of purchases and proceeds from sales of securities, excluding short-term investments and derivatives, if any, aggregated to $67,430,770 and $60,591,589, respectively, for the year ended April 30, 2016, of which $1,532,868 and $1,801,144, respectively, were U.S. government securities. The amount of purchase and sale activity impacts the portfolio turnover rate reported in the Financial Highlights.
Note 6. Affiliated Money Market Fund
The Fund invests in Columbia Short-Term Cash Fund, an affiliated money market fund established for the exclusive use by the Fund and other affiliated funds. The income earned by the Fund from such investments is included as Dividends — affiliated issuers in the Statement of Operations. As an investing fund, the Fund indirectly bears its proportionate share of the expenses of Columbia Short-Term Cash Fund.
Note 7. Line of Credit
The Fund has access to a revolving credit facility whereby the Fund may borrow for the temporary funding of
Annual Report 2016
45
COLUMBIA MULTI-ASSET INCOME FUND
NOTES TO FINANCIAL STATEMENTS (continued)
April 30, 2016
shareholder redemptions or for other temporary or emergency purposes. Effective December 8, 2015, Citibank, N.A. and HSBC Bank USA, N.A. joined JPMorgan Chase Bank, N.A. (JPMorgan) as lead of a syndicate of banks under the credit facility, which is a collective agreement between the Fund and certain other funds managed by the Investment Manager, severally and not jointly, that permits collective borrowings up to $1 billion. Interest is charged to each participating fund based on its borrowings at a rate equal to the higher of (i) the overnight federal funds rate plus 1.00% or (ii) the one-month LIBOR rate plus 1.00%. Each borrowing under the credit facility matures no later than 60 days after the date of borrowing. The Fund also pays a commitment fee equal to its pro rata share of the amount of the credit facility at a rate of 0.15% per annum. The commitment fee is included in other expenses in the Statement of Operations. Prior to December 8, 2015, JPMorgan was the sole lead bank under the credit facility agreement that permitted borrowings up to $550 million under the same terms and interest rates as described above with the exception of the commitment fee which was charged at a rate of 0.075% per annum.
The Fund had no borrowings during the year ended April 30, 2016.
Note 8. Significant Risks
Shareholder Concentration Risk
At April 30, 2016, affiliated shareholders of record owned 99.4% of the outstanding shares of the Fund in one or more accounts. Subscription and redemption activity by concentrated accounts may have a significant effect on the operations of the Fund. In the case of a large redemption, the Fund may be forced to sell investments at inopportune times, including its liquid or more liquid positions, resulting in Fund losses and the Fund holding a higher percentage of less liquid or illiquid securities. Large redemptions could result in decreased economies of scale and increased operating expenses for non-redeeming Fund shareholders.
Credit Risk
Credit risk is the risk that the value of debt securities in the Fund's portfolio may decline because the issuer may default and fail to pay interest or repay principal when due. Rating agencies assign credit ratings to debt securities to indicate their credit risk. Lower rated or unrated debt securities held by the Fund may present increased credit risk as compared to higher-rated debt securities.
Interest Rate Risk
Interest rate risk is the risk of losses attributable to changes in interest rates. In general, if prevailing interest rates rise, the values of debt securities tend to fall, and if interest rates fall, the values of debt securities tend to rise. Actions by governments and central banking authorities can result in increases in interest rates. Increasing interest rates may negatively affect the value of debt securities held by the Fund, resulting in a negative impact on the Fund's performance and net asset value per share. In general, the longer the maturity or duration of a debt security, the greater its sensitivity to changes in interest rates.
Liquidity Risk
Liquidity risk is the risk associated with a lack of marketability of investments which may make it difficult to sell the investment at a desirable time or price. Changing regulatory, market or other conditions or environments (for example, the interest rate or credit environments) may adversely affect the liquidity of the Fund's investments. The Fund may have to accept a lower selling price for the holding, sell other investments, or forego another, more appealing investment opportunity. Generally, the less liquid the market at the time the Fund sells a portfolio investment, the greater the risk of loss or decline of value to the Fund. A less liquid market can lead to an increase in Fund redemptions, which may negatively impact Fund performance and net asset value per share, including, for example, if the Fund is forced to sell securities in a down market.
Foreign Securities and Emerging Market Countries Risk
Investing in foreign securities may include certain risks and considerations not typically associated with investing in U.S. securities, such as fluctuating currency values and changing local and regional economic, political and social conditions, which may result in greater market volatility. In addition, certain foreign securities may not be as liquid as U.S. securities. Investing in emerging markets may accentuate these risks. These countries are also more likely to experience high levels of inflation, deflation or currency devaluation which could hurt their economies and securities markets. To the extent that the Fund concentrates its investment exposure to any one or a few specific countries, the Fund will be particularly susceptible to the various conditions, events or other factors impacting those countries and may, therefore,
Annual Report 2016
46
COLUMBIA MULTI-ASSET INCOME FUND
NOTES TO FINANCIAL STATEMENTS (continued)
April 30, 2016
have a greater risk than that of a fund which is more geographically diversified.
Note 9. Subsequent Events
Management has evaluated the events and transactions that have occurred through the date the financial statements were issued and noted no items requiring adjustment of the financial statements or additional disclosure.
Note 10. Information Regarding Pending and Settled Legal Proceedings
In December 2005, without admitting or denying the allegations, American Express Financial Corporation (AEFC, which is now known as Ameriprise Financial, Inc. (Ameriprise Financial)) entered into settlement agreements with the Securities and Exchange Commission (SEC) and Minnesota Department of Commerce (MDOC) related to market timing activities. As a result, AEFC was censured and ordered to cease and desist from committing or causing any violations of certain provisions of the Investment Advisers Act of 1940, the Investment Company Act of 1940, and various Minnesota laws. AEFC agreed to pay disgorgement of $10 million and civil money penalties of $7 million. AEFC also agreed to retain an independent distribution consultant to assist in developing a plan for distribution of all disgorgement and civil penalties ordered by the SEC in accordance with various undertakings detailed at http://www.sec.gov/litigation/admin/ia-2451.pdf. Ameriprise Financial and its affiliates have cooperated with the SEC and the MDOC in these legal proceedings, and have made regular reports to the Funds' Boards of Trustees.
Ameriprise Financial and certain of its affiliates have historically been involved in a number of legal, arbitration and regulatory proceedings, including routine litigation, class actions, and governmental actions, concerning matters arising in connection with the conduct of their business activities. Ameriprise Financial believes that the Funds are not currently the subject of, and that neither Ameriprise Financial nor any of its affiliates are the subject of, any pending legal, arbitration or regulatory proceedings that are likely to have a material adverse effect on the Funds or the ability of Ameriprise Financial or its affiliates to perform under their contracts with the Funds. Ameriprise Financial is required to make quarterly (10-Q), annual (10-K) and, as necessary, 8-K filings with the SEC on legal and regulatory matters that relate to Ameriprise Financial and its affiliates.
Copies of these filings may be obtained by accessing the SEC website at www.sec.gov.
There can be no assurance that these matters, or the adverse publicity associated with them, will not result in increased fund redemptions, reduced sale of fund shares or other adverse consequences to the Funds. Further, although we believe proceedings are not likely to have a material adverse effect on the Funds or the ability of Ameriprise Financial or its affiliates to perform under their contracts with the Funds, these proceedings are subject to uncertainties and, as such, we are unable to estimate the possible loss or range of loss that may result. An adverse outcome in one or more of these proceedings could result in adverse judgments, settlements, fines, penalties or other relief that could have a material adverse effect on the consolidated financial condition or results of operations of Ameriprise Financial.
Annual Report 2016
47
COLUMBIA MULTI-ASSET INCOME FUND
REPORT OF INDEPENDENT REGISTERED PUBLIC ACCOUNTING FIRM
To the Trustees of Columbia Funds Series Trust I and the Shareholders of
Columbia Multi-Asset Income Fund
In our opinion, the accompanying statement of assets and liabilities, including the portfolio of investments, and the related statements of operations and of changes in net assets and the financial highlights present fairly, in all material respects, the financial position of Columbia Multi-Asset Income Fund (the "Fund", a series of Columbia Funds Series Trust I) at April 30, 2016, and the results of its operations, the changes in its net assets and the financial highlights for each of the periods indicated, in conformity with accounting principles generally accepted in the United States of America. These financial statements and financial highlights (hereafter referred to as "financial statements") are the responsibility of the Fund's management. Our responsibility is to express an opinion on these financial statements based on our audits. We conducted our audits of these financial statements in accordance with the standards of the Public Company Accounting Oversight Board (United States). Those standards require that we plan and perform the audit to obtain reasonable assurance about whether the financial statements are free of material misstatement. An audit includes examining, on a test basis, evidence supporting the amounts and disclosures in the financial statements, assessing the accounting principles used and significant estimates made by management, and evaluating the overall financial statement presentation. We believe that our audits, which included confirmation of securities at April 30, 2016 by correspondence with the custodian, brokers and transfer agent, and the application of alternative auditing procedures where such confirmations had not been received, provide a reasonable basis for our opinion.
PricewaterhouseCoopers LLP
Minneapolis, MN
June 21, 2016
Annual Report 2016
48
COLUMBIA MULTI-ASSET INCOME FUND
FEDERAL INCOME TAX INFORMATION
(Unaudited)
The Fund hereby designates the following tax attributes for the fiscal year ended April 30, 2016. Shareholders will be notified in early 2017 of the amounts for use in preparing 2016 income tax returns.
Tax Designations:
| Qualified Dividend Income | | | 4.89 | % | |
| Dividends Received Deduction | | | 3.80 | % | |
Qualified Dividend Income. For taxable, non-corporate shareholders, the percentage of ordinary income distributed during the fiscal year that represents qualified dividend income subject to reduced tax rates.
Dividends Received Deduction. The percentage of ordinary income distributed during the fiscal year that qualifies for the corporate dividends received deduction.
Annual Report 2016
49
COLUMBIA MULTI-ASSET INCOME FUND
Shareholders elect the Board that oversees the Fund's operations. The Board appoints officers who are responsible for day-to-day business decisions based on policies set by the Board. The following table provides basic biographical information about the Fund's Trustees, including their principal occupations during the past five years, although specific titles for individuals may have varied over the period. The year set forth beneath Length of Service in the table below is the year in which the Trustee was first appointed or elected as Trustee to any Fund currently in the Columbia Funds Complex or a predecessor thereof. Under current Board policy, members serve terms of indefinite duration.
Trustees
Independent Trustees
Name,
Address,
Year of Birth | | Position Held With
the Funds and Length of
Service | | Principal Occupation(s)
During the Past Five Years
and Other Relevant
Professional Experience | | Number of
Funds in the
Columbia Funds
Complex
Overseen | | Other Directorships
Held by Trustee During
the Past Five Years | |
Janet Langford Carrig
c/o Columbia
Management Investment Advisers, LLC,
225 Franklin Street
Mail Drop BX32 05228,
Boston, MA 02110
1957 | | Trustee 1996 | | Senior Vice President, General Counsel and Corporate Secretary, ConocoPhillips (integrated energy company) since September 2007 | | | 58 | | | None | |
Douglas A. Hacker
c/o Columbia Management Investment Advisers, LLC,
225 Franklin Street
Mail Drop BX32 05228,
Boston, MA 02110
1955 | | Trustee and Chairman of the Board 1996 | | Independent business executive since May 2006; Executive Vice President — Strategy of United Airlines from December 2002 to May 2006; President of UAL Loyalty Services (airline marketing company) from September 2001 to December 2002; Executive Vice President and Chief Financial Officer of United Airlines from July 1999 to September 2001 | | | 58 | | | Spartan Nash Company (food distributor); Nash Finch Company (food distributor) from 2005 to 2013; Aircastle Limited (aircraft leasing); SeaCube Container Leasing Ltd. (container leasing) from 2010 to 2013; and Travelport Worldwide Limited (travel information technology) | |
Nancy T. Lukitsh
c/o Columbia Management Investment Advisers, LLC,
225 Franklin Street
Mail Drop BX32 05228,
Boston, MA 02110
1956 | | Trustee 2011 | | Senior Vice President, Partner and Director of Marketing, Wellington Management Company, LLP (investment adviser) from 1997 to 2010; Chair, Wellington Management Portfolios (commingled non-U.S. investment pools) from 2007 to 2010; Director, Wellington Trust Company, NA and other Wellington affiliates from 1997 to 2010 | | | 58 | | | None | |
Annual Report 2016
50
COLUMBIA MULTI-ASSET INCOME FUND
TRUSTEES AND OFFICERS (continued)
Independent Trustees (continued)
Name,
Address,
Year of Birth | | Position Held With
the Funds and Length of
Service | | Principal Occupation(s)
During the Past Five Years
and Other Relevant
Professional Experience | | Number of
Funds in the
Columbia Funds
Complex
Overseen | | Other Directorships
Held by Trustee During
the Past Five Years | |
William E. Mayer
c/o Columbia Management Investment Advisers, LLC,
225 Franklin Street
Mail Drop BX32 05228,
Boston, MA 02110
1940 | | Trustee 1991 | | Partner, Park Avenue Equity Partners (private equity) since February 1999 | | | 58 | | | DynaVox Inc. (speech creation); Lee Enterprises (print media); WR Hambrecht + Co. (financial service provider) from 2000 to 2012; BlackRock Capital Investment Corporation (investment company); and Premier, Inc. (healthcare) | |
David M. Moffett
c/o Columbia Management Investment Advisers, LLC,
225 Franklin Street
Mail Drop BX32 05228,
Boston, MA 02110
1952 | | Trustee 2011 | | Retired. Consultant to Bridgewater and Associates | | | 58 | | | Director of CIT Bank, CIT Group Inc. (commercial and consumer finance); eBay Inc. (online trading community); Genworth Financial, Inc. (financial and insurance products and services); Paypal Holdings Inc. (payment and data processing services); and Trustee University of Oklahoma Foundation | |
Charles R. Nelson
c/o Columbia Management Investment Advisers, LLC,
225 Franklin Street
Mail Drop BX32 05228,
Boston, MA 02110
1942 | | Trustee 1981 | | Retired. Professor Emeritus, University of Washington since 2011; Professor of Economics, University of Washington from 1976 to 2011; Ford and Louisa Van Voorhis Professor of Political Economy, University of Washington from 1993 to 2011; Adjunct Professor of Statistics, University of Washington from 1980 to 2011; Associate Editor, Journal of Money, Credit and Banking from September 1993 to 2008; consultant on econometric and statistical matters | | | 58 | | | None | |
John J. Neuhauser
c/o Columbia Management Investment Advisers, LLC,
225 Franklin Street
Mail Drop BX32 05228,
Boston, MA 02110
1943 | | Trustee 1984 | | President, Saint Michael's College since August 2007; Director or Trustee of several non-profit organizations, including University of Vermont Medical Center; Academic Vice President and Dean of Faculties, Boston College from August 1999 to October 2005; University Professor, Boston College from November 2005 to August 2007 | | | 58 | | | Liberty All-Star Equity Fund and Liberty All-Star Growth Fund (closed-end funds) | |
Annual Report 2016
51
COLUMBIA MULTI-ASSET INCOME FUND
TRUSTEES AND OFFICERS (continued)
Independent Trustees (continued)
Name,
Address,
Year of Birth | | Position Held With
the Funds and Length of
Service | | Principal Occupation(s)
During the Past Five Years
and Other Relevant
Professional Experience | | Number of
Funds in the
Columbia Funds
Complex
Overseen | | Other Directorships
Held by Trustee During
the Past Five Years | |
Patrick J. Simpson
c/o Columbia Management Investment Advisers, LLC,
225 Franklin Street
Mail Drop BX32 05228,
Boston, MA 02110
1944 | | Trustee 2000 | | Of Counsel, Perkins Coie LLP (law firm) since 2015; Partner, Perkins Coie LLP from 1988 to 2014 | | | 58 | | | None | |
Anne-Lee Verville
c/o Columbia Management Investment Advisers, LLC,
225 Franklin Street
Mail Drop BX32 05228,
Boston, MA 02110
1945 | | Trustee 1998 | | Retired. General Manager, Global Education Industry from 1994 to 1997, President — Application Systems Division from 1991 to 1994, Chief Financial Officer — US Marketing & Services from 1988 to 1991, and Chief Information Officer from 1987 to 1988, IBM Corporation (computer and technology) | | | 58 | | | Enesco Group, Inc. (producer of giftware and home and garden decor products) from 2001 to 2006 | |
Annual Report 2016
52
COLUMBIA MULTI-ASSET INCOME FUND
TRUSTEES AND OFFICERS (continued)
Interested Trustee Affiliated with Investment Manager*
Name,
Address,
Year of Birth | | Position Held With
the Funds and Length of
Service | | Principal Occupation(s)
During the Past Five Years
and Other Relevant
Professional Experience | | Number of
Funds in the
Columbia Funds
Complex
Overseen | | Other Directorships
Held by Trustee During
the Past Five Years | |
William F. Truscott
c/o Columbia Management Investment Advisers, LLC,
225 Franklin Street
Boston, MA 02110
1960 | | Trustee 2012 | | Chairman of the Board and President, Columbia Management Investment Advisers, LLC since May 2010 and February 2012, respectively (previously President and Chief Investment Officer, 2001-April 2010); Chief Executive Officer, Global Asset Management, Ameriprise Financial, Inc. since September 2012 (previously Chief Executive Officer, U.S. Asset Management & President, Annuities, May 2010- September 2012 and President — U.S. Asset Management and Chief Investment Officer, 2005-April 2010); Director and Chief Executive Officer, Columbia Management Investment Distributors, Inc. since May 2010 and February 2012, respectively (previously Chairman of the Board and Chief Executive Officer, 2006-April 2010); Chairman of the Board and Chief Executive Officer, RiverSource Distributors, Inc. since 2006; Director, Threadneedle Asset Management Holdings, SARL since 2014; President and Chief Executive Officer, Ameriprise Certificate Company, 2006-August 2012. | | | 178 | | | Chairman of the Board, Columbia Management Investment Advisers, LLC since May 2010; Director, Columbia Management Investment Distributors, Inc. since May 2010; Former Director, Ameriprise Certificate Company, 2006-January 2013 | |
* Interested person (as defined under the 1940 Act) by reason of being an officer, director, security holder and/or employee of the Investment Manager or Ameriprise Financial.
The Statement of Additional Information has additional information about the Fund's Board members and is available, without charge, upon request by calling 800.345.6611; contacting your financial intermediary; or visiting columbiathreadneedle.com/us.
Annual Report 2016
53
COLUMBIA MULTI-ASSET INCOME FUND
TRUSTEES AND OFFICERS (continued)
The Board has appointed officers who are responsible for day-to-day business decisions based on policies it has established. The officers serve at the pleasure of the Board. The following table provides basic information about the Officers of the Fund, including principal occupations during the past five years, although their specific titles may have varied over the period. In addition to Mr. Truscott, who is Senior Vice President, the Fund's other officers are:
Fund Officers
Name,
Address and
Year of Birth | | Position and Year
First Appointed to
Position for any Fund
in the Columbia
Funds Complex or a
Predecessor Thereof | |
Principal Occupation(s) During Past Five Years | |
Christopher O. Petersen
5228 Ameriprise Financial Center
Minneapolis, MN 55474
Born 1970 | | President and Principal Executive Officer (2015) | | Vice President and Lead Chief Counsel, Ameriprise Financial, Inc. since January 2015 (previously, Vice President and Chief Counsel January 2010-December 2014; and Vice President and Group Counsel or Counsel 2004-January 2010); officer of Columbia Funds and affiliated funds since 2007. | |
Michael G. Clarke
225 Franklin Street
Boston, MA 02110
Born 1969 | | Treasurer (2011), Chief Financial Officer (2009) and Chief Accounting Officer (2015) | | Vice President — Mutual Fund Administration, Columbia Management Investment Advisers, LLC, since May 2010; Managing Director of Fund Administration, Columbia Management Advisors, LLC, September 2004-April 2010; senior officer of Columbia Funds and affiliated funds since 2002. | |
Paul B. Goucher
100 Park Avenue
New York, NY 10017
Born 1968 | | Senior Vice President (2011), Chief Legal Officer (2015) and Assistant Secretary (2008) | | Vice President and Lead Chief Counsel, Ameriprise Financial, Inc. since November 2008 and January 2013, respectively (previously Chief Counsel, January 2010-January 2013 and Group Counsel, November 2008-January 2010). | |
Thomas P. McGuire
225 Franklin Street
Boston, MA 02110
Born 1972 | | Senior Vice President and Chief Compliance Officer (2012) | | Vice President — Asset Management Compliance, Ameriprise Financial, Inc., since May 2010; Chief Compliance Officer, Ameriprise Certificate Company since September 2010; Compliance Executive, Bank of America, 2005-April 2010. | |
Colin Moore
225 Franklin Street
Boston, MA 02110
Born 1958 | | Senior Vice President (2010) | | Executive Vice President and Global Chief Investment Officer, Ameriprise Financial, Inc., since July 2013; Director and Global Chief Investment Officer, Columbia Management Investment Advisers, LLC since May 2010; Manager, Managing Director and Chief Investment Officer, Columbia Management Advisors, LLC, 2007-April 2010. | |
Michael E. DeFao
225 Franklin Street
Boston, MA 02110
Born 1968 | | Vice President (2011) and Assistant Secretary (2010) | | Vice President and Chief Counsel, Ameriprise Financial, Inc. since May 2010; Associate General Counsel, Bank of America, 2005-April 2010. | |
Amy Johnson
5228 Ameriprise Financial Center
Minneapolis, MN 55474
Born 1965 | | Vice President (2006) | | Managing Director and Chief Operating Officer, Columbia Management Investment Advisers, LLC since May 2010 (previously Chief Administrative Officer, 2009-April 2010, and Vice President — Asset Management and Trust Company Services, 2006-2009). | |
Lyn Kephart-Strong
5228 Ameriprise
Financial Center
Minneapolis, MN 55474
Born 1960 | | Vice President (2015) | | President, Columbia Management Investment Services Corp. since October 2014; Vice President & Resolution Officer, Ameriprise Trust Company since August 2009; President, RiverSource Service Corporation 2004-2010. | |
Ryan C. Larrenaga
225 Franklin Street
Boston, MA 02110
Born 1970 | | Vice President and Secretary (2015) | | Vice President and Group Counsel, Ameriprise Financial, Inc. since August 2011 (previously, Counsel from May 2010 to August 2011); Assistant General Counsel, Bank of America, 2005-April 2010; officer of Columbia Funds and affiliated funds since 2005. | |
Annual Report 2016
54
COLUMBIA MULTI-ASSET INCOME FUND
IMPORTANT INFORMATION ABOUT THIS REPORT
Each fund mails one shareholder report to each shareholder address. If you would like more than one report, please call shareholder services at 800.345.6611 and additional reports will be sent to you.
The policy of the Board is to vote the proxies of the companies in which each fund holds investments consistent with the procedures as stated in the Statement of Additional Information (SAI). You may obtain a copy of the SAI without charge by calling 800.345.6611; contacting your financial intermediary; visiting columbiathreadneedle.com/us; or searching the website of the Securities and Exchange Commission (SEC) at sec.gov. Information regarding how each fund voted proxies relating to portfolio securities is filed with the SEC by August 31st for the most recent 12-month period ending June 30th of that year, and is available without charge by visiting columbiathreadneedle.com/us, or searching the website of the SEC at sec.gov.
Each fund files a complete schedule of portfolio holdings with the SEC for the first and third quarters of each fiscal year on Form N-Q. Each fund's Form N-Q is available on the SEC's website at sec.gov and may be reviewed and copied at the SEC's Public Reference Room in Washington, D.C. Information on the operation of the Public Reference Room may be obtained by calling 800.SEC.0330. Each fund's complete schedule of portfolio holdings, as filed on Form N-Q, can also be obtained without charge, upon request, by calling 800.345.6611.
Annual Report 2016
55
Columbia Multi-Asset Income Fund
P.O. Box 8081
Boston, MA 02266-8081

This information is for use with concurrent or prior delivery of a fund prospectus. Please read and consider the investment objectives, risks, charges and expenses for any fund carefully before investing. For a prospectus and summary prospectus, which contains this and other important information about the Fund, go to columbiathreadneedle.com/us. The Fund is distributed by Columbia Management Investment Distributors, Inc., member FINRA, and managed by Columbia Management Investment Advisers, LLC.
Columbia Threadneedle Investments (Columbia Threadneedle) is the global brand name of the Columbia and Threadneedle group of companies.
All rights reserved. Columbia Management Investment Distributors, Inc., 225 Franklin Street, Boston, MA 02110-2804
© 2016 Columbia Management Investment Advisers, LLC.
columbiathreadneedle.com/us
ANN261_04_F01_(06/16)

ANNUAL REPORT
April 30, 2016

COLUMBIA SMALL CAP VALUE FUND I


ABOUT COLUMBIA THREADNEEDLE INVESTMENTS
Columbia Threadneedle Investments is a leading global asset management group that provides a broad range of actively managed investment strategies and solutions for individual, institutional and corporate clients around the world.
With more than 2,000 people, including over 450 investment professionals based in North America, Europe and Asia, we manage $464 billion* of assets across developed and emerging market equities, fixed income, asset allocation solutions and alternatives. We are the 13th largest manager of long-term mutual fund assets in the U.S.** and the 3rd largest manager of retail funds in the U.K.***
Our priority is the investment success of our clients. We aim to deliver the investment outcomes they expect through an investment approach that is team-based, performance-driven and risk-aware. Our culture is dynamic and interactive. By sharing our insights across asset classes and geographies, we generate richer perspectives on global, regional and local investment landscapes. The ability to exchange and debate investment ideas in a collaborative environment enriches our teams' investment processes. More importantly, it results in better informed investment decisions for our clients.
Columbia funds are distributed by Columbia Management Investment Distributors, Inc., member FINRA, and managed by Columbia Management Investment Advisers, LLC.
Columbia Threadneedle Investments (Columbia Threadneedle) is the global brand name of the Columbia and Threadneedle group of companies.
* In U.S. dollars as of March 31, 2016. Source: Ameriprise Q1 Earnings Release. Includes all assets managed by entities in the Columbia and Threadneedle group of companies. Contact us for more current data.
** Source: ICI as of March 31, 2016 for Columbia Management Investment Advisers, LLC.
*** Source: Investment Association as of December 2015 for Threadneedle Asset Management Limited.
© 2016 Columbia Management Investment Advisers, LLC. All rights reserved.
Not part of the shareholder report
 Dear Shareholders,
Volatility comes with the territory for long-term investors. Some investors instinctively want to pull out of the market or sell underperforming investments at the first sign of increased volatility or perhaps even as soon as they perceive it on the horizon. But taking yourself out of the market could mean losing out on potential opportunities, and putting your longer-term investment goals at risk.
Cumulative return is not just about achieving high returns when markets are going up; it's also about remaining invested and minimizing losses during weak or volatile markets so that you can participate on the upside. Developing a deeper understanding of the various risks your portfolio is subject to can help you balance these risks.
Diversification is critical in seeking to achieve that balance. We believe that most portfolios could be more effectively diversified either by introducing holdings with performance profiles unrelated to existing holdings (like alternative products) or by rebalancing existing holdings with an eye toward risk allocation. Over time, distributing risk more evenly may produce a more pronounced diversification benefit and may improve portfolio efficiency. We believe market volatility can create significant opportunities and, in fact, these periods may be some of the very best times to invest.
With this in mind, I thought it important to highlight excerpts from a piece written by Colin Moore, Global Chief Investment Officer, in which he touches on some of these issues emphasizing the importance of a properly constructed portfolio in seeking to effectively manage volatility and to achieve consistency of returns. I encourage you to read the article in its entirety. To access the full article and for other insights on current market, please visit blog.columbiathreadneedleus.com/latest-perspectives.
You need investments that are designed to help you ease the impact of volatile market environments and keep the savings you have worked tirelessly to amass. Columbia Threadneedle Investments provides investment solutions to help you tackle financial challenges and achieve your desired outcome.
Best regards,

Christopher O. Petersen
President, Columbia Funds
Excerpts from:
Taking the scare out of the volatility bogeyman
By Colin Moore, Global Chief Investment Officer
Colin Moore is the global chief investment officer for Columbia Threadneedle Investments. His responsibilities include ensuring that a disciplined investment process is in place across all asset classes, including equity and fixed income. Mr. Moore joined one of the Columbia Threadneedle Investments legacy firms in 2002 as head of equity and was also head of fixed income and liquidity strategies from 2009 – 2010.

n In today's low growth, higher volatility world, the emphasis is shifting from maximization of returns to consistency of returns.
PRESIDENT'S MESSAGE (continued)
n Portfolios should represent the behavioral risk-return tradeoff of investors, remembering that they won't stay invested to realize the return if we get the risk tolerance wrong.
n Holding long-term savings in cash to avoid volatility (the financial equivalent of hiding under the sheets) is detrimental to achieving long-term goals.
According to Wikipedia, "The bogeyman is a common allusion to a mythical creature in many cultures used to control behavior. This monster has no specific appearance, and conceptions about it can vary drastically from household to household within the same community; in many cases he has no set appearance in the mind of an adult or child, but is simply a non-specific embodiment of terror." Different cultures have different names and physical representations for the bogeyman, and investors are no different. We have terrible monsters that we fear may destroy our portfolios, and we call one of the scariest of them volatility.
While the bogeyman is mythical (I hope!), volatility is real and can cause serious damage. To understand why investors have such a hard time coping with volatility, we first need to define three cognitive biases at work in today's investment environment:
1) Recency bias — something that has recently come to the forefront of our attention, regardless of how long established it is, suddenly seems to appear with improbable frequency.
2) Negativity bias — we tend to have a greater recall of unpleasant memories than positive memories.
3) Loss aversion — our dissatisfaction with losing money tends to be greater than our satisfaction with making money.
The level of volatility varies dramatically, and so does investor fear and panic selling — waxing when volatility rises, waning when it falls. Recent studies have pointed to demographics as an important driver of panic selling. The theory is that as people get closer to retirement, the prospects of a large (20% – 30%) loss in financial assets can have a much more pronounced effect on their sense of well-being. Wealth preservation instincts kick in much more quickly than for younger (and typically less wealthy) savers.
The reality is that there is little opportunity for return without volatility. Therefore, the bogeyman effect of holding long-term savings in cash to avoid volatility (the financial equivalent of hiding under the sheets) is detrimental to achieving long-term goals. This effect tends to be more pronounced during the episodic spikes in volatility. The significant spike in volatility in 2008 and 2009 led to significant withdrawals from long-term investment funds over the same period. Less pronounced effects can also be seen when comparing 2001 – 2003 and 2011 – 2012. Conversely, flows picked up when volatility returned to "normal" levels. Investor behavior of this type is consistent with the three behavioral biases.
I believe average volatility will be higher over the next 10 years than the last 10 years and episodic spikes will increase in frequency because sustainable economic growth will be structurally lower and geopolitical risk higher than any time since World War II. Low growth creates uncertainty while loss aversion will make investors fear that we are one economic mishap or geopolitical event away from no growth or recession. The result will be higher volatility on average. Negativity bias will tend to exacerbate "spike" reactions to event-driven geopolitical news, and the volatility bogeyman will appear more often. Assuming the behavioral biases continue, investor returns are likely to be very disappointing regardless of the total return generated by financial markets due to the bogeyman effect.
To mitigate this effect, we need to focus on portfolio construction and an improved understanding of diversification. I accept that equities are likely to offer the highest return over the next 10 years, but they also offer the highest volatility. Many portfolio construction optimization tools use historical average volatility, which is likely to underestimate the volatility investors will face. The bogeyman emerges when individual asset class volatility spikes and cross correlations rise, the combination of which increases overall portfolio volatility far beyond expectation. Diversification is meant to protect investors against volatility, but what's the point of owning lots of investments if the volatility bogeyman has not been properly estimated?
Most importantly, portfolios should be constructed to properly represent the behavioral risk-return tradeoff of investors, remembering that they won't stay invested to realize the return if we get the risk tolerance wrong. In a low growth, higher volatility world, the emphasis is shifting to return consistency rather than return maximization,
PRESIDENT'S MESSAGE (continued)
and investors are best served through investment approaches that appreciate that distinction. Even though it's a permanent feature of financial markets, volatility is less likely to be the bogeyman we all fear if portfolios are constructed with this understanding.
Please visit blog.columbiathreadneedleus.com/latest-perspectives to read the entire article.
Investors should consider the investment objectives, risks, charges and expenses of a mutual fund carefully before investing. For a free prospectus and summary prospectus, which contains this and other important information about a fund, visit columbiathreadneedle.com/us. The prospectus should be read carefully before investing.
The views expressed are as of April 2016, may change as market or other conditions change, and may differ from views expressed by other Columbia Management Investment Advisers, LLC (CMIA) associates or affiliates. Actual investments or investment decisions made by CMIA and its affiliates, whether for its own account or on behalf of clients, will not necessarily reflect the views expressed. This information is not intended to provide investment advice and does not account for individual investor circumstances. Investment decisions should always be made based on an investor's specific financial needs, objectives, goals, time horizon and risk tolerance. Asset classes described may not be suitable for all investors.
Past performance does not guarantee future results, and no forecast should be considered a guarantee either. Since economic and market conditions change frequently, there can be no assurance that the trends described here will continue or that the forecasts are accurate.
Diversification does not guarantee a profit or protect against loss.
Columbia Funds are distributed by Columbia Management Investment Distributors, Inc., member FINRA, and managed by Columbia Management Investment Advisers, LLC.
© 2016 Columbia Management Investment Advisers, LLC. All rights reserved
COLUMBIA SMALL CAP VALUE FUND I
Fund Investment Manager
Columbia Management Investment
Advisers, LLC
225 Franklin Street
Boston, MA 02110
Fund Distributor
Columbia Management Investment
Distributors, Inc.
225 Franklin Street
Boston, MA 02110
Fund Transfer Agent
Columbia Management Investment
Services Corp.
P.O. Box 8081
Boston, MA 02266-8081
For more information about any of the funds, please visit columbiathreadneedle.com/us or call 800.345.6611. Customer Service Representatives are available to answer your questions Monday through Friday from 8 a.m. to 7 p.m. Eastern time.
The views expressed in this report reflect the current views of the respective parties. These views are not guarantees of future performance and involve certain risks, uncertainties and assumptions that are difficult to predict, so actual outcomes and results may differ significantly from the views expressed. These views are subject to change at any time based upon economic, market or other conditions and the respective parties disclaim any responsibility to update such views. These views may not be relied on as investment advice and, because investment decisions for a Columbia fund are based on numerous factors, may not be relied on as an indication of trading intent on behalf of any particular Columbia fund. References to specific securities should not be construed as a recommendation or investment advice.
Performance Overview | | | 3 | | |
Manager Discussion of Fund Performance | | | 5 | | |
Understanding Your Fund's Expenses | | | 7 | | |
Portfolio of Investments | | | 8 | | |
Statement of Assets and Liabilities | | | 14 | | |
Statement of Operations | | | 16 | | |
Statement of Changes in Net Assets | | | 17 | | |
Financial Highlights | | | 20 | | |
Notes to Financial Statements | | | 29 | | |
Report of Independent Registered Public Accounting Firm | | | 36 | | |
Federal Income Tax Information | | | 37 | | |
Trustees and Officers | | | 38 | | |
Important Information About This Report | | | 43 | | |
COLUMBIA SMALL CAP VALUE FUND I
Performance Summary
n Columbia Small Cap Value Fund I (the Fund) Class A shares returned -2.60% excluding sales charges for the 12-month period that ended April 30, 2016.
n In a difficult year for stocks, the Fund outperformed its benchmark, the Russell 2000 Value Index, which returned -3.71% for the same period.
n Positive stock selection across most sectors generally accounted for the Fund's performance advantage over its benchmark.
Average Annual Total Returns (%) (for period ended April 30, 2016)
| | | Inception | | 1 Year | | 5 Years | | 10 Years | |
Class A | | 07/25/86 | | | | | | | | | | | | | |
Excluding sales charges | | | | | | | -2.60 | | | | 5.90 | | | | 4.93 | | |
Including sales charges | | | | | | | -8.21 | | | | 4.66 | | | | 4.31 | | |
Class B | | 11/09/92 | | | | | | | | | | | | | |
Excluding sales charges | | | | | | | -3.28 | | | | 5.12 | | | | 4.15 | | |
Including sales charges | | | | | | | -7.42 | | | | 4.90 | | | | 4.15 | | |
Class C | | 01/15/96 | | | | | | | | | | | | | |
Excluding sales charges | | | | | | | -3.32 | | | | 5.11 | | | | 4.15 | | |
Including sales charges | | | | | | | -4.16 | | | | 5.11 | | | | 4.15 | | |
Class I* | | 09/27/10 | | | -2.13 | | | | 6.39 | | | | 5.20 | | |
Class R* | | 09/27/10 | | | -2.83 | | | | 5.66 | | | | 4.68 | | |
Class R4* | | 11/08/12 | | | -2.31 | | | | 6.11 | | | | 5.03 | | |
Class R5* | | 11/08/12 | | | -2.19 | | | | 6.21 | | | | 5.08 | | |
Class Y* | | 07/15/09 | | | -2.13 | | | | 6.39 | | | | 5.25 | | |
Class Z | | 07/31/95 | | | -2.34 | | | | 6.17 | | | | 5.20 | | |
Russell 2000 Value Index | | | | | | | -3.71 | | | | 6.77 | | | | 4.61 | | |
Returns for Class A are shown with and without the maximum initial sales charge of 5.75%. Returns for Class B are shown with and without the applicable contingent deferred sales charge (CDSC) of 5.00% in the first year, declining to 1.00% in the sixth year and eliminated thereafter. Returns for Class C are shown with and without the 1.00% CDSC for the first year only. The Fund's other classes are not subject to sales charges and have limited eligibility. Please see the Fund's prospectus for details. Performance for different share classes will vary based on differences in sales charges and fees associated with each class. All results shown assume reinvestment of distributions during the period. Returns do not reflect the deduction of taxes that a shareholder may pay on Fund distributions or on the redemption of Fund shares. Performance results reflect the effect of any fee waivers or reimbursements of Fund expenses by Columbia Management Investment Advisers, LLC and/or any of its affiliates. Absent these fee waivers or expense reimbursement arrangements, performance results would have been lower.
The performance information shown represents past performance and is not a guarantee of future results. The investment return and principal value of your investment will fluctuate so that your shares, when redeemed, may be worth more or less than their original cost. Current performance may be lower or higher than the performance information shown. You may obtain performance information current to the most recent month-end by contacting your financial intermediary, visiting columbiathreadneedle.com/us or calling 800.345.6611.
*The returns shown for periods prior to the share class inception date (including returns for the Life of the Fund, if shown, which are since Fund inception) include the returns of the Fund's oldest share class. These returns are adjusted to reflect any higher class-related operating expenses of the newer share classes, as applicable. Please visit columbiathreadneedle.com/us/investment-products/mutual-funds/appended-performance for more information.
The Russell 2000 Value Index, an unmanaged index, tracks the performance of those Russell 2000 Index companies with lower price-to-book ratios and lower forecasted growth values.
Indices are not available for investment, are not professionally managed and do not reflect sales charges, fees, brokerage commissions, taxes or other expenses of investing. Securities in the Fund may not match those in an index.
Annual Report 2016
3
COLUMBIA SMALL CAP VALUE FUND I
PERFORMANCE OVERVIEW (continued)
Performance of a Hypothetical $10,000 Investment (May 1, 2006 – April 30, 2016)

The chart above shows the change in value of a hypothetical $10,000 investment in Class A shares of Columbia Small Cap Value Fund I during the stated time period, and does not reflect the deduction of taxes that a shareholder may pay on Fund distributions or on the redemption of Fund shares.
Annual Report 2016
4
COLUMBIA SMALL CAP VALUE FUND I
MANAGER DISCUSSION OF FUND PERFORMANCE
For the 12-month period that ended April 30, 2016, the Fund's Class A shares returned -2.60% excluding sales charges. The Fund outperformed its benchmark, the Russell 2000 Value Index, which returned -3.71% over the same period. Positive stock selection across most sectors generally accounted for the Fund's performance advantage over its benchmark. An overweight in the energy sector, which lost significant ground during the period, detracted from returns and hampered relative results.
Mounting Global Pressures Weighed on Markets
Around the world, investors turned cautious, as lackluster economic growth, contentious geopolitical conflicts and a shift in U.S. monetary policy weighed on confidence. Subpar global economic growth continued for a fourth straight year, with China's slowdown heading the list of disappointments. Conflicts in the Middle East and terrorism, both at home and abroad, heightened security fears. Plummeting oil prices and a rising dollar rounded the list of mounting pressures in 2015, although they reversed course early in 2016. A widening trade deficit also negatively impacted growth.
Despite these setbacks, the U.S. economy continued to expand modestly for the seventh consecutive year. U.S. labor markets recovered and consumer spending strengthened somewhat. The housing market inched forward, although sales were volatile — slipping early in 2016 and then bouncing back in April. Manufacturing activity softened, putting a damper on growth. In December 2015, the Federal Reserve (Fed) raised the target range of its benchmark interest rate by a quarter of a point, ending a lengthy debate about whether the economy was strong enough to withstand higher borrowing costs. Mixed economic signals early in 2016 put additional rate hikes on hold for now.
Stock market gains in the first half of the period were all but wiped out in the second half. In an increasingly risk-averse environment, investors flocked to the safety of U.S. Treasuries and high-yielding defensive sectors of the stock market. Against this backdrop, large-company stocks outperformed small-company stocks. However, small-cap value stocks held up better than small-cap growth stocks for the period.
Contributors and Detractors
The Fund's emphasis on high-quality companies was rewarded during a period of significant volatility for stocks across most sectors and capitalization ranges. In particular, stock selection in the financials, consumer discretionary, industrials and health care sectors aided relative performance.
Within the financials sector, Symetra Financial, a U.S.-based family of companies providing retirement plans, employee benefits, annuities and life insurance through independent distributors, was the top performer. Shares of Symetra Financial rose on news that it had agreed to be acquired by Japan's Sumitomo Life Insurance Company. Regional insurers United Fire Group and Hanover Insurance Group did well on strong underwriting results. Bank holdings that delivered positive returns included FCB Financial Holdings and WSFS Financial, which benefited from solid loan growth, and Towne Bank, the largest community bank in Virginia, which announced an accretive acquisition. Cash America International, a
Portfolio Management
Jeremy Javidi, CFA
Morningstar Style BoxTM

The Morningstar Style BoxTM is based on a fund's portfolio holdings. For equity funds, the vertical axis shows the market capitalization of the stocks owned, and the horizontal axis shows investment style (value, blend, or growth). Information shown is based on the most recent data provided by Morningstar.
© 2016 Morningstar, Inc. All rights reserved. The Morningstar information contained herein: (1) is proprietary to Morningstar and/or its content providers; (2) may not be copied or distributed; and (3) is not warranted to be accurate, complete or timely. Neither Morningstar nor its content providers are responsible for any damages or losses arising from any use of this information.
Top Ten Holdings (%)
(at April 30, 2016) | |
Sunstone Hotel Investors, Inc. | | | 1.2 | | |
First Citizens BancShares Inc.,
Class A | | | 1.2 | | |
Radian Group, Inc. | | | 1.1 | | |
Investors Bancorp, Inc. | | | 1.1 | | |
Mantech International Corp.,
Class A | | | 1.1 | | |
Mueller Industries, Inc. | | | 1.1 | | |
Chesapeake Lodging Trust | | | 1.0 | | |
Silicon Laboratories, Inc. | | | 1.0 | | |
Unifirst Corp. | | | 1.0 | | |
UMB Financial Corp. | | | 1.0 | | |
Percentages indicated are based upon total investments (excluding Money Market Funds).
For further detail about these holdings, please refer to the section entitled "Portfolio of Investments."
Fund holdings are as of the date given, are subject to change at any time, and are not recommendations to buy or sell any security.
Annual Report 2016
5
COLUMBIA SMALL CAP VALUE FUND I
MANAGER DISCUSSION OF FUND PERFORMANCE (continued)
Portfolio Breakdown (%)
(at April 30, 2016) | |
Common Stocks | | | 98.3 | | |
Money Market Funds | | | 1.7 | | |
Total | | | 100.0 | | |
Percentages indicated are based upon total investments. The Fund's portfolio composition is subject to change.
Equity Sector Breakdown (%)
(at April 30, 2016) | |
Consumer Discretionary | | | 10.4 | | |
Consumer Staples | | | 2.3 | | |
Energy | | | 7.2 | | |
Financials | | | 42.9 | | |
Health Care | | | 4.2 | | |
Industrials | | | 12.4 | | |
Information Technology | | | 13.6 | | |
Materials | | | 4.4 | | |
Telecommunication Services | | | 0.8 | | |
Utilities | | | 1.8 | | |
Total | | | 100.0 | | |
Percentages indicated are based upon total equity investments. The Fund's portfolio composition is subject to change.
Investment Risks
Market risk may affect a single issuer, sector of the economy, industry or the market as a whole. Foreign investments subject the Fund to risks, including political, economic, market, social and others within a particular country, as well as to currency instabilities and less stringent financial and accounting standards generally applicable to U.S. issuers. Investments in small-cap companies may be subject to greater volatility and price fluctuations because they may be thinly traded and less liquid. Value securities may be unprofitable if the market fails to recognize their intrinsic worth or the portfolio manager misgauged that worth. The Fund may invest significantly in issuers within a particular sector, which may be negatively affected by market, economic or other conditions, making the Fund more vulnerable to unfavorable developments in the sector. See the Fund's prospectus for more information on these and other risks.
pawnshop with significant exposure to gold, benefited as the price of gold rose. A position in Rexford Industrial Realty, a Southern California-based real estate investment trust, aided performance relative to the benchmark.
In the consumer discretionary sector, furniture chain Ethan Allen Interiors did well. The company gained market share and improved margins with an updated catalog of new merchandise. Cavco Industries, a long-term Fund holding, benefited from an upturn in the housing industry. Cavco Industries is one of the largest producers of manufactured and modular housing, recreational vehicles and cabin vacation homes in the United States. Shares of AMC Entertainment Holdings, which we purchased at a discount relative to its valuation, rose as the company benefited from a strong Hollywood lineup, including Disney's Star Wars movies.
Within the industrials sector, Universal Forest Products and Simpson Manufacturing were standout names. Universal Forest Products enjoyed strong sales as the housing industry continued to recover. The company sells lumber to homebuilders. Simpson Manufacturing is the dominant player in the production of joists, brackets and steel hardware. A solid understanding of building codes allows the company to tailor products to local markets. Shares of Albany International rose as investors anticipated a positive impact on cash flow from the introduction of carbon fiber cloth that the company has developed for jet engines. Delivery is expected to commence in 2016.
In the health care sector, a position in ACADIA Pharmaceuticals aided Fund performance. Shares of ACADIA Pharmaceuticals shares rose on news that the company's drug for treating Parkinson's disease received FDA approval. Chemed and Masimo, medical device companies that we invested in when their valuations were attractive, delivered strong gains. Chemed hit our estimate of fair value and was sold before the close of the reporting period.
Despite the period's negative performance, there were few real disappointments within the portfolio outside of the positioning in energy and utilities. An overweight in the weak-performing energy sector and an underweight in the strong-performing utilities sector hampered relative results. Energy stocks traded significantly lower as oil and gas prices fell during the period and utilities stocks attracted investors with their defensive characteristics.
Portfolio Positioning
Over the past year, we reduced the Fund's exposure to utilities and consumer staples stocks as valuations in both sectors became generally unattractive in our view. We also reduced exposure to the industrials sector to bring it in line with the benchmark. Based on attractive valuations, we increased the Fund's consumer discretionary holdings to a slight overweight relative to the benchmark. We continued to helm the Fund with the same disciplined philosophy we have employed since our team took over the Fund's management in June 2002: We target high-quality small companies that we believe are trading below their intrinsic value, with stable, positive earnings and low volatility compared to their peers; and we hold them until they have reached what we believe to be their fair market value. It is an approach that relies on patience, discipline and rigorous, ongoing analysis.
Annual Report 2016
6
COLUMBIA SMALL CAP VALUE FUND I
UNDERSTANDING YOUR FUND'S EXPENSES
(Unaudited)
As an investor, you incur two types of costs. There are transaction costs, which generally include sales charges on purchases and may include redemption fees. There are also ongoing costs, which generally include management fees, distribution and/or service fees, and other fund expenses. The following information is intended to help you understand your ongoing costs (in dollars) of investing in the Fund and to help you compare these costs with the ongoing costs of investing in other mutual funds.
Analyzing Your Fund's Expenses
To illustrate these ongoing costs, we have provided examples and calculated the expenses paid by investors in each share class of the Fund during the period. The actual and hypothetical information in the table is based on an initial investment of $1,000 at the beginning of the period indicated and held for the entire period. Expense information is calculated two ways and each method provides you with different information. The amount listed in the "Actual" column is calculated using the Fund's actual operating expenses and total return for the period. You may use the Actual information, together with the amount invested, to estimate the expenses that you paid over the period. Simply divide your account value by $1,000 (for example, an $8,600 account value divided by $1,000 = 8.6), then multiply the results by the expenses paid during the period under the "Actual" column. The amount listed in the "Hypothetical" column assumes a 5% annual rate of return before expenses (which is not the Fund's actual return) and then applies the Fund's actual expense ratio for the period to the hypothetical return. You should not use the hypothetical account values and expenses to estimate either your actual account balance at the end of the period or the expenses you paid during the period. See "Compare With Other Funds" below for details on how to use the hypothetical data.
Compare With Other Funds
Since all mutual funds are required to include the same hypothetical calculations about expenses in shareholder reports, you can use this information to compare the ongoing cost of investing in the Fund with other funds. To do so, compare the hypothetical example with the 5% hypothetical examples that appear in the shareholder reports of other funds. As you compare hypothetical examples of other funds, it is important to note that hypothetical examples are meant to highlight the ongoing costs of investing in a fund only and do not reflect any transaction costs, such as sales charges, or redemption or exchange fees. Therefore, the hypothetical calculations are useful in comparing ongoing costs only, and will not help you determine the relative total costs of owning different funds. If transaction costs were included in these calculations, your costs would be higher.
November 1, 2015 – April 30, 2016
| | | Account Value at the Beginning
of the Period ($) | | Account Value at the End of the
Period ($) | | Expenses Paid During the
Period ($) | | Fund's Annualized
Expense Ratio (%) | |
| | | Actual | | Hypothetical | | Actual | | Hypothetical | | Actual | | Hypothetical | | Actual | |
Class A | | | 1,000.00 | | | | 1,000.00 | | | | 1,005.30 | | | | 1,018.15 | | | | 6.73 | | | | 6.77 | | | | 1.35 | | |
Class B | | | 1,000.00 | | | | 1,000.00 | | | | 1,001.90 | | | | 1,014.37 | | | | 10.50 | | | | 10.57 | | | | 2.11 | | |
Class C | | | 1,000.00 | | | | 1,000.00 | | | | 1,001.70 | | | | 1,014.37 | | | | 10.50 | | | | 10.57 | | | | 2.11 | | |
Class I | | | 1,000.00 | | | | 1,000.00 | | | | 1,007.80 | | | | 1,020.34 | | | | 4.54 | | | | 4.57 | | | | 0.91 | | |
Class R | | | 1,000.00 | | | | 1,000.00 | | | | 1,004.10 | | | | 1,016.91 | | | | 7.97 | | | | 8.02 | | | | 1.60 | | |
Class R4 | | | 1,000.00 | | | | 1,000.00 | | | | 1,006.70 | | | | 1,019.39 | | | | 5.49 | | | | 5.52 | | | | 1.10 | | |
Class R5 | | | 1,000.00 | | | | 1,000.00 | | | | 1,007.30 | | | | 1,020.09 | | | | 4.79 | | | | 4.82 | | | | 0.96 | | |
Class Y | | | 1,000.00 | | | | 1,000.00 | | | | 1,007.60 | | | | 1,020.34 | | | | 4.54 | | | | 4.57 | | | | 0.91 | | |
Class Z | | | 1,000.00 | | | | 1,000.00 | | | | 1,006.60 | | | | 1,019.39 | | | | 5.49 | | | | 5.52 | | | | 1.10 | | |
Expenses paid during the period are equal to the annualized expense ratio for each class as indicated above, multiplied by the average account value over the period and then multiplied by the number of days in the Fund's most recent fiscal half year and divided by 366.
Expenses do not include fees and expenses incurred indirectly by the Fund from its investment in underlying funds, including affiliated and non-affiliated pooled investment vehicles, such as mutual funds and exchange-traded funds.
Had Columbia Management Investment Advisers, LLC and/or certain of its affiliates not waived/reimbursed certain fees and expenses, account value at the end of the period would have been reduced.
Annual Report 2016
7
COLUMBIA SMALL CAP VALUE FUND I
PORTFOLIO OF INVESTMENTS
April 30, 2016
(Percentages represent value of investments compared to net assets)
Common Stocks 98.4%
Issuer | | Shares | | Value ($) | |
CONSUMER DISCRETIONARY 10.2% | |
Auto Components 2.5% | |
Cooper Tire & Rubber Co. | | | 117,686 | | | | 4,064,874 | | |
Fuel Systems Solutions, Inc.(a) | | | 149,348 | | | | 791,544 | | |
Gentherm, Inc.(a) | | | 42,746 | | | | 1,570,488 | | |
Modine Manufacturing Co.(a) | | | 285,970 | | | | 3,091,336 | | |
Tenneco, Inc.(a) | | | 92,499 | | | | 4,930,197 | | |
Total | | | | | 14,448,439 | | |
Automobiles 0.5% | |
Winnebago Industries, Inc. | | | 128,123 | | | | 2,772,582 | | |
Diversified Consumer Services 0.2% | |
K12, Inc.(a) | | | 104,244 | | | | 1,281,159 | | |
Hotels, Restaurants & Leisure 0.5% | |
Ignite Restaurant Group, Inc.(a) | | | 354,408 | | | | 1,176,634 | | |
Marcus Corp. (The) | | | 89,360 | | | | 1,729,116 | | |
Total | | | | | 2,905,750 | | |
Household Durables 2.4% | |
Cavco Industries, Inc.(a) | | | 40,337 | | | | 3,537,151 | | |
Ethan Allen Interiors, Inc. | | | 121,940 | | | | 4,150,838 | | |
Hooker Furniture Corp. | | | 69,464 | | | | 1,722,707 | | |
Lifetime Brands, Inc. | | | 109,679 | | | | 1,894,156 | | |
UCP, Inc., Class A(a)(b) | | | 389,358 | | | | 3,013,631 | | |
Total | | | | | 14,318,483 | | |
Leisure Products 0.7% | |
Johnson Outdoors, Inc., Class A | | | 70,856 | | | | 1,709,755 | | |
Malibu Boats, Inc., Class A(a) | | | 151,955 | | | | 2,674,408 | | |
Total | | | | | 4,384,163 | | |
Media 1.3% | |
AMC Entertainment Holdings, Inc., Class A | | | 167,881 | | | | 4,730,887 | | |
Lions Gate Entertainment Corp. | | | 136,800 | | | | 3,036,960 | | |
Total | | | | | 7,767,847 | | |
Specialty Retail 1.0% | |
Aaron's, Inc. | | | 107,294 | | | | 2,812,176 | | |
Citi Trends, Inc. | | | 82,080 | | | | 1,474,157 | | |
Outerwall, Inc. | | | 30,600 | | | | 1,264,086 | | |
Select Comfort Corp.(a) | | | 20,440 | | | | 504,459 | | |
Total | | | | | 6,054,878 | | |
Textiles, Apparel & Luxury Goods 1.1% | |
Deckers Outdoor Corp.(a) | | | 42,569 | | | | 2,460,914 | | |
Common Stocks (continued)
Issuer | | Shares | | Value ($) | |
G-III Apparel Group Ltd.(a) | | | 40,160 | | | | 1,817,240 | | |
Steven Madden Ltd.(a) | | | 60,485 | | | | 2,117,580 | | |
Total | | | | | 6,395,734 | | |
Total Consumer Discretionary | | | | | 60,329,035 | | |
CONSUMER STAPLES 2.3% | |
Food & Staples Retailing 0.6% | |
Andersons, Inc. (The) | | | 96,742 | | | | 3,241,825 | | |
Food Products 1.1% | |
Fresh Del Monte Produce, Inc. | | | 126,080 | | | | 5,454,221 | | |
John B. Sanfilippo & Son, Inc. | | | 23,764 | | | | 1,314,862 | | |
Total | | | | | 6,769,083 | | |
Personal Products 0.6% | |
Inter Parfums, Inc. | | | 105,752 | | | | 3,238,126 | | |
Total Consumer Staples | | | | | 13,249,034 | | |
ENERGY 7.1% | |
Energy Equipment & Services 1.5% | |
Aspen Aerogels, Inc.(a) | | | 399,059 | | | | 1,899,521 | | |
CARBO Ceramics, Inc. | | | 136,330 | | | | 2,024,500 | | |
Dawson Geophysical Co.(a) | | | 288,889 | | | | 1,484,889 | | |
Geospace Technologies Corp.(a) | | | 98,710 | | | | 1,614,896 | | |
Natural Gas Services Group, Inc.(a) | | | 79,943 | | | | 1,837,890 | | |
Total | | | | | 8,861,696 | | |
Oil, Gas & Consumable Fuels 5.6% | |
Alon USA Energy, Inc. | | | 212,859 | | | | 2,235,020 | | |
Callon Petroleum Co.(a) | | | 360,461 | | | | 3,788,445 | | |
Clayton Williams Energy, Inc.(a) | | | 24,016 | | | | 435,410 | | |
Cobalt International Energy, Inc.(a) | | | 403,546 | | | | 1,303,454 | | |
Contango Oil & Gas Co.(a) | | | 121,243 | | | | 1,525,237 | | |
Earthstone Energy, Inc.(a) | | | 18,472 | | | | 255,098 | | |
Eclipse Resources Corp.(a) | | | 747,902 | | | | 1,817,402 | | |
Energen Corp. | | | 57,130 | | | | 2,427,454 | | |
Jones Energy, Inc., Class A(a) | | | 471,603 | | | | 2,263,694 | | |
Matador Resources Co.(a) | | | 148,300 | | | | 3,195,865 | | |
Rice Energy, Inc.(a) | | | 180,731 | | | | 3,128,454 | | |
Sanchez Energy Corp.(a) | | | 251,150 | | | | 2,257,838 | | |
SM Energy Co. | | | 63,540 | | | | 1,979,906 | | |
Synergy Resources Corp.(a) | | | 91,190 | | | | 658,392 | | |
Whiting Petroleum Corp.(a) | | | 185,470 | | | | 2,225,640 | | |
The accompanying Notes to Financial Statements are an integral part of this statement.
Annual Report 2016
8
COLUMBIA SMALL CAP VALUE FUND I
PORTFOLIO OF INVESTMENTS (continued)
April 30, 2016
Common Stocks (continued)
Issuer | | Shares | | Value ($) | |
WPX Energy, Inc.(a) | | | 389,150 | | | | 3,759,189 | | |
Total | | | | | 33,256,498 | | |
Total Energy | | | | | 42,118,194 | | |
FINANCIALS 42.2% | |
Banks 18.4% | |
BancFirst Corp. | | | 69,775 | | | | 4,351,867 | | |
BankUnited, Inc. | | | 148,876 | | | | 5,136,222 | | |
Banner Corp. | | | 101,271 | | | | 4,332,373 | | |
Boston Private Financial Holdings, Inc. | | | 304,180 | | | | 3,717,080 | | |
Bridge Bancorp, Inc. | | | 56,900 | | | | 1,732,036 | | |
Brookline Bancorp, Inc. | | | 279,263 | | | | 3,178,013 | | |
Capital City Bank Group, Inc. | | | 209,220 | | | | 3,100,640 | | |
Cascade Bancorp(a) | | | 430,857 | | | | 2,606,685 | | |
Centerstate Banks, Inc. | | | 246,358 | | | | 4,013,172 | | |
Columbia Banking System, Inc. | | | 163,053 | | | | 4,808,433 | | |
Community Trust Bancorp, Inc. | | | 69,337 | | | | 2,487,118 | | |
FCB Financial Holdings, Inc., Class A(a) | | | 148,073 | | | | 5,175,151 | | |
First Citizens BancShares Inc., Class A | | | 27,311 | | | | 6,964,305 | | |
First Financial Corp. | | | 115,540 | | | | 4,093,582 | | |
First of Long Island Corp. (The) | | | 68,030 | | | | 2,082,398 | | |
Heritage Financial Corp. | | | 75,753 | | | | 1,397,643 | | |
Investors Bancorp, Inc. | | | 545,019 | | | | 6,294,969 | | |
Merchants Bancshares, Inc. | | | 141,697 | | | | 4,313,257 | | |
National Bank Holdings Corp., Class A | | | 246,680 | | | | 4,931,133 | | |
Northrim BanCorp, Inc. | | | 194,464 | | | | 5,017,171 | | |
Sierra Bancorp | | | 64,527 | | | | 1,136,321 | | |
Synovus Financial Corp. | | | 173,159 | | | | 5,395,634 | | |
Towne Bank | | | 193,420 | | | | 4,061,820 | | |
Trustmark Corp. | | | 211,239 | | | | 5,177,468 | | |
UMB Financial Corp. | | | 99,450 | | | | 5,544,338 | | |
Union Bankshares Corp. | | | 127,904 | | | | 3,377,945 | | |
Webster Financial Corp. | | | 103,730 | | | | 3,800,667 | | |
Total | | | | | 108,227,441 | | |
Capital Markets 0.5% | |
INTL FCStone, Inc.(a) | | | 98,275 | | | | 2,682,907 | | |
Consumer Finance 0.9% | |
Cash America International, Inc. | | | 112,748 | | | | 4,167,166 | | |
Enova International, Inc.(a) | | | 147,452 | | | | 1,299,052 | | |
Total | | | | | 5,466,218 | | |
Common Stocks (continued)
Issuer | | Shares | | Value ($) | |
Diversified Financial Services 0.4% | |
Pico Holdings, Inc.(a) | | | 262,757 | | | | 2,609,177 | | |
Insurance 7.4% | |
American Equity Investment
Life Holding Co. | | | 285,240 | | | | 3,993,360 | | |
Argo Group International Holdings Ltd. | | | 95,761 | | | | 5,263,982 | | |
Baldwin & Lyons, Inc., Class B | | | 99,941 | | | | 2,442,558 | | |
EMC Insurance Group, Inc. | | | 94,251 | | | | 2,493,882 | | |
Employers Holdings, Inc. | | | 134,184 | | | | 3,985,265 | | |
FBL Financial Group, Inc., Class A | | | 66,856 | | | | 4,042,782 | | |
Hanover Insurance Group, Inc. (The) | | | 40,900 | | | | 3,507,584 | | |
Heritage Insurance Holdings, Inc. | | | 244,957 | | | | 3,255,479 | | |
Horace Mann Educators Corp. | | | 89,091 | | | | 2,770,730 | | |
National Western Life Group, Inc., Class A | | | 18,249 | | | | 3,954,558 | | |
Navigators Group, Inc. (The)(a) | | | 46,105 | | | | 3,808,734 | | |
United Fire Group, Inc. | | | 85,645 | | | | 3,838,609 | | |
Total | | | | | 43,357,523 | | |
Real Estate Investment Trusts (REITs) 9.8% | |
Altisource Residential Corp. | | | 243,598 | | | | 2,830,609 | | |
Chesapeake Lodging Trust | | | 243,605 | | | | 5,999,991 | | |
Cousins Properties, Inc. | | | 527,094 | | | | 5,455,423 | | |
EastGroup Properties, Inc. | | | 80,778 | | | | 4,826,485 | | |
Getty Realty Corp. | | | 239,991 | | | | 4,723,023 | | |
LaSalle Hotel Properties | | | 231,720 | | | | 5,538,108 | | |
Lexington Realty Trust | | | 525,440 | | | | 4,613,363 | | |
National Health Investors, Inc. | | | 34,340 | | | | 2,338,211 | | |
Potlatch Corp. | | | 103,505 | | | | 3,645,446 | | |
Resource Capital Corp. | | | 254,820 | | | | 3,027,262 | | |
Rexford Industrial Realty, Inc. | | | 174,603 | | | | 3,277,298 | | |
Sunstone Hotel Investors, Inc. | | | 563,555 | | | | 7,219,140 | | |
Terreno Realty Corp. | | | 198,813 | | | | 4,526,972 | | |
Total | | | | | 58,021,331 | | |
Thrifts & Mortgage Finance 4.8% | |
Bank Mutual Corp. | | | 266,719 | | | | 2,155,090 | | |
Chicopee Bancorp, Inc. | | | 34,474 | | | | 626,737 | | |
HomeStreet, Inc.(a) | | | 248,579 | | | | 5,356,877 | | |
Provident Financial Holdings, Inc. | | | 88,755 | | | | 1,535,462 | | |
Radian Group, Inc. | | | 501,250 | | | | 6,410,988 | | |
Washington Federal, Inc. | | | 220,043 | | | | 5,344,844 | | |
Westfield Financial, Inc. | | | 383,209 | | | | 2,935,381 | | |
The accompanying Notes to Financial Statements are an integral part of this statement.
Annual Report 2016
9
COLUMBIA SMALL CAP VALUE FUND I
PORTFOLIO OF INVESTMENTS (continued)
April 30, 2016
Common Stocks (continued)
Issuer | | Shares | | Value ($) | |
WSFS Financial Corp. | | | 113,652 | | | | 3,880,079 | | |
Total | | | | | 28,245,458 | | |
Total Financials | | | | | 248,610,055 | | |
HEALTH CARE 4.1% | |
Biotechnology 2.5% | |
ACADIA Pharmaceuticals, Inc.(a) | | | 89,270 | | | | 2,883,421 | | |
AMAG Pharmaceuticals, Inc.(a) | | | 52,070 | | | | 1,380,896 | | |
Dynavax Technologies Corp.(a) | | | 137,665 | | | | 2,259,083 | | |
Infinity Pharmaceuticals, Inc.(a) | | | 504,780 | | | | 2,927,724 | | |
Juno Therapeutics, Inc.(a) | | | 51,200 | | | | 2,155,008 | | |
Keryx Biopharmaceuticals, Inc.(a) | | | 343,947 | | | | 1,871,072 | | |
PTC Therapeutics, Inc.(a) | | | 147,577 | | | | 1,095,021 | | |
Total | | | | | 14,572,225 | | |
Health Care Equipment & Supplies 0.3% | |
Masimo Corp.(a) | | | 48,647 | | | | 2,108,848 | | |
Pharmaceuticals 1.3% | |
Flex Pharma, Inc.(a) | | | 222,036 | | | | 2,433,514 | | |
Pacira Pharmaceuticals, Inc.(a) | | | 50,463 | | | | 2,730,553 | | |
Supernus Pharmaceuticals, Inc.(a) | | | 148,486 | | | | 2,548,020 | | |
Total | | | | | 7,712,087 | | |
Total Health Care | | | | | 24,393,160 | | |
INDUSTRIALS 12.2% | |
Building Products 1.8% | |
Simpson Manufacturing Co., Inc. | | | 147,250 | | | | 5,536,600 | | |
Universal Forest Products, Inc. | | | 63,884 | | | | 4,896,708 | | |
Total | | | | | 10,433,308 | | |
Commercial Services & Supplies 1.0% | |
Unifirst Corp. | | | 53,865 | | | | 5,837,889 | | |
Electrical Equipment 0.7% | |
Encore Wire Corp. | | | 62,976 | | | | 2,408,832 | | |
EnerSys | | | 35,047 | | | | 2,045,693 | | |
Total | | | | | 4,454,525 | | |
Industrial Conglomerates 0.3% | |
Raven Industries, Inc. | | | 98,230 | | | | 1,580,521 | | |
Machinery 6.2% | |
Albany International Corp., Class A | | | 119,821 | | | | 4,827,588 | | |
Altra Industrial Motion Corp. | | | 138,326 | | | | 3,969,956 | | |
Dynamic Materials Corp. | | | 109,047 | | | | 1,065,389 | | |
Common Stocks (continued)
Issuer | | Shares | | Value ($) | |
EnPro Industries, Inc. | | | 49,726 | | | | 2,912,949 | | |
Gorman-Rupp Co. | | | 83,495 | | | | 2,362,074 | | |
Hardinge, Inc. | | | 100,920 | | | | 1,311,960 | | |
Kadant, Inc. | | | 49,037 | | | | 2,321,902 | | |
LB Foster Co., Class A | | | 83,638 | | | | 1,645,996 | | |
Lydall, Inc.(a) | | | 86,453 | | | | 3,180,606 | | |
Mueller Industries, Inc. | | | 195,342 | | | | 6,164,994 | | |
Standex International Corp. | | | 48,574 | | | | 3,725,140 | | |
Wabash National Corp.(a) | | | 224,390 | | | | 3,197,557 | | |
Total | | | | | 36,686,111 | | |
Professional Services 1.2% | |
FTI Consulting, Inc.(a) | | | 102,630 | | | | 4,135,989 | | |
TrueBlue, Inc.(a) | | | 146,257 | | | | 2,733,543 | | |
Total | | | | | 6,869,532 | | |
Road & Rail 0.7% | |
Landstar System, Inc. | | | 28,662 | | | | 1,878,794 | | |
Werner Enterprises, Inc. | | | 101,099 | | | | 2,561,849 | | |
Total | | | | | 4,440,643 | | |
Trading Companies & Distributors 0.3% | |
Houston Wire & Cable Co. | | | 214,271 | | | | 1,566,321 | | |
Total Industrials | | | | | 71,868,850 | | |
INFORMATION TECHNOLOGY 13.4% | |
Communications Equipment 1.2% | |
Alliance Fiber Optic Products, Inc.(a) | | | 160,805 | | | | 2,978,108 | | |
Digi International, Inc.(a) | | | 192,238 | | | | 2,031,956 | | |
Plantronics, Inc. | | | 60,160 | | | | 2,313,152 | | |
Total | | | | | 7,323,216 | | |
Electronic Equipment, Instruments & Components 3.1% | |
AVX Corp. | | | 311,242 | | | | 4,114,620 | | |
Fitbit, Inc., Class A(a) | | | 167,620 | | | | 3,059,065 | | |
GSI Group, Inc.(a) | | | 150,964 | | | | 2,196,526 | | |
InvenSense, Inc.(a) | | | 210,900 | | | | 1,619,712 | | |
MTS Systems Corp. | | | 46,537 | | | | 2,616,310 | | |
OSI Systems, Inc.(a) | | | 88,110 | | | | 4,483,918 | | |
Total | | | | | 18,090,151 | | |
Internet Software & Services 1.1% | |
j2 Global, Inc. | | | 29,585 | | | | 1,879,239 | | |
WebMD Health Corp.(a) | | | 69,224 | | | | 4,343,114 | | |
Total | | | | | 6,222,353 | | |
The accompanying Notes to Financial Statements are an integral part of this statement.
Annual Report 2016
10
COLUMBIA SMALL CAP VALUE FUND I
PORTFOLIO OF INVESTMENTS (continued)
April 30, 2016
Common Stocks (continued)
Issuer | | Shares | | Value ($) | |
IT Services 2.4% | |
Higher One Holdings, Inc.(a) | | | 460,480 | | | | 1,745,219 | | |
Lionbridge Technologies, Inc.(a) | | | 503,696 | | | | 2,513,443 | | |
Mantech International Corp., Class A | | | 185,387 | | | | 6,266,081 | | |
TeleTech Holdings, Inc. | | | 138,427 | | | | 3,846,886 | | |
Total | | | | | 14,371,629 | | |
Semiconductors & Semiconductor Equipment 3.7% | |
Cypress Semiconductor Corp. | | | 499,939 | | | | 4,514,449 | | |
Entegris, Inc.(a) | | | 292,842 | | | | 3,891,870 | | |
IXYS Corp. | | | 252,510 | | | | 2,727,108 | | |
M/A-COM Technology Solutions
Holdings, Inc.(a) | | | 54,291 | | | | 2,219,959 | | |
Silicon Laboratories, Inc.(a) | | | 125,850 | | | | 5,889,780 | | |
SunEdison Semiconductor Ltd.(a) | | | 470,060 | | | | 2,702,845 | | |
Total | | | | | 21,946,011 | | |
Software 1.5% | |
Mentor Graphics Corp. | | | 183,960 | | | | 3,671,842 | | |
MicroStrategy, Inc., Class A(a) | | | 9,870 | | | | 1,769,888 | | |
Silver Spring Networks, Inc.(a) | | | 226,010 | | | | 3,175,441 | | |
Total | | | | | 8,617,171 | | |
Technology Hardware, Storage & Peripherals 0.4% | |
Stratasys Ltd.(a) | | | 85,286 | | | | 2,086,948 | | |
Total Information Technology | | | | | 78,657,479 | | |
MATERIALS 4.3% | |
Chemicals 1.3% | |
Axiall Corp. | | | 124,340 | | | | 2,928,207 | | |
Flotek Industries, Inc.(a) | | | 221,814 | | | | 2,096,143 | | |
Tronox Ltd., Class A | | | 408,804 | | | | 2,976,093 | | |
Total | | | | | 8,000,443 | | |
Containers & Packaging 0.3% | |
Greif, Inc., Class A | | | 51,779 | | | | 1,796,731 | | |
Metals & Mining 2.3% | |
Allegheny Technologies, Inc. | | | 108,350 | | | | 1,770,439 | | |
Commercial Metals Co. | | | 275,000 | | | | 4,928,000 | | |
Common Stocks (continued)
Issuer | | Shares | | Value ($) | |
Olympic Steel, Inc. | | | 112,831 | | | | 2,552,237 | | |
TimkenSteel Corp. | | | 188,010 | | | | 2,395,248 | | |
Universal Stainless & Alloy
Products, Inc.(a) | | | 140,240 | | | | 1,827,327 | | |
Total | | | | | 13,473,251 | | |
Paper & Forest Products 0.4% | |
Louisiana-Pacific Corp.(a) | | | 129,280 | | | | 2,197,760 | | |
Total Materials | | | | | 25,468,185 | | |
TELECOMMUNICATION SERVICES 0.8% | |
Diversified Telecommunication Services 0.3% | |
magicJack VocalTec Ltd.(a) | | | 248,552 | | | | 1,506,225 | | |
Wireless Telecommunication Services 0.5% | |
Shenandoah Telecommunications Co. | | | 103,186 | | | | 2,960,406 | | |
Total Telecommunication Services | | | | | 4,466,631 | | |
UTILITIES 1.8% | |
Electric Utilities 0.8% | |
IDACORP, Inc. | | | 33,694 | | | | 2,450,564 | | |
Portland General Electric Co. | | | 61,169 | | | | 2,429,633 | | |
Total | | | | | 4,880,197 | | |
Gas Utilities 1.0% | |
Southwest Gas Corp. | | | 84,405 | | | | 5,478,729 | | |
Total Utilities | | | | | 10,358,926 | | |
Total Common Stocks
(Cost: $425,909,181) | | | | | 579,519,549 | | |
Money Market Funds 1.7%
| | | Shares | | Value ($) | |
Columbia Short-Term Cash Fund,
0.422%(b)(c) | | | 10,221,763 | | | | 10,221,763 | | |
Total Money Market Funds
(Cost: $10,221,763) | | | | | 10,221,763 | | |
Total Investments
(Cost: $436,130,944) | | | | | 589,741,312 | | |
Other Assets & Liabilities, Net | | | | | (446,186 | ) | |
Net Assets | | | | | 589,295,126 | | |
The accompanying Notes to Financial Statements are an integral part of this statement.
Annual Report 2016
11
COLUMBIA SMALL CAP VALUE FUND I
PORTFOLIO OF INVESTMENTS (continued)
April 30, 2016
Notes to Portfolio of Investments
(a) Non-income producing investment.
(b) As defined in the Investment Company Act of 1940, an affiliated company is one in which the Fund owns 5% or more of the company's outstanding voting securities, or a company which is under common ownership or control with the Fund. Holdings and transactions in these affiliated companies during the year ended April 30, 2016 are as follows:
Issuer | |
Beginning
Cost ($) | |
Purchase
Cost ($) | | Proceeds
From Sales ($) | |
Realized
Gain (Loss) ($) | |
Ending
Cost ($) | | Dividends —
Affiliated
Issuers ($) | |
Value ($) | |
Columbia
Short-Term
Cash Fund | | | 34,684,652 | | | | 289,053,880 | | | | (313,516,769 | ) | | | — | | | | 10,221,763 | | | | 20,376 | | | | 10,221,763 | | |
UCP Inc.,
Class A* | | | 2,879,745 | | | | 2,602,803 | | | | (1,088,964 | ) | | | (342,381 | ) | | | 4,051,203 | | | | — | | | | 3,013,631 | | |
Total | | | 37,564,397 | | | | 291,656,683 | | | | (314,605,733 | ) | | | (342,381 | ) | | | 14,272,966 | | | | 20,376 | | | | 13,235,394 | | |
*Issuer was not an affiliate for the entire period ended April 30, 2016.
(c) The rate shown is the seven-day current annualized yield at April 30, 2016.
Fair Value Measurements
The Fund categorizes its fair value measurements according to a three-level hierarchy that maximizes the use of observable inputs and minimizes the use of unobservable inputs by prioritizing that the most observable input be used when available. Observable inputs are those that market participants would use in pricing an investment based on market data obtained from sources independent of the reporting entity. Unobservable inputs are those that reflect the Fund's assumptions about the information market participants would use in pricing an investment. An investment's level within the fair value hierarchy is based on the lowest level of any input that is deemed significant to the asset's or liability's fair value measurement. The input levels are not necessarily an indication of the risk or liquidity associated with investments at that level. For example, certain U.S. government securities are generally high quality and liquid, however, they are reflected as Level 2 because the inputs used to determine fair value may not always be quoted prices in an active market.
Fair value inputs are summarized in the three broad levels listed below:
> Level 1 — Valuations based on quoted prices for investments in active markets that the Fund has the ability to access at the measurement date (including NAV for open-end mutual funds). Valuation adjustments are not applied to Level 1 investments.
> Level 2 — Valuations based on other significant observable inputs (including quoted prices for similar securities, interest rates, prepayment speeds, credit risks, etc.).
> Level 3 — Valuations based on significant unobservable inputs (including the Fund's own assumptions and judgment in determining the fair value of investments).
Inputs that are used in determining fair value of an investment may include price information, credit data, volatility statistics, and other factors. These inputs can be either observable or unobservable. The availability of observable inputs can vary between investments, and is affected by various factors such as the type of investment, and the volume and level of activity for that investment or similar investments in the marketplace. The inputs will be considered by the Investment Manager, along with any other relevant factors in the calculation of an investment's fair value. The Fund uses prices and inputs that are current as of the measurement date, which may include periods of market dislocations. During these periods, the availability of prices and inputs may be reduced for many investments. This condition could cause an investment to be reclassified between the various levels within the hierarchy.
Certain investments that have been measured at fair value using the net asset value per share (or its equivalent) are not categorized in the fair value hierarchy. The fair value amounts presented in the table are intended to reconcile the fair value hierarchy to the amounts presented in the Portfolio of Investments. The Columbia Short-Term Cash Fund seeks to provide shareholders with maximum current income consistent with liquidity and stability of principal. Investments in Columbia Short-Term Cash Fund may be redeemed on a daily basis without restriction.
Investments falling into the Level 3 category are primarily supported by quoted prices from brokers and dealers participating in the market for those investments. However, these may be classified as Level 3 investments due to lack of market transparency and corroboration to support these quoted prices. Additionally, valuation models may be used as the pricing source for any remaining investments classified as Level 3. These models may rely on one or more significant unobservable inputs and/or significant assumptions by the Investment Manager. Inputs used in valuations may include, but are not limited to, financial statement analysis, capital account balances, discount rates and estimated cash flows, and comparable company data.
The accompanying Notes to Financial Statements are an integral part of this statement.
Annual Report 2016
12
COLUMBIA SMALL CAP VALUE FUND I
PORTFOLIO OF INVESTMENTS (continued)
April 30, 2016
Fair Value Measurements (continued)
Under the direction of the Fund's Board of Trustees (the Board), the Investment Manager's Valuation Committee (the Committee) is responsible for overseeing the valuation procedures approved by the Board. The Committee consists of voting and non-voting members from various groups within the Investment Manager's organization, including operations and accounting, trading and investments, compliance, risk management and legal.
The Committee meets at least monthly to review and approve valuation matters, which may include a description of specific valuation determinations, data regarding pricing information received from approved pricing vendors and brokers and the results of Board-approved valuation control policies and procedures (the Policies). The Policies address, among other things, instances when market quotations are or are not readily available, including recommendations of third party pricing vendors and a determination of appropriate pricing methodologies; events that require specific valuation determinations and assessment of fair value techniques; securities with a potential for stale pricing, including those that are illiquid, restricted, or in default; and the effectiveness of third party pricing vendors, including periodic reviews of vendors. The Committee meets more frequently, as needed, to discuss additional valuation matters, which may include the need to review back-testing results, review time-sensitive information or approve related valuation actions. The Committee reports to the Board, with members of the Committee meeting with the Board at each of its regularly scheduled meetings to discuss valuation matters and actions during the period, similar to those described earlier.
For investments categorized as Level 3, the Committee monitors information similar to that described above, which may include: (i) data specific to the issuer or comparable issuers, (ii) general market or specific sector news and (iii) quoted prices and specific or similar security transactions. The Committee considers this data and any changes from prior periods in order to assess the reasonableness of observable and unobservable inputs, any assumptions or internal models used to value those securities and changes in fair value. This data is also used to corroborate, when available, information received from approved pricing vendors and brokers. Various factors impact the frequency of monitoring this information (which may occur as often as daily). However, the Committee may determine that changes to inputs, assumptions and models are not required as a result of the monitoring procedures performed.
The following table is a summary of the inputs used to value the Fund's investments at April 30, 2016:
| | | Level 1
Quoted Prices in Active
Markets for Identical
Assets ($) | |
Level 2
Other Significant
Observable Inputs ($) | |
Level 3
Significant
Unobservable Inputs ($) | |
Total ($) | |
Investments | |
Common Stocks | |
Consumer Discretionary | | | 60,329,035 | | | | — | | | | — | | | | 60,329,035 | | |
Consumer Staples | | | 13,249,034 | | | | — | | | | — | | | | 13,249,034 | | |
Energy | | | 42,118,194 | | | | — | | | | — | | | | 42,118,194 | | |
Financials | | | 248,610,055 | | | | — | | | | — | | | | 248,610,055 | | |
Health Care | | | 24,393,160 | | | | — | | | | — | | | | 24,393,160 | | |
Industrials | | | 71,868,850 | | | | — | | | | — | | | | 71,868,850 | | |
Information Technology | | | 78,657,479 | | | | — | | | | — | | | | 78,657,479 | | |
Materials | | | 25,468,185 | | | | — | | | | — | | | | 25,468,185 | | |
Telecommunication Services | | | 4,466,631 | | | | — | | | | — | | | | 4,466,631 | | |
Utilities | | | 10,358,926 | | | | — | | | | — | | | | 10,358,926 | | |
Total Common Stocks | | | 579,519,549 | | | | — | | | | — | | | | 579,519,549 | | |
Investments measured at net asset value | |
Money Market Funds | | | — | | | | — | | | | — | | | | 10,221,763 | | |
Total Investments | | | 579,519,549 | | | | — | | | | — | | | | 589,741,312 | | |
See the Portfolio of Investments for all investment classifications not indicated in the table.
There were no transfers of financial assets between levels during the period.
The accompanying Notes to Financial Statements are an integral part of this statement.
Annual Report 2016
13
COLUMBIA SMALL CAP VALUE FUND I
STATEMENT OF ASSETS AND LIABILITIES
April 30, 2016
Assets | |
Investments, at value | |
Unaffiliated issuers (identified cost $425,909,181) | | $ | 579,519,549 | | |
Affiliated issuers (identified cost $10,221,763) | | | 10,221,763 | | |
Total investments (identified cost $436,130,944) | | | 589,741,312 | | |
Receivable for: | |
Investments sold | | | 1,890,336 | | |
Capital shares sold | | | 371,192 | | |
Dividends | | | 95,861 | | |
Foreign tax reclaims | | | 4,679 | | |
Prepaid expenses | | | 1,803 | | |
Trustees' deferred compensation plan | | | 96,616 | | |
Total assets | | | 592,201,799 | | |
Liabilities | |
Payable for: | |
Investments purchased | | | 2,061,694 | | |
Capital shares purchased | | | 524,744 | | |
Investment management fees | | | 13,972 | | |
Distribution and/or service fees | | | 2,449 | | |
Transfer agent fees | | | 112,417 | | |
Compensation of board members | | | 76 | | |
Chief compliance officer expenses | | | 58 | | |
Other expenses | | | 94,647 | | |
Trustees' deferred compensation plan | | | 96,616 | | |
Total liabilities | | | 2,906,673 | | |
Net assets applicable to outstanding capital stock | | $ | 589,295,126 | | |
Represented by | |
Paid-in capital | | $ | 405,775,838 | | |
Undistributed net investment income | | | 33,272 | | |
Accumulated net realized gain | | | 29,876,155 | | |
Unrealized appreciation (depreciation) on: | |
Investments | | | 153,610,368 | | |
Foreign currency translations | | | (507 | ) | |
Total — representing net assets applicable to outstanding capital stock | | $ | 589,295,126 | | |
The accompanying Notes to Financial Statements are an integral part of this statement.
Annual Report 2016
14
COLUMBIA SMALL CAP VALUE FUND I
STATEMENT OF ASSETS AND LIABILITIES (continued)
April 30, 2016
Class A | |
Net assets | | $ | 239,418,901 | | |
Shares outstanding | | | 6,383,746 | | |
Net asset value per share | | $ | 37.50 | | |
Maximum offering price per share(a) | | $ | 39.79 | | |
Class B | |
Net assets | | $ | 954,570 | | |
Shares outstanding | | | 37,692 | | |
Net asset value per share | | $ | 25.33 | | |
Class C | |
Net assets | | $ | 26,846,356 | | |
Shares outstanding | | | 950,704 | | |
Net asset value per share | | $ | 28.24 | | |
Class I | |
Net assets | | $ | 60,451,062 | | |
Shares outstanding | | | 1,481,802 | | |
Net asset value per share | | $ | 40.80 | | |
Class R | |
Net assets | | $ | 2,760,173 | | |
Shares outstanding | | | 73,520 | | |
Net asset value per share | | $ | 37.54 | | |
Class R4 | |
Net assets | | $ | 4,006,654 | | |
Shares outstanding | | | 96,185 | | |
Net asset value per share | | $ | 41.66 | | |
Class R5 | |
Net assets | | $ | 7,115,342 | | |
Shares outstanding | | | 170,879 | | |
Net asset value per share | | $ | 41.64 | | |
Class Y | |
Net assets | | $ | 10,021,582 | | |
Shares outstanding | | | 245,437 | | |
Net asset value per share | | $ | 40.83 | | |
Class Z | |
Net assets | | $ | 237,720,486 | | |
Shares outstanding | | | 5,839,543 | | |
Net asset value per share | | $ | 40.71 | | |
(a) The maximum offering price per share is calculated by dividing the net asset value per share by 1.0 minus the maximum sales charge of 5.75%.
The accompanying Notes to Financial Statements are an integral part of this statement.
Annual Report 2016
15
COLUMBIA SMALL CAP VALUE FUND I
STATEMENT OF OPERATIONS
Year Ended April 30, 2016
Net investment income | |
Income: | |
Dividends — unaffiliated issuers | | $ | 12,941,282 | | |
Dividends — affiliated issuers | | | 20,376 | | |
Foreign taxes withheld | | | (1,434 | ) | |
Total income | | | 12,960,224 | | |
Expenses: | |
Investment management fees | | | 6,684,739 | | |
Distribution and/or service fees | |
Class A | | | 653,179 | | |
Class B | | | 13,661 | | |
Class C | | | 285,741 | | |
Class R | | | 15,814 | | |
Transfer agent fees | |
Class A | | | 540,192 | | |
Class B | | | 2,847 | | |
Class C | | | 59,030 | | |
Class R | | | 6,544 | | |
Class R4 | | | 12,954 | | |
Class R5 | | | 2,898 | | |
Class Z | | | 852,335 | | |
Compensation of board members | | | 31,136 | | |
Custodian fees | | | 24,766 | | |
Printing and postage fees | | | 151,226 | | |
Registration fees | | | 113,043 | | |
Audit fees | | | 24,893 | | |
Legal fees | | | 26,958 | | |
Chief compliance officer expenses | | | 400 | | |
Other | | | 29,897 | | |
Total expenses | | | 9,532,253 | | |
Fees waived or expenses reimbursed by Investment Manager and its affiliates | | | (1,923 | ) | |
Expense reductions | | | (3,436 | ) | |
Total net expenses | | | 9,526,894 | | |
Net investment income | | | 3,433,330 | | |
Realized and unrealized gain (loss) — net | |
Net realized gain (loss) on: | |
Investments | | | 92,215,898 | | |
Net realized gain | | | 92,215,898 | | |
Net change in unrealized appreciation (depreciation) on: | |
Investments | | | (149,292,007 | ) | |
Foreign currency translations | | | 72 | | |
Net change in unrealized depreciation | | | (149,291,935 | ) | |
Net realized and unrealized loss | | | (57,076,037 | ) | |
Net decrease in net assets from operations | | $ | (53,642,707 | ) | |
The accompanying Notes to Financial Statements are an integral part of this statement.
Annual Report 2016
16
COLUMBIA SMALL CAP VALUE FUND I
STATEMENT OF CHANGES IN NET ASSETS
| | | Year Ended
April 30,
2016 | | Year Ended
April 30,
2015 | |
Operations | |
Net investment income | | $ | 3,433,330 | | | $ | 5,458,676 | | |
Net realized gain | | | 92,215,898 | | | | 102,475,109 | | |
Net change in unrealized depreciation | | | (149,291,935 | ) | | | (69,176,369 | ) | |
Net increase (decrease) in net assets resulting from operations | | | (53,642,707 | ) | | | 38,757,416 | | |
Distributions to shareholders | |
Net investment income | |
Class A | | | (778,172 | ) | | | (1,262,553 | ) | |
Class I | | | (387,612 | ) | | | (554,090 | ) | |
Class R | | | (4,134 | ) | | | (3,574 | ) | |
Class R4 | | | (34,007 | ) | | | (74,060 | ) | |
Class R5 | | | (33,337 | ) | | | (27,472 | ) | |
Class Y | | | (49,392 | ) | | | (83,235 | ) | |
Class Z | | | (1,971,771 | ) | | | (4,237,023 | ) | |
Net realized gains | |
Class A | | | (27,922,693 | ) | | | (46,393,552 | ) | |
Class B | | | (203,344 | ) | | | (511,961 | ) | |
Class C | | | (3,861,089 | ) | | | (5,663,497 | ) | |
Class I | | | (6,618,772 | ) | | | (8,962,073 | ) | |
Class R | | | (369,442 | ) | | | (447,532 | ) | |
Class R4 | | | (763,352 | ) | | | (1,594,651 | ) | |
Class R5 | | | (603,651 | ) | | | (473,819 | ) | |
Class Y | | | (843,404 | ) | | | (1,346,279 | ) | |
Class Z | | | (44,260,011 | ) | | | (91,231,104 | ) | |
Total distributions to shareholders | | | (88,704,183 | ) | | | (162,866,475 | ) | |
Decrease in net assets from capital stock activity | | | (357,316,161 | ) | | | (137,246,211 | ) | |
Total decrease in net assets | | | (499,663,051 | ) | | | (261,355,270 | ) | |
Net assets at beginning of year | | | 1,088,958,177 | | | | 1,350,313,447 | | |
Net assets at end of year | | $ | 589,295,126 | | | $ | 1,088,958,177 | | |
Undistributed (excess of distributions over) net investment income | | $ | 33,272 | | | $ | (106,113 | ) | |
The accompanying Notes to Financial Statements are an integral part of this statement.
Annual Report 2016
17
COLUMBIA SMALL CAP VALUE FUND I
STATEMENT OF CHANGES IN NET ASSETS (continued)
| | | Year Ended April 30, 2016 | | Year Ended April 30, 2015 | |
| | | Shares | | Dollars ($) | | Shares | | Dollars ($) | |
Capital stock activity | |
Class A shares | |
Subscriptions(a) | | | 638,944 | | | | 24,505,930 | | | | 781,212 | | | | 35,312,591 | | |
Distributions reinvested | | | 685,345 | | | | 26,289,825 | | | | 1,049,797 | | | | 43,650,546 | | |
Redemptions | | | (2,067,612 | ) | | | (79,432,029 | ) | | | (3,245,472 | ) | | | (147,775,434 | ) | |
Net decrease | | | (743,323 | ) | | | (28,636,274 | ) | | | (1,414,463 | ) | | | (68,812,297 | ) | |
Class B shares | |
Subscriptions | | | 617 | | | | 16,075 | | | | 1,123 | | | | 35,196 | | |
Distributions reinvested | | | 7,136 | | | | 185,535 | | | | 16,018 | | | | 475,253 | | |
Redemptions(a) | | | (40,425 | ) | | | (1,113,591 | ) | | | (56,442 | ) | | | (1,894,637 | ) | |
Net decrease | | | (32,672 | ) | | | (911,981 | ) | | | (39,301 | ) | | | (1,384,188 | ) | |
Class C shares | |
Subscriptions | | | 108,380 | | | | 3,092,788 | | | | 44,884 | | | | 1,529,141 | | |
Distributions reinvested | | | 114,293 | | | | 3,313,349 | | | | 143,862 | | | | 4,688,447 | | |
Redemptions | | | (242,652 | ) | | | (7,040,384 | ) | | | (175,352 | ) | | | (6,331,081 | ) | |
Net increase (decrease) | | | (19,979 | ) | | | (634,247 | ) | | | 13,394 | | | | (113,493 | ) | |
Class I shares | |
Subscriptions | | | 111,600 | | | | 4,997,173 | | | | 386,084 | | | | 19,848,388 | | |
Distributions reinvested | | | 168,255 | | | | 7,006,120 | | | | 212,928 | | | | 9,515,772 | | |
Redemptions | | | (232,699 | ) | | | (9,427,243 | ) | | | (171,729 | ) | | | (7,898,636 | ) | |
Net increase | | | 47,156 | | | | 2,576,050 | | | | 427,283 | | | | 21,465,524 | | |
Class R shares | |
Subscriptions | | | 8,810 | | | | 334,327 | | | | 11,795 | | | | 524,173 | | |
Distributions reinvested | | | 9,716 | | | | 373,576 | | | | 10,823 | | | | 451,106 | | |
Redemptions | | | (30,202 | ) | | | (1,100,834 | ) | | | (7,023 | ) | | | (324,050 | ) | |
Net increase (decrease) | | | (11,676 | ) | | | (392,931 | ) | | | 15,595 | | | | 651,229 | | |
Class R4 shares | |
Subscriptions | | | 54,216 | | | | 2,375,495 | | | | 118,859 | | | | 6,172,315 | | |
Distributions reinvested | | | 18,734 | | | | 797,138 | | | | 36,579 | �� | | | 1,668,383 | | |
Redemptions | | | (185,049 | ) | | | (7,983,153 | ) | | | (131,054 | ) | | | (6,326,375 | ) | |
Net increase (decrease) | | | (112,099 | ) | | | (4,810,520 | ) | | | 24,384 | | | | 1,514,323 | | |
Class R5 shares | |
Subscriptions | | | 130,585 | | | | 5,631,370 | | | | 42,741 | | | | 2,191,492 | | |
Distributions reinvested | | | 14,979 | | | | 636,765 | | | | 11,000 | | | | 500,959 | | |
Redemptions | | | (62,593 | ) | | | (2,703,919 | ) | | | (13,543 | ) | | | (656,779 | ) | |
Net increase | | | 82,971 | | | | 3,564,216 | | | | 40,198 | | | | 2,035,672 | | |
The accompanying Notes to Financial Statements are an integral part of this statement.
Annual Report 2016
18
COLUMBIA SMALL CAP VALUE FUND I
STATEMENT OF CHANGES IN NET ASSETS (continued)
| | | Year Ended April 30, 2016 | | Year Ended April 30, 2015 | |
| | | Shares | | Dollars ($) | | Shares | | Dollars ($) | |
Capital stock activity (continued) | |
Class Y shares | |
Subscriptions | | | 183,997 | | | | 7,709,011 | | | | 83,122 | | | | 4,012,184 | | |
Distributions reinvested | | | 21,415 | | | | 892,568 | | | | 28,182 | | | | 1,260,573 | | |
Redemptions | | | (159,677 | ) | | | (6,619,275 | ) | | | (110,471 | ) | | | (5,331,312 | ) | |
Net increase | | | 45,735 | | | | 1,982,304 | | | | 833 | | | | (58,555 | ) | |
Class Z shares | |
Subscriptions | | | 1,381,342 | | | | 57,252,240 | | | | 2,001,509 | | | | 97,489,427 | | |
Distributions reinvested | | | 852,652 | | | | 35,461,780 | | | | 1,736,404 | | | | 77,565,167 | | |
Redemptions | | | (10,529,071 | ) | | | (422,766,798 | ) | | | (5,550,559 | ) | | | (267,599,020 | ) | |
Net decrease | | | (8,295,077 | ) | | | (330,052,778 | ) | | | (1,812,646 | ) | | | (92,544,426 | ) | |
Total net decrease | | | (9,038,964 | ) | | | (357,316,161 | ) | | | (2,744,723 | ) | | | (137,246,211 | ) | |
(a) Includes conversions of Class B shares to Class A shares, if any.
The accompanying Notes to Financial Statements are an integral part of this statement.
Annual Report 2016
19
COLUMBIA SMALL CAP VALUE FUND I
The following tables are intended to help you understand the Fund's financial performance. Certain information reflects financial results for a single share of a class held for the periods shown. Per share net investment income (loss) amounts are calculated based on average shares outstanding during the period. Total return assumes reinvestment of all dividends and distributions, if any. Total return does not reflect payment of sales charges, if any. Total return and portfolio turnover are not annualized for periods of less than one year. The portfolio turnover rate is calculated without regard to purchase and sales transactions of short-term instruments and certain derivatives, if any. If such transactions were included, the Fund's portfolio turnover rate may be higher.
| | | Year Ended April 30, | | Year Ended
June 30, | |
Class A | | 2016 | | 2015 | | 2014 | | 2013 | | 2012(a) | | 2011 | |
Per share data | |
Net asset value, beginning of period | | $ | 43.03 | | | $ | 48.23 | | | $ | 45.66 | | | $ | 41.67 | | | $ | 46.21 | | | $ | 35.84 | | |
Income from investment operations: | |
Net investment income | | | 0.11 | | | | 0.13 | | | | 0.14 | | | | 0.29 | | | | 0.14 | | | | 0.16 | | |
Net realized and unrealized gain (loss) | | | (1.13 | ) | | | 1.32 | | | | 9.96 | | | | 5.58 | | | | (1.81 | ) | | | 10.80 | | |
Total from investment operations | | | (1.02 | ) | | | 1.45 | | | | 10.10 | | | | 5.87 | | | | (1.67 | ) | | | 10.96 | | |
Less distributions to shareholders: | |
Net investment income | | | (0.12 | ) | | | (0.18 | ) | | | (0.30 | ) | | | (0.24 | ) | | | (0.16 | ) | | | (0.44 | ) | |
Net realized gains | | | (4.39 | ) | | | (6.47 | ) | | | (7.23 | ) | | | (1.64 | ) | | | (2.72 | ) | | | (0.15 | ) | |
Total distributions to shareholders | | | (4.51 | ) | | | (6.65 | ) | | | (7.53 | ) | | | (1.88 | ) | | | (2.88 | ) | | | (0.59 | ) | |
Proceeds from regulatory settlements | | | — | | | | — | | | | — | | | | — | | | | 0.01 | | | | — | | |
Net asset value, end of period | | $ | 37.50 | | | $ | 43.03 | | | $ | 48.23 | | | $ | 45.66 | | | $ | 41.67 | | | $ | 46.21 | | |
Total return | | | (2.60 | %) | | | 3.48 | % | | | 22.95 | % | | | 14.68 | % | | | (3.21 | %)(b) | | | 30.67 | % | |
Ratios to average net assets(c) | |
Total gross expenses | | | 1.36 | % | | | 1.33 | % | | | 1.31 | %(d) | | | 1.32 | % | | | 1.31 | %(e) | | | 1.25 | %(d) | |
Total net expenses(f) | | | 1.36 | %(g) | | | 1.33 | %(g) | | | 1.31 | %(d)(g) | | | 1.32 | %(g) | | | 1.31 | %(e)(g) | | | 1.25 | %(d)(g) | |
Net investment income | | | 0.29 | % | | | 0.29 | % | | | 0.28 | % | | | 0.70 | % | | | 0.41 | %(e) | | | 0.37 | % | |
Supplemental data | |
Net assets, end of period (in thousands) | | $ | 239,419 | | | $ | 306,663 | | | $ | 411,968 | | | $ | 518,968 | | | $ | 587,332 | | | $ | 704,167 | | |
Portfolio turnover | | | 65 | % | | | 42 | % | | | 38 | % | | | 42 | % | | | 23 | % | | | 31 | % | |
Notes to Financial Highlights
(a) For the period from July 1, 2011 to April 30, 2012. During the period, the Fund's fiscal year end was changed from June 30 to April 30.
(b) The Fund received proceeds from regulatory settlements. Had the Fund not received these proceeds, the total return would have been lower by 0.02%.
(c) In addition to the fees and expenses that the Fund bears directly, the Fund indirectly bears a pro rata share of the fees and expenses of any other funds in which it invests. Such indirect expenses are not included in the Fund's reported expense ratios.
(d) Ratios include line of credit interest expense which is less than 0.01%.
(e) Annualized.
(f) Total net expenses include the impact of certain fee waivers/expense reimbursements made by the Investment Manager and certain of its affiliates, if applicable.
(g) The benefits derived from expense reductions had an impact of less than 0.01%.
The accompanying Notes to Financial Statements are an integral part of this statement.
Annual Report 2016
20
COLUMBIA SMALL CAP VALUE FUND I
FINANCIAL HIGHLIGHTS (continued)
| | | Year Ended April 30, | | Year Ended
June 30, | |
Class B | | 2016 | | 2015 | | 2014 | | 2013 | | 2012(a) | | 2011 | |
Per share data | |
Net asset value, beginning of period | | $ | 30.61 | | | $ | 36.31 | | | $ | 35.96 | | | $ | 33.22 | | | $ | 37.54 | | | $ | 29.17 | | |
Income from investment operations: | |
Net investment income (loss) | | | (0.13 | ) | | | (0.15 | ) | | | (0.18 | ) | | | 0.04 | | | | (0.10 | ) | | | (0.13 | ) | |
Net realized and unrealized gain (loss) | | | (0.76 | ) | | | 0.92 | | | | 7.76 | | | | 4.34 | | | | (1.50 | ) | | | 8.80 | | |
Total from investment operations | | | (0.89 | ) | | | 0.77 | | | | 7.58 | | | | 4.38 | | | | (1.60 | ) | | | 8.67 | | |
Less distributions to shareholders: | |
Net investment income | | | — | | | | — | | | | — | | | | — | | | | — | | | | (0.15 | ) | |
Net realized gains | | | (4.39 | ) | | | (6.47 | ) | | | (7.23 | ) | | | (1.64 | ) | | | (2.72 | ) | | | (0.15 | ) | |
Total distributions to shareholders | | | (4.39 | ) | | | (6.47 | ) | | | (7.23 | ) | | | (1.64 | ) | | | (2.72 | ) | | | (0.30 | ) | |
Proceeds from regulatory settlements | | | — | | | | — | | | | — | | | | — | | | | 0.00 | (b) | | | — | | |
Net asset value, end of period | | $ | 25.33 | | | $ | 30.61 | | | $ | 36.31 | | | $ | 35.96 | | | $ | 33.22 | | | $ | 37.54 | | |
Total return | | | (3.28 | %) | | | 2.69 | % | | | 22.02 | % | | | 13.84 | % | | | (3.85 | %)(c) | | | 29.76 | % | |
Ratios to average net assets(d) | |
Total gross expenses | | | 2.12 | % | | | 2.08 | % | | | 2.06 | %(e) | | | 2.06 | % | | | 2.07 | %(f) | | | 2.00 | %(e) | |
Total net expenses(g) | | | 2.11 | %(h) | | | 2.08 | %(h) | | | 2.06 | %(e)(h) | | | 2.06 | %(h) | | | 2.07 | %(f)(h) | | | 2.00 | %(e)(h) | |
Net investment income (loss) | | | (0.47 | %) | | | (0.44 | %) | | | (0.46 | %) | | | 0.11 | % | | | (0.37 | %)(f) | | | (0.38 | %) | |
Supplemental data | |
Net assets, end of period (in thousands) | | $ | 955 | | | $ | 2,154 | | | $ | 3,982 | | | $ | 5,466 | | | $ | 10,427 | | | $ | 17,908 | | |
Portfolio turnover | | | 65 | % | | | 42 | % | | | 38 | % | | | 42 | % | | | 23 | % | | | 31 | % | |
Notes to Financial Highlights
(a) For the period from July 1, 2011 to April 30, 2012. During the period, the Fund's fiscal year end was changed from June 30 to April 30.
(b) Rounds to zero.
(c) The Fund received proceeds from regulatory settlements. Had the Fund not received these proceeds, the total return would have been lower by 0.02%.
(d) In addition to the fees and expenses that the Fund bears directly, the Fund indirectly bears a pro rata share of the fees and expenses of any other funds in which it invests. Such indirect expenses are not included in the Fund's reported expense ratios.
(e) Ratios include line of credit interest expense which is less than 0.01%.
(f) Annualized.
(g) Total net expenses include the impact of certain fee waivers/expense reimbursements made by the Investment Manager and certain of its affiliates, if applicable.
(h) The benefits derived from expense reductions had an impact of less than 0.01%.
The accompanying Notes to Financial Statements are an integral part of this statement.
Annual Report 2016
21
COLUMBIA SMALL CAP VALUE FUND I
FINANCIAL HIGHLIGHTS (continued)
| | | Year Ended April 30, | | Year Ended
June 30, | |
Class C | | 2016 | | 2015 | | 2014 | | 2013 | | 2012(a) | | 2011 | |
Per share data | |
Net asset value, beginning of period | | $ | 33.63 | | | $ | 39.24 | | | $ | 38.36 | | | $ | 35.33 | | | $ | 39.73 | | | $ | 30.87 | | |
Income from investment operations: | |
Net investment loss | | | (0.13 | ) | | | (0.17 | ) | | | (0.19 | ) | | | (0.01 | ) | | | (0.10 | ) | | | (0.14 | ) | |
Net realized and unrealized gain (loss) | | | (0.87 | ) | | | 1.03 | | | | 8.30 | | | | 4.68 | | | | (1.58 | ) | | | 9.30 | | |
Total from investment operations | | | (1.00 | ) | | | 0.86 | | | | 8.11 | | | | 4.67 | | | | (1.68 | ) | | | 9.16 | | |
Less distributions to shareholders: | |
Net investment income | | | — | | | | — | | | | — | | | | — | | | | — | | | | (0.15 | ) | |
Net realized gains | | | (4.39 | ) | | | (6.47 | ) | | | (7.23 | ) | | | (1.64 | ) | | | (2.72 | ) | | | (0.15 | ) | |
Total distributions to shareholders | | | (4.39 | ) | | | (6.47 | ) | | | (7.23 | ) | | | (1.64 | ) | | | (2.72 | ) | | | (0.30 | ) | |
Proceeds from regulatory settlements | | | — | | | | — | | | | — | | | | — | | | | 0.00 | (b) | | | — | | |
Net asset value, end of period | | $ | 28.24 | | | $ | 33.63 | | | $ | 39.24 | | | $ | 38.36 | | | $ | 35.33 | | | $ | 39.73 | | |
Total return | | | (3.32 | %) | | | 2.72 | % | | | 22.03 | % | | | 13.83 | % | | | (3.84 | %)(c) | | | 29.71 | % | |
Ratios to average net assets(d) | |
Total gross expenses | | | 2.12 | % | | | 2.08 | % | | | 2.06 | %(e) | | | 2.07 | % | | | 2.06 | %(f) | | | 2.00 | %(e) | |
Total net expenses(g) | | | 2.11 | %(h) | | | 2.08 | %(h) | | | 2.06 | %(e)(h) | | | 2.07 | %(h) | | | 2.06 | %(f)(h) | | | 2.00 | %(e)(h) | |
Net investment loss | | | (0.45 | %) | | | (0.47 | %) | | | (0.48 | %) | | | (0.04 | %) | | | (0.34 | %)(f) | | | (0.38 | %) | |
Supplemental data | |
Net assets, end of period (in thousands) | | $ | 26,846 | | | $ | 32,642 | | | $ | 37,568 | | | $ | 36,007 | | | $ | 42,092 | | | $ | 52,248 | | |
Portfolio turnover | | | 65 | % | | | 42 | % | | | 38 | % | | | 42 | % | | | 23 | % | | | 31 | % | |
Notes to Financial Highlights
(a) For the period from July 1, 2011 to April 30, 2012. During the period, the Fund's fiscal year end was changed from June 30 to April 30.
(b) Rounds to zero.
(c) The Fund received proceeds from regulatory settlements. Had the Fund not received these proceeds, the total return would have been lower by 0.02%.
(d) In addition to the fees and expenses that the Fund bears directly, the Fund indirectly bears a pro rata share of the fees and expenses of any other funds in which it invests. Such indirect expenses are not included in the Fund's reported expense ratios.
(e) Ratios include line of credit interest expense which is less than 0.01%.
(f) Annualized.
(g) Total net expenses include the impact of certain fee waivers/expense reimbursements made by the Investment Manager and certain of its affiliates, if applicable.
(h) The benefits derived from expense reductions had an impact of less than 0.01%.
The accompanying Notes to Financial Statements are an integral part of this statement.
Annual Report 2016
22
COLUMBIA SMALL CAP VALUE FUND I
FINANCIAL HIGHLIGHTS (continued)
| | | Year Ended April 30, | | Year Ended
June 30, | |
Class I | | 2016 | | 2015 | | 2014 | | 2013 | | 2012(a) | | 2011(b) | |
Per share data | |
Net asset value, beginning of period | | $ | 46.34 | | | $ | 51.43 | | | $ | 48.25 | | | $ | 43.93 | | | $ | 48.60 | | | $ | 40.40 | | |
Income from investment operations: | |
Net investment income | | | 0.31 | | | | 0.36 | | | | 0.39 | | | | 0.52 | | | | 0.31 | | | | 0.30 | | |
Net realized and unrealized gain (loss) | | | (1.20 | ) | | | 1.42 | | | | 10.55 | | | | 5.87 | | | | (1.90 | ) | | | 8.66 | | |
Total from investment operations | | | (0.89 | ) | | | 1.78 | | | | 10.94 | | | | 6.39 | | | | (1.59 | ) | | | 8.96 | | |
Less distributions to shareholders: | |
Net investment income | | | (0.26 | ) | | | (0.40 | ) | | | (0.53 | ) | | | (0.43 | ) | | | (0.37 | ) | | | (0.61 | ) | |
Net realized gains | | | (4.39 | ) | | | (6.47 | ) | | | (7.23 | ) | | | (1.64 | ) | | | (2.72 | ) | | | (0.15 | ) | |
Total distributions to shareholders | | | (4.65 | ) | | | (6.87 | ) | | | (7.76 | ) | | | (2.07 | ) | | | (3.09 | ) | | | (0.76 | ) | |
Proceeds from regulatory settlements | | | — | | | | — | | | | — | | | | — | | | | 0.01 | | | | — | | |
Net asset value, end of period | | $ | 40.80 | | | $ | 46.34 | | | $ | 51.43 | | | $ | 48.25 | | | $ | 43.93 | | | $ | 48.60 | | |
Total return | | | (2.13 | %) | | | 3.96 | % | | | 23.51 | % | | | 15.19 | % | | | (2.85 | %)(c) | | | 22.29 | % | |
Ratios to average net assets(d) | |
Total gross expenses | | | 0.91 | % | | | 0.88 | % | | | 0.86 | %(e) | | | 0.87 | % | | | 0.86 | %(f) | | | 0.83 | %(e)(f) | |
Total net expenses(g) | | | 0.91 | % | | | 0.88 | % | | | 0.86 | %(e) | | | 0.87 | % | | | 0.86 | %(f) | | | 0.83 | %(e)(f)(h) | |
Net investment income | | | 0.75 | % | | | 0.73 | % | | | 0.74 | % | | | 1.17 | % | | | 0.85 | %(f) | | | 0.84 | %(f) | |
Supplemental data | |
Net assets, end of period (in thousands) | | $ | 60,451 | | | $ | 66,478 | | | $ | 51,812 | | | $ | 59,690 | | | $ | 54,312 | | | $ | 75,716 | | |
Portfolio turnover | | | 65 | % | | | 42 | % | | | 38 | % | | | 42 | % | | | 23 | % | | | 31 | % | |
Notes to Financial Highlights
(a) For the period from July 1, 2011 to April 30, 2012. During the period, the Fund's fiscal year end was changed from June 30 to April 30.
(b) Based on operations from September 27, 2010 (commencement of operations) through the stated period end.
(c) The Fund received proceeds from regulatory settlements. Had the Fund not received these proceeds, the total return would have been lower by 0.02%.
(d) In addition to the fees and expenses that the Fund bears directly, the Fund indirectly bears a pro rata share of the fees and expenses of any other funds in which it invests. Such indirect expenses are not included in the Fund's reported expense ratios.
(e) Ratios include line of credit interest expense which is less than 0.01%.
(f) Annualized.
(g) Total net expenses include the impact of certain fee waivers/expense reimbursements made by the Investment Manager and certain of its affiliates, if applicable.
(h) The benefits derived from expense reductions had an impact of less than 0.01%.
The accompanying Notes to Financial Statements are an integral part of this statement.
Annual Report 2016
23
COLUMBIA SMALL CAP VALUE FUND I
FINANCIAL HIGHLIGHTS (continued)
| | | Year Ended April 30, | | Year Ended
June 30, | |
Class R | | 2016 | | 2015 | | 2014 | | 2013 | | 2012(a) | | 2011(b) | |
Per share data | |
Net asset value, beginning of period | | $ | 43.09 | | | $ | 48.28 | | | $ | 45.70 | | | $ | 41.70 | | | $ | 46.23 | | | $ | 38.43 | | |
Income from investment operations: | |
Net investment income | | | 0.02 | | | | 0.01 | | | | 0.01 | | | | 0.14 | | | | 0.12 | | | | 0.09 | | |
Net realized and unrealized gain (loss) | | | (1.13 | ) | | | 1.32 | | | | 9.98 | | | | 5.63 | | | | (1.86 | ) | | | 8.22 | | |
Total from investment operations | | | (1.11 | ) | | | 1.33 | | | | 9.99 | | | | 5.77 | | | | (1.74 | ) | | | 8.31 | | |
Less distributions to shareholders: | |
Net investment income | | | (0.05 | ) | | | (0.05 | ) | | | (0.18 | ) | | | (0.13 | ) | | | (0.08 | ) | | | (0.36 | ) | |
Net realized gains | | | (4.39 | ) | | | (6.47 | ) | | | (7.23 | ) | | | (1.64 | ) | | | (2.72 | ) | | | (0.15 | ) | |
Total distributions to shareholders | | | (4.44 | ) | | | (6.52 | ) | | | (7.41 | ) | | | (1.77 | ) | | | (2.80 | ) | | | (0.51 | ) | |
Proceeds from regulatory settlements | | | — | | | | — | | | | — | | | | — | | | | 0.01 | | | | — | | |
Net asset value, end of period | | $ | 37.54 | | | $ | 43.09 | | | $ | 48.28 | | | $ | 45.70 | | | $ | 41.70 | | | $ | 46.23 | | |
Total return | | | (2.83 | %) | | | 3.22 | % | | | 22.65 | % | | | 14.40 | % | | | (3.37 | %)(c) | | | 21.68 | % | |
Ratios to average net assets(d) | |
Total gross expenses | | | 1.61 | % | | | 1.58 | % | | | 1.56 | %(e) | | | 1.57 | % | | | 1.53 | %(f) | | | 1.50 | %(e)(f) | |
Total net expenses(g) | | | 1.61 | %(h) | | | 1.58 | %(h) | | | 1.56 | %(e)(h) | | | 1.57 | %(h) | | | 1.53 | %(f)(h) | | | 1.50 | %(e)(f)(h) | |
Net investment income | | | 0.06 | % | | | 0.01 | % | | | 0.01 | % | | | 0.33 | % | | | 0.34 | %(f) | | | 0.27 | %(f) | |
Supplemental data | |
Net assets, end of period (in thousands) | | $ | 2,760 | | | $ | 3,671 | | | $ | 3,360 | | | $ | 2,240 | | | $ | 1,869 | | | $ | 21 | | |
Portfolio turnover | | | 65 | % | | | 42 | % | | | 38 | % | | | 42 | % | | | 23 | % | | | 31 | % | |
Notes to Financial Highlights
(a) For the period from July 1, 2011 to April 30, 2012. During the period, the Fund's fiscal year end was changed from June 30 to April 30.
(b) Based on operations from September 27, 2010 (commencement of operations) through the stated period end.
(c) The Fund received proceeds from regulatory settlements. Had the Fund not received these proceeds, the total return would have been lower by 0.02%.
(d) In addition to the fees and expenses that the Fund bears directly, the Fund indirectly bears a pro rata share of the fees and expenses of any other funds in which it invests. Such indirect expenses are not included in the Fund's reported expense ratios.
(e) Ratios include line of credit interest expense which is less than 0.01%.
(f) Annualized.
(g) Total net expenses include the impact of certain fee waivers/expense reimbursements made by the Investment Manager and certain of its affiliates, if applicable.
(h) The benefits derived from expense reductions had an impact of less than 0.01%.
The accompanying Notes to Financial Statements are an integral part of this statement.
Annual Report 2016
24
COLUMBIA SMALL CAP VALUE FUND I
FINANCIAL HIGHLIGHTS (continued)
| | | Year Ended April 30, | |
Class R4 | | 2016 | | 2015 | | 2014 | | 2013(a) | |
Per share data | |
Net asset value, beginning of period | | $ | 47.24 | | | $ | 52.31 | | | $ | 48.96 | | | $ | 43.31 | | |
Income from investment operations: | |
Net investment income | | | 0.24 | | | | 0.27 | | | | 0.27 | | | | 0.22 | | |
Net realized and unrealized gain (loss) | | | (1.24 | ) | | | 1.43 | | | | 10.73 | | | | 7.42 | | |
Total from investment operations | | | (1.00 | ) | | | 1.70 | | | | 11.00 | | | | 7.64 | | |
Less distributions to shareholders: | |
Net investment income | | | (0.19 | ) | | | (0.30 | ) | | | (0.42 | ) | | | (0.35 | ) | |
Net realized gains | | | (4.39 | ) | | | (6.47 | ) | | | (7.23 | ) | | | (1.64 | ) | |
Total distributions to shareholders | | | (4.58 | ) | | | (6.77 | ) | | | (7.65 | ) | | | (1.99 | ) | |
Net asset value, end of period | | $ | 41.66 | | | $ | 47.24 | | | $ | 52.31 | | | $ | 48.96 | | |
Total return | | | (2.31 | %) | | | 3.71 | % | | | 23.26 | % | | | 18.27 | % | |
Ratios to average net assets(b) | |
Total gross expenses | | | 1.11 | % | | | 1.08 | % | | | 1.06 | %(c) | | | 0.99 | %(d) | |
Total net expenses(e) | | | 1.11 | %(f) | | | 1.08 | %(f) | | | 1.06 | %(c)(f) | | | 0.99 | %(d) | |
Net investment income | | | 0.56 | % | | | 0.53 | % | | | 0.51 | % | | | 1.00 | %(d) | |
Supplemental data | |
Net assets, end of period (in thousands) | | $ | 4,007 | | | $ | 9,840 | | | $ | 9,620 | | | $ | 3 | | |
Portfolio turnover | | | 65 | % | | | 42 | % | | | 38 | % | | | 42 | % | |
Notes to Financial Highlights
(a) Based on operations from November 8, 2012 (commencement of operations) through the stated period end.
(b) In addition to the fees and expenses that the Fund bears directly, the Fund indirectly bears a pro rata share of the fees and expenses of any other funds in which it invests. Such indirect expenses are not included in the Fund's reported expense ratios.
(c) Ratios include line of credit interest expense which is less than 0.01%.
(d) Annualized.
(e) Total net expenses include the impact of certain fee waivers/expense reimbursements made by the Investment Manager and certain of its affiliates, if applicable.
(f) The benefits derived from expense reductions had an impact of less than 0.01%.
The accompanying Notes to Financial Statements are an integral part of this statement.
Annual Report 2016
25
COLUMBIA SMALL CAP VALUE FUND I
FINANCIAL HIGHLIGHTS (continued)
| | | Year Ended April 30, | |
Class R5 | | 2016 | | 2015 | | 2014 | | 2013(a) | |
Per share data | |
Net asset value, beginning of period | | $ | 47.21 | | | $ | 52.27 | | | $ | 48.93 | | | $ | 43.31 | | |
Income from investment operations: | |
Net investment income | | | 0.31 | | | | 0.33 | | | | 0.32 | | | | 0.24 | | |
Net realized and unrealized gain (loss) | | | (1.25 | ) | | | 1.46 | | | | 10.75 | | | | 7.41 | | |
Total from investment operations | | | (0.94 | ) | | | 1.79 | | | | 11.07 | | | | 7.65 | | |
Less distributions to shareholders: | |
Net investment income | | | (0.24 | ) | | | (0.38 | ) | | | (0.50 | ) | | | (0.39 | ) | |
Net realized gains | | | (4.39 | ) | | | (6.47 | ) | | | (7.23 | ) | | | (1.64 | ) | |
Total distributions to shareholders | | | (4.63 | ) | | | (6.85 | ) | | | (7.73 | ) | | | (2.03 | ) | |
Net asset value, end of period | | $ | 41.64 | | | $ | 47.21 | | | $ | 52.27 | | | $ | 48.93 | | |
Total return | | | (2.19 | %) | | | 3.90 | % | | | 23.44 | % | | | 18.31 | % | |
Ratios to average net assets(b) | |
Total gross expenses | | | 0.96 | % | | | 0.93 | % | | | 0.91 | %(c) | | | 0.89 | %(d) | |
Total net expenses(e) | | | 0.96 | % | | | 0.93 | % | | | 0.91 | %(c) | | | 0.89 | %(d) | |
Net investment income | | | 0.74 | % | | | 0.67 | % | | | 0.61 | % | | | 1.10 | %(d) | |
Supplemental data | |
Net assets, end of period (in thousands) | | $ | 7,115 | | | $ | 4,150 | | | $ | 2,494 | | | $ | 3 | | |
Portfolio turnover | | | 65 | % | | | 42 | % | | | 38 | % | | | 42 | % | |
Notes to Financial Highlights
(a) Based on operations from November 8, 2012 (commencement of operations) through the stated period end.
(b) In addition to the fees and expenses that the Fund bears directly, the Fund indirectly bears a pro rata share of the fees and expenses of any other funds in which it invests. Such indirect expenses are not included in the Fund's reported expense ratios.
(c) Ratios include line of credit interest expense which is less than 0.01%.
(d) Annualized.
(e) Total net expenses include the impact of certain fee waivers/expense reimbursements made by the Investment Manager and certain of its affiliates, if applicable.
The accompanying Notes to Financial Statements are an integral part of this statement.
Annual Report 2016
26
COLUMBIA SMALL CAP VALUE FUND I
FINANCIAL HIGHLIGHTS (continued)
| | | Year Ended April 30, | | Year Ended
June 30, | |
Class Y | | 2016 | | 2015 | | 2014 | | 2013 | | 2012(a) | | 2011 | |
Per share data | |
Net asset value, beginning of period | | $ | 46.37 | | | $ | 51.46 | | | $ | 48.26 | | | $ | 43.93 | | | $ | 48.60 | | | $ | 37.63 | | |
Income from investment operations: | |
Net investment income | | | 0.29 | | | | 0.36 | | | | 0.31 | | | | 0.50 | | | | 0.31 | | | | 0.37 | | |
Net realized and unrealized gain (loss) | | | (1.18 | ) | | | 1.42 | | | | 10.63 | | | | 5.90 | | | | (1.90 | ) | | | 11.36 | | |
Total from investment operations | | | (0.89 | ) | | | 1.78 | | | | 10.94 | | | | 6.40 | | | | (1.59 | ) | | | 11.73 | | |
Less distributions to shareholders: | |
Net investment income | | | (0.26 | ) | | | (0.40 | ) | | | (0.51 | ) | | | (0.43 | ) | | | (0.37 | ) | | | (0.61 | ) | |
Net realized gains | | | (4.39 | ) | | | (6.47 | ) | | | (7.23 | ) | | | (1.64 | ) | | | (2.72 | ) | | | (0.15 | ) | |
Total distributions to shareholders | | | (4.65 | ) | | | (6.87 | ) | | | (7.74 | ) | | | (2.07 | ) | | | (3.09 | ) | | | (0.76 | ) | |
Proceeds from regulatory settlements | | | — | | | | — | | | | — | | | | — | | | | 0.01 | | | | — | | |
Net asset value, end of period | | $ | 40.83 | | | $ | 46.37 | | | $ | 51.46 | | | $ | 48.26 | | | $ | 43.93 | | | $ | 48.60 | | |
Total return | | | (2.13 | %) | | | 3.95 | % | | | 23.50 | % | | | 15.20 | % | | | (2.86 | %)(b) | | | 31.27 | % | |
Ratios to average net assets(c) | |
Total gross expenses | | | 0.91 | % | | | 0.88 | % | | | 0.87 | %(d) | | | 0.87 | % | | | 0.86 | %(e) | | | 0.81 | %(d) | |
Total net expenses(f) | | | 0.91 | % | | | 0.88 | % | | | 0.87 | %(d) | | | 0.87 | % | | | 0.86 | %(e) | | | 0.81 | %(d)(g) | |
Net investment income | | | 0.70 | % | | | 0.74 | % | | | 0.61 | % | | | 1.14 | % | | | 0.85 | %(e) | | | 0.82 | % | |
Supplemental data | |
Net assets, end of period (in thousands) | | $ | 10,022 | | | $ | 9,261 | | | $ | 10,234 | | | $ | 1,229 | | | $ | 1,056 | | | $ | 1,323 | | |
Portfolio turnover | | | 65 | % | | | 42 | % | | | 38 | % | | | 42 | % | | | 23 | % | | | 31 | % | |
Notes to Financial Highlights
(a) For the period from July 1, 2011 to April 30, 2012. During the period, the Fund's fiscal year end was changed from June 30 to April 30.
(b) The Fund received proceeds from regulatory settlements. Had the Fund not received these proceeds, the total return would have been lower by 0.02%.
(c) In addition to the fees and expenses that the Fund bears directly, the Fund indirectly bears a pro rata share of the fees and expenses of any other funds in which it invests. Such indirect expenses are not included in the Fund's reported expense ratios.
(d) Ratios include line of credit interest expense which is less than 0.01%.
(e) Annualized.
(f) Total net expenses include the impact of certain fee waivers/expense reimbursements made by the Investment Manager and certain of its affiliates, if applicable.
(g) The benefits derived from expense reductions had an impact of less than 0.01%.
The accompanying Notes to Financial Statements are an integral part of this statement.
Annual Report 2016
27
COLUMBIA SMALL CAP VALUE FUND I
FINANCIAL HIGHLIGHTS (continued)
| | | Year Ended April 30, | | Year Ended
June 30, | |
Class Z | | 2016 | | 2015 | | 2014 | | 2013 | | 2012(a) | | 2011 | |
Per share data | |
Net asset value, beginning of period | | $ | 46.28 | | | $ | 51.37 | | | $ | 48.21 | | | $ | 43.89 | | | $ | 48.53 | | | $ | 37.60 | | |
Income from investment operations: | |
Net investment income | | | 0.23 | | | | 0.27 | | | | 0.27 | | | | 0.41 | | | | 0.24 | | | | 0.28 | | |
Net realized and unrealized gain (loss) | | | (1.22 | ) | | | 1.41 | | | | 10.55 | | | | 5.89 | | | | (1.89 | ) | | | 11.34 | | |
Total from investment operations | | | (0.99 | ) | | | 1.68 | | | | 10.82 | | | | 6.30 | | | | (1.65 | ) | | | 11.62 | | |
Less distributions to shareholders: | |
Net investment income | | | (0.19 | ) | | | (0.30 | ) | | | (0.43 | ) | | | (0.34 | ) | | | (0.28 | ) | | | (0.54 | ) | |
Net realized gains | | | (4.39 | ) | | | (6.47 | ) | | | (7.23 | ) | | | (1.64 | ) | | | (2.72 | ) | | | (0.15 | ) | |
Total distributions to shareholders | | | (4.58 | ) | | | (6.77 | ) | | | (7.66 | ) | | | (1.98 | ) | | | (3.00 | ) | | | (0.69 | ) | |
Proceeds from regulatory settlements | | | — | | | | — | | | | — | | | | — | | | | 0.01 | | | | — | | |
Net asset value, end of period | | $ | 40.71 | | | $ | 46.28 | | | $ | 51.37 | | | $ | 48.21 | | | $ | 43.89 | | | $ | 48.53 | | |
Total return | | | (2.34 | %) | | | 3.75 | % | | | 23.24 | % | | | 14.97 | % | | | (3.00 | %)(b) | | | 31.00 | % | |
Ratios to average net assets(c) | |
Total gross expenses | | | 1.11 | % | | | 1.08 | % | | | 1.06 | %(d) | | | 1.07 | % | | | 1.06 | %(e) | | | 1.00 | %(d) | |
Total net expenses(f) | | | 1.11 | %(g) | | | 1.08 | %(g) | | | 1.06 | %(d)(g) | | | 1.07 | %(g) | | | 1.06 | %(e)(g) | | | 1.00 | %(d)(g) | |
Net investment income | | | 0.54 | % | | | 0.54 | % | | | 0.53 | % | | | 0.93 | % | | | 0.67 | %(e) | | | 0.62 | % | |
Supplemental data | |
Net assets, end of period (in thousands) | | $ | 237,720 | | | $ | 654,100 | | | $ | 819,275 | | | $ | 928,340 | | | $ | 1,051,352 | | | $ | 1,109,078 | | |
Portfolio turnover | | | 65 | % | | | 42 | % | | | 38 | % | | | 42 | % | | | 23 | % | | | 31 | % | |
Notes to Financial Highlights
(a) For the period from July 1, 2011 to April 30, 2012. During the period, the Fund's fiscal year end was changed from June 30 to April 30.
(b) The Fund received proceeds from regulatory settlements. Had the Fund not received these proceeds, the total return would have been lower by 0.02%.
(c) In addition to the fees and expenses that the Fund bears directly, the Fund indirectly bears a pro rata share of the fees and expenses of any other funds in which it invests. Such indirect expenses are not included in the Fund's reported expense ratios.
(d) Ratios include line of credit interest expense which is less than 0.01%.
(e) Annualized.
(f) Total net expenses include the impact of certain fee waivers/expense reimbursements made by the Investment Manager and certain of its affiliates, if applicable.
(g) The benefits derived from expense reductions had an impact of less than 0.01%.
The accompanying Notes to Financial Statements are an integral part of this statement.
Annual Report 2016
28
COLUMBIA SMALL CAP VALUE FUND I
NOTES TO FINANCIAL STATEMENTS
April 30, 2016
Note 1. Organization
Columbia Small Cap Value Fund I (the Fund), a series of Columbia Funds Series Trust I (the Trust), is a diversified fund. The Trust is registered under the Investment Company Act of 1940, as amended (the 1940 Act), as an open-end management investment company organized as a Massachusetts business trust.
Fund Shares
The Trust may issue an unlimited number of shares (without par value). The Fund offers Class A, Class B, Class C, Class I, Class R, Class R4, Class R5, Class Y and Class Z shares. Although all share classes generally have identical voting, dividend and liquidation rights, each share class votes separately when required by the Trust's organizational documents or by law. Different share classes pay different distribution amounts to the extent the expenses of such share classes differ, and distributions in liquidation will be proportional to the net asset value of each share class. Each share class has its own expense and sales charge structure.
Class A shares are subject to a maximum front-end sales charge of 5.75% based on the initial investment amount. Class A shares purchased without an initial sales charge in accounts aggregating $1 million to $50 million at the time of purchase are subject to a contingent deferred sales charge (CDSC) if the shares are sold within 18 months after purchase, charged as follows: 1.00% CDSC if redeemed within 12 months after purchase, and 0.50% CDSC if redeemed more than 12, but less than 18, months after purchase.
Class B shares may be subject to a maximum CDSC of 5.00% based upon the holding period after purchase. Class B shares will generally convert to Class A shares eight years after purchase. The Fund no longer accepts investments by new or existing investors in the Fund's Class B shares, except in connection with the reinvestment of any dividend and/or capital gain distributions in Class B shares of the Fund and exchanges by existing Class B shareholders of certain other funds within the Columbia Family of Funds.
Class C shares are subject to a 1.00% CDSC on shares redeemed within 12 months after purchase.
Class I shares are not subject to sales charges and are available only to the Columbia Family of Funds.
Class R shares are not subject to sales charges and are generally available only to certain retirement plans and other investors as described in the Fund's prospectus.
Class R4 shares are not subject to sales charges and are generally available only to omnibus retirement plans and certain investors as described in the Fund's prospectus.
Class R5 shares are not subject to sales charges and are generally available only to investors purchasing through authorized investment professionals and omnibus retirement plans.
Class Y shares are not subject to sales charges and are generally available only to certain retirement plans as described in the Fund's prospectus.
Class Z shares are not subject to sales charges and are available only to eligible investors, which are subject to different investment minimums as described in the Fund's prospectus.
Note 2. Summary of Significant Accounting Policies
Basis of Preparation
The Fund is an investment company that applies the accounting and reporting guidance in the Financial Accounting Standards Board (FASB) Accounting Standards Codification Topic 946, Financial Services — Investment Companies (ASC 946). The financial statements are prepared in accordance with U.S. generally accepted accounting principles (GAAP), which requires management to make certain estimates and assumptions that affect the reported amounts of assets and liabilities, the disclosure of contingent assets and liabilities at the date of the financial statements and the reported amounts of income and expenses during the reporting period. Actual results could differ from those estimates.
The following is a summary of significant accounting policies followed by the Fund in the preparation of its financial statements.
Security Valuation
All equity securities are valued at the close of business of the New York Stock Exchange (NYSE). Equity securities are valued at the last quoted sales price on the principal exchange or market on which they trade, except for securities traded on the NASDAQ Stock Market, which are valued at the NASDAQ official close price. Unlisted securities or listed securities for which there were no sales during the day are valued at the mean of the latest quoted bid and ask prices on such exchanges or markets.
Annual Report 2016
29
COLUMBIA SMALL CAP VALUE FUND I
NOTES TO FINANCIAL STATEMENTS (continued)
April 30, 2016
Foreign equity securities are valued based on the closing price on the foreign exchange in which such securities are primarily traded. If any foreign equity security closing prices are not readily available, the securities are valued at the mean of the latest quoted bid and ask prices on such exchanges or markets. Foreign currency exchange rates are generally determined at 4:00 p.m. Eastern (U.S.) time. Many securities markets and exchanges outside the U.S. close prior to the close of the NYSE; therefore, the closing prices for securities in such markets or on such exchanges may not fully reflect events that occur after such close but before the close of the NYSE. In those situations, foreign securities will be fair valued pursuant to a policy adopted by the Board of Trustees (the Board), including, if available, utilizing a third party pricing service to determine these fair values. The third party pricing service takes into account multiple factors, including, but not limited to, movements in the U.S. securities markets, certain depositary receipts, futures contracts and foreign exchange rates that have occurred subsequent to the close of the foreign exchange or market, to determine a good faith estimate that reasonably reflects the current market conditions as of the close of the NYSE. The fair value of a security is likely to be different from the quoted or published price, if available.
Investments in open-end investment companies, including money market funds, are valued at their latest net asset value.
Investments for which market quotations are not readily available, or that have quotations which management believes are not reflective of market value or reliable, are valued at fair value as determined in good faith under procedures approved by and under the general supervision of the Board. If a security or class of securities (such as foreign securities) is valued at fair value, such value is likely to be different from the quoted or published price for the security.
The determination of fair value often requires significant judgment. To determine fair value, management may use assumptions including but not limited to future cash flows and estimated risk premiums. Multiple inputs from various sources may be used to determine fair value.
GAAP requires disclosure regarding the inputs and valuation techniques used to measure fair value and any changes in valuation inputs or techniques. In addition, investments shall be disclosed by major category. This information is disclosed following the Fund's Portfolio of Investments.
Foreign Currency Transactions and Translations
The values of all assets and liabilities denominated in foreign currencies are generally translated into U.S. dollars at exchange rates determined at the close of the NYSE on any given day. Net realized and unrealized gains (losses) on foreign currency transactions and translations include gains (losses) arising from the fluctuation in exchange rates between trade and settlement dates on securities transactions, gains (losses) arising from the disposition of foreign currency and currency gains (losses) between the accrual and payment dates on dividends, interest income and foreign withholding taxes.
For financial statement purposes, the Fund does not distinguish that portion of gains (losses) on investments which is due to changes in foreign exchange rates from that which is due to changes in market prices of the investments. Such fluctuations are included with the net realized and unrealized gains (losses) on investments in the Statement of Operations.
Security Transactions
Security transactions are accounted for on the trade date. Cost is determined and gains (losses) are based upon the specific identification method for both financial statement and federal income tax purposes.
Income Recognition
Corporate actions and dividend income are generally recorded net of any non-reclaimable tax withholdings, on the ex-dividend date or upon receipt of ex-dividend notification in the case of certain foreign securities.
The Fund may receive distributions from holdings in equity securities, business development companies (BDCs), exchange-traded funds, other regulated investment companies (RICs), and real estate investment trusts (REITs), which report information on the tax character of their distributions annually. These distributions are allocated to dividend income, capital gain and return of capital based on actual information reported. Return of capital is recorded as a reduction of the cost basis of securities held. If the Fund no longer owns the applicable securities, return of capital is recorded as a realized gain. With respect to REITs, to the extent actual information has not yet been reported, estimates for return of capital are made by the Fund's management. Management's estimates are subsequently adjusted when the actual character of the distributions is disclosed by the REITs, which could result
Annual Report 2016
30
COLUMBIA SMALL CAP VALUE FUND I
NOTES TO FINANCIAL STATEMENTS (continued)
April 30, 2016
in a proportionate change in return of capital to shareholders.
Awards from class action litigation are recorded as a reduction of cost basis if the Fund still owns the applicable securities on the payment date. If the Fund no longer owns the applicable securities, the proceeds are recorded as realized gains.
Expenses
General expenses of the Trust are allocated to the Fund and other funds of the Trust based upon relative net assets or other expense allocation methodologies determined by the nature of the expense. Expenses directly attributable to the Fund are charged to the Fund. Expenses directly attributable to a specific class of shares are charged to that share class.
Determination of Class Net Asset Value
All income, expenses (other than class-specific expenses, which are charged to that share class, as shown in the Statement of Operations) and realized and unrealized gains (losses) are allocated to each class of the Fund on a daily basis, based on the relative net assets of each class, for purposes of determining the net asset value of each class.
Federal Income Tax Status
The Fund intends to qualify each year as a regulated investment company under Subchapter M of the Internal Revenue Code, as amended, and will distribute substantially all of its taxable income (including net short-term capital gains), if any, for its tax year, and as such will not be subject to federal income taxes. In addition, the Fund intends to distribute in each calendar year substantially all of its net investment income, capital gains and certain other amounts, if any, such that the Fund should not be subject to federal excise tax. Therefore, no federal income or excise tax provision is recorded.
Foreign Taxes
The Fund may be subject to foreign taxes on income, gains on investments or currency repatriation, a portion of which may be recoverable. The Fund will accrue such taxes and recoveries, as applicable, based upon its current interpretation of tax rules and regulations that exist in the markets in which it invests.
Realized gains in certain countries may be subject to foreign taxes at the Fund level, based on statutory rates. The Fund accrues for such foreign taxes on realized and unrealized gains at the appropriate rate for each
jurisdiction, as applicable. The amount, if any, is disclosed as a liability on the Statement of Assets and Liabilities.
Distributions to Shareholders
Distributions from net investment income, if any, are declared and paid at least annually. Net realized capital gains, if any, are distributed along with the income distribution. Income distributions and capital gain distributions are determined in accordance with federal income tax regulations, which may differ from GAAP.
Guarantees and Indemnifications
Under the Trust's organizational documents and, in some cases, by contract, its officers and trustees are indemnified against certain liabilities arising out of the performance of their duties to the Trust or its funds. In addition, certain of the Fund's contracts with its service providers contain general indemnification clauses. The Fund's maximum exposure under these arrangements is unknown since the amount of any future claims that may be made against the Fund cannot be determined, and the Fund has no historical basis for predicting the likelihood of any such claims.
Note 3. Fees and Other Transactions with Affiliates
Management Fees
Effective September 1, 2015, the Fund entered into a Management Agreement with Columbia Management Investment Advisers, LLC (the Investment Manager), a wholly-owned subsidiary of Ameriprise Financial, Inc. (Ameriprise Financial). Under the Management Agreement, the Investment Manager provides the Fund with investment research and advice, as well as administrative and accounting services. The management services fee is an annual fee that is equal to a percentage of the Fund's average daily net assets that declines from 0.87% to 0.75% as the Fund's net assets increase. The effective management services fee rate for the year ended April 30, 2016 was 0.85% of the Fund's average daily net assets.
Prior to September 1, 2015, the Fund paid the Investment Manager an annual fee for advisory services under an Investment Management Services Agreement and a separate annual fee for administrative and accounting services under an Administrative Services Agreement. For the period from May 1, 2015 through August 31, 2015, the investment advisory services fee paid to the Investment Manager was $2,410,692, and
Annual Report 2016
31
COLUMBIA SMALL CAP VALUE FUND I
NOTES TO FINANCIAL STATEMENTS (continued)
April 30, 2016
the administrative services fee paid to the Investment Manager was $243,472.
Compensation of Board Members
Board members, who are not officers or employees of the Investment Manager or Ameriprise Financial, are compensated for their services to the Fund as disclosed in the Statement of Operations. These Board members may participate in a Deferred Compensation Plan (the Plan) which may be terminated at any time. Obligations of the Plan will be paid solely out of the Fund's assets, and all amounts payable under the Plan constitute a general unsecured obligation of the Fund.
Compensation of Chief Compliance Officer
The Board has appointed a Chief Compliance Officer to the Fund in accordance with federal securities regulations. The Fund is allocated a portion of the expenses associated with the Chief Compliance Officer based on relative net assets of the Trust.
Transactions with Affiliates
For the year ended April 30, 2016, the Fund engaged in purchase and/or sale transactions with affiliates and/or accounts that have a common investment manager (or affiliated investment managers), common directors/trustees, and/or common officers. Those sale transactions complied with provisions of Rule 17a-7 under the 1940 Act and were $238,370. The sale transactions resulted in a net realized gain of $58,689.
Transfer Agency Fees
Under a Transfer and Dividend Disbursing Agent Agreement, Columbia Management Investment Services Corp. (the Transfer Agent), an affiliate of the Investment Manager and a wholly-owned subsidiary of Ameriprise Financial, is responsible for providing transfer agency services to the Fund. The Transfer Agent has contracted with Boston Financial Data Services (BFDS) to serve as sub-transfer agent.
The Transfer Agent receives a monthly transfer agency fee based on the number or the average value of accounts, depending on the type of account. In addition, the Transfer Agent also receives sub-transfer agency fees based on a percentage of the average aggregate value of the Fund's shares maintained in omnibus accounts (other than omnibus accounts for which American Enterprise Investment Services Inc. is the broker of record or accounts where the beneficial shareholder is a customer of Ameriprise Financial Services, Inc., for which the Transfer Agent receives a per account fee). The Transfer
Agent pays the fees of BFDS for services as sub-transfer agent and is not entitled to reimbursement for such fees from the Fund (with the exception of out-of-pocket fees).
The Transfer Agent also receives compensation from the Fund for various shareholder services and reimbursements for certain out-of-pocket fees. Total transfer agency fees for Class R5 shares are subject to an annual limitation of not more than 0.05% of the average daily net assets attributable to Class R5 shares. Class I and Class Y shares do not pay transfer agency fees.
For the year ended April 30, 2016, the Fund's effective transfer agency fee rates as a percentage of average daily net assets of each class were as follows:
Class A | | | 0.21 | % | |
Class B | | | 0.21 | | |
Class C | | | 0.21 | | |
Class R | | | 0.21 | | |
Class R4 | | | 0.21 | | |
Class R5 | | | 0.05 | | |
Class Z | | | 0.21 | | |
An annual minimum account balance fee of $20 may apply to certain accounts with a value below the applicable share class's initial minimum investment requirements to reduce the impact of small accounts on transfer agency fees. These minimum account balance fees are remitted to the Fund and recorded as part of expense reductions in the Statement of Operations. For the year ended April 30, 2016, these minimum account balance fees reduced total expenses of the Fund by $3,436.
Distribution and Service Fees
The Fund has an agreement with Columbia Management Investment Distributors, Inc. (the Distributor), an affiliate of the Investment Manager and a wholly-owned subsidiary of Ameriprise Financial, for distribution and shareholder services. The Board has approved, and the Fund has adopted, distribution and shareholder service plans (the Plans) applicable to certain share classes, which set the distribution and service fees for the Fund. These fees are calculated daily and are intended to compensate the Distributor and/or eligible selling and/or servicing agents for selling shares of the Fund and providing services to investors.
Under the Plans, the Fund pays a monthly service fee to the Distributor at the maximum annual rate of 0.25% of the average daily net assets attributable to Class A, Class B and Class C shares of the Fund. Also under the
Annual Report 2016
32
COLUMBIA SMALL CAP VALUE FUND I
NOTES TO FINANCIAL STATEMENTS (continued)
April 30, 2016
Plans, the Fund pays a monthly distribution fee to the Distributor at the maximum annual rates of 0.75%, 0.75% and 0.50% of the average daily net assets attributable to Class B, Class C and Class R shares of the Fund, respectively.
Sales Charges
Sales charges, including front-end charges and CDSCs, received by the Distributor for distributing Fund shares were $57,709 for Class A, $1 for Class B and $243 for Class C shares for the year ended April 30, 2016.
Expenses Waived/Reimbursed by the Investment Manager and its Affiliates
The Investment Manager and certain of its affiliates have contractually agreed to waive fees and/or reimburse expenses (excluding certain fees and expenses described below) for the periods disclosed below, unless sooner terminated at the sole discretion of the Board, so that the Fund's net operating expenses, after giving effect to fees waived/expenses reimbursed and any balance credits and/or overdraft charges from the Fund's custodian, do not exceed the following annual rates as a percentage of the class' average daily net assets:
| | | September 1, 2015
through
August 31, 2016 | | Prior to
September 1, 2015 | |
Class A | | | 1.37 | % | | | 1.37 | % | |
Class B | | | 2.12 | | | | 2.12 | | |
Class C | | | 2.12 | | | | 2.12 | | |
Class I | | | 0.96 | | | | 0.97 | | |
Class R | | | 1.62 | | | | 1.62 | | |
Class R4 | | | 1.12 | | | | 1.12 | | |
Class R5 | | | 1.01 | | | | 1.02 | | |
Class Y | | | 0.96 | | | | 0.97 | | |
Class Z | | | 1.12 | | | | 1.12 | | |
Under the agreement governing these fee waivers and/or expense reimbursement arrangements, the following fees and expenses are excluded from the waiver/reimbursement commitment, and therefore will be paid by the Fund, if applicable: taxes (including foreign transaction taxes), expenses associated with investments in affiliated and non-affiliated pooled investment vehicles (including mutual funds and exchange-traded funds), transaction costs and brokerage commissions, costs related to any securities lending program, dividend and interest expenses associated with securities sold short, inverse floater program fees and expenses, transaction charges and interest on borrowed money, interest, extraordinary
expenses and any other expenses the exclusion of which is specifically approved by the Board. This agreement may be modified or amended only with approval from the Investment Manager, certain of its affiliates and the Fund. Any fees waived and/or expenses reimbursed under the expense reimbursement arrangements described above are not recoverable by the Investment Manager or its affiliates in future periods.
Note 4. Federal Tax Information
The timing and character of income and capital gain distributions are determined in accordance with income tax regulations, which may differ from GAAP because of temporary or permanent book to tax differences.
At April 30, 2016, these differences are primarily due to differing treatment for deferral/reversal of wash sale losses, Trustees' deferred compensation, earnings and profits distributed to shareholders on the redemption of shares and proceeds from regulatory settlements. To the extent these differences are permanent, reclassifications are made among the components of the Fund's net assets in the Statement of Assets and Liabilities. Temporary differences do not require reclassifications.
In the Statement of Assets and Liabilities the following reclassifications were made:
Undistributed net investment income | | $ | (35,520 | ) | |
Accumulated net realized gain | | | (21,187,086 | ) | |
Paid-in capital | | | 21,222,606 | | |
Net investment income (loss) and net realized gains (losses), as disclosed in the Statement of Operations, and net assets were not affected by this reclassification.
The tax character of distributions paid during the years indicated was as follows:
Year Ended April 30, | | 2016 | | 2015 | |
Ordinary income | | $ | 3,258,425 | | | $ | 15,634,623 | | |
Long-term capital gains | | | 85,445,758 | | | | 147,231,852 | | |
Total | | | 88,704,183 | | | | 162,866,475 | | |
Short-term capital gain distributions, if any, are considered ordinary income distributions for tax purposes.
At April 30, 2016, the components of distributable earnings on a tax basis were as follows:
Undistributed ordinary income | | $ | 129,964 | | |
Undistributed long-term capital gains | | | 34,845,047 | | |
Net unrealized appreciation | | | 148,641,476 | | |
Annual Report 2016
33
COLUMBIA SMALL CAP VALUE FUND I
NOTES TO FINANCIAL STATEMENTS (continued)
April 30, 2016
At April 30, 2016, the cost of investments for federal income tax purposes was $441,099,836 and the aggregate gross unrealized appreciation and depreciation based on that cost was:
Unrealized appreciation | | $ | 164,360,869 | | |
Unrealized depreciation | | | (15,719,393 | ) | |
Net unrealized appreciation | | | 148,641,476 | | |
Management of the Fund has concluded that there are no significant uncertain tax positions in the Fund that would require recognition in the financial statements. However, management's conclusion may be subject to review and adjustment at a later date based on factors including, but not limited to, new tax laws, regulations, and administrative interpretations (including relevant court decisions). Generally, the Fund's federal tax returns for the prior three fiscal years remain subject to examination by the Internal Revenue Service.
Note 5. Portfolio Information
The cost of purchases and proceeds from sales of securities, excluding short-term investments and derivatives, if any, aggregated to $511,896,416 and $941,466,687, respectively, for the year ended April 30, 2016. The amount of purchase and sale activity impacts the portfolio turnover rate reported in the Financial Highlights.
Note 6. Affiliated Money Market Fund
The Fund invests in Columbia Short-Term Cash Fund, an affiliated money market fund established for the exclusive use by the Fund and other affiliated funds. The income earned by the Fund from such investments is included as Dividends — affiliated issuers in the Statement of Operations. As an investing fund, the Fund indirectly bears its proportionate share of the expenses of Columbia Short-Term Cash Fund.
Note 7. Line of Credit
The Fund has access to a revolving credit facility whereby the Fund may borrow for the temporary funding of shareholder redemptions or for other temporary or emergency purposes. Effective December 8, 2015, Citibank, N.A. and HSBC Bank USA, N.A. joined JPMorgan Chase Bank, N.A. (JPMorgan) as lead of a syndicate of banks under the credit facility, which is a collective agreement between the Fund and certain other funds managed by the Investment Manager, severally and not jointly, that permits collective borrowings up to $1 billion. Interest is charged to each participating fund based on its borrowings at a rate equal to the higher of (i) the overnight
federal funds rate plus 1.00% or (ii) the one-month LIBOR rate plus 1.00%. Each borrowing under the credit facility matures no later than 60 days after the date of borrowing. The Fund also pays a commitment fee equal to its pro rata share of the amount of the credit facility at a rate of 0.15% per annum. The commitment fee is included in other expenses in the Statement of Operations. Prior to December 8, 2015, JPMorgan was the sole lead bank under the credit facility agreement that permitted borrowings up to $550 million under the same terms and interest rates as described above with the exception of the commitment fee which was charged at a rate of 0.075% per annum.
The Fund had no borrowings during the year ended April 30, 2016.
Note 8. Significant Risks
Shareholder Concentration Risk
At April 30, 2016, one unaffiliated shareholder of record owned 18.8% of the outstanding shares of the Fund in one or more accounts. The Fund has no knowledge about whether any portion of those shares was owned beneficially. Affiliated shareholders of record owned 14.6% of the outstanding shares of the Fund in one or more accounts. Subscription and redemption activity by concentrated accounts may have a significant effect on the operations of the Fund. In the case of a large redemption, the Fund may be forced to sell investments at inopportune times, including its liquid or more liquid positions, resulting in Fund losses and the Fund holding a higher percentage of less liquid or illiquid securities. Large redemptions could result in decreased economies of scale and increased operating expenses for non-redeeming Fund shareholders.
Financial Sector Risk
The Fund may be more susceptible to the particular risks that may affect companies in the financial services sector than if it were invested in a wider variety of companies in unrelated sectors. Companies in the financial services sector are subject to certain risks, including the risk of regulatory change, decreased liquidity in credit markets and unstable interest rates. Such companies may have concentrated portfolios, such as a high level of loans to real estate developers, which makes them vulnerable to economic conditions that affect that industry. Performance of such companies may be affected by competitive pressures and exposure to investments or agreements that, under certain circumstances, may lead to losses (e.g., subprime
Annual Report 2016
34
COLUMBIA SMALL CAP VALUE FUND I
NOTES TO FINANCIAL STATEMENTS (continued)
April 30, 2016
loans). Companies in the financial services sector are subject to extensive governmental regulation that may limit the amount and types of loans and other financial commitments they can make, and interest rates and fees that they may charge. In addition, profitability of such companies is largely dependent upon the availability and the cost of capital.
Note 9. Subsequent Events
Management has evaluated the events and transactions that have occurred through the date the financial statements were issued and noted no items requiring adjustment of the financial statements or additional disclosure.
Note 10. Information Regarding Pending and Settled Legal Proceedings
In December 2005, without admitting or denying the allegations, American Express Financial Corporation (AEFC, which is now known as Ameriprise Financial, Inc. (Ameriprise Financial)) entered into settlement agreements with the Securities and Exchange Commission (SEC) and Minnesota Department of Commerce (MDOC) related to market timing activities. As a result, AEFC was censured and ordered to cease and desist from committing or causing any violations of certain provisions of the Investment Advisers Act of 1940, the Investment Company Act of 1940, and various Minnesota laws. AEFC agreed to pay disgorgement of $10 million and civil money penalties of $7 million. AEFC also agreed to retain an independent distribution consultant to assist in developing a plan for distribution of all disgorgement and civil penalties ordered by the SEC in accordance with various undertakings detailed at http://www.sec.gov/litigation/admin/ia-2451.pdf. Ameriprise Financial and its affiliates have cooperated with the SEC and the MDOC in these legal proceedings, and have made regular reports to the Funds' Boards of Trustees.
Ameriprise Financial and certain of its affiliates have historically been involved in a number of legal, arbitration and regulatory proceedings, including routine litigation, class actions, and governmental actions, concerning matters arising in connection with the conduct of their business activities. Ameriprise Financial believes that the Funds are not currently the subject of, and that neither Ameriprise Financial nor any of its affiliates are the subject of, any pending legal, arbitration or regulatory proceedings that are likely to have a material adverse effect on the Funds or the ability of Ameriprise Financial
or its affiliates to perform under their contracts with the Funds. Ameriprise Financial is required to make quarterly (10-Q), annual (10-K) and, as necessary, 8-K filings with the SEC on legal and regulatory matters that relate to Ameriprise Financial and its affiliates. Copies of these filings may be obtained by accessing the SEC website at www.sec.gov.
There can be no assurance that these matters, or the adverse publicity associated with them, will not result in increased fund redemptions, reduced sale of fund shares or other adverse consequences to the Funds. Further, although we believe proceedings are not likely to have a material adverse effect on the Funds or the ability of Ameriprise Financial or its affiliates to perform under their contracts with the Funds, these proceedings are subject to uncertainties and, as such, we are unable to estimate the possible loss or range of loss that may result. An adverse outcome in one or more of these proceedings could result in adverse judgments, settlements, fines, penalties or other relief that could have a material adverse effect on the consolidated financial condition or results of operations of Ameriprise Financial.
Annual Report 2016
35
COLUMBIA SMALL CAP VALUE FUND I
REPORT OF INDEPENDENT REGISTERED PUBLIC ACCOUNTING FIRM
To the Trustees of Columbia Funds Series Trust I and the Shareholders of
Columbia Small Cap Value Fund I
In our opinion, the accompanying statement of assets and liabilities, including the portfolio of investments, and the related statements of operations and of changes in net assets and the financial highlights present fairly, in all material respects, the financial position of Columbia Small Cap Value Fund I (the "Fund", a series of Columbia Funds Series Trust I) at April 30, 2016, and the results of its operations, the changes in its net assets and the financial highlights for each of the periods indicated, in conformity with accounting principles generally accepted in the United States of America. These financial statements and financial highlights (hereafter referred to as "financial statements") are the responsibility of the Fund's management. Our responsibility is to express an opinion on these financial statements based on our audits. We conducted our audits of these financial statements in accordance with the standards of the Public Company Accounting Oversight Board (United States). Those standards require that we plan and perform the audit to obtain reasonable assurance about whether the financial statements are free of material misstatement. An audit includes examining, on a test basis, evidence supporting the amounts and disclosures in the financial statements, assessing the accounting principles used and significant estimates made by management, and evaluating the overall financial statement presentation. We believe that our audits, which included confirmation of securities at April 30, 2016 by correspondence with the custodian, brokers and transfer agent, and the application of alternative auditing procedures where such confirmations had not been received, provide a reasonable basis for our opinion.
PricewaterhouseCoopers LLP
Minneapolis, MN
June 21, 2016
Annual Report 2016
36
COLUMBIA SMALL CAP VALUE FUND I
FEDERAL INCOME TAX INFORMATION
(Unaudited)
The Fund hereby designates the following tax attributes for the fiscal year ended April 30, 2016. Shareholders will be notified in early 2017 of the amounts for use in preparing 2016 income tax returns.
Tax Designations
Qualified Dividend Income | | | 100.00 | % | |
Dividends Received Deduction | | | 100.00 | % | |
Capital Gain Dividend | | $ | 100,522,960 | | |
Qualified Dividend Income. For taxable, non-corporate shareholders, the percentage of ordinary income distributed during the fiscal year that represents qualified dividend income subject to reduced tax rates.
Dividends Received Deduction. The percentage of ordinary income distributed during the fiscal year that qualifies for the corporate dividends received deduction.
Capital Gain Dividend. The Fund designates as a capital gain dividend the amount reflected above, or if subsequently determined to be different, the net capital gain of such fiscal period.
Annual Report 2016
37
COLUMBIA SMALL CAP VALUE FUND I
Shareholders elect the Board that oversees the Fund's operations. The Board appoints officers who are responsible for day-to-day business decisions based on policies set by the Board. The following table provides basic biographical information about the Fund's Trustees, including their principal occupations during the past five years, although specific titles for individuals may have varied over the period. The year set forth beneath Length of Service in the table below is the year in which the Trustee was first appointed or elected as Trustee to any Fund currently in the Columbia Funds Complex or a predecessor thereof. Under current Board policy, members serve terms of indefinite duration.
Trustees
Independent Trustees
Name,
Address,
Year of Birth | | Position Held With
the Funds and Length of
Service | | Principal Occupation(s)
During the Past Five Years
and Other Relevant
Professional Experience | | Number of
Funds in the
Columbia Funds
Complex
Overseen | | Other Directorships
Held by Trustee During
the Past Five Years | |
Janet Langford Carrig
c/o Columbia
Management Investment Advisers, LLC,
225 Franklin Street
Mail Drop BX32 05228,
Boston, MA 02110
1957 | | Trustee 1996 | | Senior Vice President, General Counsel and Corporate Secretary, ConocoPhillips (integrated energy company) since September 2007 | | | 58 | | | None | |
Douglas A. Hacker
c/o Columbia Management Investment Advisers, LLC,
225 Franklin Street
Mail Drop BX32 05228,
Boston, MA 02110
1955 | | Trustee and Chairman of the Board 1996 | | Independent business executive since May 2006; Executive Vice President — Strategy of United Airlines from December 2002 to May 2006; President of UAL Loyalty Services (airline marketing company) from September 2001 to December 2002; Executive Vice President and Chief Financial Officer of United Airlines from July 1999 to September 2001 | | | 58 | | | Spartan Nash Company (food distributor); Nash Finch Company (food distributor) from 2005 to 2013; Aircastle Limited (aircraft leasing); SeaCube Container Leasing Ltd. (container leasing) from 2010 to 2013; and Travelport Worldwide Limited (travel information technology) | |
Nancy T. Lukitsh
c/o Columbia Management Investment Advisers, LLC,
225 Franklin Street
Mail Drop BX32 05228,
Boston, MA 02110
1956 | | Trustee 2011 | | Senior Vice President, Partner and Director of Marketing, Wellington Management Company, LLP (investment adviser) from 1997 to 2010; Chair, Wellington Management Portfolios (commingled non-U.S. investment pools) from 2007 to 2010; Director, Wellington Trust Company, NA and other Wellington affiliates from 1997 to 2010 | | | 58 | | | None | |
Annual Report 2016
38
COLUMBIA SMALL CAP VALUE FUND I
TRUSTEES AND OFFICERS (continued)
Independent Trustees (continued)
Name,
Address,
Year of Birth | | Position Held With
the Funds and Length of
Service | | Principal Occupation(s)
During the Past Five Years
and Other Relevant
Professional Experience | | Number of
Funds in the
Columbia Funds
Complex
Overseen | | Other Directorships
Held by Trustee During
the Past Five Years | |
William E. Mayer
c/o Columbia Management Investment Advisers, LLC,
225 Franklin Street
Mail Drop BX32 05228,
Boston, MA 02110
1940 | | Trustee 1991 | | Partner, Park Avenue Equity Partners (private equity) since February 1999 | | | 58 | | | DynaVox Inc. (speech creation); Lee Enterprises (print media); WR Hambrecht + Co. (financial service provider) from 2000 to 2012; BlackRock Capital Investment Corporation (investment company); and Premier, Inc. (healthcare) | |
David M. Moffett
c/o Columbia Management Investment Advisers, LLC,
225 Franklin Street
Mail Drop BX32 05228,
Boston, MA 02110
1952 | | Trustee 2011 | | Retired. Consultant to Bridgewater and Associates | | | 58 | | | Director of CIT Bank, CIT Group Inc. (commercial and consumer finance); eBay Inc. (online trading community); Genworth Financial, Inc. (financial and insurance products and services); Paypal Holdings Inc. (payment and data processing services); and Trustee University of Oklahoma Foundation | |
Charles R. Nelson
c/o Columbia Management Investment Advisers, LLC,
225 Franklin Street
Mail Drop BX32 05228,
Boston, MA 02110
1942 | | Trustee 1981 | | Retired. Professor Emeritus, University of Washington since 2011; Professor of Economics, University of Washington from 1976 to 2011; Ford and Louisa Van Voorhis Professor of Political Economy, University of Washington from 1993 to 2011; Adjunct Professor of Statistics, University of Washington from 1980 to 2011; Associate Editor, Journal of Money, Credit and Banking from September 1993 to 2008; consultant on econometric and statistical matters | | | 58 | | | None | |
John J. Neuhauser
c/o Columbia Management Investment Advisers, LLC,
225 Franklin Street
Mail Drop BX32 05228,
Boston, MA 02110
1943 | | Trustee 1984 | | President, Saint Michael's College since August 2007; Director or Trustee of several non-profit organizations, including University of Vermont Medical Center; Academic Vice President and Dean of Faculties, Boston College from August 1999 to October 2005; University Professor, Boston College from November 2005 to August 2007 | | | 58 | | | Liberty All-Star Equity Fund and Liberty All-Star Growth Fund (closed-end funds) | |
Annual Report 2016
39
COLUMBIA SMALL CAP VALUE FUND I
TRUSTEES AND OFFICERS (continued)
Independent Trustees (continued)
Name,
Address,
Year of Birth | | Position Held With
the Funds and Length of
Service | | Principal Occupation(s)
During the Past Five Years
and Other Relevant
Professional Experience | | Number of
Funds in the
Columbia Funds
Complex
Overseen | | Other Directorships
Held by Trustee During
the Past Five Years | |
Patrick J. Simpson
c/o Columbia Management Investment Advisers, LLC,
225 Franklin Street
Mail Drop BX32 05228,
Boston, MA 02110
1944 | | Trustee 2000 | | Of Counsel, Perkins Coie LLP (law firm) since 2015; Partner, Perkins Coie LLP from 1988 to 2014 | | | 58 | | | None | |
Anne-Lee Verville
c/o Columbia Management Investment Advisers, LLC,
225 Franklin Street
Mail Drop BX32 05228,
Boston, MA 02110
1945 | | Trustee 1998 | | Retired. General Manager, Global Education Industry from 1994 to 1997, President — Application Systems Division from 1991 to 1994, Chief Financial Officer — US Marketing & Services from 1988 to 1991, and Chief Information Officer from 1987 to 1988, IBM Corporation (computer and technology) | | | 58 | | | Enesco Group, Inc. (producer of giftware and home and garden decor products) from 2001 to 2006 | |
Annual Report 2016
40
COLUMBIA SMALL CAP VALUE FUND I
TRUSTEES AND OFFICERS (continued)
Interested Trustee Affiliated with Investment Manager*
Name,
Address,
Year of Birth | | Position Held With
the Funds and Length of
Service | | Principal Occupation(s)
During the Past Five Years
and Other Relevant
Professional Experience | | Number of
Funds in the
Columbia Funds
Complex
Overseen | | Other Directorships
Held by Trustee During
the Past Five Years | |
William F. Truscott
c/o Columbia Management Investment Advisers, LLC,
225 Franklin Street
Boston, MA 02110
1960 | | Trustee 2012 | | Chairman of the Board and President, Columbia Management Investment Advisers, LLC since May 2010 and February 2012, respectively (previously President and Chief Investment Officer, 2001-April 2010); Chief Executive Officer, Global Asset Management, Ameriprise Financial, Inc. since September 2012 (previously Chief Executive Officer, U.S. Asset Management & President, Annuities, May 2010- September 2012 and President — U.S. Asset Management and Chief Investment Officer, 2005-April 2010); Director and Chief Executive Officer, Columbia Management Investment Distributors, Inc. since May 2010 and February 2012, respectively (previously Chairman of the Board and Chief Executive Officer, 2006-April 2010); Chairman of the Board and Chief Executive Officer, RiverSource Distributors, Inc. since 2006; Director, Threadneedle Asset Management Holdings, SARL since 2014; President and Chief Executive Officer, Ameriprise Certificate Company, 2006-August 2012. | | | 178 | | | Chairman of the Board, Columbia Management Investment Advisers, LLC since May 2010; Director, Columbia Management Investment Distributors, Inc. since May 2010; Former Director, Ameriprise Certificate Company, 2006-January 2013 | |
* Interested person (as defined under the 1940 Act) by reason of being an officer, director, security holder and/or employee of the Investment Manager or Ameriprise Financial.
The Statement of Additional Information has additional information about the Fund's Board members and is available, without charge, upon request by calling 800.345.6611; contacting your financial intermediary; or visiting columbiathreadneedle.com/us.
Annual Report 2016
41
COLUMBIA SMALL CAP VALUE FUND I
TRUSTEES AND OFFICERS (continued)
The Board has appointed officers who are responsible for day-to-day business decisions based on policies it has established. The officers serve at the pleasure of the Board. The following table provides basic information about the Officers of the Fund, including principal occupations during the past five years, although their specific titles may have varied over the period. In addition to Mr. Truscott, who is Senior Vice President, the Fund's other officers are:
Fund Officers
Name,
Address and
Year of Birth | | Position and Year
First Appointed to
Position for any Fund
in the Columbia
Funds Complex or a
Predecessor Thereof | |
Principal Occupation(s) During Past Five Years | |
Christopher O. Petersen
5228 Ameriprise Financial Center
Minneapolis, MN 55474
Born 1970 | | President and Principal Executive Officer (2015) | | Vice President and Lead Chief Counsel, Ameriprise Financial, Inc. since January 2015 (previously, Vice President and Chief Counsel January 2010-December 2014; and Vice President and Group Counsel or Counsel 2004-January 2010); officer of Columbia Funds and affiliated funds since 2007. | |
Michael G. Clarke
225 Franklin Street
Boston, MA 02110
Born 1969 | | Treasurer (2011), Chief Financial Officer (2009) and Chief Accounting Officer (2015) | | Vice President — Mutual Fund Administration, Columbia Management Investment Advisers, LLC, since May 2010; Managing Director of Fund Administration, Columbia Management Advisors, LLC, September 2004-April 2010; senior officer of Columbia Funds and affiliated funds since 2002. | |
Paul B. Goucher
100 Park Avenue
New York, NY 10017
Born 1968 | | Senior Vice President (2011), Chief Legal Officer (2015) and Assistant Secretary (2008) | | Vice President and Lead Chief Counsel, Ameriprise Financial, Inc. since November 2008 and January 2013, respectively (previously Chief Counsel, January 2010-January 2013 and Group Counsel, November 2008-January 2010). | |
Thomas P. McGuire
225 Franklin Street
Boston, MA 02110
Born 1972 | | Senior Vice President and Chief Compliance Officer (2012) | | Vice President — Asset Management Compliance, Ameriprise Financial, Inc., since May 2010; Chief Compliance Officer, Ameriprise Certificate Company since September 2010; Compliance Executive, Bank of America, 2005-April 2010. | |
Colin Moore
225 Franklin Street
Boston, MA 02110
Born 1958 | | Senior Vice President (2010) | | Executive Vice President and Global Chief Investment Officer, Ameriprise Financial, Inc., since July 2013; Director and Global Chief Investment Officer, Columbia Management Investment Advisers, LLC since May 2010; Manager, Managing Director and Chief Investment Officer, Columbia Management Advisors, LLC, 2007-April 2010. | |
Michael E. DeFao
225 Franklin Street
Boston, MA 02110
Born 1968 | | Vice President (2011) and Assistant Secretary (2010) | | Vice President and Chief Counsel, Ameriprise Financial, Inc. since May 2010; Associate General Counsel, Bank of America, 2005-April 2010. | |
Amy Johnson
5228 Ameriprise Financial Center
Minneapolis, MN 55474
Born 1965 | | Vice President (2006) | | Managing Director and Chief Operating Officer, Columbia Management Investment Advisers, LLC since May 2010 (previously Chief Administrative Officer, 2009-April 2010, and Vice President — Asset Management and Trust Company Services, 2006-2009). | |
Lyn Kephart-Strong
5228 Ameriprise
Financial Center
Minneapolis, MN 55474
Born 1960 | | Vice President (2015) | | President, Columbia Management Investment Services Corp. since October 2014; Vice President & Resolution Officer, Ameriprise Trust Company since August 2009; President, RiverSource Service Corporation 2004-2010. | |
Ryan C. Larrenaga
225 Franklin Street
Boston, MA 02110
Born 1970 | | Vice President and Secretary (2015) | | Vice President and Group Counsel, Ameriprise Financial, Inc. since August 2011 (previously, Counsel from May 2010 to August 2011); Assistant General Counsel, Bank of America, 2005-April 2010; officer of Columbia Funds and affiliated funds since 2005. | |
Annual Report 2016
42
COLUMBIA SMALL CAP VALUE FUND I
IMPORTANT INFORMATION ABOUT THIS REPORT
Each fund mails one shareholder report to each shareholder address. If you would like more than one report, please call shareholder services at 800.345.6611 and additional reports will be sent to you.
The policy of the Board is to vote the proxies of the companies in which each fund holds investments consistent with the procedures as stated in the Statement of Additional Information (SAI). You may obtain a copy of the SAI without charge by calling 800.345.6611; contacting your financial intermediary; visiting columbiathreadneedle.com/us; or searching the website of the Securities and Exchange Commission (SEC) at sec.gov. Information regarding how each fund voted proxies relating to portfolio securities is filed with the SEC by August 31st for the most recent 12-month period ending June 30th of that year, and is available without charge by visiting columbiathreadneedle.com/us, or searching the website of the SEC at sec.gov.
Each fund files a complete schedule of portfolio holdings with the SEC for the first and third quarters of each fiscal year on Form N-Q. Each fund's Form N-Q is available on the SEC's website at sec.gov and may be reviewed and copied at the SEC's Public Reference Room in Washington, D.C. Information on the operation of the Public Reference Room may be obtained by calling 800.SEC.0330. Each fund's complete schedule of portfolio holdings, as filed on Form N-Q, can also be obtained without charge, upon request, by calling 800.345.6611.
Annual Report 2016
43
Columbia Small Cap Value Fund I
P.O. Box 8081
Boston, MA 02266-8081

This information is for use with concurrent or prior delivery of a fund prospectus. Please read and consider the investment objectives, risks, charges and expenses for any fund carefully before investing. For a prospectus and summary prospectus, which contains this and other important information about the Fund, go to columbiathreadneedle.com/us. The Fund is distributed by Columbia Management Investment Distributors, Inc., member FINRA, and managed by Columbia Management Investment Advisers, LLC.
Columbia Threadneedle Investments (Columbia Threadneedle) is the global brand name of the Columbia and Threadneedle group of companies.
All rights reserved. Columbia Management Investment Distributors, Inc., 225 Franklin Street, Boston, MA 02110-2804
© 2016 Columbia Management Investment Advisers, LLC.
columbiathreadneedle.com/us
ANN229_04_F01_(06/16)

ANNUAL REPORT
April 30, 2016


ABOUT COLUMBIA THREADNEEDLE INVESTMENTS
Columbia Threadneedle Investments is a leading global asset management group that provides a broad range of actively managed investment strategies and solutions for individual, institutional and corporate clients around the world.
With more than 2,000 people, including over 450 investment professionals based in North America, Europe and Asia, we manage $464 billion* of assets across developed and emerging market equities, fixed income, asset allocation solutions and alternatives. We are the 13th largest manager of long-term mutual fund assets in the U.S.** and the 3rd largest manager of retail funds in the U.K.***
Our priority is the investment success of our clients. We aim to deliver the investment outcomes they expect through an investment approach that is team-based, performance-driven and risk-aware. Our culture is dynamic and interactive. By sharing our insights across asset classes and geographies, we generate richer perspectives on global, regional and local investment landscapes. The ability to exchange and debate investment ideas in a collaborative environment enriches our teams' investment processes. More importantly, it results in better informed investment decisions for our clients.
Columbia funds are distributed by Columbia Management Investment Distributors, Inc., member FINRA, and managed by Columbia Management Investment Advisers, LLC.
Columbia Threadneedle Investments (Columbia Threadneedle) is the global brand name of the Columbia and Threadneedle group of companies.
* In U.S. dollars as of March 31, 2016. Source: Ameriprise Q1 Earnings Release. Includes all assets managed by entities in the Columbia and Threadneedle group of companies. Contact us for more current data.
** Source: ICI as of March 31, 2016 for Columbia Management Investment Advisers, LLC.
*** Source: Investment Association as of December 2015 for Threadneedle Asset Management Limited.
© 2016 Columbia Management Investment Advisers, LLC. All rights reserved.
Not part of the shareholder report
Investment strategies to help meet investor needs
We are committed to helping investors navigate financial challenges to reach their desired outcomes. The possibilities are endless.
Your success is our priority.
 Retire comfortably
 Fund college or higher education
 Leave a legacy

Generate an appropriate stream of income in retirement
Traditional approaches to income may no longer be adequate — and they may no longer provide the diversification benefits they once did. Investors need to rethink how they generate retirement income.
Worried about running out of income? You are not alone.

Navigate a changing interest rate environment
Even in today's challenging interest rate environment, it's still possible to navigate markets and achieve your goals.
Make investment choices designed specifically for this market environment.

Maximize after-tax returns
In an environment where what you keep is more important than what you earn, municipal bonds can help mitigate higher taxes while providing attractive yields compared to other investment options.
You've worked too hard building your wealth to lose it to taxes.

Grow assets to achieve financial goals
Finding growth opportunities in today's complex market environment requires strong research capabilities, creative thinking and a disciplined approach.
Do your investments deliver the portfolio growth you need?

Ease the impact of volatile markets
With increasing concerns about market volatility, investors should consider diversifying their portfolios with non-traditional holdings.
Interested in turning volatility into opportunity?
To find out more, contact your financial professional, call 800.426.3750 or visit columbiathreadneedle.com/us
Not part of the shareholder report
 Dear Shareholders,
Volatility comes with the territory for long-term investors. Some investors instinctively want to pull out of the market or sell underperforming investments at the first sign of increased volatility or perhaps even as soon as they perceive it on the horizon. But taking yourself out of the market could mean losing out on potential opportunities, and putting your longer-term investment goals at risk.
Cumulative return is not just about achieving high returns when markets are going up; it's also about remaining invested and minimizing losses during weak or volatile markets so that you can participate on the upside. Developing a deeper understanding of the various risks your portfolio is subject to can help you balance these risks.
Diversification is critical in seeking to achieve that balance. We believe that most portfolios could be more effectively diversified either by introducing holdings with performance profiles unrelated to existing holdings (like alternative products) or by rebalancing existing holdings with an eye toward risk allocation. Over time, distributing risk more evenly may produce a more pronounced diversification benefit and may improve portfolio efficiency. We believe market volatility can create significant opportunities and, in fact, these periods may be some of the very best times to invest.
With this in mind, I thought it important to highlight excerpts from a piece written by Colin Moore, Global Chief Investment Officer, in which he touches on some of these issues emphasizing the importance of a properly constructed portfolio in seeking to effectively manage volatility and to achieve consistency of returns. I encourage you to read the article in its entirety. To access the full article and for other insights on current market, please visit blog.columbiathreadneedleus.com/latest-perspectives.
You need investments that are designed to help you ease the impact of volatile market environments and keep the savings you have worked tirelessly to amass. Columbia Threadneedle Investments provides investment solutions to help you tackle financial challenges and achieve your desired outcome.
Best regards,

Christopher O. Petersen
President, Columbia Funds
Excerpts from:
Taking the scare out of the volatility bogeyman
By Colin Moore, Global Chief Investment Officer
Colin Moore is the global chief investment officer for Columbia Threadneedle Investments. His responsibilities include ensuring that a disciplined investment process is in place across all asset classes, including equity and fixed income. Mr. Moore joined one of the Columbia Threadneedle Investments legacy firms in 2002 as head of equity and was also head of fixed income and liquidity strategies from 2009 – 2010.

n In today's low growth, higher volatility world, the emphasis is shifting from maximization of returns to consistency of returns.
PRESIDENT'S MESSAGE (continued)
n Portfolios should represent the behavioral risk-return tradeoff of investors, remembering that they won't stay invested to realize the return if we get the risk tolerance wrong.
n Holding long-term savings in cash to avoid volatility (the financial equivalent of hiding under the sheets) is detrimental to achieving long-term goals.
According to Wikipedia, "The bogeyman is a common allusion to a mythical creature in many cultures used to control behavior. This monster has no specific appearance, and conceptions about it can vary drastically from household to household within the same community; in many cases he has no set appearance in the mind of an adult or child, but is simply a non-specific embodiment of terror." Different cultures have different names and physical representations for the bogeyman, and investors are no different. We have terrible monsters that we fear may destroy our portfolios, and we call one of the scariest of them volatility.
While the bogeyman is mythical (I hope!), volatility is real and can cause serious damage. To understand why investors have such a hard time coping with volatility, we first need to define three cognitive biases at work in today's investment environment:
1) Recency bias — something that has recently come to the forefront of our attention, regardless of how long established it is, suddenly seems to appear with improbable frequency.
2) Negativity bias — we tend to have a greater recall of unpleasant memories than positive memories.
3) Loss aversion — our dissatisfaction with losing money tends to be greater than our satisfaction with making money.
The level of volatility varies dramatically, and so does investor fear and panic selling — waxing when volatility rises, waning when it falls. Recent studies have pointed to demographics as an important driver of panic selling. The theory is that as people get closer to retirement, the prospects of a large (20% – 30%) loss in financial assets can have a much more pronounced effect on their sense of well-being. Wealth preservation instincts kick in much more quickly than for younger (and typically less wealthy) savers.
The reality is that there is little opportunity for return without volatility. Therefore, the bogeyman effect of holding long-term savings in cash to avoid volatility (the financial equivalent of hiding under the sheets) is detrimental to achieving long-term goals. This effect tends to be more pronounced during the episodic spikes in volatility. The significant spike in volatility in 2008 and 2009 led to significant withdrawals from long-term investment funds over the same period. Less pronounced effects can also be seen when comparing 2001 – 2003 and 2011 – 2012. Conversely, flows picked up when volatility returned to "normal" levels. Investor behavior of this type is consistent with the three behavioral biases.
I believe average volatility will be higher over the next 10 years than the last 10 years and episodic spikes will increase in frequency because sustainable economic growth will be structurally lower and geopolitical risk higher than any time since World War II. Low growth creates uncertainty while loss aversion will make investors fear that we are one economic mishap or geopolitical event away from no growth or recession. The result will be higher volatility on average. Negativity bias will tend to exacerbate "spike" reactions to event-driven geopolitical news, and the volatility bogeyman will appear more often. Assuming the behavioral biases continue, investor returns are likely to be very disappointing regardless of the total return generated by financial markets due to the bogeyman effect.
To mitigate this effect, we need to focus on portfolio construction and an improved understanding of diversification. I accept that equities are likely to offer the highest return over the next 10 years, but they also offer the highest volatility. Many portfolio construction optimization tools use historical average volatility, which is likely to underestimate the volatility investors will face. The bogeyman emerges when individual asset class volatility spikes and cross correlations rise, the combination of which increases overall portfolio volatility far beyond expectation. Diversification is meant to protect investors against volatility, but what's the point of owning lots of investments if the volatility bogeyman has not been properly estimated?
Most importantly, portfolios should be constructed to properly represent the behavioral risk-return tradeoff of investors, remembering that they won't stay invested to realize the return if we get the risk tolerance wrong. In a low growth, higher volatility world, the emphasis is shifting to return consistency rather than return maximization,
PRESIDENT'S MESSAGE (continued)
and investors are best served through investment approaches that appreciate that distinction. Even though it's a permanent feature of financial markets, volatility is less likely to be the bogeyman we all fear if portfolios are constructed with this understanding.
Please visit blog.columbiathreadneedleus.com/latest-perspectives to read the entire article.
Investors should consider the investment objectives, risks, charges and expenses of a mutual fund carefully before investing. For a free prospectus and summary prospectus, which contains this and other important information about a fund, visit columbiathreadneedle.com/us. The prospectus should be read carefully before investing.
The views expressed are as of April 2016, may change as market or other conditions change, and may differ from views expressed by other Columbia Management Investment Advisers, LLC (CMIA) associates or affiliates. Actual investments or investment decisions made by CMIA and its affiliates, whether for its own account or on behalf of clients, will not necessarily reflect the views expressed. This information is not intended to provide investment advice and does not account for individual investor circumstances. Investment decisions should always be made based on an investor's specific financial needs, objectives, goals, time horizon and risk tolerance. Asset classes described may not be suitable for all investors.
Past performance does not guarantee future results, and no forecast should be considered a guarantee either. Since economic and market conditions change frequently, there can be no assurance that the trends described here will continue or that the forecasts are accurate.
Diversification does not guarantee a profit or protect against loss.
Columbia Funds are distributed by Columbia Management Investment Distributors, Inc., member FINRA, and managed by Columbia Management Investment Advisers, LLC.
© 2016 Columbia Management Investment Advisers, LLC. All rights reserved
Performance Overview | | | 2 | | |
Manager Discussion of Fund Performance | | | 4 | | |
Understanding Your Fund's Expenses | | | 6 | | |
Portfolio of Investments | | | 8 | | |
Statement of Assets and Liabilities | | | 23 | | |
Statement of Operations | | | 25 | | |
Statement of Changes in Net Assets | | | 26 | | |
Financial Highlights | | | 29 | | |
Notes to Financial Statements | | | 40 | | |
Report of Independent Registered Public Accounting Firm | | | 54 | | |
Federal Income Tax Information | | | 55 | | |
Trustees and Officers | | | 56 | | |
Important Information About This Report | | | 61 | | |
Fund Investment Manager
Columbia Management Investment
Advisers, LLC
225 Franklin Street
Boston, MA 02110
Fund Distributor
Columbia Management Investment
Distributors, Inc.
225 Franklin Street
Boston, MA 02110
Fund Transfer Agent
Columbia Management Investment
Services Corp.
P.O. Box 8081
Boston, MA 02266-8081
For more information about any of the funds, please visit columbiathreadneedle.com/us or call 800.345.6611. Customer Service Representatives are available to answer your questions Monday through Friday from 8 a.m. to 7 p.m. Eastern time.
The views expressed in this report reflect the current views of the respective parties. These views are not guarantees of future performance and involve certain risks, uncertainties and assumptions that are difficult to predict, so actual outcomes and results may differ significantly from the views expressed. These views are subject to change at any time based upon economic, market or other conditions and the respective parties disclaim any responsibility to update such views. These views may not be relied on as investment advice and, because investment decisions for a Columbia fund are based on numerous factors, may not be relied on as an indication of trading intent on behalf of any particular Columbia fund. References to specific securities should not be construed as a recommendation or investment advice.
Performance Summary
n Columbia Bond Fund (the Fund) Class A shares returned 2.74% excluding sales charges for the 12-month period that ended April 30, 2016.
n During the same 12-month period, the Fund slightly outperformed its benchmark, the Barclays U.S. Aggregate Bond Index, which returned 2.72%.
n The Fund's performance was helped by security selection in investment-grade bonds, while a modestly shorter duration position versus the benchmark detracted.
Average Annual Total Returns (%) (for period ended April 30, 2016)
| | | Inception | | 1 Year | | 5 Years | | 10 Years | |
Class A* | | 03/31/08 | | | | | | | | | | | | | |
Excluding sales charges | | | | | | | 2.74 | | | | 3.22 | | | | 4.50 | | |
Including sales charges | | | | | | | -2.09 | | | | 2.21 | | | | 3.99 | | |
Class B* | | 03/07/11 | | | | | | | | | | | | | |
Excluding sales charges | | | | | | | 1.98 | | | | 2.45 | | | | 3.73 | | |
Including sales charges | | | | | | | -2.92 | | | | 2.11 | | | | 3.73 | | |
Class C* | | 03/31/08 | | | | | | | | | | | | | |
Excluding sales charges | | | | | | | 1.98 | | | | 2.56 | | | | 3.79 | | |
Including sales charges | | | | | | | 1.00 | | | | 2.56 | | | | 3.79 | | |
Class I* | | 09/27/10 | | | 3.16 | | | | 3.64 | | | | 4.85 | | |
Class R* | | 11/16/11 | | | 2.49 | | | | 2.95 | | | | 4.15 | | |
Class R4* | | 11/08/12 | | | 3.01 | | | | 3.50 | | | | 4.78 | | |
Class R5* | | 11/08/12 | | | 3.11 | | | | 3.56 | | | | 4.81 | | |
Class T* | | 03/07/11 | | | | | | | | | | | | | |
Excluding sales charges | | | | | | | 2.85 | | | | 3.33 | | | | 4.61 | | |
Including sales charges | | | | | | | -2.00 | | | | 2.34 | | | | 4.10 | | |
Class W* | | 09/27/10 | | | 2.74 | | | | 3.22 | | | | 4.52 | | |
Class Y* | | 07/15/09 | | | 3.28 | | | | 3.62 | | | | 4.86 | | |
Class Z | | 01/09/86 | | | 3.00 | | | | 3.48 | | | | 4.77 | | |
Barclays U.S. Aggregate Bond Index | | | | | | | 2.72 | | | | 3.60 | | | | 4.95 | | |
Returns for Class A and Class T are shown with and without the maximum initial sales charge of 4.75%. Returns for Class B are shown with and without the applicable contingent deferred sales charge (CDSC) of 5.00% in the first year, declining to 1.00% in the sixth year and eliminated thereafter. Returns for Class C are shown with and without the 1.00% CDSC for the first year only. The Fund's other classes are not subject to sales charges and have limited eligibility. Please see the Fund's prospectus for details. Performance for different share classes will vary based on differences in sales charges and fees associated with each class. All results shown assume reinvestment of distributions during the period. Returns do not reflect the deduction of taxes that a shareholder may pay on Fund distributions or on the redemption of Fund shares. Performance results reflect the effect of any fee waivers or reimbursements of Fund expenses by Columbia Management Investment Advisers, LLC and/or any of its affiliates. Absent these fee waivers or expense reimbursement arrangements, performance results would have been lower.
The performance information shown represents past performance and is not a guarantee of future results. The investment return and principal value of your investment will fluctuate so that your shares, when redeemed, may be worth more or less than their original cost. Current performance may be lower or higher than the performance information shown. You may obtain performance information current to the most recent month-end by contacting your financial intermediary, visiting columbiathreadneedle.com/us or calling 800.345.6611.
*The returns shown for periods prior to the share class inception date (including returns for the Life of the Fund, if shown, which are since Fund inception) include the returns of the Fund's oldest share class. These returns are adjusted to reflect any higher class-related operating expenses of the newer share classes, as applicable. Please visit columbiathreadneedle.com/us/investment-products/mutual-funds/appended-performance for more information.
The Barclays U.S. Aggregate Bond Index is a broad-based benchmark that measures the investment-grade, U.S. dollar-denominated, fixed-rate taxable bond market, including Treasuries, government-related and corporate securities, mortgage-backed securities (agency fixed-rate and hybrid adjustable-rate mortgage passthroughs), asset-backed securities, and commercial mortgage-backed securities.
Indices are not available for investment, are not professionally managed and do not reflect sales charges, fees, brokerage commissions, taxes or other expenses of investing. Securities in the Fund may not match those in an index.
Annual Report 2016
2
PERFORMANCE OVERVIEW (continued)
Performance of a Hypothetical $10,000 Investment (May 1, 2006 – April 30, 2016)
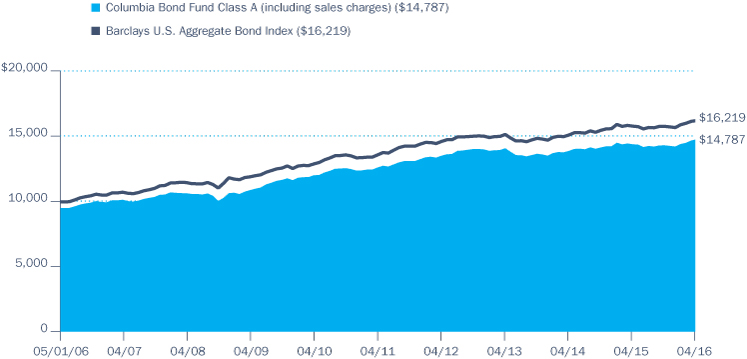
The chart above shows the change in value of a hypothetical $10,000 investment in Class A shares of Columbia Bond Fund during the stated time period, and does not reflect the deduction of taxes that a shareholder may pay on Fund distributions or on the redemption of Fund shares.
Annual Report 2016
3
MANAGER DISCUSSION OF FUND PERFORMANCE
Portfolio Management
Carl Pappo, CFA
Jason Callan
Portfolio Breakdown (%)
(at April 30, 2016) | |
Asset-Backed Securities —
Agency | | | 1.0 | | |
Asset-Backed Securities —
Non-Agency | | | 12.2 | | |
Commercial Mortgage-Backed
Securities — Non-Agency | | | 7.9 | | |
Common Stocks | | | 0.0 | (a) | |
Corporate Bonds & Notes | | | 28.3 | | |
Foreign Government Obligations | | | 1.4 | | |
Money Market Funds | | | 0.1 | | |
Municipal Bonds | | | 1.6 | | |
Preferred Debt | | | 0.4 | | |
Residential Mortgage-Backed
Securities — Agency | | | 25.2 | | |
Residential Mortgage-Backed
Securities — Non-Agency | | | 1.8 | | |
U.S. Government & Agency
Obligations | | | 0.8 | | |
U.S. Treasury Obligations | | | 19.3 | | |
Total | | | 100.0 | | |
Percentages indicated are based upon total investments. The Fund's portfolio composition is subject to change.
(a) Rounds to zero.
Quality Breakdown (%)
(at April 30, 2016) | |
AAA rating | | | 55.8 | | |
AA rating | | | 2.5 | | |
A rating | | | 9.1 | | |
BBB rating | | | 20.2 | | |
BB rating | | | 0.7 | | |
B rating | | | 0.4 | | |
CCC rating | | | 0.0 | (a) | |
D rating | | | 0.0 | (a) | |
Not rated | | | 11.3 | | |
Total | | | 100.0 | | |
Percentages indicated are based upon total fixed income investments (excluding Money Market Funds).
(a) Rounds to zero.
For the 12-month period that ended April 30, 2016, the Fund's Class A shares returned 2.74% excluding sales charges. During the same 12-month period, the Fund slightly outperformed its benchmark, the Barclays U.S. Aggregate Bond Index, which returned 2.72%. The most significant contributor to the Fund's relative performance was security selection in investment-grade bonds during the period, while a modestly shorter duration position versus the benchmark detracted.
China Concerns, Oil Declines Impacted Markets
For much of the 12-month period ended April 30, 2016, corporate spreads trended wider as markets prepared for the U.S. Federal Reserve (the Fed) to end its zero interest rate policy. As the period progressed, credit-oriented assets reacted negatively to slowing China growth, declining oil prices and fears of a domestic recession. Following a brief period of relative stability, the beginning of 2016 saw a sharp decline in global credit sentiment, as trading was halted repeatedly in the Chinese stock market and the price of oil declined to below $30 a barrel. Risk-based assets remained under pressure through the early part of February. Credit sectors rebounded strongly over the last several weeks of the period, as the Fed signaled that it was prepared to push back the timetable for further rate hikes and central banks overseas engaged in unprecedented measures designed to stimulate growth. A meaningful recovery in oil prices from their January lows also helped to boost sentiment.
The U.S. Treasury yield curve flattened over the 12-month period ended April 30, 2016, as rates rose modestly on shorter maturities while experiencing declines farther out along the curve. Credit spreads (the incremental yield provided by corporate bonds versus Treasuries) widened for the full period despite their recovery over the last several weeks.
Contributors and Detractors
Positioning over the period revolved around managing the volatility in interest rates and credit spreads. The Fund's performance benefited from being defensively positioned overall entering the period as markets reacted to the prospect of a less accommodative Fed. Security selection was a positive contributor to performance, particularly within investment-grade bonds. Within energy, a tilt toward pipeline-oriented issuers helped to provide a measure of insulation from volatility in crude oil prices. The Fund has had an overweight exposure to financials in view of the tighter regulation and higher capital standards being applied to the industry, and this positioning detracted modestly from relative performance as the outlook for prolonged low interest rates was viewed as a negative for banks.
Turning to structured asset categories, residential mortgage-backed securities (MBS) were underweighted in the portfolio throughout the period. The Fund shifted its exposure within MBS toward current pools that could be purchased at minimal premiums. Selection within agency MBS was a positive contributor to relative results. The Fund also had a focus on new issue commercial mortgage-backed securities (CMBS) based on their attractive valuations, funding purchases through the sale of higher quality government-related securities.
Annual Report 2016
4
MANAGER DISCUSSION OF FUND PERFORMANCE (continued)
For much of the period, the Fund was positioned with a modestly shorter duration (and correspondingly lower sensitivity to interest rates) than the benchmark. This was shifted to a duration overweight late in the period. For the full 12 months, the Fund's duration stance detracted slightly from performance relative to the benchmark as long-term interest rates declined. However, the negative impact was largely offset by the Fund's positioning along the Treasury yield curve, which took advantage of the curve's flattening over the period via modest rate increases for maturities three years and below that were accompanied by declining rates on longer maturities.
We invested in highly-liquid, widely-traded Treasury futures contracts to help manage portfolio duration. These enable us to efficiently implement our yield curve and offset unintended yield curve impacts from other investments in the portfolio. We also invested in credit default swaps to manage exposure to overall credit risk and individual issuer risk. On a standalone basis, various derivative positions detracted from performance. When viewed in the context of offsetting hedging positions or duration strategies, they performed as intended. The overall impact of derivatives on the portfolio was neutral to slightly positive.
Bond ratings apply to the underlying holdings of the Fund and not the Fund itself and are divided into categories ranging from highest to lowest credit quality, determined by using the middle rating of Moody's, S&P and Fitch, after dropping the highest and lowest available ratings. When ratings are available from only two rating agencies, the lower rating is used. When a rating is available from only one rating agency, that rating is used. When a bond is not rated by any rating agency, it is designated as "Not rated." Credit quality ratings assigned by a rating agency are subjective opinions, not statements of fact, and are subject to change, including daily. The ratings assigned by credit rating agencies are but one of the considerations that the Investment Manager and/or Fund's subadviser incorporates into its credit analysis process, along with such other issuer-specific factors as cash flows, capital structure and leverage ratios, ability to de-leverage (repay) through free cash flow, quality of management, market positioning and access to capital, as well as such security-specific factors as the terms of the security (e.g., interest rate and time to maturity) and the amount and type of any collateral.
Investment Risks
Market risk may affect a single issuer, sector of the economy, industry or the market as a whole. Mortgage- and asset-backed securities are affected by interest rates, financial health of issuers/originators, creditworthiness of entities providing credit enhancements and the value of underlying assets. Fixed-income securities present issuer default risk. A rise in interest rates may result in a price decline of fixed-income instruments held by the Fund, negatively impacting its performance and NAV. Falling rates may result in the Fund investing in lower yielding debt instruments, lowering the Fund's income and yield. These risks may be heightened for longer maturity and duration securities. Non-investment-grade (high-yield or junk) securities present greater price volatility and more risk to principal and income than higher rated securities. Prepayment and extension risk exists because a loan, bond or other investment may be called, prepaid or redeemed before maturity and similar yielding investments may not be available for purchase. Investing in derivatives is a specialized activity that involves special risks that subject the Fund to significant loss potential, including when used as leverage, and may result in greater fluctuation in Fund value. See the Fund's prospectus for more information on these and other risks.
Annual Report 2016
5
UNDERSTANDING YOUR FUND'S EXPENSES
(Unaudited)
As an investor, you incur two types of costs. There are transaction costs, which generally include sales charges on purchases and may include redemption fees. There are also ongoing costs, which generally include management fees, distribution and/or service fees, and other fund expenses. The following information is intended to help you understand your ongoing costs (in dollars) of investing in the Fund and to help you compare these costs with the ongoing costs of investing in other mutual funds.
Analyzing Your Fund's Expenses
To illustrate these ongoing costs, we have provided examples and calculated the expenses paid by investors in each share class of the Fund during the period. The actual and hypothetical information in the table is based on an initial investment of $1,000 at the beginning of the period indicated and held for the entire period. Expense information is calculated two ways and each method provides you with different information. The amount listed in the "Actual" column is calculated using the Fund's actual operating expenses and total return for the period. You may use the Actual information, together with the amount invested, to estimate the expenses that you paid over the period. Simply divide your account value by $1,000 (for example, an $8,600 account value divided by $1,000 = 8.6), then multiply the results by the expenses paid during the period under the "Actual" column. The amount listed in the "Hypothetical" column assumes a 5% annual rate of return before expenses (which is not the Fund's actual return) and then applies the Fund's actual expense ratio for the period to the hypothetical return. You should not use the hypothetical account values and expenses to estimate either your actual account balance at the end of the period or the expenses you paid during the period. See "Compare With Other Funds" below for details on how to use the hypothetical data.
Compare With Other Funds
Since all mutual funds are required to include the same hypothetical calculations about expenses in shareholder reports, you can use this information to compare the ongoing cost of investing in the Fund with other funds. To do so, compare the hypothetical example with the 5% hypothetical examples that appear in the shareholder reports of other funds. As you compare hypothetical examples of other funds, it is important to note that hypothetical examples are meant to highlight the ongoing costs of investing in a fund only and do not reflect any transaction costs, such as sales charges, or redemption or exchange fees. Therefore, the hypothetical calculations are useful in comparing ongoing costs only, and will not help you determine the relative total costs of owning different funds. If transaction costs were included in these calculations, your costs would be higher.
Annual Report 2016
6
UNDERSTANDING YOUR FUND'S EXPENSES (continued)
(Unaudited)
November 1, 2015 – April 30, 2016
| | | Account Value at the Beginning
of the Period ($) | | Account Value at the End of the
Period ($) | | Expenses Paid During the
Period ($) | | Fund's Annualized
Expense Ratio (%) | |
| | | Actual | | Hypothetical | | Actual | | Hypothetical | | Actual | | Hypothetical | | Actual | |
Class A | | | 1,000.00 | | | | 1,000.00 | | | | 1,033.40 | | | | 1,020.59 | | | | 4.35 | | | | 4.32 | | | | 0.86 | | |
Class B | | | 1,000.00 | | | | 1,000.00 | | | | 1,029.50 | | | | 1,016.86 | | | | 8.12 | | | | 8.07 | | | | 1.61 | | |
Class C | | | 1,000.00 | | | | 1,000.00 | | | | 1,029.60 | | | | 1,016.86 | | | | 8.12 | | | | 8.07 | | | | 1.61 | | |
Class I | | | 1,000.00 | | | | 1,000.00 | | | | 1,035.40 | | | | 1,022.63 | | | | 2.28 | | | | 2.26 | | | | 0.45 | | |
Class R | | | 1,000.00 | | | | 1,000.00 | | | | 1,032.10 | | | | 1,019.34 | | | | 5.61 | | | | 5.57 | | | | 1.11 | | |
Class R4 | | | 1,000.00 | | | | 1,000.00 | | | | 1,035.80 | | | | 1,021.83 | | | | 3.09 | | | | 3.07 | | | | 0.61 | | |
Class R5 | | | 1,000.00 | | | | 1,000.00 | | | | 1,035.30 | | | | 1,022.38 | | | | 2.53 | | | | 2.51 | | | | 0.50 | | |
Class T | | | 1,000.00 | | | | 1,000.00 | | | | 1,035.10 | | | | 1,021.08 | | | | 3.85 | | | | 3.82 | | | | 0.76 | | |
Class W | | | 1,000.00 | | | | 1,000.00 | | | | 1,033.30 | | | | 1,020.59 | | | | 4.35 | | | | 4.32 | | | | 0.86 | | |
Class Y | | | 1,000.00 | | | | 1,000.00 | | | | 1,036.60 | | | | 1,022.63 | | | | 2.28 | | | | 2.26 | | | | 0.45 | | |
Class Z | | | 1,000.00 | | | | 1,000.00 | | | | 1,034.70 | | | | 1,021.83 | | | | 3.09 | | | | 3.07 | | | | 0.61 | | |
Expenses paid during the period are equal to the annualized expense ratio for each class as indicated above, multiplied by the average account value over the period and then multiplied by the number of days in the Fund's most recent fiscal half year and divided by 366.
Expenses do not include fees and expenses incurred indirectly by the Fund from its investment in underlying funds, including affiliated and non-affiliated pooled investment vehicles, such as mutual funds and exchange-traded funds.
Had Columbia Management Investment Advisers, LLC and/or certain of its affiliates not waived/reimbursed certain fees and expenses, account value at the end of the period would have been reduced.
Annual Report 2016
7
PORTFOLIO OF INVESTMENTS
April 30, 2016
(Percentages represent value of investments compared to net assets)
Corporate Bonds & Notes 32.0%
Issuer | | Coupon
Rate | | Principal
Amount ($) | | Value ($) | |
AEROSPACE & DEFENSE 0.3% | |
Lockheed Martin Corp.
01/15/23 | | | 3.100 | % | | | 604,000 | | | | 633,006 | | |
05/15/36 | | | 4.500 | % | | | 581,000 | | | | 644,785 | | |
05/15/46 | | | 4.700 | % | | | 357,000 | | | | 410,495 | | |
Total | | | | | | | 1,688,286 | | |
AUTOMOTIVE 0.6% | |
General Motors Co.
04/01/35 | | | 5.000 | % | | | 370,000 | | | | 369,886 | | |
04/01/36 | | | 6.600 | % | | | 743,000 | | | | 869,407 | | |
04/01/46 | | | 6.750 | % | | | 1,605,000 | | | | 1,936,872 | | |
Total | | | | | | | 3,176,165 | | |
BANKING 7.7% | |
BNP Paribas SA
Junior Subordinated(a)(b)
12/31/49 | | | 7.375 | % | | | 1,125,000 | | | | 1,110,938 | | |
Bank of America Corp.
01/11/23 | | | 3.300 | % | | | 955,000 | | | | 970,550 | | |
Subordinated
05/02/17 | | | 5.700 | % | | | 1,465,000 | | | | 1,523,295 | | |
Bank of New York Mellon Corp. (The)
Junior Subordinated(a)
12/29/49 | | | 4.500 | % | | | 2,709,000 | | | | 2,546,460 | | |
Capital One Bank USA NA
Subordinated
02/15/23 | | | 3.375 | % | | | 975,000 | | | | 981,130 | | |
Citigroup, Inc.(a)
08/14/17 | | | 1.108 | % | | | 5,525,000 | | | | 5,503,618 | | |
Subordinated
06/09/16 | | | 0.906 | % | | | 2,671,000 | | | | 2,670,185 | | |
Discover Financial Services
04/27/22 | | | 5.200 | % | | | 260,000 | | | | 281,229 | | |
11/21/22 | | | 3.850 | % | | | 938,000 | | | | 949,849 | | |
Fifth Third Bancorp
Junior Subordinated(a)
12/31/49 | | | 5.100 | % | | | 1,726,000 | | | | 1,572,817 | | |
HBOS PLC
Subordinated(b)
05/21/18 | | | 6.750 | % | | | 1,395,000 | | | | 1,510,238 | | |
HSBC Holdings PLC
01/14/22 | | | 4.875 | % | | | 515,000 | | | | 566,279 | | |
HSBC Holdings PLC(a)
Junior Subordinated
12/31/49 | | | 6.375 | % | | | 2,173,000 | | | | 2,099,661 | | |
JPMorgan Chase & Co.
Junior Subordinated(a)
12/31/49 | | | 6.100 | % | | | 2,948,000 | | | | 3,029,070 | | |
Corporate Bonds & Notes (continued)
Issuer | | Coupon
Rate | | Principal
Amount ($) | | Value ($) | |
JPMorgan Chase Capital XXI
Junior Subordinated(a)
02/02/37 | | | 1.587 | % | | | 251,000 | | | | 180,469 | | |
KeyCorp Capital I
Junior Subordinated(a)
07/01/28 | | | 1.365 | % | | | 1,785,000 | | | | 1,410,150 | | |
Lloyds Banking Group PLC
Subordinated(b)
12/10/25 | | | 4.582 | % | | | 2,995,000 | | | | 3,008,062 | | |
M&T Bank Corp.
Junior Subordinated
12/31/49 | | | 6.875 | % | | | 1,266,000 | | | | 1,268,374 | | |
PNC Financial Services Group, Inc. (The)
Junior Subordinated(a)
12/31/49 | | | 4.850 | % | | | 1,190,000 | | | | 1,139,425 | | |
Santander Issuances SAU
Subordinated
11/19/25 | | | 5.179 | % | | | 1,000,000 | | | | 993,651 | | |
Santander UK Group Holdings PLC(b)
Subordinated
09/15/25 | | | 4.750 | % | | | 816,000 | | | | 796,969 | | |
09/15/45 | | | 5.625 | % | | | 364,000 | | | | 347,898 | | |
Synchrony Financial
01/15/19 | | | 2.600 | % | | | 820,000 | | | | 825,940 | | |
U.S. Bancorp
Subordinated
04/27/26 | | | 3.100 | % | | | 1,430,000 | | | | 1,438,875 | | |
Wells Fargo & Co.
Junior Subordinated(a)
12/31/49 | | | 5.900 | % | | | 5,723,000 | | | | 5,858,921 | | |
Total | | | | | | | 42,584,053 | | |
CABLE AND SATELLITE 0.2% | |
CCO Safari II LLC(b)
10/23/45 | | | 6.484 | % | | | 1,040,000 | | | | 1,228,627 | | |
CHEMICALS 0.1% | |
LyondellBasell Industries NV
02/26/55 | | | 4.625 | % | | | 695,000 | | | | 647,726 | | |
CONSTRUCTION MACHINERY 0.2% | |
John Deere Capital Corp.(a)
01/16/18 | | | 0.923 | % | | | 1,235,000 | | | | 1,234,243 | | |
DIVERSIFIED MANUFACTURING 2.5% | |
General Electric Co.
Junior Subordinated(a)
12/31/49 | | | 5.000 | % | | | 11,835,000 | | | | 12,323,194 | | |
The accompanying Notes to Financial Statements are an integral part of this statement.
Annual Report 2016
8
PORTFOLIO OF INVESTMENTS (continued)
April 30, 2016
Corporate Bonds & Notes (continued)
Issuer | | Coupon
Rate | | Principal
Amount ($) | | Value ($) | |
United Technologies Corp.
06/01/42 | | | 4.500 | % | | | 1,425,000 | | | | 1,587,105 | | |
Total | | | | | | | 13,910,299 | | |
ELECTRIC 3.2% | |
Arizona Public Service Co.
11/15/45 | | | 4.350 | % | | | 415,000 | | | | 460,134 | | |
Commonwealth Edison Co.
11/15/45 | | | 4.350 | % | | | 420,000 | | | | 458,171 | | |
DTE Electric Co.
10/01/20 | | | 3.450 | % | | | 1,255,000 | | | | 1,339,996 | | |
Dominion Resources, Inc.
10/01/25 | | | 3.900 | % | | | 396,000 | | | | 416,578 | | |
Duke Energy Progress, Inc.
08/15/45 | | | 4.200 | % | | | 490,000 | | | | 532,942 | | |
FPL Energy National Wind LLC(b)
03/10/24 | | | 5.608 | % | | | 153,242 | | | | 145,579 | | |
Georgia Power Co.
09/01/40 | | | 4.750 | % | | | 330,000 | | | | 365,449 | | |
MidAmerican Energy Co.
10/15/24 | | | 3.500 | % | | | 485,000 | | | | 520,785 | | |
Nevada Power Co.
09/15/40 | | | 5.375 | % | | | 424,000 | | | | 513,877 | | |
Niagara Mohawk Power Corp.(b)
10/01/24 | | | 3.508 | % | | | 815,000 | | | | 864,383 | | |
Oncor Electric Delivery Co. LLC
06/01/22 | | | 4.100 | % | | | 1,733,000 | | | | 1,891,550 | | |
04/01/25 | | | 2.950 | % | | | 160,000 | | | | 160,604 | | |
PPL Capital Funding, Inc.
12/01/22 | | | 3.500 | % | | | 485,000 | | | | 508,453 | | |
06/01/23 | | | 3.400 | % | | | 1,139,000 | | | | 1,177,248 | | |
03/15/44 | | | 5.000 | % | | | 590,000 | | | | 653,388 | | |
PacifiCorp
06/15/21 | | | 3.850 | % | | | 1,025,000 | | | | 1,120,971 | | |
Pacific Gas & Electric Co.
06/15/23 | | | 3.250 | % | | | 843,000 | | | | 885,034 | | |
03/01/26 | | | 2.950 | % | | | 1,005,000 | | | | 1,029,008 | | |
03/01/34 | | | 6.050 | % | | | 480,000 | | | | 637,387 | | |
Progress Energy, Inc.
12/01/39 | | | 6.000 | % | | | 915,000 | | | | 1,125,951 | | |
Public Service Electric & Gas Co.
11/01/45 | | | 4.150 | % | | | 450,000 | | | | 495,687 | | |
San Diego Gas & Electric Co.
04/01/42 | | | 4.300 | % | | | 475,000 | | | | 513,786 | | |
Southern California Edison Co.
06/01/21 | | | 3.875 | % | | | 713,000 | | | | 782,278 | | |
09/01/40 | | | 4.500 | % | | | 160,000 | | | | 180,499 | | |
02/01/45 | | | 3.600 | % | | | 254,000 | | | | 255,537 | | |
Corporate Bonds & Notes (continued)
Issuer | | Coupon
Rate | | Principal
Amount ($) | | Value ($) | |
Toledo Edison Co. (The)
05/15/37 | | | 6.150 | % | | | 410,000 | | | | 487,392 | | |
Total | | | | | | | 17,522,667 | | |
FINANCE COMPANIES 0.2% | |
HSBC Finance Corp.
Subordinated
01/15/21 | | | 6.676 | % | | | 965,000 | | | | 1,108,697 | | |
FOOD AND BEVERAGE 1.9% | |
Anheuser-Busch InBev Finance, Inc.
02/01/23 | | | 3.300 | % | | | 3,057,000 | | | | 3,185,981 | | |
02/01/26 | | | 3.650 | % | | | 1,923,000 | | | | 2,027,025 | | |
02/01/36 | | | 4.700 | % | | | 798,000 | | | | 872,719 | | |
02/01/46 | | | 4.900 | % | | | 405,000 | | | | 459,294 | | |
Molson Coors Brewing Co.
05/01/42 | | | 5.000 | % | | | 725,000 | | | | 786,671 | | |
PepsiCo, Inc.
07/17/45 | | | 4.600 | % | | | 870,000 | | | | 1,005,272 | | |
SABMiller Holdings, Inc.(b)
01/15/22 | | | 3.750 | % | | | 2,271,000 | | | | 2,426,284 | | |
Total | | | | | | | 10,763,246 | | |
HEALTH CARE 0.4% | |
Becton Dickinson and Co.
03/01/23 | | | 3.300 | % | | | 390,000 | | | | 403,458 | | |
05/15/24 | | | 3.875 | % | | | 1,822,000 | | | | 1,946,982 | | |
Total | | | | | | | 2,350,440 | | |
INDEPENDENT ENERGY 2.0% | |
Anadarko Petroleum Corp.
09/15/17 | | | 6.375 | % | | | 307,000 | | | | 326,029 | | |
03/15/26 | | | 5.550 | % | | | 640,000 | | | | 685,998 | | |
07/15/44 | | | 4.500 | % | | | 595,000 | | | | 513,011 | | |
03/15/46 | | | 6.600 | % | | | 680,000 | | | | 769,651 | | |
Canadian Natural Resources Ltd.
02/15/37 | | | 6.500 | % | | | 335,000 | | | | 335,096 | | |
02/01/39 | | | 6.750 | % | | | 90,000 | | | | 91,675 | | |
Cimarex Energy Co.
06/01/24 | | | 4.375 | % | | | 915,000 | | | | 932,171 | | |
Kerr-McGee Corp.
07/01/24 | | | 6.950 | % | | | 1,088,000 | | | | 1,204,379 | | |
Noble Energy, Inc.
05/01/21 | | | 5.625 | % | | | 403,000 | | | | 414,131 | | |
11/15/24 | | | 3.900 | % | | | 314,000 | | | | 312,194 | | |
04/01/27 | | | 8.000 | % | | | 945,000 | | | | 1,072,760 | | |
11/15/43 | | | 5.250 | % | | | 1,120,000 | | | | 1,060,382 | | |
11/15/44 | | | 5.050 | % | | | 906,000 | | | | 857,718 | | |
The accompanying Notes to Financial Statements are an integral part of this statement.
Annual Report 2016
9
PORTFOLIO OF INVESTMENTS (continued)
April 30, 2016
Corporate Bonds & Notes (continued)
Issuer | | Coupon
Rate | | Principal
Amount ($) | | Value ($) | |
Occidental Petroleum Corp.
04/15/26 | | | 3.400 | % | | | 1,065,000 | | | | 1,101,788 | | |
04/15/46 | | | 4.400 | % | | | 415,000 | | | | 442,424 | | |
Woodside Finance Ltd.(b)
03/05/25 | | | 3.650 | % | | | 714,000 | | | | 674,155 | | |
Total | | | | | | | 10,793,562 | | |
INTEGRATED ENERGY 0.5% | |
BP Capital Markets PLC
03/17/22 | | | 3.062 | % | | | 830,000 | | | | 856,091 | | |
BP Capital Markets PLC(c)
05/04/26 | | | 3.119 | % | | | 735,000 | | | | 740,027 | | |
Cenovus Energy, Inc.
10/15/19 | | | 5.700 | % | | | 905,000 | | | | 938,381 | | |
11/15/39 | | | 6.750 | % | | | 169,000 | | | | 164,117 | | |
09/15/42 | | | 4.450 | % | | | 395,000 | | | | 305,862 | | |
Total | | | | | | | 3,004,478 | | |
LIFE INSURANCE 0.9% | |
American International Group, Inc.
02/15/24 | | | 4.125 | % | | | 535,000 | | | | 560,136 | | |
04/01/26 | | | 3.900 | % | | | 1,812,000 | | | | 1,846,210 | | |
Massachusetts Mutual Life Insurance Co.
Subordinated(b)
04/15/65 | | | 4.500 | % | | | 405,000 | | | | 371,239 | | |
MetLife Capital Trust X
Junior Subordinated(a)(b)
04/08/38 | | | 9.250 | % | | | 575,000 | | | | 784,875 | | |
MetLife, Inc.
Junior Subordinated
08/01/39 | | | 10.750 | % | | | 554,000 | | | | 844,850 | | |
Teachers Insurance & Annuity Association of America
Subordinated(b)
09/15/44 | | | 4.900 | % | | | 465,000 | | | | 500,525 | | |
Total | | | | | | | 4,907,835 | | |
MEDIA AND ENTERTAINMENT 0.4% | |
21st Century Fox America, Inc.
02/15/41 | | | 6.150 | % | | | 830,000 | | | | 1,025,636 | | |
Scripps Networks Interactive, Inc.
06/15/22 | | | 3.500 | % | | | 1,245,000 | | | | 1,281,205 | | |
Total | | | | | | | 2,306,841 | | |
METALS 0.2% | |
BHP Billiton Finance USA Ltd.
Junior Subordinated(a)(b)
10/19/75 | | | 6.750 | % | | | 820,000 | | | | 850,545 | | |
Corporate Bonds & Notes (continued)
Issuer | | Coupon
Rate | | Principal
Amount ($) | | Value ($) | |
MIDSTREAM 1.8% | |
Columbia Pipeline Group, Inc.(b)
06/01/20 | | | 3.300 | % | | | 5,000 | | | | 5,064 | | |
06/01/25 | | | 4.500 | % | | | 543,000 | | | | 559,946 | | |
06/01/45 | | | 5.800 | % | | | 2,148,000 | | | | 2,264,761 | | |
Kinder Morgan Energy Partners LP
03/01/21 | | | 3.500 | % | | | 1,585,000 | | | | 1,553,054 | | |
09/01/23 | | | 3.500 | % | | | 93,000 | | | | 87,420 | | |
Plains All American Pipeline LP/Finance Corp.
05/01/19 | | | 8.750 | % | | | 1,039,000 | | | | 1,170,258 | | |
12/15/19 | | | 2.600 | % | | | 1,270,000 | | | | 1,218,307 | | |
06/01/22 | | | 3.650 | % | | | 1,152,000 | | | | 1,090,685 | | |
11/01/24 | | | 3.600 | % | | | 375,000 | | | | 336,264 | | |
10/15/25 | | | 4.650 | % | | | 218,000 | | | | 207,826 | | |
06/01/42 | | | 5.150 | % | | | 865,000 | | | | 704,722 | | |
06/15/44 | | | 4.700 | % | | | 599,000 | | | | 482,564 | | |
02/15/45 | | | 4.900 | % | | | 295,000 | | | | 241,796 | | |
Total | | | | | | | 9,922,667 | | |
NATURAL GAS 1.3% | |
NiSource Finance Corp.
02/15/23 | | | 3.850 | % | | | 685,000 | | | | 725,116 | | |
12/15/40 | | | 6.250 | % | | | 670,000 | | | | 826,601 | | |
02/15/44 | | | 4.800 | % | | | 50,000 | | | | 54,357 | | |
Sempra Energy
03/15/20 | | | 2.400 | % | | | 900,000 | | | | 906,838 | | |
11/15/20 | | | 2.850 | % | | | 885,000 | | | | 906,253 | | |
10/01/22 | | | 2.875 | % | | | 974,000 | | | | 984,057 | | |
11/15/25 | | | 3.750 | % | | | 725,000 | | | | 758,159 | | |
10/15/39 | | | 6.000 | % | | | 1,812,000 | | | | 2,201,147 | | |
Total | | | | | | | 7,362,528 | | |
OIL FIELD SERVICES 0.5% | |
Noble Holding International Ltd.
03/15/17 | | | 2.500 | % | | | 1,406,000 | | | | 1,372,607 | | |
Noble Holding International Ltd.(a)
03/16/18 | | | 5.000 | % | | | 1,270,000 | | | | 1,244,600 | | |
Total | | | | | | | 2,617,207 | | |
OTHER INDUSTRY 0.2% | |
President and Fellows of Harvard College
10/01/37 | | | 3.619 | % | | | 315,000 | | | | 322,452 | | |
President and Fellows of Harvard College(b)
01/15/39 | | | 6.500 | % | | | 415,000 | | | | 604,821 | | |
Total | | | | | | | 927,273 | | |
PHARMACEUTICALS 1.9% | |
Actavis Funding SCS
03/12/20 | | | 3.000 | % | | | 1,035,000 | | | | 1,057,189 | | |
03/15/22 | | | 3.450 | % | | | 315,000 | | | | 322,701 | | |
06/15/24 | | | 3.850 | % | | | 897,000 | | | | 921,414 | | |
The accompanying Notes to Financial Statements are an integral part of this statement.
Annual Report 2016
10
PORTFOLIO OF INVESTMENTS (continued)
April 30, 2016
Corporate Bonds & Notes (continued)
Issuer | | Coupon
Rate | | Principal
Amount ($) | | Value ($) | |
Actavis Funding SCS(a)
09/01/16 | | | 1.510 | % | | | 770,000 | | | | 770,957 | | |
Forest Laboratories LLC(b)
02/01/19 | | | 4.375 | % | | | 1,520,000 | | | | 1,604,135 | | |
Johnson & Johnson
03/01/26 | | | 2.450 | % | | | 2,906,000 | | | | 2,923,078 | | |
12/05/33 | | | 4.375 | % | | | 1,522,000 | | | | 1,756,175 | | |
Novartis Capital Corp.
11/20/45 | | | 4.000 | % | | | 789,000 | | | | 859,619 | | |
Total | | | | | | | 10,215,268 | | |
PROPERTY & CASUALTY 1.6% | |
Berkshire Hathaway Finance Corp.
05/15/43 | | | 4.300 | % | | | 188,000 | | | | 202,990 | | |
Berkshire Hathaway, Inc.
03/15/26 | | | 3.125 | % | | | 2,025,000 | | | | 2,108,770 | | |
02/11/43 | | | 4.500 | % | | | 638,000 | | | | 709,983 | | |
CNA Financial Corp.
03/01/26 | | | 4.500 | % | | | 1,230,000 | | | | 1,266,845 | | |
Loews Corp.
04/01/26 | | | 3.750 | % | | | 3,857,000 | | | | 3,993,646 | | |
05/15/43 | | | 4.125 | % | | | 158,000 | | | | 152,724 | | |
Transatlantic Holdings, Inc.
11/30/39 | | | 8.000 | % | | | 240,000 | | | | 319,480 | | |
Total | | | | | | | 8,754,438 | | |
RAILROADS 0.4% | |
BNSF Funding Trust I
Junior Subordinated(a)
12/15/55 | | | 6.613 | % | | | 1,109,000 | | | | 1,247,625 | | |
Union Pacific Corp.
03/01/46 | | | 4.050 | % | | | 1,010,000 | | | | 1,056,846 | | |
Total | | | | | | | 2,304,471 | | |
RETAILERS 0.9% | |
CVS Health Corp.
07/20/45 | | | 5.125 | % | | | 355,000 | | | | 414,870 | | |
CVS Health Corp.(b)
12/01/22 | | | 4.750 | % | | | 2,681,000 | | | | 3,014,951 | | |
CVS Pass-Through Trust(b)
08/11/36 | | | 4.163 | % | | | 1,432,800 | | | | 1,427,234 | | |
Total | | | | | | | 4,857,055 | | |
TECHNOLOGY 0.6% | |
Hewlett Packard Enterprise Co.(b)
10/15/35 | | | 6.200 | % | | | 860,000 | | | | 858,937 | | |
10/15/45 | | | 6.350 | % | | | 2,319,000 | | | | 2,312,059 | | |
Total | | | | | | | 3,170,996 | | |
Corporate Bonds & Notes (continued)
Issuer | | Coupon
Rate | | Principal
Amount ($) | | Value ($) | |
TRANSPORTATION SERVICES 0.3% | |
FedEx Corp.
11/15/45 | | | 4.750 | % | | | 489,000 | | | | 535,898 | | |
04/01/46 | | | 4.550 | % | | | 965,000 | | | | 1,027,740 | | |
Total | | | | | | | 1,563,638 | | |
WIRELINES 1.2% | |
AT&T, Inc.
03/15/22 | | | 3.800 | % | | | 763,000 | | | | 808,166 | | |
04/01/24 | | | 4.450 | % | | | 444,000 | | | | 483,733 | | |
12/15/42 | | | 4.300 | % | | | 505,000 | | | | 479,024 | | |
05/15/46 | | | 4.750 | % | | | 489,000 | | | | 492,727 | | |
Verizon Communications, Inc.
11/01/21 | | | 3.000 | % | | | 623,000 | | | | 645,891 | | |
09/15/23 | | | 5.150 | % | | | 1,201,000 | | | | 1,381,262 | | |
03/15/34 | | | 5.050 | % | | | 917,000 | | | | 1,006,432 | | |
08/21/46 | | | 4.862 | % | | | 1,294,000 | | | | 1,386,793 | | |
Total | | | | | | | 6,684,028 | | |
Total Corporate Bonds & Notes
(Cost: $169,706,903) | | | | | | | 176,457,279 | | |
Residential Mortgage-Backed Securities —
Agency 28.4% | |
Federal Home Loan Mortgage Corp.
09/01/16 | | | 9.500 | % | | | 10 | | | | 10 | | |
03/01/21 -
05/01/41 | | | 5.000 | % | | | 1,385,787 | | | | 1,544,019 | | |
09/01/25 -
10/01/29 | | | 7.500 | % | | | 32,113 | | | | 36,500 | | |
11/01/25 -
12/01/35 | | | 7.000 | % | | | 265,208 | | | | 326,100 | | |
06/01/26 | | | 8.000 | % | | | 563 | | | | 659 | | |
Federal Home Loan Mortgage Corp.(c)
06/01/43 | | | 4.000 | % | | | 6,377,539 | | | | 6,845,889 | | |
Federal National Mortgage Association
10/01/20 -
12/01/20 | | | 10.000 | % | | | 33,083 | | | | 33,815 | | |
08/01/29 -
09/01/45 | | | 3.000 | % | | | 14,217,973 | | | | 14,758,257 | | |
10/01/29 | | | 7.500 | % | | | 17,664 | | | | 21,843 | | |
12/01/29 -
05/01/30 | | | 8.000 | % | | | 102,518 | | | | 119,638 | | |
01/01/31 | | | 2.500 | % | | | 1,726,062 | | | | 1,779,787 | | |
06/01/32 | | | 7.000 | % | | | 10,505 | | | | 11,088 | | |
07/01/38 | | | 6.000 | % | | | 2,754,692 | | | | 3,144,990 | | |
08/01/40 | | | 4.500 | % | | | 6,656,325 | | | | 7,261,912 | | |
09/01/40 | | | 5.000 | % | | | 2,288,533 | | | | 2,536,958 | | |
05/01/43 -
03/01/46 | | | 3.500 | % | | | 24,905,586 | | | | 26,153,501 | | |
09/01/44 | | | 4.000 | % | | | 18,032,850 | | | | 19,254,740 | | |
The accompanying Notes to Financial Statements are an integral part of this statement.
Annual Report 2016
11
PORTFOLIO OF INVESTMENTS (continued)
April 30, 2016
Residential Mortgage-Backed Securities —
Agency (continued)
Issuer | | Coupon
Rate | | Principal
Amount ($) | | Value ($) | |
Federal National Mortgage Association(c)
05/18/31 | | | 2.500 | % | | | 4,100,000 | | | | 4,213,470 | | |
05/18/31 | | | 3.000 | % | | | 6,000,000 | | | | 6,267,109 | | |
05/18/31 -
05/12/46 | | | 3.500 | % | | | 11,300,000 | | | | 11,879,235 | | |
05/12/46 | | | 4.000 | % | | | 5,807,000 | | | | 6,203,395 | | |
05/12/46 | | | 4.500 | % | | | 12,750,000 | | | | 13,882,060 | | |
Federal National Mortgage Association(d)
01/01/40 | | | 5.500 | % | | | 3,937,500 | | | | 4,435,121 | | |
Government National Mortgage Association
01/15/17 -
12/15/17 | | | 8.500 | % | | | 26,803 | | | | 27,306 | | |
11/15/17 -
06/15/30 | | | 9.000 | % | | | 31,858 | | | | 33,888 | | |
11/15/17 -
08/15/20 | | | 9.500 | % | | | 30,593 | | | | 31,667 | | |
11/15/22 -
02/15/30 | | | 7.000 | % | | | 116,351 | | | | 130,466 | | |
05/15/23 -
12/15/31 | | | 6.500 | % | | | 101,814 | | | | 116,539 | | |
06/15/25 -
01/15/30 | | | 8.000 | % | | | 129,208 | | | | 147,385 | | |
04/15/26 -
03/15/30 | | | 7.500 | % | | | 159,106 | | | | 167,734 | | |
03/20/28 | | | 6.000 | % | | | 49,648 | | | | 57,694 | | |
Government National Mortgage Association(a)
07/20/21 | | | 2.000 | % | | | 13,021 | | | | 13,336 | | |
04/20/22 -
06/20/28 | | | 1.750 | % | | | 104,203 | | | | 107,221 | | |
07/20/22 | | | 1.875 | % | | | 18,092 | | | | 18,567 | | |
Government National Mortgage Association(c)
05/23/46 | | | 3.000 | % | | | 8,150,000 | | | | 8,439,071 | | |
05/23/46 | | | 3.500 | % | | | 11,550,000 | | | | 12,199,237 | | |
05/23/46 | | | 4.000 | % | | | 4,375,000 | | | | 4,684,109 | | |
Vendee Mortgage Trust(a)(e)
CMO IO Series 1998-1 Class 2IO
03/15/28 | | | 0.326 | % | | | 2,280,148 | | | | 17,943 | | |
CMO IO Series 1998-3 Class IO
03/15/29 | | | 0.151 | % | | | 2,940,029 | | | | 3,695 | | |
Total Residential Mortgage-Backed
Securities — Agency
(Cost: $155,486,989) | | | | | | | 156,905,954 | | |
Residential Mortgage-Backed Securities —
Non-Agency 2.1% | |
American Mortgage Trust
Series 2093-3 Class 3A(a)(f)(g)
07/27/23 | | | 8.188 | % | | | 4,277 | | | | 2,594 | | |
BCAP LLC Trust
CMO Series 2012-RR10 Class 9A1(a)(b)
10/26/35 | | | 2.903 | % | | | 1,905,486 | | | | 1,918,385 | | |
Residential Mortgage-Backed Securities —
Non-Agency (continued)
Issuer | | Coupon
Rate | | Principal
Amount ($) | | Value ($) | |
Citigroup Mortgage Loan Trust, Inc.
CMO Series 2015-A Class A4(a)
06/25/58 | | | 4.250 | % | | | 785,160 | | | | 814,593 | | |
Credit Suisse Mortgage Capital Certificates(a)(b)
CMO Series 2011-16R Class 7A3
12/27/36 | | | 3.500 | % | | | 277,547 | | | | 277,661 | | |
Credit Suisse Mortgage Capital Certificates(b)
CMO Series 2011-17R Class 2A1
12/27/37 | | | 3.400 | % | | | 74,448 | | | | 74,477 | | |
New Residential Mortgage Loan Trust(b)
CMO Series 2014-1A Class A
01/25/54 | | | 3.750 | % | | | 1,848,230 | | | | 1,904,567 | | |
Series 2014-2A Class A3
05/25/54 | | | 3.750 | % | | | 977,391 | | | | 1,009,288 | | |
RBSSP Resecuritization Trust
CMO Series 2010-1 Class 3A1(a)(b)
08/26/35 | | | 2.790 | % | | | 2,656,066 | | | | 2,674,063 | | |
WaMu Mortgage Pass-Through Certificates
CMO Series 2003-AR8 Class A(a)
08/25/33 | | | 2.476 | % | | | 2,664,366 | | | | 2,685,477 | | |
Total Residential Mortgage-Backed
Securities — Non-Agency
(Cost: $11,468,190) | | | | | | | 11,361,105 | | |
Commercial Mortgage-Backed Securities —
Non-Agency 9.0% | |
American Homes 4 Rent Trust(b)
Series 2014-SFR2 Class A
10/17/36 | | | 3.786 | % | | | 2,663,050 | | | | 2,822,386 | | |
Series 2014-SFR3 Class A
12/17/36 | | | 3.678 | % | | | 3,037,652 | | | | 3,196,458 | | |
Series 2015-SFR2 Class A
10/17/45 | | | 3.732 | % | | | 267,738 | | | | 282,754 | | |
American Homes 4 Rent
Series 2015-SFR1 Class A(b)
04/17/52 | | | 3.467 | % | | | 4,517,434 | | | | 4,684,645 | | |
Citigroup Commercial Mortgage Trust
Series 2015-GC35 Class A3
11/10/48 | | | 3.549 | % | | | 1,335,000 | | | | 1,426,646 | | |
Colony Multifamily Mortgage Trust
Series 2014-1 Class A(b)
04/20/50 | | | 2.543 | % | | | 4,202,200 | | | | 4,183,092 | | |
Commercial Mortgage Trust
Series 2007-C9 Class AM
12/10/49 | | | 5.650 | % | | | 4,835,000 | | | | 5,005,841 | | |
Series 2015-CR22 Class A5
03/10/48 | | | 3.309 | % | | | 685,000 | | | | 714,733 | | |
Series 2015-LC19 Class A4
02/10/48 | | | 3.183 | % | | | 765,000 | | | | 797,500 | | |
The accompanying Notes to Financial Statements are an integral part of this statement.
Annual Report 2016
12
PORTFOLIO OF INVESTMENTS (continued)
April 30, 2016
Commercial Mortgage-Backed Securities —
Non-Agency (continued)
Issuer | | Coupon
Rate | | Principal
Amount ($) | | Value ($) | |
DBUBS Mortgage Trust
Series 2011-LC2A Class A4(b)
07/10/44 | | | 4.537 | % | | | 2,560,000 | | | | 2,840,553 | | |
GS Mortgage Securities Trust
Series 2015-GC34 Class A4
10/10/48 | | | 3.506 | % | | | 925,000 | | | | 977,456 | | |
Invitation Homes Trust
Series 2015-SFR3 Class A(a)(b)
08/17/32 | | | 1.733 | % | | | 1,894,888 | | | | 1,885,477 | | |
JPMBB Commercial Mortgage Securities Trust
Series 2015-C27 Class A4
02/15/48 | | | 3.179 | % | | | 700,000 | | | | 722,056 | | |
JPMorgan Chase Commercial Mortgage Securities Trust
Series 2012-C6 Class A3
05/15/45 | | | 3.507 | % | | | 1,455,000 | | | | 1,556,227 | | |
LB Commercial Mortgage Trust
Series 2007-C3 Class AM(a)
07/15/44 | | | 6.096 | % | | | 5,048,000 | | | | 5,238,361 | | |
LB-UBS Commercial Mortgage Trust
Series 2007-C2 Class A3
02/15/40 | | | 5.430 | % | | | 1,094,646 | | | | 1,115,309 | | |
Merrill Lynch Mortgage Investors Trust
CMO IO Series 1998-C3 Class IO(a)(e)
12/15/30 | | | 1.078 | % | | | 308,954 | | | | 3,393 | | |
Morgan Stanley Bank of America Merrill Lynch Trust
Series 2015-C20 Class A3
02/15/48 | | | 2.988 | % | | | 495,000 | | | | 503,594 | | |
Morgan Stanley Re-Remic Trust(a)(b)
Series 2009-GG10 Class A4B
08/12/45 | | | 5.987 | % | | | 1,335,000 | | | | 1,365,687 | | |
Series 2010-GG10 Class A4B
08/15/45 | | | 5.987 | % | | | 715,000 | | | | 731,435 | | |
WF-RBS Commercial Mortgage Trust
Series 2014-C24 Class A5
11/15/47 | | | 3.607 | % | | | 620,000 | | | | 662,091 | | |
Wells Fargo Commercial Mortgage Trust
Series 2015-C26 Class A4
02/15/48 | | | 3.166 | % | | | 1,000,000 | | | | 1,031,773 | | |
Series 2015-C27 Class A4
02/15/48 | | | 3.190 | % | | | 1,490,000 | | | | 1,540,690 | | |
Series 2015-LC20 Class A4
04/15/50 | | | 2.925 | % | | | 1,647,000 | | | | 1,669,253 | | |
Series 2015-LC20 Class A5
04/15/50 | | | 3.184 | % | | | 300,000 | | | | 309,580 | | |
Series 2016-C33 Class A3
03/15/59 | | | 3.162 | % | | | 605,000 | | | | 614,332 | | |
Series 2016-NXS5 Class A4
01/15/59 | | | 3.370 | % | | | 3,500,000 | | | | 3,659,318 | | |
Total Commercial Mortgage-Backed
Securities — Non-Agency
(Cost: $49,635,049) | | | | | | | 49,540,640 | | |
Asset-Backed Securities — Agency 1.1%
Issuer | | Coupon
Rate | | Principal
Amount ($) | | Value ($) | |
United States Small Business Administration
Series 2012-20G Class 1
07/01/32 | | | 2.380 | % | | | 326,327 | | | | 330,900 | | |
Series 2012-20I Class 1
09/01/32 | | | 2.200 | % | | | 342,125 | | | | 344,282 | | |
Series 2012-20J Class 1
10/01/32 | | | 2.180 | % | | | 1,240,677 | | | | 1,247,132 | | |
Series 2012-20L Class 1
12/01/32 | | | 1.930 | % | | | 350,216 | | | | 347,308 | | |
Series 2013-20E Class 1
05/01/33 | | | 2.070 | % | | | 205,219 | | | | 205,280 | | |
Series 2013-20G Class 1
07/01/33 | | | 3.150 | % | | | 704,474 | | | | 737,023 | | |
Series 2013-20L Class 1
12/01/33 | | | 3.380 | % | | | 285,894 | | | | 302,835 | | |
Series 2014-20C Class 1
03/01/34 | | | 3.210 | % | | | 368,170 | | | | 387,211 | | |
Series 2014-20D Class 1
04/01/34 | | | 3.110 | % | | | 1,163,709 | | | | 1,223,729 | | |
Series 2014-20F Class 1
06/01/34 | | | 2.990 | % | | | 744,766 | | | | 773,278 | | |
Series 2015-20C Class 1
03/01/35 | | | 2.720 | % | | | 102,585 | | | | 104,797 | | |
Total Asset-Backed Securities — Agency
(Cost: $5,737,567) | | | | | | | 6,003,775 | | |
Asset-Backed Securities — Non-Agency 13.8% | |
ARI Fleet Lease Trust
Series 2014-A Class A2(b)
11/15/22 | | | 0.810 | % | | | 1,225,793 | | | | 1,224,305 | | |
AmeriCredit Automobile Receivables Trust
Series 2016-2 Class A2B(a)
10/08/19 | | | 1.137 | % | | | 595,000 | | | | 595,000 | | |
Ascentium Equipment Receivables LLC
Series 2015-2A Class A2(b)
12/11/17 | | | 1.570 | % | | | 470,000 | | | | 470,551 | | |
Ascentium Equipment Receivables
Series 2015-1A Class A2(b)
07/10/17 | | | 1.150 | % | | | 362,337 | | | | 362,256 | | |
Avis Budget Rental Car Funding AESOP LLC
Series 2015-2A Class A(b)
12/20/21 | | | 2.630 | % | | | 1,195,000 | | | | 1,192,518 | | |
Cabela's Credit Card Master Note Trust
Series 2015-2 Class A1
07/17/23 | | | 2.250 | % | | | 990,000 | | | | 998,934 | | |
Cabela's Credit Card Master Note Trust(a)(b)
Series 2012-1A Class A2
02/18/20 | | | 0.963 | % | | | 635,000 | | | | 634,969 | | |
Cabela's Master Credit Card Trust
Series 2014-1 Class A(a)
03/16/20 | | | 0.783 | % | | | 715,000 | | | | 714,913 | | |
The accompanying Notes to Financial Statements are an integral part of this statement.
Annual Report 2016
13
PORTFOLIO OF INVESTMENTS (continued)
April 30, 2016
Asset-Backed Securities — Non-Agency (continued)
Issuer | | Coupon
Rate | | Principal
Amount ($) | | Value ($) | |
Capital One Multi-Asset Execution Trust
Series 2015-A2 Class A2
03/15/23 | | | 2.080 | % | | | 3,405,000 | | | | 3,461,445 | | |
Series 2015-A8 Class A8
08/15/23 | | | 2.050 | % | | | 1,075,000 | | | | 1,088,854 | | |
CarMax Auto Owner Trust
Series 2015-3 Class A3
05/15/20 | | | 1.630 | % | | | 1,295,000 | | | | 1,304,030 | | |
Chase Issuance Trust
Series 2012-A4 Class A4
08/16/21 | | | 1.580 | % | | | 860,000 | | | | 864,660 | | |
Chesapeake Funding LLC(a)(b)
Series 2011-2A Class A
04/07/24 | | | 1.689 | % | | | 332,385 | | | | 333,617 | | |
Series 2012-2A Class A
05/07/24 | | | 0.889 | % | | | 114,613 | | | | 114,577 | | |
Series 2013-1A Class A
01/07/25 | | | 0.889 | % | | | 427,587 | | | | 427,347 | | |
Series 2014-1A Class A
03/07/26 | | | 0.859 | % | | | 276,394 | | | | 275,694 | | |
Citibank Credit Card Issuance Trust
Series 2014-A1 Class A1
01/23/23 | | | 2.880 | % | | | 3,455,000 | | | | 3,617,984 | | |
Series 2014-A5 Class A5
06/07/23 | | | 2.680 | % | | | 730,000 | | | | 759,577 | | |
Series 2014-A6 Class A6
07/15/21 | | | 2.150 | % | | | 475,000 | | | | 486,217 | | |
Citigroup Mortgage Loan Trust, Inc.
CMO Series 2005-WF2 Class MF1(a)
08/25/35 | | | 5.308 | % | | | 97,077 | | | | 524 | | |
Dell Equipment Finance Trust(a)(b)
Series 2015-2 Class A2B
12/22/17 | | | 1.341 | % | | | 250,000 | | | | 249,986 | | |
Dell Equipment Finance Trust(b)
Series 2015-2 Class A2A
12/22/17 | | | 1.420 | % | | | 500,000 | | | | 499,340 | | |
Discover Card Execution Note Trust
Series 2012-A6 Class A6
01/18/22 | | | 1.670 | % | | | 480,000 | | | | 483,158 | | |
Series 2015-A2 Class A
10/17/22 | | | 1.900 | % | | | 4,750,000 | | | | 4,812,529 | | |
Enterprise Fleet Financing LLC(b)
Series 2013-2 Class A2
03/20/19 | | | 1.060 | % | | | 249,695 | | | | 249,532 | | |
Series 2014-2 Class A2
03/20/20 | | | 1.050 | % | | | 590,828 | | | | 587,989 | | |
Series 2015-1 Class A2
09/20/20 | | | 1.300 | % | | | 1,053,527 | | | | 1,051,716 | | |
Series 2015-2 Class A2
02/22/21 | | | 1.590 | % | | | 837,304 | | | | 837,232 | | |
Asset-Backed Securities — Non-Agency (continued)
Issuer | | Coupon
Rate | | Principal
Amount ($) | | Value ($) | |
Ford Credit Auto Owner Trust(b)
Series 2014-2 Class A
04/15/26 | | | 2.310 | % | | | 2,095,000 | | | | 2,123,941 | | |
Series 2015-1 Class A
07/15/26 | | | 2.120 | % | | | 3,365,000 | | | | 3,398,006 | | |
Series 2015-2 Class A
01/15/27 | | | 2.440 | % | | | 970,000 | | | | 984,877 | | |
Ford Credit Floorplan Master Owner Trust
Series 2013-2 Class A(b)
03/15/22 | | | 2.090 | % | | | 1,570,000 | | | | 1,584,072 | | |
GE Dealer Floorplan Master Note Trust
Series 2012-2 Class A(a)
04/22/19 | | | 1.189 | % | | | 735,000 | | | | 736,430 | | |
GM Financial Automobile Leasing Trust
Series 2015-3 Class A3
03/20/19 | | | 1.690 | % | | | 625,000 | | | | 627,361 | | |
GM Financial Automobile Leasing Trust(a)
Series 2015-2 Class A2B
04/20/18 | | | 0.859 | % | | | 865,314 | | | | 864,585 | | |
Golden Credit Card Trust
Series 2015-3A Class A(a)(b)
07/15/19 | | | 0.853 | % | | | 3,125,000 | | | | 3,119,375 | | |
GreatAmerica Leasing Receivables Funding LLC
Series 2015-1 Class A2(b)
06/20/17 | | | 1.120 | % | | | 862,126 | | | | 862,992 | | |
Green Tree Agency Advance Funding Trust I
Series 2015-T1 Class AT1(b)
10/15/46 | | | 2.302 | % | | | 990,000 | | | | 988,862 | | |
Hertz Fleet Lease Funding LP(a)(b)
Series 2013-3 Class A
12/10/27 | | | 0.987 | % | | | 1,238,198 | | | | 1,239,072 | | |
Series 2014-1 Class A
04/10/28 | | | 0.837 | % | | | 348,372 | | | | 348,520 | | |
Series 2016-1 Class A1
04/10/30 | | | 1.439 | % | | | 2,180,000 | | | | 2,179,782 | | |
Hertz Vehicle Financing II LP
Series 2015-3A Class A(b)
09/25/21 | | | 2.670 | % | | | 1,000,000 | | | | 999,181 | | |
Huntington Auto Trust
Series 2015-1 Class A2
10/16/17 | | | 0.760 | % | | | 465,523 | | | | 465,505 | | |
Hyundai Floorplan Master Owner Trust(a)(b)
Series 2013-1A Class A
05/15/18 | | | 0.783 | % | | | 3,675,000 | | | | 3,674,733 | | |
Series 2016-1A Class A1
03/15/21 | | | 1.340 | % | | | 330,000 | | | | 329,967 | | |
John Deere Owner Trust
Series 2016-A Class A2
10/15/18 | | | 1.150 | % | | | 790,000 | | | | 788,770 | | |
The accompanying Notes to Financial Statements are an integral part of this statement.
Annual Report 2016
14
PORTFOLIO OF INVESTMENTS (continued)
April 30, 2016
Asset-Backed Securities — Non-Agency (continued)
Issuer | | Coupon
Rate | | Principal
Amount ($) | | Value ($) | |
MMAF Equipment Finance LLC
Series 2014-AA Class A2(b)
04/10/17 | | | 0.520 | % | | | 264,140 | | | | 264,107 | | |
NRZ Advance Receivables Trust(b)
Series 2015-T1 Class AT1
08/15/46 | | | 2.315 | % | | | 1,290,000 | | | | 1,289,597 | | |
Series 2015-T3 Class AT3
11/15/46 | | | 2.540 | % | | | 1,320,000 | | | | 1,320,864 | | |
Navitas Equipment Receivables LLC
Series 2015-1 Class A2(b)
11/15/18 | | | 2.120 | % | | | 1,922,722 | | | | 1,917,212 | | |
New York City Tax Lien Trust
Series 2015-A Class A(b)
11/10/28 | | | 1.340 | % | | | 749,562 | | | | 744,845 | | |
Nissan Auto Receivables Owner Trust
Series 2016-A Class A3
10/15/20 | | | 1.340 | % | | | 585,000 | | | | 584,096 | | |
Nissan Auto Receivables Owner Trust(a)
Series 2015-A Class A1
01/15/20 | | | 0.833 | % | | | 2,140,000 | | | | 2,135,125 | | |
Ocwen Master Advance Receivables Trust
Series 2015-1 Class AT1(b)
09/17/46 | | | 2.537 | % | | | 775,000 | | | | 774,647 | | |
PFS Tax Lien Trust
Series 2014-1 Class NOTE(b)
05/15/29 | | | 1.440 | % | | | 592,156 | | | | 589,394 | | |
SLM Student Loan Trust
Series 2014-2 Class A1(a)
07/25/19 | | | 0.689 | % | | | 17,373 | | | | 17,368 | | |
SMART ABS Series Trust
Series 2015-3US Class A2B(a)
04/16/18 | | | 1.187 | % | | | 645,000 | | | | 643,239 | | |
SPS Servicer Advance Receivables Trust
Series 2015-T2 Class AT2(b)
01/15/47 | | | 2.620 | % | | | 760,000 | | | | 760,005 | | |
SoFi Professional Loan Program
Series 2016-A(b)
12/26/36 | | | 2.760 | % | | | 1,317,857 | | | | 1,301,083 | | |
Synchrony Credit Card Master Note Trust
Series 2016-1 Class A
03/15/22 | | | 2.040 | % | | | 1,295,000 | | | | 1,304,161 | | |
USAA Auto Owner Trust
Series 2015-1 Class A2
03/15/18 | | | 0.820 | % | | | 4,025,140 | | | | 4,023,512 | | |
Volvo Financial Equipment LLC
Series 2015-1A Class A3(b)
06/17/19 | | | 1.510 | % | | | 1,000,000 | | | | 999,765 | | |
Wheels SPV 2 LLC
Series 2015-1A Class A2(b)
04/22/24 | | | 1.270 | % | | | 836,889 | | | | 834,182 | | |
Asset-Backed Securities — Non-Agency (continued)
Issuer | | Coupon
Rate | | Principal
Amount ($) | | Value ($) | |
World Financial Network Credit Card Master Trust
Series 2012-D Class A
04/17/23 | | | 2.150 | % | | | 790,000 | | | | 798,909 | | |
Series 2015-B Class A
06/17/24 | | | 2.550 | % | | | 1,815,000 | | | | 1,851,843 | | |
World Omni Automobile Lease Securitization Trust
Series 2015-A Class A3
10/15/18 | | | 1.540 | % | | | 830,000 | | | | 834,002 | | |
Total Asset-Backed Securities — Non-Agency
(Cost: $75,669,007) | | | | | | | 76,003,441 | | |
U.S. Treasury Obligations 21.8% | |
U.S. Treasury
05/15/16 | | | 0.250 | % | | | 16,795,000 | | | | 16,794,792 | | |
08/31/16 | | | 0.500 | % | | | 20,000,000 | | | | 20,008,860 | | |
09/15/16 | | | 0.875 | % | | | 15,633,000 | | | | 15,661,702 | | |
02/28/18 | | | 0.750 | % | | | 240,000 | | | | 239,972 | | |
03/31/18 | | | 0.875 | % | | | 6,875,000 | | | | 6,888,427 | | |
12/15/18 | | | 1.250 | % | | | 228,000 | | | | 230,209 | | |
01/15/19 | | | 1.125 | % | | | 550,000 | | | | 553,437 | | |
02/15/19 | | | 0.750 | % | | | 6,295,000 | | | | 6,270,166 | | |
03/15/19 | | | 1.000 | % | | | 3,582,000 | | | | 3,591,095 | | |
03/31/21 | | | 1.250 | % | | | 8,928,000 | | | | 8,915,445 | | |
03/31/23 | | | 1.500 | % | | | 3,331,000 | | | | 3,309,532 | | |
02/15/26 | | | 1.625 | % | | | 7,285,800 | | | | 7,159,437 | | |
11/15/45 | | | 3.000 | % | | | 5,906,400 | | | | 6,320,309 | | |
U.S. Treasury(c)
04/30/21 | | | 1.375 | % | | | 207,000 | | | | 207,938 | | |
U.S. Treasury(h)
STRIPS
11/15/18 | | | 0.000 | % | | | 7,057,000 | | | | 6,904,907 | | |
11/15/19 | | | 0.000 | % | | | 4,135,000 | | | | 3,975,100 | | |
02/15/40 | | | 0.000 | % | | | 14,141,000 | | | | 7,540,094 | | |
11/15/41 | | | 0.000 | % | | | 5,013,000 | | | | 2,505,678 | | |
05/15/43 | | | 0.000 | % | | | 7,022,000 | | | | 3,315,416 | | |
Total U.S. Treasury Obligations
(Cost: $116,675,547) | | | | | | | 120,392,516 | | |
U.S. Government & Agency Obligations 0.9% | |
Residual Funding Corp.(h)
STRIPS
01/15/30 | | | 0.000 | % | | | 3,342,000 | | | | 2,273,389 | | |
04/15/30 | | | 0.000 | % | | | 3,615,000 | | | | 2,446,787 | | |
Total U.S. Government & Agency Obligations
(Cost: $4,601,731) | | | | | | | 4,720,176 | | |
The accompanying Notes to Financial Statements are an integral part of this statement.
Annual Report 2016
15
PORTFOLIO OF INVESTMENTS (continued)
April 30, 2016
Foreign Government Obligations(i) 1.6%
Issuer | | Coupon
Rate | | Principal
Amount ($) | | Value ($) | |
COLOMBIA —% | |
Colombia Government International Bond
01/18/41 | | | 6.125 | % | | | 235,000 | | | | 254,919 | | |
FRANCE 0.3% | |
Electricite de France SA(b)
10/13/55 | | | 5.250 | % | | | 1,634,000 | | | | 1,645,861 | | |
MEXICO 0.7% | |
Mexico Government International Bond
03/15/22 | | | 3.625 | % | | | 1,536,000 | | | | 1,588,224 | | |
03/08/44 | | | 4.750 | % | | | 80,000 | | | | 80,800 | | |
Petroleos Mexicanos
03/01/18 | | | 5.750 | % | | | 1,935,000 | | | | 2,028,422 | | |
06/15/35 | | | 6.625 | % | | | 435,000 | | | | 441,525 | | |
Total | | | | | | | 4,138,971 | | |
PANAMA 0.1% | |
Panama Government International Bond
01/26/36 | | | 6.700 | % | | | 270,000 | | | | 345,600 | | |
PERU 0.1% | |
Peruvian Government International Bond
03/14/37 | | | 6.550 | % | | | 285,000 | | | | 365,513 | | |
PHILIPPINES —% | |
Philippine Government International Bond
10/23/34 | | | 6.375 | % | | | 100,000 | | | | 142,247 | | |
QATAR 0.4% | |
Nakilat, Inc.(b)
12/31/33 | | | 6.067 | % | | | 1,592,000 | | | | 1,812,492 | | |
Ras Laffan Liquefied Natural Gas Co., Ltd. III(b)
09/30/16 | | | 5.832 | % | | | 175,062 | | | | 178,292 | | |
Total | | | | | | | 1,990,784 | | |
URUGUAY —% | |
Uruguay Government International Bond
11/20/45 | | | 4.125 | % | | | 165,000 | | | | 141,900 | | |
Total Foreign Government Obligations
(Cost: $8,510,969) | | | | | | | 9,025,795 | | |
Municipal Bonds 1.8%
Issue
Description | | Coupon
Rate | | Principal
Amount ($) | | Value ($) | |
CALIFORNIA 1.1% | |
Los Angeles Unified School District
Unlimited General Obligation Bonds
Taxable Build America Bonds
Series 2009
07/01/34 | | | 5.750 | % | | | 2,485,000 | | | | 3,152,023 | | |
State of California
Unlimited General Obligation Bonds
Taxable Build America Bonds
Series 2009
04/01/39 | | | 7.550 | % | | | 1,720,000 | | | | 2,666,241 | | |
Total | | | | | | | 5,818,264 | | |
ILLINOIS 0.3% | |
City of Chicago Waterworks
Refunding Revenue Bonds
2nd Lien
Series 2012
11/01/42 | | | 5.000 | % | | | 635,000 | | | | 690,372 | | |
Revenue Bonds
Build America Bonds
Series 2010
11/01/40 | | | 6.742 | % | | | 865,000 | | | | 1,021,331 | | |
City of Chicago
Unlimited General Obligation Taxable Bonds
Series 2015B
01/01/33 | | | 7.375 | % | | | 200,000 | | | | 203,110 | | |
Total | | | | | | | 1,914,813 | | |
KENTUCKY 0.1% | |
Kentucky Asset Liability Commission
Taxable Revenue Bonds
Series 2010
04/01/18 | | | 3.165 | % | | | 788,819 | | | | 803,610 | | |
OHIO 0.3% | |
JobsOhio Beverage System
Taxable Revenue Bonds
Series 2013-B
01/01/35 | | | 4.532 | % | | | 1,310,000 | | | | 1,470,816 | | |
Total Municipal Bonds
(Cost: $7,908,447) | | | | | | | 10,007,503 | | |
Preferred Debt 0.4%
Issuer | | Coupon
Rate | | Principal
Amount ($) | | Value ($) | |
BANKING 0.3% | |
PNC Financial Services Group, Inc. (The)(a)
12/31/49 | | | 6.125 | % | | | 33,225 | | | | 960,535 | | |
The accompanying Notes to Financial Statements are an integral part of this statement.
Annual Report 2016
16
PORTFOLIO OF INVESTMENTS (continued)
April 30, 2016
Preferred Debt (continued)
Issuer | | Coupon
Rate | | Principal
Amount ($) | | Value ($) | |
State Street Corp.(a)
12/31/49 | | | 5.350 | % | | | 15,000 | | | | 394,350 | | |
U.S. Bancorp(a)
12/31/49 | | | 6.500 | % | | | 24,750 | | | | 731,610 | | |
Total | | | | | | | 2,086,495 | | |
PROPERTY & CASUALTY 0.1% | |
Allstate Corp. (The)(a)
01/15/53 | | | 5.100 | % | | | 13,575 | | | | 353,629 | | |
Total Preferred Debt
(Cost: $2,198,326) | | | | | | | 2,440,124 | | |
Common Stocks —%
Issuer | | Shares | | Value ($) | |
CONSUMER STAPLES —% | |
Beverages —% | |
Crimson Wine Group Ltd.(j) | | | 3 | | | | 25 | | |
Total Consumer Staples | | | | | 25 | | |
Common Stocks (continued)
Issuer | | Shares | | Value ($) | |
FINANCIALS —% | |
Diversified Financial Services —% | |
Leucadia National Corp. | | | 39 | | | | 651 | | |
Total Financials | | | | | 651 | | |
Total Common Stocks
(Cost: $—) | | | | | 676 | | |
Money Market Funds 0.2%
| | | Shares | | Value ($) | |
Columbia Short-Term Cash Fund,
0.422%(k)(l) | | | 868,546 | | | | 868,546 | | |
Total Money Market Funds
(Cost: $868,546) | | | | | 868,546 | | |
Total Investments
(Cost: $608,467,271) | | | | | 623,727,530 | | |
Other Assets & Liabilities, Net | | | | | (72,293,792 | ) | |
Net Assets | | | | | 551,433,738 | | |
At April 30, 2016, securities and cash totaling $701,218 were pledged as collateral.
Investments in Derivatives
Futures Contracts Outstanding at April 30, 2016
Long Futures Contracts Outstanding
Contract Description | | Number of
Contracts | | Trading
Currency | | Notional
Market
Value ($) | | Expiration
Date | | Unrealized
Appreciation ($) | | Unrealized
(Depreciation) ($) | |
U.S. Treasury 10-Year Note | | | 10 | | | USD | | | | | 1,300,625 | | | 06/2016 | | | — | | | | (175 | ) | |
U.S. Treasury 10-Year Note | | | 56 | | | USD | | | | | 7,283,500 | | | 06/2016 | | | — | | | | (10,592 | ) | |
U.S. Treasury 2-Year Note | | | 142 | | | USD | | | | | 31,044,750 | | | 06/2016 | | | — | | | | (1,332 | ) | |
U.S. Treasury 2-Year Note | | | 100 | | | USD | | | | | 21,862,500 | | | 06/2016 | | | — | | | | (2,415 | ) | |
U.S. Treasury 5-Year Note | | | 60 | | | USD | | | | | 7,254,844 | | | 06/2016 | | | 20,423 | | | | — | | |
U.S. Treasury 5-Year Note | | | 272 | | | USD | | | | | 32,888,625 | | | 06/2016 | | | — | | | | (5,031 | ) | |
Total | | | | | | | 101,634,844 | | | | | | 20,423 | | | | (19,545 | ) | |
The accompanying Notes to Financial Statements are an integral part of this statement.
Annual Report 2016
17
PORTFOLIO OF INVESTMENTS (continued)
April 30, 2016
Short Futures Contracts Outstanding
Contract Description | | Number of
Contracts | | Trading
Currency | | Notional
Market
Value ($) | | Expiration
Date | | Unrealized
Appreciation ($) | | Unrealized
(Depreciation) ($) | |
U.S. Long Bond | | | (54 | ) | | USD | | | | | (8,818,875 | ) | | 06/2016 | | | 134,198 | | | | — | | |
U.S. Long Bond | | | (5 | ) | | USD | | | | | (816,562 | ) | | 06/2016 | | | — | | | | (479 | ) | |
U.S. Treasury Ultra 10-Year Note | | | (59 | ) | | USD | | | | | (8,293,188 | ) | | 06/2016 | | | 77,029 | | | | — | | |
U.S. Treasury Ultra 10-Year Note | | | (26 | ) | | USD | | | | | (3,654,625 | ) | | 06/2016 | | | — | | | | (12,950 | ) | |
U.S. Ultra Bond | | | (60 | ) | | USD | | | | | (10,280,625 | ) | | 06/2016 | | | 273,630 | | | | — | | |
Total | | | | | | | (31,863,875 | ) | | | | | 484,857 | | | | (13,429 | ) | |
Credit Default Swap Contracts Outstanding at April 30, 2016
Buy Protection
Counterparty | | Reference
Entity | | Expiration
Date | | Pay Fixed
Rate (%) | | Notional
Currency | | Notional
Amount ($) | | Market
Value ($) | | Premium
Paid ($) | | Premium
Received
($) | | Periodic
Payments
Receivable
(Payable)
($) | | Unrealized
Appreciation
($) | | Unrealized
Depreciation
($) | |
Citi | | McDonald's Corp. | | 12/20/2020 | | | 1.000 | | | USD | | | | | 1,670,000 | | | | (51,744 | ) | | | — | | | | (41,017 | ) | | | (1,855 | ) | | | — | | | | (12,582 | ) | |
Goldman Sachs
International | | Barclays Bank, PLC
| | 12/20/2020
| | | 1.000
| | | USD |
| | | | 675,000
| | | | 2,784
| | | | —
| | | | (12,576
| ) | | | (751
| ) | | | 14,609
| | | | —
| | |
Goldman Sachs
International | | Citigroup, Inc.
| | 06/20/2021
| | | 1.000
| | | USD |
| | | | 1,375,000
| | | | (2,382
| ) | | | 2,665
| | | | —
| | | | (1,528
| ) | | | —
| | | | (6,575
| ) | |
Goldman Sachs
International | | Morgan Stanley
| | 12/20/2020
| | | 1.000
| | | USD |
| | | | 400,000
| | | | (480
| ) | | | 873
| | | | —
| | | | (444
| ) | | | —
| | | | (1,797
| ) | |
JPMorgan | | Morgan Stanley | | 12/20/2020 | | | 1.000 | | | USD | | | | | 2,800,000 | | | | (3,357 | ) | | | — | | | | (7,355 | ) | | | (3,111 | ) | | | 887 | | | | — | | |
Morgan Stanley
| | Goldman Sachs
Group, Inc. | | 12/20/2020
| | | 1.000
| | | USD |
| | | | 805,000
| | | | (449
| ) | | | 3,860
| | | | —
| | | | (894
| ) | | | —
| | | | (5,203
| ) | |
Total | | | | | | | | | | | | | | | 7,398 | | | | (60,948 | ) | | | | | 15,496 | | | | (26,157 | ) | |
Cleared Credit Default Swap Contracts Outstanding at April 30, 2016
Buy Protection
Counterparty | | Reference
Entity | | Expiration
Date | | Pay Fixed
Rate (%) | | Notional
Currency | | Notional
Amount ($) | | Unrealized
Appreciation ($) | | Unrealized
Depreciation ($) | |
Morgan Stanley | | Markit CDX North America
Investment Grade Index,
Series 26 | | 06/20/2021 | | | 1.000 | | | USD | | | | | 26,500,000 | | | | — | | | | (40,275 | ) | |
Notes to Portfolio of Investments
(a) Variable rate security.
(b) Represents privately placed and other securities and instruments exempt from SEC registration (collectively, private placements), such as Section 4(a)(2) and Rule 144A eligible securities, which are often sold only to qualified institutional buyers. The Fund may invest in private placements determined to be liquid as well as those determined to be illiquid. Private placements may be determined to be liquid under guidelines established by the Fund's Board of Trustees. At April 30, 2016, the value of these securities amounted to $101,900,508 or 18.48% of net assets.
(c) Security, or a portion thereof, has been purchased on a when-issued or delayed delivery basis.
The accompanying Notes to Financial Statements are an integral part of this statement.
Annual Report 2016
18
PORTFOLIO OF INVESTMENTS (continued)
April 30, 2016
Notes to Portfolio of Investments (continued)
(d) This security or a portion of this security has been pledged as collateral in connection with derivative contracts.
(e) Interest Only (IO) represents the right to receive the monthly interest payments on an underlying pool of mortgage loans.
(f) Identifies securities considered by the Investment Manager to be illiquid and may be difficult to sell. The aggregate value of such securities at April 30, 2016 was $2,594, which represents less than 0.01% of net assets. Information concerning such security holdings at April 30, 2016 is as follows:
Security Description | | Acquisition Dates | | Cost ($) | |
American Mortgage Trust
Series 2093-3 Class 3A
07/27/23 8.188% | | 10/22/2010 - 10/12/2011 | | | 2,938 | | |
(g) Represents fair value as determined in good faith under procedures approved by the Board of Trustees. At April 30, 2016, the value of these securities amounted to $2,594, which represents less than 0.01% of net assets.
(h) Zero coupon bond.
(i) Principal and interest may not be guaranteed by the government.
(j) Non-income producing investment.
(k) The rate shown is the seven-day current annualized yield at April 30, 2016.
(l) As defined in the Investment Company Act of 1940, an affiliated company is one in which the Fund owns 5% or more of the company's outstanding voting securities, or a company which is under common ownership or control with the Fund. Holdings and transactions in these affiliated companies during the year ended April 30, 2016 are as follows:
Issuer | | Beginning
Cost ($) | | Purchase
Cost ($) | | Proceeds
From Sales ($) | | Ending
Cost ($) | | Dividends —
Affiliated
Issuers ($) | | Value ($) | |
Columbia Short-Term Cash Fund | | | 1,697,752 | | | | 175,716,779 | | | | (176,545,985 | ) | | | 868,546 | | | | 6,971 | | | | 868,546 | | |
Abbreviation Legend
CMO Collateralized Mortgage Obligation
STRIPS Separate Trading of Registered Interest and Principal Securities
Currency Legend
USD US Dollar
Fair Value Measurements
The Fund categorizes its fair value measurements according to a three-level hierarchy that maximizes the use of observable inputs and minimizes the use of unobservable inputs by prioritizing that the most observable input be used when available. Observable inputs are those that market participants would use in pricing an investment based on market data obtained from sources independent of the reporting entity. Unobservable inputs are those that reflect the Fund's assumptions about the information market participants would use in pricing an investment. An investment's level within the fair value hierarchy is based on the lowest level of any input that is deemed significant to the asset's or liability's fair value measurement. The input levels are not necessarily an indication of the risk or liquidity associated with investments at that level. For example, certain U.S. government securities are generally high quality and liquid, however, they are reflected as Level 2 because the inputs used to determine fair value may not always be quoted prices in an active market.
Fair value inputs are summarized in the three broad levels listed below:
> Level 1 — Valuations based on quoted prices for investments in active markets that the Fund has the ability to access at the measurement date (including NAV for open-end mutual funds). Valuation adjustments are not applied to Level 1 investments.
> Level 2 — Valuations based on other significant observable inputs (including quoted prices for similar securities, interest rates, prepayment speeds, credit risks, etc.).
> Level 3 — Valuations based on significant unobservable inputs (including the Fund's own assumptions and judgment in determining the fair value of investments).
The accompanying Notes to Financial Statements are an integral part of this statement.
Annual Report 2016
19
PORTFOLIO OF INVESTMENTS (continued)
April 30, 2016
Fair Value Measurements (continued)
Inputs that are used in determining fair value of an investment may include price information, credit data, volatility statistics, and other factors. These inputs can be either observable or unobservable. The availability of observable inputs can vary between investments, and is affected by various factors such as the type of investment, and the volume and level of activity for that investment or similar investments in the marketplace. The inputs will be considered by the Investment Manager, along with any other relevant factors in the calculation of an investment's fair value. The Fund uses prices and inputs that are current as of the measurement date, which may include periods of market dislocations. During these periods, the availability of prices and inputs may be reduced for many investments. This condition could cause an investment to be reclassified between the various levels within the hierarchy.
Certain investments that have been measured at fair value using the net asset value per share (or its equivalent) are not categorized in the fair value hierarchy. The fair value amounts presented in the table are intended to reconcile the fair value hierarchy to the amounts presented in the Portfolio of Investments. The Columbia Short-Term Cash Fund seeks to provide shareholders with maximum current income consistent with liquidity and stability of principal. Investments in Columbia Short-Term Cash Fund may be redeemed on a daily basis without restriction.
Investments falling into the Level 3 category are primarily supported by quoted prices from brokers and dealers participating in the market for those investments. However, these may be classified as Level 3 investments due to lack of market transparency and corroboration to support these quoted prices. Additionally, valuation models may be used as the pricing source for any remaining investments classified as Level 3. These models may rely on one or more significant unobservable inputs and/or significant assumptions by the Investment Manager. Inputs used in valuations may include, but are not limited to, financial statement analysis, capital account balances, discount rates and estimated cash flows, and comparable company data.
Under the direction of the Fund's Board of Trustees (the Board), the Investment Manager's Valuation Committee (the Committee) is responsible for overseeing the valuation procedures approved by the Board. The Committee consists of voting and non-voting members from various groups within the Investment Manager's organization, including operations and accounting, trading and investments, compliance, risk management and legal.
The Committee meets at least monthly to review and approve valuation matters, which may include a description of specific valuation determinations, data regarding pricing information received from approved pricing vendors and brokers and the results of Board-approved valuation control policies and procedures (the Policies). The Policies address, among other things, instances when market quotations are or are not readily available, including recommendations of third party pricing vendors and a determination of appropriate pricing methodologies; events that require specific valuation determinations and assessment of fair value techniques; securities with a potential for stale pricing, including those that are illiquid, restricted, or in default; and the effectiveness of third party pricing vendors, including periodic reviews of vendors. The Committee meets more frequently, as needed, to discuss additional valuation matters, which may include the need to review back-testing results, review time-sensitive information or approve related valuation actions. The Committee reports to the Board, with members of the Committee meeting with the Board at each of its regularly scheduled meetings to discuss valuation matters and actions during the period, similar to those described earlier.
For investments categorized as Level 3, the Committee monitors information similar to that described above, which may include: (i) data specific to the issuer or comparable issuers, (ii) general market or specific sector news and (iii) quoted prices and specific or similar security transactions. The Committee considers this data and any changes from prior periods in order to assess the reasonableness of observable and unobservable inputs, any assumptions or internal models used to value those securities and changes in fair value. This data is also used to corroborate, when available, information received from approved pricing vendors and brokers. Various factors impact the frequency of monitoring this information (which may occur as often as daily). However, the Committee may determine that changes to inputs, assumptions and models are not required as a result of the monitoring procedures performed.
The accompanying Notes to Financial Statements are an integral part of this statement.
Annual Report 2016
20
PORTFOLIO OF INVESTMENTS (continued)
April 30, 2016
Fair Value Measurements (continued)
The following table is a summary of the inputs used to value the Fund's investments at April 30, 2016:
| | | Level 1
Quoted Prices in Active
Markets for Identical
Assets ($) | | Level 2
Other Significant
Observable Inputs ($) | | Level 3
Significant
Unobservable Inputs ($) | | Total ($) | |
Investments | |
Corporate Bonds & Notes | | | — | | | | 176,457,279 | | | | — | | | | 176,457,279 | | |
Residential Mortgage-Backed
Securities — Agency | | | — | | | | 150,060,065 | | | | 6,845,889 | | | | 156,905,954 | | |
Residential Mortgage-Backed
Securities — Non-Agency | | | — | | | | 11,358,511 | | | | 2,594 | | | | 11,361,105 | | |
Commercial Mortgage-Backed
Securities — Non-Agency | | | — | | | | 49,540,640 | | | | — | | | | 49,540,640 | | |
Asset-Backed Securities — Agency | | | — | | | | 6,003,775 | | | | — | | | | 6,003,775 | | |
Asset-Backed Securities — Non-Agency | | | — | | | | 74,254,574 | | | | 1,748,867 | | | | 76,003,441 | | |
U.S. Treasury Obligations | | | 96,151,321 | | | | 24,241,195 | | | | — | | | | 120,392,516 | | |
U.S. Government & Agency Obligations | | | — | | | | 4,720,176 | | | | — | | | | 4,720,176 | | |
Foreign Government Obligations | | | — | | | | 9,025,795 | | | | — | | | | 9,025,795 | | |
Municipal Bonds | | | — | | | | 10,007,503 | | | | — | | | | 10,007,503 | | |
Preferred Debt | | | 2,440,124 | | | | — | | | | — | | | | 2,440,124 | | |
Common Stocks | |
Consumer Staples | | | 25 | | | | — | | | | — | | | | 25 | | |
Financials | | | 651 | | | | — | | | | — | | | | 651 | | |
Total Common Stocks | | | 676 | | | | — | | | | — | | | | 676 | | |
Investment measured at net asset value | |
Money Market Funds | | | — | | | | — | | | | — | | | | 868,546 | | |
Total Investments | | | 98,592,121 | | | | 515,669,513 | | | | 8,597,350 | | | | 623,727,530 | | |
Derivatives | |
Assets | |
Futures Contracts | | | 505,280 | | | | — | | | | — | | | | 505,280 | | |
Swap Contracts | | | — | | | | 15,496 | | | | — | | | | 15,496 | | |
Liabilities | |
Futures Contracts | | | (32,974 | ) | | | — | | | | — | | | | (32,974 | ) | |
Swap Contracts | | | — | | | | (66,432 | ) | | | — | | | | (66,432 | ) | |
Total | | | 99,064,427 | | | | 515,618,577 | | | | 8,597,350 | | | | 624,148,900 | | |
See the Portfolio of Investments for all investment classifications not indicated in the table.
The Fund's assets assigned to the Level 2 input category are generally valued using the market approach, in which a security's value is determined through reference to prices and information from market transactions for similar or identical assets.
Derivative instruments are valued at unrealized appreciation (depreciation).
There were no transfers of financial assets between levels during the period.
The accompanying Notes to Financial Statements are an integral part of this statement.
Annual Report 2016
21
PORTFOLIO OF INVESTMENTS (continued)
April 30, 2016
Fair Value Measurements (continued)
The following table is a reconciliation of Level 3 assets for which significant observable and unobservable inputs were used to determine fair value:
| | | Residential
Mortgage-Backed
Securities —
Agency ($) | | Residential
Mortgage-Backed
Securities —
Non-Agency ($) | | Asset-Backed
Securities —
Non-Agency ($) | | Total ($) | |
Balance as of April 30, 2015 | | | — | | | | 2,953 | | | | — | | | | 2,953 | | |
Increase (decrease) in accrued discounts/premiums | | | — | | | | 291 | | | | — | | | | 291 | | |
Change in unrealized appreciation (depreciation)(a) | | | 15,944 | | | | (57 | ) | | | (1,072 | ) | | | 14,815 | | |
Sales | | | — | | | | (593 | ) | | | — | | | | (593 | ) | |
Purchases | | | 6,829,945 | | | | — | | | | 1,749,939 | | | | 8,579,884 | | |
Balance as of April 30, 2016 | | | 6,845,889 | | | | 2,594 | | | | 1,748,867 | | | | 8,597,350 | | |
(a) Change in unrealized appreciation (depreciation) relating to securities held at April 30, 2016 was $14,815, which is comprised of Residential Mortgage-Backed Securities — Agency of $15,944, Residential Mortgage-Backed Securities — Non-Agency of $(57) and Asset-Backed Securities — Non-Agency of $(1,072).
The Fund's assets assigned to the Level 3 category are valued utilizing the valuation technique deemed the most appropriate in the circumstances. Certain residential mortgage backed securities classified as Level 3 securities are valued using the market approach. To determine fair value for these securities, management considered various factors which may have included, but were not limited to, estimated cash flows of the securities, single market quotations, observable transactions for identical or similar assets in the market and the distressed nature of the security. The appropriateness of fair values for these securities is monitored on an ongoing basis which may include results of back testing, manual price reviews and other control procedures. Significant increases (decreases) to any of these inputs would result in a significantly lower (higher) fair value measurement.
The accompanying Notes to Financial Statements are an integral part of this statement.
Annual Report 2016
22
STATEMENT OF ASSETS AND LIABILITIES
April 30, 2016
Assets | |
Investments, at value | |
Unaffiliated issuers (identified cost $607,598,725) | | $ | 622,858,984 | | |
Affiliated issuers (identified cost $868,546) | | | 868,546 | | |
Total investments (identified cost $608,467,271) | | | 623,727,530 | | |
Cash | | | 613 | | |
Margin deposits | | | 250,499 | | |
Unrealized appreciation on swap contracts | | | 15,496 | | |
Premiums paid on outstanding swap contracts | | | 7,398 | | |
Receivable for: | |
Investments sold | | | 3,988,866 | | |
Investments sold on a delayed delivery basis | | | 23,205,648 | | |
Capital shares sold | | | 838,967 | | |
Dividends | | | 13,775 | | |
Interest | | | 2,989,450 | | |
Foreign tax reclaims | | | 4,408 | | |
Variation margin | | | 63,986 | | |
Expense reimbursement due from Investment Manager | | | 2,226 | | |
Prepaid expenses | | | 1,187 | | |
Trustees' deferred compensation plan | | | 137,595 | | |
Other assets | | | 2,429 | | |
Total assets | | | 655,250,073 | | |
Liabilities | |
Unrealized depreciation on swap contracts | | | 26,157 | | |
Premiums received on outstanding swap contracts | | | 60,948 | | |
Payable for: | |
Investments purchased | | | 2,736,530 | | |
Investments purchased on a delayed delivery basis | | | 98,860,483 | | |
Capital shares purchased | | | 703,325 | | |
Dividend distributions to shareholders | | | 972,427 | | |
Variation margin | | | 117,607 | | |
Investment management fees | | | 7,516 | | |
Distribution and/or service fees | | | 749 | | |
Transfer agent fees | | | 79,428 | | |
Compensation of board members | | | 51,163 | | |
Chief compliance officer expenses | | | 25 | | |
Other expenses | | | 62,382 | | |
Trustees' deferred compensation plan | | | 137,595 | | |
Total liabilities | | | 103,816,335 | | |
Net assets applicable to outstanding capital stock | | $ | 551,433,738 | | |
Represented by | |
Paid-in capital | | $ | 534,412,437 | | |
Undistributed net investment income | | | 270,279 | | |
Accumulated net realized gain | | | 1,079,189 | | |
Unrealized appreciation (depreciation) on: | |
Investments | | | 15,260,259 | | |
Futures contracts | | | 472,306 | | |
Swap contracts | | | (60,732 | ) | |
Total — representing net assets applicable to outstanding capital stock | | $ | 551,433,738 | | |
The accompanying Notes to Financial Statements are an integral part of this statement.
Annual Report 2016
23
STATEMENT OF ASSETS AND LIABILITIES (continued)
April 30, 2016
Class A | |
Net assets | | $ | 55,058,098 | | |
Shares outstanding | | | 6,313,074 | | |
Net asset value per share | | $ | 8.72 | | |
Maximum offering price per share(a) | | $ | 9.15 | | |
Class B | |
Net assets | | $ | 366,386 | | |
Shares outstanding | | | 42,006 | | |
Net asset value per share | | $ | 8.72 | | |
Class C | |
Net assets | | $ | 10,869,839 | | |
Shares outstanding | | | 1,247,601 | | |
Net asset value per share | | $ | 8.71 | | |
Class I | |
Net assets | | $ | 9,937 | | |
Shares outstanding | | | 1,136 | | |
Net asset value per share(b) | | $ | 8.74 | | |
Class R | |
Net assets | | $ | 1,749,669 | | |
Shares outstanding | | | 200,584 | | |
Net asset value per share | | $ | 8.72 | | |
Class R4 | |
Net assets | | $ | 390,101 | | |
Shares outstanding | | | 44,749 | | |
Net asset value per share | | $ | 8.72 | | |
Class R5 | |
Net assets | | $ | 52,460 | | |
Shares outstanding | | | 6,031 | | |
Net asset value per share | | $ | 8.70 | | |
Class T | |
Net assets | | $ | 10,887,338 | | |
Shares outstanding | | | 1,250,170 | | |
Net asset value per share | | $ | 8.71 | | |
Maximum offering price per share(a) | | $ | 9.14 | | |
Class W | |
Net assets | | $ | 9,936 | | |
Shares outstanding | | | 1,138 | | |
Net asset value per share | | $ | 8.73 | | |
Class Y | |
Net assets | | $ | 31,981,197 | | |
Shares outstanding | | | 3,661,038 | | |
Net asset value per share | | $ | 8.74 | | |
Class Z | |
Net assets | | $ | 440,058,777 | | |
Shares outstanding | | | 50,456,187 | | |
Net asset value per share | | $ | 8.72 | | |
(a) The maximum offering price per share is calculated by dividing the net asset value per share by 1.0 minus the maximum sales charge of 4.75%.
(b) Net asset value per share rounds to this amount due to fractional shares outstanding.
The accompanying Notes to Financial Statements are an integral part of this statement.
Annual Report 2016
24
STATEMENT OF OPERATIONS
Year Ended April 30, 2016
Net investment income | |
Income: | |
Dividends — unaffiliated issuers | | $ | 129,405 | | |
Dividends — affiliated issuers | | | 6,971 | | |
Interest | | | 15,370,506 | | |
Total income | | | 15,506,882 | | |
Expenses: | |
Investment management fees | | | 2,883,993 | | |
Distribution and/or service fees | |
Class A | | | 128,581 | | |
Class B | | | 4,870 | | |
Class C | | | 96,241 | | |
Class R | | | 10,332 | | |
Class T | | | 16,765 | | |
Class W | | | 25 | | |
Transfer agent fees | |
Class A | | | 110,382 | | |
Class B | | | 1,049 | | |
Class C | | | 20,645 | | |
Class R | | | 4,441 | | |
Class R4 | | | 602 | | |
Class R5 | | | 137 | | |
Class T | | | 24,024 | | |
Class W | | | 22 | | |
Class Z | | | 1,018,150 | | |
Compensation of board members | | | 25,693 | | |
Custodian fees | | | 39,200 | | |
Printing and postage fees | | | 44,147 | | |
Registration fees | | | 130,627 | | |
Audit fees | | | 34,451 | | |
Legal fees | | | 18,305 | | |
Chief compliance officer expenses | | | 276 | | |
Other | | | 22,841 | | |
Total expenses | | | 4,635,799 | | |
Fees waived or expenses reimbursed by Investment Manager and its affiliates | | | (908,180 | ) | |
Expense reductions | | | (1,524 | ) | |
Total net expenses | | | 3,726,095 | | |
Net investment income | | | 11,780,787 | | |
Realized and unrealized gain (loss) — net | |
Net realized gain (loss) on: | |
Investments | | | 10,102,958 | | |
Futures contracts | | | (1,923,839 | ) | |
Swap contracts | | | 328,048 | | |
Net realized gain | | | 8,507,167 | | |
Net change in unrealized appreciation (depreciation) on: | |
Investments | | | (5,863,272 | ) | |
Futures contracts | | | 284,989 | | |
Swap contracts | | | 72,031 | | |
Net change in unrealized depreciation | | | (5,506,252 | ) | |
Net realized and unrealized gain | | | 3,000,915 | | |
Net increase in net assets resulting from operations | | $ | 14,781,702 | | |
The accompanying Notes to Financial Statements are an integral part of this statement.
Annual Report 2016
25
STATEMENT OF CHANGES IN NET ASSETS
| | | Year Ended
April 30,
2016 | | Year Ended
April 30,
2015 | |
Operations | |
Net investment income | | $ | 11,780,787 | | | $ | 14,858,709 | | |
Net realized gain | | | 8,507,167 | | | | 12,182,987 | | |
Net change in unrealized appreciation (depreciation) | | | (5,506,252 | ) | | | 805,846 | | |
Net increase in net assets resulting from operations | | | 14,781,702 | | | | 27,847,542 | | |
Distributions to shareholders | |
Net investment income | |
Class A | | | (1,243,824 | ) | | | (1,026,908 | ) | |
Class B | | | (7,906 | ) | | | (7,672 | ) | |
Class C | | | (159,772 | ) | | | (104,609 | ) | |
Class I | | | (279 | ) | | | (217 | ) | |
Class R | | | (43,680 | ) | | | (31,363 | ) | |
Class R4 | | | (8,271 | ) | | | (598 | ) | |
Class R5 | | | (7,526 | ) | | | (9,477 | ) | |
Class T | | | (280,022 | ) | | | (222,195 | ) | |
Class W | | | (239 | ) | | | (175 | ) | |
Class Y | | | (833,619 | ) | | | (560,997 | ) | |
Class Z | | | (12,419,108 | ) | | | (11,980,487 | ) | |
Net realized gains | |
Class A | | | (1,218,092 | ) | | | (786,677 | ) | |
Class B | | | (11,229 | ) | | | (9,020 | ) | |
Class C | | | (225,803 | ) | | | (126,672 | ) | |
Class I | | | (239 | ) | | | (129 | ) | |
Class R | | | (58,479 | ) | | | (25,503 | ) | |
Class R4 | | | (7,353 | ) | | | (1,228 | ) | |
Class R5 | | | (7,137 | ) | | | (5,263 | ) | |
Class T | | | (264,458 | ) | | | (154,770 | ) | |
Class W | | | (240 | ) | | | (129 | ) | |
Class Y | | | (728,043 | ) | | | (335,030 | ) | |
Class Z | | | (11,277,451 | ) | | | (7,627,351 | ) | |
Total distributions to shareholders | | | (28,802,770 | ) | | | (23,016,470 | ) | |
Decrease in net assets from capital stock activity | | | (89,172,343 | ) | | | (123,369,333 | ) | |
Total decrease in net assets | | | (103,193,411 | ) | | | (118,538,261 | ) | |
Net assets at beginning of year | | | 654,627,149 | | | | 773,165,410 | | |
Net assets at end of year | | $ | 551,433,738 | | | $ | 654,627,149 | | |
Undistributed net investment income | | $ | 270,279 | | | $ | 3,495,621 | | |
The accompanying Notes to Financial Statements are an integral part of this statement.
Annual Report 2016
26
STATEMENT OF CHANGES IN NET ASSETS (continued)
| | | Year Ended April 30, 2016 | | Year Ended April 30, 2015 | |
| | | Shares | | Dollars ($) | | Shares | | Dollars ($) | |
Capital stock activity | |
Class A shares | |
Subscriptions(a) | | | 1,447,754 | | | | 12,530,595 | | | | 1,222,972 | | | | 10,909,892 | | |
Distributions reinvested | | | 202,673 | | | | 1,738,276 | | | | 148,530 | | | | 1,321,198 | | |
Redemptions | | | (1,201,283 | ) | | | (10,438,856 | ) | | | (2,412,165 | ) | | | (21,539,639 | ) | |
Net increase (decrease) | | | 449,144 | | | | 3,830,015 | | | | (1,040,663 | ) | | | (9,308,549 | ) | |
Class B shares | |
Subscriptions | | | 4,391 | | | | 37,833 | | | | 12,446 | | | | 111,576 | | |
Distributions reinvested | | | 1,460 | | | | 12,501 | | | | 1,247 | | | | 11,078 | | |
Redemptions(a) | | | (37,264 | ) | | | (324,094 | ) | | | (57,327 | ) | | | (512,088 | ) | |
Net decrease | | | (31,413 | ) | | | (273,760 | ) | | | (43,634 | ) | | | (389,434 | ) | |
Class C shares | |
Subscriptions | | | 497,828 | | | | 4,298,550 | | | | 171,635 | | | | 1,533,344 | | |
Distributions reinvested | | | 35,021 | | | | 299,573 | | | | 21,554 | | | | 191,292 | | |
Redemptions | | | (341,850 | ) | | | (2,955,428 | ) | | | (370,321 | ) | | | (3,302,682 | ) | |
Net increase (decrease) | | | 190,999 | | | | 1,642,695 | | | | (177,132 | ) | | | (1,578,046 | ) | |
Class R shares | |
Subscriptions | | | 107,472 | | | | 930,825 | | | | 47,852 | | | | 426,436 | | |
Distributions reinvested | | | 10,812 | | | | 92,696 | | | | 6,306 | | | | 56,095 | | |
Redemptions | | | (143,113 | ) | | | (1,223,237 | ) | | | (110,748 | ) | | | (989,776 | ) | |
Net decrease | | | (24,829 | ) | | | (199,716 | ) | | | (56,590 | ) | | | (507,245 | ) | |
Class R4 shares | |
Subscriptions | | | 48,949 | | | | 424,066 | | | | 7,609 | | | | 68,098 | | |
Distributions reinvested | | | 1,766 | | | | 15,113 | | | | 169 | | | | 1,494 | | |
Redemptions | | | (8,882 | ) | | | (76,926 | ) | | | (8,052 | ) | | | (71,285 | ) | |
Net increase (decrease) | | | 41,833 | | | | 362,253 | | | | (274 | ) | | | (1,693 | ) | |
Class R5 shares | |
Subscriptions | | | 598 | | | | 5,151 | | | | 7,985 | | | | 71,157 | | |
Distributions reinvested | | | 1,651 | | | | 14,147 | | | | 1,616 | | | | 14,358 | | |
Redemptions | | | (42,677 | ) | | | (365,310 | ) | | | (16,450 | ) | | | (146,558 | ) | |
Net decrease | | | (40,428 | ) | | | (346,012 | ) | | | (6,849 | ) | | | (61,043 | ) | |
Class T shares | |
Subscriptions | | | 13,848 | | | | 118,683 | | | | 15,233 | | | | 135,554 | | |
Distributions reinvested | | | 45,396 | | | | 388,980 | | | | 29,764 | | | | 264,454 | | |
Redemptions | | | (144,583 | ) | | | (1,257,650 | ) | | | (105,798 | ) | | | (943,230 | ) | |
Net decrease | | | (85,339 | ) | | | (749,987 | ) | | | (60,801 | ) | | | (543,222 | ) | |
The accompanying Notes to Financial Statements are an integral part of this statement.
Annual Report 2016
27
STATEMENT OF CHANGES IN NET ASSETS (continued)
| | | Year Ended April 30, 2016 | | Year Ended April 30, 2015 | |
| | | Shares | | Dollars ($) | | Shares | | Dollars ($) | |
Capital stock activity (continued) | |
Class Y shares | |
Subscriptions | | | 793,703 | | | | 6,891,515 | | | | 378,792 | | | | 3,405,678 | | |
Redemptions | | | (175,234 | ) | | | (1,500,000 | ) | | | (170,960 | ) | | | (1,524,008 | ) | |
Net increase | | | 618,469 | | | | 5,391,515 | | | | 207,832 | | | | 1,881,670 | | |
Class Z shares | |
Subscriptions | | | 3,470,017 | | | | 30,004,058 | | | | 3,334,124 | | | | 29,752,201 | | |
Distributions reinvested | | | 408,493 | | | | 3,507,215 | | | | 339,625 | | | | 3,022,774 | | |
Redemptions | | | (15,227,643 | ) | | | (132,340,619 | ) | | | (16,325,533 | ) | | | (145,636,746 | ) | |
Net decrease | | | (11,349,133 | ) | | | (98,829,346 | ) | | | (12,651,784 | ) | | | (112,861,771 | ) | |
Total net decrease | | | (10,230,697 | ) | | | (89,172,343 | ) | | | (13,829,895 | ) | | | (123,369,333 | ) | |
(a) Includes conversions of Class B shares to Class A shares, if any.
The accompanying Notes to Financial Statements are an integral part of this statement.
Annual Report 2016
28
The following tables are intended to help you understand the Fund's financial performance. Certain information reflects financial results for a single share of a class held for the periods shown. Per share net investment income (loss) amounts are calculated based on average shares outstanding during the period. Total return assumes reinvestment of all dividends and distributions, if any. Total return does not reflect payment of sales charges, if any. Total return and portfolio turnover are not annualized for periods of less than one year. The portfolio turnover rate is calculated without regard to purchase and sales transactions of short-term instruments and certain derivatives, if any. If such transactions were included, the Fund's portfolio turnover rate may be higher.
| | | Year Ended April 30, | | Year Ended
March 31, | |
Class A | | 2016 | | 2015 | | 2014 | | 2013 | | 2012(a) | | 2012 | |
Per share data | |
Net asset value, beginning of period | | $ | 8.91 | | | $ | 8.86 | | | $ | 9.46 | | | $ | 9.58 | | | $ | 9.50 | | | $ | 9.24 | | |
Income from investment operations: | |
Net investment income | | | 0.16 | | | | 0.17 | | | | 0.16 | | | | 0.23 | | | | 0.02 | | | | 0.29 | | |
Net realized and unrealized gain (loss) | | | 0.07 | | | | 0.15 | | | | (0.30 | ) | | | 0.17 | | | | 0.08 | | | | 0.38 | | |
Total from investment operations | | | 0.23 | | | | 0.32 | | | | (0.14 | ) | | | 0.40 | | | | 0.10 | | | | 0.67 | | |
Less distributions to shareholders: | |
Net investment income | | | (0.21 | ) | | | (0.16 | ) | | | (0.17 | ) | | | (0.23 | ) | | | (0.02 | ) | | | (0.29 | ) | |
Net realized gains | | | (0.21 | ) | | | (0.11 | ) | | | (0.29 | ) | | | (0.29 | ) | | | — | | | | (0.12 | ) | |
Total distributions to shareholders | | | (0.42 | ) | | | (0.27 | ) | | | (0.46 | ) | | | (0.52 | ) | | | (0.02 | ) | | | (0.41 | ) | |
Net asset value, end of period | | $ | 8.72 | | | $ | 8.91 | | | $ | 8.86 | | | $ | 9.46 | | | $ | 9.58 | | | $ | 9.50 | | |
Total return | | | 2.74 | % | | | 3.63 | % | | | (1.42 | %) | | | 4.21 | % | | | 1.08 | % | | | 7.35 | % | |
Ratios to average net assets(b) | |
Total gross expenses | | | 1.02 | % | | | 1.01 | % | | | 0.98 | % | | | 0.98 | % | | | 1.01 | %(c) | | | 0.99 | %(d) | |
Total net expenses(e) | | | 0.86 | %(f) | | | 0.90 | %(f) | | | 0.96 | %(f) | | | 0.90 | %(f) | | | 0.80 | %(c) | | | 0.80 | %(d)(f) | |
Net investment income | | | 1.83 | % | | | 1.85 | % | | | 1.83 | % | | | 2.43 | % | | | 2.94 | %(c) | | | 3.07 | % | |
Supplemental data | |
Net assets, end of period (in thousands) | | $ | 55,058 | | | $ | 52,256 | | | $ | 61,159 | | | $ | 82,739 | | | $ | 82,929 | | | $ | 82,041 | | |
Portfolio turnover | | | 428 | % | | | 350 | % | | | 360 | % | | | 221 | % | | | 10 | % | | | 136 | % | |
Notes to Financial Highlights
(a) For the period from April 1, 2012 to April 30, 2012. During the period, the Fund's fiscal year end was changed from March 31 to April 30.
(b) In addition to the fees and expenses that the Fund bears directly, the Fund indirectly bears a pro rata share of the fees and expenses of any other funds in which it invests. Such indirect expenses are not included in the Fund's reported expense ratios.
(c) Annualized.
(d) Ratios include line of credit interest expense which is less than 0.01%.
(e) Total net expenses include the impact of certain fee waivers/expense reimbursements made by the Investment Manager and certain of its affiliates, if applicable.
(f) The benefits derived from expense reductions had an impact of less than 0.01%.
The accompanying Notes to Financial Statements are an integral part of this statement.
Annual Report 2016
29
FINANCIAL HIGHLIGHTS (continued)
| | | Year Ended April 30, | | Year Ended
March 31, | |
Class B | | 2016 | | 2015 | | 2014 | | 2013 | | 2012(a) | | 2012 | |
Per share data | |
Net asset value, beginning of period | | $ | 8.91 | | | $ | 8.86 | | | $ | 9.46 | | | $ | 9.58 | | | $ | 9.50 | | | $ | 9.24 | | |
Income from investment operations: | |
Net investment income | | | 0.09 | | | | 0.10 | | | | 0.10 | | | | 0.16 | | | | 0.02 | | | | 0.22 | | |
Net realized and unrealized gain (loss) | | | 0.07 | | | | 0.15 | | | | (0.31 | ) | | | 0.17 | | | | 0.08 | | | | 0.38 | | |
Total from investment operations | | | 0.16 | | | | 0.25 | | | | (0.21 | ) | | | 0.33 | | | | 0.10 | | | | 0.60 | | |
Less distributions to shareholders: | |
Net investment income | | | (0.14 | ) | | | (0.09 | ) | | | (0.10 | ) | | | (0.16 | ) | | | (0.02 | ) | | | (0.22 | ) | |
Net realized gains | | | (0.21 | ) | | | (0.11 | ) | | | (0.29 | ) | | | (0.29 | ) | | | — | | | | (0.12 | ) | |
Total distributions to shareholders | | | (0.35 | ) | | | (0.20 | ) | | | (0.39 | ) | | | (0.45 | ) | | | (0.02 | ) | | | (0.34 | ) | |
Net asset value, end of period | | $ | 8.72 | | | $ | 8.91 | | | $ | 8.86 | | | $ | 9.46 | | | $ | 9.58 | | | $ | 9.50 | | |
Total return | | | 1.98 | % | | | 2.85 | % | | | (2.15 | %) | | | 3.43 | % | | | 1.02 | % | | | 6.55 | % | |
Ratios to average net assets(b) | |
Total gross expenses | | | 1.77 | % | | | 1.76 | % | | | 1.73 | % | | | 1.73 | % | | | 1.76 | %(c) | | | 1.74 | %(d) | |
Total net expenses(e) | | | 1.61 | %(f) | | | 1.65 | %(f) | | | 1.71 | %(f) | | | 1.65 | %(f) | | | 1.55 | %(c) | | | 1.55 | %(d)(f) | |
Net investment income | | | 1.08 | % | | | 1.09 | % | | | 1.07 | % | | | 1.70 | % | | | 2.18 | %(c) | | | 2.35 | % | |
Supplemental data | |
Net assets, end of period (in thousands) | | $ | 366 | | | $ | 654 | | | $ | 1,037 | | | $ | 2,110 | | | $ | 2,872 | | | $ | 2,969 | | |
Portfolio turnover | | | 428 | % | | | 350 | % | | | 360 | % | | | 221 | % | | | 10 | % | | | 136 | % | |
Notes to Financial Highlights
(a) For the period from April 1, 2012 to April 30, 2012. During the period, the Fund's fiscal year end was changed from March 31 to April 30.
(b) In addition to the fees and expenses that the Fund bears directly, the Fund indirectly bears a pro rata share of the fees and expenses of any other funds in which it invests. Such indirect expenses are not included in the Fund's reported expense ratios.
(c) Annualized.
(d) Ratios include line of credit interest expense which is less than 0.01%.
(e) Total net expenses include the impact of certain fee waivers/expense reimbursements made by the Investment Manager and certain of its affiliates, if applicable.
(f) The benefits derived from expense reductions had an impact of less than 0.01%.
The accompanying Notes to Financial Statements are an integral part of this statement.
Annual Report 2016
30
FINANCIAL HIGHLIGHTS (continued)
| | | Year Ended April 30, | | Year Ended
March 31, | |
Class C | | 2016 | | 2015 | | 2014 | | 2013 | | 2012(a) | | 2012 | |
Per share data | |
Net asset value, beginning of period | | $ | 8.90 | | | $ | 8.85 | | | $ | 9.45 | | | $ | 9.57 | | | $ | 9.49 | | | $ | 9.24 | | |
Income from investment operations: | |
Net investment income | | | 0.09 | | | | 0.10 | | | | 0.11 | | | | 0.17 | | | | 0.02 | | | | 0.23 | | |
Net realized and unrealized gain (loss) | | | 0.07 | | | | 0.16 | | | | (0.31 | ) | | | 0.17 | | | | 0.08 | | | | 0.38 | | |
Total from investment operations | | | 0.16 | | | | 0.26 | | | | (0.20 | ) | | | 0.34 | | | | 0.10 | | | | 0.61 | | |
Less distributions to shareholders: | |
Net investment income | | | (0.14 | ) | | | (0.10 | ) | | | (0.11 | ) | | | (0.17 | ) | | | (0.02 | ) | | | (0.24 | ) | |
Net realized gains | | | (0.21 | ) | | | (0.11 | ) | | | (0.29 | ) | | | (0.29 | ) | | | — | | | | (0.12 | ) | |
Total distributions to shareholders | | | (0.35 | ) | | | (0.21 | ) | | | (0.40 | ) | | | (0.46 | ) | | | (0.02 | ) | | | (0.36 | ) | |
Net asset value, end of period | | $ | 8.71 | | | $ | 8.90 | | | $ | 8.85 | | | $ | 9.45 | | | $ | 9.57 | | | $ | 9.49 | | |
Total return | | | 1.98 | % | | | 2.91 | % | | | (2.01 | %) | | | 3.59 | % | | | 1.03 | % | | | 6.72 | % | |
Ratios to average net assets(b) | |
Total gross expenses | | | 1.77 | % | | | 1.76 | % | | | 1.73 | % | | | 1.73 | % | | | 1.75 | %(c) | | | 1.74 | %(d) | |
Total net expenses(e) | | | 1.61 | %(f) | | | 1.60 | %(f) | | | 1.56 | %(f) | | | 1.50 | %(f) | | | 1.40 | %(c) | | | 1.40 | %(d)(f) | |
Net investment income | | | 1.08 | % | | | 1.15 | % | | | 1.23 | % | | | 1.83 | % | | | 2.35 | %(c) | | | 2.46 | % | |
Supplemental data | |
Net assets, end of period (in thousands) | | $ | 10,870 | | | $ | 9,406 | | | $ | 10,917 | | | $ | 15,812 | | | $ | 17,129 | | | $ | 16,872 | | |
Portfolio turnover | | | 428 | % | | | 350 | % | | | 360 | % | | | 221 | % | | | 10 | % | | | 136 | % | |
Notes to Financial Highlights
(a) For the period from April 1, 2012 to April 30, 2012. During the period, the Fund's fiscal year end was changed from March 31 to April 30.
(b) In addition to the fees and expenses that the Fund bears directly, the Fund indirectly bears a pro rata share of the fees and expenses of any other funds in which it invests. Such indirect expenses are not included in the Fund's reported expense ratios.
(c) Annualized.
(d) Ratios include line of credit interest expense which is less than 0.01%.
(e) Total net expenses include the impact of certain fee waivers/expense reimbursements made by the Investment Manager and certain of its affiliates, if applicable.
(f) The benefits derived from expense reductions had an impact of less than 0.01%.
The accompanying Notes to Financial Statements are an integral part of this statement.
Annual Report 2016
31
FINANCIAL HIGHLIGHTS (continued)
| | | Year Ended April 30, | | Year Ended
March 31, | |
Class I | | 2016 | | 2015 | | 2014 | | 2013 | | 2012(a) | | 2012 | |
Per share data | |
Net asset value, beginning of period | | $ | 8.93 | | | $ | 8.88 | | | $ | 9.48 | | | $ | 9.59 | | | $ | 9.50 | | | $ | 9.25 | | |
Income from investment operations: | |
Net investment income | | | 0.19 | | | | 0.20 | | | | 0.21 | | | | 0.30 | | | | 0.03 | | | | 0.33 | | |
Net realized and unrealized gain (loss) | | | 0.08 | | | | 0.16 | | | | (0.31 | ) | | | 0.14 | | | | 0.09 | | | | 0.36 | | |
Total from investment operations | | | 0.27 | | | | 0.36 | | | | (0.10 | ) | | | 0.44 | | | | 0.12 | | | | 0.69 | | |
Less distributions to shareholders: | |
Net investment income | | | (0.25 | ) | | | (0.20 | ) | | | (0.21 | ) | | | (0.26 | ) | | | (0.03 | ) | | | (0.32 | ) | |
Net realized gains | | | (0.21 | ) | | | (0.11 | ) | | | (0.29 | ) | | | (0.29 | ) | | | — | | | | (0.12 | ) | |
Total distributions to shareholders | | | (0.46 | ) | | | (0.31 | ) | | | (0.50 | ) | | | (0.55 | ) | | | (0.03 | ) | | | (0.44 | ) | |
Net asset value, end of period | | $ | 8.74 | | | $ | 8.93 | | | $ | 8.88 | | | $ | 9.48 | | | $ | 9.59 | | | $ | 9.50 | | |
Total return | | | 3.16 | % | | | 4.05 | % | | | (0.98 | %) | | | 4.71 | % | | | 1.21 | % | | | 7.55 | % | |
Ratios to average net assets(b) | |
Total gross expenses | | | 0.55 | % | | | 0.54 | % | | | 0.49 | % | | | 0.52 | % | | | 0.56 | %(c) | | | 0.51 | %(d) | |
Total net expenses(e) | | | 0.45 | % | | | 0.48 | % | | | 0.49 | % | | | 0.51 | % | | | 0.51 | %(c) | | | 0.51 | %(d)(f) | |
Net investment income | | | 2.24 | % | | | 2.27 | % | | | 2.33 | % | | | 2.99 | % | | | 3.22 | %(c) | | | 3.51 | % | |
Supplemental data | |
Net assets, end of period (in thousands) | | $ | 10 | | | $ | 10 | | | $ | 10 | | | $ | 2 | | | $ | 15,545 | | | $ | 15,931 | | |
Portfolio turnover | | | 428 | % | | | 350 | % | | | 360 | % | | | 221 | % | | | 10 | % | | | 136 | % | |
Notes to Financial Highlights
(a) For the period from April 1, 2012 to April 30, 2012. During the period, the Fund's fiscal year end was changed from March 31 to April 30.
(b) In addition to the fees and expenses that the Fund bears directly, the Fund indirectly bears a pro rata share of the fees and expenses of any other funds in which it invests. Such indirect expenses are not included in the Fund's reported expense ratios.
(c) Annualized.
(d) Ratios include line of credit interest expense which is less than 0.01%.
(e) Total net expenses include the impact of certain fee waivers/expense reimbursements made by the Investment Manager and certain of its affiliates, if applicable.
(f) The benefits derived from expense reductions had an impact of less than 0.01%.
The accompanying Notes to Financial Statements are an integral part of this statement.
Annual Report 2016
32
FINANCIAL HIGHLIGHTS (continued)
| | | Year Ended April 30, | | Year Ended
March 31, | |
Class R | | 2016 | | 2015 | | 2014 | | 2013 | | 2012(a) | | 2012(b) | |
Per share data | |
Net asset value, beginning of period | | $ | 8.91 | | | $ | 8.86 | | | $ | 9.46 | | | $ | 9.58 | | | $ | 9.50 | | | $ | 9.51 | | |
Income from investment operations: | |
Net investment income | | | 0.14 | | | | 0.14 | | | | 0.14 | | | | 0.21 | | | | 0.02 | | | | 0.09 | | |
Net realized and unrealized gain (loss) | | | 0.07 | | | | 0.16 | | | | (0.31 | ) | | | 0.16 | | | | 0.08 | | | | 0.07 | | |
Total from investment operations | | | 0.21 | | | | 0.30 | | | | (0.17 | ) | | | 0.37 | | | | 0.10 | | | | 0.16 | | |
Less distributions to shareholders: | |
Net investment income | | | (0.19 | ) | | | (0.14 | ) | | | (0.14 | ) | | | (0.20 | ) | | | (0.02 | ) | | | (0.09 | ) | |
Net realized gains | | | (0.21 | ) | | | (0.11 | ) | | | (0.29 | ) | | | (0.29 | ) | | | — | | | | (0.08 | ) | |
Total distributions to shareholders | | | (0.40 | ) | | | (0.25 | ) | | | (0.43 | ) | | | (0.49 | ) | | | (0.02 | ) | | | (0.17 | ) | |
Net asset value, end of period | | $ | 8.72 | | | $ | 8.91 | | | $ | 8.86 | | | $ | 9.46 | | | $ | 9.58 | | | $ | 9.50 | | |
Total return | | | 2.49 | % | | | 3.37 | % | | | (1.66 | %) | | | 3.95 | % | | | 1.06 | % | | | 1.75 | % | |
Ratios to average net assets(c) | |
Total gross expenses | | | 1.27 | % | | | 1.26 | % | | | 1.23 | % | | | 1.23 | % | | | 1.26 | %(d) | | | 1.40 | %(d)(e) | |
Total net expenses(f) | | | 1.11 | %(g) | | | 1.15 | %(g) | | | 1.21 | %(g) | | | 1.15 | %(g) | | | 1.05 | %(d) | | | 1.03 | %(d)(e) | |
Net investment income | | | 1.57 | % | | | 1.59 | % | | | 1.59 | % | | | 2.16 | % | | | 2.69 | %(d) | | | 2.69 | %(d) | |
Supplemental data | |
Net assets, end of period (in thousands) | | $ | 1,750 | | | $ | 2,009 | | | $ | 2,498 | | | $ | 2,558 | | | $ | 2,553 | | | $ | 2,506 | | |
Portfolio turnover | | | 428 | % | | | 350 | % | | | 360 | % | | | 221 | % | | | 10 | % | | | 136 | % | |
Notes to Financial Highlights
(a) For the period from April 1, 2012 to April 30, 2012. During the period, the Fund's fiscal year end was changed from March 31 to April 30.
(b) Based on operations from November 16, 2011 (commencement of operations) through the stated period end.
(c) In addition to the fees and expenses that the Fund bears directly, the Fund indirectly bears a pro rata share of the fees and expenses of any other funds in which it invests. Such indirect expenses are not included in the Fund's reported expense ratios.
(d) Annualized.
(e) Ratios include line of credit interest expense which is less than 0.01%.
(f) Total net expenses include the impact of certain fee waivers/expense reimbursements made by the Investment Manager and certain of its affiliates, if applicable.
(g) The benefits derived from expense reductions had an impact of less than 0.01%.
The accompanying Notes to Financial Statements are an integral part of this statement.
Annual Report 2016
33
FINANCIAL HIGHLIGHTS (continued)
| | | Year Ended April 30, | |
Class R4 | | 2016 | | 2015 | | 2014 | | 2013(a) | |
Per share data | |
Net asset value, beginning of period | | $ | 8.91 | | | $ | 8.85 | | | $ | 9.45 | | | $ | 9.73 | | |
Income from investment operations: | |
Net investment income | | | 0.18 | | | | 0.19 | | | | 0.18 | | | | 0.10 | | |
Net realized and unrealized gain (loss) | | | 0.07 | | | | 0.16 | | | | (0.30 | ) | | | (0.07 | )(b) | |
Total from investment operations | | | 0.25 | | | | 0.35 | | | | (0.12 | ) | | | 0.03 | | |
Less distributions to shareholders: | |
Net investment income | | | (0.23 | ) | | | (0.18 | ) | | | (0.19 | ) | | | (0.10 | ) | |
Net realized gains | | | (0.21 | ) | | | (0.11 | ) | | | (0.29 | ) | | | (0.21 | ) | |
Total distributions to shareholders | | | (0.44 | ) | | | (0.29 | ) | | | (0.48 | ) | | | (0.31 | ) | |
Net asset value, end of period | | $ | 8.72 | | | $ | 8.91 | | | $ | 8.85 | | | $ | 9.45 | | |
Total return | | | 3.01 | % | | | 4.00 | % | | | (1.18 | %) | | | 0.36 | % | |
Ratios to average net assets(c) | |
Total gross expenses | | | 0.77 | % | | | 0.76 | % | | | 0.74 | % | | | 0.69 | %(d) | |
Total net expenses(e) | | | 0.61 | %(f) | | | 0.64 | %(f) | | | 0.70 | %(f) | | | 0.69 | %(d) | |
Net investment income | | | 2.07 | % | | | 2.12 | % | | | 1.99 | % | | | 2.38 | %(d) | |
Supplemental data | |
Net assets, end of period (in thousands) | | $ | 390 | | | $ | 26 | | | $ | 28 | | | $ | 55 | | |
Portfolio turnover | | | 428 | % | | | 350 | % | | | 360 | % | | | 221 | % | |
Notes to Financial Highlights
(a) Based on operations from November 8, 2012 (commencement of operations) through the stated period end.
(b) Calculation of the net gain (loss) per share (both realized and unrealized) does not correlate to the aggregate realized and unrealized gain (loss) presented in the Statement of Operations due to the timing of subscriptions and redemptions of Fund shares in relation to fluctuations in the market value of the portfolio.
(c) In addition to the fees and expenses that the Fund bears directly, the Fund indirectly bears a pro rata share of the fees and expenses of any other funds in which it invests. Such indirect expenses are not included in the Fund's reported expense ratios.
(d) Annualized.
(e) Total net expenses include the impact of certain fee waivers/expense reimbursements made by the Investment Manager and certain of its affiliates, if applicable.
(f) The benefits derived from expense reductions had an impact of less than 0.01%.
The accompanying Notes to Financial Statements are an integral part of this statement.
Annual Report 2016
34
FINANCIAL HIGHLIGHTS (continued)
| | | Year Ended April 30, | |
Class R5 | | 2016 | | 2015 | | 2014 | | 2013(a) | |
Per share data | |
Net asset value, beginning of period | | $ | 8.89 | | | $ | 8.84 | | | $ | 9.45 | | | $ | 9.73 | | |
Income from investment operations: | |
Net investment income | | | 0.19 | | | | 0.20 | | | | 0.19 | | | | 0.11 | | |
Net realized and unrealized gain (loss) | | | 0.07 | | | | 0.15 | | | | (0.31 | ) | | | (0.07 | )(b) | |
Total from investment operations | | | 0.26 | | | | 0.35 | | | | (0.12 | ) | | | 0.04 | | |
Less distributions to shareholders: | |
Net investment income | | | (0.24 | ) | | | (0.19 | ) | | | (0.20 | ) | | | (0.11 | ) | |
Net realized gains | | | (0.21 | ) | | | (0.11 | ) | | | (0.29 | ) | | | (0.21 | ) | |
Total distributions to shareholders | | | (0.45 | ) | | | (0.30 | ) | | | (0.49 | ) | | | (0.32 | ) | |
Net asset value, end of period | | $ | 8.70 | | | $ | 8.89 | | | $ | 8.84 | | | $ | 9.45 | | |
Total return | | | 3.11 | % | | | 4.04 | % | | | (1.10 | %) | | | 0.42 | % | |
Ratios to average net assets(c) | |
Total gross expenses | | | 0.60 | % | | | 0.56 | % | | | 0.57 | % | | | 0.55 | %(d) | |
Total net expenses(e) | | | 0.50 | % | | | 0.50 | % | | | 0.57 | % | | | 0.55 | %(d) | |
Net investment income | | | 2.14 | % | | | 2.25 | % | | | 2.09 | % | | | 2.71 | %(d) | |
Supplemental data | |
Net assets, end of period (in thousands) | | $ | 52 | | | $ | 413 | | | $ | 471 | | | $ | 33,221 | | |
Portfolio turnover | | | 428 | % | | | 350 | % | | | 360 | % | | | 221 | % | |
Notes to Financial Highlights
(a) Based on operations from November 8, 2012 (commencement of operations) through the stated period end.
(b) Calculation of the net gain (loss) per share (both realized and unrealized) does not correlate to the aggregate realized and unrealized gain (loss) presented in the Statement of Operations due to the timing of subscriptions and redemptions of Fund shares in relation to fluctuations in the market value of the portfolio.
(c) In addition to the fees and expenses that the Fund bears directly, the Fund indirectly bears a pro rata share of the fees and expenses of any other funds in which it invests. Such indirect expenses are not included in the Fund's reported expense ratios.
(d) Annualized.
(e) Total net expenses include the impact of certain fee waivers/expense reimbursements made by the Investment Manager and certain of its affiliates, if applicable.
The accompanying Notes to Financial Statements are an integral part of this statement.
Annual Report 2016
35
FINANCIAL HIGHLIGHTS (continued)
| | | Year Ended April 30, | | Year Ended
March 31, | |
Class T | | 2016 | | 2015 | | 2014 | | 2013 | | 2012(a) | | 2012 | |
Per share data | |
Net asset value, beginning of period | | $ | 8.90 | | | $ | 8.85 | | | $ | 9.45 | | | $ | 9.57 | | | $ | 9.48 | | | $ | 9.23 | | |
Income from investment operations: | |
Net investment income | | | 0.17 | | | | 0.17 | | | | 0.17 | | | | 0.24 | | | | 0.02 | | | | 0.30 | | |
Net realized and unrealized gain (loss) | | | 0.07 | | | | 0.16 | | | | (0.30 | ) | | | 0.17 | | | | 0.09 | | | | 0.37 | | |
Total from investment operations | | | 0.24 | | | | 0.33 | | | | (0.13 | ) | | | 0.41 | | | | 0.11 | | | | 0.67 | | |
Less distributions to shareholders: | |
Net investment income | | | (0.22 | ) | | | (0.17 | ) | | | (0.18 | ) | | | (0.24 | ) | | | (0.02 | ) | | | (0.30 | ) | |
Net realized gains | | | (0.21 | ) | | | (0.11 | ) | | | (0.29 | ) | | | (0.29 | ) | | | — | | | | (0.12 | ) | |
Total distributions to shareholders | | | (0.43 | ) | | | (0.28 | ) | | | (0.47 | ) | | | (0.53 | ) | | | (0.02 | ) | | | (0.42 | ) | |
Net asset value, end of period | | $ | 8.71 | | | $ | 8.90 | | | $ | 8.85 | | | $ | 9.45 | | | $ | 9.57 | | | $ | 9.48 | | |
Total return | | | 2.85 | % | | | 3.73 | % | | | (1.32 | %) | | | 4.32 | % | | | 1.20 | % | | | 7.36 | % | |
Ratios to average net assets(b) | |
Total gross expenses | | | 0.92 | % | | | 0.91 | % | | | 0.88 | % | | | 0.88 | % | | | 0.91 | %(c) | | | 0.89 | %(d) | |
Total net expenses(e) | | | 0.76 | %(f) | | | 0.80 | %(f) | | | 0.86 | %(f) | | | 0.80 | %(f) | | | 0.70 | %(c) | | | 0.70 | %(d)(f) | |
Net investment income | | | 1.93 | % | | | 1.95 | % | | | 1.94 | % | | | 2.53 | % | | | 3.04 | %(c) | | | 3.17 | % | |
Supplemental data | |
Net assets, end of period (in thousands) | | $ | 10,887 | | | $ | 11,885 | | | $ | 12,351 | | | $ | 14,412 | | | $ | 15,630 | | | $ | 15,577 | | |
Portfolio turnover | | | 428 | % | | | 350 | % | | | 360 | % | | | 221 | % | | | 10 | % | | | 136 | % | |
Notes to Financial Highlights
(a) For the period from April 1, 2012 to April 30, 2012. During the period, the Fund's fiscal year end was changed from March 31 to April 30.
(b) In addition to the fees and expenses that the Fund bears directly, the Fund indirectly bears a pro rata share of the fees and expenses of any other funds in which it invests. Such indirect expenses are not included in the Fund's reported expense ratios.
(c) Annualized.
(d) Ratios include line of credit interest expense which is less than 0.01%.
(e) Total net expenses include the impact of certain fee waivers/expense reimbursements made by the Investment Manager and certain of its affiliates, if applicable.
(f) The benefits derived from expense reductions had an impact of less than 0.01%.
The accompanying Notes to Financial Statements are an integral part of this statement.
Annual Report 2016
36
FINANCIAL HIGHLIGHTS (continued)
| | | Year Ended April 30, | | Year Ended
March 31, | |
Class W | | 2016 | | 2015 | | 2014 | | 2013 | | 2012(a) | | 2012 | |
Per share data | |
Net asset value, beginning of period | | $ | 8.92 | | | $ | 8.87 | | | $ | 9.47 | | | $ | 9.58 | | | $ | 9.50 | | | $ | 9.24 | | |
Income from investment operations: | |
Net investment income | | | 0.16 | | | | 0.17 | | | | 0.17 | | | | 0.24 | | | | 0.02 | | | | 0.29 | | |
Net realized and unrealized gain (loss) | | | 0.07 | | | | 0.15 | | | | (0.31 | ) | | | 0.17 | | | | 0.08 | | | | 0.38 | | |
Total from investment operations | | | 0.23 | | | | 0.32 | | | | (0.14 | ) | | | 0.41 | | | | 0.10 | | | | 0.67 | | |
Less distributions to shareholders: | |
Net investment income | | | (0.21 | ) | | | (0.16 | ) | | | (0.17 | ) | | | (0.23 | ) | | | (0.02 | ) | | | (0.29 | ) | |
Net realized gains | | | (0.21 | ) | | | (0.11 | ) | | | (0.29 | ) | | | (0.29 | ) | | | — | | | | (0.12 | ) | |
Total distributions to shareholders | | | (0.42 | ) | | | (0.27 | ) | | | (0.46 | ) | | | (0.52 | ) | | | (0.02 | ) | | | (0.41 | ) | |
Net asset value, end of period | | $ | 8.73 | | | $ | 8.92 | | | $ | 8.87 | | | $ | 9.47 | | | $ | 9.58 | | | $ | 9.50 | | |
Total return | | | 2.74 | % | | | 3.62 | % | | | (1.40 | %) | | | 4.32 | % | | | 1.09 | % | | | 7.38 | % | |
Ratios to average net assets(b) | |
Total gross expenses | | | 1.03 | % | | | 1.00 | % | | | 0.90 | % | | | 0.90 | % | | | 0.90 | %(c) | | | 0.95 | %(d) | |
Total net expenses(e) | | | 0.86 | %(f) | | | 0.90 | %(f) | | | 0.90 | %(f) | | | 0.88 | %(f) | | | 0.75 | %(c) | | | 0.79 | %(d) | |
Net investment income | | | 1.83 | % | | | 1.85 | % | | | 1.92 | % | | | 2.46 | % | | | 3.04 | %(c) | | | 3.08 | % | |
Supplemental data | |
Net assets, end of period (in thousands) | | $ | 10 | | | $ | 10 | | | $ | 10 | | | $ | 2 | | | $ | 3 | | | $ | 2 | | |
Portfolio turnover | | | 428 | % | | | 350 | % | | | 360 | % | | | 221 | % | | | 10 | % | | | 136 | % | |
Notes to Financial Highlights
(a) For the period from April 1, 2012 to April 30, 2012. During the period, the Fund's fiscal year end was changed from March 31 to April 30.
(b) In addition to the fees and expenses that the Fund bears directly, the Fund indirectly bears a pro rata share of the fees and expenses of any other funds in which it invests. Such indirect expenses are not included in the Fund's reported expense ratios.
(c) Annualized.
(d) Ratios include line of credit interest expense which is less than 0.01%.
(e) Total net expenses include the impact of certain fee waivers/expense reimbursements made by the Investment Manager and certain of its affiliates, if applicable.
(f) The benefits derived from expense reductions had an impact of less than 0.01%.
The accompanying Notes to Financial Statements are an integral part of this statement.
Annual Report 2016
37
FINANCIAL HIGHLIGHTS (continued)
| | | Year Ended April 30, | | Year Ended
March 31, | |
Class Y | | 2016 | | 2015 | | 2014 | | 2013 | | 2012(a) | | 2012 | |
Per share data | |
Net asset value, beginning of period | | $ | 8.92 | | | $ | 8.87 | | | $ | 9.47 | | | $ | 9.59 | | | $ | 9.51 | | | $ | 9.25 | | |
Income from investment operations: | |
Net investment income | | | 0.19 | | | | 0.20 | | | | 0.20 | | | | 0.27 | | | | 0.03 | | | | 0.32 | | |
Net realized and unrealized gain (loss) | | | 0.09 | | | | 0.15 | | | | (0.30 | ) | | | 0.16 | | | | 0.08 | | | | 0.38 | | |
Total from investment operations | | | 0.28 | | | | 0.35 | | | | (0.10 | ) | | | 0.43 | | | | 0.11 | | | | 0.70 | | |
Less distributions to shareholders: | |
Net investment income | | | (0.25 | ) | | | (0.19 | ) | | | (0.21 | ) | | | (0.26 | ) | | | (0.03 | ) | | | (0.32 | ) | |
Net realized gains | | | (0.21 | ) | | | (0.11 | ) | | | (0.29 | ) | | | (0.29 | ) | | | — | | | | (0.12 | ) | |
Total distributions to shareholders | | | (0.46 | ) | | | (0.30 | ) | | | (0.50 | ) | | | (0.55 | ) | | | (0.03 | ) | | | (0.44 | ) | |
Net asset value, end of period | | $ | 8.74 | | | $ | 8.92 | | | $ | 8.87 | | | $ | 9.47 | | | $ | 9.59 | | | $ | 9.51 | | |
Total return | | | 3.28 | % | | | 4.05 | % | | | (0.99 | %) | | | 4.60 | % | | | 1.11 | % | | | 7.66 | % | |
Ratios to average net assets(b) | |
Total gross expenses | | | 0.56 | % | | | 0.54 | % | | | 0.53 | % | | | 0.53 | % | | | 0.56 | %(c) | | | 0.53 | %(d) | |
Total net expenses(e) | | | 0.45 | % | | | 0.48 | % | | | 0.53 | % | | | 0.52 | % | | | 0.51 | %(c) | | | 0.51 | %(d) | |
Net investment income | | | 2.24 | % | | | 2.27 | % | | | 2.27 | % | | | 2.80 | % | | | 3.23 | %(c) | | | 3.38 | % | |
Supplemental data | |
Net assets, end of period (in thousands) | | $ | 31,981 | | | $ | 27,155 | | | $ | 25,147 | | | $ | 24,368 | | | $ | 22,718 | | | $ | 22,474 | | |
Portfolio turnover | | | 428 | % | | | 350 | % | | | 360 | % | | | 221 | % | | | 10 | % | | | 136 | % | |
Notes to Financial Highlights
(a) For the period from April 1, 2012 to April 30, 2012. During the period, the Fund's fiscal year end was changed from March 31 to April 30.
(b) In addition to the fees and expenses that the Fund bears directly, the Fund indirectly bears a pro rata share of the fees and expenses of any other funds in which it invests. Such indirect expenses are not included in the Fund's reported expense ratios.
(c) Annualized.
(d) Ratios include line of credit interest expense which is less than 0.01%.
(e) Total net expenses include the impact of certain fee waivers/expense reimbursements made by the Investment Manager and certain of its affiliates, if applicable.
The accompanying Notes to Financial Statements are an integral part of this statement.
Annual Report 2016
38
FINANCIAL HIGHLIGHTS (continued)
| | | Year Ended April 30, | | Year Ended
March 31, | |
Class Z | | 2016 | | 2015 | | 2014 | | 2013 | | 2012(a) | | 2012 | |
Per share data | |
Net asset value, beginning of period | | $ | 8.91 | | | $ | 8.86 | | | $ | 9.46 | | | $ | 9.58 | | | $ | 9.50 | | | $ | 9.24 | | |
Income from investment operations: | |
Net investment income | | | 0.18 | | | | 0.19 | | | | 0.19 | | | | 0.26 | | | | 0.03 | | | | 0.31 | | |
Net realized and unrealized gain (loss) | | | 0.07 | | | | 0.15 | | | | (0.31 | ) | | | 0.16 | | | | 0.07 | | | | 0.38 | | |
Total from investment operations | | | 0.25 | | | | 0.34 | | | | (0.12 | ) | | | 0.42 | | | | 0.10 | | | | 0.69 | | |
Less distributions to shareholders: | |
Net investment income | | | (0.23 | ) | | | (0.18 | ) | | | (0.19 | ) | | | (0.25 | ) | | | (0.02 | ) | | | (0.31 | ) | |
Net realized gains | | | (0.21 | ) | | | (0.11 | ) | | | (0.29 | ) | | | (0.29 | ) | | | — | | | | (0.12 | ) | |
Total distributions to shareholders | | | (0.44 | ) | | | (0.29 | ) | | | (0.48 | ) | | | (0.54 | ) | | | (0.02 | ) | | | (0.43 | ) | |
Net asset value, end of period | | $ | 8.72 | | | $ | 8.91 | | | $ | 8.86 | | | $ | 9.46 | | | $ | 9.58 | | | $ | 9.50 | | |
Total return | | | 3.00 | % | | | 3.88 | % | | | (1.17 | %) | | | 4.47 | % | | | 1.10 | % | | | 7.63 | % | |
Ratios to average net assets(b) | |
Total gross expenses | | | 0.77 | % | | | 0.75 | % | | | 0.73 | % | | | 0.73 | % | | | 0.75 | %(c) | | | 0.73 | %(d) | |
Total net expenses(e) | | | 0.61 | %(f) | | | 0.65 | %(f) | | | 0.71 | %(f) | | | 0.65 | %(f) | | | 0.55 | %(c) | | | 0.55 | %(d)(f) | |
Net investment income | | | 2.08 | % | | | 2.10 | % | | | 2.07 | % | | | 2.69 | % | | | 3.14 | %(c) | | | 3.33 | % | |
Supplemental data | |
Net assets, end of period (in thousands) | | $ | 440,059 | | | $ | 550,803 | | | $ | 659,538 | | | $ | 1,077,125 | | | $ | 1,599,267 | | | $ | 1,733,175 | | |
Portfolio turnover | | | 428 | % | | | 350 | % | | | 360 | % | | | 221 | % | | | 10 | % | | | 136 | % | |
Notes to Financial Highlights
(a) For the period from April 1, 2012 to April 30, 2012. During the period, the Fund's fiscal year end was changed from March 31 to April 30.
(b) In addition to the fees and expenses that the Fund bears directly, the Fund indirectly bears a pro rata share of the fees and expenses of any other funds in which it invests. Such indirect expenses are not included in the Fund's reported expense ratios.
(c) Annualized.
(d) Ratios include line of credit interest expense which is less than 0.01%.
(e) Total net expenses include the impact of certain fee waivers/expense reimbursements made by the Investment Manager and certain of its affiliates, if applicable.
(f) The benefits derived from expense reductions had an impact of less than 0.01%.
The accompanying Notes to Financial Statements are an integral part of this statement.
Annual Report 2016
39
NOTES TO FINANCIAL STATEMENTS
April 30, 2016
Note 1. Organization
Columbia Bond Fund (the Fund), a series of Columbia Funds Series Trust I (the Trust), is a diversified fund. The Trust is registered under the Investment Company Act of 1940, as amended (the 1940 Act), as an open-end management investment company organized as a Massachusetts business trust.
Fund Shares
The Trust may issue an unlimited number of shares (without par value). The Fund offers Class A, Class B, Class C, Class I, Class R, Class R4, Class R5, Class T, Class W, Class Y and Class Z shares. Although all share classes generally have identical voting, dividend and liquidation rights, each share class votes separately when required by the Trust's organizational documents or by law. Different share classes pay different distribution amounts to the extent the expenses of such share classes differ, and distributions in liquidation will be proportional to the net asset value of each share class. Each share class has its own expense and sales charge structure.
Class A shares are subject to a maximum front-end sales charge of 4.75% based on the initial investment amount. Class A shares purchased without an initial sales charge in accounts aggregating $1 million to $50 million at the time of purchase are subject to a contingent deferred sales charge (CDSC) if the shares are sold within 18 months after purchase, charged as follows: 1.00% CDSC if redeemed within 12 months after purchase, and 0.50% CDSC if redeemed more than 12, but less than 18, months after purchase.
Class B shares may be subject to a maximum CDSC of 5.00% based upon the holding period after purchase. Class B shares will generally convert to Class A shares eight years after purchase. The Fund no longer accepts investments by new or existing investors in the Fund's Class B shares, except in connection with the reinvestment of any dividend and/or capital gain distributions in Class B shares of the Fund and exchanges by existing Class B shareholders of certain other funds within the Columbia Family of Funds.
Class C shares are subject to a 1.00% CDSC on shares redeemed within 12 months after purchase.
Class I shares are not subject to sales charges and are available only to the Columbia Family of Funds.
Class R shares are not subject to sales charges and are generally available only to certain retirement plans and other investors as described in the Fund's prospectus.
Class R4 shares are not subject to sales charges and are generally available only to omnibus retirement plans and certain investors as described in the Fund's prospectus.
Class R5 shares are not subject to sales charges and are generally available only to investors purchasing through authorized investment professionals and omnibus retirement plans.
Class T shares are subject to a maximum front-end sales charge of 4.75% based on the investment amount. Class T shares purchased without an initial sales charge in accounts aggregating $1 million to $50 million at the time of purchase are subject to a CDSC if the shares are sold within 18 months after purchase, charged as follows: 1.00% CDSC if redeemed within 12 months after purchase, and 0.50% CDSC if redeemed more than 12, but less than 18, months after purchase. Class T shares are available only to investors who received (and who have continuously held) Class T shares in connection with previous fund reorganizations.
Class W shares are not subject to sales charges and are available only to investors purchasing through authorized investment programs managed by investment professionals, including discretionary managed account programs.
Class Y shares are not subject to sales charges and are generally available only to certain retirement plans as described in the Fund's prospectus.
Class Z shares are not subject to sales charges and are available only to eligible investors, which are subject to different investment minimums as described in the Fund's prospectus.
Note 2. Summary of Significant Accounting Policies
Basis of Preparation
The Fund is an investment company that applies the accounting and reporting guidance in the Financial Accounting Standards Board (FASB) Accounting Standards Codification Topic 946, Financial Services — Investment Companies (ASC 946). The financial statements are prepared in accordance with U.S. generally accepted accounting principles (GAAP), which requires management to make certain estimates and assumptions that affect the reported amounts of assets
Annual Report 2016
40
NOTES TO FINANCIAL STATEMENTS (continued)
April 30, 2016
and liabilities, the disclosure of contingent assets and liabilities at the date of the financial statements and the reported amounts of income and expenses during the reporting period. Actual results could differ from those estimates.
The following is a summary of significant accounting policies followed by the Fund in the preparation of its financial statements.
Security Valuation
Debt securities generally are valued by pricing services approved by the Board of Trustees (the Board) based upon market transactions for normal, institutional-size trading units of similar securities. The services may use various pricing techniques that take into account, as applicable, factors such as yield, quality, coupon rate, maturity, type of issue, trading characteristics and other data, as well as broker quotes. Debt securities for which quotations are not readily available or not believed to be reflective of market value may also be valued based upon a bid quote from an approved independent broker-dealer. Debt securities maturing in 60 days or less are valued primarily at amortized cost value, unless this method results in a valuation that management believes does not approximate market value.
Asset- and mortgage-backed securities are generally valued by pricing services, which utilize pricing models that incorporate the securities' cash flow and loan performance data. These models also take into account available market data, including trades, market quotations, and benchmark yield curves for identical or similar securities. Factors used to identify similar securities may include, but are not limited to, issuer, collateral type, vintage, prepayment speeds, collateral performance, credit ratings, credit enhancement and expected life. Asset-backed securities for which quotations are readily available may also be valued based upon an over-the-counter or exchange bid quote from an approved independent broker-dealer.
All equity securities are valued at the close of business of the New York Stock Exchange (NYSE). Equity securities are valued at the last quoted sales price on the principal exchange or market on which they trade, except for securities traded on the NASDAQ Stock Market, which are valued at the NASDAQ official close price. Unlisted securities or listed securities for which there were no sales during the day are valued at the mean of the latest quoted bid and ask prices on such exchanges or markets.
Investments in open-end investment companies, including money market funds, are valued at their latest net asset value.
Futures and options on futures contracts are valued based upon the settlement price at the close of regular trading on their principal exchanges or, in the absence of transactions, at the mean of the latest quoted bid and ask prices.
Swap transactions are valued through an independent pricing service or broker, or if neither is available, through an internal model based upon observable inputs.
Investments for which market quotations are not readily available, or that have quotations which management believes are not reflective of market value or reliable, are valued at fair value as determined in good faith under procedures approved by and under the general supervision of the Board. If a security or class of securities (such as foreign securities) is valued at fair value, such value is likely to be different from the quoted or published price for the security.
The determination of fair value often requires significant judgment. To determine fair value, management may use assumptions including but not limited to future cash flows and estimated risk premiums. Multiple inputs from various sources may be used to determine fair value.
GAAP requires disclosure regarding the inputs and valuation techniques used to measure fair value and any changes in valuation inputs or techniques. In addition, investments shall be disclosed by major category. This information is disclosed following the Fund's Portfolio of Investments.
Derivative Instruments
The Fund invests in certain derivative instruments, as detailed below, to meet its investment objectives. Derivatives are instruments whose values depend on, or are derived from, in whole or in part, the value of one or more securities, currencies, commodities, indices, or other assets or instruments. Derivatives may be used to increase investment flexibility (including to maintain cash reserves while maintaining desired exposure to certain assets), for risk management (hedging) purposes, to facilitate trading, to reduce transaction costs and to pursue higher investment returns. The Fund may also use derivative instruments to mitigate certain investment risks, such as foreign currency exchange rate risk, interest rate risk and credit risk. Derivatives may involve various risks, including the potential inability of the counterparty to fulfill its obligation under the terms of the
Annual Report 2016
41
NOTES TO FINANCIAL STATEMENTS (continued)
April 30, 2016
contract, the potential for an illiquid secondary market (making it difficult for the Fund to sell, including at favorable prices) and the potential for market movements which may expose the Fund to gains or losses in excess of the amount shown in the Statement of Assets and Liabilities. The notional amounts of derivative instruments, if applicable, are not recorded in the financial statements.
A derivative instrument may suffer a marked-to-market loss if the value of the contract decreases due to an unfavorable change in the market rates or values of the underlying instrument. Losses can also occur if the counterparty does not perform under the contract. The Fund's risk of loss from counterparty credit risk on over-the-counter derivatives is generally limited to the aggregate unrealized gain netted against any collateral held by the Fund and the amount of any variation margin held by the counterparty. With exchange-traded or centrally cleared derivatives, there is reduced counterparty credit risk to the Fund since the exchange's clearinghouse, as counterparty to such instruments, guarantees against a possible default. The clearinghouse stands between the buyer and the seller of the contract; therefore, the counterparty credit risk is failure of the clearinghouse. However, credit risk still exists in exchange-traded or centrally cleared derivatives with respect to initial and variation margin that is held in a broker's customer account. While brokers are required to segregate customer margin from their own assets, in the event that a broker becomes insolvent or goes into bankruptcy and at that time there is a shortfall in the aggregate amount of margin held by the broker for all its clients, U.S. bankruptcy laws will typically allocate that shortfall on a pro-rata basis across all the broker's customers (including the Fund), potentially resulting in losses to the Fund.
In order to better define its contractual rights and to secure rights that will help the Fund mitigate its counterparty risk, the Fund may enter into an International Swaps and Derivatives Association, Inc. Master Agreement (ISDA Master Agreement) or similar agreement with its derivatives contract counterparties. An ISDA Master Agreement is an agreement between the Fund and a counterparty that governs over-the-counter derivatives and forward foreign currency exchange contracts and typically contains, among other things, collateral posting terms and netting provisions in the event of a default and/or termination event. Under an ISDA Master Agreement, the Fund may, under certain circumstances, offset with the counterparty certain
derivative instrument's payables and/or receivables with collateral held and/or posted and create one single net payment. The provisions of the ISDA Master Agreement typically permit a single net payment in the event of default (close-out netting) including the bankruptcy or insolvency of the counterparty. Note, however, that bankruptcy or insolvency laws of a particular jurisdiction may impose restrictions on or prohibitions against the right of offset in bankruptcy, insolvency or other events.
Collateral (margin) requirements differ by type of derivative. Margin requirements are established by the exchange or clearinghouse for exchange-traded and centrally cleared derivatives. Brokers can ask for margin in excess of the minimum in certain circumstances. Collateral terms are contract specific for over-the-counter derivatives. For over-the-counter derivatives traded under an ISDA Master Agreement, the collateral requirements are typically calculated by netting the marked-to-market amount for each transaction under such agreement and comparing that amount to the value of any variation margin currently pledged by the Fund and/or the counterparty. Generally, the amount of collateral due from or to a party has to exceed a minimum transfer amount threshold (e.g., $500,000) before a transfer has to be made. To the extent amounts due to the Fund from its counterparties are not fully collateralized, contractually or otherwise, the Fund bears the risk of loss from counterparty nonperformance. The Fund attempts to mitigate counterparty risk by only entering into agreements with counterparties that it believes have the financial resources to honor their obligations and by monitoring the financial stability of those counterparties.
Certain ISDA Master Agreements allow counterparties to over-the-counter derivatives transactions to terminate derivatives contracts prior to maturity in the event the Fund's net asset value declines by a stated percentage over a specified time period or if the Fund fails to meet certain terms of the ISDA Master Agreement, which would cause the Fund to accelerate payment of any net liability owed to the counterparty. The Fund also has termination rights if the counterparty fails to meet certain terms of the ISDA Master Agreement. In addition to considering counterparty credit risk, the Fund would consider terminating the derivatives contracts based on whether termination would result in a net liability owed from the counterparty.
For financial reporting purposes, the Fund does not offset derivative assets and derivative liabilities that are subject to netting arrangements in the Statement of Assets and Liabilities.
Annual Report 2016
42
NOTES TO FINANCIAL STATEMENTS (continued)
April 30, 2016
Futures Contracts
Futures contracts are exchange traded and represent commitments for the future purchase or sale of an asset at a specified price on a specified date. The Fund bought and sold futures contracts to manage the duration and yield curve exposure of the Fund versus the benchmark. These instruments may be used for other purposes in future periods. Upon entering into futures contracts, the Fund bears risks that it may not achieve the anticipated benefits of the futures contracts and may realize a loss. Additional risks include counterparty credit risk, the possibility of an illiquid market, and that a change in the value of the contract or option may not correlate with changes in the value of the underlying asset.
Upon entering into a futures contract, the Fund pledges cash or securities with the broker in an amount sufficient to meet the initial margin requirement. The initial margin deposit must be maintained at an established level over the life of the contract. Cash deposited as initial margin is recorded in the Statement of Assets and Liabilities as margin deposits. Securities deposited as initial margin are designated in the Portfolio of Investments. Subsequent payments (variation margin) are made or received by the Fund each day. The variation margin payments are equal to the daily change in the contract value and are recorded as variation margin receivable or payable and are offset in unrealized gains or losses. The Fund recognizes a realized gain or loss when the contract is closed or expires. Futures contracts involve, to varying degrees, risk of loss in excess of the variation margin disclosed in the Statement of Assets and Liabilities.
Swap Contracts
Swap contracts are negotiated in the over-the-counter market and may be entered into as a bilateral contract or centrally cleared (centrally cleared swap contract). In a centrally cleared swap contract, immediately following execution of the swap contract with a broker, the swap contract is novated to a central counterparty (the CCP) and the CCP becomes the Fund's counterparty to the centrally cleared swap contract. The Fund is required to deposit initial margin with the broker in the form of cash or securities in an amount that varies depending on the size and risk profile of the particular swap contract. Securities deposited as initial margin are designated in the Portfolio of Investments and cash deposited is recorded in the Statement of Assets and Liabilities as margin deposits. Unlike a bilateral swap contract, for centrally cleared swap contracts, the Fund has minimal credit exposure to the counterparty because the CCP
stands between the Fund and the counterparty. Swap contracts are marked-to-market daily and changes in value are recorded as unrealized appreciation (depreciation). The daily change in valuation of centrally cleared swap contracts, if any, is recorded as a receivable or payable for variation margin in the Statement of Assets and Liabilities.
Credit Default Swap Contracts
The Fund entered into credit default swap contracts to manage credit risk exposure, to increase or decrease its credit exposure to an index and to increase or decrease its credit exposure to a single issuer of debt securities. Additionally, credit default swap contracts were used to hedge the Fund's exposure on a debt security that it owns or in lieu of selling such debt security. These instruments may be used for other purposes in future periods. Credit default swap contracts are agreements in which one party pays fixed periodic payments to a counterparty in consideration for a guarantee from the counterparty to make a specific payment should a specified credit event(s) take place. Although specified credit events are contract specific, credit events are generally defined as bankruptcy, failure to pay, restructuring, obligation acceleration, obligation default, or repudiation/moratorium.
As the purchaser of a credit default swap contract, the Fund purchases protection by paying a periodic interest rate on the notional amount to the counterparty. The interest amount is accrued daily as a component of unrealized appreciation (depreciation) and is recorded as a realized loss upon payment. If a credit event as specified in the contract occurs, the Fund may have the option either to deliver the reference obligation to the seller in exchange for a cash payment of its par amount, or to receive a net cash settlement equal to the par amount less an agreed-upon value of the reference obligation as of the date of the credit event. The difference between the value of the obligation or cash delivered and the notional amount received will be recorded as a realized gain (loss).
Any premium paid or received by the Fund upon entering into a credit default swap contract is recorded as an asset or liability, respectively, and amortized daily as a component of realized gain (loss) in the Statement of Operations. Credit default swap contracts are valued daily, and the change in value is recorded as unrealized appreciation (depreciation) until the termination of the swap, at which time a realized gain (loss) is recorded.
Annual Report 2016
43
NOTES TO FINANCIAL STATEMENTS (continued)
April 30, 2016
Credit default swap contracts can involve greater risks than if a fund had invested in the reference obligation directly since, in addition to general market risks, credit default swaps are subject to counterparty credit risk, leverage risk, hedging risk, correlation risk and liquidity risk. The Fund will enter into credit default swap transactions only with counterparties that meet certain standards of creditworthiness, as determined by the Investment Manager.
Interest Rate Swap Contracts
The Fund entered into interest rate swap transactions to hedge interest rate risk in portfolio positions. These instruments may be used for other purposes in future periods. Interest rate swaps are agreements between two parties that involve the exchange of one type of interest rate for another type of interest rate cash flow on specified dates in the future, based on a predetermined, specified notional amount. Certain interest rate swaps are considered forward-starting, whereby the accrual for the exchange of cash flows does not begin until a specified date in the future (the effective date). The net cash flow for a standard interest rate swap transaction is generally the difference between a floating market interest rate versus a fixed interest rate.
Interest rate swaps are valued daily and unrealized appreciation (depreciation) is recorded. Certain interest rate swaps may accrue periodic interest on a daily basis as a component of unrealized appreciation (depreciation); the Fund will realize a gain or loss upon the payment or receipt of accrued interest. The Fund will realize a gain or a loss when the interest rate swap is terminated.
Risks of entering into interest rate swaps include a lack of correlation between the swaps and the portfolio of bonds the swaps are designed to hedge or replicate. A lack of correlation may cause the interest rate swaps to experience adverse changes in value relative to expectations. In addition, interest rate swaps are subject to the risk of default of a counterparty, and the risk of adverse movements in market interest rates relative to the interest rate swap positions taken. The Fund's maximum risk of loss from counterparty credit risk is the discounted net value of the cash flows to be received from/paid to the counterparty over the contract's remaining life to the extent that such amount is positive, plus the cost of entering into a similar transaction with another counterparty.
The Fund attempts to mitigate counterparty credit risk by entering into interest rate swap transactions only with
counterparties that meet prescribed levels of creditworthiness, as determined by the Investment Manager. The Fund and any counterparty are required to maintain an agreement that requires the Fund and that counterparty to monitor (on a daily basis) the net market value of all derivative transactions entered into pursuant to the agreement between the Fund and such counterparty. If the net market value of such derivatives transactions between the Fund and that counterparty exceeds a certain threshold (as defined in the agreement), the Fund or the counterparty is required to post cash and/or securities as collateral. Market values of derivatives transactions presented in the financial statements are not netted with the market values of other derivatives transactions or with any collateral amounts posted by the Fund or any counterparty.
Effects of Derivative Transactions in the Financial Statements
The following tables are intended to provide additional information about the effect of derivatives on the financial statements of the Fund, including: the fair value of derivatives by risk category and the location of those fair values in the Statement of Assets and Liabilities; and the impact of derivative transactions over the period in the Statement of Operations, including realized and unrealized gains (losses). The derivative instrument schedules following the Portfolio of Investments present additional information regarding derivative instruments outstanding at the end of the period, if any.
The following table is a summary of the fair value of derivative instruments (not considered to be hedging instruments for accounting disclosure purposes) at April 30, 2016:
Asset Derivatives | |
Risk Exposure
Category | | Statement of Assets and
Liabilities Location | | Fair Value ($) | |
Credit risk
| | Net assets — unrealized
appreciation on swap
contracts | | | 15,496
| | |
Credit risk
| | Premiums paid on
outstanding swap
contracts | | | 7,398
| | |
Interest rate risk
| | Net assets — unrealized
appreciation on futures
contracts | | | 505,280
| * | |
Total | | | | | 528,174 | | |
Annual Report 2016
44
NOTES TO FINANCIAL STATEMENTS (continued)
April 30, 2016
Liability Derivatives | |
Risk Exposure
Category | | Statement of Assets and
Liabilities Location | | Fair Value ($) | |
Credit risk
| | Net assets — unrealized
depreciation on swap
contracts | | | 66,432
| * | |
Credit risk
| | Premiums received on
outstanding swap
contracts | | | 60,948
| | |
Interest rate risk
| | Net assets — unrealized
depreciation on futures
contracts | | | 32,974
| * | |
Total | | | | | 160,354 | | |
*Includes cumulative appreciation (depreciation) as reported in the tables following the Portfolio of Investments. Only the current day's variation margin is reported in receivables or payables in the Statement of Assets and Liabilities.
The following table indicates the effect of derivative instruments (not considered to be hedging instruments for accounting disclosure purposes) in the Statement of Operations for the year ended April 30, 2016:
Amount of Realized Gain (Loss) on Derivatives Recognized in Income | |
Risk Exposure
Category | | Futures
Contracts ($) | | Swap
Contracts ($) | | Total ($) | |
Credit risk | | | — | | | | 214,416 | | | | 214,416 | | |
Interest rate risk | | | (1,923,839 | ) | | | 113,632 | | | | (1,810,207 | ) | |
Total | | | (1,923,839 | ) | | | 328,048 | | | | (1,595,791 | ) | |
Change in Unrealized Appreciation (Depreciation) on
Derivatives Recognized in Income | |
Risk Exposure
Category | | Futures
Contracts ($) | | Swap
Contracts ($) | | Total ($) | |
Credit risk | | | — | | | | 57,795 | | | | 57,795 | | |
Interest rate risk | | | 284,989 | | | | 14,236 | | | | 299,225 | | |
Total | | | 284,989 | | | | 72,031 | | | | 357,020 | | |
The following table provides a summary of the average outstanding volume by derivative instrument for the year ended April 30, 2016:
Derivative Instrument | | Average Notional
Amounts ($)* | |
Futures contracts — Long | | | 67,800,516 | | |
Futures contracts — Short | | | 31,448,914 | | |
Credit default swap
contracts — buy protection | | | 40,300,000
| | |
Derivative Instrument | | Average Unrealized
Appreciation ($)* | | Average Unrealized
Depreciation ($)* | |
Interest rate swap contracts | | | 10,667 | | | | (5,502 | ) | |
*Based on the ending quarterly outstanding amounts for the year ended April 30, 2016.
Asset- and Mortgage-Backed Securities
The Fund may invest in asset-backed and mortgage-backed securities. The maturity dates shown represent the original maturity of the underlying obligation. Actual maturity may vary based upon prepayment activity on these obligations. All, or a portion, of the obligation may be prepaid at any time because the underlying asset may be prepaid. As a result, decreasing market interest rates could result in an increased level of prepayment. An increased prepayment rate will have the effect of shortening the maturity of the security. Unless otherwise noted, the coupon rates presented are fixed rates.
Delayed Delivery Securities
The Fund may trade securities on other than normal settlement terms, including securities purchased or sold on a "when-issued" basis. This may increase risk to the Fund since the other party to the transaction may fail to deliver, which could cause the Fund to subsequently invest at less advantageous prices. The Fund designates cash or liquid securities in an amount equal to the delayed delivery commitment.
To Be Announced Securities
The Fund may trade securities on a To Be Announced (TBA) basis. As with other delayed-delivery transactions, a seller agrees to issue a TBA security at a future date. However, the seller does not specify the particular securities to be delivered. Instead, the Fund agrees to accept any security that meets specified terms.
In some cases, Master Securities Forward Transaction Agreements (MSFTAs) may be used to govern transactions of certain forward-settling agency mortgage-backed securities, such as delayed-delivery and TBAs, between the Fund and counterparty. The MSFTA maintains provisions for, among other things, initiation and confirmation, payment and transfer, events of default, termination, and maintenance of collateral relating to such transactions.
Mortgage Dollar Roll Transactions
The Fund may enter into mortgage "dollar rolls" in which the Fund sells securities for delivery in the current month and simultaneously contracts with the same counterparty to repurchase similar but not identical securities (same type, coupon and maturity) on a specified future date. During the roll period, the Fund loses the right to receive principal and interest paid on the securities sold. However, the Fund will benefit because it receives negotiated amounts in the form of reductions of the
Annual Report 2016
45
NOTES TO FINANCIAL STATEMENTS (continued)
April 30, 2016
purchase price for the future purchase plus the interest earned on the cash proceeds of the securities sold until the settlement date of the forward purchase. The Fund records the incremental difference between the forward purchase and sale of each forward roll as a realized gain or loss. Unless any realized gains exceed the income, capital appreciation, and gain or loss due to mortgage prepayments that would have been realized on the securities sold as part of the mortgage dollar roll, the use of this technique will diminish the investment performance of the Fund compared to what the performance would have been without the use of mortgage dollar rolls. All cash proceeds will be invested in instruments that are permissible investments for the Fund. The Fund identifies cash or liquid securities in an amount equal to the forward purchase price.
For financial reporting and tax purposes, the Fund treats "to be announced" mortgage dollar rolls as two separate transactions, one involving the purchase of a security and a separate transaction involving a sale. These transactions may increase the Fund's portfolio turnover rate. The Fund does not currently enter into mortgage dollar rolls that are accounted for as financing transactions.
Mortgage dollar rolls involve the risk that the market value of the securities the Fund is obligated to repurchase may decline below the repurchase price, or that the counterparty may default on its obligations.
Interest Only and Principal Only Securities
The Fund may invest in Interest Only (IO) or Principal Only (PO) securities. IOs are stripped securities entitled to receive all of the security's interest, but none of its principal. IOs are particularly sensitive to changes in interest rates and therefore subject to greater fluctuations in price than typical interest bearing debt securities. IOs are also subject to credit risk because the Fund may not receive all or part of the interest payments if the issuer, obligor, guarantor or counterparty defaults on its obligation. Payments received for IOs are included in interest income on the Statement of Operations. Because no principal will be received at the maturity of an IO, adjustments are made to the cost of the security on a monthly basis until maturity. POs are stripped securities entitled to receive the principal from the underlying obligation, but not the interest. POs are particularly sensitive to changes in interest rates and therefore are subject to fluctuations in price. POs are also subject to credit risk because the Fund may not receive all or part of its principal if the issuer, obligor, guarantor or counterparty defaults on its obligation. The Fund may also invest in IO or PO stripped mortgage-backed securities. Payments received for POs are treated as reductions to the cost and par value of the securities.
Offsetting of Assets and Liabilities
The following table presents the Fund's gross and net amount of assets and liabilities available for offset under netting arrangements as well as any related collateral received or pledged by the Fund as of April 30, 2016:
| | | Citi ($) | | Goldman Sachs
International ($) | | JPMorgan ($) | | Morgan
Stanley ($)(a) | | Morgan
Stanley ($)(a) | | Total ($) | |
Assets | |
Centrally cleared credit default swap contracts(b) | | | — | | | | — | | | | — | | | | — | | | | 11,221 | | | | 11,221 | | |
OTC credit default swap contracts(c) | | | — | | | | 2,033 | | | | — | | | | — | | | | — | | | | 2,033 | | |
Total Assets | | | — | | | | 2,033 | | | | — | | | | — | | | | 11,221 | | | | 13,254 | | |
Liabilities | |
OTC credit default swap contracts(c) | | | 53,599 | | | | 4,834 | | | | 6,468 | | | | 1,343 | | | | — | | | | 66,244 | | |
Total Financial and Derivative Net Assets | | | (53,599 | ) | | | (2,801 | ) | | | (6,468 | ) | | | (1,343 | ) | | | 11,221 | | | | (52,990 | ) | |
Total collateral received (pledged)(d) | | | — | | | | — | | | | — | | | | — | | | | — | | | | — | | |
Net Amount(e) | | | (53,599 | ) | | | (2,801 | ) | | | (6,468 | ) | | | (1,343 | ) | | | 11,221 | | | | (52,990 | ) | |
(a) Exposure can only be netted across transactions governed under the same master agreement with the same legal entity.
(b) Centrally cleared swaps are included within payable/receivable for variation margin on the Statement of Assets and Liabilities.
(c) Over-the-Counter Swap Contracts are presented at market value plus periodic payments receivable (payable), which is comprised of unrealized appreciation, unrealized depreciation, premiums paid and premiums received.
(d) In some instances, the actual collateral received and/or pledged may be more than the amount shown due to overcollateralization.
(e) Represents the net amount due from/(to) counterparties in the event of default.
Annual Report 2016
46
NOTES TO FINANCIAL STATEMENTS (continued)
April 30, 2016
Security Transactions
Security transactions are accounted for on the trade date. Cost is determined and gains (losses) are based upon the specific identification method for both financial statement and federal income tax purposes.
Income Recognition
Interest income is recorded on an accrual basis. Market premiums and discounts, including original issue discounts, are amortized and accreted, respectively, over the expected life of the security on all debt securities, unless otherwise noted. The Fund classifies gains and losses realized on prepayments received on mortgage-backed securities as adjustments to interest income.
The Fund may place a debt security on non-accrual status and reduce related interest income when it becomes probable that the interest will not be collected and the amount of uncollectible interest can be reasonably estimated. A defaulted debt security is removed from non-accrual status when the issuer resumes interest payments or when collectibility of interest is reasonably assured.
Corporate actions and dividend income are recorded on the ex-dividend date.
The Fund may receive distributions from holdings in equity securities, business development companies (BDCs), exchange-traded funds, other regulated investment companies (RICs), and real estate investment trusts (REITs), which report information on the tax character of their distributions annually. These distributions are allocated to dividend income, capital gain and return of capital based on actual information reported. Return of capital is recorded as a reduction of the cost basis of securities held. If the Fund no longer owns the applicable securities, return of capital is recorded as a realized gain. With respect to REITs, to the extent actual information has not yet been reported, estimates for return of capital are made by the Fund's management. Management's estimates are subsequently adjusted when the actual character of the distributions is disclosed by the REITs, which could result in a proportionate change in return of capital to shareholders.
Awards from class action litigation are recorded as a reduction of cost basis if the Fund still owns the applicable securities on the payment date. If the Fund no longer owns the applicable securities, the proceeds are recorded as realized gains.
Expenses
General expenses of the Trust are allocated to the Fund and other funds of the Trust based upon relative net assets or other expense allocation methodologies determined by the nature of the expense. Expenses directly attributable to the Fund are charged to the Fund. Expenses directly attributable to a specific class of shares are charged to that share class.
Determination of Class Net Asset Value
All income, expenses (other than class-specific expenses, which are charged to that share class, as shown in the Statement of Operations) and realized and unrealized gains (losses) are allocated to each class of the Fund on a daily basis, based on the relative net assets of each class, for purposes of determining the net asset value of each class.
Federal Income Tax Status
The Fund intends to qualify each year as a regulated investment company under Subchapter M of the Internal Revenue Code, as amended, and will distribute substantially all of its taxable income (including net short-term capital gains), if any, for its tax year, and as such will not be subject to federal income taxes. In addition, the Fund intends to distribute in each calendar year substantially all of its net investment income, capital gains and certain other amounts, if any, such that the Fund should not be subject to federal excise tax. Therefore, no federal income or excise tax provision is recorded.
Distributions to Shareholders
Distributions from net investment income, if any, are declared daily and paid monthly. Net realized capital gains, if any, are distributed at least annually. Income distributions and capital gain distributions are determined in accordance with federal income tax regulations, which may differ from GAAP.
Guarantees and Indemnifications
Under the Trust's organizational documents and, in some cases, by contract, its officers and trustees are indemnified against certain liabilities arising out of the performance of their duties to the Trust or its funds. In addition, certain of the Fund's contracts with its service providers contain general indemnification clauses. The Fund's maximum exposure under these arrangements is unknown since the amount of any future claims that may be made against the Fund cannot be determined, and the Fund has no historical basis for predicting the likelihood of any such claims.
Annual Report 2016
47
NOTES TO FINANCIAL STATEMENTS (continued)
April 30, 2016
Note 3. Fees and Other Transactions with Affiliates
Management Fees
Effective September 1, 2015, the Fund entered into a Management Agreement with Columbia Management Investment Advisers, LLC (the Investment Manager), a wholly-owned subsidiary of Ameriprise Financial, Inc. (Ameriprise Financial). Under the Management Agreement, the Investment Manager provides the Fund with investment research and advice, as well as administrative and accounting services. The management services fee is an annual fee that is equal to a percentage of the Fund's average daily net assets that declines from 0.50% to 0.34% as the Fund's net assets increase. The effective management services fee rate for the year ended April 30, 2016 was 0.50% of the Fund's average daily net assets.
Prior to September 1, 2015, the Fund paid the Investment Manager an annual fee for advisory services under an Investment Management Services Agreement and a separate annual fee for administrative and accounting services under an Administrative Services Agreement. For the period from May 1, 2015 through August 31, 2015, the investment advisory services fee paid to the Investment Manager was $890,053, and the administrative services fee paid to the Investment Manager was $142,968.
Compensation of Board Members
Board members, who are not officers or employees of the Investment Manager or Ameriprise Financial, are compensated for their services to the Fund as disclosed in the Statement of Operations. These Board members may participate in a Deferred Compensation Plan (the Plan) which may be terminated at any time. Obligations of the Plan will be paid solely out of the Fund's assets, and all amounts payable under the Plan constitute a general unsecured obligation of the Fund.
Compensation of Chief Compliance Officer
The Board has appointed a Chief Compliance Officer to the Fund in accordance with federal securities regulations. The Fund is allocated a portion of the expenses associated with the Chief Compliance Officer based on relative net assets of the Trust.
Transactions with Affiliates
For the year ended April 30 2016, the Fund engaged in purchase and/or sale transactions with affiliates and/or accounts that have a common investment manager (or
affiliated investment managers), common directors/trustees, and/or common officers. Those purchase and sale transactions complied with provisions of Rule 17a-7 under the 1940 Act and were $974,825 and $4,781,353, respectively. The sale transactions resulted in a net realized gain of $303,746.
Transfer Agency Fees
Under a Transfer and Dividend Disbursing Agent Agreement, Columbia Management Investment Services Corp. (the Transfer Agent), an affiliate of the Investment Manager and a wholly-owned subsidiary of Ameriprise Financial, is responsible for providing transfer agency services to the Fund. The Transfer Agent has contracted with Boston Financial Data Services (BFDS) to serve as sub-transfer agent.
The Transfer Agent receives a monthly transfer agency fee based on the number or the average value of accounts, depending on the type of account. In addition, the Transfer Agent also receives sub-transfer agency fees based on a percentage of the average aggregate value of the Fund's shares maintained in omnibus accounts (other than omnibus accounts for which American Enterprise Investment Services Inc. is the broker of record or accounts where the beneficial shareholder is a customer of Ameriprise Financial Services, Inc., for which the Transfer Agent receives a per account fee). The Transfer Agent pays the fees of BFDS for services as sub-transfer agent and is not entitled to reimbursement for such fees from the Fund (with the exception of out-of-pocket fees).
The Transfer Agent also receives compensation from the Fund for various shareholder services and reimbursements for certain out-of-pocket fees. Total transfer agency fees for Class R5 shares are subject to an annual limitation of not more than 0.05% of the average daily net assets attributable to Class R5 shares. Class I and Class Y shares do not pay transfer agency fees.
Annual Report 2016
48
NOTES TO FINANCIAL STATEMENTS (continued)
April 30, 2016
For the year ended April 30, 2016, the Fund's effective transfer agency fee rates as a percentage of average daily net assets of each class were as follows:
Class A | | | 0.22 | % | |
Class B | | | 0.22 | | |
Class C | | | 0.21 | | |
Class R | | | 0.22 | | |
Class R4 | | | 0.21 | | |
Class R5 | | | 0.05 | | |
Class T | | | 0.22 | | |
Class W | | | 0.23 | | |
Class Z | | | 0.22 | | |
An annual minimum account balance fee of $20 may apply to certain accounts with a value below the applicable share class's initial minimum investment requirements to reduce the impact of small accounts on transfer agency fees. These minimum account balance fees are remitted to the Fund and recorded as part of expense reductions in the Statement of Operations. For the year ended April 30, 2016, these minimum account balance fees reduced total expenses of the Fund by $1,524.
Distribution and Service Fees
The Fund has an agreement with Columbia Management Investment Distributors, Inc. (the Distributor), an affiliate of the Investment Manager and a wholly-owned subsidiary of Ameriprise Financial, for distribution and shareholder services. The Board has approved, and the Fund has adopted, distribution and shareholder service plans (the Plans) applicable to certain share classes, which set the distribution and service fees for the Fund. These fees are calculated daily and are intended to compensate the Distributor and/or eligible selling and/or servicing agents for selling shares of the Fund and providing services to investors.
Under the Plans, the Fund pays a monthly service fee to the Distributor at the maximum annual rate of 0.25% of the average daily net assets attributable to Class A, Class B, Class C and Class W shares of the Fund. Also under the Plans, the Fund pays a monthly distribution fee to the Distributor at the maximum annual rates of 0.75%, 0.75%, 0.50% and 0.25% of the average daily net assets attributable to Class B, Class C, Class R and Class W shares of the Fund, respectively.
Although the Fund may pay a distribution fee up to 0.25% of the Fund's average daily net assets attributable to Class W shares and a service fee of up to 0.25% of the
Fund's average daily net assets attributable to Class W shares, the aggregate fee shall not exceed 0.25% of the Fund's average daily net assets attributable to Class W shares.
Shareholder Services Fees
The Fund has adopted a shareholder services plan that permits it to pay for certain services provided to Class T shareholders by their selling and/or servicing agents. The Fund may pay shareholder servicing fees up to an aggregate annual rate of 0.40% of the Fund's average daily net assets attributable to Class T shares (comprised of up to 0.20% for shareholder liaison services and up to 0.20% for administrative support services). These fees are currently limited to an aggregate annual rate of not more than 0.15% of the Fund's average daily net assets attributable to Class T shares. In addition, if the Fund declares dividends on a daily basis, the servicing fee for Class T shares will be waived by selling and/or servicing agents to the extent necessary to prevent the net investment income for Class T shares from falling below 0.00% on a daily basis. The effective shareholder services fee rate for the year ended April 30, 2016 was 0.15% of the Fund's average daily net assets attributable to Class T shares.
Sales Charges
Sales charges, including front-end charges and CDSCs, received by the Distributor for distributing Fund shares were $65,564 for Class A, $163 for Class B, $1,425 for Class C and $399 for Class T shares for the year ended April 30, 2016.
Expenses Waived/Reimbursed by the Investment Manager and its Affiliates
The Investment Manager and certain of its affiliates have contractually agreed to waive fees and/or reimburse expenses (excluding certain fees and expenses described below) for the periods disclosed below, unless sooner terminated at the sole discretion of the Board, so that the Fund's net operating expenses, after giving effect to fees waived/expenses reimbursed and any balance credits and/or overdraft charges from the Fund's
Annual Report 2016
49
NOTES TO FINANCIAL STATEMENTS (continued)
April 30, 2016
custodian, do not exceed the following annual rates as a percentage of the class' average daily net assets:
| | | September 1, 2015
through
August 31, 2016 | | Prior to
September 1, 2015 | |
Class A | | | 0.86 | % | | | 0.93 | % | |
Class B | | | 1.61 | | | | 1.68 | | |
Class C | | | 1.61 | | | | 1.68 | | |
Class I | | | 0.45 | | | | 0.52 | | |
Class R | | | 1.11 | | | | 1.18 | | |
Class R4 | | | 0.61 | | | | 0.68 | | |
Class R5 | | | 0.50 | | | | 0.57 | | |
Class T | | | 0.76 | | | | 0.83 | | |
Class W | | | 0.86 | | | | 0.93 | | |
Class Y | | | 0.45 | | | | 0.52 | | |
Class Z | | | 0.61 | | | | 0.68 | | |
Under the agreement governing these fee waivers and/or expense reimbursement arrangements, the following fees and expenses are excluded from the waiver/reimbursement commitment, and therefore will be paid by the Fund, if applicable: taxes (including foreign transaction taxes), expenses associated with investments in affiliated and non-affiliated pooled investment vehicles (including mutual funds and exchange-traded funds), transaction costs and brokerage commissions, costs related to any securities lending program, dividend and interest expenses associated with securities sold short, inverse floater program fees and expenses, transaction charges and interest on borrowed money, interest, extraordinary expenses and any other expenses the exclusion of which is specifically approved by the Board. This agreement may be modified or amended only with approval from the Investment Manager, certain of its affiliates and the Fund.
Prior to September 1, 2015, the Fund's expense ratio was subject to a voluntary expense reimbursement arrangement pursuant to which fees were waived and/or expenses reimbursed (excluding certain fees and expenses immediately described above), so that the Fund's net operating expenses, after giving effect to fees waived/expenses reimbursed and any balance credits and/or overdraft charges from the Fund's custodian, did not exceed the annual rates of 0.86% for Class A, 1.61% for Class B, 1.61% for Class C, 0.45% for Class I, 1.11% for Class R, 0.61% for Class R4, 0.50% for Class R5, 0.76% for Class T, 0.86% for Class W, 0.45% for Class Y and 0.61% for Class Z.
Any fees waived and/or expenses reimbursed under the expense reimbursement arrangements described above are not recoverable by the Investment Manager or its affiliates in future periods.
Note 4. Federal Tax Information
The timing and character of income and capital gain distributions are determined in accordance with income tax regulations, which may differ from GAAP because of temporary or permanent book to tax differences.
At April 30, 2016, these differences are primarily due to differing treatment for principal and/or interest from fixed income securities, deferral/reversal of wash sale losses, Trustees' deferred compensation, distributions, post-October capital losses, derivative investments, tax straddles and certain convertible preferred securities. To the extent these differences are permanent, reclassifications are made among the components of the Fund's net assets in the Statement of Assets and Liabilities. Temporary differences do not require reclassifications.
In the Statement of Assets and Liabilities the following reclassifications were made:
Undistributed net investment income | | $ | (1,883 | ) | |
Accumulated net realized gain | | | (787 | ) | |
Paid-in capital | | | 2,670 | | |
Net investment income (loss) and net realized gains (losses), as disclosed in the Statement of Operations, and net assets were not affected by this reclassification.
The tax character of distributions paid during the years indicated was as follows:
Year Ended April 30, | | 2016 | | 2015 | |
Ordinary income | | $ | 20,174,314 | | | $ | 16,966,230 | | |
Long-term capital gains | | | 8,628,456 | | | | 6,050,240 | | |
Total | | $ | 28,802,770 | | | $ | 23,016,470 | | |
Short-term capital gain distributions, if any, are considered ordinary income distributions for tax purposes.
At April 30, 2016, the components of distributable earnings on a tax basis were as follows:
Undistributed ordinary income | | $ | 4,818,381 | | |
Net unrealized appreciation | | | 14,900,945 | | |
Annual Report 2016
50
NOTES TO FINANCIAL STATEMENTS (continued)
April 30, 2016
At April 30, 2016, the cost of investments for federal income tax purposes was $608,826,585 and the aggregate gross unrealized appreciation and depreciation based on that cost was:
Unrealized appreciation | | $ | 16,908,371 | | |
Unrealized depreciation | | | (2,007,426 | ) | |
Net unrealized appreciation | | $ | 14,900,945 | | |
Under current tax rules, regulated investment companies can elect to treat certain late-year ordinary losses incurred and post-October capital losses (capital losses realized after October 31) as arising on the first day of the following taxable year. As of April 30, 2016, the Fund will elect to treat post-October capital losses of $250,677 as arising on May 1, 2016.
Management of the Fund has concluded that there are no significant uncertain tax positions in the Fund that would require recognition in the financial statements. However, management's conclusion may be subject to review and adjustment at a later date based on factors including, but not limited to, new tax laws, regulations, and administrative interpretations (including relevant court decisions). Generally, the Fund's federal tax returns for the prior three fiscal years remain subject to examination by the Internal Revenue Service.
Note 5. Portfolio Information
The cost of purchases and proceeds from sales of securities, excluding short-term investments and derivatives, if any, aggregated to $2,792,774,181 and $2,914,317,019, respectively, for the year ended April 30, 2016, of which $2,259,218,751 and $2,240,921,242, respectively, were U.S. government securities. The amount of purchase and sale activity impacts the portfolio turnover rate reported in the Financial Highlights.
Note 6. Affiliated Money Market Fund
The Fund invests in Columbia Short-Term Cash Fund, an affiliated money market fund established for the exclusive use by the Fund and other affiliated funds. The income earned by the Fund from such investments is included as Dividends — affiliated issuers in the Statement of Operations. As an investing fund, the Fund indirectly bears its proportionate share of the expenses of Columbia Short-Term Cash Fund.
Note 7. Line of Credit
The Fund has access to a revolving credit facility whereby the Fund may borrow for the temporary funding of
shareholder redemptions or for other temporary or emergency purposes. Effective December 8, 2015, Citibank, N.A. and HSBC Bank USA, N.A. joined JPMorgan Chase Bank, N.A. (JPMorgan) as lead of a syndicate of banks under the credit facility, which is a collective agreement between the Fund and certain other funds managed by the Investment Manager, severally and not jointly, that permits collective borrowings up to $1 billion. Interest is charged to each participating fund based on its borrowings at a rate equal to the higher of (i) the overnight federal funds rate plus 1.00% or (ii) the one-month LIBOR rate plus 1.00%. Each borrowing under the credit facility matures no later than 60 days after the date of borrowing. The Fund also pays a commitment fee equal to its pro rata share of the amount of the credit facility at a rate of 0.15% per annum. The commitment fee is included in other expenses in the Statement of Operations. Prior to December 8, 2015, JPMorgan was the sole lead bank under the credit facility agreement that permitted borrowings up to $550 million under the same terms and interest rates as described above with the exception of the commitment fee which was charged at a rate of 0.075% per annum.
The Fund had no borrowings during the year ended April 30, 2016.
Note 8. Significant Risks
Shareholder Concentration Risk
At April 30, 2016, one unaffiliated shareholder of record owned 76.4% of the outstanding shares of the Fund in one or more accounts. The Fund has no knowledge about whether any portion of those shares was owned beneficially. Subscription and redemption activity by concentrated accounts may have a significant effect on the operations of the Fund. In the case of a large redemption, the Fund may be forced to sell investments at inopportune times, including its liquid or more liquid positions, resulting in Fund losses and the Fund holding a higher percentage of less liquid or illiquid securities. Large redemptions could result in decreased economies of scale and increased operating expenses for non-redeeming Fund shareholders.
Credit Risk
Credit risk is the risk that the value of debt securities in the Fund's portfolio may decline because the issuer may default and fail to pay interest or repay principal when due. Rating agencies assign credit ratings to debt securities to indicate their credit risk. Lower rated or unrated debt securities held by the Fund may present
Annual Report 2016
51
NOTES TO FINANCIAL STATEMENTS (continued)
April 30, 2016
increased credit risk as compared to higher-rated debt securities.
Interest Rate Risk
Interest rate risk is the risk of losses attributable to changes in interest rates. In general, if prevailing interest rates rise, the values of debt securities tend to fall, and if interest rates fall, the values of debt securities tend to rise. Actions by governments and central banking authorities can result in increases in interest rates. Increasing interest rates may negatively affect the value of debt securities held by the Fund, resulting in a negative impact on the Fund's performance and net asset value per share. In general, the longer the maturity or duration of a debt security, the greater its sensitivity to changes in interest rates.
Liquidity Risk
Liquidity risk is the risk associated with a lack of marketability of investments which may make it difficult to sell the investment at a desirable time or price. Changing regulatory, market or other conditions or environments (for example, the interest rate or credit environments) may adversely affect the liquidity of the Fund's investments. The Fund may have to accept a lower selling price for the holding, sell other investments, or forego another, more appealing investment opportunity. Generally, the less liquid the market at the time the Fund sells a portfolio investment, the greater the risk of loss or decline of value to the Fund. A less liquid market can lead to an increase in Fund redemptions, which may negatively impact Fund performance and net asset value per share, including, for example, if the Fund is forced to sell securities in a down market.
Mortgage- and Other Asset-Backed Securities Risk
The value of any mortgage-backed and other asset-backed securities held by the Fund may be affected by, among other things, changes or perceived changes in: interest rates; factors concerning the interests in and structure of the issuer or the originator of the mortgages or other assets; the creditworthiness of the entities that provide any supporting letters of credit, surety bonds or other credit enhancements; or the market's assessment of the quality of underlying assets. Payment of principal and interest on some mortgage-backed securities (but not the market value of the securities themselves) may be guaranteed by the full faith and credit of a particular U.S. Government agency, authority, enterprise or instrumentality, and some, but not all, are also insured or
guaranteed by the U.S. Government. Mortgage-backed securities issued by non-governmental issuers (such as commercial banks, savings and loan institutions, private mortgage insurance companies, mortgage bankers and other secondary market issuers) may entail greater risk than obligations guaranteed by the U.S. Government. Mortgage- and other asset-backed securities are subject to prepayment risk, which is the possibility that the underlying mortgage or other asset may be refinanced or prepaid prior to maturity during periods of declining or low interest rates, causing the Fund to have to reinvest the money received in securities that have lower yields. Rising or high interest rates tend to extend the duration of mortgage- and other asset-backed securities, making their prices more volatile and more sensitive to changes in interest rates.
Note 9. Subsequent Events
Management has evaluated the events and transactions that have occurred through the date the financial statements were issued and noted no items requiring adjustment of the financial statements or additional disclosure.
Note 10. Information Regarding Pending and Settled Legal Proceedings
In December 2005, without admitting or denying the allegations, American Express Financial Corporation (AEFC, which is now known as Ameriprise Financial, Inc. (Ameriprise Financial)) entered into settlement agreements with the Securities and Exchange Commission (SEC) and Minnesota Department of Commerce (MDOC) related to market timing activities. As a result, AEFC was censured and ordered to cease and desist from committing or causing any violations of certain provisions of the Investment Advisers Act of 1940, the Investment Company Act of 1940, and various Minnesota laws. AEFC agreed to pay disgorgement of $10 million and civil money penalties of $7 million. AEFC also agreed to retain an independent distribution consultant to assist in developing a plan for distribution of all disgorgement and civil penalties ordered by the SEC in accordance with various undertakings detailed at http://www.sec.gov/litigation/admin/ia-2451.pdf. Ameriprise Financial and its affiliates have cooperated with the SEC and the MDOC in these legal proceedings, and have made regular reports to the Funds' Boards of Trustees.
Ameriprise Financial and certain of its affiliates have historically been involved in a number of legal, arbitration
Annual Report 2016
52
NOTES TO FINANCIAL STATEMENTS (continued)
April 30, 2016
and regulatory proceedings, including routine litigation, class actions, and governmental actions, concerning matters arising in connection with the conduct of their business activities. Ameriprise Financial believes that the Funds are not currently the subject of, and that neither Ameriprise Financial nor any of its affiliates are the subject of, any pending legal, arbitration or regulatory proceedings that are likely to have a material adverse effect on the Funds or the ability of Ameriprise Financial or its affiliates to perform under their contracts with the Funds. Ameriprise Financial is required to make quarterly (10-Q), annual (10-K) and, as necessary, 8-K filings with the SEC on legal and regulatory matters that relate to Ameriprise Financial and its affiliates. Copies of these filings may be obtained by accessing the SEC website at www.sec.gov.
There can be no assurance that these matters, or the adverse publicity associated with them, will not result in increased fund redemptions, reduced sale of fund shares or other adverse consequences to the Funds. Further, although we believe proceedings are not likely to have a material adverse effect on the Funds or the ability of Ameriprise Financial or its affiliates to perform under their contracts with the Funds, these proceedings are subject to uncertainties and, as such, we are unable to estimate the possible loss or range of loss that may result. An adverse outcome in one or more of these proceedings could result in adverse judgments, settlements, fines, penalties or other relief that could have a material adverse effect on the consolidated financial condition or results of operations of Ameriprise Financial.
Annual Report 2016
53
REPORT OF INDEPENDENT REGISTERED PUBLIC ACCOUNTING FIRM
To the Trustees of Columbia Funds Series Trust I and the Shareholders of
Columbia Bond Fund
In our opinion, the accompanying statement of assets and liabilities, including the portfolio of investments, and the related statements of operations and of changes in net assets and the financial highlights present fairly, in all material respects, the financial position of Columbia Bond Fund (the "Fund", a series of Columbia Funds Series Trust I) at April 30, 2016, and the results of its operations, the changes in its net assets and the financial highlights for each of the periods indicated, in conformity with accounting principles generally accepted in the United States of America. These financial statements and financial highlights (hereafter referred to as "financial statements") are the responsibility of the Fund's management. Our responsibility is to express an opinion on these financial statements based on our audits. We conducted our audits of these financial statements in accordance with the standards of the Public Company Accounting Oversight Board (United States). Those standards require that we plan and perform the audit to obtain reasonable assurance about whether the financial statements are free of material misstatement. An audit includes examining, on a test basis, evidence supporting the amounts and disclosures in the financial statements, assessing the accounting principles used and significant estimates made by management, and evaluating the overall financial statement presentation. We believe that our audits, which included confirmation of securities at April 30, 2016 by correspondence with the custodian, brokers and transfer agent, and the application of alternative auditing procedures where such confirmations had not been received, provide a reasonable basis for our opinion.
PricewaterhouseCoopers LLP
Minneapolis, MN
June 21, 2016
Annual Report 2016
54
FEDERAL INCOME TAX INFORMATION
(Unaudited)
The Fund hereby designates the following tax attributes for the fiscal year ended April 30, 2016. Shareholders will be notified in early 2017 of the amounts for use in preparing 2016 income tax returns.
Tax Designations:
Capital Gain Dividend | | $ | 6,466,377 | | |
Capital Gain Dividend. The Fund designates as a capital gain dividend the amount reflected above, or if subsequently determined to be different, the net capital gain of such fiscal period.
Annual Report 2016
55
Shareholders elect the Board that oversees the Fund's operations. The Board appoints officers who are responsible for day-to-day business decisions based on policies set by the Board. The following table provides basic biographical information about the Fund's Trustees, including their principal occupations during the past five years, although specific titles for individuals may have varied over the period. The year set forth beneath Length of Service in the table below is the year in which the Trustee was first appointed or elected as Trustee to any Fund currently in the Columbia Funds Complex or a predecessor thereof. Under current Board policy, members serve terms of indefinite duration.
Trustees
Independent Trustees
Name,
Address,
Year of Birth | | Position Held With
the Funds and Length of
Service | | Principal Occupation(s)
During the Past Five Years
and Other Relevant
Professional Experience | | Number of
Funds in the
Columbia Funds
Complex
Overseen | | Other Directorships
Held by Trustee During
the Past Five Years | |
Janet Langford Carrig
c/o Columbia
Management Investment Advisers, LLC,
225 Franklin Street
Mail Drop BX32 05228,
Boston, MA 02110
1957 | | Trustee 1996 | | Senior Vice President, General Counsel and Corporate Secretary, ConocoPhillips (integrated energy company) since September 2007 | | | 58 | | | None | |
Douglas A. Hacker
c/o Columbia Management Investment Advisers, LLC,
225 Franklin Street
Mail Drop BX32 05228,
Boston, MA 02110
1955 | | Trustee and Chairman of the Board 1996 | | Independent business executive since May 2006; Executive Vice President — Strategy of United Airlines from December 2002 to May 2006; President of UAL Loyalty Services (airline marketing company) from September 2001 to December 2002; Executive Vice President and Chief Financial Officer of United Airlines from July 1999 to September 2001 | | | 58 | | | Spartan Nash Company (food distributor); Nash Finch Company (food distributor) from 2005 to 2013; Aircastle Limited (aircraft leasing); SeaCube Container Leasing Ltd. (container leasing) from 2010 to 2013; and Travelport Worldwide Limited (travel information technology) | |
Nancy T. Lukitsh
c/o Columbia Management Investment Advisers, LLC,
225 Franklin Street
Mail Drop BX32 05228,
Boston, MA 02110
1956 | | Trustee 2011 | | Senior Vice President, Partner and Director of Marketing, Wellington Management Company, LLP (investment adviser) from 1997 to 2010; Chair, Wellington Management Portfolios (commingled non-U.S. investment pools) from 2007 to 2010; Director, Wellington Trust Company, NA and other Wellington affiliates from 1997 to 2010 | | | 58 | | | None | |
Annual Report 2016
56
TRUSTEES AND OFFICERS (continued)
Independent Trustees (continued)
Name,
Address,
Year of Birth | | Position Held With
the Funds and Length of
Service | | Principal Occupation(s)
During the Past Five Years
and Other Relevant
Professional Experience | | Number of
Funds in the
Columbia Funds
Complex
Overseen | | Other Directorships
Held by Trustee During
the Past Five Years | |
William E. Mayer
c/o Columbia Management Investment Advisers, LLC,
225 Franklin Street
Mail Drop BX32 05228,
Boston, MA 02110
1940 | | Trustee 1991 | | Partner, Park Avenue Equity Partners (private equity) since February 1999 | | | 58 | | | DynaVox Inc. (speech creation); Lee Enterprises (print media); WR Hambrecht + Co. (financial service provider) from 2000 to 2012; BlackRock Capital Investment Corporation (investment company); and Premier, Inc. (healthcare) | |
David M. Moffett
c/o Columbia Management Investment Advisers, LLC,
225 Franklin Street
Mail Drop BX32 05228,
Boston, MA 02110
1952 | | Trustee 2011 | | Retired. Consultant to Bridgewater and Associates | | | 58 | | | Director of CIT Bank, CIT Group Inc. (commercial and consumer finance); eBay Inc. (online trading community); Genworth Financial, Inc. (financial and insurance products and services); Paypal Holdings Inc. (payment and data processing services); and Trustee University of Oklahoma Foundation | |
Charles R. Nelson
c/o Columbia Management Investment Advisers, LLC,
225 Franklin Street
Mail Drop BX32 05228,
Boston, MA 02110
1942 | | Trustee 1981 | | Retired. Professor Emeritus, University of Washington since 2011; Professor of Economics, University of Washington from 1976 to 2011; Ford and Louisa Van Voorhis Professor of Political Economy, University of Washington from 1993 to 2011; Adjunct Professor of Statistics, University of Washington from 1980 to 2011; Associate Editor, Journal of Money, Credit and Banking from September 1993 to 2008; consultant on econometric and statistical matters | | | 58 | | | None | |
John J. Neuhauser
c/o Columbia Management Investment Advisers, LLC,
225 Franklin Street
Mail Drop BX32 05228,
Boston, MA 02110
1943 | | Trustee 1984 | | President, Saint Michael's College since August 2007; Director or Trustee of several non-profit organizations, including University of Vermont Medical Center; Academic Vice President and Dean of Faculties, Boston College from August 1999 to October 2005; University Professor, Boston College from November 2005 to August 2007 | | | 58 | | | Liberty All-Star Equity Fund and Liberty All-Star Growth Fund (closed-end funds) | |
Annual Report 2016
57
TRUSTEES AND OFFICERS (continued)
Independent Trustees (continued)
Name,
Address,
Year of Birth | | Position Held With
the Funds and Length of
Service | | Principal Occupation(s)
During the Past Five Years
and Other Relevant
Professional Experience | | Number of
Funds in the
Columbia Funds
Complex
Overseen | | Other Directorships
Held by Trustee During
the Past Five Years | |
Patrick J. Simpson
c/o Columbia Management Investment Advisers, LLC,
225 Franklin Street
Mail Drop BX32 05228,
Boston, MA 02110
1944 | | Trustee 2000 | | Of Counsel, Perkins Coie LLP (law firm) since 2015; Partner, Perkins Coie LLP from 1988 to 2014 | | | 58 | | | None | |
Anne-Lee Verville
c/o Columbia Management Investment Advisers, LLC,
225 Franklin Street
Mail Drop BX32 05228,
Boston, MA 02110
1945 | | Trustee 1998 | | Retired. General Manager, Global Education Industry from 1994 to 1997, President — Application Systems Division from 1991 to 1994, Chief Financial Officer — US Marketing & Services from 1988 to 1991, and Chief Information Officer from 1987 to 1988, IBM Corporation (computer and technology) | | | 58 | | | Enesco Group, Inc. (producer of giftware and home and garden decor products) from 2001 to 2006 | |
Annual Report 2016
58
TRUSTEES AND OFFICERS (continued)
Interested Trustee Affiliated with Investment Manager*
Name,
Address,
Year of Birth | | Position Held With
the Funds and Length of
Service | | Principal Occupation(s)
During the Past Five Years
and Other Relevant
Professional Experience | | Number of
Funds in the
Columbia Funds
Complex
Overseen | | Other Directorships
Held by Trustee During
the Past Five Years | |
William F. Truscott
c/o Columbia Management Investment Advisers, LLC,
225 Franklin Street
Boston, MA 02110
1960 | | Trustee 2012 | | Chairman of the Board and President, Columbia Management Investment Advisers, LLC since May 2010 and February 2012, respectively (previously President and Chief Investment Officer, 2001-April 2010); Chief Executive Officer, Global Asset Management, Ameriprise Financial, Inc. since September 2012 (previously Chief Executive Officer, U.S. Asset Management & President, Annuities, May 2010- September 2012 and President — U.S. Asset Management and Chief Investment Officer, 2005-April 2010); Director and Chief Executive Officer, Columbia Management Investment Distributors, Inc. since May 2010 and February 2012, respectively (previously Chairman of the Board and Chief Executive Officer, 2006-April 2010); Chairman of the Board and Chief Executive Officer, RiverSource Distributors, Inc. since 2006; Director, Threadneedle Asset Management Holdings, SARL since 2014; President and Chief Executive Officer, Ameriprise Certificate Company, 2006-August 2012. | | | 178 | | | Chairman of the Board, Columbia Management Investment Advisers, LLC since May 2010; Director, Columbia Management Investment Distributors, Inc. since May 2010; Former Director, Ameriprise Certificate Company, 2006-January 2013 | |
* Interested person (as defined under the 1940 Act) by reason of being an officer, director, security holder and/or employee of the Investment Manager or Ameriprise Financial.
The Statement of Additional Information has additional information about the Fund's Board members and is available, without charge, upon request by calling 800.345.6611; contacting your financial intermediary; or visiting columbiathreadneedle.com/us.
Annual Report 2016
59
TRUSTEES AND OFFICERS (continued)
The Board has appointed officers who are responsible for day-to-day business decisions based on policies it has established. The officers serve at the pleasure of the Board. The following table provides basic information about the Officers of the Fund, including principal occupations during the past five years, although their specific titles may have varied over the period. In addition to Mr. Truscott, who is Senior Vice President, the Fund's other officers are:
Fund Officers
Name,
Address and
Year of Birth | | Position and Year
First Appointed to
Position for any Fund
in the Columbia
Funds Complex or a
Predecessor Thereof | |
Principal Occupation(s) During Past Five Years | |
Christopher O. Petersen
5228 Ameriprise Financial Center
Minneapolis, MN 55474
Born 1970 | | President and Principal Executive Officer (2015) | | Vice President and Lead Chief Counsel, Ameriprise Financial, Inc. since January 2015 (previously, Vice President and Chief Counsel January 2010-December 2014; and Vice President and Group Counsel or Counsel 2004-January 2010); officer of Columbia Funds and affiliated funds since 2007. | |
Michael G. Clarke
225 Franklin Street
Boston, MA 02110
Born 1969 | | Treasurer (2011), Chief Financial Officer (2009) and Chief Accounting Officer (2015) | | Vice President — Mutual Fund Administration, Columbia Management Investment Advisers, LLC, since May 2010; Managing Director of Fund Administration, Columbia Management Advisors, LLC, September 2004-April 2010; senior officer of Columbia Funds and affiliated funds since 2002. | |
Paul B. Goucher
100 Park Avenue
New York, NY 10017
Born 1968 | | Senior Vice President (2011), Chief Legal Officer (2015) and Assistant Secretary (2008) | | Vice President and Lead Chief Counsel, Ameriprise Financial, Inc. since November 2008 and January 2013, respectively (previously Chief Counsel, January 2010-January 2013 and Group Counsel, November 2008-January 2010). | |
Thomas P. McGuire
225 Franklin Street
Boston, MA 02110
Born 1972 | | Senior Vice President and Chief Compliance Officer (2012) | | Vice President — Asset Management Compliance, Ameriprise Financial, Inc., since May 2010; Chief Compliance Officer, Ameriprise Certificate Company since September 2010; Compliance Executive, Bank of America, 2005-April 2010. | |
Colin Moore
225 Franklin Street
Boston, MA 02110
Born 1958 | | Senior Vice President (2010) | | Executive Vice President and Global Chief Investment Officer, Ameriprise Financial, Inc., since July 2013; Director and Global Chief Investment Officer, Columbia Management Investment Advisers, LLC since May 2010; Manager, Managing Director and Chief Investment Officer, Columbia Management Advisors, LLC, 2007-April 2010. | |
Michael E. DeFao
225 Franklin Street
Boston, MA 02110
Born 1968 | | Vice President (2011) and Assistant Secretary (2010) | | Vice President and Chief Counsel, Ameriprise Financial, Inc. since May 2010; Associate General Counsel, Bank of America, 2005-April 2010. | |
Amy Johnson
5228 Ameriprise Financial Center
Minneapolis, MN 55474
Born 1965 | | Vice President (2006) | | Managing Director and Chief Operating Officer, Columbia Management Investment Advisers, LLC since May 2010 (previously Chief Administrative Officer, 2009-April 2010, and Vice President — Asset Management and Trust Company Services, 2006-2009). | |
Lyn Kephart-Strong
5228 Ameriprise
Financial Center
Minneapolis, MN 55474
Born 1960 | | Vice President (2015) | | President, Columbia Management Investment Services Corp. since October 2014; Vice President & Resolution Officer, Ameriprise Trust Company since August 2009; President, RiverSource Service Corporation 2004-2010. | |
Ryan C. Larrenaga
225 Franklin Street
Boston, MA 02110
Born 1970 | | Vice President and Secretary (2015) | | Vice President and Group Counsel, Ameriprise Financial, Inc. since August 2011 (previously, Counsel from May 2010 to August 2011); Assistant General Counsel, Bank of America, 2005-April 2010; officer of Columbia Funds and affiliated funds since 2005. | |
Annual Report 2016
60
IMPORTANT INFORMATION ABOUT THIS REPORT
Each fund mails one shareholder report to each shareholder address. If you would like more than one report, please call shareholder services at 800.345.6611 and additional reports will be sent to you.
The policy of the Board is to vote the proxies of the companies in which each fund holds investments consistent with the procedures as stated in the Statement of Additional Information (SAI). You may obtain a copy of the SAI without charge by calling 800.345.6611; contacting your financial intermediary; visiting columbiathreadneedle.com/us; or searching the website of the Securities and Exchange Commission (SEC) at sec.gov. Information regarding how each fund voted proxies relating to portfolio securities is filed with the SEC by August 31st for the most recent 12-month period ending June 30th of that year, and is available without charge by visiting columbiathreadneedle.com/us, or searching the website of the SEC at sec.gov.
Each fund files a complete schedule of portfolio holdings with the SEC for the first and third quarters of each fiscal year on Form N-Q. Each fund's Form N-Q is available on the SEC's website at sec.gov and may be reviewed and copied at the SEC's Public Reference Room in Washington, D.C. Information on the operation of the Public Reference Room may be obtained by calling 800.SEC.0330. Each fund's complete schedule of portfolio holdings, as filed on Form N-Q, can also be obtained without charge, upon request, by calling 800.345.6611.
Annual Report 2016
61
Columbia Bond Fund
P.O. Box 8081
Boston, MA 02266-8081

This information is for use with concurrent or prior delivery of a fund prospectus. Please read and consider the investment objectives, risks, charges and expenses for any fund carefully before investing. For a prospectus and summary prospectus, which contains this and other important information about the Fund, go to columbiathreadneedle.com/us. The Fund is distributed by Columbia Management Investment Distributors, Inc., member FINRA, and managed by Columbia Management Investment Advisers, LLC.
Columbia Threadneedle Investments (Columbia Threadneedle) is the global brand name of the Columbia and Threadneedle group of companies.
All rights reserved. Columbia Management Investment Distributors, Inc., 225 Franklin Street, Boston, MA 02110-2804
© 2016 Columbia Management Investment Advisers, LLC.
columbiathreadneedle.com/us
ANN121_04_F01_(06/16)

ANNUAL REPORT
April 30, 2016

COLUMBIA TOTAL RETURN BOND FUND
(formerly Columbia Intermediate Bond Fund)

ABOUT COLUMBIA THREADNEEDLE INVESTMENTS
Columbia Threadneedle Investments is a leading global asset management group that provides a broad range of actively managed investment strategies and solutions for individual, institutional and corporate clients around the world.
With more than 2,000 people, including over 450 investment professionals based in North America, Europe and Asia, we manage $464 billion* of assets across developed and emerging market equities, fixed income, asset allocation solutions and alternatives. We are the 13th largest manager of long-term mutual fund assets in the U.S.** and the 3rd largest manager of retail funds in the U.K.***
Our priority is the investment success of our clients. We aim to deliver the investment outcomes they expect through an investment approach that is team-based, performance-driven and risk-aware. Our culture is dynamic and interactive. By sharing our insights across asset classes and geographies, we generate richer perspectives on global, regional and local investment landscapes. The ability to exchange and debate investment ideas in a collaborative environment enriches our teams' investment processes. More importantly, it results in better informed investment decisions for our clients.
Columbia funds are distributed by Columbia Management Investment Distributors, Inc., member FINRA, and managed by Columbia Management Investment Advisers, LLC.
Columbia Threadneedle Investments (Columbia Threadneedle) is the global brand name of the Columbia and Threadneedle group of companies.
* In U.S. dollars as of March 31, 2016. Source: Ameriprise Q1 Earnings Release. Includes all assets managed by entities in the Columbia and Threadneedle group of companies. Contact us for more current data.
** Source: ICI as of March 31, 2016 for Columbia Management Investment Advisers, LLC.
*** Source: Investment Association as of December 2015 for Threadneedle Asset Management Limited.
© 2016 Columbia Management Investment Advisers, LLC. All rights reserved.
Not part of the shareholder report
Investment strategies to help meet investor needs
We are committed to helping investors navigate financial challenges to reach their desired outcomes. The possibilities are endless.
Your success is our priority.
Retire comfortably
Fund college or higher education
Leave a legacy
Generate an appropriate stream of income in retirement
Traditional approaches to income may no longer be adequate — and they may no longer provide the diversification benefits they once did. Investors need to rethink how they generate retirement income.
Worried about running out of income? You are not alone.
Navigate a changing interest rate environment
Even in today's challenging interest rate environment, it's still possible to navigate markets and achieve your goals.
Make investment choices designed specifically for this market environment.
Maximize after-tax returns
In an environment where what you keep is more important than what you earn, municipal bonds can help mitigate higher taxes while providing attractive yields compared to other investment options.
You've worked too hard building your wealth to lose it to taxes.
Grow assets to achieve financial goals
Finding growth opportunities in today's complex market environment requires strong research capabilities, creative thinking and a disciplined approach.
Do your investments deliver the portfolio growth you need?
Ease the impact of volatile markets
With increasing concerns about market volatility, investors should consider diversifying their portfolios with non-traditional holdings.
Interested in turning volatility into opportunity?
To find out more, contact your financial professional, call 800.426.3750 or visit columbiathreadneedle.com/us
Not part of the shareholder report
Get the market insight you need from our investment experts and subscribe to our latest publications


Stay informed with Columbia Threadneedle Investments
Investor insight
Find economic and market commentary, investment videos, white papers, mutual fund commentary and more at columbiathreadneedle.com/us.
Subscribe to the latest information from Columbia Threadneedle. Register your information online at columbiathreadneedle.com/us/subscribe and select the publications you would like to receive, including:
n Columbia Threadneedle Investor Newsletter, highlighting the latest macro- and micro-economic trends, investment themes, products, service changes and other items of interest to our investors
n Investment Strategy Outlook, showcasing the Columbia Threadneedle Asset Allocation Team's perspective on global economic investment conditions and markets
n MarketTrack, featuring straightforward insight on current investment opportunities
n White papers that delve deep into a variety of investment topics
n Quarterly portfolio manager commentary and fund fact sheets
Update your subscriptions at any time by accessing the email subscription center.
Social media 
We offer you multiple ways to access our market commentary and investment insights.
n Perspectives blog at columbiathreadneedle.com/us
Read timely posts by our investment team, including our chief investment officer, chief economist and portfolio managers.
n Twitter.com/CTinvest_US
Follow us on Twitter for quick, up-to-the-minute comments on market news and more.
n Youtube.com/CTInvestUS
View our commentaries on the economy, markets and current investment opportunities.
n Linkedin.com/company/Columbia-Threadneedle-Investments-US
Connect with us on LinkedIn for updates from our thought leaders.
Not part of the shareholder report
 Dear Shareholders,
Volatility comes with the territory for long-term investors. Some investors instinctively want to pull out of the market or sell underperforming investments at the first sign of increased volatility or perhaps even as soon as they perceive it on the horizon. But taking yourself out of the market could mean losing out on potential opportunities, and putting your longer-term investment goals at risk.
Cumulative return is not just about achieving high returns when markets are going up; it's also about remaining invested and minimizing losses during weak or volatile markets so that you can participate on the upside. Developing a deeper understanding of the various risks your portfolio is subject to can help you balance these risks.
Diversification is critical in seeking to achieve that balance. We believe that most portfolios could be more effectively diversified either by introducing holdings with performance profiles unrelated to existing holdings (like alternative products) or by rebalancing existing holdings with an eye toward risk allocation. Over time, distributing risk more evenly may produce a more pronounced diversification benefit and may improve portfolio efficiency. We believe market volatility can create significant opportunities and, in fact, these periods may be some of the very best times to invest.
With this in mind, I thought it important to highlight excerpts from a piece written by Colin Moore, Global Chief Investment Officer, in which he touches on some of these issues emphasizing the importance of a properly constructed portfolio in seeking to effectively manage volatility and to achieve consistency of returns. I encourage you to read the article in its entirety. To access the full article and for other insights on current market, please visit blog.columbiathreadneedleus.com/latest-perspectives.
You need investments that are designed to help you ease the impact of volatile market environments and keep the savings you have worked tirelessly to amass. Columbia Threadneedle Investments provides investment solutions to help you tackle financial challenges and achieve your desired outcome.
Best regards,

Christopher O. Petersen
President, Columbia Funds
Excerpts from:
Taking the scare out of the volatility bogeyman
By Colin Moore, Global Chief Investment Officer
Colin Moore is the global chief investment officer for Columbia Threadneedle Investments. His responsibilities include ensuring that a disciplined investment process is in place across all asset classes, including equity and fixed income. Mr. Moore joined one of the Columbia Threadneedle Investments legacy firms in 2002 as head of equity and was also head of fixed income and liquidity strategies from 2009 – 2010.

n In today's low growth, higher volatility world, the emphasis is shifting from maximization of returns to consistency of returns.
PRESIDENT'S MESSAGE (continued)
n Portfolios should represent the behavioral risk-return tradeoff of investors, remembering that they won't stay invested to realize the return if we get the risk tolerance wrong.
n Holding long-term savings in cash to avoid volatility (the financial equivalent of hiding under the sheets) is detrimental to achieving long-term goals.
According to Wikipedia, "The bogeyman is a common allusion to a mythical creature in many cultures used to control behavior. This monster has no specific appearance, and conceptions about it can vary drastically from household to household within the same community; in many cases he has no set appearance in the mind of an adult or child, but is simply a non-specific embodiment of terror." Different cultures have different names and physical representations for the bogeyman, and investors are no different. We have terrible monsters that we fear may destroy our portfolios, and we call one of the scariest of them volatility.
While the bogeyman is mythical (I hope!), volatility is real and can cause serious damage. To understand why investors have such a hard time coping with volatility, we first need to define three cognitive biases at work in today's investment environment:
1) Recency bias — something that has recently come to the forefront of our attention, regardless of how long established it is, suddenly seems to appear with improbable frequency.
2) Negativity bias — we tend to have a greater recall of unpleasant memories than positive memories.
3) Loss aversion — our dissatisfaction with losing money tends to be greater than our satisfaction with making money.
The level of volatility varies dramatically, and so does investor fear and panic selling — waxing when volatility rises, waning when it falls. Recent studies have pointed to demographics as an important driver of panic selling. The theory is that as people get closer to retirement, the prospects of a large (20% – 30%) loss in financial assets can have a much more pronounced effect on their sense of well-being. Wealth preservation instincts kick in much more quickly than for younger (and typically less wealthy) savers.
The reality is that there is little opportunity for return without volatility. Therefore, the bogeyman effect of holding long-term savings in cash to avoid volatility (the financial equivalent of hiding under the sheets) is detrimental to achieving long-term goals. This effect tends to be more pronounced during the episodic spikes in volatility. The significant spike in volatility in 2008 and 2009 led to significant withdrawals from long-term investment funds over the same period. Less pronounced effects can also be seen when comparing 2001 – 2003 and 2011 – 2012. Conversely, flows picked up when volatility returned to "normal" levels. Investor behavior of this type is consistent with the three behavioral biases.
I believe average volatility will be higher over the next 10 years than the last 10 years and episodic spikes will increase in frequency because sustainable economic growth will be structurally lower and geopolitical risk higher than any time since World War II. Low growth creates uncertainty while loss aversion will make investors fear that we are one economic mishap or geopolitical event away from no growth or recession. The result will be higher volatility on average. Negativity bias will tend to exacerbate "spike" reactions to event-driven geopolitical news, and the volatility bogeyman will appear more often. Assuming the behavioral biases continue, investor returns are likely to be very disappointing regardless of the total return generated by financial markets due to the bogeyman effect.
To mitigate this effect, we need to focus on portfolio construction and an improved understanding of diversification. I accept that equities are likely to offer the highest return over the next 10 years, but they also offer the highest volatility. Many portfolio construction optimization tools use historical average volatility, which is likely to underestimate the volatility investors will face. The bogeyman emerges when individual asset class volatility spikes and cross correlations rise, the combination of which increases overall portfolio volatility far beyond expectation. Diversification is meant to protect investors against volatility, but what's the point of owning lots of investments if the volatility bogeyman has not been properly estimated?
Most importantly, portfolios should be constructed to properly represent the behavioral risk-return tradeoff of investors, remembering that they won't stay invested to realize the return if we get the risk tolerance wrong. In a low growth, higher volatility world, the emphasis is shifting to return consistency rather than return maximization,
PRESIDENT'S MESSAGE (continued)
and investors are best served through investment approaches that appreciate that distinction. Even though it's a permanent feature of financial markets, volatility is less likely to be the bogeyman we all fear if portfolios are constructed with this understanding.
Please visit blog.columbiathreadneedleus.com/latest-perspectives to read the entire article.
Investors should consider the investment objectives, risks, charges and expenses of a mutual fund carefully before investing. For a free prospectus and summary prospectus, which contains this and other important information about a fund, visit columbiathreadneedle.com/us. The prospectus should be read carefully before investing.
The views expressed are as of April 2016, may change as market or other conditions change, and may differ from views expressed by other Columbia Management Investment Advisers, LLC (CMIA) associates or affiliates. Actual investments or investment decisions made by CMIA and its affiliates, whether for its own account or on behalf of clients, will not necessarily reflect the views expressed. This information is not intended to provide investment advice and does not account for individual investor circumstances. Investment decisions should always be made based on an investor's specific financial needs, objectives, goals, time horizon and risk tolerance. Asset classes described may not be suitable for all investors.
Past performance does not guarantee future results, and no forecast should be considered a guarantee either. Since economic and market conditions change frequently, there can be no assurance that the trends described here will continue or that the forecasts are accurate.
Diversification does not guarantee a profit or protect against loss.
Columbia Funds are distributed by Columbia Management Investment Distributors, Inc., member FINRA, and managed by Columbia Management Investment Advisers, LLC.
© 2016 Columbia Management Investment Advisers, LLC. All rights reserved
COLUMBIA TOTAL RETURN BOND FUND
Fund Investment Manager
Columbia Management Investment
Advisers, LLC
225 Franklin Street
Boston, MA 02110
Fund Distributor
Columbia Management Investment
Distributors, Inc.
225 Franklin Street
Boston, MA 02110
Fund Transfer Agent
Columbia Management Investment
Services Corp.
P.O. Box 8081
Boston, MA 02266-8081
For more information about any of the funds, please visit columbiathreadneedle.com/us or call 800.345.6611. Customer Service Representatives are available to answer your questions Monday through Friday from 8 a.m. to 7 p.m. Eastern time.
The views expressed in this report reflect the current views of the respective parties. These views are not guarantees of future performance and involve certain risks, uncertainties and assumptions that are difficult to predict, so actual outcomes and results may differ significantly from the views expressed. These views are subject to change at any time based upon economic, market or other conditions and the respective parties disclaim any responsibility to update such views. These views may not be relied on as investment advice and, because investment decisions for a Columbia fund are based on numerous factors, may not be relied on as an indication of trading intent on behalf of any particular Columbia fund. References to specific securities should not be construed as a recommendation or investment advice.
Performance Overview | | | 3 | | |
Manager Discussion of Fund Performance | | | 5 | | |
Understanding Your Fund's Expenses | | | 8 | | |
Portfolio of Investments | | | 9 | | |
Statement of Assets and Liabilities | | | 43 | | |
Statement of Operations | | | 46 | | |
Statement of Changes in Net Assets | | | 47 | | |
Financial Highlights | | | 50 | | |
Notes to Financial Statements | | | 61 | | |
Report of Independent Registered Public Accounting Firm | | | 78 | | |
Federal Income Tax Information | | | 79 | | |
Trustees and Officers | | | 80 | | |
Important Information About This Report | | | 85 | | |
COLUMBIA TOTAL RETURN BOND FUND
Performance Summary
n Columbia Total Return Bond Fund (the Fund) Class A shares returned 2.58% excluding sales charges for the 12-month period that ended April 30, 2016.
n During the same 12-month period, the Fund slightly underperformed its benchmark, the Barclays U.S. Aggregate Bond Index, which returned 2.72%.
n The Fund's performance was helped by security selection within investment-grade credits, while a modest allocation to high-yield issues detracted.
Average Annual Total Returns (%) (for period ended April 30, 2016)
| | | Inception | | 1 Year | | 5 Years | | 10 Years | |
Class A | | 07/31/00 | | | | | | | | | | | |
Excluding sales charges | | | | | | | 2.58 | | | | 3.47 | | | | 4.83 | | |
Including sales charges | | | | | | | -0.54 | | | | 2.85 | | | | 4.51 | | |
Class B | | 02/01/02 | | | | | | | | | | | | | |
Excluding sales charges | | | | | | | 1.70 | | | | 2.68 | | | | 4.04 | | |
Including sales charges | | | | | | | -1.28 | | | | 2.68 | | | | 4.04 | | |
Class C | | 02/01/02 | | | | | | | | | | | | | |
Excluding sales charges | | | | | | | 1.81 | | | | 2.82 | | | | 4.19 | | |
Including sales charges | | | | | | | 0.82 | | | | 2.82 | | | | 4.19 | | |
Class I* | | 09/27/10 | | | 2.96 | | | | 3.86 | | | | 5.17 | | |
Class K* | | 02/28/13 | | | 2.54 | | | | 3.54 | | | | 4.88 | | |
Class R | | 01/23/06 | | | 2.21 | | | | 3.22 | | | | 4.57 | | |
Class R4* | | 11/08/12 | | | 2.72 | | | | 3.71 | | | | 5.08 | | |
Class R5* | | 11/08/12 | | | 2.80 | | | | 3.76 | | | | 5.11 | | |
Class W* | | 09/27/10 | | | 2.58 | | | | 3.49 | | | | 4.87 | | |
Class Y* | | 11/08/12 | | | 2.85 | | | | 3.81 | | | | 5.13 | | |
Class Z | | 12/05/78 | | | 2.72 | | | | 3.73 | | | | 5.09 | | |
Barclays U.S. Aggregate Bond Index | | | | | | | 2.72 | | | | 3.60 | | | | 4.95 | | |
Returns for Class A are shown with and without the maximum initial sales charge of 3.00%. Returns for Class B are shown with and without the applicable contingent deferred sales charge (CDSC) of 3.00% in the first year, declining to 1.00% in the fourth year and eliminated thereafter. Returns for Class C are shown with and without the 1.00% CDSC for the first year only. The Fund's other classes are not subject to sales charges and have limited eligibility. Please see the Fund's prospectus for details. Performance for different share classes will vary based on differences in sales charges and fees associated with each class. All results shown assume reinvestment of distributions during the period. Returns do not reflect the deduction of taxes that a shareholder may pay on Fund distributions or on the redemption of Fund shares. Performance results reflect the effect of any fee waivers or reimbursements of Fund expenses by Columbia Management Investment Advisers, LLC and/or any of its affiliates. Absent these fee waivers or expense reimbursement arrangements, performance results would have been lower.
The performance information shown represents past performance and is not a guarantee of future results. The investment return and principal value of your investment will fluctuate so that your shares, when redeemed, may be worth more or less than their original cost. Current performance may be lower or higher than the performance information shown. You may obtain performance information current to the most recent month-end by contacting your financial intermediary, visiting columbiathreadneedle.com/us or calling 800.345.6611.
*The returns shown for periods prior to the share class inception date (including returns for the Life of the Fund, if shown, which are since Fund inception) include the returns of the Fund's oldest share class. These returns are adjusted to reflect any higher class-related operating expenses of the newer share classes, as applicable. Please visit columbiathreadneedle.com/us/investment-products/mutual-funds/appended-performance for more information.
The Barclays U.S. Aggregate Bond Index is a broad-based benchmark that measures the investment-grade, U.S. dollar denominated, fixed-rate taxable bond market, including Treasuries, government-related and corporate securities, mortgage-backed securities (agency fixed-rate and hybrid adjustable-rate mortgage passthroughs), asset-backed securities, and commercial mortgage-backed securities.
Indices are not available for investment, are not professionally managed and do not reflect sales charges, fees, brokerage commissions, taxes or other expenses of investing. Securities in the Fund may not match those in an index.
Annual Report 2016
3
COLUMBIA TOTAL RETURN BOND FUND
PERFORMANCE OVERVIEW (continued)
Performance of a Hypothetical $10,000 Investment (May 1, 2006 – April 30, 2016)

The chart above shows the change in value of a hypothetical $10,000 investment in Class A shares of Columbia Total Return Bond Fund during the stated time period, and does not reflect the deduction of taxes that a shareholder may pay on Fund distributions or on the redemption of Fund shares.
Annual Report 2016
4
COLUMBIA TOTAL RETURN BOND FUND
MANAGER DISCUSSION OF FUND PERFORMANCE
Effective February 19, 2016, the Fund's name was changed from Columbia Intermediate Bond Fund to Columbia Total Return Bond Fund.
For the 12-month period that ended April 30, 2016, the Fund's Class A shares returned 2.58% excluding sales charges. The Fund slightly underperformed its benchmark, the Barclays U.S. Aggregate Bond Index, which returned 2.72% for the same period. The most significant contributor to the Fund's relative performance was security selection within investment-grade credits, while a modest allocation to high-yield issues detracted.
China Concerns, Oil Declines Impacted Markets
For much of the 12-month period ended April 30, 2016, prices softened for corporate bonds as markets prepared for the U.S. Federal Reserve (the Fed) to end its zero interest rate policy. As the period progressed, credit-oriented assets reacted negatively to slowing China growth, weak demand for oil and other commodities and fears of a domestic recession. Following a brief period of relative stability, December 2015 saw oil prices resume their decline. The beginning of 2016 saw a sharp decline in global credit sentiment as plummeting Chinese stocks triggered trading halts in that market and the price of oil fell to below $30 a barrel. Risk-based assets would remain under pressure through the early part of February 2016. Credit sectors rebounded strongly over the last several weeks of the period, as the Fed signaled that it was prepared to push back the timetable for further rate hikes and central banks overseas engaged in unprecedented measures designed to stimulate growth. A meaningful recovery in oil prices from their January 2016 lows also helped to boost sentiment.
The U.S. Treasury yield curve flattened over the 12-month period ended April 30, 2016, as rates rose modestly on shorter maturities while experiencing declines farther out along the curve. Credit spreads (the incremental yield provided by corporate bonds versus Treasuries) widened for the full period despite their recovery over the last several weeks.
Contributors and Detractors
The Fund's positioning over the period revolved around managing the volatility in interest rates and credit spreads. Performance benefited from being defensively positioned overall entering the period as markets reacted to the prospect of less accommodative Fed policy. Security selection was a positive contributor to performance for the 12 months, particularly within investment-grade credit. Within energy, a tilt toward pipeline-oriented issuers helped to provide a measure of insulation from volatility in crude oil prices. We have had overweight exposure to financials for some time in view of the tighter regulation and higher capital standards being applied to the industry, and this positioning detracted modestly from relative performance as the outlook for prolonged low interest rates was viewed as a negative for banks. The Fund's exposure to high-yield corporates detracted from relative performance for the full period.
Portfolio Management
Carl Pappo, CFA
Brian Lavin, CFA
Jason Callan*
*Effective January 19, 2016, Mr. Callan was named a Portfolio Manager of the Fund. Michael Zazzarino no longer serves as a Portfolio Manager of the Fund.
Portfolio Breakdown (%)
(at April 30, 2016) | |
Asset-Backed Securities —
Agency | | | 1.0 | | |
Asset-Backed Securities —
Non-Agency | | | 14.3 | | |
Commercial Mortgage-Backed
Securities — Non-Agency | | | 5.7 | | |
Common Stocks | | | 0.0 | (a) | |
Corporate Bonds & Notes | | | 44.5 | | |
Foreign Government
Obligations | | | 1.0 | | |
Money Market Funds | | | 0.1 | | |
Municipal Bonds | | | 1.2 | | |
Options Purchased Puts | | | 0.0 | (a) | |
Preferred Debt | | | 1.2 | | |
Residential Mortgage-Backed
Securities — Agency | | | 19.7 | | |
Residential Mortgage-Backed
Securities — Non-Agency | | | 4.2 | | |
Senior Loans | | | 0.1 | | |
U.S. Government & Agency
Obligations | | | 0.6 | | |
U.S. Treasury Obligations | | | 6.4 | | |
Warrants | | | 0.0 | (a) | |
Total | | | 100.0 | | |
Percentages indicated are based upon total investments. The Fund's portfolio composition is subject to change.
(a) Rounds to zero.
Annual Report 2016
5
COLUMBIA TOTAL RETURN BOND FUND
MANAGER DISCUSSION OF FUND PERFORMANCE (continued)
Quality Breakdown (%)
(at April 30, 2016) | |
AAA rating | | | 34.3 | | |
AA rating | | | 3.5 | | |
A rating | | | 10.1 | | |
BBB rating | | | 23.6 | | |
BB rating | | | 7.6 | | |
B rating | | | 5.3 | | |
CCC rating | | | 0.9 | | |
CC rating | | | 0.2 | | |
C rating | | | 0.0 | (a) | |
D rating | | | 0.0 | (a) | |
Not rated | | | 14.5 | | |
Total | | | 100.0 | | |
Percentages indicated are based upon total fixed income investments (excluding Money Market Funds).
(a) Rounds to zero.
Bond ratings apply to the underlying holdings of the Fund and not the Fund itself and are divided into categories ranging from highest to lowest credit quality, determined by using the middle rating of Moody's, S&P and Fitch, after dropping the highest and lowest available ratings. When ratings are available from only two rating agencies, the lower rating is used. When a rating is available from only one rating agency, that rating is used. When a bond is not rated by any rating agency, it is designated as "Not rated." Credit quality ratings assigned by a rating agency are subjective opinions, not statements of fact, and are subject to change, including daily. The ratings assigned by credit rating agencies are but one of the considerations that the Investment Manager and/or Fund's subadviser incorporates into its credit analysis process, along with such other issuer-specific factors as cash flows, capital structure and leverage ratios, ability to de-leverage (repay) through free cash flow, quality of management, market positioning and access to capital, as well as such security-specific factors as the terms of the security (e.g., interest rate and time to maturity) and the amount and type of any collateral.
Turning to structured asset categories, residential mortgage-backed securities (MBS) were underweighted in the portfolio throughout the period. Selection within agency MBS was a positive contributor to relative results, as the Fund shifted its exposure toward current pools that could be purchased at minimal premiums. Non-agency MBS were overweighted when viewed from the perspective of their contribution to the Fund's interest rate sensitivity, and this added to performance as prices in the segment were support by continued light supply. The Fund also had a focus on new issue commercial mortgage-backed securities (CMBS) based on their attractive valuations, funding purchases through the sale of higher quality government-related securities.
For much of the period, the Fund was positioned with a modestly shorter duration (and correspondingly lower sensitivity to interest rates) than the benchmark. Duration was shifted to overweight late in the period. For the full 12 months, the Fund's duration stance detracted slightly from performance relative to the benchmark as long-term interest rates declined. However, the negative impact was largely offset by the Fund's positioning along the Treasury yield curve, which took advantage of the curve's flattening over the period via modest rate increases for maturities three years and below that were accompanied by declining rates on longer maturities.
We invested in highly-liquid, widely-traded Treasury futures and interest rate swap contracts to help manage portfolio duration. These enabled us to efficiently implement our yield curve opinions and offset unintended yield curve impacts from other investments in the portfolio. We also invested in credit default swaps to manage exposure to overall credit risk and individual issuer risk. On a standalone basis, various derivative positions detracted from performance. When viewed in the context of offsetting hedging positions or duration strategies, they performed as intended. The overall impact of derivatives on the portfolio was neutral to slightly positive.
Portfolio Changes
As investment-grade spreads reached relatively attractive levels in late 2015 and early 2016, the Fund increased its credit exposure by adding to both its high-yield and investment-grade corporate allocations. Within the investment-grade category, we increased exposure in early 2016 to the energy sector with a focus on issuers that had been oversold relative to their underlying fundamental credit profile.
Annual Report 2016
6
COLUMBIA TOTAL RETURN BOND FUND
MANAGER DISCUSSION OF FUND PERFORMANCE (continued)
Investment Risks
Market risk may affect a single issuer, sector of the economy, industry or the market as a whole. Fixed-income securities present issuer default risk. A rise in interest rates may result in a price decline of fixed-income instruments held by the Fund, negatively impacting its performance and NAV. Falling rates may result in the Fund investing in lower yielding debt instruments, lowering the Fund's income and yield. These risks may be heightened for longer maturity and duration securities. Prepayment and extension risk exists because a loan, bond or other investment may be called, prepaid or redeemed before maturity and similar yielding investments may not be available for purchase. Non-investment-grade (high-yield or junk) securities present greater price volatility and more risk to principal and income than higher rated securities. Investing in derivatives is a specialized activity that involves special risks that subject the Fund to significant loss potential, including when used as leverage, and may result in greater fluctuation in Fund value. Market or other (e.g., interest rate) environments may adversely affect the liquidity of Fund investments, negatively impacting their price. Generally, the less liquid the market at the time the Fund sells a holding, the greater the risk of loss or decline of value to the Fund. See the Fund's prospectus for more information on these and other risks.
Annual Report 2016
7
COLUMBIA TOTAL RETURN BOND FUND
UNDERSTANDING YOUR FUND'S EXPENSES
(Unaudited)
As an investor, you incur two types of costs. There are transaction costs, which generally include sales charges on purchases and may include redemption fees. There are also ongoing costs, which generally include management fees, distribution and/or service fees, and other fund expenses. The following information is intended to help you understand your ongoing costs (in dollars) of investing in the Fund and to help you compare these costs with the ongoing costs of investing in other mutual funds.
Analyzing Your Fund's Expenses
To illustrate these ongoing costs, we have provided examples and calculated the expenses paid by investors in each share class of the Fund during the period. The actual and hypothetical information in the table is based on an initial investment of $1,000 at the beginning of the period indicated and held for the entire period. Expense information is calculated two ways and each method provides you with different information. The amount listed in the "Actual" column is calculated using the Fund's actual operating expenses and total return for the period. You may use the Actual information, together with the amount invested, to estimate the expenses that you paid over the period. Simply divide your account value by $1,000 (for example, an $8,600 account value divided by $1,000 = 8.6), then multiply the results by the expenses paid during the period under the "Actual" column. The amount listed in the "Hypothetical" column assumes a 5% annual rate of return before expenses (which is not the Fund's actual return) and then applies the Fund's actual expense ratio for the period to the hypothetical return. You should not use the hypothetical account values and expenses to estimate either your actual account balance at the end of the period or the expenses you paid during the period. See "Compare With Other Funds" below for details on how to use the hypothetical data.
Compare With Other Funds
Since all mutual funds are required to include the same hypothetical calculations about expenses in shareholder reports, you can use this information to compare the ongoing cost of investing in the Fund with other funds. To do so, compare the hypothetical example with the 5% hypothetical examples that appear in the shareholder reports of other funds. As you compare hypothetical examples of other funds, it is important to note that hypothetical examples are meant to highlight the ongoing costs of investing in a fund only and do not reflect any transaction costs, such as sales charges, or redemption or exchange fees. Therefore, the hypothetical calculations are useful in comparing ongoing costs only, and will not help you determine the relative total costs of owning different funds. If transaction costs were included in these calculations, your costs would be higher.
November 1, 2015 – April 30, 2016
| | | Account Value at the Beginning
of the Period ($) | | Account Value at the End of the
Period ($) | | Expenses Paid During the
Period ($) | | Fund's Annualized
Expense Ratio (%) | |
| | | Actual | | Hypothetical | | Actual | | Hypothetical | | Actual | | Hypothetical | | Actual | |
Class A | | | 1,000.00 | | | | 1,000.00 | | | | 1,031.20 | | | | 1,020.59 | | | | 4.34 | | | | 4.32 | | | | 0.86 | | |
Class B | | | 1,000.00 | | | | 1,000.00 | | | | 1,026.20 | | | | 1,016.86 | | | | 8.11 | | | | 8.07 | | | | 1.61 | | |
Class C | | | 1,000.00 | | | | 1,000.00 | | | | 1,027.30 | | | | 1,016.86 | | | | 8.12 | | | | 8.07 | | | | 1.61 | | |
Class I | | | 1,000.00 | | | | 1,000.00 | | | | 1,033.00 | | | | 1,022.43 | | | | 2.48 | | | | 2.46 | | | | 0.49 | | |
Class K | | | 1,000.00 | | | | 1,000.00 | | | | 1,030.40 | | | | 1,020.93 | | | | 3.99 | | | | 3.97 | | | | 0.79 | | |
Class R | | | 1,000.00 | | | | 1,000.00 | | | | 1,029.90 | | | | 1,019.34 | | | | 5.60 | | | | 5.57 | | | | 1.11 | | |
Class R4 | | | 1,000.00 | | | | 1,000.00 | | | | 1,031.30 | | | | 1,021.83 | | | | 3.08 | | | | 3.07 | | | | 0.61 | | |
Class R5 | | | 1,000.00 | | | | 1,000.00 | | | | 1,031.70 | | | | 1,022.18 | | | | 2.73 | | | | 2.72 | | | | 0.54 | | |
Class W | | | 1,000.00 | | | | 1,000.00 | | | | 1,031.10 | | | | 1,020.59 | | | | 4.34 | | | | 4.32 | | | | 0.86 | | |
Class Y | | | 1,000.00 | | | | 1,000.00 | | | | 1,031.90 | | | | 1,022.43 | | | | 2.48 | | | | 2.46 | | | | 0.49 | | |
Class Z | | | 1,000.00 | | | | 1,000.00 | | | | 1,032.40 | | | | 1,021.83 | | | | 3.08 | | | | 3.07 | | | | 0.61 | | |
Expenses paid during the period are equal to the annualized expense ratio for each class as indicated above, multiplied by the average account value over the period and then multiplied by the number of days in the Fund's most recent fiscal half year and divided by 366.
Expenses do not include fees and expenses incurred indirectly by the Fund from its investment in underlying funds, including affiliated and non-affiliated pooled investment vehicles, such as mutual funds and exchange-traded funds.
Had Columbia Management Investment Advisers, LLC and/or certain of its affiliates not waived/reimbursed certain fees and expenses, account value at the end of the period would have been reduced.
Annual Report 2016
8
COLUMBIA TOTAL RETURN BOND FUND
PORTFOLIO OF INVESTMENTS
April 30, 2016
(Percentages represent value of investments compared to net assets)
Corporate Bonds & Notes 49.4%
Issuer | | Coupon
Rate | | Principal
Amount ($) | |
Value ($) | |
AEROSPACE & DEFENSE 0.5% | |
Huntington Ingalls Industries, Inc.(a)
12/15/21 | | | 5.000 | % | | | 940,000 | | | | 985,242 | | |
11/15/25 | | | 5.000 | % | | | 815,000 | | | | 856,769 | | |
Lockheed Martin Corp.
01/15/23 | | | 3.100 | % | | | 2,754,000 | | | | 2,886,258 | | |
05/15/36 | | | 4.500 | % | | | 4,112,000 | | | | 4,563,436 | | |
05/15/46 | | | 4.700 | % | | | 2,700,000 | | | | 3,104,582 | | |
TransDigm, Inc.
07/15/22 | | | 6.000 | % | | | 387,000 | | | | 391,721 | | |
07/15/24 | | | 6.500 | % | | | 1,154,000 | | | | 1,162,655 | | |
05/15/25 | | | 6.500 | % | | | 414,000 | | | | 416,070 | | |
Total | | | | | | | 14,366,733 | | |
AUTOMOTIVE 1.0% | |
American Axle & Manufacturing, Inc.
02/15/19 | | | 5.125 | % | | | 217,000 | | | | 222,968 | | |
Ford Motor Co.
02/01/29 | | | 6.375 | % | | | 2,340,000 | | | | 2,782,066 | | |
General Motors Co.
04/01/35 | | | 5.000 | % | | | 4,035,000 | | | | 4,033,757 | | |
04/01/36 | | | 6.600 | % | | | 4,387,000 | | | | 5,133,360 | | |
04/01/45 | | | 5.200 | % | | | 5,704,000 | | | | 5,695,193 | | |
04/01/46 | | | 6.750 | % | | | 8,685,000 | | | | 10,480,832 | | |
Schaeffler Finance BV(a)
05/15/21 | | | 4.250 | % | | | 300,000 | | | | 308,250 | | |
05/15/21 | | | 4.750 | % | | | 1,710,000 | | | | 1,757,025 | | |
Schaeffler Holding Finance BV
PIK(a)
11/15/19 | | | 6.250 | % | | | 521,000 | | | | 543,143 | | |
ZF North America Capital, Inc.(a)
04/29/25 | | | 4.750 | % | | | 826,000 | | | | 837,357 | | |
Total | | | | | | | 31,793,951 | | |
BANKING 13.2% | |
Ally Financial, Inc.
05/19/22 | | | 4.625 | % | | | 1,304,000 | | | | 1,336,600 | | |
09/30/24 | | | 5.125 | % | | | 3,621,000 | | | | 3,792,998 | | |
Subordinated
11/20/25 | | | 5.750 | % | | | 760,000 | | | | 769,500 | | |
BNP Paribas SA
Junior Subordinated(a)(b)
12/31/49 | | | 7.375 | % | | | 11,478,000 | | | | 11,334,525 | | |
Bank of America Corp.
01/11/23 | | | 3.300 | % | | | 3,766,000 | | | | 3,827,322 | | |
Subordinated
05/02/17 | | | 5.700 | % | | | 7,605,000 | | | | 7,907,618 | | |
01/22/25 | | | 4.000 | % | | | 1,625,000 | | | | 1,627,449 | | |
Corporate Bonds & Notes (continued)
Issuer | | Coupon
Rate | | Principal
Amount ($) | |
Value ($) | |
Bank of America Corp.(b)
Junior Subordinated
12/31/49 | | | 6.100 | % | | | 10,799,000 | | | | 10,805,749 | | |
12/31/49 | | | 6.250 | % | | | 1,575,000 | | | | 1,580,906 | | |
Bank of New York Mellon Corp. (The)
05/15/19 | | | 5.450 | % | | | 3,325,000 | | | | 3,707,435 | | |
Bank of New York Mellon Corp. (The)(b)
Junior Subordinated
12/29/49 | | | 4.500 | % | | | 11,001,000 | | | | 10,340,940 | | |
Barclays Bank PLC
Subordinated
09/11/24 | | | 4.375 | % | | | 2,295,000 | | | | 2,233,154 | | |
Barclays Bank PLC(b)
Junior Subordinated
12/31/49 | | | 6.625 | % | | | 14,865,000 | | | | 13,601,475 | | |
Barclays PLC
01/12/26 | | | 4.375 | % | | | 3,355,000 | | | | 3,390,731 | | |
Citigroup, Inc.
Subordinated
08/25/36 | | | 6.125 | % | | | 1,855,000 | | | | 2,140,160 | | |
Citigroup, Inc.(b)
08/14/17 | | | 1.108 | % | | | 13,820,000 | | | | 13,766,517 | | |
Cooperatieve Rabobank UA
Junior Subordinated(a)(b)
12/31/49 | | | 11.000 | % | | | 5,164,000 | | | | 6,293,625 | | |
Discover Financial Services
04/27/22 | | | 5.200 | % | | | 7,947,000 | | | | 8,595,873 | | |
11/21/22 | | | 3.850 | % | | | 4,850,000 | | | | 4,911,265 | | |
Fifth Third Bancorp
Junior Subordinated(b)
12/31/49 | | | 5.100 | % | | | 16,162,000 | | | | 14,727,622 | | |
First Horizon National Corp.
12/15/20 | | | 3.500 | % | | | 3,578,000 | | | | 3,591,389 | | |
HBOS PLC
Subordinated(a)
05/21/18 | | | 6.750 | % | | | 8,382,000 | | | | 9,074,420 | | |
HSBC Holdings PLC
Junior Subordinated(b)
12/31/49 | | | 6.375 | % | | | 9,695,000 | | | | 9,367,794 | | |
JPMorgan Chase & Co.(b)
Junior Subordinated
12/29/49 | | | 6.000 | % | | | 10,954,000 | | | | 11,201,560 | | |
12/31/49 | | | 6.100 | % | | | 21,501,000 | | | �� | 22,092,277 | | |
JPMorgan Chase Bank NA
Subordinated(b)
06/13/16 | | | 0.962 | % | | | 10,850,000 | | | | 10,852,634 | | |
JPMorgan Chase Capital XXI
Junior Subordinated(b)
02/02/37 | | | 1.587 | % | | | 20,815,000 | | | | 14,965,985 | | |
The accompanying Notes to Financial Statements are an integral part of this statement.
Annual Report 2016
9
COLUMBIA TOTAL RETURN BOND FUND
PORTFOLIO OF INVESTMENTS (continued)
April 30, 2016
Corporate Bonds & Notes (continued)
Issuer | | Coupon
Rate | | Principal
Amount ($) | |
Value ($) | |
KeyCorp Capital I
Junior Subordinated(b)
07/01/28 | | | 1.365 | % | | | 9,842,000 | | | | 7,775,180 | | |
Lloyds Bank PLC
05/14/18 | | | 1.750 | % | | | 11,120,000 | | | | 11,127,017 | | |
Lloyds Banking Group PLC(a)
Subordinated
12/10/25 | | | 4.582 | % | | | 24,033,000 | | | | 24,137,815 | | |
Lloyds Banking Group PLC(b)
Junior Subordinated
12/31/49 | | | 7.500 | % | | | 29,662,000 | | | | 29,409,873 | | |
M&T Bank Corp.
Junior Subordinated
12/31/49 | | | 6.875 | % | | | 9,101,000 | | | | 9,118,064 | | |
Mellon Capital IV
Junior Subordinated(b)
06/29/49 | | | 4.000 | % | | | 1,035,000 | | | | 797,726 | | |
PNC Bank NA
06/01/25 | | | 3.250 | % | | | 3,395,000 | | | | 3,525,164 | | |
Rabobank Capital Funding Trust III
Junior Subordinated(a)(b)
12/31/49 | | | 5.254 | % | | | 10,396,000 | | | | 10,421,990 | | |
Royal Bank of Scotland Group PLC
Subordinated
05/28/24 | | | 5.125 | % | | | 602,000 | | | | 589,248 | | |
Royal Bank of Scotland Group PLC(b)
Junior Subordinated
12/31/49 | | | 8.000 | % | | | 19,542,000 | | | | 18,729,776 | | |
Santander Issuances SAU
Subordinated
11/19/25 | | | 5.179 | % | | | 11,035,000 | | | | 10,964,939 | | |
Santander UK Group Holdings PLC(a)
Subordinated
09/15/25 | | | 4.750 | % | | | 14,734,000 | | | | 14,390,374 | | |
09/15/45 | | | 5.625 | % | | | 5,441,000 | | | | 5,200,312 | | |
State Street Capital Trust IV
Junior Subordinated(b)
06/15/37 | | | 1.634 | % | | | 1,990,000 | | | | 1,457,675 | | |
State Street Corp.
Junior Subordinated
03/15/18 | | | 4.956 | % | | | 9,929,000 | | | | 10,405,671 | | |
Synchrony Financial
01/15/19 | | | 2.600 | % | | | 4,895,000 | | | | 4,930,459 | | |
Synovus Financial Corp.
02/15/19 | | | 7.875 | % | | | 321,000 | | | | 357,113 | | |
Synovus Financial Corp.(b)
Subordinated
12/15/25 | | | 5.750 | % | | | 11,255,000 | | | | 11,423,825 | | |
Corporate Bonds & Notes (continued)
Issuer | | Coupon
Rate | | Principal
Amount ($) | |
Value ($) | |
U.S. Bancorp
Subordinated
04/27/26 | | | 3.100 | % | | | 6,480,000 | | | | 6,520,215 | | |
Washington Mutual Bank
Subordinated(c)(d)(e)
01/15/15 | | | 5.125 | % | | | 27,379,000 | | | | 41,069 | | |
Wells Fargo & Co.
Junior Subordinated(b)
12/31/49 | | | 5.900 | % | | | 28,960,000 | | | | 29,647,800 | | |
Total | | | | | | | 418,808,828 | | |
BROKERAGE/ASSET MANAGERS/EXCHANGES 0.1% | |
E*TRADE Financial Corp.
09/15/23 | | | 4.625 | % | | | 2,502,000 | | | | 2,532,524 | | |
National Financial Partners Corp.(a)
07/15/21 | | | 9.000 | % | | | 93,000 | | | | 92,535 | | |
Total | | | | | | | 2,625,059 | | |
BUILDING MATERIALS 0.2% | |
Allegion PLC
09/15/23 | | | 5.875 | % | | | 605,000 | | | | 641,300 | | |
Allegion US Holding Co., Inc.
10/01/21 | | | 5.750 | % | | | 182,000 | | | | 190,190 | | |
American Builders & Contractors Supply Co., Inc.(a)
04/15/21 | | | 5.625 | % | | | 1,591,000 | | | | 1,646,685 | | |
12/15/23 | | | 5.750 | % | | | 192,000 | | | | 200,640 | | |
Beacon Roofing Supply, Inc.
10/01/23 | | | 6.375 | % | | | 907,000 | | | | 963,687 | | |
Gibraltar Industries, Inc.
02/01/21 | | | 6.250 | % | | | 209,000 | | | | 212,135 | | |
HD Supply, Inc.
07/15/20 | | | 7.500 | % | | | 891,000 | | | | 945,574 | | |
HD Supply, Inc.(a)
12/15/21 | | | 5.250 | % | | | 1,332,000 | | | | 1,398,600 | | |
04/15/24 | | | 5.750 | % | | | 616,000 | | | | 646,030 | | |
Masco Corp.
04/01/21 | | | 3.500 | % | | | 168,000 | | | | 170,520 | | |
Nortek, Inc.
04/15/21 | | | 8.500 | % | | | 364,000 | | | | 378,560 | | |
Ply Gem Industries, Inc.
02/01/22 | | | 6.500 | % | | | 13,000 | | | | 12,903 | | |
RSI Home Products, Inc.(a)
03/15/23 | | | 6.500 | % | | | 214,000 | | | | 222,560 | | |
Total | | | | | | | 7,629,384 | | |
The accompanying Notes to Financial Statements are an integral part of this statement.
Annual Report 2016
10
COLUMBIA TOTAL RETURN BOND FUND
PORTFOLIO OF INVESTMENTS (continued)
April 30, 2016
Corporate Bonds & Notes (continued)
Issuer | | Coupon
Rate | | Principal
Amount ($) | |
Value ($) | |
CABLE AND SATELLITE 1.0% | |
Altice U.S. Finance I Corp.(a)
05/15/26 | | | 5.500 | % | | | 1,258,000 | | | | 1,270,580 | | |
Altice US Finance I Corp.(a)
07/15/23 | | | 5.375 | % | | | 791,000 | | | | 807,651 | | |
CCO Holdings LLC/Capital Corp.
01/31/22 | | | 6.625 | % | | | 404,000 | | | | 429,250 | | |
09/30/22 | | | 5.250 | % | | | 143,000 | | | | 147,648 | | |
CCO Holdings LLC/Capital Corp.(a)
05/01/23 | | | 5.125 | % | | | 545,000 | | | | 555,900 | | |
04/01/24 | | | 5.875 | % | | | 5,000 | | | | 5,238 | | |
05/01/25 | | | 5.375 | % | | | 1,586,000 | | | | 1,623,667 | | |
05/01/26 | | | 5.500 | % | | | 279,000 | | | | 284,580 | | |
05/01/27 | | | 5.875 | % | | | 1,325,000 | | | | 1,358,125 | | |
CCO Safari II LLC(a)
10/23/45 | | | 6.484 | % | | | 6,075,000 | | | | 7,176,835 | | |
CCOH Safari LLC(a)
02/15/26 | | | 5.750 | % | | | 189,000 | | | | 195,143 | | |
CSC Holdings LLC
11/15/21 | | | 6.750 | % | | | 223,000 | | | | 229,690 | | |
Cequel Communications Holdings I LLC/Capital Corp.(a)
12/15/21 | | | 5.125 | % | | | 1,824,000 | | | | 1,719,120 | | |
DISH DBS Corp.
06/01/21 | | | 6.750 | % | | | 2,134,000 | | | | 2,198,468 | | |
11/15/24 | | | 5.875 | % | | | 125,000 | | | | 117,313 | | |
DigitalGlobe, Inc.(a)
02/01/21 | | | 5.250 | % | | | 904,000 | | | | 816,990 | | |
Intelsat Jackson Holdings SA
08/01/23 | | | 5.500 | % | | | 885,000 | | | | 559,209 | | |
Neptune Finco Corp.(a)
10/15/25 | | | 6.625 | % | | | 1,836,000 | | | | 1,980,585 | | |
10/15/25 | | | 10.875 | % | | | 2,033,000 | | | | 2,261,712 | | |
Sirius XM Radio, Inc.(a)
04/15/25 | | | 5.375 | % | | | 789,000 | | | | 804,780 | | |
UPCB Finance IV Ltd.(a)
01/15/25 | | | 5.375 | % | | | 1,132,000 | | | | 1,151,810 | | |
Unitymedia Hessen GmbH & Co. KG NRW(a)
01/15/23 | | | 5.500 | % | | | 1,877,000 | | | | 1,945,041 | | |
Videotron Ltd.
07/15/22 | | | 5.000 | % | | | 1,706,000 | | | | 1,769,975 | | |
Virgin Media Finance PLC(a)
01/15/25 | | | 5.750 | % | | | 2,285,000 | | | | 2,302,137 | | |
Virgin Media Secured Finance PLC(a)
01/15/26 | | | 5.250 | % | | | 810,000 | | | | 812,333 | | |
08/15/26 | | | 5.500 | % | | | 229,000 | | | | 230,289 | | |
Total | | | | | | | 32,754,069 | | |
Corporate Bonds & Notes (continued)
Issuer | | Coupon
Rate | | Principal
Amount ($) | |
Value ($) | |
CHEMICALS 0.4% | |
Angus Chemical Co.(a)
02/15/23 | | | 8.750 | % | | | 803,000 | | | | 764,857 | | |
Axalta Coating Systems Dutch Holding B BV/U.S.
Holdings, Inc.(a)
05/01/21 | | | 7.375 | % | | | 365,000 | | | | 385,988 | | |
Celanese U.S. Holdings LLC
06/15/21 | | | 5.875 | % | | | 1,804,000 | | | | 1,943,810 | | |
Chemours Co. LLC (The)(a)
05/15/23 | | | 6.625 | % | | | 1,048,000 | | | | 917,000 | | |
05/15/25 | | | 7.000 | % | | | 1,214,000 | | | | 1,053,145 | | |
Eco Services Operations LLC/Finance Corp.(a)
11/01/22 | | | 8.500 | % | | | 632,000 | | | | 609,880 | | |
Huntsman International LLC
11/15/22 | | | 5.125 | % | | | 303,000 | | | | 304,515 | | |
INEOS Group Holdings SA(a)
02/15/19 | | | 5.875 | % | | | 820,000 | | | | 832,300 | | |
PQ Corp.(a)
11/01/18 | | | 8.750 | % | | | 2,334,000 | | | | 2,427,360 | | |
PQ Corp.(a)(f)
11/15/22 | | | 6.750 | % | | | 744,000 | | | | 768,180 | | |
Platform Specialty Products Corp.(a)
05/01/21 | | | 10.375 | % | | | 295,000 | | | | 295,000 | | |
02/01/22 | | | 6.500 | % | | | 610,000 | | | | 536,800 | | |
WR Grace & Co.(a)
10/01/21 | | | 5.125 | % | | | 438,000 | | | | 458,586 | | |
10/01/24 | | | 5.625 | % | | | 640,000 | | | | 676,800 | | |
Total | | | | | | | 11,974,221 | | |
CONSTRUCTION MACHINERY 0.2% | |
John Deere Capital Corp.(b)
01/16/18 | | | 0.923 | % | | | 6,355,000 | | | | 6,351,104 | | |
United Rentals North America, Inc.
04/15/22 | | | 7.625 | % | | | 351,000 | | | | 374,693 | | |
United Rentals North America, Inc.(f)
09/15/26 | | | 5.875 | % | | | 963,000 | | | | 972,630 | | |
Total | | | | | | | 7,698,427 | | |
CONSUMER CYCLICAL SERVICES 0.3% | |
APX Group, Inc.
12/01/19 | | | 6.375 | % | | | 1,196,000 | | | | 1,196,000 | | |
12/01/20 | | | 8.750 | % | | | 420,000 | | | | 393,750 | | |
IHS, Inc.
11/01/22 | | | 5.000 | % | | | 1,222,000 | | | | 1,276,990 | | |
Interval Acquisition Corp.(a)
04/15/23 | | | 5.625 | % | | | 1,395,000 | | | | 1,422,900 | | |
The accompanying Notes to Financial Statements are an integral part of this statement.
Annual Report 2016
11
COLUMBIA TOTAL RETURN BOND FUND
PORTFOLIO OF INVESTMENTS (continued)
April 30, 2016
Corporate Bonds & Notes (continued)
Issuer | | Coupon
Rate | | Principal
Amount ($) | |
Value ($) | |
Service Corp. International
10/01/18 | | | 7.625 | % | | | 600,000 | | | | 673,500 | | |
Visa, Inc.
12/14/45 | | | 4.300 | % | | | 4,295,000 | | | | 4,720,141 | | |
Total | | | | | | | 9,683,281 | | |
CONSUMER PRODUCTS 0.3% | |
Newell Brands, Inc.(a)
11/15/23 | | | 5.000 | % | | | 781,000 | | | | 824,111 | | |
Prestige Brands, Inc.(a)
03/01/24 | | | 6.375 | % | | | 816,000 | | | | 856,800 | | |
Scotts Miracle-Gro Co. (The)(a)
10/15/23 | | | 6.000 | % | | | 1,544,000 | | | | 1,632,780 | | |
Serta Simmons Bedding LLC(a)
10/01/20 | | | 8.125 | % | | | 1,531,000 | | | | 1,607,550 | | |
Spectrum Brands, Inc.
11/15/22 | | | 6.625 | % | | | 1,433,000 | | | | 1,547,640 | | |
07/15/25 | | | 5.750 | % | | | 1,183,000 | | | | 1,254,749 | | |
Springs Industries, Inc.
06/01/21 | | | 6.250 | % | | | 699,000 | | | | 711,232 | | |
Tempur Sealy International, Inc.
12/15/20 | | | 6.875 | % | | | 430,000 | | | | 453,113 | | |
10/15/23 | | | 5.625 | % | | | 892,000 | | | | 927,680 | | |
Total | | | | | | | 9,815,655 | | |
DIVERSIFIED MANUFACTURING 2.9% | |
Entegris, Inc.(a)
04/01/22 | | | 6.000 | % | | | 940,000 | | | | 968,200 | | |
General Electric Co.
Junior Subordinated(b)
12/31/49 | | | 5.000 | % | | | 80,741,000 | | | | 84,071,566 | | |
Manitowoc Foodservice, Inc.(a)
02/15/24 | | | 9.500 | % | | | 191,000 | | | | 211,055 | | |
United Technologies Corp.
06/01/42 | | | 4.500 | % | | | 5,978,000 | | | | 6,658,045 | | |
Total | | | | | | | 91,908,866 | | |
ELECTRIC 3.3% | |
AES Corp. (The)
07/01/21 | | | 7.375 | % | | | 466,000 | | | | 534,735 | | |
Alabama Power Co.
01/02/46 | | | 4.300 | % | | | 1,960,000 | | | | 2,156,762 | | |
Arizona Public Service Co.
11/15/45 | | | 4.350 | % | | | 4,030,000 | | | | 4,468,287 | | |
CMS Energy Corp.
02/15/18 | | | 5.050 | % | | | 10,261,000 | | | | 10,858,549 | | |
Calpine Corp.
01/15/23 | | | 5.375 | % | | | 1,693,000 | | | | 1,707,814 | | |
Corporate Bonds & Notes (continued)
Issuer | | Coupon
Rate | | Principal
Amount ($) | |
Value ($) | |
Commonwealth Edison Co.
11/15/45 | | | 4.350 | % | | | 4,550,000 | | | | 4,963,518 | | |
Dominion Resources, Inc.
10/01/25 | | | 3.900 | % | | | 2,941,000 | | | | 3,093,826 | | |
Duke Energy Progress LLC
03/30/44 | | | 4.375 | % | | | 1,635,000 | | | | 1,822,276 | | |
Duke Energy Progress, Inc.
08/15/45 | | | 4.200 | % | | | 7,210,000 | | | | 7,841,863 | | |
Exelon Corp.(a)
06/15/25 | | | 3.950 | % | | | 4,241,000 | | | | 4,522,942 | | |
FPL Energy National Wind LLC(a)
03/10/24 | | | 5.608 | % | | | 220,055 | | | | 209,052 | | |
Florida Power & Light Co.
12/01/25 | | | 3.125 | % | | | 1,380,000 | | | | 1,448,796 | | |
Georgia Power Co.
09/01/40 | | | 4.750 | % | | | 1,727,000 | | | | 1,912,516 | | |
MidAmerican Energy Co.
10/15/24 | | | 3.500 | % | | | 3,080,000 | | | | 3,307,252 | | |
NRG Energy, Inc.
07/15/22 | | | 6.250 | % | | | 1,733,000 | | | | 1,698,895 | | |
NRG Yield Operating LLC
08/15/24 | | | 5.375 | % | | | 2,095,000 | | | | 1,969,300 | | |
Niagara Mohawk Power Corp.(a)
10/01/24 | | | 3.508 | % | | | 3,325,000 | | | | 3,526,472 | | |
Oncor Electric Delivery Co. LLC
04/01/25 | | | 2.950 | % | | | 4,300,000 | | | | 4,316,232 | | |
PPL Capital Funding, Inc.
06/15/22 | | | 4.200 | % | | | 3,070,000 | | | | 3,311,723 | | |
12/01/22 | | | 3.500 | % | | | 3,095,000 | | | | 3,244,662 | | |
06/01/23 | | | 3.400 | % | | | 5,582,000 | | | | 5,769,443 | | |
Pacific Gas & Electric Co.
06/15/23 | | | 3.250 | % | | | 3,567,000 | | | | 3,744,861 | | |
03/01/26 | | | 2.950 | % | | | 5,405,000 | | | | 5,534,120 | | |
03/01/34 | | | 6.050 | % | | | 2,160,000 | | | | 2,868,240 | | |
Public Service Electric & Gas Co.
11/01/45 | | | 4.150 | % | | | 4,215,000 | | | | 4,642,932 | | |
Southern California Edison Co.
09/01/40 | | | 4.500 | % | | | 1,726,000 | | | | 1,947,132 | | |
Toledo Edison Co. (The)
05/15/37 | | | 6.150 | % | | | 4,371,000 | | | | 5,196,070 | | |
TransAlta Corp.
06/03/17 | | | 1.900 | % | | | 6,929,000 | | | | 6,815,080 | | |
Total | | | | | | | 103,433,350 | | |
FINANCE COMPANIES 0.9% | |
AerCap Ireland Capital Ltd./Global Aviation Trust
05/15/21 | | | 4.500 | % | | | 1,649,000 | | | | 1,702,592 | | |
10/01/21 | | | 5.000 | % | | | 5,110,000 | | | | 5,391,050 | | |
The accompanying Notes to Financial Statements are an integral part of this statement.
Annual Report 2016
12
COLUMBIA TOTAL RETURN BOND FUND
PORTFOLIO OF INVESTMENTS (continued)
April 30, 2016
Corporate Bonds & Notes (continued)
Issuer | | Coupon
Rate | | Principal
Amount ($) | |
Value ($) | |
Aircastle Ltd.
02/15/22 | | | 5.500 | % | | | 967,000 | | | | 1,028,646 | | |
04/01/23 | | | 5.000 | % | | | 95,000 | | | | 96,725 | | |
CIT Group, Inc.
05/15/20 | | | 5.375 | % | | | 1,505,000 | | | | 1,578,369 | | |
CIT Group, Inc.(a)
02/15/19 | | | 5.500 | % | | | 1,521,000 | | | | 1,593,247 | | |
HSBC Finance Corp.
Subordinated
01/15/21 | | | 6.676 | % | | | 8,769,000 | | | | 10,074,783 | | |
Navient Corp.
06/15/18 | | | 8.450 | % | | | 1,535,000 | | | | 1,642,450 | | |
03/25/20 | | | 8.000 | % | | | 99,000 | | | | 103,950 | | |
OneMain Financial Holdings LLC(a)
12/15/21 | | | 7.250 | % | | | 1,451,000 | | | | 1,509,040 | | |
Provident Funding Associates LP/Finance Corp.(a)
06/15/21 | | | 6.750 | % | | | 744,000 | | | | 704,940 | | |
Quicken Loans, Inc.(a)
05/01/25 | | | 5.750 | % | | | 297,000 | | | | 279,180 | | |
Springleaf Finance Corp.
06/01/20 | | | 6.000 | % | | | 396,000 | | | | 379,170 | | |
12/15/20 | | | 8.250 | % | | | 470,000 | | | | 484,688 | | |
10/01/21 | | | 7.750 | % | | | 823,000 | | | | 812,713 | | |
10/01/23 | | | 8.250 | % | | | 208,000 | | | | 207,350 | | |
iStar, Inc.
07/01/19 | | | 5.000 | % | | | 378,000 | | | | 366,660 | | |
Total | | | | | | | 27,955,553 | | |
FOOD AND BEVERAGE 2.1% | |
Anheuser-Busch InBev Finance, Inc.
02/01/23 | | | 3.300 | % | | | 15,789,000 | | | | 16,455,169 | | |
02/01/26 | | | 3.650 | % | | | 11,682,000 | | | | 12,313,938 | | |
02/01/36 | | | 4.700 | % | | | 5,471,000 | | | | 5,983,266 | | |
02/01/46 | | | 4.900 | % | | | 2,263,000 | | | | 2,566,373 | | |
Aramark Services, Inc.
03/15/20 | | | 5.750 | % | | | 663,000 | | | | 684,548 | | |
01/15/24 | | | 5.125 | % | | | 354,000 | | | | 374,355 | | |
B&G Foods, Inc.
06/01/21 | | | 4.625 | % | | | 180,000 | | | | 182,925 | | |
Constellation Brands, Inc.
11/15/24 | | | 4.750 | % | | | 3,040,000 | | | | 3,222,400 | | |
12/01/25 | | | 4.750 | % | | | 53,000 | | | | 56,246 | | |
Molson Coors Brewing Co.
05/01/42 | | | 5.000 | % | | | 5,490,000 | | | | 5,957,001 | | |
PepsiCo, Inc.
07/17/45 | | | 4.600 | % | | | 2,347,000 | | | | 2,711,923 | | |
04/14/46 | | | 4.450 | % | | | 1,068,000 | | | | 1,192,662 | | |
Pinnacle Foods Finance LLC/Corp.(a)
01/15/24 | | | 5.875 | % | | | 113,000 | | | | 119,498 | | |
Corporate Bonds & Notes (continued)
Issuer | | Coupon
Rate | | Principal
Amount ($) | |
Value ($) | |
Post Holdings, Inc.
02/15/22 | | | 7.375 | % | | | 127,000 | | | | 133,826 | | |
Post Holdings, Inc.(a)
12/15/22 | | | 6.000 | % | | | 12,000 | | | | 12,323 | | |
03/15/24 | | | 7.750 | % | | | 1,490,000 | | | | 1,620,375 | | |
SABMiller Holdings, Inc.(a)
01/15/22 | | | 3.750 | % | | | 9,885,000 | | | | 10,560,907 | | |
Treehouse Foods, Inc.(a)
02/15/24 | | | 6.000 | % | | | 160,000 | | | | 170,200 | | |
WhiteWave Foods Co. (The)
10/01/22 | | | 5.375 | % | | | 815,000 | | | | 871,577 | | |
Total | | | | | | | 65,189,512 | | |
GAMING 0.4% | |
Boyd Gaming Corp.
05/15/23 | | | 6.875 | % | | | 198,000 | | | | 205,425 | | |
Boyd Gaming Corp.(a)
04/01/26 | | | 6.375 | % | | | 301,000 | | | | 307,772 | | |
GLP Capital LP/Financing II, Inc.
11/01/18 | | | 4.375 | % | | | 940,000 | | | | 968,200 | | |
11/01/23 | | | 5.375 | % | | | 774,000 | | | | 805,927 | | |
04/15/26 | | | 5.375 | % | | | 213,000 | | | | 222,053 | | |
International Game Technology PLC(a)
02/15/22 | | | 6.250 | % | | | 998,000 | | | | 1,015,665 | | |
02/15/25 | | | 6.500 | % | | | 460,000 | | | | 465,750 | | |
MGM Resorts International
03/01/18 | | | 11.375 | % | | | 1,276,000 | | | | 1,467,400 | | |
10/01/20 | | | 6.750 | % | | | 326,000 | | | | 348,005 | | |
12/15/21 | | | 6.625 | % | | | 212,000 | | | | 225,780 | | |
03/15/23 | | | 6.000 | % | | | 954,000 | | | | 990,967 | | |
MGP Escrow Issuer LLC/Co-Issuer, Inc.(a)
05/01/24 | | | 5.625 | % | | | 306,000 | | | | 319,005 | | |
Pinnacle Entertainment, Inc.(a)
05/01/24 | | | 5.625 | % | | | 250,000 | | | | 249,688 | | |
Scientific Games International, Inc.(a)
01/01/22 | | | 7.000 | % | | | 2,536,000 | | | | 2,585,135 | | |
Seminole Tribe of Florida, Inc.(a)
10/01/20 | | | 7.804 | % | | | 475,000 | | | | 502,930 | | |
Tunica-Biloxi Gaming Authority(a)(e)
08/15/16 | | | 0.000 | % | | | 577,000 | | | | 295,713 | | |
Total | | | | | | | 10,975,415 | | |
HEALTH CARE 1.3% | |
Acadia Healthcare Co., Inc.
02/15/23 | | | 5.625 | % | | | 127,000 | | | | 129,858 | | |
Acadia Healthcare Co., Inc.(a)
03/01/24 | | | 6.500 | % | | | 814,000 | | | | 858,770 | | |
The accompanying Notes to Financial Statements are an integral part of this statement.
Annual Report 2016
13
COLUMBIA TOTAL RETURN BOND FUND
PORTFOLIO OF INVESTMENTS (continued)
April 30, 2016
Corporate Bonds & Notes (continued)
Issuer | | Coupon
Rate | | Principal
Amount ($) | |
Value ($) | |
Alere, Inc.(a)
07/01/23 | | | 6.375 | % | | | 426,000 | | | | 434,520 | | |
Amsurg Corp.
07/15/22 | | | 5.625 | % | | | 985,000 | | | | 1,010,856 | | |
CHS/Community Health Systems, Inc.
08/01/21 | | | 5.125 | % | | | 966,000 | | | | 968,811 | | |
02/01/22 | | | 6.875 | % | | | 1,485,000 | | | | 1,343,925 | | |
Change Healthcare Holdings, Inc.
12/31/19 | | | 11.000 | % | | | 257,000 | | | | 272,420 | | |
Change Healthcare Holdings, Inc.(a)
02/15/21 | | | 6.000 | % | | | 803,000 | | | | 811,030 | | |
ConvaTec Finance International SA
Junior Subordinated PIK(a)
01/15/19 | | | 8.250 | % | | | 637,000 | | | | 638,592 | | |
DaVita HealthCare Partners, Inc.
08/15/22 | | | 5.750 | % | | | 360,000 | | | | 377,100 | | |
07/15/24 | | | 5.125 | % | | | 1,904,000 | | | | 1,937,739 | | |
ExamWorks Group, Inc.
04/15/23 | | | 5.625 | % | | | 785,000 | | | | 841,912 | | |
Fresenius Medical Care U.S. Finance II, Inc.(a)
07/31/19 | | | 5.625 | % | | | 335,000 | | | | 364,731 | | |
01/31/22 | | | 5.875 | % | | | 943,000 | | | | 1,037,300 | | |
10/15/24 | | | 4.750 | % | | | 974,000 | | | | 1,010,525 | | |
HCA, Inc.
02/01/25 | | | 5.375 | % | | | 3,122,000 | | | | 3,192,245 | | |
04/15/25 | | | 5.250 | % | | | 3,739,000 | | | | 3,869,865 | | |
HealthSouth Corp.
11/01/24 | | | 5.750 | % | | | 439,000 | | | | 453,268 | | |
Hologic, Inc.(a)
07/15/22 | | | 5.250 | % | | | 1,233,000 | | | | 1,291,567 | | |
Kinetic Concepts, Inc./KCI U.S.A., Inc.
11/01/18 | | | 10.500 | % | | | 266,000 | | | | 267,995 | | |
Kinetic Concepts, Inc./KCI U.S.A., Inc.(a)
02/15/21 | | | 7.875 | % | | | 146,000 | | | | 157,863 | | |
LifePoint Health, Inc.
12/01/21 | | | 5.500 | % | | | 928,000 | | | | 965,120 | | |
MEDNAX, Inc.(a)
12/01/23 | | | 5.250 | % | | | 477,000 | | | | 493,695 | | |
MPH Acquisition Holdings LLC(a)
04/01/22 | | | 6.625 | % | | | 1,585,000 | | | | 1,656,325 | | |
Memorial Sloan-Kettering Cancer Center
07/01/52 | | | 4.125 | % | | | 9,530,000 | | | | 9,652,270 | | |
Sterigenics-Nordion Holdings LLC(a)
05/15/23 | | | 6.500 | % | | | 1,562,000 | | | | 1,585,430 | | |
Surgical Care Affiliates, Inc.(a)
04/01/23 | | | 6.000 | % | | | 481,000 | | | | 485,810 | | |
Corporate Bonds & Notes (continued)
Issuer | | Coupon
Rate | | Principal
Amount ($) | |
Value ($) | |
Tenet Healthcare Corp.
10/01/20 | | | 6.000 | % | | | 801,000 | | | | 849,060 | | |
04/01/21 | | | 4.500 | % | | | 1,599,000 | | | | 1,618,987 | | |
04/01/22 | | | 8.125 | % | | | 1,670,000 | | | | 1,732,625 | | |
06/15/23 | | | 6.750 | % | | | 45,000 | | | | 44,438 | | |
Total | | | | | | | 40,354,652 | | |
HEALTHCARE INSURANCE 0.1% | |
Centene Corp.
05/15/22 | | | 4.750 | % | | | 1,595,000 | | | | 1,632,881 | | |
Centene Corp.(a)
02/15/24 | | | 6.125 | % | | | 643,000 | | | | 678,365 | | |
Molina Healthcare, Inc.(a)
11/15/22 | | | 5.375 | % | | | 1,569,000 | | | | 1,619,993 | | |
Total | | | | | | | 3,931,239 | | |
HOME CONSTRUCTION 0.2% | |
CalAtlantic Group, Inc.
12/15/21 | | | 6.250 | % | | | 434,000 | | | | 465,465 | | |
11/15/24 | | | 5.875 | % | | | 754,000 | | | | 797,355 | | |
D.R. Horton, Inc.
08/15/23 | | | 5.750 | % | | | 1,254,000 | | | | 1,373,130 | | |
Meritage Homes Corp.
04/01/22 | | | 7.000 | % | | | 813,000 | | | | 871,942 | | |
06/01/25 | | | 6.000 | % | | | 1,035,000 | | | | 1,055,700 | | |
Taylor Morrison Communities, Inc./Monarch, Inc.(a)
04/15/23 | | | 5.875 | % | | | 246,000 | | | | 245,385 | | |
03/01/24 | | | 5.625 | % | | | 154,000 | | | | 150,150 | | |
Toll Brothers Finance Corp.
11/15/25 | | | 4.875 | % | | | 305,000 | | | | 307,288 | | |
Total | | | | | | | 5,266,415 | | |
INDEPENDENT ENERGY 2.6% | |
Anadarko Petroleum Corp.
09/15/17 | | | 6.375 | % | | | 1,273,000 | | | | 1,351,907 | | |
03/15/26 | | | 5.550 | % | | | 2,245,000 | | | | 2,406,353 | | |
07/15/44 | | | 4.500 | % | | | 1,065,000 | | | | 918,247 | | |
03/15/46 | | | 6.600 | % | | | 1,966,000 | | | | 2,225,195 | | |
Antero Resources Corp.
12/01/22 | | | 5.125 | % | | | 1,035,000 | | | | 993,600 | | |
06/01/23 | | | 5.625 | % | | | 249,000 | | | | 241,530 | | |
Canadian Natural Resources Ltd.
02/15/37 | | | 6.500 | % | | | 2,620,000 | | | | 2,620,747 | | |
02/01/39 | | | 6.750 | % | | | 705,000 | | | | 718,117 | | |
Carrizo Oil & Gas, Inc.
04/15/23 | | | 6.250 | % | | | 2,108,000 | | | | 2,023,680 | | |
Cimarex Energy Co.
06/01/24 | | | 4.375 | % | | | 7,720,000 | | | | 7,864,874 | | |
The accompanying Notes to Financial Statements are an integral part of this statement.
Annual Report 2016
14
COLUMBIA TOTAL RETURN BOND FUND
PORTFOLIO OF INVESTMENTS (continued)
April 30, 2016
Corporate Bonds & Notes (continued)
Issuer | | Coupon
Rate | | Principal
Amount ($) | |
Value ($) | |
Concho Resources, Inc.
04/01/23 | | | 5.500 | % | | | 3,240,000 | | | | 3,264,300 | | |
Continental Resources, Inc.
04/15/23 | | | 4.500 | % | | | 800,000 | | | | 714,500 | | |
06/01/24 | | | 3.800 | % | | | 4,823,000 | | | | 4,111,607 | | |
CrownRock LP/Finance, Inc.(a)
04/15/21 | | | 7.125 | % | | | 480,000 | | | | 484,800 | | |
02/15/23 | | | 7.750 | % | | | 945,000 | | | | 963,900 | | |
Diamondback Energy, Inc.
10/01/21 | | | 7.625 | % | | | 99,000 | | | | 105,559 | | |
Kerr-McGee Corp.
07/01/24 | | | 6.950 | % | | | 5,432,000 | | | | 6,013,039 | | |
Laredo Petroleum, Inc.
01/15/22 | | | 5.625 | % | | | 484,000 | | | | 445,280 | | |
05/01/22 | | | 7.375 | % | | | 479,000 | | | | 469,420 | | |
03/15/23 | | | 6.250 | % | | | 2,549,000 | | | | 2,376,942 | | |
Marathon Oil Corp.
03/15/18 | | | 5.900 | % | | | 2,174,000 | | | | 2,271,830 | | |
Newfield Exploration Co.
07/01/24 | | | 5.625 | % | | | 615,000 | | | | 625,762 | | |
Noble Energy, Inc.
05/01/21 | | | 5.625 | % | | | 1,821,000 | | | | 1,871,296 | | |
11/15/24 | | | 3.900 | % | | | 3,761,000 | | | | 3,739,363 | | |
11/15/43 | | | 5.250 | % | | | 9,415,000 | | | | 8,913,840 | | |
11/15/44 | | | 5.050 | % | | | 7,062,000 | | | | 6,685,659 | | |
Occidental Petroleum Corp.
04/15/26 | | | 3.400 | % | | | 6,420,000 | | | | 6,641,766 | | |
Parsley Energy LLC/Finance Corp.(a)
02/15/22 | | | 7.500 | % | | | 1,118,000 | | | | 1,182,285 | | |
RSP Permian, Inc.
10/01/22 | | | 6.625 | % | | | 1,652,000 | | | | 1,705,690 | | |
Ras Laffan Liquefied Natural Gas Co., Ltd. II(a)
09/30/20 | | | 5.298 | % | | | 3,095,517 | | | | 3,296,726 | | |
WPX Energy, Inc.
Senior Unsecured
01/15/22 | | | 6.000 | % | | | 508,000 | | | | 457,200 | | |
Woodside Finance Ltd.(a)
03/05/25 | | | 3.650 | % | | | 4,886,000 | | | | 4,613,337 | | |
Total | | | | | | | 82,318,351 | | |
INTEGRATED ENERGY 0.6% | |
BG Energy Capital PLC
Subordinated(a)(b)
11/30/72 | | | 6.500 | % | | | 1,230,000 | | | | 1,291,698 | | |
BP Capital Markets PLC
03/17/22 | | | 3.062 | % | | | 6,405,000 | | | | 6,606,341 | | |
BP Capital Markets PLC(f)
05/04/26 | | | 3.119 | % | | | 4,220,000 | | | | 4,248,865 | | |
Corporate Bonds & Notes (continued)
Issuer | | Coupon
Rate | | Principal
Amount ($) | |
Value ($) | |
Cenovus Energy, Inc.
10/15/19 | | | 5.700 | % | | | 4,190,000 | | | | 4,344,548 | | |
11/15/39 | | | 6.750 | % | | | 2,000,000 | | | | 1,942,206 | | |
09/15/42 | | | 4.450 | % | | | 2,550,000 | | | | 1,974,554 | | |
Total | | | | | | | 20,408,212 | | |
LEISURE —% | |
AMC Entertainment, Inc.
06/15/25 | | | 5.750 | % | | | 253,000 | | | | 259,325 | | |
Cedar Fair LP/Canada's Wonderland Co./Magnum
Management Corp.
03/15/21 | | | 5.250 | % | | | 480,000 | | | | 500,410 | | |
LTF Merger Sub, Inc.(a)
06/15/23 | | | 8.500 | % | | | 496,000 | | | | 487,320 | | |
Total | | | | | | | 1,247,055 | | |
LIFE INSURANCE 1.9% | |
American International Group, Inc.
02/15/24 | | | 4.125 | % | | | 5,159,000 | | | | 5,401,391 | | |
04/01/26 | | | 3.900 | % | | | 9,788,000 | | | | 9,972,797 | | |
Five Corners Funding Trust(a)
11/15/23 | | | 4.419 | % | | | 3,290,000 | | | | 3,495,513 | | |
Massachusetts Mutual Life Insurance Co.
Subordinated(a)
04/15/65 | | | 4.500 | % | | | 1,800,000 | | | | 1,649,950 | | |
MetLife Capital Trust X
Junior Subordinated(a)(b)
04/08/38 | | | 9.250 | % | | | 15,805,000 | | | | 21,573,825 | | |
MetLife, Inc.
Junior Subordinated
08/01/39 | | | 10.750 | % | | | 10,371,000 | | | | 15,815,775 | | |
Prudential Financial, Inc.
12/01/17 | | | 6.000 | % | | | 431,000 | | | | 460,871 | | |
Teachers Insurance & Annuity Association of America
Subordinated(a)
09/15/44 | | | 4.900 | % | | | 1,695,000 | | | | 1,824,493 | | |
Total | | | | | | | 60,194,615 | | |
LODGING 0.2% | |
Choice Hotels International, Inc.
07/01/22 | | | 5.750 | % | | | 1,500,000 | | | | 1,612,500 | | |
Hilton Worldwide Finance LLC/Corp.
10/15/21 | | | 5.625 | % | | | 1,692,000 | | | | 1,762,303 | | |
Playa Resorts Holding BV(a)
08/15/20 | | | 8.000 | % | | | 966,000 | | | | 973,245 | | |
RHP Hotel Properties LP/Finance Corp.
04/15/23 | | | 5.000 | % | | | 432,000 | | | | 443,880 | | |
Total | | | | | | | 4,791,928 | | |
The accompanying Notes to Financial Statements are an integral part of this statement.
Annual Report 2016
15
COLUMBIA TOTAL RETURN BOND FUND
PORTFOLIO OF INVESTMENTS (continued)
April 30, 2016
Corporate Bonds & Notes (continued)
Issuer | | Coupon
Rate | | Principal
Amount ($) | |
Value ($) | |
MEDIA AND ENTERTAINMENT 1.0% | |
21st Century Fox America, Inc.
02/15/41 | | | 6.150 | % | | | 7,365,000 | | | | 9,100,975 | | |
AMC Networks, Inc.
12/15/22 | | | 4.750 | % | | | 516,000 | | | | 519,870 | | |
04/01/24 | | | 5.000 | % | | | 436,000 | | | | 436,545 | | |
Activision Blizzard, Inc.(a)
09/15/21 | | | 5.625 | % | | | 1,188,000 | | | | 1,250,370 | | |
09/15/23 | | | 6.125 | % | | | 1,062,000 | | | | 1,156,252 | | |
Lamar Media Corp.(a)
02/01/26 | | | 5.750 | % | | | 228,000 | | | | 241,110 | | |
MDC Partners, Inc.(a)
05/01/24 | | | 6.500 | % | | | 2,067,000 | | | | 2,140,585 | | |
Netflix, Inc.
02/15/22 | | | 5.500 | % | | | 680,000 | | | | 710,600 | | |
02/15/25 | | | 5.875 | % | | | 1,973,000 | | | | 2,067,704 | | |
Outfront Media Capital LLC/Corp.
03/15/25 | | | 5.875 | % | | | 1,049,000 | | | | 1,096,205 | | |
Scripps Networks Interactive, Inc.
06/15/22 | | | 3.500 | % | | | 11,489,000 | | | | 11,823,100 | | |
Univision Communications, Inc.(a)
02/15/25 | | | 5.125 | % | | | 2,581,000 | | | | 2,551,964 | | |
Total | | | | | | | 33,095,280 | | |
METALS 0.6% | |
ArcelorMittal(b)
08/05/20 | | | 6.250 | % | | | 324,000 | | | | 332,100 | | |
03/01/21 | | | 6.500 | % | | | 936,000 | | | | 957,060 | | |
02/25/22 | | | 7.250 | % | | | 432,000 | | | | 453,600 | | |
03/01/41 | | | 7.750 | % | | | 1,646,000 | | | | 1,522,550 | | |
BHP Billiton Finance USA Ltd.
Junior Subordinated(a)(b)
10/19/75 | | | 6.750 | % | | | 6,135,000 | | | | 6,363,529 | | |
Freeport-McMoRan, Inc.
03/01/22 | | | 3.550 | % | | | 234,000 | | | | 195,390 | | |
11/14/24 | | | 4.550 | % | | | 330,000 | | | | 277,612 | | |
Glencore Finance Canada Ltd.(a)
11/15/16 | | | 5.800 | % | | | 5,830,000 | | | | 5,935,669 | | |
Glencore Funding LLC(a)
05/27/16 | | | 1.700 | % | | | 2,490,000 | | | | 2,481,428 | | |
Vale Overseas Ltd.
01/11/22 | | | 4.375 | % | | | 1,855,000 | | | | 1,715,875 | | |
Total | | | | | | | 20,234,813 | | |
MIDSTREAM 2.0% | |
Columbia Pipeline Group, Inc.(a)
06/01/25 | | | 4.500 | % | | | 3,549,000 | | | | 3,659,757 | | |
06/01/45 | | | 5.800 | % | | | 12,171,000 | | | | 12,832,591 | | |
Corporate Bonds & Notes (continued)
Issuer | | Coupon
Rate | | Principal
Amount ($) | |
Value ($) | |
Energy Transfer Equity LP
06/01/27 | | | 5.500 | % | | | 2,384,000 | | | | 2,046,116 | | |
Kinder Morgan Energy Partners LP
03/01/21 | | | 3.500 | % | | | 5,432,000 | | | | 5,322,518 | | |
09/01/23 | | | 3.500 | % | | | 3,641,000 | | | | 3,422,525 | | |
MPLX LP(a)
07/15/23 | | | 4.500 | % | | | 543,000 | | | | 527,161 | | |
12/01/24 | | | 4.875 | % | | | 2,803,000 | | | | 2,732,003 | | |
06/01/25 | | | 4.875 | % | | | 42,000 | | | | 40,584 | | |
Plains All American Pipeline LP/Finance Corp.
06/01/22 | | | 3.650 | % | | | 624,000 | | | | 590,788 | | |
11/01/24 | | | 3.600 | % | | | 2,830,000 | | | | 2,537,669 | | |
10/15/25 | | | 4.650 | % | | | 5,517,000 | | | | 5,259,516 | | |
06/01/42 | | | 5.150 | % | | | 4,144,000 | | | | 3,376,150 | | |
02/15/45 | | | 4.900 | % | | | 2,998,000 | | | | 2,457,308 | | |
Sabine Pass Liquefaction LLC
03/01/25 | | | 5.625 | % | | | 2,012,000 | | | | 1,961,700 | | |
Targa Resources Partners LP/Finance Corp.
01/15/18 | | | 5.000 | % | | | 316,000 | | | | 317,776 | | |
11/15/19 | | | 4.125 | % | | | 137,000 | | | | 132,890 | | |
05/01/23 | | | 5.250 | % | | | 19,000 | | | | 18,240 | | |
11/15/23 | | | 4.250 | % | | | 945,000 | | | | 871,177 | | |
Targa Resources Partners LP/Finance Corp.(a)
03/15/24 | | | 6.750 | % | | | 1,664,000 | | | | 1,693,120 | | |
Tesoro Logistics LP/Finance Corp.
10/15/19 | | | 5.500 | % | | | 73,000 | | | | 74,460 | | |
10/15/22 | | | 6.250 | % | | | 1,297,000 | | | | 1,329,425 | | |
Transcontinental Gas Pipe Line Co. LLC(a)
02/01/26 | | | 7.850 | % | | | 3,110,000 | | | | 3,754,672 | | |
Western Gas Partners LP
07/01/22 | | | 4.000 | % | | | 627,000 | | | | 601,272 | | |
06/01/25 | | | 3.950 | % | | | 547,000 | | | | 491,792 | | |
Williams Companies, Inc. (The)
01/15/23 | | | 3.700 | % | | | 5,470,000 | | | | 4,593,651 | | |
06/24/24 | | | 4.550 | % | | | 1,967,000 | | | | 1,695,298 | | |
Total | | | | | | | 62,340,159 | | |
NATURAL GAS 1.3% | |
NiSource Finance Corp.
02/15/23 | | | 3.850 | % | | | 3,305,000 | | | | 3,498,554 | | |
12/15/40 | | | 6.250 | % | | | 2,571,000 | | | | 3,171,925 | | |
Sempra Energy
03/15/20 | | | 2.400 | % | | | 4,126,000 | | | | 4,157,349 | | |
11/15/20 | | | 2.850 | % | | | 8,445,000 | | | | 8,647,807 | | |
10/01/22 | | | 2.875 | % | | | 11,185,000 | | | | 11,300,485 | | |
11/15/25 | | | 3.750 | % | | | 8,395,000 | | | | 8,778,962 | | |
10/15/39 | | | 6.000 | % | | | 1,558,000 | | | | 1,892,598 | | |
Total | | | | | | | 41,447,680 | | |
The accompanying Notes to Financial Statements are an integral part of this statement.
Annual Report 2016
16
COLUMBIA TOTAL RETURN BOND FUND
PORTFOLIO OF INVESTMENTS (continued)
April 30, 2016
Corporate Bonds & Notes (continued)
Issuer | | Coupon
Rate | | Principal
Amount ($) | |
Value ($) | |
OIL FIELD SERVICES 1.0% | |
Noble Holding International Ltd.
03/15/17 | | | 2.500 | % | | | 14,860,000 | | | | 14,507,075 | | |
Noble Holding International Ltd.(b)
03/16/18 | | | 5.000 | % | | | 16,106,000 | | | | 15,783,880 | | |
Total | | | | | | | 30,290,955 | | |
OTHER FINANCIAL INSTITUTIONS —% | |
Icahn Enterprises LP/Finance Corp.
02/01/22 | | | 5.875 | % | | | 769,000 | | | | 733,434 | | |
OTHER INDUSTRY 0.4% | |
CB Richard Ellis Services, Inc.
03/15/25 | | | 5.250 | % | | | 252,000 | | | | 262,213 | | |
Massachusetts Institute of Technology
07/01/14 | | | 4.678 | % | | | 8,809,000 | | | | 9,830,148 | | |
President and Fellows of Harvard College(a)
01/15/39 | | | 6.500 | % | | | 2,525,000 | | | | 3,679,937 | | |
Total | | | | | | | 13,772,298 | | |
OTHER REIT 0.2% | |
CyrusOne LP/Finance Corp.
11/15/22 | | | 6.375 | % | | | 346,000 | | | | 365,245 | | |
Duke Realty LP
06/15/22 | | | 4.375 | % | | | 6,725,000 | | | | 7,158,527 | | |
Total | | | | | | | 7,523,772 | | |
PACKAGING 0.3% | |
Ardagh Packaging Finance PLC/Holdings U.S.A., Inc.(a)(f)
05/15/23 | | | 4.625 | % | | | 631,000 | | | | 631,000 | | |
05/15/24 | | | 7.250 | % | | | 934,000 | | | | 934,000 | | |
Ardagh Packaging Finance PLC/Holdings USA, Inc.(a)
01/31/21 | | | 6.750 | % | | | 184,000 | | | | 184,460 | | |
Ball Corp.
12/15/20 | | | 4.375 | % | | | 632,000 | | | | 657,280 | | |
Berry Plastics Corp.
07/15/23 | | | 5.125 | % | | | 763,000 | | | | 770,630 | | |
Berry Plastics Corp.(a)
10/15/22 | | | 6.000 | % | | | 1,161,000 | | | | 1,213,245 | | |
Plastipak Holdings, Inc.(a)
10/01/21 | | | 6.500 | % | | | 1,222,000 | | | | 1,240,330 | | |
Reynolds Group Issuer, Inc./LLC
10/15/20 | | | 5.750 | % | | | 2,749,000 | | | | 2,852,087 | | |
Reynolds Group Issuer, Inc./LLC(b)
02/15/21 | | | 8.250 | % | | | 1,537,000 | | | | 1,590,795 | | |
Signode Industrial Group Luxembourg SA/US, Inc.(a)
05/01/22 | | | 6.375 | % | | | 148,000 | | | | 144,300 | | |
Total | | | | | | | 10,218,127 | | |
Corporate Bonds & Notes (continued)
Issuer | | Coupon
Rate | | Principal
Amount ($) | |
Value ($) | |
PHARMACEUTICALS 1.7% | |
Actavis Funding SCS
03/12/20 | | | 3.000 | % | | | 17,341,000 | | | | 17,712,774 | | |
03/15/22 | | | 3.450 | % | | | 2,876,000 | | | | 2,946,310 | | |
Actavis Funding SCS(b)
09/01/16 | | | 1.510 | % | | | 1,690,000 | | | | 1,692,101 | | |
Concordia Healthcare Corp.(a)
04/15/23 | | | 7.000 | % | | | 176,000 | | | | 163,240 | | |
Endo Finance LLC/Finco, Inc.(a)
02/01/25 | | | 6.000 | % | | | 895,000 | | | | 854,725 | | |
Endo Finance LLC/Ltd./Finco, Inc.(a)
07/15/23 | | | 6.000 | % | | | 772,000 | | | | 757,525 | | |
Forest Laboratories LLC(a)
02/01/19 | | | 4.375 | % | | | 6,608,000 | | | | 6,973,766 | | |
Grifols Worldwide Operations Ltd.
04/01/22 | | | 5.250 | % | | | 1,720,000 | | | | 1,771,600 | | |
Jaguar Holding Co. II/Pharmaceutical Product
Development LLC(a)
08/01/23 | | | 6.375 | % | | | 1,637,000 | | | | 1,700,843 | | |
Johnson & Johnson
03/01/26 | | | 2.450 | % | | | 3,106,000 | | | | 3,124,254 | | |
12/05/33 | | | 4.375 | % | | | 3,853,000 | | | | 4,445,823 | | |
Mallinckrodt International Finance SA/CB LLC(a)
04/15/25 | | | 5.500 | % | | | 903,000 | | | | 814,957 | | |
Novartis Capital Corp.
11/20/45 | | | 4.000 | % | | | 6,092,000 | | | | 6,637,258 | | |
Quintiles Transnational Corp.(a)
05/15/23 | | | 4.875 | % | | | 267,000 | | | | 273,341 | | |
Valeant Pharmaceuticals International, Inc.(a)
10/15/20 | | | 6.375 | % | | | 485,000 | | | | 439,531 | | |
05/15/23 | | | 5.875 | % | | | 877,000 | | | | 734,487 | | |
04/15/25 | | | 6.125 | % | | | 4,789,000 | | | | 4,000,635 | | |
Total | | | | | | | 55,043,170 | | |
PROPERTY & CASUALTY 2.2% | |
Alliant Holdings I LP(a)
08/01/23 | | | 8.250 | % | | | 48,000 | | | | 47,760 | | |
Berkshire Hathaway Finance Corp.
05/15/43 | | | 4.300 | % | | | 1,240,000 | | | | 1,338,868 | | |
Berkshire Hathaway, Inc.
03/15/23 | | | 2.750 | % | | | 6,315,000 | | | | 6,513,462 | | |
03/15/26 | | | 3.125 | % | | | 12,097,000 | | | | 12,597,429 | | |
02/11/43 | | | 4.500 | % | | | 1,572,000 | | | | 1,749,362 | | |
CNA Financial Corp.
03/01/26 | | | 4.500 | % | | | 7,315,000 | | | | 7,534,121 | | |
Chubb Corp. (The)
Junior Subordinated(b)
04/15/37 | | | 6.375 | % | | | 7,481,000 | | | | 6,433,660 | | |
The accompanying Notes to Financial Statements are an integral part of this statement.
Annual Report 2016
17
COLUMBIA TOTAL RETURN BOND FUND
PORTFOLIO OF INVESTMENTS (continued)
April 30, 2016
Corporate Bonds & Notes (continued)
Issuer | | Coupon
Rate | | Principal
Amount ($) | |
Value ($) | |
HUB International Ltd.(a)
02/15/21 | | | 9.250 | % | | | 222,000 | | | | 231,435 | | |
10/01/21 | | | 7.875 | % | | | 2,630,000 | | | | 2,577,400 | | |
Hub Holdings LLC/Finance, Inc.
PIK(a)
07/15/19 | | | 8.125 | % | | | 88,000 | | | | 81,840 | | |
Liberty Mutual Group, Inc.(a)
05/01/22 | | | 4.950 | % | | | 4,055,000 | | | | 4,409,346 | | |
05/01/42 | | | 6.500 | % | | | 2,465,000 | | | | 2,898,394 | | |
Loews Corp.
04/01/26 | | | 3.750 | % | | | 18,537,000 | | | | 19,193,729 | | |
05/15/43 | | | 4.125 | % | | | 1,295,000 | | | | 1,251,757 | | |
Transatlantic Holdings, Inc.
11/30/39 | | | 8.000 | % | | | 2,955,000 | | | | 3,933,604 | | |
Total | | | | | | | 70,792,167 | | |
RAILROADS 0.3% | |
BNSF Funding Trust I
Junior Subordinated(b)
12/15/55 | | | 6.613 | % | | | 7,737,000 | | | | 8,704,125 | | |
RESTAURANTS 0.2% | |
BC ULC/New Red Finance, Inc.(a)
01/15/22 | | | 4.625 | % | | | 1,887,000 | | | | 1,934,175 | | |
Yum! Brands, Inc.
11/01/43 | | | 5.350 | % | | | 3,790,000 | | | | 3,041,475 | | |
Total | | | | | | | 4,975,650 | | |
RETAIL REIT 0.3% | |
Kimco Realty Corp.
06/01/23 | | | 3.125 | % | | | 7,953,000 | | | | 7,910,825 | | |
RETAILERS 0.9% | |
Asbury Automotive Group, Inc.
12/15/24 | | | 6.000 | % | | | 1,176,000 | | | | 1,214,220 | | |
CVS Health Corp.
07/20/45 | | | 5.125 | % | | | 1,825,000 | | | | 2,132,783 | | |
CVS Health Corp.(a)
12/01/22 | | | 4.750 | % | | | 10,965,000 | | | | 12,330,822 | | |
CVS Pass-Through Trust(a)
08/11/36 | | | 4.163 | % | | | 5,100,007 | | | | 5,080,194 | | |
Dollar Tree, Inc.(a)
03/01/23 | | | 5.750 | % | | | 1,542,000 | | | | 1,646,548 | | |
Group 1 Automotive, Inc.
06/01/22 | | | 5.000 | % | | | 381,000 | | | | 377,190 | | |
Group 1 Automotive, Inc.(a)
12/15/23 | | | 5.250 | % | | | 372,000 | | | | 370,140 | | |
L Brands, Inc.
04/01/21 | | | 6.625 | % | | | 378,000 | | | | 429,975 | | |
Corporate Bonds & Notes (continued)
Issuer | | Coupon
Rate | | Principal
Amount ($) | |
Value ($) | |
Penske Automotive Group, Inc.
12/01/24 | | | 5.375 | % | | | 1,583,000 | | | | 1,594,872 | | |
Rite Aid Corp.
06/15/21 | | | 6.750 | % | | | 80,000 | | | | 84,400 | | |
Junior Subordinated
02/15/27 | | | 7.700 | % | | | 234,000 | | | | 284,310 | | |
Rite Aid Corp.(a)
04/01/23 | | | 6.125 | % | | | 863,000 | | | | 919,639 | | |
Sally Holdings LLC/Capital, Inc.
06/01/22 | | | 5.750 | % | | | 396,000 | | | | 414,810 | | |
12/01/25 | | | 5.625 | % | | | 235,000 | | | | 250,862 | | |
Total | | | | | | | 27,130,765 | | |
TECHNOLOGY 1.0% | |
Alliance Data Systems Corp.(a)
12/01/17 | | | 5.250 | % | | | 546,000 | | | | 552,825 | | |
04/01/20 | | | 6.375 | % | | | 140,000 | | | | 143,850 | | |
08/01/22 | | | 5.375 | % | | | 870,000 | | | | 837,375 | | |
Ancestry.com, Inc.
Junior Subordinated
12/15/20 | | | 11.000 | % | | | 224,000 | | | | 244,160 | | |
Equinix, Inc.
01/01/22 | | | 5.375 | % | | | 1,628,000 | | | | 1,701,260 | | |
01/15/26 | | | 5.875 | % | | | 692,000 | | | | 732,219 | | |
First Data Corp.(a)
08/15/23 | | | 5.375 | % | | | 1,692,000 | | | | 1,749,105 | | |
12/01/23 | | | 7.000 | % | | | 1,917,000 | | | | 1,969,717 | | |
01/15/24 | | | 5.750 | % | | | 2,255,000 | | | | 2,288,825 | | |
Hewlett Packard Enterprise Co.(a)
10/15/35 | | | 6.200 | % | | | 4,408,000 | | | | 4,402,552 | | |
10/15/45 | | | 6.350 | % | | | 8,056,000 | | | | 8,031,888 | | |
Infor US, Inc.(a)
08/15/20 | | | 5.750 | % | | | 69,000 | | | | 72,709 | | |
Iron Mountain, Inc.(a)
10/01/20 | | | 6.000 | % | | | 1,272,000 | | | | 1,345,140 | | |
MSCI, Inc.(a)
11/15/24 | | | 5.250 | % | | | 701,000 | | | | 732,545 | | |
08/15/25 | | | 5.750 | % | | | 506,000 | | | | 538,257 | | |
Microsemi Corp.(a)
04/15/23 | | | 9.125 | % | | | 666,000 | | | | 732,600 | | |
NCR Corp.
12/15/23 | | | 6.375 | % | | | 218,000 | | | | 226,720 | | |
NXP BV/Funding LLC(a)
06/15/22 | | | 4.625 | % | | | 1,244,000 | | | | 1,290,650 | | |
Qualitytech LP/Finance Corp.
08/01/22 | | | 5.875 | % | | | 595,000 | | | | 609,875 | | |
Riverbed Technology, Inc.(a)
03/01/23 | | | 8.875 | % | | | 386,000 | | | | 388,895 | | |
The accompanying Notes to Financial Statements are an integral part of this statement.
Annual Report 2016
18
COLUMBIA TOTAL RETURN BOND FUND
PORTFOLIO OF INVESTMENTS (continued)
April 30, 2016
Corporate Bonds & Notes (continued)
Issuer | | Coupon
Rate | | Principal
Amount ($) | |
Value ($) | |
Sensata Technologies UK Financing Co. PLC(a)
02/15/26 | | | 6.250 | % | | | 524,000 | | | | 559,370 | | |
Solera LLC/Finance, Inc.(a)
03/01/24 | | | 10.500 | % | | | 439,000 | | | | 459,853 | | |
VeriSign, Inc.
05/01/23 | | | 4.625 | % | | | 1,445,000 | | | | 1,484,737 | | |
04/01/25 | | | 5.250 | % | | | 277,000 | | | | 284,618 | | |
Zebra Technologies Corp.
10/15/22 | | | 7.250 | % | | | 1,510,000 | | | | 1,634,726 | | |
Total | | | | | | | 33,014,471 | | |
TRANSPORTATION SERVICES 0.4% | |
FedEx Corp.
11/15/45 | | | 4.750 | % | | | 3,569,000 | | | | 3,911,288 | | |
04/01/46 | | | 4.550 | % | | | 6,517,000 | | | | 6,940,703 | | |
Hertz Corp. (The)
01/15/21 | | | 7.375 | % | | | 79,000 | | | | 81,469 | | |
10/15/22 | | | 6.250 | % | | | 158,000 | | | | 159,104 | | |
Total | | | | | | | 11,092,564 | | |
WIRELESS 0.5% | |
Numericable-SFR SA(a)
05/15/22 | | | 6.000 | % | | | 1,649,000 | | | | 1,651,144 | | |
05/01/26 | | | 7.375 | % | | | 1,475,000 | | | | 1,497,125 | | |
SBA Telecommunications, Inc.
07/15/20 | | | 5.750 | % | | | 1,528,000 | | | | 1,577,660 | | |
Sprint Communications, Inc.(a)
11/15/18 | | | 9.000 | % | | | 638,000 | | | | 674,685 | | |
03/01/20 | | | 7.000 | % | | | 2,461,000 | | | | 2,525,601 | | |
Sprint Corp.
06/15/24 | | | 7.125 | % | | | 2,372,000 | | | | 1,779,000 | | |
02/15/25 | | | 7.625 | % | | | 66,000 | | | | 49,748 | | |
T-Mobile USA, Inc.
04/28/21 | | | 6.633 | % | | | 1,010,000 | | | | 1,064,287 | | |
04/01/23 | | | 6.625 | % | | | 2,669,000 | | | | 2,852,494 | | |
01/15/26 | | | 6.500 | % | | | 1,119,000 | | | | 1,186,140 | | |
Wind Acquisition Finance SA(a)
07/15/20 | | | 4.750 | % | | | 532,000 | | | | 507,794 | | |
04/23/21 | | | 7.375 | % | | | 348,000 | | | | 309,720 | | |
Total | | | | | | | 15,675,398 | | |
WIRELINES 1.4% | |
AT&T, Inc.
03/15/22 | | | 3.800 | % | | | 3,983,000 | | | | 4,218,774 | | |
04/01/24 | | | 4.450 | % | | | 2,311,000 | | | | 2,517,807 | | |
02/17/26 | | | 4.125 | % | | | 2,045,000 | | | | 2,194,263 | | |
12/15/42 | | | 4.300 | % | | | 2,115,000 | | | | 2,006,211 | | |
05/15/46 | | | 4.750 | % | | | 1,650,000 | | | | 1,662,576 | | |
Corporate Bonds & Notes (continued)
Issuer | | Coupon
Rate | | Principal
Amount ($) | |
Value ($) | |
CenturyLink, Inc.
12/01/23 | | | 6.750 | % | | | 1,243,000 | | | | 1,224,355 | | |
04/01/24 | | | 7.500 | % | | | 499,000 | | | | 500,247 | | |
04/01/25 | | | 5.625 | % | | | 390,000 | | | | 354,214 | | |
Frontier Communications Corp.
04/15/22 | | | 8.750 | % | | | 851,000 | | | | 840,362 | | |
Frontier Communications Corp.(a)
09/15/20 | | | 8.875 | % | | | 681,000 | | | | 721,009 | | |
09/15/25 | | | 11.000 | % | | | 3,325,000 | | | | 3,358,250 | | |
Level 3 Communications, Inc.
12/01/22 | | | 5.750 | % | | | 299,000 | | | | 307,375 | | |
Level 3 Financing, Inc.
02/01/23 | | | 5.625 | % | | | 1,326,000 | | | | 1,362,465 | | |
05/01/25 | | | 5.375 | % | | | 575,000 | | | | 585,062 | | |
Level 3 Financing, Inc.(a)
03/15/26 | | | 5.250 | % | | | 226,000 | | | | 229,390 | | |
Telecom Italia SpA(a)
05/30/24 | | | 5.303 | % | | | 1,186,000 | | | | 1,242,335 | | |
Verizon Communications, Inc.
11/01/21 | | | 3.000 | % | | | 2,454,000 | | | | 2,544,170 | | |
09/15/23 | | | 5.150 | % | | | 5,579,000 | | | | 6,416,369 | | |
03/15/34 | | | 5.050 | % | | | 4,215,000 | | | | 4,626,076 | | |
08/21/46 | | | 4.862 | % | | | 4,342,000 | | | | 4,653,365 | | |
Zayo Group LLC/Capital, Inc.
04/01/23 | | | 6.000 | % | | | 2,116,000 | | | | 2,174,190 | | |
Zayo Group LLC/Capital, Inc.(a)
05/15/25 | | | 6.375 | % | | | 469,000 | | | | 487,760 | | |
Total | | | | | | | 44,226,625 | | |
Total Corporate Bonds & Notes
(Cost: $1,536,665,420) | | | | | | | 1,563,347,049 | | |
Residential Mortgage-Backed Securities — Agency 21.8% | |
Federal Home Loan Mortgage Corp.
06/01/17-
11/01/26 | | | 8.500 | % | | | 75,701 | | | | 86,031 | | |
04/01/21 | | | 9.000 | % | | | 1,309 | | | | 1,326 | | |
08/01/24-
02/01/25 | | | 8.000 | % | | | 75,115 | | | | 85,612 | | |
10/01/28-
07/01/32 | | | 7.000 | % | | | 883,995 | | | | 1,051,462 | | |
10/01/31-
07/01/37 | | | 6.000 | % | | | 2,589,209 | | | | 2,980,438 | | |
04/01/33-
06/01/33 | | | 5.500 | % | | | 1,888,198 | | | | 2,158,974 | | |
Federal Home Loan Mortgage Corp.(b)(g)
CMO IO STRIPS Series 309 Class S4
08/15/43 | | | 5.537 | % | | | 1,696,919 | | | | 385,531 | | |
The accompanying Notes to Financial Statements are an integral part of this statement.
Annual Report 2016
19
COLUMBIA TOTAL RETURN BOND FUND
PORTFOLIO OF INVESTMENTS (continued)
April 30, 2016
| Residential Mortgage-Backed Securities — Agency (continued) | |
Issuer | | Coupon
Rate | | Principal
Amount ($) | |
Value ($) | |
CMO IO STRIPS Series 337 Class S1
09/15/44 | | | 5.617 | % | | | 4,599,314 | | | | 1,118,924 | | |
CMO IO Series 311 Class S1
08/15/43 | | | 5.517 | % | | | 10,697,959 | | | | 2,182,277 | | |
CMO IO Series 326 Class S2
03/15/44 | | | 5.517 | % | | | 12,637,079 | | | | 2,883,952 | | |
Federal Home Loan Mortgage Corp.(g)
CMO IO Series 329 Class C5
06/15/43 | | | 3.500 | % | | | 23,917,970 | | | | 4,189,408 | | |
CMO IO Series 4120 Class IA
10/15/42 | | | 3.500 | % | | | 12,203,055 | | | | 2,160,185 | | |
CMO IO Series 4176 Class BI
03/15/43 | | | 3.500 | % | | | 4,132,602 | | | | 717,843 | | |
CMO IO Series 4182 Class DI
05/15/39 | | | 3.500 | % | | | 14,427,746 | | | | 1,543,851 | | |
Federal National Mortgage Association
09/01/18 | | | 10.000 | % | | | 8,580 | | | | 9,087 | | |
04/01/23 | | | 8.500 | % | | | 10,512 | | | | 11,026 | | |
06/01/24 | | | 9.000 | % | | | 17,587 | | | | 19,190 | | |
02/01/25-
08/01/27 | | | 8.000 | % | | | 119,069 | | | | 138,086 | | |
03/01/26-
07/01/38 | | | 7.000 | % | | | 2,642,883 | | | | 3,197,549 | | |
04/01/27-
06/01/32 | | | 7.500 | % | | | 239,428 | | | | 273,332 | | |
05/01/29-
08/01/38 | | | 6.000 | % | | | 15,978,089 | | | | 18,345,181 | | |
08/01/29-
12/01/43 | | | 3.000 | % | | | 49,054,845 | | | | 50,747,621 | | |
01/01/31 | | | 2.500 | % | | | 10,409,857 | | | | 10,733,869 | | |
03/01/33-
01/01/40 | | | 5.500 | % | | | 10,996,254 | | | | 12,445,695 | | |
08/01/40-
05/01/41 | | | 5.000 | % | | | 16,563,928 | | | | 18,375,964 | | |
10/01/40-
07/01/41 | | | 4.500 | % | | | 11,036,621 | | | | 12,041,771 | | |
05/01/43-
03/01/46 | | | 3.500 | % | | | 109,859,800 | | | | 115,338,743 | | |
06/01/45-
09/01/45 | | | 4.000 | % | | | 27,536,805 | | | | 29,429,838 | | |
CMO Series 1988-4 Class Z
03/25/18 | | | 9.250 | % | | | 5,432 | | | | 5,632 | | |
Federal National Mortgage Association(b)
06/01/32 | | | 1.915 | % | | | 3,799 | | | | 3,811 | | |
07/01/37 | | | 5.964 | % | | | 119,133 | | | | 119,288 | | |
Federal National Mortgage Association(b)(g)
CMO IO Series 2013-101 Class CS
10/25/43 | | | 5.461 | % | | | 7,081,777 | | | | 1,731,524 | | |
CMO IO Series 416 Class S1
11/25/42 | | | 5.661 | % | | | 4,651,668 | | | | 1,127,918 | | |
Federal National Mortgage Association(f)
05/18/31 | | | 2.500 | % | | | 27,000,000 | | | | 27,747,241 | | |
05/18/31 | | | 3.000 | % | | | 59,700,000 | | | | 62,357,731 | | |
| Residential Mortgage-Backed Securities — Agency (continued) | |
Issuer | | Coupon
Rate | | Principal
Amount ($) | |
Value ($) | |
04/15/46-
05/12/46 | | | 4.000 | % | | | 66,763,240 | | | | 71,393,654 | | |
05/12/46 | | | 3.500 | % | | | 65,675,000 | | | | 68,825,357 | | |
05/12/46 | | | 4.500 | % | | | 33,375,000 | | | | 36,338,333 | | |
Federal National Mortgage Association(g)
CMO IO Series 2012-118 Class BI
12/25/39 | | | 3.500 | % | | | 7,236,411 | | | | 867,254 | | |
CMO IO Series 2012-148 Class BI
01/25/43 | | | 3.500 | % | | | 17,290,750 | | | | 3,132,385 | | |
CMO IO Series 2012-413 Class C39
11/25/41 | | | 4.500 | % | | | 6,629,333 | | | | 1,242,689 | | |
Federal National Mortgage Association(h)
CMO PO STRIPS Series 43 Class 1
09/25/18 | | | 0.000 | % | | | 916 | | | | 903 | | |
Government National Mortgage Association
08/15/16-
10/15/16 | | | 9.000 | % | | | 104 | | | | 104 | | |
05/15/17 | | | 8.000 | % | | | 359 | | | | 362 | | |
12/15/23-
07/20/28 | | | 7.500 | % | | | 222,833 | | | | 254,066 | | |
02/15/25 | | | 8.500 | % | | | 23,357 | | | | 27,566 | | |
01/15/30 | | | 7.000 | % | | | 248,736 | | | | 303,111 | | |
Government National Mortgage Association(b)
07/20/25 | | | 1.875 | % | | | 23,204 | | | | 23,972 | | |
Government National Mortgage Association(f)
05/23/46 | | | 3.000 | % | | | 14,500,000 | | | | 15,014,298 | | |
05/23/46 | | | 3.500 | % | | | 82,250,000 | | | | 86,873,355 | | |
05/23/46 | | | 4.000 | % | | | 10,250,000 | | | | 10,974,197 | | |
Government National Mortgage Association(g)
CMO IO Series 2012-38 Class MI
03/20/42 | | | 4.000 | % | | | 9,181,006 | | | | 1,518,308 | | |
CMO IO Series 2014-184 Class CI
11/16/41 | | | 3.500 | % | | | 8,953,376 | | | | 1,345,019 | | |
CMO IO Series 2015-53 Class EI
04/16/45 | | | 3.500 | % | | | 2,309,358 | | | | 474,256 | | |
Government National Mortgage Association(i)
05/15/42 | | | 3.000 | % | | | 7,693,461 | | | | 7,966,403 | | |
Total Residential Mortgage-Backed
Securities — Agency
(Cost: $685,900,041) | | | | | | | 692,321,503 | | |
Residential Mortgage-Backed Securities — Non-Agency 4.7% | |
ASG Resecuritization Trust(a)(b)
CMO Series 2009-2 Class G70
05/24/36 | | | 3.049 | % | | | 4,335,000 | | | | 4,334,680 | | |
CMO Series 2009-2 Class G75
05/24/36 | | | 3.049 | % | | | 4,335,000 | | | | 4,368,790 | | |
The accompanying Notes to Financial Statements are an integral part of this statement.
Annual Report 2016
20
COLUMBIA TOTAL RETURN BOND FUND
PORTFOLIO OF INVESTMENTS (continued)
April 30, 2016
| Residential Mortgage-Backed Securities — Non-Agency (continued) | |
Issuer | | Coupon
Rate | | Principal
Amount ($) | |
Value ($) | |
American Mortgage Trust
Series 2093-3 Class 3A(b)(c)(d)
07/27/23 | | | 8.188 | % | | | 2,792 | | | | 1,693 | | |
Angel Oak Mortgage Trust LLC(a)
Series 2015-1
11/25/45 | | | 4.500 | % | | | 1,218,215 | | | | 1,224,866 | | |
11/25/45 | | | 5.500 | % | | | 1,500,000 | | | | 1,494,143 | | |
BCAP LLC Trust(a)
09/26/36 | | | 3.500 | % | | | 4,956,902 | | | | 4,969,502 | | |
CMO Series 2013-RR5 Class 1A1
10/26/36 | | | 3.500 | % | | | 3,738,439 | | | | 3,751,834 | | |
BCAP LLC Trust(a)(b)
08/26/36 | | | 0.553 | % | | | 2,679,676 | | | | 2,630,500 | | |
CMO Series 2012-RR10 Class 9A1 | |
10/26/35 | | | 2.903 | % | | | 1,032,974 | | | | 1,039,967 | | |
CMO Series 2014-RR3 Class 3A1
07/26/36 | | | 0.576 | % | | | 630,923 | | | | 604,946 | | |
Series 2010-RR11 Class 8A1
05/27/37 | | | 5.390 | % | | | 3,190,280 | | | | 3,209,427 | | |
BCAP LLC
Series 2013-RR2 Class 7A1(a)
07/26/36 | | | 3.000 | % | | | 2,733,087 | | | | 2,713,955 | | |
Banc of America Funding Trust
CMO Series 2012-R5 Class A(a)(b)
10/03/39 | | | 0.699 | % | | | 1,336,006 | | | | 1,331,075 | | |
Bayview Opportunity Master Fund Trust
Series 2014-16RP Class A(a)(b)
11/28/29 | | | 3.844 | % | | | 443,849 | | | | 443,661 | | |
CAM Mortgage Trust
Series 2015-1 Class A(a)(b)
07/15/64 | | | 3.500 | % | | | 424,464 | | | | 422,683 | | |
CAM Mortgage Trust
CMO Series 2016-1 Class A(a)
01/15/56 | | | 4.000 | % | | | 2,000,000 | | | | 1,996,107 | | |
COLT LLC(a)(b)
CMO Series 15-1 Class A2
12/26/45 | | | 4.189 | % | | | 1,278,911 | | | | 1,267,401 | | |
Series 2015-A Class A2
07/27/20 | | | 4.189 | % | | | 1,500,000 | | | | 1,469,850 | | |
CSMC Trust
CMO Series 2015-RPL1 Class A2(a)(b)
02/25/57 | | | 4.535 | % | | | 1,600,000 | | | | 1,529,368 | | |
Citigroup Mortgage Loan Trust, Inc.(a)
CMO Series 15-PS1 Class A1
09/25/42 | | | 3.750 | % | | | 2,293,921 | | | | 2,339,132 | | |
Citigroup Mortgage Loan Trust, Inc.(a)(b)
CMO Series 2012-7 Class 12A1
03/25/36 | | | 2.841 | % | | | 1,427,435 | | | | 1,414,897 | | |
CMO Series 2012-9 Class 1A1
02/20/36 | | | 2.743 | % | | | 3,114,184 | | | | 3,068,886 | | |
| Residential Mortgage-Backed Securities — Non-Agency (continued) | |
Issuer | | Coupon
Rate | | Principal
Amount ($) | |
Value ($) | |
CMO Series 2013-2 Class 1A1
11/25/37 | | | 2.814 | % | | | 3,378,940 | | | | 3,365,407 | | |
CMO Series 2014-11 Class 3A3
09/25/36 | | | 0.593 | % | | | 601,000 | | | | 549,377 | | |
CMO Series 2014-12 Class 3A1
10/25/35 | | | 3.217 | % | | | 7,435,558 | | | | 7,467,837 | | |
CMO Series 2014-2 Class 3A3
08/25/37 | | | 0.573 | % | | | 1,000,000 | | | | 942,839 | | |
CMO Series 2014-C Class A
02/25/54 | | | 3.250 | % | | | 1,231,694 | | | | 1,164,162 | | |
Series 2013-11 Class 3A3
09/25/34 | | | 2.632 | % | | | 863,740 | | | | 824,346 | | |
Citigroup Mortgage Loan Trust, Inc.(b)
CMO Series 2015-A Class A4 | |
06/25/58 4.250% 4,230,100 4,388,673
CMO Series 2015-A Class B3
06/25/58 | | | 4.500 | % | | | 980,386 | | | | 944,050 | | |
Citigroup Mortgage Loan Trust, Inc.(g)
CMO IO Series 2015-A Class A1IO
06/25/58 | | | 1.000 | % | | | 20,340,931 | | | | 680,260 | | |
Credit Suisse Mortgage Capital Certificates(a)
CMO Series 2010-9R Class 1A5
08/27/37 | | | 4.000 | % | | | 1,000,000 | | | | 975,912 | | |
Credit Suisse Mortgage Capital Certificates(a)(b)
CMO Series 2009-14R Class 4A9
10/26/35 | | | 2.903 | % | | | 7,740,000 | | | | 7,836,049 | | |
CMO Series 2011-12R Class 3A1
07/27/36 | | | 2.257 | % | | | 3,371,432 | | | | 3,317,842 | | |
CMO Series 2011-16R Class 7A3
12/27/36 | | | 3.500 | % | | | 865,921 | | | | 866,278 | | |
CMO Series 2011-17R Class 3A1
10/27/35 | | | 2.433 | % | | | 800,207 | | | | 797,571 | | |
CMO Series 2014-RPL4 Class A1
08/25/62 | | | 3.625 | % | | | 8,843,028 | | | | 8,726,561 | | |
CMO Series 2014-RPL4 Class A2
08/25/62 | | | 4.664 | % | | | 3,500,000 | | | | 3,388,306 | | |
Series 2012-11 Class 3A2
06/29/47 | | | 1.435 | % | | | 1,058,140 | | | | 946,758 | | |
Credit Suisse Securities (USA) LLC(a)
CMO Series 2014-RPL1 Class A3
02/25/54 | | | 4.154 | % | | | 500,000 | | | | 491,752 | | |
Credit Suisse Securities (USA) LLC(a)(b)
CMO Series 2014-RPL1 Class A1
02/25/54 | | | 3.250 | % | | | 7,807,433 | | | | 7,699,580 | | |
JPMorgan Resecuritization Trust(a)
CMO Series 2014-5 Class 6A
09/27/36 | | | 4.000 | % | | | 2,549,219 | | | | 2,553,133 | | |
JPMorgan Resecuritization Trust(a)(b)
CMO Series 2014-1 Class 1016
03/26/36 | | | 2.844 | % | | | 4,210,000 | | | | 4,166,765 | | |
Morgan Stanley Re-Remic Trust
CMO Series 2010-R1 Class 2B(a)(b)
07/26/35 | | | 2.725 | % | | | 3,150,000 | | | | 3,117,978 | | |
The accompanying Notes to Financial Statements are an integral part of this statement.
Annual Report 2016
21
COLUMBIA TOTAL RETURN BOND FUND
PORTFOLIO OF INVESTMENTS (continued)
April 30, 2016
| Residential Mortgage-Backed Securities — Non-Agency (continued) | |
Issuer | | Coupon
Rate | | Principal
Amount ($) | |
Value ($) | |
NRPL Trust
Series 2014-1A Class A1(a)(b)
04/25/54 | | | 3.250 | % | | | 1,716,781 | | | | 1,714,549 | | |
NZES
Series 2015-PLS1 Class A(a)(b)
04/25/17 | | | 5.689 | % | | | 845,684 | | | | 838,274 | | |
Nomura Asset Acceptance Corp. Alternative Loan Trust(b)
CMO Series 2007-1 Class 1A3 (AGM)
03/25/47 | | | 5.957 | % | | | 360,840 | | | | 362,536 | | |
CMO Series 2007-1 Class 1A4 (AGM)
03/25/47 | | | 6.138 | % | | | 2,286,223 | | | | 2,296,936 | | |
Nomura Resecuritization Trust(a)(b)
CMO Series 2012-3R Class 1A1
01/26/37 | | | 0.397 | % | | | 2,987,808 | | | | 2,885,505 | | |
CMO Series 2014-6R Class 3A1
01/26/36 | | | 0.693 | % | | | 5,353,846 | | | | 5,022,790 | | |
Pretium Mortgage Credit Partners I(a)(b)
Series 2015-NPL1 Class A1
05/27/30 | | | 3.625 | % | | | 3,069,239 | | | | 3,039,660 | | |
Series 2015-NPL1 Class A2
05/28/30 | | | 4.250 | % | | | 1,000,000 | | | | 953,438 | | |
Pretium Mortgage Credit Partners
Series 2015-NPL2 Class A1(a)(b)
07/27/30 | | | 3.750 | % | | | 881,037 | | | | 874,328 | | |
Sequoia Mortgage Trust
CMO Series 2004-6 Class B2(b)
07/20/34 | | | 1.759 | % | | | 871,166 | | | | 293,466 | | |
Structured Asset Securities Corp. Mortgage Pass-Through
Certificates
CMO Series 2004-21XS Class 2A6A(b)
12/25/34 | | | 5.240 | % | | | 30,932 | | | | 31,421 | | |
Towd Point Mortgage Trust(a)
CMO Series 2015-4 Class A1
04/25/55 | | | 3.500 | % | | | 4,214,924 | | | | 4,304,145 | | |
Towd Point Mortgage Trust(a)(f)
CMO Series 2016-1 Class A1
02/25/55 | | | 3.500 | % | | | 7,465,034 | | | | 7,630,324 | | |
VML LLC
CMO Series 2014-NPL1 Class A1(a)
04/27/54 | | | 3.875 | % | | | 2,001,545 | | | | 1,991,639 | | |
Vericrest Opportunity Loan Transferee
CMO Series 2015-NPL4 Class A1(a)
02/25/55 | | | 3.500 | % | | | 1,846,336 | | | | 1,831,370 | | |
VOLT XLIV LLC
CMO Series 2016-NPL4 Class A1(a)(b)
04/25/46 | | | 4.250 | % | | | 3,000,000 | | | | 2,997,353 | | |
Total Residential Mortgage-Backed
Securities — Non-Agency
(Cost: $149,063,998) | | | | | | | 147,906,533 | | |
Commercial Mortgage-Backed Securities —
Non-Agency 6.3% | |
Issuer | | Coupon
Rate | | Principal
Amount ($) | |
Value ($) | |
1211 Avenue of the Americas Trust
Series 2015-1211 Class E(a)(b)
08/10/35 | | | 4.280 | % | | | 1,500,000 | | | | 1,310,063 | | |
American Homes 4 Rent Trust(a)
Series 2014-SFR3 Class A
12/17/36 | | | 3.678 | % | | | 1,562,779 | | | | 1,644,480 | | |
Series 2015-SFR2 Class A
10/17/45 | | | 3.732 | % | | | 4,536,674 | | | | 4,791,107 | | |
American Homes 4 Rent(a)
Series 2015-SFR1 Class F
04/17/52 | | | 5.885 | % | | | 1,000,000 | | | | 945,891 | | |
American Homes 4 Rent(a)(b)
Series 2014-SFR1 Class E
06/17/31 | | | 2.933 | % | | | 500,000 | | | | 477,234 | | |
Series 2014-SFR1 Class F
06/17/31 | | | 3.683 | % | | | 1,300,000 | | | | 1,232,875 | | |
B2R Mortgage Trust
Series 2015-2 Class E(a)(b)
11/15/48 | | | 5.672 | % | | | 500,000 | | | | 455,881 | | |
BAMLL Re-REMIC Trust
CMO PO Series 2013-FRR1 Class A1(a)(h)
12/26/20 | | | 0.000 | % | | | 2,000,000 | | | | 1,539,683 | | |
BB-UBS Trust
Subordinated, Series 2012-SHOW Class D(a)(b)
11/05/36 | | | 4.160 | % | | | 3,000,000 | | | | 3,011,703 | | |
BHMS Mortgage Trust
Series 2014-ATLS Class DFX(a)(b)
07/05/33 | | | 4.847 | % | | | 1,500,000 | | | | 1,442,894 | | |
Banc of America Merrill Lynch Commercial Mortgage
Securities Trust
Series 2015-200P Class A(a)
04/14/33 | | | 3.218 | % | | | 6,600,000 | | | | 6,849,813 | | |
Banc of America Merrill Lynch Re-Remic Trust
Series 2015-FR11 Class A705(a)(b)
09/27/44 | | | 1.880 | % | | | 1,000,000 | | | | 914,601 | | |
CGGS Commercial Mortgage Trust
Series 2016-RNDA Class AFX(a)
02/10/33 | | | 2.757 | % | | | 14,000,000 | | | | 14,200,802 | | |
CSAIL Commercial Mortgage Trust
Series 2015-C2 Class A3
06/15/57 | | | 3.231 | % | | | 1,695,000 | | | | 1,757,983 | | |
Capmark Mortgage Securities, Inc.
CMO IO Series 1997-C1 Class X(b)(g)
07/15/29 | | | 1.666 | % | | | 1,775,326 | | | | 50,365 | | |
Citigroup Commercial Mortgage Trust
Series 2015-GC29 Class A3
04/10/48 | | | 2.935 | % | | | 2,215,000 | | | | 2,239,927 | | |
Series 2016-P3 Class A3
04/15/49 | | | 3.063 | % | | | 7,800,000 | | | | 7,864,630 | | |
The accompanying Notes to Financial Statements are an integral part of this statement.
Annual Report 2016
22
COLUMBIA TOTAL RETURN BOND FUND
PORTFOLIO OF INVESTMENTS (continued)
April 30, 2016
Commercial Mortgage-Backed Securities —
Non-Agency (continued) | |
Issuer | | Coupon
Rate | | Principal
Amount ($) | |
Value ($) | |
Series 2016-P3 Class A4
04/15/49 | | | 3.329 | % | | | 9,800,000 | | | | 10,150,160 | | |
Commercial Mortgage Trust
Series 2015-LC19 Class A4
02/10/48 | | | 3.183 | % | | | 2,455,000 | | | | 2,559,297 | | |
Credit Suisse Commercial Mortgage Trust
Series 2007-C3 Class A4(b)
06/15/39 | | | 5.888 | % | | | 2,105,063 | | | | 2,165,029 | | |
Credit Suisse Mortgage Capital Certificates
Series 2010-RR4 Class 2A(a)
09/18/39 | | | 5.467 | % | | | 1,400,358 | | | | 1,399,895 | | |
DBUBS Mortgage Trust
Series 2011-LC2A Class A4(a)
07/10/44 | | | 4.537 | % | | | 10,865,000 | | | | 12,055,706 | | |
Deutsche Bank Commercial Mortgage Trust
Series 2016-C1 Class A4(d)
05/10/49 | | | 3.276 | % | | | 2,685,000 | | | | 2,799,113 | | |
General Electric Capital Assurance Co.
Series 2003-1 Class A5(a)
05/12/35 | | | 5.743 | % | | | 2,517,249 | | | | 2,722,861 | | |
Invitation Homes Trust(a)(b)
Series 2015-SFR3 Class E
08/17/32 | | | 4.183 | % | | | 3,000,000 | | | | 2,935,809 | | |
Series 2015-SFR3 Class F
08/17/32 | | | 5.183 | % | | | 4,000,000 | | | | 3,916,197 | | |
Subordinated, Series 2014-SFR3 Class E
12/17/31 | | | 4.933 | % | | | 1,965,000 | | | | 1,944,163 | | |
Subordinated, Series 2014-SFR3 Class F
12/17/31 | | | 5.433 | % | | | 1,000,000 | | | | 987,571 | | |
Subordinated, Series 2015-SFR1 Class E
03/17/32 | | | 4.633 | % | | | 2,250,000 | | | | 2,204,789 | | |
Subordinated, Series 2015-SFR2 Class E
06/17/32 | | | 3.583 | % | | | 749,000 | | | | 721,532 | | |
Subordinated, Series 2015-SFR2 Class F
06/17/32 | | | 4.133 | % | | | 800,000 | | | | 749,755 | | |
JPMBB Commercial Mortgage Securities Trust
Series 2014-C26 Class A3
01/15/48 | | | 3.231 | % | | | 765,000 | | | | 797,707 | | |
Series 2015-C27 Class A4
02/15/48 | | | 3.179 | % | | | 3,593,000 | | | | 3,706,211 | | |
Series 2015-C28 Class A3
10/15/48 | | | 2.912 | % | | | 9,955,000 | | | | 10,076,201 | | |
Series 2015-C28 Class A4
10/15/48 | | | 3.227 | % | | | 6,510,000 | | | | 6,727,011 | | |
JPMCC Re-REMIC Trust(a)(b)
Series 2016-GG10 Class AMA
04/15/36 | | | 5.987 | % | | | 9,500,000 | | | | 9,630,591 | | |
Series 2016-GG10 Class AMB
04/15/36 | | | 5.987 | % | | | 4,000,000 | | | | 3,991,276 | | |
JPMorgan Commercial Mortgage-Backed Securities Trust
Series 2009-RR1 Class A4B1(a)
03/18/51 | | | 1.000 | % | | | 2,500,000 | | | | 2,383,965 | | |
Commercial Mortgage-Backed Securities —
Non-Agency (continued) | |
Issuer | | Coupon
Rate | | Principal
Amount ($) | |
Value ($) | |
LB Commercial Mortgage Trust
Series 2007-C3 Class AM(b)
07/15/44 | | | 6.096 | % | | | 4,640,000 | | | | 4,814,975 | | |
LB-UBS Commercial Mortgage Trust
Series 2007-C2 Class A3
02/15/40 | | | 5.430 | % | | | 4,536,698 | | | | 4,622,338 | | |
LB-UBS Commercial Mortgage Trust(b)
Series 2006-C4 Class AM
06/15/38 | | | 6.116 | % | | | 2,585,000 | | | | 2,591,175 | | |
Merrill Lynch Mortgage Investors Trust
CMO IO Series 1998-C3 Class IO(b)(g)
12/15/30 | | | 1.078 | % | | | 2,020,611 | | | | 22,188 | | |
Morgan Stanley Bank of America Merrill Lynch Trust
Series 2015-C20 Class A3
02/15/48 | | | 2.988 | % | | | 2,560,000 | | | | 2,604,446 | | |
Series 2015-C21 Class A3
03/15/48 | | | 3.077 | % | | | 2,745,000 | | | | 2,805,170 | | |
Morgan Stanley Capital I Trust
Series 2014-150E Class A(a)
09/09/32 | | | 3.912 | % | | | 4,080,000 | | | | 4,395,273 | | |
Morgan Stanley Re-Remic Trust(a)(b)
Series 2009-GG10 Class A4B
08/12/45 | | | 5.987 | % | | | 4,285,000 | | | | 4,383,496 | | |
Series 2010-GG10 Class A4B
08/15/45 | | | 5.987 | % | | | 2,665,000 | | | | 2,726,259 | | |
ORES NPL LLC(a)
Series 2013-LV2 Class A
09/25/25 | | | 3.081 | % | | | 133,800 | | | | 133,131 | | |
Series 2014-LV3 Class A
03/27/24 | | | 3.000 | % | | | 1,809,824 | | | | 1,809,824 | | |
Rialto Real Estate Fund LLC(a)
Series 2014-LT6 Class A
09/15/24 | | | 2.750 | % | | | 605,160 | | | | 603,759 | | |
Subordinated, Series 2015-LT7 Class B
12/25/32 | | | 5.071 | % | | | 2,000,000 | | | | 1,999,642 | | |
Rialto Real Estate Fund LP(a)
Series 2014-LT5 Class A
05/15/24 | | | 2.850 | % | | | 548,911 | | | | 547,851 | | |
Series 2014-LT6 Class B
09/15/24 | | | 5.486 | % | | | 1,000,000 | | | | 999,765 | | |
VFC LLC(a)
Series 2014-2 Class A
07/20/30 | | | 2.750 | % | | | 1,801 | | | | 1,801 | | |
Subordinated, Series 2015-3 Class B
12/20/31 | | | 4.750 | % | | | 500,000 | | | | 499,833 | | |
WF-RBS Commercial Mortgage Trust
Series 2014-C24 Class A5
11/15/47 | | | 3.607 | % | | | 3,180,000 | | | | 3,395,884 | | |
Wells Fargo Commercial Mortgage Trust
Series 2015-C26 Class A4
02/15/48 | | | 3.166 | % | | | 5,425,000 | | | | 5,597,367 | | |
The accompanying Notes to Financial Statements are an integral part of this statement.
Annual Report 2016
23
COLUMBIA TOTAL RETURN BOND FUND
PORTFOLIO OF INVESTMENTS (continued)
April 30, 2016
Commercial Mortgage-Backed Securities —
Non-Agency (continued) | |
Issuer | | Coupon
Rate | | Principal
Amount ($) | |
Value ($) | |
Series 2015-C27 Class A4
02/15/48 | | | 3.190 | % | | | 4,975,000 | | | | 5,144,251 | | |
Series 2015-LC20 Class A4
04/15/50 | | | 2.925 | % | | | 4,460,000 | | | | 4,520,261 | | |
Series 2015-LC20 Class A5
04/15/50 | | | 3.184 | % | | | 5,170,000 | | | | 5,335,103 | | |
Series 2016-C33 Class A3
03/15/59 | | | 3.162 | % | | | 2,000,000 | | | | 2,030,849 | | |
Series 2016-C33 Class A4
03/15/59 | | | 3.426 | % | | | 2,200,000 | | | | 2,304,024 | | |
Total Commercial Mortgage-Backed
Securities — Non-Agency
(Cost: $200,053,508) | | | | | | | 199,243,436 | | |
Asset-Backed Securities — Agency 1.1% | |
United States Small Business Administration
Series 2012-20C Class 1
03/01/32 | | | 2.510 | % | | | 938,438 | | | | 958,910 | | |
Series 2012-20G Class 1
07/01/32 | | | 2.380 | % | | | 1,536,771 | | | | 1,558,308 | | |
Series 2012-20L Class 1
12/01/32 | | | 1.930 | % | | | 1,650,445 | | | | 1,636,739 | | |
Series 2013-20A Class 1
01/01/33 | | | 2.130 | % | | | 3,945,685 | | | | 3,955,471 | | |
Series 2013-20C Class 1
03/01/33 | | | 2.220 | % | | | 8,229,068 | | | | 8,299,850 | | |
Series 2013-20G Class 1
07/01/33 | | | 3.150 | % | | | 2,493,639 | | | | 2,608,856 | | |
Series 2013-20L Class 1
12/01/33 | | | 3.380 | % | | | 1,535,417 | | | | 1,626,401 | | |
Series 2014-20C Class 1
03/01/34 | | | 3.210 | % | | | 1,965,315 | | | | 2,066,953 | | |
Series 2014-20D Class 1
04/01/34 | | | 3.110 | % | | | 6,362,201 | | | | 6,690,342 | | |
Series 2014-20F Class 1
06/01/34 | | | 2.990 | % | | | 4,017,862 | | | | 4,171,679 | | |
Series 2015-20C Class 1
03/01/35 | | | 2.720 | % | | | 1,492,152 | | | | 1,524,312 | | |
Total Asset-Backed Securities — Agency
(Cost: $34,016,993) | | | | | | | 35,097,821 | | |
Asset-Backed Securities — Non-Agency 15.9% | |
A Voce CLO Ltd.(a)(b)
Series 2014-1A Class A1B
07/15/26 | | | 2.088 | % | | | 4,690,000 | | | | 4,639,728 | | |
Series 2014-1A Class A2A
07/15/26 | | | 2.628 | % | | | 3,375,000 | | | | 3,234,151 | | |
Asset-Backed Securities — Non-Agency (continued)
| |
Issuer | | Coupon
Rate | | Principal
Amount ($) | |
Value ($) | |
ARI Fleet Lease Trust
Series 2014-A Class A2(a)
11/15/22 | | | 0.810 | % | | | 663,646 | | | | 662,840 | | |
Ally Auto Receivables Trust
Series 2015-SN1 Class A2B(b)
06/20/17 | | | 0.819 | % | | | 3,275,383 | | | | 3,276,258 | | |
AmeriCredit Automobile Receivables Trust
Series 2016-2 Class A2B(b)
10/08/19 | | | 1.137 | % | | | 2,545,000 | | | | 2,544,999 | | |
Apidos CDO V(a)(b)
Series 2007-5A Class A1
04/15/21 | | | 0.868 | % | | | 2,036,138 | | | | 2,009,088 | | |
Series 2007-5A Class A1S
04/15/21 | | | 0.858 | % | | | 1,114,372 | | | | 1,104,914 | | |
Apidos CLO XXII
Series 2015-22A Class D(a)(b)
10/20/27 | | | 6.634 | % | | | 1,000,000 | | | | 883,271 | | |
Ares CLO Ltd.
Series 2014-32A Class C(a)(b)
11/15/25 | | | 4.818 | % | | | 1,500,000 | | | | 1,417,501 | | |
Ares XXX CLO Ltd.
Series 2014-30A Class A2(a)(b)
04/20/23 | | | 1.484 | % | | | 3,331,508 | | | | 3,293,806 | | |
Ares XXXVII CLO Ltd.
Series 2015-4A Class D1(a)(b)
10/15/26 | | | 7.428 | % | | | 1,000,000 | | | | 927,170 | | |
Ares XXXVIII CLO Ltd.(a)(b)
01/20/27 | | | 6.714 | % | | | 1,500,000 | | | | 1,347,200 | | |
Ascentium Equipment Receivables LLC
Series 2015-2A Class A2(a)
12/11/17 | | | 1.570 | % | | | 2,895,000 | | | | 2,898,391 | | |
Ascentium Equipment Receivables
Series 2015-1A Class A2(a)
07/10/17 | | | 1.150 | % | | | 922,148 | | | | 921,943 | | |
Avery Point VII CLO Ltd.(a)(b)
01/15/28 | | | 7.186 | % | | | 1,400,000 | | | | 1,288,255 | | |
Avis Budget Rental Car Funding AESOP LLC
Series 2015-2A Class A(a)
12/20/21 | | | 2.630 | % | | | 6,385,000 | | | | 6,371,739 | | |
BMW Vehicle Owner Trust
Series 2013-A Class A3
11/27/17 | | | 0.670 | % | | | 986,353 | | | | 986,259 | | |
Barclays Dryrock Issuance Trust
Series 2014-1 Class A(b)
12/16/19 | | | 0.793 | % | | | 5,140,000 | | | | 5,140,081 | | |
Bellemeade Re II Ltd.
CMO Series 2016-1 Class M2A(a)(b)(f)
04/25/26 | | | 4.933 | % | | | 1,000,000 | | | | 1,000,000 | | |
The accompanying Notes to Financial Statements are an integral part of this statement.
Annual Report 2016
24
COLUMBIA TOTAL RETURN BOND FUND
PORTFOLIO OF INVESTMENTS (continued)
April 30, 2016
| Asset-Backed Securities — Non-Agency (continued) | |
Issuer | | Coupon
Rate | | Principal
Amount ($) | |
Value ($) | |
Betony CLO Ltd.
Series 2015-1A Class E(a)(b)
04/15/27 | | | 5.978 | % | | | 2,000,000 | | | | 1,615,516 | | |
CNH Wholesale Master Note Trust
Series 2013-2A Class A(a)(b)
08/15/19 | | | 1.033 | % | | | 4,160,000 | | | | 4,160,712 | | |
Cabela's Credit Card Master Note Trust
Series 2015-2 Class A1
07/17/23 | | | 2.250 | % | | | 5,640,000 | | | | 5,690,896 | | |
Cabela's Credit Card Master Note Trust(a)(b)
Series 2012-1A Class A2
02/18/20 | | | 0.963 | % | | | 2,010,000 | | | | 2,009,902 | | |
Cabela's Master Credit Card Trust
Series 2014-1 Class A(b)
03/16/20 | | | 0.783 | % | | | 1,820,000 | | | | 1,819,778 | | |
Capital One Multi-Asset Execution Trust
Series 2015-A2 Class A2
03/15/23 | | | 2.080 | % | | | 5,990,000 | | | | 6,089,297 | | |
Carlyle Global Market Strategies CLO Ltd.(a)(b)
Series 2016-1A Class A2
04/20/27 | | | 2.984 | % | | | 7,300,000 | | | | 7,299,876 | | |
Series 2016-1A Class D
04/20/27 | | | 8.234 | % | | | 1,200,000 | | | | 1,149,922 | | |
Carlyle Global Market Strategies CLO(a)(b)
Series 2014-3A Class A1B
07/27/26 | | | 1.969 | % | | | 9,050,000 | | | | 9,046,516 | | |
Series 2015-4A Class D
10/20/27 | | | 6.444 | % | | | 1,300,000 | | | | 1,157,555 | | |
Series 2015-5A Class C
01/20/28 | | | 4.542 | % | | | 1,500,000 | | | | 1,434,651 | | |
Chesapeake Funding LLC(a)(b)
Series 2011-2A Class A
04/07/24 | | | 1.689 | % | | | 477,406 | | | | 479,176 | | |
Series 2012-2A Class A
05/07/24 | | | 0.889 | % | | | 290,648 | | | | 290,556 | | |
Series 2013-1A Class A
01/07/25 | | | 0.889 | % | | | 1,061,121 | | | | 1,060,526 | | |
Series 2014-1A Class A
03/07/26 | | | 0.859 | % | | | 11,940,871 | | | | 11,910,648 | | |
Citibank Credit Card Issuance Trust
Series 2014-A5 Class A5
06/07/23 | | | 2.680 | % | | | 4,075,000 | | | | 4,240,104 | | |
Citigroup Mortgage Loan Trust, Inc.
CMO Series 2005-WF2 Class MF1(b)
08/25/35 | | | 5.308 | % | | | 130,880 | | | | 707 | | |
Cole Park CLO Ltd.
Series 2015 Class E(a)(b)
10/20/28 | | | 6.734 | % | | | 1,000,000 | | | | 889,981 | | |
Conn's Receivables Funding LLC(a)
Series 2016-A Class A
04/16/18 | | | 4.680 | % | | | 5,386,329 | | | | 5,407,370 | | |
| Asset-Backed Securities — Non-Agency (continued) | |
Issuer | | Coupon
Rate | | Principal
Amount ($) | |
Value ($) | |
Subordinated, Series 2016-A Class B
08/15/18 | | | 8.960 | % | | | 1,000,000 | | | | 1,010,000 | | |
Conseco Financial Corp.
Series 1997-6 Class A10
01/15/29 | | | 6.870 | % | | | 81,029 | | | | 81,872 | | |
Contimortgage Home Equity Loan Trust
CMO Series 1996-4 Class A9 (NPFGC)
01/15/28 | | | 6.880 | % | | | 20,587 | | | | 20,194 | | |
Countrywide Home Equity Loan Trust
CMO Series 2007-S2 Class A3 (NPFGC)
05/25/37 | | | 5.813 | % | | | 1,580,451 | | | | 1,566,460 | | |
CMO Series 2007-S2 Class A6 (NPFGC)
05/25/37 | | | 5.779 | % | | | 1,515,342 | | | | 1,506,831 | | |
DT Auto Owner Trust
Subordinated, Series 2014-1A Class D(a)
01/15/21 | | | 3.980 | % | | | 4,350,000 | | | | 4,395,515 | | |
Dell Equipment Finance Trust
Series 2015-2 Class A2B(a)(b)
12/22/17 | | | 1.341 | % | | | 1,535,000 | | | | 1,534,914 | | |
Discover Card Execution Note Trust
Series 2012-A6 Class A6
01/18/22 | | | 1.670 | % | | | 2,880,000 | | | | 2,898,949 | | |
Series 2015-A2 Class A
10/17/22 | | | 1.900 | % | | | 9,135,000 | | | | 9,255,253 | | |
Dryden Senior Loan Fund
Series 2014-33A Class B(a)(b)
07/15/26 | | | 2.628 | % | | | 3,050,000 | | | | 3,018,847 | | |
Dryden XXIV Senior Loan Fund
Series 2012-24RA Class AR(a)(b)
11/15/23 | | | 1.908 | % | | | 5,405,000 | | | | 5,388,699 | | |
Enterprise Fleet Financing LLC(a)
Series 2013-2 Class A2
03/20/19 | | | 1.060 | % | | | 1,028,248 | | | | 1,027,577 | | |
Series 2015-1 Class A2
09/20/20 | | | 1.300 | % | | | 5,614,681 | | | | 5,605,026 | | |
Series 2015-2 Class A2
02/22/21 | | | 1.590 | % | | | 4,814,499 | | | | 4,814,087 | | |
Ford Credit Auto Owner Trust
Series 2013-B Class A3
10/15/17 | | | 0.570 | % | | | 61,687 | | | | 61,683 | | |
Ford Credit Auto Owner Trust(a)
Series 2014-2 Class A
04/15/26 | | | 2.310 | % | | | 11,055,000 | | | | 11,207,718 | | |
Series 2015-1 Class A
07/15/26 | | | 2.120 | % | | | 19,335,000 | | | | 19,524,651 | | |
Series 2015-2 Class A
01/15/27 | | | 2.440 | % | | | 5,695,000 | | | | 5,782,344 | | |
Ford Credit Floorplan Master Owner Trust
Series 2013-2 Class A(a)
03/15/22 | | | 2.090 | % | | | 8,300,000 | | | | 8,374,391 | | |
The accompanying Notes to Financial Statements are an integral part of this statement.
Annual Report 2016
25
COLUMBIA TOTAL RETURN BOND FUND
PORTFOLIO OF INVESTMENTS (continued)
April 30, 2016
| Asset-Backed Securities — Non-Agency (continued) | |
Issuer | | Coupon
Rate | | Principal
Amount ($) | |
Value ($) | |
GCAT LLC
CMO Series 2014-2 Class A1(a)(b)
10/25/19 | | | 3.721 | % | | | 1,696,617 | | | | 1,679,988 | | |
GE Dealer Floorplan Master Note Trust(b)
Series 2012-2 Class A
04/22/19 | | | 1.189 | % | | | 4,480,000 | | | | 4,488,716 | | |
Series 2014-1 Class A
07/20/19 | | | 0.819 | % | | | 7,625,000 | | | | 7,591,437 | | |
Series 2015-1 Class A
01/20/20 | | | 0.939 | % | | | 7,845,000 | | | | 7,825,305 | | |
GFT Mortgage Loan Trust
CMO Series 2015-GFT1 Class A(a)(b)
01/25/55 | | | 3.721 | % | | | 2,993,388 | | | | 2,957,467 | | |
GM Financial Automobile Leasing Trust
Series 2015-1 Class A2
12/20/17 | | | 1.100 | % | | | 9,867,080 | | | | 9,873,399 | | |
Golden Credit Card Trust
Series 2015-3A Class A(a)(b)
07/15/19 | | | 0.853 | % | | | 5,555,000 | | | | 5,545,002 | | |
Goldentree Loan Opportunities VIII Ltd.
Series 2014-8A Class A(a)(b)
04/19/26 | | | 2.083 | % | | | 4,880,000 | | | | 4,860,758 | | |
GreatAmerica Leasing Receivables Funding LLC
Series 2015-1 Class A2(a)
06/20/17 | | | 1.120 | % | | | 1,865,327 | | | | 1,867,201 | | |
Green Tree Agency Advance Funding Trust I
Series 2015-T1 Class AT1(a)
10/15/46 | | | 2.302 | % | | | 6,085,000 | | | | 6,078,002 | | |
Harley-Davidson Motorcycle Trust(b)
Series 2014-1 Class A2B
04/15/18 | | | 0.603 | % | | | 11,690 | | | | 11,689 | | |
Series 2015-1 Class A2B
01/15/19 | | | 0.733 | % | | | 1,483,931 | | | | 1,483,931 | | |
Hertz Fleet Lease Funding LP(a)(b)
Series 2013-3 Class A
12/10/27 | | | 0.987 | % | | | 4,658,983 | | | | 4,662,270 | | |
Series 2014-1 Class A
04/10/28 | | | 0.837 | % | | | 2,414,848 | | | | 2,415,878 | | |
Series 2015-1 Class A
07/10/29 | | | 1.007 | % | | | 7,925,000 | | | | 7,945,361 | | |
Series 2016-1 Class A1
04/10/30 | | | 1.439 | % | | | 9,335,000 | | | | 9,334,066 | | |
Hertz Vehicle Financing II LP
Series 2015-3A Class A(a)
09/25/21 | | | 2.670 | % | | | 2,870,000 | | | | 2,867,648 | | |
Hertz Vehicle Financing LLC
Series 2016-1A Class A(a)
03/25/20 | | | 2.320 | % | | | 2,600,000 | | | | 2,598,195 | | |
Honda Auto Receivables Owner Trust
Series 2013-4 Class A3
09/18/17 | | | 0.690 | % | | | 222,884 | | | | 222,824 | | |
| Asset-Backed Securities — Non-Agency (continued) | |
Issuer | | Coupon
Rate | | Principal
Amount ($) | |
Value ($) | |
Huntington Auto Trust
Series 2015-1 Class A2
10/16/17 | | | 0.760 | % | | | 2,235,086 | | | | 2,235,000 | | |
Hyundai Auto Lease Securitization Trust
Series 2015-B Class A2A(a)
12/15/17 | | | 0.950 | % | | | 5,972,703 | | | | 5,969,713 | | |
Hyundai Floorplan Master Owner Trust(a)(b)
Series 2013-1A Class A
05/15/18 | | | 0.783 | % | | | 10,155,000 | | | | 10,154,261 | | |
Series 2016-1A Class A1
03/15/21 | | | 1.340 | % | | | 1,425,000 | | | | 1,424,857 | | |
John Deere Owner Trust
Series 2016-A Class A2
10/15/18 | | | 1.150 | % | | | 3,520,000 | | | | 3,514,521 | | |
MMAF Equipment Finance LLC
Series 2014-AA Class A2(a)
04/10/17 | | | 0.520 | % | | | 1,438,869 | | | | 1,438,686 | | |
Mercedes-Benz Master Owner Trust
Series 2015-AA Class A(a)(b)
04/15/19 | | | 0.753 | % | | | 9,420,000 | | | | 9,408,216 | | |
Mountain View Funding CLO
Series 2007-3A Class A1(a)(b)
04/16/21 | | | 0.848 | % | | | 6,424,808 | | | | 6,401,929 | | |
NRZ Advance Receivables Trust(a)
Series 2015-T1 Class AT1
08/15/46 | | | 2.315 | % | | | 7,585,000 | | | | 7,582,630 | | |
Series 2015-T3 Class AT3
11/15/46 | | | 2.540 | % | | | 6,120,000 | | | | 6,124,005 | | |
New York City Tax Lien Trust
Series 2015-A Class A(a)
11/10/28 | | | 1.340 | % | | | 1,738,646 | | | | 1,727,705 | | |
Nissan Auto Receivables Owner Trust
Series 2015-A Class A1(b)
01/15/20 | | | 0.833 | % | | | 5,895,000 | | | | 5,881,571 | | |
OZLM VII Ltd.
Series 2014-7A Class A2A(a)(b)
07/17/26 | | | 2.683 | % | | | 4,195,000 | | | | 4,138,514 | | |
Oak Hill Advisors Residential Loan Trust
Series 2015-NPL1 Class A1(a)(b)
01/25/55 | | | 3.475 | % | | | 595,906 | | | | 592,219 | | |
Oak Hill Credit Partners X Ltd.
Series 2014-10A Class A(a)(b)
07/20/26 | | | 2.104 | % | | | 5,570,000 | | | | 5,569,978 | | |
Octagon Investment Partners 24 Ltd.
Series 2015-1A Class A1(a)(b)
05/21/27 | | | 2.068 | % | | | 12,000,000 | | | | 11,924,556 | | |
Octagon Investment Partners XIX Ltd.
Series 2014-A Class 1A(a)(b)
04/15/26 | | | 2.148 | % | | | 6,360,000 | | | | 6,338,344 | | |
The accompanying Notes to Financial Statements are an integral part of this statement.
Annual Report 2016
26
COLUMBIA TOTAL RETURN BOND FUND
PORTFOLIO OF INVESTMENTS (continued)
April 30, 2016
| Asset-Backed Securities — Non-Agency (continued) | |
Issuer | | Coupon
Rate | | Principal
Amount ($) | |
Value ($) | |
Octagon Investment Partners XXI Ltd.(a)(b)
Series 2014-1A Class A1A
11/14/26 | | | 2.088 | % | | | 6,000,000 | | | | 5,968,884 | | |
Series 2014-1A Class A1B
11/14/26 | | | 1.938 | % | | | 9,200,000 | | | | 9,190,138 | | |
Octagon Investment Partners XXII Ltd.
Series 2014-1A Class E1(a)(b)
11/25/25 | | | 5.885 | % | | | 1,000,000 | | | | 834,631 | | |
Octagon Investment Partners XXVI Ltd.(a)(b)
Series 2016-1A Class B1
04/15/27 | | | 3.124 | % | | | 7,000,000 | | | | 7,000,000 | | |
Series 2016-1A Class E
04/15/27 | | | 8.474 | % | | | 1,500,000 | | | | 1,453,050 | | |
Ocwen Master Advance Receivables Trust
Series 2015-1 Class AT1(a) | |
09/17/46 | | | 2.537 | % | | | 4,555,000 | | | | 4,552,927 | | |
OneMain Financial Issuance Trust(a)
Series 2015-1A Class A
03/18/26 | | | 3.190 | % | | | 5,085,000 | | | | 5,082,239 | | |
Series 2015-2A Class A
07/18/25 | | | 2.570 | % | | | 11,165,000 | | | | 11,097,433 | | |
Renaissance Home Equity Loan Trust
CMO Series 2005-3 Class M2(b)
11/25/35 | | | 5.355 | % | | | 4,750,000 | | | | 423,451 | | |
SLM Student Loan Trust
Series 2014-2 Class A1(b)
07/25/19 | | | 0.689 | % | | | 44,162 | | | | 44,148 | | |
SMART ABS Series Trust
Series 2015-3US Class A2B(b)
04/16/18 | | | 1.187 | % | | | 3,960,000 | | | | 3,949,190 | | |
SPS Servicer Advance Receivables Trust
Series 2015-T2 Class AT2(a)
01/15/47 | | | 2.620 | % | | | 3,825,000 | | | | 3,825,027 | | |
Selene Non-Performing Loans LLC
Series 2014-1A Class A(a)(b)
05/25/54 | | | 2.981 | % | | | 960,638 | | | | 952,612 | | |
Seneca Park CLO Ltd.
Series 2014-1A Class D(a)(b)
07/17/26 | | | 4.120 | % | | | 500,000 | | | | 459,513 | | |
SoFi Professional Loan Program LLC(a)(j)
Series 2015-D Class RC
10/26/37 | | | 0.000 | % | | | 1 | | | | 666,667 | | |
Series 2016-A Class RPO
01/25/38 | | | 0.000 | % | | | 3 | | | | 1,500,000 | | |
SoFi Social Professional Loan Program
Series 2016-A(a)
12/26/36 | | | 2.760 | % | | | 7,867,801 | | | | 7,767,657 | | |
| Asset-Backed Securities — Non-Agency (continued) | |
Issuer | | Coupon
Rate | | Principal
Amount ($) | |
Value ($) | |
Symphony CLO V Ltd.
Series 2007-5A Class A1(a)(b)
01/15/24 | | | 1.378 | % | | | 11,362,651 | | | | 11,176,962 | | |
Synchrony Credit Card Master Note Trust
Series 2011-2 Class A(b)
05/15/19 | | | 0.913 | % | | | 10,120,000 | | | | 10,121,259 | | |
TAL Advantage V LLC
Series 2014-2A Class A1(a)
05/20/39 | | | 1.700 | % | | | 1,912,894 | | | | 1,882,847 | | |
Venture XI CLO Ltd.
Series 2012-11A Class AR(a)(b)
11/14/22 | | | 1.918 | % | | | 9,475,000 | | | | 9,431,917 | | |
Volkswagen Auto Lease Trust
Series 2015-A Class A2B(b)
06/20/17 | | | 0.759 | % | | | 1,800,997 | | | | 1,801,868 | | |
Volkswagen Auto Loan Enhanced Trust
Series 2013-1 Class A3
08/21/17 | | | 0.560 | % | | | 201,448 | | | | 201,392 | | |
Series 2013-2 Class A3
04/20/18 | | | 0.700 | % | | | 4,007,597 | | | | 4,001,644 | | |
Wheels SPV 2 LLC
Series 2015-1A Class A2(a)
04/22/24 | | | 1.270 | % | | | 2,924,300 | | | | 2,914,844 | | |
World Financial Network Credit Card Master Trust
Series 2012-D Class A
04/17/23 | | | 2.150 | % | | | 11,475,000 | | | | 11,604,413 | | |
Series 2015-B Class A
06/17/24 | | | 2.550 | % | | | 10,735,000 | | | | 10,952,913 | | |
World Omni Automobile Lease Securitization Trust
Series 2015-A Class A2B(b)
05/15/18 | | | 0.813 | % | | | 3,418,832 | | | | 3,416,142 | | |
Total Asset-Backed Securities — Non-Agency
(Cost: $507,074,212) | | | | | | | 503,785,904 | | |
U.S. Treasury Obligations 7.0% | |
U.S. Treasury
08/31/16 | | | 0.500 | % | | | 33,400,000 | | | | 33,414,796 | | |
09/15/16 | | | 0.875 | % | | | 63,500,000 | | | | 63,616,586 | | |
03/31/21 | | | 1.250 | % | | | 14,829,000 | | | | 14,808,147 | | |
02/15/26 | | | 1.625 | % | | | 27,942,800 | | | | 27,458,167 | | |
11/15/45 | | | 3.000 | % | | | 46,541,900 | | | | 49,803,463 | | |
U.S. Treasury(f)
04/30/21 | | | 1.375 | % | | | 1,321,000 | | | | 1,326,985 | | |
U.S. Treasury(j)
STRIPS
05/15/43 | | | 0.000 | % | | | 68,949,000 | | | | 32,554,064 | | |
Total U.S. Treasury Obligations
(Cost: $218,529,885) | | | | | | | 222,982,208 | | |
The accompanying Notes to Financial Statements are an integral part of this statement.
Annual Report 2016
27
COLUMBIA TOTAL RETURN BOND FUND
PORTFOLIO OF INVESTMENTS (continued)
April 30, 2016
U.S. Government & Agency Obligations 0.7%
Issuer | | Coupon
Rate | | Principal
Amount ($) | |
Value ($) | |
Residual Funding Corp.(j)
STRIPS
01/15/30 | | | 0.000 | % | | | 22,716,000 | | | | 15,452,514 | | |
04/15/30 | | | 0.000 | % | | | 8,705,000 | | | | 5,891,918 | | |
Total U.S. Government & Agency Obligations
(Cost: $20,720,626) | | | | | | | 21,344,432 | | |
Foreign Government Obligations(k) 1.1% | |
CHILE 0.1% | |
Chile Government International Bond
10/30/22 | | | 2.250 | % | | | 2,900,000 | | | | 2,900,000 | | |
COLOMBIA 0.1% | |
Colombia Government International Bond
01/18/41 | | | 6.125 | % | | | 1,697,000 | | | | 1,840,839 | | |
FRANCE 0.5% | |
Electricite de France SA(a)
10/13/55 | | | 5.250 | % | | | 16,266,000 | | | | 16,384,075 | | |
MEXICO 0.1% | |
Mexico Government International Bond
03/15/22 | | | 3.625 | % | | | 4,114,000 | | | | 4,253,876 | | |
03/08/44 | | | 4.750 | % | | | 2,105,000 | | | | 2,126,050 | | |
Total | | | | | | | 6,379,926 | | |
PANAMA 0.1% | |
Panama Government International Bond
01/26/36 | | | 6.700 | % | | | 1,635,000 | | | | 2,092,800 | | |
PERU 0.1% | |
Peruvian Government International Bond
03/14/37 | | | 6.550 | % | | | 1,725,000 | | | | 2,212,313 | | |
PHILIPPINES —% | |
Philippine Government International Bond
10/23/34 | | | 6.375 | % | | | 525,000 | | | | 746,798 | | |
QATAR 0.1% | |
Nakilat, Inc.(a)
12/31/33 | | | 6.067 | % | | | 2,293,000 | | | | 2,610,581 | | |
Total Foreign Government Obligations
(Cost: $33,770,429) | | | | | | | 35,167,332 | | |
Municipal Bonds 1.4%
Issue
Description | | Coupon
Rate | | Principal
Amount ($) | |
Value ($) | |
CALIFORNIA 0.4% | |
Los Angeles Unified School District
Unlimited General Obligation Bonds
Taxable Build America Bonds
Series 2009
07/01/34 | | | 5.750 | % | | | 11,150,000 | | | | 14,142,883 | | |
ILLINOIS 0.2% | |
City of Chicago Waterworks
Revenue Bonds
Build America Bonds
Series 2010
11/01/40 | | | 6.742 | % | | | 1,520,000 | | | | 1,794,710 | | |
City of Chicago
Unlimited General Obligation Bonds
Taxable Project
Series 2011-C1
01/01/35 | | | 7.781 | % | | | 1,090,000 | | | | 1,145,568 | | |
Unlimited General Obligation Refunding Bonds
Taxable
Series 2014B
01/01/44 | | | 6.314 | % | | | 2,530,000 | | | | 2,271,890 | | |
Unlimited General Obligation Taxable Bonds
Series 2015B
01/01/33 | | | 7.375 | % | | | 835,000 | | | | 847,984 | | |
Total | | | | | | | 6,060,152 | | |
KENTUCKY 0.3% | |
Kentucky Asset Liability Commission
Taxable Revenue Bonds
Series 2010
04/01/18 | | | 3.165 | % | | | 8,880,995 | | | | 9,047,514 | | |
OHIO 0.3% | |
JobsOhio Beverage System
Taxable Revenue Bonds
Series 2013-B
01/01/35 | | | 4.532 | % | | | 8,565,000 | | | | 9,616,439 | | |
PUERTO RICO 0.2% | |
Puerto Rico Sales Tax Financing Corp.(l)
Revenue Bonds
1st Senior Series 2009C
08/01/57 | | | 5.750 | % | | | 1,010,000 | | | | 599,677 | | |
Subordinated Revenue Bonds
1st Series 2009A-1
08/01/43 | | | 5.250 | % | | | 4,335,000 | | | | 1,684,668 | | |
1st Series 2009B
08/01/44 | | | 6.500 | % | | | 1,020,000 | | | | 421,658 | | |
1st Series 2010C
08/01/41 | | | 5.250 | % | | | 5,075,000 | | | | 1,972,652 | | |
Total | | | | | | | 4,678,655 | | |
Total Municipal Bonds
(Cost: $42,094,512) | | | | | | | 43,545,643 | | |
The accompanying Notes to Financial Statements are an integral part of this statement.
Annual Report 2016
28
COLUMBIA TOTAL RETURN BOND FUND
PORTFOLIO OF INVESTMENTS (continued)
April 30, 2016
Preferred Debt 1.4%
Issuer | | Coupon
Rate | | Principal
Amount ($) | |
Value ($) | |
BANKING 1.1% | |
HSBC Holdings PLC
12/31/49 | | | 8.000 | % | | | 165,495 | | | | 4,385,618 | | |
M&T Bank Corp.(b)
12/31/49 | | | 6.375 | % | | | 7,243 | | | | 7,673,958 | | |
12/31/49 | | | 6.375 | % | | | 1,660 | | | | 1,783,670 | | |
State Street Corp.(b)
12/31/49 | | | 5.350 | % | | | 100,000 | | | | 2,629,000 | | |
12/31/49 | | | 5.900 | % | | | 72,535 | | | | 1,970,776 | | |
U.S. Bancorp(b)
12/31/49 | | | 6.500 | % | | | 135,337 | | | | 4,000,562 | | |
Wells Fargo & Co.
12/31/49 | | | 7.500 | % | | | 10,000 | | | | 12,460,000 | | |
Total | | | | | | | 34,903,584 | | |
BROKERAGE/ASSET MANAGERS/EXCHANGES 0.1% | |
Merrill Lynch Capital Trust I(b)
12/15/66 | | | 6.450 | % | | | 85,000 | | | | 2,208,300 | | |
BUILDING MATERIALS 0.2% | |
Stanley Black & Decker, Inc.
07/25/52 | | | 5.750 | % | | | 183,050 | | | | 4,816,045 | | |
PROPERTY & CASUALTY —% | |
Allstate Corp. (The)(b)
01/15/53 | | | 5.100 | % | | | 44,460 | | | | 1,158,183 | | |
Total Preferred Debt
(Cost: $41,024,126) | | | | | | | 43,086,112 | | |
Senior Loans 0.1%
Borrower | | Weighted
Average
Coupon | | Principal
Amount ($) | |
Value ($) | |
CHEMICALS —% | |
PQ Corp.
Term Loan(b)(f)(m)
10/27/22 | | | 5.750 | % | | | 138,649 | | | | 139,318 | | |
DIVERSIFIED MANUFACTURING —% | |
Manitowoc Foodservice, Inc.
Tranche B Term Loan(b)(m)
03/03/23 | | | 5.750 | % | | | 395,815 | | | | 400,023 | | |
Senior Loans (continued)
Borrower | | Weighted
Average
Coupon | | Principal
Amount ($) | |
Value ($) | |
PHARMACEUTICALS —% | |
Concordia Healthcare Corp.
Term Loan(b)(m)
10/21/21 | | | 5.250 | % | | | 299,250 | | | | 295,958 | | |
TECHNOLOGY 0.1% | |
Microsemi Corp.
Tranche B Term Loan(b)(m)
01/15/23 | | | 5.250 | % | | | 897,528 | | | | 903,137 | | |
Riverbed Technology, Inc.
Term Loan(b)(m)
04/25/22 | | | 5.750 | % | | | 343,537 | | | | 345,488 | | |
Total | | | | | | | 1,248,625 | | |
Total Senior Loans
(Cost: $2,029,314) | | | | | | | 2,083,924 | | |
Common Stocks —%
Issuer | | Shares | | Value ($) | |
FINANCIALS —% | |
Insurance —% | |
WMI Holdings Corp. Escrow(c)(d)(n)(o) | | | 2,725 | | | | — | | |
WMIH Corp.(n) | | | 54,217 | | | | 120,904 | | |
Total | | | | | 120,904 | | |
Total Financials | | | | | 120,904 | | |
INDUSTRIALS —% | |
Airlines —% | |
United Continental Holdings, Inc.(n) | | | 1,493 | | | | 68,394 | | |
Total Industrials | | | | | 68,394 | | |
Total Common Stocks
(Cost: $1,511,104) | | | | | 189,298 | | |
Warrants —%
HEALTH CARE —% | |
Health Care Providers & Services —% | |
HealthSouth Corp.(n) | | | 6,190 | | | | 22,346 | | |
Total Health Care | | | | | 22,346 | | |
Total Warrants
(Cost: $—) | | | | | 22,346 | | |
The accompanying Notes to Financial Statements are an integral part of this statement.
Annual Report 2016
29
COLUMBIA TOTAL RETURN BOND FUND
PORTFOLIO OF INVESTMENTS (continued)
April 30, 2016
Options Purchased Puts —%
Issuer | | Notional ($)/
Contracts | | Exercise
Price | | Expiration
Date | | Value ($) | |
Put — OTC
5-Year
Interest
Rate Swap(p) | | | 20,000,000 | | | | 2.00 | | | 12/12/16 | | | 58,890 | | |
Put — OTC
5-Year
Interest
Rate Swap(p) | | | 16,500,000 | | | | 2.15 | | | 09/09/16 | | | 8,664 | | |
Total Options Purchased Puts
(Cost: $506,625) | | | | | | | | | 67,554 | | |
Money Market Funds 0.1%
| | | Shares | |
Value ($) | |
Columbia Short-Term Cash Fund,
0.422%(q)(r) | | | 4,335,392 | | | | 4,335,392 | | |
Total Money Market Funds
(Cost: $4,335,392) | | | | | 4,335,392 | | |
Total Investments
(Cost: $3,477,296,185) | | | | | 3,514,526,487 | | |
Other Assets & Liabilities, Net | | | | | (348,454,539 | ) | |
| | | Net Assets | | | 3,166,071,948 | | |
The accompanying Notes to Financial Statements are an integral part of this statement.
At April 30, 2016, securities and cash totaling $16,516,032 were pledged as collateral.
Investments in Derivatives
Futures Contracts Outstanding at April 30, 2016
Long Futures Contracts Outstanding
Contract Description | | Number of
Contracts | | Trading
Currency | | Notional
Market
Value | | Expiration
Date | | Unrealized
Appreciation ($) | | Unrealized
(Depreciation) ($) | |
U.S. Treasury 2-Year Note | | | 541 | | | USD | | | | | 118,276,125 | | | 06/2016 | | | — | | | | (51,216 | ) | |
U.S. Treasury 2-Year Note | | | 997 | | | USD | | | | | 217,969,125 | | | 06/2016 | | | — | | | | (348,061 | ) | |
U.S. Treasury 5-Year Note | | | 601 | | | USD | | | | | 72,669,352 | | | 06/2016 | | | 242,411 | | | | — | | |
U.S. Treasury 5-Year Note | | | 3,195 | | | USD | | | | | 386,320,431 | | | 06/2016 | | | — | | | | (333,173 | ) | |
Total | | | | | | | 795,235,033 | | | | | | 242,411 | | | | (732,450 | ) | |
Short Futures Contracts Outstanding
Contract Description | | Number of
Contracts | | Trading
Currency | | Notional
Market
Value | | Expiration
Date | | Unrealized
Appreciation ($) | | Unrealized
(Depreciation) ($) | |
U.S. Long Bond | | | (31 | ) | | USD | | | | | (5,062,688 | ) | | 06/2016 | | | 40,651 | | | | — | | |
U.S. Long Bond | | | (13 | ) | | USD | | | | | (2,123,062 | ) | | 06/2016 | | | — | | | | (5,745 | ) | |
U.S. Treasury 10-Year Note | | | (110 | ) | | USD | | | | | (14,306,875 | ) | | 06/2016 | | | 89,193 | | | | — | | |
U.S. Treasury 10-Year Note | | | (181 | ) | | USD | | | | | (23,541,313 | ) | | 06/2016 | | | 11,203 | | | | — | | |
U.S. Treasury Ultra 10-Year Note | | | (332 | ) | | USD | | | | | (46,666,750 | ) | | 06/2016 | | | 434,971 | | | | — | | |
U.S. Treasury Ultra 10-Year Note | | | (206 | ) | | USD | | | | | (28,955,875 | ) | | 06/2016 | | | — | | | | (34,201 | ) | |
U.S. Ultra Bond | | | (179 | ) | | USD | | | | | (30,670,531 | ) | | 06/2016 | | | 816,329 | | | | — | | |
Total | | | | | | | (151,327,094 | ) | | | | | 1,392,347 | | | | (39,946 | ) | |
Annual Report 2016
30
COLUMBIA TOTAL RETURN BOND FUND
PORTFOLIO OF INVESTMENTS (continued)
April 30, 2016
Open Options Contracts Written at April 30, 2016
Issuer | | Puts/Calls | | Trading
Currency | | Number of
Contracts | | Exercise
Price | | Premium
Received ($) | | Expiration
Date | | Value ($) | |
Put — OTC 10-Year Interest
Rate Swap(s) | | Put
| | USD |
| | | | (30,000,000
| ) | | | 1.85
| | | | (249,750
| ) | | 07/19/2016
| | | (292,842
| ) | |
Credit Default Swap Contracts Outstanding at April 30, 2016
Buy Protection
Counterparty | | Reference
Entity | | Expiration
Date | | Pay Fixed
Rate (%) | | Notional
Currency | | Notional
Amount | | Market
Value ($) | | Premium
Paid ($) | | Premium
Received ($) | | Periodic
Payments
Receivable
(Payable) ($) | | Unrealized
Appreciation
($) | | Unrealized
Depreciation
($) | |
Barclays
| | Electricite de
France SA | | 12/20/2020
| | | 1.000
| | | USD |
| | | | 1,640,000
| | | | (21,353
| ) | | | —
| | | | (7,938
| ) | | | (1,822
| ) | | | —
| | | | (15,237
| ) | |
Barclays
| | Electricite de
France SA | | 12/20/2020
| | | 1.000
| | | USD |
| | | | 1,640,000
| | | | (21,353
| ) | | | —
| | | | (4,330
| ) | | | (1,822
| ) | | | —
| | | | (18,845
| ) | |
Barclays
| | Electricite de
France SA | | 12/20/2020
| | | 1.000
| | | USD |
| | | | 1,635,000
| | | | (21,287
| ) | | | —
| | | | (3,591
| ) | | | (1,817
| ) | | | —
| | | | (19,513
| ) | |
Barclays
| | Home Depot,
Inc. | | 06/20/2021
| | | 1.000
| | | USD |
| | | | 21,605,000
| | | | (774,776
| ) | | | —
| | | | (766,679
| ) | | | (24,006
| ) | | | —
| | | | (32,103
| ) | |
Barclays
| | International
Business
Machines Corp. | | 12/20/2020
| | | 1.000
| | | USD |
| | | | 3,190,000
| | | | (66,591
| ) | | | —
| | | | (58,390
| ) | | | (3,544
| ) | | | —
| | | | (11,745
| ) | |
Barclays
| | Newmont
Mining Corp. | | 12/20/2020
| | | 1.000
| | | USD |
| | | | 3,220,000
| | | | (8,881
| ) | | | 185,702
| | | | —
| | | | (3,578
| ) | | | —
| | | | (198,161
| ) | |
Barclays | | Viacom, Inc. | | 06/20/2021 | | | 1.000 | | | USD | | | | | 3,110,000 | | | | 76,135 | | | | 139,982 | | | | — | | | | (3,456 | ) | | | — | | | | (67,303 | ) | |
Citi
| | Campbell
Soup Co. | | 06/20/2021
�� | | | 1.000
| | | USD |
| | | | 6,945,000
| | | | (226,560
| ) | | | —
| | | | (214,373
| ) | | | (7,717
| ) | | | —
| | | | (19,904
| ) | |
Citi | | D.R. Horton, Inc. | | 12/20/2020 | | | 1.000 | | | USD | | | | | 8,925,000 | | | | 51,489 | | | | 215,908 | | | | — | | | | (9,917 | ) | | | — | | | | (174,336 | ) | |
Citi
| | Energy Transfer
Partners, LP | | 12/20/2020
| | | 1.000
| | | USD |
| | | | 1,640,000
| | | | 163,724
| | | | 97,937
| | | | —
| | | | (1,822
| ) | | | 63,965
| | | | —
| | |
Citi
| | Goldman Sachs
Group, Inc. | | 12/20/2020
| | | 1.000
| | | USD |
| | | | 3,160,000
| | | | (1,762
| ) | | | 8,317
| | | | —
| | | | (3,511
| ) | | | —
| | | | (13,590
| ) | |
Citi
| | Home Depot,
Inc. | | 06/20/2021
| | | 1.000
| | | USD |
| | | | 15,435,000
| | | | (553,514
| ) | | | —
| | | | (530,727
| ) | | | (17,150
| ) | | | —
| | | | (39,937
| ) | |
Citi
| | International
Business
Machines Corp. | | 12/20/2020
| | | 1.000
| | | USD |
| | | | 3,235,000
| | | | (67,531
| ) | | | —
| | | | (79,303
| ) | | | (3,594
| ) | | | 8,178
| | | | —
| | |
Citi
| | Kinder
Morgan, Inc. | | 12/20/2020
| | | 1.000
| | | USD |
| | | | 3,280,000
| | | | 235,358
| | | | 276,203
| | | | —
| | | | (3,644
| ) | | | —
| | | | (44,489
| ) | |
Citi
| | Markit CDX
Emerging
Markets Index,
Series 24 | | 12/20/2020
| | | 1.000
| | | USD |
| | | | 12,842,900
| | | | 1,061,329
| | | | 1,461,141
| | | | —
| | | | (14,270
| ) | | | —
| | | | (414,082
| ) | |
Citi
| | Markit CDX
Emerging
Markets Index,
Series 24 | | 12/20/2020
| | | 1.000
| | | USD |
| | | | 31,247,300
| | | | 2,582,256
| | | | 3,919,997
| | | | —
| | | | (34,719
| ) | | | —
| | | | (1,372,460
| ) | |
Citi
| | McDonald's
Corp. | | 12/20/2020
| | | 1.000
| | | USD |
| | | | 9,445,000
| | | | (292,651
| ) | | | —
| | | | (231,981
| ) | | | (10,494
| ) | | | —
| | | | (71,164
| ) | |
Citi | | Nordstrom, Inc. | | 12/20/2020 | | | 1.000 | | | USD | | | | | 3,280,000 | | | | 35,196 | | | | — | | | | (68,521 | ) | | | (3,644 | ) | | | 100,073 | | | | — | | |
Citi | | Viacom, Inc. | | 12/20/2020 | | | 1.000 | | | USD | | | | | 4,915,000 | | | | 61,203 | | | | 230,486 | | | | — | | | | (5,461 | ) | | | — | | | | (174,744 | ) | |
Citi | | Viacom, Inc. | | 12/20/2020 | | | 1.000 | | | USD | | | | | 4,915,000 | | | | 61,203 | | | | 192,883 | | | | — | | | | (5,461 | ) | | | — | | | | (137,141 | ) | |
The accompanying Notes to Financial Statements are an integral part of this statement.
Annual Report 2016
31
COLUMBIA TOTAL RETURN BOND FUND
PORTFOLIO OF INVESTMENTS (continued)
April 30, 2016
Credit Default Swap Contracts Outstanding at April 30, 2016
Buy Protection (continued)
Counterparty | | Reference
Entity | | Expiration
Date | | Pay Fixed
Rate (%) | | Notional
Currency | | Notional
Amount | | Market
Value ($) | | Premium
Paid ($) | | Premium
Received ($) | | Periodic
Payments
Receivable
(Payable) ($) | | Unrealized
Appreciation
($) | | Unrealized
Depreciation
($) | |
Citi
| | Yum! Brands,
Inc. | | 12/20/2020
| | | 1.000
| | | USD |
| | | | 3,270,000
| | | | 179,690
| | | | 241,542
| | | | —
| | | | (3,633
| ) | | | —
| | | | (65,485
| ) | |
Credit
Suisse | | Goldman Sachs
Group, Inc. | | 12/20/2020
| | | 1.000
| | | USD |
| | | | 3,145,000
| | | | (1,754
| ) | | | 84,058
| | | | —
| | | | (3,494
| ) | | | —
| | | | (89,306
| ) | |
Goldman
Sachs
International | | Barclays Bank,
PLC
| | 12/20/2020
| | | 1.000
| | | USD |
| | | | 16,420,000
| | | | 67,713
| | | | —
| | | | (305,927
| ) | | | (18,244
| ) | | | 355,396
| | | | —
| | |
Goldman
Sachs
International | | Barclays Bank,
PLC
| | 12/20/2020
| | | 1.000
| | | USD |
| | | | 1,575,000
| | | | 83,600
| | | | 172,169
| | | | —
| | | | (1,750
| ) | | | —
| | | | (90,319
| ) | |
Goldman
Sachs
International | | Barclays Bank,
PLC
| | 12/20/2020
| | | 1.000
| | | USD |
| | | | 3,120,000
| | | | 165,609
| | | | 227,714
| | | | —
| | | | (3,467
| ) | | | —
| | | | (65,572
| ) | |
Goldman
Sachs
International | | Citigroup, Inc.
| | 06/20/2021
| | | 1.000
| | | USD |
| | | | 12,275,000
| | | | (21,263
| ) | | | 23,793
| | | | —
| | | | (13,639
| ) | | | —
| | | | (58,695
| ) | |
Goldman
Sachs
International | | Costco
Wholesale Corp.
| | 12/20/2020
| | | 1.000
| | | USD |
| | | | 3,280,000
| | | | (111,426
| ) | | | —
| | | | (106,365
| ) | | | (3,644
| ) | | | —
| | | | (8,705
| ) | |
Goldman
Sachs
International | | Eaton Corp. PLC
| | 12/20/2020
| | | 1.000
| | | USD |
| | | | 3,220,000
| | | | (78,132
| ) | | | —
| | | | (64,288
| ) | | | (3,578
| ) | | | —
| | | | (17,422
| ) | |
Goldman
Sachs
International | | Electricite de
France SA
| | 12/20/2020
| | | 1.000
| | | USD |
| | | | 8,205,000
| | | | (106,825
| ) | | | —
| | | | (50,604
| ) | | | (9,117
| ) | | | —
| | | | (65,338
| ) | |
Goldman
Sachs
International | | Electricite de
France SA
| | 12/20/2020
| | | 1.000
| | | USD |
| | | | 3,280,000
| | | | (42,704
| ) | | | —
| | | | (17,301
| ) | | | (3,644
| ) | | | —
| | | | (29,047
| ) | |
Goldman
Sachs
International | | Electricite de
France SA
| | 12/20/2020
| | | 1.000
| | | USD |
| | | | 6,555,000
| | | | (85,342
| ) | | | —
| | | | (33,143
| ) | | | (7,283
| ) | | | —
| | | | (59,482
| ) | |
Goldman
Sachs
International | | HSBC Holdings
PLC
| | 12/20/2020
| | | 1.000
| | | USD |
| | | | 6,250,000
| | | | 240,444
| | | | 429,109
| | | | —
| | | | (6,944
| ) | | | —
| | | | (195,609
| ) | |
Goldman
Sachs
International | | Lloyds Bank
| | 12/20/2020
| | | 1.000
| | | USD |
| | | | 3,125,000
| | | | 150,576
| | | | 180,756
| | | | —
| | | | (3,472
| ) | | | —
| | | | (33,652
| ) | |
Goldman
Sachs
International
| | Markit CDX
Emerging
Markets Index,
Series 24 | | 12/20/2020
| | | 1.000
| | | USD |
| | | | 9,633,400
| | | | 796,098
| | | | 1,087,433
| | | | —
| | | | (10,704
| ) | | | —
| | | | (302,039
| ) | |
Goldman
Sachs
International | | McDonald's
Corp.
| | 12/20/2020
| | | 1.000
| | | USD |
| | | | 11,440,000
| | | | (354,465
| ) | | | —
| | | | (291,443
| ) | | | (12,711
| ) | | | —
| | | | (75,733
| ) | |
Goldman
Sachs
International | | Morgan Stanley
| | 12/20/2020
| | | 1.000
| | | USD |
| | | | 4,700,000
| | | | (5,636
| ) | | | 10,252
| | | | —
| | | | (5,222
| ) | | | —
| | | | (21,110
| ) | |
Goldman
Sachs
International | | Morgan Stanley
| | 12/20/2020
| | | 1.000
| | | USD |
| | | | 3,160,000
| | | | (3,789
| ) | | | 8,317
| | | | —
| | | | (3,511
| ) | | | —
| | | | (15,617
| ) | |
The accompanying Notes to Financial Statements are an integral part of this statement.
Annual Report 2016
32
COLUMBIA TOTAL RETURN BOND FUND
PORTFOLIO OF INVESTMENTS (continued)
April 30, 2016
Credit Default Swap Contracts Outstanding at April 30, 2016
Buy Protection (continued)
Counterparty | | Reference
Entity | | Expiration
Date | | Pay Fixed
Rate (%) | | Notional
Currency | | Notional
Amount | | Market
Value ($) | | Premium
Paid ($) | | Premium
Received ($) | | Periodic
Payments
Receivable
(Payable) ($) | | Unrealized
Appreciation
($) | | Unrealized
Depreciation
($) | |
Goldman
Sachs
International | | Morgan Stanley
| | 12/20/2020
| | | 1.000
| | | USD |
| | | | 6,305,000
| | | | (7,559
| ) | | | 55,219
| | | | —
| | | | (7,006
| ) | | | —
| | | | (69,784
| ) | |
Goldman
Sachs
International | | Morgan Stanley
| | 12/20/2020
| | | 1.000
| | | USD |
| | | | 6,265,000
| | | | (7,512
| ) | | | 76,597
| | | | —
| | | | (6,961
| ) | | | —
| | | | (91,070
| ) | |
Goldman
Sachs
International | | Textron, Inc.
| | 06/20/2021
| | | 1.000
| | | USD |
| | | | 6,175,000
| | | | (39,038
| ) | | | —
| | | | —
| | | | (6,861
| ) | | | —
| | | | (45,899
| ) | |
Goldman
Sachs
International | | Textron, Inc.
| | 06/20/2021
| | | 1.000
| | | USD |
| | | | 7,715,000
| | | | (48,774
| ) | | | —
| | | | —
| | | | (8,572
| ) | | | —
| | | | (57,346
| ) | |
Goldman
Sachs
International | | Walt Disney
Co. (The)
| | 12/20/2020
| | | 1.000
| | | USD |
| | | | 8,055,000
| | | | (280,484
| ) | | | —
| | | | (293,757
| ) | | | (8,950
| ) | | | 4,323
| | | | —
| | |
JPMorgan
| | Barclays
Bank PLC | | 06/20/2021
| | | 1.000
| | | USD |
| | | | 3,080,000
| | | | 191,804
| | | | 264,032
| | | | —
| | | | (3,422
| ) | | | —
| | | | (75,650
| ) | |
JPMorgan
| | Barclays
Bank, PLC | | 12/20/2020
| | | 1.000
| | | USD |
| | | | 4,905,000
| | | | 260,356
| | | | 96,384
| | | | —
| | | | (5,450
| ) | | | 158,522
| | | | —
| | |
JPMorgan
| | Campbell
Soup Co. | | 12/20/2020
| | | 1.000
| | | USD |
| | | | 11,765,000
| | | | (366,569
| ) | | | —
| | | | (257,064
| ) | | | (13,072
| ) | | | —
| | | | (122,577
| ) | |
JPMorgan | | Citigroup, Inc. | | 12/20/2020 | | | 1.000 | | | USD | | | | | 8,190,000 | | | | (38,305 | ) | | | 14,313 | | | | — | | | | (9,100 | ) | | | — | | | | (61,718 | ) | |
JPMorgan | | D.R. Horton, Inc. | | 12/20/2020 | | | 1.000 | | | USD | | | | | 16,835,000 | | | | 97,123 | | | | 374,363 | | | | — | | | | (18,706 | ) | | | — | | | | (295,946 | ) | |
JPMorgan
| | Energy Transfer
Partners, LP | | 06/20/2021
| | | 1.000
| | | USD |
| | | | 1,555,000
| | | | 182,273
| | | | 243,567
| | | | —
| | | | (1,728
| ) | | | —
| | | | (63,022
| ) | |
JPMorgan
| | General
Mills, Inc. | | 12/20/2020
| | | 1.000
| | | USD |
| | | | 3,235,000
| | | | (106,930
| ) | | | —
| | | | (101,560
| ) | | | (3,594
| ) | | | —
| | | | (8,964
| ) | |
JPMorgan
| | Goldman Sachs
Group, Inc. | | 12/20/2020
| | | 1.000
| | | USD |
| | | | 17,490,000
| | | | (9,753
| ) | | | —
| | | | (7,667
| ) | | | (19,433
| ) | | | —
| | | | (21,519
| ) | |
JPMorgan
| | Goldman Sachs
Group, Inc. | | 06/20/2021
| | | 1.000
| | | USD |
| | | | 12,505,000
| | | | 46,326
| | | | 84,258
| | | | —
| | | | (13,894
| ) | | | —
| | | | (51,826
| ) | |
JPMorgan
| | HSBC Holdings
PLC | | 06/20/2021
| | | 1.000
| | | USD |
| | | | 3,120,000
| | | | 143,643
| | | | 197,256
| | | | —
| | | | (3,467
| ) | | | —
| | | | (57,080
| ) | |
JPMorgan
| | International
Business
Machines Corp. | | 12/20/2020
| | | 1.000
| | | USD |
| | | | 3,275,000
| | | | (68,366
| ) | | | —
| | | | (59,862
| ) | | | (3,639
| ) | | | —
| | | | (12,143
| ) | |
JPMorgan
| | International
Business
Machines Corp. | | 12/20/2020
| | | 1.000
| | | USD |
| | | | 3,160,000
| | | | (65,965
| ) | | | —
| | | | (26,654
| ) | | | (3,511
| ) | | | —
| | | | (42,822
| ) | |
JPMorgan | | Lloyds Bank | | 06/20/2021 | | | 1.000 | | | USD | | | | | 3,080,000 | | | | 175,278 | | | | 182,989 | | | | — | | | | (3,422 | ) | | | — | | | | (11,133 | ) | |
JPMorgan | | Lloyds Bank | | 06/20/2021 | | | 1.000 | | | USD | | | | | 1,540,000 | | | | 87,639 | | | | 88,814 | | | | — | | | | (1,711 | ) | | | — | | | | (2,886 | ) | |
JPMorgan
| | Markit CDX
Emerging
Markets Index,
Series 24 | | 12/20/2020
| | | 1.000
| | | USD |
| | | | 9,633,400
| | | | 796,098
| | | | 1,083,151
| | | | —
| | | | (10,704
| ) | | | —
| | | | (297,757
| ) | |
JPMorgan
| | McDonald's
Corp. | | 12/20/2020
| | | 1.000
| | | USD |
| | | | 6,555,000
| | | | (203,105
| ) | | | —
| | | | (168,064
| ) | | | (7,283
| ) | | | —
| | | | (42,324
| ) | |
JPMorgan
| | McDonald's
Corp. | | 12/20/2020
| | | 1.000
| | | USD |
| | | | 3,275,000
| | | | (101,475
| ) | | | —
| | | | (81,733
| ) | | | (3,639
| ) | | | —
| | | | (23,381
| ) | |
The accompanying Notes to Financial Statements are an integral part of this statement.
Annual Report 2016
33
COLUMBIA TOTAL RETURN BOND FUND
PORTFOLIO OF INVESTMENTS (continued)
April 30, 2016
Credit Default Swap Contracts Outstanding at April 30, 2016
Buy Protection (continued)
Counterparty | | Reference
Entity | | Expiration
Date | | Pay Fixed
Rate (%) | | Notional
Currency | | Notional
Amount | | Market
Value ($) | | Premium
Paid ($) | | Premium
Received ($) | | Periodic
Payments
Receivable
(Payable) ($) | | Unrealized
Appreciation
($) | | Unrealized
Depreciation
($) | |
JPMorgan | | Nordstrom, Inc. | | 12/20/2020 | | | 1.000 | | | USD | | | | | 11,220,000 | | | | 120,398 | | | | 334,063 | | | | — | | | | (12,467 | ) | | | — | | | | (226,132 | ) | |
JPMorgan
| | Royal Bank of
Scotland
PLC (The) | | 06/20/2021
| | | 1.000
| | | USD |
| | | | 3,080,000
| | | | 221,152
| | | | 279,746
| | | | —
| | | | (3,422
| ) | | | —
| | | | (62,016
| ) | |
JPMorgan
| | Royal Bank of
Scotland
PLC (The) | | 06/20/2021
| | | 1.000
| | | USD |
| | | | 1,540,000
| | | | 110,576
| | | | 134,700
| | | | —
| | | | (1,711
| ) | | | —
| | | | (25,835
| ) | |
JPMorgan
| | Royal Bank of
Scotland
PLC (The) | | 06/20/2021
| | | 1.000
| | | USD |
| | | | 3,125,000
| | | | 224,382
| | | | 278,607
| | | | —
| | | | (3,472
| ) | | | —
| | | | (57,697
| ) | |
JPMorgan
| | Toll Brothers,
Inc. | | 06/20/2021
| | | 1.000
| | | USD |
| | | | 17,760,000
| | | | 777,766
| | | | 729,638
| | | | —
| | | | (19,733
| ) | | | 28,395
| | | | —
| | |
JPMorgan
| | Yum! Brands,
Inc. | | 12/20/2020
| | | 1.000
| | | USD |
| | | | 1,635,000
| | | | 89,845
| | | | 110,319
| | | | —
| | | | (1,817
| ) | | | —
| | | | (22,291
| ) | |
JPMorgan | | Yum! Brands,
Inc. | | 12/20/2020
| | | 1.000
| | | USD |
| | | | 980,000
| | | | 53,852
| | | | 67,987
| | | | —
| | | | (1,089
| ) | | | —
| | | | (15,224
| ) | |
Morgan
Stanley | | Citigroup, Inc.
| | 12/20/2020
| | | 1.000
| | | USD |
| | | | 3,160,000
| | | | (14,780
| ) | | | 9,699
| | | | —
| | | | (3,511
| ) | | | —
| | | | (27,990
| ) | |
Morgan
Stanley | | Electricite de
France SA | | 12/20/2020
| | | 1.000
| | | USD |
| | | | 6,555,000
| | | | (85,342
| ) | | | —
| | | | (37,368
| ) | | | (7,283
| ) | | | —
| | | | (55,257
| ) | |
Morgan
Stanley | | Goldman Sachs
Group, Inc. | | 12/20/2020
| | | 1.000
| | | USD |
| | | | 3,935,000
| | | | (2,194
| ) | | | 18,867
| | | | —
| | | | (4,372
| ) | | | —
| | | | (25,433
| ) | |
Morgan
Stanley
| | International
Business
Machines Corp. | | 12/20/2020
| | | 1.000
| | | USD |
| | | | 3,160,000
| | | | (65,965
| ) | | | —
| | | | (35,090
| ) | | | (3,511
| ) | | | —
| | | | (34,386
| ) | |
Morgan
Stanley
| | International
Business
Machines Corp. | | 12/20/2020
| | | 1.000
| | | USD |
| | | | 3,155,000
| | | | (65,860
| ) | | | —
| | | | (32,289
| ) | | | (3,506
| ) | | | —
| | | | (37,077
| ) | |
Morgan
Stanley | | Kinder
Morgan, Inc. | | 06/20/2021
| | | 1.000
| | | USD |
| | | | 3,115,000
| | | | 273,026
| | | | 332,826
| | | | —
| | | | (3,461
| ) | | | —
| | | | (63,261
| ) | |
Morgan
Stanley | | Nucor Corp.
| | 09/20/2020
| | | 1.000
| | | USD |
| | | | 10,160,000
| | | | 70,633
| | | | —
| | | | (100,954
| ) | | | (11,289
| ) | | | 160,298
| | | | —
| | |
Total | | | | | | | | | | | | | | | 14,251,094 | | | | (4,036,966 | ) | | | | | 879,150 | | | | (6,125,331 | ) | |
Cleared Credit Default Swap Contracts Outstanding at April 30, 2016
Buy Protection
Counterparty | | Reference
Entity | | Expiration
Date | | Pay Fixed
Rate (%) | | Notional
Currency | | Notional
Amount | | Unrealized
Appreciation
($) | | Unrealized
Depreciation
($) | |
Morgan Stanley
| | Markit CDX North America High Yield Index,
Series 26 | | 06/20/2021
| | | 5.000
| | | USD |
| | | | 69,540,000
| | | | —
| | | | (743,522
| ) | |
Morgan Stanley
| | Markit CDX North America Investment
Grade Index, Series 26 | | 06/20/2021
| | | 1.000
| | | USD |
| | | | 122,205,000
| | | | 30,047
| | | | —
| | |
Total | | | | | | | | | | | | | 30,047 | | | | (743,522 | ) | |
The accompanying Notes to Financial Statements are an integral part of this statement.
Annual Report 2016
34
COLUMBIA TOTAL RETURN BOND FUND
PORTFOLIO OF INVESTMENTS (continued)
April 30, 2016
Credit Default Swap Contracts Outstanding at April 30, 2016
Sell Protection
Counterparty | | Reference
Entity | | Expiration
Date | | Receive
Fixed
Rate (%) | | Implied
Credit
Spread (%)* | | Notional
Currency | | Notional
Amount | | Market
Value ($) | | Premium
Paid ($) | | Premium
Received
($) | | Periodic
Payments
Receivable
(Payable)
($) | | Unrealized
Appreciation
($) | | Unrealized
Depreciation
($) | |
Barclays
| | Anadarko
Petroleum
Corp. | | 12/20/2020
| | | 1.000
| | | | 2.381
| | | USD |
| | | | (6,235,000
| ) | | | (371,141
| ) | | | —
| | | | (577,881
| ) | | | 6,928
| | | | 213,668
| | | | —
| | |
Barclays
| | Anadarko
Petroleum
Corp. | | 06/20/2021
| | | 1.000
| | | | 2.495
| | | USD |
| | | | (3,080,000
| ) | | | (216,443
| ) | | | —
| | | | (349,156
| ) | | | 3,422
| | | | 136,135
| | | | —
| | |
Barclays
| | Bank of
America
Corp. | | 06/20/2018
| | | 1.000
| | | | 0.549
| | | USD |
| | | | (15,565,000
| ) | | | 150,047
| | | | 202,311
| | | | —
| | | | 17,294
| | | | —
| | | | (34,970
| ) | |
Barclays
| | Canadian
Natural
Resources
Ltd. | | 12/20/2020
| | | 1.000
| | | | 2.146
| | | USD |
| | | | (3,120,000
| ) | | | (155,802
| ) | | | —
| | | | (356,351
| ) | | | 3,467
| | | | 204,016
| | | | —
| | |
Goldman
Sachs
International | | Anadarko
Petroleum
Corp. | | 12/20/2020
| | | 1.000
| | | | 2.381
| | | USD |
| | | | (3,120,000
| ) | | | (185,719
| ) | | | —
| | | | (318,039
| ) | | | 3,467
| | | | 135,787
| | | | —
| | |
Goldman
Sachs
International | | Anadarko
Petroleum
Corp. | | 12/20/2020
| | | 1.000
| | | | 2.381
| | | USD |
| | | | (3,120,000
| ) | | | (185,720
| ) | | | —
| | | | (317,551
| ) | | | 3,467
| | | | 135,298
| | | | —
| | |
Goldman
Sachs
International | | Anadarko
Petroleum
Corp. | | 12/20/2020
| | | 1.000
| | | | 2.381
| | | USD |
| | | | (7,790,000
| ) | | | (463,703
| ) | | | —
| | | | (678,683
| ) | | | 8,656
| | | | 223,636
| | | | —
| | |
Goldman
Sachs
International | | Barrick
Gold Corp.
| | 12/20/2020
| | | 1.000
| | | | 1.164
| | | USD |
| | | | (3,235,000
| ) | | | (23,837
| ) | | | —
| | | | (330,052
| ) | | | 3,594
| | | | 309,809
| | | | —
| | |
Goldman
Sachs
International | | Citigroup,
Inc.
| | 06/20/2018
| | | 1.000
| | | | 0.558
| | | USD |
| | | | (7,800,000
| ) | | | 73,711
| | | | 76,273
| | | | —
| | | | 8,667
| | | | 6,105
| | | | —
| | |
Goldman
Sachs
International
| | Markit
CMBX
North
America
Index,
Series 6
BBB- | | 05/11/2063
| | | 3.000
| | | | 4.094
| | | USD |
| | | | (6,400,000
| ) | | | (378,958
| ) | | | —
| | | | (534,132
| ) | | | 2,667
| | | | 157,841
| | | | —
| | |
Goldman
Sachs
International
| | Markit
CMBX
North
America
Index,
Series 6
BBB- | | 05/11/2063
| | | 3.000
| | | | 4.094
| | | USD |
| | | | (3,100,000
| ) | | | (183,559
| ) | | | —
| | | | (275,097
| ) | | | 1,292
| | | | 92,830
| | | | —
| | |
Goldman
Sachs
International
| | Markit
CMBX
North
America
Index,
Series 7
BBB- | | 01/17/2047
| | | 3.000
| | | | 4.364
| | | USD |
| | | | (3,200,000
| ) | | | (267,898
| ) | | | —
| | | | (400,668
| ) | | | 1,333
| | | | 134,103
| | | | —
| | |
Goldman
Sachs
International
| | Markit
CMBX
North
America
Index,
Series 7
BBB- | | 01/17/2047
| | | 3.000
| | | | 4.364
| | | USD |
| | | | (3,200,000
| ) | | | (267,898
| ) | | | —
| | | | (404,323
| ) | | | 1,333
| | | | 137,758
| | | | —
| | |
The accompanying Notes to Financial Statements are an integral part of this statement.
Annual Report 2016
35
COLUMBIA TOTAL RETURN BOND FUND
PORTFOLIO OF INVESTMENTS (continued)
April 30, 2016
Credit Default Swap Contracts Outstanding at April 30, 2016
Sell Protection (continued)
Counterparty | | Reference
Entity | | Expiration
Date | | Receive
Fixed
Rate (%) | | Implied
Credit
Spread (%)* | | Notional
Currency | | Notional
Amount | | Market
Value ($) | | Premium
Paid ($) | | Premium
Received
($) | | Periodic
Payments
Receivable
(Payable)
($) | | Unrealized
Appreciation
($) | | Unrealized
Depreciation
($) | |
JPMorgan
| | Bank of
America
Corp. | | 06/20/2018
| | | 1.000
| | | | 0.549
| | | USD |
| | | | (23,480,000
| ) | | | 226,347
| | | | 264,885
| | | | —
| | | | 26,089
| | | | —
| | | | (12,449
| ) | |
JPMorgan
| | Citigroup,
Inc. | | 06/20/2018
| | | 1.000
| | | | 0.558
| | | USD |
| | | | (7,825,000
| ) | | | 73,948
| | | | 91,641
| | | | —
| | | | 8,694
| | | | —
| | | | (8,999
| ) | |
JPMorgan
| | Citigroup,
Inc. | | 06/20/2018
| | | 1.000
| | | | 0.558
| | | USD |
| | | | (23,350,000
| ) | | | 220,660
| | | | 313,563
| | | | —
| | | | 25,944
| | | | —
| | | | (66,959
| ) | |
JPMorgan | | FedEx Corp. | | 12/20/2020 | | | 1.000 | | | | 0.503 | | | USD | | | | | (3,215,000 | ) | | | 73,048 | | | | 74,544 | | | | — | | | | 3,572 | | | | 2,076 | | | | — | | |
JPMorgan
| | Markit
CMBX
North
America
Index,
Series 7
BBB- | | 01/17/2047
| | | 3.000
| | | | 4.364
| | | USD |
| | | | (3,000,000
| ) | | | (251,155
| ) | | | —
| | | | (271,565
| ) | | | 1,250
| | | | 21,660
| | | | —
| | |
JPMorgan
| | Plains All
American
Pipeline LP | | 06/20/2021
| | | 1.000
| | | | 3.579
| | | USD |
| | | | (1,565,000
| ) | | | (183,165
| ) | | | —
| | | | (212,789
| ) | | | 1,739
| | | | 31,363
| | | | —
| | |
JPMorgan
| | Plains All
American
Pipeline LP | | 06/20/2021
| | | 1.000
| | | | 3.579
| | | USD |
| | | | (1,555,000
| ) | | | (181,996
| ) | | | —
| | | | (181,910
| ) | | | 1,728
| | | | 1,642
| | | | —
| | |
JPMorgan
| | Plains All
American
Pipeline, LP | | 06/20/2021
| | | 1.000
| | | | 3.579
| | | USD |
| | | | (1,560,000
| ) | | | (182,580
| ) | | | —
| | | | (314,098
| ) | | | 1,733
| | | | 133,251
| | | | —
| | |
JPMorgan
| | Plains All
American
Pipeline, LP | | 06/20/2021
| | | 1.000
| | | | 3.579
| | | USD |
| | | | (1,555,000
| ) | | | (181,996
| ) | | | —
| | | | (259,601
| ) | | | 1,728
| | | | 79,333
| | | | —
| | |
Morgan
Stanley
| | Anadarko
Petroleum
Corp. | | 12/20/2020
| | | 1.000
| | | | 2.381
| | | USD |
| | | | (6,445,000
| ) | | | (383,641
| ) | | | —
| | | | (541,214
| ) | | | 7,161
| | | | 164,734
| | | | —
| | |
Morgan
Stanley
| | Anadarko
Petroleum
Corp. | | 12/20/2020
| | | 1.000
| | | | 2.381
| | | USD |
| | | | (6,435,000
| ) | | | (383,045
| ) | | | —
| | | | (647,049
| ) | | | 7,150
| | | | 271,154
| | | | —
| | |
Morgan
Stanley
| | Anadarko
Petroleum
Corp. | | 12/20/2020
| | | 1.000
| | | | 2.381
| | | USD |
| | | | (4,740,000
| ) | | | (282,151
| ) | | | —
| | | | (713,522
| ) | | | 5,267
| | | | 436,638
| | | | —
| | |
Morgan
Stanley
| | Bank of
America
Corp. | | 06/20/2018
| | | 1.000
| | | | 0.549
| | | USD |
| | | | (7,800,000
| ) | | | 75,192
| | | | 74,601
| | | | —
| | | | 8,667
| | | | 9,258
| | | | —
| | |
Morgan
Stanley
| | Bank of
America
Corp. | | 06/20/2018
| | | 1.000
| | | | 0.549
| | | USD |
| | | | (7,875,000
| ) | | | 75,915
| | | | 82,082
| | | | —
| | | | 8,750
| | | | 2,583
| | | | —
| | |
Morgan
Stanley
| | Canadian
Natural
Resources
Ltd. | | 06/20/2021
| | | 1.000
| | | | 2.300
| | | USD |
| | | | (1,560,000
| ) | | | (96,534
| ) | | | —
| | | | (119,896
| ) | | | 1,733
| | | | 25,095
| | | | —
| | |
Morgan
Stanley
| | Enterprise
Products
Partners LP | | 06/20/2021
| | | 1.000
| | | | 2.154
| | | USD |
| | | | (9,370,000
| ) | | | (518,852
| ) | | | —
| | | | (494,627
| ) | | | 10,411
| | | | —
| | | | (13,814
| ) | |
Morgan
Stanley
| | Enterprise
Products
Partners, LP | | 06/20/2021
| | | 1.000
| | | | 2.154
| | | USD |
| | | | (9,335,000
| ) | | | (516,914
| ) | | | —
| | | | (779,553
| ) | | | 10,372
| | | | 273,011
| | | | —
| | |
The accompanying Notes to Financial Statements are an integral part of this statement.
Annual Report 2016
36
COLUMBIA TOTAL RETURN BOND FUND
PORTFOLIO OF INVESTMENTS (continued)
April 30, 2016
Credit Default Swap Contracts Outstanding at April 30, 2016
Sell Protection (continued)
Counterparty | | Reference
Entity | | Expiration
Date | | Receive
Fixed
Rate (%) | | Implied
Credit
Spread (%)* | | Notional
Currency | | Notional
Amount | | Market
Value ($) | | Premium
Paid ($) | | Premium
Received
($) | | Periodic
Payments
Receivable
(Payable)
($) | | Unrealized
Appreciation
($) | | Unrealized
Depreciation
($) | |
Morgan
Stanley
| | Markit
CMBX
North
America
Index,
Series 6
BBB- | | 05/11/2063
| | | 3.000
| | | | 4.094
| | | USD |
| | | | (3,000,000
| ) | | | (177,636
| ) | | | —
| | | | (185,770
| ) | | | 1,250
| | | | 9,384
| | | | —
| | |
Morgan
Stanley
| | Markit
CMBX
North
America
Index,
Series 6
BBB- | | 05/11/2063
| | | 3.000
| | | | 4.094
| | | USD |
| | | | (2,300,000
| ) | | | (136,188
| ) | | | —
| | | | (179,577
| ) | | | 958
| | | | 44,347
| | | | —
| | |
Morgan
Stanley
| | Markit
CMBX
North
America
Index,
Series 6
BBB- | | 05/11/2063
| | | 3.000
| | | | 4.094
| | | USD |
| | | | (6,000,000
| ) | | | (355,274
| ) | | | —
| | | | (499,506
| ) | | | 2,500
| | | | 146,732
| | | | —
| | |
Morgan
Stanley
| | Markit
CMBX
North
America
Index,
Series 7
BBB- | | 01/17/2047
| | | 3.000
| | | | 4.364
| | | USD |
| | | | (4,100,000
| ) | | | (343,245
| ) | | | —
| | | | (482,339
| ) | | | 1,708
| | | | 140,802
| | | | —
| | |
Morgan
Stanley
| | Markit
CMBX
North
America
Index,
Series 7
BBB- | | 01/17/2047
| | | 3.000
| | | | 4.364
| | | USD |
| | | | (3,000,000
| ) | | | (251,155
| ) | | | —
| | | | (360,854
| ) | | | 1,250
| | | | 110,949
| | | | —
| | |
Morgan
Stanley
| | Markit
CMBX
North
America
Index,
Series 7
BBB- | | 01/17/2047
| | | 3.000
| | | | 4.364
| | | USD |
| | | | (8,500,000
| ) | | | (711,606
| ) | | | —
| | | | (1,033,067
| ) | | | 3,542
| | | | 325,003
| | | | —
| | |
Morgan
Stanley
| | Mondelez
International,
Inc. | | 12/20/2020
| | | 1.000
| | | | 0.382
| | | USD |
| | | | (3,235,000
| ) | | | 91,700
| | | | 95,598
| | | | —
| | | | 3,594
| | | | —
| | | | (304
| ) | |
Morgan
Stanley
| | Plains All
American
Pipeline LP | | 06/20/2021
| | | 1.000
| | | | 3.579
| | | USD |
| | | | (4,620,000
| ) | | | (540,719
| ) | | | —
| | | | (694,802
| ) | | | 5,133
| | | | 159,216
| | | | —
| | |
Morgan
Stanley
| | Plains All
American
Pipeline, LP | | 06/20/2021
| | | 1.000
| | | | 3.579
| | | USD |
| | | | (3,115,000
| ) | | | (364,576
| ) | | | —
| | | | (556,662
| ) | | | 3,461
| | | | 195,547
| | | | —
| | |
Morgan
Stanley
| | Plains All
American
Pipeline, LP | | 06/20/2021
| | | 1.000
| | | | 3.579
| | | USD |
| | | | (3,125,000
| ) | | | (365,746
| ) | | | —
| | | | (478,965
| ) | | | 3,472
| | | | 116,691
| | | | —
| | |
The accompanying Notes to Financial Statements are an integral part of this statement.
Annual Report 2016
37
COLUMBIA TOTAL RETURN BOND FUND
PORTFOLIO OF INVESTMENTS (continued)
April 30, 2016
Credit Default Swap Contracts Outstanding at April 30, 2016
Sell Protection (continued)
Counterparty | | Reference
Entity | | Expiration
Date | | Receive
Fixed
Rate (%) | | Implied
Credit
Spread (%)* | | Notional
Currency | | Notional
Amount | | Market
Value ($) | | Premium
Paid ($) | | Premium
Received
($) | | Periodic
Payments
Receivable
(Payable)
($) | | Unrealized
Appreciation
($) | | Unrealized
Depreciation
($) | |
Morgan
Stanley
| | Plains All
American
Pipeline, LP | | 06/21/2021
| | | 1.000
| | | | 3.579
| | | USD |
| | | | (1,560,000
| ) | | | (182,580
| ) | | | —
| | | | (301,883
| ) | | | 1,733
| | | | 121,036
| | | | —
| | |
Total | | | | | | | | | | | | | | | | | 1,275,498 | | | | (13,851,182 | ) | | | | | 4,708,491 | | | | (137,495 | ) | |
*Implied credit spreads, represented in absolute terms, utilized in determining the market value of credit default swap agreements on corporate or sovereign issues as of period end serve as an indicator of the current status of the payment/performance risk and represent the likelihood or risk of default for the credit derivative. The implied credit spread of a particular referenced entity reflects the cost of buying/selling protection and may include upfront payments required to be made to enter into the agreement. Wider credit spreads represent a deterioration of the referenced entity's credit soundness and a greater likelihood or risk of default or other credit event occurring as defined under the terms of the agreement.
Cleared Interest Rate Swap Contracts Outstanding at April 30, 2016
Counterparty | | Fund Receives | | Fund Pays | | Expiration
Date | | Notional
Currency | | Notional
Amount | | Unrealized
Appreciation ($) | | Unrealized
Depreciation ($) | |
Morgan Stanley | | 3-Month USD LIBOR-BBA | | | 1.593 | | | 09/14/2020 | | USD | | | | | 11,350,000 | | | | — | | | | (208,343 | ) | |
Morgan Stanley | | 3-Month USD LIBOR-BBA | | | 1.5692 | | | 09/16/2020 | | USD | | | | | 11,000,000 | | | | — | | | | (189,478 | ) | |
Total | | | | | | | | | | | | | — | | | | (397,821 | ) | |
Notes to Portfolio of Investments
(a) Represents privately placed and other securities and instruments exempt from SEC registration (collectively, private placements), such as Section 4(a)(2) and Rule 144A eligible securities, which are often sold only to qualified institutional buyers. The Fund may invest in private placements determined to be liquid as well as those determined to be illiquid. Private placements may be determined to be liquid under guidelines established by the Fund's Board of Trustees. At April 30, 2016, the value of these securities amounted to $994,181,856 or 31.40% of net assets.
(b) Variable rate security.
(c) Identifies securities considered by the Investment Manager to be illiquid and may be difficult to sell. The aggregate value of such securities at April 30, 2016 was $42,762, which represents less than 0.01% of net assets. Information concerning such security holdings at April 30, 2016 is as follows:
Security Description | | Acquisition Dates | | Cost ($) | |
American Mortgage Trust
Series 2093-3 Class 3A
07/27/23 8.188% | | 04/27/1995 | | | 2,664 | | |
WMI Holdings Corp. Escrow | | 03/28/2008 | | | — | | |
Washington Mutual Bank
Subordinated
01/15/15 5.125% | | 09/25/2007 - 05/14/2008 | | | 24,052,072 | | |
(d) Represents fair value as determined in good faith under procedures approved by the Board of Trustees. At April 30, 2016, the value of these securities amounted to $2,841,875, which represents 0.09% of net assets.
(e) Represents securities that have defaulted on payment of interest. The Fund has stopped accruing interest on these securities. At April 30, 2016, the value of these securities amounted to $336,782, which represents 0.01% of net assets.
(f) Security, or a portion thereof, has been purchased on a when-issued or delayed delivery basis.
(g) Interest Only (IO) represents the right to receive the monthly interest payments on an underlying pool of mortgage loans.
The accompanying Notes to Financial Statements are an integral part of this statement.
Annual Report 2016
38
COLUMBIA TOTAL RETURN BOND FUND
PORTFOLIO OF INVESTMENTS (continued)
April 30, 2016
Notes to Portfolio of Investments (continued)
(h) Principal Only (PO) represents the right to receive the principal portion only on an underlying pool of mortgage loans.
(i) This security or a portion of this security has been pledged as collateral in connection with derivative contracts.
(j) Zero coupon bond.
(k) Principal and interest may not be guaranteed by the government.
(l) Municipal obligations include debt obligations issued by or on behalf of territories, possessions, or sovereign nations within the territorial boundaries of the United States. At April 30, 2016, the value of these securities amounted to $4,678,655 or 0.15% of net assets.
(m) Senior loans have interest rates that float periodically based primarily on the London Interbank Offered Rate ("LIBOR") and other short-term rates. The interest rate shown reflects the weighted average coupon as of April 30, 2016. The interest rate shown for senior loans purchased on a when-issued or delayed delivery basis, if any, reflects an estimated average coupon. Remaining maturities of senior loans may be less than the stated maturities shown as a result of contractual or optional prepayments by the borrower. Such prepayments cannot be predicted.
(n) Non-income producing investment.
(o) Negligible market value.
(p) Purchased Swaption Contracts Outstanding at April 30, 2016:
Description | | Counterparty | | Fund Receives | | Fund Pays | | Exercise
Rate (%) | | Expiration
Date | | Notional
Amount ($) | | Premium
Paid ($) | | Market
Value ($) | |
Put — OTC
5-Year Interest Rate Swap | | Barclays
| | 3-Month USD
LIBOR BBA | | Fixed rate of
2.150% | | | 2.150
| | | 09/13/2021
| | | 16,500,000
| | | | 235,125
| | | | 8,664
| | |
Put — OTC
5-Year Interest Rate Swap | | Citi
| | 3-Month USD
LIBOR BBA | | Fixed rate of
2.000% | | | 2.000
| | | 12/14/2021
| | | 20,000,000
| | | | 271,500
| | | | 58,890
| | |
Total | | | | | | | | | | | | | | | 506,625 | | | | 67,554 | | |
(q) The rate shown is the seven-day current annualized yield at April 30, 2016.
(r) As defined in the Investment Company Act of 1940, an affiliated company is one in which the Fund owns 5% or more of the company's outstanding voting securities, or a company which is under common ownership or control with the Fund. Holdings and transactions in these affiliated companies during the year ended April 30, 2016 are as follows:
Issuer | | Beginning
Cost ($) | | Purchase
Cost ($) | | Proceeds
From Sales ($) | | Ending
Cost ($) | | Dividends —
Affiliated
Issuers ($) | | Value ($) | |
Columbia Short-Term Cash Fund | | | 18,280,193 | | | | 538,085,621 | | | | (552,030,422 | ) | | | 4,335,392 | | | | 16,394 | | | | 4,335,392 | | |
(s) Written Swaption Contracts Outstanding at April 30, 2016:
Description | | Counterparty | | Fund Receives | | Fund Pays | | Exercise
Rate (%) | | Expiration
Date | | Notional
Amount ($) | | Premium
Received ($) | | Market
Value ($) | |
Put — OTC
10-Year Interest Rate Swap | | Citi
| | Fixed rate of
1.850% | | 3-Month USD
LIBOR BBA | | | 1.850
| | | 07/21/2026
| | | (30,000,000
| ) | | | (249,750
| ) | | | (292,842
| ) | |
Abbreviation Legend
AGM Assured Guaranty Municipal Corporation
CMO Collateralized Mortgage Obligation
NPFGC National Public Finance Guarantee Corporation
PIK Payment-in-Kind
STRIPS Separate Trading of Registered Interest and Principal Securities
Currency Legend
USD US Dollar
The accompanying Notes to Financial Statements are an integral part of this statement.
Annual Report 2016
39
COLUMBIA TOTAL RETURN BOND FUND
PORTFOLIO OF INVESTMENTS (continued)
April 30, 2016
Fair Value Measurements
The Fund categorizes its fair value measurements according to a three-level hierarchy that maximizes the use of observable inputs and minimizes the use of unobservable inputs by prioritizing that the most observable input be used when available. Observable inputs are those that market participants would use in pricing an investment based on market data obtained from sources independent of the reporting entity. Unobservable inputs are those that reflect the Fund's assumptions about the information market participants would use in pricing an investment. An investment's level within the fair value hierarchy is based on the lowest level of any input that is deemed significant to the asset's or liability's fair value measurement. The input levels are not necessarily an indication of the risk or liquidity associated with investments at that level. For example, certain U.S. government securities are generally high quality and liquid, however, they are reflected as Level 2 because the inputs used to determine fair value may not always be quoted prices in an active market.
Fair value inputs are summarized in the three broad levels listed below:
> Level 1 — Valuations based on quoted prices for investments in active markets that the Fund has the ability to access at the measurement date (including NAV for open-end mutual funds). Valuation adjustments are not applied to Level 1 investments.
> Level 2 — Valuations based on other significant observable inputs (including quoted prices for similar securities, interest rates, prepayment speeds, credit risks, etc.).
> Level 3 — Valuations based on significant unobservable inputs (including the Fund's own assumptions and judgment in determining the fair value of investments).
Inputs that are used in determining fair value of an investment may include price information, credit data, volatility statistics, and other factors. These inputs can be either observable or unobservable. The availability of observable inputs can vary between investments, and is affected by various factors such as the type of investment, and the volume and level of activity for that investment or similar investments in the marketplace. The inputs will be considered by the Investment Manager, along with any other relevant factors in the calculation of an investment's fair value. The Fund uses prices and inputs that are current as of the measurement date, which may include periods of market dislocations. During these periods, the availability of prices and inputs may be reduced for many investments. This condition could cause an investment to be reclassified between the various levels within the hierarchy.
Certain investments that have been measured at fair value using the net asset value per share (or its equivalent) are not categorized in the fair value hierarchy. The fair value amounts presented in the table are intended to reconcile the fair value hierarchy to the amounts presented in the Portfolio of Investments. The Columbia Short-Term Cash Fund seeks to provide shareholders with maximum current income consistent with liquidity and stability of principal. Investments in Columbia Short-Term Cash Fund may be redeemed on a daily basis without restriction.
Investments falling into the Level 3 category are primarily supported by quoted prices from brokers and dealers participating in the market for those investments. However, these may be classified as Level 3 investments due to lack of market transparency and corroboration to support these quoted prices. Additionally, valuation models may be used as the pricing source for any remaining investments classified as Level 3. These models may rely on one or more significant unobservable inputs and/or significant assumptions by the Investment Manager. Inputs used in valuations may include, but are not limited to, financial statement analysis, capital account balances, discount rates and estimated cash flows, and comparable company data.
Under the direction of the Fund's Board of Trustees (the Board), the Investment Manager's Valuation Committee (the Committee) is responsible for overseeing the valuation procedures approved by the Board. The Committee consists of voting and non-voting members from various groups within the Investment Manager's organization, including operations and accounting, trading and investments, compliance, risk management and legal.
The Committee meets at least monthly to review and approve valuation matters, which may include a description of specific valuation determinations, data regarding pricing information received from approved pricing vendors and brokers and the results of Board-approved valuation control policies and procedures (the Policies). The Policies address, among other things, instances when market quotations are or are not readily available, including recommendations of third party pricing vendors and a determination of appropriate pricing methodologies; events that require specific valuation determinations and assessment of fair value techniques; securities with a potential for stale pricing, including those that are illiquid, restricted, or in default; and the effectiveness of third party pricing vendors, including periodic reviews of vendors. The Committee meets more frequently, as needed, to discuss additional valuation matters, which may include the need to review back-testing results, review time-sensitive information or approve related valuation actions. The Committee reports to the Board, with members of the Committee meeting with the Board at each of its regularly scheduled meetings to discuss valuation matters and actions during the period, similar to those described earlier.
For investments categorized as Level 3, the Committee monitors information similar to that described above, which may include: (i) data specific to the issuer or comparable issuers, (ii) general market or specific sector news and (iii) quoted prices and specific or similar security transactions. The Committee considers this data and any changes from prior periods in order to assess the reasonableness of observable and unobservable inputs, any assumptions or internal models used to value those securities and changes in fair value. This data is also used to corroborate, when available, information received from approved pricing vendors and brokers. Various factors impact the frequency of monitoring this information (which may occur as often as daily). However, the Committee may determine that changes to inputs, assumptions and models are not required as a result of the monitoring procedures performed.
The accompanying Notes to Financial Statements are an integral part of this statement.
Annual Report 2016
40
COLUMBIA TOTAL RETURN BOND FUND
PORTFOLIO OF INVESTMENTS (continued)
April 30, 2016
Fair Value Measurements (continued)
The following table is a summary of the inputs used to value the Fund's investments at April 30, 2016:
| | | Level 1
Quoted Prices in Active
Markets for Identical
Assets ($) | | Level 2
Other Significant
Observable Inputs ($) | | Level 3
Significant
Unobservable Inputs ($) | | Total ($) | |
Investments | |
Corporate Bonds & Notes | | | — | | | | 1,563,305,980 | | | | 41,069 | | | | 1,563,347,049 | | |
Residential Mortgage-Backed
Securities — Agency | | | — | | | | 677,171,822 | | | | 15,149,681 | | | | 692,321,503 | | |
Residential Mortgage-Backed
Securities — Non-Agency | | | — | | | | 138,000,615 | | | | 9,905,918 | | | | 147,906,533 | | |
Commercial Mortgage-Backed
Securities — Non-Agency | | | — | | | | 196,311,192 | | | | 2,932,244 | | | | 199,243,436 | | |
Asset-Backed Securities — Agency | | | — | | | | 35,097,821 | | | | — | | | | 35,097,821 | | |
Asset-Backed Securities — Non-Agency | | | — | | | | 480,305,691 | | | | 23,480,213 | | | | 503,785,904 | | |
U.S. Treasury Obligations | | | 189,101,159 | | | | 33,881,049 | | | | — | | | | 222,982,208 | | |
U.S. Government & Agency Obligations | | | — | | | | 21,344,432 | | | | — | | | | 21,344,432 | | |
Foreign Government Obligations | | | — | | | | 35,167,332 | | | | — | | | | 35,167,332 | | |
Municipal Bonds | | | — | | | | 43,545,643 | | | | — | | | | 43,545,643 | | |
Preferred Debt | | | 43,086,112 | | | | — | | | | — | | | | 43,086,112 | | |
Senior Loans | | | — | | | | 2,083,924 | | | | — | | | | 2,083,924 | | |
Common Stocks | |
Financials | | | 120,904 | | | | — | | | | — | | | | 120,904 | | |
Industrials | | | 68,394 | | | | — | | | | — | | | | 68,394 | | |
Total Common Stocks | | | 189,298 | | | | — | | | | — | | | | 189,298 | | |
Warrants | |
Health Care | | | 22,346 | | | | — | | | | — | | | | 22,346 | | |
Options Purchased Puts | | | — | | | | 67,554 | | | | — | | | | 67,554 | | |
Investments measured at net asset value | |
Money Market Funds | | | — | | | | — | | | | — | | | | 4,335,392 | | |
Total Investments | | | 232,398,915 | | | | 3,226,283,055 | | | | 51,509,125 | | | | 3,514,526,487 | | |
Derivatives | |
Assets | |
Futures Contracts | | | 1,634,758 | | | | — | | | | — | | | | 1,634,758 | | |
Swap Contracts | | | — | | | | 5,617,688 | | | | — | | | | 5,617,688 | | |
Liabilities | |
Futures Contracts | | | (772,396 | ) | | | — | | | | — | | | | (772,396 | ) | |
Options Contracts Written | | | — | | | | (292,842 | ) | | | — | | | | (292,842 | ) | |
Swap Contracts | | | — | | | | (7,404,169 | ) | | | — | | | | (7,404,169 | ) | |
Total | | | 233,261,277 | | | | 3,224,203,732 | | | | 51,509,125 | | | | 3,513,309,526 | | |
See the Portfolio of Investments for all investment classifications not indicated in the table.
The Fund's assets assigned to the Level 2 input category are generally valued using the market approach, in which a security's value is determined through reference to prices and information from market transactions for similar or identical assets.
The accompanying Notes to Financial Statements are an integral part of this statement.
Annual Report 2016
41
COLUMBIA TOTAL RETURN BOND FUND
PORTFOLIO OF INVESTMENTS (continued)
April 30, 2016
Fair Value Measurements (continued)
Futures contracts and swap contracts are valued at unrealized appreciation (depreciation).
There were no transfers of financial assets between Levels 1 and 2 during the period.
The following table is a reconciliation of Level 3 assets for which significant observable and unobservable inputs were used to determine fair value:
| | | Corporate
Bonds &
Notes ($) | | Residential
Mortgage-Backed
Securities —
Agency ($) | | Residential
Mortgage-Backed
Securities —
Non-Agency ($) | | Commercial
Mortgage-Backed
Securities —
Non-Agency ($) | | Asset-Backed
Securities —
Non-Agency ($) | | Senior
Loans ($) | | Total ($) | |
Balance as of
April 30, 2015 | | | 518,165 | | | | 487,500 | | | | 12,755,784 | | | | 2,238,583 | | | | 20,298,332 | | | | 148,925 | | | | 36,447,289 | | |
Increase (decrease)
in accrued
discounts/premiums | | | — | | | | — | | | | (17,035 | ) | | | (560 | ) | | | 45 | | | | — | | | | (17,550 | ) | |
Realized gain (loss) | | | 8,726 | | | | — | | | | (28,687 | ) | | | — | | | | — | | | | 2,035 | | | | (17,926 | ) | |
Change in unrealized
appreciation
(depreciation)(a) | | | (8,487 | ) | | | 35,283 | | | | (213,813 | ) | | | 32,907 | | | | 39,816 | | | | (2,405 | ) | | | (116,699 | ) | |
Sales | | | (477,335 | ) | | | — | | | | (11,401,695 | ) | | | (2,104,213 | ) | | | (1,319,338 | ) | | | (148,555 | ) | | | (15,451,136 | ) | |
Purchases | | | — | | | | 15,114,398 | | | | 8,811,364 | | | | 2,765,527 | | | | 20,441,358 | | | | — | | | | 47,132,647 | | |
Transfers into
Level 3 | | | — | | | | — | | | | — | | | | — | | | | — | | | | — | | | | — | | |
Transfers out of
Level 3 | | | — | | | | (487,500 | ) | | | — | | | | — | | | | (15,980,000 | ) | | | — | | | | (16,467,500 | ) | |
Balance as of
April 30, 2016 | | | 41,069 | | | | 15,149,681 | | | | 9,905,918 | | | | 2,932,244 | | | | 23,480,213 | | | | — | | | | 51,509,125 | | |
(a) Change in unrealized appreciation (depreciation) relating to securities held at April 30, 2016 was $39,089, which is comprised of Residential Mortgage-Backed Securities — Agency of $35,283, Residential Mortgage-Backed Securities — Non-Agency of $(68,917), Commercial Mortgage-Backed Securities — Non-Agency of $32,907 and Asset-Backed Securities — Non-Agency of $39,816.
The Fund's assets assigned to the Level 3 category are valued utilizing the valuation technique deemed the most appropriate in the circumstances.
Certain corporate bonds classified as Level 3 are valued using a market approach. To determine fair value for these securities, management considered various factors which may have included, but were not limited to, trades of similar securities, estimated earnings of the respective company, market multiples derived from a set of comparable companies, and the position of the security within the respective company's capital structure. Significant increases (decreases) to any of these inputs would result in a significantly lower (higher) fair value measurement. Generally, a change in estimated earnings of the respective company might result in change to the comparable companies and market multiples.
Certain residential, commercial, and asset backed securities classified as Level 3 securities are valued using the market approach and utilize single market quotations from broker dealers which may have included, but were not limited to, observable transactions for identical or similar assets in the market and the distressed nature of the security. The appropriateness of fair values for these securities is monitored on an ongoing basis which may include results of back testing, manual price reviews and other control procedures. Significant increases (decreases) to any of these inputs would result in a significantly lower (higher) fair value measurement.
Other residential mortgage backed securities classified as Level 3 are valued using a market approach. To determine fair value for these securities, management considered various factors which may have included, but were not limited to, estimated cash flows of the securities and observed yields on securities management deemed comparable. Significant increases (decreases) to any of these inputs would result in a significantly lower (higher) fair value measurement. Generally, a change in observable yields on comparable securities would result in a directionally similar change to discount rates.
Financial assets were transferred from Level 3 to Level 2 as observable market inputs were utilized and management determined that there was sufficient, reliable and observable market data to value these assets as of period end.
Transfers into and/or out of Level 3 are determined based on the fair value at the beginning of the period for security positions held throughout the period.
The accompanying Notes to Financial Statements are an integral part of this statement.
Annual Report 2016
42
COLUMBIA TOTAL RETURN BOND FUND
STATEMENT OF ASSETS AND LIABILITIES
April 30, 2016
Assets | |
Investments, at value | |
Unaffiliated issuers (identified cost $3,472,454,168) | | $ | 3,510,123,541 | | |
Affiliated issuers (identified cost $4,335,392) | | | 4,335,392 | | |
Options purchased (identified cost $506,625) | | | 67,554 | | |
Total investments (identified cost $3,477,296,185) | | | 3,514,526,487 | | |
Foreign currency (identified cost $157,958) | | | 115,995 | | |
Cash collateral held at broker | | | 300,000 | | |
Margin deposits | | | 349,079 | | |
Unrealized appreciation on swap contracts | | | 5,587,641 | | |
Premiums paid on outstanding swap contracts | | | 15,526,592 | | |
Receivable for: | |
Investments sold | | | 34,037,418 | | |
Investments sold on a delayed delivery basis | | | 167,489,090 | | |
Capital shares sold | | | 7,594,626 | | |
Dividends | | | 143,826 | | |
Interest | | | 23,802,808 | | |
Foreign tax reclaims | | | 68,096 | | |
Variation margin | | | 628,663 | | |
Expense reimbursement due from Investment Manager | | | 3,036 | | |
Prepaid expenses | | | 6,606 | | |
Trustees' deferred compensation plan | | | 167,257 | | |
Other assets | | | 50,983 | | |
Total assets | | | 3,770,398,203 | | |
Liabilities | |
Option contracts written, at value (premiums received $249,750) | | | 292,842 | | |
Due to custodian | | | 99,297 | | |
Unrealized depreciation on swap contracts | | | 6,262,826 | | |
Premiums received on outstanding swap contracts | | | 17,888,148 | | |
Payable for: | |
Investments purchased | | | 22,950,247 | | |
Investments purchased on a delayed delivery basis | | | 544,824,265 | | |
Capital shares purchased | | | 3,417,457 | | |
Dividend distributions to shareholders | | | 7,373,889 | | |
Variation margin | | | 400,573 | | |
Investment management fees | | | 41,244 | | |
Distribution and/or service fees | | | 12,209 | | |
Transfer agent fees | | | 335,831 | | |
Plan administration fees | | | 81 | | |
Compensation of board members | | | 60,754 | | |
Chief compliance officer expenses | | | 142 | | |
Other expenses | | | 199,193 | | |
Trustees' deferred compensation plan | | | 167,257 | | |
Total liabilities | | | 604,326,255 | | |
Net assets applicable to outstanding capital stock | | $ | 3,166,071,948 | | |
The accompanying Notes to Financial Statements are an integral part of this statement.
Annual Report 2016
43
COLUMBIA TOTAL RETURN BOND FUND
STATEMENT OF ASSETS AND LIABILITIES (continued)
April 30, 2016
Represented by | |
Paid-in capital | | $ | 3,133,495,497 | | |
Undistributed net investment income | | | 4,536,980 | | |
Accumulated net realized loss | | | (6,432,507 | ) | |
Unrealized appreciation (depreciation) on: | |
Investments | | | 37,669,373 | | |
Foreign currency translations | | | (41,963 | ) | |
Futures contracts | | | 862,362 | | |
Options purchased | | | (439,071 | ) | |
Options contracts written | | | (43,092 | ) | |
Swap contracts | | | (3,535,631 | ) | |
Total — representing net assets applicable to outstanding capital stock | | $ | 3,166,071,948 | | |
Class A | |
Net assets | | $ | 978,459,573 | | |
Shares outstanding | | | 106,409,624 | | |
Net asset value per share | | $ | 9.20 | | |
Maximum offering price per share | | $ | 9.48 | | |
Class B | |
Net assets | | $ | 5,270,020 | | |
Shares outstanding | | | 573,145 | | |
Net asset value per share | | $ | 9.19 | | |
Class C | |
Net assets | | $ | 55,974,821 | | |
Shares outstanding | | | 6,087,244 | | |
Net asset value per share | | $ | 9.20 | | |
Class I | |
Net assets | | $ | 421,701,817 | | |
Shares outstanding | | | 45,810,311 | | |
Net asset value per share | | $ | 9.21 | | |
Class K | |
Net assets | | $ | 11,832,558 | | |
Shares outstanding | | | 1,287,382 | | |
Net asset value per share | | $ | 9.19 | | |
Class R | |
Net assets | | $ | 2,407,063 | | |
Shares outstanding | | | 261,750 | | |
Net asset value per share | | $ | 9.20 | | |
Class R4 | |
Net assets | | $ | 8,265,436 | | |
Shares outstanding | | | 900,040 | | |
Net asset value per share | | $ | 9.18 | | |
The accompanying Notes to Financial Statements are an integral part of this statement.
Annual Report 2016
44
COLUMBIA TOTAL RETURN BOND FUND
STATEMENT OF ASSETS AND LIABILITIES (continued)
April 30, 2016
Class R5 | |
Net assets | | $ | 22,620,959 | | |
Shares outstanding | | | 2,462,867 | | |
Net asset value per share | | $ | 9.18 | | |
Class W | |
Net assets | | $ | 562,638,478 | | |
Shares outstanding | | | 61,116,742 | | |
Net asset value per share | | $ | 9.21 | | |
Class Y | |
Net assets | | $ | 18,085,929 | | |
Shares outstanding | | | 1,965,381 | | |
Net asset value per share | | $ | 9.20 | | |
Class Z | |
Net assets | | $ | 1,078,815,294 | | |
Shares outstanding | | | 117,286,011 | | |
Net asset value per share | | $ | 9.20 | | |
(a) The maximum offering price per share is calculated by dividing the net asset value per share by 1.0 minus the maximum sales charge of 3.00%.
The accompanying Notes to Financial Statements are an integral part of this statement.
Annual Report 2016
45
COLUMBIA TOTAL RETURN BOND FUND
STATEMENT OF OPERATIONS
Year Ended April 30, 2016
Net investment income | |
Income: | |
Dividends — unaffiliated issuers | | $ | 2,530,854 | | |
Dividends — affiliated issuers | | | 16,394 | | |
Interest | | | 106,575,209 | | |
Total income | | | 109,122,457 | | |
Expenses: | |
Investment management fees | | | 15,985,801 | | |
Distribution and/or service fees | |
Class A | | | 2,871,342 | | |
Class B | | | 78,725 | | |
Class C | | | 563,148 | | |
Class R | | | 13,808 | | |
Class W | | | 1,359,214 | | |
Transfer agent fees | |
Class A | | | 1,774,805 | | |
Class B | | | 12,267 | | |
Class C | | | 86,989 | | |
Class K | | | 5,721 | | |
Class R | | | 4,263 | | |
Class R4 | | | 12,255 | | |
Class R5 | | | 11,216 | | |
Class W | | | 835,470 | | |
Class Z | | | 1,802,788 | | |
Plan administration fees | |
Class K | | | 28,656 | | |
Compensation of board members | | | 75,743 | | |
Custodian fees | | | 79,964 | | |
Printing and postage fees | | | 364,275 | | |
Registration fees | | | 160,134 | | |
Audit fees | | | 35,109 | | |
Legal fees | | | 105,860 | | |
Chief compliance officer expenses | | | 1,631 | | |
Other | | | 86,406 | | |
Total expenses | | | 26,355,590 | | |
Fees waived or expenses reimbursed by Investment Manager and its affiliates | | | (1,507,986 | ) | |
Expense reductions | | | (2,250 | ) | |
Total net expenses | | | 24,845,354 | | |
Net investment income | | | 84,277,103 | | |
Realized and unrealized gain (loss) — net | |
Net realized gain (loss) on: | |
Investments | | | 2,232,646 | | |
Foreign currency translations | | | (286 | ) | |
Forward foreign currency exchange contracts | | | (576,358 | ) | |
Futures contracts | | | (6,066,743 | ) | |
Options purchased | | | (90,425 | ) | |
Options contracts written | | | 210,000 | | |
Swap contracts | | | (8,573,213 | ) | |
Net realized loss | | | (12,864,379 | ) | |
Net change in unrealized appreciation (depreciation) on: | |
Investments | | | 8,312,032 | | |
Foreign currency translations | | | (22,787 | ) | |
Forward foreign currency exchange contracts | | | 646,845 | | |
Futures contracts | | | (266,529 | ) | |
Options purchased | | | (439,071 | ) | |
Options contracts written | | | (43,092 | ) | |
Swap contracts | | | 2,011,115 | | |
Net change in unrealized appreciation | | | 10,198,513 | | |
Net realized and unrealized loss | | | (2,665,866 | ) | |
Net increase in net assets resulting from operations | | $ | 81,611,237 | | |
The accompanying Notes to Financial Statements are an integral part of this statement.
Annual Report 2016
46
COLUMBIA TOTAL RETURN BOND FUND
STATEMENT OF CHANGES IN NET ASSETS
| | | Year Ended
April 30,
2016 | | Year Ended
April 30,
2015 | |
Operations | |
Net investment income | | $ | 84,277,103 | | | $ | 93,796,385 | | |
Net realized gain (loss) | | | (12,864,379 | ) | | | 54,797,335 | | |
Net change in unrealized appreciation (depreciation) | | | 10,198,513 | | | | (14,301,042 | ) | |
Net increase in net assets resulting from operations | | | 81,611,237 | | | | 134,292,678 | | |
Distributions to shareholders | |
Net investment income | |
Class A | | | (21,854,015 | ) | | | (32,597,667 | ) | |
Class B | | | (86,058 | ) | | | (251,748 | ) | |
Class C | | | (652,734 | ) | | | (1,106,474 | ) | |
Class I | | | (8,486,350 | ) | | | (13,407,390 | ) | |
Class K | | | (228,572 | ) | | | (313,476 | ) | |
Class R | | | (45,010 | ) | | | (61,670 | ) | |
Class R4 | | | (171,793 | ) | | | (210,789 | ) | |
Class R5 | | | (501,470 | ) | | | (509,703 | ) | |
Class W | | | (10,390,799 | ) | | | (11,575,491 | ) | |
Class Y | | | (409,821 | ) | | | (453,598 | ) | |
Class Z | | | (25,015,987 | ) | | | (32,321,680 | ) | |
Net realized gains | |
Class A | | | (13,263,948 | ) | | | — | | |
Class B | | | (84,555 | ) | | | — | | |
Class C | | | (646,345 | ) | | | — | | |
Class I | | | (4,464,242 | ) | | | — | | |
Class K | | | (132,525 | ) | | | — | | |
Class R | | | (36,080 | ) | | | — | | |
Class R4 | | | (92,423 | ) | | | — | | |
Class R5 | | | (266,663 | ) | | | — | | |
Class W | | | (6,730,155 | ) | | | — | | |
Class Y | | | (218,301 | ) | | | — | | |
Class Z | | | (13,507,425 | ) | | | — | | |
Total distributions to shareholders | | | (107,285,271 | ) | | | (92,809,686 | ) | |
Decrease in net assets from capital stock activity | | | (305,143,329 | ) | | | (532,055,615 | ) | |
Total decrease in net assets | | | (330,817,363 | ) | | | (490,572,623 | ) | |
Net assets at beginning of year | | | 3,496,889,311 | | | | 3,987,461,934 | | |
Net assets at end of year | | $ | 3,166,071,948 | | | $ | 3,496,889,311 | | |
Undistributed net investment income | | $ | 4,536,980 | | | $ | 6,047,374 | | |
The accompanying Notes to Financial Statements are an integral part of this statement.
Annual Report 2016
47
COLUMBIA TOTAL RETURN BOND FUND
STATEMENT OF CHANGES IN NET ASSETS (continued)
| | | Year Ended April 30, 2016 | | Year Ended April 30, 2015 | |
| | | Shares | | Dollars ($) | | Shares | | Dollars ($) | |
Capital stock activity | |
Class A shares | |
Subscriptions(a) | | | 8,240,977 | | | | 74,719,720 | | | | 14,146,361 | | | | 130,597,121 | | |
Distributions reinvested | | | 3,616,019 | | | | 32,681,095 | | | | 3,193,721 | | | | 29,503,094 | | |
Redemptions | | | (40,336,791 | ) | | | (367,210,613 | ) | | | (43,522,927 | ) | | | (401,914,347 | ) | |
Net decrease | | | (28,479,795 | ) | | | (259,809,798 | ) | | | (26,182,845 | ) | | | (241,814,132 | ) | |
Class B shares | |
Subscriptions | | | 30,181 | | | | 273,499 | | | | 65,062 | | | | 600,697 | | |
Distributions reinvested | | | 16,731 | | | | 151,039 | | | | 24,799 | | | | 229,072 | | |
Redemptions(a) | | | (699,553 | ) | | | (6,350,408 | ) | | | (937,596 | ) | | | (8,655,645 | ) | |
Net decrease | | | (652,641 | ) | | | (5,925,870 | ) | | | (847,735 | ) | | | (7,825,876 | ) | |
Class C shares | |
Subscriptions | | | 716,784 | | | | 6,494,185 | | | | 673,068 | | | | 6,208,573 | | |
Distributions reinvested | | | 125,289 | | | | 1,130,608 | | | | 102,962 | | | | 951,070 | | |
Redemptions | | | (1,304,196 | ) | | | (11,844,278 | ) | | | (1,301,507 | ) | | | (12,007,246 | ) | |
Net decrease | | | (462,123 | ) | | | (4,219,485 | ) | | | (525,477 | ) | | | (4,847,603 | ) | |
Class I shares | |
Subscriptions | | | 15,526,943 | | | | 141,479,693 | | | | 13,438,123 | | | | 123,848,892 | | |
Distributions reinvested | | | 1,430,441 | | | | 12,950,244 | | | | 1,449,456 | | | | 13,407,104 | | |
Redemptions | | | (23,686,150 | ) | | | (215,994,196 | ) | | | (25,297,110 | ) | | | (232,968,322 | ) | |
Net decrease | | | (6,728,766 | ) | | | (61,564,259 | ) | | | (10,409,531 | ) | | | (95,712,326 | ) | |
Class K shares | |
Subscriptions | | | 245,441 | | | | 2,225,606 | | | | 203,111 | | | | 1,878,084 | | |
Distributions reinvested | | | 39,932 | | | | 360,779 | | | | 33,919 | | | | 313,222 | | |
Redemptions | | | (185,611 | ) | | | (1,686,186 | ) | | | (598,199 | ) | | | (5,506,290 | ) | |
Net increase (decrease) | | | 99,762 | | | | 900,199 | | | | (361,169 | ) | | | (3,314,984 | ) | |
Class R shares | |
Subscriptions | | | 166,721 | | | | 1,515,815 | | | | 108,429 | | | | 1,002,039 | | |
Distributions reinvested | | | 7,411 | | | | 66,945 | | | | 5,842 | | | | 53,989 | | |
Redemptions | | | (211,519 | ) | | | (1,914,425 | ) | | | (115,601 | ) | | | (1,066,029 | ) | |
Net decrease | | | (37,387 | ) | | | (331,665 | ) | | | (1,330 | ) | | | (10,001 | ) | |
Class R4 shares | |
Subscriptions | | | 433,627 | | | | 3,947,722 | | | | 224,590 | | | | 2,068,572 | | |
Distributions reinvested | | | 27,223 | | | | 245,785 | | | | 21,243 | | | | 196,034 | | |
Redemptions | | | (389,251 | ) | | | (3,546,202 | ) | | | (235,638 | ) | | | (2,171,845 | ) | |
Net increase | | | 71,599 | | | | 647,305 | | | | 10,195 | | | | 92,761 | | |
The accompanying Notes to Financial Statements are an integral part of this statement.
Annual Report 2016
48
COLUMBIA TOTAL RETURN BOND FUND
STATEMENT OF CHANGES IN NET ASSETS (continued)
| | | Year Ended April 30, 2016 | | Year Ended April 30, 2015 | |
| | | Shares | | Dollars ($) | | Shares | | Dollars ($) | |
Capital stock activity (continued) | |
Class R5 shares | |
Subscriptions | | | 517,182 | | | | 4,707,971 | | | | 719,473 | | | | 6,622,697 | | |
Distributions reinvested | | | 85,019 | | | | 767,788 | | | | 55,176 | | | | 509,422 | | |
Redemptions | | | (473,998 | ) | | | (4,291,461 | ) | | | (188,178 | ) | | | (1,737,347 | ) | |
Net increase | | | 128,203 | | | | 1,184,298 | | | | 586,471 | | | | 5,394,772 | | |
Class W shares | |
Subscriptions | | | 26,310,748 | | | | 239,845,328 | | | | 19,765,320 | | | | 183,113,256 | | |
Distributions reinvested | | | 1,893,054 | | | | 17,120,639 | | | | 1,251,768 | | | | 11,575,239 | | |
Redemptions | | | (16,023,295 | ) | | | (145,618,334 | ) | | | (27,475,576 | ) | | | (253,088,522 | ) | |
Net increase (decrease) | | | 12,180,507 | | | | 111,347,633 | | | | (6,458,488 | ) | | | (58,400,027 | ) | |
Class Y shares | |
Subscriptions | | | 511,585 | | | | 4,636,517 | | | | 588,614 | | | | 5,444,201 | | |
Distributions reinvested | | | 69,282 | | | | 626,841 | | | | 49,009 | | | | 453,313 | | |
Redemptions | | | (586,205 | ) | | | (5,289,699 | ) | | | (375,043 | ) | | | (3,457,126 | ) | |
Net increase (decrease) | | | (5,338 | ) | | | (26,341 | ) | | | 262,580 | | | | 2,440,388 | | |
Class Z shares | |
Subscriptions | | | 23,866,857 | | | | 217,046,791 | | | | 15,882,894 | | | | 146,660,467 | | |
Distributions reinvested | | | 1,889,016 | | | | 17,081,530 | | | | 1,370,750 | | | | 12,667,947 | | |
Redemptions | | | (35,463,542 | ) | | | (321,473,667 | ) | | | (31,147,225 | ) | | | (287,387,001 | ) | |
Net decrease | | | (9,707,669 | ) | | | (87,345,346 | ) | | | (13,893,581 | ) | | | (128,058,587 | ) | |
Total net decrease | | | (33,593,648 | ) | | | (305,143,329 | ) | | | (57,820,910 | ) | | | (532,055,615 | ) | |
(a) Includes conversions of Class B shares to Class A shares, if any.
The accompanying Notes to Financial Statements are an integral part of this statement.
Annual Report 2016
49
COLUMBIA TOTAL RETURN BOND FUND
The following tables are intended to help you understand the Fund's financial performance. Certain information reflects financial results for a single share of a class held for the periods shown. Per share net investment income (loss) amounts are calculated based on average shares outstanding during the period. Total return assumes reinvestment of all dividends and distributions, if any. Total return does not reflect payment of sales charges, if any. Total return and portfolio turnover are not annualized for periods of less than one year. The portfolio turnover rate is calculated without regard to purchase and sales transactions of short-term instruments and certain derivatives, if any. If such transactions were included, the Fund's portfolio turnover rate may be higher.
| | | Year Ended April 30, | | Year Ended
March 31, | |
Class A | | 2016 | | 2015 | | 2014 | | 2013 | | 2012(a) | | 2012 | |
Per share data | |
Net asset value, beginning of period | | $ | 9.25 | | | $ | 9.15 | | | $ | 9.49 | | | $ | 9.39 | | | $ | 9.33 | | | $ | 9.08 | | |
Income from investment operations: | |
Net investment income | | | 0.22 | | | | 0.23 | | | | 0.24 | | | | 0.28 | | | | 0.03 | | | | 0.33 | | |
Net realized and unrealized gain (loss) | | | 0.01 | (b) | | | 0.09 | | | | (0.31 | ) | | | 0.23 | | | | 0.05 | | | | 0.28 | | |
Total from investment operations | | | 0.23 | | | | 0.32 | | | | (0.07 | ) | | | 0.51 | | | | 0.08 | | | | 0.61 | | |
Less distributions to shareholders: | |
Net investment income | | | (0.17 | ) | | | (0.22 | ) | | | (0.21 | ) | | | (0.26 | ) | | | (0.02 | ) | | | (0.36 | ) | |
Net realized gains | | | (0.11 | ) | | | — | | | | (0.06 | ) | | | (0.15 | ) | | | — | | | | — | | |
Total distributions to shareholders | | | (0.28 | ) | | | (0.22 | ) | | | (0.27 | ) | | | (0.41 | ) | | | (0.02 | ) | | | (0.36 | ) | |
Proceeds from regulatory settlements | | | — | | | | — | | | | — | | | | — | | | | — | | | | 0.00 | (c) | |
Net asset value, end of period | | $ | 9.20 | | | $ | 9.25 | | | $ | 9.15 | | | $ | 9.49 | | | $ | 9.39 | | | $ | 9.33 | | |
Total return | | | 2.58 | % | | | 3.56 | % | | | (0.62 | %) | | | 5.52 | % | | | 0.91 | % | | | 6.82 | % | |
Ratios to average net assets(d) | |
Total gross expenses | | | 0.91 | % | | | 0.92 | % | | | 0.91 | % | | | 0.94 | % | | | 0.96 | %(e) | | | 0.95 | %(f) | |
Total net expenses(g) | | | 0.86 | %(h) | | | 0.85 | %(h) | | | 0.85 | %(h) | | | 0.86 | %(h) | | | 0.84 | %(e) | | | 0.84 | %(f)(h) | |
Net investment income | | | 2.39 | % | | | 2.45 | % | | | 2.67 | % | | | 2.94 | % | | | 3.35 | %(e) | | | 3.62 | % | |
Supplemental data | |
Net assets, end of period (in thousands) | | $ | 978,460 | | | $ | 1,248,168 | | | $ | 1,473,961 | | | $ | 2,168,079 | | | $ | 352,338 | | | $ | 338,578 | | |
Portfolio turnover | | | 458 | % | | | 316 | % | | | 274 | % | | | 239 | % | | | 10 | % | | | 170 | % | |
Notes to Financial Highlights
(a) For the period from April 1, 2012 to April 30, 2012. During the period, the Fund's fiscal year end was changed from March 31 to April 30.
(b) Calculation of the net gain (loss) per share (both realized and unrealized) does not correlate to the aggregate realized and unrealized gain (loss) presented in the Statement of Operations due to the timing of subscriptions and redemptions of Fund shares in relation to fluctuations in the market value of the portfolio.
(c) Rounds to zero.
(d) In addition to the fees and expenses that the Fund bears directly, the Fund indirectly bears a pro rata share of the fees and expenses of any other funds in which it invests. Such indirect expenses are not included in the Fund's reported expense ratios.
(e) Annualized.
(f) Ratios include line of credit interest expense which is less than 0.01%.
(g) Total net expenses include the impact of certain fee waivers/expense reimbursements made by the Investment Manager and certain of its affiliates, if applicable.
(h) The benefits derived from expense reductions had an impact of less than 0.01%.
The accompanying Notes to Financial Statements are an integral part of this statement.
Annual Report 2016
50
COLUMBIA TOTAL RETURN BOND FUND
FINANCIAL HIGHLIGHTS (continued)
| | | Year Ended April 30, | | Year Ended
March 31, | |
Class B | | 2016 | | 2015 | | 2014 | | 2013 | | 2012(a) | | 2012 | |
Per share data | |
Net asset value, beginning of period | | $ | 9.25 | | | $ | 9.15 | | | $ | 9.49 | | | $ | 9.39 | | | $ | 9.33 | | | $ | 9.08 | | |
Income from investment operations: | |
Net investment income | | | 0.14 | | | | 0.16 | | | | 0.17 | | | | 0.21 | | | | 0.02 | | | | 0.27 | | |
Net realized and unrealized gain (loss) | | | 0.01 | (b) | | | 0.09 | | | | (0.30 | ) | | | 0.23 | | | | 0.06 | | | | 0.27 | | |
Total from investment operations | | | 0.15 | | | | 0.25 | | | | (0.13 | ) | | | 0.44 | | | | 0.08 | | | | 0.54 | | |
Less distributions to shareholders: | |
Net investment income | | | (0.10 | ) | | | (0.15 | ) | | | (0.15 | ) | | | (0.19 | ) | | | (0.02 | ) | | | (0.29 | ) | |
Net realized gains | | | (0.11 | ) | | | — | | | | (0.06 | ) | | | (0.15 | ) | | | — | | | | — | | |
Total distributions to shareholders | | | (0.21 | ) | | | (0.15 | ) | | | (0.21 | ) | | | (0.34 | ) | | | (0.02 | ) | | | (0.29 | ) | |
Proceeds from regulatory settlements | | | — | | | | — | | | | — | | | | — | | | | — | | | | 0.00 | (c) | |
Net asset value, end of period | | $ | 9.19 | | | $ | 9.25 | | | $ | 9.15 | | | $ | 9.49 | | | $ | 9.39 | | | $ | 9.33 | | |
Total return | | | 1.70 | % | | | 2.79 | % | | | (1.36 | %) | | | 4.74 | % | | | 0.85 | % | | | 6.01 | % | |
Ratios to average net assets(d) | |
Total gross expenses | | | 1.66 | % | | | 1.67 | % | | | 1.66 | % | | | 1.69 | % | | | 1.71 | %(e) | | | 1.72 | %(f) | |
Total net expenses(g) | | | 1.61 | %(h) | | | 1.60 | %(h) | | | 1.60 | %(h) | | | 1.61 | %(h) | | | 1.59 | %(e) | | | 1.59 | %(f)(h) | |
Net investment income | | | 1.59 | % | | | 1.71 | % | | | 1.90 | % | | | 2.20 | % | | | 2.59 | %(e) | | | 2.93 | % | |
Supplemental data | |
Net assets, end of period (in thousands) | | $ | 5,270 | | | $ | 11,344 | | | $ | 18,976 | | | $ | 41,955 | | | $ | 6,081 | | | $ | 6,253 | | |
Portfolio turnover | | | 458 | % | | | 316 | % | | | 274 | % | | | 239 | % | | | 10 | % | | | 170 | % | |
Notes to Financial Highlights
(a) For the period from April 1, 2012 to April 30, 2012. During the period, the Fund's fiscal year end was changed from March 31 to April 30.
(b) Calculation of the net gain (loss) per share (both realized and unrealized) does not correlate to the aggregate realized and unrealized gain (loss) presented in the Statement of Operations due to the timing of subscriptions and redemptions of Fund shares in relation to fluctuations in the market value of the portfolio.
(c) Rounds to zero.
(d) In addition to the fees and expenses that the Fund bears directly, the Fund indirectly bears a pro rata share of the fees and expenses of any other funds in which it invests. Such indirect expenses are not included in the Fund's reported expense ratios.
(e) Annualized.
(f) Ratios include line of credit interest expense which is less than 0.01%.
(g) Total net expenses include the impact of certain fee waivers/expense reimbursements made by the Investment Manager and certain of its affiliates, if applicable.
(h) The benefits derived from expense reductions had an impact of less than 0.01%.
The accompanying Notes to Financial Statements are an integral part of this statement.
Annual Report 2016
51
COLUMBIA TOTAL RETURN BOND FUND
FINANCIAL HIGHLIGHTS (continued)
| | | Year Ended April 30, | | Year Ended
March 31, | |
Class C | | 2016 | | 2015 | | 2014 | | 2013 | | 2012(a) | | 2012 | |
Per share data | |
Net asset value, beginning of period | | $ | 9.25 | | | $ | 9.15 | | | $ | 9.49 | | | $ | 9.39 | | | $ | 9.33 | | | $ | 9.08 | | |
Income from investment operations: | |
Net investment income | | | 0.15 | | | | 0.17 | | | | 0.19 | | | | 0.22 | | | | 0.02 | | | | 0.28 | | |
Net realized and unrealized gain (loss) | | | 0.01 | (b) | | | 0.09 | | | | (0.31 | ) | | | 0.23 | | | | 0.06 | | | | 0.28 | | |
Total from investment operations | | | 0.16 | | | | 0.26 | | | | (0.12 | ) | | | 0.45 | | | | 0.08 | | | | 0.56 | | |
Less distributions to shareholders: | |
Net investment income | | | (0.10 | ) | | | (0.16 | ) | | | (0.16 | ) | | | (0.20 | ) | | | (0.02 | ) | | | (0.31 | ) | |
Net realized gains | | | (0.11 | ) | | | — | | | | (0.06 | ) | | | (0.15 | ) | | | — | | | | — | | |
Total distributions to shareholders | | | (0.21 | ) | | | (0.16 | ) | | | (0.22 | ) | | | (0.35 | ) | | | (0.02 | ) | | | (0.31 | ) | |
Proceeds from regulatory settlements | | | — | | | | — | | | | — | | | | — | | | | — | | | | 0.00 | (c) | |
Net asset value, end of period | | $ | 9.20 | | | $ | 9.25 | | | $ | 9.15 | | | $ | 9.49 | | | $ | 9.39 | | | $ | 9.33 | | |
Total return | | | 1.81 | % | | | 2.89 | % | | | (1.21 | %) | | | 4.90 | % | | | 0.86 | % | | | 6.20 | % | |
Ratios to average net assets(d) | |
Total gross expenses | | | 1.66 | % | | | 1.67 | % | | | 1.66 | % | | | 1.69 | % | | | 1.71 | %(e) | | | 1.70 | %(f) | |
Total net expenses(g) | | | 1.61 | %(h) | | | 1.50 | %(h) | | | 1.45 | %(h) | | | 1.46 | %(h) | | | 1.44 | %(e) | | | 1.44 | %(f)(h) | |
Net investment income | | | 1.65 | % | | | 1.80 | % | | | 2.07 | % | | | 2.37 | % | | | 2.75 | %(e) | | | 3.04 | % | |
Supplemental data | |
Net assets, end of period (in thousands) | | $ | 55,975 | | | $ | 60,605 | | | $ | 64,739 | | | $ | 95,745 | | | $ | 35,579 | | | $ | 35,304 | | |
Portfolio turnover | | | 458 | % | | | 316 | % | | | 274 | % | | | 239 | % | | | 10 | % | | | 170 | % | |
Notes to Financial Highlights
(a) For the period from April 1, 2012 to April 30, 2012. During the period, the Fund's fiscal year end was changed from March 31 to April 30.
(b) Calculation of the net gain (loss) per share (both realized and unrealized) does not correlate to the aggregate realized and unrealized gain (loss) presented in the Statement of Operations due to the timing of subscriptions and redemptions of Fund shares in relation to fluctuations in the market value of the portfolio.
(c) Rounds to zero.
(d) In addition to the fees and expenses that the Fund bears directly, the Fund indirectly bears a pro rata share of the fees and expenses of any other funds in which it invests. Such indirect expenses are not included in the Fund's reported expense ratios.
(e) Annualized.
(f) Ratios include line of credit interest expense which is less than 0.01%.
(g) Total net expenses include the impact of certain fee waivers/expense reimbursements made by the Investment Manager and certain of its affiliates, if applicable.
(h) The benefits derived from expense reductions had an impact of less than 0.01%.
The accompanying Notes to Financial Statements are an integral part of this statement.
Annual Report 2016
52
COLUMBIA TOTAL RETURN BOND FUND
FINANCIAL HIGHLIGHTS (continued)
| | | Year Ended April 30, | | Year Ended
March 31, | |
Class I | | 2016 | | 2015 | | 2014 | | 2013 | | 2012(a) | | 2012 | |
Per share data | |
Net asset value, beginning of period | | $ | 9.26 | | | $ | 9.16 | | | $ | 9.50 | | | $ | 9.39 | | | $ | 9.33 | | | $ | 9.08 | | |
Income from investment operations: | |
Net investment income | | | 0.25 | | | | 0.26 | | | | 0.28 | | | | 0.31 | | | | 0.03 | | | | 0.37 | | |
Net realized and unrealized gain (loss) | | | 0.01 | (b) | | | 0.10 | | | | (0.31 | ) | | | 0.24 | | | | 0.06 | | | | 0.27 | | |
Total from investment operations | | | 0.26 | | | | 0.36 | | | | (0.03 | ) | | | 0.55 | | | | 0.09 | | | | 0.64 | | |
Less distributions to shareholders: | |
Net investment income | | | (0.20 | ) | | | (0.26 | ) | | | (0.25 | ) | | | (0.29 | ) | | | (0.03 | ) | | | (0.39 | ) | |
Net realized gains | | | (0.11 | ) | | | — | | | | (0.06 | ) | | | (0.15 | ) | | | — | | | | — | | |
Total distributions to shareholders | | | (0.31 | ) | | | (0.26 | ) | | | (0.31 | ) | | | (0.44 | ) | | | (0.03 | ) | | | (0.39 | ) | |
Proceeds from regulatory settlements | | | — | | | | — | | | | — | | | | — | | | | — | | | | 0.00 | (c) | |
Net asset value, end of period | | $ | 9.21 | | | $ | 9.26 | | | $ | 9.16 | | | $ | 9.50 | | | $ | 9.39 | | | $ | 9.33 | | |
Total return | | | 2.96 | % | | | 3.94 | % | | | (0.27 | %) | | | 6.00 | % | | | 0.94 | % | | | 7.17 | % | |
Ratios to average net assets(d) | |
Total gross expenses | | | 0.50 | % | | | 0.50 | % | | | 0.50 | % | | | 0.50 | % | | | 0.52 | %(e) | | | 0.51 | %(f) | |
Total net expenses(g) | | | 0.49 | % | | | 0.49 | % | | | 0.50 | % | | | 0.50 | % | | | 0.52 | %(e) | | | 0.51 | %(f)(h) | |
Net investment income | | | 2.76 | % | | | 2.80 | % | | | 3.05 | % | | | 3.31 | % | | | 3.68 | %(e) | | | 4.01 | % | |
Supplemental data | |
Net assets, end of period (in thousands) | | $ | 421,702 | | | $ | 486,713 | | | $ | 576,729 | | | $ | 459,989 | | | $ | 90,345 | | | $ | 86,768 | | |
Portfolio turnover | | | 458 | % | | | 316 | % | | | 274 | % | | | 239 | % | | | 10 | % | | | 170 | % | |
Notes to Financial Highlights
(a) For the period from April 1, 2012 to April 30, 2012. During the period, the Fund's fiscal year end was changed from March 31 to April 30.
(b) Calculation of the net gain (loss) per share (both realized and unrealized) does not correlate to the aggregate realized and unrealized gain (loss) presented in the Statement of Operations due to the timing of subscriptions and redemptions of Fund shares in relation to fluctuations in the market value of the portfolio.
(c) Rounds to zero.
(d) In addition to the fees and expenses that the Fund bears directly, the Fund indirectly bears a pro rata share of the fees and expenses of any other funds in which it invests. Such indirect expenses are not included in the Fund's reported expense ratios.
(e) Annualized.
(f) Ratios include line of credit interest expense which is less than 0.01%.
(g) Total net expenses include the impact of certain fee waivers/expense reimbursements made by the Investment Manager and certain of its affiliates, if applicable.
(h) The benefits derived from expense reductions had an impact of less than 0.01%.
The accompanying Notes to Financial Statements are an integral part of this statement.
Annual Report 2016
53
COLUMBIA TOTAL RETURN BOND FUND
FINANCIAL HIGHLIGHTS (continued)
| | | Year Ended April 30, | |
Class K | | 2016 | | 2015 | | 2014 | | 2013(a) | |
Per share data | |
Net asset value, beginning of period | | $ | 9.25 | | | $ | 9.15 | | | $ | 9.49 | | | $ | 9.42 | | |
Income from investment operations: | |
Net investment income | | | 0.22 | | | | 0.23 | | | | 0.25 | | | | 0.05 | | |
Net realized and unrealized gain (loss) | | | 0.01 | (b) | | | 0.10 | | | | (0.31 | ) | | | 0.06 | | |
Total from investment operations | | | 0.23 | | | | 0.33 | | | | (0.06 | ) | | | 0.11 | | |
Less distributions to shareholders: | |
Net investment income | | | (0.18 | ) | | | (0.23 | ) | | | (0.22 | ) | | | (0.04 | ) | |
Net realized gains | | | (0.11 | ) | | | — | | | | (0.06 | ) | | | — | | |
Total distributions to shareholders | | | (0.29 | ) | | | (0.23 | ) | | | (0.28 | ) | | | (0.04 | ) | |
Net asset value, end of period | | $ | 9.19 | | | $ | 9.25 | | | $ | 9.15 | | | $ | 9.49 | | |
Total return | | | 2.54 | % | | | 3.63 | % | | | (0.53 | %) | | | 1.19 | % | |
Ratios to average net assets(c) | |
Total gross expenses | | | 0.80 | % | | | 0.80 | % | | | 0.74 | % | | | 0.79 | %(d) | |
Total net expenses(e) | | | 0.79 | % | | | 0.79 | % | | | 0.74 | % | | | 0.79 | %(d) | |
Net investment income | | | 2.49 | % | | | 2.52 | % | | | 2.67 | % | | | 2.97 | %(d) | |
Supplemental data | |
Net assets, end of period (in thousands) | | $ | 11,833 | | | $ | 10,984 | | | $ | 14,168 | | | $ | 75,741 | | |
Portfolio turnover | | | 458 | % | | | 316 | % | | | 274 | % | | | 239 | % | |
Notes to Financial Highlights
(a) Based on operations from February 28, 2013 (commencement of operations) through the stated period end.
(b) Calculation of the net gain (loss) per share (both realized and unrealized) does not correlate to the aggregate realized and unrealized gain (loss) presented in the Statement of Operations due to the timing of subscriptions and redemptions of Fund shares in relation to fluctuations in the market value of the portfolio.
(c) In addition to the fees and expenses that the Fund bears directly, the Fund indirectly bears a pro rata share of the fees and expenses of any other funds in which it invests. Such indirect expenses are not included in the Fund's reported expense ratios.
(d) Annualized.
(e) Total net expenses include the impact of certain fee waivers/expense reimbursements made by the Investment Manager and certain of its affiliates, if applicable.
The accompanying Notes to Financial Statements are an integral part of this statement.
Annual Report 2016
54
COLUMBIA TOTAL RETURN BOND FUND
FINANCIAL HIGHLIGHTS (continued)
| | | Year Ended April 30, | | Year Ended
March 31, | |
Class R | | 2016 | | 2015 | | 2014 | | 2013 | | 2012(a) | | 2012 | |
Per share data | |
Net asset value, beginning of period | | $ | 9.26 | | | $ | 9.15 | | | $ | 9.49 | | | $ | 9.39 | | | $ | 9.33 | | | $ | 9.08 | | |
Income from investment operations: | |
Net investment income | | | 0.19 | | | | 0.20 | | | | 0.22 | | | | 0.26 | | | | 0.02 | | | | 0.31 | | |
Net realized and unrealized gain (loss) | | | 0.01 | (b) | | | 0.11 | | | | (0.31 | ) | | | 0.23 | | | | 0.06 | | | | 0.28 | | |
Total from investment operations | | | 0.20 | | | | 0.31 | | | | (0.09 | ) | | | 0.49 | | | | 0.08 | | | | 0.59 | | |
Less distributions to shareholders: | |
Net investment income | | | (0.15 | ) | | | (0.20 | ) | | | (0.19 | ) | | | (0.24 | ) | | | (0.02 | ) | | | (0.34 | ) | |
Net realized gains | | | (0.11 | ) | | | — | | | | (0.06 | ) | | | (0.15 | ) | | | — | | | | — | | |
Total distributions to shareholders | | | (0.26 | ) | | | (0.20 | ) | | | (0.25 | ) | | | (0.39 | ) | | | (0.02 | ) | | | (0.34 | ) | |
Proceeds from regulatory settlements | | | — | | | | — | | | | — | | | | — | | | | — | | | | 0.00 | (c) | |
Net asset value, end of period | | $ | 9.20 | | | $ | 9.26 | | | $ | 9.15 | | | $ | 9.49 | | | $ | 9.39 | | | $ | 9.33 | | |
Total return | | | 2.21 | % | | | 3.41 | % | | | (0.87 | %) | | | 5.26 | % | | | 0.89 | % | | | 6.55 | % | |
Ratios to average net assets(d) | |
Total gross expenses | | | 1.16 | % | | | 1.17 | % | | | 1.16 | % | | | 1.20 | % | | | 1.21 | %(e) | | | 1.20 | %(f) | |
Total net expenses(g) | | | 1.11 | %(h) | | | 1.10 | %(h) | | | 1.10 | %(h) | | | 1.12 | %(h) | | | 1.09 | %(e) | | | 1.09 | %(f)(h) | |
Net investment income | | | 2.13 | % | | | 2.19 | % | | | 2.43 | % | | | 2.73 | % | | | 3.08 | %(e) | | | 3.39 | % | |
Supplemental data | |
Net assets, end of period (in thousands) | | $ | 2,407 | | | $ | 2,769 | | | $ | 2,750 | | | $ | 3,052 | | | $ | 2,631 | | | $ | 2,786 | | |
Portfolio turnover | | | 458 | % | | | 316 | % | | | 274 | % | | | 239 | % | | | 10 | % | | | 170 | % | |
Notes to Financial Highlights
(a) For the period from April 1, 2012 to April 30, 2012. During the period, the Fund's fiscal year end was changed from March 31 to April 30.
(b) Calculation of the net gain (loss) per share (both realized and unrealized) does not correlate to the aggregate realized and unrealized gain (loss) presented in the Statement of Operations due to the timing of subscriptions and redemptions of Fund shares in relation to fluctuations in the market value of the portfolio.
(c) Rounds to zero.
(d) In addition to the fees and expenses that the Fund bears directly, the Fund indirectly bears a pro rata share of the fees and expenses of any other funds in which it invests. Such indirect expenses are not included in the Fund's reported expense ratios.
(e) Annualized.
(f) Ratios include line of credit interest expense which is less than 0.01%.
(g) Total net expenses include the impact of certain fee waivers/expense reimbursements made by the Investment Manager and certain of its affiliates, if applicable.
(h) The benefits derived from expense reductions had an impact of less than 0.01%.
The accompanying Notes to Financial Statements are an integral part of this statement.
Annual Report 2016
55
COLUMBIA TOTAL RETURN BOND FUND
FINANCIAL HIGHLIGHTS (continued)
| | | Year Ended April 30, | |
Class R4 | | 2016 | | 2015 | | 2014 | | 2013(a) | |
Per share data | |
Net asset value, beginning of period | | $ | 9.24 | | | $ | 9.14 | | | $ | 9.48 | | | $ | 9.66 | | |
Income from investment operations: | |
Net investment income | | | 0.24 | | | | 0.25 | | | | 0.27 | | | | 0.14 | | |
Net realized and unrealized gain (loss) | | | 0.00 | (b)(c) | | | 0.10 | | | | (0.31 | ) | | | (0.05 | )(b) | |
Total from investment operations | | | 0.24 | | | | 0.35 | | | | (0.04 | ) | | | 0.09 | | |
Less distributions to shareholders: | |
Net investment income | | | (0.19 | ) | | | (0.25 | ) | | | (0.24 | ) | | | (0.12 | ) | |
Net realized gains | | | (0.11 | ) | | | — | | | | (0.06 | ) | | | (0.15 | ) | |
Total distributions to shareholders | | | (0.30 | ) | | | (0.25 | ) | | | (0.30 | ) | | | (0.27 | ) | |
Net asset value, end of period | | $ | 9.18 | | | $ | 9.24 | | | $ | 9.14 | | | $ | 9.48 | | |
Total return | | | 2.72 | % | | | 3.82 | % | | | (0.38 | %) | | | 0.99 | % | |
Ratios to average net assets(d) | |
Total gross expenses | | | 0.66 | % | | | 0.67 | % | | | 0.67 | % | | | 0.67 | %(e) | |
Total net expenses(f) | | | 0.61 | %(g) | | | 0.60 | %(g) | | | 0.60 | %(g) | | | 0.60 | %(e) | |
Net investment income | | | 2.65 | % | | | 2.70 | % | | | 3.02 | % | | | 3.26 | %(e) | |
Supplemental data | |
Net assets, end of period (in thousands) | | $ | 8,265 | | | $ | 7,656 | | | $ | 7,477 | | | $ | 57 | | |
Portfolio turnover | | | 458 | % | | | 316 | % | | | 274 | % | | | 239 | % | |
Notes to Financial Highlights
(a) Based on operations from November 8, 2012 (commencement of operations) through the stated period end.
(b) Calculation of the net gain (loss) per share (both realized and unrealized) does not correlate to the aggregate realized and unrealized gain (loss) presented in the Statement of Operations due to the timing of subscriptions and redemptions of Fund shares in relation to fluctuations in the market value of the portfolio.
(c) Rounds to zero.
(d) In addition to the fees and expenses that the Fund bears directly, the Fund indirectly bears a pro rata share of the fees and expenses of any other funds in which it invests. Such indirect expenses are not included in the Fund's reported expense ratios.
(e) Annualized.
(f) Total net expenses include the impact of certain fee waivers/expense reimbursements made by the Investment Manager and certain of its affiliates, if applicable.
(g) The benefits derived from expense reductions had an impact of less than 0.01%.
The accompanying Notes to Financial Statements are an integral part of this statement.
Annual Report 2016
56
COLUMBIA TOTAL RETURN BOND FUND
FINANCIAL HIGHLIGHTS (continued)
| | | Year Ended April 30, | |
Class R5 | | 2016 | | 2015 | | 2014 | | 2013(a) | |
Per share data | |
Net asset value, beginning of period | | $ | 9.24 | | | $ | 9.14 | | | $ | 9.48 | | | $ | 9.66 | | |
Income from investment operations: | |
Net investment income | | | 0.25 | | | | 0.25 | | | | 0.28 | | | | 0.15 | | |
Net realized and unrealized gain (loss) | | | 0.00 | (b)(c) | | | 0.10 | | | | (0.31 | ) | | | (0.05 | )(c) | |
Total from investment operations | | | 0.25 | | | | 0.35 | | | | (0.03 | ) | | | 0.10 | | |
Less distributions to shareholders: | |
Net investment income | | | (0.20 | ) | | | (0.25 | ) | | | (0.25 | ) | | | (0.13 | ) | |
Net realized gains | | | (0.11 | ) | | | — | | | | (0.06 | ) | | | (0.15 | ) | |
Total distributions to shareholders | | | (0.31 | ) | | | (0.25 | ) | | | (0.31 | ) | | | (0.28 | ) | |
Net asset value, end of period | | $ | 9.18 | | | $ | 9.24 | | | $ | 9.14 | | | $ | 9.48 | | |
Total return | | | 2.80 | % | | | 3.89 | % | | | (0.28 | %) | | | 1.03 | % | |
Ratios to average net assets(d) | |
Total gross expenses | | | 0.55 | % | | | 0.55 | % | | | 0.51 | % | | | 0.54 | %(e) | |
Total net expenses(f) | | | 0.54 | % | | | 0.54 | % | | | 0.50 | % | | | 0.54 | %(e) | |
Net investment income | | | 2.73 | % | | | 2.74 | % | | | 3.15 | % | | | 3.30 | %(e) | |
Supplemental data | |
Net assets, end of period (in thousands) | | $ | 22,621 | | | $ | 21,580 | | | $ | 15,980 | | | $ | 318 | | |
Portfolio turnover | | | 458 | % | | | 316 | % | | | 274 | % | | | 239 | % | |
Notes to Financial Highlights
(a) Based on operations from November 8, 2012 (commencement of operations) through the stated period end.
(b) Rounds to zero.
(c) Calculation of the net gain (loss) per share (both realized and unrealized) does not correlate to the aggregate realized and unrealized gain (loss) presented in the Statement of Operations due to the timing of subscriptions and redemptions of Fund shares in relation to fluctuations in the market value of the portfolio.
(d) In addition to the fees and expenses that the Fund bears directly, the Fund indirectly bears a pro rata share of the fees and expenses of any other funds in which it invests. Such indirect expenses are not included in the Fund's reported expense ratios.
(e) Annualized.
(f) Total net expenses include the impact of certain fee waivers/expense reimbursements made by the Investment Manager and certain of its affiliates, if applicable.
The accompanying Notes to Financial Statements are an integral part of this statement.
Annual Report 2016
57
COLUMBIA TOTAL RETURN BOND FUND
FINANCIAL HIGHLIGHTS (continued)
| | | Year Ended April 30, | | Year Ended
March 31, | |
Class W | | 2016 | | 2015 | | 2014 | | 2013 | | 2012(a) | | 2012 | |
Per share data | |
Net asset value, beginning of period | | $ | 9.26 | | | $ | 9.16 | | | $ | 9.50 | | | $ | 9.39 | | | $ | 9.33 | | | $ | 9.08 | | |
Income from investment operations: | |
Net investment income | | | 0.22 | | | | 0.23 | | | | 0.24 | | | | 0.27 | | | | 0.03 | | | | 0.34 | | |
Net realized and unrealized gain (loss) | | | 0.01 | (b) | | | 0.09 | | | | (0.30 | ) | | | 0.25 | | | | 0.05 | | | | 0.27 | | |
Total from investment operations | | | 0.23 | | | | 0.32 | | | | (0.06 | ) | | | 0.52 | | | | 0.08 | | | | 0.61 | | |
Less distributions to shareholders: | |
Net investment income | | | (0.17 | ) | | | (0.22 | ) | | | (0.22 | ) | | | (0.26 | ) | | | (0.02 | ) | | | (0.36 | ) | |
Net realized gains | | | (0.11 | ) | | | — | | | | (0.06 | ) | | | (0.15 | ) | | | — | | | | — | | |
Total distributions to shareholders | | | (0.28 | ) | | | (0.22 | ) | | | (0.28 | ) | | | (0.41 | ) | | | (0.02 | ) | | | (0.36 | ) | |
Proceeds from regulatory settlements | | | — | | | | — | | | | — | | | | — | | | | — | | | | 0.00 | (c) | |
Net asset value, end of period | | $ | 9.21 | | | $ | 9.26 | | | $ | 9.16 | | | $ | 9.50 | | | $ | 9.39 | | | $ | 9.33 | | |
Total return | | | 2.58 | % | | | 3.56 | % | | | (0.62 | %) | | | 5.59 | % | | | 0.91 | % | | | 6.84 | % | |
Ratios to average net assets(d) | |
Total gross expenses | | | 0.91 | % | | | 0.92 | % | | | 0.91 | % | | | 0.92 | % | | | 0.94 | %(e) | | | 0.94 | %(f) | |
Total net expenses(g) | | | 0.86 | %(h) | | | 0.85 | %(h) | | | 0.85 | %(h) | | | 0.85 | %(h) | | | 0.82 | %(e) | | | 0.83 | %(f)(h) | |
Net investment income | | | 2.41 | % | | | 2.45 | % | | | 2.68 | % | | | 2.91 | % | | | 3.38 | %(e) | | | 3.64 | % | |
Supplemental data | |
Net assets, end of period (in thousands) | | $ | 562,638 | | | $ | 453,340 | | | $ | 507,419 | | | $ | 752,819 | | | $ | 3 | | | $ | 3 | | |
Portfolio turnover | | | 458 | % | | | 316 | % | | | 274 | % | | | 239 | % | | | 10 | % | | | 170 | % | |
Notes to Financial Highlights
(a) For the period from April 1, 2012 to April 30, 2012. During the period, the Fund's fiscal year end was changed from March 31 to April 30.
(b) Calculation of the net gain (loss) per share (both realized and unrealized) does not correlate to the aggregate realized and unrealized gain (loss) presented in the Statement of Operations due to the timing of subscriptions and redemptions of Fund shares in relation to fluctuations in the market value of the portfolio.
(c) Rounds to zero.
(d) In addition to the fees and expenses that the Fund bears directly, the Fund indirectly bears a pro rata share of the fees and expenses of any other funds in which it invests. Such indirect expenses are not included in the Fund's reported expense ratios.
(e) Annualized.
(f) Ratios include line of credit interest expense which is less than 0.01%.
(g) Total net expenses include the impact of certain fee waivers/expense reimbursements made by the Investment Manager and certain of its affiliates, if applicable.
(h) The benefits derived from expense reductions had an impact of less than 0.01%.
The accompanying Notes to Financial Statements are an integral part of this statement.
Annual Report 2016
58
COLUMBIA TOTAL RETURN BOND FUND
FINANCIAL HIGHLIGHTS (continued)
| | | Year Ended April 30, | |
Class Y | | 2016 | | 2015 | | 2014 | | 2013(a) | |
Per share data | |
Net asset value, beginning of period | | $ | 9.26 | | | $ | 9.16 | | | $ | 9.49 | | | $ | 9.67 | | |
Income from investment operations: | |
Net investment income | | | 0.25 | | | | 0.26 | | | | 0.29 | | | | 0.14 | | |
Net realized and unrealized gain (loss) | | | 0.00 | (b)(c) | | | 0.10 | | | | (0.31 | ) | | | (0.04 | )(c) | |
Total from investment operations | | | 0.25 | | | | 0.36 | | | | (0.02 | ) | | | 0.10 | | |
Less distributions to shareholders: | |
Net investment income | | | (0.20 | ) | | | (0.26 | ) | | | (0.25 | ) | | | (0.13 | ) | |
Net realized gains | | | (0.11 | ) | | | — | | | | (0.06 | ) | | | (0.15 | ) | |
Total distributions to shareholders | | | (0.31 | ) | | | (0.26 | ) | | | (0.31 | ) | | | (0.28 | ) | |
Net asset value, end of period | | $ | 9.20 | | | $ | 9.26 | | | $ | 9.16 | | | $ | 9.49 | | |
Total return | | | 2.85 | % | | | 3.94 | % | | | (0.17 | %) | | | 1.05 | % | |
Ratios to average net assets(d) | |
Total gross expenses | | | 0.50 | % | | | 0.50 | % | | | 0.51 | % | | | 0.45 | %(e) | |
Total net expenses(f) | | | 0.49 | % | | | 0.49 | % | | | 0.50 | % | | | 0.45 | %(e) | |
Net investment income | | | 2.77 | % | | | 2.80 | % | | | 3.21 | % | | | 3.18 | %(e) | |
Supplemental data | |
Net assets, end of period (in thousands) | | $ | 18,086 | | | $ | 18,249 | | | $ | 15,642 | | | $ | 2 | | |
Portfolio turnover | | | 458 | % | | | 316 | % | | | 274 | % | | | 239 | % | |
Notes to Financial Highlights
(a) Based on operations from November 8, 2012 (commencement of operations) through the stated period end.
(b) Rounds to zero.
(c) Calculation of the net gain (loss) per share (both realized and unrealized) does not correlate to the aggregate realized and unrealized gain (loss) presented in the Statement of Operations due to the timing of subscriptions and redemptions of Fund shares in relation to fluctuations in the market value of the portfolio.
(d) In addition to the fees and expenses that the Fund bears directly, the Fund indirectly bears a pro rata share of the fees and expenses of any other funds in which it invests. Such indirect expenses are not included in the Fund's reported expense ratios.
(e) Annualized.
(f) Total net expenses include the impact of certain fee waivers/expense reimbursements made by the Investment Manager and certain of its affiliates, if applicable.
The accompanying Notes to Financial Statements are an integral part of this statement.
Annual Report 2016
59
COLUMBIA TOTAL RETURN BOND FUND
FINANCIAL HIGHLIGHTS (continued)
| | | Year Ended April 30, | | Year Ended
March 31, | |
Class Z | | 2016 | | 2015 | | 2014 | | 2013 | | 2012(a) | | 2012 | |
Per share data | |
Net asset value, beginning of period | | $ | 9.26 | | | $ | 9.15 | | | $ | 9.49 | | | $ | 9.39 | | | $ | 9.33 | | | $ | 9.08 | | |
Income from investment operations: | |
Net investment income | | | 0.24 | | | | 0.25 | | | | 0.27 | | | | 0.31 | | | | 0.03 | | | | 0.36 | | |
Net realized and unrealized gain (loss) | | | 0.00 | (b)(c) | | | 0.11 | | | | (0.31 | ) | | | 0.23 | | | | 0.06 | | | | 0.27 | | |
Total from investment operations | | | 0.24 | | | | 0.36 | | | | (0.04 | ) | | | 0.54 | | | | 0.09 | | | | 0.63 | | |
Less distributions to shareholders: | |
Net investment income | | | (0.19 | ) | | | (0.25 | ) | | | (0.24 | ) | | | (0.29 | ) | | | (0.03 | ) | | | (0.38 | ) | |
Net realized gains | | | (0.11 | ) | | | — | | | | (0.06 | ) | | | (0.15 | ) | | | — | | | | — | | |
Total distributions to shareholders | | | (0.30 | ) | | | (0.25 | ) | | | (0.30 | ) | | | (0.44 | ) | | | (0.03 | ) | | | (0.38 | ) | |
Proceeds from regulatory settlements | | | — | | | | — | | | | — | | | | — | | | | — | | | | 0.00 | (b) | |
Net asset value, end of period | | $ | 9.20 | | | $ | 9.26 | | | $ | 9.15 | | | $ | 9.49 | | | $ | 9.39 | | | $ | 9.33 | | |
Total return | | | 2.72 | % | | | 3.93 | % | | | (0.37 | %) | | | 5.79 | % | | | 0.93 | % | | | 7.08 | % | |
Ratios to average net assets(d) | |
Total gross expenses | | | 0.66 | % | | | 0.67 | % | | | 0.66 | % | | | 0.70 | % | | | 0.71 | %(e) | | | 0.70 | %(f) | |
Total net expenses(g) | | | 0.61 | %(h) | | | 0.60 | %(h) | | | 0.60 | %(h) | | | 0.62 | %(h) | | | 0.59 | %(e) | | | 0.59 | %(f)(h) | |
Net investment income | | | 2.64 | % | | | 2.69 | % | | | 2.92 | % | | | 3.23 | % | | | 3.60 | %(e) | | | 3.89 | % | |
Supplemental data | |
Net assets, end of period (in thousands) | | $ | 1,078,815 | | | $ | 1,175,483 | | | $ | 1,289,621 | | | $ | 1,915,534 | | | $ | 2,881,803 | | | $ | 2,853,669 | | |
Portfolio turnover | | | 458 | % | | | 316 | % | | | 274 | % | | | 239 | % | | | 10 | % | | | 170 | % | |
Notes to Financial Highlights
(a) For the period from April 1, 2012 to April 30, 2012. During the period, the Fund's fiscal year end was changed from March 31 to April 30.
(b) Rounds to zero.
(c) Calculation of the net gain (loss) per share (both realized and unrealized) does not correlate to the aggregate realized and unrealized gain (loss) presented in the Statement of Operations due to the timing of subscriptions and redemptions of Fund shares in relation to fluctuations in the market value of the portfolio.
(d) In addition to the fees and expenses that the Fund bears directly, the Fund indirectly bears a pro rata share of the fees and expenses of any other funds in which it invests. Such indirect expenses are not included in the Fund's reported expense ratios.
(e) Annualized.
(f) Ratios include line of credit interest expense which is less than 0.01%.
(g) Total net expenses include the impact of certain fee waivers/expense reimbursements made by the Investment Manager and certain of its affiliates, if applicable.
(h) The benefits derived from expense reductions had an impact of less than 0.01%.
The accompanying Notes to Financial Statements are an integral part of this statement.
Annual Report 2016
60
COLUMBIA TOTAL RETURN BOND FUND
NOTES TO FINANCIAL STATEMENTS
April 30, 2016
Note 1. Organization
Columbia Total Return Bond Fund (formerly known as Columbia Intermediate Bond Fund) (the Fund), a series of Columbia Funds Series Trust I (the Trust), is a diversified fund. The Trust is registered under the Investment Company Act of 1940, as amended (the 1940 Act), as an open-end management investment company organized as a Massachusetts business trust. Effective February 19, 2016, Columbia Intermediate Bond Fund was renamed Columbia Total Return Bond Fund.
Fund Shares
The Trust may issue an unlimited number of shares (without par value). The Fund offers Class A, Class B, Class C, Class I, Class K, Class R, Class R4, Class R5, Class W, Class Y and Class Z shares. Although all share classes generally have identical voting, dividend and liquidation rights, each share class votes separately when required by the Trust's organizational documents or by law. Different share classes pay different distribution amounts to the extent the expenses of such share classes differ, and distributions in liquidation will be proportional to the net asset value of each share class. Each share class has its own expense and sales charge structure.
Class A shares are subject to a maximum front-end sales charge of 3.00% based on the initial investment amount. Class A shares purchased without an initial sales charge in accounts aggregating $1 million to $50 million at the time of purchase are subject to a contingent deferred sales charge (CDSC) if the shares are sold within 18 months after purchase, charged as follows: 1.00% CDSC if redeemed within 12 months after purchase, and 0.50% CDSC if redeemed more than 12, but less than 18, months after purchase.
Class B shares may be subject to a maximum CDSC of 3.00% based upon the holding period after purchase. Class B shares will generally convert to Class A shares eight years after purchase. The Fund no longer accepts investments by new or existing investors in the Fund's Class B shares, except in connection with the reinvestment of any dividend and/or capital gain distributions in Class B shares of the Fund and exchanges by existing Class B shareholders of certain other funds within the Columbia Family of Funds.
Class C shares are subject to a 1.00% CDSC on shares redeemed within 12 months after purchase.
Class I shares are not subject to sales charges and are available only to the Columbia Family of Funds.
Class K shares are not subject to sales charges, however this share class is closed to new investors.
Class R shares are not subject to sales charges and are generally available only to certain retirement plans and other investors as described in the Fund's prospectus.
Class R4 shares are not subject to sales charges and are generally available only to omnibus retirement plans and certain investors as described in the Fund's prospectus.
Class R5 shares are not subject to sales charges and are generally available only to investors purchasing through authorized investment professionals and omnibus retirement plans.
Class W shares are not subject to sales charges and are available only to investors purchasing through authorized investment programs managed by investment professionals, including discretionary managed account programs.
Class Y shares are not subject to sales charges and are generally available only to certain retirement plans as described in the Fund's prospectus.
Class Z shares are not subject to sales charges and are available only to eligible investors, which are subject to different investment minimums as described in the Fund's prospectus.
Note 2. Summary of Significant Accounting Policies
Basis of Preparation
The Fund is an investment company that applies the accounting and reporting guidance in the Financial Accounting Standards Board (FASB) Accounting Standards Codification Topic 946, Financial Services — Investment Companies (ASC 946). The financial statements are prepared in accordance with U.S. generally accepted accounting principles (GAAP), which requires management to make certain estimates and assumptions that affect the reported amounts of assets and liabilities, the disclosure of contingent assets and liabilities at the date of the financial statements and the reported amounts of income and expenses during the reporting period. Actual results could differ from those estimates.
Annual Report 2016
61
COLUMBIA TOTAL RETURN BOND FUND
NOTES TO FINANCIAL STATEMENTS (continued)
April 30, 2016
The following is a summary of significant accounting policies followed by the Fund in the preparation of its financial statements.
Security Valuation
Debt securities generally are valued by pricing services approved by the Board of Trustees (the Board) based upon market transactions for normal, institutional-size trading units of similar securities. The services may use various pricing techniques that take into account, as applicable, factors such as yield, quality, coupon rate, maturity, type of issue, trading characteristics and other data, as well as broker quotes. Debt securities for which quotations are not readily available or not believed to be reflective of market value may also be valued based upon a bid quote from an approved independent broker-dealer. Debt securities maturing in 60 days or less are valued primarily at amortized cost value, unless this method results in a valuation that management believes does not approximate market value.
Asset- and mortgage-backed securities are generally valued by pricing services, which utilize pricing models that incorporate the securities' cash flow and loan performance data. These models also take into account available market data, including trades, market quotations, and benchmark yield curves for identical or similar securities. Factors used to identify similar securities may include, but are not limited to, issuer, collateral type, vintage, prepayment speeds, collateral performance, credit ratings, credit enhancement and expected life. Asset-backed securities for which quotations are readily available may also be valued based upon an over-the-counter or exchange bid quote from an approved independent broker-dealer.
Senior loan securities for which reliable market quotations are readily available are generally valued by pricing services at the average of the bids received.
All equity securities are valued at the close of business of the New York Stock Exchange (NYSE). Equity securities are valued at the last quoted sales price on the principal exchange or market on which they trade, except for securities traded on the NASDAQ Stock Market, which are valued at the NASDAQ official close price. Unlisted securities or listed securities for which there were no sales during the day are valued at the mean of the latest quoted bid and ask prices on such exchanges or markets.
Investments in open-end investment companies, including money market funds, are valued at their latest net asset value.
Forward foreign currency exchange contracts are marked-to-market based upon foreign currency exchange rates provided by a pricing service.
Futures and options on futures contracts are valued based upon the settlement price at the close of regular trading on their principal exchanges or, in the absence of transactions, at the mean of the latest quoted bid and ask prices.
Option contracts are valued at the mean of the latest quoted bid and ask prices on their primary exchanges. Option contracts, including over-the-counter option contracts, with no readily available market quotations are valued using quotes obtained from independent brokers as of the close of the NYSE.
Swap transactions are valued through an independent pricing service or broker, or if neither is available, through an internal model based upon observable inputs.
Investments for which market quotations are not readily available, or that have quotations which management believes are not reflective of market value or reliable, are valued at fair value as determined in good faith under procedures approved by and under the general supervision of the Board. If a security or class of securities (such as foreign securities) is valued at fair value, such value is likely to be different from the quoted or published price for the security.
The determination of fair value often requires significant judgment. To determine fair value, management may use assumptions including but not limited to future cash flows and estimated risk premiums. Multiple inputs from various sources may be used to determine fair value.
GAAP requires disclosure regarding the inputs and valuation techniques used to measure fair value and any changes in valuation inputs or techniques. In addition, investments shall be disclosed by major category. This information is disclosed following the Fund's Portfolio of Investments.
Foreign Currency Transactions and Translations
The values of all assets and liabilities denominated in foreign currencies are generally translated into U.S. dollars at exchange rates determined at the close of the NYSE on any given day. Net realized and unrealized gains (losses) on foreign currency transactions and translations include gains (losses) arising from the fluctuation in exchange rates between trade and settlement dates on securities transactions, gains (losses) arising from the disposition of foreign currency and currency gains (losses) between the accrual and
Annual Report 2016
62
COLUMBIA TOTAL RETURN BOND FUND
NOTES TO FINANCIAL STATEMENTS (continued)
April 30, 2016
payment dates on dividends, interest income and foreign withholding taxes.
For financial statement purposes, the Fund does not distinguish that portion of gains (losses) on investments which is due to changes in foreign exchange rates from that which is due to changes in market prices of the investments. Such fluctuations are included with the net realized and unrealized gains (losses) on investments in the Statement of Operations.
Derivative Instruments
The Fund invests in certain derivative instruments, as detailed below, to meet its investment objectives. Derivatives are instruments whose values depend on, or are derived from, in whole or in part, the value of one or more securities, currencies, commodities, indices, or other assets or instruments. Derivatives may be used to increase investment flexibility (including to maintain cash reserves while maintaining desired exposure to certain assets), for risk management (hedging) purposes, to facilitate trading, to reduce transaction costs and to pursue higher investment returns. The Fund may also use derivative instruments to mitigate certain investment risks, such as foreign currency exchange rate risk, interest rate risk and credit risk. Derivatives may involve various risks, including the potential inability of the counterparty to fulfill its obligation under the terms of the contract, the potential for an illiquid secondary market (making it difficult for the Fund to sell, including at favorable prices) and the potential for market movements which may expose the Fund to gains or losses in excess of the amount shown in the Statement of Assets and Liabilities. The notional amounts of derivative instruments, if applicable, are not recorded in the financial statements.
A derivative instrument may suffer a marked-to-market loss if the value of the contract decreases due to an unfavorable change in the market rates or values of the underlying instrument. Losses can also occur if the counterparty does not perform under the contract. The Fund's risk of loss from counterparty credit risk on over-the-counter derivatives is generally limited to the aggregate unrealized gain netted against any collateral held by the Fund and the amount of any variation margin held by the counterparty. With exchange-traded or centrally cleared derivatives, there is reduced counterparty credit risk to the Fund since the exchange's clearinghouse, as counterparty to such instruments, guarantees against a possible default. The clearinghouse stands between the buyer and the seller of the contract; therefore, the counterparty credit risk is failure of the
clearinghouse. However, credit risk still exists in exchange-traded or centrally cleared derivatives with respect to initial and variation margin that is held in a broker's customer account. While brokers are required to segregate customer margin from their own assets, in the event that a broker becomes insolvent or goes into bankruptcy and at that time there is a shortfall in the aggregate amount of margin held by the broker for all its clients, U.S. bankruptcy laws will typically allocate that shortfall on a pro-rata basis across all the broker's customers (including the Fund), potentially resulting in losses to the Fund.
In order to better define its contractual rights and to secure rights that will help the Fund mitigate its counterparty risk, the Fund may enter into an International Swaps and Derivatives Association, Inc. Master Agreement (ISDA Master Agreement) or similar agreement with its derivatives contract counterparties. An ISDA Master Agreement is an agreement between the Fund and a counterparty that governs over-the-counter derivatives and forward foreign currency exchange contracts and typically contains, among other things, collateral posting terms and netting provisions in the event of a default and/or termination event. Under an ISDA Master Agreement, the Fund may, under certain circumstances, offset with the counterparty certain derivative instrument's payables and/or receivables with collateral held and/or posted and create one single net payment. The provisions of the ISDA Master Agreement typically permit a single net payment in the event of default (close-out netting) including the bankruptcy or insolvency of the counterparty. Note, however, that bankruptcy or insolvency laws of a particular jurisdiction may impose restrictions on or prohibitions against the right of offset in bankruptcy, insolvency or other events.
Collateral (margin) requirements differ by type of derivative. Margin requirements are established by the exchange or clearinghouse for exchange-traded and centrally cleared derivatives. Brokers can ask for margin in excess of the minimum in certain circumstances. Collateral terms are contract specific for over-the-counter derivatives. For over-the-counter derivatives traded under an ISDA Master Agreement, the collateral requirements are typically calculated by netting the marked-to-market amount for each transaction under such agreement and comparing that amount to the value of any variation margin currently pledged by the Fund and/or the counterparty. Generally, the amount of collateral due from or to a party has to exceed a minimum transfer amount threshold (e.g., $500,000) before a transfer has to be made. To the extent amounts due to the Fund from its
Annual Report 2016
63
COLUMBIA TOTAL RETURN BOND FUND
NOTES TO FINANCIAL STATEMENTS (continued)
April 30, 2016
counterparties are not fully collateralized, contractually or otherwise, the Fund bears the risk of loss from counterparty nonperformance. The Fund attempts to mitigate counterparty risk by only entering into agreements with counterparties that it believes have the financial resources to honor their obligations and by monitoring the financial stability of those counterparties.
Certain ISDA Master Agreements allow counterparties to over-the-counter derivatives transactions to terminate derivatives contracts prior to maturity in the event the Fund's net asset value declines by a stated percentage over a specified time period or if the Fund fails to meet certain terms of the ISDA Master Agreement, which would cause the Fund to accelerate payment of any net liability owed to the counterparty. The Fund also has termination rights if the counterparty fails to meet certain terms of the ISDA Master Agreement. In addition to considering counterparty credit risk, the Fund would consider terminating the derivatives contracts based on whether termination would result in a net liability owed from the counterparty.
For financial reporting purposes, the Fund does not offset derivative assets and derivative liabilities that are subject to netting arrangements in the Statement of Assets and Liabilities.
Forward Foreign Currency Exchange Contracts
Forward foreign currency exchange contracts are over-the-counter agreements between two parties to buy and sell a currency at a set price on a future date. The Fund utilized forward foreign currency exchange contracts to hedge the currency exposure associated with some or all of the Fund's securities and to shift foreign currency exposure back to U.S. dollars. These instruments may be used for other purposes in future periods.
The values of forward foreign currency exchange contracts fluctuate daily with changes in foreign currency exchange rates. Changes in the value of these contracts are recorded as unrealized appreciation or depreciation until the contract is exercised or has expired. The Fund will realize a gain or loss when the forward foreign currency exchange contract is closed or expires.
The use of forward foreign currency exchange contracts does not eliminate fluctuations in the prices of the Fund's portfolio securities. The risks of forward foreign currency exchange contracts include movement in the values of the foreign currencies relative to the U.S. dollar (or other foreign currencies) and the possibility that counterparties
will not complete their contractual obligations, which may be in excess of the amount reflected, if any, in the Statement of Assets and Liabilities.
Futures Contracts
Futures contracts are exchange traded and represent commitments for the future purchase or sale of an asset at a specified price on a specified date. The Fund bought and sold futures contracts to manage the duration and yield curve exposure of the Fund versus the benchmark. These instruments may be used for other purposes in future periods. Upon entering into futures contracts, the Fund bears risks that it may not achieve the anticipated benefits of the futures contracts and may realize a loss. Additional risks include counterparty credit risk, the possibility of an illiquid market, and that a change in the value of the contract or option may not correlate with changes in the value of the underlying asset.
Upon entering into a futures contract, the Fund pledges cash or securities with the broker in an amount sufficient to meet the initial margin requirement. The initial margin deposit must be maintained at an established level over the life of the contract. Cash deposited as initial margin is recorded in the Statement of Assets and Liabilities as margin deposits. Securities deposited as initial margin are designated in the Portfolio of Investments. Subsequent payments (variation margin) are made or received by the Fund each day. The variation margin payments are equal to the daily change in the contract value and are recorded as variation margin receivable or payable and are offset in unrealized gains or losses. The Fund recognizes a realized gain or loss when the contract is closed or expires. Futures contracts involve, to varying degrees, risk of loss in excess of the variation margin disclosed in the Statement of Assets and Liabilities.
Options Contracts
Options are contracts which entitle the holder to purchase or sell securities or other identified assets at a specified price, or in the case of index option contracts, to receive or pay the difference between the index value and the strike price of the index option contract. Option contracts can be either exchange-traded or over-the-counter. The Fund purchased and wrote option contracts to hedge portfolio investments, to manage exposure to fluctuations in interest rates and to hedge the fair value of other Fund investments. Completion of transactions for option contracts traded in the over-the-counter market depends upon the performance of the other party. Cash collateral may be collected or posted by the Fund to secure
Annual Report 2016
64
COLUMBIA TOTAL RETURN BOND FUND
NOTES TO FINANCIAL STATEMENTS (continued)
April 30, 2016
certain over-the-counter option contract trades. Cash collateral held or posted by the Fund for such option contract trades must be returned to the counterparty or the Fund upon closure, exercise or expiration of the contract.
Options contracts purchased are recorded as investments. When the Fund writes an options contract, the premium received is recorded as an asset and an amount equivalent to the premium is recorded as a liability in the Statement of Assets and Liabilities and is subsequently adjusted to reflect the current fair value of the option written. Changes in the fair value of the written option are recorded as unrealized appreciation or depreciation until the contract is exercised or has expired. The Fund will realize a gain or loss when the option contract is closed or expires. When option contracts are exercised, the proceeds on sales for a written call or purchased put option contract, or the purchase cost for a written put or purchased call option contract, is adjusted by the amount of premium received or paid.
For over-the-counter options purchased, the Fund bears the risk of loss of the amount of the premiums paid plus the positive change in market values net of any collateral held by the Fund should the counterparty fail to perform under the contracts. Option contracts written by the Fund do not typically give rise to counterparty credit risk, as options written generally obligate the Fund and not the counterparty to perform. The risk in writing a call option contract is that the Fund gives up the opportunity for profit if the market price of the security increases above the strike price and the option contract is exercised. The risk in writing a put option contract is that the Fund may incur a loss if the market price of the security decreases below the strike price and the option contract is exercised. Exercise of a written option could result in the Fund purchasing or selling a security or foreign currency when it otherwise would not, or at a price different from
the current market value. In purchasing and writing options, the Fund bears the risk of an unfavorable change in the value of the underlying instrument or the risk that the Fund may not be able to enter into a closing transaction due to an illiquid market.
Interest Rate Swaption Contracts
Interest rate swaption contracts entered into by the Fund typically represent an option that gives the purchaser the right, but not the obligation, to enter into an interest rate swap contract on a future date. Each interest rate swaption agreement will specify if the buyer is entitled to receive the fixed or floating rate if the interest rate is exercised. Changes in the value of a purchased interest rate swaption contracts are reported as unrealized appreciation or depreciation on options in the Statement of Assets and Liabilities. Gain or loss is recognized in the Statement of Operations when the interest rate swaption contract is closed or expires.
When the Fund writes an interest rate swaption contract, the premium received is recorded as an asset and an amount equivalent to the premium is recorded as a liability in the Statement of Assets and Liabilities and is subsequently adjusted to reflect the current fair value of the interest rate swaption contract written. Premiums received from writing interest rate swaption contracts that expire unexercised are recorded by the Fund on the expiration date as realized gains from options written in the Statement of Operations. The difference between the premium and the amount paid on effecting a closing purchase transaction, including brokerage commissions, is also recorded as realized gain, or if the premium is less than the amount paid for the closing purchase, as realized loss. These amounts are reflected as net realized gain (loss) on options written in the Statement of Operations.
Contracts and premiums associated with options contracts written for the year ended April 30, 2016 are as follows:
| | | Calls | | Puts | |
| | | Contracts | | Premiums ($) | | Contracts | | Premiums ($) | |
Balance at April 30, 2015 | | | — | | | | — | | | | — | | | | — | | |
Opened | | | 30,000,000 | | | | 210,000 | | | | 30,000,000 | | | | 249,750 | | |
Closed | | | — | | | | — | | | | — | | | | — | | |
Expired | | | (30,000,000 | ) | | | (210,000 | ) | | | — | | | | — | | |
Exercised | | | — | | | | — | | | | — | | | | — | | |
Balance at April 30, 2016 | | | — | | | | — | | | | 30,000,000 | | | | 249,750 | | |
Annual Report 2016
65
COLUMBIA TOTAL RETURN BOND FUND
NOTES TO FINANCIAL STATEMENTS (continued)
April 30, 2016
Swap Contracts
Swap contracts are negotiated in the over-the-counter market and may be entered into as a bilateral contract or centrally cleared (centrally cleared swap contract). In a centrally cleared swap contract, immediately following execution of the swap contract with a broker, the swap contract is novated to a central counterparty (the CCP) and the CCP becomes the Fund's counterparty to the centrally cleared swap contract. The Fund is required to deposit initial margin with the broker in the form of cash or securities in an amount that varies depending on the size and risk profile of the particular swap contract. Securities deposited as initial margin are designated in the Portfolio of Investments and cash deposited is recorded in the Statement of Assets and Liabilities as margin deposits. Unlike a bilateral swap contract, for centrally cleared swap contracts, the Fund has minimal credit exposure to the counterparty because the CCP stands between the Fund and the counterparty. Swap contracts are marked-to-market daily and changes in value are recorded as unrealized appreciation (depreciation). The daily change in valuation of centrally cleared swap contracts, if any, is recorded as a receivable or payable for variation margin in the Statement of Assets and Liabilities.
Credit Default Swap Contracts
The Fund entered into credit default swap contracts to increase or decrease its credit exposure to an index and to increase or decrease its credit exposure to a single issuer of debt securities. Additionally, credit default swap contracts were used to hedge the Fund's exposure on a debt security that it owns or in lieu of selling such debt security. These instruments may be used for other purposes in future periods. Credit default swap contracts are agreements in which one party pays fixed periodic payments to a counterparty in consideration for a guarantee from the counterparty to make a specific payment should a specified credit event(s) take place. Although specified credit events are contract specific, credit events are generally defined as bankruptcy, failure to pay, restructuring, obligation acceleration, obligation default, or repudiation/moratorium.
As the purchaser of a credit default swap contract, the Fund purchases protection by paying a periodic interest rate on the notional amount to the counterparty. The interest amount is accrued daily as a component of unrealized appreciation (depreciation) and is recorded as a realized loss upon payment. If a credit event as specified in the contract occurs, the Fund may have the option either to deliver the reference obligation to the
seller in exchange for a cash payment of its par amount, or to receive a net cash settlement equal to the par amount less an agreed-upon value of the reference obligation as of the date of the credit event. The difference between the value of the obligation or cash delivered and the notional amount received will be recorded as a realized gain (loss).
As the seller of a credit default swap contract, the Fund sells protection to a buyer and will generally receive a periodic interest rate on the notional amount. The interest amount is accrued daily as a component of unrealized appreciation (depreciation) and is recorded as a realized gain upon receipt of the payment. If a credit event as specified in the contract with the counterparty occurs, the Fund may either be required to accept the reference obligation from the buyer in exchange for a cash payment of its notional amount, or to pay the buyer a net cash settlement equal to the notional amount less an agreed-upon value of the reference obligation (recovery value) as of the date of the credit event. The difference between the value of the obligation or cash received and the notional amount paid will be recorded as a realized gain (loss). The maximum potential amount of undiscounted future payments the Fund could be required to make as the seller of protection under a credit default swap contract is equal to the notional amount of the reference obligation. These potential amounts may be partially offset by any recovery values of the respective reference obligations or premiums received upon entering into the agreement. The notional amounts and market values of all credit default swap contracts in which the Fund is the seller of protection, if any, are disclosed in the Credit Default Swap Contracts Outstanding schedule following the Portfolio of Investments.
As a protection seller, the Fund bears the risk of loss from the credit events specified in the contract with the counterparty. For credit default swap contracts on credit indices, quoted market prices and resulting market values serve as an indicator of the current status of the payment/performance risk. Increasing market values, in absolute terms when compared to the notional amount of the swap, represent a deterioration of the reference entity's credit soundness and a greater likelihood or risk of default or other credit event occurring as defined under the terms of the contract.
Any premium paid or received by the Fund upon entering into a credit default swap contract is recorded as an asset or liability, respectively, and amortized daily as a component of realized gain (loss) in the Statement of Operations. Credit default swap contracts are valued
Annual Report 2016
66
COLUMBIA TOTAL RETURN BOND FUND
NOTES TO FINANCIAL STATEMENTS (continued)
April 30, 2016
daily, and the change in value is recorded as unrealized appreciation (depreciation) until the termination of the swap, at which time a realized gain (loss) is recorded.
Credit default swap contracts can involve greater risks than if a fund had invested in the reference obligation directly since, in addition to general market risks, credit default swaps are subject to counterparty credit risk, leverage risk, hedging risk, correlation risk and liquidity risk. The Fund will enter into credit default swap transactions only with counterparties that meet certain standards of creditworthiness, as determined by the Investment Manager.
Interest Rate Swap Contracts
The Fund entered into interest rate swap transactions to gain exposure to or protect itself from market rate changes. These instruments may be used for other purposes in future periods. Interest rate swaps are agreements between two parties that involve the exchange of one type of interest rate for another type of interest rate cash flow on specified dates in the future, based on a predetermined, specified notional amount. Certain interest rate swaps are considered forward-starting, whereby the accrual for the exchange of cash flows does not begin until a specified date in the future (the effective date). The net cash flow for a standard interest rate swap transaction is generally the difference between a floating market interest rate versus a fixed interest rate.
Interest rate swaps are valued daily and unrealized appreciation (depreciation) is recorded. Certain interest rate swaps may accrue periodic interest on a daily basis as a component of unrealized appreciation (depreciation); the Fund will realize a gain or loss upon the payment or receipt of accrued interest. The Fund will realize a gain or a loss when the interest rate swap is terminated.
Risks of entering into interest rate swaps include a lack of correlation between the swaps and the portfolio of bonds the swaps are designed to hedge or replicate. A lack of correlation may cause the interest rate swaps to experience adverse changes in value relative to expectations. In addition, interest rate swaps are subject to the risk of default of a counterparty, and the risk of adverse movements in market interest rates relative to the interest rate swap positions taken. The Fund's maximum risk of loss from counterparty credit risk is the discounted net value of the cash flows to be received from/paid to the counterparty over the contract's
remaining life to the extent that such amount is positive, plus the cost of entering into a similar transaction with another counterparty.
The Fund attempts to mitigate counterparty credit risk by entering into interest rate swap transactions only with counterparties that meet prescribed levels of creditworthiness, as determined by the Investment Manager. The Fund and any counterparty are required to maintain an agreement that requires the Fund and that counterparty to monitor (on a daily basis) the net market value of all derivative transactions entered into pursuant to the agreement between the Fund and such counterparty. If the net market value of such derivatives transactions between the Fund and that counterparty exceeds a certain threshold (as defined in the agreement), the Fund or the counterparty is required to post cash and/or securities as collateral. Market values of derivatives transactions presented in the financial statements are not netted with the market values of other derivatives transactions or with any collateral amounts posted by the Fund or any counterparty.
Effects of Derivative Transactions in the Financial Statements
The following tables are intended to provide additional information about the effect of derivatives on the financial statements of the Fund, including: the fair value of derivatives by risk category and the location of those fair values in the Statement of Assets and Liabilities; and the impact of derivative transactions over the period in the Statement of Operations, including realized and unrealized gains (losses). The derivative instrument schedules following the Portfolio of Investments present additional information regarding derivative instruments outstanding at the end of the period, if any.
Annual Report 2016
67
COLUMBIA TOTAL RETURN BOND FUND
NOTES TO FINANCIAL STATEMENTS (continued)
April 30, 2016
The following table is a summary of the fair value of derivative instruments (not considered to be hedging instruments for accounting disclosure purposes) at April 30, 2016:
Asset Derivatives | |
Risk Exposure
Category | | Statement of Assets and
Liabilities Location | | Fair Value ($) | |
Credit risk | | Net assets — unrealized
appreciation on swap
contracts | | | 5,617,688
| * | |
Credit risk | | Premiums paid on
outstanding swap
contracts | | | 15,526,592
| | |
Interest rate
risk | | Net assets — unrealized
appreciation on futures
contracts | | | 1,634,758
| * | |
Interest rate risk | | Investments, at value —
Options purchased | | | 67,554
| | |
Total | | | | | 22,846,592 | | |
Liability Derivatives | |
Risk Exposure
Category | | Statement of Assets and
Liabilities Location | |
Fair Value ($) | |
Credit risk | | Net assets — unrealized
depreciation on swap
contracts | | | 7,006,348
| * | |
Credit risk | | Premiums received on
outstanding swap
contracts | | | 17,888,148
| | |
Interest rate
risk | | Net assets — unrealized
depreciation on futures
contracts | | | 772,396
| * | |
Interest rate
risk | | Options contracts written,
at value | | | 292,842 | | |
Interest rate
risk | | Net assets — unrealized
depreciation on swap
contracts | | | 397,821
| * | |
Total | | | | | 26,357,555 | | |
*Includes cumulative appreciation (depreciation) as reported in the tables following the Portfolio of Investments. Only the current day's variation margin is reported in receivables or payables in the Statement of Assets and Liabilities.
The following table indicates the effect of derivative instruments (not considered to be hedging instruments for accounting disclosure purposes) in the Statement of Operations for the year ended April 30, 2016:
Amount of Realized Gain (Loss) on Derivatives Recognized in Income | |
| Risk Exposure Category | | Forward Foreign
Currency Exchange
Contracts ($) | | Futures
Contracts ($) | | Options Contracts
Written ($) | | Options Contracts
Purchased ($) | | Swap
Contracts ($) | | Total ($) | |
Credit risk | | | — | | | | — | | | | — | | | | — | | | | (8,611,379 | ) | | | (8,611,379 | ) | |
Foreign exchange risk | | | (576,358 | ) | | | — | | | | — | | | | — | | | | — | | | | (576,358 | ) | |
Interest rate risk | | | — | | | | (6,066,743 | ) | | | 210,000 | | | | (90,425 | ) | | | 38,166 | | | | (5,909,002 | ) | |
Total | | | (576,358 | ) | | | (6,066,743 | ) | | | 210,000 | | | | (90,425 | ) | | | (8,573,213 | ) | | | (15,096,739 | ) | |
Change in Unrealized Appreciation (Depreciation) on Derivatives Recognized in Income | |
| Risk Exposure Category | | Forward Foreign
Currency Exchange
Contracts ($) | | Futures
Contracts ($) | | Options Contracts
Written ($) | | Options Contracts
Purchased ($) | | Swap
Contracts ($) | | Total ($) | |
Credit risk | | | — | | | | — | | | | — | | | | — | | | | 2,348,875 | | | | 2,348,875 | | |
Foreign exchange risk | | | 646,845 | | | | — | | | | — | | | | — | | | | — | | | | 646,845 | | |
Interest rate risk | | | — | | | | (266,529 | ) | | | (43,092 | ) | | | (439,071 | ) | | | (337,760 | ) | | | (1,086,452 | ) | |
Total | | | 646,845 | | | | (266,529 | ) | | | (43,092 | ) | | | (439,071 | ) | | | 2,011,115 | | | | 1,909,268 | | |
The following table provides a summary of the average outstanding volume by derivative instrument for the year ended April 30, 2016:
Derivative Instrument | | Average Notional Amounts ($)* | |
Futures contracts — Long | | | 511,494,113 | | |
Futures contracts — Short | | | 153,548,472 | | |
Credit default swap contracts —
buy protection | | | 785,851,565 | | |
Credit default swap contracts —
sell protection | | | 82,867,500 | | |
Derivative Instrument | | Average Market Value ($)* | |
Options contracts — Purchased | | | 258,625 | | |
Options contracts — Written | | | (73,211 | ) | |
Derivative Instrument | | Average Unrealized
Appreciation ($)* | | Average Unrealized
Depreciation ($)* | |
Forward foreign currency
exchange contracts | | | 15,467 | | | | (48,915 | ) | |
Interest rate swap contracts | | | 61,577 | | | | (396,123 | ) | |
*Based on the ending quarterly outstanding amounts for the year ended April 30, 2016.
Annual Report 2016
68
COLUMBIA TOTAL RETURN BOND FUND
NOTES TO FINANCIAL STATEMENTS (continued)
April 30, 2016
Investments in Senior Loans
The Fund may invest in senior loan assignments. When the Fund purchases an assignment of a senior loan, the Fund typically has direct rights against the borrower; provided, however, that the Fund's rights may be more limited than the lender from which it acquired the assignment and the Fund may be able to enforce its rights only through an administrative agent. Although certain senior loan assignments are secured by collateral, the Fund could experience delays or limitations in realizing such collateral or have its interest subordinated to other indebtedness of the obligor. In the event that the administrator or collateral agent of a loan becomes insolvent, enters into receivership or bankruptcy, the Fund may incur costs and delays in realizing payment or may suffer a loss of principal and/or interest. The risk of loss is greater for unsecured or subordinated loans. In addition, senior loan assignments are vulnerable to market, economic or other conditions or events that may reduce the demand for senior loan assignments and certain senior loan assignments which were liquid, when purchased, may become illiquid.
The Fund may enter into senior loan assignments where all or a portion of the loan may be unfunded. The Fund is obligated to fund these commitments at the borrower's discretion. These commitments are generally traded and priced in the same manner as other senior loan securities and are disclosed as unfunded senior loan commitments in the Fund's Portfolio of Investments with a corresponding payable for investments purchased. The Fund designates cash or liquid securities to cover these commitments.
Asset- and Mortgage-Backed Securities
The Fund may invest in asset-backed and mortgage-backed securities. The maturity dates shown represent the original maturity of the underlying obligation. Actual maturity may vary based upon prepayment activity on these obligations. All, or a portion, of the obligation may be prepaid at any time because the underlying asset may be prepaid. As a result, decreasing market interest rates could result in an increased level of prepayment. An increased prepayment rate will have the effect of shortening the maturity of the security. Unless otherwise noted, the coupon rates presented are fixed rates.
Delayed Delivery Securities
The Fund may trade securities on other than normal settlement terms, including securities purchased or sold on a "when-issued" basis. This may increase risk to the Fund since the other party to the transaction may fail to deliver, which could cause the Fund to subsequently invest at less advantageous prices. The Fund designates
cash or liquid securities in an amount equal to the delayed delivery commitment.
To Be Announced Securities
The Fund may trade securities on a To Be Announced (TBA) basis. As with other delayed-delivery transactions, a seller agrees to issue a TBA security at a future date. However, the seller does not specify the particular securities to be delivered. Instead, the Fund agrees to accept any security that meets specified terms.
In some cases, Master Securities Forward Transaction Agreements (MSFTAs) may be used to govern transactions of certain forward-settling agency mortgage-backed securities, such as delayed-delivery and TBAs, between the Fund and counterparty. The MSFTA maintains provisions for, among other things, initiation and confirmation, payment and transfer, events of default, termination, and maintenance of collateral relating to such transactions.
Mortgage Dollar Roll Transactions
The Fund may enter into mortgage "dollar rolls" in which the Fund sells securities for delivery in the current month and simultaneously contracts with the same counterparty to repurchase similar but not identical securities (same type, coupon and maturity) on a specified future date. During the roll period, the Fund loses the right to receive principal and interest paid on the securities sold. However, the Fund will benefit because it receives negotiated amounts in the form of reductions of the purchase price for the future purchase plus the interest earned on the cash proceeds of the securities sold until the settlement date of the forward purchase. The Fund records the incremental difference between the forward purchase and sale of each forward roll as a realized gain or loss. Unless any realized gains exceed the income, capital appreciation, and gain or loss due to mortgage prepayments that would have been realized on the securities sold as part of the mortgage dollar roll, the use of this technique will diminish the investment performance of the Fund compared to what the performance would have been without the use of mortgage dollar rolls. All cash proceeds will be invested in instruments that are permissible investments for the Fund. The Fund identifies cash or liquid securities in an amount equal to the forward purchase price.
For financial reporting and tax purposes, the Fund treats "to be announced" mortgage dollar rolls as two separate transactions, one involving the purchase of a security and a separate transaction involving a sale. These transactions may increase the Fund's portfolio turnover rate. The Fund does not currently enter into mortgage dollar rolls that are accounted for as financing transactions.
Annual Report 2016
69
COLUMBIA TOTAL RETURN BOND FUND
NOTES TO FINANCIAL STATEMENTS (continued)
April 30, 2016
Mortgage dollar rolls involve the risk that the market value of the securities the Fund is obligated to repurchase may decline below the repurchase price, or that the counterparty may default on its obligations.
Interest Only and Principal Only Securities
The Fund may invest in Interest Only (IO) or Principal Only (PO) securities. IOs are stripped securities entitled to receive all of the security's interest, but none of its principal. IOs are particularly sensitive to changes in interest rates and therefore subject to greater fluctuations in price than typical interest bearing debt securities. IOs are also subject to credit risk because the Fund may not receive all or part of the interest payments if the issuer, obligor, guarantor or counterparty defaults
on its obligation. Payments received for IOs are included in interest income on the Statement of Operations. Because no principal will be received at the maturity of an IO, adjustments are made to the cost of the security on a monthly basis until maturity. POs are stripped securities entitled to receive the principal from the underlying obligation, but not the interest. POs are particularly sensitive to changes in interest rates and therefore are subject to fluctuations in price. POs are also subject to credit risk because the Fund may not receive all or part of its principal if the issuer, obligor, guarantor or counterparty defaults on its obligation. The Fund may also invest in IO or PO stripped mortgage-backed securities. Payments received for POs are treated as reductions to the cost and par value of the securities.
Offsetting of Assets and Liabilities
The following table presents the Fund's gross and net amount of assets and liabilities available for offset under netting arrangements as well as any related collateral received or pledged by the Fund as of April 30, 2016:
| | Barclays ($) | | Citi ($) | | Credit
Suisse ($) | | Goldman Sachs
International ($) | | JPMorgan ($) | | Morgan
Stanley ($)(a) | | Morgan
Stanley ($)(a) | | Total ($) | |
Assets | |
Centrally cleared
credit default
swap contracts(b) | | | — | | | | — | | | | — | | | | — | | | | — | | | | — | | | | 163,203 | | | | 163,203 | | |
Options purchased
puts | | | 8,664 | | | | 58,890 | | | | — | | | | — | | | | — | | | | — | | | | — | | | | 67,554 | | |
OTC credit default
swap contracts(c) | | | 240,020 | | | | 4,348,877 | | | | — | | | | 1,541,837 | | | | 4,130,598 | | | | 592,727 | | | | — | | | | 10,854,059 | | |
Total Assets | | | 248,684 | | | | 4,407,767 | | | | — | | | | 1,541,837 | | | | 4,130,598 | | | | 592,727 | | | | 163,203 | | | | 11,084,816 | | |
Liabilities | |
Centrally cleared
interest rate swap
contracts(b) | | | — | | | | — | | | | — | | | | — | | | | — | | | | — | | | | 10,581 | | | | 10,581 | | |
Options contracts
written | | | — | | | | 292,842 | | | | — | | | | — | | | | — | | | | — | | | | — | | | | 292,842 | | |
OTC credit default
swap contracts(c) | | | 1,680,399 | | | | 1,184,484 | | | | 5,248 | | | | 3,225,131 | | | | 1,996,453 | | | | 5,799,085 | | | | — | | | | 13,890,800 | | |
Total Liabilities | | | 1,680,399 | | | | 1,477,326 | | | | 5,248 | | | | 3,225,131 | | | | 1,996,453 | | | | 5,799,085 | | | | 10,581 | | | | 14,194,223 | | |
Total Financial
and Derivative
Net Assets | | | (1,431,715 | ) | | | 2,930,441 | | | | (5,248 | ) | | | (1,683,294 | ) | | | 2,134,145 | | | | (5,206,358 | ) | | | 152,622 | | | | (3,109,407 | ) | |
Total collateral
received (pledged)(d) | | | (1,431,715 | ) | | | 2,828,000 | | | | — | | | | (1,683,294 | ) | | | 1,890,000 | | | | (5,146,417 | ) | | | — | | | | (3,543,426 | ) | |
Net Amount(e) | | | — | | | | 102,441 | | | | (5,248 | ) | | | — | | | | 244,145 | | | | (59,941 | ) | | | 152,622 | | | | 434,019 | | |
(a) Exposure can only be netted across transactions governed under the same master agreement with the same legal entity.
(b) Centrally cleared swaps are included within payable/receivable for variation margin on the Statement of Assets and Liabilities.
(c) Over-the-Counter Swap Contracts are presented at market value plus periodic payments receivable (payable), which is comprised of unrealized appreciation, unrealized depreciation, premiums paid and premiums received.
(d) In some instances, the actual collateral received and/or pledged may be more than the amount shown due to overcollateralization.
(e) Represents the net amount due from/(to) counterparties in the event of default.
Annual Report 2016
70
COLUMBIA TOTAL RETURN BOND FUND
NOTES TO FINANCIAL STATEMENTS (continued)
April 30, 2016
Security Transactions
Security transactions are accounted for on the trade date. Cost is determined and gains (losses) are based upon the specific identification method for both financial statement and federal income tax purposes.
Income Recognition
Interest income is recorded on an accrual basis. Market premiums and discounts, including original issue discounts, are amortized and accreted, respectively, over the expected life of the security on all debt securities, unless otherwise noted. The Fund classifies gains and losses realized on prepayments received on mortgage-backed securities as adjustments to interest income.
The Fund may place a debt security on non-accrual status and reduce related interest income when it becomes probable that the interest will not be collected and the amount of uncollectible interest can be reasonably estimated. A defaulted debt security is removed from non-accrual status when the issuer resumes interest payments or when collectibility of interest is reasonably assured.
Corporate actions and dividend income are recorded on the ex-dividend date.
The Fund may receive distributions from holdings in equity securities, business development companies (BDCs), exchange-traded funds, other regulated investment companies (RICs), and real estate investment trusts (REITs), which report information on the tax character of their distributions annually. These distributions are allocated to dividend income, capital gain and return of capital based on actual information reported. Return of capital is recorded as a reduction of the cost basis of securities held. If the Fund no longer owns the applicable securities, return of capital is recorded as a realized gain. With respect to REITs, to the extent actual information has not yet been reported, estimates for return of capital are made by the Fund's management. Management's estimates are subsequently adjusted when the actual character of the distributions is disclosed by the REITs, which could result in a proportionate change in return of capital to shareholders.
Awards from class action litigation are recorded as a reduction of cost basis if the Fund still owns the applicable securities on the payment date. If the Fund no longer owns the applicable securities, the proceeds are recorded as realized gains.
The value of additional securities received as an income payment is recorded as income and increases the cost basis of such securities.
The Fund may receive other income from senior loans, including amendment fees, consent fees and commitment fees. These fees are recorded as income when received by the Fund. These amounts are included in Interest Income in the Statement of Operations.
Expenses
General expenses of the Trust are allocated to the Fund and other funds of the Trust based upon relative net assets or other expense allocation methodologies determined by the nature of the expense. Expenses directly attributable to the Fund are charged to the Fund. Expenses directly attributable to a specific class of shares are charged to that share class.
Determination of Class Net Asset Value
All income, expenses (other than class-specific expenses, which are charged to that share class, as shown in the Statement of Operations) and realized and unrealized gains (losses) are allocated to each class of the Fund on a daily basis, based on the relative net assets of each class, for purposes of determining the net asset value of each class.
Federal Income Tax Status
The Fund intends to qualify each year as a regulated investment company under Subchapter M of the Internal Revenue Code, as amended, and will distribute substantially all of its taxable income (including net short-term capital gains), if any, for its tax year, and as such will not be subject to federal income taxes. In addition, the Fund intends to distribute in each calendar year substantially all of its net investment income, capital gains and certain other amounts, if any, such that the Fund should not be subject to federal excise tax. Therefore, no federal income or excise tax provision is recorded.
Distributions to Shareholders
Distributions from net investment income, if any, are declared daily and paid monthly. Net realized capital gains, if any, are distributed at least annually. Income distributions and capital gain distributions are determined in accordance with federal income tax regulations, which may differ from GAAP.
Guarantees and Indemnifications
Under the Trust's organizational documents and, in some cases, by contract, its officers and trustees are indemnified against certain liabilities arising out of the performance of their duties to the Trust or its funds. In addition, certain of the Fund's contracts with its service providers contain general indemnification clauses. The Fund's maximum exposure under these arrangements is unknown since the
Annual Report 2016
71
COLUMBIA TOTAL RETURN BOND FUND
NOTES TO FINANCIAL STATEMENTS (continued)
April 30, 2016
amount of any future claims that may be made against the Fund cannot be determined, and the Fund has no historical basis for predicting the likelihood of any such claims.
Note 3. Fees and Other Transactions with Affiliates
Management Fees
Effective September 1, 2015, the Fund entered into a Management Agreement with Columbia Management Investment Advisers, LLC (the Investment Manager), a wholly-owned subsidiary of Ameriprise Financial, Inc. (Ameriprise Financial). Under the Management Agreement, the Investment Manager provides the Fund with investment research and advice, as well as administrative and accounting services. The management services fee is an annual fee that is equal to a percentage of the Fund's average daily net assets that declines from 0.50% to 0.34% as the Fund's net assets increase. The effective management services fee rate for the year ended April 30, 2016 was 0.48% of the Fund's average daily net assets.
Prior to September 1, 2015, the Fund paid the Investment Manager an annual fee for advisory services under an Investment Management Services Agreement and a separate annual fee for administrative and accounting services under an Administrative Services Agreement. For the period from May 1, 2015 through August 31, 2015, the investment advisory services fee paid to the Investment Manager was $4,803,822, and the administrative services fee paid to the Investment Manager was $705,786.
Compensation of Board Members
Board members, who are not officers or employees of the Investment Manager or Ameriprise Financial, are compensated for their services to the Fund as disclosed in the Statement of Operations. These Board members may participate in a Deferred Compensation Plan (the Plan) which may be terminated at any time. Obligations of the Plan will be paid solely out of the Fund's assets, and all amounts payable under the Plan constitute a general unsecured obligation of the Fund.
Compensation of Chief Compliance Officer
The Board has appointed a Chief Compliance Officer to the Fund in accordance with federal securities regulations. The Fund is allocated a portion of the expenses associated with the Chief Compliance Officer based on relative net assets of the Trust.
Transactions with Affiliates
For the year ended April 30, 2016, the Fund engaged in purchase and/or sale transactions with affiliates and/or accounts that have a common investment manager
(or affiliated investment managers), common directors/trustees, and/or common officers. Those purchase and sale transactions complied with provisions of Rule 17a-7 under the 1940 Act and were $12,935,133 and $88,788,958, respectively. The sale transactions resulted in a net realized gain of $1,994,648.
Transfer Agency Fees
Under a Transfer and Dividend Disbursing Agent Agreement, Columbia Management Investment Services Corp. (the Transfer Agent), an affiliate of the Investment Manager and a wholly-owned subsidiary of Ameriprise Financial, is responsible for providing transfer agency services to the Fund. The Transfer Agent has contracted with Boston Financial Data Services (BFDS) to serve as sub-transfer agent.
The Transfer Agent receives a monthly transfer agency fee based on the number or the average value of accounts, depending on the type of account. In addition, the Transfer Agent also receives sub-transfer agency fees based on a percentage of the average aggregate value of the Fund's shares maintained in omnibus accounts (other than omnibus accounts for which American Enterprise Investment Services Inc. is the broker of record or accounts where the beneficial shareholder is a customer of Ameriprise Financial Services, Inc., for which the Transfer Agent receives a per account fee). The Transfer Agent pays the fees of BFDS for services as sub-transfer agent and is not entitled to reimbursement for such fees from the Fund (with the exception of out-of-pocket fees).
The Transfer Agent also receives compensation from the Fund for various shareholder services and reimbursements for certain out-of-pocket fees. Total transfer agency fees for Class K and Class R5 shares are subject to an annual limitation of not more than 0.05% of the average daily net assets attributable to each share class. Class I and Class Y shares do not pay transfer agency fees.
For the year ended April 30, 2016, the Fund's effective transfer agency fee rates as a percentage of average daily net assets of each class were as follows:
Class A | | | 0.15 | % | |
Class B | | | 0.16 | | |
Class C | | | 0.15 | | |
Class K | | | 0.05 | | |
Class R | | | 0.15 | | |
Class R4 | | | 0.15 | | |
Class R5 | | | 0.05 | | |
Class W | | | 0.15 | | |
Class Z | | | 0.15 | | |
Annual Report 2016
72
COLUMBIA TOTAL RETURN BOND FUND
NOTES TO FINANCIAL STATEMENTS (continued)
April 30, 2016
The Fund and certain other associated investment companies have severally, but not jointly, guaranteed the performance and observance of all the terms and conditions of a lease entered into by Seligman Data Corp. (SDC), the former transfer agent, including the payment of rent by SDC (the Guaranty). SDC was the legacy Seligman funds' former transfer agent.
The lease and the Guaranty expire in January 2019. At April 30, 2016, the Fund's total potential future obligation over the life of the Guaranty is $8,780. The liability remaining at April 30, 2016 for non-recurring charges associated with the lease amounted to $6,967 and is recorded as a part of the payable for other expenses in the Statement of Assets and Liabilities.
An annual minimum account balance fee of $20 may apply to certain accounts with a value below the applicable share class's initial minimum investment requirements to reduce the impact of small accounts on transfer agency fees. These minimum account balance fees are remitted to the Fund and recorded as part of expense reductions in the Statement of Operations. For the year ended April 30, 2016, these minimum account balance fees reduced total expenses of the Fund by $2,250.
Plan Administration Fees
Under a Plan Administration Services Agreement with the Transfer Agent, the Fund pays an annual fee at a rate of 0.25% of the Fund's average daily net assets attributable to Class K shares for the provision of various administrative, recordkeeping, communication and educational services.
Distribution and Service Fees
The Fund has an agreement with Columbia Management Investment Distributors, Inc. (the Distributor), an affiliate of the Investment Manager and a wholly-owned subsidiary of Ameriprise Financial, for distribution and shareholder services. The Board has approved, and the Fund has adopted, distribution and shareholder service plans (the Plans) applicable to certain share classes, which set the distribution and service fees for the Fund. These fees are calculated daily and are intended to compensate the Distributor and/or eligible selling and/or servicing agents for selling shares of the Fund and providing services to investors.
Under the Plans, the Fund pays a monthly service fee to the Distributor at the maximum annual rate of 0.25% of the average daily net assets attributable to Class A, Class B, Class C and Class W shares of the Fund. Also under the Plans, the Fund pays a monthly distribution fee to the Distributor at the maximum annual rates of 0.10%,
0.75%, 0.75%, 0.50% and 0.25% of the average daily net assets attributable to Class A, Class B, Class C, Class R and Class W shares of the Fund, respectively.
Although the Fund may pay distribution and service fees up to a maximum annual rate of 0.35% of the Fund's average daily net assets attributable to Class A shares (comprised of up to 0.10% for distribution services and up to 0.25% for shareholder liaison services), the Fund currently limits such fees to an aggregate fee of not more than 0.25% of the Fund's average daily net assets attributable to Class A shares.
Although the Fund may pay a distribution fee up to 0.25% of the Fund's average daily net assets attributable to Class W shares and a service fee of up to 0.25% of the Fund's average daily net assets attributable to Class W shares, the aggregate fee shall not exceed 0.25% of the Fund's average daily net assets attributable to Class W shares.
Sales Charges
Sales charges, including front-end charges and CDSCs, received by the Distributor for distributing Fund shares were $237,656 for Class A, $1,212 for Class Band $2,045 for Class C shares for the year ended April 30, 2016.
Expenses Waived/Reimbursed by the Investment Manager and its Affiliates
The Fund's expense ratio is subject to an expense reimbursement arrangement pursuant to which fees will be waived and/or expenses reimbursed (excluding certain fees and expenses described below), so that the Fund's net operating expenses, after giving effect to fees waived/expenses reimbursed and any balance credits and/or overdraft charges from the Fund's custodian, do not exceed the annual rates of:
| | | Contractual
Expense Cap
September 1, 2015
through
August 31, 2016 | | Voluntary
Expense Cap
Prior to
September 1, 2015 | |
Class A | | | 0.86 | % | | | 0.86 | % | |
Class B | | | 1.61 | | | | 1.61 | | |
Class C | | | 1.61 | | | | 1.61 | | |
Class I | | | 0.49 | | | | 0.48 | | |
Class K | | | 0.79 | | | | 0.78 | | |
Class R | | | 1.11 | | | | 1.11 | | |
Class R4 | | | 0.61 | | | | 0.61 | | |
Class R5 | | | 0.54 | | | | 0.53 | | |
Class W | | | 0.86 | | | | 0.86 | | |
Class Y | | | 0.49 | | | | 0.48 | | |
Class Z | | | 0.61 | | | | 0.61 | | |
Annual Report 2016
73
COLUMBIA TOTAL RETURN BOND FUND
NOTES TO FINANCIAL STATEMENTS (continued)
April 30, 2016
The contractual agreement may be modified or amended only with approval from the Investment Manager, certain of its affiliates and the Fund. Under the arrangements, the following fees and expenses are excluded from the waiver/reimbursement commitment, and therefore will be paid by the Fund, if applicable: taxes (including foreign transaction taxes), expenses associated with investments in affiliated and non-affiliated pooled investment vehicles (including mutual funds and exchange-traded funds), transaction costs and brokerage commissions, costs related to any securities lending program, dividend and interest expenses associated with securities sold short, inverse floater program fees and expenses, transaction charges and interest on borrowed money, interest and extraordinary expenses. Any fees waived and/or expenses reimbursed under the expense reimbursement arrangements described above are not recoverable by the Investment Manager or its affiliates in future periods.
Note 4. Federal Tax Information
The timing and character of income and capital gain distributions are determined in accordance with income tax regulations, which may differ from GAAP because of temporary or permanent book to tax differences.
At April 30, 2016, these differences are primarily due to differing treatment for principal and/or interest from fixed income securities, deferral/reversal of wash sale losses, Trustees' deferred compensation, distributions, distribution reclassifications, foreign currency transactions, derivative investments, tax straddles and swap investments. To the extent these differences are permanent, reclassifications are made among the components of the Fund's net assets in the Statement of Assets and Liabilities. Temporary differences do not require reclassifications.
In the Statement of Assets and Liabilities the following reclassifications were made:
Undistributed net investment income | | $ | (17,944,888 | ) | |
Accumulated net realized loss | | | 17,944,885 | | |
Paid-in capital | | | 3 | | |
Net investment income (loss) and net realized gains (losses), as disclosed in the Statement of Operations, and net assets were not affected by this reclassification.
The tax character of distributions paid during the years indicated was as follows:
Year Ended April 30, | | 2016 | | 2015 | |
Ordinary income | | $ | 77,090,799 | | | $ | 92,809,686 | | |
Long-term capital gains | | | 30,194,472 | | | | — | | |
Total | | $ | 107,285,271 | | | $ | 92,809,686 | | |
Short-term capital gain distributions, if any, are considered ordinary income distributions for tax purposes.
At April 30, 2016, the components of distributable earnings on a tax basis were as follows:
Undistributed ordinary income | | $ | 12,477,834 | | |
Undistributed long-term capital gains | | | 1,835,475 | | |
Net unrealized appreciation | | | 29,049,710 | | |
At April 30, 2016, the cost of investments for federal income tax purposes was $3,485,476,777 and the aggregate gross unrealized appreciation and depreciation based on that cost was:
Unrealized appreciation | | $ | 83,628,957 | | |
Unrealized depreciation | | | (54,579,247 | ) | |
Net unrealized appreciation | | $ | 29,049,710 | | |
Management of the Fund has concluded that there are no significant uncertain tax positions in the Fund that would require recognition in the financial statements. However, management's conclusion may be subject to review and adjustment at a later date based on factors including, but not limited to, new tax laws, regulations, and administrative interpretations (including relevant court decisions). Generally, the Fund's federal tax returns for the prior three fiscal years remain subject to examination by the Internal Revenue Service.
Note 5. Portfolio Information
The cost of purchases and proceeds from sales of securities, excluding short-term investments and derivatives, if any, aggregated to $17,280,556,224 and $17,567,516,961, respectively, for the year ended April 30, 2016, of which $13,523,115,386 and $13,727,135,185, respectively, were U.S. government securities. The amount of purchase and sale activity impacts the portfolio turnover rate reported in the Financial Highlights.
Annual Report 2016
74
COLUMBIA TOTAL RETURN BOND FUND
NOTES TO FINANCIAL STATEMENTS (continued)
April 30, 2016
Note 6. Affiliated Money Market Fund
The Fund invests in Columbia Short-Term Cash Fund, an affiliated money market fund established for the exclusive use by the Fund and other affiliated funds. The income earned by the Fund from such investments is included as Dividends — affiliated issuers in the Statement of Operations. As an investing fund, the Fund indirectly bears its proportionate share of the expenses of Columbia Short-Term Cash Fund.
Note 7. Line of Credit
The Fund has access to a revolving credit facility whereby the Fund may borrow for the temporary funding of shareholder redemptions or for other temporary or emergency purposes. Effective December 8, 2015, Citibank, N.A. and HSBC Bank USA, N.A. joined JPMorgan Chase Bank, N.A. (JPMorgan) as lead of a syndicate of banks under the credit facility, which is a collective agreement between the Fund and certain other funds managed by the Investment Manager, severally and not jointly, that permits collective borrowings up to $1 billion. Interest is charged to each participating fund based on its borrowings at a rate equal to the higher of (i) the overnight federal funds rate plus 1.00% or (ii) the one-month LIBOR rate plus 1.00%. Each borrowing under the credit facility matures no later than 60 days after the date of borrowing. The Fund also pays a commitment fee equal to its pro rata share of the amount of the credit facility at a rate of 0.15% per annum. The commitment fee is included in other expenses in the Statement of Operations. Prior to December 8, 2015, JPMorgan was the sole lead bank under the credit facility agreement that permitted borrowings up to $550 million under the same terms and interest rates as described above with the exception of the commitment fee which was charged at a rate of 0.075% per annum.
The Fund had no borrowings during the year ended April 30, 2016.
Note 8. Significant Risks
Shareholder Concentration Risk
At April 30, 2016, one unaffiliated shareholder of record owned 17.9% of the outstanding shares of the Fund in one or more accounts. The Fund has no knowledge about whether any portion of those shares was owned beneficially. Affiliated shareholders of record owned 63.0% of the outstanding shares of the Fund in one or more accounts. Subscription and redemption activity by concentrated accounts may have a significant effect on the operations of the Fund. In the case of a large
redemption, the Fund may be forced to sell investments at inopportune times, including its liquid or more liquid positions, resulting in Fund losses and the Fund holding a higher percentage of less liquid or illiquid securities. Large redemptions could result in decreased economies of scale and increased operating expenses for non-redeeming Fund shareholders.
Credit Risk
Credit risk is the risk that the value of debt securities in the Fund's portfolio may decline because the issuer may default and fail to pay interest or repay principal when due. Rating agencies assign credit ratings to debt securities to indicate their credit risk. Lower rated or unrated debt securities held by the Fund may present increased credit risk as compared to higher-rated debt securities.
Interest Rate Risk
Interest rate risk is the risk of losses attributable to changes in interest rates. In general, if prevailing interest rates rise, the values of debt securities tend to fall, and if interest rates fall, the values of debt securities tend to rise. Actions by governments and central banking authorities can result in increases in interest rates. Increasing interest rates may negatively affect the value of debt securities held by the Fund, resulting in a negative impact on the Fund's performance and net asset value per share. In general, the longer the maturity or duration of a debt security, the greater its sensitivity to changes in interest rates.
Liquidity Risk
Liquidity risk is the risk associated with a lack of marketability of investments which may make it difficult to sell the investment at a desirable time or price. Changing regulatory, market or other conditions or environments (for example, the interest rate or credit environments) may adversely affect the liquidity of the Fund's investments. The Fund may have to accept a lower selling price for the holding, sell other investments, or forego another, more appealing investment opportunity. Generally, the less liquid the market at the time the Fund sells a portfolio investment, the greater the risk of loss or decline of value to the Fund. A less liquid market can lead to an increase in Fund redemptions, which may negatively impact Fund performance and net asset value per share, including, for example, if the Fund is forced to sell securities in a down market.
Annual Report 2016
75
COLUMBIA TOTAL RETURN BOND FUND
NOTES TO FINANCIAL STATEMENTS (continued)
April 30, 2016
Derivatives Risk
Losses involving derivative instruments may be substantial, because a relatively small price movement in the underlying security(ies), commodity, currency or index or other instrument or asset may result in a substantial loss for the Fund. In addition to the potential for increased losses, the use of derivative instruments may lead to increased volatility within the Fund. Derivatives will typically increase the Fund's exposure to principal risks to which it is otherwise exposed, and may expose the Fund to additional risks, including correlation risk, counterparty risk, hedging risk, leverage risk and liquidity risk.
High-Yield Securities Risk
Securities rated below investment grade (commonly called "high-yield" or "junk" bonds) and unrated securities of comparable quality expose the Fund to a greater risk of loss of principal and income than a fund that invests solely or primarily in investment grade securities. In addition, these investments have greater price fluctuations, are less liquid and are more likely to experience a default than higher-rated securities. High-yield securities are considered to be predominantly speculative with respect to the issuer's capacity to pay interest and repay principal.
Mortgage- and Other Asset-Backed Securities Risk
The value of any mortgage-backed and other asset-backed securities held by the Fund may be affected by, among other things, changes or perceived changes in: interest rates; factors concerning the interests in and structure of the issuer or the originator of the mortgages or other assets; the creditworthiness of the entities that provide any supporting letters of credit, surety bonds or other credit enhancements; or the market's assessment of the quality of underlying assets. Payment of principal and interest on some mortgage-backed securities (but not the market value of the securities themselves) may be guaranteed by the full faith and credit of a particular U.S. Government agency, authority, enterprise or instrumentality, and some, but not all, are also insured or guaranteed by the U.S. Government. Mortgage-backed securities issued by non-governmental issuers (such as commercial banks, savings and loan institutions, private mortgage insurance companies, mortgage bankers and other secondary market issuers) may entail greater risk than obligations guaranteed by the U.S. Government. Mortgage- and other asset-backed securities are subject to prepayment risk, which is the possibility that the underlying mortgage or other asset may be refinanced or prepaid prior to maturity during periods of declining or low interest rates, causing the Fund to have to reinvest
the money received in securities that have lower yields. Rising or high interest rates tend to extend the duration of mortgage- and other asset-backed securities, making their prices more volatile and more sensitive to changes in interest rates.
Note 9. Subsequent Events
Management has evaluated the events and transactions that have occurred through the date the financial statements were issued and noted no items requiring adjustment of the financial statements or additional disclosure.
Note 10. Information Regarding Pending and Settled Legal Proceedings
In December 2005, without admitting or denying the allegations, American Express Financial Corporation (AEFC, which is now known as Ameriprise Financial, Inc. (Ameriprise Financial)) entered into settlement agreements with the Securities and Exchange Commission (SEC) and Minnesota Department of Commerce (MDOC) related to market timing activities. As a result, AEFC was censured and ordered to cease and desist from committing or causing any violations of certain provisions of the Investment Advisers Act of 1940, the Investment Company Act of 1940, and various Minnesota laws. AEFC agreed to pay disgorgement of $10 million and civil money penalties of $7 million. AEFC also agreed to retain an independent distribution consultant to assist in developing a plan for distribution of all disgorgement and civil penalties ordered by the SEC in accordance with various undertakings detailed at http://www.sec.gov/litigation/admin/ia-2451.pdf. Ameriprise Financial and its affiliates have cooperated with the SEC and the MDOC in these legal proceedings, and have made regular reports to the Funds' Boards of Trustees.
Ameriprise Financial and certain of its affiliates have historically been involved in a number of legal, arbitration and regulatory proceedings, including routine litigation, class actions, and governmental actions, concerning matters arising in connection with the conduct of their business activities. Ameriprise Financial believes that the Funds are not currently the subject of, and that neither Ameriprise Financial nor any of its affiliates are the subject of, any pending legal, arbitration or regulatory proceedings that are likely to have a material adverse effect on the Funds or the ability of Ameriprise Financial or its affiliates to perform under their contracts with the Funds. Ameriprise Financial is required to make quarterly (10-Q), annual (10-K) and, as necessary,
Annual Report 2016
76
COLUMBIA TOTAL RETURN BOND FUND
NOTES TO FINANCIAL STATEMENTS (continued)
April 30, 2016
8-K filings with the SEC on legal and regulatory matters that relate to Ameriprise Financial and its affiliates. Copies of these filings may be obtained by accessing the SEC website at www.sec.gov.
There can be no assurance that these matters, or the adverse publicity associated with them, will not result in increased fund redemptions, reduced sale of fund shares or other adverse consequences to the Funds. Further, although we believe proceedings are not likely to have a material adverse effect on the Funds or the ability of Ameriprise Financial or its affiliates to perform under their contracts with the Funds, these proceedings are subject to uncertainties and, as such, we are unable to estimate the possible loss or range of loss that may result. An adverse outcome in one or more of these proceedings could result in adverse judgments, settlements, fines, penalties or other relief that could have a material adverse effect on the consolidated financial condition or results of operations of Ameriprise Financial.
Annual Report 2016
77
COLUMBIA TOTAL RETURN BOND FUND
REPORT OF INDEPENDENT REGISTERED PUBLIC ACCOUNTING FIRM
To the Trustees of Columbia Funds Series Trust I and the Shareholders of
Columbia Total Return Bond Fund (formerly known as Columbia Intermediate Bond Fund)
In our opinion, the accompanying statement of assets and liabilities, including the portfolio of investments, and the related statements of operations and of changes in net assets and the financial highlights present fairly, in all material respects, the financial position of Columbia Total Return Bond Fund (formerly known as Columbia Intermediate Bond Fund) (the "Fund", a series of Columbia Funds Series Trust I) at April 30, 2016, and the results of its operations, the changes in its net assets and the financial highlights for each of the periods indicated, in conformity with accounting principles generally accepted in the United States of America. These financial statements and financial highlights (hereafter referred to as "financial statements") are the responsibility of the Fund's management. Our responsibility is to express an opinion on these financial statements based on our audits. We conducted our audits of these financial statements in accordance with the standards of the Public Company Accounting Oversight Board (United States). Those standards require that we plan and perform the audit to obtain reasonable assurance about whether the financial statements are free of material misstatement. An audit includes examining, on a test basis, evidence supporting the amounts and disclosures in the financial statements, assessing the accounting principles used and significant estimates made by management, and evaluating the overall financial statement presentation. We believe that our audits, which included confirmation of securities at April 30, 2016 by correspondence with the custodian, brokers, agent banks and transfer agent, and the application of alternative auditing procedures where such confirmations had not been received, provide a reasonable basis for our opinion.
PricewaterhouseCoopers LLP
Minneapolis, MN
June 21, 2016
Annual Report 2016
78
COLUMBIA TOTAL RETURN BOND FUND
FEDERAL INCOME TAX INFORMATION
(Unaudited)
The Fund hereby designates the following tax attributes for the fiscal year ended April 30, 2016. Shareholders will be notified in early 2017 of the amounts for use in preparing 2016 income tax returns.
Tax Designations:
Capital Gain Dividend | | $ | 6,586,572 | | |
Capital Gain Dividend. The Fund designates as a capital gain dividend the amount reflected above, or if subsequently determined to be different, the net capital gain of such fiscal period.
Annual Report 2016
79
COLUMBIA TOTAL RETURN BOND FUND
Shareholders elect the Board that oversees the Fund's operations. The Board appoints officers who are responsible for day-to-day business decisions based on policies set by the Board. The following table provides basic biographical information about the Fund's Trustees, including their principal occupations during the past five years, although specific titles for individuals may have varied over the period. The year set forth beneath Length of Service in the table below is the year in which the Trustee was first appointed or elected as Trustee to any Fund currently in the Columbia Funds Complex or a predecessor thereof. Under current Board policy, members serve terms of indefinite duration.
Trustees
Independent Trustees
Name,
Address,
Year of Birth | | Position Held With
the Funds and Length of
Service | | Principal Occupation(s)
During the Past Five Years
and Other Relevant
Professional Experience | | Number of
Funds in the
Columbia Funds
Complex
Overseen | | Other Directorships
Held by Trustee During
the Past Five Years | |
Janet Langford Carrig
c/o Columbia
Management Investment Advisers, LLC,
225 Franklin Street
Mail Drop BX32 05228,
Boston, MA 02110
1957 | | Trustee 1996 | | Senior Vice President, General Counsel and Corporate Secretary, ConocoPhillips (integrated energy company) since September 2007 | | | 58 | | | None | |
Douglas A. Hacker
c/o Columbia Management Investment Advisers, LLC,
225 Franklin Street
Mail Drop BX32 05228,
Boston, MA 02110
1955 | | Trustee and Chairman of the Board 1996 | | Independent business executive since May 2006; Executive Vice President — Strategy of United Airlines from December 2002 to May 2006; President of UAL Loyalty Services (airline marketing company) from September 2001 to December 2002; Executive Vice President and Chief Financial Officer of United Airlines from July 1999 to September 2001 | | | 58 | | | Spartan Nash Company (food distributor); Nash Finch Company (food distributor) from 2005 to 2013; Aircastle Limited (aircraft leasing); SeaCube Container Leasing Ltd. (container leasing) from 2010 to 2013; and Travelport Worldwide Limited (travel information technology) | |
Nancy T. Lukitsh
c/o Columbia Management Investment Advisers, LLC,
225 Franklin Street
Mail Drop BX32 05228,
Boston, MA 02110
1956 | | Trustee 2011 | | Senior Vice President, Partner and Director of Marketing, Wellington Management Company, LLP (investment adviser) from 1997 to 2010; Chair, Wellington Management Portfolios (commingled non-U.S. investment pools) from 2007 to 2010; Director, Wellington Trust Company, NA and other Wellington affiliates from 1997 to 2010 | | | 58 | | | None | |
Annual Report 2016
80
COLUMBIA TOTAL RETURN BOND FUND
TRUSTEES AND OFFICERS (continued)
Independent Trustees (continued)
Name,
Address,
Year of Birth | | Position Held With
the Funds and Length of
Service | | Principal Occupation(s)
During the Past Five Years
and Other Relevant
Professional Experience | | Number of
Funds in the
Columbia Funds
Complex
Overseen | | Other Directorships
Held by Trustee During
the Past Five Years | |
William E. Mayer
c/o Columbia Management Investment Advisers, LLC,
225 Franklin Street
Mail Drop BX32 05228,
Boston, MA 02110
1940 | | Trustee 1991 | | Partner, Park Avenue Equity Partners (private equity) since February 1999 | | | 58 | | | DynaVox Inc. (speech creation); Lee Enterprises (print media); WR Hambrecht + Co. (financial service provider) from 2000 to 2012; BlackRock Capital Investment Corporation (investment company); and Premier, Inc. (healthcare) | |
David M. Moffett
c/o Columbia Management Investment Advisers, LLC,
225 Franklin Street
Mail Drop BX32 05228,
Boston, MA 02110
1952 | | Trustee 2011 | | Retired. Consultant to Bridgewater and Associates | | | 58 | | | Director of CIT Bank, CIT Group Inc. (commercial and consumer finance); eBay Inc. (online trading community); Genworth Financial, Inc. (financial and insurance products and services); Paypal Holdings Inc. (payment and data processing services); and Trustee University of Oklahoma Foundation | |
Charles R. Nelson
c/o Columbia Management Investment Advisers, LLC,
225 Franklin Street
Mail Drop BX32 05228,
Boston, MA 02110
1942 | | Trustee 1981 | | Retired. Professor Emeritus, University of Washington since 2011; Professor of Economics, University of Washington from 1976 to 2011; Ford and Louisa Van Voorhis Professor of Political Economy, University of Washington from 1993 to 2011; Adjunct Professor of Statistics, University of Washington from 1980 to 2011; Associate Editor, Journal of Money, Credit and Banking from September 1993 to 2008; consultant on econometric and statistical matters | | | 58 | | | None | |
John J. Neuhauser
c/o Columbia Management Investment Advisers, LLC,
225 Franklin Street
Mail Drop BX32 05228,
Boston, MA 02110
1943 | | Trustee 1984 | | President, Saint Michael's College since August 2007; Director or Trustee of several non-profit organizations, including University of Vermont Medical Center; Academic Vice President and Dean of Faculties, Boston College from August 1999 to October 2005; University Professor, Boston College from November 2005 to August 2007 | | | 58 | | | Liberty All-Star Equity Fund and Liberty All-Star Growth Fund (closed-end funds) | |
Annual Report 2016
81
COLUMBIA TOTAL RETURN BOND FUND
TRUSTEES AND OFFICERS (continued)
Independent Trustees (continued)
Name,
Address,
Year of Birth | | Position Held With
the Funds and Length of
Service | | Principal Occupation(s)
During the Past Five Years
and Other Relevant
Professional Experience | | Number of
Funds in the
Columbia Funds
Complex
Overseen | | Other Directorships
Held by Trustee During
the Past Five Years | |
Patrick J. Simpson
c/o Columbia Management Investment Advisers, LLC,
225 Franklin Street
Mail Drop BX32 05228,
Boston, MA 02110
1944 | | Trustee 2000 | | Of Counsel, Perkins Coie LLP (law firm) since 2015; Partner, Perkins Coie LLP from 1988 to 2014 | | | 58 | | | None | |
Anne-Lee Verville
c/o Columbia Management Investment Advisers, LLC,
225 Franklin Street
Mail Drop BX32 05228,
Boston, MA 02110
1945 | | Trustee 1998 | | Retired. General Manager, Global Education Industry from 1994 to 1997, President — Application Systems Division from 1991 to 1994, Chief Financial Officer — US Marketing & Services from 1988 to 1991, and Chief Information Officer from 1987 to 1988, IBM Corporation (computer and technology) | | | 58 | | | Enesco Group, Inc. (producer of giftware and home and garden decor products) from 2001 to 2006 | |
Annual Report 2016
82
COLUMBIA TOTAL RETURN BOND FUND
TRUSTEES AND OFFICERS (continued)
Interested Trustee Affiliated with Investment Manager*
Name,
Address,
Year of Birth | | Position Held With
the Funds and Length of
Service | | Principal Occupation(s)
During the Past Five Years
and Other Relevant
Professional Experience | | Number of
Funds in the
Columbia Funds
Complex
Overseen | | Other Directorships
Held by Trustee During
the Past Five Years | |
William F. Truscott
c/o Columbia Management Investment Advisers, LLC,
225 Franklin Street
Boston, MA 02110
1960 | | Trustee 2012 | | Chairman of the Board and President, Columbia Management Investment Advisers, LLC since May 2010 and February 2012, respectively (previously President and Chief Investment Officer, 2001-April 2010); Chief Executive Officer, Global Asset Management, Ameriprise Financial, Inc. since September 2012 (previously Chief Executive Officer, U.S. Asset Management & President, Annuities, May 2010- September 2012 and President — U.S. Asset Management and Chief Investment Officer, 2005-April 2010); Director and Chief Executive Officer, Columbia Management Investment Distributors, Inc. since May 2010 and February 2012, respectively (previously Chairman of the Board and Chief Executive Officer, 2006-April 2010); Chairman of the Board and Chief Executive Officer, RiverSource Distributors, Inc. since 2006; Director, Threadneedle Asset Management Holdings, SARL since 2014; President and Chief Executive Officer, Ameriprise Certificate Company, 2006-August 2012. | | | 178 | | | Chairman of the Board, Columbia Management Investment Advisers, LLC since May 2010; Director, Columbia Management Investment Distributors, Inc. since May 2010; Former Director, Ameriprise Certificate Company, 2006-January 2013 | |
* Interested person (as defined under the 1940 Act) by reason of being an officer, director, security holder and/or employee of the Investment Manager or Ameriprise Financial.
The Statement of Additional Information has additional information about the Fund's Board members and is available, without charge, upon request by calling 800.345.6611; contacting your financial intermediary; or visiting columbiathreadneedle.com/us.
Annual Report 2016
83
COLUMBIA TOTAL RETURN BOND FUND
TRUSTEES AND OFFICERS (continued)
The Board has appointed officers who are responsible for day-to-day business decisions based on policies it has established. The officers serve at the pleasure of the Board. The following table provides basic information about the Officers of the Fund, including principal occupations during the past five years, although their specific titles may have varied over the period. In addition to Mr. Truscott, who is Senior Vice President, the Fund's other officers are:
Fund Officers
Name,
Address and
Year of Birth | | Position and Year
First Appointed to
Position for any Fund
in the Columbia
Funds Complex or a
Predecessor Thereof | |
Principal Occupation(s) During Past Five Years | |
Christopher O. Petersen
5228 Ameriprise Financial Center
Minneapolis, MN 55474
Born 1970 | | President and Principal Executive Officer (2015) | | Vice President and Lead Chief Counsel, Ameriprise Financial, Inc. since January 2015 (previously, Vice President and Chief Counsel January 2010-December 2014; and Vice President and Group Counsel or Counsel 2004-January 2010); officer of Columbia Funds and affiliated funds since 2007. | |
Michael G. Clarke
225 Franklin Street
Boston, MA 02110
Born 1969 | | Treasurer (2011), Chief Financial Officer (2009) and Chief Accounting Officer (2015) | | Vice President — Mutual Fund Administration, Columbia Management Investment Advisers, LLC, since May 2010; Managing Director of Fund Administration, Columbia Management Advisors, LLC, September 2004-April 2010; senior officer of Columbia Funds and affiliated funds since 2002. | |
Paul B. Goucher
100 Park Avenue
New York, NY 10017
Born 1968 | | Senior Vice President (2011), Chief Legal Officer (2015) and Assistant Secretary (2008) | | Vice President and Lead Chief Counsel, Ameriprise Financial, Inc. since November 2008 and January 2013, respectively (previously Chief Counsel, January 2010-January 2013 and Group Counsel, November 2008-January 2010). | |
Thomas P. McGuire
225 Franklin Street
Boston, MA 02110
Born 1972 | | Senior Vice President and Chief Compliance Officer (2012) | | Vice President — Asset Management Compliance, Ameriprise Financial, Inc., since May 2010; Chief Compliance Officer, Ameriprise Certificate Company since September 2010; Compliance Executive, Bank of America, 2005-April 2010. | |
Colin Moore
225 Franklin Street
Boston, MA 02110
Born 1958 | | Senior Vice President (2010) | | Executive Vice President and Global Chief Investment Officer, Ameriprise Financial, Inc., since July 2013; Director and Global Chief Investment Officer, Columbia Management Investment Advisers, LLC since May 2010; Manager, Managing Director and Chief Investment Officer, Columbia Management Advisors, LLC, 2007-April 2010. | |
Michael E. DeFao
225 Franklin Street
Boston, MA 02110
Born 1968 | | Vice President (2011) and Assistant Secretary (2010) | | Vice President and Chief Counsel, Ameriprise Financial, Inc. since May 2010; Associate General Counsel, Bank of America, 2005-April 2010. | |
Amy Johnson
5228 Ameriprise Financial Center
Minneapolis, MN 55474
Born 1965 | | Vice President (2006) | | Managing Director and Chief Operating Officer, Columbia Management Investment Advisers, LLC since May 2010 (previously Chief Administrative Officer, 2009-April 2010, and Vice President — Asset Management and Trust Company Services, 2006-2009). | |
Lyn Kephart-Strong
5228 Ameriprise
Financial Center
Minneapolis, MN 55474
Born 1960 | | Vice President (2015) | | President, Columbia Management Investment Services Corp. since October 2014; Vice President & Resolution Officer, Ameriprise Trust Company since August 2009; President, RiverSource Service Corporation 2004-2010. | |
Ryan C. Larrenaga
225 Franklin Street
Boston, MA 02110
Born 1970 | | Vice President and Secretary (2015) | | Vice President and Group Counsel, Ameriprise Financial, Inc. since August 2011 (previously, Counsel from May 2010 to August 2011); Assistant General Counsel, Bank of America, 2005-April 2010; officer of Columbia Funds and affiliated funds since 2005. | |
Annual Report 2016
84
COLUMBIA TOTAL RETURN BOND FUND
IMPORTANT INFORMATION ABOUT THIS REPORT
Each fund mails one shareholder report to each shareholder address. If you would like more than one report, please call shareholder services at 800.345.6611 and additional reports will be sent to you.
The policy of the Board is to vote the proxies of the companies in which each fund holds investments consistent with the procedures as stated in the Statement of Additional Information (SAI). You may obtain a copy of the SAI without charge by calling 800.345.6611; contacting your financial intermediary; visiting columbiathreadneedle.com/us; or searching the website of the Securities and Exchange Commission (SEC) at sec.gov. Information regarding how each fund voted proxies relating to portfolio securities is filed with the SEC by August 31st for the most recent 12-month period ending June 30th of that year, and is available without charge by visiting columbiathreadneedle.com/us, or searching the website of the SEC at sec.gov.
Each fund files a complete schedule of portfolio holdings with the SEC for the first and third quarters of each fiscal year on Form N-Q. Each fund's Form N-Q is available on the SEC's website at sec.gov and may be reviewed and copied at the SEC's Public Reference Room in Washington, D.C. Information on the operation of the Public Reference Room may be obtained by calling 800.SEC.0330. Each fund's complete schedule of portfolio holdings, as filed on Form N-Q, can also be obtained without charge, upon request, by calling 800.345.6611.
Annual Report 2016
85
Columbia Total Return Bond Fund
P.O. Box 8081
Boston, MA 02266-8081

This information is for use with concurrent or prior delivery of a fund prospectus. Please read and consider the investment objectives, risks, charges and expenses for any fund carefully before investing. For a prospectus and summary prospectus, which contains this and other important information about the Fund, go to columbiathreadneedle.com/us. The Fund is distributed by Columbia Management Investment Distributors, Inc., member FINRA, and managed by Columbia Management Investment Advisers, LLC.
Columbia Threadneedle Investments (Columbia Threadneedle) is the global brand name of the Columbia and Threadneedle group of companies.
All rights reserved. Columbia Management Investment Distributors, Inc., 225 Franklin Street, Boston, MA 02110-2804
© 2016 Columbia Management Investment Advisers, LLC.
columbiathreadneedle.com/us
ANN166_04_F01_(06/16)

ANNUAL REPORT
April 30, 2016

COLUMBIA U.S. TREASURY INDEX FUND

 Dear Shareholders,
Volatility comes with the territory for long-term investors. Some investors instinctively want to pull out of the market or sell underperforming investments at the first sign of increased volatility or perhaps even as soon as they perceive it on the horizon. But taking yourself out of the market could mean losing out on potential opportunities, and putting your longer-term investment goals at risk.
Cumulative return is not just about achieving high returns when markets are going up; it's also about remaining invested and minimizing losses during weak or volatile markets so that you can participate on the upside. Developing a deeper understanding of the various risks your portfolio is subject to can help you balance these risks.
Diversification is critical in seeking to achieve that balance. We believe that most portfolios could be more effectively diversified either by introducing holdings with performance profiles unrelated to existing holdings (like alternative products) or by rebalancing existing holdings with an eye toward risk allocation. Over time, distributing risk more evenly may produce a more pronounced diversification benefit and may improve portfolio efficiency. We believe market volatility can create significant opportunities and, in fact, these periods may be some of the very best times to invest.
With this in mind, I thought it important to highlight excerpts from a piece written by Colin Moore, Global Chief Investment Officer, in which he touches on some of these issues emphasizing the importance of a properly constructed portfolio in seeking to effectively manage volatility and to achieve consistency of returns. I encourage you to read the article in its entirety. To access the full article and for other insights on current market, please visit blog.columbiathreadneedleus.com/latest-perspectives.
You need investments that are designed to help you ease the impact of volatile market environments and keep the savings you have worked tirelessly to amass. Columbia Threadneedle Investments provides investment solutions to help you tackle financial challenges and achieve your desired outcome.
Best regards,

Christopher O. Petersen
President, Columbia Funds
Excerpts from:
Taking the scare out of the volatility bogeyman
By Colin Moore, Global Chief Investment Officer
Colin Moore is the global chief investment officer for Columbia Threadneedle Investments. His responsibilities include ensuring that a disciplined investment process is in place across all asset classes, including equity and fixed income. Mr. Moore joined one of the Columbia Threadneedle Investments legacy firms in 2002 as head of equity and was also head of fixed income and liquidity strategies from 2009 – 2010.

n In today's low growth, higher volatility world, the emphasis is shifting from maximization of returns to consistency of returns.
PRESIDENT'S MESSAGE (continued)
n Portfolios should represent the behavioral risk-return tradeoff of investors, remembering that they won't stay invested to realize the return if we get the risk tolerance wrong.
n Holding long-term savings in cash to avoid volatility (the financial equivalent of hiding under the sheets) is detrimental to achieving long-term goals.
According to Wikipedia, "The bogeyman is a common allusion to a mythical creature in many cultures used to control behavior. This monster has no specific appearance, and conceptions about it can vary drastically from household to household within the same community; in many cases he has no set appearance in the mind of an adult or child, but is simply a non-specific embodiment of terror." Different cultures have different names and physical representations for the bogeyman, and investors are no different. We have terrible monsters that we fear may destroy our portfolios, and we call one of the scariest of them volatility.
While the bogeyman is mythical (I hope!), volatility is real and can cause serious damage. To understand why investors have such a hard time coping with volatility, we first need to define three cognitive biases at work in today's investment environment:
1) Recency bias — something that has recently come to the forefront of our attention, regardless of how long established it is, suddenly seems to appear with improbable frequency.
2) Negativity bias — we tend to have a greater recall of unpleasant memories than positive memories.
3) Loss aversion — our dissatisfaction with losing money tends to be greater than our satisfaction with making money.
The level of volatility varies dramatically, and so does investor fear and panic selling — waxing when volatility rises, waning when it falls. Recent studies have pointed to demographics as an important driver of panic selling. The theory is that as people get closer to retirement, the prospects of a large (20% – 30%) loss in financial assets can have a much more pronounced effect on their sense of well-being. Wealth preservation instincts kick in much more quickly than for younger (and typically less wealthy) savers.
The reality is that there is little opportunity for return without volatility. Therefore, the bogeyman effect of holding long-term savings in cash to avoid volatility (the financial equivalent of hiding under the sheets) is detrimental to achieving long-term goals. This effect tends to be more pronounced during the episodic spikes in volatility. The significant spike in volatility in 2008 and 2009 led to significant withdrawals from long-term investment funds over the same period. Less pronounced effects can also be seen when comparing 2001 – 2003 and 2011 – 2012. Conversely, flows picked up when volatility returned to "normal" levels. Investor behavior of this type is consistent with the three behavioral biases.
I believe average volatility will be higher over the next 10 years than the last 10 years and episodic spikes will increase in frequency because sustainable economic growth will be structurally lower and geopolitical risk higher than any time since World War II. Low growth creates uncertainty while loss aversion will make investors fear that we are one economic mishap or geopolitical event away from no growth or recession. The result will be higher volatility on average. Negativity bias will tend to exacerbate "spike" reactions to event-driven geopolitical news, and the volatility bogeyman will appear more often. Assuming the behavioral biases continue, investor returns are likely to be very disappointing regardless of the total return generated by financial markets due to the bogeyman effect.
To mitigate this effect, we need to focus on portfolio construction and an improved understanding of diversification. I accept that equities are likely to offer the highest return over the next 10 years, but they also offer the highest volatility. Many portfolio construction optimization tools use historical average volatility, which is likely to underestimate the volatility investors will face. The bogeyman emerges when individual asset class volatility spikes and cross correlations rise, the combination of which increases overall portfolio volatility far beyond expectation. Diversification is meant to protect investors against volatility, but what's the point of owning lots of investments if the volatility bogeyman has not been properly estimated?
Most importantly, portfolios should be constructed to properly represent the behavioral risk-return tradeoff of investors, remembering that they won't stay invested to realize the return if we get the risk tolerance wrong. In a low growth, higher volatility world, the emphasis is shifting to return consistency rather than return maximization,
PRESIDENT'S MESSAGE (continued)
and investors are best served through investment approaches that appreciate that distinction. Even though it's a permanent feature of financial markets, volatility is less likely to be the bogeyman we all fear if portfolios are constructed with this understanding.
Please visit blog.columbiathreadneedleus.com/latest-perspectives to read the entire article.
Investors should consider the investment objectives, risks, charges and expenses of a mutual fund carefully before investing. For a free prospectus and summary prospectus, which contains this and other important information about a fund, visit columbiathreadneedle.com/us. The prospectus should be read carefully before investing.
The views expressed are as of April 2016, may change as market or other conditions change, and may differ from views expressed by other Columbia Management Investment Advisers, LLC (CMIA) associates or affiliates. Actual investments or investment decisions made by CMIA and its affiliates, whether for its own account or on behalf of clients, will not necessarily reflect the views expressed. This information is not intended to provide investment advice and does not account for individual investor circumstances. Investment decisions should always be made based on an investor's specific financial needs, objectives, goals, time horizon and risk tolerance. Asset classes described may not be suitable for all investors.
Past performance does not guarantee future results, and no forecast should be considered a guarantee either. Since economic and market conditions change frequently, there can be no assurance that the trends described here will continue or that the forecasts are accurate.
Diversification does not guarantee a profit or protect against loss.
Columbia Funds are distributed by Columbia Management Investment Distributors, Inc., member FINRA, and managed by Columbia Management Investment Advisers, LLC.
© 2016 Columbia Management Investment Advisers, LLC. All rights reserved
COLUMBIA U.S. TREASURY INDEX FUND
Performance Overview | | | 2 | | |
Manager Discussion of Fund Performance | | | 4 | | |
Understanding Your Fund's Expenses | | | 6 | | |
Portfolio of Investments | | | 7 | | |
Statement of Assets and Liabilities | | | 10 | | |
Statement of Operations | | | 12 | | |
Statement of Changes in Net Assets | | | 13 | | |
Financial Highlights | | | 15 | | |
Notes to Financial Statements | | | 22 | | |
Report of Independent Registered Public Accounting Firm | | | 28 | | |
Federal Income Tax Information | | | 29 | | |
Trustees and Officers | | | 30 | | |
Important Information About This Report | | | 35 | | |
Fund Investment Manager
Columbia Management Investment
Advisers, LLC
225 Franklin Street
Boston, MA 02110
Fund Distributor
Columbia Management Investment
Distributors, Inc.
225 Franklin Street
Boston, MA 02110
Fund Transfer Agent
Columbia Management Investment
Services Corp.
P.O. Box 8081
Boston, MA 02266-8081
For more information about any of the funds, please visit columbiathreadneedle.com/us or call 800.345.6611. Customer Service Representatives are available to answer your questions Monday through Friday from 8 a.m. to 7 p.m. Eastern time.
The views expressed in this report reflect the current views of the respective parties. These views are not guarantees of future performance and involve certain risks, uncertainties and assumptions that are difficult to predict, so actual outcomes and results may differ significantly from the views expressed. These views are subject to change at any time based upon economic, market or other conditions and the respective parties disclaim any responsibility to update such views. These views may not be relied on as investment advice and, because investment decisions for a Columbia fund are based on numerous factors, may not be relied on as an indication of trading intent on behalf of any particular Columbia fund. References to specific securities should not be construed as a recommendation or investment advice.
COLUMBIA U.S. TREASURY INDEX FUND
Performance Summary
n Columbia U.S. Treasury Index Fund (the Fund) Class A shares returned 2.38% excluding sales charges for the 12-month period that ended April 30, 2016.
n The Fund underperformed its benchmark, the Citi Bond U.S. Treasury Index, which returned 2.77% over the same period.
n The Fund generally tracked the benchmark in a period that was for the most part favorable for U.S. Treasury securities. Fees, which the Fund incurs but the benchmark does not, generally accounted for the slight difference in returns.
Average Annual Total Returns (%) (for period ended April 30, 2016)
| | | Inception | | 1 Year | | 5 Years | | 10 Years | |
Class A | | 11/25/02 | | | 2.38 | | | | 2.85 | | | | 4.22 | | |
Class B | | 11/25/02 | | | | | | | | | | | | | |
Excluding sales charges | | | | | | | 1.62 | | | | 2.08 | | | | 3.44 | | |
Including sales charges | | | | | | | -3.38 | | | | 1.71 | | | | 3.44 | | |
Class C | | 11/25/02 | | | | | | | | | | | | | |
Excluding sales charges | | | | | | | 1.67 | | | | 2.20 | | | | 3.58 | | |
Including sales charges | | | | | | | 0.67 | | | | 2.20 | | | | 3.58 | | |
Class I* | | 09/27/10 | | | 2.54 | | | | 3.07 | | | | 4.46 | | |
Class R5* | | 11/08/12 | | | 2.54 | | | | 3.07 | | | | 4.45 | | |
Class W* | | 06/18/12 | | | 2.28 | | | | 2.75 | | | | 4.05 | | |
Class Z | | 06/04/91 | | | 2.54 | | | | 3.07 | | | | 4.46 | | |
Citi Bond U.S. Treasury Index | | | | | | | 2.77 | | | | 3.27 | | | | 4.63 | | |
Returns for Class B are shown with and without the applicable contingent deferred sales charge (CDSC) of 5.00% in the first year, declining to 1.00% in the sixth year and eliminated thereafter. Returns for Class C are shown with and without the 1.00% CDSC for the first year only. The Fund's other classes are not subject to sales charges and have limited eligibility. Please see the Fund's prospectus for details. Performance for different share classes will vary based on differences in sales charges and fees associated with each class. All results shown assume reinvestment of distributions during the period. Returns do not reflect the deduction of taxes that a shareholder may pay on Fund distributions or on the redemption of Fund shares. Performance results reflect the effect of any fee waivers or reimbursements of Fund expenses by Columbia Management Investment Advisers, LLC and/or any of its affiliates. Absent these fee waivers or expense reimbursement arrangements, performance results would have been lower.
The performance information shown represents past performance and is not a guarantee of future results. The investment return and principal value of your investment will fluctuate so that your shares, when redeemed, may be worth more or less than their original cost. Current performance may be lower or higher than the performance information shown. You may obtain performance information current to the most recent month-end by contacting your financial intermediary, visiting columbiathreadneedle.com/us or calling 800.345.6611.
*The returns shown for periods prior to the share class inception date (including returns for the Life of the Fund, if shown, which are since Fund inception) include the returns of the Fund's oldest share class. These returns are adjusted to reflect any higher class-related operating expenses of the newer share classes, as applicable. Please visit columbiathreadneedle.com/us/investment-products/mutual-funds/appended-performance for more information.
The Citi Bond U.S. Treasury Index is an index composed of all U.S. Treasury notes and bonds with remaining maturities of at least one year and outstanding principal of at least $25 million that are included in the Citi Broad Investment-Grade Bond Index.
Indices are not available for investment, are not professionally managed and do not reflect sales charges, fees, brokerage commissions, taxes or other expenses of investing. Securities in the Fund may not match those in an index.
Annual Report 2016
2
COLUMBIA U.S. TREASURY INDEX FUND
PERFORMANCE OVERVIEW (continued)
Performance of a Hypothetical $10,000 Investment (May 1, 2006 – April 30, 2016)
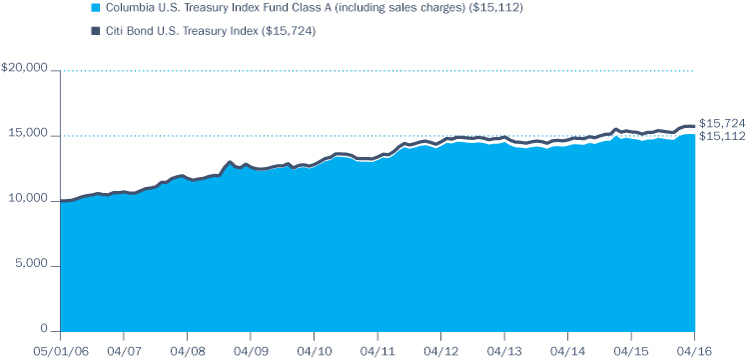
The chart above shows the change in value of a hypothetical $10,000 investment in Class A shares of Columbia U.S. Treasury Index Fund during the stated time period, and does not reflect the deduction of taxes that a shareholder may pay on Fund distributions or on the redemption of Fund shares.
Annual Report 2016
3
COLUMBIA U.S. TREASURY INDEX FUND
MANAGER DISCUSSION OF FUND PERFORMANCE
Portfolio Management
Orhan Imer, Ph.D., CFA
William Finan
Portfolio Breakdown (%)
(at April 30, 2016) | |
Money Market Funds | | | 0.2 | | |
U.S. Treasury Obligations | | | 99.8 | | |
Total | | | 100.0 | | |
Percentages indicated are based upon total investments. The Fund's portfolio composition is subject to change.
Quality Breakdown (%)
(at April 30, 2016) | |
AAA rating | | | 100.0 | | |
Total | | | 100.0 | | |
Percentages indicated are based upon total fixed income investments (excluding Money Market Funds).
Bond ratings apply to the underlying holdings of the Fund and not the Fund itself and are divided into categories ranging from highest to lowest credit quality, determined by using the middle rating of Moody's, S&P and Fitch, after dropping the highest and lowest available ratings. When ratings are available from only two rating agencies, the lower rating is used. When a rating is available from only one rating agency, that rating is used. When a bond is not rated by any rating agency, it is designated as "Not rated." Credit quality ratings assigned by a rating agency are subjective opinions, not statements of fact, and are subject to change, including daily. The ratings assigned by credit rating agencies are but one of the considerations that the Investment Manager and/or Fund's subadviser incorporates into its credit analysis process, along with such other issuer-specific factors as cash flows, capital structure and leverage ratios, ability to de-leverage (repay) through free cash flow, quality of management, market positioning and access to capital, as well as such security-specific factors as the terms of the security (e.g., interest rate and time to maturity) and the amount and type of any collateral.
At April 30, 2016, approximately 40.6% of the Fund's shares were owned in the aggregate by affiliated funds-of-funds managed by Columbia Management Investment Advisers, LLC (the Investment Manager). As a result of asset allocation decisions by the Investment Manager, it is possible that the Fund may experience relatively large purchases or redemptions from affiliated funds-of-funds. The Investment Manager seeks to minimize the impact of these transactions by structuring them over a reasonable period of time. The Fund may experience increased expenses as it buys and sells securities as a result of purchases or redemptions by affiliated funds-of-funds.
For the 12-month period that ended April 30, 2016, the Fund's Class A shares returned 2.38% excluding sales charges. The Citi Bond U.S. Treasury Index returned 2.77% over the same period. The Fund generally tracked the benchmark in a period that was for the most part favorable for U.S. Treasury securities. Fees, which the Fund incurs but the benchmark does not, generally accounted for the slight difference in returns.
A Period of Generally Positive Treasury Performance
During the 12-month period, the much-anticipated "normalization" of U.S. interest rate policy by the Federal Reserve (Fed) finally got underway. On December 16, the Fed raised rates by 25 basis points after a prolonged delay due to uncertainty over global economic performance and low U.S. inflation. Anticipating and then responding to the rate hike, Treasuries posted positive performance over the period as the yield curve (a chart of Treasury yields from short- to long-term) flattened significantly. Longer term yields declined and short-term yields rose. For example, 10-year Treasury yields declined from 2.12% to 1.83%, while two-year Treasury yields rose from 0.60% to 0.77% over the 12-month period. Elsewhere, five-year Treasury yields declined from 1.50% to 1.28%, and 30-year Treasuries fell from 2.82% to 2.66%%.
Several factors influenced the flattening of the Treasury yield curve and the overall positive performance of Treasury securities. U.S. economic growth remained steady, if unspectacular. Domestic employment continued to improve, with the unemployment rate receding from 5.4% at the start of the period to approximately 5% as of April 30, 2016. At the same time, there was a slight pickup in the rate of inflation from near zero to approximately 1% over the period, though inflation remained below the Fed's target of 2%. In early 2016, the low level of U.S. inflation, along with continual worries over receding global growth and low commodity prices, convinced the Fed to lower its forecast regarding the number of short-term rate increases that would take place during 2016.
Even as the Fed began a slight tightening of its monetary policy, central banks elsewhere in the world continued to pursue an aggressive strategy of policy accommodation, as the European Central Bank and the Bank of Japan resorted to negative short-term interest rates and high-volume asset purchases in seeking to jumpstart their respective economies. As long-term European rates retreated, investors continued to be attracted to U.S. Treasury yields, which helped longer term Treasuries to rally.
Annual Report 2016
4
COLUMBIA U.S. TREASURY INDEX FUND
MANAGER DISCUSSION OF FUND PERFORMANCE (continued)
Meanwhile, crude oil prices finally stabilized, after they had plummeted dramatically at times since the summer of 2014. Renewed firmness in the price of oil and other commodities meant that the U.S. economy registered some inflation, but not enough to trigger a rapid pace in the tightening of the Fed's monetary policy.
Investment Risks
Market risk may affect a single issuer, sector of the economy, industry or the market as a whole. The U.S. government may be unable or unwilling to honor its financial obligations. Securities issued or guaranteed by federal agencies and U.S. government-sponsored instrumentalities may or may not be backed by the full faith and credit of the U.S. government. A rise in interest rates may result in a price decline of fixed-income instruments held by the Fund, negatively impacting its performance and NAV. Falling rates may result in the Fund investing in lower yielding debt instruments, lowering the Fund's income and yield. These risks may be heightened for longer maturity and duration securities. The Fund's net value will generally decline when the performance of its targeted index declines. See the Fund's prospectus for more information on these and other risks.
Annual Report 2016
5
COLUMBIA U.S. TREASURY INDEX FUND
UNDERSTANDING YOUR FUND'S EXPENSES
(Unaudited)
As an investor, you incur two types of costs. There are transaction costs, which generally include sales charges on purchases and may include redemption fees. There are also ongoing costs, which generally include management fees, distribution and/or service fees, and other fund expenses. The following information is intended to help you understand your ongoing costs (in dollars) of investing in the Fund and to help you compare these costs with the ongoing costs of investing in other mutual funds.
Analyzing Your Fund's Expenses
To illustrate these ongoing costs, we have provided examples and calculated the expenses paid by investors in each share class of the Fund during the period. The actual and hypothetical information in the table is based on an initial investment of $1,000 at the beginning of the period indicated and held for the entire period. Expense information is calculated two ways and each method provides you with different information. The amount listed in the "Actual" column is calculated using the Fund's actual operating expenses and total return for the period. You may use the Actual information, together with the amount invested, to estimate the expenses that you paid over the period. Simply divide your account value by $1,000 (for example, an $8,600 account value divided by $1,000 = 8.6), then multiply the results by the expenses paid during the period under the "Actual" column. The amount listed in the "Hypothetical" column assumes a 5% annual rate of return before expenses (which is not the Fund's actual return) and then applies the Fund's actual expense ratio for the period to the hypothetical return. You should not use the hypothetical account values and expenses to estimate either your actual account balance at the end of the period or the expenses you paid during the period. See "Compare With Other Funds" below for details on how to use the hypothetical data.
Compare With Other Funds
Since all mutual funds are required to include the same hypothetical calculations about expenses in shareholder reports, you can use this information to compare the ongoing cost of investing in the Fund with other funds. To do so, compare the hypothetical example with the 5% hypothetical examples that appear in the shareholder reports of other funds. As you compare hypothetical examples of other funds, it is important to note that hypothetical examples are meant to highlight the ongoing costs of investing in a fund only and do not reflect any transaction costs, such as sales charges, or redemption or exchange fees. Therefore, the hypothetical calculations are useful in comparing ongoing costs only, and will not help you determine the relative total costs of owning different funds. If transaction costs were included in these calculations, your costs would be higher.
November 1, 2015 – April 30, 2016
| | | Account Value at the Beginning
of the Period ($) | | Account Value at the End of the
Period ($) | | Expenses Paid During the
Period ($) | | Fund's Annualized
Expense Ratio (%) | |
| | | Actual | | Hypothetical | | Actual | | Hypothetical | | Actual | | Hypothetical | | Actual | |
Class A | | | 1,000.00 | | | | 1,000.00 | | | | 1,022.70 | | | | 1,023.12 | | | | 1.76 | | | | 1.76 | | | | 0.35 | | |
Class B | | | 1,000.00 | | | | 1,000.00 | | | | 1,018.90 | | | | 1,019.39 | | | | 5.52 | | | | 5.52 | | | | 1.10 | | |
Class C | | | 1,000.00 | | | | 1,000.00 | | | | 1,019.20 | | | | 1,019.64 | | | | 5.27 | | | | 5.27 | | | | 1.05 | | |
Class I | | | 1,000.00 | | | | 1,000.00 | | | | 1,023.50 | | | | 1,023.87 | | | | 1.01 | | | | 1.01 | | | | 0.20 | | |
Class R5 | | | 1,000.00 | | | | 1,000.00 | | | | 1,023.50 | | | | 1,023.87 | | | | 1.01 | | | | 1.01 | | | | 0.20 | | |
Class W | | | 1,000.00 | | | | 1,000.00 | | | | 1,022.20 | | | | 1,022.63 | | | | 2.26 | | | | 2.26 | | | | 0.45 | | |
Class Z | | | 1,000.00 | | | | 1,000.00 | | | | 1,023.50 | | | | 1,023.87 | | | | 1.01 | | | | 1.01 | | | | 0.20 | | |
Expenses paid during the period are equal to the annualized expense ratio for each class as indicated above, multiplied by the average account value over the period and then multiplied by the number of days in the Fund's most recent fiscal half year and divided by 366.
Expenses do not include fees and expenses incurred indirectly by the Fund from its investment in underlying funds, including affiliated and non-affiliated pooled investment vehicles, such as mutual funds and exchange-traded funds.
Had Columbia Management Investment Advisers, LLC and/or certain of its affiliates not waived/reimbursed certain fees and expenses, account value at the end of the period would have been reduced.
Annual Report 2016
6
COLUMBIA U.S. TREASURY INDEX FUND
PORTFOLIO OF INVESTMENTS
April 30, 2016
(Percentages represent value of investments compared to net assets)
U.S. Treasury Obligations 99.2%
Issuer | | Coupon
Rate | | Principal
Amount ($) | | Value ($) | |
U.S. Treasury | |
04/30/17 | | | 0.500 | % | | | 5,000,000 | | | | 4,994,531 | | |
06/15/17 | | | 0.875 | % | | | 13,700,000 | | | | 13,736,391 | | |
06/30/17 | | | 0.625 | % | | | 8,585,000 | | | | 8,583,659 | | |
06/30/17 | | | 0.750 | % | | | 11,385,000 | | | | 11,397,899 | | |
06/30/17 | | | 2.500 | % | | | 4,110,000 | | | | 4,196,536 | | |
07/15/17 | | | 0.875 | % | | | 12,175,000 | | | | 12,206,862 | | |
07/31/17 | | | 0.625 | % | | | 15,000,000 | | | | 14,995,312 | | |
07/31/17 | | | 2.375 | % | | | 12,800,000 | | | | 13,070,003 | | |
08/15/17 | | | 0.875 | % | | | 2,145,000 | | | | 2,150,698 | | |
11/30/17 | | | 0.875 | % | | | 5,020,000 | | | | 5,032,550 | | |
12/31/17 | | | 0.750 | % | | | 15,000,000 | | | | 15,001,755 | | |
01/31/18 | | | 0.750 | % | | | 3,590,000 | | | | 3,590,000 | | |
02/15/18 | | | 1.000 | % | | | 6,055,000 | | | | 6,080,545 | | |
02/15/18 | | | 3.500 | % | | | 13,150,000 | | | | 13,790,037 | | |
04/15/18 | | | 0.750 | % | | | 15,000,000 | | | | 14,990,625 | | |
05/15/18 | | | 1.000 | % | | | 11,460,000 | | | | 11,505,656 | | |
05/15/18 | | | 3.875 | % | | | 3,330,000 | | | | 3,541,249 | | |
06/30/18 | | | 2.375 | % | | | 5,000,000 | | | | 5,167,970 | | |
07/15/18 | | | 0.875 | % | | | 13,520,000 | | | | 13,536,900 | | |
08/15/18 | | | 1.000 | % | | | 1,820,000 | | | | 1,827,109 | | |
08/31/18 | | | 1.500 | % | | | 13,065,000 | | | | 13,268,122 | | |
09/15/18 | | | 1.000 | % | | | 5,550,000 | | | | 5,570,596 | | |
11/15/18 | | | 1.250 | % | | | 5,435,000 | | | | 5,487,652 | | |
11/30/18 | | | 1.250 | % | | | 1,430,000 | | | | 1,443,965 | | |
12/15/18 | | | 1.250 | % | | | 5,010,000 | | | | 5,058,534 | | |
12/31/18 | | | 1.500 | % | | | 860,000 | | | | 874,210 | | |
01/15/19 | | | 1.125 | % | | | 1,925,000 | | | | 1,937,031 | | |
02/15/19 | | | 0.750 | % | | | 6,415,000 | | | | 6,389,693 | | |
04/30/19 | | | 1.625 | % | | | 9,730,000 | | | | 9,928,784 | | |
07/31/19 | | | 0.875 | % | | | 10,305,000 | | | | 10,270,787 | | |
07/31/19 | | | 1.625 | % | | | 15,000,000 | | | | 15,309,375 | | |
09/30/19 | | | 1.750 | % | | | 9,920,000 | | | | 10,161,413 | | |
10/31/19 | | | 1.500 | % | | | 11,200,000 | | | | 11,375,000 | | |
11/15/19 | | | 3.375 | % | | | 6,475,000 | | | | 6,998,562 | | |
12/31/19 | | | 1.625 | % | | | 2,180,000 | | | | 2,222,578 | | |
01/31/20 | | | 1.250 | % | | | 13,650,000 | | | | 13,723,055 | | |
02/29/20 | | | 1.250 | % | | | 9,015,000 | | | | 9,059,723 | | |
02/29/20 | | | 1.375 | % | | | 4,200,000 | | | | 4,239,375 | | |
03/31/20 | | | 1.375 | % | | | 15,000,000 | | | | 15,135,937 | | |
04/30/20 | | | 1.375 | % | | | 12,675,000 | | | | 12,783,926 | | |
05/31/20 | | | 1.500 | % | | | 2,255,000 | | | | 2,284,597 | | |
07/31/20 | | | 1.625 | % | | | 4,895,000 | | | | 4,980,662 | | |
08/15/20 | | | 2.625 | % | | | 5,550,000 | | | | 5,877,145 | | |
08/15/20 | | | 8.750 | % | | | 15,000,000 | | | | 19,738,470 | | |
08/31/20 | | | 1.375 | % | | | 2,655,000 | | | | 2,673,668 | | |
08/31/20 | | | 2.125 | % | | | 2,090,000 | | | | 2,169,763 | | |
09/30/20 | | | 1.375 | % | | | 6,435,000 | | | | 6,475,219 | | |
09/30/20 | | | 2.000 | % | | | 2,400,000 | | | | 2,480,251 | | |
10/31/20 | | | 1.375 | % | | | 7,695,000 | | | | 7,740,689 | | |
10/31/20 | | | 1.750 | % | | | 2,285,000 | | | | 2,335,163 | | |
11/30/20 | | | 1.625 | % | | | 7,170,000 | | | | 7,295,475 | | |
11/30/20 | | | 2.000 | % | | | 5,545,000 | | | | 5,728,246 | | |
12/31/20 | | | 1.750 | % | | | 3,775,000 | | | | 3,858,758 | | |
01/31/21 | | | 1.375 | % | | | 4,395,000 | | | | 4,416,288 | | |
02/28/21 | | | 1.125 | % | | | 7,630,000 | | | | 7,580,825 | | |
03/31/21 | | | 2.250 | % | | | 4,450,000 | | | | 4,651,638 | | |
05/15/21 | | | 3.125 | % | | | 2,880,000 | | | | 3,135,151 | | |
07/31/21 | | | 2.250 | % | | | 2,425,000 | | | | 2,535,735 | | |
08/31/21 | | | 2.000 | % | | | 3,400,000 | | | | 3,509,837 | | |
U.S. Treasury Obligations (continued)
Issuer | | Coupon
Rate | | Principal
Amount ($) | | Value ($) | |
09/30/21 | | | 2.125 | % | | | 3,025,000 | | | | 3,141,865 | | |
11/30/21 | | | 1.875 | % | | | 12,105,000 | | | | 12,412,358 | | |
12/31/21 | | | 2.125 | % | | | 6,400,000 | | | | 6,644,499 | | |
01/31/22 | | | 1.500 | % | | | 10,050,000 | | | | 10,083,758 | | |
02/15/22 | | | 2.000 | % | | | 3,000,000 | | | | 3,095,625 | | |
02/28/22 | | | 1.750 | % | | | 12,550,000 | | | | 12,754,916 | | |
03/31/22 | | | 1.750 | % | | | 2,705,000 | | | | 2,748,004 | | |
04/30/22 | | | 1.750 | % | | | 1,960,000 | | | | 1,990,012 | | |
05/31/22 | | | 1.875 | % | | | 1,780,000 | | | | 1,819,981 | | |
06/30/22 | | | 2.125 | % | | | 1,025,000 | | | | 1,062,316 | | |
07/31/22 | | | 2.000 | % | | | 2,630,000 | | | | 2,705,612 | | |
08/15/22 | | | 1.625 | % | | | 3,975,000 | | | | 4,003,258 | | |
08/31/22 | | | 1.875 | % | | | 2,070,000 | | | | 2,113,259 | | |
09/30/22 | | | 1.750 | % | | | 4,540,000 | | | | 4,597,458 | | |
10/31/22 | | | 1.875 | % | | | 2,925,000 | | | | 2,983,272 | | |
11/30/22 | | | 2.000 | % | | | 3,265,000 | | | | 3,353,511 | | |
12/31/22 | | | 2.125 | % | | | 2,610,000 | | | | 2,701,452 | | |
01/31/23 | | | 1.750 | % | | | 3,340,000 | | | | 3,375,487 | | |
02/28/23 | | | 1.500 | % | | | 3,325,000 | | | | 3,305,519 | | |
05/15/23 | | | 1.750 | % | | | 15,000,000 | | | | 15,154,095 | | |
08/15/23 | | | 2.500 | % | | | 9,870,000 | | | | 10,476,462 | | |
11/15/23 | | | 2.750 | % | | | 3,590,000 | | | | 3,875,517 | | |
02/15/24 | | | 2.750 | % | | | 3,830,000 | | | | 4,134,006 | | |
05/15/24 | | | 2.500 | % | | | 3,350,000 | | | | 3,552,571 | | |
08/15/24 | | | 2.375 | % | | | 2,560,000 | | | | 2,688,799 | | |
11/15/24 | | | 2.250 | % | | | 9,410,000 | | | | 9,785,299 | | |
02/15/25 | | | 2.000 | % | | | 5,015,000 | | | | 5,108,836 | | |
05/15/25 | | | 2.125 | % | | | 6,220,000 | | | | 6,395,665 | | |
08/15/25 | | | 2.000 | % | | | 9,845,000 | | | | 10,012,670 | | |
11/15/25 | | | 2.250 | % | | | 5,550,000 | | | | 5,760,944 | | |
02/15/26 | | | 1.625 | % | | | 6,670,000 | | | | 6,554,317 | | |
02/15/26 | | | 6.000 | % | | | 4,780,000 | | | | 6,593,599 | | |
11/15/28 | | | 5.250 | % | | | 1,825,000 | | | | 2,483,925 | | |
02/15/29 | | | 5.250 | % | | | 1,930,000 | | | | 2,636,336 | | |
05/15/30 | | | 6.250 | % | | | 570,000 | | | | 863,661 | | |
02/15/31 | | | 5.375 | % | | | 1,185,000 | | | | 1,686,126 | | |
02/15/36 | | | 4.500 | % | | | 555,000 | | | | 755,039 | | |
02/15/39 | | | 3.500 | % | | | 9,930,000 | | | | 11,724,381 | | |
11/15/39 | | | 4.375 | % | | | 2,460,000 | | | | 3,286,791 | | |
05/15/40 | | | 4.375 | % | | | 1,080,000 | | | | 1,443,530 | | |
11/15/40 | | | 4.250 | % | | | 9,500,000 | | | | 12,485,821 | | |
02/15/41 | | | 4.750 | % | | | 1,710,000 | | | | 2,411,167 | | |
05/15/41 | | | 4.375 | % | | | 2,205,000 | | | | 2,953,838 | | |
08/15/41 | | | 3.750 | % | | | 1,800,000 | | | | 2,200,289 | | |
02/15/43 | | | 3.125 | % | | | 7,385,000 | | | | 8,115,133 | | |
05/15/43 | | | 2.875 | % | | | 2,250,000 | | | | 2,354,766 | | |
08/15/43 | | | 3.625 | % | | | 3,170,000 | | | | 3,816,877 | | |
11/15/43 | | | 3.750 | % | | | 3,150,000 | | | | 3,878,929 | | |
02/15/44 | | | 3.625 | % | | | 3,000,000 | | | | 3,608,556 | | |
05/15/44 | | | 3.375 | % | | | 3,450,000 | | | | 3,965,209 | | |
08/15/44 | | | 3.125 | % | | | 3,290,000 | | | | 3,608,847 | | |
11/15/44 | | | 3.000 | % | | | 13,980,000 | | | | 14,962,417 | | |
02/15/45 | | | 2.500 | % | | | 5,540,000 | | | | 5,352,161 | | |
05/15/45 | | | 3.000 | % | | | 3,400,000 | | | | 3,637,602 | | |
08/15/45 | | | 2.875 | % | | | 4,720,000 | | | | 4,924,839 | | |
11/15/45 | | | 3.000 | % | | | 4,740,000 | | | | 5,072,170 | | |
02/15/46 | | | 2.500 | % | | | 2,710,000 | | | | 2,618,643 | | |
Total U.S. Treasury Obligations
(Cost: $709,166,880) | | | | | | | 725,934,180 | | |
The accompanying Notes to Financial Statements are an integral part of this statement.
Annual Report 2016
7
COLUMBIA U.S. TREASURY INDEX FUND
PORTFOLIO OF INVESTMENTS (continued)
April 30, 2016
Money Market Funds 0.2%
| | | Shares | | Value ($) | |
Columbia Short-Term Cash Fund,
0.422%(a)(b) | | | 1,441,192 | | | | 1,441,192 | | |
Total Money Market Funds
(Cost: $1,441,192) | | | | | 1,441,192 | | |
Total Investments
(Cost: $710,608,072) | | | | | 727,375,372 | | |
Other Assets & Liabilities, Net | | | | | 4,680,658 | | |
Net Assets | | | | | 732,056,030 | | |
Notes to Portfolio of Investments
(a) The rate shown is the seven-day current annualized yield at April 30, 2016.
(b) As defined in the Investment Company Act of 1940, an affiliated company is one in which the Fund owns 5% or more of the company's outstanding voting securities, or a company which is under common ownership or control with the Fund. Holdings and transactions in these affiliated companies during the year ended April 30, 2016 are as follows:
Issuer | | Beginning
Cost ($) | | Purchase
Cost ($) | | Proceeds
From Sales ($) | | Ending
Cost ($) | | Dividends —
Affiliated
Issuers ($) | | Value ($) | |
Columbia Short-Term Cash Fund | | | 1,032,087 | | | | 109,446,385 | | | | (109,037,280 | ) | | | 1,441,192 | | | | 10,055 | | | | 1,441,192 | | |
Fair Value Measurements
The Fund categorizes its fair value measurements according to a three-level hierarchy that maximizes the use of observable inputs and minimizes the use of unobservable inputs by prioritizing that the most observable input be used when available. Observable inputs are those that market participants would use in pricing an investment based on market data obtained from sources independent of the reporting entity. Unobservable inputs are those that reflect the Fund's assumptions about the information market participants would use in pricing an investment. An investment's level within the fair value hierarchy is based on the lowest level of any input that is deemed significant to the asset's or liability's fair value measurement. The input levels are not necessarily an indication of the risk or liquidity associated with investments at that level. For example, certain U.S. government securities are generally high quality and liquid, however, they are reflected as Level 2 because the inputs used to determine fair value may not always be quoted prices in an active market.
Fair value inputs are summarized in the three broad levels listed below:
> Level 1 — Valuations based on quoted prices for investments in active markets that the Fund has the ability to access at the measurement date (including NAV for open-end mutual funds). Valuation adjustments are not applied to Level 1 investments.
> Level 2 — Valuations based on other significant observable inputs (including quoted prices for similar securities, interest rates, prepayment speeds, credit risks, etc.).
> Level 3 — Valuations based on significant unobservable inputs (including the Fund's own assumptions and judgment in determining the fair value of investments).
Inputs that are used in determining fair value of an investment may include price information, credit data, volatility statistics, and other factors. These inputs can be either observable or unobservable. The availability of observable inputs can vary between investments, and is affected by various factors such as the type of investment, and the volume and level of activity for that investment or similar investments in the marketplace. The inputs will be considered by the Investment Manager, along with any other relevant factors in the calculation of an investment's fair value. The Fund uses prices and inputs that are current as of the measurement date, which may include periods of market dislocations. During these periods, the availability of prices and inputs may be reduced for many investments. This condition could cause an investment to be reclassified between the various levels within the hierarchy.
Certain investments that have been measured at fair value using the net asset value per share (or its equivalent) are not categorized in the fair value hierarchy. The fair value amounts presented in the table are intended to reconcile the fair value hierarchy to the amounts presented in the Portfolio of Investments. The Columbia Short-Term Cash Fund seeks to provide shareholders with maximum current income consistent with liquidity and stability of principal. Investments in Columbia Short-Term Cash Fund may be redeemed on a daily basis without restriction.
The accompanying Notes to Financial Statements are an integral part of this statement.
Annual Report 2016
8
COLUMBIA U.S. TREASURY INDEX FUND
PORTFOLIO OF INVESTMENTS (continued)
April 30, 2016
Fair Value Measurements (continued)
Investments falling into the Level 3 category are primarily supported by quoted prices from brokers and dealers participating in the market for those investments. However, these may be classified as Level 3 investments due to lack of market transparency and corroboration to support these quoted prices. Additionally, valuation models may be used as the pricing source for any remaining investments classified as Level 3. These models may rely on one or more significant unobservable inputs and/or significant assumptions by the Investment Manager. Inputs used in valuations may include, but are not limited to, financial statement analysis, capital account balances, discount rates and estimated cash flows, and comparable company data.
Under the direction of the Fund's Board of Trustees (the Board), the Investment Manager's Valuation Committee (the Committee) is responsible for overseeing the valuation procedures approved by the Board. The Committee consists of voting and non-voting members from various groups within the Investment Manager's organization, including operations and accounting, trading and investments, compliance, risk management and legal.
The Committee meets at least monthly to review and approve valuation matters, which may include a description of specific valuation determinations, data regarding pricing information received from approved pricing vendors and brokers and the results of Board-approved valuation control policies and procedures (the Policies). The Policies address, among other things, instances when market quotations are or are not readily available, including recommendations of third party pricing vendors and a determination of appropriate pricing methodologies; events that require specific valuation determinations and assessment of fair value techniques; securities with a potential for stale pricing, including those that are illiquid, restricted, or in default; and the effectiveness of third party pricing vendors, including periodic reviews of vendors. The Committee meets more frequently, as needed, to discuss additional valuation matters, which may include the need to review back-testing results, review time-sensitive information or approve related valuation actions. The Committee reports to the Board, with members of the Committee meeting with the Board at each of its regularly scheduled meetings to discuss valuation matters and actions during the period, similar to those described earlier.
For investments categorized as Level 3, the Committee monitors information similar to that described above, which may include: (i) data specific to the issuer or comparable issuers, (ii) general market or specific sector news and (iii) quoted prices and specific or similar security transactions. The Committee considers this data and any changes from prior periods in order to assess the reasonableness of observable and unobservable inputs, any assumptions or internal models used to value those securities and changes in fair value. This data is also used to corroborate, when available, information received from approved pricing vendors and brokers. Various factors impact the frequency of monitoring this information (which may occur as often as daily). However, the Committee may determine that changes to inputs, assumptions and models are not required as a result of the monitoring procedures performed.
The following table is a summary of the inputs used to value the Fund's investments at April 30, 2016:
| | | Level 1
Quoted Prices in Active
Markets for Identical
Assets ($) | | Level 2
Other Significant
Observable Inputs ($) | | Level 3
Significant
Unobservable Inputs ($) | | Total ($) | |
Investments | |
U.S. Treasury Obligations | | | 725,934,180 | | | | — | | | | — | | | | 725,934,180 | | |
Investments measured at net asset value | |
Money Market Funds | | | — | | | | — | | | | — | | | | 1,441,192 | | |
Total Investments | | | 725,934,180 | | | | — | | | | — | | | | 727,375,372 | | |
See the Portfolio of Investments for all investment classifications not indicated in the table.
Financial assets were transferred from Level 2 to Level 1 as the market for these assets were deemed to be active during the period and fair values were consequently obtained using quoted prices for identical assets rather than being based upon other observable market inputs as of period end.
The following table shows transfers between Level 1 and Level 2 of the fair value hierarchy:
Transfers In | | Transfers Out | |
| Level 1 ($) | | Level 2 ($) | | Level 1 ($) | | Level 2 ($) | |
| | 4,137,825 | | | | — | | | | — | | | | 4,137,825 | | |
Transfers between Level 1 and Level 2 are determined based on the fair value at the beginning of the period for security positions held throughout the period.
There were no transfers of financial assets between Levels 2 and 3 during the period.
The accompanying Notes to Financial Statements are an integral part of this statement.
Annual Report 2016
9
COLUMBIA U.S. TREASURY INDEX FUND
STATEMENT OF ASSETS AND LIABILITIES
April 30, 2016
Assets | |
Investments, at value | |
Unaffiliated issuers (identified cost $709,166,880) | | $ | 725,934,180 | | |
Affiliated issuers (identified cost $1,441,192) | | | 1,441,192 | | |
Total investments (identified cost $710,608,072) | | | 727,375,372 | | |
Receivable for: | |
Investments sold | | | 7,992,405 | | |
Capital shares sold | | | 1,674,458 | | |
Dividends | | | 877 | | |
Interest | | | 4,160,121 | | |
Expense reimbursement due from Investment Manager | | | 4,088 | | |
Trustees' deferred compensation plan | | | 42,135 | | |
Other assets | | | 1,873 | | |
Total assets | | | 741,251,329 | | |
Liabilities | |
Payable for: | |
Investments purchased | | | 7,675,016 | | |
Capital shares purchased | | | 676,183 | | |
Dividend distributions to shareholders | | | 791,631 | | |
Investment management fees | | | 7,978 | | |
Distribution and/or service fees | | | 1,955 | | |
Other expenses | | | 401 | | |
Trustees' deferred compensation plan | | | 42,135 | | |
Total liabilities | | | 9,195,299 | | |
Net assets applicable to outstanding capital stock | | $ | 732,056,030 | | |
Represented by | |
Paid-in capital | | $ | 715,092,109 | | |
Undistributed net investment income | | | 176,307 | | |
Accumulated net realized gain | | | 20,314 | | |
Unrealized appreciation (depreciation) on: | |
Investments | | | 16,767,300 | | |
Total — representing net assets applicable to outstanding capital stock | | $ | 732,056,030 | | |
The accompanying Notes to Financial Statements are an integral part of this statement.
Annual Report 2016
10
COLUMBIA U.S. TREASURY INDEX FUND
STATEMENT OF ASSETS AND LIABILITIES (continued)
April 30, 2016
Class A | |
Net assets | | $ | 41,893,452 | | |
Shares outstanding | | | 3,694,720 | | |
Net asset value per share | | $ | 11.34 | | |
Class B | |
Net assets | | $ | 721,030 | | |
Shares outstanding | | | 63,599 | | |
Net asset value per share | | $ | 11.34 | | |
Class C | |
Net assets | | $ | 9,892,258 | | |
Shares outstanding | | | 872,456 | | |
Net asset value per share | | $ | 11.34 | | |
Class I | |
Net assets | | $ | 175,747,021 | | |
Shares outstanding | | | 15,499,990 | | |
Net asset value per share | | $ | 11.34 | | |
Class R5 | |
Net assets | | $ | 3,906,085 | | |
Shares outstanding | | | 345,080 | | |
Net asset value per share | | $ | 11.32 | | |
Class W | |
Net assets | | $ | 225,255,022 | | |
Shares outstanding | | | 19,878,303 | | |
Net asset value per share | | $ | 11.33 | | |
Class Z | |
Net assets | | $ | 274,641,162 | | |
Shares outstanding | | | 24,221,419 | | |
Net asset value per share | | $ | 11.34 | | |
The accompanying Notes to Financial Statements are an integral part of this statement.
Annual Report 2016
11
COLUMBIA U.S. TREASURY INDEX FUND
STATEMENT OF OPERATIONS
Year Ended April 30, 2016
Net investment income | |
Income: | |
Dividends — affiliated issuers | | $ | 10,055 | | |
Interest | | | 8,244,048 | | |
Total income | | | 8,254,103 | | |
Expenses: | |
Investment management fees | | | 2,018,549 | | |
Distribution and/or service fees | |
Class A | | | 79,789 | | |
Class B | | | 9,162 | | |
Class C | | | 80,501 | | |
Class W | | | 319,950 | | |
Compensation of board members | | | 23,013 | | |
Other | | | 2,832 | | |
Total expenses | | | 2,533,796 | | |
Fees waived or expenses reimbursed by Investment Manager and its affiliates | | | (1,037,002 | ) | |
Fees waived by Distributor — Class A | | | (31,883 | ) | |
Fees waived by Distributor — Class B | | | (915 | ) | |
Fees waived by Distributor — Class C | | | (12,058 | ) | |
Expense reductions | | | (740 | ) | |
Total net expenses | | | 1,451,198 | | |
Net investment income | | | 6,802,905 | | |
Realized and unrealized gain (loss) — net | |
Net realized gain (loss) on: | |
Investments | | | 1,207,986 | | |
Net realized gain | | | 1,207,986 | | |
Net change in unrealized appreciation (depreciation) on: | |
Investments | | | 7,666,863 | | |
Net change in unrealized appreciation | | | 7,666,863 | | |
Net realized and unrealized gain | | | 8,874,849 | | |
Net increase in net assets resulting from operations | | $ | 15,677,754 | | |
The accompanying Notes to Financial Statements are an integral part of this statement.
Annual Report 2016
12
COLUMBIA U.S. TREASURY INDEX FUND
STATEMENT OF CHANGES IN NET ASSETS
| | | Year Ended
April 30,
2016 | | Year Ended
April 30,
2015 | |
Operations | |
Net investment income | | $ | 6,802,905 | | | $ | 4,726,673 | | |
Net realized gain | | | 1,207,986 | | | | 3,090,049 | | |
Net change in unrealized appreciation | | | 7,666,863 | | | | 2,775,416 | | |
Net increase in net assets resulting from operations | | | 15,677,754 | | | | 10,592,138 | | |
Distributions to shareholders | |
Net investment income | |
Class A | | | (419,707 | ) | | | (328,771 | ) | |
Class B | | | (5,083 | ) | | | (7,351 | ) | |
Class C | | | (49,117 | ) | | | (42,996 | ) | |
Class I | | | (1,578,525 | ) | | | (1,013,955 | ) | |
Class R5 | | | (46,260 | ) | | | (31,254 | ) | |
Class W | | | (1,537,937 | ) | | | (258,679 | ) | |
Class Z | | | (3,286,714 | ) | | | (3,009,714 | ) | |
Net realized gains | |
Class A | | | (162,218 | ) | | | (35,542 | ) | |
Class B | | | (3,942 | ) | | | (1,014 | ) | |
Class C | | | (38,698 | ) | | | (5,115 | ) | |
Class I | | | (469,920 | ) | | | (52,108 | ) | |
Class R5 | | | (15,825 | ) | | | (1,355 | ) | |
Class W | | | (373,381 | ) | | | (8,887 | ) | |
Class Z | | | (1,071,971 | ) | | | (147,809 | ) | |
Total distributions to shareholders | | | (9,059,298 | ) | | | (4,944,550 | ) | |
Increase in net assets from capital stock activity | | | 292,974,152 | | | | 120,598,877 | | |
Total increase in net assets | | | 299,592,608 | | | | 126,246,465 | | |
Net assets at beginning of year | | | 432,463,422 | | | | 306,216,957 | | |
Net assets at end of year | | $ | 732,056,030 | | | $ | 432,463,422 | | |
Undistributed net investment income | | $ | 176,307 | | | $ | 229,358 | | |
The accompanying Notes to Financial Statements are an integral part of this statement.
Annual Report 2016
13
COLUMBIA U.S. TREASURY INDEX FUND
STATEMENT OF CHANGES IN NET ASSETS (continued)
| | | Year Ended April 30, 2016 | | Year Ended April 30, 2015 | |
| | | Shares | | Dollars ($) | | Shares | | Dollars ($) | |
Capital stock activity | |
Class A shares | |
Subscriptions(a) | | | 5,031,370 | | | | 56,443,621 | | | | 4,057,095 | | | | 45,502,626 | | |
Distributions reinvested | | | 39,518 | | | | 442,365 | | | | 26,593 | | | | 298,202 | | |
Redemptions | | | (4,207,867 | ) | | | (47,017,172 | ) | | | (3,261,772 | ) | | | (36,553,436 | ) | |
Net increase | | | 863,021 | | | | 9,868,814 | | | | 821,916 | | | | 9,247,392 | | |
Class B shares | |
Subscriptions | | | 3,599 | | | | 40,427 | | | | 3,045 | | | | 34,402 | | |
Distributions reinvested | | | 563 | | | | 6,286 | | | | 445 | | | | 4,988 | | |
Redemptions(a) | | | (46,565 | ) | | | (523,946 | ) | | | (32,522 | ) | | | (362,348 | ) | |
Net decrease | | | (42,403 | ) | | | (477,233 | ) | | | (29,032 | ) | | | (322,958 | ) | |
Class C shares | |
Subscriptions | | | 470,430 | | | | 5,288,219 | | | | 262,999 | | | | 2,944,060 | | |
Distributions reinvested | | | 7,706 | | | | 86,076 | | | | 4,177 | | | | 46,784 | | |
Redemptions | | | (237,289 | ) | | | (2,666,588 | ) | | | (217,651 | ) | | | (2,432,082 | ) | |
Net increase | | | 240,847 | | | | 2,707,707 | | | | 49,525 | | | | 558,762 | | |
Class I shares | |
Subscriptions | | | 10,826,689 | | | | 120,565,663 | | | | 172,065 | | | | 1,952,968 | | |
Distributions reinvested | | | 182,619 | | | | 2,048,243 | | | | 95,159 | | | | 1,065,901 | | |
Redemptions | | | (1,475,657 | ) | | | (16,587,694 | ) | | | (491,912 | ) | | | (5,517,651 | ) | |
Net increase (decrease) | | | 9,533,651 | | | | 106,026,212 | | | | (224,688 | ) | | | (2,498,782 | ) | |
Class R5 shares | |
Subscriptions | | | 298,452 | | | | 3,340,022 | | | | 332,232 | | | | 3,726,540 | | |
Distributions reinvested | | | 3,070 | | | | 34,345 | | | | 2,356 | | | | 26,384 | | |
Redemptions | | | (187,355 | ) | | | (2,100,080 | ) | | | (233,623 | ) | | | (2,640,687 | ) | |
Net increase | | | 114,167 | | | | 1,274,287 | | | | 100,965 | | | | 1,112,237 | | |
Class W shares | |
Subscriptions | | | 18,119,536 | | | | 202,280,449 | | | | 5,954,382 | | | | 67,776,857 | | |
Distributions reinvested | | | 170,398 | | | | 1,911,141 | | | | 23,801 | | | | 267,431 | | |
Redemptions | | | (5,055,156 | ) | | | (57,152,634 | ) | | | (438,970 | ) | | | (4,927,414 | ) | |
Net increase | | | 13,234,778 | | | | 147,038,956 | | | | 5,539,213 | | | | 63,116,874 | | |
Class Z shares | |
Subscriptions | | | 11,149,410 | | | | 125,689,191 | | | | 7,706,138 | | | | 87,166,501 | | |
Distributions reinvested | | | 285,516 | | | | 3,198,038 | | | | 199,141 | | | | 2,232,106 | | |
Redemptions | | | (9,151,215 | ) | | | (102,351,820 | ) | | | (3,591,307 | ) | | | (40,013,255 | ) | |
Net increase | | | 2,283,711 | | | | 26,535,409 | | | | 4,313,972 | | | | 49,385,352 | | |
Total net increase | | | 26,227,772 | | | | 292,974,152 | | | | 10,571,871 | | | | 120,598,877 | | |
(a) Includes conversions of Class B shares to Class A shares, if any.
The accompanying Notes to Financial Statements are an integral part of this statement.
Annual Report 2016
14
COLUMBIA U.S. TREASURY INDEX FUND
The following tables are intended to help you understand the Fund's financial performance. Certain information reflects financial results for a single share of a class held for the periods shown. Per share net investment income (loss) amounts are calculated based on average shares outstanding during the period. Total return assumes reinvestment of all dividends and distributions, if any. Total return does not reflect payment of sales charges, if any. Total return and portfolio turnover are not annualized for periods of less than one year. The portfolio turnover rate is calculated without regard to purchase and sales transactions of short-term instruments and certain derivatives, if any. If such transactions were included, the Fund's portfolio turnover rate may be higher.
| | | Year Ended April 30, | | Year Ended
March 31, | |
Class A | | 2016 | | 2015 | | 2014 | | 2013 | | 2012(a) | | 2012 | |
Per share data | |
Net asset value, beginning of period | | $ | 11.28 | | | $ | 11.03 | | | $ | 11.52 | | | $ | 11.74 | | | $ | 11.59 | | | $ | 11.03 | | |
Income from investment operations: | |
Net investment income | | | 0.14 | | | | 0.15 | | | | 0.14 | | | | 0.13 | | | | 0.01 | | | | 0.18 | | |
Net realized and unrealized gain (loss) | | | 0.12 | | | | 0.26 | | | | (0.36 | ) | | | 0.11 | | | | 0.15 | | | | 0.70 | | |
Total from investment operations | | | 0.26 | | | | 0.41 | | | | (0.22 | ) | | | 0.24 | | | | 0.16 | | | | 0.88 | | |
Less distributions to shareholders: | |
Net investment income | | | (0.14 | ) | | | (0.15 | ) | | | (0.15 | ) | | | (0.13 | ) | | | (0.01 | ) | | | (0.19 | ) | |
Net realized gains | | | (0.06 | ) | | | (0.01 | ) | | | (0.12 | ) | | | (0.33 | ) | | | — | | | | (0.13 | ) | |
Total distributions to shareholders | | | (0.20 | ) | | | (0.16 | ) | | | (0.27 | ) | | | (0.46 | ) | | | (0.01 | ) | | | (0.32 | ) | |
Net asset value, end of period | | $ | 11.34 | | | $ | 11.28 | | | $ | 11.03 | | | $ | 11.52 | | | $ | 11.74 | | | $ | 11.59 | | |
Total return | | | 2.38 | % | | | 3.70 | % | | | (1.92 | %) | | | 2.06 | % | | | 1.40 | % | | | 8.01 | % | |
Ratios to average net assets(b) | |
Total gross expenses | | | 0.66 | % | | | 0.66 | % | | | 0.66 | % | | | 0.66 | % | | | 0.66 | %(c) | | | 0.66 | %(d) | |
Total net expenses(e) | | | 0.35 | %(f) | | | 0.38 | %(f) | | | 0.45 | %(f) | | | 0.45 | %(f) | | | 0.45 | %(c) | | | 0.45 | %(d)(f) | |
Net investment income | | | 1.30 | % | | | 1.33 | % | | | 1.24 | % | | | 1.15 | % | | | 1.30 | %(c) | | | 1.55 | % | |
Supplemental data | |
Net assets, end of period (in thousands) | | $ | 41,893 | | | $ | 31,946 | | | $ | 22,163 | | | $ | 28,129 | | | $ | 42,700 | | | $ | 43,818 | | |
Portfolio turnover | | | 91 | % | | | 65 | % | | | 76 | % | | | 99 | % | | | 7 | % | | | 106 | % | |
Notes to Financial Highlights
(a) For the period from April 1, 2012 to April 30, 2012. During the period, the Fund's fiscal year end was changed from March 31 to April 30.
(b) In addition to the fees and expenses that the Fund bears directly, the Fund indirectly bears a pro rata share of the fees and expenses of any other funds in which it invests. Such indirect expenses are not included in the Fund's reported expense ratios.
(c) Annualized.
(d) Ratios include line of credit interest expense which is less than 0.01%.
(e) Total net expenses include the impact of certain fee waivers/expense reimbursements made by the Investment Manager and certain of its affiliates, if applicable.
(f) The benefits derived from expense reductions had an impact of less than 0.01%.
The accompanying Notes to Financial Statements are an integral part of this statement.
Annual Report 2016
15
COLUMBIA U.S. TREASURY INDEX FUND
FINANCIAL HIGHLIGHTS (continued)
| | | Year Ended April 30, | | Year Ended
March 31, | |
Class B | | 2016 | | 2015 | | 2014 | | 2013 | | 2012(a) | | 2012 | |
Per share data | |
Net asset value, beginning of period | | $ | 11.28 | | | $ | 11.02 | | | $ | 11.52 | | | $ | 11.74 | | | $ | 11.59 | | | $ | 11.03 | | |
Income from investment operations: | |
Net investment income | | | 0.06 | | | | 0.06 | | | | 0.05 | | | | 0.05 | | | | 0.01 | | | | 0.10 | | |
Net realized and unrealized gain (loss) | | | 0.12 | | | | 0.27 | | | | (0.37 | ) | | | 0.10 | | | | 0.14 | | | | 0.69 | | |
Total from investment operations | | | 0.18 | | | | 0.33 | | | | (0.32 | ) | | | 0.15 | | | | 0.15 | | | | 0.79 | | |
Less distributions to shareholders: | |
Net investment income | | | (0.06 | ) | | | (0.06 | ) | | | (0.06 | ) | | | (0.04 | ) | | | (0.00 | )(b) | | | (0.10 | ) | |
Net realized gains | | | (0.06 | ) | | | (0.01 | ) | | | (0.12 | ) | | | (0.33 | ) | | | — | | | | (0.13 | ) | |
Total distributions to shareholders | | | (0.12 | ) | | | (0.07 | ) | | | (0.18 | ) | | | (0.37 | ) | | | (0.00 | )(b) | | | (0.23 | ) | |
Net asset value, end of period | | $ | 11.34 | | | $ | 11.28 | | | $ | 11.02 | | | $ | 11.52 | | | $ | 11.74 | | | $ | 11.59 | | |
Total return | | | 1.62 | % | | | 3.02 | % | | | (2.74 | %) | | | 1.30 | % | | | 1.34 | % | | | 7.21 | % | |
Ratios to average net assets(c) | |
Total gross expenses | | | 1.41 | % | | | 1.41 | % | | | 1.41 | % | | | 1.40 | % | | | 1.41 | %(d) | | | 1.41 | %(e) | |
Total net expenses(f) | | | 1.10 | %(g) | | | 1.13 | %(g) | | | 1.20 | %(g) | | | 1.20 | %(g) | | | 1.20 | %(d) | | | 1.20 | %(e)(g) | |
Net investment income | | | 0.54 | % | | | 0.58 | % | | | 0.49 | % | | | 0.40 | % | | | 0.55 | %(d) | | | 0.83 | % | |
Supplemental data | |
Net assets, end of period (in thousands) | | $ | 721 | | | $ | 1,196 | | | $ | 1,489 | | | $ | 2,162 | | | $ | 3,102 | | | $ | 3,143 | | |
Portfolio turnover | | | 91 | % | | | 65 | % | | | 76 | % | | | 99 | % | | | 7 | % | | | 106 | % | |
Notes to Financial Highlights
(a) For the period from April 1, 2012 to April 30, 2012. During the period, the Fund's fiscal year end was changed from March 31 to April 30.
(b) Rounds to zero.
(c) In addition to the fees and expenses that the Fund bears directly, the Fund indirectly bears a pro rata share of the fees and expenses of any other funds in which it invests. Such indirect expenses are not included in the Fund's reported expense ratios.
(d) Annualized.
(e) Ratios include line of credit interest expense which is less than 0.01%.
(f) Total net expenses include the impact of certain fee waivers/expense reimbursements made by the Investment Manager and certain of its affiliates, if applicable.
(g) The benefits derived from expense reductions had an impact of less than 0.01%.
The accompanying Notes to Financial Statements are an integral part of this statement.
Annual Report 2016
16
COLUMBIA U.S. TREASURY INDEX FUND
FINANCIAL HIGHLIGHTS (continued)
| | | Year Ended April 30, | | Year Ended
March 31, | |
Class C | | 2016 | | 2015 | | 2014 | | 2013 | | 2012(a) | | 2012 | |
Per share data | |
Net asset value, beginning of period | | $ | 11.28 | | | $ | 11.02 | | | $ | 11.52 | | | $ | 11.74 | | | $ | 11.59 | | | $ | 11.03 | | |
Income from investment operations: | |
Net investment income | | | 0.07 | | | | 0.07 | | | | 0.07 | | | | 0.06 | | | | 0.01 | | | | 0.11 | | |
Net realized and unrealized gain (loss) | | | 0.12 | | | | 0.27 | | | | (0.37 | ) | | | 0.11 | | | | 0.15 | | | | 0.70 | | |
Total from investment operations | | | 0.19 | | | | 0.34 | | | | (0.30 | ) | | | 0.17 | | | | 0.16 | | | | 0.81 | | |
Less distributions to shareholders: | |
Net investment income | | | (0.07 | ) | | | (0.07 | ) | | | (0.08 | ) | | | (0.06 | ) | | | (0.01 | ) | | | (0.12 | ) | |
Net realized gains | | | (0.06 | ) | | | (0.01 | ) | | | (0.12 | ) | | | (0.33 | ) | | | — | | | | (0.13 | ) | |
Total distributions to shareholders | | | (0.13 | ) | | | (0.08 | ) | | | (0.20 | ) | | | (0.39 | ) | | | (0.01 | ) | | | (0.25 | ) | |
Net asset value, end of period | | $ | 11.34 | | | $ | 11.28 | | | $ | 11.02 | | | $ | 11.52 | | | $ | 11.74 | | | $ | 11.59 | | |
Total return | | | 1.67 | % | | | 3.11 | % | | | (2.59 | %) | | | 1.45 | % | | | 1.35 | % | | | 7.37 | % | |
Ratios to average net assets(b) | |
Total gross expenses | | | 1.41 | % | | | 1.41 | % | | | 1.41 | % | | | 1.41 | % | | | 1.41 | %(c) | | | 1.41 | %(d) | |
Total net expenses(e) | | | 1.05 | %(f) | | | 1.05 | %(f) | | | 1.05 | %(f) | | | 1.05 | %(f) | | | 1.05 | %(c) | | | 1.05 | %(d)(f) | |
Net investment income | | | 0.59 | % | | | 0.66 | % | | | 0.64 | % | | | 0.55 | % | | | 0.70 | %(c) | | | 0.98 | % | |
Supplemental data | |
Net assets, end of period (in thousands) | | $ | 9,892 | | | $ | 7,124 | | | $ | 6,417 | | | $ | 10,111 | | | $ | 11,628 | | | $ | 12,172 | | |
Portfolio turnover | | | 91 | % | | | 65 | % | | | 76 | % | | | 99 | % | | | 7 | % | | | 106 | % | |
Notes to Financial Highlights
(a) For the period from April 1, 2012 to April 30, 2012. During the period, the Fund's fiscal year end was changed from March 31 to April 30.
(b) In addition to the fees and expenses that the Fund bears directly, the Fund indirectly bears a pro rata share of the fees and expenses of any other funds in which it invests. Such indirect expenses are not included in the Fund's reported expense ratios.
(c) Annualized.
(d) Ratios include line of credit interest expense which is less than 0.01%.
(e) Total net expenses include the impact of certain fee waivers/expense reimbursements made by the Investment Manager and certain of its affiliates, if applicable.
(f) The benefits derived from expense reductions had an impact of less than 0.01%.
The accompanying Notes to Financial Statements are an integral part of this statement.
Annual Report 2016
17
COLUMBIA U.S. TREASURY INDEX FUND
FINANCIAL HIGHLIGHTS (continued)
| | | Year Ended April 30, | | Year Ended
March 31, | |
Class I | | 2016 | | 2015 | | 2014 | | 2013 | | 2012(a) | | 2012 | |
Per share data | |
Net asset value, beginning of period | | $ | 11.28 | | | $ | 11.02 | | | $ | 11.52 | | | $ | 11.74 | | | $ | 11.59 | | | $ | 11.03 | | |
Income from investment operations: | |
Net investment income | | | 0.16 | | | | 0.17 | | | | 0.17 | | | | 0.16 | | | | 0.02 | | | | 0.21 | | |
Net realized and unrealized gain (loss) | | | 0.12 | | | | 0.27 | | | | (0.38 | ) | | | 0.11 | | | | 0.14 | | | | 0.70 | | |
Total from investment operations | | | 0.28 | | | | 0.44 | | | | (0.21 | ) | | | 0.27 | | | | 0.16 | | | | 0.91 | | |
Less distributions to shareholders: | |
Net investment income | | | (0.16 | ) | | | (0.17 | ) | | | (0.17 | ) | | | (0.16 | ) | | | (0.01 | ) | | | (0.22 | ) | |
Net realized gains | | | (0.06 | ) | | | (0.01 | ) | | | (0.12 | ) | | | (0.33 | ) | | | — | | | | (0.13 | ) | |
Total distributions to shareholders | | | (0.22 | ) | | | (0.18 | ) | | | (0.29 | ) | | | (0.49 | ) | | | (0.01 | ) | | | (0.35 | ) | |
Net asset value, end of period | | $ | 11.34 | | | $ | 11.28 | | | $ | 11.02 | | | $ | 11.52 | | | $ | 11.74 | | | $ | 11.59 | | |
Total return | | | 2.54 | % | | | 3.98 | % | | | (1.76 | %) | | | 2.31 | % | | | 1.42 | % | | | 8.29 | % | |
Ratios to average net assets(b) | |
Total gross expenses | | | 0.41 | % | | | 0.41 | % | | | 0.41 | % | | | 0.41 | % | | | 0.41 | %(c) | | | 0.41 | %(d) | |
Total net expenses(e) | | | 0.20 | % | | | 0.20 | % | | | 0.20 | % | | | 0.20 | % | | | 0.20 | %(c) | | | 0.20 | %(d) | |
Net investment income | | | 1.45 | % | | | 1.51 | % | | | 1.49 | % | | | 1.39 | % | | | 1.55 | %(c) | | | 1.81 | % | |
Supplemental data | |
Net assets, end of period (in thousands) | | $ | 175,747 | | | $ | 67,291 | | | $ | 68,254 | | | $ | 54,959 | | | $ | 91,092 | | | $ | 84,899 | | |
Portfolio turnover | | | 91 | % | | | 65 | % | | | 76 | % | | | 99 | % | | | 7 | % | | | 106 | % | |
Notes to Financial Highlights
(a) For the period from April 1, 2012 to April 30, 2012. During the period, the Fund's fiscal year end was changed from March 31 to April 30.
(b) In addition to the fees and expenses that the Fund bears directly, the Fund indirectly bears a pro rata share of the fees and expenses of any other funds in which it invests. Such indirect expenses are not included in the Fund's reported expense ratios.
(c) Annualized.
(d) Ratios include line of credit interest expense which is less than 0.01%.
(e) Total net expenses include the impact of certain fee waivers/expense reimbursements made by the Investment Manager and certain of its affiliates, if applicable.
The accompanying Notes to Financial Statements are an integral part of this statement.
Annual Report 2016
18
COLUMBIA U.S. TREASURY INDEX FUND
FINANCIAL HIGHLIGHTS (continued)
| | | Year Ended April 30, | |
Class R5 | | 2016 | | 2015 | | 2014 | | 2013(a) | |
Per share data | |
Net asset value, beginning of period | | $ | 11.26 | | | $ | 11.01 | | | $ | 11.51 | | | $ | 11.68 | | |
Income from investment operations: | |
Net investment income | | | 0.16 | | | | 0.17 | | | | 0.17 | | | | 0.08 | | |
Net realized and unrealized gain (loss) | | | 0.12 | | | | 0.26 | | | | (0.38 | ) | | | (0.04 | )(b) | |
Total from investment operations | | | 0.28 | | | | 0.43 | | | | (0.21 | ) | | | 0.04 | | |
Less distributions to shareholders: | |
Net investment income | | | (0.16 | ) | | | (0.17 | ) | | | (0.17 | ) | | | (0.08 | ) | |
Net realized gains | | | (0.06 | ) | | | (0.01 | ) | | | (0.12 | ) | | | (0.13 | ) | |
Total distributions to shareholders | | | (0.22 | ) | | | (0.18 | ) | | | (0.29 | ) | | | (0.21 | ) | |
Net asset value, end of period | | $ | 11.32 | | | $ | 11.26 | | | $ | 11.01 | | | $ | 11.51 | | |
Total return | | | 2.54 | % | | | 3.89 | % | | | (1.76 | %) | | | 0.31 | % | |
Ratios to average net assets(c) | |
Total gross expenses | | | 0.41 | % | | | 0.41 | % | | | 0.41 | % | | | 0.45 | %(d) | |
Total net expenses(e) | | | 0.20 | % | | | 0.20 | % | | | 0.20 | % | | | 0.20 | %(d) | |
Net investment income | | | 1.45 | % | | | 1.50 | % | | | 1.52 | % | | | 1.41 | %(d) | |
Supplemental data | |
Net assets, end of period (in thousands) | | $ | 3,906 | | | $ | 2,600 | | | $ | 1,431 | | | $ | 2 | | |
Portfolio turnover | | | 91 | % | | | 65 | % | | | 76 | % | | | 99 | % | |
Notes to Financial Highlights
(a) Based on operations from November 8, 2012 (commencement of operations) through the stated period end.
(b) Calculation of the net gain (loss) per share (both realized and unrealized) does not correlate to the aggregate realized and unrealized gain (loss) presented in the Statement of Operations due to the timing of subscriptions and redemptions of Fund shares in relation to fluctuations in the market value of the portfolio.
(c) In addition to the fees and expenses that the Fund bears directly, the Fund indirectly bears a pro rata share of the fees and expenses of any other funds in which it invests. Such indirect expenses are not included in the Fund's reported expense ratios.
(d) Annualized.
(e) Total net expenses include the impact of certain fee waivers/expense reimbursements made by the Investment Manager and certain of its affiliates, if applicable.
The accompanying Notes to Financial Statements are an integral part of this statement.
Annual Report 2016
19
COLUMBIA U.S. TREASURY INDEX FUND
FINANCIAL HIGHLIGHTS (continued)
| | | Year Ended April 30, | |
Class W | | 2016 | | 2015 | | 2014 | | 2013(a) | |
Per share data | |
Net asset value, beginning of period | | $ | 11.27 | | | $ | 11.02 | | | $ | 11.52 | | | $ | 11.90 | | |
Income from investment operations: | |
Net investment income | | | 0.13 | | | | 0.13 | | | | 0.14 | | | | 0.11 | | |
Net realized and unrealized gain (loss) | | | 0.12 | | | | 0.27 | | | | (0.37 | ) | | | (0.05 | )(b) | |
Total from investment operations | | | 0.25 | | | | 0.40 | | | | (0.23 | ) | | | 0.06 | | |
Less distributions to shareholders: | |
Net investment income | | | (0.13 | ) | | | (0.14 | ) | | | (0.15 | ) | | | (0.11 | ) | |
Net realized gains | | | (0.06 | ) | | | (0.01 | ) | | | (0.12 | ) | | | (0.33 | ) | |
Total distributions to shareholders | | | (0.19 | ) | | | (0.15 | ) | | | (0.27 | ) | | | (0.44 | ) | |
Net asset value, end of period | | $ | 11.33 | | | $ | 11.27 | | | $ | 11.02 | | | $ | 11.52 | | |
Total return | | | 2.28 | % | | | 3.63 | % | | | (2.00 | %) | | | 0.52 | % | |
Ratios to average net assets(c) | |
Total gross expenses | | | 0.65 | % | | | 0.65 | % | | | 0.66 | % | | | 0.65 | %(d) | |
Total net expenses(e) | | | 0.45 | %(f) | | | 0.45 | %(f) | | | 0.45 | %(f) | | | 0.45 | %(d) | |
Net investment income | | | 1.17 | % | | | 1.20 | % | | | 1.24 | % | | | 1.10 | %(d) | |
Supplemental data | |
Net assets, end of period (in thousands) | | $ | 225,255 | | | $ | 74,873 | | | $ | 12,167 | | | $ | 29,171 | | |
Portfolio turnover | | | 91 | % | | | 65 | % | | | 76 | % | | | 99 | % | |
Notes to Financial Highlights
(a) Based on operations from June 18, 2012 (commencement of operations) through the stated period end.
(b) Calculation of the net gain (loss) per share (both realized and unrealized) does not correlate to the aggregate realized and unrealized gain (loss) presented in the Statement of Operations due to the timing of subscriptions and redemptions of Fund shares in relation to fluctuations in the market value of the portfolio.
(c) In addition to the fees and expenses that the Fund bears directly, the Fund indirectly bears a pro rata share of the fees and expenses of any other funds in which it invests. Such indirect expenses are not included in the Fund's reported expense ratios.
(d) Annualized.
(e) Total net expenses include the impact of certain fee waivers/expense reimbursements made by the Investment Manager and certain of its affiliates, if applicable.
(f) The benefits derived from expense reductions had an impact of less than 0.01%.
The accompanying Notes to Financial Statements are an integral part of this statement.
Annual Report 2016
20
COLUMBIA U.S. TREASURY INDEX FUND
FINANCIAL HIGHLIGHTS (continued)
| | | Year Ended April 30, | | Year Ended
March 31, | |
Class Z | | 2016 | | 2015 | | 2014 | | 2013 | | 2012(a) | | 2012 | |
Per share data | |
Net asset value, beginning of period | | $ | 11.28 | | | $ | 11.02 | | | $ | 11.52 | | | $ | 11.74 | | | $ | 11.59 | | | $ | 11.03 | | |
Income from investment operations: | |
Net investment income | | | 0.16 | | | | 0.17 | | | | 0.17 | | | | 0.16 | | | | 0.02 | | | | 0.21 | | |
Net realized and unrealized gain (loss) | | | 0.12 | | | | 0.27 | | | | (0.38 | ) | | | 0.11 | | | | 0.14 | | | | 0.70 | | |
Total from investment operations | | | 0.28 | | | | 0.44 | | | | (0.21 | ) | | | 0.27 | | | | 0.16 | | | | 0.91 | | |
Less distributions to shareholders: | |
Net investment income | | | (0.16 | ) | | | (0.17 | ) | | | (0.17 | ) | | | (0.16 | ) | | | (0.01 | ) | | | (0.22 | ) | |
Net realized gains | | | (0.06 | ) | | | (0.01 | ) | | | (0.12 | ) | | | (0.33 | ) | | | — | | | | (0.13 | ) | |
Total distributions to shareholders | | | (0.22 | ) | | | (0.18 | ) | | | (0.29 | ) | | | (0.49 | ) | | | (0.01 | ) | | | (0.35 | ) | |
Net asset value, end of period | | $ | 11.34 | | | $ | 11.28 | | | $ | 11.02 | | | $ | 11.52 | | | $ | 11.74 | | | $ | 11.59 | | |
Total return | | | 2.54 | % | | | 3.98 | % | | | (1.76 | %) | | | 2.31 | % | | | 1.42 | % | | | 8.28 | % | |
Ratios to average net assets(b) | |
Total gross expenses | | | 0.41 | % | | | 0.41 | % | | | 0.41 | % | | | 0.41 | % | | | 0.41 | %(c) | | | 0.41 | %(d) | |
Total net expenses(e) | | | 0.20 | %(f) | | | 0.20 | %(f) | | | 0.20 | %(f) | | | 0.20 | %(f) | | | 0.20 | %(c) | | | 0.20 | %(d)(f) | |
Net investment income | | | 1.44 | % | | | 1.51 | % | | | 1.49 | % | | | 1.40 | % | | | 1.55 | %(c) | | | 1.82 | % | |
Supplemental data | |
Net assets, end of period (in thousands) | | $ | 274,641 | | | $ | 247,434 | | | $ | 194,297 | | | $ | 227,687 | | | $ | 271,853 | | | $ | 267,044 | | |
Portfolio turnover | | | 91 | % | | | 65 | % | | | 76 | % | | | 99 | % | | | 7 | % | | | 106 | % | |
Notes to Financial Highlights
(a) For the period from April 1, 2012 to April 30, 2012. During the period, the Fund's fiscal year end was changed from March 31 to April 30.
(b) In addition to the fees and expenses that the Fund bears directly, the Fund indirectly bears a pro rata share of the fees and expenses of any other funds in which it invests. Such indirect expenses are not included in the Fund's reported expense ratios.
(c) Annualized.
(d) Ratios include line of credit interest expense which is less than 0.01%.
(e) Total net expenses include the impact of certain fee waivers/expense reimbursements made by the Investment Manager and certain of its affiliates, if applicable.
(f) The benefits derived from expense reductions had an impact of less than 0.01%.
The accompanying Notes to Financial Statements are an integral part of this statement.
Annual Report 2016
21
COLUMBIA U.S. TREASURY INDEX FUND
NOTES TO FINANCIAL STATEMENTS
April 30, 2016
Note 1. Organization
Columbia U.S. Treasury Index Fund (the Fund), a series of Columbia Funds Series Trust I (the Trust), is a diversified fund. The Trust is registered under the Investment Company Act of 1940, as amended (the 1940 Act), as an open-end management investment company organized as a Massachusetts business trust.
Fund Shares
The Trust may issue an unlimited number of shares (without par value). The Fund offers Class A, Class B, Class C, Class I, Class R5, Class W and Class Z shares. Although all share classes generally have identical voting, dividend and liquidation rights, each share class votes separately when required by the Trust's organizational documents or by law. Different share classes pay different distribution amounts to the extent the expenses of such share classes differ, and distributions in liquidation will be proportional to the net asset value of each share class. Each share class has its own expense and sales charge structure.
Class A shares are not subject to any front-end sales charge or contingent deferred sales charge (CDSC).
Class B shares may be subject to a maximum CDSC of 5.00% based upon the holding period after purchase. Class B shares will generally convert to Class A shares eight years after purchase. The Fund no longer accepts investments by new or existing investors in the Fund's Class B shares, except in connection with the reinvestment of any dividend and/or capital gain distributions in Class B shares of the Fund and exchanges by existing Class B shareholders of certain other funds within the Columbia Family of Funds.
Class C shares are subject to a 1.00% CDSC on shares redeemed within 12 months after purchase.
Class I shares are not subject to sales charges and are available only to the Columbia Family of Funds.
Class R5 shares are not subject to sales charges and are generally available only to investors purchasing through authorized investment professionals and omnibus retirement plans.
Class W shares are not subject to sales charges and are available only to investors purchasing through authorized investment programs managed by investment professionals, including discretionary managed account programs.
Class Z shares are not subject to sales charges and are available only to eligible investors, which are subject to
different investment minimums as described in the Fund's prospectus.
Note 2. Summary of Significant Accounting Policies
Basis of Preparation
The Fund is an investment company that applies the accounting and reporting guidance in the Financial Accounting Standards Board (FASB) Accounting Standards Codification Topic 946, Financial Services — Investment Companies (ASC 946). The financial statements are prepared in accordance with U.S. generally accepted accounting principles (GAAP), which requires management to make certain estimates and assumptions that affect the reported amounts of assets and liabilities, the disclosure of contingent assets and liabilities at the date of the financial statements and the reported amounts of income and expenses during the reporting period. Actual results could differ from those estimates.
The following is a summary of significant accounting policies followed by the Fund in the preparation of its financial statements.
Security Valuation
Debt securities generally are valued by pricing services approved by the Board of Trustees (the Board) based upon market transactions for normal, institutional-size trading units of similar securities. The services may use various pricing techniques that take into account, as applicable, factors such as yield, quality, coupon rate, maturity, type of issue, trading characteristics and other data, as well as broker quotes. Debt securities for which quotations are not readily available or not believed to be reflective of market value may also be valued based upon a bid quote from an approved independent broker-dealer. Debt securities maturing in 60 days or less are valued primarily at amortized cost value, unless this method results in a valuation that management believes does not approximate market value.
Investments in open-end investment companies, including money market funds, are valued at their latest net asset value.
Investments for which market quotations are not readily available, or that have quotations which management believes are not reflective of market value or reliable, are valued at fair value as determined in good faith under procedures approved by and under the general supervision of the Board. If a security or class of
Annual Report 2016
22
COLUMBIA U.S. TREASURY INDEX FUND
NOTES TO FINANCIAL STATEMENTS (continued)
April 30, 2016
securities (such as foreign securities) is valued at fair value, such value is likely to be different from the quoted or published price for the security.
The determination of fair value often requires significant judgment. To determine fair value, management may use assumptions including but not limited to future cash flows and estimated risk premiums. Multiple inputs from various sources may be used to determine fair value.
GAAP requires disclosure regarding the inputs and valuation techniques used to measure fair value and any changes in valuation inputs or techniques. In addition, investments shall be disclosed by major category. This information is disclosed following the Fund's Portfolio of Investments.
Security Transactions
Security transactions are accounted for on the trade date. Cost is determined and gains (losses) are based upon the specific identification method for both financial statement and federal income tax purposes.
Income Recognition
Interest income is recorded on an accrual basis. Market premiums and discounts, including original issue discounts, are amortized and accreted, respectively, over the expected life of the security on all debt securities, unless otherwise noted.
The Fund may place a debt security on non-accrual status and reduce related interest income when it becomes probable that the interest will not be collected and the amount of uncollectible interest can be reasonably estimated. A defaulted debt security is removed from non-accrual status when the issuer resumes interest payments or when collectibility of interest is reasonably assured.
Dividend income is recorded on the ex-dividend date.
Expenses
General expenses of the Trust are allocated to the Fund and other funds of the Trust based upon relative net assets or other expense allocation methodologies determined by the nature of the expense. Expenses directly attributable to the Fund are charged to the Fund. Expenses directly attributable to a specific class of shares are charged to that share class.
Determination of Class Net Asset Value
All income, expenses (other than class-specific expenses, which are charged to that share class, as shown in the Statement of Operations) and realized and
unrealized gains (losses) are allocated to each class of the Fund on a daily basis, based on the relative net assets of each class, for purposes of determining the net asset value of each class.
Federal Income Tax Status
The Fund intends to qualify each year as a regulated investment company under Subchapter M of the Internal Revenue Code, as amended, and will distribute substantially all of its taxable income (including net short-term capital gains), if any, for its tax year, and as such will not be subject to federal income taxes. In addition, the Fund intends to distribute in each calendar year substantially all of its net investment income, capital gains and certain other amounts, if any, such that the Fund should not be subject to federal excise tax. Therefore, no federal income or excise tax provision is recorded.
Distributions to Shareholders
Distributions from net investment income, if any, are declared daily and paid monthly. Net realized capital gains, if any, are distributed at least annually. Income distributions and capital gain distributions are determined in accordance with federal income tax regulations, which may differ from GAAP.
Guarantees and Indemnifications
Under the Trust's organizational documents and, in some cases, by contract, its officers and trustees are indemnified against certain liabilities arising out of the performance of their duties to the Trust or its funds. In addition, certain of the Fund's contracts with its service providers contain general indemnification clauses. The Fund's maximum exposure under these arrangements is unknown since the amount of any future claims that may be made against the Fund cannot be determined, and the Fund has no historical basis for predicting the likelihood of any such claims.
Note 3. Fees and Other Transactions with Affiliates
Management Fees
Effective September 1, 2015, the Fund entered into a Management Agreement with Columbia Management Investment Advisers, LLC (the Investment Manager), a wholly-owned subsidiary of Ameriprise Financial, Inc. (Ameriprise Financial). Under the Management Agreement, the Investment Manager provides the Fund with investment research and advice, as well as
Annual Report 2016
23
COLUMBIA U.S. TREASURY INDEX FUND
NOTES TO FINANCIAL STATEMENTS (continued)
April 30, 2016
administrative and accounting services. The management services fee is an annual fee that is equal to 0.40% of the Fund's average daily net assets.
Prior to September 1, 2015, the Fund paid the Investment Manager an annual fee for advisory services under an Investment Management Services Agreement and a separate annual fee for administrative and accounting services under an Administrative Services Agreement. For the period from May 1, 2015 through August 31, 2015, the investment advisory services fee paid to the Investment Manager was $134,417, and the administrative services fee paid to the Investment Manager was $403,250.
The Investment Manager, from the management services fee it receives from the Fund, pays all operating expenses of the Fund, with the exception of brokerage fees and commissions, interest, fees and expenses of Trustees who are not officers, directors or employees of the Investment Manager or its affiliates, distribution and/or shareholder servicing and plan administration fees and any extraordinary non-recurring expenses that may arise, including litigation fees.
Compensation of Board Members
Board members, who are not officers or employees of the Investment Manager or Ameriprise Financial, are compensated for their services to the Fund as disclosed in the Statement of Operations. These Board members may participate in a Deferred Compensation Plan (the Plan) which may be terminated at any time. Obligations of the Plan will be paid solely out of the Fund's assets, and all amounts payable under the Plan constitute a general unsecured obligation of the Fund.
Compensation of Chief Compliance Officer
The Board has appointed a Chief Compliance Officer to the Fund in accordance with federal securities regulations. The Fund is allocated a portion of the expenses associated with the Chief Compliance Officer based on relative net assets of the Trust. The expenses of the Chief Compliance Officer allocated to the Fund are payable by the Investment Manager.
Transfer Agency Fees
Under a Transfer and Dividend Disbursing Agent Agreement, Columbia Management Investment Services Corp. (the Transfer Agent), an affiliate of the Investment Manager and a wholly-owned subsidiary of Ameriprise Financial, is responsible for providing transfer agency services to the Fund. The Transfer Agent has contracted
with Boston Financial Data Services (BFDS) to serve as sub-transfer agent.
The transfer agency fees are payable by the Investment Manager. The Transfer Agent pays the fees of BFDS for services as sub-transfer agent and is not entitled to reimbursement for such fees from the Fund. The Transfer Agent also receives compensation from the Investment Manager for various shareholder services and reimbursements for certain out-of-pocket expenses.
An annual minimum account balance fee of $20 may apply to certain accounts with a value below the applicable share class's initial minimum investment requirements to reduce the impact of small accounts on transfer agency fees. These minimum account balance fees are remitted to the Fund and recorded as part of expense reductions in the Statement of Operations. For the year ended April 30, 2016, these minimum account balance fees reduced total expenses of the Fund by $740.
Distribution and Service Fees
The Fund has an agreement with Columbia Management Investment Distributors, Inc. (the Distributor), an affiliate of the Investment Manager and a wholly-owned subsidiary of Ameriprise Financial, for distribution and shareholder services. The Board has approved, and the Fund has adopted, distribution and shareholder service plans (the Plans) applicable to certain share classes, which set the distribution and service fees for the Fund. These fees are calculated daily and are intended to compensate the Distributor and/or eligible selling and/or servicing agents for selling shares of the Fund and providing services to investors.
Under the Plans, the Fund pays a monthly service fee to the Distributor at the maximum annual rate of 0.25% of the average daily net assets attributable to Class A, Class B, Class C and Class W shares of the Fund. Also under the Plans, the Fund pays a monthly distribution fee to the Distributor at the maximum annual rates of 0.75%, 0.75% and 0.25% of the average daily net assets attributable to Class B, Class C and Class W shares of the Fund, respectively.
The Distributor has voluntarily agreed to waive a portion of the service fee for Class A, Class B and Class C shares so that the service fee does not exceed 0.15% annually of the average daily net assets attributable to each such share class. This arrangement may be modified or terminated by the Distributor at any time.
The Distributor has also voluntarily agreed to waive a portion of the distribution fee for Class C shares so that
Annual Report 2016
24
COLUMBIA U.S. TREASURY INDEX FUND
NOTES TO FINANCIAL STATEMENTS (continued)
April 30, 2016
the distribution fee does not exceed 0.70% annually of the average daily net assets attributable to Class C shares. This arrangement may be modified or terminated by the Distributor at any time.
Although the Fund may pay a distribution fee up to 0.25% of the Fund's average daily net assets attributable to Class W shares and a service fee of up to 0.25% of the Fund's average daily net assets attributable to Class W shares, the aggregate fee shall not exceed 0.25% of the Fund's average daily net assets attributable to Class W shares.
Sales Charges
Sales charges, including front-end charges and CDSCs, received by the Distributor for distributing Fund shares were $93 for Class A, $0 for Class B and $2,584 for Class C shares for the year ended April 30, 2016.
Expenses Waived/Reimbursed by the Investment Manager and its Affiliates
The Investment Manager and certain of its affiliates have contractually agreed to waive fees and/or reimburse expenses (excluding certain fees and expenses described below) for the period disclosed below, unless sooner terminated at the sole discretion of the Board, so that the Fund's net operating expenses, after giving effect to fees waived/expenses reimbursed and any balance credits and/or overdraft charges from the Fund's custodian, do not exceed the following annual rates as a percentage of the class' average daily net assets:
| | | Fee Rates Contractual
through
August 31, 2016 | |
Class A | | | 0.45 | % | |
Class B | | | 1.20 | | |
Class C | | | 1.20 | | |
Class I | | | 0.20 | | |
Class R5 | | | 0.20 | | |
Class W | | | 0.45 | | |
Class Z | | | 0.20 | | |
Under the agreement governing these fee waivers and/or expense reimbursement arrangements, the following fees and expenses are excluded from the waiver/reimbursement commitment, and therefore will be paid by the Fund, if applicable: taxes (including foreign transaction taxes), expenses associated with investments in affiliated and non-affiliated pooled investment vehicles (including mutual funds and exchange-traded funds), transaction costs and brokerage commissions, costs related to any securities lending
program, dividend and interest expenses associated with securities sold short, inverse floater program fees and expenses, transaction charges and interest on borrowed money, interest, extraordinary expenses and any other expenses the exclusion of which is specifically approved by the Board. This agreement may be modified or amended only with approval from the Investment Manager, certain of its affiliates and the Fund. Any fees waived and/or expenses reimbursed under the expense reimbursement arrangements described above are not recoverable by the Investment Manager or its affiliates in future periods. Class A, Class B and Class C distribution and service fees waived by the Distributor, as discussed above, are in addition to the waiver/reimbursement commitment under the agreement.
Note 4. Federal Tax Information
The timing and character of income and capital gain distributions are determined in accordance with income tax regulations, which may differ from GAAP because of temporary or permanent book to tax differences.
At April 30, 2016, these differences are primarily due to differing treatment for principal and/or interest from fixed income securities, deferral/reversal of wash sale losses, Trustees' deferred compensation and distributions. To the extent these differences are permanent, reclassifications are made among the components of the Fund's net assets in the Statement of Assets and Liabilities. Temporary differences do not require reclassifications.
In the Statement of Assets and Liabilities the following reclassifications were made:
Undistributed net investment income | | $ | 67,387 | | |
Accumulated net realized gain | | | (67,388 | ) | |
Paid-in capital | | | 1 | | |
Net investment income (loss) and net realized gains (losses), as disclosed in the Statement of Operations, and net assets were not affected by this reclassification.
The tax character of distributions paid during the years indicated was as follows:
Year Ended April 30, | | 2016 | | 2015 | |
Ordinary income | | $ | 6,923,343 | | | $ | 4,692,720 | | |
Long-term capital gains | | | 2,135,955 | | | | 251,830 | | |
Total | | $ | 9,059,298 | | | $ | 4,944,550 | | |
Short-term capital gain distributions, if any, are considered ordinary income distributions for tax purposes.
Annual Report 2016
25
COLUMBIA U.S. TREASURY INDEX FUND
NOTES TO FINANCIAL STATEMENTS (continued)
April 30, 2016
At April 30, 2016, the components of distributable earnings on a tax basis were as follows:
Undistributed ordinary income | | $ | 934,116 | | |
Undistributed long-term capital gains | | | 783,937 | | |
Net unrealized appreciation | | | 16,003,677 | | |
At April 30, 2016, the cost of investments for federal income tax purposes was $711,371,695 and the aggregate gross unrealized appreciation and depreciation based on that cost was:
Unrealized appreciation | | $ | 16,111,543 | | |
Unrealized depreciation | | | (107,866 | ) | |
Net unrealized appreciation | | $ | 16,003,677 | | |
Management of the Fund has concluded that there are no significant uncertain tax positions in the Fund that would require recognition in the financial statements. However, management's conclusion may be subject to review and adjustment at a later date based on factors including, but not limited to, new tax laws, regulations, and administrative interpretations (including relevant court decisions). Generally, the Fund's federal tax returns for the prior three fiscal years remain subject to examination by the Internal Revenue Service.
Note 5. Portfolio Information
The cost of purchases and proceeds from sales of securities, excluding short-term investments and derivatives, if any, aggregated to $747,252,343 and $458,452,996, respectively, for the year ended April 30, 2016, of which $747,252,343 and $458,452,996, respectively, were U.S. government securities. The amount of purchase and sale activity impacts the portfolio turnover rate reported in the Financial Highlights.
Note 6. Affiliated Money Market Fund
The Fund invests in Columbia Short-Term Cash Fund, an affiliated money market fund established for the exclusive use by the Fund and other affiliated funds. The income earned by the Fund from such investments is included as Dividends — affiliated issuers in the Statement of Operations. As an investing fund, the Fund indirectly bears its proportionate share of the expenses of Columbia Short-Term Cash Fund.
Note 7. Line of Credit
The Fund has access to a revolving credit facility whereby the Fund may borrow for the temporary funding of shareholder redemptions or for other temporary or
emergency purposes. Effective December 8, 2015, Citibank, N.A. and HSBC Bank USA, N.A. joined JPMorgan Chase Bank, N.A. (JPMorgan) as lead of a syndicate of banks under the credit facility, which is a collective agreement between the Fund and certain other funds managed by the Investment Manager, severally and not jointly, that permits collective borrowings up to $1 billion. Interest is charged to each participating fund based on its borrowings at a rate equal to the higher of (i) the overnight federal funds rate plus 1.00% or (ii) the one-month LIBOR rate plus 1.00%. Each borrowing under the credit facility matures no later than 60 days after the date of borrowing. The Fund also pays a commitment fee equal to its pro rata share of the amount of the credit facility at a rate of 0.15% per annum. The commitment fee is included in other expenses in the Statement of Operations. Prior to December 8, 2015, JPMorgan was the sole lead bank under the credit facility agreement that permitted borrowings up to $550 million under the same terms and interest rates as described above with the exception of the commitment fee which was charged at a rate of 0.075% per annum.
The Fund had no borrowings during the year ended April 30, 2016.
Note 8. Significant Risks
Shareholder Concentration Risk
At April 30, 2016, affiliated shareholders of record owned 73.8% of the outstanding shares of the Fund in one or more accounts. Subscription and redemption activity by concentrated accounts may have a significant effect on the operations of the Fund. In the case of a large redemption, the Fund may be forced to sell investments at inopportune times, including its liquid or more liquid positions, resulting in Fund losses and the Fund holding a higher percentage of less liquid or illiquid securities. Large redemptions could result in decreased economies of scale and increased operating expenses for non-redeeming Fund shareholders.
Credit Risk
Credit risk is the risk that the value of debt securities in the Fund's portfolio may decline because the issuer may default and fail to pay interest or repay principal when due. Rating agencies assign credit ratings to debt securities to indicate their credit risk. Lower rated or unrated debt securities held by the Fund may present increased credit risk as compared to higher-rated debt securities.
Annual Report 2016
26
COLUMBIA U.S. TREASURY INDEX FUND
NOTES TO FINANCIAL STATEMENTS (continued)
April 30, 2016
Interest Rate Risk
Interest rate risk is the risk of losses attributable to changes in interest rates. In general, if prevailing interest rates rise, the values of debt securities tend to fall, and if interest rates fall, the values of debt securities tend to rise. Actions by governments and central banking authorities can result in increases in interest rates. Increasing interest rates may negatively affect the value of debt securities held by the Fund, resulting in a negative impact on the Fund's performance and net asset value per share. In general, the longer the maturity or duration of a debt security, the greater its sensitivity to changes in interest rates.
Note 9. Subsequent Events
Management has evaluated the events and transactions that have occurred through the date the financial statements were issued and noted no items requiring adjustment of the financial statements or additional disclosure.
Note 10. Information Regarding Pending and Settled Legal Proceedings
In December 2005, without admitting or denying the allegations, American Express Financial Corporation (AEFC, which is now known as Ameriprise Financial, Inc. (Ameriprise Financial)) entered into settlement agreements with the Securities and Exchange Commission (SEC) and Minnesota Department of Commerce (MDOC) related to market timing activities. As a result, AEFC was censured and ordered to cease and desist from committing or causing any violations of certain provisions of the Investment Advisers Act of 1940, the Investment Company Act of 1940, and various Minnesota laws. AEFC agreed to pay disgorgement of $10 million and civil money penalties of $7 million. AEFC also agreed to retain an independent distribution consultant to assist in developing a plan for distribution of all disgorgement and civil penalties ordered by the SEC in accordance with various undertakings detailed at http://www.sec.gov/litigation/admin/ia-2451.pdf. Ameriprise Financial and its affiliates have cooperated with the SEC and the MDOC in these legal proceedings, and have made regular reports to the Funds' Boards of Trustees.
Ameriprise Financial and certain of its affiliates have historically been involved in a number of legal, arbitration and regulatory proceedings, including routine litigation, class actions, and governmental actions, concerning matters arising in connection with the conduct of their
business activities. Ameriprise Financial believes that the Funds are not currently the subject of, and that neither Ameriprise Financial nor any of its affiliates are the subject of, any pending legal, arbitration or regulatory proceedings that are likely to have a material adverse effect on the Funds or the ability of Ameriprise Financial or its affiliates to perform under their contracts with the Funds. Ameriprise Financial is required to make quarterly (10-Q), annual (10-K) and, as necessary, 8-K filings with the SEC on legal and regulatory matters that relate to Ameriprise Financial and its affiliates. Copies of these filings may be obtained by accessing the SEC website at www.sec.gov.
There can be no assurance that these matters, or the adverse publicity associated with them, will not result in increased fund redemptions, reduced sale of fund shares or other adverse consequences to the Funds. Further, although we believe proceedings are not likely to have a material adverse effect on the Funds or the ability of Ameriprise Financial or its affiliates to perform under their contracts with the Funds, these proceedings are subject to uncertainties and, as such, we are unable to estimate the possible loss or range of loss that may result. An adverse outcome in one or more of these proceedings could result in adverse judgments, settlements, fines, penalties or other relief that could have a material adverse effect on the consolidated financial condition or results of operations of Ameriprise Financial.
Annual Report 2016
27
COLUMBIA U.S. TREASURY INDEX FUND
REPORT OF INDEPENDENT REGISTERED PUBLIC ACCOUNTING FIRM
To the Trustees of Columbia Funds Series Trust I and the Shareholders of
Columbia U.S. Treasury Index Fund
In our opinion, the accompanying statement of assets and liabilities, including the portfolio of investments, and the related statements of operations and of changes in net assets and the financial highlights present fairly, in all material respects, the financial position of Columbia U.S. Treasury Index Fund (the "Fund", a series of Columbia Funds Series Trust I) at April 30, 2016, and the results of its operations, the changes in its net assets and the financial highlights for each of the periods indicated, in conformity with accounting principles generally accepted in the United States of America. These financial statements and financial highlights (hereafter referred to as "financial statements") are the responsibility of the Fund's management. Our responsibility is to express an opinion on these financial statements based on our audits. We conducted our audits of these financial statements in accordance with the standards of the Public Company Accounting Oversight Board (United States). Those standards require that we plan and perform the audit to obtain reasonable assurance about whether the financial statements are free of material misstatement. An audit includes examining, on a test basis, evidence supporting the amounts and disclosures in the financial statements, assessing the accounting principles used and significant estimates made by management, and evaluating the overall financial statement presentation. We believe that our audits, which included confirmation of securities at April 30, 2016 by correspondence with the custodian, brokers and transfer agent, and the application of alternative auditing procedures where such confirmations had not been received, provide a reasonable basis for our opinion.
PricewaterhouseCoopers LLP
Minneapolis, MN
June 21, 2016
Annual Report 2016
28
COLUMBIA U.S. TREASURY INDEX FUND
FEDERAL INCOME TAX INFORMATION
(Unaudited)
The Fund hereby designates the following tax attributes for the fiscal year ended April 30, 2016. Shareholders will be notified in early 2017 of the amounts for use in preparing 2016 income tax returns.
Tax Designations:
Capital Gain Dividend | | $ | 1,348,920 | | |
Capital Gain Dividend. The Fund designates as a capital gain dividend the amount reflected above, or if subsequently determined to be different, the net capital gain of such fiscal period.
Annual Report 2016
29
COLUMBIA U.S. TREASURY INDEX FUND
Shareholders elect the Board that oversees the Fund's operations. The Board appoints officers who are responsible for day-to-day business decisions based on policies set by the Board. The following table provides basic biographical information about the Fund's Trustees, including their principal occupations during the past five years, although specific titles for individuals may have varied over the period. The year set forth beneath Length of Service in the table below is the year in which the Trustee was first appointed or elected as Trustee to any Fund currently in the Columbia Funds Complex or a predecessor thereof. Under current Board policy, members serve terms of indefinite duration.
Trustees
Independent Trustees
Name,
Address,
Year of Birth | | Position Held With
the Funds and Length of
Service | | Principal Occupation(s)
During the Past Five Years
and Other Relevant
Professional Experience | | Number of
Funds in the
Columbia Funds
Complex
Overseen | | Other Directorships
Held by Trustee During
the Past Five Years | |
Janet Langford Carrig
c/o Columbia
Management Investment Advisers, LLC,
225 Franklin Street
Mail Drop BX32 05228,
Boston, MA 02110
1957 | | Trustee 1996 | | Senior Vice President, General Counsel and Corporate Secretary, ConocoPhillips (integrated energy company) since September 2007 | | | 58 | | | None | |
Douglas A. Hacker
c/o Columbia Management Investment Advisers, LLC,
225 Franklin Street
Mail Drop BX32 05228,
Boston, MA 02110
1955 | | Trustee and Chairman of the Board 1996 | | Independent business executive since May 2006; Executive Vice President — Strategy of United Airlines from December 2002 to May 2006; President of UAL Loyalty Services (airline marketing company) from September 2001 to December 2002; Executive Vice President and Chief Financial Officer of United Airlines from July 1999 to September 2001 | | | 58 | | | Spartan Nash Company (food distributor); Nash Finch Company (food distributor) from 2005 to 2013; Aircastle Limited (aircraft leasing); SeaCube Container Leasing Ltd. (container leasing) from 2010 to 2013; and Travelport Worldwide Limited (travel information technology) | |
Nancy T. Lukitsh
c/o Columbia Management Investment Advisers, LLC,
225 Franklin Street
Mail Drop BX32 05228,
Boston, MA 02110
1956 | | Trustee 2011 | | Senior Vice President, Partner and Director of Marketing, Wellington Management Company, LLP (investment adviser) from 1997 to 2010; Chair, Wellington Management Portfolios (commingled non-U.S. investment pools) from 2007 to 2010; Director, Wellington Trust Company, NA and other Wellington affiliates from 1997 to 2010 | | | 58 | | | None | |
Annual Report 2016
30
COLUMBIA U.S. TREASURY INDEX FUND
TRUSTEES AND OFFICERS (continued)
Independent Trustees (continued)
Name,
Address,
Year of Birth | | Position Held With
the Funds and Length of
Service | | Principal Occupation(s)
During the Past Five Years
and Other Relevant
Professional Experience | | Number of
Funds in the
Columbia Funds
Complex
Overseen | | Other Directorships
Held by Trustee During
the Past Five Years | |
William E. Mayer
c/o Columbia Management Investment Advisers, LLC,
225 Franklin Street
Mail Drop BX32 05228,
Boston, MA 02110
1940 | | Trustee 1991 | | Partner, Park Avenue Equity Partners (private equity) since February 1999 | | | 58 | | | DynaVox Inc. (speech creation); Lee Enterprises (print media); WR Hambrecht + Co. (financial service provider) from 2000 to 2012; BlackRock Capital Investment Corporation (investment company); and Premier, Inc. (healthcare) | |
David M. Moffett
c/o Columbia Management Investment Advisers, LLC,
225 Franklin Street
Mail Drop BX32 05228,
Boston, MA 02110
1952 | | Trustee 2011 | | Retired. Consultant to Bridgewater and Associates | | | 58 | | | Director of CIT Bank, CIT Group Inc. (commercial and consumer finance); eBay Inc. (online trading community); Genworth Financial, Inc. (financial and insurance products and services); Paypal Holdings Inc. (payment and data processing services); and Trustee University of Oklahoma Foundation | |
Charles R. Nelson
c/o Columbia Management Investment Advisers, LLC,
225 Franklin Street
Mail Drop BX32 05228,
Boston, MA 02110
1942 | | Trustee 1981 | | Retired. Professor Emeritus, University of Washington since 2011; Professor of Economics, University of Washington from 1976 to 2011; Ford and Louisa Van Voorhis Professor of Political Economy, University of Washington from 1993 to 2011; Adjunct Professor of Statistics, University of Washington from 1980 to 2011; Associate Editor, Journal of Money, Credit and Banking from September 1993 to 2008; consultant on econometric and statistical matters | | | 58 | | | None | |
John J. Neuhauser
c/o Columbia Management Investment Advisers, LLC,
225 Franklin Street
Mail Drop BX32 05228,
Boston, MA 02110
1943 | | Trustee 1984 | | President, Saint Michael's College since August 2007; Director or Trustee of several non-profit organizations, including University of Vermont Medical Center; Academic Vice President and Dean of Faculties, Boston College from August 1999 to October 2005; University Professor, Boston College from November 2005 to August 2007 | | | 58 | | | Liberty All-Star Equity Fund and Liberty All-Star Growth Fund (closed-end funds) | |
Annual Report 2016
31
COLUMBIA U.S. TREASURY INDEX FUND
TRUSTEES AND OFFICERS (continued)
Independent Trustees (continued)
Name,
Address,
Year of Birth | | Position Held With
the Funds and Length of
Service | | Principal Occupation(s)
During the Past Five Years
and Other Relevant
Professional Experience | | Number of
Funds in the
Columbia Funds
Complex
Overseen | | Other Directorships
Held by Trustee During
the Past Five Years | |
Patrick J. Simpson
c/o Columbia Management Investment Advisers, LLC,
225 Franklin Street
Mail Drop BX32 05228,
Boston, MA 02110
1944 | | Trustee 2000 | | Of Counsel, Perkins Coie LLP (law firm) since 2015; Partner, Perkins Coie LLP from 1988 to 2014 | | | 58 | | | None | |
Anne-Lee Verville
c/o Columbia Management Investment Advisers, LLC,
225 Franklin Street
Mail Drop BX32 05228,
Boston, MA 02110
1945 | | Trustee 1998 | | Retired. General Manager, Global Education Industry from 1994 to 1997, President — Application Systems Division from 1991 to 1994, Chief Financial Officer — US Marketing & Services from 1988 to 1991, and Chief Information Officer from 1987 to 1988, IBM Corporation (computer and technology) | | | 58 | | | Enesco Group, Inc. (producer of giftware and home and garden decor products) from 2001 to 2006 | |
Annual Report 2016
32
COLUMBIA U.S. TREASURY INDEX FUND
TRUSTEES AND OFFICERS (continued)
Interested Trustee Affiliated with Investment Manager*
Name,
Address,
Year of Birth | | Position Held With
the Funds and Length of
Service | | Principal Occupation(s)
During the Past Five Years
and Other Relevant
Professional Experience | | Number of
Funds in the
Columbia Funds
Complex
Overseen | | Other Directorships
Held by Trustee During
the Past Five Years | |
William F. Truscott
c/o Columbia Management Investment Advisers, LLC,
225 Franklin Street
Boston, MA 02110
1960 | | Trustee 2012 | | Chairman of the Board and President, Columbia Management Investment Advisers, LLC since May 2010 and February 2012, respectively (previously President and Chief Investment Officer, 2001-April 2010); Chief Executive Officer, Global Asset Management, Ameriprise Financial, Inc. since September 2012 (previously Chief Executive Officer, U.S. Asset Management & President, Annuities, May 2010- September 2012 and President — U.S. Asset Management and Chief Investment Officer, 2005-April 2010); Director and Chief Executive Officer, Columbia Management Investment Distributors, Inc. since May 2010 and February 2012, respectively (previously Chairman of the Board and Chief Executive Officer, 2006-April 2010); Chairman of the Board and Chief Executive Officer, RiverSource Distributors, Inc. since 2006; Director, Threadneedle Asset Management Holdings, SARL since 2014; President and Chief Executive Officer, Ameriprise Certificate Company, 2006-August 2012. | | | 178 | | | Chairman of the Board, Columbia Management Investment Advisers, LLC since May 2010; Director, Columbia Management Investment Distributors, Inc. since May 2010; Former Director, Ameriprise Certificate Company, 2006-January 2013 | |
* Interested person (as defined under the 1940 Act) by reason of being an officer, director, security holder and/or employee of the Investment Manager or Ameriprise Financial.
The Statement of Additional Information has additional information about the Fund's Board members and is available, without charge, upon request by calling 800.345.6611; contacting your financial intermediary; or visiting columbiathreadneedle.com/us.
Annual Report 2016
33
COLUMBIA U.S. TREASURY INDEX FUND
TRUSTEES AND OFFICERS (continued)
The Board has appointed officers who are responsible for day-to-day business decisions based on policies it has established. The officers serve at the pleasure of the Board. The following table provides basic information about the Officers of the Fund, including principal occupations during the past five years, although their specific titles may have varied over the period. In addition to Mr. Truscott, who is Senior Vice President, the Fund's other officers are:
Fund Officers
Name,
Address and
Year of Birth | | Position and Year
First Appointed to
Position for any Fund
in the Columbia
Funds Complex or a
Predecessor Thereof | |
Principal Occupation(s) During Past Five Years | |
Christopher O. Petersen
5228 Ameriprise Financial Center
Minneapolis, MN 55474
Born 1970 | | President and Principal Executive Officer (2015) | | Vice President and Lead Chief Counsel, Ameriprise Financial, Inc. since January 2015 (previously, Vice President and Chief Counsel January 2010-December 2014; and Vice President and Group Counsel or Counsel 2004-January 2010); officer of Columbia Funds and affiliated funds since 2007. | |
Michael G. Clarke
225 Franklin Street
Boston, MA 02110
Born 1969 | | Treasurer (2011), Chief Financial Officer (2009) and Chief Accounting Officer (2015) | | Vice President — Mutual Fund Administration, Columbia Management Investment Advisers, LLC, since May 2010; Managing Director of Fund Administration, Columbia Management Advisors, LLC, September 2004-April 2010; senior officer of Columbia Funds and affiliated funds since 2002. | |
Paul B. Goucher
100 Park Avenue
New York, NY 10017
Born 1968 | | Senior Vice President (2011), Chief Legal Officer (2015) and Assistant Secretary (2008) | | Vice President and Lead Chief Counsel, Ameriprise Financial, Inc. since November 2008 and January 2013, respectively (previously Chief Counsel, January 2010-January 2013 and Group Counsel, November 2008-January 2010). | |
Thomas P. McGuire
225 Franklin Street
Boston, MA 02110
Born 1972 | | Senior Vice President and Chief Compliance Officer (2012) | | Vice President — Asset Management Compliance, Ameriprise Financial, Inc., since May 2010; Chief Compliance Officer, Ameriprise Certificate Company since September 2010; Compliance Executive, Bank of America, 2005-April 2010. | |
Colin Moore
225 Franklin Street
Boston, MA 02110
Born 1958 | | Senior Vice President (2010) | | Executive Vice President and Global Chief Investment Officer, Ameriprise Financial, Inc., since July 2013; Director and Global Chief Investment Officer, Columbia Management Investment Advisers, LLC since May 2010; Manager, Managing Director and Chief Investment Officer, Columbia Management Advisors, LLC, 2007-April 2010. | |
Michael E. DeFao
225 Franklin Street
Boston, MA 02110
Born 1968 | | Vice President (2011) and Assistant Secretary (2010) | | Vice President and Chief Counsel, Ameriprise Financial, Inc. since May 2010; Associate General Counsel, Bank of America, 2005-April 2010. | |
Amy Johnson
5228 Ameriprise Financial Center
Minneapolis, MN 55474
Born 1965 | | Vice President (2006) | | Managing Director and Chief Operating Officer, Columbia Management Investment Advisers, LLC since May 2010 (previously Chief Administrative Officer, 2009-April 2010, and Vice President — Asset Management and Trust Company Services, 2006-2009). | |
Lyn Kephart-Strong
5228 Ameriprise
Financial Center
Minneapolis, MN 55474
Born 1960 | | Vice President (2015) | | President, Columbia Management Investment Services Corp. since October 2014; Vice President & Resolution Officer, Ameriprise Trust Company since August 2009; President, RiverSource Service Corporation 2004-2010. | |
Ryan C. Larrenaga
225 Franklin Street
Boston, MA 02110
Born 1970 | | Vice President and Secretary (2015) | | Vice President and Group Counsel, Ameriprise Financial, Inc. since August 2011 (previously, Counsel from May 2010 to August 2011); Assistant General Counsel, Bank of America, 2005-April 2010; officer of Columbia Funds and affiliated funds since 2005. | |
Annual Report 2016
34
COLUMBIA U.S. TREASURY INDEX FUND
IMPORTANT INFORMATION ABOUT THIS REPORT
Each fund mails one shareholder report to each shareholder address. If you would like more than one report, please call shareholder services at 800.345.6611 and additional reports will be sent to you.
The policy of the Board is to vote the proxies of the companies in which each fund holds investments consistent with the procedures as stated in the Statement of Additional Information (SAI). You may obtain a copy of the SAI without charge by calling 800.345.6611; contacting your financial intermediary; visiting columbiathreadneedle.com/us; or searching the website of the Securities and Exchange Commission (SEC) at sec.gov. Information regarding how each fund voted proxies relating to portfolio securities is filed with the SEC by August 31st for the most recent 12-month period ending June 30th of that year, and is available without charge by visiting columbiathreadneedle.com/us, or searching the website of the SEC at sec.gov.
Each fund files a complete schedule of portfolio holdings with the SEC for the first and third quarters of each fiscal year on Form N-Q. Each fund's Form N-Q is available on the SEC's website at sec.gov and may be reviewed and copied at the SEC's Public Reference Room in Washington, D.C. Information on the operation of the Public Reference Room may be obtained by calling 800.SEC.0330. Each fund's complete schedule of portfolio holdings, as filed on Form N-Q, can also be obtained without charge, upon request, by calling 800.345.6611.
Annual Report 2016
35
Columbia U.S. Treasury Index Fund
P.O. Box 8081
Boston, MA 02266-8081

This information is for use with concurrent or prior delivery of a fund prospectus. Please read and consider the investment objectives, risks, charges and expenses for any fund carefully before investing. For a prospectus and summary prospectus, which contains this and other important information about the Fund, go to columbiathreadneedle.com/us. The Fund is distributed by Columbia Management Investment Distributors, Inc., member FINRA, and managed by Columbia Management Investment Advisers, LLC.
Columbia Threadneedle Investments (Columbia Threadneedle) is the global brand name of the Columbia and Threadneedle group of companies.
All rights reserved. Columbia Management Investment Distributors, Inc., 225 Franklin Street, Boston, MA 02110-2804
© 2016 Columbia Management Investment Advisers, LLC.
columbiathreadneedle.com/us
ANN237_04_F01_(06/16)
Item 2. Code of Ethics.
(a) The registrant has adopted a code of ethics that applies to the registrant’s principal executive officer, principal financial officer, principal accounting officer or controller, or persons performing similar functions, regardless of whether these individuals are employed by the registrant or a third party.
(b) During the period covered by this report, there were not any amendments to a provision of the code of ethics adopted in 2(a) above.
(c) During the period covered by this report, there were no waivers, including any implicit waivers, from a provision of the code of ethics described in 2(a) above that relates to one or more of the items set forth in paragraph (b) of this item’s instructions.
Item 3. Audit Committee Financial Expert.
The registrant’s Board of Trustees has determined that Douglas A. Hacker, David M. Moffett and Anne-Lee Verville, each of whom are members of the registrant’s Board of Trustees and Audit Committee, each qualify as an audit committee financial expert. Mr. Hacker, Mr. Moffett and Ms. Verville are each independent trustees, as defined in paragraph (a)(2) of this item’s instructions.
Item 4. Principal Accountant Fees and Services.
Fee information below is disclosed for the six series of the registrant whose reports to stockholders are included in this annual filing.
(a) Audit Fees. Aggregate Audit Fees billed by the principal accountant for professional services rendered during the fiscal years ended April 30, 2016 and April 30, 2015 are approximately as follows:
2016 | | 2015 | |
$ | 154,500 | | $ | 139,100 | |
| | | | | |
Audit Fees include amounts related to the audit of the registrant’s annual financial statements or services that are normally provided by the accountant in connection with statutory and regulatory filings or engagements for those fiscal years.
(b) Audit-Related Fees. Aggregate Audit-Related Fees billed to the registrant by the principal accountant for professional services rendered during the fiscal years ended April 30, 2016 and April 30, 2015 are approximately as follows:
Audit-Related Fees include amounts for assurance and related services by the principal accountant that are reasonably related to the performance of the audit of the registrant’s financial statements and are not reported in Audit Fees above. In fiscal years 2016 and 2015, Audit-Related Fees consist of agreed-upon procedures performed for semi-annual shareholder reports.
During the fiscal years ended April 30, 2016 and April 30, 2015, there were no Audit-Related Fees billed by the registrant’s principal accountant to the registrant’s investment adviser (not including any sub-adviser whose role is primarily portfolio management and is subcontracted with or overseen by another investment adviser) and any entity controlling, controlled by, or under common control with the adviser that provides ongoing services to the registrant for an engagement that related directly to the operations and financial reporting of the registrant.
(c) Tax Fees. Aggregate Tax Fees billed by the principal accountant to the registrant for professional services rendered during the fiscal years ended April 30, 2016 and April 30, 2015 are approximately as follows:
2016 | | 2015 | |
$ | 33,100 | | $ | 26,300 | |
| | | | | |
Tax Fees include amounts for the review of annual tax returns, the review of required shareholder distribution calculations and typically include amounts for professional services by the principal accountant for tax compliance, tax advice and tax planning.
During the fiscal years ended April 30, 2016 and April 30, 2015, there were no Tax Fees billed by the registrant’s principal accountant to the registrant’s investment adviser (not including any sub-adviser whose role is primarily portfolio management and is subcontracted with or overseen by another investment adviser) and any entity controlling, controlled by, or under common control with the adviser that provides ongoing services to the registrant for an engagement that related directly to the operations and financial reporting of the registrant.
(d) All Other Fees. Aggregate All Other Fees billed by the principal accountant to the registrant for professional services rendered during the fiscal years ended April 30, 2016 and April 30, 2015 are approximately as follows:
All Other Fees include amounts for products and services provided by the principal accountant, other than the services reported in paragraphs (a) through (c) above.
Aggregate All Other Fees billed by the registrant’s principal accountant to the registrant’s investment adviser (not including any sub-adviser whose role is primarily portfolio management and is subcontracted with or overseen by another investment adviser) and any entity controlling, controlled by, or under common control with the adviser that provides ongoing services to the registrant for an engagement that related directly to the operations and financial reporting of the registrant during the fiscal years ended April 30, 2016 and April 30, 2015 are approximately as follows:
2016 | | 2015 | |
$ | 335,000 | | $ | 225,000 | |
| | | | | |
In fiscal years 2016 and 2015, All Other Fees primarily consists of fees billed for internal control examinations of the registrant’s transfer agent and investment adviser.
(e)(1) Audit Committee Pre-Approval Policies and Procedures
The registrant’s Audit Committee is required to pre-approve the engagement of the registrant’s independent auditors to provide audit and non-audit services to the registrant and non-audit services to its investment adviser (excluding any sub-adviser whose role is primarily portfolio management and is sub-contracted or overseen by another investment adviser (the “Adviser”) or any entity controlling, controlled by or under common control with the Adviser that provides ongoing services to the Fund (a “Control Affiliate”) if the engagement relates directly to the operations and financial reporting of the registrant.
The Audit Committee has adopted a Policy for Engagement of Independent Auditors for Audit and Non-Audit Services (the “Policy”). The Policy sets forth the understanding of the Audit Committee regarding the engagement of the registrant’s independent accountants to provide (i) audit and permissible audit-related, tax and other services to the registrant (“Fund Services”); (ii) non-audit services to the registrant’s Adviser and any Control Affiliates, that relates directly to the operations and financial reporting of a Fund (“Fund-related Adviser Services”); and (iii) certain other audit and non-audit services to the registrant’s Adviser and its Control Affiliates. A service will require specific pre-approval by the Audit Committee if it is to be provided by the Fund’s independent auditor; provided, however, that pre-approval of non-audit services to the Fund, the Adviser or Control Affiliates may be waived if certain de minimis requirements set forth in the SEC’s rules are met.
Under the Policy, the Audit Committee may delegate pre-approval authority to any pre-designated member or members who are independent board members. The member(s) to whom such authority is delegated must report, for informational purposes only, any pre-approval decisions to the Audit Committee at its next regular meeting. The Audit Committee’s responsibilities with respect to the pre-approval of services performed by the independent auditor may not be delegated to management.
On an annual basis, at a regularly scheduled Audit Committee meeting, the Fund’s Treasurer or other Fund officer shall submit to the Audit Committee a schedule of the types of Fund Services and Fund-related Adviser Services that are subject to specific pre-approval. This schedule will provide a description of each type of service that is subject to specific pre-approval, along with total projected fees for each service. The pre-approval will generally cover a one-year period. The Audit Committee will review and approve the types of services and the projected fees for the next one-year period and may add to, or subtract from, the list of pre-approved services from time to time, based on subsequent determinations. This specific approval acknowledges that the Audit Committee is in agreement with the specific types of services that the independent auditor will be permitted to perform and the projected fees for each service.
The Fund’s Treasurer or other Fund officer shall report to the Audit Committee at each of its regular meetings regarding all Fund Services or Fund-related Adviser Services provided since the last such report was rendered, including a description of the services, by category, with forecasted fees for the annual reporting period, proposed changes requiring specific pre-approval and a description of services provided by the independent auditor, by category, with actual fees during the current reporting period.
*****
(e)(2) 100% of the services performed for items (b) through (d) above during 2016 and 2015 were pre-approved by the registrant’s Audit Committee.
(f) Not applicable.
(g) The aggregate non-audit fees billed by the registrant’s accountant for services rendered to the registrant, and rendered to the registrant’s investment adviser (not including any sub-adviser whose role is primarily portfolio management and is subcontracted with or overseen by another investment adviser), and any entity controlling, controlled by, or under common control with the adviser that provides ongoing services to the registrant during the fiscal years ended April 30, 2016 and April 30, 2015 are approximately as follows:
2016 | | 2015 | |
$ | 370,500 | | $ | 253,300 | |
| | | | | |
(h) The registrant’s Audit Committee of the Board of Directors has considered whether the provision of non-audit services that were rendered to the registrant’s adviser (not including any sub-adviser whose role is primarily portfolio management and is subcontracted with or overseen by another investment adviser), and any entity controlling, controlled by, or under common control with the investment adviser that provides ongoing services to the registrant that were not pre-approved pursuant to paragraph (c)(7)(ii) of Rule 2-01 of Regulation S-X, is compatible with maintaining the principal accountant’s independence.
Item 5. Audit Committee of Listed Registrants.
Not applicable.
Item 6. Investments
(a) The registrant’s “Schedule I — Investments in securities of unaffiliated issuers” (as set forth in 17 CFR 210.12-12) is included in Item 1 of this Form N-CSR.
(b) Not applicable.
Item 7. Disclosure of Proxy Voting Policies and Procedures for Closed-End Management Investment Companies.
Not applicable.
Item 8. Portfolio Managers of Closed-End Management Investment Companies.
Not applicable.
Item 9. Purchases of Equity Securities by Closed-End Management Investment Company and Affiliated Purchasers.
Not applicable.
Item 10. Submission of Matters to a Vote of Security Holders.
There were no material changes to the procedures by which shareholders may recommend nominees to the registrant’s board of directors.
Item 11. Controls and Procedures.
(a) The registrant’s principal executive officer and principal financial officers, based on their evaluation of the registrant’s disclosure controls and procedures as of a date within 90 days of the filing of this report, have concluded that such controls and procedures are adequately designed to ensure that material information required to be disclosed by the registrant in Form N-CSR is accumulated and communicated to the registrant’s management, including the principal executive officer and principal financial officer, or persons performing similar functions, as appropriate to allow timely decisions regarding required disclosure.
(b) There was no change in the registrant’s internal control over financial reporting that occurred during the registrant’s second fiscal quarter of the period covered by this report that has materially affected, or is reasonably likely to materially affect, the registrant’s internal control over financial reporting.
Item 12. Exhibits.
(a)(1) Code of ethics required to be disclosed under Item 2 of Form N-CSR attached hereto as Exhibit 99.CODE ETH.
(a)(2) Certifications pursuant to Rule 30a-2(a) under the Investment Company Act of 1940 (17 CFR 270.30a-2(a)) attached hereto as Exhibit 99.CERT.
(a)(3) Not applicable.
(b) Certification pursuant to Rule 30a-2(b) under the Investment Company Act of 1940 (17 CFR 270.30a-2(b)) attached hereto as Exhibit 99.906CERT.
SIGNATURES
Pursuant to the requirements of the Securities Exchange Act of 1934 and the Investment Company Act of 1940, the registrant has duly caused this report to be signed on its behalf by the undersigned, thereunto duly authorized.
(registrant) | | Columbia Funds Series Trust I |
|
|
By (Signature and Title) | /s/ Christopher O. Petersen |
| Christopher O. Petersen, President and Principal Executive Officer |
|
|
Date | | June 21, 2016 |
| |
Pursuant to the requirements of the Securities Exchange Act of 1934 and the Investment Company Act of 1940, this report has been signed below by the following persons on behalf of the registrant and in the capacities and on the dates indicated. |
| |
By (Signature and Title) | /s/ Christopher O. Petersen |
| Christopher O. Petersen, President and Principal Executive Officer |
|
|
Date | | June 21, 2016 |
|
|
By (Signature and Title) | /s/ Michael G. Clarke |
| Michael G. Clarke, Treasurer and Chief Financial Officer |
|
|
Date | | June 21, 2016 |
| | | | | |