UNITED STATES
SECURITIES AND EXCHANGE COMMISSION
Washington, D.C. 20549
FORM N-CSR
CERTIFIED SHAREHOLDER REPORT OF REGISTERED
MANAGEMENT INVESTMENT COMPANIES
Investment Company Act file number | 811-04367 |
|
Columbia Funds Series Trust I |
(Exact name of registrant as specified in charter) |
|
225 Franklin Street, Boston, Massachusetts | | 02110 |
(Address of principal executive offices) | | (Zip code) |
|
Ryan Larrenaga c/o Columbia Management Investment Advisers, LLC 225 Franklin Street Boston, MA 02110 |
(Name and address of agent for service) |
|
Registrant’s telephone number, including area code: | (800) 345-6611 | |
|
Date of fiscal year end: | May 31 | |
|
Date of reporting period: | May 31, 2016 | |
| | | | | | | | |
Form N-CSR is to be used by management investment companies to file reports with the Commission not later than 10 days after the transmission to stockholders of any report that is required to be transmitted to stockholders under Rule 30e-1 under the Investment Company Act of 1940 (17 CFR 270.30e-1). The Commission may use the information provided on Form N-CSR in its regulatory, disclosure review, inspection, and policymaking roles.
A registrant is required to disclose the information specified by Form N-CSR, and the Commission will make this information public. A registrant is not required to respond to the collection of information contained in Form N-CSR unless the Form displays a currently valid Office of Management and Budget (“OMB”) control number. Please direct comments concerning the accuracy of the information collection burden estimate and any suggestions for reducing the burden to Secretary, Securities and Exchange Commission, 450 Fifth Street, NW, Washington, DC 20549-0609. The OMB has reviewed this collection of information under the clearance requirements of 44 U.S.C. § 3507.
Item 1. Reports to Stockholders.

ANNUAL REPORT
May 31, 2016

COLUMBIA HIGH YIELD MUNICIPAL FUND


ABOUT COLUMBIA THREADNEEDLE INVESTMENTS
Columbia Threadneedle Investments is a leading global asset management group that provides a broad range of actively managed investment strategies and solutions for individual, institutional and corporate clients around the world.
With more than 2,000 people, including over 450 investment professionals based in North America, Europe and Asia, we manage $464 billion* of assets across developed and emerging market equities, fixed income, asset allocation solutions and alternatives. We are the 13th largest manager of long-term mutual fund assets in the U.S.** and the 3rd largest manager of retail funds in the U.K.***
Our priority is the investment success of our clients. We aim to deliver the investment outcomes they expect through an investment approach that is team-based, performance-driven and risk-aware. Our culture is dynamic and interactive. By sharing our insights across asset classes and geographies, we generate richer perspectives on global, regional and local investment landscapes. The ability to exchange and debate investment ideas in a collaborative environment enriches our teams' investment processes. More importantly, it results in better informed investment decisions for our clients.
Columbia funds are distributed by Columbia Management Investment Distributors, Inc., member FINRA, and managed by Columbia Management Investment Advisers, LLC.
Columbia Threadneedle Investments (Columbia Threadneedle) is the global brand name of the Columbia and Threadneedle group of companies.
* In U.S. dollars as of March 31, 2016. Source: Ameriprise Q1 Earnings Release. Includes all assets managed by entities in the Columbia and Threadneedle group of companies. Contact us for more current data.
** Source: ICI as of March 31, 2016 for Columbia Management Investment Advisers, LLC.
*** Source: Investment Association as of December 2015 for Threadneedle Asset Management Limited.
© 2016 Columbia Management Investment Advisers, LLC. All rights reserved.
Not part of the shareholder report
 Dear Shareholders,
Volatility comes with the territory for long-term investors. Some investors instinctively want to pull out of the market or sell underperforming investments at the first sign of increased volatility or perhaps even as soon as they perceive it on the horizon. But taking yourself out of the market could mean losing out on potential opportunities, and putting your longer-term investment goals at risk.
Cumulative return is not just about achieving high returns when markets are going up; it's also about remaining invested and minimizing losses during weak or volatile markets so that you can participate on the upside. Developing a deeper understanding of the various risks your portfolio is subject to can help you balance these risks.
Diversification is critical in seeking to achieve that balance. We believe that most portfolios could be more effectively diversified either by introducing holdings with performance profiles unrelated to existing holdings (like alternative products) or by rebalancing existing holdings with an eye toward risk allocation. Over time, distributing risk more evenly may produce a more pronounced diversification benefit and may improve portfolio efficiency. We believe market volatility can create significant opportunities and, in fact, these periods may be some of the very best times to invest.
With this in mind, I thought it important to highlight excerpts from a piece written by Colin Moore, Global Chief Investment Officer, in which he touches on some of these issues emphasizing the importance of a properly constructed portfolio in seeking to effectively manage volatility and to achieve consistency of returns. I encourage you to read the article in its entirety. To access the full article and for other insights on current market, please visit blog.columbiathreadneedleus.com/latest-perspectives.
You need investments that are designed to help you ease the impact of volatile market environments and keep the savings you have worked tirelessly to amass. Columbia Threadneedle Investments provides investment solutions to help you tackle financial challenges and achieve your desired outcome.
Best regards,

Christopher O. Petersen
President, Columbia Funds
Excerpts from:
Taking the scare out of the volatility bogeyman
By Colin Moore, Global Chief Investment Officer
Colin Moore is the global chief investment officer for Columbia Threadneedle Investments. His responsibilities include ensuring that a disciplined investment process is in place across all asset classes, including equity and fixed income. Mr. Moore joined one of the Columbia Threadneedle Investments legacy firms in 2002 as head of equity and was also head of fixed income and liquidity strategies from 2009 – 2010.

n In today's low growth, higher volatility world, the emphasis is shifting from maximization of returns to consistency of returns.
PRESIDENT'S MESSAGE (continued)
n Portfolios should represent the behavioral risk-return tradeoff of investors, remembering that they won't stay invested to realize the return if we get the risk tolerance wrong.
n Holding long-term savings in cash to avoid volatility (the financial equivalent of hiding under the sheets) is detrimental to achieving long-term goals.
According to Wikipedia, "The bogeyman is a common allusion to a mythical creature in many cultures used to control behavior. This monster has no specific appearance, and conceptions about it can vary drastically from household to household within the same community; in many cases he has no set appearance in the mind of an adult or child, but is simply a non-specific embodiment of terror." Different cultures have different names and physical representations for the bogeyman, and investors are no different. We have terrible monsters that we fear may destroy our portfolios, and we call one of the scariest of them volatility.
While the bogeyman is mythical (I hope!), volatility is real and can cause serious damage. To understand why investors have such a hard time coping with volatility, we first need to define three cognitive biases at work in today's investment environment:
1) Recency bias — something that has recently come to the forefront of our attention, regardless of how long established it is, suddenly seems to appear with improbable frequency.
2) Negativity bias — we tend to have a greater recall of unpleasant memories than positive memories.
3) Loss aversion — our dissatisfaction with losing money tends to be greater than our satisfaction with making money.
The level of volatility varies dramatically, and so does investor fear and panic selling — waxing when volatility rises, waning when it falls. Recent studies have pointed to demographics as an important driver of panic selling. The theory is that as people get closer to retirement, the prospects of a large (20% – 30%) loss in financial assets can have a much more pronounced effect on their sense of well-being. Wealth preservation instincts kick in much more quickly than for younger (and typically less wealthy) savers.
The reality is that there is little opportunity for return without volatility. Therefore, the bogeyman effect of holding long-term savings in cash to avoid volatility (the financial equivalent of hiding under the sheets) is detrimental to achieving long-term goals. This effect tends to be more pronounced during the episodic spikes in volatility. The significant spike in volatility in 2008 and 2009 led to significant withdrawals from long-term investment funds over the same period. Less pronounced effects can also be seen when comparing 2001 – 2003 and 2011 – 2012. Conversely, flows picked up when volatility returned to "normal" levels. Investor behavior of this type is consistent with the three behavioral biases.
I believe average volatility will be higher over the next 10 years than the last 10 years and episodic spikes will increase in frequency because sustainable economic growth will be structurally lower and geopolitical risk higher than any time since World War II. Low growth creates uncertainty while loss aversion will make investors fear that we are one economic mishap or geopolitical event away from no growth or recession. The result will be higher volatility on average. Negativity bias will tend to exacerbate "spike" reactions to event-driven geopolitical news, and the volatility bogeyman will appear more often. Assuming the behavioral biases continue, investor returns are likely to be very disappointing regardless of the total return generated by financial markets due to the bogeyman effect.
To mitigate this effect, we need to focus on portfolio construction and an improved understanding of diversification. I accept that equities are likely to offer the highest return over the next 10 years, but they also offer the highest volatility. Many portfolio construction optimization tools use historical average volatility, which is likely to underestimate the volatility investors will face. The bogeyman emerges when individual asset class volatility spikes and cross correlations rise, the combination of which increases overall portfolio volatility far beyond expectation. Diversification is meant to protect investors against volatility, but what's the point of owning lots of investments if the volatility bogeyman has not been properly estimated?
Most importantly, portfolios should be constructed to properly represent the behavioral risk-return tradeoff of investors, remembering that they won't stay invested to realize the return if we get the risk tolerance wrong. In a low growth, higher volatility world, the emphasis is shifting to return consistency rather than return maximization,
PRESIDENT'S MESSAGE (continued)
and investors are best served through investment approaches that appreciate that distinction. Even though it's a permanent feature of financial markets, volatility is less likely to be the bogeyman we all fear if portfolios are constructed with this understanding.
Please visit blog.columbiathreadneedleus.com/latest-perspectives to read the entire article.
Investors should consider the investment objectives, risks, charges and expenses of a mutual fund carefully before investing. For a free prospectus and summary prospectus, which contains this and other important information about a fund, visit columbiathreadneedle.com/us. The prospectus should be read carefully before investing.
The views expressed are as of April 2016, may change as market or other conditions change, and may differ from views expressed by other Columbia Management Investment Advisers, LLC (CMIA) associates or affiliates. Actual investments or investment decisions made by CMIA and its affiliates, whether for its own account or on behalf of clients, will not necessarily reflect the views expressed. This information is not intended to provide investment advice and does not account for individual investor circumstances. Investment decisions should always be made based on an investor's specific financial needs, objectives, goals, time horizon and risk tolerance. Asset classes described may not be suitable for all investors.
Past performance does not guarantee future results, and no forecast should be considered a guarantee either. Since economic and market conditions change frequently, there can be no assurance that the trends described here will continue or that the forecasts are accurate.
Diversification does not guarantee a profit or protect against loss.
Columbia Funds are distributed by Columbia Management Investment Distributors, Inc., member FINRA, and managed by Columbia Management Investment Advisers, LLC.
© 2016 Columbia Management Investment Advisers, LLC. All rights reserved
COLUMBIA HIGH YIELD MUNICIPAL FUND
Fund Investment Manager
Columbia Management Investment
Advisers, LLC
225 Franklin Street
Boston, MA 02110
Fund Distributor
Columbia Management Investment
Distributors, Inc.
225 Franklin Street
Boston, MA 02110
Fund Transfer Agent
Columbia Management Investment
Services Corp.
P.O. Box 8081
Boston, MA 02266-8081
For more information about any of the funds, please visit columbiathreadneedle.com/us or call 800.345.6611. Customer Service Representatives are available to answer your questions Monday through Friday from 8 a.m. to 7 p.m. Eastern time.
The views expressed in this report reflect the current views of the respective parties. These views are not guarantees of future performance and involve certain risks, uncertainties and assumptions that are difficult to predict, so actual outcomes and results may differ significantly from the views expressed. These views are subject to change at any time based upon economic, market or other conditions and the respective parties disclaim any responsibility to update such views. These views may not be relied on as investment advice and, because investment decisions for a Columbia fund are based on numerous factors, may not be relied on as an indication of trading intent on behalf of any particular Columbia fund. References to specific securities should not be construed as a recommendation or investment advice.
Performance Overview | | | 3 | | |
Manager Discussion of Fund Performance | | | 5 | | |
Understanding Your Fund's Expenses | | | 8 | | |
Portfolio of Investments | | | 9 | | |
Statement of Assets and Liabilities | | | 26 | | |
Statement of Operations | | | 28 | | |
Statement of Changes in Net Assets | | | 29 | | |
Financial Highlights | | | 31 | | |
Notes to Financial Statements | | | 37 | | |
Report of Independent Registered Public Accounting Firm | | | 44 | | |
Federal Income Tax Information | | | 45 | | |
Trustees and Officers | | | 46 | | |
Important Information About This Report | | | 51 | | |
COLUMBIA HIGH YIELD MUNICIPAL FUND
Performance Summary
n Columbia High Yield Municipal Fund (the Fund) Class A shares returned 6.27% excluding sales charges for the 12-month period that ended May 31, 2016. Class Z shares returned 6.48% for the same period.
n The Fund outperformed its Blended Benchmark and the Barclays High Yield Municipal Bond Index, which returned 5.20% and 4.70%, respectively, during the same 12-month period.
n The Fund's underweight position in Puerto Rico-related issues and overweight position in longer maturity bonds were the most important factors in its positive relative performance.
Average Annual Total Returns (%) (for period ended May 31, 2016)
| | | Inception | | 1 Year | | 5 Years | | 10 Years | |
Class A | | 07/31/00 | | | | | | | | | | | | | |
Excluding sales charges | | | | | | | 6.27 | | | | 7.44 | | | | 4.55 | | |
Including sales charges | | | | | | | 3.09 | | | | 6.80 | | | | 4.24 | | |
Class B | | 07/15/02 | | | | | | | | | | | | | |
Excluding sales charges | | | | | | | 5.48 | | | | 6.64 | | | | 3.78 | | |
Including sales charges | | | | | | | 0.48 | | | | 6.33 | | | | 3.78 | | |
Class C | | 07/15/02 | | | | | | | | | | | | | |
Excluding sales charges | | | | | | | 5.58 | | | | 6.78 | | | | 3.92 | | |
Including sales charges | | | | | | | 4.58 | | | | 6.78 | | | | 3.92 | | |
Class R4* | | 03/19/13 | | | 6.58 | | | | 7.68 | | | | 4.78 | | |
Class R5* | | 11/08/12 | | | 6.67 | | | | 7.75 | | | | 4.81 | | |
Class Z | | 03/05/84 | | | 6.48 | | | | 7.65 | | | | 4.76 | | |
Blended Benchmark | | | | | | | 5.20 | | | | 6.55 | | | | 4.95 | | |
Barclays High Yield Municipal Bond Index | | 05/30/03 | | | 4.70 | | | | 7.51 | | | | 4.88 | | |
Returns for Class A are shown with and without the maximum initial sales charge of 3.00%. Returns for Class B are shown with and without the applicable contingent deferred sales charge (CDSC) of 5.00% in the first year, declining to 1.00% in the sixth year and eliminated thereafter. Returns for Class C are shown with and without the 1.00% CDSC for the first year only. The Fund's other classes are not subject to sales charges and have limited eligibility. Please see the Fund's prospectus for details. Performance for different share classes will vary based on differences in sales charges and fees associated with each class. All results shown assume reinvestment of distributions during the period. Returns do not reflect the deduction of taxes that a shareholder may pay on Fund distributions or on the redemption of Fund shares. Performance results reflect the effect of any fee waivers or reimbursements of Fund expenses by Columbia Management Investment Advisers, LLC and/or any of its affiliates. Absent these fee waivers or expense reimbursement arrangements, performance results would have been lower.
The performance information shown represents past performance and is not a guarantee of future results. The investment return and principal value of your investment will fluctuate so that your shares, when redeemed, may be worth more or less than their original cost. Current performance may be lower or higher than the performance information shown. You may obtain performance information current to the most recent month-end by contacting your financial intermediary, visiting columbiathreadneedle.com/us or calling 800.345.6611.
*The returns shown for periods prior to the share class inception date (including returns for the Life of the Fund, if shown, which are since Fund inception) include the returns of the Fund's oldest share class. These returns are adjusted to reflect any higher class-related operating expenses of the newer share classes, as applicable. Please visit columbiathreadneedle.com/us/investment-products/mutual-funds/appended-performance for more information.
The Blended Benchmark, established by the Investment Manager, consists of a 60% weighting of the Barclays High Yield Municipal Bond Index and a 40% weighting of the Barclays Municipal Bond Index. The Barclays Municipal Bond Index is considered representative of the broad market for investment-grade, tax-exempt bonds with a maturity of at least one year.
The Barclays High Yield Municipal Bond Index is comprised of bonds with maturities greater than one-year, having a par value of at least $3 million issued as part of a transaction size greater than $20 million, and rated no higher than "BB+" or equivalent by any of the three principal rating agencies.
Indices are not available for investment, are not professionally managed and do not reflect sales charges, fees, brokerage commissions, taxes or other expenses of investing. Securities in the Fund may not match those in an index.
Annual Report 2016
3
COLUMBIA HIGH YIELD MUNICIPAL FUND
PERFORMANCE OVERVIEW (continued)
Performance of a Hypothetical $10,000 Investment (June 1, 2006 – May 31, 2016)
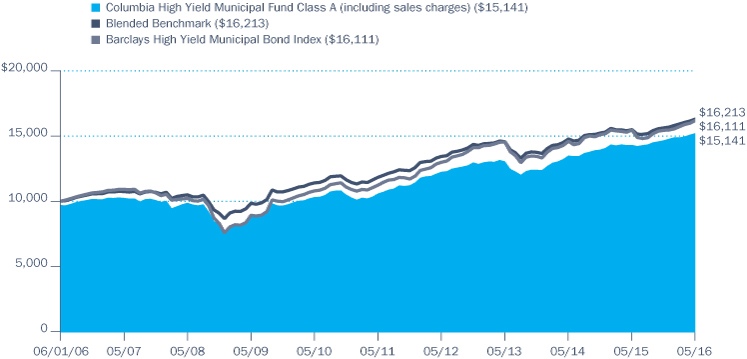
The chart above shows the change in value of a hypothetical $10,000 investment in Class A shares of Columbia High Yield Municipal Fund during the stated time period, and does not reflect the deduction of taxes that a shareholder may pay on Fund distributions or on the redemption of Fund shares.
Annual Report 2016
4
COLUMBIA HIGH YIELD MUNICIPAL FUND
MANAGER DISCUSSION OF FUND PERFORMANCE
For the 12-month period that ended May 31, 2016, Class A shares of the Fund returned 6.27% excluding sales charges. Class Z shares of the Fund returned 6.48% for the same time period. The Fund outperformed its Blended Benchmark and the Barclays High Yield Municipal Bond Index, which returned 5.20% and 4.70%, respectively, during the same 12-month period. The Fund's underweight position in Puerto Rico-related issues and overweight position in longer maturity bonds were the most important factors in its positive relative performance.
Rally in High-Yield Municipal Bonds
High-yield municipal bonds rallied during the 12 months ended May 31, 2016 due to both broader interest-rate trends and developments specific to the tax-exempt market. With regard to the former, investors remained confident that the backdrop of slow growth and low inflation would enable the U.S. Federal Reserve (Fed) to maintain a gradual approach to raising interest rates. U.S. Treasury yields declined as a result, with particularly strong performance occurring in the intermediate- to long-term portions of the yield curve. (Prices rise as yields fall.)
Municipal bonds outperformed Treasury bonds during the period, as the continued improvement in the health of state and local finances provided a sound underpinning for the asset class. In addition, municipal bonds benefited from the combination of low new-issue supply and robust investor demand. High-yield municipals, in general, outpaced the broader market at a time in which upbeat investor sentiment fueled a reach for yield. Tobacco was by far the best performing market segment, with above-average yields and positive fundamental news generating demand for bonds in that sector. On the other end of the spectrum, Puerto Rico's bonds fell in price due to concerns about the growing possibility that the territory will be compelled to default on its debt.
Contributors and Detractors
The Fund's relative outperformance was largely a result of its underweight in Puerto Rico-related issues, which lagged the Blended Benchmark by a wide margin. An overweight in longer maturity bonds further aided returns given that yields declined the most for bonds with maturities of 15 years and higher. Positions in longer maturity, zero-coupon bonds added value, as well. This market segment, which tends to have an above-average sensitivity to movements in prevailing rates, performed very well at a time of falling yields. The Fund's positions in lower rated issues with high coupons also experienced meaningful appreciation due to the stability in credit conditions and the robust demand for higher yielding securities.
The Fund was further boosted by its above-benchmark weighting in bonds issued by continuing care retirement communities (CCRCs). We have held a longstanding overweight to this sector due to its attractive yields and our belief that the aging population will continue to fuel demand for elder-care facilities. One of the Fund's leading contributors was Lutheran Homes, an Ohio-based CCRC whose bonds gained ground after the company announced an advanced refunding of its debt.
The Fund's underweight in the strong-performing tobacco sector detracted from its 12-month results. On a longer term basis, however, we prefer to
Portfolio Management
Chad Farrington, CFA
Top Ten States/Territories (%)
(at May 31, 2016) | |
California | | | 9.9 | | |
Illinois | | | 9.5 | | |
Florida | | | 9.5 | | |
Texas | | | 8.4 | | |
New York | | | 5.2 | | |
Pennsylvania | | | 4.6 | | |
New Jersey | | | 3.9 | | |
Louisiana | | | 3.3 | | |
Missouri | | | 3.0 | | |
Virginia | | | 3.0 | | |
Percentages indicated are based upon total investments (excluding Money Market Funds).
For further detail about these holdings, please refer to the section entitled "Portfolio of Investments."
Fund holdings are as of the date given, are subject to change at any time, and are not recommendations to buy or sell any security.
Annual Report 2016
5
COLUMBIA HIGH YIELD MUNICIPAL FUND
MANAGER DISCUSSION OF FUND PERFORMANCE (continued)
Quality Breakdown (%)
(at May 31, 2016) | |
AAA rating | | | 3.6 | | |
AA rating | | | 9.4 | | |
A rating | | | 16.7 | | |
BBB rating | | | 24.3 | | |
BB rating | | | 6.5 | | |
B rating | | | 1.7 | | |
CCC rating | | | 0.2 | | |
CC rating | | | 2.8 | | |
Not rated | | | 34.8 | | |
Total | | | 100.0 | | |
Percentages indicated are based upon total fixed income investments (excluding Money Market Funds).
Bond ratings apply to the underlying holdings of the Fund and not the Fund itself and are divided into categories ranging from highest to lowest credit quality, determined by using the middle rating of Moody's, S&P and Fitch, after dropping the highest and lowest available ratings. When ratings are available from only two rating agencies, the lower rating is used. When a rating is available from only one rating agency, that rating is used. When a bond is not rated by any rating agency, it is designated as "Not rated." Credit quality ratings assigned by a rating agency are subjective opinions, not statements of fact, and are subject to change, including daily. The ratings assigned by credit rating agencies are but one of the considerations that the Investment Manager and/or Fund's subadviser incorporates into its credit analysis process, along with such other issuer-specific factors as cash flows, capital structure and leverage ratios, ability to de-leverage (repay) through free cash flow, quality of management, market positioning and access to capital, as well as such security-specific factors as the terms of the security (e.g., interest rate and time to maturity) and the amount and type of any collateral.
keep a smaller weighting in this market segment due to its above-average volatility. Relative performance was also hurt by our decision to maintain a short duration (lower interest-rate sensitivity) versus the Blended Benchmark during a period of positive performance for the overall market. The Fund held a fairly sizable cash balance at times, which further detracted from results given the healthy gain for the Blended Benchmark. In terms of security selection, our investments in three distressed issues — Louisiana Pellets, Allen Academy Charter School (based in Michigan), and Texas Pellets — were among the most notable detractors.
Portfolio Positioning at Period's End
It became more difficult to find attractively valued securities by the end of the period, with benchmark yields at all-time lows, spreads approaching pre-recession levels, and the yield curve flattening. Overall market volatility increased as questions about economic strength and timing of the U.S. Federal Reserve's next rate hike added uncertainty. Despite these potential headwinds, the combination of substantial mutual fund inflows and low new-issue supply provided support for the municipal bond market. Although Puerto Rico is generally viewed as being distinct from U.S.-based municipal issuers, it remained unclear how the territory's likely default will affect the market in the coming months.
We became a bit more cautious in this environment, maintaining a disciplined approach and holding an above-average cash position to take advantage of future buying opportunities in the event that yields rise. We also sought to preserve sufficient liquidity to meet any outflows that typically accompany periods of increased volatility. In addition, we shifted the portfolio's overall credit quality higher to help mitigate the potential for a less favorable investment backdrop. We believe this is the prudent course after an extended period of positive market performance.
Annual Report 2016
6
COLUMBIA HIGH YIELD MUNICIPAL FUND
MANAGER DISCUSSION OF FUND PERFORMANCE (continued)
Investment Risks
Fixed-income securities present issuer default risk. The Fund invests substantially in municipal securities and will be affected by tax, legislative, regulatory, demographic or political changes, as well as changes impacting a state's financial, economic or other conditions. A relatively small number of tax-exempt issuers may necessitate the Fund investing more heavily in a single issuer and, therefore, be more exposed to the risk of loss than a fund that invests more broadly. Prepayment and extension risk exists because a loan, bond or other investment may be called, prepaid or redeemed before maturity and similar yielding investments may not be available for purchase. A rise in interest rates may result in a price decline of fixed-income instruments held by the Fund, negatively impacting its performance and NAV. Falling rates may result in the Fund investing in lower yielding debt instruments, lowering the Fund's income and yield. These risks may be heightened for longer maturity and duration securities. Non-investment-grade (high-yield or junk) securities present greater price volatility and more risk to principal and income than higher rated securities. Market risk may affect a single issuer, sector of the economy, industry or the market as a whole. Federal and state tax rules apply to capital gain distributions and any gains or losses on sales. Income may be subject to state, local or alternative minimum taxes. Market or other (e.g., interest rate) environments may adversely affect the liquidity of Fund investments, negatively impacting their price. Generally, the less liquid the market at the time the Fund sells a holding, the greater the risk of loss or decline of value to the Fund. See the Fund's prospectus for more information on these and other risks.
Annual Report 2016
7
COLUMBIA HIGH YIELD MUNICIPAL FUND
UNDERSTANDING YOUR FUND'S EXPENSES
(Unaudited)
As an investor, you incur two types of costs. There are transaction costs, which generally include sales charges on purchases and may include redemption fees. There are also ongoing costs, which generally include management fees, distribution and/or service fees, and other fund expenses. The following information is intended to help you understand your ongoing costs (in dollars) of investing in the Fund and to help you compare these costs with the ongoing costs of investing in other mutual funds.
Analyzing Your Fund's Expenses
To illustrate these ongoing costs, we have provided examples and calculated the expenses paid by investors in each share class of the Fund during the period. The actual and hypothetical information in the table is based on an initial investment of $1,000 at the beginning of the period indicated and held for the entire period. Expense information is calculated two ways and each method provides you with different information. The amount listed in the "Actual" column is calculated using the Fund's actual operating expenses and total return for the period. You may use the Actual information, together with the amount invested, to estimate the expenses that you paid over the period. Simply divide your account value by $1,000 (for example, an $8,600 account value divided by $1,000 = 8.6), then multiply the results by the expenses paid during the period under the "Actual" column. The amount listed in the "Hypothetical" column assumes a 5% annual rate of return before expenses (which is not the Fund's actual return) and then applies the Fund's actual expense ratio for the period to the hypothetical return. You should not use the hypothetical account values and expenses to estimate either your actual account balance at the end of the period or the expenses you paid during the period. See "Compare With Other Funds" below for details on how to use the hypothetical data.
Compare With Other Funds
Since all mutual funds are required to include the same hypothetical calculations about expenses in shareholder reports, you can use this information to compare the ongoing cost of investing in the Fund with other funds. To do so, compare the hypothetical example with the 5% hypothetical examples that appear in the shareholder reports of other funds. As you compare hypothetical examples of other funds, it is important to note that hypothetical examples are meant to highlight the ongoing costs of investing in a fund only and do not reflect any transaction costs, such as sales charges, or redemption or exchange fees. Therefore, the hypothetical calculations are useful in comparing ongoing costs only, and will not help you determine the relative total costs of owning different funds. If transaction costs were included in these calculations, your costs would be higher.
December 1, 2015 – May 31, 2016
| | | Account Value at the Beginning
of the Period ($) | | Account Value at the End of the
Period ($) | | Expenses Paid During the
Period ($) | | Fund's Annualized
Expense Ratio (%) | |
| | | Actual | | Hypothetical | | Actual | | Hypothetical | | Actual | | Hypothetical | | Actual | |
Class A | | | 1,000.00 | | | | 1,000.00 | | | | 1,037.30 | | | | 1,020.70 | | | | 4.38 | | | | 4.34 | | | | 0.86 | | |
Class B | | | 1,000.00 | | | | 1,000.00 | | | | 1,033.40 | | | | 1,016.95 | | | | 8.18 | | | | 8.12 | | | | 1.61 | | |
Class C | | | 1,000.00 | | | | 1,000.00 | | | | 1,033.90 | | | | 1,017.45 | | | | 7.68 | | | | 7.62 | | | | 1.51 | | |
Class R4 | | | 1,000.00 | | | | 1,000.00 | | | | 1,039.30 | | | | 1,021.70 | | | | 3.36 | | | | 3.34 | | | | 0.66 | | |
Class R5 | | | 1,000.00 | | | | 1,000.00 | | | | 1,039.80 | | | | 1,022.15 | | | | 2.91 | | | | 2.88 | | | | 0.57 | | |
Class Z | | | 1,000.00 | | | | 1,000.00 | | | | 1,038.30 | | | | 1,021.70 | | | | 3.36 | | | | 3.34 | | | | 0.66 | | |
Expenses paid during the period are equal to the annualized expense ratio for each class as indicated above, multiplied by the average account value over the period and then multiplied by the number of days in the Fund's most recent fiscal half year and divided by 366.
Expenses do not include fees and expenses incurred indirectly by the Fund from its investment in underlying funds, including affiliated and non-affiliated pooled investment vehicles, such as mutual funds and exchange-traded funds.
Had Columbia Management Investment Advisers, LLC and/or certain of its affiliates not waived/reimbursed certain fees and expenses, account value at the end of the period would have been reduced.
Annual Report 2016
8
COLUMBIA HIGH YIELD MUNICIPAL FUND
PORTFOLIO OF INVESTMENTS
May 31, 2016
(Percentages represent value of investments compared to net assets)
Municipal Bonds 94.6%
Issue
Description | | Coupon
Rate | | Principal
Amount ($) | |
Value ($) | |
ALABAMA 0.9% | |
Lower Alabama Gas District (The)
Revenue Bonds
Series 2016A
09/01/46 | | | 5.000 | % | | | 6,215,000 | | | | 8,070,550 | | |
ALASKA 0.6% | |
City of Koyukuk
Revenue Bonds
Tanana Chiefs Conference Health Care
Series 2011
10/01/41 | | | 7.750 | % | | | 5,000,000 | | | | 5,673,200 | | |
ARIZONA 2.6% | |
City of Glendale Water & Sewer
Refunding Revenue Bonds
Senior Lien
Series 2015
07/01/27 | | | 5.000 | % | | | 2,500,000 | | | | 3,100,175 | | |
Industrial Development Authority of the County of Pima (The)
Refunding Revenue Bonds
Facility-Edkey Charter Schools Project
Series 2013
07/01/33 | | | 6.000 | % | | | 2,000,000 | | | | 2,031,820 | | |
07/01/43 | | | 6.000 | % | | | 2,500,000 | | | | 2,507,650 | | |
07/01/48 | | | 6.000 | % | | | 1,500,000 | | | | 1,500,765 | | |
Revenue Bonds
American Charter Schools Foundation
Series 2007A
07/01/38 | | | 5.625 | % | | | 3,840,000 | | | | 3,747,379 | | |
Industrial Development Authority of the County of Yavapai
Revenue Bonds
Yavapai Regional Medical Center
Series 2008B
08/01/37 | | | 5.625 | % | | | 3,500,000 | | | | 3,697,995 | | |
La Paz County Industrial Development Authority
Revenue Bonds
Charter School Solutions - Harmony Public
Series 2016
02/15/36 | | | 5.000 | % | | | 1,200,000 | | | | 1,313,868 | | |
Maricopa County Pollution Control Corp.
Revenue Bonds
El Paso Electric Co. Project
Series 2009B
04/01/40 | | | 7.250 | % | | | 3,600,000 | | | | 4,177,764 | | |
Surprise Municipal Property Corp.
Revenue Bonds
Series 2007
04/01/32 | | | 4.900 | % | | | 2,000,000 | | | | 2,030,800 | | |
Total | | | | | | | 24,108,216 | | |
Municipal Bonds (continued)
Issue
Description | | Coupon
Rate | | Principal
Amount ($) | |
Value ($) | |
CALIFORNIA 9.4% | |
Agua Caliente Band of Cahuilla Indians
Revenue Bonds
Series 2003(a)(b)
07/01/18 | | | 6.000 | % | | | 1,260,000 | | | | 1,257,367 | | |
Alameda Corridor Transportation Authority
Refunding Revenue Bonds
2nd Subordinated Lien
Series 2016B
10/01/35 | | | 5.000 | % | | | 1,000,000 | | | | 1,197,170 | | |
Cabazon Band Mission Indians(a)(b)(c)
Revenue Bonds
Mortgage Notes
Series 2004
10/01/11 | | | 13.000 | % | | | 384,294 | | | | 191,874 | | |
01/01/16 | | | 8.375 | % | | | 560,000 | | | | 188,602 | | |
10/01/19 | | | 0.000 | % | | | 2,785,000 | | | | 937,682 | | |
Series 2010
10/01/20 | | | 0.000 | % | | | 1,420,000 | | | | 538,450 | | |
California Health Facilities Financing Authority
Refunding Revenue Bonds
Northern California Presbyterian Homes
Series 2015
07/01/39 | | | 5.000 | % | | | 900,000 | | | | 1,060,182 | | |
California Housing Finance Agency(d)
Revenue Bonds
Home Mortgage
Series 2006K AMT
08/01/26 | | | 4.625 | % | | | 4,865,000 | | | | 4,895,406 | | |
Series 2008K AMT
08/01/33 | | | 5.550 | % | | | 560,000 | | | | 567,885 | | |
California Municipal Finance Authority
Revenue Bonds
UTS Renewable Energy-Waste Water Facilities
Series 2011 AMT(a)(d)
12/01/32 | | | 7.500 | % | | | 1,835,000 | | | | 1,705,761 | | |
California Pollution Control Financing Authority
Revenue Bonds
Aemerge Redpak Services Southern California, LLC Project
Series 2016 AMT(a)(d)
12/01/27 | | | 7.000 | % | | | 2,500,000 | | | | 2,525,175 | | |
California State Public Works Board
Refunding Revenue Bonds
Various Capital Projects
Series 2012G
11/01/37 | | | 5.000 | % | | | 1,250,000 | | | | 1,465,713 | | |
California Statewide Communities Development Authority
Prerefunded 01/01/19 Revenue Bonds
Aspire Public Schools
Series 2010
07/01/46 | | | 6.125 | % | | | 2,990,000 | | | | 3,383,903 | | |
The accompanying Notes to Financial Statements are an integral part of this statement.
Annual Report 2016
9
COLUMBIA HIGH YIELD MUNICIPAL FUND
PORTFOLIO OF INVESTMENTS (continued)
May 31, 2016
Municipal Bonds (continued)
Issue
Description | | Coupon
Rate | | Principal
Amount ($) | |
Value ($) | |
Refunding Revenue Bonds
899 Charleston Project
Series 2014A
11/01/44 | | | 5.250 | % | | | 1,500,000 | | | | 1,602,420 | | |
Revenue Bonds
American Baptist Homes West
Series 2010
10/01/39 | | | 6.250 | % | | | 2,750,000 | | | | 3,151,802 | | |
Loma Linda University Medical Center
Series 2014
12/01/44 | | | 5.250 | % | | | 500,000 | | | | 559,565 | | |
12/01/54 | | | 5.500 | % | | | 5,000,000 | | | | 5,647,400 | | |
Chino Public Financing Authority
Refunding Special Tax Bonds
Series 2012
09/01/34 | | | 5.000 | % | | | 1,775,000 | | | | 1,964,481 | | |
City of Carson
Special Assessment Bonds
Assessment District No. 92-1
Series 1992
09/02/22 | | | 7.375 | % | | | 70,000 | | | | 70,702 | | |
City of Long Beach Marina System
Revenue Bonds
Series 2015
05/15/45 | | | 5.000 | % | | | 500,000 | | | | 564,605 | | |
City of Los Angeles Department of Airports
Revenue Bonds
Senior Series 2015A AMT(d)
05/15/27 | | | 5.000 | % | | | 1,250,000 | | | | 1,536,987 | | |
City of Santa Maria Water & Wastewater
Refunding Revenue Bonds
Series 2012A(e)
02/01/25 | | | 0.000 | % | | | 3,100,000 | | | | 2,212,656 | | |
City of Upland
Certificate of Participation
San Antonio Community Hospital
Series 2011
01/01/41 | | | 6.500 | % | | | 5,000,000 | | | | 5,844,350 | | |
Compton Unified School District
Unlimited General Obligation Bonds
Election of 2002 - Capital Appreciation
Series 2006C(e)
06/01/25 | | | 0.000 | % | | | 2,310,000 | | | | 1,850,864 | | |
County of Sacramento Airport System
Subordinated Revenue Bonds
Series 2009D
07/01/35 | | | 6.000 | % | | | 2,500,000 | | | | 2,753,800 | | |
Empire Union School District
Special Tax Bonds
Communities Facilities District No. 1987-1
Series 2002A (AMBAC)(e)
10/01/21 | | | 0.000 | % | | | 1,665,000 | | | | 1,438,527 | | |
Municipal Bonds (continued)
Issue
Description | | Coupon
Rate | | Principal
Amount ($) | |
Value ($) | |
Foothill-Eastern Transportation Corridor Agency
Refunding Revenue Bonds
Junior Lien
Series 2014C
01/15/43 | | | 6.500 | % | | | 5,000,000 | | | | 5,990,150 | | |
Hesperia Public Financing Authority
Tax Allocation Bonds
Redevelopment & Housing Projects
Series 2007A (SGI)
09/01/27 | | | 5.500 | % | | | 5,430,000 | | | | 5,708,939 | | |
M-S-R Energy Authority
Revenue Bonds
Series 2009B
11/01/39 | | | 6.500 | % | | | 5,000,000 | | | | 7,190,000 | | |
Oakdale Public Financing Authority
Tax Allocation Bonds
Central City Redevelopment Project
Series 2004
06/01/33 | | | 5.375 | % | | | 2,000,000 | | | | 2,002,460 | | |
Palomar Health
Certificate of Participation
Series 2010
11/01/41 | | | 6.000 | % | | | 2,500,000 | | | | 2,670,250 | | |
San Diego Public Facilities Financing Authority
Refunding Revenue Bonds
Ballpark
Series 2016
10/15/31 | | | 5.000 | % | | | 650,000 | | | | 795,347 | | |
San Francisco City & County Redevelopment Agency
Prerefunded 08/01/19 Tax Allocation Bonds
Mission Bay South Redevelopment Project
Series 2009D
08/01/39 | | | 6.625 | % | | | 1,500,000 | | | | 1,768,845 | | |
State of California Department of Veterans Affairs
Revenue Bonds
Series 2012A
12/01/25 | | | 3.500 | % | | | 4,355,000 | | | | 4,678,838 | | |
State of California
Unlimited General Obligation Bonds
Various Purpose
Series 2012
04/01/42 | | | 5.000 | % | | | 3,000,000 | | | | 3,507,000 | | |
University of California
Refunding Revenue Bonds
Limited Project
Series 2015I
05/15/27 | | | 5.000 | % | | | 2,000,000 | | | | 2,508,140 | | |
Series 2015AO
05/15/27 | | | 5.000 | % | | | 2,000,000 | | | | 2,523,180 | | |
Total | | | | | | | 88,456,478 | | |
The accompanying Notes to Financial Statements are an integral part of this statement.
Annual Report 2016
10
COLUMBIA HIGH YIELD MUNICIPAL FUND
PORTFOLIO OF INVESTMENTS (continued)
May 31, 2016
Municipal Bonds (continued)
Issue
Description | | Coupon
Rate | | Principal
Amount ($) | |
Value ($) | |
COLORADO 1.9% | |
Colorado Health Facilities Authority
Refunding Revenue Bonds
NCMC, Inc. Project
Series 2016
05/15/32 | | | 4.000 | % | | | 3,535,000 | | | | 3,885,177 | | |
Foothills Metropolitan District
Special Assessment Bonds
Series 2014
12/01/38 | | | 6.000 | % | | | 4,250,000 | | | | 4,596,588 | | |
Regional Transportation District
Certificate of Participation
Series 2014A
06/01/39 | | | 5.000 | % | | | 7,000,000 | | | | 8,059,170 | | |
Sierra Ridge Metropolitan District No. 2
Senior Limited General Obligation Bonds
Series 2016A(f)
12/01/46 | | | 5.500 | % | | | 1,500,000 | | | | 1,559,820 | | |
Total | | | | | | | 18,100,755 | | |
CONNECTICUT 0.9% | |
Connecticut State Development Authority
Prerefunded 08/15/17 Revenue Bonds
Alzheimers Resource Center, Inc. Project
Series 2007
08/15/27 | | | 5.500 | % | | | 500,000 | | | | 528,010 | | |
Connecticut State Health & Educational Facility Authority
Revenue Bonds
Church Home of Hartford, Inc. Project
Series 2016(a)
09/01/53 | | | 5.000 | % | | | 1,750,000 | | | | 1,858,028 | | |
Harbor Point Infrastructure Improvement District
Tax Allocation Bonds
Harbor Point Project
Series 2010A
04/01/39 | | | 7.875 | % | | | 4,000,000 | | | | 4,720,000 | | |
Mohegan Tribe of Indians of Connecticut
Revenue Bonds
Public Improvement-Priority Distribution
Series 2003(a)(b)
01/01/33 | | | 5.250 | % | | | 1,000,000 | | | | 961,520 | | |
Total | | | | | | | 8,067,558 | | |
DELAWARE 0.2% | |
Centerline Equity Issuer Trust
Secured AMT(a)(d)
05/15/19 | | | 6.300 | % | | | 1,000,000 | | | | 1,121,640 | | |
Municipal Bonds (continued)
Issue
Description | | Coupon
Rate | | Principal
Amount ($) | |
Value ($) | |
City of Wilmington
Revenue Bonds
Housing-Electra Arms Senior Associates Project
Series 1998 AMT(d)
06/01/28 | | | 6.250 | % | | | 635,000 | | | | 635,451 | | |
Total | | | | | | | 1,757,091 | | |
DISTRICT OF COLUMBIA 0.8% | |
Metropolitan Washington Airports Authority(d)
Refunding Revenue Bonds
Series 2014A AMT
10/01/23 | | | 5.000 | % | | | 2,000,000 | | | | 2,422,500 | | |
Revenue Bonds
Airport System
Series 2012A AMT
10/01/24 | | | 5.000 | % | | | 4,000,000 | | | | 4,746,360 | | |
Total | | | | | | | 7,168,860 | | |
FLORIDA 9.2% | |
Capital Trust Agency, Inc.(a)
Revenue Bonds
1st Mortgage Tallahassee Tapestry Senior Housing Project
Series 2015
12/01/50 | | | 7.125 | % | | | 2,000,000 | | | | 2,071,820 | | |
Capital Trust Agency, Inc.(c)
Revenue Bonds
Atlantic Housing Foundation
Subordinated Series 2008B
07/15/32 | | | 0.000 | % | | | 1,370,000 | | | | 274,082 | | |
City of Lakeland
Refunding Revenue Bonds
1st Mortgage-Carpenters Home Estates
Series 2008
01/01/28 | | | 6.250 | % | | | 675,000 | | | | 717,181 | | |
01/01/43 | | | 6.375 | % | | | 2,250,000 | | | | 2,363,805 | | |
Revenue Bonds
Lakeland Regional Health
Series 2015
11/15/40 | | | 5.000 | % | | | 5,000,000 | | | | 5,737,850 | | |
City of Tallahassee
Revenue Bonds
Tallahassee Memorial Healthcare, Inc. Project
Series 2016
12/01/55 | | | 5.000 | % | | | 3,000,000 | | | | 3,413,010 | | |
County of Miami-Dade
Subordinated Refunding Revenue Bonds
Series 2012B
10/01/37 | | | 5.000 | % | | | 1,530,000 | | | | 1,773,102 | | |
County of Miami-Dade(e)
Revenue Bonds
Capital Appreciation
Subordinated Series 2009B
10/01/41 | | | 0.000 | % | | | 20,000,000 | | | | 7,302,600 | | |
The accompanying Notes to Financial Statements are an integral part of this statement.
Annual Report 2016
11
COLUMBIA HIGH YIELD MUNICIPAL FUND
PORTFOLIO OF INVESTMENTS (continued)
May 31, 2016
Municipal Bonds (continued)
Issue
Description | | Coupon
Rate | | Principal
Amount ($) | |
Value ($) | |
Florida Development Finance Corp.
Revenue Bonds
Renaissance Charter School
Series 2010A
09/15/40 | | | 6.000 | % | | | 3,750,000 | | | | 3,931,125 | | |
Series 2012A
06/15/43 | | | 6.125 | % | | | 5,500,000 | | | | 6,034,875 | | |
Renaissance Charter School Projects
Series 2013A
06/15/44 | | | 8.500 | % | | | 5,000,000 | | | | 5,856,000 | | |
Florida Development Finance Corp.(a)
Revenue Bonds
Miami Arts Charter School Project
Series 2014A
06/15/44 | | | 6.000 | % | | | 6,100,000 | | | | 6,236,213 | | |
Renaissance Charter School
Series 2015
06/15/46 | | | 6.125 | % | | | 5,000,000 | | | | 5,125,050 | | |
Florida Higher Educational Facilities Financial Authority
Refunding Revenue Bonds
Nova Southeastern University
Series 2016
04/01/35 | | | 5.000 | % | | | 1,190,000 | | | | 1,409,139 | | |
Mid-Bay Bridge Authority
Prerefunded 10/01/21 Revenue Bonds
Series 2011A
10/01/40 | | | 7.250 | % | | | 4,000,000 | | | | 5,192,400 | | |
Middle Village Community Development District
Special Assessment Bonds
Series 2004A
05/01/35 | | | 6.000 | % | | | 1,855,000 | | | | 1,596,227 | | |
Orange County Health Facilities Authority
Refunding Revenue Bonds
Mayflower Retirement Center
Series 2012
06/01/42 | | | 5.125 | % | | | 750,000 | | | | 818,033 | | |
Orlando Health, Inc.
Series 2016A
10/01/34 | | | 5.000 | % | | | 2,000,000 | | | | 2,420,340 | | |
Revenue Bonds
1st Mortgage-Orlando Lutheran Towers
Series 2007
07/01/32 | | | 5.500 | % | | | 350,000 | | | | 356,507 | | |
07/01/38 | | | 5.500 | % | | | 1,750,000 | | | | 1,780,660 | | |
Orange County Industrial Development Authority
Revenue Bonds
VITAG Florida LLC Project
Series 2014 AMT(a)(d)
07/01/36 | | | 8.000 | % | | | 5,000,000 | | | | 5,249,850 | | |
Palm Beach County Health Facilities Authority
Revenue Bonds
Sinai Residences Boca Raton
Series 2014
06/01/49 | | | 7.500 | % | | | 1,250,000 | | | | 1,541,087 | | |
Municipal Bonds (continued)
Issue
Description | | Coupon
Rate | | Principal
Amount ($) | |
Value ($) | |
Sarasota County Health Facilities Authority
Refunding Revenue Bonds
Village on the Isle Project
Series 2007
01/01/32 | | | 5.500 | % | | | 4,000,000 | | | | 4,167,280 | | |
Seven Oaks Community Development District II
Special Assessment Bonds
Series 2004A
05/01/35 | | | 5.875 | % | | | 370,000 | | | | 363,436 | | |
South Lake County Hospital District
Revenue Bonds
South Lake Hospital, Inc.
Series 2010A
04/01/39 | | | 6.250 | % | | | 2,000,000 | | | | 2,254,180 | | |
St. Johns County Industrial Development Authority
Refunding Revenue Bonds
Bayview Project
Series 2007A
10/01/41 | | | 5.250 | % | | | 3,725,000 | | | | 3,417,985 | | |
St. Johns County Industrial Development Authority(c)
Refunding Revenue Bonds
Glenmoor Project
Series 2014A
01/01/49 | | | 5.375 | % | | | 3,206,250 | | | | 1,859,561 | | |
Subordinated Series 2014B
01/01/49 | | | 2.500 | % | | | 1,186,427 | | | | 12 | | |
Waterset North Community Development District
Special Assessment Bonds
Series 2007A
05/01/39 | | | 6.600 | % | | | 1,810,000 | | | | 1,813,276 | | |
Westridge Community Development District
Special Assessment Bonds
Series 2005(c)
05/01/37 | | | 0.000 | % | | | 2,650,000 | | | | 1,457,473 | | |
Total | | | | | | | 86,534,159 | | |
GEORGIA 2.5% | |
DeKalb County Hospital Authority
Revenue Bonds
DeKalb Medical Center, Inc. Project
Series 2010
09/01/40 | | | 6.125 | % | | | 4,500,000 | | | | 5,143,860 | | |
Fulton County Residential Care Facilities for the Elderly Authority
Revenue Bonds
1st Mortgage-Lenbrook Project
Series 2006A
07/01/29 | | | 5.000 | % | | | 3,000,000 | | | | 3,032,340 | | |
Georgia State Road & Tollway Authority
Revenue Bonds
I-75 S Expressway
Series 2014S(a)(e)
06/01/49 | | | 0.000 | % | | | 9,100,000 | | | | 5,483,387 | | |
The accompanying Notes to Financial Statements are an integral part of this statement.
Annual Report 2016
12
COLUMBIA HIGH YIELD MUNICIPAL FUND
PORTFOLIO OF INVESTMENTS (continued)
May 31, 2016
Municipal Bonds (continued)
Issue
Description | | Coupon
Rate | | Principal
Amount ($) | |
Value ($) | |
Municipal Electric Authority of Georgia
Revenue Bonds
Series 1991V Escrowed to Maturity
01/01/18 | | | 6.600 | % | | | 365,000 | | | | 387,586 | | |
Rockdale County Development Authority
Revenue Bonds
Visy Paper Project
Series 2007A AMT(d)
01/01/34 | | | 6.125 | % | | | 5,000,000 | | | | 5,087,200 | | |
Savannah Economic Development Authority
Refunding Revenue Bonds
Marshes Skidaway Island Project
Series 2013
01/01/49 | | | 7.250 | % | | | 3,500,000 | | | | 4,064,235 | | |
Total | | | | | | | 23,198,608 | | |
GUAM 0.6% | |
Guam Department of Education
Certificate of Participation
John F. Kennedy High School
Series 2010A(b)
12/01/40 | | | 6.875 | % | | | 4,750,000 | | | | 5,233,360 | | |
HAWAII 1.3% | |
State of Hawaii Department of Budget & Finance
Revenue Bonds
15 Craigside Project
Series 2009A
11/15/44 | | | 9.000 | % | | | 2,375,000 | | | | 2,900,445 | | |
Hawaii Pacific University
Series 2013A
07/01/43 | | | 6.875 | % | | | 2,800,000 | | | | 3,191,664 | | |
State of Hawaii
Refunding Unlimited General Obligation Bonds
Series 2016FE
10/01/27 | | | 5.000 | % | | | 4,890,000 | | | | 6,288,833 | | |
Total | | | | | | | 12,380,942 | | |
IDAHO 0.5% | |
Idaho Health Facilities Authority
Revenue Bonds
Terraces of Boise Project
Series 2014A
10/01/49 | | | 8.125 | % | | | 4,000,000 | | | | 4,469,880 | | |
ILLINOIS 9.3% | |
Chicago Park District
Limited General Obligation Bonds
Series 2015A
01/01/40 | | | 5.000 | % | | | 3,000,000 | | | | 3,286,890 | | |
Municipal Bonds (continued)
Issue
Description | | Coupon
Rate | | Principal
Amount ($) | |
Value ($) | |
Limited General Obligation Refunding Bonds
Limited Tax
Series 2014B
01/01/26 | | | 5.000 | % | | | 1,500,000 | | | | 1,717,410 | | |
City of Chicago Wastewater Transmission
Refunding Revenue Bonds
2nd Lien
Series 2015C
01/01/35 | | | 5.000 | % | | | 1,000,000 | | | | 1,126,150 | | |
City of Chicago
Refunding Revenue Bonds
Series 2002
01/01/30 | | | 5.000 | % | | | 1,000,000 | | | | 1,097,910 | | |
Refunding Unlimited General Obligation Bonds
Series 2005D
01/01/33 | | | 5.500 | % | | | 1,000,000 | | | | 1,010,170 | | |
Unlimited General Obligation Bonds
Project
Series 2011A
01/01/40 | | | 5.000 | % | | | 5,000,000 | | | | 4,924,900 | | |
Series 2009C
01/01/40 | | | 5.000 | % | | | 2,500,000 | | | | 2,462,450 | | |
Series 2015A
01/01/39 | | | 5.500 | % | | | 500,000 | | | | 499,975 | | |
Unlimited General Obligation Refunding Bonds
Project
Series 2014A
01/01/33 | | | 5.250 | % | | | 1,000,000 | | | | 999,950 | | |
01/01/36 | | | 5.000 | % | | | 3,000,000 | | | | 2,970,300 | | |
Projects
Series 2010A
01/01/24 | | | 5.000 | % | | | 2,000,000 | | | | 2,041,960 | | |
Series 2007F
01/01/42 | | | 5.500 | % | | | 1,000,000 | | | | 999,950 | | |
Series 2016C
01/01/38 | | | 5.000 | % | | | 2,500,000 | | | | 2,464,175 | | |
Du Page County Special Service Area No. 31
Special Tax Bonds
Monarch Landing Project
Series 2006
03/01/36 | | | 5.625 | % | | | 750,000 | | | | 751,950 | | |
Illinois Finance Authority
Prerefunded 08/15/19 Revenue Bonds
Silver Cross & Medical Centers
Series 2009
08/15/44 | | | 7.000 | % | | | 5,000,000 | | | | 5,941,850 | | |
Prerefunded 12/01/17 Revenue Bonds
Columbia College
Series 2007 (NPFGC)
12/01/37 | | | 5.000 | % | | | 5,000,000 | | | | 5,312,750 | | |
Revenue Bonds
CHF-Normal LLC-Illinois State University
Series 2011
04/01/43 | | | 7.000 | % | | | 3,450,000 | | | | 3,972,502 | | |
The accompanying Notes to Financial Statements are an integral part of this statement.
Annual Report 2016
13
COLUMBIA HIGH YIELD MUNICIPAL FUND
PORTFOLIO OF INVESTMENTS (continued)
May 31, 2016
Municipal Bonds (continued)
Issue
Description | | Coupon
Rate | | Principal
Amount ($) | |
Value ($) | |
Provena Health
Series 2009A
08/15/34 | | | 7.750 | % | | | 4,000,000 | | | | 4,762,800 | | |
Riverside Health System
Series 2009
11/15/35 | | | 6.250 | % | | | 3,000,000 | | | | 3,462,750 | | |
Smith Village Project
Series 2005A
11/15/35 | | | 6.250 | % | | | 2,750,000 | | | | 2,759,955 | | |
Illinois Finance Authority(c)
Revenue Bonds
Leafs Hockey Club Project
Series 2007A
03/01/37 | | | 0.000 | % | | | 1,000,000 | | | | 249,610 | | |
Illinois State Toll Highway Authority
Refunding Revenue Bonds
Series 2014-A
12/01/21 | | | 5.000 | % | | | 1,525,000 | | | | 1,810,328 | | |
Illinois State Toll Highway Authority(f)
Senior Revenue Bonds
Series 2016B
01/01/37 | | | 5.000 | % | | | 3,500,000 | | | | 4,190,235 | | |
Metropolitan Pier & Exposition Authority
Refunding Revenue Bonds
McCormick Place Project
Series 2010B-2
06/15/50 | | | 5.000 | % | | | 5,000,000 | | | | 5,258,950 | | |
Railsplitter Tobacco Settlement Authority
Revenue Bonds
Series 2010
06/01/28 | | | 6.000 | % | | | 5,000,000 | | | | 5,955,900 | | |
Southwestern Illinois Development Authority
Prerefunded 02/15/07 Revenue Bonds
Anderson Hospital
Series 2006
08/15/26 | | | 5.125 | % | | | 1,245,000 | | | | 1,284,218 | | |
State of Illinois
Unlimited General Obligation Bonds
Series 2014
05/01/29 | | | 5.000 | % | | | 3,500,000 | | | | 3,823,960 | | |
Series 2016
01/01/41 | | | 5.000 | % | | | 3,830,000 | | | | 4,125,944 | | |
Village of Annawan
Tax Allocation Bonds
Patriot Renewable Fuels LLC Project
Series 2007
01/01/18 | | | 5.625 | % | | | 1,470,000 | | | | 1,470,176 | | |
Village of Hillside
Tax Allocation Bonds
Senior Lien-Mannheim Redevelopment Project
Series 2008
01/01/28 | | | 7.000 | % | | | 5,240,000 | | | | 5,562,784 | | |
Municipal Bonds (continued)
Issue
Description | | Coupon
Rate | | Principal
Amount ($) | |
Value ($) | |
Village of Lincolnshire
Special Tax Bonds
Sedgebrook Project
Series 2004
03/01/34 | | | 6.250 | % | | | 649,000 | | | | 651,791 | | |
Total | | | | | | | 86,950,643 | | |
INDIANA 0.1% | |
City of Portage
Prerefunded 07/15/16 Tax Allocation Bonds
Ameriplex Project
Series 2006
07/15/23 | | | 5.000 | % | | | 700,000 | | | | 703,787 | | |
IOWA 0.4% | |
Iowa Finance Authority(c)
Refunding Revenue Bonds
Deerfield Retirement Community
Series 2014
05/15/56 | | | 2.000 | % | | | 401,062 | | | | 321 | | |
Iowa Finance Authority(g)
Refunding Revenue Bonds
Deerfield Retirement Community
Series 2014
11/15/46 | | | 2.700 | % | | | 2,138,019 | | | | 1,810,667 | | |
Iowa Student Loan Liquidity Corp.
Revenue Bonds
Senior Series 2011A-2 AMT(d)
12/01/30 | | | 5.850 | % | | | 1,540,000 | | | | 1,647,292 | | |
Total | | | | | | | 3,458,280 | | |
KANSAS 1.7% | |
City of Lenexa
Revenue Bonds
Lakeview Village, Inc. Project
Series 2009
05/15/29 | | | 7.125 | % | | | 500,000 | | | | 552,240 | | |
05/15/39 | | | 7.250 | % | | | 1,500,000 | | | | 1,652,835 | | |
City of Manhattan
Revenue Bonds
Meadowlark Hills Retirement Foundation
Series 2007A
05/15/29 | | | 5.000 | % | | | 2,680,000 | | | | 2,700,582 | | |
City of Overland Park
Revenue Bonds
Prairiefire-Lionsgate Project
Series 2012
12/15/32 | | | 6.000 | % | | | 6,000,000 | | | | 5,669,520 | | |
The accompanying Notes to Financial Statements are an integral part of this statement.
Annual Report 2016
14
COLUMBIA HIGH YIELD MUNICIPAL FUND
PORTFOLIO OF INVESTMENTS (continued)
May 31, 2016
Municipal Bonds (continued)
Issue
Description | | Coupon
Rate | | Principal
Amount ($) | |
Value ($) | |
Wyandotte County-Kansas City Unified Government
Revenue Bonds
Legends Village West Project
Series 2006
10/01/28 | | | 4.875 | % | | | 5,185,000 | | | | 5,199,311 | | |
Total | | | | | | | 15,774,488 | | |
KENTUCKY 0.2% | |
Kentucky Economic Development Finance Authority
Revenue Bonds
Louisville Arena
Subordinated Series 2008A-1 (AGM)
12/01/38 | | | 6.000 | % | | | 1,150,000 | | | | 1,238,688 | | |
Paducah Electric Plant Board
Refunding Revenue Bonds
Series 2016A (AGM)(f)
10/01/35 | | | 5.000 | % | | | 1,000,000 | | | | 1,162,190 | | |
Total | | | | | | | 2,400,878 | | |
LOUISIANA 3.2% | |
Juban Crossing Economic Development District
Refunding Revenue Bonds
Drainage Projects
Series 2015B
09/15/44 | | | 7.000 | % | | | 750,000 | | | | 798,450 | | |
General Infrastructure Projects
Series 2015C
09/15/44 | | | 7.000 | % | | | 3,665,000 | | | | 3,901,759 | | |
Road Projects
Series 2015A
09/15/44 | | | 7.000 | % | | | 1,335,000 | | | | 1,421,241 | | |
Louisiana Local Government Environmental Facilities & Community Development Authority
Revenue Bonds
Westlake Chemical Corp.
Series 2010A-2
11/01/35 | | | 6.500 | % | | | 5,000,000 | | | | 6,009,850 | | |
Louisiana Public Facilities Authority
Refunding Revenue Bonds
Nineteenth Judicial District
Series 2015C (AGM)
06/01/42 | | | 5.000 | % | | | 1,000,000 | | | | 1,142,320 | | |
Ochsner Clinic Foundation
Series 2016
05/15/34 | | | 5.000 | % | | | 2,100,000 | | | | 2,484,930 | | |
Louisiana Public Facilities Authority(d)
Revenue Bonds
Impala Warehousing LLC Project
Series 2013 AMT
07/01/36 | | | 6.500 | % | | | 5,000,000 | | | | 5,629,950 | | |
Louisiana Pellets, Inc. Project
Series 2013 AMT
07/01/39 | | | 10.500 | % | | | 5,000,000 | | | | 2,888,250 | | |
Municipal Bonds (continued)
Issue
Description | | Coupon
Rate | | Principal
Amount ($) | |
Value ($) | |
New Orleans Aviation Board
Revenue Bonds
Consolidated Rental Car
Series 2009A
01/01/40 | | | 6.500 | % | | | 5,000,000 | | | | 5,599,950 | | |
Total | | | | | | | 29,876,700 | | |
MARYLAND 0.7% | |
Maryland Economic Development Corp.
Prerefunded 06/01/18 Revenue Bonds
University of Maryland-College Park Projects
Series 2008
06/01/43 | | | 5.875 | % | | | 2,590,000 | | | | 2,849,544 | | |
Maryland Health & Higher Educational Facilities Authority
Refunding Revenue Bonds
University of Maryland Medical System
Series 2015
07/01/34 | | | 5.000 | % | | | 2,750,000 | | | | 3,232,212 | | |
Resolution Trust Corp.
Pass-Through Certificates
Series 1993A
12/01/16 | | | 8.500 | % | | | 455,482 | | | | 455,290 | | |
Total | | | | | | | 6,537,046 | | |
MASSACHUSETTS 2.8% | |
Massachusetts Development Finance Agency
Refunding Revenue Bonds
1st Mortgage-VOA Concord
Series 2007
11/01/41 | | | 5.200 | % | | | 1,000,000 | | | | 1,003,090 | | |
South Shore Hospital
Series 2016I
07/01/36 | | | 4.000 | % | | | 750,000 | | | | 806,708 | | |
Revenue Bonds
Foxborough Regional Charter School
Series 2010A
07/01/42 | | | 7.000 | % | | | 4,200,000 | | | | 4,794,132 | | |
Linden Ponds, Inc. Facility
Series 2011A-2
11/15/46 | | | 5.500 | % | | | 279,667 | | | | 257,103 | | |
Massachusetts Development Finance Agency(e)
Revenue Bonds
Linden Ponds, Inc. Facility
Series 2011B
11/15/56 | | | 0.000 | % | | | 1,391,019 | | | | 7,901 | | |
Massachusetts Educational Financing Authority(d)
Revenue Bonds
Education Loan
Series 2014-I AMT
01/01/21 | | | 5.000 | % | | | 1,885,000 | | | | 2,105,168 | | |
Series 2008H (AGM) AMT
01/01/30 | | | 6.350 | % | | | 1,575,000 | | | | 1,652,726 | | |
Series 2012J AMT
07/01/21 | | | 5.000 | % | | | 3,000,000 | | | | 3,381,840 | | |
The accompanying Notes to Financial Statements are an integral part of this statement.
Annual Report 2016
15
COLUMBIA HIGH YIELD MUNICIPAL FUND
PORTFOLIO OF INVESTMENTS (continued)
May 31, 2016
Municipal Bonds (continued)
Issue
Description | | Coupon
Rate | | Principal
Amount ($) | |
Value ($) | |
Massachusetts Educational Financing Authority(d)(f)
Refunding Revenue Bonds
Series 2016J AMT
07/01/33 | | | 3.500 | % | | | 6,000,000 | | | | 5,931,540 | | |
Massachusetts Health & Educational Facilities Authority
Prerefunded 07/01/18 Revenue Bonds
Boston Medical Center
Series 2008
07/01/38 | | | 5.250 | % | | | 525,000 | | | | 572,938 | | |
Revenue Bonds
Milford Regional Medical Center
Series 2007E
07/15/32 | | | 5.000 | % | | | 1,250,000 | | | | 1,286,587 | | |
Unrefunded Revenue Bonds
Boston Medical Center
Series 2008
07/01/38 | | | 5.250 | % | | | 4,295,000 | | | | 4,508,204 | | |
Total | | | | | | | 26,307,937 | | |
MICHIGAN 2.2% | |
Allen Academy
Refunding Revenue Bonds
Public School Academy
Series 2013
06/01/33 | | | 6.000 | % | | | 5,750,000 | | | | 4,206,930 | | |
City of Detroit Sewage Disposal System
Refunding Revenue Bonds
Senior Lien
Series 2012A
07/01/39 | | | 5.250 | % | | | 1,375,000 | | | | 1,536,095 | | |
City of Detroit Water Supply System
Revenue Bonds
Senior Lien
Series 2011A
07/01/41 | | | 5.250 | % | | | 1,445,000 | | | | 1,598,632 | | |
Series 2011C
07/01/41 | | | 5.000 | % | | | 1,025,000 | | | | 1,121,975 | | |
Michigan Finance Authority
Refunding Revenue Bonds
Series 2014H1
10/01/22 | | | 5.000 | % | | | 1,075,000 | | | | 1,250,204 | | |
Revenue Bonds
School District of the City of Detroit
Series 2012
06/01/20 | | | 5.000 | % | | | 1,000,000 | | | | 1,099,200 | | |
Michigan State Hospital Finance Authority
Refunding Revenue Bonds
Henry Ford Health System
Series 2006A
11/15/46 | | | 5.250 | % | | | 3,000,000 | | | | 3,060,720 | | |
Michigan Tobacco Settlement Finance Authority
Revenue Bonds
Senior Series 2007A
06/01/34 | | | 6.000 | % | | | 1,000,000 | | | | 990,030 | | |
Municipal Bonds (continued)
Issue
Description | | Coupon
Rate | | Principal
Amount ($) | |
Value ($) | |
06/01/48 | | | 6.000 | % | | | 6,000,000 | | | | 5,907,720 | | |
Total | | | | | | | 20,771,506 | | |
MINNESOTA 1.6% | |
City of Anoka
Revenue Bonds
Homestead Anoka, Inc. Project
Series 2011A
11/01/46 | | | 7.000 | % | | | 4,070,000 | | | | 4,367,517 | | |
City of Blaine
Refunding Revenue Bonds
Crest View Senior Community Project
Series 2015
07/01/45 | | | 6.125 | % | | | 3,500,000 | | | | 3,730,545 | | |
07/01/50 | | | 6.125 | % | | | 1,500,000 | | | | 1,597,680 | | |
City of Eveleth
Refunding Revenue Bonds
Arrowhead Senior Living Community
Series 2007
10/01/27 | | | 5.200 | % | | | 2,375,000 | | | | 2,375,356 | | |
Dakota County Community Development Agency
Revenue Bonds
Sanctuary at West St. Paul Project
Series 2015
08/01/35 | | | 6.000 | % | | | 2,235,000 | | | | 2,306,051 | | |
Housing & Redevelopment Authority of The City of St. Paul
Refunding Revenue Bonds
HealthEast Care System Project
Series 2015
11/15/40 | | | 5.000 | % | | | 265,000 | | | | 306,459 | | |
Minneapolis/St. Paul Housing Finance Board
Revenue Bonds
Mortgage-Backed Securities Program-Cityliving
Series 2006A-2 (GNMA/FNMA) AMT(d)
12/01/38 | | | 5.000 | % | | | 4,848 | | | | 4,850 | | |
Total | | | | | | | 14,688,458 | | |
MISSISSIPPI 0.3% | |
County of Lowndes
Refunding Revenue Bonds
Weyerhaeuser Co. Project
Series 1992A
04/01/22 | | | 6.800 | % | | | 1,995,000 | | | | 2,485,471 | | |
Series 1992B
04/01/22 | | | 6.700 | % | | | 230,000 | | | | 284,232 | | |
Rankin County Five Lakes Utility District
Series 1994
07/15/37 | | | 7.000 | % | | | 230,000 | | | | 230,255 | | |
Total | | | | | | | 2,999,958 | | |
The accompanying Notes to Financial Statements are an integral part of this statement.
Annual Report 2016
16
COLUMBIA HIGH YIELD MUNICIPAL FUND
PORTFOLIO OF INVESTMENTS (continued)
May 31, 2016
Municipal Bonds (continued)
Issue
Description | | Coupon
Rate | | Principal
Amount ($) | |
Value ($) | |
MISSOURI 2.8% | |
City of Kansas City
Tax Allocation Bonds
Kansas City-Maincor Project
Series 2007A Escrowed to Maturity
03/01/18 | | | 5.250 | % | | | 500,000 | | | | 527,095 | | |
Shoal Creek Parkway Project
Series 2011
06/01/25 | | | 6.500 | % | | | 1,900,000 | | | | 1,913,908 | | |
City of Manchester
Refunding Tax Allocation Bonds
Highway 141/Manchester Road Project
Series 2010
11/01/39 | | | 6.875 | % | | | 5,000,000 | | | | 5,295,800 | | |
Grundy County Industrial Development Authority
Revenue Bonds
Wright Memorial Hospital
Series 2009
09/01/34 | | | 6.750 | % | | | 2,250,000 | | | | 2,440,215 | | |
Health & Educational Facilities Authority of the State of Missouri
Revenue Bonds
Medical Research-Lutheran Services
Series 2016A
02/01/46 | | | 5.000 | % | | | 2,550,000 | | | | 2,890,374 | | |
Kirkwood Industrial Development Authority
Revenue Bonds
Aberdeen Heights
Series 2010A
05/15/45 | | | 8.250 | % | | | 4,500,000 | | | | 5,074,875 | | |
St. Louis County Industrial Development Authority
Prerefunded 12/01/17 Revenue Bonds
St. Andrews Residence for Seniors
Series 2007A
12/01/41 | | | 6.375 | % | | | 3,000,000 | | | | 3,252,420 | | |
Refunding Revenue Bonds
Ranken Jordan Project
Series 2007
11/15/35 | | | 5.000 | % | | | 1,300,000 | | | | 1,302,028 | | |
St. Andrews Residence for Seniors
Series 2015
12/01/45 | | | 5.125 | % | | | 3,000,000 | | | | 3,153,120 | | |
Total | | | | | | | 25,849,835 | | |
NEBRASKA 1.6% | |
Central Plains Energy Project
Revenue Bonds
Project #3
Series 2012
09/01/42 | | | 5.000 | % | | | 5,000,000 | | | | 5,565,800 | | |
Municipal Bonds (continued)
Issue
Description | | Coupon
Rate | | Principal
Amount ($) | |
Value ($) | |
Public Power Generation Agency
Refunding Revenue Bonds
Whelan Energy Center Unit
Series 2015
01/01/28 | | | 5.000 | % | | | 8,000,000 | | | | 9,577,200 | | |
Total | | | | | | | 15,143,000 | | |
NEVADA 0.8% | |
City of Sparks
Tax Anticipation Revenue Bonds
Senior Sales
Series 2008A(a)
06/15/28 | | | 6.750 | % | | | 5,000,000 | | | | 5,305,850 | | |
State of Nevada Department of Business & Industry
Revenue Bonds
Somerset Academy
Series 2015A(a)
12/15/45 | | | 5.125 | % | | | 2,515,000 | | | | 2,570,154 | | |
Total | | | | | | | 7,876,004 | | |
NEW HAMPSHIRE —% | |
New Hampshire Business Finance Authority
Revenue Bonds
Pennichuck Water Works, Inc. Project
Series 1988 Escrowed to Maturity AMT(d)
07/01/18 | | | 7.500 | % | | | 90,000 | | | | 95,739 | | |
NEW JERSEY 3.4% | |
City of Atlantic City
Refunding Unlimited General Obligation Bonds
Tax Appeal
Series 2013
12/01/21 | | | 5.000 | % | | | 2,500,000 | | | | 1,701,125 | | |
Unlimited General Obligation Refunding Bonds
Tax Appeal
Series 2013
12/01/24 | | | 5.000 | % | | | 1,545,000 | | | | 1,051,033 | | |
Middlesex County Improvement Authority(c)
Revenue Bonds
Heldrich Center Hotel
Series 2005C
01/01/37 | | | 0.000 | % | | | 1,250,000 | | | | 37,463 | | |
Subordinated Revenue Bonds
Heldrich Center Hotel
Series 2005B
01/01/25 | | | 0.000 | % | | | 2,750,000 | | | | 108,542 | | |
01/01/37 | | | 0.000 | % | | | 6,450,000 | | | | 254,581 | | |
New Jersey Building Authority
Refunding Revenue Bonds
Series 2016A
06/15/30 | | | 4.000 | % | | | 1,000,000 | | | | 1,013,670 | | |
The accompanying Notes to Financial Statements are an integral part of this statement.
Annual Report 2016
17
COLUMBIA HIGH YIELD MUNICIPAL FUND
PORTFOLIO OF INVESTMENTS (continued)
May 31, 2016
Municipal Bonds (continued)
Issue
Description | | Coupon
Rate | | Principal
Amount ($) | |
Value ($) | |
New Jersey Economic Development Authority
Prerefunded 11/15/16 Revenue Bonds
Seabrook Village, Inc. Facility
Series 2006
11/15/36 | | | 5.250 | % | | | 2,250,000 | | | | 2,297,430 | | |
Revenue Bonds
Provident Group-Rowan Properties LLC
Series 2015
01/01/48 | | | 5.000 | % | | | 960,000 | | | | 1,059,946 | | |
School Facilities Construction
Series 2014UU
06/15/40 | | | 5.000 | % | | | 1,500,000 | | | | 1,619,340 | | |
Series 2015WW
06/15/40 | | | 5.250 | % | | | 375,000 | | | | 413,846 | | |
New Jersey Economic Development Authority(d)
Revenue Bonds
UMM Energy Partners LLC
Series 2012A AMT
06/15/43 | | | 5.125 | % | | | 2,000,000 | | | | 2,090,360 | | |
New Jersey Health Care Facilities Financing Authority
Revenue Bonds
St. Josephs Healthcare Systems
Series 2008
07/01/38 | | | 6.625 | % | | | 3,000,000 | | | | 3,285,540 | | |
New Jersey Higher Education Student Assistance Authority(d)
Revenue Bonds
Senior Series 2013-1A AMT
12/01/21 | | | 5.000 | % | | | 1,500,000 | | | | 1,700,640 | | |
Senior Series 2014-1A-1 AMT
12/01/22 | | | 5.000 | % | | | 1,000,000 | | | | 1,144,440 | | |
Subordinated Revenue Bonds
Series 2013-1B AMT
12/01/43 | | | 4.750 | % | | | 5,000,000 | | | | 5,227,350 | | |
New Jersey Transportation Trust Fund Authority
Revenue Bonds
Transportation Program
Series 2015AA
06/15/45 | | | 5.000 | % | | | 1,750,000 | | | | 1,876,140 | | |
New Jersey Transportation Trust Fund Authority(e)
Revenue Bonds
Capital Appreciation Transportation System
Series 2006C (AGM)
12/15/32 | | | 0.000 | % | | | 10,000,000 | | | | 5,152,300 | | |
Tobacco Settlement Financing Corp.
Revenue Bonds
Capital Appreciation
Series 2007-1C(e)
06/01/41 | | | 0.000 | % | | | 7,500,000 | | | | 1,961,925 | | |
Total | | | | | | | 31,995,671 | | |
Municipal Bonds (continued)
Issue
Description | | Coupon
Rate | | Principal
Amount ($) | |
Value ($) | |
NEW YORK 3.4% | |
Build NYC Resource Corp.
Revenue Bonds
International Leadership Charter School
Series 2013
07/01/43 | | | 6.000 | % | | | 4,330,000 | | | | 4,332,208 | | |
City of New York
Unlimited General Obligation Refunding Bonds
Series 2014J
08/01/23 | | | 5.000 | % | | | 3,000,000 | | | | 3,699,810 | | |
Series 2015C
08/01/27 | | | 5.000 | % | | | 4,000,000 | | | | 4,928,640 | | |
Jefferson County Industrial Development Agency
Revenue Bonds
Green Bonds
Series 2014 AMT(d)
01/01/24 | | | 5.250 | % | | | 1,900,000 | | | | 1,872,849 | | |
Nassau County Tobacco Settlement Corp.
Asset-Backed Revenue Bonds
Capital Appreciation
Third Series 2006D(e)
06/01/60 | | | 0.000 | % | | | 25,000,000 | | | | 122,500 | | |
New York City Water & Sewer System
Refunding Revenue Bonds
2nd General Resolution
Series 2015FF
06/15/27 | | | 5.000 | % | | | 2,645,000 | | | | 3,317,597 | | |
New York State Dormitory Authority
Prerefunded 07/01/17 Revenue Bonds
New York University Hospital Center
Series 2007B
07/01/37 | | | 5.625 | % | | | 2,000,000 | | | | 2,105,880 | | |
Prerefunded 07/01/20 Revenue Bonds
NYU Hospitals Center
Series 2011A
07/01/40 | | | 6.000 | % | | | 1,000,000 | �� | | | 1,196,890 | | |
New York Transportation Development Corp.
Revenue Bonds
LaGuardia Airport Terminal B Redevelopment Project
Series 2016 AMT(d)(f)
07/01/46 | | | 4.000 | % | | | 1,000,000 | | | | 1,028,520 | | |
Port Authority of New York & New Jersey(d)
Refunding Revenue Bonds
Consolidated 186th
Series 2014-186 AMT
10/15/22 | | | 5.000 | % | | | 5,000,000 | | | | 6,009,000 | | |
Revenue Bonds
5th Installment-Special Project
Series 1996-4 AMT
10/01/19 | | | 6.750 | % | | | 120,000 | | | | 120,022 | | |
The accompanying Notes to Financial Statements are an integral part of this statement.
Annual Report 2016
18
COLUMBIA HIGH YIELD MUNICIPAL FUND
PORTFOLIO OF INVESTMENTS (continued)
May 31, 2016
Municipal Bonds (continued)
Issue
Description | | Coupon
Rate | | Principal
Amount ($) | |
Value ($) | |
Ulster County Industrial Development Agency
Revenue Bonds
Series 2007A
09/15/42 | | | 6.000 | % | | | 3,400,000 | | | | 3,454,808 | | |
Total | | | | | | | 32,188,724 | | |
NORTH CAROLINA 0.8% | |
Durham Housing Authority
Revenue Bonds
Magnolia Pointe Apartments
Series 2005 AMT(d)
02/01/38 | | | 5.650 | % | | | 3,075,635 | | | | 3,196,723 | | |
North Carolina Eastern Municipal Power Agency
Revenue Bonds
Series 1991A Escrowed to Maturity
01/01/18 | | | 6.500 | % | | | 3,320,000 | | | | 3,618,235 | | |
North Carolina Medical Care Commission
Refunding Revenue Bonds
United Methodist Retirement Homes
Series 2016
10/01/35 | | | 5.000 | % | | | 1,000,000 | | | | 1,180,430 | | |
Total | | | | | | | 7,995,388 | | |
NORTH DAKOTA 0.3% | |
City of Fargo
Revenue Bonds
Sanford Obligation Group
Series 2011
11/01/31 | | | 6.250 | % | | | 2,500,000 | | | | 3,064,425 | | |
OHIO 1.6% | |
Buckeye Tobacco Settlement Financing Authority
Asset-Backed Senior Turbo Revenue Bonds
Series 2007A-2
06/01/47 | | | 5.875 | % | | | 2,500,000 | | | | 2,431,250 | | |
County of Lucas
Prerefunded 11/01/20 Improvement Revenue Bonds
Lutheran Homes
Series 2010A
11/01/45 | | | 7.000 | % | | | 5,000,000 | | | | 6,249,400 | | |
County of Scioto
Refunding Revenue Bonds
Southern Ohio Medical Center
Series 2016
02/15/34 | | | 5.000 | % | | | 1,445,000 | | | | 1,732,497 | | |
State of Ohio
Revenue Bonds
Portsmouth Bypass Project
Series 2015 AMT(d)
12/31/39 | | | 5.000 | % | | | 4,100,000 | | | | 4,629,351 | | |
Municipal Bonds (continued)
Issue
Description | | Coupon
Rate | | Principal
Amount ($) | |
Value ($) | |
Summit County Port Authority
Revenue Bonds
Seville Project
Series 2005A
05/15/25 | | | 5.100 | % | | | 375,000 | | | | 375,334 | | |
Total | | | | | | | 15,417,832 | | |
OREGON 1.1% | |
City of Forest Grove
Revenue Bonds
Oak Tree Foundation Project
Series 2007
03/01/37 | | | 5.500 | % | | | 2,830,000 | | | | 2,877,289 | | |
Cow Creek Band of Umpqua Tribe of Indians
Revenue Bonds
Series 2006C(a)(b)
10/01/26 | | | 5.625 | % | | | 1,700,000 | | | | 1,712,937 | | |
Hospital Facilities Authority of Multnomah County
Refunding Revenue Bonds
Mirabella at South Waterfront
Series 2014A
10/01/49 | | | 5.500 | % | | | 3,115,000 | | | | 3,433,197 | | |
Warm Springs Reservation Confederated Tribe
Revenue Bonds
Pelton Round Butte Tribal
Series 2009B(b)
11/01/33 | | | 6.375 | % | | | 2,410,000 | | | | 2,626,756 | | |
Total | | | | | | | 10,650,179 | | |
PENNSYLVANIA 4.5% | |
Allegheny County Higher Education Building Authority
Refunding Revenue Bonds
Duquesne University
Series 2016
03/01/29 | | | 5.000 | % | | | 1,030,000 | | | | 1,262,893 | | |
Dauphin County Industrial Development Authority
Revenue Bonds
Dauphin Consolidated Water Supply
Series 1992A AMT(d)
06/01/24 | | | 6.900 | % | | | 3,200,000 | | | | 4,097,088 | | |
Montgomery County Industrial Development Authority
Refunding Revenue Bonds
Albert Einstein Healthcare
Series 2015
01/15/46 | | | 5.250 | % | | | 1,250,000 | | | | 1,399,700 | | |
Pennsylvania Economic Development Financing Authority
Revenue Bonds
Philadelphia Biosolids Facility
Series 2009
01/01/32 | | | 6.250 | % | | | 3,375,000 | | | | 3,728,599 | | |
The accompanying Notes to Financial Statements are an integral part of this statement.
Annual Report 2016
19
COLUMBIA HIGH YIELD MUNICIPAL FUND
PORTFOLIO OF INVESTMENTS (continued)
May 31, 2016
Municipal Bonds (continued)
Issue
Description | | Coupon
Rate | | Principal
Amount ($) | |
Value ($) | |
Pennsylvania Economic Development Financing Authority(d)
Revenue Bonds
PA Bridges Finco LP
Series 2015 AMT
06/30/42 | | | 5.000 | % | | | 3,050,000 | | | | 3,455,192 | | |
Pennsylvania Higher Educational Facilities Authority
Revenue Bonds
Edinboro University Foundation
Series 2010
07/01/30 | | | 5.800 | % | | | 1,000,000 | | | | 1,087,330 | | |
Shippensburg University
Series 2011
10/01/43 | | | 6.250 | % | | | 2,000,000 | | | | 2,245,700 | | |
Pennsylvania Housing Finance Agency
Revenue Bonds
Series 2013-115A AMT(d)
10/01/33 | | | 4.200 | % | | | 5,000,000 | | | | 5,328,550 | | |
Pennsylvania Industrial Development Authority
Prerefunded 07/01/18 Revenue Bonds
Economic Development
Series 2008
07/01/23 | | | 5.500 | % | | | 295,000 | | | | 323,459 | | |
Pennsylvania Turnpike Commission
Revenue Bonds
Series 2014C
12/01/44 | | | 5.000 | % | | | 3,000,000 | | | | 3,496,170 | | |
Subordinated Refunding Revenue Bonds
Series 2015A-1
12/01/28 | | | 5.000 | % | | | 3,300,000 | | | | 3,945,975 | | |
Philadelphia Authority for Industrial Development
Revenue Bonds
1st Philadelphia Preparatory Charter School
Series 2014
06/15/33 | | | 7.000 | % | | | 1,870,000 | | | | 2,210,060 | | |
State Public School Building Authority
Refunding Revenue Bonds
Philadelphia School District
Series 2015
06/01/25 | | | 5.000 | % | | | 8,000,000 | | | | 9,140,800 | | |
Total | | | | | | | 41,721,516 | | |
PUERTO RICO 2.7% | |
Commonwealth of Puerto Rico(b)
Unlimited General Obligation Bonds
Series 2014A
07/01/35 | | | 8.000 | % | | | 7,000,000 | | | | 4,567,500 | | |
Unlimited General Obligation Refunding Bonds
Public Improvement
Series 2012A
07/01/41 | | | 5.000 | % | | | 2,000,000 | | | | 1,217,640 | | |
Municipal Bonds (continued)
Issue
Description | | Coupon
Rate | | Principal
Amount ($) | |
Value ($) | |
Puerto Rico Commonwealth Aqueduct & Sewer Authority
Revenue Bonds
Senior Lien
Series 2012A(b)
07/01/42 | | | 5.250 | % | | | 2,525,000 | | | | 1,666,803 | | |
Puerto Rico Electric Power Authority(b)
Refunding Revenue Bonds
Series 2010ZZ
07/01/25 | | | 5.250 | % | | | 2,000,000 | | | | 1,199,960 | | |
Revenue Bonds
Series 2013A
07/01/36 | | | 6.750 | % | | | 1,000,000 | | | | 599,980 | | |
07/01/43 | | | 7.000 | % | | | 6,570,000 | | | | 3,942,131 | | |
Puerto Rico Highways & Transportation Authority
Refunding Revenue Bonds
Series 2007N(b)
07/01/21 | | | 5.500 | % | | | 760,000 | | | | 133,000 | | |
Puerto Rico Industrial Tourist Educational, Medical &
Environmental Control Facilities Financing Authority
Revenue Bonds
Cogen Facilities AES Puerto Rico Project
Series 2000 AMT(b)(d)
06/01/26 | | | 6.625 | % | | | 5,820,000 | | | | 5,627,649 | | |
Puerto Rico Sales Tax Financing Corp.(b)
Revenue Bonds
Senior Lien
Series 2011C
08/01/40 | | | 5.250 | % | | | 1,885,000 | | | | 1,152,527 | | |
08/01/46 | | | 5.000 | % | | | 2,000,000 | | | | 1,210,140 | | |
Series 2007
08/01/57 | | | 5.250 | % | | | 1,350,000 | | | | 825,336 | | |
Subordinated Revenue Bonds
1st Series 2009B
08/01/44 | | | 6.500 | % | | | 1,000,000 | | | | 408,820 | | |
1st Series 2010A
08/01/39 | | | 5.375 | % | | | 5,155,000 | | | | 2,062,825 | | |
1st Series 2010C
08/01/41 | | | 5.250 | % | | | 1,000,000 | | | | 400,150 | | |
Total | | | | | | | 25,014,461 | | |
RHODE ISLAND 0.3% | |
Rhode Island Student Loan Authority
Revenue Bonds
Series 2016A AMT(d)
12/01/27 | | | 3.125 | % | | | 2,675,000 | | | | 2,631,665 | | |
SOUTH CAROLINA 2.0% | |
South Carolina Jobs-Economic Development Authority
Prerefunded 09/15/18 Revenue Bonds
Kershaw County Medical Center Project
Series 2008
09/15/38 | | | 6.000 | % | | | 5,050,000 | | | | 5,638,830 | | |
The accompanying Notes to Financial Statements are an integral part of this statement.
Annual Report 2016
20
COLUMBIA HIGH YIELD MUNICIPAL FUND
PORTFOLIO OF INVESTMENTS (continued)
May 31, 2016
Municipal Bonds (continued)
Issue
Description | | Coupon
Rate | | Principal
Amount ($) | |
Value ($) | |
Refunding Revenue Bonds
1st Mortgage-Lutheran Homes
Series 2007
05/01/28 | | | 5.500 | % | | | 2,300,000 | | | | 2,333,580 | | |
1st Mortgage-Wesley Commons
Series 2006
10/01/36 | | | 5.300 | % | | | 4,000,000 | | | | 4,007,840 | | |
Revenue Bonds
Lutheran Homes of South Carolina, Inc. Obligation Group
Series 2013
05/01/43 | | | 5.000 | % | | | 750,000 | | | | 771,600 | | |
05/01/48 | | | 5.125 | % | | | 1,500,000 | | | | 1,558,395 | | |
York Preparatory Academy Project
Series 2014A
11/01/45 | | | 7.250 | % | | | 4,000,000 | | | | 4,480,640 | | |
Total | | | | | | | 18,790,885 | | |
TENNESSEE —% | |
Shelby County Health Educational & Housing Facilities Board
Prerefunded 12/01/16 Revenue Bonds
Village at Germantown, Inc.
Series 2006
12/01/34 | | | 6.250 | % | | | 450,000 | | | | 462,380 | | |
TEXAS 8.2% | |
Capital Area Cultural Education Facilities Finance Corp.
Revenue Bonds
Roman Catholic Diocese
Series 2005B
04/01/45 | | | 6.125 | % | | | 5,000,000 | | | | 5,749,800 | | |
Central Texas Regional Mobility Authority
Subordinated Revenue Bonds
Lien
Series 2011
01/01/41 | | | 6.750 | % | | | 5,000,000 | | | | 6,064,400 | | |
Central Texas Turnpike System
Refunding Revenue Bonds
Series 2015B
08/15/37 | | | 5.000 | % | | | 5,000,000 | | | | 5,833,150 | | |
City of Dallas Waterworks & Sewer System
Refunding Revenue Bonds
Series 2015A
10/01/27 | | | 5.000 | % | | | 3,000,000 | | | | 3,782,370 | | |
City of Houston Airport System
Refunding Revenue Bonds
Special Facilities Continental
Series 2011A AMT(d)
07/15/38 | | | 6.625 | % | | | 4,000,000 | | | | 4,642,320 | | |
Clifton Higher Education Finance Corp.
Revenue Bonds
International Leadership of Texas
Series 2015
08/15/45 | | | 5.750 | % | | | 5,500,000 | | | | 5,846,775 | | |
Municipal Bonds (continued)
Issue
Description | | Coupon
Rate | | Principal
Amount ($) | |
Value ($) | |
Deaf Smith County Hospital District
Limited General Obligation Bonds
Series 2010A
03/01/40 | | | 6.500 | % | | | 4,000,000 | | | | 4,480,760 | | |
Gulf Coast Industrial Development Authority
Revenue Bonds
Citgo Petroleum Project
Series 1998 AMT(d)
04/01/28 | | | 8.000 | % | | | 875,000 | | | | 876,864 | | |
HFDC of Central Texas, Inc.
Revenue Bonds
Series 2006A
11/01/36 | | | 5.750 | % | | | 5,000,000 | | | | 5,047,300 | | |
La Vernia Higher Education Finance Corp.
Prerefunded 08/15/19 Revenue Bonds
Kipp, Inc.
Series 2009A
08/15/29 | | | 6.000 | % | | | 1,000,000 | | | | 1,155,540 | | |
08/15/39 | | | 6.250 | % | | | 1,500,000 | | | | 1,745,085 | | |
Mission Economic Development Corp.
Revenue Bonds
Senior Lien - Natgasoline Project
Series 2016 AMT(a)(d)
10/01/31 | | | 5.750 | % | | | 4,500,000 | | | | 4,752,405 | | |
Mission Economic Development Corp
Revenue Bonds
Dallas Clean Energy McCommas
Series 2011 AMT(d)
12/01/24 | | | 6.875 | % | | | 5,000,000 | | | | 5,184,500 | | |
New Hope Cultural Education Facilities Corp.
Revenue Bonds
Cardinal Bay, Inc. - Village on the Park
Series 2016
07/01/46 | | | 5.000 | % | | | 700,000 | | | | 777,854 | | |
Pharr Higher Education Finance Authority
Revenue Bonds
Idea Public Schools
Series 2009A
08/15/39 | | | 6.500 | % | | | 3,000,000 | | | | 3,377,190 | | |
Red River Health Facilities Development Corp.
Revenue Bonds
MRC Crossings Project
Series 2014A
11/15/49 | | | 8.000 | % | | | 2,000,000 | | | | 2,397,320 | | |
Sanger Industrial Development Corp.
Revenue Bonds
Texas Pellets Project
Series 2012B AMT(d)
07/01/38 | | | 8.000 | % | | | 4,950,000 | | | | 4,307,045 | | |
The accompanying Notes to Financial Statements are an integral part of this statement.
Annual Report 2016
21
COLUMBIA HIGH YIELD MUNICIPAL FUND
PORTFOLIO OF INVESTMENTS (continued)
May 31, 2016
Municipal Bonds (continued)
Issue
Description | | Coupon
Rate | | Principal
Amount ($) | |
Value ($) | |
Tarrant County Cultural Education Facilities Finance Corp.
Revenue Bonds
Air Force Villages, Inc. Obligation
Series 2009
11/15/44 | | | 6.375 | % | | | 4,250,000 | | | | 4,710,062 | | |
CC Young Memorial Home
Series 2009A
02/15/38 | | | 8.000 | % | | | 4,000,000 | | | | 4,492,840 | | |
Texas Municipal Gas Acquisition & Supply Corp. III
Revenue Bonds
Series 2012
12/15/32 | | | 5.000 | % | | | 1,250,000 | | | | 1,397,425 | | |
Total | | | | | | | 76,621,005 | | |
VIRGIN ISLANDS 0.8% | |
Virgin Islands Public Finance Authority
Revenue Bonds
Matching Fund Loan Notes-Senior Lien
Series 2012A(b)
10/01/32 | | | 5.000 | % | | | 3,785,000 | | | | 4,104,833 | | |
Virgin Islands Water & Power Authority — Electric System
Refunding Revenue Bonds
Series 2012A(b)
07/01/21 | | | 4.000 | % | | | 3,000,000 | | | | 3,091,800 | | |
Total | | | | | | | 7,196,633 | | |
VIRGINIA 2.9% | |
Alexandria Industrial Development Authority
Refunding Revenue Bonds
Goodwin House, Inc.
Series 2015
10/01/45 | | | 5.000 | % | | | 5,725,000 | | | | 6,575,449 | | |
10/01/50 | | | 5.000 | % | | | 2,275,000 | | | | 2,605,034 | | |
City of Chesapeake Expressway Toll Road
Refunding Revenue Bonds
Transportation System
Series 2012(e)
07/15/40 | | | 0.000 | % | | | 7,530,000 | | | | 5,949,754 | | |
Mosaic District Community Development Authority
Special Assessment Bonds
Series 2011A
03/01/36 | | | 6.875 | % | | | 2,500,000 | | | | 2,878,625 | | |
Tobacco Settlement Financing Corp.
Revenue Bonds
Senior Series 2007-B1
06/01/47 | | | 5.000 | % | | | 10,000,000 | | | | 9,375,600 | | |
Total | | | | | | | 27,384,462 | | |
WASHINGTON 2.0% | |
Greater Wenatchee Regional Events Center Public Facilities District
Revenue Bonds
Series 2012A
09/01/42 | | | 5.500 | % | | | 2,150,000 | | | | 2,282,074 | | |
Municipal Bonds (continued)
Issue
Description | | Coupon
Rate | | Principal
Amount ($) | |
Value ($) | |
King County Public Hospital District No. 4
Revenue Bonds
Series 2015A
12/01/35 | | | 6.000 | % | | | 1,250,000 | | | | 1,273,363 | | |
12/01/45 | | | 6.250 | % | | | 2,500,000 | | | | 2,553,825 | | |
Port of Seattle Industrial Development Corp.
Refunding Revenue Bonds
Special Facilities Delta Air Lines, Inc.
Series 2012 AMT(d)
04/01/30 | | | 5.000 | % | | | 2,500,000 | | | | 2,685,150 | | |
Tacoma Consolidated Local Improvement Districts
Special Assessment Bonds
No. 65
Series 2013
04/01/43 | | | 5.750 | % | | | 2,190,000 | | | | 2,195,782 | | |
Washington State Housing Finance Commission
Refunding Revenue Bonds
Nonprofit Housing-Mirabella
Series 2012
10/01/47 | | | 6.750 | % | | | 5,000,000 | | | | 5,435,850 | | |
Revenue Bonds
Heron's Key
Series 2015A
07/01/50 | | | 7.000 | % | | | 2,100,000 | | | | 2,198,868 | | |
Total | | | | | | | 18,624,912 | | |
WISCONSIN 1.5% | |
Public Finance Authority
Revenue Bonds
FFAH North Carolina and Missouri Portfolio
Series 2015A
12/01/50 | | | 5.150 | % | | | 3,220,000 | | | | 3,399,740 | | |
Public Finance Authority(d)
Refunding Revenue Bonds
Celanese Project
Series 2016C AMT
11/01/30 | | | 4.300 | % | | | 2,000,000 | | | | 2,071,880 | | |
Waste Management, Inc. Project
Series 2016 AMT
05/01/27 | | | 2.875 | % | | | 630,000 | | | | 632,426 | | |
Wisconsin Health & Educational Facilities Authority
Prerefunded 09/15/19 Revenue Bonds
St. John's Community, Inc.
Series 2009A
09/15/39 | | | 7.625 | % | | | 1,750,000 | | | | 2,112,687 | | |
Prerefunded 12/03/18 Revenue Bonds
Medical College of Wisconsin
Series 2008A
12/01/35 | | | 5.250 | % | | | 4,525,000 | | | | 5,013,881 | | |
The accompanying Notes to Financial Statements are an integral part of this statement.
Annual Report 2016
22
COLUMBIA HIGH YIELD MUNICIPAL FUND
PORTFOLIO OF INVESTMENTS (continued)
May 31, 2016
Municipal Bonds (continued)
Issue
Description | | Coupon
Rate | | Principal
Amount ($) | |
Value ($) | |
Unrefunded Revenue Bonds
Medical College of Wisconsin
Series 2008A
12/01/35 | | | 5.250 | % | | | 475,000 | | | | 517,750 | | |
Total | | | | | | | 13,748,364 | | |
Total Municipal Bonds
(Cost: $834,096,921) | | | | | | | 886,162,418 | | |
Municipal Preferred Stocks 0.1%
MARYLAND 0.1% | |
Munimae TE Bond Subsidiary LLC
AMT(a)(d)
06/30/49 | | | 5.800 | % | | | 1,000,000 | | | | 1,038,440 | | |
Total Municipal Preferred Stocks
(Cost: $1,000,000) | | | | | | | 1,038,440 | | |
Municipal Short Term 2.9%
Issue
Description | | Effective
Yield | | Principal
Amount ($) | | Value ($) | |
CALIFORNIA 0.2% | |
California Statewide Communities Development Authority
Revenue Bonds
John Muir Health
VRDN Series 2008A (Wells Fargo Bank)(g)(h)
08/15/36 | | | 0.320 | % | | | 2,105,000 | | | | 2,105,000 | | |
MARYLAND 0.3% | |
County of Montgomery
Unlimited General Obligation Bonds
Public Improvement
BAN Series 2011B(g)
06/01/26 | | | 0.350 | % | | | 3,000,000 | | | | 3,000,000 | | |
MICHIGAN 0.1% | |
University of Michigan
Revenue Bonds
Series 2012D-1(g)
12/01/24 | | | 0.300 | % | | | 1,200,000 | | | | 1,200,000 | | |
MISSOURI 0.2% | |
Health & Educational Facilities Authority of the State of Missouri
Revenue Bonds
Washington University
Series 2009B(g)
03/01/40 | | | 0.350 | % | | | 1,800,000 | | | | 1,800,000 | | |
Municipal Short Term (continued)
Issue
Description | | Effective
Yield | | Principal
Amount ($) | | Value ($) | |
NEW JERSEY 0.5% | |
City of Newark
Unlimited General Obligation Notes
TAN Series 2016A
02/15/17 | | | 1.680 | % | | | 4,000,000 | | | | 4,022,880 | | |
NEW YORK 1.6% | |
City of New York
Unlimited General Obligation Bonds
Series 2013I-4(g)
04/01/36 | | | 0.350 | % | | | 5,000,000 | | | | 5,000,000 | | |
New York City Transitional Finance Authority Future Tax Secured
Revenue Bonds
Series 2011(g)
11/01/29 | | | 0.340 | % | | | 2,500,000 | | | | 2,500,000 | | |
New York City Transitional Finance Authority
Subordinated Revenue Bonds
Future Tax Secured
Series 2016(g)
02/01/45 | | | 0.370 | % | | | 5,000,000 | | | | 5,000,000 | | |
New York City Water & Sewer System
Revenue Bonds
2nd General Resolution
Series 2014(g)
06/15/50 | | | 0.330 | % | | | 1,500,000 | | | | 1,500,000 | | |
Triborough Bridge & Tunnel Authority
Refunding Revenue Bonds
Subseries 2015B-2-RE(g)
01/01/32 | | | 0.350 | % | | | 1,000,000 | | | | 1,000,000 | | |
Total | | | | | | | 15,000,000 | | |
Total Municipal Short Term
(Cost: $27,128,636) | | | | | | | 27,127,880 | | |
Money Market Funds 2.4%
| | | Shares | | Value ($) | |
JPMorgan Municipal Money Market Fund,
Agency Shares, 0.180%(i) | | | 22,023,313 | | | | 22,023,313 | | |
Total Money Market Funds
(Cost: $22,023,313) | | | | | 22,023,313 | | |
Total Investments
(Cost: $884,248,870) | | | | | 936,352,051 | | |
Other Assets & Liabilities, Net | | | | | (380,502 | ) | |
Net Assets | | | | | 935,971,549 | | |
The accompanying Notes to Financial Statements are an integral part of this statement.
Annual Report 2016
23
COLUMBIA HIGH YIELD MUNICIPAL FUND
PORTFOLIO OF INVESTMENTS (continued)
May 31, 2016
Notes to Portfolio of Investments
(a) Represents privately placed and other securities and instruments exempt from SEC registration (collectively, private placements), such as Section 4(a)(2) and Rule 144A eligible securities, which are often sold only to qualified institutional buyers. The Fund may invest in private placements determined to be liquid as well as those determined to be illiquid. Private placements may be determined to be liquid under guidelines established by the Fund's Board of Trustees. At May 31, 2016, the value of these securities amounted to $50,832,205 or 5.43% of net assets.
(b) Municipal obligations include debt obligations issued by or on behalf of territories, possessions, or sovereign nations within the territorial boundaries of the United States. At May 31, 2016, the value of these securities amounted to $45,859,642 or 4.90% of net assets.
(c) Represents securities that have defaulted on payment of interest. The Fund has stopped accruing interest on these securities. At May 31, 2016, the value of these securities amounted to $6,098,253, which represents 0.65% of net assets.
(d) Income from this security may be subject to alternative minimum tax.
(e) Zero coupon bond.
(f) Security, or a portion thereof, has been purchased on a when-issued or delayed delivery basis.
(g) Variable rate security.
(h) The Fund is entitled to receive principal and interest from the guarantor after a day or a week's notice or upon maturity. The maturity date disclosed represents the final maturity.
(i) The rate shown is the seven-day current annualized yield at May 31, 2016.
Abbreviation Legend
AGM Assured Guaranty Municipal Corporation
AMBAC Ambac Assurance Corporation
AMT Alternative Minimum Tax
BAN Bond Anticipation Note
FNMA Federal National Mortgage Association
GNMA Government National Mortgage Association
NPFGC National Public Finance Guarantee Corporation
SGI Syncora Guarantee, Inc.
TAN Tax Anticipation Note
VRDN Variable Rate Demand Note
Fair Value Measurements
The Fund categorizes its fair value measurements according to a three-level hierarchy that maximizes the use of observable inputs and minimizes the use of unobservable inputs by prioritizing that the most observable input be used when available. Observable inputs are those that market participants would use in pricing an investment based on market data obtained from sources independent of the reporting entity. Unobservable inputs are those that reflect the Fund's assumptions about the information market participants would use in pricing an investment. An investment's level within the fair value hierarchy is based on the lowest level of any input that is deemed significant to the asset's or liability's fair value measurement. The input levels are not necessarily an indication of the risk or liquidity associated with investments at that level. For example, certain U.S. government securities are generally high quality and liquid, however, they are reflected as Level 2 because the inputs used to determine fair value may not always be quoted prices in an active market.
Fair value inputs are summarized in the three broad levels listed below:
> Level 1 — Valuations based on quoted prices for investments in active markets that the Fund has the ability to access at the measurement date (including NAV for open-end mutual funds). Valuation adjustments are not applied to Level 1 investments.
> Level 2 — Valuations based on other significant observable inputs (including quoted prices for similar securities, interest rates, prepayment speeds, credit risks, etc.).
> Level 3 — Valuations based on significant unobservable inputs (including the Fund's own assumptions and judgment in determining the fair value of investments).
The accompanying Notes to Financial Statements are an integral part of this statement.
Annual Report 2016
24
COLUMBIA HIGH YIELD MUNICIPAL FUND
PORTFOLIO OF INVESTMENTS (continued)
May 31, 2016
Fair Value Measurements (continued)
Inputs that are used in determining fair value of an investment may include price information, credit data, volatility statistics, and other factors. These inputs can be either observable or unobservable. The availability of observable inputs can vary between investments, and is affected by various factors such as the type of investment, and the volume and level of activity for that investment or similar investments in the marketplace. The inputs will be considered by the Investment Manager, along with any other relevant factors in the calculation of an investment's fair value. The Fund uses prices and inputs that are current as of the measurement date, which may include periods of market dislocations. During these periods, the availability of prices and inputs may be reduced for many investments. This condition could cause an investment to be reclassified between the various levels within the hierarchy.
Investments falling into the Level 3 category are primarily supported by quoted prices from brokers and dealers participating in the market for those investments. However, these may be classified as Level 3 investments due to lack of market transparency and corroboration to support these quoted prices. Additionally, valuation models may be used as the pricing source for any remaining investments classified as Level 3. These models may rely on one or more significant unobservable inputs and/or significant assumptions by the Investment Manager. Inputs used in valuations may include, but are not limited to, financial statement analysis, capital account balances, discount rates and estimated cash flows, and comparable company data.
Under the direction of the Fund's Board of Trustees (the Board), the Investment Manager's Valuation Committee (the Committee) is responsible for overseeing the valuation procedures approved by the Board. The Committee consists of voting and non-voting members from various groups within the Investment Manager's organization, including operations and accounting, trading and investments, compliance, risk management and legal.
The Committee meets at least monthly to review and approve valuation matters, which may include a description of specific valuation determinations, data regarding pricing information received from approved pricing vendors and brokers and the results of Board-approved valuation control policies and procedures (the Policies). The Policies address, among other things, instances when market quotations are or are not readily available, including recommendations of third party pricing vendors and a determination of appropriate pricing methodologies; events that require specific valuation determinations and assessment of fair value techniques; securities with a potential for stale pricing, including those that are illiquid, restricted, or in default; and the effectiveness of third party pricing vendors, including periodic reviews of vendors. The Committee meets more frequently, as needed, to discuss additional valuation matters, which may include the need to review back-testing results, review time-sensitive information or approve related valuation actions. The Committee reports to the Board, with members of the Committee meeting with the Board at each of its regularly scheduled meetings to discuss valuation matters and actions during the period, similar to those described earlier.
For investments categorized as Level 3, the Committee monitors information similar to that described above, which may include: (i) data specific to the issuer or comparable issuers, (ii) general market or specific sector news and (iii) quoted prices and specific or similar security transactions. The Committee considers this data and any changes from prior periods in order to assess the reasonableness of observable and unobservable inputs, any assumptions or internal models used to value those securities and changes in fair value. This data is also used to corroborate, when available, information received from approved pricing vendors and brokers. Various factors impact the frequency of monitoring this information (which may occur as often as daily). However, the Committee may determine that changes to inputs, assumptions and models are not required as a result of the monitoring procedures performed.
The following table is a summary of the inputs used to value the Fund's investments at May 31, 2016:
| | | Level 1
Quoted Prices in Active
Markets for Identical
Assets ($) | | Level 2
Other Significant
Observable Inputs ($) | | Level 3
Significant
Unobservable Inputs ($) | | Total ($) | |
Investments | |
Municipal Bonds | | | — | | | | 886,162,418 | | | | — | | | | 886,162,418 | | |
Municipal Preferred Stocks | | | — | | | | 1,038,440 | | | | — | | | | 1,038,440 | | |
Municipal Short Term | | | — | | | | 27,127,880 | | | | — | | | | 27,127,880 | | |
Money Market Funds | | | 22,023,313 | | | | — | | | | — | | | | 22,023,313 | | |
Total Investments | | | 22,023,313 | | | | 914,328,738 | | | | — | | | | 936,352,051 | | |
See the Portfolio of Investments for all investment classifications not indicated in the table.
The Fund's assets assigned to the Level 2 input category are generally valued using the market approach, in which a security's value is determined through reference to prices and information from market transactions for similar or identical assets.
There were no transfers of financial assets between levels during the period.
The accompanying Notes to Financial Statements are an integral part of this statement.
Annual Report 2016
25
COLUMBIA HIGH YIELD MUNICIPAL FUND
STATEMENT OF ASSETS AND LIABILITIES
May 31, 2016
Assets | |
Investments, at value | |
(identified cost $884,248,870) | | $ | 936,352,051 | | |
Receivable for: | |
Investments sold | | | 1,342,227 | | |
Capital shares sold | | | 2,899,939 | | |
Interest | | | 14,498,287 | | |
Expense reimbursement due from Investment Manager | | | 7,452 | | |
Prepaid expenses | | | 815 | | |
Trustees' deferred compensation plan | | | 72,723 | | |
Total assets | | | 955,173,494 | | |
Liabilities | |
Payable for: | |
Investments purchased on a delayed delivery basis | | | 13,840,150 | | |
Capital shares purchased | | | 1,649,516 | | |
Dividend distributions to shareholders | | | 3,407,706 | | |
Investment management fees | | | 54,978 | | |
Distribution and/or service fees | | | 9,755 | | |
Transfer agent fees | | | 121,733 | | |
Compensation of board members | | | 139 | | |
Chief compliance officer expenses | | | 76 | | |
Other expenses | | | 45,169 | | |
Trustees' deferred compensation plan | | | 72,723 | | |
Total liabilities | | | 19,201,945 | | |
Net assets applicable to outstanding capital stock | | $ | 935,971,549 | | |
Represented by | |
Paid-in capital | | $ | 951,032,534 | | |
Undistributed net investment income | | | 6,145,186 | | |
Accumulated net realized loss | | | (73,309,352 | ) | |
Unrealized appreciation (depreciation) on: | |
Investments | | | 52,103,181 | | |
Total — representing net assets applicable to outstanding capital stock | | $ | 935,971,549 | | |
The accompanying Notes to Financial Statements are an integral part of this statement.
Annual Report 2016
26
COLUMBIA HIGH YIELD MUNICIPAL FUND
STATEMENT OF ASSETS AND LIABILITIES (continued)
May 31, 2016
Class A | |
Net assets | | $ | 190,261,992 | | |
Shares outstanding | | | 17,451,346 | | |
Net asset value per share | | $ | 10.90 | | |
Maximum offering price per share(a) | | $ | 11.24 | | |
Class B | |
Net assets | | $ | 381,500 | | |
Shares outstanding | | | 34,998 | | |
Net asset value per share | | $ | 10.90 | | |
Class C | |
Net assets | | $ | 60,143,522 | | |
Shares outstanding | | | 5,517,575 | | |
Net asset value per share | | $ | 10.90 | | |
Class R4 | |
Net assets | | $ | 4,606,716 | | |
Shares outstanding | | | 422,035 | | |
Net asset value per share | | $ | 10.92 | | |
Class R5 | |
Net assets | | $ | 7,922,440 | | |
Shares outstanding | | | 727,147 | | |
Net asset value per share | | $ | 10.90 | | |
Class Z | |
Net assets | | $ | 672,655,379 | | |
Shares outstanding | | | 61,697,004 | | |
Net asset value per share | | $ | 10.90 | | |
(a) The maximum offering price per share is calculated by dividing the net asset value per share by 1.0 minus the maximum sales charge of 3.00%.
The accompanying Notes to Financial Statements are an integral part of this statement.
Annual Report 2016
27
COLUMBIA HIGH YIELD MUNICIPAL FUND
STATEMENT OF OPERATIONS
Year Ended May 31, 2016
Net investment income | |
Income: | |
Dividends | | $ | 10,238 | | |
Interest | | | 45,558,320 | | |
Total income | | | 45,568,558 | | |
Expenses: | |
Investment management fees | | | 4,712,761 | | |
Distribution and/or service fees | |
Class A | | | 310,960 | | |
Class B | | | 4,298 | | |
Class C | | | 405,902 | | |
Transfer agent fees | |
Class A | | | 279,191 | | |
Class B | | | 817 | | |
Class C | | | 76,589 | | |
Class R4 | | | 6,989 | | |
Class R5 | | | 3,250 | | |
Class Z | | | 1,201,152 | | |
Compensation of board members | | | 32,936 | | |
Custodian fees | | | 8,280 | | |
Printing and postage fees | | | 44,802 | | |
Registration fees | | | 114,647 | | |
Audit fees | | | 25,108 | | |
Legal fees | | | 25,544 | | |
Chief compliance officer expenses | | | 428 | | |
Other | | | 24,239 | | |
Total expenses | | | 7,277,893 | | |
Fees waived or expenses reimbursed by Investment Manager and its affiliates | | | (788,955 | ) | |
Fees waived by Distributor — Class C | | | (42,675 | ) | |
Expense reductions | | | (540 | ) | |
Total net expenses | | | 6,445,723 | | |
Net investment income | | | 39,122,835 | | |
Realized and unrealized gain (loss) — net | |
Net realized gain (loss) on: | |
Investments | | | 6,703,655 | | |
Net realized gain | | | 6,703,655 | | |
Net change in unrealized appreciation (depreciation) on: | |
Investments | | | 8,563,697 | | |
Net change in unrealized appreciation | | | 8,563,697 | | |
Net realized and unrealized gain | | | 15,267,352 | | |
Net increase in net assets resulting from operations | | $ | 54,390,187 | | |
The accompanying Notes to Financial Statements are an integral part of this statement.
Annual Report 2016
28
COLUMBIA HIGH YIELD MUNICIPAL FUND
STATEMENT OF CHANGES IN NET ASSETS
| | | Year Ended
May 31, 2016 | | Year Ended
May 31, 2015 | |
Operations | |
Net investment income | | $ | 39,122,835 | | | $ | 36,477,119 | | |
Net realized gain (loss) | | | 6,703,655 | | | | (623,291 | ) | |
Net change in unrealized appreciation | | | 8,563,697 | | | | 10,594,016 | | |
Net increase in net assets resulting from operations | | | 54,390,187 | | | | 46,447,844 | | |
Distributions to shareholders | |
Net investment income | |
Class A | | | (6,659,083 | ) | | | (5,592,712 | ) | |
Class B | | | (16,117 | ) | | | (24,142 | ) | |
Class C | | | (1,550,533 | ) | | | (1,007,374 | ) | |
Class R4 | | | (174,625 | ) | | | (200,006 | ) | |
Class R5 | | | (298,416 | ) | | | (334,876 | ) | |
Class Z | | | (30,016,673 | ) | | | (29,144,371 | ) | |
Total distributions to shareholders | | | (38,715,447 | ) | | | (36,303,481 | ) | |
Increase in net assets from capital stock activity | | | 63,139,825 | | | | 86,188,876 | | |
Total increase in net assets | | | 78,814,565 | | | | 96,333,239 | | |
Net assets at beginning of year | | | 857,156,984 | | | | 760,823,745 | | |
Net assets at end of year | | $ | 935,971,549 | | | $ | 857,156,984 | | |
Undistributed net investment income | | $ | 6,145,186 | | | $ | 5,741,369 | | |
The accompanying Notes to Financial Statements are an integral part of this statement.
Annual Report 2016
29
COLUMBIA HIGH YIELD MUNICIPAL FUND
STATEMENT OF CHANGES IN NET ASSETS (continued)
| | | Year Ended May 31, 2016 | | Year Ended May 31, 2015 | |
| | | Shares | | Dollars ($) | | Shares | | Dollars ($) | |
Capital stock activity | |
Class A shares | |
Subscriptions(a) | | | 9,497,720 | | | | 102,169,905 | | | | 8,525,197 | | | | 91,272,394 | | |
Distributions reinvested | | | 557,693 | | | | 5,997,009 | | | | 465,860 | | | | 4,975,636 | | |
Redemptions | | | (6,652,755 | ) | | | (71,278,715 | ) | | | (6,672,098 | ) | | | (70,992,894 | ) | |
Net increase | | | 3,402,658 | | | | 36,888,199 | | | | 2,318,959 | | | | 25,255,136 | | |
Class B shares | |
Subscriptions | | | 2,359 | | | | 25,076 | | | | 5,531 | | | | 59,009 | | |
Distributions reinvested | | | 532 | | | | 5,713 | | | | 1,076 | | | | 11,474 | | |
Redemptions(a) | | | (18,932 | ) | | | (202,354 | ) | | | (28,839 | ) | | | (307,153 | ) | |
Net decrease | | | (16,041 | ) | | | (171,565 | ) | | | (22,232 | ) | | | (236,670 | ) | |
Class C shares | |
Subscriptions | | | 2,941,111 | | | | 31,667,069 | | | | 1,450,137 | | | | 15,484,440 | | |
Distributions reinvested | | | 122,791 | | | | 1,320,888 | | | | 73,813 | | | | 789,337 | | |
Redemptions | | | (587,907 | ) | | | (6,302,634 | ) | | | (371,078 | ) | | | (3,969,373 | ) | |
Net increase | | | 2,475,995 | | | | 26,685,323 | | | | 1,152,872 | | | | 12,304,404 | | |
Class R4 shares | |
Subscriptions | | | 321,870 | | | | 3,446,632 | | | | 814,813 | | | | 8,693,911 | | |
Distributions reinvested | | | 16,168 | | | | 174,147 | | | | 18,603 | | | | 199,523 | | |
Redemptions | | | (309,403 | ) | | | (3,295,468 | ) | | | (674,164 | ) | | | (7,278,745 | ) | |
Net increase | | | 28,635 | | | | 325,311 | | | | 159,252 | | | | 1,614,689 | | |
Class R5 shares | |
Subscriptions | | | 902,960 | | | | 9,659,184 | | | | 1,256,786 | | | | 13,496,976 | | |
Distributions reinvested | | | 27,670 | | | | 297,378 | | | | 31,259 | | | | 334,376 | | |
Redemptions | | | (567,183 | ) | | | (6,059,468 | ) | | | (1,664,359 | ) | | | (17,750,931 | ) | |
Net increase (decrease) | | | 363,447 | | | | 3,897,094 | | | | (376,314 | ) | | | (3,919,579 | ) | |
Class Z shares | |
Subscriptions | | | 13,430,368 | | | | 144,231,439 | | | | 13,827,878 | | | | 147,622,599 | | |
Distributions reinvested | | | 625,211 | | | | 6,719,777 | | | | 547,977 | | | | 5,858,071 | | |
Redemptions | | | (14,482,989 | ) | | | (155,435,753 | ) | | | (9,617,465 | ) | | | (102,309,774 | ) | |
Net increase (decrease) | | | (427,410 | ) | | | (4,484,537 | ) | | | 4,758,390 | | | | 51,170,896 | | |
Total net increase | | | 5,827,284 | | | | 63,139,825 | | | | 7,990,927 | | | | 86,188,876 | | |
(a) Includes conversions of Class B shares to Class A shares, if any.
The accompanying Notes to Financial Statements are an integral part of this statement.
Annual Report 2016
30
COLUMBIA HIGH YIELD MUNICIPAL FUND
The following tables are intended to help you understand the Fund's financial performance. Certain information reflects financial results for a single share of a class held for the periods shown. Per share net investment income (loss) amounts are calculated based on average shares outstanding during the period. Total return assumes reinvestment of all dividends and distributions, if any. Total return does not reflect payment of sales charges, if any. Total return and portfolio turnover are not annualized for periods of less than one year. The portfolio turnover rate is calculated without regard to purchase and sales transactions of short-term instruments and certain derivatives, if any. If such transactions were included, the Fund's portfolio turnover rate may be higher.
| | | Year Ended May 31, | | Year Ended
June 30, | |
Class A | | 2016 | | 2015 | | 2014 | | 2013 | | 2012(a) | | 2011 | |
Per share data | |
Net asset value, beginning of period | | $ | 10.71 | | | $ | 10.56 | | | $ | 10.72 | | | $ | 10.49 | | | $ | 9.60 | | | $ | 9.77 | | |
Income from investment operations: | |
Net investment income | | | 0.47 | | | | 0.47 | | | | 0.49 | | | | 0.45 | | | | 0.45 | | | | 0.53 | | |
Net realized and unrealized gain (loss) | | | 0.19 | | | | 0.15 | | | | (0.16 | ) | | | 0.22 | | | | 0.88 | | | | (0.19 | ) | |
Total from investment operations | | | 0.66 | | | | 0.62 | | | | 0.33 | | | | 0.67 | | | | 1.33 | | | | 0.34 | | |
Less distributions to shareholders: | |
Net investment income | | | (0.47 | ) | | | (0.47 | ) | | | (0.49 | ) | | | (0.44 | ) | | | (0.44 | ) | | | (0.51 | ) | |
Total distributions to shareholders | | | (0.47 | ) | | | (0.47 | ) | | | (0.49 | ) | | | (0.44 | ) | | | (0.44 | ) | | | (0.51 | ) | |
Net asset value, end of period | | $ | 10.90 | | | $ | 10.71 | | | $ | 10.56 | | | $ | 10.72 | | | $ | 10.49 | | | $ | 9.60 | | |
Total return | | | 6.27 | % | | | 5.97 | % | | | 3.35 | % | | | 6.44 | % | | | 14.19 | % | | | 3.63 | % | |
Ratios to average net assets(b) | |
Total gross expenses | | | 0.95 | % | | | 0.95 | % | | | 0.95 | % | | | 0.96 | % | | | 0.96 | %(c) | | | 0.91 | % | |
Total net expenses(d) | | | 0.86 | %(e) | | | 0.86 | %(e) | | | 0.86 | %(e) | | | 0.85 | %(e) | | | 0.80 | %(c)(e) | | | 0.85 | %(e) | |
Net investment income | | | 4.33 | % | | | 4.44 | % | | | 4.87 | % | | | 4.17 | % | | | 4.92 | %(c) | | | 5.46 | % | |
Supplemental data | |
Net assets, end of period (in thousands) | | $ | 190,262 | | | $ | 150,483 | | | $ | 123,890 | | | $ | 91,422 | | | $ | 93,456 | | | $ | 63,669 | | |
Portfolio turnover | | | 10 | % | | | 7 | % | | | 12 | % | | | 9 | % | | | 9 | % | | | 23 | % | |
Notes to Financial Highlights
(a) For the period from July 1, 2011 to May 31, 2012. During the period, the Fund's fiscal year end was changed from June 30 to May 31.
(b) In addition to the fees and expenses that the Fund bears directly, the Fund indirectly bears a pro rata share of the fees and expenses of any other funds in which it invests. Such indirect expenses are not included in the Fund's reported expense ratios.
(c) Annualized.
(d) Total net expenses include the impact of certain fee waivers/expense reimbursements made by the Investment Manager and certain of its affiliates, if applicable.
(e) The benefits derived from expense reductions had an impact of less than 0.01%.
The accompanying Notes to Financial Statements are an integral part of this statement.
Annual Report 2016
31
COLUMBIA HIGH YIELD MUNICIPAL FUND
FINANCIAL HIGHLIGHTS (continued)
| | | Year Ended May 31, | | Year Ended
June 30, | |
Class B | | 2016 | | 2015 | | 2014 | | 2013 | | 2012(a) | | 2011 | |
Per share data | |
Net asset value, beginning of period | | $ | 10.71 | | | $ | 10.56 | | | $ | 10.72 | | | $ | 10.49 | | | $ | 9.60 | | | $ | 9.77 | | |
Income from investment operations: | |
Net investment income | | | 0.39 | | | | 0.39 | | | | 0.42 | | | | 0.37 | | | | 0.39 | | | | 0.46 | | |
Net realized and unrealized gain (loss) | | | 0.18 | | | | 0.15 | | | | (0.17 | ) | | | 0.22 | | | | 0.87 | | | | (0.19 | ) | |
Total from investment operations | | | 0.57 | | | | 0.54 | | | | 0.25 | | | | 0.59 | | | | 1.26 | | | | 0.27 | | |
Less distributions to shareholders: | |
Net investment income | | | (0.38 | ) | | | (0.39 | ) | | | (0.41 | ) | | | (0.36 | ) | | | (0.37 | ) | | | (0.44 | ) | |
Total distributions to shareholders | | | (0.38 | ) | | | (0.39 | ) | | | (0.41 | ) | | | (0.36 | ) | | | (0.37 | ) | | | (0.44 | ) | |
Net asset value, end of period | | $ | 10.90 | | | $ | 10.71 | | | $ | 10.56 | | | $ | 10.72 | | | $ | 10.49 | | | $ | 9.60 | | |
Total return | | | 5.48 | % | | | 5.19 | % | | | 2.59 | % | | | 5.65 | % | | | 13.41 | % | | | 2.85 | % | |
Ratios to average net assets(b) | |
Total gross expenses | | | 1.70 | % | | | 1.70 | % | | | 1.71 | % | | | 1.70 | % | | | 1.72 | %(c) | | | 1.65 | % | |
Total net expenses(d) | | | 1.61 | %(e) | | | 1.61 | %(e) | | | 1.62 | %(e) | | | 1.60 | %(e) | | | 1.55 | %(c)(e) | | | 1.60 | %(e) | |
Net investment income | | | 3.62 | % | | | 3.70 | % | | | 4.13 | % | | | 3.41 | % | | | 4.24 | %(c) | | | 4.69 | % | |
Supplemental data | |
Net assets, end of period (in thousands) | | $ | 382 | | | $ | 547 | | | $ | 774 | | | $ | 1,217 | | | $ | 2,142 | | | $ | 3,052 | | |
Portfolio turnover | | | 10 | % | | | 7 | % | | | 12 | % | | | 9 | % | | | 9 | % | | | 23 | % | |
Notes to Financial Highlights
(a) For the period from July 1, 2011 to May 31, 2012. During the period, the Fund's fiscal year end was changed from June 30 to May 31.
(b) In addition to the fees and expenses that the Fund bears directly, the Fund indirectly bears a pro rata share of the fees and expenses of any other funds in which it invests. Such indirect expenses are not included in the Fund's reported expense ratios.
(c) Annualized.
(d) Total net expenses include the impact of certain fee waivers/expense reimbursements made by the Investment Manager and certain of its affiliates, if applicable.
(e) The benefits derived from expense reductions had an impact of less than 0.01%.
The accompanying Notes to Financial Statements are an integral part of this statement.
Annual Report 2016
32
COLUMBIA HIGH YIELD MUNICIPAL FUND
FINANCIAL HIGHLIGHTS (continued)
| | | Year Ended May 31, | | Year Ended
June 30, | |
Class C | | 2016 | | 2015 | | 2014 | | 2013 | | 2012(a) | | 2011 | |
Per share data | |
Net asset value, beginning of period | | $ | 10.71 | | | $ | 10.56 | | | $ | 10.72 | | | $ | 10.49 | | | $ | 9.60 | | | $ | 9.77 | | |
Income from investment operations: | |
Net investment income | | | 0.40 | | | | 0.40 | | | | 0.43 | | | | 0.38 | | | | 0.40 | | | | 0.48 | | |
Net realized and unrealized gain (loss) | | | 0.19 | | | | 0.15 | | | | (0.16 | ) | | | 0.22 | | | | 0.88 | | | | (0.20 | ) | |
Total from investment operations | | | 0.59 | | | | 0.55 | | | | 0.27 | | | | 0.60 | | | | 1.28 | | | | 0.28 | | |
Less distributions to shareholders: | |
Net investment income | | | (0.40 | ) | | | (0.40 | ) | | | (0.43 | ) | | | (0.37 | ) | | | (0.39 | ) | | | (0.45 | ) | |
Total distributions to shareholders | | | (0.40 | ) | | | (0.40 | ) | | | (0.43 | ) | | | (0.37 | ) | | | (0.39 | ) | | | (0.45 | ) | |
Net asset value, end of period | | $ | 10.90 | | | $ | 10.71 | | | $ | 10.56 | | | $ | 10.72 | | | $ | 10.49 | | | $ | 9.60 | | |
Total return | | | 5.58 | % | | | 5.31 | % | | | 2.73 | % | | | 5.81 | % | | | 13.56 | % | | | 3.01 | % | |
Ratios to average net assets(b) | |
Total gross expenses | | | 1.70 | % | | | 1.70 | % | | | 1.70 | % | | | 1.71 | % | | | 1.71 | %(c) | | | 1.66 | % | |
Total net expenses(d) | | | 1.51 | %(e) | | | 1.49 | %(e) | | | 1.46 | %(e) | | | 1.45 | %(e) | | | 1.40 | %(c)(e) | | | 1.45 | %(e) | |
Net investment income | | | 3.67 | % | | | 3.79 | % | | | 4.26 | % | | | 3.57 | % | | | 4.30 | %(c) | | | 4.88 | % | |
Supplemental data | |
Net assets, end of period (in thousands) | | $ | 60,144 | | | $ | 32,575 | | | $ | 19,946 | | | $ | 14,684 | | | $ | 12,525 | | | $ | 8,509 | | |
Portfolio turnover | | | 10 | % | | | 7 | % | | | 12 | % | | | 9 | % | | | 9 | % | | | 23 | % | |
Notes to Financial Highlights
(a) For the period from July 1, 2011 to May 31, 2012. During the period, the Fund's fiscal year end was changed from June 30 to May 31.
(b) In addition to the fees and expenses that the Fund bears directly, the Fund indirectly bears a pro rata share of the fees and expenses of any other funds in which it invests. Such indirect expenses are not included in the Fund's reported expense ratios.
(c) Annualized.
(d) Total net expenses include the impact of certain fee waivers/expense reimbursements made by the Investment Manager and certain of its affiliates, if applicable.
(e) The benefits derived from expense reductions had an impact of less than 0.01%.
The accompanying Notes to Financial Statements are an integral part of this statement.
Annual Report 2016
33
COLUMBIA HIGH YIELD MUNICIPAL FUND
FINANCIAL HIGHLIGHTS (continued)
| | | Year Ended May 31, | |
Class R4 | | 2016 | | 2015 | | 2014 | | 2013(a) | |
Per share data | |
Net asset value, beginning of period | | $ | 10.72 | | | $ | 10.57 | | | $ | 10.73 | | | $ | 10.77 | | |
Income from investment operations: | |
Net investment income | | | 0.49 | | | | 0.49 | | | | 0.52 | | | | 0.10 | | |
Net realized and unrealized gain (loss) | | | 0.20 | | | | 0.15 | | | | (0.18 | ) | | | (0.05 | )(b) | |
Total from investment operations | | | 0.69 | | | | 0.64 | | | | 0.34 | | | | 0.05 | | |
Less distributions to shareholders: | |
Net investment income | | | (0.49 | ) | | | (0.49 | ) | | | (0.50 | ) | | | (0.09 | ) | |
Total distributions to shareholders | | | (0.49 | ) | | | (0.49 | ) | | | (0.50 | ) | | | (0.09 | ) | |
Net asset value, end of period | | $ | 10.92 | | | $ | 10.72 | | | $ | 10.57 | | | $ | 10.73 | | |
Total return | | | 6.58 | % | | | 6.18 | % | | | 3.53 | % | | | 0.50 | % | |
Ratios to average net assets(c) | |
Total gross expenses | | | 0.75 | % | | | 0.76 | % | | | 0.76 | % | | | 0.71 | %(d) | |
Total net expenses(e) | | | 0.66 | %(f) | | | 0.66 | %(f) | | | 0.65 | %(f) | | | 0.68 | %(d) | |
Net investment income | | | 4.52 | % | | | 4.65 | % | | | 5.09 | % | | | 4.54 | %(d) | |
Supplemental data | |
Net assets, end of period (in thousands) | | $ | 4,607 | | | $ | 4,218 | | | $ | 2,476 | | | $ | 3 | | |
Portfolio turnover | | | 10 | % | | | 7 | % | | | 12 | % | | | 9 | % | |
Notes to Financial Highlights
(a) Based on operations from March 19, 2013 (commencement of operations) through the stated period end.
(b) Calculation of the net gain (loss) per share (both realized and unrealized) does not correlate to the aggregate realized and unrealized gain (loss) presented in the Statement of Operations due to the timing of subscriptions and redemptions of Fund shares in relation to fluctuations in the market value of the portfolio.
(c) In addition to the fees and expenses that the Fund bears directly, the Fund indirectly bears a pro rata share of the fees and expenses of any other funds in which it invests. Such indirect expenses are not included in the Fund's reported expense ratios.
(d) Annualized.
(e) Total net expenses include the impact of certain fee waivers/expense reimbursements made by the Investment Manager and certain of its affiliates, if applicable.
(f) The benefits derived from expense reductions had an impact of less than 0.01%.
The accompanying Notes to Financial Statements are an integral part of this statement.
Annual Report 2016
34
COLUMBIA HIGH YIELD MUNICIPAL FUND
FINANCIAL HIGHLIGHTS (continued)
| | | Year Ended May 31, | |
Class R5 | | 2016 | | 2015 | | 2014 | | 2013(a) | |
Per share data | |
Net asset value, beginning of period | | $ | 10.70 | | | $ | 10.55 | | | $ | 10.71 | | | $ | 10.75 | | |
Income from investment operations: | |
Net investment income | | | 0.50 | | | | 0.50 | | | | 0.52 | | | | 0.28 | | |
Net realized and unrealized gain (loss) | | | 0.20 | | | | 0.15 | | | | (0.17 | ) | | | (0.06 | )(b) | |
Total from investment operations | | | 0.70 | | | | 0.65 | | | | 0.35 | | | | 0.22 | | |
Less distributions to shareholders: | |
Net investment income | | | (0.50 | ) | | | (0.50 | ) | | | (0.51 | ) | | | (0.26 | ) | |
Total distributions to shareholders | | | (0.50 | ) | | | (0.50 | ) | | | (0.51 | ) | | | (0.26 | ) | |
Net asset value, end of period | | $ | 10.90 | | | $ | 10.70 | | | $ | 10.55 | | | $ | 10.71 | | |
Total return | | | 6.67 | % | | | 6.27 | % | | | 3.64 | % | | | 2.05 | % | |
Ratios to average net assets(c) | |
Total gross expenses | | | 0.62 | % | | | 0.61 | % | | | 0.63 | % | | | 0.61 | %(d) | |
Total net expenses(e) | | | 0.57 | % | | | 0.58 | % | | | 0.57 | % | | | 0.61 | %(d) | |
Net investment income | | | 4.62 | % | | | 4.67 | % | | | 5.21 | % | | | 4.76 | %(d) | |
Supplemental data | |
Net assets, end of period (in thousands) | | $ | 7,922 | | | $ | 3,893 | | | $ | 7,807 | | | $ | 509 | | |
Portfolio turnover | | | 10 | % | | | 7 | % | | | 12 | % | | | 9 | % | |
Notes to Financial Highlights
(a) Based on operations from November 8, 2012 (commencement of operations) through the stated period end.
(b) Calculation of the net gain (loss) per share (both realized and unrealized) does not correlate to the aggregate realized and unrealized gain (loss) presented in the Statement of Operations due to the timing of subscriptions and redemptions of Fund shares in relation to fluctuations in the market value of the portfolio.
(c) In addition to the fees and expenses that the Fund bears directly, the Fund indirectly bears a pro rata share of the fees and expenses of any other funds in which it invests. Such indirect expenses are not included in the Fund's reported expense ratios.
(d) Annualized.
(e) Total net expenses include the impact of certain fee waivers/expense reimbursements made by the Investment Manager and certain of its affiliates, if applicable.
The accompanying Notes to Financial Statements are an integral part of this statement.
Annual Report 2016
35
COLUMBIA HIGH YIELD MUNICIPAL FUND
FINANCIAL HIGHLIGHTS (continued)
| | | Year Ended May 31, | | Year Ended
June 30, | |
Class Z | | 2016 | | 2015 | | 2014 | | 2013 | | 2012(a) | | 2011 | |
Per share data | |
Net asset value, beginning of period | | $ | 10.71 | | | $ | 10.56 | | | $ | 10.72 | | | $ | 10.49 | | | $ | 9.60 | | | $ | 9.77 | | |
Income from investment operations: | |
Net investment income | | | 0.49 | | | | 0.49 | | | | 0.51 | | | | 0.47 | | | | 0.47 | | | | 0.55 | | |
Net realized and unrealized gain (loss) | | | 0.19 | | | | 0.15 | | | | (0.16 | ) | | | 0.22 | | | | 0.88 | | | | (0.19 | ) | |
Total from investment operations | | | 0.68 | | | | 0.64 | | | | 0.35 | | | | 0.69 | | | | 1.35 | | | | 0.36 | | |
Less distributions to shareholders: | |
Net investment income | | | (0.49 | ) | | | (0.49 | ) | | | (0.51 | ) | | | (0.46 | ) | | | (0.46 | ) | | | (0.53 | ) | |
Total distributions to shareholders | | | (0.49 | ) | | | (0.49 | ) | | | (0.51 | ) | | | (0.46 | ) | | | (0.46 | ) | | | (0.53 | ) | |
Net asset value, end of period | | $ | 10.90 | | | $ | 10.71 | | | $ | 10.56 | | | $ | 10.72 | | | $ | 10.49 | | | $ | 9.60 | | |
Total return | | | 6.48 | % | | | 6.19 | % | | | 3.56 | % | | | 6.65 | % | | | 14.39 | % | | | 3.82 | % | |
Ratios to average net assets(b) | |
Total gross expenses | | | 0.75 | % | | | 0.75 | % | | | 0.75 | % | | | 0.76 | % | | | 0.76 | %(c) | | | 0.71 | % | |
Total net expenses(d) | | | 0.66 | %(e) | | | 0.66 | %(e) | | | 0.67 | %(e) | | | 0.65 | %(e) | | | 0.60 | %(c)(e) | | | 0.65 | %(e) | |
Net investment income | | | 4.55 | % | | | 4.64 | % | | | 5.07 | % | | | 4.37 | % | | | 5.12 | %(c) | | | 5.68 | % | |
Supplemental data | |
Net assets, end of period (in thousands) | | $ | 672,655 | | | $ | 665,442 | | | $ | 605,931 | | | $ | 849,332 | | | $ | 830,124 | | | $ | 641,387 | | |
Portfolio turnover | | | 10 | % | | | 7 | % | | | 12 | % | | | 9 | % | | | 9 | % | | | 23 | % | |
Notes to Financial Highlights
(a) For the period from July 1, 2011 to May 31, 2012. During the period, the Fund's fiscal year end was changed from June 30 to May 31.
(b) In addition to the fees and expenses that the Fund bears directly, the Fund indirectly bears a pro rata share of the fees and expenses of any other funds in which it invests. Such indirect expenses are not included in the Fund's reported expense ratios.
(c) Annualized.
(d) Total net expenses include the impact of certain fee waivers/expense reimbursements made by the Investment Manager and certain of its affiliates, if applicable.
(e) The benefits derived from expense reductions had an impact of less than 0.01%.
The accompanying Notes to Financial Statements are an integral part of this statement.
Annual Report 2016
36
COLUMBIA HIGH YIELD MUNICIPAL FUND
NOTES TO FINANCIAL STATEMENTS
May 31, 2016
Note 1. Organization
Columbia High Yield Municipal Fund (the Fund), a series of Columbia Funds Series Trust I (the Trust), is a diversified fund. The Trust is registered under the Investment Company Act of 1940, as amended (the 1940 Act), as an open-end management investment company organized as a Massachusetts business trust.
Fund Shares
The Trust may issue an unlimited number of shares (without par value). The Fund offers Class A, Class B, Class C, Class R4, Class R5 and Class Z shares. Although all share classes generally have identical voting, dividend and liquidation rights, each share class votes separately when required by the Trust's organizational documents or by law. Different share classes pay different distribution amounts to the extent the expenses of such share classes differ, and distributions in liquidation will be proportional to the net asset value of each share class. Each share class has its own expense and sales charge structure.
Class A shares are subject to a maximum front-end sales charge of 3.00% based on the initial investment amount. Class A shares purchased without an initial sales charge in accounts aggregating $1 million to $50 million at the time of purchase are subject to a contingent deferred sales charge (CDSC) if the shares are sold within 18 months after purchase, charged as follows: 1.00% CDSC if redeemed within 12 months after purchase, and 0.50% CDSC if redeemed more than 12, but less than 18, months after purchase.
Class B shares may be subject to a maximum CDSC of 5.00% based upon the holding period after purchase. Class B shares will generally convert to Class A shares eight years after purchase. The Fund no longer accepts investments by new or existing investors in the Fund's Class B shares, except in connection with the reinvestment of any dividend and/or capital gain distributions in Class B shares of the Fund and exchanges by existing Class B shareholders of certain other funds within the Columbia Family of Funds.
Class C shares are subject to a 1.00% CDSC on shares redeemed within 12 months after purchase.
Class R4 shares are not subject to sales charges and are generally available only to omnibus retirement plans and certain investors as described in the Fund's prospectus.
Class R5 shares are not subject to sales charges and are generally available only to investors purchasing through authorized investment professionals and omnibus retirement plans.
Class Z shares are not subject to sales charges and are available only to eligible investors, which are subject to different investment minimums as described in the Fund's prospectus.
Note 2. Summary of Significant Accounting Policies
Basis of Preparation
The Fund is an investment company that applies the accounting and reporting guidance in the Financial Accounting Standards Board (FASB) Accounting Standards Codification Topic 946, Financial Services — Investment Companies (ASC 946). The financial statements are prepared in accordance with U.S. generally accepted accounting principles (GAAP), which requires management to make certain estimates and assumptions that affect the reported amounts of assets and liabilities, the disclosure of contingent assets and liabilities at the date of the financial statements and the reported amounts of income and expenses during the reporting period. Actual results could differ from those estimates.
The following is a summary of significant accounting policies followed by the Fund in the preparation of its financial statements.
Security Valuation
Debt securities generally are valued by pricing services approved by the Board of Trustees (the Board) based upon market transactions for normal, institutional-size trading units of similar securities. The services may use various pricing techniques that take into account, as applicable, factors such as yield, quality, coupon rate, maturity, type of issue, trading characteristics and other data, as well as broker quotes. Debt securities for which quotations are not readily available or not believed to be reflective of market value may also be valued based upon a bid quote from an approved independent broker-dealer. Debt securities maturing in 60 days or less are valued primarily at amortized cost value, unless this method results in a valuation that management believes does not approximate market value.
All equity securities are valued at the close of business of the New York Stock Exchange (NYSE). Equity securities are valued at the last quoted sales price on the principal exchange or market on which they trade, except for
Annual Report 2016
37
COLUMBIA HIGH YIELD MUNICIPAL FUND
NOTES TO FINANCIAL STATEMENTS (continued)
May 31, 2016
securities traded on the NASDAQ Stock Market, which are valued at the NASDAQ official close price. Unlisted securities or listed securities for which there were no sales during the day are valued at the mean of the latest quoted bid and ask prices on such exchanges or markets.
Investments in open-end investment companies, including money market funds, are valued at their latest net asset value.
Investments for which market quotations are not readily available, or that have quotations which management believes are not reflective of market value or reliable, are valued at fair value as determined in good faith under procedures approved by and under the general supervision of the Board. If a security or class of securities (such as foreign securities) is valued at fair value, such value is likely to be different from the quoted or published price for the security.
The determination of fair value often requires significant judgment. To determine fair value, management may use assumptions including but not limited to future cash flows and estimated risk premiums. Multiple inputs from various sources may be used to determine fair value.
GAAP requires disclosure regarding the inputs and valuation techniques used to measure fair value and any changes in valuation inputs or techniques. In addition, investments shall be disclosed by major category. This information is disclosed following the Fund's Portfolio of Investments.
Delayed Delivery Securities
The Fund may trade securities on other than normal settlement terms, including securities purchased or sold on a "when-issued" basis. This may increase risk to the Fund since the other party to the transaction may fail to deliver, which could cause the Fund to subsequently invest at less advantageous prices. The Fund designates cash or liquid securities in an amount equal to the delayed delivery commitment.
Security Transactions
Security transactions are accounted for on the trade date. Cost is determined and gains (losses) are based upon the specific identification method for both financial statement and federal income tax purposes.
Income Recognition
Interest income is recorded on an accrual basis. Market premiums and discounts, including original issue discounts, are amortized and accreted, respectively, over
the expected life of the security on all debt securities, unless otherwise noted.
The Fund may place a debt security on non-accrual status and reduce related interest income when it becomes probable that the interest will not be collected and the amount of uncollectible interest can be reasonably estimated. A defaulted debt security is removed from non-accrual status when the issuer resumes interest payments or when collectibility of interest is reasonably assured.
Dividend income is recorded on the ex-dividend date.
Awards from class action litigation are recorded as a reduction of cost basis if the Fund still owns the applicable securities on the payment date. If the Fund no longer owns the applicable securities, the proceeds are recorded as realized gains.
Expenses
General expenses of the Trust are allocated to the Fund and other funds of the Trust based upon relative net assets or other expense allocation methodologies determined by the nature of the expense. Expenses directly attributable to the Fund are charged to the Fund. Expenses directly attributable to a specific class of shares are charged to that share class.
Determination of Class Net Asset Value
All income, expenses (other than class-specific expenses, which are charged to that share class, as shown in the Statement of Operations) and realized and unrealized gains (losses) are allocated to each class of the Fund on a daily basis, based on the relative net assets of each class, for purposes of determining the net asset value of each class.
Federal Income Tax Status
The Fund intends to qualify each year as a regulated investment company under Subchapter M of the Internal Revenue Code, as amended, and will distribute substantially all of its tax exempt and taxable income (including net short-term capital gains), if any, for its tax year, and as such will not be subject to federal income taxes. In addition, the Fund intends to distribute in each calendar year substantially all of its net investment income, capital gains and certain other amounts, if any, such that the Fund should not be subject to federal excise tax. Therefore, no federal income or excise tax provision is recorded.
Annual Report 2016
38
COLUMBIA HIGH YIELD MUNICIPAL FUND
NOTES TO FINANCIAL STATEMENTS (continued)
May 31, 2016
Distributions to Shareholders
Distributions from net investment income, if any, are declared daily and paid monthly. Net realized capital gains, if any, are distributed at least annually. Income distributions and capital gain distributions are determined in accordance with federal income tax regulations, which may differ from GAAP.
Guarantees and Indemnifications
Under the Trust's organizational documents and, in some cases, by contract, its officers and trustees are indemnified against certain liabilities arising out of the performance of their duties to the Trust or its funds. In addition, certain of the Fund's contracts with its service providers contain general indemnification clauses. The Fund's maximum exposure under these arrangements is unknown since the amount of any future claims that may be made against the Fund cannot be determined, and the Fund has no historical basis for predicting the likelihood of any such claims.
Note 3. Fees and Other Transactions with Affiliates
Management Fees
Effective October 1, 2015, the Fund entered into a Management Agreement with Columbia Management Investment Advisers, LLC (the Investment Manager), a wholly-owned subsidiary of Ameriprise Financial, Inc. (Ameriprise Financial). Under the Management Agreement, the Investment Manager provides the Fund with investment research and advice, as well as administrative and accounting services. The management services fee is an annual fee that is equal to a percentage of the Fund's average daily net assets that declines from 0.54% to 0.34% as the Fund's net assets increase. The effective management services fee rate for the year ended May 31, 2016 was 0.54% of the Fund's average daily net assets.
Prior to October 1, 2015, the Fund paid the Investment Manager an annual fee for advisory services under an Investment Management Services Agreement and a separate annual fee for administrative and accounting services under an Administrative Services Agreement. For the period from June 1, 2015 through September 30, 2015, the investment advisory services fee paid to the Investment Manager was $1,326,979 and the administrative services fee paid to the Investment Manager was $192,012.
Compensation of Board Members
Board members, who are not officers or employees of the Investment Manager or Ameriprise Financial, are compensated for their services to the Fund as disclosed in the Statement of Operations. These Board members may participate in a Deferred Compensation Plan (the Plan) which may be terminated at any time. Obligations of the Plan will be paid solely out of the Fund's assets, and all amounts payable under the Plan constitute a general unsecured obligation of the Fund.
Compensation of Chief Compliance Officer
The Board has appointed a Chief Compliance Officer to the Fund in accordance with federal securities regulations. The Fund is allocated a portion of the expenses associated with the Chief Compliance Officer based on relative net assets of the Trust.
Transfer Agency Fees
Under a Transfer and Dividend Disbursing Agent Agreement, Columbia Management Investment Services Corp. (the Transfer Agent), an affiliate of the Investment Manager and a wholly-owned subsidiary of Ameriprise Financial, is responsible for providing transfer agency services to the Fund. The Transfer Agent has contracted with Boston Financial Data Services (BFDS) to serve as sub-transfer agent.
The Transfer Agent receives a monthly transfer agency fee based on the number or the average value of accounts, depending on the type of account. In addition, the Transfer Agent also receives sub-transfer agency fees based on a percentage of the average aggregate value of the Fund's shares maintained in omnibus accounts (other than omnibus accounts for which American Enterprise Investment Services Inc. is the broker of record or accounts where the beneficial shareholder is a customer of Ameriprise Financial Services, Inc., for which the Transfer Agent receives a per account fee). The Transfer Agent pays the fees of BFDS for services as sub-transfer agent and is not entitled to reimbursement for such fees from the Fund (with the exception of out-of-pocket fees).
The Transfer Agent also receives compensation from the Fund for various shareholder services and reimbursements for certain out-of-pocket fees. Total transfer agency fees for Class R5 shares are subject to an annual limitation of not more than 0.05% of the average daily net assets attributable to Class R5 shares.
Annual Report 2016
39
COLUMBIA HIGH YIELD MUNICIPAL FUND
NOTES TO FINANCIAL STATEMENTS (continued)
May 31, 2016
For the year ended May 31, 2016, the Fund's effective transfer agency fee rates as a percentage of average daily net assets of each class were as follows:
Class A | | | 0.18 | % | |
Class B | | | 0.18 | | |
Class C | | | 0.18 | | |
Class R4 | | | 0.18 | | |
Class R5 | | | 0.05 | | |
Class Z | | | 0.18 | | |
An annual minimum account balance fee of $20 may apply to certain accounts with a value below the applicable share class's initial minimum investment requirements to reduce the impact of small accounts on transfer agency fees. These minimum account balance fees are remitted to the Fund and recorded as part of expense reductions in the Statement of Operations. For the year ended May 31, 2016, these minimum account balance fees reduced total expenses of the Fund by $540.
Distribution and Service Fees
The Fund has an agreement with Columbia Management Investment Distributors, Inc. (the Distributor), an affiliate of the Investment Manager and a wholly-owned subsidiary of Ameriprise Financial, for distribution and shareholder services. The Board has approved, and the Fund has adopted, distribution and shareholder service plans (the Plans) applicable to certain share classes, which set the distribution and service fees for the Fund. These fees are calculated daily and are intended to compensate the Distributor and/or eligible selling and/or servicing agents for selling shares of the Fund and providing services to investors.
Under the Plans, the Fund pays a monthly service fee to the Distributor at the maximum annual rate of 0.20% of the average daily net assets attributable to Class A, Class B and Class C shares of the Fund. Also under the Plans, the Fund pays a monthly distribution fee to the Distributor at the maximum annual rates of 0.75% of the average daily net assets attributable to Class B and Class C shares of the Fund, respectively.
The Distributor has voluntarily agreed to waive a portion of the distribution fee for Class C shares so that the distribution fee does not exceed 0.65% annually of the average daily net assets attributable to Class C shares. This arrangement may be modified or terminated by the Distributor at any time.
Sales Charges
Sales charges, including front-end charges and CDSCs, received by the Distributor for distributing Fund shares
were $238,370 for Class A and for $6,349 for Class C shares for the year ended May 31, 2016.
Expenses Waived/Reimbursed by the Investment Manager and its Affiliates
The Investment Manager and certain of its affiliates have contractually agreed to waive fees and/or reimburse expenses (excluding certain fees and expenses described below) for the periods disclosed below, unless sooner terminated at the sole discretion of the Board, so that the Fund's net operating expenses, after giving effect to fees waived/expenses reimbursed and any balance credits and/or overdraft charges from the Fund's custodian, do not exceed the following annual rates as a percentage of the class' average daily net assets:
| | | October 1, 2015
through
September 30, 2016 | | Prior to
October 1, 2015 | |
Class A | | | 0.86 | % | | | 0.88 | % | |
Class B | | | 1.61 | | | | 1.63 | | |
Class C | | | 1.61 | | | | 1.63 | | |
Class R4 | | | 0.66 | | | | 0.68 | | |
Class R5 | | | 0.57 | | | | 0.60 | | |
Class Z | | | 0.66 | | | | 0.68 | | |
Under the agreement governing these fee waivers and/or expense reimbursement arrangements, the following fees and expenses are excluded from the waiver/reimbursement commitment, and therefore will be paid by the Fund, if applicable: taxes (including foreign transaction taxes), expenses associated with investments in affiliated and non-affiliated pooled investment vehicles (including mutual funds and exchange-traded funds), transaction costs and brokerage commissions, costs related to any securities lending program, dividend and interest expenses associated with securities sold short, inverse floater program fees and expenses, transaction charges and interest on borrowed money, interest, extraordinary expenses and any other expenses the exclusion of which is specifically approved by the Board. This agreement may be modified or amended only with approval from the Investment Manager, certain of its affiliates and the Fund.
Prior to October 1, 2015, the Fund's expense ratio was subject to a voluntary expense reimbursement arrangement pursuant to which fees were waived and/or expenses reimbursed (excluding certain fees and expenses immediately described above), so that the Fund's net operating expenses, after giving effect to fees waived/expenses reimbursed and any balance credits and/or overdraft charges from the Fund's custodian, did
Annual Report 2016
40
COLUMBIA HIGH YIELD MUNICIPAL FUND
NOTES TO FINANCIAL STATEMENTS (continued)
May 31, 2016
not exceed the annual rates of 0.86% for Class A, 1.61% for Class B, 1.61% for Class C, 0.66% for Class R4, 0.58% for Class R5 and 0.66% for Class Z.
Any fees waived and/or expenses reimbursed under the expense reimbursement arrangements described above are not recoverable by the Investment Manager or its affiliates in future periods. Class C distribution fees waived by the Distributor, as discussed above, are in addition to the waiver/reimbursement under these fee waivers and/or expense reimbursement arrangements.
Note 4. Federal Tax Information
The timing and character of income and capital gain distributions are determined in accordance with income tax regulations, which may differ from GAAP because of temporary or permanent book to tax differences.
At May 31, 2016, these differences are primarily due to differing treatment for capital loss carryforwards, principal and/or interest from fixed income securities, deferral/reversal of wash sale losses, Trustees' deferred compensation, distributions, investments in partnerships and tax straddles. To the extent these differences are permanent, reclassifications are made among the components of the Fund's net assets in the Statement of Assets and Liabilities. Temporary differences do not require reclassifications.
In the Statement of Assets and Liabilities the following reclassifications were made:
Undistributed net investment income | | $ | (3,571 | ) | |
Accumulated net realized loss | | | 5,697,866 | | |
Paid-in capital | | | (5,694,295 | ) | |
Net investment income (loss) and net realized gains (losses), as disclosed in the Statement of Operations, and net assets were not affected by this reclassification.
The tax character of distributions paid during the years indicated was as follows:
Year Ended May 31, | | 2016 | | 2015 | |
Ordinary income | | $ | 769,511 | | | $ | 161,721 | | |
Tax-exempt income | | | 37,945,936 | | | | 36,141,760 | | |
Total | | $ | 38,715,447 | | | $ | 36,303,481 | | |
Short-term capital gain distributions, if any, are considered ordinary income distributions for tax purposes.
At May 31, 2016, the components of distributable earnings on a tax basis were as follows:
Undistributed tax-exempt income | | $ | 14,902,578 | | |
Capital loss carryforwards | | | (72,071,451 | ) | |
Net unrealized appreciation | | | 52,782,341 | | |
At May 31, 2016, the cost of investments for federal income tax purposes was $883,569,710 and the aggregate gross unrealized appreciation and depreciation based on that cost was:
Unrealized appreciation | | $ | 79,310,722 | | |
Unrealized depreciation | | | (26,528,381 | ) | |
Net unrealized appreciation | | $ | 52,782,341 | | |
The following capital loss carryforwards, determined at May 31, 2016, may be available to reduce taxable income arising from future net realized gains on investments, if any, to the extent permitted by the Internal Revenue Code:
Year of Expiration | | Amount ($) | |
2017 | | | 17,741,445 | | |
2018 | | | 35,721,468 | | |
2019 | | | 4,244,605 | | |
No expiration — short-term | | | 2,054,931 | | |
No expiration — long-term | | | 12,309,002 | | |
Total | | | 72,071,451 | | |
Capital loss carryforwards with no expiration are required to be utilized prior to any capital losses which carry an expiration date. As a result of this ordering rule, capital loss carryforwards which carry an expiration date may be more likely to expire unused.
For the year ended May 31, 2016, $2,561,069 of capital loss carryforward was utilized, $5,694,295 expired unused.
Management of the Fund has concluded that there are no significant uncertain tax positions in the Fund that would require recognition in the financial statements. However, management's conclusion may be subject to review and adjustment at a later date based on factors including, but not limited to, new tax laws, regulations, and administrative interpretations (including relevant court decisions). Generally, the Fund's federal tax returns for the prior three fiscal years remain subject to examination by the Internal Revenue Service.
Annual Report 2016
41
COLUMBIA HIGH YIELD MUNICIPAL FUND
NOTES TO FINANCIAL STATEMENTS (continued)
May 31, 2016
Note 5. Portfolio Information
The cost of purchases and proceeds from sales of securities, excluding short-term investments and derivatives, if any, aggregated to $152,928,907 and $80,569,404, respectively, for the year ended May 31, 2016. The amount of purchase and sale activity impacts the portfolio turnover rate reported in the Financial Highlights.
Note 6. Line of Credit
The Fund has access to a revolving credit facility whereby the Fund may borrow for the temporary funding of shareholder redemptions or for other temporary or emergency purposes. Effective December 8, 2015, Citibank, N.A. and HSBC Bank USA, N.A. joined JPMorgan Chase Bank, N.A. (JPMorgan) as lead of a syndicate of banks under the credit facility, which is a collective agreement between the Fund and certain other funds managed by the Investment Manager, severally and not jointly, that permits collective borrowings up to $1 billion. Interest is charged to each participating fund based on its borrowings at a rate equal to the higher of (i) the overnight federal funds rate plus 1.00% or (ii) the one-month LIBOR rate plus 1.00%. Each borrowing under the credit facility matures no later than 60 days after the date of borrowing. The Fund also pays a commitment fee equal to its pro rata share of the amount of the credit facility at a rate of 0.15% per annum. The commitment fee is included in other expenses in the Statement of Operations. Prior to December 8, 2015, JPMorgan was the sole lead bank under the credit facility agreement that permitted borrowings up to $550 million under the same terms and interest rates as described above with the exception of the commitment fee which was charged at a rate of 0.075% per annum.
The Fund had no borrowings during the year ended May 31, 2016.
Note 7. Significant Risks
Shareholder Concentration Risk
At May 31, 2016, one unaffiliated shareholder of record owned 52.8% of the outstanding shares of the Fund in one or more accounts. The Fund has no knowledge about whether any portion of those shares was owned beneficially. Subscription and redemption activity by concentrated accounts may have a significant effect on the operations of the Fund. In the case of a large redemption, the Fund may be forced to sell investments at inopportune times, including its liquid or more liquid
positions, resulting in Fund losses and the Fund holding a higher percentage of less liquid or illiquid securities. Large redemptions could result in decreased economies of scale and increased operating expenses for non-redeeming Fund shareholders.
Credit Risk
Credit risk is the risk that the value of debt securities in the Fund's portfolio may decline because the issuer may default and fail to pay interest or repay principal when due. Rating agencies assign credit ratings to debt securities to indicate their credit risk. Lower rated or unrated debt securities held by the Fund may present increased credit risk as compared to higher-rated debt securities.
Interest Rate Risk
Interest rate risk is the risk of losses attributable to changes in interest rates. In general, if prevailing interest rates rise, the values of debt securities tend to fall, and if interest rates fall, the values of debt securities tend to rise. Actions by governments and central banking authorities can result in increases in interest rates. Increasing interest rates may negatively affect the value of debt securities held by the Fund, resulting in a negative impact on the Fund's performance and net asset value per share. In general, the longer the maturity or duration of a debt security, the greater its sensitivity to changes in interest rates.
Liquidity Risk
Liquidity risk is the risk associated with a lack of marketability of investments which may make it difficult to sell the investment at a desirable time or price. Changing regulatory, market or other conditions or environments (for example, the interest rate or credit environments) may adversely affect the liquidity of the Fund's investments. The Fund may have to accept a lower selling price for the holding, sell other investments, or forego another, more appealing investment opportunity. Generally, the less liquid the market at the time the Fund sells a portfolio investment, the greater the risk of loss or decline of value to the Fund. A less liquid market can lead to an increase in Fund redemptions, which may negatively impact Fund performance and net asset value per share, including, for example, if the Fund is forced to sell securities in a down market.
Annual Report 2016
42
COLUMBIA HIGH YIELD MUNICIPAL FUND
NOTES TO FINANCIAL STATEMENTS (continued)
May 31, 2016
High-Yield Securities Risk
Securities rated below investment grade (commonly called "high-yield" or "junk" bonds) and unrated securities of comparable quality expose the Fund to a greater risk of loss of principal and income than a fund that invests solely or primarily in investment grade securities. In addition, these investments have greater price fluctuations, are less liquid and are more likely to experience a default than higher-rated securities. High-yield securities are considered to be predominantly speculative with respect to the issuer's capacity to pay interest and repay principal.
Note 8. Subsequent Events
Management has evaluated the events and transactions that have occurred through the date the financial statements were issued and noted no items requiring adjustment of the financial statements or additional disclosure.
Note 9. Information Regarding Pending and Settled Legal Proceedings
In December 2005, without admitting or denying the allegations, American Express Financial Corporation (AEFC, which is now known as Ameriprise Financial, Inc. (Ameriprise Financial)) entered into settlement agreements with the Securities and Exchange Commission (SEC) and Minnesota Department of Commerce (MDOC) related to market timing activities. As a result, AEFC was censured and ordered to cease and desist from committing or causing any violations of certain provisions of the Investment Advisers Act of 1940, the Investment Company Act of 1940, and various Minnesota laws. AEFC agreed to pay disgorgement of $10 million and civil money penalties of $7 million. AEFC also agreed to retain an independent distribution consultant to assist in developing a plan for distribution of all disgorgement and civil penalties ordered by the SEC in accordance with various undertakings detailed at http://www.sec.gov/litigation/admin/ia-2451.pdf. Ameriprise Financial and its affiliates have cooperated with the SEC and the MDOC in these legal proceedings, and have made regular reports to the Funds' Boards of Trustees.
Ameriprise Financial and certain of its affiliates have historically been involved in a number of legal, arbitration and regulatory proceedings, including routine litigation, class actions, and governmental actions, concerning matters arising in connection with the conduct of their business activities. Ameriprise Financial believes that
the Funds are not currently the subject of, and that neither Ameriprise Financial nor any of its affiliates are the subject of, any pending legal, arbitration or regulatory proceedings that are likely to have a material adverse effect on the Funds or the ability of Ameriprise Financial or its affiliates to perform under their contracts with the Funds. Ameriprise Financial is required to make quarterly (10-Q), annual (10-K) and, as necessary, 8-K filings with the SEC on legal and regulatory matters that relate to Ameriprise Financial and its affiliates. Copies of these filings may be obtained by accessing the SEC website at www.sec.gov.
There can be no assurance that these matters, or the adverse publicity associated with them, will not result in increased fund redemptions, reduced sale of fund shares or other adverse consequences to the Funds. Further, although we believe proceedings are not likely to have a material adverse effect on the Funds or the ability of Ameriprise Financial or its affiliates to perform under their contracts with the Funds, these proceedings are subject to uncertainties and, as such, we are unable to estimate the possible loss or range of loss that may result. An adverse outcome in one or more of these proceedings could result in adverse judgments, settlements, fines, penalties or other relief that could have a material adverse effect on the consolidated financial condition or results of operations of Ameriprise Financial.
Annual Report 2016
43
COLUMBIA HIGH YIELD MUNICIPAL FUND
REPORT OF INDEPENDENT REGISTERED PUBLIC ACCOUNTING FIRM
To the Trustees of Columbia Funds Series Trust I and the Shareholders of
Columbia High Yield Municipal Fund
In our opinion, the accompanying statement of assets and liabilities, including the portfolio of investments, and the related statements of operations and of changes in net assets and the financial highlights present fairly, in all material respects, the financial position of Columbia High Yield Municipal Fund (the "Fund", a series of Columbia Funds Series Trust I) at May 31, 2016, and the results of its operations, the changes in its net assets and the financial highlights for each of the periods indicated, in conformity with accounting principles generally accepted in the United States of America. These financial statements and financial highlights (hereafter referred to as "financial statements") are the responsibility of the Fund's management. Our responsibility is to express an opinion on these financial statements based on our audits. We conducted our audits of these financial statements in accordance with the standards of the Public Company Accounting Oversight Board (United States). Those standards require that we plan and perform the audit to obtain reasonable assurance about whether the financial statements are free of material misstatement. An audit includes examining, on a test basis, evidence supporting the amounts and disclosures in the financial statements, assessing the accounting principles used and significant estimates made by management, and evaluating the overall financial statement presentation. We believe that our audits, which included confirmation of securities at May 31, 2016 by correspondence with the custodian and brokers, provide a reasonable basis for our opinion.
PricewaterhouseCoopers LLP
Minneapolis, MN
July 25, 2016
Annual Report 2016
44
COLUMBIA HIGH YIELD MUNICIPAL FUND
FEDERAL INCOME TAX INFORMATION
(Unaudited)
The Fund hereby designates the following tax attributes for the fiscal year ended May 31, 2016. Shareholders will be notified in early 2017 of the amounts for use in preparing 2016 income tax returns.
Tax Designations
Exempt-Interest Dividends | | | 98.01 | % | |
Exempt-Interest Dividends. The percentage of net investment income distributed during the fiscal year that qualifies as exempt-interest dividends for federal income tax purposes. A portion of the income may be subject to federal alternative minimum tax.
Annual Report 2016
45
COLUMBIA HIGH YIELD MUNICIPAL FUND
Shareholders elect the Board that oversees the Fund's operations. The Board appoints officers who are responsible for day-to-day business decisions based on policies set by the Board. The following table provides basic biographical information about the Fund's Trustees, including their principal occupations during the past five years, although specific titles for individuals may have varied over the period. The year set forth beneath Length of Service in the table below is the year in which the Trustee was first appointed or elected as Trustee to any Fund currently in the Columbia Funds Complex or a predecessor thereof. Under current Board policy, members serve terms of indefinite duration.
Trustees
Independent Trustees
Name,
Address,
Year of Birth | | Position Held With
the Trust and Length of
Service | | Principal Occupation(s)
During the Past Five Years
and Other Relevant
Professional Experience | | Number of
Funds in the
Columbia Funds
Complex
Overseen | | Other Directorships
Held by Trustee During
the Past Five Years | |
Janet Langford Carrig
c/o Columbia
Management Investment Advisers, LLC,
225 Franklin Street
Mail Drop BX32 05228,
Boston, MA 02110
1957 | | Trustee 1996 | | Senior Vice President, General Counsel and Corporate Secretary, ConocoPhillips (integrated energy company) since September 2007 | | | 57 | | | None | |
Douglas A. Hacker
c/o Columbia Management Investment Advisers, LLC,
225 Franklin Street
Mail Drop BX32 05228,
Boston, MA 02110
1955 | | Trustee and Chairman of the Board 1996 | | Independent business executive since May 2006; Executive Vice President — Strategy of United Airlines from December 2002 to May 2006; President of UAL Loyalty Services (airline marketing company) from September 2001 to December 2002; Executive Vice President and Chief Financial Officer of United Airlines from July 1999 to September 2001 | | | 57 | | | Spartan Nash Company (food distributor); Nash Finch Company (food distributor) from 2005 to 2013; Aircastle Limited (aircraft leasing); SeaCube Container Leasing Ltd. (container leasing) from 2010 to 2013; and Travelport Worldwide Limited (travel information technology) | |
Nancy T. Lukitsh
c/o Columbia Management Investment Advisers, LLC,
225 Franklin Street
Mail Drop BX32 05228,
Boston, MA 02110
1956 | | Trustee 2011 | | Senior Vice President, Partner and Director of Marketing, Wellington Management Company, LLP (investment adviser) from 1997 to 2010; Chair, Wellington Management Portfolios (commingled non-U.S. investment pools) from 2007 to 2010; Director, Wellington Trust Company, NA and other Wellington affiliates from 1997 to 2010 | | | 57 | | | None | |
Annual Report 2016
46
COLUMBIA HIGH YIELD MUNICIPAL FUND
TRUSTEES AND OFFICERS (continued)
Independent Trustees (continued)
Name,
Address,
Year of Birth | | Position Held With
the Trust and Length of
Service | | Principal Occupation(s)
During the Past Five Years
and Other Relevant
Professional Experience | | Number of
Funds in the
Columbia Funds
Complex
Overseen | | Other Directorships
Held by Trustee During
the Past Five Years | |
William E. Mayer
c/o Columbia Management Investment Advisers, LLC,
225 Franklin Street
Mail Drop BX32 05228,
Boston, MA 02110
1940 | | Trustee 1991 | | Partner, Park Avenue Equity Partners (private equity) since February 1999 | | | 57 | | | DynaVox Inc. (speech creation); Lee Enterprises (print media); WR Hambrecht + Co. (financial service provider) from 2000 to 2012; BlackRock Capital Investment Corporation (investment company); and Premier, Inc. (healthcare) | |
David M. Moffett
c/o Columbia Management Investment Advisers, LLC,
225 Franklin Street
Mail Drop BX32 05228,
Boston, MA 02110
1952 | | Trustee 2011 | | Retired. Consultant to Bridgewater and Associates | | | 57 | | | Director of CIT Bank, CIT Group Inc. (commercial and consumer finance); eBay Inc. (online trading community); Genworth Financial, Inc. (financial and insurance products and services); Paypal Holdings Inc. (payment and data processing services); and Trustee University of Oklahoma Foundation | |
Charles R. Nelson
c/o Columbia Management Investment Advisers, LLC,
225 Franklin Street
Mail Drop BX32 05228,
Boston, MA 02110
1942 | | Trustee 1981 | | Retired. Professor Emeritus, University of Washington since 2011; Professor of Economics, University of Washington from 1976 to 2011; Ford and Louisa Van Voorhis Professor of Political Economy, University of Washington from 1993 to 2011; Adjunct Professor of Statistics, University of Washington from 1980 to 2011; Associate Editor, Journal of Money, Credit and Banking from September 1993 to 2008; consultant on econometric and statistical matters | | | 57 | | | None | |
John J. Neuhauser
c/o Columbia Management Investment Advisers, LLC,
225 Franklin Street
Mail Drop BX32 05228,
Boston, MA 02110
1943 | | Trustee 1984 | | President, Saint Michael's College since August 2007; Director or Trustee of several non-profit organizations, including University of Vermont Medical Center; Academic Vice President and Dean of Faculties, Boston College from August 1999 to October 2005; University Professor, Boston College from November 2005 to August 2007 | | | 57 | | | Liberty All-Star Equity Fund and Liberty All-Star Growth Fund (closed-end funds) | |
Annual Report 2016
47
COLUMBIA HIGH YIELD MUNICIPAL FUND
TRUSTEES AND OFFICERS (continued)
Independent Trustees (continued)
Name,
Address,
Year of Birth | | Position Held With
the Trust and Length of
Service | | Principal Occupation(s)
During the Past Five Years
and Other Relevant
Professional Experience | | Number of
Funds in the
Columbia Funds
Complex
Overseen | | Other Directorships
Held by Trustee During
the Past Five Years | |
Patrick J. Simpson
c/o Columbia Management Investment Advisers, LLC,
225 Franklin Street
Mail Drop BX32 05228,
Boston, MA 02110
1944 | | Trustee 2000 | | Of Counsel, Perkins Coie LLP (law firm) since 2015; Partner, Perkins Coie LLP from 1988 to 2014 | | | 57 | | | None | |
Anne-Lee Verville
c/o Columbia Management Investment Advisers, LLC,
225 Franklin Street
Mail Drop BX32 05228,
Boston, MA 02110
1945 | | Trustee 1998 | | Retired. General Manager, Global Education Industry from 1994 to 1997, President — Application Systems Division from 1991 to 1994, Chief Financial Officer — US Marketing & Services from 1988 to 1991, and Chief Information Officer from 1987 to 1988, IBM Corporation (computer and technology) | | | 57 | | | Enesco Group, Inc. (producer of giftware and home and garden decor products) from 2001 to 2006 | |
Consultant to the Trustees*
Name,
Address,
Year of Birth | | Position Held With
the Trust and Length of
Service | | Principal Occupation(s)
During the Past Five Years
and Other Relevant
Professional Experience | | Number of
Funds in the
Columbia Funds
Complex
Overseen | | Other Directorships
Held by Trustee During
the Past Five Years | |
J. Kevin Connaughton
c/o Columbia
Management Investment Advisers, LLC,
225 Franklin Street
Mail Drop BX32 05228,
Boston, MA 02110
1964 | | Trustee Consultant 2016 | | Trustee Consultant, Columbia Funds since March 2016; Managing Director and General Manager of Mutual Fund Products, Columbia Management Investment Advisers, LLC from May 2010 to February 2015; President, Columbia Funds from 2009 to 2015; and senior officer of Columbia Funds and affiliated funds from 2003 to 2015 | | | 57 | | | Board of Governors, Gateway Healthcare since January 2016; Trustee, New Century Portfolios since March 2015; and Director, The Autism Project since March 2015 | |
* J. Kevin Connaughton was appointed consultant to the Trustees effective March 1, 2016. Shareholders of the Funds are expected to be asked to elect Mr. Connaughton as a Trustee at a future shareholder meeting.
Annual Report 2016
48
COLUMBIA HIGH YIELD MUNICIPAL FUND
TRUSTEES AND OFFICERS (continued)
Interested Trustee Affiliated with Investment Manager*
Name,
Address,
Year of Birth | | Position Held With
the Trust and Length of
Service | | Principal Occupation(s)
During the Past Five Years
and Other Relevant
Professional Experience | | Number of
Funds in the
Columbia Funds
Complex
Overseen | | Other Directorships
Held by Trustee During
the Past Five Years | |
William F. Truscott
c/o Columbia Management Investment Advisers, LLC,
225 Franklin Street
Boston, MA 02110
1960 | | Trustee 2012 | | Chairman of the Board and President, Columbia Management Investment Advisers, LLC since May 2010 and February 2012, respectively; Chief Executive Officer, Global Asset Management, Ameriprise Financial, Inc. since September 2012 (previously Chief Executive Officer, U.S. Asset Management & President, Annuities, May 2010- September 2012); Director and Chief Executive Officer, Columbia Management Investment Distributors, Inc. since May 2010 and February 2012, respectively; Chairman of the Board and Chief Executive Officer, RiverSource Distributors, Inc. since 2006; Director, Threadneedle Asset Management Holdings, SARL since 2014; President and Chief Executive Officer, Ameriprise Certificate Company, 2006-August 2012. | | | 176 | | | Chairman of the Board, Columbia Management Investment Advisers, LLC since May 2010; Director, Columbia Management Investment Distributors, Inc. since May 2010; Former Director, Ameriprise Certificate Company, 2006-January 2013 | |
* Interested person (as defined under the 1940 Act) by reason of being an officer, director, security holder and/or employee of the Investment Manager or Ameriprise Financial.
The Statement of Additional Information has additional information about the Fund's Board members and is available, without charge, upon request by calling 800.345.6611; contacting your financial intermediary; or visiting columbiathreadneedle.com/us.
Annual Report 2016
49
COLUMBIA HIGH YIELD MUNICIPAL FUND
TRUSTEES AND OFFICERS (continued)
The Board has appointed officers who are responsible for day-to-day business decisions based on policies it has established. The officers serve at the pleasure of the Board. The following table provides basic information about the Officers of the Fund, including principal occupations during the past five years, although their specific titles may have varied over the period. In addition to Mr. Truscott, who is Senior Vice President, the Fund's other officers are:
Fund Officers
Name,
Address and
Year of Birth | | Position and Year
First Appointed to
Position for any Fund
in the Columbia
Funds Complex or a
Predecessor Thereof | |
Principal Occupation(s) During Past Five Years | |
Christopher O. Petersen
5228 Ameriprise Financial Center
Minneapolis, MN 55474
Born 1970 | | President and Principal Executive Officer (2015) | | Vice President and Lead Chief Counsel, Ameriprise Financial, Inc. since January 2015 (previously, Vice President and Chief Counsel January 2010-December 2014; officer of Columbia Funds and affiliated funds since 2007. | |
Michael G. Clarke
225 Franklin Street
Boston, MA 02110
Born 1969 | | Treasurer (2011), Chief Financial Officer (2009) and Chief Accounting Officer (2015) | | Vice President — Mutual Fund Administration, Columbia Management Investment Advisers, LLC, since May 2010; senior officer of Columbia Funds and affiliated funds since 2002. | |
Paul B. Goucher
100 Park Avenue
New York, NY 10017
Born 1968 | | Senior Vice President (2011), Chief Legal Officer (2015) and Assistant Secretary (2008) | | Vice President and Lead Chief Counsel, Ameriprise Financial, Inc. since November 2008 and January 2013, respectively (previously Chief Counsel, January 2010-January 2013; Vice President, Chief Legal Officer and Assistant Secretary, Columbia Management Investment Advisers, LLC since May 2010. | |
Thomas P. McGuire
225 Franklin Street
Boston, MA 02110
Born 1972 | | Senior Vice President and Chief Compliance Officer (2012) | | Vice President — Asset Management Compliance, Ameriprise Financial, Inc., since May 2010; Chief Compliance Officer, Ameriprise Certificate Company since September 2010. | |
Colin Moore
225 Franklin Street
Boston, MA 02110
Born 1958 | | Senior Vice President (2010) | | Executive Vice President and Global Chief Investment Officer, Ameriprise Financial, Inc., since July 2013; Executive Vice President and Global Chief Investment Officer, Columbia Management Investment Advisers, LLC since July 2013 (previously Director and Global Chief Investment Officer, 2010-2013). | |
Michael E. DeFao
225 Franklin Street
Boston, MA 02110
Born 1968 | | Vice President (2011) and Assistant Secretary (2010) | | Vice President and Chief Counsel, Ameriprise Financial, Inc. since May 2010. | |
Amy Johnson
5228 Ameriprise Financial Center
Minneapolis, MN 55474
Born 1965 | | Vice President (2006) | | Managing Director and Global Head of Operations Columbia Management Investment Advisers, LLC since April 2016 (previously Managing Director and Chief Operating Officer, 2010-2016). | |
Lyn Kephart-Strong
5228 Ameriprise
Financial Center
Minneapolis, MN 55474
Born 1960 | | Vice President (2015) | | President, Columbia Management Investment Services Corp. since October 2014; Vice President & Resolution Officer, Ameriprise Trust Company since August 2009. | |
Ryan C. Larrenaga
225 Franklin Street
Boston, MA 02110
Born 1970 | | Vice President and Secretary (2015) | | Vice President and Group Counsel, Ameriprise Financial, Inc. since August 2011 (previously, Counsel from May 2010 to August 2011); officer of Columbia Funds and affiliated funds since 2005. | |
Annual Report 2016
50
COLUMBIA HIGH YIELD MUNICIPAL FUND
IMPORTANT INFORMATION ABOUT THIS REPORT
Each fund mails one shareholder report to each shareholder address. If you would like more than one report, please call shareholder services at 800.345.6611 and additional reports will be sent to you.
The policy of the Board is to vote the proxies of the companies in which each fund holds investments consistent with the procedures as stated in the Statement of Additional Information (SAI). You may obtain a copy of the SAI without charge by calling 800.345.6611; contacting your financial intermediary; visiting columbiathreadneedle.com/us; or searching the website of the Securities and Exchange Commission (SEC) at sec.gov. Information regarding how each fund voted proxies relating to portfolio securities is filed with the SEC by August 31st for the most recent 12-month period ending June 30th of that year, and is available without charge by visiting columbiathreadneedle.com/us, or searching the website of the SEC at sec.gov.
Each fund files a complete schedule of portfolio holdings with the SEC for the first and third quarters of each fiscal year on Form N-Q. Each fund's Form N-Q is available on the SEC's website at sec.gov and may be reviewed and copied at the SEC's Public Reference Room in Washington, D.C. Information on the operation of the Public Reference Room may be obtained by calling 800.SEC.0330. Each fund's complete schedule of portfolio holdings, as filed on Form N-Q, can also be obtained without charge, upon request, by calling 800.345.6611.
Annual Report 2016
51
Columbia High Yield Municipal Fund
P.O. Box 8081
Boston, MA 02266-8081

This information is for use with concurrent or prior delivery of a fund prospectus. Please read and consider the investment objectives, risks, charges and expenses for any fund carefully before investing. For a prospectus and summary prospectus, which contains this and other important information about the Fund, go to columbiathreadneedle.com/us. The Fund is distributed by Columbia Management Investment Distributors, Inc., member FINRA, and managed by Columbia Management Investment Advisers, LLC.
Columbia Threadneedle Investments (Columbia Threadneedle) is the global brand name of the Columbia and Threadneedle group of companies.
All rights reserved. Columbia Management Investment Distributors, Inc., 225 Franklin Street, Boston, MA 02110-2804
© 2016 Columbia Management Investment Advisers, LLC.
columbiathreadneedle.com/us
ANN161_05_F01_(07/16)

ANNUAL REPORT
May 31, 2016

COLUMBIA ADAPTIVE RISK ALLOCATION FUND

ABOUT COLUMBIA THREADNEEDLE INVESTMENTS
Columbia Threadneedle Investments is a leading global asset management group that provides a broad range of actively managed investment strategies and solutions for individual, institutional and corporate clients around the world.
With more than 2,000 people, including over 450 investment professionals based in North America, Europe and Asia, we manage $464 billion* of assets across developed and emerging market equities, fixed income, asset allocation solutions and alternatives. We are the 13th largest manager of long-term mutual fund assets in the U.S.** and the 3rd largest manager of retail funds in the U.K.***
Our priority is the investment success of our clients. We aim to deliver the investment outcomes they expect through an investment approach that is team-based, performance-driven and risk-aware. Our culture is dynamic and interactive. By sharing our insights across asset classes and geographies, we generate richer perspectives on global, regional and local investment landscapes. The ability to exchange and debate investment ideas in a collaborative environment enriches our teams' investment processes. More importantly, it results in better informed investment decisions for our clients.
Columbia funds are distributed by Columbia Management Investment Distributors, Inc., member FINRA, and managed by Columbia Management Investment Advisers, LLC.
Columbia Threadneedle Investments (Columbia Threadneedle) is the global brand name of the Columbia and Threadneedle group of companies.
* In U.S. dollars as of March 31, 2016. Source: Ameriprise Q1 Earnings Release. Includes all assets managed by entities in the Columbia and Threadneedle group of companies. Contact us for more current data.
** Source: ICI as of March 31, 2016 for Columbia Management Investment Advisers, LLC.
*** Source: Investment Association as of December 2015 for Threadneedle Asset Management Limited.
© 2016 Columbia Management Investment Advisers, LLC. All rights reserved.
Not part of the shareholder report
Investment strategies to help meet investor needs
We are committed to helping investors navigate financial challenges to reach their desired outcomes. The possibilities are endless.
Your success is our priority.
 Retire comfortably
 Fund college or higher education
 Leave a legacy

Generate an appropriate stream of income in retirement
Traditional approaches to income may no longer be adequate — and they may no longer provide the diversification benefits they once did. Investors need to rethink how they generate retirement income.
Worried about running out of income? You are not alone.

Navigate a changing interest rate environment
Even in today's challenging interest rate environment, it's still possible to navigate markets and achieve your goals.
Make investment choices designed specifically for this market environment.

Maximize after-tax returns
In an environment where what you keep is more important than what you earn, municipal bonds can help mitigate higher taxes while providing attractive yields compared to other investment options.
You've worked too hard building your wealth to lose it to taxes.

Grow assets to achieve financial goals
Finding growth opportunities in today's complex market environment requires strong research capabilities, creative thinking and a disciplined approach.
Do your investments deliver the portfolio growth you need?

Ease the impact of volatile markets
With increasing concerns about market volatility, investors should consider diversifying their portfolios with non-traditional holdings.
Interested in turning volatility into opportunity?
To find out more, contact your financial professional, call 800.426.3750 or visit columbiathreadneedle.com/us
Not part of the shareholder report
 Dear Shareholders,
Volatility comes with the territory for long-term investors. Some investors instinctively want to pull out of the market or sell underperforming investments at the first sign of increased volatility or perhaps even as soon as they perceive it on the horizon. But taking yourself out of the market could mean losing out on potential opportunities, and putting your longer-term investment goals at risk.
Cumulative return is not just about achieving high returns when markets are going up; it's also about remaining invested and minimizing losses during weak or volatile markets so that you can participate on the upside. Developing a deeper understanding of the various risks your portfolio is subject to can help you balance these risks.
Diversification is critical in seeking to achieve that balance. We believe that most portfolios could be more effectively diversified either by introducing holdings with performance profiles unrelated to existing holdings (like alternative products) or by rebalancing existing holdings with an eye toward risk allocation. Over time, distributing risk more evenly may produce a more pronounced diversification benefit and may improve portfolio efficiency. We believe market volatility can create significant opportunities and, in fact, these periods may be some of the very best times to invest.
With this in mind, I thought it important to highlight excerpts from a piece written by Colin Moore, Global Chief Investment Officer, in which he touches on some of these issues emphasizing the importance of a properly constructed portfolio in seeking to effectively manage volatility and to achieve consistency of returns. I encourage you to read the article in its entirety. To access the full article and for other insights on current market, please visit blog.columbiathreadneedleus.com/latest-perspectives.
You need investments that are designed to help you ease the impact of volatile market environments and keep the savings you have worked tirelessly to amass. Columbia Threadneedle Investments provides investment solutions to help you tackle financial challenges and achieve your desired outcome.
Best regards,

Christopher O. Petersen
President, Columbia Funds
Excerpts from:
Taking the scare out of the volatility bogeyman
By Colin Moore, Global Chief Investment Officer
Colin Moore is the global chief investment officer for Columbia Threadneedle Investments. His responsibilities include ensuring that a disciplined investment process is in place across all asset classes, including equity and fixed income. Mr. Moore joined one of the Columbia Threadneedle Investments legacy firms in 2002 as head of equity and was also head of fixed income and liquidity strategies from 2009 – 2010.

n In today's low growth, higher volatility world, the emphasis is shifting from maximization of returns to consistency of returns.
PRESIDENT'S MESSAGE (continued)
n Portfolios should represent the behavioral risk-return tradeoff of investors, remembering that they won't stay invested to realize the return if we get the risk tolerance wrong.
n Holding long-term savings in cash to avoid volatility (the financial equivalent of hiding under the sheets) is detrimental to achieving long-term goals.
According to Wikipedia, "The bogeyman is a common allusion to a mythical creature in many cultures used to control behavior. This monster has no specific appearance, and conceptions about it can vary drastically from household to household within the same community; in many cases he has no set appearance in the mind of an adult or child, but is simply a non-specific embodiment of terror." Different cultures have different names and physical representations for the bogeyman, and investors are no different. We have terrible monsters that we fear may destroy our portfolios, and we call one of the scariest of them volatility.
While the bogeyman is mythical (I hope!), volatility is real and can cause serious damage. To understand why investors have such a hard time coping with volatility, we first need to define three cognitive biases at work in today's investment environment:
1) Recency bias — something that has recently come to the forefront of our attention, regardless of how long established it is, suddenly seems to appear with improbable frequency.
2) Negativity bias — we tend to have a greater recall of unpleasant memories than positive memories.
3) Loss aversion — our dissatisfaction with losing money tends to be greater than our satisfaction with making money.
The level of volatility varies dramatically, and so does investor fear and panic selling — waxing when volatility rises, waning when it falls. Recent studies have pointed to demographics as an important driver of panic selling. The theory is that as people get closer to retirement, the prospects of a large (20% – 30%) loss in financial assets can have a much more pronounced effect on their sense of well-being. Wealth preservation instincts kick in much more quickly than for younger (and typically less wealthy) savers.
The reality is that there is little opportunity for return without volatility. Therefore, the bogeyman effect of holding long-term savings in cash to avoid volatility (the financial equivalent of hiding under the sheets) is detrimental to achieving long-term goals. This effect tends to be more pronounced during the episodic spikes in volatility. The significant spike in volatility in 2008 and 2009 led to significant withdrawals from long-term investment funds over the same period. Less pronounced effects can also be seen when comparing 2001 – 2003 and 2011 – 2012. Conversely, flows picked up when volatility returned to "normal" levels. Investor behavior of this type is consistent with the three behavioral biases.
I believe average volatility will be higher over the next 10 years than the last 10 years and episodic spikes will increase in frequency because sustainable economic growth will be structurally lower and geopolitical risk higher than any time since World War II. Low growth creates uncertainty while loss aversion will make investors fear that we are one economic mishap or geopolitical event away from no growth or recession. The result will be higher volatility on average. Negativity bias will tend to exacerbate "spike" reactions to event-driven geopolitical news, and the volatility bogeyman will appear more often. Assuming the behavioral biases continue, investor returns are likely to be very disappointing regardless of the total return generated by financial markets due to the bogeyman effect.
To mitigate this effect, we need to focus on portfolio construction and an improved understanding of diversification. I accept that equities are likely to offer the highest return over the next 10 years, but they also offer the highest volatility. Many portfolio construction optimization tools use historical average volatility, which is likely to underestimate the volatility investors will face. The bogeyman emerges when individual asset class volatility spikes and cross correlations rise, the combination of which increases overall portfolio volatility far beyond expectation. Diversification is meant to protect investors against volatility, but what's the point of owning lots of investments if the volatility bogeyman has not been properly estimated?
Most importantly, portfolios should be constructed to properly represent the behavioral risk-return tradeoff of investors, remembering that they won't stay invested to realize the return if we get the risk tolerance wrong. In a low growth, higher volatility world, the emphasis is shifting to return consistency rather than return maximization,
PRESIDENT'S MESSAGE (continued)
and investors are best served through investment approaches that appreciate that distinction. Even though it's a permanent feature of financial markets, volatility is less likely to be the bogeyman we all fear if portfolios are constructed with this understanding.
Please visit blog.columbiathreadneedleus.com/latest-perspectives to read the entire article.
Investors should consider the investment objectives, risks, charges and expenses of a mutual fund carefully before investing. For a free prospectus and summary prospectus, which contains this and other important information about a fund, visit columbiathreadneedle.com/us. The prospectus should be read carefully before investing.
The views expressed are as of April 2016, may change as market or other conditions change, and may differ from views expressed by other Columbia Management Investment Advisers, LLC (CMIA) associates or affiliates. Actual investments or investment decisions made by CMIA and its affiliates, whether for its own account or on behalf of clients, will not necessarily reflect the views expressed. This information is not intended to provide investment advice and does not account for individual investor circumstances. Investment decisions should always be made based on an investor's specific financial needs, objectives, goals, time horizon and risk tolerance. Asset classes described may not be suitable for all investors.
Past performance does not guarantee future results, and no forecast should be considered a guarantee either. Since economic and market conditions change frequently, there can be no assurance that the trends described here will continue or that the forecasts are accurate.
Diversification does not guarantee a profit or protect against loss.
Columbia Funds are distributed by Columbia Management Investment Distributors, Inc., member FINRA, and managed by Columbia Management Investment Advisers, LLC.
© 2016 Columbia Management Investment Advisers, LLC. All rights reserved.
COLUMBIA ADAPTIVE RISK ALLOCATION FUND
Performance Overview | | | 2 | | |
Manager Discussion of Fund Performance | | | 4 | | |
Understanding Your Fund's Expenses | | | 7 | | |
Portfolio of Investments | | | 8 | | |
Statement of Assets and Liabilities | | | 17 | | |
Statement of Operations | | | 19 | | |
Statement of Changes in Net Assets | | | 20 | | |
Financial Highlights | | | 22 | | |
Notes to Financial Statements | | | 31 | | |
Report of Independent Registered Public Accounting Firm | | | 47 | | |
Trustees and Officers | | | 48 | | |
Important Information About This Report | | | 53 | | |
Fund Investment Manager
Columbia Management Investment
Advisers, LLC
225 Franklin Street
Boston, MA 02110
Fund Distributor
Columbia Management Investment
Distributors, Inc.
225 Franklin Street
Boston, MA 02110
Fund Transfer Agent
Columbia Management Investment
Services Corp.
P.O. Box 8081
Boston, MA 02266-8081
For more information about any of the funds, please visit columbiathreadneedle.com/us or call 800.345.6611. Customer Service Representatives are available to answer your questions Monday through Friday from 8 a.m. to 7 p.m. Eastern time.
The views expressed in this report reflect the current views of the respective parties. These views are not guarantees of future performance and involve certain risks, uncertainties and assumptions that are difficult to predict, so actual outcomes and results may differ significantly from the views expressed. These views are subject to change at any time based upon economic, market or other conditions and the respective parties disclaim any responsibility to update such views. These views may not be relied on as investment advice and, because investment decisions for a Columbia fund are based on numerous factors, may not be relied on as an indication of trading intent on behalf of any particular Columbia fund. References to specific securities should not be construed as a recommendation or investment advice.
COLUMBIA ADAPTIVE RISK ALLOCATION FUND
Performance Summary
n Columbia Adaptive Risk Allocation Fund (the Fund) Class A shares returned -0.55% excluding sales charges for the 12-month period that ended May 31, 2016.
n During the same time period, the Fund outperformed its Blended Benchmark, which returned -0.95%, but underperformed the Citi Three-Month U.S. Treasury Bill Index, which returned 0.12%.
n The Fund takes a risk-based approach to allocating assets across four primary segments of global capital markets — equities, interest rates, inflation hedging and spread assets. While absolute returns were disappointing, our tactical positioning was the principal driver of the Fund's outperformance of its Blended Benchmark during the period.
Average Annual Total Returns (%) (for period ended May 31, 2016)
| | | Inception | | 1 Year | | Life | |
Class A | | 06/19/12 | | | | | | | | | |
Excluding sales charges | | | | | | | -0.55 | | | | 2.95 | | |
Including sales charges | | | | | | | -6.26 | | | | 1.41 | | |
Class C | | 06/19/12 | | | | | | | | | |
Excluding sales charges | | | | | | | -1.26 | | | | 2.17 | | |
Including sales charges | | | | | | | -2.24 | | | | 2.17 | | |
Class K | | 06/19/12 | | | -0.45 | | | | 3.02 | | |
Class R | | 06/19/12 | | | -0.75 | | | | 2.69 | | |
Class R4* | | 10/01/14 | | | -0.25 | | | | 3.06 | | |
Class R5 | | 06/19/12 | | | -0.15 | | | | 3.29 | | |
Class W | | 06/19/12 | | | -0.55 | | | | 2.97 | | |
Class Y* | | 10/01/14 | | | -0.15 | | | | 3.11 | | |
Class Z | | 06/19/12 | | | -0.25 | | | | 3.22 | | |
Blended Benchmark | | | | | | | -0.95 | | | | 5.94 | | |
Citi Three-Month U.S. Treasury Bill Index | | | | | | | 0.12 | | | | 0.07 | | |
Returns for Class A are shown with and without the maximum initial sales charge of 5.75%. Returns for Class C are shown with and without the 1.00% CDSC for the first year only. The Fund's other classes are not subject to sales charges and have limited eligibility. Please see the Fund's prospectus for details. Performance for different share classes will vary based on differences in sales charges and fees associated with each class. All results shown assume reinvestment of distributions during the period. Returns do not reflect the deduction of taxes that a shareholder may pay on Fund distributions or on the redemption of Fund shares. Performance results reflect the effect of any fee waivers or reimbursements of Fund expenses by Columbia Management Investment Advisers, LLC and/or any of its affiliates. Absent these fee waivers or expense reimbursement arrangements, performance results would have been lower.
The performance information shown represents past performance and is not a guarantee of future results. The investment return and principal value of your investment will fluctuate so that your shares, when redeemed, may be worth more or less than their original cost. Current performance may be lower or higher than the performance information shown. You may obtain performance information current to the most recent month-end by contacting your financial intermediary, visiting columbiathreadneedle.com/us or calling 800.345.6611.
*The returns shown for periods prior to the share class inception date (including returns for the Life of the Fund, if shown, which are since Fund inception) include the returns of the Fund's oldest share class. Since the Fund launched more than one share class at its inception, Class A shares were used. These returns are adjusted to reflect any higher class-related operating expenses of the newer share classes, as applicable. Please visit columbiathreadneedle.com/us/investment-products/mutual-funds/appended-performance for more information.
The Blended Benchmark, a weighted custom composite established by the Investment Manager, consists of a 60% weighting of the MSCI ACWI All Cap Index (Net) and a 40% weighting of the Barclays Global Aggregate Index. The MSCI ACWI All Cap Index captures large, mid, small and micro cap representation across 23 developed markets countries and large, mid and small cap representation across 23 emerging markets countries. The Barclays Global Aggregate Index is a broad-based benchmark that measures the global investment-grade fixed-rate debt markets.
The Citi Three-Month U.S. Treasury Bill Index is an unmanaged index that represents the performance of three-month Treasury bills and reflects reinvestment of all distributions and changes in market prices.
Indices are not available for investment, are not professionally managed and do not reflect sales charges, fees, brokerage commissions, taxes (except the MSCI ACWI All Cap Index (Net), which reflects reinvested dividends net of withholding taxes) or other expenses of investing. Securities in the Fund may not match those in an index.
Annual Report 2016
2
COLUMBIA ADAPTIVE RISK ALLOCATION FUND
PERFORMANCE OVERVIEW (continued)
Performance of a Hypothetical $10,000 Investment (June 19, 2012 – May 31, 2016)
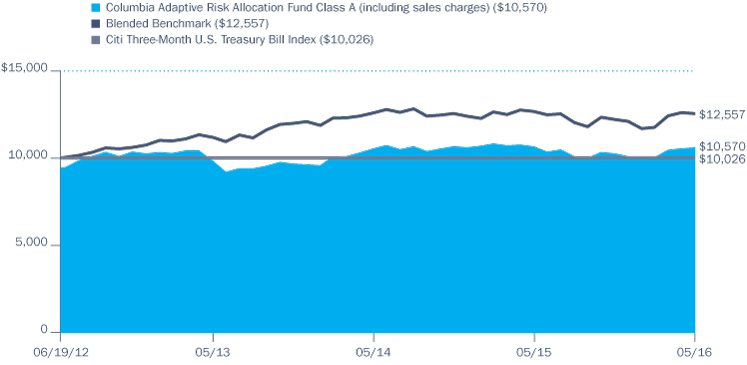
The chart above shows the change in value of a hypothetical $10,000 investment in Class A shares of Columbia Adaptive Risk Allocation Fund during the stated time period, and does not reflect the deduction of taxes that a shareholder may pay on Fund distributions or on the redemption of Fund shares.
Annual Report 2016
3
COLUMBIA ADAPTIVE RISK ALLOCATION FUND
MANAGER DISCUSSION OF FUND PERFORMANCE
Portfolio Management
Jeffrey Knight, CFA
Orhan Imer, Ph.D., CFA
Joshua Kutin, CFA
Toby Nangle
Beth Vanney, CFA
Portfolio Breakdown (%)
(at May 31, 2016) | |
Alternative Investment Funds | | | 7.7 | | |
Equity Funds | | | 7.8 | | |
Exchange-Traded Funds | | | 1.3 | | |
Foreign Government
Obligations | | | 8.9 | | |
Inflation-Indexed Bonds | | | 21.7 | | |
Money Market Funds(a) | | | 44.6 | | |
Residential Mortgage-Backed
Securities — Agency | | | 6.3 | | |
U.S. Treasury Obligations | | | 1.7 | | |
Total | | | 100.0 | | |
(a) Includes investments in Money Market Funds (amounting to $250.8 million) which have been segregated to cover obligations related to the Fund's investment in derivatives which provides exposure to multiple markets. For a description of the Fund's investments in derivatives, see Investments in Derivatives following the Portfolio of Investments, and Note 2 to the financial statements.
Percentages indicated are based upon total investments. The Fund's portfolio composition is subject to change.
For the 12-month period that ended May 31, 2016, the Fund's Class A shares returned -0.55% excluding sales charges. During the same time period, the Fund outperformed its Blended Benchmark, which returned -0.95%, but underperformed the Citi Three-Month U.S. Treasury Bill Index, which returned 0.12%. The Fund takes a risk-based approach to allocating assets across four primary segments of global capital markets. While absolute returns were disappointing, our tactical positioning was the principal driver of the Fund's outperformance of its Blended Benchmark during the period.
Market State Policy Implementation Contributed Most Positively
The Fund uses a global allocation strategy and takes a flexible approach to allocating portfolio risk across multiple asset classes — equity securities, inflation hedging assets, and fixed-income securities (generally consisting of fixed-income securities issued by governments, which are referred to as interest rate assets, and other fixed-income securities, which are referred to as spread assets). We employ a market state classification process — based on multiple market-based indicators — to identify four distinct market environments and create a policy or benchmark portfolio with a strategic risk allocation for each environment that is intended to generate attractive risk-adjusted returns in that environment. Allocations of risk to asset classes may differ significantly across market environments. While a global risk-balanced portfolio is what we expect the Fund to be in most often, other market states represent conditions when risk balancing may be less than ideal, and the portfolio can deviate from balance to improve risk-adjusted return potential for that environment. This could be to protect capital in a weakening market or to more fully participate when market conditions are considered favorable. Once a policy portfolio is established, we then employ a tactical overlay process driven by the Columbia Global Asset Allocation Team's Investment Strategy Outlook.
While absolute returns were disappointing, our tactical positioning was the principal driver of the Fund's relative outperformance during the period. Of the four broad global asset classes to which the Fund allocates, its exposure to interest rates, primarily via global government bonds, contributed most positively, as interest rates around much of the globe declined overall, thereby positively impacting the fixed-income holdings in the Fund. To a lesser degree, the Fund's allocation to spread assets — primarily investment-grade corporate bonds, high yield bonds, mortgage-backed securities and emerging market debt, also boosted relative results. Exposure to inflation hedging assets added value, albeit modestly so, as well. Positions in commodities detracted from the Fund's relative performance, as commodity prices were hit hard during the period. However, the effect of the Fund's commodity exposure was virtually offset by exposure to real estate investment trusts (REITs), which performed well. Exposure to global inflation-linked bonds contributed positively. The only global asset class to detract from the Fund's relative performance was equities, especially international equities, which significantly lagged U.S. equities during the period.
Annual Report 2016
4
COLUMBIA ADAPTIVE RISK ALLOCATION FUND
MANAGER DISCUSSION OF FUND PERFORMANCE (continued)
Global Positioning Reflected Changing Market Conditions
We use an adaptive approach to re-allocate portfolio risk exposures as market conditions change in an effort to improve risk-adjusted returns. We believes no single portfolio is appropriate for all market environments and have identified four distinct market states — highly bullish, bullish, neutral and capital preservation. We expect the Fund to be in the neutral market state the majority of the time. The Fund was indeed in the neutral market state in each month of the period except June 2015 and May 2016, when market-based indicators became more positive. From a risk allocation perspective, then, the Fund in the neutral state was approximately 50% of the portfolio's risk allocation in equities through much of the period, with the remaining 50% of the portfolio's risk allocation divided among the other three asset classes. In the months when the Fund was in a bullish state, the Fund slightly increased risk exposure to equities and decreased exposure to interest rates. With these changes, the Fund's portfolio turnover rate for the 12-month period was 254%.
Usage of Derivatives
During the period, the Fund used futures (including bond, currency, equity, index and interest rate futures), currency forwards, options and swaps (including credit default, credit default swap index, interest rate and total return swaps), for both hedging and non-hedging purposes, including, for example, seeking to enhance returns or as a substitute for a position in an underlying asset. The Fund also used derivatives to manage its overall risk exposure and to obtain leverage (market exposure in excess of the Fund's assets) within certain asset classes and during certain market environments in seeking to maintain attractive expected risk-adjusted returns while adhering to the Fund's risk allocation framework. On a stand-alone basis, the usage of swap contracts was positive. This was offset, however, by the Fund's futures, forward foreign currency exchange and options contracts, which detracted.
At Period's End
At the end of the period, we favored a neutral stance toward equities. Fixed income remained positioned in a neutral stance as well, as recession risks in the U.S. abated in the last months of the period, while negative or very low yields prevailed across a large swath of the globe. The overall duration framework remained negative, with duration performing poorly in the context of the aforementioned reflation dynamic.
Maintaining a long-term perspective, we believe the Fund's adaptive risk allocation approach offers the potential to improve risk-adjusted returns as compared to a traditional 60/40 balanced portfolio, making it an attractive diversifier within portfolios maintaining a traditional allocation to both stocks and bonds.
Market Exposure By Asset Class
Categories (%)(a)
(at May 31, 2016) | |
Equity Assets | | | 42.8 | | |
Inflation-Hedging Assets | | | 32.9 | | |
Spread Assets | | | -20.2 | | |
Interest Rate Assets | | | 32.5 | | |
(a) Percentages are based upon net assets. The percentages do not equal 100% due to the effects of leverage within the Fund's portfolio. Leverage exists when the Fund purchases or sells an instrument or enters into a transaction without investing cash in an amount equal to the full economic exposure of the instrument or transaction. The Fund's portfolio composition and its market exposure are subject to change. Inflation-Hedging Assets may include, but are not limited to, direct or indirect investments in commodity-related investments, including certain types of commodities-linked derivatives and notes, and U.S. and non-U.S. inflation-linked bonds. Interest Rate Assets generally include fixed-income securities issued by U.S. and non-U.S. governments. Spread Assets generally include any other fixed-income securities.
Annual Report 2016
5
COLUMBIA ADAPTIVE RISK ALLOCATION FUND
MANAGER DISCUSSION OF FUND PERFORMANCE
Investment Risks
Market risk may affect a single issuer, sector of the economy, industry or the market as a whole. The Fund's investment in other funds subjects it to the investment performance (positive or negative), risks and expenses of these underlying funds. Asset allocation does not assure a profit or protect against loss. Investing in derivatives is a specialized activity that involves special risks that subject the Fund to significant loss potential, including when used as leverage, and may result in greater fluctuation in fund value. Commodity investments may be affected by the overall market and industry- and commodity-specific factors, and may be more volatile and less liquid than other investments. Short positions (where the underlying asset is not owned) can create unlimited risk. International investing involves certain risks and volatility due to potential political, economic or currency instabilities and different financial and accounting standards. Risks are enhanced for emerging market issuers. Investment in or exposure to foreign currencies subjects the Fund to currency fluctuation and risk of loss. Investments in small- and mid-cap companies involve risks and volatility greater than investments in larger, more established companies. Fixed-income securities present issuer default risk. A rise in interest rates may result in a price decline of fixed-income instruments held by the Fund, negatively impacting its performance and NAV. Falling rates may result in the Fund investing in lower yielding debt instruments, lowering the Fund's income and yield. These risks may be heightened for longer maturity and duration securities Interest payments on inflation-protected securities may be more volatile than interest paid on ordinary bonds. In periods of deflation, these securities provide no income. As a non-diversified fund, fewer investments could have a greater affect on performance. Investments selected using quantitative methods may perform differently from the market as a whole and may not enable the Fund to achieve its objective. Market or other (e.g., interest rate) environments may adversely affect the liquidity of fund investments, negatively impacting their price. Generally, the less liquid the market at the time the Fund sells a holding, the greater the risk of loss or decline of value to the Fund. See the Fund's prospectus for information on these and other risks.
Annual Report 2016
6
COLUMBIA ADAPTIVE RISK ALLOCATION FUND
UNDERSTANDING YOUR FUND'S EXPENSES
(Unaudited)
As an investor, you incur two types of costs. There are transaction costs, which generally include sales charges on purchases and may include redemption fees. There are also ongoing costs, which generally include management fees, distribution and/or service fees, and other fund expenses. The following information is intended to help you understand your ongoing costs (in dollars) of investing in the Fund and to help you compare these costs with the ongoing costs of investing in other mutual funds.
Analyzing Your Fund's Expenses
To illustrate these ongoing costs, we have provided examples and calculated the expenses paid by investors in each share class of the Fund during the period. The actual and hypothetical information in the table is based on an initial investment of $1,000 at the beginning of the period indicated and held for the entire period. Expense information is calculated two ways and each method provides you with different information. The amount listed in the "Actual" column is calculated using the Fund's actual operating expenses and total return for the period. You may use the Actual information, together with the amount invested, to estimate the expenses that you paid over the period. Simply divide your account value by $1,000 (for example, an $8,600 account value divided by $1,000 = 8.6), then multiply the results by the expenses paid during the period under the "Actual" column. The amount listed in the "Hypothetical" column assumes a 5% annual rate of return before expenses (which is not the Fund's actual return) and then applies the Fund's actual expense ratio for the period to the hypothetical return. You should not use the hypothetical account values and expenses to estimate either your actual account balance at the end of the period or the expenses you paid during the period. See "Compare With Other Funds" below for details on how to use the hypothetical data.
Compare With Other Funds
Since all mutual funds are required to include the same hypothetical calculations about expenses in shareholder reports, you can use this information to compare the ongoing cost of investing in the Fund with other funds. To do so, compare the hypothetical example with the 5% hypothetical examples that appear in the shareholder reports of other funds. As you compare hypothetical examples of other funds, it is important to note that hypothetical examples are meant to highlight the ongoing costs of investing in a fund only and do not reflect any transaction costs, such as sales charges, or redemption or exchange fees. Therefore, the hypothetical calculations are useful in comparing ongoing costs only, and will not help you determine the relative total costs of owning different funds. If transaction costs were included in these calculations, your costs would be higher.
December 1, 2015 – May 31, 2016
| | | Account Value at the Beginning
of the Period ($) | | Account Value at the End of the
Period ($) | | Expenses Paid During the
Period ($) | | Fund's Annualized
Expense Ratio (%) | |
| | | Actual | | Hypothetical | | Actual | | Hypothetical | | Actual | | Hypothetical | | Actual | |
Class A | | | 1,000.00 | | | | 1,000.00 | | | | 1,033.10 | | | | 1,019.55 | | | | 5.54 | | | | 5.50 | | | | 1.09 | | |
Class C | | | 1,000.00 | | | | 1,000.00 | | | | 1,029.70 | | | | 1,015.80 | | | | 9.34 | | | | 9.27 | | | | 1.84 | | |
Class K | | | 1,000.00 | | | | 1,000.00 | | | | 1,033.00 | | | | 1,019.90 | | | | 5.18 | | | | 5.15 | | | | 1.02 | | |
Class R | | | 1,000.00 | | | | 1,000.00 | | | | 1,031.20 | | | | 1,018.25 | | | | 6.86 | | | | 6.81 | | | | 1.35 | | |
Class R4 | | | 1,000.00 | | | | 1,000.00 | | | | 1,033.90 | | | | 1,020.80 | | | | 4.27 | | | | 4.24 | | | | 0.84 | | |
Class R5 | | | 1,000.00 | | | | 1,000.00 | | | | 1,034.90 | | | | 1,021.15 | | | | 3.92 | | | | 3.89 | | | | 0.77 | | |
Class W | | | 1,000.00 | | | | 1,000.00 | | | | 1,032.00 | | | | 1,019.55 | | | | 5.54 | | | | 5.50 | | | | 1.09 | | |
Class Y | | | 1,000.00 | | | | 1,000.00 | | | | 1,034.90 | | | | 1,021.40 | | | | 3.66 | | | | 3.64 | | | | 0.72 | | |
Class Z | | | 1,000.00 | | | | 1,000.00 | | | | 1,035.00 | | | | 1,020.80 | | | | 4.27 | | | | 4.24 | | | | 0.84 | | |
Expenses paid during the period are equal to the annualized expense ratio for each class as indicated above, multiplied by the average account value over the period and then multiplied by the number of days in the Fund's most recent fiscal half year and divided by 366.
Expenses do not include fees and expenses incurred indirectly by the Fund from its investment in underlying funds, including affiliated and non-affiliated pooled investment vehicles, such as mutual funds and exchange-traded funds.
Had Columbia Management Investment Advisers, LLC and/or certain of its affiliates not waived/reimbursed certain fees and expenses, account value at the end of the period would have been reduced.
Annual Report 2016
7
COLUMBIA ADAPTIVE RISK ALLOCATION FUND
PORTFOLIO OF INVESTMENTS
May 31, 2016
(Percentages represent value of investments compared to net assets)
Equity Funds 7.0%
| | | Shares | | Value ($) | |
GLOBAL REAL ESTATE 7.0% | |
Columbia Real Estate Equity Fund,
Class I Shares(a) | | | 2,750,135 | | | | 43,837,145 | | |
Total Equity Funds
(Cost: $42,860,061) | | | | | 43,837,145 | | |
Alternative Investment Funds 7.0%
Columbia Commodity Strategy Fund,
Class I Shares(a)(b) | | | 7,954,786 | | | | 43,671,777 | | |
Total Alternative Investment Funds
(Cost: $41,963,526) | | | | | 43,671,777 | | |
Exchange-Traded Funds 1.1%
iShares MSCI Canada ETF | | | 289,750 | | | | 7,098,875 | | |
Total Exchange-Traded Funds
(Cost: $7,166,797) | | | | | 7,098,875 | | |
Residential Mortgage-Backed Securities —
Agency 5.6%
Issuer | | Coupon
Rate | | Principal
Amount ($) | | Value ($) | |
Federal National Mortgage Association(c) | |
06/16/31 | | | 2.500 | % | | | 4,600,000 | | | | 4,717,156 | | |
06/13/46 | | | 3.500 | % | | | 10,000,000 | | | | 10,466,334 | | |
06/13/46 | | | 4.000 | % | | | 4,750,000 | | | | 5,071,922 | | |
06/13/46 | | | 5.000 | % | | | 6,000,000 | | | | 6,655,430 | | |
Government National Mortgage Association(c)
06/21/2046 | | | 3.500 | % | | | 8,000,000 | | | | 8,444,162 | | |
Total Residential Mortgage-Backed
Securities — Agency
(Cost: $35,341,240) | | | | | | | 35,355,004 | | |
Inflation-Indexed Bonds(d) 19.6%
FRANCE 1.9% | |
France Government Bond OAT(e)
07/25/24 | | | 0.250 | % | | EUR | 8,874,075 | | | | 10,706,296 | | |
07/25/40 | | | 1.800 | % | | EUR | 800,380 | | | | 1,299,975 | | |
Total | | | | | | | 12,006,271 | | |
Inflation-Indexed Bonds(d) (continued)
Issuer | | Coupon
Rate | | Principal
Amount ($) | | Value ($) | |
GERMANY 0.7% | |
Bundesrepublik Deutschland Bundesobligation
Inflation-Linked Bond(e)
04/15/18 | | | 0.750 | % | | EUR | 2,785,204 | | | | 3,174,383 | | |
Deutsche Bundesrepublik Inflation-Linked Bond(e)
04/15/23 | | | 0.100 | % | | EUR | 780,481 | | | | 929,131 | | |
Total | | | | | | | 4,103,514 | | |
ITALY 1.1% | |
Italy Buoni Poliennali Del Tesoro(e)
09/15/19 | | | 2.350 | % | | EUR | 718,374 | | | | 870,996 | | |
09/15/21 | | | 2.100 | % | | EUR | 703,073 | | | | 871,218 | | |
09/15/24 | | | 2.350 | % | | EUR | 652,158 | | | | 835,251 | | |
09/15/26 | | | 3.100 | % | | EUR | 370,573 | | | | 511,357 | | |
09/15/41 | | | 2.550 | % | | EUR | 2,766,036 | | | | 3,919,984 | | |
Total | | | | | | | 7,008,806 | | |
NEW ZEALAND 0.6% | |
New Zealand Government Bond(e)
09/20/25 | | | 2.000 | % | | NZD | 5,172,370 | | | | 3,616,211 | | |
SWEDEN 0.1% | |
Sweden Inflation-Linked Bond
06/01/25 | | | 1.000 | % | | SEK | 5,023,043 | | | | 723,654 | | |
UNITED KINGDOM 4.5% | |
United Kingdom Gilt Inflation-Linked Bond(e) | |
03/22/29 | | | 0.125 | % | | GBP | 4,398,360 | | | | 7,232,273 | | |
03/22/34 | | | 0.750 | % | | GBP | 2,079,715 | | | | 3,951,916 | | |
03/22/44 | | | 0.125 | % | | GBP | 6,999,850 | | | | 13,253,810 | | |
03/22/52 | | | 0.250 | % | | GBP | 1,617,840 | | | | 3,494,154 | | |
Total | | | | | | | 27,932,153 | | |
UNITED STATES 10.7% | |
U.S. Treasury Inflation-Indexed Bond
04/15/19 | | | 0.125 | % | | | 10,162,700 | | | | 10,315,537 | | |
01/15/21 | | | 1.125 | % | | | 5,442,950 | | | | 5,761,022 | | |
01/15/22 | | | 0.125 | % | | | 11,836,350 | | | | 11,899,544 | | |
01/15/24 | | | 0.625 | % | | | 14,186,062 | | | | 14,632,881 | | |
01/15/25 | | | 0.250 | % | | | 8,294,550 | | | | 8,279,106 | | |
02/15/42 | | | 0.750 | % | | | 8,430,960 | | | | 8,074,179 | | |
02/15/43 | | | 0.625 | % | | | 3,625,160 | | | | 3,366,867 | | |
02/15/45 | | | 0.750 | % | | | 4,803,485 | | | | 4,585,325 | | |
Total | | | | | | | 66,914,461 | | |
Total Inflation-Indexed Bonds
(Cost: $123,598,019) | | | | | | | 122,305,070 | | |
The accompanying Notes to Financial Statements are an integral part of this statement.
Annual Report 2016
8
COLUMBIA ADAPTIVE RISK ALLOCATION FUND
PORTFOLIO OF INVESTMENTS (continued)
May 31, 2016
U.S. Treasury Obligations 1.5%
Issuer | | Coupon
Rate | | Principal
Amount ($) | | Value ($) | |
U.S. Treasury
10/31/18 | | | 1.750 | % | | | 3,350,000 | | | | 3,414,906 | | |
01/31/20 | | | 1.375 | % | | | 1,600,000 | | | | 1,611,688 | | |
02/15/21 | | | 3.625 | % | | | 1,600,000 | | | | 1,765,062 | | |
08/15/23 | | | 2.500 | % | | | 325,000 | | | | 343,662 | | |
08/15/26 | | | 6.750 | % | | | 825,000 | | | | 1,202,857 | | |
08/15/27 | | | 6.375 | % | | | 725,000 | | | | 1,051,930 | | |
Total U.S. Treasury Obligations
(Cost: $9,319,934) | | | | | | | 9,390,105 | | |
Foreign Government Obligations(d) 8.1%
BELGIUM 0.8% | |
Belgium Government Bond(e)
06/22/24 | | | 2.600 | % | | EUR | 3,750,000 | | | | 4,971,461 | | |
FRANCE 0.4% | |
France Government Bond OAT(e)
05/25/45 | | | 3.250 | % | | EUR | 1,500,000 | | | | 2,373,417 | | |
ITALY 0.3% | |
Italy Buoni Poliennali Del Tesoro(e)
09/01/46 | | | 3.250 | % | | EUR | 1,250,000 | | | | 1,603,079 | | |
JAPAN 2.7% | |
Japan Government 30-Year Bond
09/20/44 | | | 1.700 | % | | JPY | 1,375,000,000 | | | | 17,094,403 | | |
Foreign Government Obligations(d) (continued)
Issuer | | Coupon
Rate | | Principal
Amount ($) | | Value ($) | |
MEXICO 0.7% | |
Mexican Bonos
06/10/21 | | | 6.500 | % | | MXN | 82,500,000 | | | | 4,643,918 | | |
NEW ZEALAND 1.3% | |
New Zealand Government Bond(e)
04/15/27 | | | 4.500 | % | | NZD | 10,000,000 | | | | 7,962,155 | | |
POLAND 0.5% | |
Poland Government Bond
07/25/26 | | | 2.500 | % | | | 13,500,000 | | | | 3,245,686 | | |
SPAIN 1.4% | |
Spain Government Bond(e)
01/31/22 | | | 5.850 | % | | EUR | 5,875,000 | | | | 8,472,595 | | |
Total Foreign Government Obligations
(Cost: $47,992,448) | | | | | | | 50,366,714 | | |
Money Market Funds 40.2% | |
| | | | | Shares | | Value ($) | |
Columbia Short-Term Cash Fund,
0.434%(a)(f) | | | | | 250,808,285 | | | | 250,808,285 | | |
Total Money Market Funds
(Cost: $250,808,285) | | | | | | | 250,808,285 | | |
Total Investments
(Cost: $559,050,310) | | | | | | | 562,832,975 | | |
Other Assets & Liabilities, Net | | | | | | | 61,668,022 | | |
Net Assets | | | | | | | 624,500,997 | | |
At May 31, 2016, cash totaling $17,019,970 was pledged as collateral.
Investments in Derivatives
Forward Foreign Currency Exchange Contracts Open at May 31, 2016
Counterparty | | Exchange Date | | Currency to
be Delivered | |
| | Currency to
be Received | |
| | Unrealized
Appreciation ($) | | Unrealized
Depreciation ($) | |
Barclays | | 06/02/2016 | | | 13,522,000 | | | EUR | | | | | 15,563,491 | | | USD | | | | | 518,235 | | | | — | | |
Barclays | | 06/02/2016 | | | 10,470,000 | | | EUR | | | | | 11,978,882 | | | USD | | | | | 329,433 | | | | — | | |
Barclays | | 06/02/2016 | | | 14,500,000 | | | EUR | | | | | 16,366,977 | | | USD | | | | | 233,547 | | | | — | | |
Barclays | | 06/02/2016 | | | 5,030,000 | | | EUR | | | | | 5,610,563 | | | USD | | | | | 13,932 | | | | — | | |
Barclays | | 06/02/2016 | | | 2,100,000 | | | NOK | | | | | 256,426 | | | USD | | | | | 5,398 | | | | — | | |
Barclays | | 06/02/2016 | | | 15,082,709 | | | USD | | | | | 13,522,000 | | | EUR | | | | | — | | | | (37,451 | ) | |
Barclays | | 06/02/2016 | | | 16,173,590 | | | USD | | | | | 14,500,000 | | | EUR | | | | | — | | | | (40,161 | ) | |
The accompanying Notes to Financial Statements are an integral part of this statement.
Annual Report 2016
9
COLUMBIA ADAPTIVE RISK ALLOCATION FUND
PORTFOLIO OF INVESTMENTS (continued)
May 31, 2016
Forward Foreign Currency Exchange Contracts Open at May 31, 2016 (continued)
Counterparty | | Exchange Date | | Currency to
be Delivered | |
| | Currency to
be Received | |
| | Unrealized
Appreciation ($) | | Unrealized
Depreciation ($) | |
Barclays | | 06/02/2016 | | | 17,747,655 | | | USD | | | | | 15,500,000 | | | EUR | | | | | — | | | | (501,576 | ) | |
Barclays | | 06/02/2016 | | | 252,486 | | | USD | | | | | 2,100,000 | | | NOK | | | | | — | | | | (1,458 | ) | |
Barclays | | 07/08/2016 | | | 21,022,000 | | | EUR | | | | | 23,461,935 | | | USD | | | | | 40,349 | | | | — | | |
Barclays | | 07/08/2016 | | | 20,380,000 | | | EUR | | | | | 22,745,453 | | | USD | | | | | 39,148 | | | | — | | |
Barclays | | 07/08/2016 | | | 21,010,000 | | | EUR | | | | | 23,421,119 | | | USD | | | | | 12,902 | | | | — | | |
Barclays | | 07/08/2016 | | | 2,100,000 | | | NOK | | | | | 252,461 | | | USD | | | | | 1,459 | | | | — | | |
Barclays | | 07/08/2016 | | | 950,000 | | | NOK | | | | | 113,400 | | | USD | | | | | — | | | | (148 | ) | |
Barclays | | 07/08/2016 | | | 5,617,705 | | | USD | | | | | 5,030,000 | | | EUR | | | | | — | | | | (13,549 | ) | |
Citi | | 06/02/2016 | | | 650,000 | | | AUD | | | | | 467,641 | | | USD | | | | | — | | | | (2,146 | ) | |
Citi | | 06/02/2016 | | | 1,500,000 | | | AUD | | | | | 1,079,172 | | | USD | | | | | — | | | | (4,953 | ) | |
Citi | | 06/02/2016 | | | 2,750,000 | | | CAD | | | | | 2,105,166 | | | USD | | | | | 8,091 | | | | — | | |
Citi | | 06/02/2016 | | | 750,000 | | | CAD | | | | | 574,136 | | | USD | | | | | 2,207 | | | | — | | |
Citi | | 06/02/2016 | | | 1,008,664,000 | | | JPY | | | | | 9,200,760 | | | USD | | | | | 91,951 | | | | — | | |
Citi | | 06/02/2016 | | | 260,000,000 | | | JPY | | | | | 2,370,165 | | | USD | | | | | 22,217 | | | | — | | |
Citi | | 06/02/2016 | | | 301,336,000 | | | JPY | | | | | 2,712,505 | | | USD | | | | | — | | | | (8,730 | ) | |
Citi | | 06/02/2016 | | | 6,000,000 | | | SEK | | | | | 730,424 | | | USD | | | | | 11,116 | | | | — | | |
Citi | | 06/02/2016 | | | 495,270 | | | USD | | | | | 650,000 | | | AUD | | | | | — | | | | (25,483 | ) | |
Citi | | 06/02/2016 | | | 1,122,162 | | | USD | | | | | 1,500,000 | | | AUD | | | | | — | | | | (38,037 | ) | |
Citi | | 06/02/2016 | | | 597,853 | | | USD | | | | | 750,000 | | | CAD | | | | | — | | | | (25,923 | ) | |
Citi | | 06/02/2016 | | | 2,162,625 | | | USD | | | | | 2,750,000 | | | CAD | | | | | — | | | | (65,549 | ) | |
Citi | | 06/02/2016 | | | 2,446,230 | | | USD | | | | | 260,000,000 | | | JPY | | | | | — | | | | (98,282 | ) | |
Citi | | 06/02/2016 | | | 12,044,736 | | | USD | | | | | 1,310,000,000 | | | JPY | | | | | — | | | | (214,691 | ) | |
Citi | | 06/02/2016 | | | 748,457 | | | USD | | | | | 6,000,000 | | | SEK | | | | | — | | | | (29,149 | ) | |
Citi | | 07/08/2016 | | | 650,000 | | | AUD | | | | | 468,930 | | | USD | | | | | — | | | | (197 | ) | |
Citi | | 07/08/2016 | | | 1,500,000 | | | AUD | | | | | 1,082,147 | | | USD | | | | | — | | | | (454 | ) | |
Citi | | 07/08/2016 | | | 7,330,000 | | | AUD | | | | | 5,273,738 | | | USD | | | | | — | | | | (16,572 | ) | |
Citi | | 07/08/2016 | | | 6,200,000 | | | CAD | | | | | 4,746,510 | | | USD | | | | | 18,622 | | | | — | | |
Citi | | 07/08/2016 | | | 750,000 | | | CAD | | | | | 571,674 | | | USD | | | | | — | | | | (248 | ) | |
Citi | | 07/08/2016 | | | 3,130,000 | | | CAD | | | | | 2,386,517 | | | USD | | | | | — | | | | (304 | ) | |
Citi | | 07/08/2016 | | | 2,750,000 | | | CAD | | | | | 2,096,139 | | | USD | | | | | — | | | | (908 | ) | |
Citi | | 07/08/2016 | | | 1,230,000,000 | | | JPY | | | | | 11,227,647 | | | USD | | | | | 105,115 | | | | — | | |
Citi | | 07/08/2016 | | | 2,881,836,000 | | | JPY | | | | | 26,071,393 | | | USD | | | | | 11,789 | | | | — | | |
Citi | | 07/08/2016 | | | 260,000,000 | | | JPY | | | | | 2,352,750 | | | USD | | | | | 1,645 | | | | — | | |
Citi | | 07/08/2016 | | | 585,000,000 | | | JPY | | | | | 5,289,235 | | | USD | | | | | — | | | | (749 | ) | |
Citi | | 07/08/2016 | | | 12,800,000 | | | SEK | | | | | 1,541,203 | | | USD | | | | | 4,272 | | | | — | | |
Citi | | 07/08/2016 | | | 3,000,000 | | | SEK | | | | | 360,083 | | | USD | | | | | — | | | | (135 | ) | |
Citi | | 07/08/2016 | | | 5,500,000 | | | SEK | | | | | 660,152 | | | USD | | | | | — | | | | (248 | ) | |
Citi | | 07/08/2016 | | | 1,350,000 | | | SGD | | | | | 980,617 | | | USD | | | | | 911 | | | | — | | |
Citi | | 07/08/2016 | | | 1,077,723 | | | USD | | | | | 1,500,000 | | | AUD | | | | | 4,878 | | | | — | | |
Citi | | 07/08/2016 | | | 467,013 | | | USD | | | | | 650,000 | | | AUD | | | | | 2,114 | | | | — | | |
Citi | | 07/08/2016 | | | 574,175 | | | USD | | | | | 750,000 | | | CAD | | | | | — | | | | (2,253 | ) | |
The accompanying Notes to Financial Statements are an integral part of this statement.
Annual Report 2016
10
COLUMBIA ADAPTIVE RISK ALLOCATION FUND
PORTFOLIO OF INVESTMENTS (continued)
May 31, 2016
Forward Foreign Currency Exchange Contracts Open at May 31, 2016 (continued)
Counterparty | | Exchange Date | | Currency to
be Delivered | |
| | Currency to
be Received | |
| | Unrealized
Appreciation ($) | | Unrealized
Depreciation ($) | |
Citi | | 07/08/2016 | | | 2,105,307 | | | USD | | | | | 2,750,000 | | | CAD | | | | | — | | | | (8,260 | ) | |
Citi | | 07/08/2016 | | | 2,373,324 | | | USD | | | | | 260,000,000 | | | JPY | | | | | — | | | | (22,220 | ) | |
Citi | | 07/08/2016 | | | 8,979,051 | | | USD | | | | | 983,664,000 | | | JPY | | | | | — | | | | (84,064 | ) | |
Citi | | 07/08/2016 | | | 361,219 | | | USD | | | | | 3,000,000 | | | SEK | | | | | — | | | | (1,001 | ) | |
Credit Suisse | | 07/08/2016 | | | 4,120,000 | | | CHF | | | | | 4,161,637 | | | USD | | | | | 9,398 | | | | — | | |
Credit Suisse | | 07/08/2016 | | | 2,480,000 | | | CHF | | | | | 2,498,489 | | | USD | | | | | — | | | | (917 | ) | |
Credit Suisse | | 07/08/2016 | | | 4,610,000 | | | DKK | | | | | 692,138 | | | USD | | | | | 1,572 | | | | — | | |
Credit Suisse | | 07/08/2016 | | | 5,130,000 | | | DKK | | | | | 768,355 | | | USD | | | | | — | | | | (106 | ) | |
Credit Suisse | | 07/08/2016 | | | 11,604,000 | | | NZD | | | | | 7,812,567 | | | USD | | | | | — | | | | (23,567 | ) | |
Credit Suisse | | 07/08/2016 | | | 4,735,000 | | | NZD | | | | | 3,173,184 | | | USD | | | | | — | | | | (24,342 | ) | |
HSBC | | 07/08/2016 | | | 12,762,000 | | | PLN | | | | | 3,239,241 | | | USD | | | | | 6,123 | | | | — | | |
Standard Chartered | | 06/02/2016 | | | 1,850,000 | | | GBP | | | | | 2,703,372 | | | USD | | | | | 23,925 | | | | — | | |
Standard Chartered | | 06/02/2016 | | | 17,000,000 | | | MXN | | | | | 932,907 | | | USD | | | | | 11,835 | | | | — | | |
Standard Chartered | | 06/02/2016 | | | 576,313 | | | USD | | | | | 400,000 | | | GBP | | | | | 3,027 | | | | — | | |
Standard Chartered | | 06/02/2016 | | | 2,119,875 | | | USD | | | | | 1,450,000 | | | GBP | | | | | — | | | | (19,768 | ) | |
Standard Chartered | | 06/02/2016 | | | 965,525 | | | USD | | | | | 17,000,000 | | | MXN | | | | | — | | | | (44,453 | ) | |
Standard Chartered | | 07/08/2016 | | | 19,343,700 | | | GBP | | | | | 28,120,497 | | | USD | | | | | 96,425 | | | | — | | |
Standard Chartered | | 07/08/2016 | | | 9,825,000 | | | GBP | | | | | 14,329,496 | | | USD | | | | | 95,585 | | | | — | | |
Standard Chartered | | 07/08/2016 | | | 1,700,000 | | | GBP | | | | | 2,464,405 | | | USD | | | | | 1,540 | | | | — | | |
Standard Chartered | | 07/08/2016 | | | 18,000,000 | | | HKD | | | | | 2,318,854 | | | USD | | | | | 1,249 | | | | — | | |
Standard Chartered | | 07/08/2016 | | | 53,451,000 | | | MXN | | | | | 2,888,697 | | | USD | | | | | 4,740 | | | | — | | |
Standard Chartered | | 07/08/2016 | | | 21,070,000 | | | MXN | | | | | 1,134,461 | | | USD | | | | | — | | | | (2,374 | ) | |
Standard Chartered | | 07/08/2016 | | | 2,486,539 | | | USD | | | | | 1,700,000 | | | GBP | | | | | — | | | | (23,674 | ) | |
UBS | | 06/02/2016 | | | 4,000,000 | | | NZD | | | | | 2,745,350 | | | USD | | | | | 38,950 | | | | — | | |
UBS | | 06/02/2016 | | | 2,764,320 | | | USD | | | | | 4,000,000 | | | NZD | | | | | — | | | | (57,920 | ) | |
Total | | | | | | | | | | | | | | | | | | | | | | | 1,773,700 | | | | (1,442,020 | ) | |
Futures Contracts Outstanding at May 31, 2016
Long Futures Contracts Outstanding
Contract Description | | Number of
Contracts | | Trading
Currency | | Notional
Market
Value ($) | | Expiration
Date | | Unrealized
Appreciation ($) | | Unrealized
(Depreciation) ($) | |
Australian 3-Year Bond | | | 26 | | | AUD | | | | | 2,118,041 | | | 06/2016 | | | 14,113 | | | | — | | |
Canadian Government 10-Year Bond | | | 58 | | | CAD | | | | | 6,410,142 | | | 09/2016 | | | 21,714 | | | | — | | |
Euro-BTP | | | 58 | | | EUR | | | | | 9,007,616 | | | 06/2016 | | | 50,141 | | | | — | | |
Euro-Bund | | | 8 | | | EUR | | | | | 1,459,530 | | | 06/2016 | | | 5,019 | | | | — | | |
Euro-Buxl 30-Year | | | 33 | | | EUR | | | | | 6,180,283 | | | 06/2016 | | | 12,355 | | | | — | | |
Euro-OAT | | | 60 | | | EUR | | | | | 10,585,977 | | | 06/2016 | | | 61,351 | | | | — | | |
Japanese 10-Year Government Bond | | | 3 | | | JPY | | | | | 4,118,752 | | | 06/2016 | | | 8,693 | | | | — | | |
Long Gilt | | | 108 | | | GBP | | | | | 19,200,772 | | | 09/2016 | | | 44,178 | | | | — | | |
The accompanying Notes to Financial Statements are an integral part of this statement.
Annual Report 2016
11
COLUMBIA ADAPTIVE RISK ALLOCATION FUND
PORTFOLIO OF INVESTMENTS (continued)
May 31, 2016
Long Futures Contracts Outstanding (continued)
Contract Description | | Number of
Contracts | | Trading
Currency | | Notional
Market
Value ($) | | Expiration
Date | | Unrealized
Appreciation ($) | | Unrealized
(Depreciation) ($) | |
Mini MSCI EAFE Index | | | 880 | | | USD | | | | | 73,062,000 | | | 06/2016 | | | 640,523 | | | | — | | |
Mini MSCI Emerging Markets Index | | | 677 | | | USD | | | | | 27,269,560 | | | 06/2016 | | | — | | | | (327,846 | ) | |
S&P 500 E-mini | | | 1,527 | | | USD | | | | | 159,945,615 | | | 06/2016 | | | 4,845,238 | | | | — | | |
Short Term Euro-BTP | | | 15 | | | EUR | | | | | 1,884,106 | | | 06/2016 | | | 2,667 | | | | — | | |
U.S. Long Bond | | | 25 | | | USD | | | | | 4,082,813 | | | 09/2016 | | | 4,795 | | | | — | | |
U.S. Treasury 10-Year Note | | | 283 | | | USD | | | | | 36,701,563 | | | 09/2016 | | | — | | | | (12,425 | ) | |
U.S. Treasury 2-Year Note | | | 43 | | | USD | | | | | 9,369,969 | | | 09/2016 | | | — | | | | (202 | ) | |
U.S. Treasury 5-Year Note | | | 95 | | | USD | | | | | 11,411,133 | | | 09/2016 | | | 562 | | | | — | | |
U.S. Treasury 5-Year Note | | | 63 | | | USD | | | | | 7,567,383 | | | 09/2016 | | | — | | | | (3,067 | ) | |
U.S. Ultra Bond | | | 105 | | | USD | | | | | 18,388,125 | | | 09/2016 | | | — | | | | (821 | ) | |
Total | | | | | | | 408,763,380 | | | | | | 5,711,349 | | | | (344,361 | ) | |
Short Futures Contracts Outstanding
Contract Description | | Number of
Contracts | | Trading
Currency | | Notional
Market
Value ($) | | Expiration
Date | | Unrealized
Appreciation ($) | | Unrealized
(Depreciation) ($) | |
U.S. Treasury 10-Year Note | | | (26 | ) | | USD | | | | | (3,371,875 | ) | | 09/2016 | | | 1,982 | | | | — | | |
U.S. Treasury 5-Year Note | | | (33 | ) | | USD | | | | | (3,963,867 | ) | | 09/2016 | | | 1,230 | | | | — | | |
U.S. Ultra Bond | | | (13 | ) | | USD | | | | | (2,276,625 | ) | | 09/2016 | | | — | | | | (129 | ) | |
Total | | | | | | | (9,612,367 | ) | | | | | 3,212 | | | | (129 | ) | |
Total Return Swap Contracts Outstanding at May 31, 2016
Counterparty | | Fund Receives | | Fund Pays | | Expiration
Date | | Notional
Currency | | Notional
Amount | | Premium
Paid ($) | | Premium
Received ($) | | Unrealized
Appreciation
($) | | Unrealized
Depreciation
($) | |
Citi
| | Total return on
iShares iBoxx
High Yield
Corporate
Bond ETF | | Floating rate
based on
3-month USD
LIBOR-BBA
minus 0.620% | | 06/09/2016 | | | | | 34,008,421 | | | | — | | | | — | | | | 1,462,523 | | | | — | | |
Citi
| | Total return on
PowerShares
Senior Loan
Portfolio
| | Floating rate
based on
1-month USD
LIBOR-BBA
minus 3.550% | | 06/22/2016 | | | | | 11,505,000 | | | | — | | | | — | | | | 86,459 | | | | — | | |
Citi
| | Total return on
iShares iBoxx
Investment
Grade
Corporate
Bond ETF | | Floating rate
based on
3-month USD
LIBOR-BBA
plus 0.100% | | 06/22/2016 | | | | | 19,999,965 | | | | — | | | | — | | | | 427,417 | | | | — | | |
Citi
| | Total return on
iShares
JPMorgan
USD Emerging
Markets Index | | Floating rate
based on
1-month USD
LIBOR-BBA
minus 0.450% | | 06/30/2016 | | | | | 5,992,920 | | | | — | | | | — | | | | — | | | | — | | |
The accompanying Notes to Financial Statements are an integral part of this statement.
Annual Report 2016
12
COLUMBIA ADAPTIVE RISK ALLOCATION FUND
PORTFOLIO OF INVESTMENTS (continued)
May 31, 2016
Total Return Swap Contracts Outstanding at May 31, 2016 (continued)
Counterparty | | Fund Receives | | Fund Pays | | Expiration
Date | | Notional
Currency | | Notional
Amount | | Premium
Paid ($) | | Premium
Received ($) | | Unrealized
Appreciation
($) | | Unrealized
Depreciation
($) | |
Citi
| | Total return on
iShares iBoxx
High Yield
Corporate
Bond ETF | | Floating rate
based on
1-month USD
LIBOR-BBA
minus 0.600% | | 06/30/2016 | | | | | 3,996,558 | | | | — | | | | — | | | | — | | | | — | | |
Citi
| | Total return on
iShares iBoxx
Investment
Grade
Corporate
Bond ETF | | Floating rate
based on
1-month USD
LIBOR-BBA
plus 0.350% | | 06/30/2016 | | | | | 26,862,750 | | | | — | | | | — | | | | — | | | | — | | |
JPMorgan
| | Total return
on iShares
JPMorgan
USD Emerging
Markets Index | | Floating rate
based on
3-month USD
LIBOR-BBA
minus 0.670% | | 07/22/2016 | | | | | 31,738,313 | | | | — | | | | — | | | | 9,053 | | | | — | | |
Morgan Stanley
| | Total return
on iShares
iBoxx
High Yield
Corporate
Bond ETF | | Floating rate
based on
1-month USD
LIBOR-BBA
minus 1.000% | | 06/10/2016 | | | | | 5,027,550 | | | | — | | | | — | | | | 32,584 | | | | — | | |
Morgan Stanley
| | Total return
on iShares
iBoxx
High Yield
Corporate
Bond ETF | | Floating rate
based on
3-month USD
LIBOR-BBA
minus 0.250% | | 08/05/2016 | | | | | 22,405,440 | | | | — | | | | — | | | | 274,467 | | | | — | | |
Total | | | | | | | | | | | | | — | | | | — | | | | 2,292,503 | | | | — | | |
Notes to Portfolio of Investments
(a) As defined in the Investment Company Act of 1940, an affiliated company is one in which the Fund owns 5% or more of the company's outstanding voting securities, or a company which is under common ownership or control with the Fund. Holdings and transactions in these affiliated companies during the year ended May 31, 2016 are as follows:
Issuer | | Beginning
Cost ($) | | Purchase
Cost ($) | | Proceeds
From
Sales ($) | | Realized
Gain
(Loss) ($) | | Ending
Cost ($) | | Capital Gain
Distributions ($) | | Dividends —
Affiliated
Issuers ($) | | Value ($) | |
Columbia Commodity
Strategy Fund,
Class I Shares | | | 31,846,778 | | | | 56,889,000 | | | | (43,051,000 | ) | | | (3,721,252 | ) | | | 41,963,526 | | | | — | | | | — | | | | 43,671,777 | | |
Columbia Real Estate
Equity Fund,
Class I Shares | | | 37,009,010 | | | | 35,466,942 | | | | (28,753,000 | ) | | | (862,891 | ) | | | 42,860,061 | | | | 2,175,863 | | | | 756,079 | | | | 43,837,145 | | |
Columbia Short-Term
Cash Fund | | | 160,877,769 | | | | 655,189,496 | | | | (565,258,980 | ) | | | — | | | | 250,808,285 | | | | — | | | | 565,578 | | | | 250,808,285 | | |
Total | | | 229,733,557 | | | | 747,545,438 | | | | (637,062,980 | ) | | | (4,584,143 | ) | | | 335,631,872 | | | | 2,175,863 | | | | 1,321,657 | | | | 338,317,207 | | |
(b) Non-income producing investment.
(c) Security, or a portion thereof, has been purchased on a when-issued or delayed delivery basis.
(d) Principal amounts are denominated in United States Dollars unless otherwise noted.
(e) Represents privately placed and other securities and instruments exempt from SEC registration (collectively, private placements), such as Section 4(a)(2) and Rule 144A eligible securities, which are often sold only to qualified institutional buyers. The Fund may invest in private placements determined to be liquid as well as those determined to be illiquid. Private placements may be determined to be liquid under guidelines established by the Fund's Board of Trustees. At May 31, 2016, the value of these securities amounted to $80,049,662 or 12.82% of net assets.
The accompanying Notes to Financial Statements are an integral part of this statement.
Annual Report 2016
13
COLUMBIA ADAPTIVE RISK ALLOCATION FUND
PORTFOLIO OF INVESTMENTS (continued)
May 31, 2016
Notes to Portfolio of Investments (continued)
(f) The rate shown is the seven-day current annualized yield at May 31, 2016.
Currency Legend
AUD Australian Dollar
CAD Canadian Dollar
CHF Swiss Franc
DKK Danish Krone
EUR Euro
GBP British Pound
HKD Hong Kong Dollar
JPY Japanese Yen
MXN Mexican Peso
NOK Norwegian Krone
NZD New Zealand Dollar
PLN Polish Zloty
SEK Swedish Krona
SGD Singapore Dollar
USD US Dollar
ZAR South African Rand
Fair Value Measurements
The Fund categorizes its fair value measurements according to a three-level hierarchy that maximizes the use of observable inputs and minimizes the use of unobservable inputs by prioritizing that the most observable input be used when available. Observable inputs are those that market participants would use in pricing an investment based on market data obtained from sources independent of the reporting entity. Unobservable inputs are those that reflect the Fund's assumptions about the information market participants would use in pricing an investment. An investment's level within the fair value hierarchy is based on the lowest level of any input that is deemed significant to the asset's or liability's fair value measurement. The input levels are not necessarily an indication of the risk or liquidity associated with investments at that level. For example, certain U.S. government securities are generally high quality and liquid, however, they are reflected as Level 2 because the inputs used to determine fair value may not always be quoted prices in an active market.
Fair value inputs are summarized in the three broad levels listed below:
> Level 1 — Valuations based on quoted prices for investments in active markets that the Fund has the ability to access at the measurement date (including NAV for open-end mutual funds). Valuation adjustments are not applied to Level 1 investments.
> Level 2 — Valuations based on other significant observable inputs (including quoted prices for similar securities, interest rates, prepayment speeds, credit risks, etc.).
> Level 3 — Valuations based on significant unobservable inputs (including the Fund's own assumptions and judgment in determining the fair value of investments).
Inputs that are used in determining fair value of an investment may include price information, credit data, volatility statistics, and other factors. These inputs can be either observable or unobservable. The availability of observable inputs can vary between investments, and is affected by various factors such as the type of investment, and the volume and level of activity for that investment or similar investments in the marketplace. The inputs will be considered by the Investment Manager, along with any other relevant factors in the calculation of an investment's fair value. The Fund uses prices and inputs that are current as of the measurement date, which may include periods of market dislocations. During these periods, the availability of prices and inputs may be reduced for many investments. This condition could cause an investment to be reclassified between the various levels within the hierarchy.
Certain investments that have been measured at fair value using the net asset value per share (or its equivalent) are not categorized in the fair value hierarchy. The fair value amounts presented in the table are intended to reconcile the fair value hierarchy to the amounts presented in the Portfolio of Investments. The Columbia Short-Term Cash Fund seeks to provide shareholders with maximum current income consistent with liquidity and stability of principal. Investments in Columbia Short-Term Cash Fund may be redeemed on a daily basis without restriction.
The accompanying Notes to Financial Statements are an integral part of this statement.
Annual Report 2016
14
COLUMBIA ADAPTIVE RISK ALLOCATION FUND
PORTFOLIO OF INVESTMENTS (continued)
May 31, 2016
Fair Value Measurements (continued)
Investments falling into the Level 3 category are primarily supported by quoted prices from brokers and dealers participating in the market for those investments. However, these may be classified as Level 3 investments due to lack of market transparency and corroboration to support these quoted prices. Additionally, valuation models may be used as the pricing source for any remaining investments classified as Level 3. These models may rely on one or more significant unobservable inputs and/or significant assumptions by the Investment Manager. Inputs used in valuations may include, but are not limited to, financial statement analysis, capital account balances, discount rates and estimated cash flows, and comparable company data.
Under the direction of the Fund's Board of Trustees (the Board), the Investment Manager's Valuation Committee (the Committee) is responsible for overseeing the valuation procedures approved by the Board. The Committee consists of voting and non-voting members from various groups within the Investment Manager's organization, including operations and accounting, trading and investments, compliance, risk management and legal.
The Committee meets at least monthly to review and approve valuation matters, which may include a description of specific valuation determinations, data regarding pricing information received from approved pricing vendors and brokers and the results of Board-approved valuation control policies and procedures (the Policies). The Policies address, among other things, instances when market quotations are or are not readily available, including recommendations of third party pricing vendors and a determination of appropriate pricing methodologies; events that require specific valuation determinations and assessment of fair value techniques; securities with a potential for stale pricing, including those that are illiquid, restricted, or in default; and the effectiveness of third party pricing vendors, including periodic reviews of vendors. The Committee meets more frequently, as needed, to discuss additional valuation matters, which may include the need to review back-testing results, review time-sensitive information or approve related valuation actions. The Committee reports to the Board, with members of the Committee meeting with the Board at each of its regularly scheduled meetings to discuss valuation matters and actions during the period, similar to those described earlier.
For investments categorized as Level 3, the Committee monitors information similar to that described above, which may include: (i) data specific to the issuer or comparable issuers, (ii) general market or specific sector news and (iii) quoted prices and specific or similar security transactions. The Committee considers this data and any changes from prior periods in order to assess the reasonableness of observable and unobservable inputs, any assumptions or internal models used to value those securities and changes in fair value. This data is also used to corroborate, when available, information received from approved pricing vendors and brokers. Various factors impact the frequency of monitoring this information (which may occur as often as daily). However, the Committee may determine that changes to inputs, assumptions and models are not required as a result of the monitoring procedures performed.
The following table is a summary of the inputs used to value the Fund's investments at May 31, 2016:
| | | Level 1
Quoted Prices in Active
Markets for Identical
Assets ($) | | Level 2
Other Significant
Observable Inputs ($) | | Level 3
Significant
Unobservable Inputs ($) | | Total ($) | |
Investments | |
Equity Funds | | | 43,837,145 | | | | — | | | | — | | | | 43,837,145 | | |
Alternative Investment Funds | | | 43,671,777 | | | | — | | | | — | | | | 43,671,777 | | |
Exchange-Traded Funds | | | 7,098,875 | | | | — | | | | — | | | | 7,098,875 | | |
Residential Mortgage-Backed
Securities — Agency | | | — | | | | 35,355,004 | | | | — | | | | 35,355,004 | | |
Inflation-Indexed Bonds | | | — | | | | 122,305,070 | | | | — | | | | 122,305,070 | | |
U.S. Treasury Obligations | | | 9,390,105 | | | | — | | | | — | | | | 9,390,105 | | |
Foreign Government Obligations | | | — | | | | 50,366,714 | | | | — | | | | 50,366,714 | | |
Investments measured at net asset value | |
Money Market Funds | | | — | | | | — | | | | — | | | | 250,808,285 | | |
Total Investments | | | 103,997,902 | | | | 208,026,788 | | | | — | | | | 562,832,975 | | |
The accompanying Notes to Financial Statements are an integral part of this statement.
Annual Report 2016
15
COLUMBIA ADAPTIVE RISK ALLOCATION FUND
PORTFOLIO OF INVESTMENTS (continued)
May 31, 2016
Fair Value Measurements (continued)
| | | Level 1
Quoted Prices in Active
Markets for Identical
Assets ($) | | Level 2
Other Significant
Observable Inputs ($) | | Level 3
Significant
Unobservable Inputs ($) | | Total ($) | |
Derivatives | |
Assets | |
Forward Foreign Currency Exchange
Contracts | | | — | | | | 1,773,700 | | | | — | | | | 1,773,700 | | |
Futures Contracts | | | 5,714,561 | | | | — | | | | — | | | | 5,714,561 | | |
Swap Contracts | | | — | | | | 2,292,503 | | | | — | | | | 2,292,503 | | |
Liabilities | |
Forward Foreign Currency Exchange
Contracts | | | — | | | | (1,442,020 | ) | | | — | | | | (1,442,020 | ) | |
Futures Contracts | | | (344,490 | ) | | | — | | | | — | | | | (344,490 | ) | |
Total | | | 109,367,973 | | | | 210,650,971 | | | | — | | | | 570,827,229 | | |
See the Portfolio of Investments for all investment classifications not indicated in the table.
The Fund's assets assigned to the Level 2 input category are generally valued using the market approach, in which a security's value is determined through reference to prices and information from market transactions for similar or identical assets.
Derivative instruments are valued at unrealized appreciation (depreciation).
There were no transfers of financial assets between levels during the period.
The accompanying Notes to Financial Statements are an integral part of this statement.
Annual Report 2016
16
COLUMBIA ADAPTIVE RISK ALLOCATION FUND
STATEMENT OF ASSETS AND LIABILITIES
May 31, 2016
Assets | |
Investments, at value | |
Unaffiliated issuers (identified cost $223,418,438) | | $ | 224,515,768 | | |
Affiliated issuers (identified cost $335,631,872) | | | 338,317,207 | | |
Total investments (identified cost $559,050,310) | | | 562,832,975 | | |
Foreign currency (identified cost $44,516) | | | 44,374 | | |
Cash collateral held at broker | | | 40,000 | | |
Margin deposits | | | 16,979,970 | | |
Unrealized appreciation on forward foreign currency exchange contracts | | | 1,773,700 | | |
Unrealized appreciation on swap contracts | | | 2,292,503 | | |
Receivable for: | |
Investments sold | | | 112,937,440 | | |
Investments sold on a delayed delivery basis | | | 21,777,745 | | |
Capital shares sold | | | 9,224,321 | | |
Dividends | | | 79,299 | | |
Interest | | | 795,502 | | |
Foreign tax reclaims | | | 17,732 | | |
Variation margin | | | 174,202 | | |
Prepaid expenses | | | 437 | | |
Trustees' deferred compensation plan | | | 11,621 | | |
Total assets | | | 728,981,821 | | |
Liabilities | |
Unrealized depreciation on forward foreign currency exchange contracts | | | 1,442,020 | | |
Payable for: | |
Investments purchased | | | 42,484,125 | | |
Investments purchased on a delayed delivery basis | | | 57,156,805 | | |
Capital shares purchased | | | 825,644 | | |
Variation margin | | | 2,357,961 | | |
Investment management fees | | | 40,409 | | |
Distribution and/or service fees | | | 20,943 | | |
Transfer agent fees | | | 59,112 | | |
Compensation of board members | | | 139 | | |
Chief compliance officer expenses | | | 37 | | |
Other expenses | | | 82,008 | | |
Trustees' deferred compensation plan | | | 11,621 | | |
Total liabilities | | | 104,480,824 | | |
Net assets applicable to outstanding capital stock | | $ | 624,500,997 | | |
Represented by | |
Paid-in capital | | $ | 626,556,247 | | |
Excess of distributions over net investment income | | | (675,972 | ) | |
Accumulated net realized loss | | | (13,159,526 | ) | |
Unrealized appreciation (depreciation) on: | |
Investments — unaffiliated issuers | | | 1,097,330 | | |
Investments — affiliated issuers | | | 2,685,335 | | |
Foreign currency translations | | | 3,329 | | |
Forward foreign currency exchange contracts | | | 331,680 | | |
Futures contracts | | | 5,370,071 | | |
Swap contracts | | | 2,292,503 | | |
Total — representing net assets applicable to outstanding capital stock | | $ | 624,500,997 | | |
The accompanying Notes to Financial Statements are an integral part of this statement.
Annual Report 2016
17
COLUMBIA ADAPTIVE RISK ALLOCATION FUND
STATEMENT OF ASSETS AND LIABILITIES (continued)
May 31, 2016
Class A | |
Net assets | | $ | 140,291,012 | | |
Shares outstanding | | | 14,014,933 | | |
Net asset value per share | | $ | 10.01 | | |
Maximum offering price per share(a) | | $ | 10.62 | | |
Class C | |
Net assets | | $ | 61,385,689 | | |
Shares outstanding | | | 6,298,152 | | |
Net asset value per share | | $ | 9.75 | | |
Class K | |
Net assets | | $ | 2,712 | | |
Shares outstanding | | | 270 | | |
Net asset value per share(b) | | $ | 10.03 | | |
Class R | |
Net assets | | $ | 860,525 | | |
Shares outstanding | | | 86,655 | | |
Net asset value per share | | $ | 9.93 | | |
Class R4 | |
Net assets | | $ | 10,907,704 | | |
Shares outstanding | | | 1,082,006 | | |
Net asset value per share | | $ | 10.08 | | |
Class R5 | |
Net assets | | $ | 1,627,937 | | |
Shares outstanding | | | 161,215 | | |
Net asset value per share | | $ | 10.10 | | |
Class W | |
Net assets | | $ | 383,552,367 | | |
Shares outstanding | | | 38,269,239 | | |
Net asset value per share | | $ | 10.02 | | |
Class Y | |
Net assets | | $ | 2,490 | | |
Shares outstanding | | | 246 | | |
Net asset value per share(b) | | $ | 10.11 | | |
Class Z | |
Net assets | | $ | 25,870,561 | | |
Shares outstanding | | | 2,567,360 | | |
Net asset value per share | | $ | 10.08 | | |
(a) The maximum offering price per share is calculated by dividing the net asset value per share by 1.0 minus the maximum sales charge of 5.75%.
(b) Net asset value per share rounds to this amount due to fractional shares outstanding.
The accompanying Notes to Financial Statements are an integral part of this statement.
Annual Report 2016
18
COLUMBIA ADAPTIVE RISK ALLOCATION FUND
STATEMENT OF OPERATIONS
Year Ended May 31, 2016
Net investment income | |
Income: | |
Dividends — unaffiliated issuers | | $ | 225,196 | | |
Dividends — affiliated issuers | | | 1,321,657 | | |
Interest | | | 1,925,993 | | |
Foreign taxes withheld | | | (347 | ) | |
Total income | | | 3,472,499 | | |
Expenses: | |
Investment management fees | | | 2,976,007 | | |
Distribution and/or service fees | |
Class A | | | 398,939 | | |
Class C | | | 590,225 | | |
Class R | | | 1,669 | | |
Class W | | | 518,696 | | |
Transfer agent fees | |
Class A | | | 248,242 | | |
Class C | | | 91,347 | | |
Class K | | | 1 | | |
Class R | | | 483 | | |
Class R4 | | | 17,044 | | |
Class R5 | | | 720 | | |
Class W | | | 314,187 | | |
Class Z | | | 31,443 | | |
Plan administration fees | |
Class K | | | 7 | | |
Compensation of board members | | | 24,387 | | |
Custodian fees | | | 53,848 | | |
Printing and postage fees | | | 91,839 | | |
Registration fees | | | 189,573 | | |
Audit fees | | | 41,659 | | |
Legal fees | | | 12,645 | | |
Chief compliance officer expenses | | | 225 | | |
Other | | | 16,217 | | |
Total expenses | | | 5,619,403 | | |
Fees waived or expenses reimbursed by Investment Manager and its affiliates | | | (331,893 | ) | |
Expense reductions | | | (40 | ) | |
Total net expenses | | | 5,287,470 | | |
Net investment loss | | | (1,814,971 | ) | |
Realized and unrealized gain (loss) — net | |
Net realized gain (loss) on: | |
Investments — unaffiliated issuers | | | (106,884 | ) | |
Investments — affiliated issuers | | | (4,584,143 | ) | |
Capital gain distributions from underlying affiliated funds | | | 2,175,863 | | |
Foreign currency translations | | | 147,249 | | |
Forward foreign currency exchange contracts | | | (2,094,723 | ) | |
Futures contracts | | | (4,085,279 | ) | |
Options purchased | | | (314,712 | ) | |
Options contracts written | | | 1,439 | | |
Swap contracts | | | 2,400,999 | | |
Net realized loss | | | (6,460,191 | ) | |
Net change in unrealized appreciation (depreciation) on: | |
Investments — unaffiliated issuers | | | 4,340,387 | | |
Investments — affiliated issuers | | | 3,370,610 | | |
Foreign currency translations | | | 150,788 | | |
Forward foreign currency exchange contracts | | | 383,112 | | |
Futures contracts | | | 790,390 | | |
Swap contracts | | | 698,457 | | |
Net change in unrealized appreciation | | | 9,733,744 | | |
Net realized and unrealized gain | | | 3,273,553 | | |
Net increase in net assets resulting from operations | | $ | 1,458,582 | | |
The accompanying Notes to Financial Statements are an integral part of this statement.
Annual Report 2016
19
COLUMBIA ADAPTIVE RISK ALLOCATION FUND
STATEMENT OF CHANGES IN NET ASSETS
| | | Year Ended
May 31,
2016 | | Year Ended
May 31,
2015(a) | |
Operations | |
Net investment loss | | $ | (1,814,971 | ) | | $ | (988,253 | ) | |
Net realized gain (loss) | | | (6,460,191 | ) | | | 3,155,082 | | |
Net change in unrealized appreciation (depreciation) | | | 9,733,744 | | | | (1,611,956 | ) | |
Net increase in net assets resulting from operations | | | 1,458,582 | | | | 554,873 | | |
Distributions to shareholders | |
Net investment income | |
Class A | | | — | | | | (15,795 | ) | |
Class K | | | — | | | | (5 | ) | |
Class R4 | | | — | | | | (19,603 | ) | |
Class R5 | | | — | | | | (1,192 | ) | |
Class W | | | — | | | | (115,976 | ) | |
Class Y | | | — | | | | (11 | ) | |
Class Z | | | — | | | | (17,288 | ) | |
Net realized gains | |
Class A | | | (1,583,099 | ) | | | (420,284 | ) | |
Class C | | | (617,046 | ) | | | (122,589 | ) | |
Class K | | | (27 | ) | | | (48 | ) | |
Class R | | | (2,605 | ) | | | (1,570 | ) | |
Class R4 | | | (107,570 | ) | | | (112,812 | ) | |
Class R5 | | | (12,937 | ) | | | (4,985 | ) | |
Class W | | | (1,821,566 | ) | | | (3,086,005 | ) | |
Class Y | | | (24 | ) | | | (44 | ) | |
Class Z | | | (192,670 | ) | | | (99,486 | ) | |
Total distributions to shareholders | | | (4,337,544 | ) | | | (4,017,693 | ) | |
Increase in net assets from capital stock activity | | | 196,174,393 | | | | 237,224,074 | | |
Total increase in net assets | | | 193,295,431 | | | | 233,761,254 | | |
Net assets at beginning of year | | | 431,205,566 | | | | 197,444,312 | | |
Net assets at end of year | | $ | 624,500,997 | | | $ | 431,205,566 | | |
Excess of distributions over net investment income | | $ | (675,972 | ) | | $ | (297,284 | ) | |
(a) Class R4 and Class Y shares are based on operations from October 1, 2014 (commencement of operations) through the stated period end.
The accompanying Notes to Financial Statements are an integral part of this statement.
Annual Report 2016
20
COLUMBIA ADAPTIVE RISK ALLOCATION FUND
STATEMENT OF CHANGES IN NET ASSETS (continued)
| | | Year Ended May 31, 2016 | | Year Ended May 31, 2015(a) | |
| | | Shares | | Dollars ($) | | Shares | | Dollars ($) | |
Capital stock activity | |
Class A shares | |
Subscriptions | | | 6,477,611 | | | | 63,559,452 | | | | 17,144,145 | | | | 175,750,190 | | |
Distributions reinvested | | | 166,863 | | | | 1,578,524 | | | | 41,129 | | | | 415,816 | | |
Redemptions | | | (9,344,931 | ) | | | (90,415,838 | ) | | | (1,180,923 | ) | | | (12,081,431 | ) | |
Net increase (decrease) | | | (2,700,457 | ) | | | (25,277,862 | ) | | | 16,004,351 | | | | 164,084,575 | | |
Class C shares | |
Subscriptions | | | 2,529,237 | | | | 24,329,314 | | | | 5,276,583 | | | | 53,187,065 | | |
Distributions reinvested | | | 66,586 | | | | 615,252 | | | | 12,303 | | | | 122,541 | | |
Redemptions | | | (1,549,411 | ) | | | (14,704,497 | ) | | | (78,314 | ) | | | (790,418 | ) | |
Net increase | | | 1,046,412 | | | | 10,240,069 | | | | 5,210,572 | | | | 52,519,188 | | |
Class R shares | |
Subscriptions | | | 79,167 | | | | 761,750 | | | | 28,912 | | | | 295,000 | | |
Distributions reinvested | | | 275 | | | | 2,579 | | | | 151 | | | | 1,522 | | |
Redemptions | | | (7,249 | ) | | | (70,691 | ) | | | (14,871 | ) | | | (150,755 | ) | |
Net increase | | | 72,193 | | | | 693,638 | | | | 14,192 | | | | 145,767 | | |
Class R4 shares | |
Subscriptions | | | 536,608 | | | | 5,350,191 | | | | 1,173,638 | | | | 12,174,146 | | |
Distributions reinvested | | | 11,297 | | | | 107,546 | | | | 13,041 | | | | 132,364 | | |
Redemptions | | | (553,645 | ) | | | (5,366,946 | ) | | | (98,933 | ) | | | (1,019,360 | ) | |
Net increase (decrease) | | | (5,740 | ) | | | 90,791 | | | | 1,087,746 | | | | 11,287,150 | | |
Class R5 shares | |
Subscriptions | | | 76,079 | | | | 763,436 | | | | 167,304 | | | | 1,715,426 | | |
Distributions reinvested | | | 1,355 | | | | 12,910 | | | | 603 | | | | 6,117 | | |
Redemptions | | | (77,319 | ) | | | (753,316 | ) | | | (9,335 | ) | | | (95,898 | ) | |
Net increase | | | 115 | | | | 23,030 | | | | 158,572 | | | | 1,625,645 | | |
Class W shares | |
Subscriptions | | | 24,944,483 | | | | 242,892,513 | | | | 2,225,843 | | | | 22,852,770 | | |
Distributions reinvested | | | 192,348 | | | | 1,821,539 | | | | 316,084 | | | | 3,201,931 | | |
Redemptions | | | (3,998,727 | ) | | | (39,020,767 | ) | | | (3,283,557 | ) | | | (33,716,457 | ) | |
Net increase (decrease) | | | 21,138,104 | | | | 205,693,285 | | | | (741,630 | ) | | | (7,661,756 | ) | |
Class Y shares | |
Subscriptions | | | — | | | | — | | | | 246 | | | | 2,500 | | |
Net increase | | | — | | | | — | | | | 246 | | | | 2,500 | | |
Class Z shares | |
Subscriptions | | | 1,479,031 | | | | 14,678,134 | | | | 2,095,595 | | | | 21,567,975 | | |
Distributions reinvested | | | 19,209 | | | | 182,674 | | | | 11,499 | | | | 116,597 | | |
Redemptions | | | (1,036,140 | ) | | | (10,149,366 | ) | | | (631,221 | ) | | | (6,463,567 | ) | |
Net increase | | | 462,100 | | | | 4,711,442 | | | | 1,475,873 | | | | 15,221,005 | | |
Total net increase | | | 20,012,727 | | | | 196,174,393 | | | | 23,209,922 | | | | 237,224,074 | | |
(a) Class R4 and Class Y shares are based on operations from October 1, 2014 (commencement of operations) through the stated period end.
The accompanying Notes to Financial Statements are an integral part of this statement.
Annual Report 2016
21
COLUMBIA ADAPTIVE RISK ALLOCATION FUND
The following tables are intended to help you understand the Fund's financial performance. Certain information reflects financial results for a single share of a class held for the periods shown. Per share net investment income (loss) amounts are calculated based on average shares outstanding during the period. Total return assumes reinvestment of all dividends and distributions, if any. Total return does not reflect payment of sales charges, if any. Total return and portfolio turnover are not annualized for periods of less than one year. The portfolio turnover rate is calculated without regard to purchase and sales transactions of short-term instruments and certain derivatives, if any. If such transactions were included, the Fund's portfolio turnover rate may be higher.
| | | Year Ended May 31, | |
Class A | | 2016 | | 2015 | | 2014 | | 2013(a) | |
Per share data | |
Net asset value, beginning of period | | $ | 10.17 | | | $ | 10.24 | | | $ | 10.06 | | | $ | 10.00 | | |
Income from investment operations: | |
Net investment income (loss) | | | (0.03 | ) | | | (0.04 | ) | | | 0.01 | | | | (0.04 | ) | |
Net realized and unrealized gain (loss) | | | (0.03 | )(b) | | | 0.14 | | | | 0.65 | | | | 0.47 | | |
Increase from payment by affiliate | | | — | | | | 0.01 | | | | — | | | | — | | |
Total from investment operations | | | (0.06 | ) | | | 0.11 | | | | 0.66 | | | | 0.43 | | |
Less distributions to shareholders: | |
Net investment income | | | — | | | | (0.00 | )(c) | | | — | | | | (0.14 | ) | |
Net realized gains | | | (0.10 | ) | | | (0.18 | ) | | | (0.48 | ) | | | (0.23 | ) | |
Total distributions to shareholders | | | (0.10 | ) | | | (0.18 | ) | | | (0.48 | ) | | | (0.37 | ) | |
Net asset value, end of period | | $ | 10.01 | | | $ | 10.17 | | | $ | 10.24 | | | $ | 10.06 | | |
Total return | | | (0.55 | %) | | | 1.13 | %(d) | | | 7.07 | % | | | 4.15 | % | |
Ratios to average net assets(e) | |
Total gross expenses | | | 1.15 | % | | | 1.23 | % | | | 2.01 | % | | | 2.97 | %(f) | |
Total net expenses(g) | | | 1.07 | %(h) | | | 1.06 | % | | | 0.75 | % | | | 0.60 | %(f) | |
Net investment income (loss) | | | (0.32 | %) | | | (0.35 | %) | | | 0.14 | % | | | (0.42 | %)(f) | |
Supplemental data | |
Net assets, end of period (in thousands) | | $ | 140,291 | | | $ | 169,978 | | | $ | 7,281 | | | $ | 8,139 | | |
Portfolio turnover | | | 254 | % | | | 256 | % | | | 303 | % | | | 76 | % | |
Notes to Financial Highlights
(a) Based on operations from June 19, 2012 (commencement of operations) through the stated period end.
(b) Calculation of the net gain (loss) per share (both realized and unrealized) does not correlate to the aggregate realized and unrealized gain (loss) presented in the Statement of Operations due to the timing of subscriptions and redemptions of Fund shares in relation to fluctuations in the market value of the portfolio.
(c) Rounds to zero.
(d) The Fund received a payment from an affiliate. Had the Fund not received this payment, the total return would have been lower by 0.07%.
(e) In addition to the fees and expenses that the Fund bears directly, the Fund indirectly bears a pro rata share of the fees and expenses of any other funds in which it invests. Such indirect expenses are not included in the Fund's reported expense ratios.
(f) Annualized.
(g) Total net expenses include the impact of certain fee waivers/expense reimbursements made by the Investment Manager and certain of its affiliates, if applicable.
(h) The benefits derived from expense reductions had an impact of less than 0.01%.
The accompanying Notes to Financial Statements are an integral part of this statement.
Annual Report 2016
22
COLUMBIA ADAPTIVE RISK ALLOCATION FUND
FINANCIAL HIGHLIGHTS (continued)
| | | Year Ended May 31, | |
Class C | | 2016 | | 2015 | | 2014 | | 2013(a) | |
Per share data | |
Net asset value, beginning of period | | $ | 9.98 | | | $ | 10.11 | | | $ | 10.03 | | | $ | 10.00 | | |
Income from investment operations: | |
Net investment loss | | | (0.10 | ) | | | (0.11 | ) | | | (0.06 | ) | | | (0.12 | ) | |
Net realized and unrealized gain (loss) | | | (0.03 | )(b) | | | 0.15 | | | | 0.62 | | | | 0.48 | | |
Increase from payment by affiliate | | | — | | | | 0.01 | | | | — | | | | — | | |
Total from investment operations | | | (0.13 | ) | | | 0.05 | | | | 0.56 | | | | 0.36 | | |
Less distributions to shareholders: | |
Net investment income | | | — | | | | — | | | | — | | | | (0.10 | ) | |
Net realized gains | | | (0.10 | ) | | | (0.18 | ) | | | (0.48 | ) | | | (0.23 | ) | |
Total distributions to shareholders | | | (0.10 | ) | | | (0.18 | ) | | | (0.48 | ) | | | (0.33 | ) | |
Net asset value, end of period | | $ | 9.75 | | | $ | 9.98 | | | $ | 10.11 | | | $ | 10.03 | | |
Total return | | | (1.26 | %) | | | 0.48 | %(c) | | | 6.07 | % | | | 3.43 | % | |
Ratios to average net assets(d) | |
Total gross expenses | | | 1.90 | % | | | 1.98 | % | | | 2.76 | % | | | 3.69 | %(e) | |
Total net expenses(f) | | | 1.82 | %(g) | | | 1.81 | % | | | 1.50 | % | | | 1.33 | %(e) | |
Net investment loss | | | (1.09 | %) | | | (1.11 | %) | | | (0.65 | %) | | | (1.19 | %)(e) | |
Supplemental data | |
Net assets, end of period (in thousands) | | $ | 61,386 | | | $ | 52,406 | | | $ | 416 | | | $ | 1,387 | | |
Portfolio turnover | | | 254 | % | | | 256 | % | | | 303 | % | | | 76 | % | |
Notes to Financial Highlights
(a) Based on operations from June 19, 2012 (commencement of operations) through the stated period end.
(b) Calculation of the net gain (loss) per share (both realized and unrealized) does not correlate to the aggregate realized and unrealized gain (loss) presented in the Statement of Operations due to the timing of subscriptions and redemptions of Fund shares in relation to fluctuations in the market value of the portfolio.
(c) The Fund received a payment from an affiliate. Had the Fund not received this payment, the total return would have been lower by 0.07%.
(d) In addition to the fees and expenses that the Fund bears directly, the Fund indirectly bears a pro rata share of the fees and expenses of any other funds in which it invests. Such indirect expenses are not included in the Fund's reported expense ratios.
(e) Annualized.
(f) Total net expenses include the impact of certain fee waivers/expense reimbursements made by the Investment Manager and certain of its affiliates, if applicable.
(g) The benefits derived from expense reductions had an impact of less than 0.01%.
The accompanying Notes to Financial Statements are an integral part of this statement.
Annual Report 2016
23
COLUMBIA ADAPTIVE RISK ALLOCATION FUND
FINANCIAL HIGHLIGHTS (continued)
| | | Year Ended May 31, | |
Class K | | 2016 | | 2015 | | 2014 | | 2013(a) | |
Per share data | |
Net asset value, beginning of period | | $ | 10.18 | | | $ | 10.25 | | | $ | 10.06 | | | $ | 10.00 | | |
Income from investment operations: | |
Net investment income (loss) | | | (0.02 | ) | | | (0.03 | ) | | | 0.03 | | | | (0.04 | ) | |
Net realized and unrealized gain (loss) | | | (0.03 | )(b) | | | 0.15 | | | | 0.64 | | | | 0.47 | | |
Increase from payment by affiliate | | | — | | | | 0.01 | | | | — | | | | — | | |
Total from investment operations | | | (0.05 | ) | | | 0.13 | | | | 0.67 | | | | 0.43 | | |
Less distributions to shareholders: | |
Net investment income | | | — | | | | (0.02 | ) | | | — | | | | (0.14 | ) | |
Net realized gains | | | (0.10 | ) | | | (0.18 | ) | | | (0.48 | ) | | | (0.23 | ) | |
Total distributions to shareholders | | | (0.10 | ) | | | (0.20 | ) | | | (0.48 | ) | | | (0.37 | ) | |
Net asset value, end of period | | $ | 10.03 | | | $ | 10.18 | | | $ | 10.25 | | | $ | 10.06 | | |
Total return | | | (0.45 | %) | | | 1.25 | %(c) | | | 7.18 | % | | | 4.13 | % | |
Ratios to average net assets(d) | |
Total gross expenses | | | 1.04 | % | | | 1.10 | % | | | 1.79 | % | | | 2.90 | %(e) | |
Total net expenses(f) | | | 0.97 | % | | | 0.84 | % | | | 0.63 | % | | | 0.63 | %(e) | |
Net investment income (loss) | | | (0.24 | %) | | | (0.27 | %) | | | 0.35 | % | | | (0.37 | %)(e) | |
Supplemental data | |
Net assets, end of period (in thousands) | | $ | 3 | | | $ | 3 | | | $ | 3 | | | $ | 3 | | |
Portfolio turnover | | | 254 | % | | | 256 | % | | | 303 | % | | | 76 | % | |
Notes to Financial Highlights
(a) Based on operations from June 19, 2012 (commencement of operations) through the stated period end.
(b) Calculation of the net gain (loss) per share (both realized and unrealized) does not correlate to the aggregate realized and unrealized gain (loss) presented in the Statement of Operations due to the timing of subscriptions and redemptions of Fund shares in relation to fluctuations in the market value of the portfolio.
(c) The Fund received a payment from an affiliate. Had the Fund not received this payment, the total return would have been lower by 0.07%.
(d) In addition to the fees and expenses that the Fund bears directly, the Fund indirectly bears a pro rata share of the fees and expenses of any other funds in which it invests. Such indirect expenses are not included in the Fund's reported expense ratios.
(e) Annualized.
(f) Total net expenses include the impact of certain fee waivers/expense reimbursements made by the Investment Manager and certain of its affiliates, if applicable.
The accompanying Notes to Financial Statements are an integral part of this statement.
Annual Report 2016
24
COLUMBIA ADAPTIVE RISK ALLOCATION FUND
FINANCIAL HIGHLIGHTS (continued)
| | | Year Ended May 31, | |
Class R | | 2016 | | 2015 | | 2014 | | 2013(a) | |
Per share data | |
Net asset value, beginning of period | | $ | 10.11 | | | $ | 10.20 | | | $ | 10.05 | | | $ | 10.00 | | |
Income from investment operations: | |
Net investment loss | | | (0.06 | ) | | | (0.08 | ) | | | (0.01 | ) | | | (0.07 | ) | |
Net realized and unrealized gain (loss) | | | (0.02 | )(b) | | | 0.16 | | | | 0.64 | | | | 0.47 | | |
Increase from payment by affiliate | | | — | | | | 0.01 | | | | — | | | | — | | |
Total from investment operations | | | (0.08 | ) | | | 0.09 | | | | 0.63 | | | | 0.40 | | |
Less distributions to shareholders: | |
Net investment income | | | — | | | | — | | | | — | | | | (0.12 | ) | |
Net realized gains | | | (0.10 | ) | | | (0.18 | ) | | | (0.48 | ) | | | (0.23 | ) | |
Total distributions to shareholders | | | (0.10 | ) | | | (0.18 | ) | | | (0.48 | ) | | | (0.35 | ) | |
Net asset value, end of period | | $ | 9.93 | | | $ | 10.11 | | | $ | 10.20 | | | $ | 10.05 | | |
Total return | | | (0.75 | %) | | | 0.87 | %(c) | | | 6.77 | % | | | 3.90 | % | |
Ratios to average net assets(d) | |
Total gross expenses | | | 1.38 | % | | | 1.48 | % | | | 2.26 | % | | | 3.14 | %(e) | |
Total net expenses(f) | | | 1.34 | %(g) | | | 1.32 | % | | | 1.00 | % | | | 0.87 | %(e) | |
Net investment loss | | | (0.57 | %) | | | (0.83 | %) | | | (0.14 | %) | | | (0.74 | %)(e) | |
Supplemental data | |
Net assets, end of period (in thousands) | | $ | 861 | | | $ | 146 | | | $ | 3 | | | $ | 3 | | |
Portfolio turnover | | | 254 | % | | | 256 | % | | | 303 | % | | | 76 | % | |
Notes to Financial Highlights
(a) Based on operations from June 19, 2012 (commencement of operations) through the stated period end.
(b) Calculation of the net gain (loss) per share (both realized and unrealized) does not correlate to the aggregate realized and unrealized gain (loss) presented in the Statement of Operations due to the timing of subscriptions and redemptions of Fund shares in relation to fluctuations in the market value of the portfolio.
(c) The Fund received a payment from an affiliate. Had the Fund not received this payment, the total return would have been lower by 0.07%.
(d) In addition to the fees and expenses that the Fund bears directly, the Fund indirectly bears a pro rata share of the fees and expenses of any other funds in which it invests. Such indirect expenses are not included in the Fund's reported expense ratios.
(e) Annualized.
(f) Total net expenses include the impact of certain fee waivers/expense reimbursements made by the Investment Manager and certain of its affiliates, if applicable.
(g) The benefits derived from expense reductions had an impact of less than 0.01%.
The accompanying Notes to Financial Statements are an integral part of this statement.
Annual Report 2016
25
COLUMBIA ADAPTIVE RISK ALLOCATION FUND
FINANCIAL HIGHLIGHTS (continued)
| | | Year Ended May 31, | |
Class R4 | | 2016 | | 2015(a) | |
Per share data | |
Net asset value, beginning of period | | $ | 10.21 | | | $ | 10.13 | | |
Income from investment operations: | |
Net investment loss | | | (0.01 | ) | | | (0.02 | ) | |
Net realized and unrealized gain (loss) | | | (0.02 | )(b) | | | 0.31 | | |
Total from investment operations | | | (0.03 | ) | | | 0.29 | | |
Less distributions to shareholders: | |
Net investment income | | | — | | | | (0.03 | ) | |
Net realized gains | | | (0.10 | ) | | | (0.18 | ) | |
Total distributions to shareholders | | | (0.10 | ) | | | (0.21 | ) | |
Net asset value, end of period | | $ | 10.08 | | | $ | 10.21 | | |
Total return | | | (0.25 | %) | | | 2.87 | % | |
Ratios to average net assets(c) | |
Total gross expenses | | | 0.90 | % | | | 0.99 | %(d) | |
Total net expenses(e) | | | 0.82 | %(f) | | | 0.82 | %(d) | |
Net investment loss | | | (0.08 | %) | | | (0.30 | %)(d) | |
Supplemental data | |
Net assets, end of period (in thousands) | | $ | 10,908 | | | $ | 11,110 | | |
Portfolio turnover | | | 254 | % | | | 256 | % | |
Notes to Financial Highlights
(a) Based on operations from October 1, 2014 (commencement of operations) through the stated period end.
(b) Calculation of the net gain (loss) per share (both realized and unrealized) does not correlate to the aggregate realized and unrealized gain (loss) presented in the Statement of Operations due to the timing of subscriptions and redemptions of Fund shares in relation to fluctuations in the market value of the portfolio.
(c) In addition to the fees and expenses that the Fund bears directly, the Fund indirectly bears a pro rata share of the fees and expenses of any other funds in which it invests. Such indirect expenses are not included in the Fund's reported expense ratios.
(d) Annualized.
(e) Total net expenses include the impact of certain fee waivers/expense reimbursements made by the Investment Manager and certain of its affiliates, if applicable.
(f) The benefits derived from expense reductions had an impact of less than 0.01%.
The accompanying Notes to Financial Statements are an integral part of this statement.
Annual Report 2016
26
COLUMBIA ADAPTIVE RISK ALLOCATION FUND
FINANCIAL HIGHLIGHTS (continued)
| | | Year Ended May 31, | |
Class R5 | | 2016 | | 2015 | | 2014 | | 2013(a) | |
Per share data | |
Net asset value, beginning of period | | $ | 10.22 | | | $ | 10.29 | | | $ | 10.07 | | | $ | 10.00 | | |
Income from investment operations: | |
Net investment income (loss) | | | 0.00 | (b) | | | (0.01 | ) | | | 0.07 | | | | (0.03 | ) | |
Net realized and unrealized gain (loss) | | | (0.02 | )(c) | | | 0.15 | | | | 0.63 | | | | 0.48 | | |
Increase from payment by affiliate | | | — | | | | 0.01 | | | | — | | | | — | | |
Total from investment operations | | | (0.02 | ) | | | 0.15 | | | | 0.70 | | | | 0.45 | | |
Less distributions to shareholders: | |
Net investment income | | | — | | | | (0.04 | ) | | | — | | | | (0.15 | ) | |
Net realized gains | | | (0.10 | ) | | | (0.18 | ) | | | (0.48 | ) | | | (0.23 | ) | |
Total distributions to shareholders | | | (0.10 | ) | | | (0.22 | ) | | | (0.48 | ) | | | (0.38 | ) | |
Net asset value, end of period | | $ | 10.10 | | | $ | 10.22 | | | $ | 10.29 | | | $ | 10.07 | | |
Total return | | | (0.15 | %) | | | 1.48 | %(d) | | | 7.47 | % | | | 4.37 | % | |
Ratios to average net assets(e) | |
Total gross expenses | | | 0.79 | % | | | 0.86 | % | | | 1.54 | % | | | 2.66 | %(f) | |
Total net expenses(g) | | | 0.73 | % | | | 0.69 | % | | | 0.38 | % | | | 0.38 | %(f) | |
Net investment income (loss) | | | 0.03 | % | | | (0.14 | %) | | | 0.68 | % | | | (0.25 | %)(f) | |
Supplemental data | |
Net assets, end of period (in thousands) | | $ | 1,628 | | | $ | 1,647 | | | $ | 26 | | | $ | 3 | | |
Portfolio turnover | | | 254 | % | | | 256 | % | | | 303 | % | | | 76 | % | |
Notes to Financial Highlights
(a) Based on operations from June 19, 2012 (commencement of operations) through the stated period end.
(b) Rounds to zero.
(c) Calculation of the net gain (loss) per share (both realized and unrealized) does not correlate to the aggregate realized and unrealized gain (loss) presented in the Statement of Operations due to the timing of subscriptions and redemptions of Fund shares in relation to fluctuations in the market value of the portfolio.
(d) The Fund received a payment from an affiliate. Had the Fund not received this payment, the total return would have been lower by 0.07%.
(e) In addition to the fees and expenses that the Fund bears directly, the Fund indirectly bears a pro rata share of the fees and expenses of any other funds in which it invests. Such indirect expenses are not included in the Fund's reported expense ratios.
(f) Annualized.
(g) Total net expenses include the impact of certain fee waivers/expense reimbursements made by the Investment Manager and certain of its affiliates, if applicable.
The accompanying Notes to Financial Statements are an integral part of this statement.
Annual Report 2016
27
COLUMBIA ADAPTIVE RISK ALLOCATION FUND
FINANCIAL HIGHLIGHTS (continued)
| | | Year Ended May 31, | |
Class W | | 2016 | | 2015 | | 2014 | | 2013(a) | |
Per share data | |
Net asset value, beginning of period | | $ | 10.18 | | | $ | 10.25 | | | $ | 10.06 | | | $ | 10.00 | | |
Income from investment operations: | |
Net investment income (loss) | | | (0.03 | ) | | | (0.04 | ) | | | 0.05 | | | | (0.04 | ) | |
Net realized and unrealized gain (loss) | | | (0.03 | )(b) | | | 0.14 | | | | 0.62 | | | | 0.47 | | |
Increase from payment by affiliate | | | — | | | | 0.01 | | | | — | | | | — | | |
Total from investment operations | | | (0.06 | ) | | | 0.11 | | | | 0.67 | | | | 0.43 | | |
Less distributions to shareholders: | |
Net investment income | | | — | | | | (0.00 | )(c) | | | — | | | | (0.14 | ) | |
Net realized gains | | | (0.10 | ) | | | (0.18 | ) | | | (0.48 | ) | | | (0.23 | ) | |
Total distributions to shareholders | | | (0.10 | ) | | | (0.18 | ) | | | (0.48 | ) | | | (0.37 | ) | |
Net asset value, end of period | | $ | 10.02 | | | $ | 10.18 | | | $ | 10.25 | | | $ | 10.06 | | |
Total return | | | (0.55 | %) | | | 1.13 | %(d) | | | 7.18 | % | | | 4.15 | % | |
Ratios to average net assets(e) | |
Total gross expenses | | | 1.14 | % | | | 1.25 | % | | | 2.01 | % | | | 2.90 | %(f) | |
Total net expenses(g) | | | 1.08 | %(h) | | | 0.96 | % | | | 0.75 | % | | | 0.62 | %(f) | |
Net investment income (loss) | | | (0.31 | %) | | | (0.37 | %) | | | 0.62 | % | | | (0.42 | %)(f) | |
Supplemental data | |
Net assets, end of period (in thousands) | | $ | 383,552 | | | $ | 174,418 | | | $ | 183,246 | | | $ | 3 | | |
Portfolio turnover | | | 254 | % | | | 256 | % | | | 303 | % | | | 76 | % | |
Notes to Financial Highlights
(a) Based on operations from June 19, 2012 (commencement of operations) through the stated period end.
(b) Calculation of the net gain (loss) per share (both realized and unrealized) does not correlate to the aggregate realized and unrealized gain (loss) presented in the Statement of Operations due to the timing of subscriptions and redemptions of Fund shares in relation to fluctuations in the market value of the portfolio.
(c) Rounds to zero.
(d) The Fund received a payment from an affiliate. Had the Fund not received this payment, the total return would have been lower by 0.07%.
(e) In addition to the fees and expenses that the Fund bears directly, the Fund indirectly bears a pro rata share of the fees and expenses of any other funds in which it invests. Such indirect expenses are not included in the Fund's reported expense ratios.
(f) Annualized.
(g) Total net expenses include the impact of certain fee waivers/expense reimbursements made by the Investment Manager and certain of its affiliates, if applicable.
(h) The benefits derived from expense reductions had an impact of less than 0.01%.
The accompanying Notes to Financial Statements are an integral part of this statement.
Annual Report 2016
28
COLUMBIA ADAPTIVE RISK ALLOCATION FUND
FINANCIAL HIGHLIGHTS (continued)
| | | Year Ended May 31, | |
Class Y | | 2016 | | 2015(a) | |
Per share data | |
Net asset value, beginning of period | | $ | 10.23 | | | $ | 10.15 | | |
Income from investment operations: | |
Net investment income (loss) | | | 0.00 | (b) | | | (0.02 | ) | |
Net realized and unrealized gain (loss) | | | (0.02 | )(c) | | | 0.32 | | |
Total from investment operations | | | (0.02 | ) | | | 0.30 | | |
Less distributions to shareholders: | |
Net investment income | | | — | | | | (0.04 | ) | |
Net realized gains | | | (0.10 | ) | | | (0.18 | ) | |
Total distributions to shareholders | | | (0.10 | ) | | | (0.22 | ) | |
Net asset value, end of period | | $ | 10.11 | | | $ | 10.23 | | |
Total return | | | (0.15 | %) | | | 2.98 | % | |
Ratios to average net assets(d) | |
Total gross expenses | | | 0.76 | % | | | 0.85 | %(e) | |
Total net expenses(f) | | | 0.69 | % | | | 0.65 | %(e) | |
Net investment income (loss) | | | 0.02 | % | | | (0.28 | %)(e) | |
Supplemental data | |
Net assets, end of period (in thousands) | | $ | 2 | | | $ | 3 | | |
Portfolio turnover | | | 254 | % | | | 256 | % | |
Notes to Financial Highlights
(a) Based on operations from October 1, 2014 (commencement of operations) through the stated period end.
(b) Rounds to zero.
(c) Calculation of the net gain (loss) per share (both realized and unrealized) does not correlate to the aggregate realized and unrealized gain (loss) presented in the Statement of Operations due to the timing of subscriptions and redemptions of Fund shares in relation to fluctuations in the market value of the portfolio.
(d) In addition to the fees and expenses that the Fund bears directly, the Fund indirectly bears a pro rata share of the fees and expenses of any other funds in which it invests. Such indirect expenses are not included in the Fund's reported expense ratios.
(e) Annualized.
(f) Total net expenses include the impact of certain fee waivers/expense reimbursements made by the Investment Manager and certain of its affiliates, if applicable.
The accompanying Notes to Financial Statements are an integral part of this statement.
Annual Report 2016
29
COLUMBIA ADAPTIVE RISK ALLOCATION FUND
FINANCIAL HIGHLIGHTS (continued)
| | | Year Ended May 31, | |
Class Z | | 2016 | | 2015 | | 2014 | | 2013(a) | |
Per share data | |
Net asset value, beginning of period | | $ | 10.21 | | | $ | 10.28 | | | $ | 10.07 | | | $ | 10.00 | | |
Income from investment operations: | |
Net investment income (loss) | | | (0.01 | ) | | | (0.02 | ) | | | 0.04 | | | | (0.02 | ) | |
Net realized and unrealized gain (loss) | | | (0.02 | )(b) | | | 0.15 | | | | 0.65 | | | | 0.47 | | |
Increase from payment by affiliate | | | — | | | | 0.01 | | | | — | | | | — | | |
Total from investment operations | | | (0.03 | ) | | | 0.14 | | | | 0.69 | | | | 0.45 | | |
Less distributions to shareholders: | |
Net investment income | | | — | | | | (0.03 | ) | | | — | | | | (0.15 | ) | |
Net realized gains | | | (0.10 | ) | | | (0.18 | ) | | | (0.48 | ) | | | (0.23 | ) | |
Total distributions to shareholders | | | (0.10 | ) | | | (0.21 | ) | | | (0.48 | ) | | | (0.38 | ) | |
Net asset value, end of period | | $ | 10.08 | | | $ | 10.21 | | | $ | 10.28 | | | $ | 10.07 | | |
Total return | | | (0.25 | %) | | | 1.37 | %(c) | | | 7.37 | % | | | 4.39 | % | |
Ratios to average net assets(d) | |
Total gross expenses | | | 0.90 | % | | | 0.99 | % | | | 1.76 | % | | | 2.66 | %(e) | |
Total net expenses(f) | | | 0.82 | %(g) | | | 0.78 | % | | | 0.50 | % | | | 0.35 | %(e) | |
Net investment income (loss) | | | (0.06 | %) | | | (0.17 | %) | | | 0.41 | % | | | (0.17 | %)(e) | |
Supplemental data | |
Net assets, end of period (in thousands) | | $ | 25,871 | | | $ | 21,494 | | | $ | 6,470 | | | $ | 5,156 | | |
Portfolio turnover | | | 254 | % | | | 256 | % | | | 303 | % | | | 76 | % | |
Notes to Financial Highlights
(a) Based on operations from June 19, 2012 (commencement of operations) through the stated period end.
(b) Calculation of the net gain (loss) per share (both realized and unrealized) does not correlate to the aggregate realized and unrealized gain (loss) presented in the Statement of Operations due to the timing of subscriptions and redemptions of Fund shares in relation to fluctuations in the market value of the portfolio.
(c) The Fund received a payment from an affiliate. Had the Fund not received this payment, the total return would have been lower by 0.07%.
(d) In addition to the fees and expenses that the Fund bears directly, the Fund indirectly bears a pro rata share of the fees and expenses of any other funds in which it invests. Such indirect expenses are not included in the Fund's reported expense ratios.
(e) Annualized.
(f) Total net expenses include the impact of certain fee waivers/expense reimbursements made by the Investment Manager and certain of its affiliates, if applicable.
(g) The benefits derived from expense reductions had an impact of less than 0.01%.
The accompanying Notes to Financial Statements are an integral part of this statement.
Annual Report 2016
30
COLUMBIA ADAPTIVE RISK ALLOCATION FUND
NOTES TO FINANCIAL STATEMENTS
May 31, 2016
Note 1. Organization
Columbia Adaptive Risk Allocation Fund (the Fund), a series of Columbia Funds Series Trust I (the Trust), is a non-diversified fund. The Trust is registered under the Investment Company Act of 1940, as amended (the 1940 Act), as an open-end management investment company organized as a Massachusetts business trust.
The Fund invests significantly in Class I shares of affiliated funds managed by Columbia Management Investment Advisers, LLC (the Investment Manager), a wholly-owned subsidiary of Ameriprise Financial, Inc. (Ameriprise Financial), or its affiliates (affiliated underlying funds) as well as third-party advised (unaffiliated) funds, including exchange-traded funds (Underlying Funds).
For information on the Underlying Funds, please refer to the Fund's current prospectus and the prospectuses of the Underlying Funds.
Fund Shares
The Trust may issue an unlimited number of shares (without par value). The Fund offers Class A, Class C, Class K, Class R, Class R4, Class R5, Class W, Class Y and Class Z shares. Although all share classes generally have identical voting, dividend and liquidation rights, each share class votes separately when required by the Trust's organizational documents or by law. Different share classes pay different distribution amounts to the extent the expenses of such share classes differ, and distributions in liquidation will be proportional to the net asset value of each share class. Each share class has its own expense and sales charge structure.
Class A shares are subject to a maximum front-end sales charge of 5.75% based on the initial investment amount. Class A shares purchased without an initial sales charge in accounts aggregating $1 million to $50 million at the time of purchase are subject to a contingent deferred sales charge (CDSC) if the shares are sold within 18 months after purchase, charged as follows: 1.00% CDSC if redeemed within 12 months after purchase, and 0.50% CDSC if redeemed more than 12, but less than 18, months after purchase.
Class C shares are subject to a 1.00% CDSC on shares redeemed within 12 months after purchase.
Class K shares are not subject to sales charges, however this share class is closed to new investors.
Class R shares are not subject to sales charges and are generally available only to certain retirement plans and other investors as described in the Fund's prospectus.
Class R4 shares are not subject to sales charges and are generally available only to omnibus retirement plans and certain investors as described in the Fund's prospectus.
Class R5 shares are not subject to sales charges and are generally available only to investors purchasing through authorized investment professionals and omnibus retirement plans.
Class W shares are not subject to sales charges and are available only to investors purchasing through authorized investment programs managed by investment professionals, including discretionary managed account programs.
Class Y shares are not subject to sales charges and are generally available only to certain retirement plans as described in the Fund's prospectus.
Class Z shares are not subject to sales charges and are available only to eligible investors, which are subject to different investment minimums as described in the Fund's prospectus.
Note 2. Summary of Significant Accounting Policies
Basis of Preparation
The Fund is an investment company that applies the accounting and reporting guidance in the Financial Accounting Standards Board (FASB) Accounting Standards Codification Topic 946, Financial Services — Investment Companies (ASC 946). The financial statements are prepared in accordance with U.S. generally accepted accounting principles (GAAP), which requires management to make certain estimates and assumptions that affect the reported amounts of assets and liabilities, the disclosure of contingent assets and liabilities at the date of the financial statements and the reported amounts of income and expenses during the reporting period. Actual results could differ from those estimates.
The following is a summary of significant accounting policies followed by the Fund in the preparation of its financial statements.
Security Valuation
All equity securities and exchange-traded funds are valued at the close of business of the New York Stock Exchange (NYSE). Equity securities and exchange-traded funds are valued at the last quoted sales price on the principal exchange or market on which they trade, except for securities traded on the NASDAQ Stock Market, which are valued at the NASDAQ official close price. Unlisted securities or listed securities for which there were no
Annual Report 2016
31
COLUMBIA ADAPTIVE RISK ALLOCATION FUND
NOTES TO FINANCIAL STATEMENTS (continued)
May 31, 2016
sales during the day are valued at the mean of the latest quoted bid and ask prices on such exchanges or markets.
Debt securities generally are valued by pricing services approved by the Board of Trustees (the Board) based upon market transactions for normal, institutional-size trading units of similar securities. The services may use various pricing techniques that take into account, as applicable, factors such as yield, quality, coupon rate, maturity, type of issue, trading characteristics and other data, as well as broker quotes. Debt securities for which quotations are not readily available or not believed to be reflective of market value may also be valued based upon a bid quote from an approved independent broker-dealer. Debt securities maturing in 60 days or less are valued primarily at amortized cost value, unless this method results in a valuation that management believes does not approximate market value.
Asset- and mortgage-backed securities are generally valued by pricing services, which utilize pricing models that incorporate the securities' cash flow and loan performance data. These models also take into account available market data, including trades, market quotations, and benchmark yield curves for identical or similar securities. Factors used to identify similar securities may include, but are not limited to, issuer, collateral type, vintage, prepayment speeds, collateral performance, credit ratings, credit enhancement and expected life. Asset-backed securities for which quotations are readily available may also be valued based upon an over-the-counter or exchange bid quote from an approved independent broker-dealer.
Investments in the Underlying Funds are valued at the net asset value of the applicable class of the Underlying Fund determined as of the close of the NYSE on the valuation date.
Forward foreign currency exchange contracts are marked-to-market based upon foreign currency exchange rates provided by a pricing service.
Futures and options on futures contracts are valued based upon the settlement price at the close of regular trading on their principal exchanges or, in the absence of transactions, at the mean of the latest quoted bid and ask prices.
Option contracts are valued at the mean of the latest quoted bid and ask prices on their primary exchanges. Option contracts, including over-the-counter option contracts, with no readily available market quotations are valued using quotes obtained from independent brokers as of the close of the NYSE.
Swap transactions are valued through an independent pricing service or broker, or if neither is available, through an internal model based upon observable inputs.
Investments for which market quotations are not readily available, or that have quotations which management believes are not reflective of market value or reliable, are valued at fair value as determined in good faith under procedures approved by and under the general supervision of the Board. If a security or class of securities (such as foreign securities) is valued at fair value, such value is likely to be different from the quoted or published price for the security.
The determination of fair value often requires significant judgment. To determine fair value, management may use assumptions including but not limited to future cash flows and estimated risk premiums. Multiple inputs from various sources may be used to determine fair value.
GAAP requires disclosure regarding the inputs and valuation techniques used to measure fair value and any changes in valuation inputs or techniques. In addition, investments shall be disclosed by major category. This information is disclosed following the Fund's Portfolio of Investments.
Foreign Currency Transactions and Translations
The values of all assets and liabilities denominated in foreign currencies are generally translated into U.S. dollars at exchange rates determined at the close of the NYSE on any given day. Net realized and unrealized gains (losses) on foreign currency transactions and translations include gains (losses) arising from the fluctuation in exchange rates between trade and settlement dates on securities transactions, gains (losses) arising from the disposition of foreign currency and currency gains (losses) between the accrual and payment dates on dividends, interest income and foreign withholding taxes.
For financial statement purposes, the Fund does not distinguish that portion of gains (losses) on investments which is due to changes in foreign exchange rates from that which is due to changes in market prices of the investments. Such fluctuations are included with the net realized and unrealized gains (losses) on investments in the Statement of Operations.
Derivative Instruments
The Fund invests in certain derivative instruments, as detailed below, to meet its investment objectives. Derivatives are instruments whose values depend on, or are derived from, in whole or in part, the value of one or more securities, currencies, commodities, indices, or
Annual Report 2016
32
COLUMBIA ADAPTIVE RISK ALLOCATION FUND
NOTES TO FINANCIAL STATEMENTS (continued)
May 31, 2016
other assets or instruments. Derivatives may be used to increase investment flexibility (including to maintain cash reserves while maintaining desired exposure to certain assets), for risk management (hedging) purposes, to facilitate trading, to reduce transaction costs and to pursue higher investment returns. The Fund may also use derivative instruments to mitigate certain investment risks, such as foreign currency exchange rate risk, interest rate risk and credit risk. Derivatives may involve various risks, including the potential inability of the counterparty to fulfill its obligation under the terms of the contract, the potential for an illiquid secondary market (making it difficult for the Fund to sell, including at favorable prices) and the potential for market movements which may expose the Fund to gains or losses in excess of the amount shown in the Statement of Assets and Liabilities. The notional amounts of derivative instruments, if applicable, are not recorded in the financial statements.
A derivative instrument may suffer a marked-to-market loss if the value of the contract decreases due to an unfavorable change in the market rates or values of the underlying instrument. Losses can also occur if the counterparty does not perform under the contract. The Fund's risk of loss from counterparty credit risk on over-the-counter derivatives is generally limited to the aggregate unrealized gain netted against any collateral held by the Fund and the amount of any variation margin held by the counterparty. With exchange-traded or centrally cleared derivatives, there is reduced counterparty credit risk to the Fund since the exchange's clearinghouse, as counterparty to such instruments, guarantees against a possible default. The clearinghouse stands between the buyer and the seller of the contract; therefore, the counterparty credit risk is failure of the clearinghouse. However, credit risk still exists in exchange-traded or centrally cleared derivatives with respect to initial and variation margin that is held in a broker's customer account. While brokers are required to segregate customer margin from their own assets, in the event that a broker becomes insolvent or goes into bankruptcy and at that time there is a shortfall in the aggregate amount of margin held by the broker for all its clients, U.S. bankruptcy laws will typically allocate that shortfall on a pro-rata basis across all the broker's customers (including the Fund), potentially resulting in losses to the Fund.
In order to better define its contractual rights and to secure rights that will help the Fund mitigate its counterparty risk, the Fund may enter into an International Swaps and Derivatives Association, Inc.
Master Agreement (ISDA Master Agreement) or similar agreement with its derivatives contract counterparties. An ISDA Master Agreement is an agreement between the Fund and a counterparty that governs over-the-counter derivatives and forward foreign currency exchange contracts and typically contains, among other things, collateral posting terms and netting provisions in the event of a default and/or termination event. Under an ISDA Master Agreement, the Fund may, under certain circumstances, offset with the counterparty certain derivative instrument's payables and/or receivables with collateral held and/or posted and create one single net payment. The provisions of the ISDA Master Agreement typically permit a single net payment in the event of default (close-out netting) including the bankruptcy or insolvency of the counterparty. Note, however, that bankruptcy or insolvency laws of a particular jurisdiction may impose restrictions on or prohibitions against the right of offset in bankruptcy, insolvency or other events.
Collateral (margin) requirements differ by type of derivative. Margin requirements are established by the exchange or clearinghouse for exchange-traded and centrally cleared derivatives. Brokers can ask for margin in excess of the minimum in certain circumstances. Collateral terms are contract specific for over-the-counter derivatives. For over-the-counter derivatives traded under an ISDA Master Agreement, the collateral requirements are typically calculated by netting the marked-to-market amount for each transaction under such agreement and comparing that amount to the value of any variation margin currently pledged by the Fund and/or the counterparty. Generally, the amount of collateral due from or to a party has to exceed a minimum transfer amount threshold (e.g., $500,000) before a transfer has to be made. To the extent amounts due to the Fund from its counterparties are not fully collateralized, contractually or otherwise, the Fund bears the risk of loss from counterparty nonperformance. The Fund attempts to mitigate counterparty risk by only entering into agreements with counterparties that it believes have the financial resources to honor their obligations and by monitoring the financial stability of those counterparties.
Certain ISDA Master Agreements allow counterparties to over-the-counter derivatives transactions to terminate derivatives contracts prior to maturity in the event the Fund's net asset value declines by a stated percentage over a specified time period or if the Fund fails to meet certain terms of the ISDA Master Agreement, which would cause the Fund to accelerate payment of any net liability owed to the counterparty. The Fund also has termination rights if the counterparty fails to meet
Annual Report 2016
33
COLUMBIA ADAPTIVE RISK ALLOCATION FUND
NOTES TO FINANCIAL STATEMENTS (continued)
May 31, 2016
certain terms of the ISDA Master Agreement. In addition to considering counterparty credit risk, the Fund would consider terminating the derivatives contracts based on whether termination would result in a net liability owed from the counterparty.
For financial reporting purposes, the Fund does not offset derivative assets and derivative liabilities that are subject to netting arrangements in the Statement of Assets and Liabilities.
Forward Foreign Currency Exchange Contracts
Forward foreign currency exchange contracts are over-the-counter agreements between two parties to buy and sell a currency at a set price on a future date. The Fund utilized forward foreign currency exchange contracts to hedge the currency exposure associated with some or all of the Fund's securities, to shift foreign currency exposure back to U.S. dollars, to shift U.S. dollar exposure to achieve a representative weighted mix of major currencies in its benchmark and/or to recover an underweight country exposure in its portfolio, and to generate total return through long and short currency positions versus the U.S. dollar. These instruments may be used for other purposes in future periods.
The values of forward foreign currency exchange contracts fluctuate daily with changes in foreign currency exchange rates. Changes in the value of these contracts are recorded as unrealized appreciation or depreciation until the contract is exercised or has expired. The Fund will realize a gain or loss when the forward foreign currency exchange contract is closed or expires.
The use of forward foreign currency exchange contracts does not eliminate fluctuations in the prices of the Fund's portfolio securities. The risks of forward foreign currency exchange contracts include movement in the values of the foreign currencies relative to the U.S. dollar (or other foreign currencies) and the possibility that counterparties will not complete their contractual obligations, which may be in excess of the amount reflected, if any, in the Statement of Assets and Liabilities.
Futures Contracts
Futures contracts are exchange traded and represent commitments for the future purchase or sale of an asset at a specified price on a specified date. The Fund bought and sold futures contracts to manage the duration and yield curve exposure of the Fund versus the benchmark, to manage exposure to movements in interest rates, to manage exposure to the securities market and to maintain appropriate equity market exposure while
keeping sufficient cash to accommodate daily redemptions. These instruments may be used for other purposes in future periods. Upon entering into futures contracts, the Fund bears risks that it may not achieve the anticipated benefits of the futures contracts and may realize a loss. Additional risks include counterparty credit risk, the possibility of an illiquid market, and that a change in the value of the contract or option may not correlate with changes in the value of the underlying asset.
Upon entering into a futures contract, the Fund pledges cash or securities with the broker in an amount sufficient to meet the initial margin requirement. The initial margin deposit must be maintained at an established level over the life of the contract. Cash deposited as initial margin is recorded in the Statement of Assets and Liabilities as margin deposits. Securities deposited as initial margin are designated in the Portfolio of Investments. Subsequent payments (variation margin) are made or received by the Fund each day. The variation margin payments are equal to the daily change in the contract value and are recorded as variation margin receivable or payable and are offset in unrealized gains or losses. The Fund recognizes a realized gain or loss when the contract is closed or expires. Futures contracts involve, to varying degrees, risk of loss in excess of the variation margin disclosed in the Statement of Assets and Liabilities.
Options Contracts
Options are contracts which entitle the holder to purchase or sell securities or other identified assets at a specified price, or in the case of index option contracts, to receive or pay the difference between the index value and the strike price of the index option contract. Option contracts can be either exchange-traded or over-the-counter. The Fund purchased and wrote option contracts to decrease the Fund's exposure to equity market risk and to increase return on investments and to protect gains. These instruments may be used for other purposes in future periods. Completion of transactions for option contracts traded in the over-the-counter market depends upon the performance of the other party. Cash collateral may be collected or posted by the Fund to secure certain over-the-counter option contract trades. Cash collateral held or posted by the Fund for such option contract trades must be returned to the counterparty or the Fund upon closure, exercise or expiration of the contract.
Options contracts purchased are recorded as investments. When the Fund writes an options contract, the premium received is recorded as an asset and an amount equivalent to the premium is recorded as a
Annual Report 2016
34
COLUMBIA ADAPTIVE RISK ALLOCATION FUND
NOTES TO FINANCIAL STATEMENTS (continued)
May 31, 2016
liability in the Statement of Assets and Liabilities and is subsequently adjusted to reflect the current fair value of the option written. Changes in the fair value of the written option are recorded as unrealized appreciation or depreciation until the contract is exercised or has expired. The Fund will realize a gain or loss when the option contract is closed or expires. When option contracts are exercised, the proceeds on sales for a written call or purchased put option contract, or the purchase cost for a written put or purchased call option contract, is adjusted by the amount of premium received or paid.
For over-the-counter options purchased, the Fund bears the risk of loss of the amount of the premiums paid plus the positive change in market values net of any collateral held by the Fund should the counterparty fail to perform under the contracts. Option contracts written by the Fund do not typically give rise to counterparty credit risk, as options written generally obligate the Fund and not the counterparty to perform. The risk in writing a call option contract is that the Fund gives up the opportunity for profit if the market price of the security increases above the strike price and the option contract is exercised. The risk in writing a put option contract is that the Fund may incur a loss if the market price of the security decreases below the strike price and the option contract is exercised. Exercise of a written option could result in the Fund purchasing or selling a security or foreign currency when it otherwise would not, or at a price different from the current market value. In purchasing and writing options, the Fund bears the risk of an unfavorable change in the value of the underlying instrument or the risk that the Fund may not be able to enter into a closing transaction due to an illiquid market.
Contracts and premiums associated with options contracts written for the year ended May 31, 2016 are as follows:
| | Puts | |
| | Contracts | | Premiums ($) | |
Balance at June 1, 2015 | | | — | | | | — | | |
Opened | | | (208 | ) | | | (103,368 | ) | |
Closed | | | 208 | | | | 103,368 | | |
Balance at May 31, 2016 | | | — | | | | — | | |
Swap Contracts
Swap contracts are negotiated in the over-the-counter market and may be entered into as a bilateral contract or centrally cleared (centrally cleared swap contract). In a centrally cleared swap contract, immediately following execution of the swap contract with a broker, the swap
contract is novated to a central counterparty (the CCP) and the CCP becomes the Fund's counterparty to the centrally cleared swap contract. The Fund is required to deposit initial margin with the broker in the form of cash or securities in an amount that varies depending on the size and risk profile of the particular swap contract. Securities deposited as initial margin are designated in the Portfolio of Investments and cash deposited is recorded in the Statement of Assets and Liabilities as margin deposits. Unlike a bilateral swap contract, for centrally cleared swap contracts, the Fund has minimal credit exposure to the counterparty because the CCP stands between the Fund and the counterparty. Swap contracts are marked-to-market daily and changes in value are recorded as unrealized appreciation (depreciation). The daily change in valuation of centrally cleared swap contracts, if any, is recorded as a receivable or payable for variation margin in the Statement of Assets and Liabilities.
Credit Default Swap Contracts
The Fund entered into credit default swap contracts to increase or decrease its credit exposure to an index, and to manage credit risk exposure. Additionally, credit default swap contracts were used to hedge the Fund's exposure on a debt security that it owns or in lieu of selling such debt security. These instruments may be used for other purposes in future periods. Credit default swap contracts are agreements in which one party pays fixed periodic payments to a counterparty in consideration for a guarantee from the counterparty to make a specific payment should a specified credit event(s) take place. Although specified credit events are contract specific, credit events are generally defined as bankruptcy, failure to pay, restructuring, obligation acceleration, obligation default, or repudiation/moratorium.
As the purchaser of a credit default swap contract, the Fund purchases protection by paying a periodic interest rate on the notional amount to the counterparty. The interest amount is accrued daily as a component of unrealized appreciation (depreciation) and is recorded as a realized loss upon payment. If a credit event as specified in the contract occurs, the Fund may have the option either to deliver the reference obligation to the seller in exchange for a cash payment of its par amount, or to receive a net cash settlement equal to the par amount less an agreed-upon value of the reference obligation as of the date of the credit event. The difference between the value of the obligation or cash delivered and the notional amount received will be recorded as a realized gain (loss).
Annual Report 2016
35
COLUMBIA ADAPTIVE RISK ALLOCATION FUND
NOTES TO FINANCIAL STATEMENTS (continued)
May 31, 2016
As the seller of a credit default swap contract, the Fund sells protection to a buyer and will generally receive a periodic interest rate on the notional amount. The interest amount is accrued daily as a component of unrealized appreciation (depreciation) and is recorded as a realized gain upon receipt of the payment. If a credit event as specified in the contract with the counterparty occurs, the Fund may either be required to accept the reference obligation from the buyer in exchange for a cash payment of its notional amount, or to pay the buyer a net cash settlement equal to the notional amount less an agreed-upon value of the reference obligation (recovery value) as of the date of the credit event. The difference between the value of the obligation or cash received and the notional amount paid will be recorded as a realized gain (loss). The maximum potential amount of undiscounted future payments the Fund could be required to make as the seller of protection under a credit default swap contract is equal to the notional amount of the reference obligation. These potential amounts may be partially offset by any recovery values of the respective reference obligations or premiums received upon entering into the agreement. The notional amounts and market values of all credit default swap contracts in which the Fund is the seller of protection, if any, are disclosed in the Credit Default Swap Contracts Outstanding schedule following the Portfolio of Investments.
As a protection seller, the Fund bears the risk of loss from the credit events specified in the contract with the counterparty. For credit default swap contracts on credit indices, quoted market prices and resulting market values serve as an indicator of the current status of the payment/performance risk. Increasing market values, in absolute terms when compared to the notional amount of the swap, represent a deterioration of the reference entity's credit soundness and a greater likelihood or risk of default or other credit event occurring as defined under the terms of the contract.
Any premium paid or received by the Fund upon entering into a credit default swap contract is recorded as an asset or liability, respectively, and amortized daily as a component of realized gain (loss) in the Statement of Operations. Credit default swap contracts are valued daily, and the change in value is recorded as unrealized appreciation (depreciation) until the termination of the swap, at which time a realized gain (loss) is recorded.
Credit default swap contracts can involve greater risks than if a fund had invested in the reference obligation directly since, in addition to general market risks, credit default swaps are subject to counterparty credit risk, leverage risk, hedging risk, correlation risk and liquidity
risk. The Fund will enter into credit default swap transactions only with counterparties that meet certain standards of creditworthiness, as determined by the Investment Manager.
Interest Rate Swap Contracts
The Fund entered into interest rate swap transactions to manage interest rate market risk exposure to produce incremental earnings, to gain exposure to or protect itself from market rate changes and to synthetically add or subtract principal exposure to a market. These instruments may be used for other purposes in future periods. Interest rate swaps are agreements between two parties that involve the exchange of one type of interest rate for another type of interest rate cash flow on specified dates in the future, based on a predetermined, specified notional amount. Certain interest rate swaps are considered forward-starting, whereby the accrual for the exchange of cash flows does not begin until a specified date in the future (the effective date). The net cash flow for a standard interest rate swap transaction is generally the difference between a floating market interest rate versus a fixed interest rate.
Interest rate swaps are valued daily and unrealized appreciation (depreciation) is recorded. Certain interest rate swaps may accrue periodic interest on a daily basis as a component of unrealized appreciation (depreciation); the Fund will realize a gain or loss upon the payment or receipt of accrued interest. The Fund will realize a gain or a loss when the interest rate swap is terminated.
Risks of entering into interest rate swaps include a lack of correlation between the swaps and the portfolio of bonds the swaps are designed to hedge or replicate. A lack of correlation may cause the interest rate swaps to experience adverse changes in value relative to expectations. In addition, interest rate swaps are subject to the risk of default of a counterparty, and the risk of adverse movements in market interest rates relative to the interest rate swap positions taken. The Fund's maximum risk of loss from counterparty credit risk is the discounted net value of the cash flows to be received from/paid to the counterparty over the contract's remaining life to the extent that such amount is positive, plus the cost of entering into a similar transaction with another counterparty.
The Fund attempts to mitigate counterparty credit risk by entering into interest rate swap transactions only with counterparties that meet prescribed levels of creditworthiness, as determined by the Investment Manager. The Fund and any counterparty are required to maintain an agreement that requires the Fund and that
Annual Report 2016
36
COLUMBIA ADAPTIVE RISK ALLOCATION FUND
NOTES TO FINANCIAL STATEMENTS (continued)
May 31, 2016
counterparty to monitor (on a daily basis) the net market value of all derivative transactions entered into pursuant to the agreement between the Fund and such counterparty. If the net market value of such derivatives transactions between the Fund and that counterparty exceeds a certain threshold (as defined in the agreement), the Fund or the counterparty is required to post cash and/or securities as collateral. Market values of derivatives transactions presented in the financial statements are not netted with the market values of other derivatives transactions or with any collateral amounts posted by the Fund or any counterparty.
Total Return Swap Contracts
The Fund entered into total return swap contracts to manage long or short exposure to the total return on a specified reference security in return for periodic payments based on a fixed or variable interest rate. These instruments may be used for other purposes in future periods. Total return swap contracts may be used to obtain exposure to an underlying reference security, instrument, or other asset or index or market without owning, taking physical custody of, or short selling any such security, instrument or asset in a market.
Total return swap contracts are valued daily, and the change in value is recorded as unrealized appreciation (depreciation) until the termination of the swap, at which time the Fund will realize a gain (loss). Periodic payments received (or made) by the Fund over the term of the contract are recorded as realized gains (losses).
Total return swap contracts may be subject to liquidity risk, which exists when a particular swap contract is difficult to purchase or sell. It may not be possible for the Fund to initiate a transaction or liquidate a position at an advantageous time or price, which may result in significant losses. Total return swap contracts are subject to the risk associated with the investment in the underlying reference security, instrument or asset. The risk in the case of short total return swap contracts is unlimited based on the potential for unlimited increases in the market value of the underlying reference security, instrument or asset. This risk may be offset if the Fund holds any of the underlying reference security, instrument or asset. The risk in the case of long total return swap contracts is limited to the current notional amount of the total return swap contract.
Total return swap contracts are also subject to the risk of the counterparty not fulfilling its obligations under the contract (counterparty credit risk). The Fund attempts to mitigate counterparty credit risk by entering into total return swap contracts only with counterparties that meet
prescribed levels of creditworthiness, as determined by the Investment Manager.
Effects of Derivative Transactions in the Financial Statements
The following tables are intended to provide additional information about the effect of derivatives on the financial statements of the Fund, including: the fair value of derivatives by risk category and the location of those fair values in the Statement of Assets and Liabilities; and the impact of derivative transactions over the period in the Statement of Operations, including realized and unrealized gains (losses). The derivative instrument schedules following the Portfolio of Investments present additional information regarding derivative instruments outstanding at the end of the period, if any.
The following table is a summary of the fair value of derivative instruments (not considered to be hedging instruments for accounting disclosure purposes) at May 31, 2016:
Asset Derivatives | |
Risk Exposure
Category | | Statement of Assets and
Liabilities Location | | Fair Value ($) | |
Equity risk
| | Net assets — unrealized
appreciation on
futures contracts | | | 5,485,761
| * | |
Equity risk
| | Net assets — unrealized
appreciation on swap
contracts | | | 2,292,503
| * | |
Foreign exchange
risk
| | Unrealized appreciation on
forward foreign currency
exchange contracts | | | 1,773,700
| | |
Interest rate risk
| | Net assets — unrealized
appreciation on futures
contracts | | | 228,800
| * | |
Total | | | | | 9,780,764 | | |
Liability Derivatives | |
Risk Exposure
Category | | Statement of Assets and
Liabilities Location | | Fair Value ($) | |
Equity risk
| | Net assets — unrealized
depreciation on futures
contracts | | | 327,846
| * | |
Foreign exchange
risk
| | Unrealized depreciation on
forward foreign currency
exchange contracts | | | 1,442,020
| | |
Interest rate risk
| | Net assets — unrealized
depreciation on futures
contracts | | | 16,644
| * | |
Total | | | | | 1,786,510 | | |
*Includes cumulative appreciation (depreciation) as reported in the tables following the Portfolio of Investments. Only the current day's variation margin is reported in receivables or payables in the Statement of Assets and Liabilities.
Annual Report 2016
37
COLUMBIA ADAPTIVE RISK ALLOCATION FUND
NOTES TO FINANCIAL STATEMENTS (continued)
May 31, 2016
The following table indicates the effect of derivative instruments (not considered to be hedging instruments for accounting disclosure purposes) in the Statement of Operations for the year ended May 31, 2016:
Amount of Realized Gain (Loss) on Derivatives Recognized in Income | |
Risk Exposure Category | | Forward Foreign
Currency Exchange
Contracts ($) | | Futures
Contracts ($) | | Options Contracts
Written ($) | | Options Contracts
Purchased ($) | | Swap
Contracts ($) | | Total ($) | |
Credit risk | | | — | | | | — | | | | — | | | | — | | | | (539,472 | ) | | | (539,472 | ) | |
Equity risk | | | — | | | | (9,396,236 | ) | | | 1,439 | | | | (314,712 | ) | | | 2,142,267 | | | | (7,567,242 | ) | |
Foreign exchange risk | | | (2,094,723 | ) | | | (113 | ) | | | — | | | | — | | | | — | | | | (2,094,836 | ) | |
Interest rate risk | | | — | | | | 5,311,070 | | | | — | | | | — | | | | 798,204 | | | | 6,109,274 | | |
Total | | | (2,094,723 | ) | | | (4,085,279 | ) | | | 1,439 | | | | (314,712 | ) | | | 2,400,999 | | | | (4,092,276 | ) | |
Change in Unrealized Appreciation (Depreciation) on Derivatives Recognized in Income | |
Risk Exposure Category | | Forward Foreign
Currency Exchange
Contracts ($) | | Futures
Contracts ($) | | Swap
Contracts ($) | | Total ($) | |
Credit risk | | | — | | | | — | | | | (957,089 | ) | | | (957,089 | ) | |
Equity risk | | | — | | | | 572,287 | | | | 2,292,503 | | | | 2,864,790 | | |
Foreign exchange risk | | | 383,112 | | | | — | | | | — | | | | 383,112 | | |
Interest rate risk | | | — | | | | 218,103 | | | | (636,957 | ) | | | (418,854 | ) | |
Other | | | — | | | | — | | | | — | | | | — | | |
Total | | | 383,112 | | | | 790,390 | | | | 698,457 | | | | 1,871,959 | | |
The following table provides a summary of the average outstanding volume by derivative instrument for the year ended May 31, 2016:
Derivative Instrument | | Average Notional
Amounts ($)* | |
Futures contracts — Long | | | 301,350,131 | | |
Futures contracts — Short | | | 21,031,139 | | |
Credit default swap contracts — sell protection | | | 34,937,500 | | |
| Derivative Instrument | | Average Market
Value ($)** | |
Options contracts — Purchased | | | 8,783 | | |
Options contracts — Written | | | — | | |
Derivative Instrument | | Average Unrealized
Appreciation ($)* | | Average Unrealized
Depreciation ($)* | |
Forward foreign currency
exchange contracts | | | 1,232,487 | | | | (471,383 | ) | |
Interest rate swap contracts | | | 167,836 | | | | — | | |
Total return swap contracts | | | 914,012 | | | | (608,316 | ) | |
*Based on the ending quarterly outstanding amounts for the year ended May 31, 2016.
**Based on the ending daily outstanding amounts for the year ended May 31, 2016.
Asset- and Mortgage-Backed Securities
The Fund may invest in asset-backed and mortgage-backed securities. The maturity dates shown represent the original maturity of the underlying obligation. Actual maturity may vary based upon prepayment activity on
these obligations. All, or a portion, of the obligation may be prepaid at any time because the underlying asset may be prepaid. As a result, decreasing market interest rates could result in an increased level of prepayment. An increased prepayment rate will have the effect of shortening the maturity of the security. Unless otherwise noted, the coupon rates presented are fixed rates.
Delayed Delivery Securities
The Fund may trade securities on other than normal settlement terms, including securities purchased or sold on a "when-issued" basis. This may increase risk to the Fund since the other party to the transaction may fail to deliver, which could cause the Fund to subsequently invest at less advantageous prices. The Fund designates cash or liquid securities in an amount equal to the delayed delivery commitment.
To Be Announced Securities
The Fund may trade securities on a To Be Announced (TBA) basis. As with other delayed-delivery transactions, a seller agrees to issue a TBA security at a future date. However, the seller does not specify the particular securities to be delivered. Instead, the Fund agrees to accept any security that meets specified terms.
In some cases, Master Securities Forward Transaction Agreements (MSFTAs) may be used to govern transactions of certain forward-settling agency mortgage-backed securities, such as delayed-delivery and TBAs,
Annual Report 2016
38
COLUMBIA ADAPTIVE RISK ALLOCATION FUND
NOTES TO FINANCIAL STATEMENTS (continued)
May 31, 2016
between the Fund and counterparty. The MSFTA maintains provisions for, among other things, initiation and confirmation, payment and transfer, events of default, termination, and maintenance of collateral relating to such transactions.
Mortgage Dollar Roll Transactions
The Fund may enter into mortgage "dollar rolls" in which the Fund sells securities for delivery in the current month and simultaneously contracts with the same counterparty to repurchase similar but not identical securities (same type, coupon and maturity) on a specified future date. During the roll period, the Fund loses the right to receive principal and interest paid on the securities sold. However, the Fund will benefit because it receives negotiated amounts in the form of reductions of the purchase price for the future purchase plus the interest earned on the cash proceeds of the securities sold until the settlement date of the forward purchase. The Fund records the incremental difference between the forward purchase and sale of each forward roll as a realized gain or loss. Unless any realized gains exceed the income, capital appreciation, and gain or loss due to mortgage prepayments that would have been realized on the securities sold as part of the mortgage dollar roll, the use of this technique will diminish the investment performance of the Fund compared to what
the performance would have been without the use of mortgage dollar rolls. All cash proceeds will be invested in instruments that are permissible investments for the Fund. The Fund identifies cash or liquid securities in an amount equal to the forward purchase price.
For financial reporting and tax purposes, the Fund treats "to be announced" mortgage dollar rolls as two separate transactions, one involving the purchase of a security and a separate transaction involving a sale. These transactions may increase the Fund's portfolio turnover rate. The Fund does not currently enter into mortgage dollar rolls that are accounted for as financing transactions.
Mortgage dollar rolls involve the risk that the market value of the securities the Fund is obligated to repurchase may decline below the repurchase price, or that the counterparty may default on its obligations.
Treasury Inflation Protected Securities
The Fund may invest in treasury inflation protected securities (TIPS). The principal amount of TIPS is adjusted periodically and is increased for inflation or decreased for deflation based on a monthly published index. These adjustments are recorded as interest income in the Statement of Operations. Coupon payments are based on the adjusted principal at the time the interest is paid.
Offsetting of Assets and Liabilities
The following table presents the Fund's gross and net amount of assets and liabilities available for offset under netting arrangements as well as any related collateral received or pledged by the Fund as of May 31, 2016:
| | | Barclays
($) | | Citi
($) | | Credit
Suisse
($) | | HSBC
($) | | JPMorgan
($) | | Morgan
Stanley
($) | | Standard
Chartered
($) | | UBS
($) | | Total
($) | |
Assets | |
Forward foreign currency
exchange contracts | | | 1,194,403 | | | | 284,928 | | | | 10,970 | | | | 6,123 | | | | — | | | | — | | | | 238,326 | | | | 38,950 | | | | 1,773,700 | | |
OTC total return swap
contracts(a) | | | — | | | | 1,976,399 | | | | — | | | | — | | | | 9,053 | | | | 307,051 | | | | — | | | | — | | | | 2,292,503 | | |
Total Assets | | | 1,194,403 | | | | 2,261,327 | | | | 10,970 | | | | 6,123 | | | | 9,053 | | | | 307,051 | | | | 238,326 | | | | 38,950 | | | | 4,066,203 | | |
Liabilities | |
Forward foreign currency
exchange contracts | | | 594,343 | | | | 650,556 | | | | 48,932 | | | | — | | | | — | | | | — | | | | 90,269 | | | | 57,920 | | | | 1,442,020 | | |
Total Financial and
Derivative Net Assets | | | 600,060 | | | | 1,610,771 | | | | (37,962 | ) | | | 6,123 | | | | 9,053 | | | | 307,051 | | | | 148,057 | | | | (18,970 | ) | | | 2,624,183 | | |
Total collateral received
(pledged)(b) | | | — | | | | 1,610,771 | | | | — | | | | — | | | | — | | | | 135,000 | | | | — | | | | — | | | | 1,745,771 | | |
Net Amount(c) | | | 600,060 | | | | — | | | | (37,962 | ) | | | 6,123 | | | | 9,053 | | | | 172,051 | | | | 148,057 | | | | (18,970 | ) | | | 878,412 | | |
(a) Over-the-Counter Swap Contracts are presented at market value plus periodic payments receivable (payable), which is comprised of unrealized appreciation, unrealized depreciation, premiums paid and premiums received.
(b) In some instances, the actual collateral received and/or pledged may be more than the amount shown due to overcollateralization.
(c) Represents the net amount due from/(to) counterparties in the event of default.
Annual Report 2016
39
COLUMBIA ADAPTIVE RISK ALLOCATION FUND
NOTES TO FINANCIAL STATEMENTS (continued)
May 31, 2016
Security Transactions
Security transactions are accounted for on the trade date. Cost is determined and gains (losses) are based upon the specific identification method for both financial statement and federal income tax purposes.
Income Recognition
Interest income is recorded on an accrual basis. Market premiums and discounts, including original issue discounts, are amortized and accreted, respectively, over the expected life of the security on all debt securities, unless otherwise noted. The Fund classifies gains and losses realized on prepayments received on mortgage-backed securities as adjustments to interest income.
The Fund may place a debt security on non-accrual status and reduce related interest income when it becomes probable that the interest will not be collected and the amount of uncollectible interest can be reasonably estimated. A defaulted debt security is removed from non-accrual status when the issuer resumes interest payments or when collectibility of interest is reasonably assured.
Income and capital gain distributions from the Underlying Funds, if any, are recorded on the ex-dividend date.
Expenses
General expenses of the Trust are allocated to the Fund and other funds of the Trust based upon relative net assets or other expense allocation methodologies determined by the nature of the expense. Expenses directly attributable to the Fund are charged to the Fund. Expenses directly attributable to a specific class of shares are charged to that share class.
Determination of Class Net Asset Value
All income, expenses (other than class-specific expenses, which are charged to that share class, as shown in the Statement of Operations) and realized and unrealized gains (losses) are allocated to each class of the Fund on a daily basis, based on the relative net assets of each class, for purposes of determining the net asset value of each class.
Federal Income Tax Status
The Fund intends to qualify each year as a regulated investment company under Subchapter M of the Internal Revenue Code, as amended, and will distribute substantially all of its taxable income (including net short-term capital gains), if any, for its tax year, and as such will not be subject to federal income taxes. In
addition, the Fund intends to distribute in each calendar year substantially all of its net investment income, capital gains and certain other amounts, if any, such that the Fund should not be subject to federal excise tax. Therefore, no federal income or excise tax provision is recorded.
Foreign Taxes
The Fund may be subject to foreign taxes on income, gains on investments or currency repatriation, a portion of which may be recoverable. The Fund will accrue such taxes and recoveries, as applicable, based upon its current interpretation of tax rules and regulations that exist in the markets in which it invests.
Realized gains in certain countries may be subject to foreign taxes at the Fund level, based on statutory rates. The Fund accrues for such foreign taxes on realized and unrealized gains at the appropriate rate for each jurisdiction, as applicable. The amount, if any, is disclosed as a liability on the Statement of Assets and Liabilities.
Distributions to Shareholders
Distributions from net investment income, if any, are declared and paid annually. Net realized capital gains, if any, are distributed along with the income distribution. Income distributions and capital gain distributions are determined in accordance with federal income tax regulations, which may differ from GAAP.
Guarantees and Indemnifications
Under the Trust's organizational documents and, in some cases, by contract, its officers and trustees are indemnified against certain liabilities arising out of the performance of their duties to the Trust or its funds. In addition, certain of the Fund's contracts with its service providers contain general indemnification clauses. The Fund's maximum exposure under these arrangements is unknown since the amount of any future claims that may be made against the Fund cannot be determined, and the Fund has no historical basis for predicting the likelihood of any such claims.
Note 3. Fees and Other Transactions with Affiliates
Management Fees
Effective October 1, 2015, the Fund entered into a Management Agreement with the Investment Manager. Under the Management Agreement, the Investment Manager provides the Fund with investment research and
Annual Report 2016
40
COLUMBIA ADAPTIVE RISK ALLOCATION FUND
NOTES TO FINANCIAL STATEMENTS (continued)
May 31, 2016
advice, as well as administrative and accounting services. The management services fee is an annual fee that is a blend of (i) a fee that declines from 0.06% to 0.03%, depending on asset levels, on assets invested in affiliated mutual funds, exchange-traded funds and closed-end funds that pay an investment advisory fee to the Investment Manager, (ii) a fee that declines from 0.16% to 0.13%, depending on asset levels, on assets invested in exchange-traded funds and mutual funds that are not managed by the Investment Manager or its affiliates and (iii) a fee that declines from 0.76% to 0.63%, depending on asset levels, on assets invested in securities, instruments and other assets not described above, including affiliated mutual funds, exchange-traded funds and closed-end funds advised by the Investment Manager that do not pay an investment advisory fee, third party closed-end funds, derivatives and individual securities. The effective management services fee rate for the year ended May 31, 2016 was 0.65% of the Fund's average daily net assets.
In addition to the fees and expenses which the Fund bears directly, the Fund indirectly bears a pro rata share of the fees and expenses of the Underlying Funds (also referred to as "acquired funds") in which the Fund invests. Because the Underlying Funds have varied expense and fee levels and the Fund may own different proportions of Underlying Funds at different times, the amount of fees and expenses incurred indirectly by the Fund will vary.
Prior to October 1, 2015, the Fund paid the Investment Manager an annual fee for advisory services under an Investment Management Services Agreement and a separate annual fee for administrative and accounting services under an Administrative Services Agreement. For the period from June 1, 2015 through September 30, 2015, the investment advisory services fee paid to the Investment Manager was $869,670, and the administrative services fee paid to the Investment Manager was $88,584.
Participating Affiliates
The Investment Manager and its investment advisory affiliates (Participating Affiliates) around the world may coordinate in providing services to their clients. Such coordination may include functional leadership of the business (the "Global" business). From time to time the Investment Manager (or any affiliated investment subadviser to the Fund, as the case may be) may engage its Participating Affiliates to provide a variety of services such as investment research, investment monitoring,
trading and discretionary investment management (including portfolio management) to certain accounts managed by the Investment Manager, including the Fund. These Participating Affiliates will provide services to the Investment Manager (or any affiliated investment subadviser to the Fund as the case may be) either pursuant to subadvisory agreements, personnel-sharing agreements or similar inter-company arrangements and the Fund will pay no additional fees and expenses as a result of any such arrangements.
These Participating Affiliates, like the Investment Manager, are direct or indirect subsidiaries of Ameriprise Financial and are registered with appropriate respective regulators in their home jurisdictions and, where required, the Securities and Exchange Commission and the Commodity Futures Trading Commission in the United States.
Pursuant to some of these arrangements, certain employees of these Participating Affiliates may serve as "associated persons" of the Investment Manager and, in this capacity, subject to the oversight and supervision of the Investment Manager and consistent with the investment objectives, policies and limitations set forth in the Fund's prospectus and Statement of Additional Information (SAI), may provide such services to the Fund on behalf of the Investment Manager.
Compensation of Board Members
Board members, who are not officers or employees of the Investment Manager or Ameriprise Financial, are compensated for their services to the Fund as disclosed in the Statement of Operations. These Board members may participate in a Deferred Compensation Plan (the Plan) which may be terminated at any time. Obligations of the Plan will be paid solely out of the Fund's assets, and all amounts payable under the Plan constitute a general unsecured obligation of the Fund.
Compensation of Chief Compliance Officer
The Board has appointed a Chief Compliance Officer to the Fund in accordance with federal securities regulations. The Fund is allocated a portion of the expenses associated with the Chief Compliance Officer based on relative net assets of the Trust.
Transfer Agency Fees
Under a Transfer and Dividend Disbursing Agent Agreement, Columbia Management Investment Services Corp. (the Transfer Agent), an affiliate of the Investment Manager and a wholly-owned subsidiary of Ameriprise Financial, is responsible for providing transfer agency
Annual Report 2016
41
COLUMBIA ADAPTIVE RISK ALLOCATION FUND
NOTES TO FINANCIAL STATEMENTS (continued)
May 31, 2016
services to the Fund. The Transfer Agent has contracted with Boston Financial Data Services (BFDS) to serve as sub-transfer agent.
The Transfer Agent receives a monthly transfer agency fee based on the number or the average value of accounts, depending on the type of account. In addition, the Transfer Agent also receives sub-transfer agency fees based on a percentage of the average aggregate value of the Fund's shares maintained in omnibus accounts (other than omnibus accounts for which American Enterprise Investment Services Inc. is the broker of record or accounts where the beneficial shareholder is a customer of Ameriprise Financial Services, Inc., for which the Transfer Agent receives a per account fee). The Transfer Agent pays the fees of BFDS for services as sub-transfer agent and is not entitled to reimbursement for such fees from the Fund (with the exception of out-of-pocket fees).
The Transfer Agent also receives compensation from the Fund for various shareholder services and reimbursements for certain out-of-pocket fees. Total transfer agency fees for Class K and Class R5 shares are subject to an annual limitation of not more than 0.05% of the average daily net assets attributable to each share class. Class Y shares do not pay transfer agency fees.
For the year ended May 31, 2016, the Fund's effective transfer agency fee rates as a percentage of average daily net assets of each class were as follows:
Class A | | | 0.16 | % | |
Class C | | | 0.16 | | |
Class K | | | 0.05 | | |
Class R | | | 0.14 | | |
Class R4 | | | 0.16 | | |
Class R5 | | | 0.05 | | |
Class W | | | 0.15 | | |
Class Z | | | 0.15 | | |
An annual minimum account balance fee of $20 may apply to certain accounts with a value below the applicable share class's initial minimum investment requirements to reduce the impact of small accounts on transfer agency fees. These minimum account balance fees are remitted to the Fund and recorded as part of expense reductions in the Statement of Operations. For the year ended May 31, 2016, these minimum account balance fees reduced total expenses of the Fund by $40.
Plan Administration Fees
Under a Plan Administration Services Agreement with the Transfer Agent, the Fund pays an annual fee at a rate of 0.25% of the Fund's average daily net assets attributable to Class K shares for the provision of various administrative, recordkeeping, communication and educational services.
Distribution and Service Fees
The Fund has an agreement with Columbia Management Investment Distributors, Inc. (the Distributor), an affiliate of the Investment Manager and a wholly-owned subsidiary of Ameriprise Financial, for distribution and shareholder services. The Board has approved, and the Fund has adopted, distribution and shareholder service plans (the Plans) applicable to certain share classes, which set the distribution and service fees for the Fund. These fees are calculated daily and are intended to compensate the Distributor and/or eligible selling and/or servicing agents for selling shares of the Fund and providing services to investors.
Under the Plans, the Fund pays a monthly service fee to the Distributor at the maximum annual rate of 0.25% of the average daily net assets attributable to Class A, Class C and Class W shares of the Fund. Also under the Plans, the Fund pays a monthly distribution fee to the Distributor at the maximum annual rates of 0.10%, 0.75%, 0.50% and 0.25% of the average daily net assets attributable to Class A, Class C, Class R and Class W shares of the Fund, respectively.
Although the Fund may pay distribution and service fees up to a maximum annual rate of 0.35% of the Fund's average daily net assets attributable to Class A shares (comprised of up to 0.10% for distribution services and up to 0.25% for shareholder liaison services), the Fund currently limits such fees to an aggregate fee of not more than 0.25% of the Fund's average daily net assets attributable to Class A shares.
Although the Fund may pay a distribution fee up to 0.25% of the Fund's average daily net assets attributable to Class W shares and a service fee of up to 0.25% of the Fund's average daily net assets attributable to Class W shares, the aggregate fee shall not exceed 0.25% of the Fund's average daily net assets attributable to Class W shares.
Sales Charges
Sales charges, including front-end charges and CDSCs, received by the Distributor for distributing Fund shares were $342,472 for Class A, and $26,451 for Class C shares for the year ended May 31, 2016.
Annual Report 2016
42
COLUMBIA ADAPTIVE RISK ALLOCATION FUND
NOTES TO FINANCIAL STATEMENTS (continued)
May 31, 2016
Expenses Waived/Reimbursed by the Investment Manager and its Affiliates
The Investment Manager and certain of its affiliates have contractually agreed to waive fees and/or reimburse expenses (excluding certain fees and expenses described below) for the period disclosed below, so that the Fund's net operating expenses, including indirect expenses of the Underlying Funds, after giving effect to fees waived/expenses reimbursed and any balance credits and/or overdraft charges from the Fund's custodian, do not exceed the following annual rates as a percentage of the class' average daily net assets:
| | | October 1, 2015
through
September 30, 2016 | | Prior to
October 1, 2015 | |
Class A | | | 1.24 | % | | | 1.16 | % | |
Class C | | | 1.99 | | | | 1.91 | | |
Class K | | | 1.17 | | | | 1.04 | | |
Class R | | | 1.49 | | | | 1.41 | | |
Class R4 | | | 0.99 | | | | 0.91 | | |
Class R5 | | | 0.92 | | | | 0.79 | | |
Class W | | | 1.24 | | | | 1.16 | | |
Class Y | | | 0.87 | | | | 0.74 | | |
Class Z | | | 0.99 | | | | 0.91 | | |
Under the agreement governing these fee waivers and/or expense reimbursement arrangements, the following fees and expenses are excluded from the waiver/reimbursement commitment, and therefore will be paid by the Fund, if applicable: taxes (including foreign transaction taxes), transaction costs and brokerage commissions, costs related to any securities lending program, dividend and interest expenses associated with securities sold short, inverse floater program fees and expenses, transaction charges and interest on borrowed money, interest, extraordinary expenses and any other expenses the exclusion of which is specifically approved by the Board. This agreement may be modified or amended only with approval from the Investment Manager, certain of its affiliates and the Fund. Any fees waived and/or expenses reimbursed under the expense reimbursement arrangements described above are not recoverable by the Investment Manager or its affiliates in future periods.
Note 4. Federal Tax Information
The timing and character of income and capital gain distributions are determined in accordance with income tax regulations, which may differ from GAAP because of temporary or permanent book to tax differences.
At May 31, 2016, these differences are primarily due to differing treatment for capital loss carryforwards, deferral/reversal of wash sale losses, Trustees' deferred compensation, distribution reclassifications, foreign currency transactions, investments in partnerships, derivative investments, swap investments, TIPS investments and tax straddles. To the extent these differences are permanent, reclassifications are made among the components of the Fund's net assets in the Statement of Assets and Liabilities. Temporary differences do not require reclassifications.
In the Statement of Assets and Liabilities the following reclassifications were made:
Excess of distributions over net investment income | | $ | 1,436,283 | | |
Accumulated net realized loss | | | (1,517,981 | ) | |
Paid-in capital | | | 81,698 | | |
Net investment income (loss) and net realized gains (losses), as disclosed in the Statement of Operations, and net assets were not affected by this reclassification.
The tax character of distributions paid during the years indicated was as follows:
Year Ended May 31, | | 2016 | | 2015 | |
Ordinary income | | $ | 690,550 | | | $ | 1,918,527 | | |
Long-term capital gains | | | 3,646,994 | | | | 2,099,166 | | |
Total | | $ | 4,337,544 | | | $ | 4,017,693 | | |
Short-term capital gain distributions, if any, are considered ordinary income distributions for tax purposes.
At May 31, 2016, the components of distributable earnings on a tax basis were as follows:
Undistributed ordinary income | | $ | 4,002,064 | | |
Capital loss carryforwards | | | (4,118,122 | ) | |
Net unrealized appreciation | | | 353,888 | | |
At May 31, 2016, the cost of investments for federal income tax purposes was $562,479,087 and the aggregate gross unrealized appreciation and depreciation based on that cost was:
Unrealized appreciation | | $ | 2,031,892 | | |
Unrealized depreciation | | | (1,678,004 | ) | |
Net unrealized appreciation | | $ | 353,888 | | |
The following capital loss carryforwards, determined at May 31, 2016, may be available to reduce taxable income arising from future net realized gains on
Annual Report 2016
43
COLUMBIA ADAPTIVE RISK ALLOCATION FUND
NOTES TO FINANCIAL STATEMENTS (continued)
May 31, 2016
investments, if any, to the extent permitted by the Internal Revenue Code:
Year of Expiration | | Amount ($) | |
No expiration — short-term | | | 4,118,122 | | |
Total | | | 4,118,122 | | |
Capital loss carryforwards with no expiration are required to be utilized prior to any capital losses which carry an expiration date. As a result of this ordering rule, capital loss carryforwards which carry an expiration date may be more likely to expire unused.
Management of the Fund has concluded that there are no significant uncertain tax positions in the Fund that would require recognition in the financial statements. However, management's conclusion may be subject to review and adjustment at a later date based on factors including, but not limited to, new tax laws, regulations, and administrative interpretations (including relevant court decisions). Generally, the Fund's federal tax returns for the prior three fiscal years remain subject to examination by the Internal Revenue Service.
Note 5. Portfolio Information
The cost of purchases and proceeds from sales of securities, excluding short-term investments and derivatives, if any, aggregated to $680,601,221 and $665,118,881, respectively, for the year ended May 31, 2016, of which $462,498,093 and $474,331,781, respectively, were U.S. government securities. The amount of purchase and sale activity impacts the portfolio turnover rate reported in the Financial Highlights.
Note 6. Affiliated Money Market Fund
The Fund significantly invests in Columbia Short-Term Cash Fund, an affiliated money market fund established for the exclusive use by the Fund and other affiliated funds. The income earned by the Fund from such investments is included as Dividends — affiliated issuers in the Statement of Operations. As an investing fund, the Fund indirectly bears its proportionate share of the expenses of Columbia Short-Term Cash Fund.
Note 7. Line of Credit
The Fund has access to a revolving credit facility whereby the Fund may borrow for the temporary funding of shareholder redemptions or for other temporary or emergency purposes. Effective December 8, 2015, Citibank, N.A. and HSBC Bank USA, N.A. joined JPMorgan Chase Bank, N.A. (JPMorgan) as lead of a syndicate of banks under the credit facility, which is a collective
agreement between the Fund and certain other funds managed by the Investment Manager, severally and not jointly, that permits collective borrowings up to $1 billion. Interest is charged to each participating fund based on its borrowings at a rate equal to the higher of (i) the overnight federal funds rate plus 1.00% or (ii) the one-month LIBOR rate plus 1.00%. Each borrowing under the credit facility matures no later than 60 days after the date of borrowing. The Fund also pays a commitment fee equal to its pro rata share of the amount of the credit facility at a rate of 0.15% per annum. The commitment fee is included in other expenses in the Statement of Operations. Prior to December 8, 2015, JPMorgan was the sole lead bank under the credit facility agreement that permitted borrowings up to $550 million under the same terms and interest rates as described above with the exception of the commitment fee which was charged at a rate of 0.075% per annum.
The Fund had no borrowings during the year ended May 31, 2016.
Note 8. Significant Risks
Shareholder Concentration Risk
At May 31, 2016, affiliated shareholder of record owned 90.2% of the outstanding shares of the Fund in one or more accounts. The Fund has no knowledge about whether any portion of those shares was owned beneficially. Subscription and redemption activity by concentrated accounts may have a significant effect on the operations of the Fund. In the case of a large redemption, the Fund may be forced to sell investments at inopportune times, including its liquid or more liquid positions, resulting in Fund losses and the Fund holding a higher percentage of less liquid or illiquid securities. Large redemptions could result in decreased economies of scale and increased operating expenses for non-redeeming Fund shareholders.
Commodity-related Investment Risk
The value of commodities investments will generally be affected by overall market movements and factors specific to a particular industry or commodity, which may include demand for the commodity, weather, embargoes, tariffs, and economic health, political, international, regulatory and other developments. Exposure to commodities and commodities markets may subject the value of the Fund's investments to greater volatility than other types of investments. Commodities investments may also subject the Fund to counterparty risk and liquidity risk. The Fund may make commodity-related investments through one or more wholly-owned
Annual Report 2016
44
COLUMBIA ADAPTIVE RISK ALLOCATION FUND
NOTES TO FINANCIAL STATEMENTS (continued)
May 31, 2016
subsidiaries organized outside the U.S. that are generally not subject to U.S. laws (including securities laws) and their protections.
Derivatives Risk
Losses involving derivative instruments may be substantial, because a relatively small price movement in the underlying security(ies), commodity, currency or index or other instrument or asset may result in a substantial loss for the Fund. In addition to the potential for increased losses, the use of derivative instruments may lead to increased volatility within the Fund. Derivatives will typically increase the Fund's exposure to principal risks to which it is otherwise exposed, and may expose the Fund to additional risks, including correlation risk, counterparty risk, hedging risk, leverage risk and liquidity risk.
Credit Risk
Credit risk is the risk that the value of debt securities in the Fund's portfolio may decline because the issuer may default and fail to pay interest or repay principal when due. Rating agencies assign credit ratings to debt securities to indicate their credit risk. Lower rated or unrated debt securities held by the Fund may present increased credit risk as compared to higher-rated debt securities.
Interest Rate Risk
Interest rate risk is the risk of losses attributable to changes in interest rates. In general, if prevailing interest rates rise, the values of debt securities tend to fall, and if interest rates fall, the values of debt securities tend to rise. Actions by governments and central banking authorities can result in increases in interest rates. Increasing interest rates may negatively affect the value of debt securities held by the Fund, resulting in a negative impact on the Fund's performance and net asset value per share. In general, the longer the maturity or duration of a debt security, the greater its sensitivity to changes in interest rates.
Liquidity Risk
Liquidity risk is the risk associated with a lack of marketability of investments which may make it difficult to sell the investment at a desirable time or price. Changing regulatory, market or other conditions or environments (for example, the interest rate or credit environments) may adversely affect the liquidity of the Fund's investments. The Fund may have to accept a lower selling price for the holding, sell other investments, or forego another, more appealing investment
opportunity. Generally, the less liquid the market at the time the Fund sells a portfolio investment, the greater the risk of loss or decline of value to the Fund. A less liquid market can lead to an increase in Fund redemptions, which may negatively impact Fund performance and net asset value per share, including, for example, if the Fund is forced to sell securities in a down market.
Leverage Risk
Leverage occurs when the Fund increases its assets available for investment using borrowings, short sales, derivatives, or similar instruments or techniques. The use of leverage may make any change in the Fund's net asset value even greater and thus result in increased volatility of returns. Because short sales involve borrowing securities and then selling them, the Fund's short sales effectively leverage the Fund's assets. The Fund's assets that are used as collateral to secure the Fund's obligations to return the securities sold short may decrease in value while the short positions are outstanding, which may force the Fund to use its other assets to increase the collateral. Leverage can create an interest expense that may lower the Fund's overall returns. Leverage presents the opportunity for increased net income and capital gains, but also exaggerates the Fund's risk of loss. There can be no guarantee that a leveraging strategy will be successful.
Non-Diversification Risk
A non-diversified fund is permitted to invest a greater percentage of its total assets in fewer issuers than a diversified fund. The Fund may, therefore, have a greater risk of loss from a few issuers than a similar fund that invests more broadly.
Note 9. Subsequent Events
Management has evaluated the events and transactions that have occurred through the date the financial statements were issued and noted no items requiring adjustment of the financial statements or additional disclosure.
Note 10. Information Regarding Pending and Settled Legal Proceedings
In December 2005, without admitting or denying the allegations, American Express Financial Corporation (AEFC, which is now known as Ameriprise Financial, Inc. (Ameriprise Financial)) entered into settlement agreements with the Securities and Exchange Commission (SEC) and Minnesota Department of
Annual Report 2016
45
COLUMBIA ADAPTIVE RISK ALLOCATION FUND
NOTES TO FINANCIAL STATEMENTS (continued)
May 31, 2016
Commerce (MDOC) related to market timing activities. As a result, AEFC was censured and ordered to cease and desist from committing or causing any violations of certain provisions of the Investment Advisers Act of 1940, the Investment Company Act of 1940, and various Minnesota laws. AEFC agreed to pay disgorgement of $10 million and civil money penalties of $7 million. AEFC also agreed to retain an independent distribution consultant to assist in developing a plan for distribution of all disgorgement and civil penalties ordered by the SEC in accordance with various undertakings detailed at http://www.sec.gov/litigation/admin/ia-2451.pdf. Ameriprise Financial and its affiliates have cooperated with the SEC and the MDOC in these legal proceedings, and have made regular reports to the Funds' Boards of Trustees.
Ameriprise Financial and certain of its affiliates have historically been involved in a number of legal, arbitration and regulatory proceedings, including routine litigation, class actions, and governmental actions, concerning matters arising in connection with the conduct of their business activities. Ameriprise Financial believes that the Funds are not currently the subject of, and that neither Ameriprise Financial nor any of its affiliates are the subject of, any pending legal, arbitration or regulatory proceedings that are likely to have a material adverse effect on the Funds or the ability of Ameriprise Financial or its affiliates to perform under their contracts with the Funds. Ameriprise Financial is required to make quarterly (10-Q), annual (10-K) and, as necessary, 8-K filings with the SEC on legal and regulatory matters that relate to Ameriprise Financial and its affiliates. Copies of these filings may be obtained by accessing the SEC website at www.sec.gov.
There can be no assurance that these matters, or the adverse publicity associated with them, will not result in increased fund redemptions, reduced sale of fund shares or other adverse consequences to the Funds. Further, although we believe proceedings are not likely to have a material adverse effect on the Funds or the ability of Ameriprise Financial or its affiliates to perform under their contracts with the Funds, these proceedings are subject to uncertainties and, as such, we are unable to estimate the possible loss or range of loss that may result. An adverse outcome in one or more of these proceedings could result in adverse judgments, settlements, fines, penalties or other relief that could have a material adverse effect on the consolidated financial condition or results of operations of Ameriprise Financial.
Annual Report 2016
46
COLUMBIA ADAPTIVE RISK ALLOCATION FUND
REPORT OF INDEPENDENT REGISTERED PUBLIC ACCOUNTING FIRM
To the Trustees of Columbia Funds Series Trust I and the Shareholders of
Columbia Adaptive Risk Allocation Fund
In our opinion, the accompanying statement of assets and liabilities, including the portfolio of investments, and the related statements of operations and of changes in net assets and the financial highlights present fairly, in all material respects, the financial position of Columbia Adaptive Risk Allocation Fund (the "Fund", a series of Columbia Funds Series Trust I) at May 31, 2016, and the results of its operations, the changes in its net assets and the financial highlights for each of the periods indicated, in conformity with accounting principles generally accepted in the United States of America. These financial statements and financial highlights (hereafter referred to as "financial statements") are the responsibility of the Fund's management. Our responsibility is to express an opinion on these financial statements based on our audits. We conducted our audits of these financial statements in accordance with the standards of the Public Company Accounting Oversight Board (United States). Those standards require that we plan and perform the audit to obtain reasonable assurance about whether the financial statements are free of material misstatement. An audit includes examining, on a test basis, evidence supporting the amounts and disclosures in the financial statements, assessing the accounting principles used and significant estimates made by management, and evaluating the overall financial statement presentation. We believe that our audits, which included confirmation of securities at May 31, 2016 by correspondence with the custodian, brokers and transfer agent, and the application of alternative auditing procedures where such confirmations had not been received, provide a reasonable basis for our opinion.
PricewaterhouseCoopers LLP
Minneapolis, MN
July 25, 2016
Annual Report 2016
47
COLUMBIA ADAPTIVE RISK ALLOCATION FUND
Shareholders elect the Board that oversees the Fund's operations. The Board appoints officers who are responsible for day-to-day business decisions based on policies set by the Board. The following table provides basic biographical information about the Fund's Trustees, including their principal occupations during the past five years, although specific titles for individuals may have varied over the period. The year set forth beneath Length of Service in the table below is the year in which the Trustee was first appointed or elected as Trustee to any Fund currently in the Columbia Funds Complex or a predecessor thereof. Under current Board policy, members serve terms of indefinite duration.
Trustees
Independent Trustees
Name,
Address,
Year of Birth | | Position Held With
the Trust and Length of
Service | | Principal Occupation(s)
During the Past Five Years
and Other Relevant
Professional Experience | | Number of
Funds in the
Columbia Funds
Complex
Overseen | | Other Directorships
Held by Trustee During
the Past Five Years | |
Janet Langford Carrig
c/o Columbia
Management Investment Advisers, LLC,
225 Franklin Street
Mail Drop BX32 05228,
Boston, MA 02110
1957 | | Trustee 1996 | | Senior Vice President, General Counsel and Corporate Secretary, ConocoPhillips (integrated energy company) since September 2007 | | | 57 | | | None | |
Douglas A. Hacker
c/o Columbia Management Investment Advisers, LLC,
225 Franklin Street
Mail Drop BX32 05228,
Boston, MA 02110
1955 | | Trustee and Chairman of the Board 1996 | | Independent business executive since May 2006; Executive Vice President — Strategy of United Airlines from December 2002 to May 2006; President of UAL Loyalty Services (airline marketing company) from September 2001 to December 2002; Executive Vice President and Chief Financial Officer of United Airlines from July 1999 to September 2001 | | | 57 | | | Spartan Nash Company (food distributor); Nash Finch Company (food distributor) from 2005 to 2013; Aircastle Limited (aircraft leasing); SeaCube Container Leasing Ltd. (container leasing) from 2010 to 2013; and Travelport Worldwide Limited (travel information technology) | |
Nancy T. Lukitsh
c/o Columbia Management Investment Advisers, LLC,
225 Franklin Street
Mail Drop BX32 05228,
Boston, MA 02110
1956 | | Trustee 2011 | | Senior Vice President, Partner and Director of Marketing, Wellington Management Company, LLP (investment adviser) from 1997 to 2010; Chair, Wellington Management Portfolios (commingled non-U.S. investment pools) from 2007 to 2010; Director, Wellington Trust Company, NA and other Wellington affiliates from 1997 to 2010 | | | 57 | | | None | |
Annual Report 2016
48
COLUMBIA ADAPTIVE RISK ALLOCATION FUND
TRUSTEES AND OFFICERS (continued)
Independent Trustees (continued)
Name,
Address,
Year of Birth | | Position Held With
the Trust and Length of
Service | | Principal Occupation(s)
During the Past Five Years
and Other Relevant
Professional Experience | | Number of
Funds in the
Columbia Funds
Complex
Overseen | | Other Directorships
Held by Trustee During
the Past Five Years | |
William E. Mayer
c/o Columbia Management Investment Advisers, LLC,
225 Franklin Street
Mail Drop BX32 05228,
Boston, MA 02110
1940 | | Trustee 1991 | | Partner, Park Avenue Equity Partners (private equity) since February 1999 | | | 57 | | | DynaVox Inc. (speech creation); Lee Enterprises (print media); WR Hambrecht + Co. (financial service provider) from 2000 to 2012; BlackRock Capital Investment Corporation (investment company); and Premier, Inc. (healthcare) | |
David M. Moffett
c/o Columbia Management Investment Advisers, LLC,
225 Franklin Street
Mail Drop BX32 05228,
Boston, MA 02110
1952 | | Trustee 2011 | | Retired. Consultant to Bridgewater and Associates | | | 57 | | | Director of CIT Bank, CIT Group Inc. (commercial and consumer finance); eBay Inc. (online trading community); Genworth Financial, Inc. (financial and insurance products and services); Paypal Holdings Inc. (payment and data processing services); and Trustee University of Oklahoma Foundation | |
Charles R. Nelson
c/o Columbia Management Investment Advisers, LLC,
225 Franklin Street
Mail Drop BX32 05228,
Boston, MA 02110
1942 | | Trustee 1981 | | Retired. Professor Emeritus, University of Washington since 2011; Professor of Economics, University of Washington from 1976 to 2011; Ford and Louisa Van Voorhis Professor of Political Economy, University of Washington from 1993 to 2011; Adjunct Professor of Statistics, University of Washington from 1980 to 2011; Associate Editor, Journal of Money, Credit and Banking from September 1993 to 2008; consultant on econometric and statistical matters | | | 57 | | | None | |
John J. Neuhauser
c/o Columbia Management Investment Advisers, LLC,
225 Franklin Street
Mail Drop BX32 05228,
Boston, MA 02110
1943 | | Trustee 1984 | | President, Saint Michael's College since August 2007; Director or Trustee of several non-profit organizations, including University of Vermont Medical Center; Academic Vice President and Dean of Faculties, Boston College from August 1999 to October 2005; University Professor, Boston College from November 2005 to August 2007 | | | 57 | | | Liberty All-Star Equity Fund and Liberty All-Star Growth Fund (closed-end funds) | |
Annual Report 2016
49
COLUMBIA ADAPTIVE RISK ALLOCATION FUND
TRUSTEES AND OFFICERS (continued)
Independent Trustees (continued)
Name,
Address,
Year of Birth | | Position Held With
the Trust and Length of
Service | | Principal Occupation(s)
During the Past Five Years
and Other Relevant
Professional Experience | | Number of
Funds in the
Columbia Funds
Complex
Overseen | | Other Directorships
Held by Trustee During
the Past Five Years | |
Patrick J. Simpson
c/o Columbia Management Investment Advisers, LLC,
225 Franklin Street
Mail Drop BX32 05228,
Boston, MA 02110
1944 | | Trustee 2000 | | Of Counsel, Perkins Coie LLP (law firm) since 2015; Partner, Perkins Coie LLP from 1988 to 2014 | | | 57 | | | None | |
Anne-Lee Verville
c/o Columbia Management Investment Advisers, LLC,
225 Franklin Street
Mail Drop BX32 05228,
Boston, MA 02110
1945 | | Trustee 1998 | | Retired. General Manager, Global Education Industry from 1994 to 1997, President — Application Systems Division from 1991 to 1994, Chief Financial Officer — US Marketing & Services from 1988 to 1991, and Chief Information Officer from 1987 to 1988, IBM Corporation (computer and technology) | | | 57 | | | Enesco Group, Inc. (producer of giftware and home and garden decor products) from 2001 to 2006 | |
Consultant to the Trustees*
Name,
Address,
Year of Birth | | Position Held With
the Trust and Length of
Service | | Principal Occupation(s)
During the Past Five Years
and Other Relevant
Professional Experience | | Number of
Funds in the
Columbia Funds
Complex
Overseen | | Other Directorships
Held by Trustee During
the Past Five Years | |
J. Kevin Connaughton
c/o Columbia
Management Investment Advisers, LLC,
225 Franklin Street
Mail Drop BX32 05228,
Boston, MA 02110
1964 | | Trustee Consultant 2016 | | Trustee Consultant, Columbia Funds since March 2016; Managing Director and General Manager of Mutual Fund Products, Columbia Management Investment Advisers, LLC from May 2010 to February 2015; President, Columbia Funds from 2009 to 2015; and senior officer of Columbia Funds and affiliated funds from 2003 to 2015 | | | 57 | | | Board of Governors, Gateway Healthcare since January 2016; Trustee, New Century Portfolios since March 2015; and Director, The Autism Project since March 2015 | |
* J. Kevin Connaughton was appointed consultant to the Trustees effective March 1, 2016. Shareholders of the Funds are expected to be asked to elect Mr. Connaughton as a Trustee at a future shareholder meeting.
Annual Report 2016
50
COLUMBIA ADAPTIVE RISK ALLOCATION FUND
TRUSTEES AND OFFICERS (continued)
Interested Trustee Affiliated with Investment Manager*
Name,
Address,
Year of Birth | | Position Held With
the Trust and Length of
Service | | Principal Occupation(s)
During the Past Five Years
and Other Relevant
Professional Experience | | Number of
Funds in the
Columbia Funds
Complex
Overseen | | Other Directorships
Held by Trustee During
the Past Five Years | |
William F. Truscott
c/o Columbia Management Investment Advisers, LLC,
225 Franklin Street
Boston, MA 02110
1960 | | Trustee 2012 | | Chairman of the Board and President, Columbia Management Investment Advisers, LLC since May 2010 and February 2012, respectively; Chief Executive Officer, Global Asset Management, Ameriprise Financial, Inc. since September 2012 (previously Chief Executive Officer, U.S. Asset Management & President, Annuities, May 2010- September 2012; Director and Chief Executive Officer, Columbia Management Investment Distributors, Inc. since May 2010 and February 2012, respectively; Chairman of the Board and Chief Executive Officer, RiverSource Distributors, Inc. since 2006; Director, Threadneedle Asset Management Holdings, SARL since 2014; President and Chief Executive Officer, Ameriprise Certificate Company, 2006-August 2012. | | | 176 | | | Chairman of the Board, Columbia Management Investment Advisers, LLC since May 2010; Director, Columbia Management Investment Distributors, Inc. since May 2010; Former Director, Ameriprise Certificate Company, 2006-January 2013 | |
* Interested person (as defined under the 1940 Act) by reason of being an officer, director, security holder and/or employee of the Investment Manager or Ameriprise Financial.
The Statement of Additional Information has additional information about the Fund's Board members and is available, without charge, upon request by calling 800.345.6611; contacting your financial intermediary; or visiting columbiathreadneedle.com/us.
Annual Report 2016
51
COLUMBIA ADAPTIVE RISK ALLOCATION FUND
TRUSTEES AND OFFICERS (continued)
The Board has appointed officers who are responsible for day-to-day business decisions based on policies it has established. The officers serve at the pleasure of the Board. The following table provides basic information about the Officers of the Fund, including principal occupations during the past five years, although their specific titles may have varied over the period. In addition to Mr. Truscott, who is Senior Vice President, the Fund's other officers are:
Fund Officers
Name,
Address and
Year of Birth | | Position and Year
First Appointed to
Position for any Fund
in the Columbia
Funds Complex or a
Predecessor Thereof | |
Principal Occupation(s) During Past Five Years | |
Christopher O. Petersen
5228 Ameriprise Financial Center
Minneapolis, MN 55474
Born 1970 | | President and Principal Executive Officer (2015) | | Vice President and Lead Chief Counsel, Ameriprise Financial, Inc. since January 2015 (previously, Vice President and Chief Counsel January 2010-December 2014); officer of Columbia Funds and affiliated funds since 2007. | |
Michael G. Clarke
225 Franklin Street
Boston, MA 02110
Born 1969 | | Treasurer (2011), Chief Financial Officer (2009) and Chief Accounting Officer (2015) | | Vice President — Mutual Fund Administration, Columbia Management Investment Advisers, LLC, since May 2010; senior officer of Columbia Funds and affiliated funds since 2002. | |
Paul B. Goucher
100 Park Avenue
New York, NY 10017
Born 1968 | | Senior Vice President (2011), Chief Legal Officer (2015) and Assistant Secretary (2008) | | Vice President and Lead Chief Counsel, Ameriprise Financial, Inc. since November 2008 and January 2013, respectively (previously Chief Counsel, January 2010-January 2013); Vice President, Chief Legal Officer and Assistant Secretary, Columbia Management Investment Advisers, LLC since May 2010. | |
Thomas P. McGuire
225 Franklin Street
Boston, MA 02110
Born 1972 | | Senior Vice President and Chief Compliance Officer (2012) | | Vice President — Asset Management Compliance, Ameriprise Financial, Inc., since May 2010; Chief Compliance Officer, Ameriprise Certificate Company since September 2010. | |
Colin Moore
225 Franklin Street
Boston, MA 02110
Born 1958 | | Senior Vice President (2010) | | Executive Vice President and Global Chief Investment Officer, Ameriprise Financial, Inc., since July 2013; Executive Vice President and Global Chief Investment Officer, Columbia Management Investment Advisers, LLC since July 2013 (previously Director and Global Chief Investment Officer, 2010-2013). | |
Michael E. DeFao
225 Franklin Street
Boston, MA 02110
Born 1968 | | Vice President (2011) and Assistant Secretary (2010) | | Vice President and Chief Counsel, Ameriprise Financial, Inc. since May 2010. | |
Amy Johnson
5228 Ameriprise Financial Center
Minneapolis, MN 55474
Born 1965 | | Vice President (2006) | | Managing Director and Global Head of Operations, Columbia Management Investment Advisers, LLC since April 2016 (previously Managing Director and Chief Operating Officer, 2010-2016). | |
Lyn Kephart-Strong
5228 Ameriprise
Financial Center
Minneapolis, MN 55474
Born 1960 | | Vice President (2015) | | President, Columbia Management Investment Services Corp. since October 2014; Vice President & Resolution Officer, Ameriprise Trust Company since August 2009. | |
Ryan C. Larrenaga
225 Franklin Street
Boston, MA 02110
Born 1970 | | Vice President and Secretary (2015) | | Vice President and Group Counsel, Ameriprise Financial, Inc. since August 2011 (previously, Counsel from May 2010 to August 2011); officer of Columbia Funds and affiliated funds since 2005. | |
Annual Report 2016
52
COLUMBIA ADAPTIVE RISK ALLOCATION FUND
IMPORTANT INFORMATION ABOUT THIS REPORT
Each fund mails one shareholder report to each shareholder address. If you would like more than one report, please call shareholder services at 800.345.6611 and additional reports will be sent to you.
The policy of the Board is to vote the proxies of the companies in which each fund holds investments consistent with the procedures as stated in the Statement of Additional Information (SAI). You may obtain a copy of the SAI without charge by calling 800.345.6611; contacting your financial intermediary; visiting columbiathreadneedle.com/us; or searching the website of the Securities and Exchange Commission (SEC) at sec.gov. Information regarding how each fund voted proxies relating to portfolio securities is filed with the SEC by August 31st for the most recent 12-month period ending June 30th of that year, and is available without charge by visiting columbiathreadneedle.com/us, or searching the website of the SEC at sec.gov.
Each fund files a complete schedule of portfolio holdings with the SEC for the first and third quarters of each fiscal year on Form N-Q. Each fund's Form N-Q is available on the SEC's website at sec.gov and may be reviewed and copied at the SEC's Public Reference Room in Washington, D.C. Information on the operation of the Public Reference Room may be obtained by calling 800.SEC.0330. Each fund's complete schedule of portfolio holdings, as filed on Form N-Q, can also be obtained without charge, upon request, by calling 800.345.6611.
You may obtain the current net asset value (NAV) of Fund shares at no cost by calling 800.345.6611 or by sending an e-mail to serviceinquiries@columbiathreadneedle.com.
Annual Report 2016
53
Columbia Adaptive Risk Allocation Fund
P.O. Box 8081
Boston, MA 02266-8081

This information is for use with concurrent or prior delivery of a fund prospectus. Please read and consider the investment objectives, risks, charges and expenses for any fund carefully before investing. For a prospectus and summary prospectus, which contains this and other important information about the Fund, go to columbiathreadneedle.com/us. The Fund is distributed by Columbia Management Investment Distributors, Inc., member FINRA, and managed by Columbia Management Investment Advisers, LLC.
Columbia Threadneedle Investments (Columbia Threadneedle) is the global brand name of the Columbia and Threadneedle group of companies.
All rights reserved. Columbia Management Investment Distributors, Inc., 225 Franklin Street, Boston, MA 02110-2804
© 2016 Columbia Management Investment Advisers, LLC.
columbiathreadneedle.com/us
ANN214_05_F01_(07/16)

ANNUAL REPORT
May 31, 2016

COLUMBIA ADAPTIVE ALTERNATIVES FUND

ABOUT COLUMBIA THREADNEEDLE INVESTMENTS
Columbia Threadneedle Investments is a leading global asset management group that provides a broad range of actively managed investment strategies and solutions for individual, institutional and corporate clients around the world.
With more than 2,000 people, including over 450 investment professionals based in North America, Europe and Asia, we manage $464 billion* of assets across developed and emerging market equities, fixed income, asset allocation solutions and alternatives. We are the 13th largest manager of long-term mutual fund assets in the U.S.** and the 3rd largest manager of retail funds in the U.K.***
Our priority is the investment success of our clients. We aim to deliver the investment outcomes they expect through an investment approach that is team-based, performance-driven and risk-aware. Our culture is dynamic and interactive. By sharing our insights across asset classes and geographies, we generate richer perspectives on global, regional and local investment landscapes. The ability to exchange and debate investment ideas in a collaborative environment enriches our teams' investment processes. More importantly, it results in better informed investment decisions for our clients.
Columbia funds are distributed by Columbia Management Investment Distributors, Inc., member FINRA, and managed by Columbia Management Investment Advisers, LLC.
Columbia Threadneedle Investments (Columbia Threadneedle) is the global brand name of the Columbia and Threadneedle group of companies.
* In U.S. dollars as of March 31, 2016. Source: Ameriprise Q1 Earnings Release. Includes all assets managed by entities in the Columbia and Threadneedle group of companies. Contact us for more current data.
** Source: ICI as of March 31, 2016 for Columbia Management Investment Advisers, LLC.
*** Source: Investment Association as of December 2015 for Threadneedle Asset Management Limited.
© 2016 Columbia Management Investment Advisers, LLC. All rights reserved.
Not part of the shareholder report
 Dear Shareholders,
Volatility comes with the territory for long-term investors. Some investors instinctively want to pull out of the market or sell underperforming investments at the first sign of increased volatility or perhaps even as soon as they perceive it on the horizon. But taking yourself out of the market could mean losing out on potential opportunities, and putting your longer-term investment goals at risk.
Cumulative return is not just about achieving high returns when markets are going up; it's also about remaining invested and minimizing losses during weak or volatile markets so that you can participate on the upside. Developing a deeper understanding of the various risks your portfolio is subject to can help you balance these risks.
Diversification is critical in seeking to achieve that balance. We believe that most portfolios could be more effectively diversified either by introducing holdings with performance profiles unrelated to existing holdings (like alternative products) or by rebalancing existing holdings with an eye toward risk allocation. Over time, distributing risk more evenly may produce a more pronounced diversification benefit and may improve portfolio efficiency. We believe market volatility can create significant opportunities and, in fact, these periods may be some of the very best times to invest.
With this in mind, I thought it important to highlight excerpts from a piece written by Colin Moore, Global Chief Investment Officer, in which he touches on some of these issues emphasizing the importance of a properly constructed portfolio in seeking to effectively manage volatility and to achieve consistency of returns. I encourage you to read the article in its entirety. To access the full article and for other insights on current market, please visit blog.columbiathreadneedleus.com/latest-perspectives.
You need investments that are designed to help you ease the impact of volatile market environments and keep the savings you have worked tirelessly to amass. Columbia Threadneedle Investments provides investment solutions to help you tackle financial challenges and achieve your desired outcome.
Best regards,

Christopher O. Petersen
President, Columbia Funds
Excerpts from:
Taking the scare out of the volatility bogeyman
By Colin Moore, Global Chief Investment Officer
Colin Moore is the global chief investment officer for Columbia Threadneedle Investments. His responsibilities include ensuring that a disciplined investment process is in place across all asset classes, including equity and fixed income. Mr. Moore joined one of the Columbia Threadneedle Investments legacy firms in 2002 as head of equity and was also head of fixed income and liquidity strategies from 2009 – 2010.

n In today's low growth, higher volatility world, the emphasis is shifting from maximization of returns to consistency of returns.
PRESIDENT'S MESSAGE (continued)
n Portfolios should represent the behavioral risk-return tradeoff of investors, remembering that they won't stay invested to realize the return if we get the risk tolerance wrong.
n Holding long-term savings in cash to avoid volatility (the financial equivalent of hiding under the sheets) is detrimental to achieving long-term goals.
According to Wikipedia, "The bogeyman is a common allusion to a mythical creature in many cultures used to control behavior. This monster has no specific appearance, and conceptions about it can vary drastically from household to household within the same community; in many cases he has no set appearance in the mind of an adult or child, but is simply a non-specific embodiment of terror." Different cultures have different names and physical representations for the bogeyman, and investors are no different. We have terrible monsters that we fear may destroy our portfolios, and we call one of the scariest of them volatility.
While the bogeyman is mythical (I hope!), volatility is real and can cause serious damage. To understand why investors have such a hard time coping with volatility, we first need to define three cognitive biases at work in today's investment environment:
1) Recency bias — something that has recently come to the forefront of our attention, regardless of how long established it is, suddenly seems to appear with improbable frequency.
2) Negativity bias — we tend to have a greater recall of unpleasant memories than positive memories.
3) Loss aversion — our dissatisfaction with losing money tends to be greater than our satisfaction with making money.
The level of volatility varies dramatically, and so does investor fear and panic selling — waxing when volatility rises, waning when it falls. Recent studies have pointed to demographics as an important driver of panic selling. The theory is that as people get closer to retirement, the prospects of a large (20% – 30%) loss in financial assets can have a much more pronounced effect on their sense of well-being. Wealth preservation instincts kick in much more quickly than for younger (and typically less wealthy) savers.
The reality is that there is little opportunity for return without volatility. Therefore, the bogeyman effect of holding long-term savings in cash to avoid volatility (the financial equivalent of hiding under the sheets) is detrimental to achieving long-term goals. This effect tends to be more pronounced during the episodic spikes in volatility. The significant spike in volatility in 2008 and 2009 led to significant withdrawals from long-term investment funds over the same period. Less pronounced effects can also be seen when comparing 2001 – 2003 and 2011 – 2012. Conversely, flows picked up when volatility returned to "normal" levels. Investor behavior of this type is consistent with the three behavioral biases.
I believe average volatility will be higher over the next 10 years than the last 10 years and episodic spikes will increase in frequency because sustainable economic growth will be structurally lower and geopolitical risk higher than any time since World War II. Low growth creates uncertainty while loss aversion will make investors fear that we are one economic mishap or geopolitical event away from no growth or recession. The result will be higher volatility on average. Negativity bias will tend to exacerbate "spike" reactions to event-driven geopolitical news, and the volatility bogeyman will appear more often. Assuming the behavioral biases continue, investor returns are likely to be very disappointing regardless of the total return generated by financial markets due to the bogeyman effect.
To mitigate this effect, we need to focus on portfolio construction and an improved understanding of diversification. I accept that equities are likely to offer the highest return over the next 10 years, but they also offer the highest volatility. Many portfolio construction optimization tools use historical average volatility, which is likely to underestimate the volatility investors will face. The bogeyman emerges when individual asset class volatility spikes and cross correlations rise, the combination of which increases overall portfolio volatility far beyond expectation. Diversification is meant to protect investors against volatility, but what's the point of owning lots of investments if the volatility bogeyman has not been properly estimated?
Most importantly, portfolios should be constructed to properly represent the behavioral risk-return tradeoff of investors, remembering that they won't stay invested to realize the return if we get the risk tolerance wrong. In a low growth, higher volatility world, the emphasis is shifting to return consistency rather than return maximization,
PRESIDENT'S MESSAGE (continued)
and investors are best served through investment approaches that appreciate that distinction. Even though it's a permanent feature of financial markets, volatility is less likely to be the bogeyman we all fear if portfolios are constructed with this understanding.
Please visit blog.columbiathreadneedleus.com/latest-perspectives to read the entire article.
Investors should consider the investment objectives, risks, charges and expenses of a mutual fund carefully before investing. For a free prospectus and summary prospectus, which contains this and other important information about a fund, visit columbiathreadneedle.com/us. The prospectus should be read carefully before investing.
The views expressed are as of April 2016, may change as market or other conditions change, and may differ from views expressed by other Columbia Management Investment Advisers, LLC (CMIA) associates or affiliates. Actual investments or investment decisions made by CMIA and its affiliates, whether for its own account or on behalf of clients, will not necessarily reflect the views expressed. This information is not intended to provide investment advice and does not account for individual investor circumstances. Investment decisions should always be made based on an investor's specific financial needs, objectives, goals, time horizon and risk tolerance. Asset classes described may not be suitable for all investors.
Past performance does not guarantee future results, and no forecast should be considered a guarantee either. Since economic and market conditions change frequently, there can be no assurance that the trends described here will continue or that the forecasts are accurate.
Diversification does not guarantee a profit or protect against loss.
Columbia Funds are distributed by Columbia Management Investment Distributors, Inc., member FINRA, and managed by Columbia Management Investment Advisers, LLC.
© 2016 Columbia Management Investment Advisers, LLC. All rights reserved.
COLUMBIA ADAPTIVE ALTERNATIVES FUND
Fund Investment Manager
Columbia Management Investment
Advisers, LLC
225 Franklin Street
Boston, MA 02110
Fund Distributor
Columbia Management Investment
Distributors, Inc.
225 Franklin Street
Boston, MA 02110
Fund Transfer Agent
Columbia Management Investment
Services Corp.
P.O. Box 8081
Boston, MA 02266-8081
For more information about any of the funds, please visit columbiathreadneedle.com/us or call 800.345.6611. Customer Service Representatives are available to answer your questions Monday through Friday from 8 a.m. to 7 p.m. Eastern time.
The views expressed in this report reflect the current views of the respective parties. These views are not guarantees of future performance and involve certain risks, uncertainties and assumptions that are difficult to predict, so actual outcomes and results may differ significantly from the views expressed. These views are subject to change at any time based upon economic, market or other conditions and the respective parties disclaim any responsibility to update such views. These views may not be relied on as investment advice and, because investment decisions for a Columbia fund are based on numerous factors, may not be relied on as an indication of trading intent on behalf of any particular Columbia fund. References to specific securities should not be construed as a recommendation or investment advice.
Performance Overview | | | 3 | | |
Manager Discussion of Fund Performance | | | 5 | | |
Understanding Your Fund's Expenses | | | 7 | | |
Consolidated Portfolio of Investments | | | 8 | | |
Consolidated Statement of Assets and Liabilities | | | 14 | | |
Consolidated Statement of Operations | | | 16 | | |
Consolidated Statement of Changes in Net Assets | | | 17 | | |
Consolidated Financial Highlights | | | 19 | | |
Notes to Consolidated Financial Statements | | | 28 | | |
Report of Independent Registered Public Accounting Firm | | | 40 | | |
Federal Income Tax Information | | | 41 | | |
Trustees and Officers | | | 42 | | |
Important Information About This Report | | | 47 | | |
COLUMBIA ADAPTIVE ALTERNATIVES FUND
Performance Summary
n Columbia Adaptive Alternatives Fund (the Fund) Class A shares returned -3.67% excluding sales charges for the 12-month period that ended May 31, 2016.
n The Citi One-Month U.S. Treasury Bill Index returned 0.09% over the same period.
n The Fund, multi-strategy in nature, accesses various alternative investment strategies that offer return opportunities typically not available from traditional investments.
Average Annual Total Returns (%) (for period ended May 31, 2016)
| | Inception | | 1 Year | | Life | |
Class A | | 01/28/15 | | | | | | | | | |
Excluding sales charges | | | | | | | -3.67 | | | | -3.85 | | |
Including sales charges | | | | | | | -9.20 | | | | -8.02 | | |
Class C | | 01/28/15 | | | | | | | | | |
Excluding sales charges | | | | | | | -4.42 | | | | -4.55 | | |
Including sales charges | | | | | | | -5.37 | | | | -4.55 | | |
Class I | | 01/28/15 | | | -3.24 | | | | -3.45 | | |
Class R | | 01/28/15 | | | -3.92 | | | | -4.11 | | |
Class R4 | | 01/28/15 | | | -3.42 | | | | -3.59 | | |
Class R5 | | 01/28/15 | | | -3.37 | | | | -3.55 | | |
Class W | | 01/28/15 | | | -3.68 | | | | -3.93 | | |
Class Y | | 01/28/15 | | | -3.34 | | | | -3.53 | | |
Class Z | | 01/28/15 | | | -3.63 | | | | -3.75 | | |
Citi One-Month U.S. Treasury Bill Index | | | | | | | 0.09 | | | | 0.07 | | |
Returns for Class A are shown with and without the maximum initial sales charge of 5.75%. Returns for Class C are shown with and without the 1.00% CDSC for the first year only. The Fund's other classes are not subject to sales charges and have limited eligibility. Please see the Fund's prospectus for details. Performance for different share classes will vary based on differences in sales charges and fees associated with each class. All results shown assume reinvestment of distributions during the period. Returns do not reflect the deduction of taxes that a shareholder may pay on Fund distributions or on the redemption of Fund shares. Performance results reflect the effect of any fee waivers or reimbursements of Fund expenses by Columbia Management Investment Advisers, LLC and/or any of its affiliates. Absent these fee waivers or expense reimbursement arrangements, performance results would have been lower.
The performance information shown represents past performance and is not a guarantee of future results. The investment return and principal value of your investment will fluctuate so that your shares, when redeemed, may be worth more or less than their original cost. Current performance may be lower or higher than the performance information shown. You may obtain performance information current to the most recent month-end by contacting your financial intermediary, visiting columbiathreadneedle.com/us or calling 800.345.6611.
The Citi One-Month U.S. Treasury Bill Index is an unmanaged index that represents the performance of one-month Treasury bills and reflects reinvestment of all distributions and changes in market prices.
Indices are not available for investment, are not professionally managed and do not reflect sales charges, fees, brokerage commissions, taxes or other expenses of investing. Securities in the Fund may not match those in an index.
Annual Report 2016
3
COLUMBIA ADAPTIVE ALTERNATIVES FUND
PERFORMANCE OVERVIEW (continued)
Performance of a Hypothetical $10,000 Investment (January 28, 2015 – May 31, 2016)
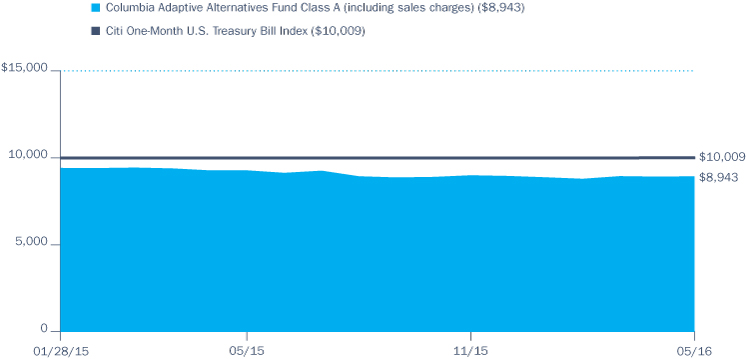
The chart above shows the change in value of a hypothetical $10,000 investment in Class A shares of Columbia Adaptive Alternatives Fund during the stated time period, and does not reflect the deduction of taxes that a shareholder may pay on Fund distributions or on the redemption of Fund shares.
Annual Report 2016
4
COLUMBIA ADAPTIVE ALTERNATIVES FUND
MANAGER DISCUSSION OF FUND PERFORMANCE
For the 12-month period that ended May 31, 2016, the Fund's Class A shares returned -3.67% excluding sales charges. The Citi One-Month U.S. Treasury Bill Index returned 0.09% over the same period. As an absolute return fund, the Fund employs a benchmark-agnostic strategy and thus any comparison to the Citi One-Month U.S. Treasury Bill Index is for information purposes only. The Fund, multi-strategy in nature, accesses various alternative investment strategies that offer return opportunities typically not available from traditional investments.
Risk-Averse Investor Sentiment Heightened During Period
Around the world, investors turned increasingly cautious during the period, as lackluster economic growth, contentious geopolitical conflicts and an expected shift in U.S. monetary policy weighed on confidence. Subpar global economic growth persisted, with China's ongoing slowdown heading the list of disappointments. Plummeting oil prices and a rising U.S. dollar rounded off the list of mounting pressures. Some of these pressures subsided during the first months of 2016, which corresponded with yet another sell-off and swift market recovery in a relatively short period of time. In the U.S., the labor market added new jobs, resulting in the unemployment rate moving down to 4.7%. Consumer spending strengthened somewhat, and the housing market inched forward, although sales slipped near the end of 2015, as new industry regulation led to longer closing periods. Economic growth outside the U.S. was mostly lackluster. A weaker currency benefited eurozone countries as did accommodative bank lending standards. However, eurozone economic growth still registered at a level of less than 2.0% for the period. The weakness in commodity markets helped drive Russia and Brazil into recession, and China's economy slowed more than expected. In Japan, policymakers sought to raise inflation, as they struggled to maintain economic growth.
For U.S. investors, stock market losses in the first half of the period were offset by a recovery during both October of 2015 and again in the February to March 2016 timeframe. U.S. stocks outperformed both foreign developed and emerging markets, as a strong U.S. dollar weighed on returns from overseas for much of the period. However, during the last three months of the period, international equities began to trend higher, at a pace greater than U.S. shares. The U.S. bond market eked out a low single-digit return during the period, led by stronger performance during the second half of the fiscal year. Long-duration corporate bonds and high yield bonds shed the most ground, as losses in the first half of the period outweighed the subsequent recovery in these asset classes that investors experienced toward the end of the period.
Non-Traditional Asset Classes Hampered Fund Results Most
The Fund is comprised of three primary investment components — an allocation to hedge fund strategies, including long/short, arbitrage and relative value, managed by Blackstone Alternative Investment Advisors LLC (Blackstone); an internally-managed alternative beta strategies portfolio, which includes direct access to the risk premia that drive investment returns such as value, momentum and quality; and exposure
Portfolio Management
Jeffrey Knight, CFA
William Landes, Ph.D.
Marc Khalamayzer, CFA
Joshua Kutin, CFA
Market Exposure By Strategies (%)(a)
(at May 31, 2016) | |
Alternative Beta Strategies | | | 204.6 | | |
Hedge Fund Strategies | | | 49.9 | | |
Non-Traditional Asset Classes | | | 6.2 | | |
(a) Percentages are based upon net assets. The percentages do not equal 100% due to the effects of leverage within the Fund's portfolio. Leverage exists when the Fund purchases or sells an instrument or enters into a transaction without investing cash in an amount equal to the full economic exposure of the instrument or transaction. The Fund's portfolio composition and its market exposure are subject to change. At period end, Hedge Fund Strategies included investment in the Blackstone Alternative Multi-Strategy Fund (an unaffiliated mutual fund); Alternative Beta Strategies included investment in total return swap contracts; and Non-Traditional Asset Classes included investment in affiliated and/or unaffiliated funds, including exchange-traded funds (ETFs).
Portfolio Breakdown (%)
(at May 31, 2016) | |
Alternative Investment Funds | | | 52.7 | | |
Equity Funds | | | 0.6 | | |
Exchange-Traded Funds | | | 3.1 | | |
Money Market Funds | | | 43.6 | | |
Total | | | 100.0 | | |
Percentages indicated are based upon total investments. The Fund's portfolio composition is subject to change.
Annual Report 2016
5
COLUMBIA ADAPTIVE ALTERNATIVES FUND
MANAGER DISCUSSION OF FUND PERFORMANCE (continued)
Investment Risks
Absolute return funds are not designed to outperform stocks and bonds in strong markets. Market risk may affect a single issuer, sector of the economy, industry or the market as a whole. Alternative investments involve substantial risks and are more volatile than traditional investments, making them more suitable for investors with an above-average tolerance for risk. Foreign investments subject the Fund to risks, including political, economic, market, social and others within a particular country, as well as to currency instabilities and less stringent financial and accounting standards generally applicable to U.S. issuers. The Fund's investment in other funds subjects it to the investment performance (positive or negative), risks and expenses of these underlying funds. ETFs trade like stocks, are subject to investment risk and will fluctuate in market value. The Fund employs multiple strategies independently of one another, which may result in contradicting trades (i.e., with no net benefit to the Fund), while increasing transaction costs. Investing in derivatives is a specialized activity that involves special risks that subject the Fund to significant loss potential, including when used as leverage, and may result in greater fluctuation in fund value. The Fund's use of leverage subjects additional fund assets to the risk of loss. The sales price the Fund (or its underlying investments) could receive for any particular investment may differ from the Fund's (or underlying investments) valuation of the investment. As a non-diversified fund, fewer investments could have a greater effect on performance. See the Fund's prospectus for information on these and other risks.
to non-traditional asset classes, which may include real assets (commodities, REITs, inflation-linked bonds) and listed private equities that are often less correlated to traditional stock and bond markets. During the period, the non-traditional asset classes, or what we call our directional strategies, posted the largest negative absolute return, due primarily to exposure to commodities. The hedge fund strategies portfolio also posted a negative absolute return during the period. The alternative beta strategies sleeve posted a positive absolute return during the period due primarily to effective asset allocation within the sleeve. Within the alternative beta sleeve, the largest positive contributions to return came from positions focused on equity low beta risk premia, equity quality and currency value risk premia. The biggest detractors from absolute return in the alternative beta sleeve were positions focused on equity value.
Changes to Alternative Beta Component Reflected Refined Strategy
Beginning in September 2015, the alternative beta component of the Fund was amended to reflect an evolution in the Fund management team's thinking and capabilities. Prior to this date, a highly focused subset of alternative beta positions was utilized to complement the hedge fund exposures generated within the Blackstone-managed hedge fund portfolio sleeve. At the start of September 2015, the alternative beta universe of positions was expanded significantly, as the team's coverage and expertise were refined. The alternative beta strategies portfolio was from that date on run as an independent, distinct return generative portion of the Fund managed to meet a set volatility target. The team's decision to evolve the management of alternative beta exposures resulted in the greatest net positive contribution to the Fund's absolute return during the period.
Derivatives Usage
The Fund utilizes derivatives for both hedging and non-hedging purposes, including, for example, seeking to enhance returns or as a substitute for a position in an underlying asset or index. During the period, the alternative beta sleeve of the Fund's strategy used total return swap positions to more efficiently and cost effectively manage its exposures. These flexible structures, which allow for direct and highly versatile portfolio management applications, added value to the Fund's results during the period. Also, the underlying managers of hedge fund strategies employed derivatives such as futures and forward foreign currency exchange contracts and similar instruments as part of their underlying strategies to hedge market exposure and/or to gain implicit leverage, subject to the constraints of the Investment Company Act of 1940. The stand-alone impact of these derivatives detracted slightly from performance.
Looking ahead
The Fund is an absolute return-focused portfolio that seeks to meet its performance target irrespective of global macro conditions. As such, the Fund invests in positions that tend to exhibit little market directionality. The Fund intends to maintain its three-component strategy of investing in hedge fund investments via Blackstone, low to zero market directionally-based alternative beta positions and non-traditional long-only exposures.
Annual Report 2016
6
COLUMBIA ADAPTIVE ALTERNATIVES FUND
UNDERSTANDING YOUR FUND'S EXPENSES
(Unaudited)
As an investor, you incur two types of costs. There are transaction costs, which generally include sales charges on purchases and may include redemption fees. There are also ongoing costs, which generally include management fees, distribution and/or service fees, and other fund expenses. The following information is intended to help you understand your ongoing costs (in dollars) of investing in the Fund and to help you compare these costs with the ongoing costs of investing in other mutual funds.
Analyzing Your Fund's Expenses
To illustrate these ongoing costs, we have provided examples and calculated the expenses paid by investors in each share class of the Fund during the period. The actual and hypothetical information in the table is based on an initial investment of $1,000 at the beginning of the period indicated and held for the entire period. Expense information is calculated two ways and each method provides you with different information. The amount listed in the "Actual" column is calculated using the Fund's actual operating expenses and total return for the period. You may use the Actual information, together with the amount invested, to estimate the expenses that you paid over the period. Simply divide your account value by $1,000 (for example, an $8,600 account value divided by $1,000 = 8.6), then multiply the results by the expenses paid during the period under the "Actual" column. The amount listed in the "Hypothetical" column assumes a 5% annual rate of return before expenses (which is not the Fund's actual return) and then applies the Fund's actual expense ratio for the period to the hypothetical return. You should not use the hypothetical account values and expenses to estimate either your actual account balance at the end of the period or the expenses you paid during the period. See "Compare With Other Funds" below for details on how to use the hypothetical data.
Compare With Other Funds
Since all mutual funds are required to include the same hypothetical calculations about expenses in shareholder reports, you can use this information to compare the ongoing cost of investing in the Fund with other funds. To do so, compare the hypothetical example with the 5% hypothetical examples that appear in the shareholder reports of other funds. As you compare hypothetical examples of other funds, it is important to note that hypothetical examples are meant to highlight the ongoing costs of investing in a fund only and do not reflect any transaction costs, such as sales charges, or redemption or exchange fees. Therefore, the hypothetical calculations are useful in comparing ongoing costs only, and will not help you determine the relative total costs of owning different funds. If transaction costs were included in these calculations, your costs would be higher.
December 1, 2015 – May 31, 2016
| | Account Value at the Beginning
of the Period ($) | | Account Value at the End of the
Period ($) | | Expenses Paid During the
Period ($) | | Fund's Annualized
Expense Ratio (%) | |
| | Actual | | Hypothetical | | Actual | | Hypothetical | | Actual | | Hypothetical | | Actual | |
Class A | | | 1,000.00 | | | | 1,000.00 | | | | 993.50 | | | | 1,018.00 | | | | 6.98 | | | | 7.06 | | | | 1.40 | | |
Class C | | | 1,000.00 | | | | 1,000.00 | | | | 989.10 | | | | 1,014.25 | | | | 10.69 | | | | 10.83 | | | | 2.15 | | |
Class I | | | 1,000.00 | | | | 1,000.00 | | | | 994.90 | | | | 1,019.95 | | | | 5.04 | | | | 5.10 | | | | 1.01 | | |
Class R | | | 1,000.00 | | | | 1,000.00 | | | | 992.00 | | | | 1,016.70 | | | | 8.27 | | | | 8.37 | | | | 1.66 | | |
Class R4 | | | 1,000.00 | | | | 1,000.00 | | | | 995.00 | | | | 1,019.40 | | | | 5.59 | | | | 5.65 | | | | 1.12 | | |
Class R5 | | | 1,000.00 | | | | 1,000.00 | | | | 994.60 | | | | 1,019.70 | | | | 5.29 | | | | 5.35 | | | | 1.06 | | |
Class W | | | 1,000.00 | | | | 1,000.00 | | | | 993.50 | | | | 1,017.95 | | | | 7.03 | | | | 7.11 | | | | 1.41 | | |
Class Y | | | 1,000.00 | | | | 1,000.00 | | | | 994.90 | | | | 1,019.95 | | | | 5.04 | | | | 5.10 | | | | 1.01 | | |
Class Z | | | 1,000.00 | | | | 1,000.00 | | | | 992.90 | | | | 1,017.40 | | | | 7.57 | | | | 7.67 | | | | 1.52 | | |
Expenses paid during the period are equal to the annualized expense ratio for each class as indicated above, multiplied by the average account value over the period and then multiplied by the number of days in the Fund's most recent fiscal half year and divided by 366.
Expenses do not include fees and expenses incurred indirectly by the Fund from its investment in underlying funds, including affiliated and non-affiliated pooled investment vehicles, such as mutual funds and exchange-traded funds.
Had Columbia Management Investment Advisers, LLC and/or certain of its affiliates not waived/reimbursed certain fees and expenses, account value at the end of the period would have been reduced.
Annual Report 2016
7
COLUMBIA ADAPTIVE ALTERNATIVES FUND
CONSOLIDATED PORTFOLIO OF INVESTMENTS
May 31, 2016
(Percentages represent value of investments compared to net assets)
Equity Funds 0.6%
| | | Shares | | Value ($) | |
GLOBAL REAL ESTATE 0.6% | |
Columbia Real Estate Equity Fund,
Class I Shares(a) | | | 83,504 | | | | 1,331,058 | | |
Total Equity Funds
(Cost: $1,368,927) | | | | | 1,331,058 | | |
Alternative Investment Funds 52.4%
Blackstone Alternative Multi-Strategy
Fund(a) | | | 10,732,433 | | | | 107,002,361 | | |
Columbia Commodity Strategy Fund,
Class I Shares(a)(b) | | | 991,950 | | | | 5,445,805 | | |
Total Alternative Investment Funds
(Cost: $113,079,060) | | | | | 112,448,166 | | |
Exchange-Traded Funds 3.1%
| | | Shares | | Value ($) | |
PowerShares Global Listed Private
Equity Portfolio | | | 551,688 | | | | 5,814,791 | | |
iShares US Real Estate ETF | | | 10,164 | | | | 795,638 | | |
Total Exchange-Traded Funds
(Cost: $6,782,685) | | | | | 6,610,429 | | |
Money Market Funds 43.4%
Columbia Short-Term Cash Fund,
0.434%(a)(c) | | | 93,039,309 | | | | 93,039,309 | | |
Total Money Market Funds
(Cost: $93,039,309) | | | | | 93,039,309 | | |
Total Investments
(Cost: $214,269,981) | | | | | 213,428,962 | | |
Other Assets & Liabilities, Net | | | | | 969,185 | | |
Net Assets | | | | | 214,398,147 | | |
At May 31, 2016, cash totaling $720,000 was pledged as collateral.
Investments in Derivatives
Forward Foreign Currency Exchange Contracts Open at May 31, 2016
Counterparty | | Exchange Date | | Currency to
be Delivered | |
| | Currency to
be Received | |
| | Unrealized
Appreciation ($) | | Unrealized
Depreciation ($) | |
Citi | | 07/08/2016 | | | 257,850,000 | | | JPY | | | | | 2,353,698 | | | USD | | | | | 22,036 | | | | — | | |
HSBC | | 07/08/2016 | | | 2,354,724 | | | USD | | | | | 257,850,000 | | | JPY | | | | | — | | | | (26,191 | ) | |
Total | | | | | | | | | | | | | | | | | | | | | | | 22,036 | | | | (26,191 | ) | |
Total Return Swap Contracts Outstanding at May 31, 2016
Counterparty | | Fund Receives | | Fund Pays | | Expiration
Date | | Notional
Currency | | Notional
Amount | | Premium
Paid ($) | | Premium
Received ($) | | Unrealized
Appreciation
($) | | Unrealized
Depreciation
($) | |
Barclays
| | Total return on
Barclays
Hedging
Insights Index(a) | | Fixed rate of
0.150% | | 11/30/2016 | | USD | | | 9,342,754 | | | | — | | | | — | | | | 94,614 | | | | — | | |
Barclays
| | Total return on
Barclays
TrendStar+ Alt
Roll 2 Index(b) | | Fixed rate of
0.700% | | 11/30/2016 | | USD | | | 19,604,717 | | | | — | | | | — | | | | 105,335 | | | | — | | |
Barclays
| | Total return on
Atlantic High
Yield Investment
Grade Spread
BetaBarclays
Credit Index(c) | | Fixed rate of
0.600% | | 11/30/2016 | | USD | | | 44,611,967 | | | | 1,464 | | | | — | | | | — | | | | (76,267 | ) | |
The accompanying Notes to Consolidated Financial Statements are an integral part of this statement.
Annual Report 2016
8
COLUMBIA ADAPTIVE ALTERNATIVES FUND
CONSOLIDATED PORTFOLIO OF INVESTMENTS (continued)
May 31, 2016
Total Return Swap Contracts Outstanding at May 31, 2016 (continued)
Counterparty | | Fund Receives | | Fund Pays | | Expiration
Date | | Notional
Currency | | Notional
Amount | | Premium
Paid ($) | | Premium
Received ($) | | Unrealized
Appreciation
($) | | Unrealized
Depreciation
($) | |
Deutsche Bank
| | Total return on
Deutsche Bank
Haven Plus —
USD Excess
Return(d) | | Fixed rate of
0.000% | | 11/30/2016 | | USD | | | 5,980,040 | | | | — | | | | — | | | | 70,867 | | | | — | | |
Deutsche Bank
| | Total return on
Deutsche Bank
Equity Sector
Neutral Quality
Factor Index —
USD Excess
Return(e) | | Fixed rate of
0.000% | | 11/30/2016 | | USD | | | 18,466,551 | | | | 260 | | | | — | | | | — | | | | (80,903 | ) | |
Deutsche Bank
| | Total return on
Deutsche Bank
Equity Low Beta
Turnover Control
Factor Index —
USD Excess
Return(e) | | Fixed rate of
0.000% | | 11/30/2016 | | USD | | | 11,077,336 | | | | 196 | | | | — | | | | 42,595 | | | | — | | |
Deutsche Bank
| | Total return on
Deutsche Bank
Equity
Risk-Adjusted
Momentum
Factor Index —
USD Excess
Return(f) | | Fixed rate of
0.000% | | 11/30/2016 | | USD | | | 11,542,394 | | | | 195 | | | | — | | | | 20,843 | | | | — | | |
Deutsche Bank
| | Total return on
Deutsche Bank
Equity Sector
Neutral Value
Factor Index —
USD Excess
Return(e) | | Fixed rate of
0.000% | | 11/30/2016 | | USD | | | 15,904,626 | | | | 225 | | | | — | | | | 22,589 | | | | — | | |
Deutsche Bank
| | Total return on
Deutsche Bank
Currency
Valuation —
USD Excess
Return(d) | | Fixed rate of
0.000% | | 11/30/2016 | | USD | | | 16,816,718 | | | | — | | | | — | | | | — | | | | (10,836 | ) | |
Goldman Sachs
International
| | Total return on
Goldman Sachs
Risk Premia
Basket
Series 27
Excess Return(g) | | Fixed rate of
0.350% | | 10/21/2016 | | USD | | | 22,303,054 | | | | — | | | | — | | | | — | | | | (309,323 | ) | |
Goldman Sachs
International
| | Total return on
Goldman Sachs
Commodity
Volatility Carry
Series 18
Excess Return
Strategy(h) | | Fixed rate of
0.350% | | 11/30/2016 | | USD | | | 12,020,058 | | | | — | | | | — | | | | 304,975 | | | | — | | |
Goldman Sachs
International
| | Total return on
Goldman Sachs
Momentum
Risk Premium
Basket Index
RP17(i) | | Fixed rate of
0.310% | | 11/30/2016 | | USD | | | 4,544,659 | | | | — | | | | — | | | | — | | | | (6,117 | ) | |
The accompanying Notes to Consolidated Financial Statements are an integral part of this statement.
Annual Report 2016
9
COLUMBIA ADAPTIVE ALTERNATIVES FUND
CONSOLIDATED PORTFOLIO OF INVESTMENTS (continued)
May 31, 2016
Total Return Swap Contracts Outstanding at May 31, 2016 (continued)
Counterparty | | Fund Receives | | Fund Pays | | Expiration
Date | | Notional
Currency | | Notional
Amount | | Premium
Paid ($) | | Premium
Received ($) | | Unrealized
Appreciation
($) | | Unrealized
Depreciation
($) | |
Goldman Sachs
International
| | Total return on
Goldman Sachs
FX EM & G10
3 Month
Valuation Index
C0014(j) | | Fixed rate of
0.180% | | 11/30/2016 | | USD | | | 5,106,344 | | | | — | | | | — | | | | 6,384 | | | | — | | |
Goldman Sachs
International
| | Total return on
Goldman Sachs
FX EM & G10
3 Month Carry
Index C0015(j) | | Fixed rate of
0.260% | | 11/30/2016 | | USD | | | 4,229,636 | | | | — | | | | — | | | | — | | | | (1,725 | ) | |
Goldman Sachs
International
| | Total return on
Goldman Sachs
FX Time Series
Momentum
Index C0038(j) | | Fixed rate of
0.220% | | 11/30/2016 | | USD | | | 9,131,422 | | | | — | | | | — | | | | — | | | | (54,481 | ) | |
Goldman Sachs
International
| | Total return on
Goldman Sachs
TY Volatility
Carry X5 Index
Class E(k) | | Fixed rate of
0.230% | | 11/30/2016 | | USD | | | 14,737,327 | | | | — | | | | — | | | | 5,002 | | | | — | | |
Goldman Sachs
International
| | Total return on
Goldman Sachs
Commodity
Curve Risk
Premium Index(a) | | Fixed rate of
0.110% | | 11/30/2016 | | USD | | | 23,218,085 | | | | — | | | | — | | | | — | | | | (83,927 | ) | |
Goldman Sachs
International
| | Total return on
Goldman Sachs
Carry Risk
Premium Basket
Index RP16(i) | | Fixed rate of
0.280% | | 11/30/2016 | | USD | | | 11,036,249 | | | | — | | | | — | | | | — | | | | (1,302 | ) | |
Goldman Sachs
International
| | Total return on
Goldman Sachs
Curve Index
C0046(l) | | Fixed rate of
0.140% | | 11/30/2016 | | USD | | | 38,614,747 | | | | — | | | | — | | | | — | | | | (27,109 | ) | |
Goldman Sachs
International
| | Total return on
Goldman Sachs
Rates and
Bonds Time
Series
Momentum
Index C0042(l) | | Fixed rate of
0.210% | | 11/30/2016 | | USD | | | 22,976,392 | | | | — | | | | — | | | | — | | | | (41,030 | ) | |
Goldman Sachs
International
| | Total return on
Goldman Sachs
RP Equity World
Long Short
Series 37
Excess Return(e) | | Fixed rate of
0.110% | | 11/30/2016 | | USD | | | 89,150,884 | | | | — | | | | — | | | | 103,936 | | | | — | | |
Morgan Stanley
| | Total return on
Morgan Stanley
FX VolNet
Premium
Strategy
Series 2(m) | | Fixed rate of
0.800% | | 11/30/2016 | | USD | | | 915,000 | | | | 696 | | | | — | | | | 13,343 | | | | — | | |
Morgan Stanley
| | Total return on
Morgan Stanley
FX VolNet
Premium
Strategy
Series 2(m) | | Fixed rate of
0.800% | | 11/30/2016 | | USD | | | 8,240,000 | | | | 248 | | | | — | | | | 126,076 | | | | — | | |
The accompanying Notes to Consolidated Financial Statements are an integral part of this statement.
Annual Report 2016
10
COLUMBIA ADAPTIVE ALTERNATIVES FUND
CONSOLIDATED PORTFOLIO OF INVESTMENTS (continued)
May 31, 2016
Total Return Swap Contracts Outstanding at May 31, 2016 (continued)
Counterparty | | Fund Receives | | Fund Pays | | Expiration
Date | | Notional
Currency | | Notional
Amount | | Premium
Paid ($) | | Premium
Received ($) | | Unrealized
Appreciation
($) | | Unrealized
Depreciation
($) | |
Morgan Stanley
| | Total return on
Morgan Stanley
SmartInvest
Alpha Index(n) | | Fixed rate of
0.750% | | 11/30/2016 | | USD | | | 7,677,925 | | | | — | | | | — | | | | 12,425 | | | | — | | |
Morgan Stanley
| | Total return on
Morgan Stanley
VolNet
PremiumPlus2
Index(o) | | Fixed rate of
0.800% | | 11/30/2016 | | USD | | | 11,402,524 | | | | — | | | | — | | | | 99,703 | | | | — | | |
Total | | | | | | | | | | | | | 3,284 | | | | — | | | | 1,028,687 | | | | (693,020 | ) | |
(a) Underlying assets of this index include long/short domestic commodity futures.
(b) Underlying assets of this index include interest rate swaps of 2 year and 10 year durations.
(c) Underlying assets of this index include credit default swaps on high yield, investment grade, and foreign indices.
(d) Underlying assets of this index include USD and long/short foreign currencies.
(e) Underlying assets of this index include long/short foreign and domestic equities.
(f) Underlying assets of this index include long foreign and domestic equities and a short domestic ETF.
(g) Underlying assets of this index include forward foreign currency exchange contracts, long/short commodity futures, long/short foreign and domestic bond futures, options on short commodity futures, options on foreign and domestic indices and long/short foreign and domestic equities.
(h) Underlying assets of this index include long/short options on a domestic index and long/short futures and options on commodities.
(i) Underlying assets of this index include long/short commodity futures and forward foreign currency exchange contracts.
(j) Underlying assets of this index include forward foreign currency exchange contracts.
(k) Underlying assets of this index include long futures on treasuries and short options on treasuries.
(l) Underlying assets of this index include long/short foreign and domestic bond futures.
(m) Underlying assets of this index include capped variance swaps on currencies.
(n) Underlying assets of this index include long domestic equities and a short domestic index.
(o) Underlying assets of this index include long/short puts and calls on a domestic index.
Notes to Consolidated Portfolio of Investments
(a) As defined in the Investment Company Act of 1940, an affiliated company is one in which the Fund owns 5% or more of the company's outstanding voting securities, or a company which is under common ownership or control with the Fund. Holdings and transactions in these affiliated companies during the year ended May 31, 2016 are as follows:
Issuer | | Beginning
Cost ($) | | Purchase
Cost ($) | | Proceeds
From
Sales ($) | | Realized
Gain
(Loss) ($) | | Ending
Cost ($) | | Capital Gain
Distributions ($) | | Dividends —
Affiliated
Issuers ($) | | Value ($) | |
Blackstone Alternative
Multi-Strategy Fund* | | | 87,800,000 | | | | 25,451,327 | | | | (5,900,000 | ) | | | 143,902 | | | | 107,495,229 | | | | — | | | | — | | | | 107,002,361 | | |
Columbia Commodity
Strategy Fund,
Class I Shares | | | 5,465,176 | | | | 2,540,000 | | | | (2,055,000 | ) | | | (366,345 | ) | | | 5,583,831 | | | | — | | | | — | | | | 5,445,805 | | |
Columbia Inflation
Protected Securities Fund,
Class I Shares | | | 5,512,793 | | | | — | | | | (5,212,769 | ) | | | (300,024 | ) | | | — | | | | — | | | | — | | | | — | | |
Columbia Real Estate
Equity Fund,
Class I Shares | | | 5,643,007 | | | | 276,899 | | | | (3,899,999 | ) | | | (650,980 | ) | | | 1,368,927 | | | | 219,086 | | | | 57,814 | | | | 1,331,058 | | |
The accompanying Notes to Consolidated Financial Statements are an integral part of this statement.
Annual Report 2016
11
COLUMBIA ADAPTIVE ALTERNATIVES FUND
CONSOLIDATED PORTFOLIO OF INVESTMENTS (continued)
May 31, 2016
Notes to Consolidated Portfolio of Investments (continued)
Issuer | | Beginning
Cost ($) | | Purchase
Cost ($) | | Proceeds
From
Sales ($) | | Realized
Gain
(Loss) ($) | | Ending
Cost ($) | | Capital Gain
Distributions ($) | | Dividends —
Affiliated
Issuers ($) | | Value ($) | |
Columbia Short-Term
Cash Fund | | | 48,352,793 | | | | 188,077,485 | | | | (143,390,969 | ) | | | — | | | | 93,039,309 | | | | — | | | | 179,709 | | | | 93,039,309 | | |
Total | | | 152,773,769 | | | | 216,345,711 | | | | (160,458,737 | ) | | | (1,173,447 | ) | | | 207,487,296 | | | | 219,086 | | | | 237,523 | | | | 206,818,533 | | |
*Issuer was not an affiliate for the entire period ended May 31, 2016.
(b) Non-income producing investment.
(c) The rate shown is the seven-day current annualized yield at May 31, 2016.
Currency Legend
JPY Japanese Yen
USD US Dollar
Fair Value Measurements
The Fund categorizes its fair value measurements according to a three-level hierarchy that maximizes the use of observable inputs and minimizes the use of unobservable inputs by prioritizing that the most observable input be used when available. Observable inputs are those that market participants would use in pricing an investment based on market data obtained from sources independent of the reporting entity. Unobservable inputs are those that reflect the Fund's assumptions about the information market participants would use in pricing an investment. An investment's level within the fair value hierarchy is based on the lowest level of any input that is deemed significant to the asset's or liability's fair value measurement. The input levels are not necessarily an indication of the risk or liquidity associated with investments at that level. For example, certain U.S. government securities are generally high quality and liquid, however, they are reflected as Level 2 because the inputs used to determine fair value may not always be quoted prices in an active market.
Fair value inputs are summarized in the three broad levels listed below:
> Level 1 — Valuations based on quoted prices for investments in active markets that the Fund has the ability to access at the measurement date (including NAV for open-end mutual funds). Valuation adjustments are not applied to Level 1 investments.
> Level 2 — Valuations based on other significant observable inputs (including quoted prices for similar securities, interest rates, prepayment speeds, credit risks, etc.).
> Level 3 — Valuations based on significant unobservable inputs (including the Fund's own assumptions and judgment in determining the fair value of investments).
Inputs that are used in determining fair value of an investment may include price information, credit data, volatility statistics, and other factors. These inputs can be either observable or unobservable. The availability of observable inputs can vary between investments, and is affected by various factors such as the type of investment, and the volume and level of activity for that investment or similar investments in the marketplace. The inputs will be considered by the Investment Manager, along with any other relevant factors in the calculation of an investment's fair value. The Fund uses prices and inputs that are current as of the measurement date, which may include periods of market dislocations. During these periods, the availability of prices and inputs may be reduced for many investments. This condition could cause an investment to be reclassified between the various levels within the hierarchy.
Certain investments that have been measured at fair value using the net asset value per share (or its equivalent) are not categorized in the fair value hierarchy. The fair value amounts presented in the table are intended to reconcile the fair value hierarchy to the amounts presented in the Consolidated Portfolio of Investments. The Columbia Short-Term Cash Fund seeks to provide shareholders with maximum current income consistent with liquidity and stability of principal. Investments in Columbia Short-Term Cash Fund may be redeemed on a daily basis without restriction.
Investments falling into the Level 3 category are primarily supported by quoted prices from brokers and dealers participating in the market for those investments. However, these may be classified as Level 3 investments due to lack of market transparency and corroboration to support these quoted prices. Additionally, valuation models may be used as the pricing source for any remaining investments classified as Level 3. These models may rely on one or more significant unobservable inputs and/or significant assumptions by the Investment Manager. Inputs used in valuations may include, but are not limited to, financial statement analysis, capital account balances, discount rates and estimated cash flows, and comparable company data.
Under the direction of the Fund's Board of Trustees (the Board), the Investment Manager's Valuation Committee (the Committee) is responsible for overseeing the valuation procedures approved by the Board. The Committee consists of voting and non-voting members from various groups within the Investment Manager's organization, including operations and accounting, trading and investments, compliance, risk management and legal.
The accompanying Notes to Consolidated Financial Statements are an integral part of this statement.
Annual Report 2016
12
COLUMBIA ADAPTIVE ALTERNATIVES FUND
CONSOLIDATED PORTFOLIO OF INVESTMENTS (continued)
May 31, 2016
Fair Value Measurements (continued)
The Committee meets at least monthly to review and approve valuation matters, which may include a description of specific valuation determinations, data regarding pricing information received from approved pricing vendors and brokers and the results of Board-approved valuation control policies and procedures (the Policies). The Policies address, among other things, instances when market quotations are or are not readily available, including recommendations of third party pricing vendors and a determination of appropriate pricing methodologies; events that require specific valuation determinations and assessment of fair value techniques; securities with a potential for stale pricing, including those that are illiquid, restricted, or in default; and the effectiveness of third party pricing vendors, including periodic reviews of vendors. The Committee meets more frequently, as needed, to discuss additional valuation matters, which may include the need to review back-testing results, review time-sensitive information or approve related valuation actions. The Committee reports to the Board, with members of the Committee meeting with the Board at each of its regularly scheduled meetings to discuss valuation matters and actions during the period, similar to those described earlier.
For investments categorized as Level 3, the Committee monitors information similar to that described above, which may include: (i) data specific to the issuer or comparable issuers, (ii) general market or specific sector news and (iii) quoted prices and specific or similar security transactions. The Committee considers this data and any changes from prior periods in order to assess the reasonableness of observable and unobservable inputs, any assumptions or internal models used to value those securities and changes in fair value. This data is also used to corroborate, when available, information received from approved pricing vendors and brokers. Various factors impact the frequency of monitoring this information (which may occur as often as daily). However, the Committee may determine that changes to inputs, assumptions and models are not required as a result of the monitoring procedures performed.
The following table is a summary of the inputs used to value the Fund's investments at May 31, 2016:
| | | Level 1
Quoted Prices in Active
Markets for Identical
Assets ($) | | Level 2
Other Significant
Observable Inputs ($) | | Level 3
Significant
Unobservable Inputs ($) | | Total ($) | |
Investments | |
Equity Funds | | | 1,331,058 | | | | — | | | | — | | | | 1,331,058 | | |
Alternative Investment Funds | | | 112,448,166 | | | | — | | | | — | | | | 112,448,166 | | |
Exchange-Traded Funds | | | 6,610,429 | | | | — | | | | — | | | | 6,610,429 | | |
Investments measured at net asset value | |
Money Market Funds | | | — | | | | — | | | | — | | | | 93,039,309 | | |
Total Investments | | | 120,389,653 | | | | — | | | | — | | | | 213,428,962 | | |
Derivatives | |
Assets | |
Forward Foreign Currency Exchange Contracts | | | — | | | | 22,036 | | | | — | | | | 22,036 | | |
Swap Contracts | | | — | | | | — | | | | 1,028,687 | | | | 1,028,687 | | |
Liabilities | |
Forward Foreign Currency Exchange Contracts | | | — | | | | (26,191 | ) | | | — | | | | (26,191 | ) | |
Swap Contracts | | | — | | | | — | | | | (693,020 | ) | | | (693,020 | ) | |
Total | | | 120,389,653 | | | | (4,155 | ) | | | 335,667 | | | | 213,760,474 | | |
See the Consolidated Portfolio of Investments for all investment classifications not indicated in the table.
Derivative instruments are valued at unrealized appreciation (depreciation).
There were no transfers of financial assets between levels during the period.
The Fund does not hold any significant investments (greater than one percent of net assets) categorized as Level 3.
The Fund's assets assigned to the Level 3 category are valued utilizing the valuation technique deemed the most appropriate in the circumstances. Certain swap contracts classified as Level 3 securities are valued using the market approach and utilize single market quotations from broker dealers. The appropriateness of fair values for these securities is monitored on an ongoing basis which may include results of back testing and other control procedures. Significant increases (decreases) to any of these inputs would result in a significantly lower (higher) valuation measurement.
The accompanying Notes to Consolidated Financial Statements are an integral part of this statement.
Annual Report 2016
13
COLUMBIA ADAPTIVE ALTERNATIVES FUND
CONSOLIDATED STATEMENT OF ASSETS AND LIABILITIES
May 31, 2016
Assets | |
Investments, at value | |
Unaffiliated issuers (identified cost $6,782,685) | | $ | 6,610,429 | | |
Affiliated issuers (identified cost $207,487,296) | | | 206,818,533 | | |
Total investments (identified cost $214,269,981) | | | 213,428,962 | | |
Cash collateral held at broker | | | 720,000 | | |
Unrealized appreciation on forward foreign currency exchange contracts | | | 22,036 | | |
Unrealized appreciation on swap contracts | | | 1,028,687 | | |
Premiums paid on outstanding swap contracts | | | 3,284 | | |
Receivable for: | |
Investments sold | | | 458,676 | | |
Capital shares sold | | | 2,692,321 | | |
Dividends | | | 31,981 | | |
Expense reimbursement due from Investment Manager | | | 12,103 | | |
Prepaid expenses | | | 279 | | |
Trustees' deferred compensation plan | | | 7,115 | | |
Total assets | | | 218,405,444 | | |
Liabilities | |
Unrealized depreciation on forward foreign currency exchange contracts | | | 26,191 | | |
Unrealized depreciation on swap contracts | | | 693,020 | | |
Payable for: | |
Investments purchased | | | 2,848,634 | | |
Capital shares purchased | | | 282,931 | | |
Investment management fees | | | 28,649 | | |
Distribution and/or service fees | | | 5,298 | | |
Transfer agent fees | | | 36,225 | | |
Compensation of board members | | | 149 | | |
Chief compliance officer expenses | | | 14 | | |
Other expenses | | | 79,071 | | |
Trustees' deferred compensation plan | | | 7,115 | | |
Total liabilities | | | 4,007,297 | | |
Net assets applicable to outstanding capital stock | | $ | 214,398,147 | | |
Represented by | |
Paid-in capital | | $ | 221,764,652 | | |
Undistributed net investment income | | | 876,959 | | |
Accumulated net realized loss | | | (7,733,957 | ) | |
Unrealized appreciation (depreciation) on: | |
Investments — unaffiliated issuers | | | (172,256 | ) | |
Investments — affiliated issuers | | | (668,763 | ) | |
Forward foreign currency exchange contracts | | | (4,155 | ) | |
Swap contracts | | | 335,667 | | |
Total — representing net assets applicable to outstanding capital stock | | $ | 214,398,147 | | |
The accompanying Notes to Consolidated Financial Statements are an integral part of this statement.
Annual Report 2016
14
COLUMBIA ADAPTIVE ALTERNATIVES FUND
CONSOLIDATED STATEMENT OF ASSETS AND LIABILITIES (continued)
May 31, 2016
Class A | |
Net assets | | $ | 18,578,764 | | |
Shares outstanding | | | 1,970,514 | | |
Net asset value per share | | $ | 9.43 | | |
Maximum offering price per share(a) | | $ | 10.01 | | |
Class C | |
Net assets | | $ | 2,271,610 | | |
Shares outstanding | | | 242,050 | | |
Net asset value per share | | $ | 9.38 | | |
Class I | |
Net assets | | $ | 21,531,078 | | |
Shares outstanding | | | 2,277,059 | | |
Net asset value per share | | $ | 9.46 | | |
Class R | |
Net assets | | $ | 9,408 | | |
Shares outstanding | | | 1,000 | | |
Net asset value per share | | $ | 9.41 | | |
Class R4 | |
Net assets | | $ | 1,010,322 | | |
Shares outstanding | | | 106,958 | | |
Net asset value per share | | $ | 9.45 | | |
Class R5 | |
Net assets | | $ | 9,449 | | |
Shares outstanding | | | 1,000 | | |
Net asset value per share | | $ | 9.45 | | |
Class W | |
Net assets | | $ | 167,527,575 | | |
Shares outstanding | | | 17,783,844 | | |
Net asset value per share | | $ | 9.42 | | |
Class Y | |
Net assets | | $ | 9,453 | | |
Shares outstanding | | | 1,000 | | |
Net asset value per share | | $ | 9.45 | | |
Class Z | |
Net assets | | $ | 3,450,488 | | |
Shares outstanding | | | 366,008 | | |
Net asset value per share | | $ | 9.43 | | |
(a) The maximum offering price per share is calculated by dividing the net asset value per share by 1.0 minus the maximum sales charge of 5.75%.
The accompanying Notes to Consolidated Financial Statements are an integral part of this statement.
Annual Report 2016
15
COLUMBIA ADAPTIVE ALTERNATIVES FUND
CONSOLIDATED STATEMENT OF OPERATIONS
Year Ended May 31, 2016
Net investment income | |
Income: | |
Dividends — unaffiliated issuers | | $ | 2,510,104 | | |
Dividends — affiliated issuers | | | 237,523 | | |
Total income | | | 2,747,627 | | |
Expenses: | |
Investment management fees | | | 2,297,187 | | |
Distribution and/or service fees | |
Class A | | | 39,577 | | |
Class C | | | 17,952 | | |
Class R | | | 48 | | |
Class W | | | 301,579 | | |
Transfer agent fees | |
Class A | | | 42,725 | | |
Class C | | | 4,835 | | |
Class R | | | 25 | | |
Class R4 | | | 1,457 | | |
Class R5 | | | 5 | | |
Class W | | | 321,103 | | |
Class Z | | | 29,922 | | |
Compensation of board members | | | 28,741 | | |
Custodian fees | | | 3,721 | | |
Printing and postage fees | | | 83,865 | | |
Registration fees | | | 123,487 | | |
Audit fees | | | 53,770 | | |
Legal fees | | | 6,000 | | |
Chief compliance officer expenses | | | 109 | | |
Other | | | 116,504 | | |
Total expenses | | | 3,472,612 | | |
Fees waived or expenses reimbursed by Investment Manager and its affiliates | | | (1,191,019 | ) | |
Total net expenses | | | 2,281,593 | | |
Net investment income | | | 466,034 | | |
Realized and unrealized gain (loss) — net | |
Net realized gain (loss) on: | |
Investments — unaffiliated issuers | | | (1,749,205 | ) | |
Investments — affiliated issuers | | | (1,173,447 | ) | |
Capital gain distributions from underlying affiliated funds | | | 219,086 | | |
Foreign currency translations | | | 11,249 | | |
Forward foreign currency exchange contracts | | | (167,663 | ) | |
Futures contracts | | | (1,356,980 | ) | |
Swap contracts | | | (296,123 | ) | |
Net realized loss | | | (4,513,083 | ) | |
Net change in unrealized appreciation (depreciation) on: | |
Investments — unaffiliated issuers | | | 32,893 | | |
Investments — affiliated issuers | | | (3,015,173 | ) | |
Forward foreign currency exchange contracts | | | (4,155 | ) | |
Futures contracts | | | 116,613 | | |
Swap contracts | | | 444,980 | | |
Net change in unrealized depreciation | | | (2,424,842 | ) | |
Net realized and unrealized loss | | | (6,937,925 | ) | |
Net decrease in net assets from operations | | $ | (6,471,891 | ) | |
The accompanying Notes to Consolidated Financial Statements are an integral part of this statement.
Annual Report 2016
16
COLUMBIA ADAPTIVE ALTERNATIVES FUND
CONSOLIDATED STATEMENT OF CHANGES IN NET ASSETS
| | | Year Ended
May 31,
2016 | | Year Ended
May 31,
2015(a) | |
Operations | |
Net investment income (loss) | | $ | 466,034 | | | $ | (697,252 | ) | |
Net realized loss | | | (4,513,083 | ) | | | (3,839,934 | ) | |
Net change in unrealized appreciation (depreciation) | | | (2,424,842 | ) | | | 1,915,335 | | |
Net decrease in net assets resulting from operations | | | (6,471,891 | ) | | | (2,621,851 | ) | |
Distributions to shareholders | |
Net investment income | |
Class A | | | (111,301 | ) | | | — | | |
Class C | | | (3,424 | ) | | | — | | |
Class I | | | (182,360 | ) | | | — | | |
Class R | | | (44 | ) | | | — | | |
Class R4 | | | (7,948 | ) | | | — | | |
Class R5 | | | (78 | ) | | | — | | |
Class W | | | (688,958 | ) | | | — | | |
Class Y | | | (81 | ) | | | — | | |
Class Z | | | (5,611 | ) | | | — | | |
Total distributions to shareholders | | | (999,805 | ) | | | — | | |
Increase in net assets from capital stock activity | | | 45,354,149 | | | | 144,137,435 | | |
Total increase in net assets | | | 37,882,453 | | | | 141,515,584 | | |
Net assets at beginning of year | | | 176,515,694 | | | | 35,000,110 | | |
Net assets at end of year | | $ | 214,398,147 | | | $ | 176,515,694 | | |
Undistributed net investment income | | $ | 876,959 | | | $ | 10,908 | | |
(a) Based on operations from January 28, 2015 (commencement of operations) through the stated period end.
The accompanying Notes to Consolidated Financial Statements are an integral part of this statement.
Annual Report 2016
17
COLUMBIA ADAPTIVE ALTERNATIVES FUND
CONSOLIDATED STATEMENT OF CHANGES IN NET ASSETS (continued)
| | | Year Ended May 31, 2016 | | Year Ended May 31, 2015(a) | |
| | | Shares | | Dollars ($) | | Shares | | Dollars ($) | |
Capital stock activity | |
Class A shares | |
Subscriptions | | | 2,457,215 | | | | 23,500,707 | | | | 460,028 | | | | 4,541,390 | | |
Distributions reinvested | | | 11,784 | | | | 111,243 | | | | — | | | | — | | |
Redemptions | | | (952,381 | ) | | | (8,922,663 | ) | | | (7,132 | ) | | | (69,903 | ) | |
Net increase | | | 1,516,618 | | | | 14,689,287 | | | | 452,896 | | | | 4,471,487 | | |
Class C shares | |
Subscriptions | | | 162,526 | | | | 1,549,976 | | | | 93,835 | | | | 924,788 | | |
Distributions reinvested | | | 362 | | | | 3,408 | | | | — | | | | — | | |
Redemptions | | | (15,673 | ) | | | (147,665 | ) | | | — | | | | — | | |
Net increase | | | 147,215 | | | | 1,405,719 | | | | 93,835 | | | | 924,788 | | |
Class I shares | |
Subscriptions | | | — | | | | — | | | | 2,256,770 | | | | 22,500,000 | | |
Distributions reinvested | | | 19,289 | | | | 182,279 | | | | — | | | | — | | |
Net increase | | | 19,289 | | | | 182,279 | | | | 2,256,770 | | | | 22,500,000 | | |
Class R4 shares | |
Subscriptions | | | 116,664 | | | | 1,119,304 | | | | — | | | | — | | |
Distributions reinvested | | | 832 | | | | 7,850 | | | | — | | | | — | | |
Redemptions | | | (11,538 | ) | | | (107,865 | ) | | | — | | | | — | | |
Net increase | | | 105,958 | | | | 1,019,289 | | | | — | | | | — | | |
Class W shares | |
Subscriptions | | | 8,593,180 | | | | 80,645,108 | | | | 12,324,400 | | | | 123,209,339 | | |
Distributions reinvested | | | 73,054 | | | | 688,900 | | | | — | | | | — | | |
Redemptions | | | (2,478,236 | ) | | | (23,456,091 | ) | | | (729,554 | ) | | | (7,243,204 | ) | |
Net increase | | | 6,187,998 | | | | 57,877,917 | | | | 11,594,846 | | | | 115,966,135 | | |
Class Z shares | |
Subscriptions | | | 414,721 | | | | 3,884,973 | | | | 27,500 | | | | 275,025 | | |
Distributions reinvested | | | 573 | | | | 5,411 | | | | — | | | | — | | |
Redemptions | | | (3,568,786 | ) | | | (33,710,726 | ) | | | — | | | | — | | |
Net increase (decrease) | | | (3,153,492 | ) | | | (29,820,342 | ) | | | 27,500 | | | | 275,025 | | |
Total net increase | | | 4,823,586 | | | | 45,354,149 | | | | 14,425,847 | | | | 144,137,435 | | |
(a) Based on operations from January 28, 2015 (commencement of operations) through the stated period end.
The accompanying Notes to Consolidated Financial Statements are an integral part of this statement.
Annual Report 2016
18
COLUMBIA ADAPTIVE ALTERNATIVES FUND
CONSOLIDATED FINANCIAL HIGHLIGHTS
The following tables are intended to help you understand the Fund's financial performance. Certain information reflects financial results for a single share of a class held for the periods shown. Per share net investment income (loss) amounts are calculated based on average shares outstanding during the period. Total return assumes reinvestment of all dividends and distributions, if any. Total return does not reflect payment of sales charges, if any. Total return and portfolio turnover are not annualized for periods of less than one year. The portfolio turnover rate is calculated without regard to purchase and sales transactions of short-term instruments and certain derivatives, if any. If such transactions were included, the Fund's portfolio turnover rate may be higher.
| | | Year Ended May 31, | |
Class A | | 2016 | | 2015(a) | |
Per share data | |
Net asset value, beginning of period | | $ | 9.85 | | | $ | 10.00 | | |
Income from investment operations: | |
Net investment income (loss) | | | 0.05 | | | | (0.05 | ) | |
Net realized and unrealized loss | | | (0.41 | ) | | | (0.10 | ) | |
Total from investment operations | | | (0.36 | ) | | | (0.15 | ) | |
Less distributions to shareholders: | |
Net investment income | | | (0.06 | ) | | | — | | |
Total distributions to shareholders | | | (0.06 | ) | | | — | | |
Net asset value, end of period | | $ | 9.43 | | | $ | 9.85 | | |
Total return | | | (3.67 | %) | | | (1.50 | %) | |
Ratios to average net assets(b) | |
Total gross expenses | | | 2.09 | % | | | 2.08 | %(c) | |
Total net expenses(d) | | | 1.39 | % | | | 1.50 | %(c) | |
Net investment income (loss) | | | 0.49 | % | | | (1.42 | %)(c) | |
Supplemental data | |
Net assets, end of period (in thousands) | | $ | 18,579 | | | $ | 4,470 | | |
Portfolio turnover | | | 32 | % | | | 28 | % | |
Notes to Consolidated Financial Highlights
(a) Based on operations from January 28, 2015 (commencement of operations) through the stated period end.
(b) In addition to the fees and expenses that the Fund bears directly, the Fund indirectly bears a pro rata share of the fees and expenses of any other funds in which it invests. Such indirect expenses are not included in the Fund's reported expense ratios.
(c) Annualized.
(d) Total net expenses include the impact of certain fee waivers/expense reimbursements made by the Investment Manager and certain of its affiliates, if applicable.
The accompanying Notes to Consolidated Financial Statements are an integral part of this statement.
Annual Report 2016
19
COLUMBIA ADAPTIVE ALTERNATIVES FUND
CONSOLIDATED FINANCIAL HIGHLIGHTS (continued)
| | | Year Ended May 31, | |
Class C | | 2016 | | 2015(a) | |
Per share data | |
Net asset value, beginning of period | | $ | 9.83 | | | $ | 10.00 | | |
Income from investment operations: | |
Net investment loss | | | (0.03 | ) | | | (0.07 | ) | |
Net realized and unrealized loss | | | (0.40 | ) | | | (0.10 | ) | |
Total from investment operations | | | (0.43 | ) | | | (0.17 | ) | |
Less distributions to shareholders: | |
Net investment income | | | (0.02 | ) | | | — | | |
Total distributions to shareholders | | | (0.02 | ) | | | — | | |
Net asset value, end of period | | $ | 9.38 | | | $ | 9.83 | | |
Total return | | | (4.42 | %) | | | (1.70 | %) | |
Ratios to average net assets(b) | |
Total gross expenses | | | 2.84 | % | | | 2.83 | %(c) | |
Total net expenses(d) | | | 2.14 | % | | | 2.25 | %(c) | |
Net investment loss | | | (0.34 | %) | | | (2.18 | %)(c) | |
Supplemental data | |
Net assets, end of period (in thousands) | | $ | 2,272 | | | $ | 932 | | |
Portfolio turnover | | | 32 | % | | | 28 | % | |
Notes to Consolidated Financial Highlights
(a) Based on operations from January 28, 2015 (commencement of operations) through the stated period end.
(b) In addition to the fees and expenses that the Fund bears directly, the Fund indirectly bears a pro rata share of the fees and expenses of any other funds in which it invests. Such indirect expenses are not included in the Fund's reported expense ratios.
(c) Annualized.
(d) Total net expenses include the impact of certain fee waivers/expense reimbursements made by the Investment Manager and certain of its affiliates, if applicable.
The accompanying Notes to Consolidated Financial Statements are an integral part of this statement.
Annual Report 2016
20
COLUMBIA ADAPTIVE ALTERNATIVES FUND
CONSOLIDATED FINANCIAL HIGHLIGHTS (continued)
| | | Year Ended May 31, | |
Class I | | 2016 | | 2015(a) | |
Per share data | |
Net asset value, beginning of period | | $ | 9.86 | | | $ | 10.00 | | |
Income from investment operations: | |
Net investment income (loss) | | | 0.07 | | | | (0.03 | ) | |
Net realized and unrealized loss | | | (0.39 | ) | | | (0.11 | ) | |
Total from investment operations | | | (0.32 | ) | | | (0.14 | ) | |
Less distributions to shareholders: | |
Net investment income | | | (0.08 | ) | | | — | | |
Total distributions to shareholders | | | (0.08 | ) | | | — | | |
Net asset value, end of period | | $ | 9.46 | | | $ | 9.86 | | |
Total return | | | (3.24 | %) | | | (1.40 | %) | |
Ratios to average net assets(b) | |
Total gross expenses | | | 1.57 | % | | | 1.58 | %(c) | |
Total net expenses(d) | | | 0.99 | % | | | 1.11 | %(c) | |
Net investment income (loss) | | | 0.73 | % | | | (0.98 | %)(c) | |
Supplemental data | |
Net assets, end of period (in thousands) | | $ | 21,531 | | | $ | 22,263 | | |
Portfolio turnover | | | 32 | % | | | 28 | % | |
Notes to Consolidated Financial Highlights
(a) Based on operations from January 28, 2015 (commencement of operations) through the stated period end.
(b) In addition to the fees and expenses that the Fund bears directly, the Fund indirectly bears a pro rata share of the fees and expenses of any other funds in which it invests. Such indirect expenses are not included in the Fund's reported expense ratios.
(c) Annualized.
(d) Total net expenses include the impact of certain fee waivers/expense reimbursements made by the Investment Manager and certain of its affiliates, if applicable.
The accompanying Notes to Consolidated Financial Statements are an integral part of this statement.
Annual Report 2016
21
COLUMBIA ADAPTIVE ALTERNATIVES FUND
CONSOLIDATED FINANCIAL HIGHLIGHTS (continued)
| | | Year Ended May 31, | |
Class R | | 2016 | | 2015(a) | |
Per share data | |
Net asset value, beginning of period | | $ | 9.84 | | | $ | 10.00 | | |
Income from investment operations: | |
Net investment income (loss) | | | 0.01 | | | | (0.05 | ) | |
Net realized and unrealized loss | | | (0.40 | ) | | | (0.11 | ) | |
Total from investment operations | | | (0.39 | ) | | | (0.16 | ) | |
Less distributions to shareholders: | |
Net investment income | | | (0.04 | ) | | | — | | |
Total distributions to shareholders | | | (0.04 | ) | | | — | | |
Net asset value, end of period | | $ | 9.41 | | | $ | 9.84 | | |
Total return | | | (3.92 | %) | | | (1.60 | %) | |
Ratios to average net assets(b) | |
Total gross expenses | | | 2.33 | % | | | 2.33 | %(c) | |
Total net expenses(d) | | | 1.64 | % | | | 1.73 | %(c) | |
Net investment income (loss) | | | 0.09 | % | | | (1.59 | %)(c) | |
Supplemental data | |
Net assets, end of period (in thousands) | | $ | 9 | | | $ | 10 | | |
Portfolio turnover | | | 32 | % | | | 28 | % | |
Notes to Consolidated Financial Highlights
(a) Based on operations from January 28, 2015 (commencement of operations) through the stated period end.
(b) In addition to the fees and expenses that the Fund bears directly, the Fund indirectly bears a pro rata share of the fees and expenses of any other funds in which it invests. Such indirect expenses are not included in the Fund's reported expense ratios.
(c) Annualized.
(d) Total net expenses include the impact of certain fee waivers/expense reimbursements made by the Investment Manager and certain of its affiliates, if applicable.
The accompanying Notes to Consolidated Financial Statements are an integral part of this statement.
Annual Report 2016
22
COLUMBIA ADAPTIVE ALTERNATIVES FUND
CONSOLIDATED FINANCIAL HIGHLIGHTS (continued)
| | | Year Ended May 31, | |
Class R4 | | 2016 | | 2015(a) | |
Per share data | |
Net asset value, beginning of period | | $ | 9.86 | | | $ | 10.00 | | |
Income from investment operations: | |
Net investment income (loss) | | | 0.19 | | | | (0.04 | ) | |
Net realized and unrealized loss | | | (0.53 | ) | | | (0.10 | ) | |
Total from investment operations | | | (0.34 | ) | | | (0.14 | ) | |
Less distributions to shareholders: | |
Net investment income | | | (0.07 | ) | | | — | | |
Total distributions to shareholders | | | (0.07 | ) | | | — | | |
Net asset value, end of period | | $ | 9.45 | | | $ | 9.86 | | |
Total return | | | (3.42 | %) | | | (1.40 | %) | |
Ratios to average net assets(b) | |
Total gross expenses | | | 1.83 | % | | | 1.80 | %(c) | |
Total net expenses(d) | | | 1.12 | % | | | 1.23 | %(c) | |
Net investment income (loss) | | | 2.03 | % | | | (1.09 | %)(c) | |
Supplemental data | |
Net assets, end of period (in thousands) | | $ | 1,010 | | | $ | 10 | | |
Portfolio turnover | | | 32 | % | | | 28 | % | |
Notes to Consolidated Financial Highlights
(a) Based on operations from January 28, 2015 (commencement of operations) through the stated period end.
(b) In addition to the fees and expenses that the Fund bears directly, the Fund indirectly bears a pro rata share of the fees and expenses of any other funds in which it invests. Such indirect expenses are not included in the Fund's reported expense ratios.
(c) Annualized.
(d) Total net expenses include the impact of certain fee waivers/expense reimbursements made by the Investment Manager and certain of its affiliates, if applicable.
The accompanying Notes to Consolidated Financial Statements are an integral part of this statement.
Annual Report 2016
23
COLUMBIA ADAPTIVE ALTERNATIVES FUND
CONSOLIDATED FINANCIAL HIGHLIGHTS (continued)
| | | Year Ended May 31, | |
Class R5 | | 2016 | | 2015(a) | |
Per share data | |
Net asset value, beginning of period | | $ | 9.86 | | | $ | 10.00 | | |
Income from investment operations: | |
Net investment income (loss) | | | 0.07 | | | | (0.03 | ) | |
Net realized and unrealized loss | | | (0.40 | ) | | | (0.11 | ) | |
Total from investment operations | | | (0.33 | ) | | | (0.14 | ) | |
Less distributions to shareholders: | |
Net investment income | | | (0.08 | ) | | | — | | |
Total distributions to shareholders | | | (0.08 | ) | | | — | | |
Net asset value, end of period | | $ | 9.45 | | | $ | 9.86 | | |
Total return | | | (3.37 | %) | | | (1.40 | %) | |
Ratios to average net assets(b) | |
Total gross expenses | | | 1.62 | % | | | 1.63 | %(c) | |
Total net expenses(d) | | | 1.04 | % | | | 1.17 | %(c) | |
Net investment income (loss) | | | 0.69 | % | | | (1.03 | %)(c) | |
Supplemental data | |
Net assets, end of period (in thousands) | | $ | 9 | | | $ | 10 | | |
Portfolio turnover | | | 32 | % | | | 28 | % | |
Notes to Consolidated Financial Highlights
(a) Based on operations from January 28, 2015 (commencement of operations) through the stated period end.
(b) In addition to the fees and expenses that the Fund bears directly, the Fund indirectly bears a pro rata share of the fees and expenses of any other funds in which it invests. Such indirect expenses are not included in the Fund's reported expense ratios.
(c) Annualized.
(d) Total net expenses include the impact of certain fee waivers/expense reimbursements made by the Investment Manager and certain of its affiliates, if applicable.
The accompanying Notes to Consolidated Financial Statements are an integral part of this statement.
Annual Report 2016
24
COLUMBIA ADAPTIVE ALTERNATIVES FUND
CONSOLIDATED FINANCIAL HIGHLIGHTS (continued)
| | | Year Ended May 31, | |
Class W | | 2016 | | 2015(a) | |
Per share data | |
Net asset value, beginning of period | | $ | 9.84 | | | $ | 10.00 | | |
Income from investment operations: | |
Net investment income (loss) | | | 0.02 | | | | (0.05 | ) | |
Net realized and unrealized loss | | | (0.38 | ) | | | (0.11 | ) | |
Total from investment operations | | | (0.36 | ) | | | (0.16 | ) | |
Less distributions to shareholders: | |
Net investment income | | | (0.06 | ) | | | — | | |
Total distributions to shareholders | | | (0.06 | ) | | | — | | |
Net asset value, end of period | | $ | 9.42 | | | $ | 9.84 | | |
Total return | | | (3.68 | %) | | | (1.60 | %) | |
Ratios to average net assets(b) | |
Total gross expenses | | | 2.09 | % | | | 2.07 | %(c) | |
Total net expenses(d) | | | 1.38 | % | | | 1.48 | %(c) | |
Net investment income (loss) | | | 0.24 | % | | | (1.35 | %)(c) | |
Supplemental data | |
Net assets, end of period (in thousands) | | $ | 167,528 | | | $ | 114,125 | | |
Portfolio turnover | | | 32 | % | | | 28 | % | |
Notes to Consolidated Financial Highlights
(a) Based on operations from January 28, 2015 (commencement of operations) through the stated period end.
(b) In addition to the fees and expenses that the Fund bears directly, the Fund indirectly bears a pro rata share of the fees and expenses of any other funds in which it invests. Such indirect expenses are not included in the Fund's reported expense ratios.
(c) Annualized.
(d) Total net expenses include the impact of certain fee waivers/expense reimbursements made by the Investment Manager and certain of its affiliates, if applicable.
The accompanying Notes to Consolidated Financial Statements are an integral part of this statement.
Annual Report 2016
25
COLUMBIA ADAPTIVE ALTERNATIVES FUND
CONSOLIDATED FINANCIAL HIGHLIGHTS (continued)
| | | Year Ended May 31, | |
Class Y | | 2016 | | 2015(a) | |
Per share data | |
Net asset value, beginning of period | | $ | 9.86 | | | $ | 10.00 | | |
Income from investment operations: | |
Net investment income (loss) | | | 0.07 | | | | (0.03 | ) | |
Net realized and unrealized loss | | | (0.40 | ) | | | (0.11 | ) | |
Total from investment operations | | | (0.33 | ) | | | (0.14 | ) | |
Less distributions to shareholders: | |
Net investment income | | | (0.08 | ) | | | — | | |
Total distributions to shareholders | | | (0.08 | ) | | | — | | |
Net asset value, end of period | | $ | 9.45 | | | $ | 9.86 | | |
Total return | | | (3.34 | %) | | | (1.40 | %) | |
Ratios to average net assets(b) | |
Total gross expenses | | | 1.57 | % | | | 1.58 | %(c) | |
Total net expenses(d) | | | 0.99 | % | | | 1.12 | %(c) | |
Net investment income (loss) | | | 0.72 | % | | | (0.98 | %)(c) | |
Supplemental data | |
Net assets, end of period (in thousands) | | $ | 9 | | | $ | 10 | | |
Portfolio turnover | | | 32 | % | | | 28 | % | |
Notes to Consolidated Financial Highlights
(a) Based on operations from January 28, 2015 (commencement of operations) through the stated period end.
(b) In addition to the fees and expenses that the Fund bears directly, the Fund indirectly bears a pro rata share of the fees and expenses of any other funds in which it invests. Such indirect expenses are not included in the Fund's reported expense ratios.
(c) Annualized.
(d) Total net expenses include the impact of certain fee waivers/expense reimbursements made by the Investment Manager and certain of its affiliates, if applicable.
The accompanying Notes to Consolidated Financial Statements are an integral part of this statement.
Annual Report 2016
26
COLUMBIA ADAPTIVE ALTERNATIVES FUND
CONSOLIDATED FINANCIAL HIGHLIGHTS (continued)
| | | Year Ended May 31, | |
Class Z | | 2016 | | 2015(a) | |
Per share data | |
Net asset value, beginning of period | | $ | 9.86 | | | $ | 10.00 | | |
Income from investment operations: | |
Net investment loss | | | (0.06 | ) | | | (0.04 | ) | |
Net realized and unrealized loss | | | (0.30 | ) | | | (0.10 | ) | |
Total from investment operations | | | (0.36 | ) | | | (0.14 | ) | |
Less distributions to shareholders: | |
Net investment income | | | (0.07 | ) | | | — | | |
Total distributions to shareholders | | | (0.07 | ) | | | — | | |
Net asset value, end of period | | $ | 9.43 | | | $ | 9.86 | | |
Total return | | | (3.63 | %) | | | (1.40 | %) | |
Ratios to average net assets(b) | |
Total gross expenses | | | 1.84 | % | | | 1.83 | %(c) | |
Total net expenses(d) | | | 1.12 | % | | | 1.23 | %(c) | |
Net investment loss | | | (0.56 | %) | | | (1.09 | %)(c) | |
Supplemental data | |
Net assets, end of period (in thousands) | | $ | 3,450 | | | $ | 34,686 | | |
Portfolio turnover | | | 32 | % | | | 28 | % | |
Notes to Consolidated Financial Highlights
(a) Based on operations from January 28, 2015 (commencement of operations) through the stated period end.
(b) In addition to the fees and expenses that the Fund bears directly, the Fund indirectly bears a pro rata share of the fees and expenses of any other funds in which it invests. Such indirect expenses are not included in the Fund's reported expense ratios.
(c) Annualized.
(d) Total net expenses include the impact of certain fee waivers/expense reimbursements made by the Investment Manager and certain of its affiliates, if applicable.
The accompanying Notes to Consolidated Financial Statements are an integral part of this statement.
Annual Report 2016
27
COLUMBIA ADAPTIVE ALTERNATIVES FUND
NOTES TO CONSOLIDATED FINANCIAL STATEMENTS
May 31, 2016
Note 1. Organization
Columbia Adaptive Alternatives Fund (the Fund), a series of Columbia Funds Series Trust I (the Trust), is a non-diversified fund. The Trust is registered under the Investment Company Act of 1940, as amended (the 1940 Act), as an open-end management investment company organized as a Massachusetts business trust.
The Fund invests significantly in Class I shares of affiliated funds managed by Columbia Management Investment Advisers, LLC (the Investment Manager), a wholly-owned subsidiary of Ameriprise Financial, Inc. (Ameriprise Financial), or its affiliates (affiliated underlying funds) as well as third-party advised (unaffiliated) funds, including exchange-traded funds (Underlying Funds).
For information on the Underlying Funds, please refer to the Fund's current prospectus and the prospectuses of the Underlying Funds.
Basis for Consolidation
CAAF Offshore Fund, Ltd. (the Subsidiary) is a Cayman Islands exempted company and wholly-owned subsidiary of the Fund. The Subsidiary acts as an investment vehicle in order to effect certain investment strategies consistent with the Fund's investment objective and policies as stated in its current prospectus and statement of additional information. In accordance with the Memorandum and Articles of Association of the Subsidiary (the Articles), the Fund owns the sole issued share of the Subsidiary and retains all rights associated with such share, including the right to receive notice of, attend and vote at general meetings of the Subsidiary, rights in a winding-up or repayment of capital and the right to participate in the profits or assets of the Subsidiary.
The Fund owned 100% of the outstanding shares of Columbia Intermediary Alternatives Fund for the period from June 1, 2015 through November 23, 2015. Columbia Intermediary Alternatives Fund liquidated on November 24, 2015. The results of its operations are included in the consolidated financial statements (financial statements) through date of liquidation.
The financial statements include the accounts of the consolidated Fund, the respective Subsidiary and Columbia Intermediary Alternatives Fund (through the date of liquidation). Subsequent references to the Fund within the Notes to Consolidated Financial Statements collectively refer to the Fund, the Subsidiary and Columbia Intermediary Alternatives Fund (through the date of liquidation). All intercompany transactions and balances have been eliminated in the consolidation process.
At May 31, 2016, the Subsidiary and Columbia Intermediary Alternatives Fund (through the date of liquidation) financial statement information is as follows:
| | | CAAF
Offshore
Fund, Ltd. | | Columbia
Intermediary
Alternatives
Fund | |
% of consolidated
fund net assets | | | 14.11
| % | | | —
| % | |
Net assets | | $ | 30,226,186 | | | $ | — | | |
Net investment income (loss) | | | (256,390 | ) | | | (28,968 | ) | |
Net realized gain (loss) | | | (1,013,483 | ) | | | 143,902 | | |
Net change in unrealized
appreciation (depreciation) | | | 302,576
| | | | 26,462
| | |
Fund Shares
The Trust may issue an unlimited number of shares (without par value). The Fund offers Class A, Class C, Class I, Class R, Class R4, Class R5, Class W, Class Y and Class Z shares. Although all share classes generally have identical voting, dividend and liquidation rights, each share class votes separately when required by the Trust's organizational documents or by law. Different share classes pay different distribution amounts to the extent the expenses of such share classes differ, and distributions in liquidation will be proportional to the net asset value of each share class. Each share class has its own expense and sales charge structure.
Class A shares are subject to a maximum front-end sales charge of 5.75% based on the initial investment amount. Class A shares purchased without an initial sales charge in accounts aggregating $1 million to $50 million at the time of purchase are subject to a contingent deferred sales charge (CDSC) if the shares are sold within 18 months after purchase, charged as follows: 1.00% CDSC if redeemed within 12 months after purchase, and 0.50% CDSC if redeemed more than 12, but less than 18, months after purchase.
Class C shares are subject to a 1.00% CDSC on shares redeemed within 12 months after purchase.
Class I shares are not subject to sales charges and are available only to the Columbia Family of Funds.
Class R shares are not subject to sales charges and are generally available only to certain retirement plans and other investors as described in the Fund's prospectus.
Class R4 shares are not subject to sales charges and are generally available only to omnibus retirement plans and certain investors as described in the Fund's prospectus.
Annual Report 2016
28
COLUMBIA ADAPTIVE ALTERNATIVES FUND
NOTES TO CONSOLIDATED FINANCIAL STATEMENTS (continued)
May 31, 2016
Class R5 shares are not subject to sales charges and are generally available only to investors purchasing through authorized investment professionals and omnibus retirement plans.
Class W shares are not subject to sales charges and are available only to investors purchasing through authorized investment programs managed by investment professionals, including discretionary managed account programs.
Class Y shares are not subject to sales charges and are generally available only to certain retirement plans as described in the Fund's prospectus.
Class Z shares are not subject to sales charges and are available only to eligible investors, which are subject to different investment minimums as described in the Fund's prospectus.
Note 2. Summary of Significant Accounting Policies
Basis of Preparation
The Fund is an investment company that applies the accounting and reporting guidance in the Financial Accounting Standards Board (FASB) Accounting Standards Codification Topic 946, Financial Services — Investment Companies (ASC 946). The financial statements are prepared in accordance with U.S. generally accepted accounting principles (GAAP), which requires management to make certain estimates and assumptions that affect the reported amounts of assets and liabilities, the disclosure of contingent assets and liabilities at the date of the financial statements and the reported amounts of income and expenses during the reporting period. Actual results could differ from those estimates.
The following is a summary of significant accounting policies followed by the Fund in the preparation of its financial statements.
Security Valuation
All equity securities and exchange-traded funds are valued at the close of business of the New York Stock Exchange (NYSE). Equity securities and exchange-traded funds are valued at the last quoted sales price on the principal exchange or market on which they trade, except for securities traded on the NASDAQ Stock Market, which are valued at the NASDAQ official close price. Unlisted securities or listed securities for which there were no sales during the day are valued at the mean of the latest quoted bid and ask prices on such exchanges or markets.
Investments in the Underlying Funds are valued at the net asset value of the applicable class of the Underlying Fund determined as of the close of the NYSE on the valuation date.
Forward foreign currency exchange contracts are marked-to-market based upon foreign currency exchange rates provided by a pricing service.
Swap transactions are valued through an independent pricing service or broker, or if neither is available, through an internal model based upon observable inputs.
Investments for which market quotations are not readily available, or that have quotations which management believes are not reflective of market value or reliable, are valued at fair value as determined in good faith under procedures approved by and under the general supervision of the Board of Trustees (the Board). If a security or class of securities (such as foreign securities) is valued at fair value, such value is likely to be different from the quoted or published price for the security.
The determination of fair value often requires significant judgment. To determine fair value, management may use assumptions including but not limited to future cash flows and estimated risk premiums. Multiple inputs from various sources may be used to determine fair value.
GAAP requires disclosure regarding the inputs and valuation techniques used to measure fair value and any changes in valuation inputs or techniques. In addition, investments shall be disclosed by major category. This information is disclosed following the Fund's Consolidated Portfolio of Investments.
Foreign Currency Transactions and Translations
The values of all assets and liabilities denominated in foreign currencies are generally translated into U.S. dollars at exchange rates determined at the close of the NYSE on any given day. Net realized and unrealized gains (losses) on foreign currency transactions and translations include gains (losses) arising from the fluctuation in exchange rates between trade and settlement dates on securities transactions, gains (losses) arising from the disposition of foreign currency and currency gains (losses) between the accrual and payment dates on dividends, interest income and foreign withholding taxes.
For financial statement purposes, the Fund does not distinguish that portion of gains (losses) on investments which is due to changes in foreign exchange rates from that which is due to changes in market prices of the investments. Such fluctuations are included with the net realized and unrealized gains (losses) on investments in the Consolidated Statement of Operations.
Annual Report 2016
29
COLUMBIA ADAPTIVE ALTERNATIVES FUND
NOTES TO CONSOLIDATED FINANCIAL STATEMENTS (continued)
May 31, 2016
Derivative Instruments
The Fund invests in certain derivative instruments, as detailed below, to meet its investment objectives. Derivatives are instruments whose values depend on, or are derived from, in whole or in part, the value of one or more securities, currencies, commodities, indices, or other assets or instruments. Derivatives may be used to increase investment flexibility (including to maintain cash reserves while maintaining desired exposure to certain assets), for risk management (hedging) purposes, to facilitate trading, to reduce transaction costs and to pursue higher investment returns. The Fund may also use derivative instruments to mitigate certain investment risks, such as foreign currency exchange rate risk, interest rate risk and credit risk. Derivatives may involve various risks, including the potential inability of the counterparty to fulfill its obligation under the terms of the contract, the potential for an illiquid secondary market (making it difficult for the Fund to sell, including at favorable prices) and the potential for market movements which may expose the Fund to gains or losses in excess of the amount shown in the Consolidated Statement of Assets and Liabilities. The notional amounts of derivative instruments, if applicable, are not recorded in the financial statements.
A derivative instrument may suffer a marked-to-market loss if the value of the contract decreases due to an unfavorable change in the market rates or values of the underlying instrument. Losses can also occur if the counterparty does not perform under the contract. The Fund's risk of loss from counterparty credit risk on over-the-counter derivatives is generally limited to the aggregate unrealized gain netted against any collateral held by the Fund and the amount of any variation margin held by the counterparty. With exchange-traded or centrally cleared derivatives, there is reduced counterparty credit risk to the Fund since the exchange's clearinghouse, as counterparty to such instruments, guarantees against a possible default. The clearinghouse stands between the buyer and the seller of the contract; therefore, the counterparty credit risk is failure of the clearinghouse. However, credit risk still exists in exchange-traded or centrally cleared derivatives with respect to initial and variation margin that is held in a broker's customer account. While brokers are required to segregate customer margin from their own assets, in the event that a broker becomes insolvent or goes into bankruptcy and at that time there is a shortfall in the aggregate amount of margin held by the broker for all its clients, U.S. bankruptcy laws will typically allocate that shortfall on a pro-rata basis across all the broker's customers (including the Fund), potentially resulting in losses to the Fund.
In order to better define its contractual rights and to secure rights that will help the Fund mitigate its counterparty risk, the Fund may enter into an International Swaps and Derivatives Association, Inc. Master Agreement (ISDA Master Agreement) or similar agreement with its derivatives contract counterparties. An ISDA Master Agreement is an agreement between the Fund and a counterparty that governs over-the-counter derivatives and forward foreign currency exchange contracts and typically contains, among other things, collateral posting terms and netting provisions in the event of a default and/or termination event. Under an ISDA Master Agreement, the Fund may, under certain circumstances, offset with the counterparty certain derivative instrument's payables and/or receivables with collateral held and/or posted and create one single net payment. The provisions of the ISDA Master Agreement typically permit a single net payment in the event of default (close-out netting) including the bankruptcy or insolvency of the counterparty. Note, however, that bankruptcy or insolvency laws of a particular jurisdiction may impose restrictions on or prohibitions against the right of offset in bankruptcy, insolvency or other events.
Collateral (margin) requirements differ by type of derivative. Margin requirements are established by the exchange or clearinghouse for exchange-traded and centrally cleared derivatives. Brokers can ask for margin in excess of the minimum in certain circumstances. Collateral terms are contract specific for over-the-counter derivatives. For over-the-counter derivatives traded under an ISDA Master Agreement, the collateral requirements are typically calculated by netting the marked-to-market amount for each transaction under such agreement and comparing that amount to the value of any variation margin currently pledged by the Fund and/or the counterparty. Generally, the amount of collateral due from or to a party has to exceed a minimum transfer amount threshold (e.g., $500,000) before a transfer has to be made. To the extent amounts due to the Fund from its counterparties are not fully collateralized, contractually or otherwise, the Fund bears the risk of loss from counterparty nonperformance. The Fund attempts to mitigate counterparty risk by only entering into agreements with counterparties that it believes have the financial resources to honor their obligations and by monitoring the financial stability of those counterparties.
Certain ISDA Master Agreements allow counterparties to over-the-counter derivatives transactions to terminate derivatives contracts prior to maturity in the event the Fund's net asset value declines by a stated percentage over a specified time period or if the Fund fails to meet
Annual Report 2016
30
COLUMBIA ADAPTIVE ALTERNATIVES FUND
NOTES TO CONSOLIDATED FINANCIAL STATEMENTS (continued)
May 31, 2016
certain terms of the ISDA Master Agreement, which would cause the Fund to accelerate payment of any net liability owed to the counterparty. The Fund also has termination rights if the counterparty fails to meet certain terms of the ISDA Master Agreement. In addition to considering counterparty credit risk, the Fund would consider terminating the derivatives contracts based on whether termination would result in a net liability owed from the counterparty.
For financial reporting purposes, the Fund does not offset derivative assets and derivative liabilities that are subject to netting arrangements in the Consolidated Statement of Assets and Liabilities.
Forward Foreign Currency Exchange Contracts
Forward foreign currency exchange contracts are over-the-counter agreements between two parties to buy and sell a currency at a set price on a future date. The Fund utilized forward foreign currency exchange contracts to hedge the currency exposure associated with some or all of the Fund's securities. These instruments may be used for other purposes in future periods.
The values of forward foreign currency exchange contracts fluctuate daily with changes in foreign currency exchange rates. Changes in the value of these contracts are recorded as unrealized appreciation or depreciation until the contract is exercised or has expired. The Fund will realize a gain or loss when the forward foreign currency exchange contract is closed or expires.
The use of forward foreign currency exchange contracts does not eliminate fluctuations in the prices of the Fund's portfolio securities. The risks of forward foreign currency exchange contracts include movement in the values of the foreign currencies relative to the U.S. dollar (or other foreign currencies) and the possibility that counterparties will not complete their contractual obligations, which may be in excess of the amount reflected, if any, in the Consolidated Statement of Assets and Liabilities.
Futures Contracts
Futures contracts are exchange traded and represent commitments for the future purchase or sale of an asset at a specified price on a specified date. The Fund bought and sold futures contracts to manage exposure to the securities market. These instruments may be used for other purposes in future periods. Upon entering into futures contracts, the Fund bears risks that it may not achieve the anticipated benefits of the futures contracts and may realize a loss. Additional risks include counterparty credit risk, the possibility of an illiquid market, and that a change in the value of the contract or
option may not correlate with changes in the value of the underlying asset.
Upon entering into a futures contract, the Fund pledges cash or securities with the broker in an amount sufficient to meet the initial margin requirement. The initial margin deposit must be maintained at an established level over the life of the contract. Cash deposited as initial margin is recorded in the Consolidated Statement of Assets and Liabilities as margin deposits. Securities deposited as initial margin are designated in the Consolidated Portfolio of Investments. Subsequent payments (variation margin) are made or received by the Fund each day. The variation margin payments are equal to the daily change in the contract value and are recorded as variation margin receivable or payable and are offset in unrealized gains or losses. The Fund recognizes a realized gain or loss when the contract is closed or expires. Futures contracts involve, to varying degrees, risk of loss in excess of the variation margin disclosed in the Consolidated Statement of Assets and Liabilities.
Swap Contracts
Swap contracts are negotiated in the over-the-counter market and may be entered into as a bilateral contract or centrally cleared (centrally cleared swap contract). In a centrally cleared swap contract, immediately following execution of the swap contract with a broker, the swap contract is novated to a central counterparty (the CCP) and the CCP becomes the Fund's counterparty to the centrally cleared swap contract. The Fund is required to deposit initial margin with the broker in the form of cash or securities in an amount that varies depending on the size and risk profile of the particular swap contract. Securities deposited as initial margin are designated in the Consolidated Portfolio of Investments and cash deposited is recorded in the Consolidated Statement of Assets and Liabilities as margin deposits. Unlike a bilateral swap contract, for centrally cleared swap contracts, the Fund has minimal credit exposure to the counterparty because the CCP stands between the Fund and the counterparty. Swap contracts are marked-to-market daily and changes in value are recorded as unrealized appreciation (depreciation). The daily change in valuation of centrally cleared swap contracts, if any, is recorded as a receivable or payable for variation margin in the Consolidated Statement of Assets and Liabilities.
Total Return Swap Contracts
The Fund entered into total return swap contracts to manage long or short exposure to the total return on a reference security index in return for periodic payments based on a fixed or variable interest rate and to manage
Annual Report 2016
31
COLUMBIA ADAPTIVE ALTERNATIVES FUND
NOTES TO CONSOLIDATED FINANCIAL STATEMENTS (continued)
May 31, 2016
long or short exposure to a commodities index. These instruments may be used for other purposes in future periods. Total return swap contracts may be used to obtain exposure to an underlying reference security, instrument, or other asset or index or market without owning, taking physical custody of, or short selling any such security, instrument or asset in a market.
Total return swap contracts are valued daily, and the change in value is recorded as unrealized appreciation (depreciation) until the termination of the swap, at which time the Fund will realize a gain (loss). Periodic payments received (or made) by the Fund over the term of the contract are recorded as realized gains (losses).
Total return swap contracts may be subject to liquidity risk, which exists when a particular swap contract is difficult to purchase or sell. It may not be possible for the Fund to initiate a transaction or liquidate a position at an advantageous time or price, which may result in significant losses. Total return swap contracts are subject to the risk associated with the investment in the underlying reference security, instrument or asset. The risk in the case of short total return swap contracts is unlimited based on the potential for unlimited increases in the market value of the underlying reference security, instrument or asset. This risk may be offset if the Fund holds any of the underlying reference security, instrument or asset. The risk in the case of long total return swap contracts is limited to the current notional amount of the total return swap contract.
Total return swap contracts are also subject to the risk of the counterparty not fulfilling its obligations under the contract (counterparty credit risk). The Fund attempts to mitigate counterparty credit risk by entering into total return swap contracts only with counterparties that meet prescribed levels of creditworthiness, as determined by the Investment Manager.
Effects of Derivative Transactions in the Financial Statements
The following tables are intended to provide additional information about the effect of derivatives on the financial statements of the Fund, including: the fair value of derivatives by risk category and the location of those fair values in the Consolidated Statement of Assets and Liabilities; and the impact of derivative transactions over the period in the Consolidated Statement of Operations, including realized and unrealized gains (losses). The derivative instrument schedules following the Consolidated Portfolio of Investments present additional information regarding derivative instruments outstanding at the end of the period, if any.
The following table is a summary of the fair value of derivative instruments (not considered to be hedging instruments for accounting disclosure purposes) at May 31, 2016:
Asset Derivatives | |
Risk Exposure
Category | | Consolidated Statement of
Assets and Liabilities Location | | Fair Value ($) | |
Credit risk
| | Premiums paid on
outstanding swap
contracts | | | 1,464
| | |
Equity risk
| | Net assets — unrealized
appreciation on swap
contracts | | | 302,091
| * | |
Equity risk
| | Premiums paid on
outstanding swap
contracts | | | 876
| | |
Foreign exchange
risk
| | Unrealized appreciation on
forward foreign currency
exchange contracts | | | 22,036
| | |
Foreign exchange
risk
| | Net assets — unrealized
appreciation on swap
contracts | | | 216,670
| * | |
Foreign exchange
risk
| | Premiums paid on
outstanding swap
contracts | | | 944
| | |
Interest rate risk
| | Net assets — unrealized
appreciation on swap
contracts | | | 110,337
| * | |
Commodity-related
investment risk
| | Net assets — unrealized
appreciation on swap
contracts | | | 399,589
| * | |
Total | | | | | 1,054,007 | | |
Liability Derivatives | |
Risk Exposure
Category | | Consolidated Statement of
Assets and Liabilities Location | | Fair Value ($) | |
Credit risk
| | Net assets — unrealized
depreciation on swap
contracts | | | 76,267
| * | |
Equity risk
| | Net assets — unrealized
depreciation on swap
contracts | | | 390,226
| * | |
Foreign exchange
risk
| | Unrealized depreciation on
forward foreign currency
exchange contracts | | | 26,191
| | |
Foreign exchange
risk
| | Net assets — unrealized
depreciation on swap
contracts | | | 67,042
| * | |
Interest rate risk
| | Net assets — unrealized
depreciation on swap
contracts | | | 68,139
| * | |
Commodity-related
investment risk
| | Net assets — Unrealized
depreciation on swap
contracts | | | 91,346
| * | |
Total | | | | | 719,211 | | |
*Includes cumulative appreciation (depreciation) as reported in the tables following the Consolidated Portfolio of Investments. Only the current day's variation margin is reported in receivables or payables in the Consolidated Statement of Assets and Liabilities.
Annual Report 2016
32
COLUMBIA ADAPTIVE ALTERNATIVES FUND
NOTES TO CONSOLIDATED FINANCIAL STATEMENTS (continued)
May 31, 2016
The following table indicates the effect of derivative instruments (not considered to be hedging instruments for accounting disclosure purposes) in the Consolidated Statement of Operations for the year ended May 31, 2016:
Amount of Realized Gain (Loss) on Derivatives Recognized in Income | |
Risk Exposure Category | | Forward Foreign
Currency Exchange
Contracts ($) | | Futures
Contracts ($) | | Swap
Contracts ($) | | Total ($) | |
Commodity-related investment risk | | | — | | | | — | | | | 306,186 | | | | 306,186 | | |
Credit risk | | | — | | | | — | | | | 119,556 | | | | 119,556 | | |
Equity risk | | | — | | | | (1,356,980 | ) | | | 282,845 | | | | (1,074,135 | ) | |
Foreign exchange risk | | | (167,663 | ) | | | — | | | | (1,407,518 | ) | | | (1,575,181 | ) | |
Interest rate risk | | | — | | | | — | | | | 402,808 | | | | 402,808 | | |
Total | | | (167,663 | ) | | | (1,356,980 | ) | | | (296,123 | ) | | | (1,820,766 | ) | |
Change in Unrealized Appreciation (Depreciation) on Derivatives Recognized in Income | |
Risk Exposure Category | | Forward Foreign
Currency Exchange
Contracts ($) | | Futures
Contracts ($) | | Swap
Contracts ($) | | Total ($) | |
Commodity-related investment risk | | | — | | | | — | | | | 308,243 | | | | 308,243 | | |
Credit risk | | | — | | | | — | | | | (76,267 | ) | | | (76,267 | ) | |
Equity risk | | | — | | | | 116,613 | | | | 21,178 | | | | 137,791 | | |
Foreign exchange risk | | | (4,155 | ) | | | — | | | | 149,628 | | | | 145,473 | | |
Interest rate risk | | | — | | | | — | | | | 42,198 | | | | 42,198 | | |
Total | | | (4,155 | ) | | | 116,613 | | | | 444,980 | | | | 557,438 | | |
The following table provides a summary of the average outstanding volume by derivative instrument for the year ended May 31, 2016:
Derivative Instrument | | Average Notional
Amounts ($)* | |
Futures contracts — Long | | | 2,518,431 | | |
Derivative Instrument | | Average Unrealized
Appreciation ($)* | | Average Unrealized
Depreciation ($)* | |
Forward foreign currency
exchange contracts | | | 5,509 | | | | (6,548 | ) | |
Total return swap contracts | | | 785,453 | | | | (1,225,280 | ) | |
*Based on the ending quarterly outstanding amounts for the year ended May 31, 2016.
Annual Report 2016
33
COLUMBIA ADAPTIVE ALTERNATIVES FUND
NOTES TO CONSOLIDATED FINANCIAL STATEMENTS (continued)
May 31, 2016
Offsetting of Assets and Liabilities
The following table presents the Fund's gross and net amount of assets and liabilities available for offset under netting arrangements as well as any related collateral received or pledged by the Fund as of May 31, 2016:
| | Barclays ($)(a) | | Barclays ($)(a) | | Citi ($) | | Deutsche
Bank ($) | | Goldman
Sachs
International
($)(a) | | Goldman
Sachs
International
($)(a) | | HSBC ($) | | Morgan
Stanley ($)(a) | | Morgan
Stanley ($)(a) | | Total ($) | |
Assets | |
Forward foreign
currency exchange
contracts | | | — | | | | — | | | | 22,036 | | | | — | | | | — | | | | — | | | | — | | | | — | | | | — | | | | 22,036 | | |
OTC total return
swap contracts(b) | | | 94,614 | | | | 105,335 | | | | — | | | | 156,894 | | | | 304,975 | | | | 115,322 | | | | — | | | | 239,122 | | | | 12,425 | | | | 1,028,687 | | |
Total Assets | | | 94,614 | | | | 105,335 | | | | 22,036 | | | | 156,894 | | | | 304,975 | | | | 115,322 | | | | — | | | | 239,122 | | | | 12,425 | | | | 1,050,723 | | |
Liabilities | |
Forward foreign
currency exchange
contracts | | | — | | | | — | | | | — | | | | — | | | | — | | | | — | | | | 26,191 | | | | — | | | | — | | | | 26,191 | | |
OTC total return
swap contracts(b) | | | — | | | | 76,267 | | | | — | | | | 91,739 | | | | 400,669 | | | | 124,345 | | | | — | | | | — | | | | — | | | | 693,020 | | |
Total Liabilities | | | — | | | | 76,267 | | | | — | | | | 91,739 | | | | 400,669 | | | | 124,345 | | | | 26,191 | | | | — | | | | — | | | | 719,211 | | |
Total Financial and
Derivative Net Assets | | | 94,614 | | | | 29,068 | | | | 22,036 | | | | 65,155 | | | | (95,694 | ) | | | (9,023 | ) | | | (26,191 | ) | | | 239,122 | | | | 12,425 | | | | 331,512 | | |
Total collateral
received (pledged)(c) | | | — | | | | — | | | | — | | | | — | | | | (95,694 | ) | | | (9,023 | ) | | | — | | | | — | | | | 12,425 | | | | (92,292 | ) | |
Net Amount(d) | | | 94,614 | | | | 29,068 | | | | 22,036 | | | | 65,155 | | | | — | | | | — | | | | (26,191 | ) | | | 239,122 | | | | — | | | | 423,804 | | |
(a) Exposure can only be netted across transactions governed under the same master agreement with the same legal entity.
(b) Over-the-Counter Swap Contracts are presented at market value plus periodic payments receivable (payable), which is comprised of unrealized appreciation, unrealized depreciation, premiums paid and premiums received.
(c) In some instances, the actual collateral received and/or pledged may be more than the amount shown due to overcollateralization.
(d) Represents the net amount due from/(to) counterparties in the event of default.
Security Transactions
Security transactions are accounted for on the trade date. Cost is determined and gains (losses) are based upon the specific identification method for both financial statement and federal income tax purposes.
Income Recognition
Income and capital gain distributions from the Underlying Funds, if any, are recorded on the ex-dividend date.
The Fund may receive distributions from holdings in equity securities, business development companies (BDCs), exchange-traded funds, other regulated investment companies (RICs), and real estate investment trusts (REITs), which report information on the tax character of their distributions annually. These distributions are allocated to dividend income, capital gain and return of capital based on actual information reported. Return of capital is recorded as a reduction of the cost basis of securities held. If the Fund no longer owns the applicable securities, return of capital is
recorded as a realized gain. With respect to REITs, to the extent actual information has not yet been reported, estimates for return of capital are made by the Fund's management. Management's estimates are subsequently adjusted when the actual character of the distributions is disclosed by the REITs, which could result in a proportionate change in return of capital to shareholders.
Corporate actions and dividend income are recorded on the ex-dividend date.
Expenses
General expenses of the Trust are allocated to the Fund and other funds of the Trust based upon relative net assets or other expense allocation methodologies determined by the nature of the expense. Expenses directly attributable to the Fund are charged to the Fund. Expenses directly attributable to a specific class of shares are charged to that share class.
Annual Report 2016
34
COLUMBIA ADAPTIVE ALTERNATIVES FUND
NOTES TO CONSOLIDATED FINANCIAL STATEMENTS (continued)
May 31, 2016
Determination of Class Net Asset Value
All income, expenses (other than class-specific expenses, which are charged to that share class, as shown in the Consolidated Statement of Operations) and realized and unrealized gains (losses) are allocated to each class of the Fund on a daily basis, based on the relative net assets of each class, for purposes of determining the net asset value of each class.
Federal Income Tax Status
The Fund intends to qualify each year as a regulated investment company under Subchapter M of the Internal Revenue Code, as amended, and will distribute substantially all of its taxable income (including net short-term capital gains), if any, for its tax year, and as such will not be subject to federal income taxes. In addition, the Fund intends to distribute in each calendar year substantially all of its net investment income, capital gains and certain other amounts, if any, such that the Fund should not be subject to federal excise tax. Therefore, no federal income or excise tax provision is recorded.
Distributions to Shareholders
Distributions from net investment income, if any, are declared and paid annually. Net realized capital gains, if any, are distributed along with the income distribution. Income distributions and capital gain distributions are determined in accordance with federal income tax regulations, which may differ from GAAP.
Guarantees and Indemnifications
Under the Trust's organizational documents and, in some cases, by contract, its officers and trustees are indemnified against certain liabilities arising out of the performance of their duties to the Trust or its funds. In addition, certain of the Fund's contracts with its service providers contain general indemnification clauses. The Fund's maximum exposure under these arrangements is unknown since the amount of any future claims that may be made against the Fund cannot be determined, and the Fund has no historical basis for predicting the likelihood of any such claims.
Note 3. Fees and Other Transactions with Affiliates
Management Fees
Effective October 1, 2015, the Fund entered into a Management Agreement with the Investment Manager, a wholly-owned subsidiary of Ameriprise Financial.
Under the Management Agreement, the Investment Manager provides the Fund with investment research and advice, as well as administrative and accounting services. The management services fee is an annual fee that is equal to a percentage of the Fund's average daily net assets that decline from 1.33% to 1.30% as the Fund's net assets increase, including assets invested in affiliated pooled investment vehicles (including mutual funds and exchange-traded funds); however, with respect to the Fund's assets invested in the affiliated underlying funds, the Investment Manager will waive the amount equal to the net management fee (investment management and administrative services fees, less reimbursements/waivers) of the affiliated underlying funds. The effective management services fee rate for the year ended May 31, 2016 was 1.33% of the Fund's average daily net assets.
The Investment Manager has contractually agreed to waive 0.10% of the management fee through September 30, 2016.
The effective management fee rate, net of fee waivers, for the year ended May 31, 2016 was 1.21% of the Fund's average daily net assets.
In addition to the fees and expenses which the Fund bears directly, the Fund indirectly bears a pro rata share of the fees and expenses of the Underlying Funds in which the Fund invests. Because the Underlying Funds have varied expense and fee levels and the Fund may own different proportions of Underlying Funds at different times, the amount of fees and expenses incurred indirectly by the Fund will vary. These expenses are not reflected in the expenses shown in the Consolidated Statement of Operations and are not included in the ratios to average net assets shown in the Consolidated Financial Highlights.
Prior to October 1, 2015, the Fund paid the Investment Manager an annual fee for advisory services under an Investment Management Services Agreement and a separate annual fee for administrative and accounting services under an Administrative Services Agreement. For the period from June 1, 2015 through September 30, 2015, the investment advisory services fee paid to the Investment Manager, net of fee waivers, was $674,446, and the administrative services fee paid to the Investment Manager was $48,241.
Subadvisory Agreement
The Fund's Board has approved a subadvisory agreement between the Investment Manager and Threadneedle
Annual Report 2016
35
COLUMBIA ADAPTIVE ALTERNATIVES FUND
NOTES TO CONSOLIDATED FINANCIAL STATEMENTS (continued)
May 31, 2016
International Limited (Threadneedle), an affiliate of the Investment Manager and an indirect wholly-owned subsidiary of Ameriprise Financial. As of May 31, 2016, Threadneedle is not providing services to the Fund pursuant to the subadvisory agreement.
Other Expenses
Other expenses include offering costs which were incurred prior to the shares of the Fund being offered. Offering costs include, among other things, state registration filing fees and printing costs. The Fund amortizes offering costs over a period of 12 months from the commencement of operations.
Compensation of Board Members
Board members, who are not officers or employees of the Investment Manager or Ameriprise Financial, are compensated for their services to the Fund as disclosed in the Consolidated Statement of Operations. These Board members may participate in a Deferred Compensation Plan (the Plan) which may be terminated at any time. Obligations of the Plan will be paid solely out of the Fund's assets, and all amounts payable under the Plan constitute a general unsecured obligation of the Fund.
Compensation of Chief Compliance Officer
The Board has appointed a Chief Compliance Officer to the Fund in accordance with federal securities regulations. The Fund is allocated a portion of the expenses associated with the Chief Compliance Officer based on relative net assets of the Trust.
Transfer Agency Fees
Under a Transfer and Dividend Disbursing Agent Agreement, Columbia Management Investment Services Corp. (the Transfer Agent), an affiliate of the Investment Manager and a wholly-owned subsidiary of Ameriprise Financial, is responsible for providing transfer agency services to the Fund. The Transfer Agent has contracted with Boston Financial Data Services (BFDS) to serve as sub-transfer agent.
The Transfer Agent receives a monthly transfer agency fee based on the number or the average value of accounts, depending on the type of account. In addition, the Transfer Agent also receives sub-transfer agency fees based on a percentage of the average aggregate value of the Fund's shares maintained in omnibus accounts (other than omnibus accounts for which American Enterprise Investment Services Inc. is the broker of record or accounts where the beneficial shareholder is a customer of Ameriprise Financial Services, Inc., for which
the Transfer Agent receives a per account fee). The Transfer Agent pays the fees of BFDS for services as sub-transfer agent and is not entitled to reimbursement for such fees from the Fund (with the exception of out-of-pocket fees).
The Transfer Agent also receives compensation from the Fund for various shareholder services and reimbursements for certain out-of-pocket fees. Total transfer agency fees for Class R5 shares are subject to an annual limitation of not more than 0.05% of the average daily net assets attributable to Class R5 shares. Class I and Class Y shares do not pay transfer agency fees.
For the year ended May 31, 2016, the Fund's effective transfer agency fee rates as a percentage of average daily net assets of each class were as follows:
Class A | | | 0.27 | % | |
Class C | | | 0.27 | | |
Class R | | | 0.26 | | |
Class R4 | | | 0.28 | | |
Class R5 | | | 0.05 | | |
Class W | | | 0.27 | | |
Class Z | | | 0.25 | | |
An annual minimum account balance fee of $20 may apply to certain accounts with a value below the applicable share class's initial minimum investment requirements to reduce the impact of small accounts on transfer agency fees. These minimum account balance fees are remitted to the Fund and recorded as part of expense reductions in the Consolidated Statement of Operations. For the year ended May 31, 2016, no minimum account balance fees were charged by the Fund.
Distribution and Service Fees
The Fund has an agreement with Columbia Management Investment Distributors, Inc. (the Distributor), an affiliate of the Investment Manager and a wholly-owned subsidiary of Ameriprise Financial, for distribution and shareholder services. The Board has approved, and the Fund has adopted, distribution and shareholder service plans (the Plans) applicable to certain share classes, which set the distribution and service fees for the Fund. These fees are calculated daily and are intended to compensate the Distributor and/or eligible selling and/or servicing agents for selling shares of the Fund and providing services to investors.
Under the Plans, the Fund pays a monthly service fee to the Distributor at the maximum annual rate of 0.25% of the average daily net assets attributable to Class A,
Annual Report 2016
36
COLUMBIA ADAPTIVE ALTERNATIVES FUND
NOTES TO CONSOLIDATED FINANCIAL STATEMENTS (continued)
May 31, 2016
Class C and Class W shares of the Fund. Also under the Plans, the Fund pays a monthly distribution fee to the Distributor at the maximum annual rates of 0.75%, 0.50% and 0.25% of the average daily net assets attributable to Class C, Class R and Class W shares of the Fund, respectively.
Although the Fund may pay a distribution fee up to 0.25% of the Fund's average daily net assets attributable to Class W shares and a service fee of up to 0.25% of the Fund's average daily net assets attributable to Class W shares, the aggregate fee shall not exceed 0.25% of the Fund's average daily net assets attributable to Class W shares.
Sales Charges
Sales charges, including front-end charges and CDSCs, received by the Distributor for distributing Fund shares were $47,915 for Class A and $994 for Class C shares for the year ended May 31, 2016.
Expenses Waived/Reimbursed by the Investment Manager and its Affiliates
The Investment Manager and certain of its affiliates have contractually agreed to waive fees and/or reimburse expenses (excluding certain fees and expenses described below) for the period disclosed below, so that the Fund's net operating expenses, including indirect expenses of the Underlying Funds, after giving effect to fees waived/expenses reimbursed and any balance credits and/or overdraft charges from the Fund's custodian, do not exceed the following annual rates as a percentage of the class' average daily net assets:
| | | Fee Rates Contractual
through
September 30, 2016 | |
Class A | | | 2.85 | % | |
Class C | | | 3.60 | | |
Class I | | | 2.45 | | |
Class R | | | 3.10 | | |
Class R4 | | | 2.60 | | |
Class R5 | | | 2.50 | | |
Class W | | | 2.85 | | |
Class Y | | | 2.45 | | |
Class Z | | | 2.60 | | |
Under the agreement governing these fee waivers and/or expense reimbursement arrangements, the following fees and expenses are excluded from the waiver/reimbursement commitment, and therefore will be paid by the Fund, if applicable: taxes (including foreign
transaction taxes), transaction costs and brokerage commissions, costs related to any securities lending program, dividend and interest expenses associated with securities sold short by the Fund and Blackstone Alternative Multi-Strategy Fund (an unaffiliated mutual fund indirectly invested in by the Fund for the period from June 1, 2015 through November 23, 2015 and directly invested in by the Fund since November 24, 2015), inverse floater program fees and expenses, transaction charges and interest on borrowed money, interest, extraordinary expenses and any other expenses the exclusion of which is specifically approved by the Board. This agreement may be modified or amended only with approval from the Investment Manager, certain of its affiliates and the Fund. Any fees waived and/or expenses reimbursed under the expense reimbursement arrangements described above are not recoverable by the Investment Manager or its affiliates in future periods. The annual rates in the table above include the contractual waiver of 0.10% of the management fee through September 30, 2016, as described above.
Note 4. Federal Tax Information
The timing and character of income and capital gain distributions are determined in accordance with income tax regulations, which may differ from GAAP because of temporary or permanent book to tax differences.
At May 31, 2016, these differences are primarily due to differing treatment for capital loss carryforwards, deferral/reversal of wash sale losses, Trustees' deferred compensation, foreign currency transactions, non-deductible expenses, re-characterization of distributions for investments, derivative investments, investments in commodity subsidiaries and swap investments. To the extent these differences are permanent, reclassifications are made among the components of the Fund's net assets in the Consolidated Statement of Assets and Liabilities. Temporary differences do not require reclassifications. In the Consolidated Statement of Assets and Liabilities the following reclassifications were made:
Undistributed net investment income | | $ | 1,399,822 | | |
Accumulated net realized loss | | | (1,628,112 | ) | |
Paid-in capital | | | 228,290 | | |
Net investment income (loss) and net realized gains (losses), as disclosed in the Consolidated Statement of Operations, and net assets were not affected by this reclassification.
Annual Report 2016
37
COLUMBIA ADAPTIVE ALTERNATIVES FUND
NOTES TO CONSOLIDATED FINANCIAL STATEMENTS (continued)
May 31, 2016
The tax character of distributions paid during the years indicated was as follows:
Year Ended May 31, | | 2016 | | 2015 | |
Ordinary income | | $ | 999,805 | | | $ | — | | |
Short-term capital gain distributions, if any, are considered ordinary income distributions for tax purposes.
At May 31, 2016, the components of distributable earnings on a tax basis were as follows:
Undistributed ordinary income | | $ | 1,567,660 | | |
Capital loss carryforwards | | | (6,311,800 | ) | |
Net unrealized depreciation | | | (2,353,947 | ) | |
At May 31, 2016, the cost of investments for federal income tax purposes was $216,372,477 and the aggregate gross unrealized appreciation and depreciation based on that cost was:
Unrealized appreciation | | $ | 47,917 | | |
Unrealized depreciation | | | (2,401,864 | ) | |
Net unrealized depreciation | | $ | (2,353,947 | ) | |
The following capital loss carryforwards, determined at May 31, 2016, may be available to reduce taxable income arising from future net realized gains on investments, if any, to the extent permitted by the Internal Revenue Code:
Year of Expiration | | Amount ($) | |
No expiration — short-term | | | 5,826,674 | | |
No expiration — long-term | | | 485,126 | | |
Total | | | 6,311,800 | | |
Management of the Fund has concluded that there are no significant uncertain tax positions in the Fund that would require recognition in the financial statements. However, management's conclusion may be subject to review and adjustment at a later date based on factors including, but not limited to, new tax laws, regulations, and administrative interpretations (including relevant court decisions). Generally, the Fund's federal tax returns for the prior three fiscal years remain subject to examination by the Internal Revenue Service.
Note 5. Portfolio Information
The cost of purchases and proceeds from sales of securities, excluding short-term investments and derivatives, if any, aggregated to $35,486,058 and $35,011,411, respectively, for the year ended May 31,
2016. The amount of purchase and sale activity impacts the portfolio turnover rate reported in the Consolidated Financial Highlights.
Note 6. Affiliated Money Market Fund
The Fund significantly invests in Columbia Short-Term Cash Fund, an affiliated money market fund established for the exclusive use by the Fund and other affiliated funds. The income earned by the Fund from such investments is included as Dividends — affiliated issuers in the Consolidated Statement of Operations. As an investing fund, the Fund indirectly bears its proportionate share of the expenses of Columbia Short-Term Cash Fund.
Note 7. Line of Credit
The Fund has access to a revolving credit facility whereby the Fund may borrow for the temporary funding of shareholder redemptions or for other temporary or emergency purposes. Effective December 8, 2015, Citibank, N.A. and HSBC Bank USA, N.A. joined JPMorgan Chase Bank, N.A. (JPMorgan) as lead of a syndicate of banks under the credit facility, which is a collective agreement between the Fund and certain other funds managed by the Investment Manager, severally and not jointly, that permits collective borrowings up to $1 billion. Interest is charged to each participating fund based on its borrowings at a rate equal to the higher of (i) the overnight federal funds rate plus 1.00% or (ii) the one-month LIBOR rate plus 1.00%. Each borrowing under the credit facility matures no later than 60 days after the date of borrowing. The Fund also pays a commitment fee equal to its pro rata share of the amount of the credit facility at a rate of 0.15% per annum. The commitment fee is included in other expenses in the Consolidated Statement of Operations. Prior to December 8, 2015, JPMorgan was the sole lead bank under the credit facility agreement that permitted borrowings up to $550 million under the same terms and interest rates as described above with the exception of the commitment fee which was charged at a rate of 0.075% per annum.
The Fund had no borrowings during the year ended May 31, 2016.
Note 8. Significant Risks
Shareholder Concentration Risk
At May 31, 2016, affiliated shareholders of record owned 99.1% of the outstanding shares of the Fund in one or more accounts. Subscription and redemption activity by concentrated accounts may have a significant effect on
Annual Report 2016
38
COLUMBIA ADAPTIVE ALTERNATIVES FUND
NOTES TO CONSOLIDATED FINANCIAL STATEMENTS (continued)
May 31, 2016
the operations of the Fund. In the case of a large redemption, the Fund may be forced to sell investments at inopportune times, including its liquid or more liquid positions, resulting in Fund losses and the Fund holding a higher percentage of less liquid or illiquid securities. Large redemptions could result in decreased economies of scale and increased operating expenses for non-redeeming Fund shareholders.
Derivatives Risk
Losses involving derivative instruments may be substantial, because a relatively small price movement in the underlying security(ies), commodity, currency or index or other instrument or asset may result in a substantial loss for the Fund. In addition to the potential for increased losses, the use of derivative instruments may lead to increased volatility within the Fund. Derivatives will typically increase the Fund's exposure to principal risks to which it is otherwise exposed, and may expose the Fund to additional risks, including correlation risk, counterparty risk, hedging risk, leverage risk and liquidity risk.
Non-Diversification Risk
A non-diversified fund is permitted to invest a greater percentage of its total assets in fewer issuers than a diversified fund. The Fund may, therefore, have a greater risk of loss from a few issuers than a similar fund that invests more broadly.
Note 9. Subsequent Events
Management has evaluated the events and transactions that have occurred through the date the financial statements were issued and noted no items requiring adjustment of the financial statements or additional disclosure.
Note 10. Information Regarding Pending and Settled Legal Proceedings
In December 2005, without admitting or denying the allegations, American Express Financial Corporation (AEFC, which is now known as Ameriprise Financial, Inc. (Ameriprise Financial)) entered into settlement agreements with the Securities and Exchange Commission (SEC) and Minnesota Department of Commerce (MDOC) related to market timing activities. As a result, AEFC was censured and ordered to cease and desist from committing or causing any violations of certain provisions of the Investment Advisers Act of 1940, the Investment Company Act of 1940, and various Minnesota laws. AEFC agreed to pay disgorgement of $10 million and civil money penalties of $7 million. AEFC
also agreed to retain an independent distribution consultant to assist in developing a plan for distribution of all disgorgement and civil penalties ordered by the SEC in accordance with various undertakings detailed at http://www.sec.gov/litigation/admin/ia-2451.pdf. Ameriprise Financial and its affiliates have cooperated with the SEC and the MDOC in these legal proceedings, and have made regular reports to the Funds' Boards of Trustees.
Ameriprise Financial and certain of its affiliates have historically been involved in a number of legal, arbitration and regulatory proceedings, including routine litigation, class actions, and governmental actions, concerning matters arising in connection with the conduct of their business activities. Ameriprise Financial believes that the Funds are not currently the subject of, and that neither Ameriprise Financial nor any of its affiliates are the subject of, any pending legal, arbitration or regulatory proceedings that are likely to have a material adverse effect on the Funds or the ability of Ameriprise Financial or its affiliates to perform under their contracts with the Funds. Ameriprise Financial is required to make quarterly (10-Q), annual (10-K) and, as necessary, 8-K filings with the SEC on legal and regulatory matters that relate to Ameriprise Financial and its affiliates. Copies of these filings may be obtained by accessing the SEC website at www.sec.gov.
There can be no assurance that these matters, or the adverse publicity associated with them, will not result in increased fund redemptions, reduced sale of fund shares or other adverse consequences to the Funds. Further, although we believe proceedings are not likely to have a material adverse effect on the Funds or the ability of Ameriprise Financial or its affiliates to perform under their contracts with the Funds, these proceedings are subject to uncertainties and, as such, we are unable to estimate the possible loss or range of loss that may result. An adverse outcome in one or more of these proceedings could result in adverse judgments, settlements, fines, penalties or other relief that could have a material adverse effect on the consolidated financial condition or results of operations of Ameriprise Financial.
Annual Report 2016
39
COLUMBIA ADAPTIVE ALTERNATIVES FUND
REPORT OF INDEPENDENT REGISTERED PUBLIC ACCOUNTING FIRM
To the Trustees of Columbia Funds Series Trust I and the Shareholders of
Columbia Adaptive Alternatives Fund
In our opinion, the accompanying consolidated statement of assets and liabilities, including the consolidated portfolio of investments, and the related consolidated statements of operations and of changes in net assets and the consolidated financial highlights present fairly, in all material respects, the financial position of Columbia Adaptive Alternatives Fund (the "Fund", a series of Columbia Funds Series Trust I) at May 31, 2016, and the results of its operations, the changes in its net assets and the financial highlights for each of the periods indicated, in conformity with accounting principles generally accepted in the United States of America. These financial statements and financial highlights (hereafter referred to as "financial statements") are the responsibility of the Fund's management. Our responsibility is to express an opinion on these financial statements based on our audits. We conducted our audits of these financial statements in accordance with the standards of the Public Company Accounting Oversight Board (United States). Those standards require that we plan and perform the audit to obtain reasonable assurance about whether the financial statements are free of material misstatement. An audit includes examining, on a test basis, evidence supporting the amounts and disclosures in the financial statements, assessing the accounting principles used and significant estimates made by management, and evaluating the overall financial statement presentation. We believe that our audits, which included confirmation of securities at May 31, 2016 by correspondence with the custodian, brokers and transfer agent, and the application of alternative auditing procedures where such confirmations had not been received, provide a reasonable basis for our opinion.
PricewaterhouseCoopers LLP
Minneapolis, MN
July 25, 2016
Annual Report 2016
40
COLUMBIA ADAPTIVE ALTERNATIVES FUND
FEDERAL INCOME TAX INFORMATION
(Unaudited)
The Fund hereby designates the following tax attributes for the fiscal year ended May 31, 2016. Shareholders will be notified in early 2017 of the amounts for use in preparing 2016 income tax returns.
Tax Designations:
| Qualified Dividend Income | | | 12.47 | % | |
| Dividends Received Deduction | | | 0.01 | % | |
Qualified Dividend Income. For taxable, non-corporate shareholders, the percentage of ordinary income distributed during the fiscal year that represents qualified dividend income subject to reduced tax rates.
Dividends Received Deduction. The percentage of ordinary income distributed during the fiscal year that qualifies for the corporate dividends received deduction.
Annual Report 2016
41
COLUMBIA ADAPTIVE ALTERNATIVES FUND
Shareholders elect the Board that oversees the Fund's operations. The Board appoints officers who are responsible for day-to-day business decisions based on policies set by the Board. The following table provides basic biographical information about the Fund's Trustees, including their principal occupations during the past five years, although specific titles for individuals may have varied over the period. The year set forth beneath Length of Service in the table below is the year in which the Trustee was first appointed or elected as Trustee to any Fund currently in the Columbia Funds Complex or a predecessor thereof. Under current Board policy, members serve terms of indefinite duration.
Trustees
Independent Trustees
Name,
Address,
Year of Birth | | Position Held With
the Trust and Length of
Service | | Principal Occupation(s)
During the Past Five Years
and Other Relevant
Professional Experience | | Number of
Funds in the
Columbia Funds
Complex
Overseen | | Other Directorships
Held by Trustee During
the Past Five Years | |
Janet Langford Carrig
c/o Columbia
Management Investment Advisers, LLC,
225 Franklin Street
Mail Drop BX32 05228,
Boston, MA 02110
1957 | | Trustee 1996 | | Senior Vice President, General Counsel and Corporate Secretary, ConocoPhillips (integrated energy company) since September 2007 | | | 57 | | | None | |
Douglas A. Hacker
c/o Columbia Management Investment Advisers, LLC,
225 Franklin Street
Mail Drop BX32 05228,
Boston, MA 02110
1955 | | Trustee and Chairman of the Board 1996 | | Independent business executive since May 2006; Executive Vice President — Strategy of United Airlines from December 2002 to May 2006; President of UAL Loyalty Services (airline marketing company) from September 2001 to December 2002; Executive Vice President and Chief Financial Officer of United Airlines from July 1999 to September 2001 | | | 57 | | | Spartan Nash Company (food distributor); Nash Finch Company (food distributor) from 2005 to 2013; Aircastle Limited (aircraft leasing); SeaCube Container Leasing Ltd. (container leasing) from 2010 to 2013; and Travelport Worldwide Limited (travel information technology) | |
Nancy T. Lukitsh
c/o Columbia Management Investment Advisers, LLC,
225 Franklin Street
Mail Drop BX32 05228,
Boston, MA 02110
1956 | | Trustee 2011 | | Senior Vice President, Partner and Director of Marketing, Wellington Management Company, LLP (investment adviser) from 1997 to 2010; Chair, Wellington Management Portfolios (commingled non-U.S. investment pools) from 2007 to 2010; Director, Wellington Trust Company, NA and other Wellington affiliates from 1997 to 2010 | | | 57 | | | None | |
Annual Report 2016
42
COLUMBIA ADAPTIVE ALTERNATIVES FUND
TRUSTEES AND OFFICERS (continued)
Independent Trustees (continued)
Name,
Address,
Year of Birth | | Position Held With
the Trust and Length of
Service | | Principal Occupation(s)
During the Past Five Years
and Other Relevant
Professional Experience | | Number of
Funds in the
Columbia Funds
Complex
Overseen | | Other Directorships
Held by Trustee During
the Past Five Years | |
William E. Mayer
c/o Columbia Management Investment Advisers, LLC,
225 Franklin Street
Mail Drop BX32 05228,
Boston, MA 02110
1940 | | Trustee 1991 | | Partner, Park Avenue Equity Partners (private equity) since February 1999 | | | 57 | | | DynaVox Inc. (speech creation); Lee Enterprises (print media); WR Hambrecht + Co. (financial service provider) from 2000 to 2012; BlackRock Capital Investment Corporation (investment company); and Premier, Inc. (healthcare) | |
David M. Moffett
c/o Columbia Management Investment Advisers, LLC,
225 Franklin Street
Mail Drop BX32 05228,
Boston, MA 02110
1952 | | Trustee 2011 | | Retired. Consultant to Bridgewater and Associates | | | 57 | | | Director of CIT Bank, CIT Group Inc. (commercial and consumer finance); eBay Inc. (online trading community); Genworth Financial, Inc. (financial and insurance products and services); Paypal Holdings Inc. (payment and data processing services); and Trustee University of Oklahoma Foundation | |
Charles R. Nelson
c/o Columbia Management Investment Advisers, LLC,
225 Franklin Street
Mail Drop BX32 05228,
Boston, MA 02110
1942 | | Trustee 1981 | | Retired. Professor Emeritus, University of Washington since 2011; Professor of Economics, University of Washington from 1976 to 2011; Ford and Louisa Van Voorhis Professor of Political Economy, University of Washington from 1993 to 2011; Adjunct Professor of Statistics, University of Washington from 1980 to 2011; Associate Editor, Journal of Money, Credit and Banking from September 1993 to 2008; consultant on econometric and statistical matters | | | 57 | | | None | |
John J. Neuhauser
c/o Columbia Management Investment Advisers, LLC,
225 Franklin Street
Mail Drop BX32 05228,
Boston, MA 02110
1943 | | Trustee 1984 | | President, Saint Michael's College since August 2007; Director or Trustee of several non-profit organizations, including University of Vermont Medical Center; Academic Vice President and Dean of Faculties, Boston College from August 1999 to October 2005; University Professor, Boston College from November 2005 to August 2007 | | | 57 | | | Liberty All-Star Equity Fund and Liberty All-Star Growth Fund (closed-end funds) | |
Annual Report 2016
43
COLUMBIA ADAPTIVE ALTERNATIVES FUND
TRUSTEES AND OFFICERS (continued)
Independent Trustees (continued)
Name,
Address,
Year of Birth | | Position Held With
the Trust and Length of
Service | | Principal Occupation(s)
During the Past Five Years
and Other Relevant
Professional Experience | | Number of
Funds in the
Columbia Funds
Complex
Overseen | | Other Directorships
Held by Trustee During
the Past Five Years | |
Patrick J. Simpson
c/o Columbia Management Investment Advisers, LLC,
225 Franklin Street
Mail Drop BX32 05228,
Boston, MA 02110
1944 | | Trustee 2000 | | Of Counsel, Perkins Coie LLP (law firm) since 2015; Partner, Perkins Coie LLP from 1988 to 2014 | | 57 | | None | |
Anne-Lee Verville
c/o Columbia Management Investment Advisers, LLC,
225 Franklin Street
Mail Drop BX32 05228,
Boston, MA 02110
1945 | | Trustee 1998 | | Retired. General Manager, Global Education Industry from 1994 to 1997, President — Application Systems Division from 1991 to 1994, Chief Financial Officer — US Marketing & Services from 1988 to 1991, and Chief Information Officer from 1987 to 1988, IBM Corporation (computer and technology) | | 57 | | Enesco Group, Inc. (producer of giftware and home and garden decor products) from 2001 to 2006 | |
Consultant to the Trustees*
Name,
Address,
Year of Birth | | Position Held With
the Trust and Length of
Service | | Principal Occupation(s)
During the Past Five Years
and Other Relevant
Professional Experience | | Number of
Funds in the
Columbia Funds
Complex
Overseen | | Other Directorships
Held by Trustee During
the Past Five Years | |
J. Kevin Connaughton
c/o Columbia
Management Investment Advisers, LLC,
225 Franklin Street
Mail Drop BX32 05228,
Boston, MA 02110
1964 | | Trustee Consultant 2016 | | Trustee Consultant, Columbia Funds since March 2016; Managing Director and General Manager of Mutual Fund Products, Columbia Management Investment Advisers, LLC from May 2010 to February 2015; President, Columbia Funds from 2009 to 2015; and senior officer of Columbia Funds and affiliated funds from 2003 to 2015 | | 57 | | Board of Governors, Gateway Healthcare since January 2016; Trustee, New Century Portfolios since March 2015; and Director, The Autism Project since March 2015 | |
* J. Kevin Connaughton was appointed consultant to the Trustees effective March 1, 2016. Shareholders of the Funds are expected to be asked to elect Mr. Connaughton as a Trustee at a future shareholder meeting.
Annual Report 2016
44
COLUMBIA ADAPTIVE ALTERNATIVES FUND
TRUSTEES AND OFFICERS (continued)
Interested Trustee Affiliated with Investment Manager*
Name,
Address,
Year of Birth | | Position Held With
the Trust and Length of
Service | | Principal Occupation(s)
During the Past Five Years
and Other Relevant
Professional Experience | | Number of
Funds in the
Columbia Funds
Complex
Overseen | | Other Directorships
Held by Trustee During
the Past Five Years | |
William F. Truscott
c/o Columbia Management Investment Advisers, LLC,
225 Franklin Street
Boston, MA 02110
1960 | | Trustee 2012 | | Chairman of the Board and President, Columbia Management Investment Advisers, LLC since May 2010 and February 2012, respectively; Chief Executive Officer, Global Asset Management, Ameriprise Financial, Inc. since September 2012 (previously Chief Executive Officer, U.S. Asset Management & President, Annuities, May 2010- September 2012); Director and Chief Executive Officer, Columbia Management Investment Distributors, Inc. since May 2010 and February 2012, respectively; Chairman of the Board and Chief Executive Officer, RiverSource Distributors, Inc. since 2006; Director, Threadneedle Asset Management Holdings, SARL since 2014; President and Chief Executive Officer, Ameriprise Certificate Company, 2006-August 2012. | | 176 | | Chairman of the Board, Columbia Management Investment Advisers, LLC since May 2010; Director, Columbia Management Investment Distributors, Inc. since May 2010; Former Director, Ameriprise Certificate Company, 2006-January 2013 | |
* Interested person (as defined under the 1940 Act) by reason of being an officer, director, security holder and/or employee of the Investment Manager or Ameriprise Financial.
The Statement of Additional Information has additional information about the Fund's Board members and is available, without charge, upon request by calling 800.345.6611; contacting your financial intermediary; or visiting columbiathreadneedle.com/us.
Annual Report 2016
45
COLUMBIA ADAPTIVE ALTERNATIVES FUND
TRUSTEES AND OFFICERS (continued)
The Board has appointed officers who are responsible for day-to-day business decisions based on policies it has established. The officers serve at the pleasure of the Board. The following table provides basic information about the Officers of the Fund, including principal occupations during the past five years, although their specific titles may have varied over the period. In addition to Mr. Truscott, who is Senior Vice President, the Fund's other officers are:
Fund Officers
Name,
Address and
Year of Birth | | Position and Year
First Appointed to
Position for any Fund
in the Columbia
Funds Complex or a
Predecessor Thereof | |
Principal Occupation(s) During Past Five Years | |
Christopher O. Petersen
5228 Ameriprise Financial Center
Minneapolis, MN 55474
Born 1970 | | President and Principal Executive Officer (2015) | | Vice President and Lead Chief Counsel, Ameriprise Financial, Inc. since January 2015 (previously, Vice President and Chief Counsel January 2010-December 2014; officer of Columbia Funds and affiliated funds since 2007. | |
Michael G. Clarke
225 Franklin Street
Boston, MA 02110
Born 1969 | | Treasurer (2011), Chief Financial Officer (2009) and Chief Accounting Officer (2015) | | Vice President — Mutual Fund Administration, Columbia Management Investment Advisers, LLC, since May 2010; senior officer of Columbia Funds and affiliated funds since 2002. | |
Paul B. Goucher
100 Park Avenue
New York, NY 10017
Born 1968 | | Senior Vice President (2011), Chief Legal Officer (2015) and Assistant Secretary (2008) | | Vice President and Lead Chief Counsel, Ameriprise Financial, Inc. since November 2008 and January 2013, respectively (previously Chief Counsel, January 2010-January 2013); Vice President, Chief Legal Officer and Assistant Secretary, Columbia Management Investment Advisers, LLC since May 2010. | |
Thomas P. McGuire
225 Franklin Street
Boston, MA 02110
Born 1972 | | Senior Vice President and Chief Compliance Officer (2012) | | Vice President — Asset Management Compliance, Ameriprise Financial, Inc., since May 2010; Chief Compliance Officer, Ameriprise Certificate Company since September 2010. | |
Colin Moore
225 Franklin Street
Boston, MA 02110
Born 1958 | | Senior Vice President (2010) | | Executive Vice President and Global Chief Investment Officer, Ameriprise Financial, Inc., since July 2013; Executive Vice President and Global Chief Investment Officer, Columbia Management Investment Advisers, LLC since July 2013 (previously Director and Global Chief Investment Officer, 2010-2013). | |
Michael E. DeFao
225 Franklin Street
Boston, MA 02110
Born 1968 | | Vice President (2011) and Assistant Secretary (2010) | | Vice President and Chief Counsel, Ameriprise Financial, Inc. since May 2010. | |
Amy Johnson
5228 Ameriprise Financial Center
Minneapolis, MN 55474
Born 1965 | | Vice President (2006) | | Managing Director and Global Head of Operations, Columbia Management Investment Advisers, LLC since April 2016 (previously Managing Director and Chief Operating Officer, 2010-2016). | |
Lyn Kephart-Strong
5228 Ameriprise
Financial Center
Minneapolis, MN 55474
Born 1960 | | Vice President (2015) | | President, Columbia Management Investment Services Corp. since October 2014; Vice President & Resolution Officer, Ameriprise Trust Company since August 2009. | |
Ryan C. Larrenaga
225 Franklin Street
Boston, MA 02110
Born 1970 | | Vice President and Secretary (2015) | | Vice President and Group Counsel, Ameriprise Financial, Inc. since August 2011 (previously, Counsel from May 2010 to August 2011); officer of Columbia Funds and affiliated funds since 2005. | |
Annual Report 2016
46
COLUMBIA ADAPTIVE ALTERNATIVES FUND
IMPORTANT INFORMATION ABOUT THIS REPORT
Each fund mails one shareholder report to each shareholder address. If you would like more than one report, please call shareholder services at 800.345.6611 and additional reports will be sent to you.
The policy of the Board is to vote the proxies of the companies in which each fund holds investments consistent with the procedures as stated in the Statement of Additional Information (SAI). You may obtain a copy of the SAI without charge by calling 800.345.6611; contacting your financial intermediary; visiting columbiathreadneedle.com/us; or searching the website of the Securities and Exchange Commission (SEC) at sec.gov. Information regarding how each fund voted proxies relating to portfolio securities is filed with the SEC by August 31st for the most recent 12-month period ending June 30th of that year, and is available without charge by visiting columbiathreadneedle.com/us, or searching the website of the SEC at sec.gov.
Each fund files a complete schedule of portfolio holdings with the SEC for the first and third quarters of each fiscal year on Form N-Q. Each fund's Form N-Q is available on the SEC's website at sec.gov and may be reviewed and copied at the SEC's Public Reference Room in Washington, D.C. Information on the operation of the Public Reference Room may be obtained by calling 800.SEC.0330. Each fund's complete schedule of portfolio holdings, as filed on Form N-Q, can also be obtained without charge, upon request, by calling 800.345.6611.
You may obtain the current net asset value (NAV) of Fund shares at no cost by calling 800.345.6611 or by sending an e-mail to serviceinquiries@columbiathreadneedle.com.
Annual Report 2016
47
Columbia Adaptive Alternatives Fund
P.O. Box 8081
Boston, MA 02266-8081

This information is for use with concurrent or prior delivery of a fund prospectus. Please read and consider the investment objectives, risks, charges and expenses for any fund carefully before investing. For a prospectus and summary prospectus, which contains this and other important information about the Fund, go to columbiathreadneedle.com/us. The Fund is distributed by Columbia Management Investment Distributors, Inc., member FINRA, and managed by Columbia Management Investment Advisers, LLC.
Columbia Threadneedle Investments (Columbia Threadneedle) is the global brand name of the Columbia and Threadneedle group of companies.
All rights reserved. Columbia Management Investment Distributors, Inc., 225 Franklin Street, Boston, MA 02110-2804
© 2016 Columbia Management Investment Advisers, LLC.
columbiathreadneedle.com/us
ANN259_05_F01_(07/16)

ANNUAL REPORT
May 31, 2016

COLUMBIA DIVERSIFIED ABSOLUTE RETURN FUND

ABOUT COLUMBIA THREADNEEDLE INVESTMENTS
Columbia Threadneedle Investments is a leading global asset management group that provides a broad range of actively managed investment strategies and solutions for individual, institutional and corporate clients around the world.
With more than 2,000 people, including over 450 investment professionals based in North America, Europe and Asia, we manage $464 billion* of assets across developed and emerging market equities, fixed income, asset allocation solutions and alternatives. We are the 13th largest manager of long-term mutual fund assets in the U.S.** and the 3rd largest manager of retail funds in the U.K.***
Our priority is the investment success of our clients. We aim to deliver the investment outcomes they expect through an investment approach that is team-based, performance-driven and risk-aware. Our culture is dynamic and interactive. By sharing our insights across asset classes and geographies, we generate richer perspectives on global, regional and local investment landscapes. The ability to exchange and debate investment ideas in a collaborative environment enriches our teams' investment processes. More importantly, it results in better informed investment decisions for our clients.
Columbia funds are distributed by Columbia Management Investment Distributors, Inc., member FINRA, and managed by Columbia Management Investment Advisers, LLC.
Columbia Threadneedle Investments (Columbia Threadneedle) is the global brand name of the Columbia and Threadneedle group of companies.
* In U.S. dollars as of March 31, 2016. Source: Ameriprise Q1 Earnings Release. Includes all assets managed by entities in the Columbia and Threadneedle group of companies. Contact us for more current data.
** Source: ICI as of March 31, 2016 for Columbia Management Investment Advisers, LLC.
*** Source: Investment Association as of December 2015 for Threadneedle Asset Management Limited.
© 2016 Columbia Management Investment Advisers, LLC. All rights reserved.
Not part of the shareholder report
 Dear Shareholders,
Volatility comes with the territory for long-term investors. Some investors instinctively want to pull out of the market or sell underperforming investments at the first sign of increased volatility or perhaps even as soon as they perceive it on the horizon. But taking yourself out of the market could mean losing out on potential opportunities, and putting your longer-term investment goals at risk.
Cumulative return is not just about achieving high returns when markets are going up; it's also about remaining invested and minimizing losses during weak or volatile markets so that you can participate on the upside. Developing a deeper understanding of the various risks your portfolio is subject to can help you balance these risks.
Diversification is critical in seeking to achieve that balance. We believe that most portfolios could be more effectively diversified either by introducing holdings with performance profiles unrelated to existing holdings (like alternative products) or by rebalancing existing holdings with an eye toward risk allocation. Over time, distributing risk more evenly may produce a more pronounced diversification benefit and may improve portfolio efficiency. We believe market volatility can create significant opportunities and, in fact, these periods may be some of the very best times to invest.
With this in mind, I thought it important to highlight excerpts from a piece written by Colin Moore, Global Chief Investment Officer, in which he touches on some of these issues emphasizing the importance of a properly constructed portfolio in seeking to effectively manage volatility and to achieve consistency of returns. I encourage you to read the article in its entirety. To access the full article and for other insights on current market, please visit blog.columbiathreadneedleus.com/latest-perspectives.
You need investments that are designed to help you ease the impact of volatile market environments and keep the savings you have worked tirelessly to amass. Columbia Threadneedle Investments provides investment solutions to help you tackle financial challenges and achieve your desired outcome.
Best regards,

Christopher O. Petersen
President, Columbia Funds
Excerpts from:
Taking the scare out of the volatility bogeyman
By Colin Moore, Global Chief Investment Officer
Colin Moore is the global chief investment officer for Columbia Threadneedle Investments. His responsibilities include ensuring that a disciplined investment process is in place across all asset classes, including equity and fixed income. Mr. Moore joined one of the Columbia Threadneedle Investments legacy firms in 2002 as head of equity and was also head of fixed income and liquidity strategies from 2009 – 2010.

n In today's low growth, higher volatility world, the emphasis is shifting from maximization of returns to consistency of returns.
PRESIDENT'S MESSAGE (continued)
n Portfolios should represent the behavioral risk-return tradeoff of investors, remembering that they won't stay invested to realize the return if we get the risk tolerance wrong.
n Holding long-term savings in cash to avoid volatility (the financial equivalent of hiding under the sheets) is detrimental to achieving long-term goals.
According to Wikipedia, "The bogeyman is a common allusion to a mythical creature in many cultures used to control behavior. This monster has no specific appearance, and conceptions about it can vary drastically from household to household within the same community; in many cases he has no set appearance in the mind of an adult or child, but is simply a non-specific embodiment of terror." Different cultures have different names and physical representations for the bogeyman, and investors are no different. We have terrible monsters that we fear may destroy our portfolios, and we call one of the scariest of them volatility.
While the bogeyman is mythical (I hope!), volatility is real and can cause serious damage. To understand why investors have such a hard time coping with volatility, we first need to define three cognitive biases at work in today's investment environment:
1) Recency bias — something that has recently come to the forefront of our attention, regardless of how long established it is, suddenly seems to appear with improbable frequency.
2) Negativity bias — we tend to have a greater recall of unpleasant memories than positive memories.
3) Loss aversion — our dissatisfaction with losing money tends to be greater than our satisfaction with making money.
The level of volatility varies dramatically, and so does investor fear and panic selling — waxing when volatility rises, waning when it falls. Recent studies have pointed to demographics as an important driver of panic selling. The theory is that as people get closer to retirement, the prospects of a large (20% – 30%) loss in financial assets can have a much more pronounced effect on their sense of well-being. Wealth preservation instincts kick in much more quickly than for younger (and typically less wealthy) savers.
The reality is that there is little opportunity for return without volatility. Therefore, the bogeyman effect of holding long-term savings in cash to avoid volatility (the financial equivalent of hiding under the sheets) is detrimental to achieving long-term goals. This effect tends to be more pronounced during the episodic spikes in volatility. The significant spike in volatility in 2008 and 2009 led to significant withdrawals from long-term investment funds over the same period. Less pronounced effects can also be seen when comparing 2001 – 2003 and 2011 – 2012. Conversely, flows picked up when volatility returned to "normal" levels. Investor behavior of this type is consistent with the three behavioral biases.
I believe average volatility will be higher over the next 10 years than the last 10 years and episodic spikes will increase in frequency because sustainable economic growth will be structurally lower and geopolitical risk higher than any time since World War II. Low growth creates uncertainty while loss aversion will make investors fear that we are one economic mishap or geopolitical event away from no growth or recession. The result will be higher volatility on average. Negativity bias will tend to exacerbate "spike" reactions to event-driven geopolitical news, and the volatility bogeyman will appear more often. Assuming the behavioral biases continue, investor returns are likely to be very disappointing regardless of the total return generated by financial markets due to the bogeyman effect.
To mitigate this effect, we need to focus on portfolio construction and an improved understanding of diversification. I accept that equities are likely to offer the highest return over the next 10 years, but they also offer the highest volatility. Many portfolio construction optimization tools use historical average volatility, which is likely to underestimate the volatility investors will face. The bogeyman emerges when individual asset class volatility spikes and cross correlations rise, the combination of which increases overall portfolio volatility far beyond expectation. Diversification is meant to protect investors against volatility, but what's the point of owning lots of investments if the volatility bogeyman has not been properly estimated?
Most importantly, portfolios should be constructed to properly represent the behavioral risk-return tradeoff of investors, remembering that they won't stay invested to realize the return if we get the risk tolerance wrong. In a low growth, higher volatility world, the emphasis is shifting to return consistency rather than return maximization,
PRESIDENT'S MESSAGE (continued)
and investors are best served through investment approaches that appreciate that distinction. Even though it's a permanent feature of financial markets, volatility is less likely to be the bogeyman we all fear if portfolios are constructed with this understanding.
Please visit blog.columbiathreadneedleus.com/latest-perspectives to read the entire article.
Investors should consider the investment objectives, risks, charges and expenses of a mutual fund carefully before investing. For a free prospectus and summary prospectus, which contains this and other important information about a fund, visit columbiathreadneedle.com/us. The prospectus should be read carefully before investing.
The views expressed are as of April 2016, may change as market or other conditions change, and may differ from views expressed by other Columbia Management Investment Advisers, LLC (CMIA) associates or affiliates. Actual investments or investment decisions made by CMIA and its affiliates, whether for its own account or on behalf of clients, will not necessarily reflect the views expressed. This information is not intended to provide investment advice and does not account for individual investor circumstances. Investment decisions should always be made based on an investor's specific financial needs, objectives, goals, time horizon and risk tolerance. Asset classes described may not be suitable for all investors.
Past performance does not guarantee future results, and no forecast should be considered a guarantee either. Since economic and market conditions change frequently, there can be no assurance that the trends described here will continue or that the forecasts are accurate.
Diversification does not guarantee a profit or protect against loss.
Columbia Funds are distributed by Columbia Management Investment Distributors, Inc., member FINRA, and managed by Columbia Management Investment Advisers, LLC.
© 2016 Columbia Management Investment Advisers, LLC. All rights reserved.
COLUMBIA DIVERSIFIED ABSOLUTE RETURN FUND
Fund Investment Manager
Columbia Management Investment
Advisers, LLC
225 Franklin Street
Boston, MA 02110
Fund Distributor
Columbia Management Investment
Distributors, Inc.
225 Franklin Street
Boston, MA 02110
Fund Transfer Agent
Columbia Management Investment
Services Corp.
P.O. Box 8081
Boston, MA 02266-8081
For more information about any of the funds, please visit columbiathreadneedle.com/us or call 800.345.6611. Customer Service Representatives are available to answer your questions Monday through Friday from 8 a.m. to 7 p.m. Eastern time.
The views expressed in this report reflect the current views of the respective parties. These views are not guarantees of future performance and involve certain risks, uncertainties and assumptions that are difficult to predict, so actual outcomes and results may differ significantly from the views expressed. These views are subject to change at any time based upon economic, market or other conditions and the respective parties disclaim any responsibility to update such views. These views may not be relied on as investment advice and, because investment decisions for a Columbia fund are based on numerous factors, may not be relied on as an indication of trading intent on behalf of any particular Columbia fund. References to specific securities should not be construed as a recommendation or investment advice.
Performance Overview | | | 3 | | |
Manager Discussion of Fund Performance | | | 5 | | |
Understanding Your Fund's Expenses | | | 8 | | |
Consolidated Portfolio of Investments | | | 9 | | |
Consolidated Statement of Assets and Liabilities | | | 35 | | |
Consolidated Statement of Operations | | | 37 | | |
Consolidated Statement of Changes in Net Assets | | | 38 | | |
Consolidated Financial Highlights | | | 40 | | |
Notes to Consolidated Financial Statements | | | 47 | | |
Report of Independent Registered Public Accounting Firm | | | 64 | | |
Federal Income Tax Information | | | 65 | | |
Trustees and Officers | | | 66 | | |
Important Information About This Report | | | 71 | | |
COLUMBIA DIVERSIFIED ABSOLUTE RETURN FUND
Performance Summary
n Columbia Diversified Absolute Return Fund (the Fund) Class A shares returned -3.96% excluding sales charges for the 12-month period that ended May 31, 2016.
n The Citi One-Month U.S. Treasury Bill Index returned 0.09% over the same period.
n The Fund is a diversified portfolio that invests across multiple asset classes using both traditional and alternative investment strategies.
n During the period, each of the Fund's three core strategies (alpha, tactical beta and alternative beta) posted a negative absolute return amid highly challenging market conditions.
Average Annual Total Returns (%) (for period ended May 31, 2016)
| | | Inception | | 1 Year | | Life | |
Class A | | 02/19/15 | | | | | | | | | |
Excluding sales charges | | | | | | | -3.96 | | | | -2.36 | | |
Including sales charges | | | | | | | -9.52 | | | | -6.78 | | |
Class C | | 02/19/15 | | | | | | | | | |
Excluding sales charges | | | | | | | -4.68 | | | | -3.08 | | |
Including sales charges | | | | | | | -5.63 | | | | -3.08 | | |
Class I | | 02/19/15 | | | -3.58 | | | | -1.98 | | |
Class R4 | | 02/19/15 | | | -3.69 | | | | -2.07 | | |
Class R5 | | 02/19/15 | | | -3.59 | | | | -1.99 | | |
Class W | | 02/19/15 | | | -3.87 | | | | -2.28 | | |
Class Z | | 02/19/15 | | | -3.69 | | | | -2.07 | | |
Citi One-Month U.S. Treasury Bill Index | | | | | | | 0.09 | | | | 0.07 | | |
Returns for Class A are shown with and without the maximum initial sales charge of 5.75%. Returns for Class C are shown with and without the 1.00% contingent deferred sales charge for the first year only. The Fund's other classes are not subject to sales charges and have limited eligibility. Please see the Fund's prospectus for details. Performance for different share classes will vary based on differences in sales charges and fees associated with each class. All results shown assume reinvestment of distributions during the period. Returns do not reflect the deduction of taxes that a shareholder may pay on Fund distributions or on the redemption of Fund shares. Performance results reflect the effect of any fee waivers or reimbursements of Fund expenses by Columbia Management Investment Advisers, LLC and/or any of its affiliates. Absent these fee waivers or expense reimbursement arrangements, performance results would have been lower.
The performance information shown represents past performance and is not a guarantee of future results. The investment return and principal value of your investment will fluctuate so that your shares, when redeemed, may be worth more or less than their original cost. Current performance may be lower or higher than the performance information shown. You may obtain performance information current to the most recent month-end by contacting your financial intermediary, visiting columbiathreadneedle.com/us or calling 800.345.6611.
The Citi One-Month U.S. Treasury Bill Index is an unmanaged index that measures the rate of return for 30-day U.S. Treasury Bills.
Indices are not available for investment, are not professionally managed and do not reflect sales charges, fees, brokerage commissions, taxes or other expenses of investing. Securities in the Fund may not match those in an index.
Annual Report 2016
3
COLUMBIA DIVERSIFIED ABSOLUTE RETURN FUND
PERFORMANCE OVERVIEW (continued)
Performance of a Hypothetical $10,000 Investment (February 19, 2015 – May 31, 2016)
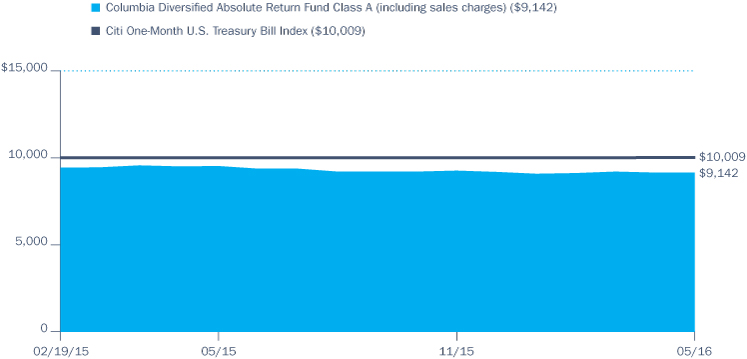
The chart above shows the change in value of a hypothetical $10,000 investment in Class A shares of Columbia Diversified Absolute Return Fund during the stated time period, and does not reflect the deduction of taxes that a shareholder may pay on Fund distributions or on the redemption of Fund shares.
Annual Report 2016
4
COLUMBIA DIVERSIFIED ABSOLUTE RETURN FUND
MANAGER DISCUSSION OF FUND PERFORMANCE
At May 31, 2016, approximately 72.2% of the Fund's shares were owned in the aggregate by affiliated funds-of-funds managed by Columbia Management Investment Advisers, LLC (the Investment Manager). As a result of asset allocation decisions by the Investment Manager, it is possible that the Fund may experience relatively large purchases or redemptions from affiliated funds-of-funds. The Investment Manager seeks to minimize the impact of these transactions by structuring them over a reasonable period of time. The Fund may experience increased expenses as it buys and sells securities as a result of purchases or redemptions by affiliated funds-of-funds.
For the 12-month period that ended May 31, 2016, the Fund's Class A shares returned -3.96% excluding sales charges. The Citi One-Month U.S. Treasury Bill Index returned 0.09% over the same period. As an absolute return fund, the Fund employs a benchmark-agnostic strategy and thus any comparison to the Citi One-Month U.S. Treasury Bill Index is for information purposes only. The Fund is a diversified portfolio that invests across multiple asset classes using both traditional and alternative investment strategies.
Risk-Averse Investor Sentiment Heightened During Period
Around the world, investors turned increasingly cautious during the period, as lackluster economic growth, contentious geopolitical conflicts and an expected shift in U.S. monetary policy weighed on confidence. Subpar global economic growth persisted, with China's ongoing slowdown heading the list of disappointments. Plummeting oil prices and a rising U.S. dollar rounded off the list of mounting pressures. Some of these pressures subsided during the first months of 2016, which corresponded with yet another sell-off and swift market recovery in a relatively short period of time. In the U.S., the labor market added new jobs, resulting in the unemployment rate moving down to 4.7% (Source: U.S. Bureau of Labor Statistics.) Consumer spending strengthened somewhat, and the housing market inched forward, although sales slipped near the end of 2015, as new industry regulation led to longer closing periods. Economic growth outside the U.S. was mostly lackluster. A weaker currency benefited eurozone countries as did accommodative bank lending standards. However, eurozone economic growth still registered at a level of less than 2.0% for the period. The weakness in commodity markets helped drive Russia and Brazil into recession, and China's economy slowed more than expected. In Japan, policymakers sought to raise inflation, as they struggled to maintain economic growth.
For U.S. investors, stock market losses in the first half of the period were offset by a recovery during both October of 2015 and again in the February to March 2016 timeframe. U.S. stocks outperformed both foreign developed and emerging markets, as a strong U.S. dollar weighed on returns from overseas for much of the period. However, during the last three months of the period, international equities began to trend higher, at a pace greater than U.S. shares. The U.S. bond market eked out a low single-digit return during the period, led by stronger performance during the second half of the fiscal year. Long-duration corporate bonds and high yield bonds shed the most ground, as losses in the first half of the period
Portfolio Management
Jeffrey Knight, CFA
William Landes, Ph.D.
Kent Peterson, Ph.D.
Brian Virginia
Joshua Kutin, CFA
Portfolio Breakdown — Long Positions (%)
(at May 31, 2016) | |
Asset-Backed Securities —
Non-Agency | | | 0.1 | | |
Commercial Mortgage-Backed Securities — Non-Agency | | | 0.9 | | |
Common Stocks | | | 34.1 | | |
Corporate Bonds & Notes | | | 2.2 | | |
Exchange-Traded Funds | | | 16.6 | | |
Foreign Government
Obligations | | | 4.1 | | |
Inflation-Indexed Bonds | | | 0.1 | | |
Limited Partnerships | | | 0.1 | | |
Options Purchased Puts | | | 0.0 | (a) | |
Residential Mortgage-Backed
Securities — Agency | | | 0.0 | (a) | |
Residential Mortgage-Backed
Securities — Non-Agency | | | 0.8 | | |
Treasury Bills | | | 1.5 | | |
U.S. Treasury Obligations | | | 0.1 | | |
Short-Term Investments
Segregated in Connection
with Open Derivatives
Contracts(b) | | | 64.5 | | |
Total | | | 125.1 | | |
Percentages indicated are based upon total investments, net of investments sold short. The Fund's portfolio composition is subject to change.
(a) Rounds to zero.
(b) Includes investments in Money Market Funds (amounting to $84.0 million) which have been segregated to cover obligations relating to the Fund's investment in derivatives which provide exposure to multiple markets. For a description of the Fund's investments in derivatives, see Investments in Derivatives following the Consolidated Portfolio of Investments and Note 2 to the Notes to Consolidated Financial Statements.
Annual Report 2016
5
COLUMBIA DIVERSIFIED ABSOLUTE RETURN FUND
MANAGER DISCUSSION OF FUND PERFORMANCE (continued)
Portfolio Breakdown — Short Positions (%)
(at May 31, 2016) | |
Common Stocks | | | (25.1 | ) | |
Total | | | (25.1 | ) | |
Percentages indicated are based upon total investments. The Fund's portfolio composition is subject to change.
Market Exposure Through Derivatives
Investments (% of notional exposure)
(at May 31, 2016)(a) | |
| | Long | | Short | | Net | |
Fixed Income
Derivative
Contracts | | | 94.2 | | | | (8.1 | ) | | | 86.1 | | |
Equity Derivative
Contracts | | | 13.9 | | | | (0.2 | ) | | | 13.7 | | |
Foreign Currency
Derivative
Contracts | | | 48.4 | | | | (48.2 | ) | | | 0.2 | | |
Total Notional
Market Value
of Derivative
Contracts | | | 156.5 | | | | (56.5 | ) | | | 100.0 | | |
(a) The Fund has market exposure (long and/or short) to the fixed income and equity asset classes and foreign currency through its investments in derivatives. The notional exposure of a financial instrument is the nominal or face amount that is used to calculate payments made on that instrument and/or changes in value for the instrument. The notional exposure is a hypothetical underlying quantity upon which payment obligations are computed. Notional exposures provide a gauge for how the Fund may behave given changes in individual markets. For a description of the Fund's investments in derivatives, see Investments in Derivatives following the Consolidated Portfolio of Investments, and Note 2 to the financial statements.
Investment Risks
Absolute return funds are not designed to outperform stocks and bonds in strong markets. Market risk may affect a single issuer, sector of the economy, industry or the market as a whole. Alternative investments involve substantial risks and are more volatile than traditional investments, making them more suitable for investors with an above-average tolerance for risk. Foreign investments subject the Fund to risks, including political, economic, market, social and others within a particular country, as well as to currency instabilities and less stringent financial and
outweighed the subsequent recovery in these asset classes that investors experienced toward the end of the period.
Alpha Strategies Posted Most Negative Absolute Returns
The Fund invests in three core strategies — alpha, which is a measure of return resulting from active management; tactical beta, which seeks opportunities to earn returns from price movements of broad markets; and alternative beta, which seeks to generate returns with relatively low correlation to overall market movements by employing a systematic, rules-based approach. During the period, each of these three components posted a negative absolute return amidst highly challenging market conditions. Alpha strategies posted the largest negative absolute return, followed by tactical beta and then alternative beta strategies.
Within the alpha strategies sleeve, which is comprised of six internally-managed hedge fund portfolios, the equity long/short alpha opportunities and VIX, or volatility index, futures strategies posted the biggest negative absolute returns. The G10 currency, the equity research market neutral and the adaptive risk allocation portfolios performed best on a relative basis. Within the tactical beta sleeve, a position in a global opportunities bond portfolio posted a significantly negative absolute return.
Flexible Portfolio Structure Enabled Changes
While the Fund features a flexible portfolio structure that employs both fundamental and quantitative methods to identify market opportunities and can dynamically reallocate as market conditions change, there were no material changes in the Fund's allocation during the period. Still, given the changes made within each of the core three strategies, the Fund's portfolio turnover rate for the 12-month period was 196%.
Derivatives Usage
The Fund utilizes derivatives for both hedging and non-hedging purposes, including, for example, seeking to enhance returns or as a substitute for a position in an underlying asset or index. During the period, the Fund used forward foreign currency exchange contracts, futures, options and swaps to more efficiently and cost effectively manage its exposures. These flexible structures, which allow for direct and highly versatile portfolio management applications, detracted from the Fund's results during the period.
The Fund is an absolute return-focused portfolio that seeks to meet its performance target regardless of global macro conditions. As such, the Fund invests in positions that tend to exhibit little market directionality. The Fund intends to adhere to its core three-strategy approach of investing in alpha, tactical beta and alternative beta sources of potential return.
Annual Report 2016
6
COLUMBIA DIVERSIFIED ABSOLUTE RETURN FUND
MANAGER DISCUSSION OF FUND PERFORMANCE (continued)
accounting standards generally applicable to U.S. issuers. The Fund's investment in other funds subjects it to the investment performance (positive or negative), risks and expenses of these underlying funds. ETFs trade like stocks, are subject to investment risk and will fluctuate in market value. Investment products, including shares of mutual funds, are not federally or FDIC-insured, are not deposits or obligations of, or guaranteed by any financial institution. The Fund employs multiple strategies independently of one another, which may result in contradicting trades (i.e., with no net benefit to the Fund) while increasing transaction costs. Commodity investments may be affected by the overall market and industry- and commodity-specific factors, and may be more volatile and less liquid than other investments. Investing in derivatives is a specialized activity that involves special risks that subject the Fund to significant loss potential, including when used as leverage, and may result in greater fluctuation in Fund value. The Fund's use of leverage subjects additional Fund assets to the risk of loss. The sales price the Fund (or its underlying investments) could receive for any particular investment may differ from the Fund's (or underlying investments') valuation of the investment. Short positions (where the underlying asset is not owned) can create unlimited risk. See the Fund's prospectus for more information on these and other risks.
Annual Report 2016
7
COLUMBIA DIVERSIFIED ABSOLUTE RETURN FUND
UNDERSTANDING YOUR FUND'S EXPENSES
(Unaudited)
As an investor, you incur two types of costs. There are transaction costs, which generally include sales charges on purchases and may include redemption fees. There are also ongoing costs, which generally include management fees, distribution and/or service fees, and other fund expenses. The following information is intended to help you understand your ongoing costs (in dollars) of investing in the Fund and to help you compare these costs with the ongoing costs of investing in other mutual funds.
Analyzing Your Fund's Expenses
To illustrate these ongoing costs, we have provided examples and calculated the expenses paid by investors in each share class of the Fund during the period. The actual and hypothetical information in the table is based on an initial investment of $1,000 at the beginning of the period indicated and held for the entire period. Expense information is calculated two ways and each method provides you with different information. The amount listed in the "Actual" column is calculated using the Fund's actual operating expenses and total return for the period. You may use the Actual information, together with the amount invested, to estimate the expenses that you paid over the period. Simply divide your account value by $1,000 (for example, an $8,600 account value divided by $1,000 = 8.6), then multiply the results by the expenses paid during the period under the "Actual" column. The amount listed in the "Hypothetical" column assumes a 5% annual rate of return before expenses (which is not the Fund's actual return) and then applies the Fund's actual expense ratio for the period to the hypothetical return. You should not use the hypothetical account values and expenses to estimate either your actual account balance at the end of the period or the expenses you paid during the period. See "Compare With Other Funds" below for details on how to use the hypothetical data.
Compare With Other Funds
Since all mutual funds are required to include the same hypothetical calculations about expenses in shareholder reports, you can use this information to compare the ongoing cost of investing in the Fund with other funds. To do so, compare the hypothetical example with the 5% hypothetical examples that appear in the shareholder reports of other funds. As you compare hypothetical examples of other funds, it is important to note that hypothetical examples are meant to highlight the ongoing costs of investing in a fund only and do not reflect any transaction costs, such as sales charges, or redemption or exchange fees. Therefore, the hypothetical calculations are useful in comparing ongoing costs only, and will not help you determine the relative total costs of owning different funds. If transaction costs were included in these calculations, your costs would be higher.
December 1, 2015 – May 31, 2016
| | | Account Value at the Beginning
of the Period ($) | | Account Value at the End of the
Period ($) | | Expenses Paid During the
Period ($) | | Fund's Annualized
Expense Ratio (%) | |
| | | Actual | | Hypothetical | | Actual | | Hypothetical | | Actual | | Hypothetical | | Actual | |
Class A | | | 1,000.00 | | | | 1,000.00 | | | | 987.80 | | | | 1,013.65 | | | | 11.28 | | | | 11.43 | | | | 2.27 | | |
Class C | | | 1,000.00 | | | | 1,000.00 | | | | 984.50 | | | | 1,009.90 | | | | 14.98 | | | | 15.17 | | | | 3.02 | | |
Class I | | | 1,000.00 | | | | 1,000.00 | | | | 989.70 | | | | 1,015.65 | | | | 9.30 | | | | 9.42 | | | | 1.87 | | |
Class R4 | | | 1,000.00 | | | | 1,000.00 | | | | 989.50 | | | | 1,014.90 | | | | 10.05 | | | | 10.18 | | | | 2.02 | | |
Class R5 | | | 1,000.00 | | | | 1,000.00 | | | | 990.60 | | | | 1,015.40 | | | | 9.55 | | | | 9.67 | | | | 1.92 | | |
Class W | | | 1,000.00 | | | | 1,000.00 | | | | 988.80 | | | | 1,013.65 | | | | 11.29 | | | | 11.43 | | | | 2.27 | | |
Class Z | | | 1,000.00 | | | | 1,000.00 | | | | 989.50 | | | | 1,014.90 | | | | 10.05 | | | | 10.18 | | | | 2.02 | | |
Expenses paid during the period are equal to the annualized expense ratio for each class as indicated above, multiplied by the average account value over the period and then multiplied by the number of days in the Fund's most recent fiscal half year and divided by 366.
Expenses do not include fees and expenses incurred indirectly by the Fund from its investment in underlying funds, including affiliated and non-affiliated pooled investment vehicles, such as mutual funds and exchange-traded funds.
Had Columbia Management Investment Advisers, LLC and/or certain of its affiliates not waived/reimbursed certain fees and expenses, account value at the end of the period would have been reduced.
Annual Report 2016
8
COLUMBIA DIVERSIFIED ABSOLUTE RETURN FUND
CONSOLIDATED PORTFOLIO OF INVESTMENTS
May 31, 2016
(Percentages represent value of investments compared to net assets)
Common Stocks 28.8%
Issuer | | Shares | | Value ($) | |
CONSUMER DISCRETIONARY 5.8% | |
Auto Components 0.1% | |
Magna International, Inc.(a) | | | 3,127 | | | | 126,737 | | |
Hotels, Restaurants & Leisure 0.8% | |
Darden Restaurants, Inc.(a) | | | 3,455 | | | | 234,352 | | |
Interval Leisure Group, Inc. | | | 3,159 | | | | 45,361 | | |
Norwegian Cruise Line Holdings Ltd.(a)(b) | | | 6,846 | | | | 317,723 | | |
Starwood Hotels & Resorts Worldwide, Inc. | | | 7,330 | | | | 538,242 | | |
Yum! Brands, Inc.(a) | | | 1,899 | | | | 155,889 | | |
Total | | | | | 1,291,567 | | |
Household Durables 0.7% | |
Mohawk Industries, Inc.(a)(b) | | | 423 | | | | 83,200 | | |
Newell Brands, Inc.(a) | | | 20,586 | | | | 981,746 | | |
Total | | | | | 1,064,946 | | |
Internet & Catalog Retail 1.5% | |
Amazon.com, Inc.(a)(b) | | | 1,869 | | | | 1,350,895 | | |
Ctrip.com International Ltd., ADR(a)(b) | | | 5,798 | | | | 265,316 | | |
Expedia, Inc.(a) | | | 4,680 | | | | 520,603 | | |
Lands' End, Inc.(a)(b) | | | 8,565 | | | | 143,635 | | |
Total | | | | | 2,280,449 | | |
Media 1.1% | |
Comcast Corp., Class A(a) | | | 13,635 | | | | 863,095 | | |
DISH Network Corp., Class A(a)(b) | | | 11,507 | | | | 574,199 | | |
Liberty Global PLC, Class A(a)(b) | | | 4,413 | | | | 164,826 | | |
News Corp., Class A(a) | | | 15,810 | | | | 189,088 | | |
Total | | | | | 1,791,208 | | |
Multiline Retail 0.2% | |
Hudson's Bay Co. | | | 8,358 | | | | 94,457 | | |
Target Corp.(a) | | | 2,419 | | | | 166,379 | | |
Total | | | | | 260,836 | | |
Specialty Retail 1.1% | |
Burlington Stores, Inc.(a)(b) | | | 2,275 | | | | 137,319 | | |
Cabela's, Inc.(a)(b) | | | 6,245 | | | | 303,257 | | |
Foot Locker, Inc.(a) | | | 2,057 | | | | 115,027 | | |
GameStop Corp., Class A(a) | | | 6,225 | | | | 181,148 | | |
GNC Holdings, Inc., Class A(a) | | | 3,573 | | | | 93,077 | | |
Home Depot, Inc. (The)(a) | | | 2,940 | | | | 388,433 | | |
Signet Jewelers Ltd.(a) | | | 993 | | | | 98,277 | | |
Williams-Sonoma, Inc.(a) | | | 6,551 | | | | 347,465 | | |
Total | | | | | 1,664,003 | | |
Common Stocks (continued)
Issuer | | Shares | | Value ($) | |
Textiles, Apparel & Luxury Goods 0.3% | |
Nike, Inc., Class B | | | 2,592 | | | | 143,130 | | |
Sequential Brands Group, Inc.(a)(b) | | | 37,565 | | | | 302,774 | | |
Total | | | | | 445,904 | | |
Total Consumer Discretionary | | | | | 8,925,650 | | |
CONSUMER STAPLES 1.6% | |
Beverages 0.4% | |
Constellation Brands, Inc., Class A(a) | | | 1,044 | | | | 159,889 | | |
Molson Coors Brewing Co., Class B(a) | | | 1,716 | | | | 170,193 | | |
PepsiCo, Inc.(a) | | | 2,572 | | | | 260,209 | | |
Total | | | | | 590,291 | | |
Food & Staples Retailing 0.2% | |
CVS Health Corp.(a) | | | 2,035 | | | | 196,276 | | |
SYSCO Corp.(a) | | | 3,061 | | | | 147,264 | | |
Total | | | | | 343,540 | | |
Food Products 0.4% | |
Mondelez International, Inc., Class A(a) | | | 3,137 | | | | 139,565 | | |
Pilgrim's Pride Corp.(a) | | | 9,171 | | | | 228,083 | | |
Tyson Foods, Inc., Class A(a) | | | 1,384 | | | | 88,271 | | |
WhiteWave Foods Co. (The)(a)(b) | | | 1,780 | | | | 79,477 | | |
Total | | | | | 535,396 | | |
Household Products 0.1% | |
Energizer Holdings, Inc.(a) | | | 2,495 | | | | 118,088 | | |
Personal Products 0.2% | |
Herbalife Ltd.(a)(b) | | | 2,937 | | | | 170,023 | | |
Nu Skin Enterprises, Inc., Class A(a) | | | 4,802 | | | | 189,439 | | |
Total | | | | | 359,462 | | |
Tobacco 0.3% | |
Altria Group, Inc.(a) | | | 3,321 | | | | 211,349 | | |
Philip Morris International, Inc.(a) | | | 2,343 | | | | 231,207 | | |
Total | | | | | 442,556 | | |
Total Consumer Staples | | | | | 2,389,333 | | |
ENERGY 1.1% | |
Energy Equipment & Services 0.2% | |
Halliburton Co.(a) | | | 1,723 | | | | 72,676 | | |
Schlumberger Ltd.(a) | | | 1,712 | | | | 130,626 | | |
Transocean Ltd.(a) | | | 14,535 | | | | 142,298 | | |
Total | | | | | 345,600 | | |
The accompanying Notes to Consolidated Financial Statements are an integral part of this statement.
Annual Report 2016
9
COLUMBIA DIVERSIFIED ABSOLUTE RETURN FUND
CONSOLIDATED PORTFOLIO OF INVESTMENTS (continued)
May 31, 2016
Common Stocks (continued)
Issuer | | Shares | | Value ($) | |
Oil, Gas & Consumable Fuels 0.9% | |
Anadarko Petroleum Corp.(a) | | | 1,617 | | | | 83,858 | | |
| BP PLC, ADR(a) | | | 3,416 | | | | 107,262 | | |
Cabot Oil & Gas Corp.(a) | | | 1,162 | | | | 27,853 | | |
Canadian Natural Resources Ltd. | | | 1,822 | | | | 54,186 | | |
Cimarex Energy Co.(a) | | | 432 | | | | 50,233 | | |
Continental Resources, Inc.(a)(b) | | | 977 | | | | 41,093 | | |
Devon Energy Corp.(a) | | | 2,534 | | | | 91,452 | | |
EOG Resources, Inc.(a) | | | 683 | | | | 55,569 | | |
Exxon Mobil Corp.(a) | | | 1,547 | | | | 137,714 | | |
Hess Corp.(a) | | | 1,379 | | | | 82,644 | | |
Kinder Morgan, Inc.(a) | | | 3,567 | | | | 64,491 | | |
Marathon Petroleum Corp.(a) | | | 669 | | | | 23,301 | | |
Noble Energy, Inc.(a) | | | 2,407 | | | | 86,050 | | |
Occidental Petroleum Corp.(a) | | | 711 | | | | 53,638 | | |
Suncor Energy, Inc.(a) | | | 5,554 | | | | 153,568 | | |
Tesoro Corp.(a) | | | 693 | | | | 54,109 | | |
Valero Energy Corp.(a) | | | 860 | | | | 47,042 | | |
World Fuel Services Corp.(a) | | | 3,979 | | | | 182,915 | | |
Total | | | | | 1,396,978 | | |
Total Energy | | | | | 1,742,578 | | |
FINANCIALS 2.9% | |
Banks 0.7% | |
Bank of America Corp.(a) | | | 11,879 | | | | 175,690 | | |
BB&T Corp.(a) | | | 3,319 | | | | 120,712 | | |
Citigroup, Inc.(a) | | | 4,622 | | | | 215,246 | | |
Fifth Third Bancorp(a) | | | 6,526 | | | | 123,146 | | |
PacWest Bancorp(a) | | | 3,023 | | | | 125,999 | | |
Wells Fargo & Co.(a) | | | 5,232 | | | | 265,367 | | |
Total | | | | | 1,026,160 | | |
Capital Markets 0.2% | |
Bank of New York Mellon Corp. (The)(a) | | | 1,802 | | | | 75,792 | | |
Invesco Ltd.(a) | | | 5,182 | | | | 162,715 | | |
Morgan Stanley(a) | | | 3,705 | | | | 101,406 | | |
Total | | | | | 339,913 | | |
Diversified Financial Services 0.1% | |
Intercontinental Exchange, Inc.(a) | | | 433 | | | | 117,395 | | |
Insurance 0.8% | |
Aflac, Inc.(a) | | | 3,415 | | | | 237,206 | | |
American Equity Investment Life
Holding Co.(a) | | | 6,717 | | | | 108,883 | | |
Common Stocks (continued)
Issuer | | Shares | | Value ($) | |
American International Group, Inc.(a) | | | 1,664 | | | | 96,312 | | |
Genworth Financial, Inc., Class A(b) | | | 33,120 | | | | 122,544 | | |
MetLife, Inc.(a) | | | 3,605 | | | | 164,208 | | |
Progressive Corp. (The)(a) | | | 3,414 | | | | 113,686 | | |
Prudential Financial, Inc.(a) | | | 2,648 | | | | 209,854 | | |
Reinsurance Group of America, Inc.(a) | | | 101 | | | | 10,013 | | |
Validus Holdings Ltd.(a) | | | 3,649 | | | | 177,670 | | |
Total | | | | | 1,240,376 | | |
Real Estate Investment Trusts (REITs) 0.8% | |
Alexandria Real Estate Equities, Inc. | | | 3,215 | | | | 311,533 | | |
CBL & Associates Properties, Inc.(a) | | | 14,730 | | | | 141,703 | | |
Empire State Realty Trust, Inc., Class A(a) | | | 11,195 | | | | 212,145 | | |
Lamar Advertising Co. Class A(a) | | | 4,655 | | | | 302,808 | | |
Outfront Media, Inc.(a) | | | 12,425 | | | | 276,332 | | |
Total | | | | | 1,244,521 | | |
Real Estate Management & Development 0.2% | |
St. Joe Co. (The)(a)(b) | | | 22,190 | | | | 385,662 | | |
Thrifts & Mortgage Finance 0.1% | |
MGIC Investment Corp.(a)(b) | | | 24,615 | | | | 173,536 | | |
Total Financials | | | | | 4,527,563 | | |
HEALTH CARE 5.2% | |
Biotechnology 2.8% | |
AbbVie, Inc.(a) | | | 2,433 | | | | 153,109 | | |
Alexion Pharmaceuticals, Inc.(b) | | | 2,979 | | | | 449,531 | | |
Alkermes PLC(a)(b) | | | 9,735 | | | | 451,801 | | |
Biogen, Inc.(a)(b) | | | 596 | | | | 172,679 | | |
BioMarin Pharmaceutical, Inc.(a)(b) | | | 4,911 | | | | 440,271 | | |
Bluebird Bio, Inc.(a)(b) | | | 8,656 | | | | 391,684 | | |
Dynavax Technologies Corp.(a)(b) | | | 16,310 | | | | 270,583 | | |
Novavax, Inc.(a)(b) | | | 94,998 | | | | 578,538 | | |
Spark Therapeutics, Inc.(a)(b) | | | 11,675 | | | | 653,216 | | |
Ultragenyx Pharmaceutical, Inc.(a)(b) | | | 4,265 | | | | 311,772 | | |
Vertex Pharmaceuticals, Inc.(a)(b) | | | 4,288 | | | | 399,427 | | |
Total | | | | | 4,272,611 | | |
Health Care Equipment & Supplies 0.8% | |
DENTSPLY SIRONA, Inc.(a) | | | 3,455 | | | | 214,763 | | |
Entellus Medical, Inc.(a)(b) | | | 3,351 | | | | 60,117 | | |
Medtronic PLC(a) | | | 6,525 | | | | 525,132 | | |
Zimmer Biomet Holdings, Inc.(a) | | | 3,091 | | | | 377,442 | | |
Total | | | | | 1,177,454 | | |
The accompanying Notes to Consolidated Financial Statements are an integral part of this statement.
Annual Report 2016
10
COLUMBIA DIVERSIFIED ABSOLUTE RETURN FUND
CONSOLIDATED PORTFOLIO OF INVESTMENTS (continued)
May 31, 2016
Common Stocks (continued)
Issuer | | Shares | | Value ($) | |
Health Care Providers & Services 0.9% | |
Aetna, Inc.(a) | | | 1,865 | | | | 211,174 | | |
AmerisourceBergen Corp.(a) | | | 2,568 | | | | 192,548 | | |
Centene Corp.(b) | | | 4,625 | | | | 288,369 | | |
CIGNA Corp.(a) | | | 1,156 | | | | 148,095 | | |
Express Scripts Holding Co.(a)(b) | | | 2,668 | | | | 201,567 | | |
Humana, Inc.(a) | | | 1,470 | | | | 253,590 | | |
Laboratory Corp. of America Holdings(a)(b) | | | 1,480 | | | | 189,366 | | |
Total | | | | | 1,484,709 | | |
Life Sciences Tools & Services 0.1% | |
Thermo Fisher Scientific, Inc.(a) | | | 1,217 | | | | 184,704 | | |
Pharmaceuticals 0.6% | |
Allergan PLC(a)(b) | | | 950 | | | | 223,963 | | |
Bristol-Myers Squibb Co.(a) | | | 5,689 | | | | 407,901 | | |
GW Pharmaceuticals PLC ADR(a)(b) | | | 721 | | | | 64,256 | | |
Merck & Co., Inc.(a) | | | 594 | | | | 33,418 | | |
Pfizer, Inc.(a) | | | 6,806 | | | | 236,168 | | |
Total | | | | | 965,706 | | |
Total Health Care | | | | | 8,085,184 | | |
INDUSTRIALS 3.8% | |
Aerospace & Defense 1.0% | |
Boeing Co. (The)(a) | | | 213 | | | | 26,870 | | |
Honeywell International, Inc.(a) | | | 1,511 | | | | 171,997 | | |
Lockheed Martin Corp.(a) | | | 2,545 | | | | 601,206 | | |
Mercury Systems, Inc.(a)(b) | | | 6,457 | | | | 137,211 | | |
Northrop Grumman Corp.(a) | | | 2,812 | | | | 598,028 | | |
Total | | | | | 1,535,312 | | |
Air Freight & Logistics 0.1% | |
United Parcel Service, Inc., Class B(a) | | | 1,615 | | | | 166,490 | | |
Airlines 0.7% | |
Alaska Air Group, Inc.(a) | | | 7,897 | | | | 524,361 | | |
American Airlines Group, Inc.(a) | | | 2,288 | | | | 73,010 | | |
Delta Air Lines, Inc.(a) | | | 4,169 | | | | 181,185 | | |
United Continental Holdings, Inc.(a)(b) | | | 5,628 | | | | 253,766 | | |
Total | | | | | 1,032,322 | | |
Electrical Equipment 0.2% | |
Rockwell Automation, Inc.(a) | | | 2,360 | | | | 273,878 | | |
Industrial Conglomerates 0.1% | |
Carlisle Companies, Inc.(a) | | | 1,865 | | | | 193,624 | | |
Common Stocks (continued)
Issuer | | Shares | | Value ($) | |
Machinery 0.8% | |
FANUC Corp., ADR | | | 13,530 | | | | 343,121 | | |
Ingersoll-Rand PLC(a) | | | 6,176 | | | | 412,619 | | |
Snap-On, Inc.(a) | | | 714 | | | | 115,539 | | |
Xylem, Inc. | | | 10,310 | | | | 460,445 | | |
Total | | | | | 1,331,724 | | |
Professional Services 0.2% | |
Dun & Bradstreet Corp. (The)(a) | | | 1,009 | | | | 128,042 | | |
ManpowerGroup, Inc.(a) | | | 2,334 | | | | 186,137 | | |
Total | | | | | 314,179 | | |
Road & Rail 0.6% | |
CSX Corp.(a) | | | 11,555 | | | | 305,399 | | |
JB Hunt Transport Services, Inc.(a) | | | 1,854 | | | | 153,363 | | |
Kansas City Southern(a) | | | 2,405 | | | | 223,905 | | |
Union Pacific Corp.(a) | | | 3,065 | | | | 258,042 | | |
Total | | | | | 940,709 | | |
Trading Companies & Distributors 0.1% | |
HD Supply Holdings, Inc.(a)(b) | | | 2,799 | | | | 98,805 | | |
Total Industrials | | | | | 5,887,043 | | |
INFORMATION TECHNOLOGY 6.5% | |
Communications Equipment 0.7% | |
Cisco Systems, Inc.(a) | | | 7,986 | | | | 231,993 | | |
F5 Networks, Inc.(a)(b) | | | 1,987 | | | | 218,967 | | |
Palo Alto Networks, Inc.(a)(b) | | | 4,425 | | | | 577,286 | | |
Total | | | | | 1,028,246 | | |
Electronic Equipment, Instruments & Components 0.4% | |
Universal Display Corp.(a)(b) | | | 2,810 | | | | 188,692 | | |
Zebra Technologies Corp., Class A(a)(b) | | | 6,158 | | | | 327,051 | | |
Total | | | | | 515,743 | | |
Internet Software & Services 1.0% | |
Akamai Technologies, Inc.(b) | | | 3,017 | | | | 164,668 | | |
Alphabet, Inc., Class A(a)(b) | | | 761 | | | | 569,875 | | |
Alphabet, Inc., Class C(b) | | | 836 | | | | 615,062 | | |
VeriSign, Inc.(a)(b) | | | 2,610 | | | | 223,050 | | |
Total | | | | | 1,572,655 | | |
IT Services 0.5% | |
EPAM Systems, Inc.(a)(b) | | | 2,890 | | | | 221,114 | | |
Leidos Holdings, Inc.(a) | | | 7,475 | | | | 369,265 | | |
PayPal Holdings, Inc.(a)(b) | | | 5,546 | | | | 209,583 | | |
Total | | | | | 799,962 | | |
The accompanying Notes to Consolidated Financial Statements are an integral part of this statement.
Annual Report 2016
11
COLUMBIA DIVERSIFIED ABSOLUTE RETURN FUND
CONSOLIDATED PORTFOLIO OF INVESTMENTS (continued)
May 31, 2016
Common Stocks (continued)
Issuer | | Shares | | Value ($) | |
Semiconductors & Semiconductor Equipment 2.0% | |
Broadcom Ltd.(a) | | | 1,236 | | | | 190,789 | | |
Cavium, Inc.(a)(b) | | | 3,400 | | | | 169,150 | | |
Lam Research Corp.(a) | | | 7,476 | | | | 619,088 | | |
Marvell Technology Group Ltd.(a) | | | 7,747 | | | | 79,252 | | |
Microchip Technology, Inc.(a) | | | 3,231 | | | | 166,978 | | |
NVIDIA Corp.(a) | | | 10,810 | | | | 505,043 | | |
NXP Semiconductors NV(a)(b) | | | 1,818 | | | | 171,783 | | |
Qorvo, Inc.(a)(b) | | | 8,185 | | | | 417,189 | | |
Silicon Laboratories, Inc.(a)(b) | | | 7,220 | | | | 359,195 | | |
Skyworks Solutions, Inc. | | | 6,740 | | | | 449,962 | | |
Total | | | | | 3,128,429 | | |
Software 1.4% | |
Electronic Arts, Inc.(a)(b) | | | 10,951 | | | | 840,489 | | |
Red Hat, Inc.(a)(b) | | | 2,554 | | | | 197,833 | | |
Salesforce.com, Inc.(a)(b) | | | 4,168 | | | | 348,904 | | |
Tableau Software, Inc., Class A(a)(b) | | | 2,716 | | | | 139,711 | | |
Workday, Inc., Class A(a)(b) | | | 7,337 | | | | 556,438 | | |
Total | | | | | 2,083,375 | | |
Technology Hardware, Storage & Peripherals 0.5% | |
Apple, Inc.(a) | | | 4,212 | | | | 420,610 | | |
Diebold, Inc.(a) | | | 5,829 | | | | 150,680 | | |
Electronics for Imaging, Inc.(a)(b) | | | 5,595 | | | | 245,229 | | |
Total | | | | | 816,519 | | |
Total Information Technology | | | | | 9,944,929 | | |
MATERIALS 1.0% | |
Chemicals 0.6% | |
Albemarle Corp.(a) | | | 1,025 | | | | 80,463 | | |
Cabot Corp.(a) | | | 3,531 | | | | 161,402 | | |
Dow Chemical Co. (The)(a) | | | 1,904 | | | | 97,789 | | |
Eastman Chemical Co.(a) | | | 1,144 | | | | 83,924 | | |
EI du Pont de Nemours & Co.(a) | | | 837 | | | | 54,748 | | |
LyondellBasell Industries NV, Class A(a) | | | 2,362 | | | | 192,172 | | |
Monsanto Co.(a) | | | 437 | | | | 49,149 | | |
PPG Industries, Inc.(a) | | | 876 | | | | 94,328 | | |
Westlake Chemical Corp.(a) | | | 719 | | | | 31,730 | | |
Total | | | | | 845,705 | | |
Common Stocks (continued)
Issuer | | Shares | | Value ($) | |
Containers & Packaging 0.2% | |
Sealed Air Corp.(a) | | | 7,799 | | | | 362,186 | | |
Metals & Mining 0.1% | |
Alcoa, Inc.(a) | | | 2,741 | | | | 25,409 | | |
Nucor Corp.(a) | | | 349 | | | | 16,930 | | |
Reliance Steel & Aluminum Co.(a) | | | 1,315 | | | | 97,770 | | |
Steel Dynamics, Inc.(a) | | | 1,629 | | | | 40,220 | | |
Total | | | | | 180,329 | | |
Paper & Forest Products 0.1% | |
Domtar Corp.(a) | | | 5,678 | | | | 219,398 | | |
Total Materials | | | | | 1,607,618 | | |
TELECOMMUNICATION SERVICES 0.1% | |
Diversified Telecommunication Services 0.1% | |
CenturyLink, Inc.(a) | | | 5,456 | | | | 147,967 | | |
Total Telecommunication Services | | | | | 147,967 | | |
UTILITIES 0.8% | |
Electric Utilities 0.4% | |
American Electric Power Co., Inc.(a) | | | 1,343 | | | | 86,932 | | |
Edison International(a) | | | 1,256 | | | | 89,967 | | |
Entergy Corp.(a) | | | 2,421 | | | | 183,802 | | |
PG&E Corp.(a) | | | 681 | | | | 40,915 | | |
Pinnacle West Capital Corp.(a) | | | 1,021 | | | | 75,135 | | |
Xcel Energy, Inc.(a) | | | 1,915 | | | | 79,224 | | |
Total | | | | | 555,975 | | |
Gas Utilities —% | |
Atmos Energy Corp.(a) | | | 652 | | | | 47,531 | | |
Multi-Utilities 0.4% | |
Ameren Corp. | | | 2,625 | | | | 130,069 | | |
DTE Energy Co.(a) | | | 1,280 | | | | 116,070 | | |
NiSource, Inc.(a) | | | 4,055 | | | | 96,752 | | |
Public Service Enterprise Group, Inc.(a) | | | 5,046 | | | | 225,809 | | |
Total | | | | | 568,700 | | |
Total Utilities | | | | | 1,172,206 | | |
Total Common Stocks
(Cost: $43,799,195) | | | | | 44,430,071 | | |
The accompanying Notes to Consolidated Financial Statements are an integral part of this statement.
Annual Report 2016
12
COLUMBIA DIVERSIFIED ABSOLUTE RETURN FUND
CONSOLIDATED PORTFOLIO OF INVESTMENTS (continued)
May 31, 2016
Corporate Bonds & Notes 1.9%
Issuer | | Coupon
Rate | | Principal
Amount ($) | | Value ($) | |
Aerospace & Defense —% | |
L-3 Communications Corp.
05/28/24 | | | 3.950 | % | | | 9,000 | | | | 9,114 | | |
Automotive —% | |
American Axle & Manufacturing, Inc.
02/15/19 | | | 5.125 | % | | | 25,000 | | | | 25,500 | | |
Fiat Chrysler Automobiles NV
04/15/20 | | | 4.500 | % | | | 10,000 | | | | 10,100 | | |
Schaeffler Holding Finance BV
PIK(c)
08/15/18 | | | 6.875 | % | | | 10,030 | | | | 10,331 | | |
Total | | | | | | | 45,931 | | |
Banking —% | |
Ally Financial, Inc.
11/18/19 | | | 3.750 | % | | | 36,000 | | | | 36,000 | | |
Building Materials —% | |
Masco Corp.
04/01/21 | | | 3.500 | % | | | 2,000 | | | | 2,025 | | |
Nortek, Inc.
04/15/21 | | | 8.500 | % | | | 22,000 | | | | 22,963 | | |
USG Corp.(c)
11/01/21 | | | 5.875 | % | | | 25,000 | | | | 26,281 | | |
Total | | | | | | | 51,269 | | |
Cable and Satellite 0.1% | |
CCO Holdings LLC/Capital Corp.
03/15/21 | | | 5.250 | % | | | 30,000 | | | | 31,200 | | |
Cablevision Systems Corp.
09/15/17 | | | 8.625 | % | | | 24,000 | | | | 25,530 | | |
Charter Communications Operating LLC/Capital(c)
07/23/20 | | | 3.579 | % | | | 10,000 | | | | 10,316 | | |
Hughes Satellite Systems Corp.
06/15/19 | | | 6.500 | % | | | 16,000 | | | | 17,160 | | |
Virgin Media Secured Finance PLC
01/15/21 | | | 5.250 | % | | | 25,000 | | | | 26,687 | | |
Total | | | | | | | 110,893 | | |
Chemicals —% | |
Ashland, Inc.
04/15/18 | | | 3.875 | % | | | 29,000 | | | | 29,725 | | |
LYB International Finance BV
03/15/44 | | | 4.875 | % | | | 20,000 | | | | 19,586 | | |
Total | | | | | | | 49,311 | | |
Construction Machinery —% | |
CNH Industrial Capital LLC
02/01/17 | | | 3.250 | % | | | 22,000 | | | | 22,110 | | |
Corporate Bonds & Notes (continued)
Issuer | | Coupon
Rate | | Principal
Amount ($) | | Value ($) | |
Consumer Cyclical Services —% | |
ADT Corp. (The)
03/15/20 | | | 5.250 | % | | | 11,000 | | | | 11,591 | | |
Service Corp. International
11/15/20 | | | 4.500 | % | | | 34,000 | | | | 34,893 | | |
Total | | | | | | | 46,484 | | |
Consumer Products —% | |
Spectrum Brands, Inc.
11/15/20 | | | 6.375 | % | | | 24,000 | | | | 25,111 | | |
Tempur Sealy International, Inc.
12/15/20 | | | 6.875 | % | | | 24,000 | | | | 25,517 | | |
Total | | | | | | | 50,628 | | |
Electric 0.2% | |
DTE Energy Co.
12/01/23 | | | 3.850 | % | | | 100,000 | | | | 107,028 | | |
IPALCO Enterprises, Inc.
07/15/20 | | | 3.450 | % | | | 25,000 | | | | 25,250 | | |
NRG Energy, Inc.
01/15/18 | | | 7.625 | % | | | 13,000 | | | | 13,975 | | |
Pacific Gas & Electric Co.
08/15/24 | | | 3.400 | % | | | 100,000 | | | | 105,568 | | |
Progress Energy, Inc.
04/01/22 | | | 3.150 | % | | | 100,000 | | | | 102,414 | | |
Total | | | | | | | 354,235 | | |
Finance Companies 0.1% | |
AerCap Aviation Solutions BV
05/30/17 | | | 6.375 | % | | | 33,000 | | | | 34,114 | | |
Aircastle Ltd.
04/15/17 | | | 6.750 | % | | | 25,000 | | | | 25,812 | | |
CIT Group, Inc.
03/15/18 | | | 5.250 | % | | | 24,000 | | | | 24,780 | | |
Navient Corp.
06/15/18 | | | 8.450 | % | | | 22,000 | | | | 23,705 | | |
OneMain Financial Holdings LLC(c)
12/15/19 | | | 6.750 | % | | | 28,000 | | | | 28,210 | | |
Total | | | | | | | 136,621 | | |
Food and Beverage 0.1% | |
Aramark Services, Inc.
03/15/20 | | | 5.750 | % | | | 6,000 | | | | 6,191 | | |
ConAgra Foods, Inc.
01/25/23 | | | 3.200 | % | | | 43,000 | | | | 43,468 | | |
Constellation Brands, Inc.
11/15/19 | | | 3.875 | % | | | 34,000 | | | | 35,615 | | |
The accompanying Notes to Consolidated Financial Statements are an integral part of this statement.
Annual Report 2016
13
COLUMBIA DIVERSIFIED ABSOLUTE RETURN FUND
CONSOLIDATED PORTFOLIO OF INVESTMENTS (continued)
May 31, 2016
Corporate Bonds & Notes (continued)
Issuer | | Coupon
Rate | | Principal
Amount ($) | | Value ($) | |
Molson Coors Brewing Co.
05/01/42 | | | 5.000 | % | | | 50,000 | | | | 54,180 | | |
Total | | | | | | | 139,454 | | |
Gaming —% | |
GLP Capital LP/Financing II, Inc.
11/01/18 | | | 4.375 | % | | | 25,000 | | | | 25,812 | | |
MGM Resorts International
03/01/18 | | | 11.375 | % | | | 22,000 | | | | 25,080 | | |
Total | | | | | | | 50,892 | | |
Health Care 0.1% | |
CHS/Community Health Systems, Inc.
08/15/18 | | | 5.125 | % | | | 5,000 | | | | 5,093 | | |
HCA, Inc.
10/15/19 | | | 4.250 | % | | | 30,000 | | | | 31,125 | | |
Kinetic Concepts, Inc./KCI U.S.A., Inc.(c)
02/15/21 | | | 7.875 | % | | | 2,000 | | | | 2,146 | | |
Tenet Healthcare Corp.(c)(d)
06/15/20 | | | 4.134 | % | | | 22,000 | | | | 21,890 | | |
Universal Health Services, Inc.(c)
08/01/19 | | | 3.750 | % | | | 23,000 | | | | 23,747 | | |
Total | | | | | | | 84,001 | | |
Healthcare Insurance —% | |
Wellcare Health Plans, Inc.
11/15/20 | | | 5.750 | % | | | 24,000 | | | | 24,870 | | |
Home Construction 0.1% | |
CalAtlantic Group, Inc.
05/15/18 | | | 8.375 | % | | | 15,000 | | | | 16,575 | | |
D.R. Horton, Inc.
02/15/20 | | | 4.000 | % | | | 35,000 | | | | 36,137 | | |
Lennar Corp.
11/15/19 | | | 4.500 | % | | | 34,000 | | | | 35,233 | | |
Toll Brothers Finance Corp.
11/01/19 | | | 6.750 | % | | | 38,000 | | | | 42,750 | | |
Total | | | | | | | 130,695 | | |
Independent Energy 0.1% | |
Continental Resources, Inc.
06/01/44 | | | 4.900 | % | | | 65,000 | | | | 53,462 | | |
Woodside Finance Ltd.(c)
03/05/25 | | | 3.650 | % | | | 50,000 | | | | 47,424 | | |
Total | | | | | | | 100,886 | | |
Integrated Energy —% | |
Cenovus Energy, Inc.
09/15/42 | | | 4.450 | % | | | 8,000 | | | | 5,879 | | |
Leisure —% | |
Cedar Fair LP/Canada's Wonderland Co./Magnum Management Corp.
03/15/21 | | | 5.250 | % | | | 26,000 | | | | 27,040 | | |
Corporate Bonds & Notes (continued)
Issuer | | Coupon
Rate | | Principal
Amount ($) | | Value ($) | |
Life Insurance 0.1% | |
Five Corners Funding Trust(c)
11/15/23 | | | 4.419 | % | | | 100,000 | | | | 106,224 | | |
Lodging —% | |
Choice Hotels International, Inc.
08/28/20 | | | 5.700 | % | | | 30,000 | | | | 32,250 | | |
Media and Entertainment 0.2% | |
21st Century Fox America, Inc.
09/15/44 | | | 4.750 | % | | | 50,000 | | | | 52,854 | | |
Nielsen Finance LLC/Co.
10/01/20 | | | 4.500 | % | | | 33,000 | | | | 33,784 | | |
Scripps Networks Interactive, Inc.
06/15/25 | | | 3.950 | % | | | 50,000 | | | | 51,390 | | |
Sky PLC(c)
11/26/22 | | | 3.125 | % | | | 50,000 | | | | 49,810 | | |
Univision Communications, Inc.(c)
09/15/22 | | | 6.750 | % | | | 25,000 | | | | 26,531 | | |
Total | | | | | | | 214,369 | | |
Midstream 0.3% | |
Columbia Pipeline Group, Inc.
06/01/45 | | | 5.800 | % | | | 56,000 | | | | 60,642 | | |
Enterprise Products Operating LLC
05/15/46 | | | 4.900 | % | | | 50,000 | | | | 49,890 | | |
Kinder Morgan Energy Partners LP
02/15/18 | | | 5.950 | % | | | 294,000 | | | | 309,120 | | |
03/01/43 | | | 5.000 | % | | | 50,000 | | | | 42,870 | | |
Williams Partners LP
09/15/45 | | | 5.100 | % | | | 50,000 | | | | 40,420 | | |
Total | | | | | | | 502,942 | | |
Natural Gas —% | |
Sempra Energy
06/15/24 | | | 3.550 | % | | | 50,000 | | | | 51,636 | | |
Packaging 0.1% | |
Reynolds Group Issuer, Inc./LLC
08/15/19 | | | 7.875 | % | | | 39,000 | | | | 40,121 | | |
Silgan Holdings, Inc.
04/01/20 | | | 5.000 | % | | | 35,000 | | | | 36,138 | | |
Total | | | | | | | 76,259 | | |
Paper —% | |
Graphic Packaging International, Inc.
04/15/21 | | | 4.750 | % | | | 30,000 | | | | 31,425 | | |
Pharmaceuticals —% | |
Valeant Pharmaceuticals International, Inc.(c)
08/15/18 | | | 6.750 | % | | | 9,000 | | | | 8,798 | | |
The accompanying Notes to Consolidated Financial Statements are an integral part of this statement.
Annual Report 2016
14
COLUMBIA DIVERSIFIED ABSOLUTE RETURN FUND
CONSOLIDATED PORTFOLIO OF INVESTMENTS (continued)
May 31, 2016
Corporate Bonds & Notes (continued)
Issuer | | Coupon
Rate | | Principal
Amount ($) | | Value ($) | |
Retailers 0.1% | |
Dollar Tree, Inc.(c)
03/01/20 | | | 5.250 | % | | | 34,000 | | | | 35,445 | | |
L Brands, Inc.
04/01/21 | | | 6.625 | % | | | 25,000 | | | | 27,844 | | |
Total | | | | | | | 63,289 | | |
Technology 0.1% | |
Equinix, Inc.
04/01/20 | | | 4.875 | % | | | 25,000 | | | | 25,938 | | |
First Data Corp.(c)
11/01/20 | | | 6.750 | % | | | 27,000 | | | | 28,417 | | |
NXP BV/Funding LLC(c)
06/15/20 | | | 4.125 | % | | | 26,000 | | | | 26,520 | | |
Total | | | | | | | 80,875 | | |
Transportation Services —% | |
ERAC U.S.A. Finance LLC(c)
02/15/45 | | | 4.500 | % | | | 50,000 | | | | 50,766 | | |
Wireless 0.1% | |
SBA Telecommunications, Inc.
07/15/20 | | | 5.750 | % | | | 24,000 | | | | 24,720 | | |
Sprint Communications, Inc.(c)
11/15/18 | | | 9.000 | % | | | 10,000 | | | | 10,625 | | |
T-Mobile USA, Inc.
04/28/20 | | | 6.542 | % | | | 26,000 | | | | 26,861 | | |
Total | | | | | | | 62,206 | | |
Wirelines 0.1% | |
AT&T, Inc.
06/15/45 | | | 4.350 | % | | | 50,000 | | | | 47,057 | | |
CenturyLink, Inc.
06/15/17 | | | 5.150 | % | | | 26,000 | | | | 26,663 | | |
Verizon Communications, Inc.
11/01/42 | | | 3.850 | % | | | 90,000 | | | | 82,309 | | |
Total | | | | | | | 156,029 | | |
Total Corporate Bonds & Notes
(Cost: $2,834,404) | | | | | | | 2,913,381 | | |
Residential Mortgage-Backed Securities — Agency —%
Federal Home Loan Mortgage Corp.
CMO IO Series 326 Class S2(d)(e)
03/15/44 | | | 5.516 | % | | | 83,354 | | | | 19,012 | | |
Government National Mortgage Association
CMO IO Series 2014-190 Class AI(e)
12/20/38 | | | 3.500 | % | | | 276,815 | | | | 38,363 | | |
Total Residential Mortgage-Backed
Securities — Agency
(Cost: $62,348) | | | | | | | 57,375 | | |
Residential Mortgage-Backed Securities — Non-Agency 0.7%
Issuer | | Coupon
Rate | | Principal
Amount ($) | | Value ($) | |
Credit Suisse Mortgage Capital Certificates(c)
Series 2010-9R Class 1A3
08/27/37 | | | 3.750 | % | | | 378,729 | | | | 383,652 | | |
Credit Suisse Mortgage Capital Certificates(c)(d) | |
CMO Series 2014-RPL4 Class A1
08/25/62 | | | 3.625 | % | | | 218,778 | | | | 216,090 | | |
CMO Series 2014-RPL4 Class A2
08/25/62 | | | 4.720 | % | | | 500,000 | | | | 491,906 | | |
Total Residential Mortgage-Backed
Securities — Non-Agency
(Cost: $1,074,380) | | | | | | | 1,091,648 | | |
Commercial Mortgage-Backed Securities — Non-Agency 0.7%
American Homes 4 Rent(c)
Series 2015-SFR1 Class A
04/17/52 | | | 3.467 | % | | | 245,138 | | | | 252,892 | | |
American Homes 4 Rent(c)(d) | |
Series 2014-SFR1 Class E
06/17/31 | | | 2.935 | % | | | 250,000 | | | | 239,998 | | |
Banc of America Merrill Lynch Re-Remic Trust
Series 2014-FRR7 Class A(c)(d)
10/26/44 | | | 2.689 | % | | | 500,000 | | | | 493,307 | | |
Rialto Real Estate Fund LLC
Series 2015-LT7 Class A(c)
12/25/32 | | | 3.000 | % | | | 108,946 | | | | 108,946 | | |
VFC LLC
Series 2015-3 Class A(c)
12/20/31 | | | 2.750 | % | | | 4,238 | | | | 4,238 | | |
Total Commercial Mortgage-Backed
Securities — Non-Agency
(Cost: $1,098,766) | | | | | | | 1,099,381 | | |
Asset-Backed Securities — Non-Agency 0.1%
SPS Servicer Advance Receivables Trust
Series 2015-T2 Class AT2(c)
01/15/47 | | | 2.620 | % | | | 100,000 | | | | 100,038 | | |
Total Asset-Backed Securities — Non-Agency
(Cost: $99,992) | | | | | | | 100,038 | | |
Inflation-Indexed Bonds(f) 0.1%
MEXICO 0.1% | |
Mexican Udibonos
11/15/40 | | | 4.000 | % | | MXN | 2,168,858 | | | | 122,544 | | |
Total Inflation-Indexed Bonds
(Cost: $151,950) | | | | | | | 122,544 | | |
The accompanying Notes to Consolidated Financial Statements are an integral part of this statement.
Annual Report 2016
15
COLUMBIA DIVERSIFIED ABSOLUTE RETURN FUND
CONSOLIDATED PORTFOLIO OF INVESTMENTS (continued)
May 31, 2016
U.S. Treasury Obligations —%
Issuer | | Coupon
Rate | | Principal
Amount ($) | | Value ($) | |
U.S. Treasury
05/15/25 | | | 2.125 | % | | | 70,000 | | | | 71,838 | | |
Total U.S. Treasury Obligations
(Cost: $69,098) | | | | | | | 71,838 | | |
Foreign Government Obligations(f)(g) 3.4%
ARGENTINA 0.1% | |
Argentina Republic Government International Bond(c)
04/22/26 | | | 7.500 | % | | | 150,000 | | | | 157,500 | | |
AUSTRALIA 0.1% | |
Australia Government Bond(c)
10/21/19 | | | 2.750 | % | | AUD | 170,000 | | | | 127,228 | | |
04/21/25 | | | 3.250 | % | | AUD | 89,000 | | | | 69,452 | | |
Total | | | | | | | 196,680 | | |
CANADA 0.4% | |
Canadian Government Bond
06/01/26 | | | 1.500 | % | | | 710,000 | | | | 550,902 | | |
CROATIA 0.1% | |
Croatia Government International Bond(c)
01/26/24 | | | 6.000 | % | | | 200,000 | | | | 215,850 | | |
DOMINICAN REPUBLIC 0.1% | |
Dominican Republic International Bond(c)
05/06/21 | | | 7.500 | % | | | 137,000 | | | | 150,357 | | |
GEORGIA 0.2% | |
Georgian Railway JSC(c)
07/11/22 | | | 7.750 | % | | | 200,000 | | | | 220,040 | | |
HUNGARY 0.4% | |
Hungary Government Bond
06/24/25 | | | 5.500 | % | | HUF | 100,300,000 | | | | 417,639 | | |
MFB Hungarian Development Bank(c)
10/21/20 | | | 6.250 | % | | | 200,000 | | | | 221,069 | | |
Total | | | | | | | 638,708 | | |
INDONESIA 0.1% | |
Indonesia Government International Bond(c)
01/08/26 | | | 4.750 | % | | | 200,000 | | | | 212,063 | | |
IRELAND 0.1% | |
Vnesheconombank Via VEB Finance PLC(c)
11/21/23 | | | 5.942 | % | | | 200,000 | | | | 201,290 | | |
Foreign Government Obligations(f)(g) (continued)
Issuer | | Coupon
Rate | | Principal
Amount ($) | | Value ($) | |
IVORY COAST 0.1% | |
Ivory Coast Government International Bond(c)
07/23/24 | | | 5.375 | % | | | 200,000 | | | | 182,540 | | |
MEXICO 0.3% | |
Mexican Bonos
11/23/34 | | | 7.750 | % | | MXN | 3,070,000 | | | | 183,491 | | |
Petroleos Mexicanos(c)
02/04/19 | | | 5.500 | % | | | 191,000 | | | | 199,499 | | |
Total | | | | | | | 382,990 | | |
POLAND 0.2% | |
Poland Government Bond
07/25/26 | | | 2.500 | % | | PLN | 1,350,000 | | | | 324,569 | | |
RUSSIAN FEDERATION 0.7% | |
Russian Federal Bond — OFZ
08/16/23 | | | 7.000 | % | | RUB | 25,000,000 | | | | 339,282 | | |
02/03/27 | | | 8.150 | % | | RUB | 38,000,000 | | | | 548,550 | | |
01/19/28 | | | 7.050 | % | | RUB | 19,000,000 | | | | 251,162 | | |
Total | | | | | | | 1,138,994 | | |
UNITED KINGDOM 0.5% | |
United Kingdom Gilt(c)
03/07/25 | | | 5.000 | % | | GBP | 372,000 | | | | 701,742 | | |
Total Foreign Government Obligations
(Cost: $5,297,204) | | | | | | | 5,274,225 | | |
Exchange-Traded Funds 14.0%
| | | Shares | | Value ($) | |
Vanguard Mortgage-Backed
Securities ETF | | | 15,609 | | | | 834,301 | | |
Vanguard REIT ETF | | | 28,048 | | | | 2,347,337 | | |
iPath Bloomberg Commodity Index
Total Return ETN(b) | | | 99,691 | | | | 2,341,742 | | |
iShares JPMorgan USD Emerging
Markets Bond ETF | | | 17,966 | | | | 1,993,867 | | |
iShares TIPS Bond ETF | | | 60,979 | | | | 6,960,143 | | |
iShares iBoxx $ High Yield Corporate
Bond ETF | | | 55,827 | | | | 4,667,695 | | |
iShares iBoxx $ Investment Grade
Corporate Bond ETF | | | 20,836 | | | | 2,487,610 | | |
Total Exchange-Traded Funds
(Cost: $21,142,025) | | | | | 21,632,695 | | |
The accompanying Notes to Consolidated Financial Statements are an integral part of this statement.
Annual Report 2016
16
COLUMBIA DIVERSIFIED ABSOLUTE RETURN FUND
CONSOLIDATED PORTFOLIO OF INVESTMENTS (continued)
May 31, 2016
Limited Partnerships 0.1%
Issuer | | Shares | | Value ($) | |
FINANCIALS 0.1% | |
Capital Markets 0.1% | |
Lazard Ltd., Class A(a) | | | 2,506 | | | | 88,161 | | |
Total Financials | | | 88,161 | | |
Total Limited Partnerships
(Cost: $96,286) | | | 88,161 | �� | |
Treasury Bills 1.3%
Issuer | | Effective
Yield | | Principal
Amount ($) | | Value ($) | |
UNITED STATES 1.3% | |
U.S. Treasury Bills
12/08/16 | | | 0.450 | % | | | 1,940,000 | | | | 1,935,394 | | |
Total Treasury Bills
(Cost: $1,934,061) | | | | | | | 1,935,394 | | |
Options Purchased Puts —%
Issuer | | Notional ($)/
Contracts | | Exercise
Price | | Expiration
Date | | Value ($) | |
Put — OTC
5-Year Interest
Rate Swap(h) | | | 600,000 | | | | 2.00 | | | 12/02/16 | | | 1,418 | | |
Put — OTC
5-Year Interest
Rate Swap(h) | | | 670,000 | | | | 2.15 | | | 09/09/16 | | | 198 | | |
Total Options Purchased Puts
(Cost: $17,596) | | | | | | | | | 1,616 | | |
Money Market Funds 54.4%
| | | Shares | | Value ($) | |
Columbia Short-Term Cash Fund,
0.434%(i)(j) | | | 84,043,686 | | | | 84,043,686 | | |
Total Money Market Funds
(Cost: $84,043,686) | | | | | 84,043,686 | | |
Total Investments
(Cost: $161,720,991) | | | | | 162,862,053 | | |
Investments Sold Short (21.2)%
Common Stocks (21.2)%
Issuer | | Shares | | Value ($) | |
CONSUMER DISCRETIONARY (4.1)% | |
Auto Components —% | |
BorgWarner, Inc. | | | (1,833 | ) | | | (62,377 | ) | |
Automobiles (0.1)% | |
Fiat Chrysler Automobiles NV | | | (14,866 | ) | | | (106,589 | ) | |
Distributors (0.3)% | |
Genuine Parts Co. | | | (4,434 | ) | | | (429,743 | ) | |
Diversified Consumer Services (0.1)% | |
H&R Block, Inc. | | | (8,910 | ) | | | (190,318 | ) | |
Hotels, Restaurants & Leisure (1.1)% | |
Cheesecake Factory, Inc. (The) | | | (6,580 | ) | | | (328,145 | ) | |
Chipotle Mexican Grill, Inc.(b) | | | (952 | ) | | | (420,746 | ) | |
Choice Hotels International, Inc. | | | (5,705 | ) | | | (258,893 | ) | |
Dunkin' Brands Group, Inc. | | | (5,390 | ) | | | (233,333 | ) | |
Marriott International, Inc., Class A | | | (858 | ) | | | (56,662 | ) | |
McDonald's Corp. | | | (320 | ) | | | (39,059 | ) | |
Texas Roadhouse, Inc. | | | (1,834 | ) | | | (82,181 | ) | |
Wyndham Worldwide Corp. | | | (879 | ) | | | (59,236 | ) | |
Wynn Resorts Ltd. | | | (1,811 | ) | | | (174,182 | ) | |
Total | | | | | (1,652,437 | ) | |
Internet & Catalog Retail (0.1)% | |
Netflix, Inc.(b) | | | (1,075 | ) | | | (110,263 | ) | |
Leisure Products —% | |
Hasbro, Inc. | | | (380 | ) | | | (33,170 | ) | |
Media (0.7)% | |
Meredith Corp. | | | (940 | ) | | | (46,530 | ) | |
Omnicom Group, Inc. | | | (1,180 | ) | | | (98,329 | ) | |
RCS MediaGroup SpA(b) | | | (448 | ) | | | (380 | ) | |
Regal Entertainment Group, Class A | | | (18,768 | ) | | | (394,691 | ) | |
Thomson Reuters Corp. | | | (10,710 | ) | | | (450,355 | ) | |
Tribune Media Co., Class A | | | (751 | ) | | | (30,228 | ) | |
Walt Disney Co. (The) | | | (637 | ) | | | (63,203 | ) | |
WPP PLC, ADR | | | (673 | ) | | | (78,021 | ) | |
Total | | | | | (1,161,737 | ) | |
Multiline Retail (0.4)% | |
Dollar Tree, Inc.(b) | | | (1,838 | ) | | | (166,413 | ) | |
Kohl's Corp. | | | (1,229 | ) | | | (44,293 | ) | |
Macy's, Inc. | | | (1,425 | ) | | | (47,324 | ) | |
Nordstrom, Inc. | | | (9,132 | ) | | | (346,833 | ) | |
Total | | | | | (604,863 | ) | |
The accompanying Notes to Consolidated Financial Statements are an integral part of this statement.
Annual Report 2016
17
COLUMBIA DIVERSIFIED ABSOLUTE RETURN FUND
CONSOLIDATED PORTFOLIO OF INVESTMENTS (continued)
May 31, 2016
Investments Sold Short (continued)
Common Stocks (continued)
Issuer | | Shares | | Value ($) | |
Specialty Retail (1.2)% | |
Abercrombie & Fitch Co., Class A | | | (14,325 | ) | | | (284,925 | ) | |
AutoZone, Inc.(b) | | | (395 | ) | | | (301,069 | ) | |
Cabela's, Inc.(b) | | | (2,520 | ) | | | (122,371 | ) | |
CarMax, Inc.(b) | | | (2,612 | ) | | | (140,160 | ) | |
Dick's Sporting Goods, Inc. | | | (7,080 | ) | | | (303,732 | ) | |
Dsw Inc-class A | | | (1,666 | ) | | | (35,253 | ) | |
Gap, Inc. (The) | | | (3,187 | ) | | | (57,334 | ) | |
Tiffany & Co. | | | (777 | ) | | | (48,143 | ) | |
Ulta Salon Cosmetics & Fragrance, Inc.(b) | | | (2,125 | ) | | | (495,146 | ) | |
Urban Outfitters, Inc.(b) | | | (1,374 | ) | | | (39,200 | ) | |
Total | | | | | (1,827,333 | ) | |
Textiles, Apparel & Luxury Goods (0.1)% | |
Carter's, Inc. | | | (820 | ) | | | (82,443 | ) | |
Michael Kors Holdings Ltd.(b) | | | (399 | ) | | | (17,045 | ) | |
Total | | | | | (99,488 | ) | |
Total Consumer Discretionary | | | | | (6,278,318 | ) | |
CONSUMER STAPLES (1.0)% | |
Beverages (0.2)% | |
Brown-Forman Corp., Class B | | | (1,111 | ) | | | (108,956 | ) | |
Coca-Cola Co. (The) | | | (1,527 | ) | | | (68,104 | ) | |
Monster Beverage Corp.(b) | | | (850 | ) | | | (127,500 | ) | |
Total | | | | | (304,560 | ) | |
Food & Staples Retailing —% | |
Wal-Mart Stores, Inc. | | | (940 | ) | | | (66,533 | ) | |
Food Products (0.4)% | |
ConAgra Foods, Inc. | | | (1,513 | ) | | | (69,144 | ) | |
Hershey Co. (The) | | | (715 | ) | | | (66,388 | ) | |
J & J Snack Foods Corp. | | | (595 | ) | | | (62,772 | ) | |
Jm Smucker Co/the | | | (480 | ) | | | (61,992 | ) | |
Kraft Heinz Co. (The) | | | (1,153 | ) | | | (95,918 | ) | |
McCormick & Co., Inc. | | | (1,022 | ) | | | (99,206 | ) | |
Nomad Foods Ltd.(b) | | | (7,971 | ) | | | (77,478 | ) | |
Total | | | | | (532,898 | ) | |
Household Products (0.2)% | |
Church & Dwight Co., Inc. | | | (1,022 | ) | | | (100,647 | ) | |
Kimberly-Clark Corp. | | | (798 | ) | | | (101,378 | ) | |
Procter & Gamble Co. (The) | | | (1,104 | ) | | | (89,468 | ) | |
Total | | | | | (291,493 | ) | |
Investments Sold Short (continued)
Common Stocks (continued)
Issuer | | Shares | | Value ($) | |
Personal Products (0.1)% | |
Avon Products, Inc. | | | (26,923 | ) | | | (105,000 | ) | |
Estee Lauder Companies, Inc. (The),
Class A | | | (999 | ) | | | (91,688 | ) | |
Total | | | | | (196,688 | ) | |
Tobacco (0.1)% | |
Reynolds American, Inc. | | | (1,357 | ) | | | (67,443 | ) | |
Total Consumer Staples | | | | | (1,459,615 | ) | |
ENERGY (0.7)% | |
Energy Equipment & Services (0.1)% | |
Core Laboratories NV | | | (217 | ) | | | (26,311 | ) | |
Ensco PLC, Class A | | | (2,316 | ) | | | (22,905 | ) | |
National Oilwell Varco, Inc. | | | (1,420 | ) | | | (46,789 | ) | |
Noble Corp. PLC | | | (2,395 | ) | | | (19,974 | ) | |
Rowan Companies PLC, Class A | | | (1,531 | ) | | | (25,920 | ) | |
SEACOR Holdings, Inc.(b) | | | (437 | ) | | | (25,071 | ) | |
Total | | | | | (166,970 | ) | |
Oil, Gas & Consumable Fuels (0.6)% | |
Apache Corp. | | | (617 | ) | | | (35,255 | ) | |
Cenovus Energy, Inc. | | | (5,936 | ) | | | (89,515 | ) | |
Cheniere Energy, Inc.(b) | | | (3,428 | ) | | | (110,142 | ) | |
Chevron Corp. | | | (836 | ) | | | (84,436 | ) | |
Cobalt International Energy, Inc.(b) | | | (17,260 | ) | | | (38,662 | ) | |
ConocoPhillips | | | (740 | ) | | | (32,405 | ) | |
Hollyfrontier Corp. | | | (922 | ) | | | (24,673 | ) | |
Marathon Oil Corp. | | | (2,495 | ) | | | (32,610 | ) | |
Oneok, Inc. | | | (1,290 | ) | | | (55,793 | ) | |
Royal Dutch Shell Plc-adr | | | (2,364 | ) | | | (114,630 | ) | |
Southwestern Energy Co.(b) | | | (3,064 | ) | | | (41,885 | ) | |
Total SA, ADR | | | (2,535 | ) | | | (122,998 | ) | |
Williams Companies, Inc. (The) | | | (2,290 | ) | | | (50,746 | ) | |
Total | | | | | (833,750 | ) | |
Total Energy | | | | | (1,000,720 | ) | |
FINANCIALS (1.8)% | |
Banks (0.2)% | |
First Horizon National Corp. | | | (6,650 | ) | | | (96,824 | ) | |
M&T Bank Corp. | | | (266 | ) | | | (31,787 | ) | |
People's United Financial | | | (5,138 | ) | | | (81,592 | ) | |
The accompanying Notes to Consolidated Financial Statements are an integral part of this statement.
Annual Report 2016
18
COLUMBIA DIVERSIFIED ABSOLUTE RETURN FUND
CONSOLIDATED PORTFOLIO OF INVESTMENTS (continued)
May 31, 2016
Investments Sold Short (continued)
Common Stocks (continued)
Issuer | | Shares | | Value ($) | |
Regions Financial Corp. | | | (3,973 | ) | | | (39,055 | ) | |
Synovus Financial Corp. | | | (2,873 | ) | | | (92,424 | ) | |
Total | | | | | (341,682 | ) | |
Capital Markets (1.0)% | |
Affiliated Managers Group, Inc.(b) | | | (701 | ) | | | (121,638 | ) | |
Eaton Vance Corp. | | | (1,106 | ) | | | (40,214 | ) | |
Federated Investors, Inc., Class B | | | (1,262 | ) | | | (40,788 | ) | |
Franklin Resources, Inc. | | | (10,369 | ) | | | (387,282 | ) | |
Janus Capital Group, Inc. | | | (5,474 | ) | | | (83,095 | ) | |
Raymond James Financial, Inc. | | | (6,775 | ) | | | (379,874 | ) | |
T Rowe Price Group, Inc. | | | (4,465 | ) | | | (344,073 | ) | |
TD Ameritrade Holding Corp. | | | (2,391 | ) | | | (78,114 | ) | |
Total | | | | | (1,475,078 | ) | |
Insurance (0.3)% | |
Aon PLC | | | (778 | ) | | | (85,012 | ) | |
Fidelity & Guaranty Life | | | (3,337 | ) | | | (79,254 | ) | |
Mercury General Corp. | | | (2,509 | ) | | | (131,898 | ) | |
Travelers Companies, Inc. (The) | | | (688 | ) | | | (78,528 | ) | |
Unum Group | | | (2,469 | ) | | | (91,156 | ) | |
Total | | | | | (465,848 | ) | |
Real Estate Investment Trusts (REITs) (0.3)% | |
Prologis, Inc. | | | (9,880 | ) | | | (469,596 | ) | |
Total Financials | | | | | (2,752,204 | ) | |
HEALTH CARE (3.8)% | |
Biotechnology (1.2)% | |
Amgen, Inc. | | | (3,542 | ) | | | (559,459 | ) | |
Baxalta, Inc. | | | (32 | ) | | | (1,447 | ) | |
Immunomedics, Inc.(b) | | | (22,484 | ) | | | (108,823 | ) | |
Intrexon Corp.(b) | | | (646 | ) | | | (19,858 | ) | |
Ophthotech Corp.(b) | | | (6,325 | ) | | | (339,652 | ) | |
OPKO Health, Inc.(b) | | | (7,994 | ) | | | (84,976 | ) | |
Sarepta Therapeutics, Inc.(b) | | | (8,310 | ) | | | (173,928 | ) | |
Seattle Genetics, Inc.(b) | | | (8,650 | ) | | | (349,720 | ) | |
uniQure NV(b) | | | (15,245 | ) | | | (206,494 | ) | |
Total | | | | | (1,844,357 | ) | |
Health Care Equipment & Supplies (0.6)% | |
Baxter International, Inc. | | | (1,536 | ) | | | (66,294 | ) | |
Becton Dickinson and Co. | | | (2,760 | ) | | | (459,402 | ) | |
Investments Sold Short (continued)
Common Stocks (continued)
Issuer | | Shares | | Value ($) | |
CR Bard, Inc. | | | (76 | ) | | | (16,647 | ) | |
Hill-Rom Holdings, Inc. | | | (1,039 | ) | | | (51,046 | ) | |
Intuitive Surgical, Inc.(b) | | | (43 | ) | | | (27,292 | ) | |
Stryker Corp. | | | (162 | ) | | | (18,008 | ) | |
Teleflex, Inc. | | | (96 | ) | | | (15,466 | ) | |
Varian Medical Systems, Inc.(b) | | | (4,652 | ) | | | (385,139 | ) | |
Total | | | | | (1,039,294 | ) | |
Health Care Providers & Services (0.4)% | |
Anthem, Inc. | | | (3,114 | ) | | | (411,546 | ) | |
DaVita HealthCare Partners, Inc.(b) | | | (241 | ) | | | (18,634 | ) | |
Henry Schein, Inc.(b) | | | (102 | ) | | | (17,720 | ) | |
Patterson Cos, Inc. | | | (2,491 | ) | | | (121,586 | ) | |
Quest Diagnostics, Inc. | | | (498 | ) | | | (38,431 | ) | |
Total | | | | | (607,917 | ) | |
Health Care Technology (0.1)% | |
athenahealth, Inc.(b) | | | (204 | ) | | | (25,881 | ) | |
Veeva Systems Inc., Class A(b) | | | (4,591 | ) | | | (151,273 | ) | |
Total | | | | | (177,154 | ) | |
Life Sciences Tools & Services (0.2)% | |
Bruker Corp. | | | (2,060 | ) | | | (54,384 | ) | |
Illumina, Inc.(b) | | | (908 | ) | | | (131,506 | ) | |
Mettler-Toledo International, Inc.(b) | | | (94 | ) | | | (35,280 | ) | |
Waters Corp.(b) | | | (356 | ) | | | (48,968 | ) | |
Total | | | | | (270,138 | ) | |
Pharmaceuticals (1.3)% | |
Astrazeneca PLC, ADR | | | (2,248 | ) | | | (66,765 | ) | |
Eli Lilly & Co. | | | (5,329 | ) | | | (399,835 | ) | |
Glaxosmithkline PLC, ADR | | | (7,175 | ) | | | (304,005 | ) | |
Johnson & Johnson | | | (1,088 | ) | | | (122,607 | ) | |
Mylan NV(b) | | | (2,067 | ) | | | (89,584 | ) | |
Novo Nordisk A/S, ADR | | | (8,754 | ) | | | (490,574 | ) | |
Roche Holding AG, ADR | | | (3,184 | ) | | | (104,690 | ) | |
Zoetis, Inc. | | | (8,715 | ) | | | (413,265 | ) | |
Total | | | | | (1,991,325 | ) | |
Total Health Care | | | | | (5,930,185 | ) | |
INDUSTRIALS (3.3)% | |
Aerospace & Defense (0.3)% | |
TransDigm Group, Inc.(b) | | | (1,315 | ) | | | (346,555 | ) | |
The accompanying Notes to Consolidated Financial Statements are an integral part of this statement.
Annual Report 2016
19
COLUMBIA DIVERSIFIED ABSOLUTE RETURN FUND
CONSOLIDATED PORTFOLIO OF INVESTMENTS (continued)
May 31, 2016
Investments Sold Short (continued)
Common Stocks (continued)
Issuer | | Shares | | Value ($) | |
Triumph Group, Inc. | | | (3,734 | ) | | | (140,884 | ) | |
Total | | | | | (487,439 | ) | |
Air Freight & Logistics (0.2)% | |
Expeditors International of Washington, Inc. | | | (7,165 | ) | | | (347,861 | ) | |
Airlines —% | |
Copa Holdings SA, Class A | | | (981 | ) | | | (50,590 | ) | |
Commercial Services & Supplies (0.1)% | |
Pitney Bowes, Inc. | | | (2,856 | ) | | | (53,207 | ) | |
Construction & Engineering (0.3)% | |
Fluor Corp. | | | (8,227 | ) | | | (434,221 | ) | |
Electrical Equipment (0.1)% | |
Emerson Electric Co. | | | (2,051 | ) | | | (106,693 | ) | |
Industrial Conglomerates (0.5)% | |
3M Co. | | | (2,394 | ) | | | (402,958 | ) | |
Roper Industries, Inc. | | | (2,365 | ) | | | (404,604 | ) | |
Total | | | | | (807,562 | ) | |
Machinery (0.7)% | |
Caterpillar, Inc. | | | (1,127 | ) | | | (81,719 | ) | |
Deere & Co. | | | (4,670 | ) | | | (384,294 | ) | |
PACCAR, Inc. | | | (6,505 | ) | | | (362,654 | ) | |
Parker Hannifin Corp. | | | (1,087 | ) | | | (124,831 | ) | |
SPX Corp. | | | (10,520 | ) | | | (174,316 | ) | |
Total | | | | | (1,127,814 | ) | |
Professional Services (0.3)% | |
IHS, Inc., Class A(b) | | | (687 | ) | | | (84,453 | ) | |
Robert Half International, Inc. | | | (8,960 | ) | | | (372,647 | ) | |
Total | | | | | (457,100 | ) | |
Road & Rail (0.1)% | |
Genesee & Wyoming Inc-cl A(b) | | | (560 | ) | | | (33,639 | ) | |
Hertz Global Holdings, Inc.(b) | | | (12,991 | ) | | | (125,883 | ) | |
Total | | | | | (159,522 | ) | |
Trading Companies & Distributors (0.7)% | |
Air Lease Corp. | | | (4,358 | ) | | | (130,958 | ) | |
Fastenal Co. | | | (8,425 | ) | | | (387,803 | ) | |
MSC Industrial Direct Co., Inc., Class A | | | (6,927 | ) | | | (519,178 | ) | |
Total | | | | | (1,037,939 | ) | |
Total Industrials | | | | | (5,069,948 | ) | |
Investments Sold Short (continued)
Common Stocks (continued)
Issuer | | Shares | | Value ($) | |
INFORMATION TECHNOLOGY (5.3)% | |
Communications Equipment (0.3)% | |
Arista Networks, Inc.(b) | | | (5,640 | ) | | | (413,355 | ) | |
Brocade Communications Systems, Inc. | | | (9,427 | ) | | | (85,409 | ) | |
Total | | | | | (498,764 | ) | |
Electronic Equipment, Instruments & Components (0.9)% | |
Dolby Laboratories, Inc., Class A | | | (16,148 | ) | | | (766,222 | ) | |
IPG Photonics Corp.(b) | | | (6,215 | ) | | | (536,852 | ) | |
Vishay Intertechnology, Inc. | | | (8,133 | ) | | | (105,404 | ) | |
Total | | | | | (1,408,478 | ) | |
Internet Software & Services (0.2)% | |
Shutterstock, Inc.(b) | | | (4,482 | ) | | | (188,065 | ) | |
Twitter, Inc.(b) | | | (1,601 | ) | | | (24,367 | ) | |
Total | | | | | (212,432 | ) | |
IT Services (1.2)% | |
First Data Corp., Class A(b) | | | (10,169 | ) | | | (127,418 | ) | |
Global Payments, Inc. | | | (5,745 | ) | | | (446,329 | ) | |
International Business Machines Corp. | | | (1,318 | ) | | | (202,629 | ) | |
Teradata Corp.(b) | | | (6,692 | ) | | | (189,651 | ) | |
Western Union Co. | | | (21,775 | ) | | | (423,524 | ) | |
Xerox Corp. | | | (47,772 | ) | | | (476,287 | ) | |
Total | | | | | (1,865,838 | ) | |
Semiconductors & Semiconductor Equipment (0.9)% | |
Amkor Technology, Inc.(b) | | | (64,536 | ) | | | (407,222 | ) | |
First Solar, Inc.(b) | | | (1,566 | ) | | | (77,752 | ) | |
Intel Corp. | | | (4,739 | ) | | | (149,705 | ) | |
Micron Technology, Inc.(b) | | | (11,849 | ) | | | (150,719 | ) | |
Teradyne, Inc. | | | (15,325 | ) | | | (303,588 | ) | |
Xilinx, Inc. | | | (5,910 | ) | | | (280,075 | ) | |
Total | | | | | (1,369,061 | ) | |
Software (1.0)% | |
FireEye, Inc.(b) | | | (8,270 | ) | | | (131,659 | ) | |
Netsuite, Inc.(b) | | | (8,885 | ) | | | (704,669 | ) | |
Oracle Corp. | | | (5,192 | ) | | | (208,719 | ) | |
ServiceNow, Inc.(b) | | | (3,700 | ) | | | (265,031 | ) | |
VMware, Inc., Class A(b) | | | (2,800 | ) | | | (169,568 | ) | |
Zynga, Inc., Class A(b) | | | (45,548 | ) | | | (117,058 | ) | |
Total | | | | | (1,596,704 | ) | |
The accompanying Notes to Consolidated Financial Statements are an integral part of this statement.
Annual Report 2016
20
COLUMBIA DIVERSIFIED ABSOLUTE RETURN FUND
CONSOLIDATED PORTFOLIO OF INVESTMENTS (continued)
May 31, 2016
Investments Sold Short (continued)
Common Stocks (continued)
Issuer | | Shares | | Value ($) | |
Technology Hardware, Storage & Peripherals (0.8)% | |
Hewlett Packard Enterprise Co. | | | (12,933 | ) | | | (238,873 | ) | |
Lexmark International, Inc., Class A | | | (12,775 | ) | | | (483,661 | ) | |
NetApp, Inc. | | | (20,117 | ) | | | (513,587 | ) | |
Total | | | | | (1,236,121 | ) | |
Total Information Technology | | | | | (8,187,398 | ) | |
MATERIALS (0.6)% | |
Chemicals (0.4)% | |
Agrium, Inc. | | | (516 | ) | | | (46,543 | ) | |
Air Products & Chemicals, Inc. | | | (490 | ) | | | (69,894 | ) | |
Ashland, Inc. | | | (1,076 | ) | | | (121,975 | ) | |
Ecolab, Inc. | | | (641 | ) | | | (75,151 | ) | |
Fmc Corp. | | | (2,985 | ) | | | (141,758 | ) | |
Ingevity Corp.(b) | | | (164 | ) | | | (4,779 | ) | |
International Flavors & Fragrances, Inc. | | | (355 | ) | | | (45,795 | ) | |
Platform Specialty Products Corp.(b) | | | (11,542 | ) | | | (109,533 | ) | |
WR Grace & Co. | | | (1,194 | ) | | | (92,702 | ) | |
Total | | | | | (708,130 | ) | |
Containers & Packaging (0.1)% | |
Packaging Corp. of America | | | (519 | ) | | | (35,412 | ) | |
Silgan Holdings, Inc. | | | (457 | ) | | | (23,371 | ) | |
Sonoco Products Co. | | | (1,388 | ) | | | (66,166 | ) | |
Westrock Co. | | | (987 | ) | | | (39,095 | ) | |
Total | | | | | (164,044 | ) | |
Metals & Mining (0.1)% | |
Allegheny Technologies, Inc. | | | (7,214 | ) | | | (89,309 | ) | |
Total Materials | | | | | (961,483 | ) | |
Investments Sold Short (continued)
Common Stocks (continued)
Issuer | | Shares | | Value ($) | |
TELECOMMUNICATION SERVICES (0.1)% | |
Diversified Telecommunication Services (0.1)% | |
BCE, Inc. | | | (818 | ) | | | (37,661 | ) | |
Telus Corp. | | | (2,196 | ) | | | (69,569 | ) | |
Verizon Communications, Inc. | | | (1,250 | ) | | | (63,625 | ) | |
Total | | | | | (170,855 | ) | |
Total Telecommunication Services | | | | | (170,855 | ) | |
UTILITIES (0.5)% | |
Electric Utilities (0.1)% | |
Southern Co. (The) | | | (2,232 | ) | | | (110,350 | ) | |
Independent Power and Renewable Electricity Producers (0.1)% | |
NRG Energy, Inc. | | | (10,428 | ) | | | (170,811 | ) | |
Multi-Utilities (0.2)% | |
Consolidated Edison, Inc. | | | (1,635 | ) | | | (119,780 | ) | |
Dominion Resources, Inc. | | | (1,329 | ) | | | (96,020 | ) | |
Mdu Resources Group, Inc. | | | (5,779 | ) | | | (132,166 | ) | |
Sempra Energy | | | (1,157 | ) | | | (123,938 | ) | |
Total | | | | | (471,904 | ) | |
Water Utilities (0.1)% | |
Aqua America, Inc. | | | (2,429 | ) | | | (78,481 | ) | |
Total Utilities | | | | | (831,546 | ) | |
Total Common Stocks
(Proceeds: $31,604,635) | | | | | (32,642,272 | ) | |
Total Investments Sold Short
(Proceeds: $31,604,635) | | | | | (32,642,272 | ) | |
Total Investments, Net of Investments Sold Short | | | | | 130,219,781 | | |
Other Assets & Liabilities, Net | | | | | 24,161,124 | | |
Net Assets | | | | | 154,380,905 | | |
At May 31, 2016, securities and cash totaling $58,986,575 were pledged as collateral.
Investments in Derivatives
Forward Foreign Currency Exchange Contracts Open at May 31, 2016
Counterparty | | Exchange Date | | Currency to
be Delivered | |
| | Currency to
be Received | |
| | Unrealized
Appreciation ($) | | Unrealized
Depreciation ($) | |
BNP Paribas | | 06/03/2016 | | | 3,035,000 | | | SEK | | | | | 364,718 | | | USD | | | | | 852 | | | | — | | |
BNP Paribas | | 06/03/2016 | | | 375,387 | | | USD | | | | | 3,035,000 | | | SEK | | | | | — | | | | (11,520 | ) | |
BNP Paribas | | 06/23/2016 | | | 1,891,659 | | | AUD | | | | | 1,457,240 | | | USD | | | | | 91,195 | | | | — | | |
BNP Paribas | | 06/23/2016 | | | 800,000 | | | AUD | | | | | 584,434 | | | USD | | | | | 6,721 | | | | — | | |
The accompanying Notes to Consolidated Financial Statements are an integral part of this statement.
Annual Report 2016
21
COLUMBIA DIVERSIFIED ABSOLUTE RETURN FUND
CONSOLIDATED PORTFOLIO OF INVESTMENTS (continued)
May 31, 2016
Forward Foreign Currency Exchange Contracts Open at May 31, 2016 (continued)
Counterparty | | Exchange Date | | Currency to
be Delivered | |
| | Currency to
be Received | |
| | Unrealized
Appreciation ($) | | Unrealized
Depreciation ($) | |
BNP Paribas | | 06/23/2016 | | | 100,000 | | | AUD | | | | | 77,035 | | | USD | | | | | 4,821 | | | | — | | |
BNP Paribas | | 06/23/2016 | | | 3,900,000 | | | CAD | | | | | 3,077,336 | | | USD | | | | | 103,349 | | | | — | | |
BNP Paribas | | 06/23/2016 | | | 400,000 | | | CAD | | | | | 309,029 | | | USD | | | | | 4,005 | | | | — | | |
BNP Paribas | | 06/23/2016 | | | 800,000 | | | CHF | | | | | 822,791 | | | USD | | | | | 17,111 | | | | — | | |
BNP Paribas | | 06/23/2016 | | | 3,179,082 | | | EUR | | | | | 3,565,182 | | | USD | | | | | 25,104 | | | | — | | |
BNP Paribas | | 06/23/2016 | | | 100,000 | | | GBP | | | | | 143,432 | | | USD | | | | | — | | | | (1,428 | ) | |
BNP Paribas | | 06/23/2016 | | | 17,292,183 | | | NOK | | | | | 2,106,234 | | | USD | | | | | 39,297 | | | | — | | |
BNP Paribas | | 06/23/2016 | | | 7,400,000 | | | NOK | | | | | 904,727 | | | USD | | | | | 20,204 | | | | — | | |
BNP Paribas | | 06/23/2016 | | | 2,900,000 | | | NOK | | | | | 353,228 | | | USD | | | | | 6,590 | | | | — | | |
BNP Paribas | | 06/23/2016 | | | 2,760,385 | | | NZD | | | | | 1,889,622 | | | USD | | | | | 24,090 | | | | — | | |
BNP Paribas | | 06/23/2016 | | | 600,000 | | | SEK | | | | | 72,213 | | | USD | | | | | 214 | | | | — | | |
BNP Paribas | | 06/23/2016 | | | 13,578,233 | | | SGD | | | | | 10,030,978 | | | USD | | | | | 174,615 | | | | — | | |
BNP Paribas | | 06/23/2016 | | | 100,000 | | | SGD | | | | | 73,875 | | | USD | | | | | 1,286 | | | | — | | |
BNP Paribas | | 06/23/2016 | | | 100,000 | | | SGD | | | | | 72,574 | | | USD | | | | | — | | | | (15 | ) | |
BNP Paribas | | 06/23/2016 | | | 938,041 | | | USD | | | | | 1,300,000 | | | AUD | | | | | 742 | | | | — | | |
BNP Paribas | | 06/23/2016 | | | 236,718 | | | USD | | | | | 300,000 | | | CAD | | | | | — | | | | (7,950 | ) | |
BNP Paribas | | 06/23/2016 | | | 1,156,334 | | | USD | | | | | 1,500,000 | | | CAD | | | | | — | | | | (12,493 | ) | |
BNP Paribas | | 06/23/2016 | | | 225,526 | | | USD | | | | | 200,000 | | | EUR | | | | | — | | | | (2,815 | ) | |
BNP Paribas | | 06/23/2016 | | | 2,013,764 | | | USD | | | | | 1,780,947 | | | EUR | | | | | — | | | | (30,585 | ) | |
BNP Paribas | | 06/23/2016 | | | 5,510,466 | | | USD | | | | | 3,803,285 | | | GBP | | | | | — | | | | (1,046 | ) | |
BNP Paribas | | 06/23/2016 | | | 1,016,491 | | | USD | | | | | 700,000 | | | GBP | | | | | — | | | | (2,475 | ) | |
BNP Paribas | | 06/23/2016 | | | 9,146,398 | | | USD | | | | | 1,014,609,916 | | | JPY | | | | | 23,668 | | | | — | | |
BNP Paribas | | 06/23/2016 | | | 1,682,026 | | | USD | | | | | 186,587,121 | | | JPY | | | | | 4,353 | | | | — | | |
BNP Paribas | | 06/23/2016 | | | 917 | | | USD | | | | | 100,000 | | | JPY | | | | | — | | | | (13 | ) | |
BNP Paribas | | 06/23/2016 | | | 1,238,135 | | | USD | | | | | 10,300,000 | | | NOK | | | | | — | | | | (6,974 | ) | |
BNP Paribas | | 06/23/2016 | | | 471,618 | | | USD | | | | | 700,000 | | | NZD | | | | | 1,458 | | | | — | | |
BNP Paribas | | 06/23/2016 | | | 443,628 | | | USD | | | | | 3,600,000 | | | SEK | | | | | — | | | | (11,636 | ) | |
BNP Paribas | | 06/23/2016 | | | 1,885,421 | | | USD | | | | | 15,300,000 | | | SEK | | | | | — | | | | (49,451 | ) | |
BNP Paribas | | 06/23/2016 | | | 219,314 | | | USD | | | | | 300,000 | | | SGD | | | | | — | | | | (1,546 | ) | |
BNP Paribas | | 07/12/2016 | | | 365,311 | | | USD | | | | | 3,035,000 | | | SEK | | | | | — | | | | (837 | ) | |
Barclays | | 06/03/2016 | | | 2,483,000 | | | CNH | | | | | 382,618 | | | USD | | | | | 5,678 | | | | — | | |
Barclays | | 06/03/2016 | | | 76,787,000 | | | JPY | | | | | 703,326 | | | USD | | | | | 9,868 | | | | — | | |
Barclays | | 06/03/2016 | | | 2,363,000 | | | JPY | | | | | 21,572 | | | USD | | | | | 232 | | | | — | | |
Barclays | | 06/03/2016 | | | 3,036,000 | | | JPY | | | | | 27,303 | | | USD | | | | | — | | | | (115 | ) | |
Barclays | | 06/03/2016 | | | 376,966 | | | USD | | | | | 2,483,000 | | | CNH | | | | | — | | | | (26 | ) | |
Barclays | | 06/03/2016 | | | 739,299 | | | USD | | | | | 82,186,000 | | | JPY | | | | | 2,917 | | | | — | | |
Barclays | | 06/14/2016 | | | 123,276,000 | | | HUF | | | | | 452,632 | | | USD | | | | | 15,292 | | | | — | | |
Barclays | | 06/14/2016 | | | 5,889,000 | | | MXN | | | | | 331,820 | | | USD | | | | | 13,206 | | | | — | | |
Barclays | | 06/23/2016 | | | 1,100,000 | | | CHF | | | | | 1,130,494 | | | USD | | | | | 22,683 | | | | — | | |
Barclays | | 06/29/2016 | | | 20,525,000 | | | SEK | | | | | 2,470,629 | | | USD | | | | | 7,006 | | | | — | | |
Barclays | | 06/29/2016 | | | 3,704,387 | | | USD | | | | | 5,484,000 | | | NZD | | | | | 608 | | | | — | | |
Barclays | | 06/29/2016 | | | 2,474,087 | | | USD | | | | | 3,660,000 | | | NZD | | | | | — | | | | (1,387 | ) | |
The accompanying Notes to Consolidated Financial Statements are an integral part of this statement.
Annual Report 2016
22
COLUMBIA DIVERSIFIED ABSOLUTE RETURN FUND
CONSOLIDATED PORTFOLIO OF INVESTMENTS (continued)
May 31, 2016
Forward Foreign Currency Exchange Contracts Open at May 31, 2016 (continued)
Counterparty | | Exchange Date | | Currency to
be Delivered | |
| | Currency to
be Received | |
| | Unrealized
Appreciation ($) | | Unrealized
Depreciation ($) | |
Barclays | | 07/12/2016 | | | 2,483,000 | | | CNH | | | | | 376,409 | | | USD | | | | | 56 | | | | — | | |
Barclays | | 07/12/2016 | | | 82,186,000 | | | JPY | | | | | 740,288 | | | USD | | | | | — | | | | (2,978 | ) | |
Citi | | 06/03/2016 | | | 364,000 | | | CHF | | | | | 367,468 | | | USD | | | | | 1,253 | | | | — | | |
Citi | | 06/03/2016 | | | 1,448,000 | | | EUR | | | | | 1,658,995 | | | USD | | | | | 47,815 | | | | — | | |
Citi | | 06/03/2016 | | | 374,867 | | | USD | | | | | 364,000 | | | CHF | | | | | — | | | | (8,652 | ) | |
Citi | | 06/03/2016 | | | 1,642,971 | | | USD | | | | | 1,448,000 | | | EUR | | | | | — | | | | (31,792 | ) | |
Citi | | 06/14/2016 | | | 317,000 | | | AUD | | | | | 236,084 | | | USD | | | | | 7,082 | | | | — | | |
Citi | | 06/29/2016 | | | 3,684,597 | | | USD | | | | | 5,111,000 | | | AUD | | | | | 5,376 | | | | — | | |
Citi | | 07/12/2016 | | | 677,000 | | | CAD | | | | | 517,837 | | | USD | | | | | 1,580 | | | | — | | |
Citi | | 07/12/2016 | | | 4,780,000 | | | CNH | | | | | 724,751 | | | USD | | | | | 237 | | | | — | | |
Citi | | 07/12/2016 | | | 300,000 | | | EUR | | | | | 335,250 | | | USD | | | | | 965 | | | | — | | |
Citi | | 07/12/2016 | | | 368,171 | | | USD | | | | | 364,000 | | | CHF | | | | | — | | | | (1,258 | ) | |
Credit Suisse | | 06/14/2016 | | | 51,000 | | | EUR | | | | | 58,709 | | | USD | | | | | 1,937 | | | | — | | |
Credit Suisse | | 06/15/2016 | | | 40,011,920 | | | RUB | | | | | 605,798 | | | USD | | | | | 8,015 | | | | — | | |
Credit Suisse | | 06/23/2016 | | | 200,000 | | | CHF | | | | | 205,664 | | | USD | | | | | 4,244 | | | | — | | |
Credit Suisse | | 06/23/2016 | | | 1,400,000 | | | GBP | | | | | 2,029,206 | | | USD | | | | | 1,173 | | | | — | | |
Credit Suisse | | 06/23/2016 | | | 200,000 | | | GBP | | | | | 289,887 | | | USD | | | | | 168 | | | | — | | |
Credit Suisse | | 06/23/2016 | | | 1,600,000 | | | NZD | | | | | 1,094,888 | | | USD | | | | | 13,571 | | | | — | | |
Credit Suisse | | 06/23/2016 | | | 2,700,000 | | | SEK | | | | | 332,622 | | | USD | | | | | 8,627 | | | | — | | |
Credit Suisse | | 06/23/2016 | | | 2,600,000 | | | SEK | | | | | 320,303 | | | USD | | | | | 8,308 | | | | — | | |
Credit Suisse | | 06/23/2016 | | | 1,629,014 | | | USD | | | | | 180,700,000 | | | JPY | | | | | 4,156 | | | | — | | |
Deutsche Bank | | 06/15/2016 | | | 37,200,000 | | | RUB | | | | | 563,380 | | | USD | | | | | 7,607 | | | | — | | |
Deutsche Bank | | 06/23/2016 | | | 900,000 | | | AUD | | | | | 666,072 | | | USD | | | | | 16,145 | | | | — | | |
Deutsche Bank | | 06/23/2016 | | | 500,000 | | | CAD | | | | | 394,564 | | | USD | | | | | 13,284 | | | | — | | |
Deutsche Bank | | 06/23/2016 | | | 2,600,000 | | | CAD | | | | | 1,980,863 | | | USD | | | | | — | | | | (1,795 | ) | |
Deutsche Bank | | 06/23/2016 | | | 900,000 | | | CHF | | | | | 922,498 | | | USD | | | | | 16,107 | | | | — | | |
Deutsche Bank | | 06/23/2016 | | | 100,000 | | | CHF | | | | | 102,878 | | | USD | | | | | 2,168 | | | | — | | |
Deutsche Bank | | 06/23/2016 | | | 4,221,704 | | | EUR | | | | | 4,760,634 | | | USD | | | | | 59,541 | | | | — | | |
Deutsche Bank | | 06/23/2016 | | | 7,875,327 | | | GBP | | | | | 11,414,625 | | | USD | | | | | 6,466 | | | | — | | |
Deutsche Bank | | 06/23/2016 | | | 12,100,000 | | | JPY | | | | | 111,009 | | | USD | | | | | 1,649 | | | | — | | |
Deutsche Bank | | 06/23/2016 | | | 5,100,000 | | | JPY | | | | | 45,919 | | | USD | | | | | — | | | | (175 | ) | |
Deutsche Bank | | 06/23/2016 | | | 24,232,384 | | | JPY | | | | | 218,450 | | | USD | | | | | — | | | | (563 | ) | |
Deutsche Bank | | 06/23/2016 | | | 112,000,000 | | | JPY | | | | | 1,010,476 | | | USD | | | | | — | | | | (1,782 | ) | |
Deutsche Bank | | 06/23/2016 | | | 3,211,151 | | | NZD | | | | | 2,198,044 | | | USD | | | | | 27,875 | | | | — | | |
Deutsche Bank | | 06/23/2016 | | | 700,000 | | | NZD | | | | | 479,082 | | | USD | | | | | 6,006 | | | | — | | |
Deutsche Bank | | 06/23/2016 | | | 14,305,246 | | | SEK | | | | | 1,754,171 | | | USD | | | | | 37,570 | | | | — | | |
Deutsche Bank | | 06/23/2016 | | | 900,000 | | | SEK | | | | | 107,963 | | | USD | | | | | — | | | | (35 | ) | |
Deutsche Bank | | 06/23/2016 | | | 1,000,000 | | | SGD | | | | | 736,986 | | | USD | | | | | 11,091 | | | | — | | |
Deutsche Bank | | 06/23/2016 | | | 231,004 | | | USD | | | | | 300,000 | | | AUD | | | | | — | | | | (14,362 | ) | |
Deutsche Bank | | 06/23/2016 | | | 1,386,023 | | | USD | | | | | 1,800,000 | | | AUD | | | | | — | | | | (86,170 | ) | |
Deutsche Bank | | 06/23/2016 | | | 229,443 | | | USD | | | | | 300,000 | | | CAD | | | | | — | | | | (675 | ) | |
Deutsche Bank | | 06/23/2016 | | | 8,060,445 | | | USD | | | | | 10,236,377 | | | CAD | | | | | — | | | | (254,584 | ) | |
The accompanying Notes to Consolidated Financial Statements are an integral part of this statement.
Annual Report 2016
23
COLUMBIA DIVERSIFIED ABSOLUTE RETURN FUND
CONSOLIDATED PORTFOLIO OF INVESTMENTS (continued)
May 31, 2016
Forward Foreign Currency Exchange Contracts Open at May 31, 2016 (continued)
Counterparty | | Exchange Date | | Currency to
be Delivered | |
| | Currency to
be Received | |
| | Unrealized
Appreciation ($) | | Unrealized
Depreciation ($) | |
Deutsche Bank | | 06/23/2016 | | | 10,427,059 | | | USD | | | | | 10,168,402 | | | CHF | | | | | — | | | | (186,456 | ) | |
Deutsche Bank | | 06/23/2016 | | | 225,531 | | | USD | | | | | 200,000 | | | EUR | | | | | — | | | | (2,821 | ) | |
Deutsche Bank | | 06/23/2016 | | | 447,688 | | | USD | | | | | 395,336 | | | EUR | | | | | — | | | | (7,461 | ) | |
Deutsche Bank | | 06/23/2016 | | | 144,942 | | | USD | | | | | 100,000 | | | GBP | | | | | — | | | | (82 | ) | |
Deutsche Bank | | 06/23/2016 | | | 1,751,353 | | | USD | | | | | 1,200,000 | | | GBP | | | | | — | | | | (13,039 | ) | |
Deutsche Bank | | 06/23/2016 | | | 5,180,199 | | | USD | | | | | 574,167,169 | | | JPY | | | | | 9,136 | | | | — | | |
Deutsche Bank | | 06/23/2016 | | | 389,587 | | | USD | | | | | 3,200,000 | | | NOK | | | | | — | | | | (7,091 | ) | |
Deutsche Bank | | 06/23/2016 | | | 637,896 | | | USD | | | | | 5,225,191 | | | NOK | | | | | — | | | | (13,328 | ) | |
Deutsche Bank | | 06/23/2016 | | | 2,855,763 | | | USD | | | | | 4,172,633 | | | NZD | | | | | — | | | | (35,801 | ) | |
Deutsche Bank | | 06/23/2016 | | | 889,809 | | | USD | | | | | 7,400,000 | | | SEK | | | | | — | | | | (1,824 | ) | |
Deutsche Bank | | 06/23/2016 | | | 761,672 | | | USD | | | | | 6,181,554 | | | SEK | | | | | — | | | | (19,898 | ) | |
Deutsche Bank | | 06/23/2016 | | | 147,852 | | | USD | | | | | 200,000 | | | SGD | | | | | — | | | | (2,674 | ) | |
Deutsche Bank | | 06/23/2016 | | | 17,822,403 | | | USD | | | | | 24,108,365 | | | SGD | | | | | — | | | | (322,277 | ) | |
HSBC | | 06/03/2016 | | | 729,000 | | | AUD | | | | | 527,964 | | | USD | | | | | 1,100 | | | | — | | |
HSBC | | 06/03/2016 | | | 159,633 | | | USD | | | | | 221,000 | | | AUD | | | | | 88 | | | | — | | |
HSBC | | 06/03/2016 | | | 373,738 | | | USD | | | | | 508,000 | | | AUD | | | | | — | | | | (6,596 | ) | |
HSBC | | 06/14/2016 | | | 280 | | | USD | | | | | 30,000 | | | JPY | | | | | — | | | | (9 | ) | |
HSBC | | 06/23/2016 | | | 13,142,874 | | | AUD | | | | | 10,125,191 | | | USD | | | | | 634,187 | | | | — | | |
HSBC | | 06/23/2016 | | | 1,098,400 | | | AUD | | | | | 818,703 | | | USD | | | | | 25,504 | | | | — | | |
HSBC | | 06/23/2016 | | | 4,293,362 | | | CAD | | | | | 3,370,545 | | | USD | | | | | 96,595 | | | | — | | |
HSBC | | 06/23/2016 | | | 100,000 | | | CAD | | | | | 78,916 | | | USD | | | | | 2,660 | | | | — | | |
HSBC | | 06/23/2016 | | | 1,200,000 | | | CHF | | | | | 1,231,691 | | | USD | | | | | 23,171 | | | | — | | |
HSBC | | 06/23/2016 | | | 300,000 | | | CHF | | | | | 310,467 | | | USD | | | | | 8,337 | | | | — | | |
HSBC | | 06/23/2016 | | | 4,109,106 | | | EUR | | | | | 4,634,163 | | | USD | | | | | 58,454 | | | | — | | |
HSBC | | 06/23/2016 | | | 124,524 | | | GBP | | | | | 180,510 | | | USD | | | | | 125 | | | | — | | |
HSBC | | 06/23/2016 | | | 1,053,901 | | | GBP | | | | | 1,525,762 | | | USD | | | | | — | | | | (914 | ) | |
HSBC | | 06/23/2016 | | | 102,549,260 | | | JPY | | | | | 956,259 | | | USD | | | | | 29,417 | | | | — | | |
HSBC | | 06/23/2016 | | | 8,300,000 | | | JPY | | | | | 77,360 | | | USD | | | | | 2,345 | | | | — | | |
HSBC | | 06/23/2016 | | | 4,400,000 | | | NOK | | | | | 536,238 | | | USD | | | | | 10,305 | | | | — | | |
HSBC | | 06/23/2016 | | | 1,700,000 | | | NOK | | | | | 207,183 | | | USD | | | | | 3,981 | | | | — | | |
HSBC | | 06/23/2016 | | | 1,000,000 | | | NZD | | | | | 686,914 | | | USD | | | | | 11,091 | | | | — | | |
HSBC | | 06/23/2016 | | | 200,000 | | | NZD | | | | | 136,921 | | | USD | | | | | 1,756 | | | | — | | |
HSBC | | 06/23/2016 | | | 3,582,291 | | | SGD | | | | | 2,647,092 | | | USD | | | | | 46,727 | | | | — | | |
HSBC | | 06/23/2016 | | | 900,000 | | | SGD | | | | | 660,939 | | | USD | | | | | 7,634 | | | | — | | |
HSBC | | 06/23/2016 | | | 74,552 | | | USD | | | | | 100,000 | | | AUD | | | | | — | | | | (2,337 | ) | |
HSBC | | 06/23/2016 | | | 154,079 | | | USD | | | | | 200,000 | | | AUD | | | | | — | | | | (9,651 | ) | |
HSBC | | 06/23/2016 | | | 102,838 | | | USD | | | | | 100,000 | | | CHF | | | | | — | | | | (2,128 | ) | |
HSBC | | 06/23/2016 | | | 1,359,452 | | | USD | | | | | 1,319,991 | | | CHF | | | | | — | | | | (30,089 | ) | |
HSBC | | 06/23/2016 | | | 112,778 | | | USD | | | | | 100,000 | | | EUR | | | | | — | | | | (1,423 | ) | |
HSBC | | 06/23/2016 | | | 684,514 | | | USD | | | | | 600,000 | | | EUR | | | | | — | | | | (16,382 | ) | |
HSBC | | 06/23/2016 | | | 578,378 | | | USD | | | | | 400,000 | | | GBP | | | | | 1,060 | | | | — | | |
HSBC | | 06/23/2016 | | | 144,960 | | | USD | | | | | 100,000 | | | GBP | | | | | — | | | | (101 | ) | |
The accompanying Notes to Consolidated Financial Statements are an integral part of this statement.
Annual Report 2016
24
COLUMBIA DIVERSIFIED ABSOLUTE RETURN FUND
CONSOLIDATED PORTFOLIO OF INVESTMENTS (continued)
May 31, 2016
Forward Foreign Currency Exchange Contracts Open at May 31, 2016 (continued)
Counterparty | | Exchange Date | | Currency to
be Delivered | |
| | Currency to
be Received | |
| | Unrealized
Appreciation ($) | | Unrealized
Depreciation ($) | |
HSBC | | 06/23/2016 | | | 3,754,321 | | | USD | | | | | 416,418,409 | | | JPY | | | | | 9,277 | | | | — | | |
HSBC | | 06/23/2016 | | | 35,161 | | | USD | | | | | 3,900,000 | | | JPY | | | | | 87 | | | | — | | |
HSBC | | 06/23/2016 | | | 244,263 | | | USD | | | | | 26,600,000 | | | JPY | | | | | — | | | | (3,852 | ) | |
HSBC | | 06/23/2016 | | | 831,912 | | | USD | | | | | 6,800,000 | | | NOK | | | | | — | | | | (19,107 | ) | |
HSBC | | 06/23/2016 | | | 4,097,443 | | | USD | | | | | 5,985,138 | | | NZD | | | | | — | | | | (52,550 | ) | |
HSBC | | 06/23/2016 | | | 382,223 | | | USD | | | | | 3,100,000 | | | SEK | | | | | — | | | | (10,229 | ) | |
HSBC | | 06/23/2016 | | | 744,834 | | | USD | | | | | 6,041,883 | | | SEK | | | | | — | | | | (19,820 | ) | |
HSBC | | 06/23/2016 | | | 886,726 | | | USD | | | | | 1,200,000 | | | SGD | | | | | — | | | | (15,653 | ) | |
HSBC | | 06/29/2016 | | | 3,670,000 | | | CHF | | | | | 3,712,921 | | | USD | | | | | 15,746 | | | | — | | |
HSBC | | 07/12/2016 | | | 527,227 | | | USD | | | | | 729,000 | | | AUD | | | | | — | | | | (1,154 | ) | |
Morgan Stanley | | 06/14/2016 | | | 1,316,000 | | | PLN | | | | | 334,805 | | | USD | | | | | 1,209 | | | | — | | |
Morgan Stanley | | 06/23/2016 | | | 100,000 | | | CHF | | | | | 102,820 | | | USD | | | | | 2,110 | | | | — | | |
Morgan Stanley | | 06/23/2016 | | | 18,000,000 | | | JPY | | | | | 162,264 | | | USD | | | | | — | | | | (420 | ) | |
Morgan Stanley | | 06/23/2016 | | | 1,100,000 | | | SEK | | | | | 135,499 | | | USD | | | | | 3,501 | | | | — | | |
Morgan Stanley | | 06/29/2016 | | | 2,455,992 | | | USD | | | | | 3,226,000 | | | CAD | | | | | 4,018 | | | | — | | |
Standard Chartered | | 06/03/2016 | | | 14,526,000 | | | MXN | | | | | 788,336 | | | USD | | | | | 1,401 | | | | — | | |
Standard Chartered | | 06/03/2016 | | | 2,885,000 | | | MXN | | | | | 156,280 | | | USD | | | | | — | | | | (13 | ) | |
Standard Chartered | | 06/03/2016 | | | 994,624 | | | USD | | | | | 17,411,000 | | | MXN | | | | | — | | | | (51,396 | ) | |
Standard Chartered | | 06/14/2016 | | | 497,300 | | | GBP | | | | | 720,022 | | | USD | | | | | — | | | | (312 | ) | |
Standard Chartered | | 06/29/2016 | | | 675,730,000 | | | JPY | | | | | 6,178,216 | | | USD | | | | | 69,515 | | | | — | | |
Standard Chartered | | 06/29/2016 | | | 10,807,000 | | | JPY | | | | | 97,367 | | | USD | | | | | — | | | | (330 | ) | |
Standard Chartered | | 07/12/2016 | | | 785,098 | | | USD | | | | | 14,526,000 | | | MXN | | | | | — | | | | (1,652 | ) | |
State Street | | 06/14/2016 | | | 726,000 | | | CAD | | | | | 561,728 | | | USD | | | | | 8,105 | | | | — | | |
State Street | | 06/23/2016 | | | 100,000 | | | AUD | | | | | 71,742 | | | USD | | | | | — | | | | (472 | ) | |
State Street | | 06/23/2016 | | | 200,000 | | | CAD | | | | | 157,799 | | | USD | | | | | 5,287 | | | | — | | |
State Street | | 06/23/2016 | | | 3,019,890 | | | CHF | | | | | 3,105,624 | | | USD | | | | | 64,291 | | | | — | | |
State Street | | 06/23/2016 | | | 1,003,271 | | | GBP | | | | | 1,456,015 | | | USD | | | | | 2,681 | | | | — | | |
State Street | | 06/23/2016 | | | 569,645,050 | | | JPY | | | | | 5,135,880 | | | USD | | | | | — | | | | (12,584 | ) | |
State Street | | 06/23/2016 | | | 8,500,000 | | | NOK | | | | | 1,034,815 | | | USD | | | | | 18,809 | | | | — | | |
State Street | | 06/23/2016 | | | 100,000 | | | NOK | | | | | 12,174 | | | USD | | | | | 221 | | | | — | | |
State Street | | 06/23/2016 | | | 1,916,683 | | | NZD | | | | | 1,312,096 | | | USD | | | | | 16,758 | | | | — | | |
State Street | | 06/23/2016 | | | 3,315,706 | | | SGD | | | | | 2,449,004 | | | USD | | | | | 42,151 | | | | — | | |
State Street | | 06/23/2016 | | | 1,100,000 | | | SGD | | | | | 795,316 | | | USD | | | | | — | | | | (3,168 | ) | |
State Street | | 06/23/2016 | | | 2,944,346 | | | USD | | | | | 3,822,089 | | | AUD | | | | | — | | | | (184,257 | ) | |
State Street | | 06/23/2016 | | | 1,561,425 | | | USD | | | | | 1,979,006 | | | CAD | | | | | — | | | | (52,313 | ) | |
State Street | | 06/23/2016 | | | 102,839 | | | USD | | | | | 100,000 | | | CHF | | | | | — | | | | (2,129 | ) | |
State Street | | 06/23/2016 | | | 2,192,031 | | | USD | | | | | 1,943,750 | | | EUR | | | | | — | | | | (27,562 | ) | |
State Street | | 06/23/2016 | | | 245,233 | | | USD | | | | | 27,200,000 | | | JPY | | | | | 601 | | | | — | | |
State Street | | 06/23/2016 | | | 774,517 | | | USD | | | | | 85,538,178 | | | JPY | | | | | — | | | | (1,421 | ) | |
State Street | | 06/23/2016 | | | 1,046,312 | | | USD | | | | | 1,548,373 | | | NZD | | | | | 115 | | | | — | | |
State Street | | 06/23/2016 | | | 616,109 | | | USD | | | | | 900,000 | | | NZD | | | | | — | | | | (7,869 | ) | |
State Street | | 06/23/2016 | | | 4,287,827 | | | USD | | | | | 34,800,000 | | | SEK | | | | | — | | | | (111,896 | ) | |
The accompanying Notes to Consolidated Financial Statements are an integral part of this statement.
Annual Report 2016
25
COLUMBIA DIVERSIFIED ABSOLUTE RETURN FUND
CONSOLIDATED PORTFOLIO OF INVESTMENTS (continued)
May 31, 2016
Forward Foreign Currency Exchange Contracts Open at May 31, 2016 (continued)
Counterparty | | Exchange Date | | Currency to
be Delivered | |
| | Currency to
be Received | |
| | Unrealized
Appreciation ($) | | Unrealized
Depreciation ($) | |
State Street | | 06/23/2016 | | | 960,189 | | | USD | | | | | 1,300,000 | | | SGD | | | | | — | | | | (16,526 | ) | |
State Street | | 07/12/2016 | | | 1,587,000 | | | NZD | | | | | 1,067,749 | | | USD | | | | | — | | | | (3,740 | ) | |
UBS | | 06/23/2016 | | | 1,200,000 | | | AUD | | | | | 911,268 | | | USD | | | | | 44,699 | | | | — | | |
UBS | | 06/23/2016 | | | 718,348 | | | CAD | | | | | 568,642 | | | USD | | | | | 20,858 | | | | — | | |
UBS | | 06/23/2016 | | | 7,085,883 | | | CHF | | | | | 7,277,059 | | | USD | | | | | 140,862 | | | | — | | |
UBS | | 06/23/2016 | | | 89,200,000 | | | JPY | | | | | 826,937 | | | USD | | | | | 20,746 | | | | — | | |
UBS | | 06/23/2016 | | | 27,900,000 | | | JPY | | | | | 251,590 | | | USD | | | | | — | | | | (570 | ) | |
UBS | | 06/23/2016 | | | 1,495,815,434 | | | JPY | | | | | 13,488,635 | | | USD | | | | | — | | | | (30,576 | ) | |
UBS | | 06/23/2016 | | | 1,600,000 | | | NOK | | | | | 198,487 | | | USD | | | | | 7,239 | | | | — | | |
UBS | | 06/23/2016 | | | 2,400,000 | | | NOK | | | | | 286,757 | | | USD | | | | | — | | | | (116 | ) | |
UBS | | 06/23/2016 | | | 2,862,429 | | | NZD | | | | | 1,959,152 | | | USD | | | | | 24,657 | | | | — | | |
UBS | | 06/23/2016 | | | 2,112,504 | | | NZD | | | | | 1,427,081 | | | USD | | | | | — | | | | (598 | ) | |
UBS | | 06/23/2016 | | | 55,566,876 | | | SEK | | | | | 6,843,953 | | | USD | | | | | 176,039 | | | | — | | |
UBS | | 06/23/2016 | | | 4,800,000 | | | SEK | | | | | 591,197 | | | USD | | | | | 15,207 | | | | — | | |
UBS | | 06/23/2016 | | | 1,700,000 | | | SGD | | | | | 1,256,551 | | | USD | | | | | 22,530 | | | | — | | |
UBS | | 06/23/2016 | | | 755,881 | | | SGD | | | | | 561,259 | | | USD | | | | | 12,569 | | | | — | | |
UBS | | 06/23/2016 | | | 100,000 | | | SGD | | | | | 72,301 | | | USD | | | | | — | | | | (288 | ) | |
UBS | | 06/23/2016 | | | 77,020 | | | USD | | | | | 100,000 | | | AUD | | | | | — | | | | (4,806 | ) | |
UBS | | 06/23/2016 | | | 7,280,305 | | | USD | | | | | 9,455,388 | | | AUD | | | | | — | | | | (452,180 | ) | |
UBS | | 06/23/2016 | | | 394,493 | | | USD | | | | | 500,000 | | | CAD | | | | | — | | | | (13,213 | ) | |
UBS | | 06/23/2016 | | | 205,677 | | | USD | | | | | 200,000 | | | CHF | | | | | — | | | | (4,257 | ) | |
UBS | | 06/23/2016 | | | 1,043,645 | | | USD | | | | | 1,000,000 | | | CHF | | | | | — | | | | (36,545 | ) | |
UBS | | 06/23/2016 | | | 7,905,882 | | | USD | | | | | 6,998,084 | | | EUR | | | | | — | | | | (113,139 | ) | |
UBS | | 06/23/2016 | | | 9,118,454 | | | USD | | | | | 6,286,242 | | | GBP | | | | | — | | | | (12,236 | ) | |
UBS | | 06/23/2016 | | | 182,578 | | | USD | | | | | 1,500,000 | | | NOK | | | | | — | | | | (3,283 | ) | |
UBS | | 06/23/2016 | | | 1,436,664 | | | USD | | | | | 11,800,000 | | | NOK | | | | | — | | | | (26,208 | ) | |
UBS | | 06/23/2016 | | | 201,789 | | | USD | | | | | 300,000 | | | NZD | | | | | 958 | | | | — | | |
UBS | | 06/23/2016 | | | 1,683,587 | | | USD | | | | | 2,418,033 | | | NZD | | | | | — | | | | (49,425 | ) | |
UBS | | 06/23/2016 | | | 499,989 | | | USD | | | | | 4,000,000 | | | SEK | | | | | — | | | | (19,997 | ) | |
Total | | | | | | | | | | | | | 2,673,157 | | | | (2,597,377 | ) | |
Futures Contracts Outstanding at May 31, 2016
Long Futures Contracts Outstanding
Contract Description | | Number of
Contracts | | Trading
Currency | | Notional
Market
Value ($) | | Expiration
Date | | Unrealized
Appreciation ($) | | Unrealized
(Depreciation) ($) | |
| 10-Year Mini JGB | | | 41 | | | JPY | | | | | 5,624,888 | | | 06/2016 | | | 2,015 | | | | — | | |
| 10-Year Mini JGB | | | 64 | | | JPY | | | | | 8,780,313 | | | 06/2016 | | | — | | | | (177 | ) | |
3-Month Euro Euribor | | | 7 | | | EUR | | | | | 1,952,785 | | | 12/2016 | | | — | | | | (14 | ) | |
| 3-Month Euroyen TFX | | | 36 | | | JPY | | | | | 8,131,575 | | | 12/2016 | | | 1,531 | | | | — | | |
| 3-Month Euroyen TFX | | | 32 | | | JPY | | | | | 7,228,067 | | | 12/2016 | | | — | | | | (598 | ) | |
| 90-Day Euro$ | | | 17 | | | USD | | | | | 4,210,050 | | | 12/2016 | | | — | | | | (4,924 | ) | |
The accompanying Notes to Consolidated Financial Statements are an integral part of this statement.
Annual Report 2016
26
COLUMBIA DIVERSIFIED ABSOLUTE RETURN FUND
CONSOLIDATED PORTFOLIO OF INVESTMENTS (continued)
May 31, 2016
Futures Contracts Outstanding at May 31, 2016 (continued)
Long Futures Contracts Outstanding (continued)
Contract Description | | Number of
Contracts | | Trading
Currency | | Notional
Market
Value ($) | | Expiration
Date | | Unrealized
Appreciation ($) | | Unrealized
(Depreciation) ($) | |
| 90-Day Sterling | | | 32 | | | GBP | | | | | 5,758,638 | | | 12/2016 | | | — | | | | (563 | ) | |
Australian 10-Year Bond | | | 56 | | | AUD | | | | | 5,378,406 | | | 06/2016 | | | 57,283 | | | | — | | |
Australian 10-Year Bond | | | 22 | | | AUD | | | | | 2,112,945 | | | 06/2016 | | | 767 | | | | — | | |
Australian 3-Year Bond | | | 13 | | | AUD | | | | | 1,059,020 | | | 06/2016 | | | 7,056 | | | | — | | |
Banker's Acceptance | | | 55 | | | CAD | | | | | 10,383,145 | | | 12/2016 | | | 1,970 | | | | — | | |
Banker's Acceptance | | | 18 | | | CAD | | | | | 3,398,120 | | | 12/2016 | | | — | | | | (1,785 | ) | |
CAC40 Index | | | 1 | | | EUR | | | | | 49,847 | | | 06/2016 | | | 2,584 | | | | — | | |
CAC40 Index | | | 1 | | | EUR | | | | | 49,847 | | | 06/2016 | | | 958 | | | | — | | |
Canadian Government 10-Year Bond | | | 22 | | | CAD | | | | | 2,431,433 | | | 09/2016 | | | 7,046 | | | | — | | |
| EURO STOXX 50 | | | 36 | | | EUR | | | | | 1,222,892 | | | 06/2016 | | | 55,648 | | | | — | | |
Euro CHF 3-Month ICE | | | 17 | | | CHF | | | | | 4,310,287 | | | 12/2016 | | | — | | | | (1,754 | ) | |
Euro-Bund | | | 24 | | | EUR | | | | | 4,378,590 | | | 06/2016 | | | 21,514 | | | | — | | |
FTSE 100 Index | | | 11 | | | GBP | | | | | 990,881 | | | 06/2016 | | | 26,684 | | | | — | | |
FTSE 100 Index | | | 2 | | | GBP | | | | | 180,160 | | | 06/2016 | | | 1,961 | | | | — | | |
FTSE/MIB Index | | | 1 | | | EUR | | | | | 100,355 | | | 06/2016 | | | 5,439 | | | | — | | |
Hang Seng Index | | | 1 | | | HKD | | | | | 131,738 | | | 06/2016 | | | 2,455 | | | | — | | |
Long Gilt | | | 13 | | | GBP | | | | | 2,311,204 | | | 09/2016 | | | 6,117 | | | | — | | |
Long Gilt | | | 1 | | | GBP | | | | | 177,785 | | | 09/2016 | | | 309 | | | | — | | |
Mini MSCI Emerging Markets Index | | | 55 | | | USD | | | | | 2,215,400 | | | 06/2016 | | | — | | | | (15,652 | ) | |
S&P 500 E-mini | | | 54 | | | USD | | | | | 5,656,230 | | | 06/2016 | | | 222,647 | | | | — | | |
S&P 500 E-mini | | | 3 | | | USD | | | | | 314,235 | | | 06/2016 | | | 5,340 | | | | — | | |
S&P/TSE 60 Index | | | 1 | | | CAD | | | | | 125,031 | | | 06/2016 | | | — | | | | (872 | ) | |
SPI 200 Index | | | 2 | | | AUD | | | | | 194,492 | | | 06/2016 | | | 11,256 | | | | — | | |
TOPIX Index | | | 10 | | | JPY | | | | | 1,243,509 | | | 06/2016 | | | 41,328 | | | | — | | |
U.S. Treasury 5-Year Note | | | 44 | | | USD | | | | | 5,285,156 | | | 09/2016 | | | 1,983 | | | | — | | |
Total | | | | | | | 95,387,024 | | | | | | 483,891 | | | | (26,339 | ) | |
Short Futures Contracts Outstanding
Contract Description | | Number of
Contracts | | Trading
Currency | | Notional
Market
Value ($) | | Expiration
Date | | Unrealized
Appreciation ($) | | Unrealized
(Depreciation) ($) | |
3-Month Euro Euribor | | | (18 | ) | | EUR | | | | | (5,021,446 | ) | | 12/2016 | | | — | | | | (410 | ) | |
| 90-Day Euro$ | | | (7 | ) | | USD | | | | | (1,733,550 | ) | | 12/2016 | | | — | | | | (456 | ) | |
| 90-Day Euro$ | | | (8 | ) | | USD | | | | | (1,981,200 | ) | | 12/2016 | | | — | | | | (916 | ) | |
Banker's Acceptance | | | (21 | ) | | CAD | | | | | (3,964,474 | ) | | 12/2016 | | | 4,725 | | | | — | | |
Canadian Government 10-Year Bond | | | (5 | ) | | CAD | | | | | (552,598 | ) | | 09/2016 | | | — | | | | (1,193 | ) | |
Canadian Government 10-Year Bond | | | (7 | ) | | CAD | | | | | (773,638 | ) | | 09/2016 | | | — | | | | (3,452 | ) | |
The accompanying Notes to Consolidated Financial Statements are an integral part of this statement.
Annual Report 2016
27
COLUMBIA DIVERSIFIED ABSOLUTE RETURN FUND
CONSOLIDATED PORTFOLIO OF INVESTMENTS (continued)
May 31, 2016
Futures Contracts Outstanding at May 31, 2016 (continued)
Short Futures Contracts Outstanding (continued)
Contract Description | | Number of
Contracts | | Trading
Currency | | Notional
Market
Value ($) | | Expiration
Date | | Unrealized
Appreciation ($) | | Unrealized
(Depreciation) ($) | |
Euro CHF 3-Month ICE | | | (16 | ) | | CHF | | | | | (4,056,740 | ) | | 12/2016 | | | 2,798 | | | | — | | |
Euro-Bund | | | (4 | ) | | EUR | | | | | (729,765 | ) | | 06/2016 | | | — | | | | (2,016 | ) | |
Euro-Bund | | | (16 | ) | | EUR | | | | | (2,919,060 | ) | | 06/2016 | | | — | | | | (22,818 | ) | |
Hang Seng Index | | | (1 | ) | | HKD | | | | | (131,738 | ) | | 06/2016 | | | — | | | | (2,056 | ) | |
IBEX 35 Index | | | (1 | ) | | EUR | | | | | (100,341 | ) | | 06/2016 | | | — | | | | (3,880 | ) | |
Long Gilt | | | (2 | ) | | GBP | | | | | (355,570 | ) | | 09/2016 | | | — | | | | (712 | ) | |
OMXS30 Index | | | (2 | ) | | SEK | | | | | (32,758 | ) | | 06/2016 | | | — | | | | (885 | ) | |
S&P 500 E-mini | | | (1 | ) | | USD | | | | | (104,745 | ) | | 06/2016 | | | 115 | | | | — | | |
SPI 200 Index | | | (1 | ) | | AUD | | | | | (97,246 | ) | | 06/2016 | | | 54 | | | | — | | |
SPI 200 Index | | | (1 | ) | | AUD | | | | | (97,246 | ) | | 06/2016 | | | — | | | | (325 | ) | |
TOPIX Index | | | (2 | ) | | JPY | | | | | (248,702 | ) | | 06/2016 | | | — | | | | (13,084 | ) | |
U.S. Long Bond | | | (4 | ) | | USD | | | | | (653,250 | ) | | 09/2016 | | | — | | | | (1,788 | ) | |
U.S. Long Bond | | | (17 | ) | | USD | | | | | (2,776,312 | ) | | 09/2016 | | | — | | | | (18,755 | ) | |
U.S. Treasury 10-Year Note | | | (5 | ) | | USD | | | | | (648,438 | ) | | 09/2016 | | | — | | | | (361 | ) | |
U.S. Treasury 10-Year Note | | | (23 | ) | | USD | | | | | (2,982,812 | ) | | 09/2016 | | | — | | | | (6,113 | ) | |
U.S. Treasury 5-Year Note | | | (19 | ) | | USD | | | | | (2,282,227 | ) | | 09/2016 | | | — | | | | (920 | ) | |
U.S. Ultra Bond | | | (2 | ) | | USD | | | | | (350,250 | ) | | 09/2016 | | | — | | | | (832 | ) | |
Total | | | | | | | (32,594,106 | ) | | | | | 7,692 | | | | (80,972 | ) | |
Credit Default Swap Contracts Outstanding at May 31, 2016
Buy Protection
Counterparty | | Reference
Entity | | Expiration
Date | | Pay Fixed
Rate (%) | | Notional
Currency | | Notional
Amount | | Market
Value ($) | | Premium
Paid ($) | | Premium
Received
($) | | Periodic
Payments
Receivable
(Payable)
($) | | Unrealized
Appreciation
($) | | Unrealized
Depreciation
($) | |
Goldman Sachs
International
| | Markit CDX
Emerging
Markets Index,
Series 25 | | 06/20/2021
| | | 1.000
| | | USD |
| | | | 800,000
| | | | 72,625
| | | | 71,468
| | | | —
| | | | (1,600
| ) | | | —
| | | | (443
| ) | |
Cleared Credit Default Swap Contracts Outstanding at May 31, 2016
Buy Protection
Counterparty | | Reference
Entity | | Expiration
Date | | Pay Fixed
Rate (%) | | Notional
Currency | | Notional
Amount | | Unrealized
Appreciation ($) | | Unrealized
Depreciation ($) | |
Morgan Stanley
| | Markit CDX North America
Investment Grade Index,
Series 26 | |
06/20/2021 | | |
1.000 | | |
USD | | |
450,000 | | | |
— | | | | (1,877 | ) | |
The accompanying Notes to Consolidated Financial Statements are an integral part of this statement.
Annual Report 2016
28
COLUMBIA DIVERSIFIED ABSOLUTE RETURN FUND
CONSOLIDATED PORTFOLIO OF INVESTMENTS (continued)
May 31, 2016
Cleared Credit Default Swap Contracts Outstanding at May 31, 2016
Sell Protection
Counterparty | | Reference
Entity | | Expiration
Date | | Receive
Fixed
Rate (%) | | Implied
Credit
Spread
(%)** | | Notional
Currency | | Notional
Amount | | Unrealized
Appreciation ($) | | Unrealized
Depreciation ($) | |
Morgan Stanley
| | Markit iTraxx
Europe
Crossover Index,
Series 25 | | 06/20/2021 | | | 5.000 | | | | 3.154 | | | | EUR | | | | 1,090,000 | | | | 18,381 | | | | — | | |
**Implied credit spreads, represented in absolute terms, utilized in determining the market value of credit default swap agreements on corporate or sovereign issues as of period end serve as an indicator of the current status of the payment/performance risk and represent the likelihood or risk of default for the credit derivative. The implied credit spread of a particular referenced entity reflects the cost of buying/selling protection and may include upfront payments required to be made to enter into the agreement. Wider credit spreads represent a deterioration of the referenced entity's credit soundness and a greater likelihood or risk of default or other credit event occurring as defined under the terms of the agreement.
Cleared Interest Rate Swap Contracts Outstanding at May 31, 2016
Counterparty | | Fund Receives | | Fund Pays | | Expiration
Date | | Notional
Currency | | Notional
Amount | | Unrealized
Appreciation
($) | | Unrealized
Depreciation
($) | |
Morgan Stanley
| | 3-Month USD
LIBOR-BBA | | Fixed rate of
1.577% | | 09/15/2020
| | USD |
| | | | 1,400,000
| | | | —
| | | | (20,418
| ) | |
Morgan Stanley
| | 3-Month USD
LIBOR-BBA | | Fixed rate of
1.905% | | 09/15/2022
| | USD |
| | | | 3,489,000
| | | | —
| | | | (106,019
| ) | |
Total | | | | | | | | | | | | | — | | | | (126,437 | ) | |
Total Return Swap Contracts Outstanding at May 31, 2016
Counterparty | | Fund Receives | | Fund Pays | | Expiration
Date | | Notional
Currency | | Notional
Amount | | Premium
Paid ($) | | Premium
Received ($) | | Unrealized
Appreciation
($) | | Unrealized
Depreciation
($) | |
Goldman Sachs
International
| | Total return on
Goldman Sachs
Risk Premia
Basket Series 44
Excess Return(a) | | Fixed rate of
0.350%
| | 09/20/2016
| | USD |
| | | | 2,997,895
| | | | —
| | | | —
| | | | —
| | | | (41,759
| ) | |
Goldman Sachs
International
| | Total return on
Goldman Sachs
Risk Premia
Basket Series 44
Excess Return(a) | | Fixed rate of
0.350%
| | 10/15/2016
| | USD |
| | | | 4,821,065
| | | | —
| | | | —
| | | | —
| | | | (67,155
| ) | |
Goldman Sachs
International
| | Total return on
Goldman Sachs
Risk Premia
Basket Series 44
Excess Return(a) | | Fixed rate of
0.350%
| | 11/09/2016
| | USD |
| | | | 9,962,825
| | | | —
| | | | —
| | | | —
| | | | (138,777
| ) | |
Goldman Sachs
International
| | Total return on
Goldman Sachs
Risk Premia
Basket Series 27
Excess Return(b) | | Fixed rate of
0.350%
| | 11/30/2016
| | USD |
| | | | 19,080,150
| | | | —
| | | | —
| | | | —
| | | | (264,620
| ) | |
Total | | | | | | | | | | | | | — | | | | — | | | | — | | | | (512,311 | ) | |
(a) Underlying assets of this index include forward foreign currency exchange contracts, long/short foreign and domestic commodity futures, long/short foreign and domestic index futures, options on short commodity futures, options on foreign and domestic indices, short currency options, foreign indices and long/short foreign and domestic equities.
(b) Underlying assets of this index include forward foreign currency exchange contracts, long/short commodity futures, long/short foreign and domestic bond futures, options on short commodity futures, options on foreign and domestic indices and long/short foreign and domestic equities.
The accompanying Notes to Consolidated Financial Statements are an integral part of this statement.
Annual Report 2016
29
COLUMBIA DIVERSIFIED ABSOLUTE RETURN FUND
CONSOLIDATED PORTFOLIO OF INVESTMENTS (continued)
May 31, 2016
Notes to Consolidated Portfolio of Investments
(a) This security or a portion of this security has been pledged as collateral in connection with securities sold short.
(b) Non-income producing investment.
(c) Represents privately placed and other securities and instruments exempt from SEC registration (collectively, private placements), such as Section 4(a)(2) and Rule 144A eligible securities, which are often sold only to qualified institutional buyers. The Fund may invest in private placements determined to be liquid as well as those determined to be illiquid. Private placements may be determined to be liquid under guidelines established by the Fund's Board of Trustees. At May 31, 2016, the value of these securities amounted to $5,463,178 or 3.54% of net assets.
(d) Variable rate security.
(e) Interest Only (IO) represents the right to receive the monthly interest payments on an underlying pool of mortgage loans.
(f) Principal amounts are denominated in United States Dollars unless otherwise noted.
(g) Principal and interest may not be guaranteed by the government.
(h) Purchased swaption contracts outstanding at May 31, 2016:
Description | | Counterparty | | Fund Receives | | Fund Pays | | Exercise
Rate (%) | | Expiration
Date | | Notional
Amount ($) | | Premium
Paid ($) | | Market
Value ($) | |
Put — OTC 5-Year
Interest Rate Swap | | Barclays
| | 3-Month USD
LIBOR BBA | | Fixed rate
of 2.150% | | | 2.150
| | | 09/13/2021
| | | 670,000
| | | | 9,196
| | | | 198
| | |
Put — OTC 5-Year
Interest Rate Swap | | Barclays
| | 3-Month USD
LIBOR BBA | | Fixed rate
of 2.000% | | | 2.000
| | | 12/06/2021
| | | 600,000
| | | | 8,400
| | | | 1,418
| | |
Total | | | | | | | | | | | | | | | 17,596 | | | | 1,616 | | |
(i) The rate shown is the seven-day current annualized yield at May 31, 2016.
(j) As defined in the Investment Company Act of 1940, an affiliated company is one in which the Fund owns 5% or more of the company's outstanding voting securities, or a company which is under common ownership or control with the Fund. Holdings and transactions in these affiliated companies during the year ended May 31, 2016 are as follows:
Issuer | | Beginning
Cost ($) | | Purchase
Cost ($) | | Proceeds
From Sales ($) | | Ending
Cost ($) | | Dividends —
Affiliated
Issuers ($) | | Value ($) | |
Columbia Short-Term Cash Fund | | | 58,711,963 | | | | 175,801,993 | | | | (150,470,270 | ) | | | 84,043,686 | | | | 224,255 | | | | 84,043,686 | | |
Abbreviation Legend
ADR American Depositary Receipt
CMO Collateralized Mortgage Obligation
PIK Payment-in-Kind
Currency Legend
AUD Australian Dollar
CAD Canadian Dollar
CHF Swiss Franc
CNH Yuan Offshore Renminbi
EUR Euro
GBP British Pound
HKD Hong Kong Dollar
HUF Hungarian Forint
JPY Japanese Yen
MXN Mexican Peso
The accompanying Notes to Consolidated Financial Statements are an integral part of this statement.
Annual Report 2016
30
COLUMBIA DIVERSIFIED ABSOLUTE RETURN FUND
CONSOLIDATED PORTFOLIO OF INVESTMENTS (continued)
May 31, 2016
Currency Legend (continued)
NOK Norwegian Krone
NZD New Zealand Dollar
PLN Polish Zloty
RUB Russian Rouble
SEK Swedish Krona
SGD Singapore Dollar
USD US Dollar
Fair Value Measurements
The Fund categorizes its fair value measurements according to a three-level hierarchy that maximizes the use of observable inputs and minimizes the use of unobservable inputs by prioritizing that the most observable input be used when available. Observable inputs are those that market participants would use in pricing an investment based on market data obtained from sources independent of the reporting entity. Unobservable inputs are those that reflect the Fund's assumptions about the information market participants would use in pricing an investment. An investment's level within the fair value hierarchy is based on the lowest level of any input that is deemed significant to the asset's or liability's fair value measurement. The input levels are not necessarily an indication of the risk or liquidity associated with investments at that level. For example, certain U.S. government securities are generally high quality and liquid, however, they are reflected as Level 2 because the inputs used to determine fair value may not always be quoted prices in an active market.
Fair value inputs are summarized in the three broad levels listed below:
> Level 1 — Valuations based on quoted prices for investments in active markets that the Fund has the ability to access at the measurement date (including NAV for open-end mutual funds). Valuation adjustments are not applied to Level 1 investments.
> Level 2 — Valuations based on other significant observable inputs (including quoted prices for similar securities, interest rates, prepayment speeds, credit risks, etc.).
> Level 3 — Valuations based on significant unobservable inputs (including the Fund's own assumptions and judgment in determining the fair value of investments).
Inputs that are used in determining fair value of an investment may include price information, credit data, volatility statistics, and other factors. These inputs can be either observable or unobservable. The availability of observable inputs can vary between investments, and is affected by various factors such as the type of investment, and the volume and level of activity for that investment or similar investments in the marketplace. The inputs will be considered by the Investment Manager, along with any other relevant factors in the calculation of an investment's fair value. The Fund uses prices and inputs that are current as of the measurement date, which may include periods of market dislocations. During these periods, the availability of prices and inputs may be reduced for many investments. This condition could cause an investment to be reclassified between the various levels within the hierarchy.
Foreign equity securities actively traded in markets where there is a significant delay in the local close relative to the New York Stock Exchange (NYSE) are classified as Level 2. The values of these securities may include an adjustment to reflect the impact of significant market movements following the close of local trading, as described in Note 2 to the financial statements — Security Valuation.
Certain investments that have been measured at fair value using the net asset value per share (or its equivalent) are not categorized in the fair value hierarchy. The fair value amounts presented in the table are intended to reconcile the fair value hierarchy to the amounts presented in the Portfolio of Investments. The Columbia Short-Term Cash Fund seeks to provide shareholders with maximum current income consistent with liquidity and stability of principal. Investments in Columbia Short-Term Cash Fund may be redeemed on a daily basis without restriction.
Investments falling into the Level 3 category are primarily supported by quoted prices from brokers and dealers participating in the market for those investments. However, these may be classified as Level 3 investments due to lack of market transparency and corroboration to support these quoted prices. Additionally, valuation models may be used as the pricing source for any remaining investments classified as Level 3. These models may rely on one or more significant unobservable inputs and/or significant assumptions by the Investment Manager. Inputs used in valuations may include, but are not limited to, financial statement analysis, capital account balances, discount rates and estimated cash flows, and comparable company data.
Under the direction of the Fund's Board of Trustees (the Board), the Investment Manager's Valuation Committee (the Committee) is responsible for overseeing the valuation procedures approved by the Board. The Committee consists of voting and non-voting members from various groups within the Investment Manager's organization, including operations and accounting, trading and investments, compliance, risk management and legal.
The Committee meets at least monthly to review and approve valuation matters, which may include a description of specific valuation determinations, data regarding pricing information received from approved pricing vendors and brokers and the results of Board-approved valuation control policies and procedures (the Policies). The Policies address, among other things, instances when market quotations are or are not readily available, including recommendations of third party pricing vendors and a determination of appropriate pricing methodologies; events that require specific valuation determinations and assessment of fair value techniques; securities with a potential for stale pricing,
The accompanying Notes to Consolidated Financial Statements are an integral part of this statement.
Annual Report 2016
31
COLUMBIA DIVERSIFIED ABSOLUTE RETURN FUND
CONSOLIDATED PORTFOLIO OF INVESTMENTS (continued)
May 31, 2016
Fair Value Measurements (continued)
including those that are illiquid, restricted, or in default; and the effectiveness of third party pricing vendors, including periodic reviews of vendors. The Committee meets more frequently, as needed, to discuss additional valuation matters, which may include the need to review back-testing results, review time-sensitive information or approve related valuation actions. The Committee reports to the Board, with members of the Committee meeting with the Board at each of its regularly scheduled meetings to discuss valuation matters and actions during the period, similar to those described earlier.
For investments categorized as Level 3, the Committee monitors information similar to that described above, which may include: (i) data specific to the issuer or comparable issuers, (ii) general market or specific sector news and (iii) quoted prices and specific or similar security transactions. The Committee considers this data and any changes from prior periods in order to assess the reasonableness of observable and unobservable inputs, any assumptions or internal models used to value those securities and changes in fair value. This data is also used to corroborate, when available, information received from approved pricing vendors and brokers. Various factors impact the frequency of monitoring this information (which may occur as often as daily). However, the Committee may determine that changes to inputs, assumptions and models are not required as a result of the monitoring procedures performed.
The following table is a summary of the inputs used to value the Fund's investments at May 31, 2016:
| | | Level 1
Quoted Prices in Active
Markets for Identical
Assets ($) | | Level 2
Other Significant
Observable Inputs ($) | | Level 3
Significant
Unobservable Inputs ($) | | Total ($) | |
Investments | |
Common Stocks | |
Consumer Discretionary | | | 8,925,650 | | | | — | | | | — | | | | 8,925,650 | | |
Consumer Staples | | | 2,389,333 | | | | — | | | | — | | | | 2,389,333 | | |
Energy | | | 1,742,578 | | | | — | | | | — | | | | 1,742,578 | | |
Financials | | | 4,527,563 | | | | — | | | | — | | | | 4,527,563 | | |
Health Care | | | 8,085,184 | | | | — | | | | — | | | | 8,085,184 | | |
Industrials | | | 5,887,043 | | | | — | | | | — | | | | 5,887,043 | | |
Information Technology | | | 9,944,929 | | | | — | | | | — | | | | 9,944,929 | | |
Materials | | | 1,607,618 | | | | — | | | | — | | | | 1,607,618 | | |
Telecommunication Services | | | 147,967 | | | | — | | | | — | | | | 147,967 | | |
Utilities | | | 1,172,206 | | | | — | | | | — | | | | 1,172,206 | | |
Total Common Stocks | | | 44,430,071 | | | | — | | | | — | | | | 44,430,071 | | |
The accompanying Notes to Consolidated Financial Statements are an integral part of this statement.
Annual Report 2016
32
COLUMBIA DIVERSIFIED ABSOLUTE RETURN FUND
CONSOLIDATED PORTFOLIO OF INVESTMENTS (continued)
May 31, 2016
Fair Value Measurements (continued)
| | | Level 1
Quoted Prices in Active
Markets for Identical
Assets ($) | | Level 2
Other Significant
Observable Inputs ($) | | Level 3
Significant
Unobservable Inputs ($) | | Total ($) | |
Corporate Bonds & Notes | | | — | | | | 2,913,381 | | | | — | | | | 2,913,381 | | |
Residential Mortgage-Backed
Securities — Agency | | | — | | | | 57,375 | | | | — | | | | 57,375 | | |
Residential Mortgage-Backed
Securities — Non-Agency | | | — | | | | 1,091,648 | | | | — | | | | 1,091,648 | | |
Commercial Mortgage-Backed
Securities — Non-Agency | | | — | | | | 1,099,381 | | | | — | | | | 1,099,381 | | |
Asset-Backed Securities —
Non-Agency | | | — | | | | — | | | | 100,038 | | | | 100,038 | | |
Inflation-Indexed Bonds | | | — | | | | 122,544 | | | | — | | | | 122,544 | | |
U.S. Treasury Obligations | | | 71,838 | | | | — | | | | — | | | | 71,838 | | |
Foreign Government Obligations | | | — | | | | 5,274,225 | | | | — | | | | 5,274,225 | | |
Exchange-Traded Funds | | | 21,632,695 | | | | — | | | | — | | | | 21,632,695 | | |
Limited Partnerships | |
Financials | | | 88,161 | | | | — | | | | — | | | | 88,161 | | |
Treasury Bills | | | 1,935,394 | | | | — | | | | — | | | | 1,935,394 | | |
Options Purchased Puts | | | — | | | | 1,616 | | | | — | | | | 1,616 | | |
Investments measured at net
asset value | |
Money Market Funds | | | — | | | | — | | | | — | | | | 84,043,686 | | |
Total Investments | | | 68,158,159 | | | | 10,560,170 | | | | 100,038 | | | | 162,862,053 | | |
Investments Sold Short | |
Common Stocks | |
Consumer Discretionary | | | (6,277,938 | ) | | | (380 | ) | | | — | | | | (6,278,318 | ) | |
Consumer Staples | | | (1,459,615 | ) | | | — | | | | — | | | | (1,459,615 | ) | |
Energy | | | (1,000,720 | ) | | | — | | | | — | | | | (1,000,720 | ) | |
Financials | | | (2,752,204 | ) | | | — | | | | — | | | | (2,752,204 | ) | |
Health Care | | | (5,930,185 | ) | | | — | | | | — | | | | (5,930,185 | ) | |
Industrials | | | (5,069,948 | ) | | | — | | | | — | | | | (5,069,948 | ) | |
Information Technology | | | (8,187,398 | ) | | | — | | | | — | | | | (8,187,398 | ) | |
Materials | | | (961,483 | ) | | | — | | | | — | | | | (961,483 | ) | |
Telecommunication Services | | | (170,855 | ) | | | — | | | | — | | | | (170,855 | ) | |
Utilities | | | (831,546 | ) | | | — | | | | — | | | | (831,546 | ) | |
Total Common Stocks | | | (32,641,892 | ) | | | (380 | ) | | | — | | | | (32,642,272 | ) | |
Total Investments Sold Short | | | (32,641,892 | ) | | | (380 | ) | | | — | | | | (32,642,272 | ) | |
Total Investments, Net of Investments
Sold Short | | | 35,516,267 | | | | 10,559,790 | | | | 100,038 | | | | 130,219,781 | | |
The accompanying Notes to Consolidated Financial Statements are an integral part of this statement.
Annual Report 2016
33
COLUMBIA DIVERSIFIED ABSOLUTE RETURN FUND
CONSOLIDATED PORTFOLIO OF INVESTMENTS (continued)
May 31, 2016
Fair Value Measurements (continued)
| | | Level 1
Quoted Prices in Active
Markets for Identical
Assets ($) | | Level 2
Other Significant
Observable Inputs ($) | | Level 3
Significant
Unobservable Inputs ($) | | Total ($) | |
Derivatives | |
Assets | |
Forward Foreign Currency Exchange
Contracts | | | — | | | | 2,673,157 | | | | — | | | | 2,673,157 | | |
Futures Contracts | | | 491,583 | | | | — | | | | — | | | | 491,583 | | |
Swap Contracts | | | — | | | | 18,381 | | | | — | | | | 18,381 | | |
Liabilities | |
Forward Foreign Currency Exchange
Contracts | | | — | | | | (2,597,377 | ) | | | — | | | | (2,597,377 | ) | |
Futures Contracts | | | (107,311 | ) | | | — | | | | — | | | | (107,311 | ) | |
Swap Contracts | | | — | | | | (128,757 | ) | | | (512,311 | ) | | | (641,068 | ) | |
Total | | | 35,900,539 | | | | 10,525,194 | | | | (412,273 | ) | | | 130,057,146 | | |
See the Consolidated Portfolio of Investments for all investment classifications not indicated in the table.
The Fund's assets assigned to the Level 2 input category are generally valued using the market approach, in which a security's value is determined through reference to prices and information from market transactions for similar or identical assets. These assets include certain foreign securities for which a third party statistical pricing service may be employed for purposes of fair market valuation. The model utilized by such third party statistical pricing service takes into account a security's correlation to available market data including, but not limited to, intraday index, ADR, and exchange-traded fund movements.
Forward foreign currency exchange contracts, futures contracts and swap contracts are valued at unrealized appreciation (depreciation).
There were no transfers of financial assets between levels during the period.
The Fund does not hold any significant investments (greater than one percent of net assets) categorized as Level 3.
The Fund's assets assigned to the Level 3 category are valued utilizing the valuation technique deemed the most appropriate in the circumstances. Certain mortgage backed securities and swap contracts classified as Level 3 securities are valued using the market approach and utilize single market quotations from broker dealers. The appropriateness of fair values for these securities is monitored on an ongoing basis which may include results of back testing and other control procedures. Significant increases (decreases) to any of these inputs would result in a significantly lower (higher) valuation measurement.
The accompanying Notes to Consolidated Financial Statements are an integral part of this statement.
Annual Report 2016
34
COLUMBIA DIVERSIFIED ABSOLUTE RETURN FUND
CONSOLIDATED STATEMENT OF ASSETS AND LIABILITIES
May 31, 2016
Assets | |
Investments, at value | |
Unaffiliated issuers (identified cost $77,659,709) | | $ | 78,816,751 | | |
Affiliated issuers (identified cost $84,043,686) | | | 84,043,686 | | |
Options purchased (identified cost $17,596) | | | 1,616 | | |
Total investments (identified cost $161,720,991) | | | 162,862,053 | | |
Cash | | | 1,707 | | |
Cash collateral held at broker | | | 23,002,015 | | |
Margin deposits | | | 1,581,378 | | |
Unrealized appreciation on forward foreign currency exchange contracts | | | 2,673,157 | | |
Premiums paid on outstanding swap contracts | | | 71,468 | | |
Receivable for: | |
Investments sold | | | 224,593 | | |
Capital shares sold | | | 34,020 | | |
Dividends | | | 101,149 | | |
Interest | | | 128,574 | | |
Foreign tax reclaims | | | 9,209 | | |
Variation margin | | | 53,779 | | |
Expense reimbursement due from Investment Manager | | | 8,052 | | |
Prepaid expenses | | | 113 | | |
Trustees' deferred compensation plan | | | 4,180 | | |
Total assets | | | 190,755,447 | | |
Liabilities | |
Securities sold short, at value (proceeds $31,604,635) | | | 32,642,272 | | |
Foreign currency (cost $3,510) | | | 3,496 | | |
Unrealized depreciation on forward foreign currency exchange contracts | | | 2,597,377 | | |
Unrealized depreciation on swap contracts | | | 512,754 | | |
Payable for: | |
Investments purchased | | | 173,426 | | |
Capital shares purchased | | | 125,651 | | |
Dividends and interest on securities sold short | | | 74,792 | | |
Variation margin | | | 95,911 | | |
Investment management fees | | | 19,933 | | |
Distribution and/or service fees | | | 1,151 | | |
Transfer agent fees | | | 28,509 | | |
Compensation of board members | | | 118 | | |
Chief compliance officer expenses | | | 13 | | |
Other expenses | | | 94,959 | | |
Trustees' deferred compensation plan | | | 4,180 | | |
Total liabilities | | | 36,374,542 | | |
Net assets applicable to outstanding capital stock | | $ | 154,380,905 | | |
Represented by | |
Paid-in capital | | $ | 157,159,455 | | |
Excess of distributions over net investment income | | | (903,351 | ) | |
Accumulated net realized loss | | | (1,808,702 | ) | |
Unrealized appreciation (depreciation) on: | |
Investments | | | 1,157,042 | | |
Foreign currency translations | | | (7,287 | ) | |
Forward foreign currency exchange contracts | | | 75,780 | | |
Futures contracts | | | 384,272 | | |
Options purchased | | | (15,980 | ) | |
Securities sold short | | | (1,037,637 | ) | |
Swap contracts | | | (622,687 | ) | |
Total — representing net assets applicable to outstanding capital stock | | $ | 154,380,905 | | |
The accompanying Notes to Consolidated Financial Statements are an integral part of this statement.
Annual Report 2016
35
COLUMBIA DIVERSIFIED ABSOLUTE RETURN FUND
CONSOLIDATED STATEMENT OF ASSETS AND LIABILITIES (continued)
May 31, 2016
Class A | |
Net assets | | $ | 208,601 | | |
Shares outstanding | | | 21,698 | | |
Net asset value per share | | $ | 9.61 | | |
Maximum offering price per share(a) | | $ | 10.20 | | |
Class C | |
Net assets | | $ | 9,539 | | |
Shares outstanding | | | 1,000 | | |
Net asset value per share | | $ | 9.54 | | |
Class I | |
Net assets | | $ | 111,609,607 | | |
Shares outstanding | | | 11,565,049 | | |
Net asset value per share | | $ | 9.65 | | |
Class R4 | |
Net assets | | $ | 9,636 | | |
Shares outstanding | | | 1,000 | | |
Net asset value per share | | $ | 9.64 | | |
Class R5 | |
Net assets | | $ | 9,646 | | |
Shares outstanding | | | 1,000 | | |
Net asset value per share | | $ | 9.65 | | |
Class W | |
Net assets | | $ | 41,795,734 | | |
Shares outstanding | | | 4,345,568 | | |
Net asset value per share | | $ | 9.62 | | |
Class Z | |
Net assets | | $ | 738,142 | | |
Shares outstanding | | | 76,601 | | |
Net asset value per share | | $ | 9.64 | | |
(a) The maximum offering price per share is calculated by dividing the net asset value per share by 1.0 minus the maximum sales charge of 5.75% for Class A.
The accompanying Notes to Consolidated Financial Statements are an integral part of this statement.
Annual Report 2016
36
COLUMBIA DIVERSIFIED ABSOLUTE RETURN FUND
CONSOLIDATED STATEMENT OF OPERATIONS
Year Ended May 31, 2016
Net investment income | |
Income: | |
Dividends — unaffiliated issuers | | $ | 688,948 | | |
Dividends — affiliated issuers | | | 224,255 | | |
Interest | | | 424,522 | | |
Foreign taxes withheld | | | (3,865 | ) | |
Total income | | | 1,333,860 | | |
Expenses: | |
Investment management fees | | | 1,620,956 | | |
Distribution and/or service fees | |
Class A | | | 383 | | |
Class C | | | 98 | | |
Class W | | | 61,508 | | |
Transfer agent fees | |
Class A | | | 895 | | |
Class C | | | 46 | | |
Class R4 | | | 46 | | |
Class R5 | | | 5 | | |
Class W | | | 197,852 | | |
Class Z | | | 3,533 | | |
Compensation of board members | | | 18,502 | | |
Custodian fees | | | 72,811 | | |
Printing and postage fees | | | 52,914 | | |
Registration fees | | | 82,352 | | |
Audit fees | | | 60,693 | | |
Legal fees | | | 3,694 | | |
Dividends and interest on securities sold short | | | 709,577 | | |
Chief compliance officer expenses | | | 68 | | |
Other | | | 99,365 | | |
Total expenses | | | 2,985,298 | | |
Fees waived or expenses reimbursed by Investment Manager and its affiliates | | | (392,299 | ) | |
Total net expenses | | | 2,592,999 | | |
Net investment loss | | | (1,259,139 | ) | |
Realized and unrealized gain (loss) — net | |
Net realized gain (loss) on: | |
Investments | | | (4,075,312 | ) | |
Foreign currency translations | | | 42,310 | | |
Forward foreign currency exchange contracts | | | (325,205 | ) | |
Futures contracts | | | (2,207,628 | ) | |
Securities sold short | | | 3,245,933 | | |
Swap contracts | | | 1,199,130 | | |
Net realized loss | | | (2,120,772 | ) | |
Net change in unrealized appreciation (depreciation) on: | |
Investments | | | 998,875 | | |
Foreign currency translations | | | 7,685 | | |
Forward foreign currency exchange contracts | | | 196,955 | | |
Futures contracts | | | 234,757 | | |
Options purchased | | | (15,980 | ) | |
Securities sold short | | | (912,727 | ) | |
Swap contracts | | | (1,208,807 | ) | |
Net change in unrealized depreciation | | | (699,242 | ) | |
Net realized and unrealized loss | | | (2,820,014 | ) | |
Net decrease in net assets from operations | | $ | (4,079,153 | ) | |
The accompanying Notes to Consolidated Financial Statements are an integral part of this statement.
Annual Report 2016
37
COLUMBIA DIVERSIFIED ABSOLUTE RETURN FUND
CONSOLIDATED STATEMENT OF CHANGES IN NET ASSETS
| | | Year Ended
May 31,
2016 | | Year Ended
May 31,
2015(a) | |
Operations | |
Net investment loss | | $ | (1,259,139 | ) | | $ | (214,038 | ) | |
Net realized gain (loss) | | | (2,120,772 | ) | | | 733,142 | | |
Net change in unrealized appreciation (depreciation) | | | (699,242 | ) | | | 632,745 | | |
Net increase (decrease) in net assets resulting from operations | | | (4,079,153 | ) | | | 1,151,849 | | |
Distributions to shareholders | |
Net investment income | |
Class A | | | (518 | ) | | | — | | |
Class C | | | (9 | ) | | | — | | |
Class I | | | (440,917 | ) | | | — | | |
Class R4 | | | (36 | ) | | | — | | |
Class R5 | | | (36 | ) | | | — | | |
Class W | | | (132,341 | ) | | | — | | |
Class Z | | | (2,746 | ) | | | — | | |
Net realized gains | |
Class A | | | (1,079 | ) | | | — | | |
Class C | | | (61 | ) | | | — | | |
Class I | | | (711,822 | ) | | | — | | |
Class R4 | | | (61 | ) | | | — | | |
Class R5 | | | (61 | ) | | | — | | |
Class W | | | (277,711 | ) | | | — | | |
Class Z | | | (4,640 | ) | | | — | | |
Total distributions to shareholders | | | (1,572,038 | ) | | | — | | |
Increase in net assets from capital stock activity | | | 51,696,990 | | | | 107,113,257 | | |
Total increase in net assets | | | 46,045,799 | | | | 108,265,106 | | |
Net assets at beginning of year | | | 108,335,106 | | | | 70,000 | | |
Net assets at end of year | | $ | 154,380,905 | | | $ | 108,335,106 | | |
Undistributed (excess of distributions over) net investment income | | $ | (903,351 | ) | | $ | 40,247 | | |
(a) Based on operations from February 19, 2015 (commencement of operations) through the stated period end.
The accompanying Notes to Consolidated Financial Statements are an integral part of this statement.
Annual Report 2016
38
COLUMBIA DIVERSIFIED ABSOLUTE RETURN FUND
CONSOLIDATED STATEMENT OF CHANGES IN NET ASSETS (continued)
| | | Year Ended May 31, 2016 | | Year Ended May 31, 2015(a) | |
| | | Shares | | Dollars ($) | | Shares | | Dollars ($) | |
Capital stock activity | |
Class A shares | |
Subscriptions | | | 20,554 | | | | 202,447 | | | | 119 | | | | 1,195 | | |
Distributions reinvested | | | 155 | | | | 1,507 | | | | — | | | | — | | |
Redemptions | | | (130 | ) | | | (1,269 | ) | | | — | | | | — | | |
Net increase | | | 20,579 | | | | 202,685 | | | | 119 | | | | 1,195 | | |
Class I shares | |
Subscriptions | | | 1,630,984 | | | | 15,949,695 | | | | 10,690,962 | | | | 106,932,653 | | |
Distributions reinvested | | | 118,584 | | | | 1,152,640 | | | | — | | | | — | | |
Redemptions | | | (819,583 | ) | | | (7,962,439 | ) | | | (56,898 | ) | | | (576,466 | ) | |
Net increase | | | 929,985 | | | | 9,139,896 | | | | 10,634,064 | | | | 106,356,187 | | |
Class W shares | |
Subscriptions | | | 4,872,747 | | | | 47,428,065 | | | | — | | | | — | | |
Distributions reinvested | | | 42,264 | | | | 409,961 | | | | — | | | | — | | |
Redemptions | | | (570,443 | ) | | | (5,485,481 | ) | | | — | | | | — | | |
Net increase | | | 4,344,568 | | | | 42,352,545 | | | | — | | | | — | | |
Class Z shares | |
Subscriptions | | | 591 | | | | 5,708 | | | | 75,396 | | | | 755,875 | | |
Distributions reinvested | | | 751 | | | | 7,288 | | | | — | | | | — | | |
Redemptions | | | (1,137 | ) | | | (11,132 | ) | | | — | | | | — | | |
Net increase | | | 205 | | | | 1,864 | | | | 75,396 | | | | 755,875 | | |
Total net increase | | | 5,295,337 | | | | 51,696,990 | | | | 10,709,579 | | | | 107,113,257 | | |
(a) Based on operations from February 19, 2015 (commencement of operations) through the stated period end.
The accompanying Notes to Consolidated Financial Statements are an integral part of this statement.
Annual Report 2016
39
COLUMBIA DIVERSIFIED ABSOLUTE RETURN FUND
CONSOLIDATED FINANCIAL HIGHLIGHTS
The following tables are intended to help you understand the Fund's financial performance. Certain information reflects financial results for a single share of a class held for the periods shown. Per share net investment income (loss) amounts are calculated based on average shares outstanding during the period. Total return assumes reinvestment of all dividends and distributions, if any. Total return does not reflect payment of sales charges, if any. Total return and portfolio turnover are not annualized for periods of less than one year. The portfolio turnover rate is calculated without regard to purchase and sales transactions of short-term instruments and certain derivatives, if any. If such transactions were included, the Fund's portfolio turnover rate may be higher.
| | | Year Ended May 31, | |
Class A | | 2016 | | 2015(a) | |
Per share data | |
Net asset value, beginning of period | | $ | 10.10 | | | $ | 10.00 | | |
Income from investment operations: | |
Net investment loss | | | (0.13 | ) | | | (0.03 | ) | |
Net realized and unrealized gain (loss) | | | (0.27 | ) | | | 0.13 | | |
Total from investment operations | | | (0.40 | ) | | | 0.10 | | |
Less distributions to shareholders: | |
Net investment income | | | (0.03 | ) | | | — | | |
Net realized gains | | | (0.06 | ) | | | — | | |
Total distributions to shareholders | | | (0.09 | ) | | | — | | |
Net asset value, end of period | | $ | 9.61 | | | $ | 10.10 | | |
Total return | | | (3.96 | %) | | | 1.00 | % | |
Ratios to average net assets(b) | |
Total gross expenses | | | 3.03 | %(c) | | | 2.11 | %(c)(d) | |
Total net expenses(e) | | | 2.22 | %(c) | | | 1.99 | %(c)(d) | |
Net investment loss | | | (1.31 | %) | | | (1.04 | %)(d) | |
Supplemental data | |
Net assets, end of period (in thousands) | | $ | 209 | | | $ | 11 | | |
Portfolio turnover | | | 196 | % | | | 60 | % | |
Notes to Consolidated Financial Highlights
(a) Based on operations from February 19, 2015 (commencement of operations) through the stated period end.
(b) In addition to the fees and expenses that the Fund bears directly, the Fund indirectly bears a pro rata share of the fees and expenses of any other funds in which it invests. Such indirect expenses are not included in the Fund's reported expense ratios.
(c) Ratios include dividends and interest on securities sold short. If dividends and interest on securities sold short had been excluded, expenses would have been lower by 0.53% and 0.41% the years ended May 31, 2016 and 2015, respectively.
(d) Annualized.
(e) Total net expenses include the impact of certain fee waivers/expense reimbursements made by the Investment Manager and certain of its affiliates, if applicable.
The accompanying Notes to Consolidated Financial Statements are an integral part of this statement.
Annual Report 2016
40
COLUMBIA DIVERSIFIED ABSOLUTE RETURN FUND
CONSOLIDATED FINANCIAL HIGHLIGHTS (continued)
| | | Year Ended May 31, | |
Class C | | 2016 | | 2015(a) | |
Per share data | |
Net asset value, beginning of period | | $ | 10.08 | | | $ | 10.00 | | |
Income from investment operations: | |
Net investment loss | | | (0.19 | ) | | | (0.05 | ) | |
Net realized and unrealized gain (loss) | | | (0.28 | ) | | | 0.13 | | |
Total from investment operations | | | (0.47 | ) | | | 0.08 | | |
Less distributions to shareholders: | |
Net investment income | | | (0.01 | ) | | | — | | |
Net realized gains | | | (0.06 | ) | | | — | | |
Total distributions to shareholders | | | (0.07 | ) | | | — | | |
Net asset value, end of period | | $ | 9.54 | | | $ | 10.08 | | |
Total return | | | (4.68 | %) | | | 0.80 | % | |
Ratios to average net assets(b) | |
Total gross expenses | | | 3.78 | %(c) | | | 2.89 | %(c)(d) | |
Total net expenses(e) | | | 2.97 | %(c) | | | 2.75 | %(c)(d) | |
Net investment loss | | | (2.00 | %) | | | (1.80 | %)(d) | |
Supplemental data | |
Net assets, end of period (in thousands) | | $ | 10 | | | $ | 10 | | |
Portfolio turnover | | | 196 | % | | | 60 | % | |
Notes to Consolidated Financial Highlights
(a) Based on operations from February 19, 2015 (commencement of operations) through the stated period end.
(b) In addition to the fees and expenses that the Fund bears directly, the Fund indirectly bears a pro rata share of the fees and expenses of any other funds in which it invests. Such indirect expenses are not included in the Fund's reported expense ratios.
(c) Ratios include dividends and interest on securities sold short. If dividends and interest on securities sold short had been excluded, expenses would have been lower by 0.50% and 0.42% for the years ended May 31, 2016 and 2015, respectively.
(d) Annualized.
(e) Total net expenses include the impact of certain fee waivers/expense reimbursements made by the Investment Manager and certain of its affiliates, if applicable.
The accompanying Notes to Consolidated Financial Statements are an integral part of this statement.
Annual Report 2016
41
COLUMBIA DIVERSIFIED ABSOLUTE RETURN FUND
CONSOLIDATED FINANCIAL HIGHLIGHTS (continued)
| | | Year Ended May 31, | |
Class I | | 2016 | | 2015(a) | |
Per share data | |
Net asset value, beginning of period | | $ | 10.11 | | | $ | 10.00 | | |
Income from investment operations: | |
Net investment loss | | | (0.08 | ) | | | (0.02 | ) | |
Net realized and unrealized gain (loss) | | | (0.28 | ) | | | 0.13 | | |
Total from investment operations | | | (0.36 | ) | | | 0.11 | | |
Less distributions to shareholders: | |
Net investment income | | | (0.04 | ) | | | — | | |
Net realized gains | | | (0.06 | ) | | | — | | |
Total distributions to shareholders | | | (0.10 | ) | | | — | | |
Net asset value, end of period | | $ | 9.65 | | | $ | 10.11 | | |
Total return | | | (3.58 | %) | | | 1.10 | % | |
Ratios to average net assets(b) | |
Total gross expenses | | | 1.97 | %(c) | | | 1.84 | %(c)(d) | |
Total net expenses(e) | | | 1.80 | %(c) | | | 1.69 | %(c)(d) | |
Net investment loss | | | (0.83 | %) | | | (0.74 | %)(d) | |
Supplemental data | |
Net assets, end of period (in thousands) | | $ | 111,610 | | | $ | 107,511 | | |
Portfolio turnover | | | 196 | % | | | 60 | % | |
Notes to Consolidated Financial Highlights
(a) Based on operations from February 19, 2015 (commencement of operations) through the stated period end.
(b) In addition to the fees and expenses that the Fund bears directly, the Fund indirectly bears a pro rata share of the fees and expenses of any other funds in which it invests. Such indirect expenses are not included in the Fund's reported expense ratios.
(c) Ratios include dividends and interest on securities sold short. If dividends and interest on securities sold short had been excluded, expenses would have been lower by 0.50% and 0.42% for the years ended May 31, 2016 and 2015, respectively.
(d) Annualized.
(e) Total net expenses include the impact of certain fee waivers/expense reimbursements made by the Investment Manager and certain of its affiliates, if applicable.
The accompanying Notes to Consolidated Financial Statements are an integral part of this statement.
Annual Report 2016
42
COLUMBIA DIVERSIFIED ABSOLUTE RETURN FUND
CONSOLIDATED FINANCIAL HIGHLIGHTS (continued)
| | | Year Ended May 31, | |
Class R4 | | 2016 | | 2015(a) | |
Per share data | |
Net asset value, beginning of period | | $ | 10.11 | | | $ | 10.00 | | |
Income from investment operations: | |
Net investment loss | | | (0.09 | ) | | | (0.02 | ) | |
Net realized and unrealized gain (loss) | | | (0.28 | ) | | | 0.13 | | |
Total from investment operations | | | (0.37 | ) | | | 0.11 | | |
Less distributions to shareholders: | |
Net investment income | | | (0.04 | ) | | | — | | |
Net realized gains | | | (0.06 | ) | | | — | | |
Total distributions to shareholders | | | (0.10 | ) | | | — | | |
Net asset value, end of period | | $ | 9.64 | | | $ | 10.11 | | |
Total return | | | (3.69 | %) | | | 1.10 | % | |
Ratios to average net assets(b) | |
Total gross expenses | | | 2.77 | %(c) | | | 1.89 | %(c)(d) | |
Total net expenses(e) | | | 1.97 | %(c) | | | 1.74 | %(c)(d) | |
Net investment loss | | | (0.99 | %) | | | (0.79 | %)(d) | |
Supplemental data | |
Net assets, end of period (in thousands) | | $ | 10 | | | $ | 10 | | |
Portfolio turnover | | | 196 | % | | | 60 | % | |
Notes to Consolidated Financial Highlights
(a) Based on operations from February 19, 2015 (commencement of operations) through the stated period end.
(b) In addition to the fees and expenses that the Fund bears directly, the Fund indirectly bears a pro rata share of the fees and expenses of any other funds in which it invests. Such indirect expenses are not included in the Fund's reported expense ratios.
(c) Ratios include dividends and interest on securities sold short. If dividends and interest on securities sold short had been excluded, expenses would have been lower by 0.50% and 0.42% for the years ended May 31, 2016 and 2015, respectively.
(d) Annualized.
(e) Total net expenses include the impact of certain fee waivers/expense reimbursements made by the Investment Manager and certain of its affiliates, if applicable.
The accompanying Notes to Consolidated Financial Statements are an integral part of this statement.
Annual Report 2016
43
COLUMBIA DIVERSIFIED ABSOLUTE RETURN FUND
CONSOLIDATED FINANCIAL HIGHLIGHTS (continued)
| | | Year Ended May 31, | |
Class R5 | | 2016 | | 2015(a) | |
Per share data | |
Net asset value, beginning of period | | $ | 10.11 | | | $ | 10.00 | | |
Income from investment operations: | |
Net investment loss | | | (0.09 | ) | | | (0.02 | ) | |
Net realized and unrealized gain (loss) | | | (0.27 | ) | | | 0.13 | | |
Total from investment operations | | | (0.36 | ) | | | 0.11 | | |
Less distributions to shareholders: | |
Net investment income | | | (0.04 | ) | | | — | | |
Net realized gains | | | (0.06 | ) | | | — | | |
Total distributions to shareholders | | | (0.10 | ) | | | — | | |
Net asset value, end of period | | $ | 9.65 | | | $ | 10.11 | | |
Total return | | | (3.59 | %) | | | 1.10 | % | |
Ratios to average net assets(b) | |
Total gross expenses | | | 2.02 | %(c) | | | 1.89 | %(c)(d) | |
Total net expenses(e) | | | 1.85 | %(c) | | | 1.74 | %(c)(d) | |
Net investment loss | | | (0.88 | %) | | | (0.80 | %)(d) | |
Supplemental data | |
Net assets, end of period (in thousands) | | $ | 10 | | | $ | 10 | | |
Portfolio turnover | | | 196 | % | | | 60 | % | |
Notes to Consolidated Financial Highlights
(a) Based on operations from February 19, 2015 (commencement of operations) through the stated period end.
(b) In addition to the fees and expenses that the Fund bears directly, the Fund indirectly bears a pro rata share of the fees and expenses of any other funds in which it invests. Such indirect expenses are not included in the Fund's reported expense ratios.
(c) Ratios include dividends and interest on securities sold short. If dividends and interest on securities sold short had been excluded, expenses would have been lower by 0.50% and 0.42% for the years ended May 31, 2016 and 2015, respectively.
(d) Annualized.
(e) Total net expenses include the impact of certain fee waivers/expense reimbursements made by the Investment Manager and certain of its affiliates, if applicable.
The accompanying Notes to Consolidated Financial Statements are an integral part of this statement.
Annual Report 2016
44
COLUMBIA DIVERSIFIED ABSOLUTE RETURN FUND
CONSOLIDATED FINANCIAL HIGHLIGHTS (continued)
| | | Year Ended May 31, | |
Class W | | 2016 | | 2015(a) | |
Per share data | |
Net asset value, beginning of period | | $ | 10.10 | | | $ | 10.00 | | |
Income from investment operations: | |
Net investment loss | | | (0.13 | ) | | | (0.03 | ) | |
Net realized and unrealized gain (loss) | | | (0.26 | ) | | | 0.13 | | |
Total from investment operations | | | (0.39 | ) | | | 0.10 | | |
Less distributions to shareholders: | |
Net investment income | | | (0.03 | ) | | | — | | |
Net realized gains | | | (0.06 | ) | | | — | | |
Total distributions to shareholders | | | (0.09 | ) | | | — | | |
Net asset value, end of period | | $ | 9.62 | | | $ | 10.10 | | |
Total return | | | (3.87 | %) | | | 1.00 | % | |
Ratios to average net assets(b) | |
Total gross expenses | | | 3.03 | %(c) | | | 2.14 | %(c)(d) | |
Total net expenses(e) | | | 2.22 | %(c) | | | 2.00 | %(c)(d) | |
Net investment loss | | | (1.24 | %) | | | (1.05 | %)(d) | |
Supplemental data | |
Net assets, end of period (in thousands) | | $ | 41,796 | | | $ | 10 | | |
Portfolio turnover | | | 196 | % | | | 60 | % | |
Notes to Consolidated Financial Highlights
(a) Based on operations from February 19, 2015 (commencement of operations) through the stated period end.
(b) In addition to the fees and expenses that the Fund bears directly, the Fund indirectly bears a pro rata share of the fees and expenses of any other funds in which it invests. Such indirect expenses are not included in the Fund's reported expense ratios.
(c) Ratios include dividends and interest on securities sold short. If dividends and interest on securities sold short had been excluded, expenses would have been lower by 0.60% and 0.42% for the years ended May 31, 2016 and 2015, respectively.
(d) Annualized.
(e) Total net expenses include the impact of certain fee waivers/expense reimbursements made by the Investment Manager and certain of its affiliates, if applicable.
The accompanying Notes to Consolidated Financial Statements are an integral part of this statement.
Annual Report 2016
45
COLUMBIA DIVERSIFIED ABSOLUTE RETURN FUND
CONSOLIDATED FINANCIAL HIGHLIGHTS (continued)
| | | Year Ended May 31, | |
Class Z | | 2016 | | 2015(a) | |
Per share data | |
Net asset value, beginning of period | | $ | 10.11 | | | $ | 10.00 | | |
Income from investment operations: | |
Net investment loss | | | (0.10 | ) | | | (0.02 | ) | |
Net realized and unrealized gain (loss) | | | (0.27 | ) | | | 0.13 | | |
Total from investment operations | | | (0.37 | ) | | | 0.11 | | |
Less distributions to shareholders: | |
Net investment income | | | (0.04 | ) | | | — | | |
Net realized gains | | | (0.06 | ) | | | — | | |
Total distributions to shareholders | | | (0.10 | ) | | | — | | |
Net asset value, end of period | | $ | 9.64 | | | $ | 10.11 | | |
Total return | | | (3.69 | %) | | | 1.10 | % | |
Ratios to average net assets(b) | |
Total gross expenses | | | 2.77 | %(c) | | | 1.91 | %(c)(d) | |
Total net expenses(e) | | | 1.97 | %(c) | | | 1.75 | %(c)(d) | |
Net investment loss | | | (0.99 | %) | | | (0.74 | %)(d) | |
Supplemental data | |
Net assets, end of period (in thousands) | | $ | 738 | | | $ | 772 | | |
Portfolio turnover | | | 196 | % | | | 60 | % | |
Notes to Consolidated Financial Highlights
(a) Based on operations from February 19, 2015 (commencement of operations) through the stated period end.
(b) In addition to the fees and expenses that the Fund bears directly, the Fund indirectly bears a pro rata share of the fees and expenses of any other funds in which it invests. Such indirect expenses are not included in the Fund's reported expense ratios.
(c) Ratios include dividends and interest on securities sold short. If dividends and interest on securities sold short had been excluded, expenses would have been lower by 0.50% and 0.44% for the years ended May 31, 2016 and 2015, respectively.
(d) Annualized.
(e) Total net expenses include the impact of certain fee waivers/expense reimbursements made by the Investment Manager and certain of its affiliates, if applicable.
The accompanying Notes to Consolidated Financial Statements are an integral part of this statement.
Annual Report 2016
46
COLUMBIA DIVERSIFIED ABSOLUTE RETURN FUND
NOTES TO CONSOLIDATED FINANCIAL STATEMENTS
May 31, 2016
Note 1. Organization
Columbia Diversified Absolute Return Fund (the Fund), a series of Columbia Funds Series Trust I (the Trust), is a diversified fund. The Trust is registered under the Investment Company Act of 1940, as amended (the 1940 Act), as an open-end management investment company organized as a Massachusetts business trust.
Basis for Consolidation (Columbia Diversified Absolute Return Fund)
CDARF1 Offshore Fund, Ltd., CDARF2 Offshore Fund, Ltd. and CDARF3 Offshore Fund, Ltd. (each, a Subsidiary) are each a Cayman Islands exempted company and wholly-owned subsidiary of the Fund. Each Subsidiary acts as an investment vehicle in order to effect certain investment strategies consistent with the Fund's investment objective and policies as stated in its current prospectus and statement of additional information. In accordance with the Memorandum and Articles of Association of the Subsidiary (the Articles), the Fund owns the sole issued share of each Subsidiary and retains all rights associated with such share, including the right to receive notice of, attend and vote at general meetings of the Subsidiaries, rights in a winding-up or repayment of capital and the right to participate in the profits or assets of the Subsidiaries. The consolidated financial statements (financial statements) include the accounts of the consolidated Fund and each respective Subsidiary. Subsequent references to the Fund within the Notes to Consolidated Financial Statements collectively refer to the Fund and each Subsidiary. All intercompany transactions and balances have been eliminated in the consolidation process.
At May 31, 2016, each Subsidiary financial statement information is as follows:
| | | CDARF1
Offshore
Fund, Ltd. | | CDARF2
Offshore
Fund, Ltd. | | CDARF3
Offshore
Fund, Ltd. | |
% of consolidated fund
net assets | | | 0.16
| % | | | 2.19
| % | | | 5.95
| % | |
Net assets | | $ | 244,031 | | | $ | 3,373,687 | | | $ | 9,180,353 | | |
Net investment income (loss) | | | (14,838 | ) | | | (28,118 | ) | | | (72,609 | ) | |
Net realized gain (loss) | | | (83,224 | ) | | | (26,201 | ) | | | 1,291,408 | | |
Net change in unrealized
appreciation (depreciation) | | | (9
| ) | | | 206,363
| | | | (1,052,350
| ) | |
The consolidated financial statements present the portfolio holdings, financial position and results of operations of the Fund and the Subsidiaries on a consolidated basis.
Fund Shares
The Trust may issue an unlimited number of shares (without par value). The Fund offers Class A, Class C, Class I, Class R4, Class R5, Class W and Class Z shares. Although all share classes generally have identical voting, dividend and liquidation rights, each share class votes separately when required by the Trust's organizational documents or by law. Different share classes pay different distribution amounts to the extent the expenses of such share classes differ, and distributions in liquidation will be proportional to the net asset value of each share class. Each share class has its own expense and sales charge structure.
Class A shares are subject to a maximum front-end sales charge of 5.75% based on the initial investment amount. Class A shares purchased without an initial sales charge in accounts aggregating $1 million to $50 million at the time of purchase are subject to a contingent deferred sales charge (CDSC) if the shares are sold within 18 months after purchase, charged as follows: 1.00% CDSC if redeemed within 12 months after purchase, and 0.50% CDSC if redeemed more than 12, but less than 18, months after purchase.
Class C shares are subject to a 1.00% CDSC on shares redeemed within 12 months after purchase.
Class I shares are not subject to sales charges and are available only to the Columbia Family of Funds.
Class R4 shares are not subject to sales charges and are generally available only to omnibus retirement plans and certain investors as described in the Fund's prospectus.
Class R5 shares are not subject to sales charges and are generally available only to investors purchasing through authorized investment professionals and omnibus retirement plans.
Class W shares are not subject to sales charges and are available only to investors purchasing through authorized investment programs managed by investment professionals, including discretionary managed account programs.
Class Z shares are not subject to sales charges and are available only to eligible investors, which are subject to different investment minimums as described in the Fund's prospectus.
Note 2. Summary of Significant Accounting Policies
Basis of Preparation
The Fund is an investment company that applies the accounting and reporting guidance in the Financial
Annual Report 2016
47
COLUMBIA DIVERSIFIED ABSOLUTE RETURN FUND
NOTES TO CONSOLIDATED FINANCIAL STATEMENTS (continued)
May 31, 2016
Accounting Standards Board (FASB) Accounting Standards Codification Topic 946, Financial Services — Investment Companies (ASC 946). The financial statements are prepared in accordance with U.S. generally accepted accounting principles (GAAP), which requires management to make certain estimates and assumptions that affect the reported amounts of assets and liabilities, the disclosure of contingent assets and liabilities at the date of the financial statements and the reported amounts of income and expenses during the reporting period. Actual results could differ from those estimates.
The following is a summary of significant accounting policies followed by the Fund in the preparation of its financial statements.
Security Valuation
All equity securities and exchange-traded funds are valued at the close of business of the New York Stock Exchange (NYSE). Equity securities and exchange-traded funds are valued at the last quoted sales price on the principal exchange or market on which they trade, except for securities traded on the NASDAQ Stock Market, which are valued at the NASDAQ official close price. Unlisted securities or listed securities for which there were no sales during the day are valued at the mean of the latest quoted bid and ask prices on such exchanges or markets.
Debt securities generally are valued by pricing services approved by the Board of Trustees (the Board) based upon market transactions for normal, institutional-size trading units of similar securities. The services may use various pricing techniques that take into account, as applicable, factors such as yield, quality, coupon rate, maturity, type of issue, trading characteristics and other data, as well as broker quotes. Debt securities for which quotations are not readily available or not believed to be reflective of market value may also be valued based upon a bid quote from an approved independent broker-dealer. Debt securities maturing in 60 days or less are valued primarily at amortized cost value, unless this method results in a valuation that management believes does not approximate market value.
Foreign equity securities are valued based on the closing price on the foreign exchange in which such securities are primarily traded. If any foreign equity security closing prices are not readily available, the securities are valued at the mean of the latest quoted bid and ask prices on such exchanges or markets. Foreign currency exchange rates are generally determined at 4:00 p.m. Eastern (U.S.) time. Many securities markets and exchanges outside the U.S. close prior to the close of the NYSE; therefore, the closing prices for securities in such
markets or on such exchanges may not fully reflect events that occur after such close but before the close of the NYSE. In those situations, foreign securities will be fair valued pursuant to a policy adopted by the Board, including, if available, utilizing a third party pricing service to determine these fair values. The third party pricing service takes into account multiple factors, including, but not limited to, movements in the U.S. securities markets, certain depositary receipts, futures contracts and foreign exchange rates that have occurred subsequent to the close of the foreign exchange or market, to determine a good faith estimate that reasonably reflects the current market conditions as of the close of the NYSE. The fair value of a security is likely to be different from the quoted or published price, if available.
Asset- and mortgage-backed securities are generally valued by pricing services, which utilize pricing models that incorporate the securities' cash flow and loan performance data. These models also take into account available market data, including trades, market quotations, and benchmark yield curves for identical or similar securities. Factors used to identify similar securities may include, but are not limited to, issuer, collateral type, vintage, prepayment speeds, collateral performance, credit ratings, credit enhancement and expected life. Asset-backed securities for which quotations are readily available may also be valued based upon an over-the-counter or exchange bid quote from an approved independent broker-dealer.
Investments in open-end investment companies, including money market funds, are valued at their latest net asset value.
Forward foreign currency exchange contracts are marked-to-market based upon foreign currency exchange rates provided by a pricing service.
Futures and options on futures contracts are valued based upon the settlement price at the close of regular trading on their principal exchanges or, in the absence of transactions, at the mean of the latest quoted bid and ask prices.
Option contracts are valued at the mean of the latest quoted bid and ask prices on their primary exchanges. Option contracts, including over-the-counter option contracts, with no readily available market quotations are valued using quotes obtained from independent brokers as of the close of the NYSE.
Swap transactions are valued through an independent pricing service or broker, or if neither is available, through an internal model based upon observable inputs.
Annual Report 2016
48
COLUMBIA DIVERSIFIED ABSOLUTE RETURN FUND
NOTES TO CONSOLIDATED FINANCIAL STATEMENTS (continued)
May 31, 2016
Investments for which market quotations are not readily available, or that have quotations which management believes are not reflective of market value or reliable, are valued at fair value as determined in good faith under procedures approved by and under the general supervision of the Board. If a security or class of securities (such as foreign securities) is valued at fair value, such value is likely to be different from the quoted or published price for the security.
The determination of fair value often requires significant judgment. To determine fair value, management may use assumptions including but not limited to future cash flows and estimated risk premiums. Multiple inputs from various sources may be used to determine fair value.
GAAP requires disclosure regarding the inputs and valuation techniques used to measure fair value and any changes in valuation inputs or techniques. In addition, investments shall be disclosed by major category. This information is disclosed following the Fund's Consolidated Portfolio of Investments.
Foreign Currency Transactions and Translations
The values of all assets and liabilities denominated in foreign currencies are generally translated into U.S. dollars at exchange rates determined at the close of the NYSE on any given day. Net realized and unrealized gains (losses) on foreign currency transactions and translations include gains (losses) arising from the fluctuation in exchange rates between trade and settlement dates on securities transactions, gains (losses) arising from the disposition of foreign currency and currency gains (losses) between the accrual and payment dates on dividends, interest income and foreign withholding taxes.
For financial statement purposes, the Fund does not distinguish that portion of gains (losses) on investments which is due to changes in foreign exchange rates from that which is due to changes in market prices of the investments. Such fluctuations are included with the net realized and unrealized gains (losses) on investments in the Consolidated Statement of Operations.
Derivative Instruments
The Fund invests in certain derivative instruments, as detailed below, to meet its investment objectives. Derivatives are instruments whose values depend on, or are derived from, in whole or in part, the value of one or more securities, currencies, commodities, indices, or other assets or instruments. Derivatives may be used to increase investment flexibility (including to maintain cash reserves while maintaining desired exposure to certain
assets), for risk management (hedging) purposes, to facilitate trading, to reduce transaction costs and to pursue higher investment returns. The Fund may also use derivative instruments to mitigate certain investment risks, such as foreign currency exchange rate risk, interest rate risk and credit risk. Derivatives may involve various risks, including the potential inability of the counterparty to fulfill its obligation under the terms of the contract, the potential for an illiquid secondary market (making it difficult for the Fund to sell, including at favorable prices) and the potential for market movements which may expose the Fund to gains or losses in excess of the amount shown in the Consolidated Statement of Assets and Liabilities. The notional amounts of derivative instruments, if applicable, are not recorded in the financial statements.
A derivative instrument may suffer a marked-to-market loss if the value of the contract decreases due to an unfavorable change in the market rates or values of the underlying instrument. Losses can also occur if the counterparty does not perform under the contract. The Fund's risk of loss from counterparty credit risk on over-the-counter derivatives is generally limited to the aggregate unrealized gain netted against any collateral held by the Fund and the amount of any variation margin held by the counterparty. With exchange-traded or centrally cleared derivatives, there is reduced counterparty credit risk to the Fund since the exchange's clearinghouse, as counterparty to such instruments, guarantees against a possible default. The clearinghouse stands between the buyer and the seller of the contract; therefore, the counterparty credit risk is failure of the clearinghouse. However, credit risk still exists in exchange-traded or centrally cleared derivatives with respect to initial and variation margin that is held in a broker's customer account. While brokers are required to segregate customer margin from their own assets, in the event that a broker becomes insolvent or goes into bankruptcy and at that time there is a shortfall in the aggregate amount of margin held by the broker for all its clients, U.S. bankruptcy laws will typically allocate that shortfall on a pro-rata basis across all the broker's customers (including the Fund), potentially resulting in losses to the Fund.
In order to better define its contractual rights and to secure rights that will help the Fund mitigate its counterparty risk, the Fund may enter into an International Swaps and Derivatives Association, Inc. Master Agreement (ISDA Master Agreement) or similar agreement with its derivatives contract counterparties. An ISDA Master Agreement is an agreement between the Fund and a counterparty that governs over-the-counter derivatives and forward foreign currency exchange
Annual Report 2016
49
COLUMBIA DIVERSIFIED ABSOLUTE RETURN FUND
NOTES TO CONSOLIDATED FINANCIAL STATEMENTS (continued)
May 31, 2016
contracts and typically contains, among other things, collateral posting terms and netting provisions in the event of a default and/or termination event. Under an ISDA Master Agreement, the Fund may, under certain circumstances, offset with the counterparty certain derivative instrument's payables and/or receivables with collateral held and/or posted and create one single net payment. The provisions of the ISDA Master Agreement typically permit a single net payment in the event of default (close-out netting) including the bankruptcy or insolvency of the counterparty. Note, however, that bankruptcy or insolvency laws of a particular jurisdiction may impose restrictions on or prohibitions against the right of offset in bankruptcy, insolvency or other events.
Collateral (margin) requirements differ by type of derivative. Margin requirements are established by the exchange or clearinghouse for exchange-traded and centrally cleared derivatives. Brokers can ask for margin in excess of the minimum in certain circumstances. Collateral terms are contract specific for over-the-counter derivatives. For over-the-counter derivatives traded under an ISDA Master Agreement, the collateral requirements are typically calculated by netting the marked-to-market amount for each transaction under such agreement and comparing that amount to the value of any variation margin currently pledged by the Fund and/or the counterparty. Generally, the amount of collateral due from or to a party has to exceed a minimum transfer amount threshold (e.g., $500,000) before a transfer has to be made. To the extent amounts due to the Fund from its counterparties are not fully collateralized, contractually or otherwise, the Fund bears the risk of loss from counterparty nonperformance. The Fund attempts to mitigate counterparty risk by only entering into agreements with counterparties that it believes have the financial resources to honor their obligations and by monitoring the financial stability of those counterparties.
Certain ISDA Master Agreements allow counterparties to over-the-counter derivatives transactions to terminate derivatives contracts prior to maturity in the event the Fund's net asset value declines by a stated percentage over a specified time period or if the Fund fails to meet certain terms of the ISDA Master Agreement, which would cause the Fund to accelerate payment of any net liability owed to the counterparty. The Fund also has termination rights if the counterparty fails to meet certain terms of the ISDA Master Agreement. In addition to considering counterparty credit risk, the Fund would consider terminating the derivatives contracts based on whether termination would result in a net liability owed from the counterparty.
For financial reporting purposes, the Fund does not offset derivative assets and derivative liabilities that are subject to netting arrangements in the Consolidated Statement of Assets and Liabilities.
Forward Foreign Currency Exchange Contracts
Forward foreign currency exchange contracts are over-the-counter agreements between two parties to buy and sell a currency at a set price on a future date. The Fund utilized forward foreign currency exchange contracts to hedge the currency exposure associated with some or all of the Fund's securities, to shift foreign currency exposure back to U.S. dollars, to shift investment exposure from one currency to another, to shift U.S. dollar exposure to achieve a representative weighted mix of major currencies in its benchmark and/or to recover an underweight country exposure in its portfolio, to generate total return through long and short currency positions versus the U.S. dollar. These instruments may be used for other purposes in future periods.
The values of forward foreign currency exchange contracts fluctuate daily with changes in foreign currency exchange rates. Changes in the value of these contracts are recorded as unrealized appreciation or depreciation until the contract is exercised or has expired. The Fund will realize a gain or loss when the forward foreign currency exchange contract is closed or expires.
The use of forward foreign currency exchange contracts does not eliminate fluctuations in the prices of the Fund's portfolio securities. The risks of forward foreign currency exchange contracts include movement in the values of the foreign currencies relative to the U.S. dollar (or other foreign currencies) and the possibility that counterparties will not complete their contractual obligations, which may be in excess of the amount reflected, if any, in the Consolidated Statement of Assets and Liabilities.
Futures Contracts
Futures contracts are exchange traded and represent commitments for the future purchase or sale of an asset at a specified price on a specified date. The Fund bought and sold futures contracts to produce incremental earnings, to manage the duration and yield curve exposure of the Fund versus the benchmark, to manage exposure to movements in interest rates, to manage exposure to the securities market and maintain appropriate equity market exposure while keeping sufficient cash to accommodate daily redemptions. These instruments may be used for other purposes in future periods. Upon entering into futures contracts, the Fund bears risks that it may not achieve the anticipated
Annual Report 2016
50
COLUMBIA DIVERSIFIED ABSOLUTE RETURN FUND
NOTES TO CONSOLIDATED FINANCIAL STATEMENTS (continued)
May 31, 2016
benefits of the futures contracts and may realize a loss. Additional risks include counterparty credit risk, the possibility of an illiquid market, and that a change in the value of the contract or option may not correlate with changes in the value of the underlying asset.
Upon entering into a futures contract, the Fund pledges cash or securities with the broker in an amount sufficient to meet the initial margin requirement. The initial margin deposit must be maintained at an established level over the life of the contract. Cash deposited as initial margin is recorded in the Consolidated Statement of Assets and Liabilities as margin deposits. Securities deposited as initial margin are designated in the Consolidated Portfolio of Investments. Subsequent payments (variation margin) are made or received by the Fund each day. The variation margin payments are equal to the daily change in the contract value and are recorded as variation margin receivable or payable and are offset in unrealized gains or losses. The Fund recognizes a realized gain or loss when the contract is closed or expires. Futures contracts involve, to varying degrees, risk of loss in excess of the variation margin disclosed in the Consolidated Statement of Assets and Liabilities.
Options Contracts
Options are contracts which entitle the holder to purchase or sell securities or other identified assets at a specified price, or in the case of index option contracts, to receive or pay the difference between the index value and the strike price of the index option contract. Option contracts can be either exchange-traded or over-the-counter. The Fund purchased and wrote option contracts to produce incremental earnings, to decrease the Fund's exposure to equity market risk and to increase return on investments, to protect gains, to manage exposure to fluctuations in interest rates and to hedge the fair value of other Fund investments. These instruments may be used for other purposes in future periods. Completion of transactions for option contracts traded in the over-the-counter market depends upon the performance of the other party. Cash collateral may be collected or posted by the Fund to secure certain over-the-counter option contract trades. Cash collateral held or posted by the Fund for such option contract trades must be returned to the counterparty or the Fund upon closure, exercise or expiration of the contract.
Options contracts purchased are recorded as investments. When the Fund writes an options contract, the premium received is recorded as an asset and an amount equivalent to the premium is recorded as a liability in the Consolidated Statement of Assets and Liabilities and is
subsequently adjusted to reflect the current fair value of the option written. Changes in the fair value of the written option are recorded as unrealized appreciation or depreciation until the contract is exercised or has expired. The Fund will realize a gain or loss when the option contract is closed or expires. When option contracts are exercised, the proceeds on sales for a written call or purchased put option contract, or the purchase cost for a written put or purchased call option contract, is adjusted by the amount of premium received or paid.
For over-the-counter options purchased, the Fund bears the risk of loss of the amount of the premiums paid plus the positive change in market values net of any collateral held by the Fund should the counterparty fail to perform under the contracts. Option contracts written by the Fund do not typically give rise to counterparty credit risk, as options written generally obligate the Fund and not the counterparty to perform. The risk in writing a call option contract is that the Fund gives up the opportunity for profit if the market price of the security increases above the strike price and the option contract is exercised. The risk in writing a put option contract is that the Fund may incur a loss if the market price of the security decreases below the strike price and the option contract is exercised. Exercise of a written option could result in the Fund purchasing or selling a security or foreign currency when it otherwise would not, or at a price different from the current market value. In purchasing and writing options, the Fund bears the risk of an unfavorable change in the value of the underlying instrument or the risk that the Fund may not be able to enter into a closing transaction due to an illiquid market.
Interest Rate Swaption Contracts
Interest rate swaption contracts entered into by the Fund typically represent an option that gives the purchaser the right, but not the obligation, to enter into an interest rate swap contract on a future date. Each interest rate swaption agreement will specify if the buyer is entitled to receive the fixed or floating rate if the interest rate is exercised. Changes in the value of a purchased interest rate swaption contracts are reported as unrealized appreciation or depreciation on options in the Consolidated Statement of Assets and Liabilities. Gain or loss is recognized in the Consolidated Statement of Operations when the interest rate swaption contract is closed or expires.
When the Fund writes an interest rate swaption contract, the premium received is recorded as an asset and an amount equivalent to the premium is recorded as a liability
Annual Report 2016
51
COLUMBIA DIVERSIFIED ABSOLUTE RETURN FUND
NOTES TO CONSOLIDATED FINANCIAL STATEMENTS (continued)
May 31, 2016
in the Consolidated Statement of Assets and Liabilities and is subsequently adjusted to reflect the current fair value of the interest rate swaption contract written. Premiums received from writing interest rate swaption contracts that expire unexercised are recorded by the Fund on the expiration date as realized gains from options written in the Consolidated Statement of Operations. The difference between the premium and the amount paid on effecting a closing purchase transaction, including brokerage commissions, is also recorded as realized gain, or if the premium is less than the amount paid for the closing purchase, as realized loss. These amounts are reflected as net realized gain (loss) on options written in the Consolidated Statement of Operations.
Swap Contracts
Swap contracts are negotiated in the over-the-counter market and may be entered into as a bilateral contract or centrally cleared (centrally cleared swap contract). In a centrally cleared swap contract, immediately following execution of the swap contract with a broker, the swap contract is novated to a central counterparty (the CCP) and the CCP becomes the Fund's counterparty to the centrally cleared swap contract. The Fund is required to deposit initial margin with the broker in the form of cash or securities in an amount that varies depending on the size and risk profile of the particular swap contract. Securities deposited as initial margin are designated in the Consolidated Portfolio of Investments and cash deposited is recorded in the Consolidated Statement of Assets and Liabilities as margin deposits. Unlike a bilateral swap contract, for centrally cleared swap contracts, the Fund has minimal credit exposure to the counterparty because the CCP stands between the Fund and the counterparty. Swap contracts are marked-to-market daily and changes in value are recorded as unrealized appreciation (depreciation). The daily change in valuation of centrally cleared swap contracts, if any, is recorded as a receivable or payable for variation margin in the Consolidated Statement of Assets and Liabilities.
Credit Default Swap Contracts
The Fund entered into credit default swap contracts to manage credit risk exposure, to increase or decrease its credit exposure to an index, to increase or decrease its credit exposure to a single issuer of debt securities, to increase or decrease its credit exposure to a specific debt security or a basket of debt securities as a protection buyer to reduce overall credit exposure. These instruments may be used for other purposes in future periods. Credit default swap contracts are agreements in which one party pays fixed periodic payments to a
counterparty in consideration for a guarantee from the counterparty to make a specific payment should a specified credit event(s) take place. Although specified credit events are contract specific, credit events are generally defined as bankruptcy, failure to pay, restructuring, obligation acceleration, obligation default, or repudiation/moratorium.
As the purchaser of a credit default swap contract, the Fund purchases protection by paying a periodic interest rate on the notional amount to the counterparty. The interest amount is accrued daily as a component of unrealized appreciation (depreciation) and is recorded as a realized loss upon payment. If a credit event as specified in the contract occurs, the Fund may have the option either to deliver the reference obligation to the seller in exchange for a cash payment of its par amount, or to receive a net cash settlement equal to the par amount less an agreed-upon value of the reference obligation as of the date of the credit event. The difference between the value of the obligation or cash delivered and the notional amount received will be recorded as a realized gain (loss).
As the seller of a credit default swap contract, the Fund sells protection to a buyer and will generally receive a periodic interest rate on the notional amount. The interest amount is accrued daily as a component of unrealized appreciation (depreciation) and is recorded as a realized gain upon receipt of the payment. If a credit event as specified in the contract with the counterparty occurs, the Fund may either be required to accept the reference obligation from the buyer in exchange for a cash payment of its notional amount, or to pay the buyer a net cash settlement equal to the notional amount less an agreed-upon value of the reference obligation (recovery value) as of the date of the credit event. The difference between the value of the obligation or cash received and the notional amount paid will be recorded as a realized gain (loss). The maximum potential amount of undiscounted future payments the Fund could be required to make as the seller of protection under a credit default swap contract is equal to the notional amount of the reference obligation. These potential amounts may be partially offset by any recovery values of the respective reference obligations or premiums received upon entering into the agreement. The notional amounts and market values of all credit default swap contracts in which the Fund is the seller of protection, if any, are disclosed in the Credit Default Swap Contracts Outstanding schedule following the Consolidated Portfolio of Investments.
Annual Report 2016
52
COLUMBIA DIVERSIFIED ABSOLUTE RETURN FUND
NOTES TO CONSOLIDATED FINANCIAL STATEMENTS (continued)
May 31, 2016
As a protection seller, the Fund bears the risk of loss from the credit events specified in the contract with the counterparty. For credit default swap contracts on credit indices, quoted market prices and resulting market values serve as an indicator of the current status of the payment/performance risk. Increasing market values, in absolute terms when compared to the notional amount of the swap, represent a deterioration of the reference entity's credit soundness and a greater likelihood or risk of default or other credit event occurring as defined under the terms of the contract.
Any premium paid or received by the Fund upon entering into a credit default swap contract is recorded as an asset or liability, respectively, and amortized daily as a component of realized gain (loss) in the Consolidated Statement of Operations. Credit default swap contracts are valued daily, and the change in value is recorded as unrealized appreciation (depreciation) until the termination of the swap, at which time a realized gain (loss) is recorded.
Credit default swap contracts can involve greater risks than if a fund had invested in the reference obligation directly since, in addition to general market risks, credit default swaps are subject to counterparty credit risk, leverage risk, hedging risk, correlation risk and liquidity risk. The Fund will enter into credit default swap transactions only with counterparties that meet certain standards of creditworthiness, as determined by the Investment Manager.
Interest Rate Swap Contracts
The Fund entered into interest rate swap transactions to produce incremental earnings, to manage interest rate market risk exposure to produce incremental earnings, to gain exposure to or protect itself from market rate changes and to synthetically add or subtract principal exposure to a market. These instruments may be used for other purposes in future periods. Interest rate swaps are agreements between two parties that involve the exchange of one type of interest rate for another type of interest rate cash flow on specified dates in the future, based on a predetermined, specified notional amount. Certain interest rate swaps are considered forward-starting, whereby the accrual for the exchange of cash flows does not begin until a specified date in the future (the effective date). The net cash flow for a standard interest rate swap transaction is generally the difference between a floating market interest rate versus a fixed interest rate.
Interest rate swaps are valued daily and unrealized appreciation (depreciation) is recorded. Certain interest
rate swaps may accrue periodic interest on a daily basis as a component of unrealized appreciation (depreciation); the Fund will realize a gain or loss upon the payment or receipt of accrued interest. The Fund will realize a gain or a loss when the interest rate swap is terminated.
Risks of entering into interest rate swaps include a lack of correlation between the swaps and the portfolio of bonds the swaps are designed to hedge or replicate. A lack of correlation may cause the interest rate swaps to experience adverse changes in value relative to expectations. In addition, interest rate swaps are subject to the risk of default of a counterparty, and the risk of adverse movements in market interest rates relative to the interest rate swap positions taken. The Fund's maximum risk of loss from counterparty credit risk is the discounted net value of the cash flows to be received from/paid to the counterparty over the contract's remaining life to the extent that such amount is positive, plus the cost of entering into a similar transaction with another counterparty.
The Fund attempts to mitigate counterparty credit risk by entering into interest rate swap transactions only with counterparties that meet prescribed levels of creditworthiness, as determined by the Investment Manager. The Fund and any counterparty are required to maintain an agreement that requires the Fund and that counterparty to monitor (on a daily basis) the net market value of all derivative transactions entered into pursuant to the agreement between the Fund and such counterparty. If the net market value of such derivatives transactions between the Fund and that counterparty exceeds a certain threshold (as defined in the agreement), the Fund or the counterparty is required to post cash and/or securities as collateral. Market values of derivatives transactions presented in the financial statements are not netted with the market values of other derivatives transactions or with any collateral amounts posted by the Fund or any counterparty.
Total Return Swap Contracts
The Fund entered into total return swap contracts to manage long or short exposure to the total return on a specified reference security in return for periodic payments based on a fixed or variable interest rate, to manage long or short exposure to the total return on a basket of reference securities in return for periodic payments based on a fixed or variable interest rate, to manage long or short exposure to the total return on a reference security index in return for periodic payments based on a fixed or variable interest rate. These instruments may be used for other purposes in future
Annual Report 2016
53
COLUMBIA DIVERSIFIED ABSOLUTE RETURN FUND
NOTES TO CONSOLIDATED FINANCIAL STATEMENTS (continued)
May 31, 2016
periods. Total return swap contracts may be used to obtain exposure to an underlying reference security, instrument, or other asset or index or market without owning, taking physical custody of, or short selling any such security, instrument or asset in a market.
Total return swap contracts are valued daily, and the change in value is recorded as unrealized appreciation (depreciation) until the termination of the swap, at which time the Fund will realize a gain (loss). Periodic payments received (or made) by the Fund over the term of the contract are recorded as realized gains (losses).
Total return swap contracts may be subject to liquidity risk, which exists when a particular swap contract is difficult to purchase or sell. It may not be possible for the Fund to initiate a transaction or liquidate a position at an advantageous time or price, which may result in significant losses. Total return swap contracts are subject to the risk associated with the investment in the underlying reference security, instrument or asset. The risk in the case of short total return swap contracts is unlimited based on the potential for unlimited increases in the market value of the underlying reference security, instrument or asset. This risk may be offset if the Fund holds any of the underlying reference security, instrument or asset. The risk in the case of long total return swap contracts is limited to the current notional amount of the total return swap contract.
Total return swap contracts are also subject to the risk of the counterparty not fulfilling its obligations under the contract (counterparty credit risk). The Fund attempts to mitigate counterparty credit risk by entering into total return swap contracts only with counterparties that meet prescribed levels of creditworthiness, as determined by the Investment Manager.
Effects of Derivative Transactions in the Financial Statements
The following tables are intended to provide additional information about the effect of derivatives on the financial statements of the Fund, including: the fair value of derivatives by risk category and the location of those fair values in the Consolidated Statement of Assets and Liabilities; and the impact of derivative transactions over the period in the Consolidated Statement of Operations, including realized and unrealized gains (losses). The derivative instrument schedules following the Consolidated Portfolio of Investments present additional information regarding derivative instruments outstanding at the end of the period, if any.
The following table is a summary of the fair value of derivative instruments (not considered to be hedging instruments for accounting disclosure purposes) at May 31, 2016:
Asset Derivatives | |
Risk Exposure
Category | | Statement of Assets and
Liabilities Location | | Fair Value ($) | |
Credit risk
| | Net assets — unrealized
appreciation on swap
contracts | | | 18,381
| * | |
Credit risk
| | Premiums paid on outstanding
swap contracts | | | 71,468
| | |
Equity risk
| | Net assets — unrealized
appreciation on futures
contracts | | | 376,469
| * | |
Foreign exchange risk
| | Unrealized appreciation on
forward foreign currency
exchange contracts | | | 2,673,157
| | |
Interest rate risk
| | Net assets — unrealized
appreciation on futures
contracts | | | 115,114
| * | |
Interest rate risk
| | Investments, at value —
options purchased | | | 1,616
| | |
Total | | | | | 3,256,205 | | |
Liability Derivatives | |
Risk Exposure
Category | | Statement of Assets and
Liabilities Location | | Fair Value ($) | |
Credit risk
| �� | Net assets — unrealized
depreciation on swap
contracts | | | 2,320
| * | |
Equity risk
| | Net assets — unrealized
depreciation on futures
contracts | | | 36,754
| * | |
Equity risk
| | Net assets — unrealized
depreciation on swap
contracts | | | 512,311
| * | |
Foreign exchange risk
| | Unrealized depreciation on
forward foreign currency
exchange contracts | | | 2,597,377
| | |
Interest rate risk
| | Net assets — unrealized
depreciation on futures
contracts | | | 70,557
| * | |
Interest rate risk
| | Net assets — unrealized
depreciation on swap
contracts | | | 126,437
| * | |
Total | | | | | 3,345,756 | | |
*Includes cumulative appreciation (depreciation) as reported in the tables following the Consolidated Portfolio of Investments. Only the current day's variation margin is reported in receivables or payables in the Consolidated Statement of Assets and Liabilities.
Annual Report 2016
54
COLUMBIA DIVERSIFIED ABSOLUTE RETURN FUND
NOTES TO CONSOLIDATED FINANCIAL STATEMENTS (continued)
May 31, 2016
The following table indicates the effect of derivative instruments (not considered to be hedging instruments for accounting disclosure purposes) in the Consolidated Statement of Operations for the year ended May 31, 2016:
Amount of Realized Gain (Loss) on Derivatives Recognized in Income | |
Risk Exposure Category | | Forward Foreign
Currency Exchange
Contracts ($) | | Futures
Contracts ($) | | Swap
Contracts ($) | | Total ($) | |
Credit risk | | | — | | | | — | | | | 37,394 | | | | 37,394 | | |
Equity risk | | | — | | | | (2,099,753 | ) | | | 1,291,408 | | | | (808,345 | ) | |
Foreign exchange risk | | | (325,205 | ) | | | — | | | | — | | | | (325,205 | ) | |
Interest rate risk | | | — | | | | (107,875 | ) | | | (129,672 | ) | | | (237,547 | ) | |
Total | | | (325,205 | ) | | | (2,207,628 | ) | | | 1,199,130 | | | | (1,333,703 | ) | |
Change in Unrealized Appreciation (Depreciation) on Derivatives Recognized in Income | |
Risk Exposure Category | | Forward Foreign
Currency Exchange
Contracts ($) | | Futures
Contracts ($) | | Options Contracts
Purchased ($) | | Swap
Contracts ($) | | Total ($) | |
Credit risk | | | — | | | | — | | | | — | | | | (31,752 | ) | | | (31,752 | ) | |
Equity risk | | | — | | | | 132,603 | | | | — | | | | (1,052,350 | ) | | | (919,747 | ) | |
Foreign exchange risk | | | 196,955 | | | | — | | | | — | | | | — | | | | 196,955 | | |
Interest rate risk | | | — | | | | 102,154 | | | | (15,980 | ) | | | (124,705 | ) | | | (38,531 | ) | |
Total | | | 196,955 | | | | 234,757 | | | | (15,980 | ) | | | (1,208,807 | ) | | | (793,075 | ) | |
The following table provides a summary of the average outstanding volume by derivative instrument for the year ended May 31, 2016:
Derivative Instrument | | Average Notional
Amounts ($)* | |
Futures contracts — Long | | | 88,182,656 | | |
Futures contracts — Short | | | 34,824,890 | | |
Credit default swap contracts — buy protection | | | 2,322,750 | | |
Credit default swap contracts — sell protection | | | 5,091,775 | | |
Derivative Instrument | | Average Market
Value ($)* | |
Options contracts — Purchased | | | 2,590 | | |
Derivative Instrument | | Average Unrealized
Appreciation ($)* | | Average Unrealized
Depreciation ($)* | |
Forward foreign currency
exchange contracts | | | 2,335,863 | | | | (2,120,454 | ) | |
Interest rate swap contracts | | | 1,244 | | | | (107,851 | ) | |
Total return swap contracts | | | 387,046 | | | | (299,200 | ) | |
*Based on the ending quarterly outstanding amounts for the year ended May 31, 2016.
Asset- and Mortgage-Backed Securities
The Fund may invest in asset-backed and mortgage-backed securities. The maturity dates shown represent the original maturity of the underlying obligation. Actual maturity may vary based upon prepayment activity on these obligations. All, or a portion, of the obligation may be prepaid at any time because the underlying asset may
be prepaid. As a result, decreasing market interest rates could result in an increased level of prepayment. An increased prepayment rate will have the effect of shortening the maturity of the security. Unless otherwise noted, the coupon rates presented are fixed rates.
Treasury Inflation Protected Securities
The Fund may invest in treasury inflation protected securities (TIPS). The principal amount of TIPS is adjusted periodically and is increased for inflation or decreased for deflation based on a monthly published index. These adjustments are recorded as interest income in the Consolidated Statement of Operations. Coupon payments are based on the adjusted principal at the time the interest is paid.
Interest Only and Principal Only Securities
The Fund may invest in Interest Only (IO) or Principal Only (PO) securities. IOs are stripped securities entitled to receive all of the security's interest, but none of its principal. IOs are particularly sensitive to changes in interest rates and therefore subject to greater fluctuations in price than typical interest bearing debt securities. IOs are also subject to credit risk because the Fund may not receive all or part of the interest payments if the issuer, obligor, guarantor or counterparty defaults on its obligation. Payments received for IOs are included in interest income on the Consolidated Statement of Operations. Because no principal will be received at the
Annual Report 2016
55
COLUMBIA DIVERSIFIED ABSOLUTE RETURN FUND
NOTES TO CONSOLIDATED FINANCIAL STATEMENTS (continued)
May 31, 2016
maturity of an IO, adjustments are made to the cost of the security on a monthly basis until maturity. POs are stripped securities entitled to receive the principal from the underlying obligation, but not the interest. POs are particularly sensitive to changes in interest rates and therefore are subject to fluctuations in price. POs are also subject to credit risk because the Fund may not receive all or part of its principal if the issuer, obligor, guarantor or counterparty defaults on its obligation. The Fund may also invest in IO or PO stripped mortgage-backed securities. Payments received for POs are treated as reductions to the cost and par value of the securities.
Short Sales
The Fund may sell a security it does not own in anticipation of a decline in the fair value of the security. When the Fund sells a security short, it must borrow the security sold short and deliver it to the broker-dealer through which it made the short sale. The Fund is required to maintain a margin account with the broker and to pledge assets to the broker as collateral for the borrowed security. Securities pledged as collateral are
designated in the Consolidated Portfolio of Investments. In addition, cash collateral held at broker in the Consolidated Statement of Assets and Liabilities. The Fund can purchase the same security at the current market price and deliver it to the broker to close out the short sale. The Fund is obligated to pay the broker a fee for borrowing the security. The fee is included in "Dividends and interest on securities sold short" in the Consolidated Statement of Operations and a short position is reported as a liability at fair value in the Consolidated Statement of Assets and Liabilities. The Fund must also pay the broker for any dividends accrued (recognized on ex-date) on the borrowed security. This amount is recorded as an expense in the Consolidated Statement of Operations. The Fund will record a gain if the security declines in value, and will realize a loss if the security appreciates. Such gain, limited to the price at which the Fund sold the security short, or such loss, potentially unlimited in size because the short position loses value as the market price of the security sold short increases, will be recognized upon the termination of a short sale.
Offsetting of Assets and Liabilities
The following table presents the Fund's gross and net amount of assets and liabilities available for offset under netting arrangements as well as any related collateral received or pledged by the Fund as of May 31, 2016:
| | | Barclays
($) | | BNP
Paribas
($) | | Citi
($) | | Credit
Suisse
($) | | Deutsche
Bank
($) | | Goldman
Sachs
International
($)(a) | | Goldman
Sachs
International
($)(a) | | HSBC
($) | | JPMorgan
($) | | Morgan
Stanley
($)(a) | | Morgan
Stanley
($)(a) | | Standard
Chartered
($) | | State
Street
($) | | UBS
($) | | Total
($) | |
Assets | |
Centrally
cleared
credit
default
swap
contracts(b) | | | — | | | | — | | | | — | | | | — | | | | — | | | | — | | | | — | | | | — | | | | — | | | | — | | | | 92 | | | | — | | | | — | | | | — | | | | 92 | | |
Forward
foreign
currency
exchange
contracts | | | 77,546 | | | | 549,675 | | | | 64,308 | | | | 50,199 | | | | 214,645 | | | | — | | | | — | | | | 989,647 | | | | — | | | | 10,838 | | | | — | | | | 70,916 | | | | 159,019 | | | | 486,364 | | | | 2,673,157 | | |
Options
purchased
puts | | | 1,616 | | | | — | | | | — | | | | — | | | | — | | | | — | | | | — | | | | — | | | | — | | | | — | | | | — | | | | — | | | | — | | | | — | | | | 1,616 | | |
OTC credit
default
swap
contracts(c) | | | — | | | | — | | | | — | | | | — | | | | — | | | | 71,025 | | | | — | | | | — | | | | — | | | | — | | | | — | | | | — | | | | — | | | | — | | | | 71,025 | | |
Total
Assets | | | 79,162 | | | | 549,675 | | | | 64,308 | | | | 50,199 | | | | 214,645 | | | | 71,025 | | | | — | | | | 989,647 | | | | — | | | | 10,838 | | | | 92 | | | | 70,916 | | | | 159,019 | | | | 486,364 | | | | 2,745,890 | | |
Annual Report 2016
56
COLUMBIA DIVERSIFIED ABSOLUTE RETURN FUND
NOTES TO CONSOLIDATED FINANCIAL STATEMENTS (continued)
May 31, 2016
| | Barclays
($) | | BNP
Paribas
($) | | Citi
($) | | Credit
Suisse
($) | | Deutsche
Bank
($) | | Goldman
Sachs
International
($)(a) | | Goldman
Sachs
International
($)(a) | | HSBC
($) | | JPMorgan
($) | | Morgan
Stanley
($)(a) | | Morgan
Stanley
($)(a) | | Standard
Chartered
($) | | State
Street
($) | | UBS
($) | | Total
($) | |
Liabilities | |
Centrally
cleared
credit
default
swap
contracts(b) | | | — | | | | — | | | | — | | | | — | | | | — | | | | — | | | | — | | | | — | | | | — | | | | — | | | | 5,398 | | | | — | | | | — | | | | — | | | | 5,398 | | |
Centrally
cleared
interest
rate swap
contracts(b) | | | — | | | | — | | | | — | | | | — | | | | — | | | | — | | | | — | | | | — | | | | — | | | | — | | | | 1,989 | | | | — | | | | — | | | | — | | | | 1,989 | | |
Forward
foreign
currency
exchange
contracts | | | 4,506 | | | | 140,784 | | | | 41,702 | | | | — | | | | 972,893 | | | | — | | | | — | | | | 191,995 | | | | — | | | | 420 | | | | — | | | | 53,703 | | | | 423,937 | | | | 767,437 | | | | 2,597,377 | | |
OTC total
return swap
contracts(c) | | | — | | | | — | | | | — | | | | — | | | | — | | | | — | | | | 512,311 | | | | — | | | | — | | | | — | | | | — | | | | — | | | | — | | | | — | | | | 512,311 | | |
Securities
borrowed | | | — | | | | — | | | | — | | | | — | | | | — | | | | — | | | | — | | | | — | | | | 32,642,272 | | | | — | | | | — | | | | — | | | | — | | | | — | | | | 32,642,272 | | |
Total
Liabilities | | | 4,506 | | | | 140,784 | | | | 41,702 | | | | — | | | | 972,893 | | | | — | | | | 512,311 | | | | 191,995 | | | | 32,642,272 | | | | 420 | | | | 7,387 | | | | 53,703 | | | | 423,937 | | | | 767,437 | | | | 35,759,347 | | |
Total
Financial
and
Derivative
Net
Assets | | | 74,656 | | | | 408,891 | | | | 22,606 | | | | 50,199 | | | | (758,248 | ) | | | 71,025 | | | | (512,311 | ) | | | 797,652 | | | | (32,642,272 | ) | | | 10,418 | | | | (7,295 | ) | | | 17,213 | | | | (264,918 | ) | | | (281,073 | ) | | | (33,013,457 | ) | |
Total
collateral
received
(pledged)(d) | | | — | | | | — | | | | — | | | | — | | | | — | | | | — | | | | (512,311 | ) | | | — | | | | (32,642,272 | ) | | | — | | | | (7,295 | ) | | | — | | | | — | | | | — | | | | (33,161,878 | ) | |
Net
Amount(e) | | | 74,656 | | | | 408,891 | | | | 22,606 | | | | 50,199 | | | | (758,248 | ) | | | 71,025 | | | | — | | | | 797,652 | | | | — | | | | 10,418 | | | | — | | | | 17,213 | | | | (264,918 | ) | | | (281,073 | ) | | | 148,421 | | |
(a) Exposure can only be netted across transactions governed under the same master agreement with the same legal entity.
(b) Centrally cleared swaps are included within payable/receivable for variation margin on the Statement of Assets and Liabilities.
(c) Over-the-Counter Swap Contracts are presented at market value plus periodic payments receivable (payable), which is comprised of unrealized appreciation, unrealized depreciation, premiums paid and premiums received.
(d) In some instances, the actual collateral received and/or pledged may be more than the amount shown due to overcollateralization.
(e) Represents the net amount due from/(to) counterparties in the event of default.
Security Transactions
Security transactions are accounted for on the trade date. Cost is determined and gains (losses) are based upon the specific identification method for both financial statement and federal income tax purposes.
Income Recognition
Corporate actions and dividend income are generally recorded net of any non-reclaimable tax withholdings, on the ex-dividend date or upon receipt of ex-dividend notification in the case of certain foreign securities.
Interest income is recorded on an accrual basis. Market premiums and discounts, including original issue discounts, are amortized and accreted, respectively, over the expected life of the security on all debt securities, unless otherwise noted. The Fund classifies gains and losses realized on prepayments received on mortgage-backed securities as adjustments to interest income.
The Fund may place a debt security on non-accrual status and reduce related interest income when it becomes probable that the interest will not be collected and the amount of uncollectible interest can be reasonably estimated. A defaulted debt security is
Annual Report 2016
57
COLUMBIA DIVERSIFIED ABSOLUTE RETURN FUND
NOTES TO CONSOLIDATED FINANCIAL STATEMENTS (continued)
May 31, 2016
removed from non-accrual status when the issuer resumes interest payments or when collectibility of interest is reasonably assured.
The Fund may receive distributions from holdings in equity securities, business development companies (BDCs), exchange-traded funds, other regulated investment companies (RICs), and real estate investment trusts (REITs), which report information on the tax character of their distributions annually. These distributions are allocated to dividend income, capital gain and return of capital based on actual information reported. Return of capital is recorded as a reduction of the cost basis of securities held. If the Fund no longer owns the applicable securities, return of capital is recorded as a realized gain. With respect to REITs, to the extent actual information has not yet been reported, estimates for return of capital are made by the Fund's management. Management's estimates are subsequently adjusted when the actual character of the distributions is disclosed by the REITs, which could result in a proportionate change in return of capital to shareholders.
Awards from class action litigation are recorded as a reduction of cost basis if the Fund still owns the applicable securities on the payment date. If the Fund no longer owns the applicable securities, the proceeds are recorded as realized gains.
The value of additional securities received as an income payment is recorded as income and increases the cost basis of such securities.
Expenses
General expenses of the Trust are allocated to the Fund and other funds of the Trust based upon relative net assets or other expense allocation methodologies determined by the nature of the expense. Expenses directly attributable to the Fund are charged to the Fund. Expenses directly attributable to a specific class of shares are charged to that share class.
Determination of Class Net Asset Value
All income, expenses (other than class-specific expenses, which are charged to that share class, as shown in the Consolidated Statement of Operations) and realized and unrealized gains (losses) are allocated to each class of the Fund on a daily basis, based on the relative net assets of each class, for purposes of determining the net asset value of each class.
Federal Income Tax Status
The Fund intends to qualify each year as a regulated investment company under Subchapter M of the Internal
Revenue Code, as amended, and will distribute substantially all of its taxable income (including net short-term capital gains), if any, for its tax year, and as such will not be subject to federal income taxes. In addition, the Fund intends to distribute in each calendar year substantially all of its net investment income, capital gains and certain other amounts, if any, such that the Fund should not be subject to federal excise tax. Therefore, no federal income or excise tax provision is recorded.
Foreign Taxes
The Fund may be subject to foreign taxes on income, gains on investments or currency repatriation, a portion of which may be recoverable. The Fund will accrue such taxes and recoveries, as applicable, based upon its current interpretation of tax rules and regulations that exist in the markets in which it invests.
Realized gains in certain countries may be subject to foreign taxes at the Fund level, based on statutory rates. The Fund accrues for such foreign taxes on realized and unrealized gains at the appropriate rate for each jurisdiction, as applicable. The amount, if any, is disclosed as a liability on the Consolidated Statement of Assets and Liabilities.
Distributions to Shareholders
Distributions from net investment income, if any, are declared and paid annually. Net realized capital gains, if any, are distributed along with the income distribution. Income distributions and capital gain distributions are determined in accordance with federal income tax regulations, which may differ from GAAP.
Guarantees and Indemnifications
Under the Trust's organizational documents and, in some cases, by contract, its officers and trustees are indemnified against certain liabilities arising out of the performance of their duties to the Trust or its funds. In addition, certain of the Fund's contracts with its service providers contain general indemnification clauses. The Fund's maximum exposure under these arrangements is unknown since the amount of any future claims that may be made against the Fund cannot be determined, and the Fund has no historical basis for predicting the likelihood of any such claims.
Note 3. Fees and Other Transactions with Affiliates
Management Fees
Effective October 1, 2015, the Fund entered into a Management Agreement with Columbia Management
Annual Report 2016
58
COLUMBIA DIVERSIFIED ABSOLUTE RETURN FUND
NOTES TO CONSOLIDATED FINANCIAL STATEMENTS (continued)
May 31, 2016
Investment Advisers, LLC (the Investment Manager), a wholly-owned subsidiary of Ameriprise Financial, Inc. (Ameriprise Financial). Under the Management Agreement, the Investment Manager provides the Fund with investment research and advice, as well as administrative and accounting services. The management services fee is an annual fee that is equal to a percentage of the Fund's average daily net assets that declines from 1.18% to 1.03% as the Fund's net assets increase. The effective management services fee rate for the year ended May 31, 2016 was 1.18% of the Fund's average daily net assets.
Prior to October 1, 2015, the Fund paid the Investment Manager an annual fee for advisory services under an Investment Management Services Agreement and a separate annual fee for administrative and accounting services under an Administrative Services Agreement. For the period from June 1, 2015 through September 30, 2015, the investment advisory services fee paid to the Investment Manager was $402,600, and the administrative services fee paid to the Investment Manager was $29,280.
Subadvisory Agreement
The Fund's Board has approved a subadvisory agreement between the Investment Manager and Threadneedle International Limited (Threadneedle), an affiliate of the Investment Manager and an indirect wholly-owned subsidiary of Ameriprise Financial. As of May 31, 2016, Threadneedle is not providing services to the Fund pursuant to the subadvisory agreement.
Other Expenses
Other expenses include offering costs which were incurred prior to the shares of the Fund being offered. Offering costs include, among other things, state registration filing fees and printing costs. The Fund amortizes offering costs over a period of 12 months from the commencement of operations.
Compensation of Board Members
Board members, who are not officers or employees of the Investment Manager or Ameriprise Financial, are compensated for their services to the Fund as disclosed in the Consolidated Statement of Operations. These Board members may participate in a Deferred Compensation Plan (the Plan) which may be terminated at any time. Obligations of the Plan will be paid solely out of the Fund's assets, and all amounts payable under the Plan constitute a general unsecured obligation of the Fund.
Compensation of Chief Compliance Officer
The Board has appointed a Chief Compliance Officer to the Fund in accordance with federal securities regulations. The Fund is allocated a portion of the expenses associated with the Chief Compliance Officer based on relative net assets of the Trust.
Transfer Agency Fees
Under a Transfer and Dividend Disbursing Agent Agreement, Columbia Management Investment Services Corp. (the Transfer Agent), an affiliate of the Investment Manager and a wholly-owned subsidiary of Ameriprise Financial, is responsible for providing transfer agency services to the Fund. The Transfer Agent has contracted with Boston Financial Data Services (BFDS) to serve as sub-transfer agent.
The Transfer Agent receives a monthly transfer agency fee based on the number or the average value of accounts, depending on the type of account. In addition, the Transfer Agent also receives sub-transfer agency fees based on a percentage of the average aggregate value of the Fund's shares maintained in omnibus accounts (other than omnibus accounts for which American Enterprise Investment Services Inc. is the broker of record or accounts where the beneficial shareholder is a customer of Ameriprise Financial Services, Inc., for which the Transfer Agent receives a per account fee). The Transfer Agent pays the fees of BFDS for services as sub-transfer agent and is not entitled to reimbursement for such fees from the Fund (with the exception of out-of-pocket fees).
The Transfer Agent also receives compensation from the Fund for various shareholder services and reimbursements for certain out-of-pocket fees. Total transfer agency fees for Class R5 shares are subject to an annual limitation of not more than 0.05% of the average daily net assets attributable to Class R5 shares. Class I shares do not pay transfer agency fees.
For the year ended May 31, 2016, the Fund's effective transfer agency fee rates as a percentage of average daily net assets of each class were as follows:
Class A | | | 0.79 | % | |
Class C | | | 0.79 | | |
Class R4 | | | 0.79 | | |
Class R5 | | | 0.05 | | |
Class W | | | 0.79 | | |
Class Z | | | 0.79 | | |
Annual Report 2016
59
COLUMBIA DIVERSIFIED ABSOLUTE RETURN FUND
NOTES TO CONSOLIDATED FINANCIAL STATEMENTS (continued)
May 31, 2016
An annual minimum account balance fee of $20 may apply to certain accounts with a value below the applicable share class's initial minimum investment requirements to reduce the impact of small accounts on transfer agency fees. These minimum account balance fees are remitted to the Fund and recorded as part of expense reductions in the Consolidated Statement of Operations. For the year ended May 31, 2016, no minimum account balance fees were charged by the Fund.
Distribution and Service Fees
The Fund has an agreement with Columbia Management Investment Distributors, Inc. (the Distributor), an affiliate of the Investment Manager and a wholly-owned subsidiary of Ameriprise Financial, for distribution and shareholder services. The Board has approved, and the Fund has adopted, distribution and shareholder service plans (the Plans) applicable to certain share classes, which set the distribution and service fees for the Fund. These fees are calculated daily and are intended to compensate the Distributor and/or eligible selling and/or servicing agents for selling shares of the Fund and providing services to investors.
Under the Plans, the Fund pays a monthly service fee to the Distributor at the maximum annual rate of 0.25% of the average daily net assets attributable to Class A, Class C and Class W shares of the Fund. Also under the Plans, the Fund pays a monthly distribution fee to the Distributor at the maximum annual rates of 0.75% and 0.25% of the average daily net assets attributable to Class C and Class W shares of the Fund, respectively.
Although the Fund may pay a distribution fee up to 0.25% of the Fund's average daily net assets attributable to Class W shares and a service fee of up to 0.25% of the Fund's average daily net assets attributable to Class W shares, the aggregate fee shall not exceed 0.25% of the Fund's average daily net assets attributable to Class W shares.
Sales Charges
Sales charges, including front-end charges and CDSCs, received by the Distributor for distributing Fund shares were $3,037 for Class A shares for the year ended May 31, 2016.
Expenses Waived/Reimbursed by the Investment Manager and its Affiliates
The Investment Manager and certain of its affiliates have contractually agreed to waive fees and/or reimburse expenses (excluding certain fees and expenses
described below) for the period disclosed below, so that the Fund's net operating expenses, including indirect expenses of the Underlying Funds, after giving effect to fees waived/expenses reimbursed and any balance credits and/or overdraft charges from the Fund's custodian, do not exceed the following annual rates as a percentage of the class' average daily net assets:
| | | Fee Rates Contractual
through
September 30, 2016 | |
Class A | | | 1.71 | % | |
Class C | | | 2.46 | | |
Class I | | | 1.31 | | |
Class R4 | | | 1.46 | | |
Class R5 | | | 1.36 | | |
Class W | | | 1.71 | | |
Class Z | | | 1.46 | | |
Under the agreement governing these fee waivers and/or expense reimbursement arrangements, the following fees and expenses are excluded from the waiver/reimbursement commitment, and therefore will be paid by the Fund, if applicable: taxes (including foreign transaction taxes), transaction costs and brokerage commissions, costs related to any securities lending program, dividend and interest expenses associated with securities sold short, inverse floater program fees and expenses, transaction charges and interest on borrowed money, interest, extraordinary expenses and any other expenses the exclusion of which is specifically approved by the Board. This agreement may be modified or amended only with approval from the Investment Manager, certain of its affiliates and the Fund. Any fees waived and/or expenses reimbursed under the expense reimbursement arrangements described above are not recoverable by the Investment Manager or its affiliates in future periods.
Note 4. Federal Tax Information
The timing and character of income and capital gain distributions are determined in accordance with income tax regulations, which may differ from GAAP because of temporary or permanent book to tax differences.
At May 31, 2016, these differences are primarily due to differing treatment for capital loss carryforwards, principal and/or interest from fixed income securities, deferral/reversal of wash sale losses, Trustees' deferred compensation, foreign currency transactions, net operating loss reclassification, non-deductible expenses,
Annual Report 2016
60
COLUMBIA DIVERSIFIED ABSOLUTE RETURN FUND
NOTES TO CONSOLIDATED FINANCIAL STATEMENTS (continued)
May 31, 2016
late-year ordinary losses, re-characterization of distributions for investments, derivative investments, tax straddles, swap investments, investments in commodity subsidiaries, constructive sales of appreciated financial positions, and excess distributions. To the extent these differences are permanent, reclassifications are made among the components of the Fund's net assets in the Statement of Assets and Liabilities. Temporary differences do not require reclassifications.
In the Statement of Assets and Liabilities the following reclassifications were made:
Excess of distributions over net investment income | | $ | 892,144 | | |
Accumulated net realized loss | | | 1,370,577 | | |
Paid-in capital | | | (2,262,721 | ) | |
Net investment income (loss) and net realized gains (losses), as disclosed in the Statement of Operations, and net assets were not affected by this reclassification.
The tax character of distributions paid during the years indicated was as follows:
Year Ended May 31, | | 2016 | | 2015 | |
Ordinary income | | $ | 1,391,405 | | | $ | — | | |
Long-term capital gains | | | 180,633 | | | | — | | |
Total | | $ | 1,572,038 | | | $ | — | | |
Short-term capital gain distributions, if any, are considered ordinary income distributions for tax purposes.
At May 31, 2016, the components of distributable earnings on a tax basis were as follows:
Capital loss carryforwards | | $ | (1,249,633 | ) | |
Net unrealized appreciation | | | 133,808 | | |
At May 31, 2016, the cost of investments for federal income tax purposes was $162,904,264 and the aggregate gross unrealized appreciation and depreciation based on that cost was:
Unrealized appreciation | | $ | 4,991,057 | | |
Unrealized depreciation | | | (4,857,249 | ) | |
Net unrealized appreciation | | $ | 133,808 | | |
The following capital loss carryforwards, determined at May 31, 2016, may be available to reduce taxable income arising from future net realized gains on
investments, if any, to the extent permitted by the Internal Revenue Code:
Year of Expiration | | Amount ($) | |
No expiration — short-term | | | 386,927 | | |
No expiration — long-term | | | 862,706 | | |
Total | | | 1,249,633 | | |
Under current tax rules, regulated investment companies can elect to treat certain late-year ordinary losses incurred and post-October capital losses (capital losses realized after October 31) as arising on the first day of the following taxable year. As of May 31, 2016, the Fund will elect to treat late-year ordinary losses of $749,299 as arising on June 1, 2016.
Management of the Fund has concluded that there are no significant uncertain tax positions in the Fund that would require recognition in the financial statements. However, management's conclusion may be subject to review and adjustment at a later date based on factors including, but not limited to, new tax laws, regulations, and administrative interpretations (including relevant court decisions). Generally, the Fund's federal tax returns for the prior three fiscal years remain subject to examination by the Internal Revenue Service.
Note 5. Portfolio Information
The cost of purchases and proceeds from sales of securities, excluding short-term investments and derivatives, if any, aggregated to $177,331,351 and $167,742,554, respectively, for the year ended May 31, 2016, of which $9,036,382 and $15,860,216, respectively, were U.S. government securities. The amount of purchase and sale activity impacts the portfolio turnover rate reported in the Financial Highlights.
Note 6. Affiliated Money Market Fund
The Fund significantly invests in Columbia Short-Term Cash Fund, an affiliated money market fund established for the exclusive use by the Fund and other affiliated funds. The income earned by the Fund from such investments is included as Dividends — affiliated issuers in the Consolidated Statement of Operations. As an investing fund, the Fund indirectly bears its proportionate share of the expenses of Columbia Short-Term Cash Fund.
Note 7. Line of Credit
The Fund has access to a revolving credit facility whereby the Fund may borrow for the temporary funding of shareholder redemptions or for other temporary or
Annual Report 2016
61
COLUMBIA DIVERSIFIED ABSOLUTE RETURN FUND
NOTES TO CONSOLIDATED FINANCIAL STATEMENTS (continued)
May 31, 2016
emergency purposes. Effective December 8, 2015, Citibank, N.A. and HSBC Bank USA, N.A. joined JPMorgan Chase Bank, N.A. (JPMorgan) as lead of a syndicate of banks under the credit facility, which is a collective agreement between the Fund and certain other funds managed by the Investment Manager, severally and not jointly, that permits collective borrowings up to $1 billion. Interest is charged to each participating fund based on its borrowings at a rate equal to the higher of (i) the overnight federal funds rate plus 1.00% or (ii) the one-month LIBOR rate plus 1.00%. Each borrowing under the credit facility matures no later than 60 days after the date of borrowing. The Fund also pays a commitment fee equal to its pro rata share of the amount of the credit facility at a rate of 0.15% per annum. The commitment fee is included in other expenses in the Consolidated Statement of Operations. Prior to December 8, 2015, JPMorgan was the sole lead bank under the credit facility agreement that permitted borrowings up to $550 million under the same terms and interest rates as described above with the exception of the commitment fee which was charged at a rate of 0.075% per annum.
The Fund had no borrowings during the year ended May 31, 2016.
Note 8. Significant Risks
Shareholder Concentration Risk
At May 31, 2016, affiliated shareholders of record owned 99.8% of the outstanding shares of the Fund in one or more accounts. Subscription and redemption activity by concentrated accounts may have a significant effect on the operations of the Fund. In the case of a large redemption, the Fund may be forced to sell investments at inopportune times, including its liquid or more liquid positions, resulting in Fund losses and the Fund holding a higher percentage of less liquid or illiquid securities. Large redemptions could result in decreased economies of scale and increased operating expenses for non-redeeming Fund shareholders.
Derivatives Risk
Losses involving derivative instruments may be substantial, because a relatively small price movement in the underlying security(ies), commodity, currency or index or other instrument or asset may result in a substantial loss for the Fund. In addition to the potential for increased losses, the use of derivative instruments may lead to increased volatility within the Fund. Derivatives will typically increase the Fund's exposure to principal risks to which it is otherwise exposed, and may expose
the Fund to additional risks, including correlation risk, counterparty risk, hedging risk, leverage risk and liquidity risk.
Short Selling Risk
Leverage occurs when the Fund increases its assets available for investment using borrowings, short sales, derivatives, or similar instruments or techniques. Because short sales involve borrowing securities and then selling them, the Fund's short sales effectively leverage the Fund's assets. The Fund's assets that are used as collateral to secure the Fund's obligations to return the securities sold short may decrease in value while the short positions are outstanding, which may force the Fund to use its other assets to increase the collateral. Leverage can create an interest expense that may lower the Fund's overall returns. Leverage presents the opportunity for increased net income and capital gains, but may also exaggerate the Fund's volatility and risk of loss. There can be no guarantee that a leveraging strategy will be successful.
Note 9. Subsequent Events
Management has evaluated the events and transactions that have occurred through the date the financial statements were issued and noted no items requiring adjustment of the financial statements or additional disclosure.
Note 10. Information Regarding Pending and Settled Legal Proceedings
In December 2005, without admitting or denying the allegations, American Express Financial Corporation (AEFC, which is now known as Ameriprise Financial, Inc. (Ameriprise Financial)) entered into settlement agreements with the Securities and Exchange Commission (SEC) and Minnesota Department of Commerce (MDOC) related to market timing activities. As a result, AEFC was censured and ordered to cease and desist from committing or causing any violations of certain provisions of the Investment Advisers Act of 1940, the Investment Company Act of 1940, and various Minnesota laws. AEFC agreed to pay disgorgement of $10 million and civil money penalties of $7 million. AEFC also agreed to retain an independent distribution consultant to assist in developing a plan for distribution of all disgorgement and civil penalties ordered by the SEC in accordance with various undertakings detailed at http://www.sec.gov/litigation/admin/ia-2451.pdf. Ameriprise Financial and its affiliates have cooperated with the SEC and the MDOC in these legal proceedings,
Annual Report 2016
62
COLUMBIA DIVERSIFIED ABSOLUTE RETURN FUND
NOTES TO CONSOLIDATED FINANCIAL STATEMENTS (continued)
May 31, 2016
and have made regular reports to the Funds' Boards of Trustees.
Ameriprise Financial and certain of its affiliates have historically been involved in a number of legal, arbitration and regulatory proceedings, including routine litigation, class actions, and governmental actions, concerning matters arising in connection with the conduct of their business activities. Ameriprise Financial believes that the Funds are not currently the subject of, and that neither Ameriprise Financial nor any of its affiliates are the subject of, any pending legal, arbitration or regulatory proceedings that are likely to have a material adverse effect on the Funds or the ability of Ameriprise Financial or its affiliates to perform under their contracts with the Funds. Ameriprise Financial is required to make quarterly (10-Q), annual (10-K) and, as necessary, 8-K filings with the SEC on legal and regulatory matters that relate to Ameriprise Financial and its affiliates. Copies of these filings may be obtained by accessing the SEC website at www.sec.gov.
There can be no assurance that these matters, or the adverse publicity associated with them, will not result in increased fund redemptions, reduced sale of fund shares or other adverse consequences to the Funds. Further, although we believe proceedings are not likely to have a material adverse effect on the Funds or the ability of Ameriprise Financial or its affiliates to perform under their contracts with the Funds, these proceedings are subject to uncertainties and, as such, we are unable to estimate the possible loss or range of loss that may result. An adverse outcome in one or more of these proceedings could result in adverse judgments, settlements, fines, penalties or other relief that could have a material adverse effect on the consolidated financial condition or results of operations of Ameriprise Financial.
Annual Report 2016
63
COLUMBIA DIVERSIFIED ABSOLUTE RETURN FUND
REPORT OF INDEPENDENT REGISTERED PUBLIC ACCOUNTING FIRM
To the Trustees of Columbia Funds Series Trust I and the Shareholders of
Columbia Diversified Absolute Return Fund
In our opinion, the accompanying consolidated statement of assets and liabilities, including the consolidated portfolio of investments, and the related consolidated statements of operations and of changes in net assets and the consolidated financial highlights present fairly, in all material respects, the financial position of Columbia Diversified Absolute Return Fund (the "Fund", a series of Columbia Funds Series Trust I) at May 31, 2016, and the results of its operations, the changes in its net assets and the financial highlights for each of the periods indicated, in conformity with accounting principles generally accepted in the United States of America. These financial statements and financial highlights (hereafter referred to as "financial statements") are the responsibility of the Fund's management. Our responsibility is to express an opinion on these financial statements based on our audits. We conducted our audits of these financial statements in accordance with the standards of the Public Company Accounting Oversight Board (United States). Those standards require that we plan and perform the audit to obtain reasonable assurance about whether the financial statements are free of material misstatement. An audit includes examining, on a test basis, evidence supporting the amounts and disclosures in the financial statements, assessing the accounting principles used and significant estimates made by management, and evaluating the overall financial statement presentation. We believe that our audits, which included confirmation of securities at May 31, 2016 by correspondence with the custodian, brokers and transfer agent, and the application of alternative auditing procedures where such confirmations had not been received, provide a reasonable basis for our opinion.
PricewaterhouseCoopers LLP
Minneapolis, MN
July 25, 2016
Annual Report 2016
64
COLUMBIA DIVERSIFIED ABSOLUTE RETURN FUND
FEDERAL INCOME TAX INFORMATION
(Unaudited)
The Fund hereby designates the following tax attributes for the fiscal year ended May 31, 2016. Shareholders will be notified in early 2017 of the amounts for use in preparing 2016 income tax returns.
Tax Designations
| Qualified Dividend Income | | | 5.72 | % | |
Dividends Received Deduction | | | 5.27 | % | |
Qualified Dividend Income. For taxable, non-corporate shareholders, the percentage of ordinary income distributed during the fiscal year that represents qualified dividend income subject to reduced tax rates.
Dividends Received Deduction. The percentage of ordinary income distributed during the fiscal year that qualifies for the corporate dividends received deduction.
Annual Report 2016
65
COLUMBIA DIVERSIFIED ABSOLUTE RETURN FUND
Shareholders elect the Board that oversees the Fund's operations. The Board appoints officers who are responsible for day-to-day business decisions based on policies set by the Board. The following table provides basic biographical information about the Fund's Trustees, including their principal occupations during the past five years, although specific titles for individuals may have varied over the period. The year set forth beneath Length of Service in the table below is the year in which the Trustee was first appointed or elected as Trustee to any Fund currently in the Columbia Funds Complex or a predecessor thereof. Under current Board policy, members serve terms of indefinite duration.
Trustees
Independent Trustees
Name,
Address,
Year of Birth | | Position Held With
the Trust and Length of
Service | | Principal Occupation(s)
During the Past Five Years
and Other Relevant
Professional Experience | | Number of
Funds in the
Columbia Funds
Complex
Overseen | | Other Directorships
Held by Trustee During
the Past Five Years | |
Janet Langford Carrig
c/o Columbia
Management Investment Advisers, LLC,
225 Franklin Street
Mail Drop BX32 05228,
Boston, MA 02110
1957 | | Trustee 1996 | | Senior Vice President, General Counsel and Corporate Secretary, ConocoPhillips (integrated energy company) since September 2007 | | | 57 | | | None | |
Douglas A. Hacker
c/o Columbia Management Investment Advisers, LLC,
225 Franklin Street
Mail Drop BX32 05228,
Boston, MA 02110
1955 | | Trustee and Chairman of the Board 1996 | | Independent business executive since May 2006; Executive Vice President — Strategy of United Airlines from December 2002 to May 2006; President of UAL Loyalty Services (airline marketing company) from September 2001 to December 2002; Executive Vice President and Chief Financial Officer of United Airlines from July 1999 to September 2001 | | | 57 | | | Spartan Nash Company (food distributor); Nash Finch Company (food distributor) from 2005 to 2013; Aircastle Limited (aircraft leasing); SeaCube Container Leasing Ltd. (container leasing) from 2010 to 2013; and Travelport Worldwide Limited (travel information technology) | |
Nancy T. Lukitsh
c/o Columbia Management Investment Advisers, LLC,
225 Franklin Street
Mail Drop BX32 05228,
Boston, MA 02110
1956 | | Trustee 2011 | | Senior Vice President, Partner and Director of Marketing, Wellington Management Company, LLP (investment adviser) from 1997 to 2010; Chair, Wellington Management Portfolios (commingled non-U.S. investment pools) from 2007 to 2010; Director, Wellington Trust Company, NA and other Wellington affiliates from 1997 to 2010 | | | 57 | | | None | |
Annual Report 2016
66
COLUMBIA DIVERSIFIED ABSOLUTE RETURN FUND
TRUSTEES AND OFFICERS (continued)
Independent Trustees (continued)
Name,
Address,
Year of Birth | | Position Held With
the Trust and Length of
Service | | Principal Occupation(s)
During the Past Five Years
and Other Relevant
Professional Experience | | Number of
Funds in the
Columbia Funds
Complex
Overseen | | Other Directorships
Held by Trustee During
the Past Five Years | |
William E. Mayer
c/o Columbia Management Investment Advisers, LLC,
225 Franklin Street
Mail Drop BX32 05228,
Boston, MA 02110
1940 | | Trustee 1991 | | Partner, Park Avenue Equity Partners (private equity) since February 1999 | | | 57 | | | DynaVox Inc. (speech creation); Lee Enterprises (print media); WR Hambrecht + Co. (financial service provider) from 2000 to 2012; BlackRock Capital Investment Corporation (investment company); and Premier, Inc. (healthcare) | |
David M. Moffett
c/o Columbia Management Investment Advisers, LLC,
225 Franklin Street
Mail Drop BX32 05228,
Boston, MA 02110
1952 | | Trustee 2011 | | Retired. Consultant to Bridgewater and Associates | | | 57 | | | Director of CIT Bank, CIT Group Inc. (commercial and consumer finance); eBay Inc. (online trading community); Genworth Financial, Inc. (financial and insurance products and services); Paypal Holdings Inc. (payment and data processing services); and Trustee University of Oklahoma Foundation | |
Charles R. Nelson
c/o Columbia Management Investment Advisers, LLC,
225 Franklin Street
Mail Drop BX32 05228,
Boston, MA 02110
1942 | | Trustee 1981 | | Retired. Professor Emeritus, University of Washington since 2011; Professor of Economics, University of Washington from 1976 to 2011; Ford and Louisa Van Voorhis Professor of Political Economy, University of Washington from 1993 to 2011; Adjunct Professor of Statistics, University of Washington from 1980 to 2011; Associate Editor, Journal of Money, Credit and Banking from September 1993 to 2008; consultant on econometric and statistical matters | | | 57 | | | None | |
John J. Neuhauser
c/o Columbia Management Investment Advisers, LLC,
225 Franklin Street
Mail Drop BX32 05228,
Boston, MA 02110
1943 | | Trustee 1984 | | President, Saint Michael's College since August 2007; Director or Trustee of several non-profit organizations, including University of Vermont Medical Center; Academic Vice President and Dean of Faculties, Boston College from August 1999 to October 2005; University Professor, Boston College from November 2005 to August 2007 | | | 57 | | | Liberty All-Star Equity Fund and Liberty All-Star Growth Fund (closed-end funds) | |
Annual Report 2016
67
COLUMBIA DIVERSIFIED ABSOLUTE RETURN FUND
TRUSTEES AND OFFICERS (continued)
Independent Trustees (continued)
Name,
Address,
Year of Birth | | Position Held With
the Trust and Length of
Service | | Principal Occupation(s)
During the Past Five Years
and Other Relevant
Professional Experience | | Number of
Funds in the
Columbia Funds
Complex
Overseen | | Other Directorships
Held by Trustee During
the Past Five Years | |
Patrick J. Simpson
c/o Columbia Management Investment Advisers, LLC,
225 Franklin Street
Mail Drop BX32 05228,
Boston, MA 02110
1944 | | Trustee 2000 | | Of Counsel, Perkins Coie LLP (law firm) since 2015; Partner, Perkins Coie LLP from 1988 to 2014 | | | 57 | | | None | |
Anne-Lee Verville
c/o Columbia Management Investment Advisers, LLC,
225 Franklin Street
Mail Drop BX32 05228,
Boston, MA 02110
1945 | | Trustee 1998 | | Retired. General Manager, Global Education Industry from 1994 to 1997, President — Application Systems Division from 1991 to 1994, Chief Financial Officer — US Marketing & Services from 1988 to 1991, and Chief Information Officer from 1987 to 1988, IBM Corporation (computer and technology) | | | 57 | | | Enesco Group, Inc. (producer of giftware and home and garden decor products) from 2001 to 2006 | |
Consultant to the Trustees*
Name,
Address,
Year of Birth | | Position Held With
the Trust and Length of
Service | | Principal Occupation(s)
During the Past Five Years
and Other Relevant
Professional Experience | | Number of
Funds in the
Columbia Funds
Complex
Overseen | | Other Directorships
Held by Trustee During
the Past Five Years | |
J. Kevin Connaughton
c/o Columbia
Management Investment Advisers, LLC,
225 Franklin Street
Mail Drop BX32 05228,
Boston, MA 02110
1964 | | Trustee Consultant 2016 | | Trustee Consultant, Columbia Funds since March 2016; Managing Director and General Manager of Mutual Fund Products, Columbia Management Investment Advisers, LLC from May 2010 to February 2015; President, Columbia Funds from 2009 to 2015; and senior officer of Columbia Funds and affiliated funds from 2003 to 2015 | | | 57 | | | Board of Governors, Gateway Healthcare since January 2016; Trustee, New Century Portfolios since March 2015; and Director, The Autism Project since March 2015 | |
* J. Kevin Connaughton was appointed consultant to the Trustees effective March 1, 2016. Shareholders of the Funds are expected to be asked to elect Mr. Connaughton as a Trustee at a future shareholder meeting.
Annual Report 2016
68
COLUMBIA DIVERSIFIED ABSOLUTE RETURN FUND
TRUSTEES AND OFFICERS (continued)
Interested Trustee Affiliated with Investment Manager*
Name,
Address,
Year of Birth | | Position Held With
the Trust and Length of
Service | | Principal Occupation(s)
During the Past Five Years
and Other Relevant
Professional Experience | | Number of
Funds in the
Columbia Funds
Complex
Overseen | | Other Directorships
Held by Trustee During
the Past Five Years | |
William F. Truscott
c/o Columbia Management Investment Advisers, LLC,
225 Franklin Street
Boston, MA 02110
1960 | | Trustee 2012 | | Chairman of the Board and President, Columbia Management Investment Advisers, LLC since May 2010 and February 2012, respectively; Chief Executive Officer, Global Asset Management, Ameriprise Financial, Inc. since September 2012 (previously Chief Executive Officer, U.S. Asset Management & President, Annuities, May 2010- September 2012); Director and Chief Executive Officer, Columbia Management Investment Distributors, Inc. since May 2010 and February 2012, respectively; Chairman of the Board and Chief Executive Officer, RiverSource Distributors, Inc. since 2006; Director, Threadneedle Asset Management Holdings, SARL since 2014; President and Chief Executive Officer, Ameriprise Certificate Company, 2006-August 2012. | | | 176 | | | Chairman of the Board, Columbia Management Investment Advisers, LLC since May 2010; Director, Columbia Management Investment Distributors, Inc. since May 2010; Former Director, Ameriprise Certificate Company, 2006-January 2013 | |
* Interested person (as defined under the 1940 Act) by reason of being an officer, director, security holder and/or employee of the Investment Manager or Ameriprise Financial.
The Statement of Additional Information has additional information about the Fund's Board members and is available, without charge, upon request by calling 800.345.6611; contacting your financial intermediary; or visiting columbiathreadneedle.com/us.
Annual Report 2016
69
COLUMBIA DIVERSIFIED ABSOLUTE RETURN FUND
TRUSTEES AND OFFICERS (continued)
The Board has appointed officers who are responsible for day-to-day business decisions based on policies it has established. The officers serve at the pleasure of the Board. The following table provides basic information about the Officers of the Fund, including principal occupations during the past five years, although their specific titles may have varied over the period. In addition to Mr. Truscott, who is Senior Vice President, the Fund's other officers are:
Fund Officers
Name,
Address and
Year of Birth | | Position and Year
First Appointed to
Position for any Fund
in the Columbia
Funds Complex or a
Predecessor Thereof | |
Principal Occupation(s) During Past Five Years | |
Christopher O. Petersen
5228 Ameriprise Financial Center
Minneapolis, MN 55474
Born 1970 | | President and Principal Executive Officer (2015) | | Vice President and Lead Chief Counsel, Ameriprise Financial, Inc. since January 2015 (previously, Vice President and Chief Counsel January 2010-December 2014; officer of Columbia Funds and affiliated funds since 2007. | |
Michael G. Clarke
225 Franklin Street
Boston, MA 02110
Born 1969 | | Treasurer (2011), Chief Financial Officer (2009) and Chief Accounting Officer (2015) | | Vice President — Mutual Fund Administration, Columbia Management Investment Advisers, LLC, since May 2010; senior officer of Columbia Funds and affiliated funds since 2002. | |
Paul B. Goucher
100 Park Avenue
New York, NY 10017
Born 1968 | | Senior Vice President (2011), Chief Legal Officer (2015) and Assistant Secretary (2008) | | Vice President and Lead Chief Counsel, Ameriprise Financial, Inc. since November 2008 and January 2013, respectively (previously Chief Counsel, January 2010-January 2013); Vice President, Chief Legal Officer and Assistant Secretary, Columbia Management Investment Advisers, LLC since May 2010. | |
Thomas P. McGuire
225 Franklin Street
Boston, MA 02110
Born 1972 | | Senior Vice President and Chief Compliance Officer (2012) | | Vice President — Asset Management Compliance, Ameriprise Financial, Inc., since May 2010; Chief Compliance Officer, Ameriprise Certificate Company since September 2010. | |
Colin Moore
225 Franklin Street
Boston, MA 02110
Born 1958 | | Senior Vice President (2010) | | Executive Vice President and Global Chief Investment Officer, Ameriprise Financial, Inc., since July 2013; Executive Vice President, and Global Chief Investment Officer, Columbia Management Investment Advisers, LLC since July 2013 (previously Director and Global Chief Investment Officer, 2010-2013). | |
Michael E. DeFao
225 Franklin Street
Boston, MA 02110
Born 1968 | | Vice President (2011) and Assistant Secretary (2010) | | Vice President and Chief Counsel, Ameriprise Financial, Inc. since May 2010. | |
Amy Johnson
5228 Ameriprise Financial Center
Minneapolis, MN 55474
Born 1965 | | Vice President (2006) | | Managing Director and Global Head of Operations, Columbia Management Investment Advisers, LLC since April 2016 (previously Managing Director and Chief Operating Officer, 2010-2016). | |
Lyn Kephart-Strong
5228 Ameriprise
Financial Center
Minneapolis, MN 55474
Born 1960 | | Vice President (2015) | | President, Columbia Management Investment Services Corp. since October 2014; Vice President & Resolution Officer, Ameriprise Trust Company since August 2009. | |
Ryan C. Larrenaga
225 Franklin Street
Boston, MA 02110
Born 1970 | | Vice President and Secretary (2015) | | Vice President and Group Counsel, Ameriprise Financial, Inc. since August 2011 (previously, Counsel from May 2010 to August 2011); officer of Columbia Funds and affiliated funds since 2005. | |
Annual Report 2016
70
COLUMBIA DIVERSIFIED ABSOLUTE RETURN FUND
IMPORTANT INFORMATION ABOUT THIS REPORT
Each fund mails one shareholder report to each shareholder address. If you would like more than one report, please call shareholder services at 800.345.6611 and additional reports will be sent to you.
The policy of the Board is to vote the proxies of the companies in which each fund holds investments consistent with the procedures as stated in the Statement of Additional Information (SAI). You may obtain a copy of the SAI without charge by calling 800.345.6611; contacting your financial intermediary; visiting columbiathreadneedle.com/us; or searching the website of the Securities and Exchange Commission (SEC) at sec.gov. Information regarding how each fund voted proxies relating to portfolio securities is filed with the SEC by August 31st for the most recent 12-month period ending June 30th of that year, and is available without charge by visiting columbiathreadneedle.com/us, or searching the website of the SEC at sec.gov.
Each fund files a complete schedule of portfolio holdings with the SEC for the first and third quarters of each fiscal year on Form N-Q. Each fund's Form N-Q is available on the SEC's website at sec.gov and may be reviewed and copied at the SEC's Public Reference Room in Washington, D.C. Information on the operation of the Public Reference Room may be obtained by calling 800.SEC.0330. Each fund's complete schedule of portfolio holdings, as filed on Form N-Q, can also be obtained without charge, upon request, by calling 800.345.6611.
You may obtain the current net asset value (NAV) of Fund shares at no cost by calling 800.345.6611 or by sending an e-mail to serviceinquiries@columbiathreadneedle.com.
Annual Report 2016
71
Columbia Diversified Absolute Return Fund
P.O. Box 8081
Boston, MA 02266-8081

This information is for use with concurrent or prior delivery of a fund prospectus. Please read and consider the investment objectives, risks, charges and expenses for any fund carefully before investing. For a prospectus and summary prospectus, which contains this and other important information about the Fund, go to columbiathreadneedle.com/us. The Fund is distributed by Columbia Management Investment Distributors, Inc., member FINRA, and managed by Columbia Management Investment Advisers, LLC.
Columbia Threadneedle Investments (Columbia Threadneedle) is the global brand name of the Columbia and Threadneedle group of companies.
All rights reserved. Columbia Management Investment Distributors, Inc., 225 Franklin Street, Boston, MA 02110-2804
© 2016 Columbia Management Investment Advisers, LLC.
columbiathreadneedle.com/us
ANN258_05_F01_(07/16)

ANNUAL REPORT
May 31, 2016

COLUMBIA DIVIDEND INCOME FUND

ABOUT COLUMBIA THREADNEEDLE INVESTMENTS
Columbia Threadneedle Investments is a leading global asset management group that provides a broad range of actively managed investment strategies and solutions for individual, institutional and corporate clients around the world.
With more than 2,000 people, including over 450 investment professionals based in North America, Europe and Asia, we manage $464 billion* of assets across developed and emerging market equities, fixed income, asset allocation solutions and alternatives. We are the 13th largest manager of long-term mutual fund assets in the U.S.** and the 3rd largest manager of retail funds in the U.K.***
Our priority is the investment success of our clients. We aim to deliver the investment outcomes they expect through an investment approach that is team-based, performance-driven and risk-aware. Our culture is dynamic and interactive. By sharing our insights across asset classes and geographies, we generate richer perspectives on global, regional and local investment landscapes. The ability to exchange and debate investment ideas in a collaborative environment enriches our teams' investment processes. More importantly, it results in better informed investment decisions for our clients.
Columbia funds are distributed by Columbia Management Investment Distributors, Inc., member FINRA, and managed by Columbia Management Investment Advisers, LLC.
Columbia Threadneedle Investments (Columbia Threadneedle) is the global brand name of the Columbia and Threadneedle group of companies.
* In U.S. dollars as of March 31, 2016. Source: Ameriprise Q1 Earnings Release. Includes all assets managed by entities in the Columbia and Threadneedle group of companies. Contact us for more current data.
** Source: ICI as of March 31, 2016 for Columbia Management Investment Advisers, LLC.
*** Source: Investment Association as of December 2015 for Threadneedle Asset Management Limited.
© 2016 Columbia Management Investment Advisers, LLC. All rights reserved.
Not part of the shareholder report
Investment strategies to help meet investor needs
We are committed to helping investors navigate financial challenges to reach their desired outcomes. The possibilities are endless.
Your success is our priority.
Retire comfortably
Fund college or higher education
Leave a legacy
Generate an appropriate stream of income in retirement
Traditional approaches to income may no longer be adequate — and they may no longer provide the diversification benefits they once did. Investors need to rethink how they generate retirement income.
Worried about running out of income? You are not alone.
Navigate a changing interest rate environment
Even in today's challenging interest rate environment, it's still possible to navigate markets and achieve your goals.
Make investment choices designed specifically for this market environment.
Maximize after-tax returns
In an environment where what you keep is more important than what you earn, municipal bonds can help mitigate higher taxes while providing attractive yields compared to other investment options.
You've worked too hard building your wealth to lose it to taxes.
Grow assets to achieve financial goals
Finding growth opportunities in today's complex market environment requires strong research capabilities, creative thinking and a disciplined approach.
Do your investments deliver the portfolio growth you need?
Ease the impact of volatile markets
With increasing concerns about market volatility, investors should consider diversifying their portfolios with non-traditional holdings.
Interested in turning volatility into opportunity?
To find out more, contact your financial professional, call 800.426.3750 or visit columbiathreadneedle.com/us
Not part of the shareholder report
 Dear Shareholders,
Volatility comes with the territory for long-term investors. Some investors instinctively want to pull out of the market or sell underperforming investments at the first sign of increased volatility or perhaps even as soon as they perceive it on the horizon. But taking yourself out of the market could mean losing out on potential opportunities, and putting your longer-term investment goals at risk.
Cumulative return is not just about achieving high returns when markets are going up; it's also about remaining invested and minimizing losses during weak or volatile markets so that you can participate on the upside. Developing a deeper understanding of the various risks your portfolio is subject to can help you balance these risks.
Diversification is critical in seeking to achieve that balance. We believe that most portfolios could be more effectively diversified either by introducing holdings with performance profiles unrelated to existing holdings (like alternative products) or by rebalancing existing holdings with an eye toward risk allocation. Over time, distributing risk more evenly may produce a more pronounced diversification benefit and may improve portfolio efficiency. We believe market volatility can create significant opportunities and, in fact, these periods may be some of the very best times to invest.
With this in mind, I thought it important to highlight excerpts from a piece written by Colin Moore, Global Chief Investment Officer, in which he touches on some of these issues emphasizing the importance of a properly constructed portfolio in seeking to effectively manage volatility and to achieve consistency of returns. I encourage you to read the article in its entirety. To access the full article and for other insights on current market, please visit blog.columbiathreadneedleus.com/latest-perspectives.
You need investments that are designed to help you ease the impact of volatile market environments and keep the savings you have worked tirelessly to amass. Columbia Threadneedle Investments provides investment solutions to help you tackle financial challenges and achieve your desired outcome.
Best regards,

Christopher O. Petersen
President, Columbia Funds
Excerpts from:
Taking the scare out of the volatility bogeyman
By Colin Moore, Global Chief Investment Officer
Colin Moore is the global chief investment officer for Columbia Threadneedle Investments. His responsibilities include ensuring that a disciplined investment process is in place across all asset classes, including equity and fixed income. Mr. Moore joined one of the Columbia Threadneedle Investments legacy firms in 2002 as head of equity and was also head of fixed income and liquidity strategies from 2009 – 2010.

n In today's low growth, higher volatility world, the emphasis is shifting from maximization of returns to consistency of returns.
PRESIDENT'S MESSAGE (continued)
n Portfolios should represent the behavioral risk-return tradeoff of investors, remembering that they won't stay invested to realize the return if we get the risk tolerance wrong.
n Holding long-term savings in cash to avoid volatility (the financial equivalent of hiding under the sheets) is detrimental to achieving long-term goals.
According to Wikipedia, "The bogeyman is a common allusion to a mythical creature in many cultures used to control behavior. This monster has no specific appearance, and conceptions about it can vary drastically from household to household within the same community; in many cases he has no set appearance in the mind of an adult or child, but is simply a non-specific embodiment of terror." Different cultures have different names and physical representations for the bogeyman, and investors are no different. We have terrible monsters that we fear may destroy our portfolios, and we call one of the scariest of them volatility.
While the bogeyman is mythical (I hope!), volatility is real and can cause serious damage. To understand why investors have such a hard time coping with volatility, we first need to define three cognitive biases at work in today's investment environment:
1) Recency bias — something that has recently come to the forefront of our attention, regardless of how long established it is, suddenly seems to appear with improbable frequency.
2) Negativity bias — we tend to have a greater recall of unpleasant memories than positive memories.
3) Loss aversion — our dissatisfaction with losing money tends to be greater than our satisfaction with making money.
The level of volatility varies dramatically, and so does investor fear and panic selling — waxing when volatility rises, waning when it falls. Recent studies have pointed to demographics as an important driver of panic selling. The theory is that as people get closer to retirement, the prospects of a large (20% – 30%) loss in financial assets can have a much more pronounced effect on their sense of well-being. Wealth preservation instincts kick in much more quickly than for younger (and typically less wealthy) savers.
The reality is that there is little opportunity for return without volatility. Therefore, the bogeyman effect of holding long-term savings in cash to avoid volatility (the financial equivalent of hiding under the sheets) is detrimental to achieving long-term goals. This effect tends to be more pronounced during the episodic spikes in volatility. The significant spike in volatility in 2008 and 2009 led to significant withdrawals from long-term investment funds over the same period. Less pronounced effects can also be seen when comparing 2001 – 2003 and 2011 – 2012. Conversely, flows picked up when volatility returned to "normal" levels. Investor behavior of this type is consistent with the three behavioral biases.
I believe average volatility will be higher over the next 10 years than the last 10 years and episodic spikes will increase in frequency because sustainable economic growth will be structurally lower and geopolitical risk higher than any time since World War II. Low growth creates uncertainty while loss aversion will make investors fear that we are one economic mishap or geopolitical event away from no growth or recession. The result will be higher volatility on average. Negativity bias will tend to exacerbate "spike" reactions to event-driven geopolitical news, and the volatility bogeyman will appear more often. Assuming the behavioral biases continue, investor returns are likely to be very disappointing regardless of the total return generated by financial markets due to the bogeyman effect.
To mitigate this effect, we need to focus on portfolio construction and an improved understanding of diversification. I accept that equities are likely to offer the highest return over the next 10 years, but they also offer the highest volatility. Many portfolio construction optimization tools use historical average volatility, which is likely to underestimate the volatility investors will face. The bogeyman emerges when individual asset class volatility spikes and cross correlations rise, the combination of which increases overall portfolio volatility far beyond expectation. Diversification is meant to protect investors against volatility, but what's the point of owning lots of investments if the volatility bogeyman has not been properly estimated?
Most importantly, portfolios should be constructed to properly represent the behavioral risk-return tradeoff of investors, remembering that they won't stay invested to realize the return if we get the risk tolerance wrong. In a low growth, higher volatility world, the emphasis is shifting to return consistency rather than return maximization,
PRESIDENT'S MESSAGE (continued)
and investors are best served through investment approaches that appreciate that distinction. Even though it's a permanent feature of financial markets, volatility is less likely to be the bogeyman we all fear if portfolios are constructed with this understanding.
Please visit blog.columbiathreadneedleus.com/latest-perspectives to read the entire article.
Investors should consider the investment objectives, risks, charges and expenses of a mutual fund carefully before investing. For a free prospectus and summary prospectus, which contains this and other important information about a fund, visit columbiathreadneedle.com/us. The prospectus should be read carefully before investing.
The views expressed are as of April 2016, may change as market or other conditions change, and may differ from views expressed by other Columbia Management Investment Advisers, LLC (CMIA) associates or affiliates. Actual investments or investment decisions made by CMIA and its affiliates, whether for its own account or on behalf of clients, will not necessarily reflect the views expressed. This information is not intended to provide investment advice and does not account for individual investor circumstances. Investment decisions should always be made based on an investor's specific financial needs, objectives, goals, time horizon and risk tolerance. Asset classes described may not be suitable for all investors.
Past performance does not guarantee future results, and no forecast should be considered a guarantee either. Since economic and market conditions change frequently, there can be no assurance that the trends described here will continue or that the forecasts are accurate.
Diversification does not guarantee a profit or protect against loss.
Columbia Funds are distributed by Columbia Management Investment Distributors, Inc., member FINRA, and managed by Columbia Management Investment Advisers, LLC.
© 2016 Columbia Management Investment Advisers, LLC. All rights reserved.
COLUMBIA DIVIDEND INCOME FUND
Performance Overview | | | 2 | | |
Manager Discussion of Fund Performance | | | 4 | | |
Understanding Your Fund's Expenses | | | 7 | | |
Portfolio of Investments | | | 8 | | |
Statement of Assets and Liabilities | | | 13 | | |
Statement of Operations | | | 15 | | |
Statement of Changes in Net Assets | | | 16 | | |
Financial Highlights | | | 19 | | |
Notes to Financial Statements | | | 30 | | |
Report of Independent Registered Public Accounting Firm | | | 38 | | |
Federal Income Tax Information | | | 39 | | |
Trustees and Officers | | | 40 | | |
Important Information About This Report | | | 45 | | |
Fund Investment Manager
Columbia Management Investment
Advisers, LLC
225 Franklin Street
Boston, MA 02110
Fund Distributor
Columbia Management Investment
Distributors, Inc.
225 Franklin Street
Boston, MA 02110
Fund Transfer Agent
Columbia Management Investment
Services Corp.
P.O. Box 8081
Boston, MA 02266-8081
For more information about any of the funds, please visit columbiathreadneedle.com/us or call 800.345.6611. Customer Service Representatives are available to answer your questions Monday through Friday from 8 a.m. to 7 p.m. Eastern time.
The views expressed in this report reflect the current views of the respective parties. These views are not guarantees of future performance and involve certain risks, uncertainties and assumptions that are difficult to predict, so actual outcomes and results may differ significantly from the views expressed. These views are subject to change at any time based upon economic, market or other conditions and the respective parties disclaim any responsibility to update such views. These views may not be relied on as investment advice and, because investment decisions for a Columbia fund are based on numerous factors, may not be relied on as an indication of trading intent on behalf of any particular Columbia fund. References to specific securities should not be construed as a recommendation or investment advice.
COLUMBIA DIVIDEND INCOME FUND
Performance Summary
n Columbia Dividend Income Fund (the Fund) Class A shares returned 4.42% excluding sales charges for the 12-month period that ended May 31, 2016.
n The Fund outperformed its benchmark, the Russell 1000 Index, which returned 0.78% for the same time period.
n The Fund's emphasis on quality provided downside protection during two major market downdrafts and solid results relative to its benchmark.
Average Annual Total Returns (%) (for period ended May 31, 2016)
| | | Inception | | 1 Year | | 5 Years | | 10 Years | |
Class A | | 11/25/02 | | | | | | | | | | | | | |
Excluding sales charges | | | | | | | 4.42 | | | | 10.92 | | | | 7.93 | | |
Including sales charges | | | | | | | -1.56 | | | | 9.62 | | | | 7.30 | | |
Class B | | 11/25/02 | | | | | | | | | | | | | |
Excluding sales charges | | | | | | | 3.62 | | | | 10.08 | | | | 7.12 | | |
Including sales charges | | | | | | | -1.20 | | | | 9.81 | | | | 7.12 | | |
Class C | | 11/25/02 | | | | | | | | | | | | | |
Excluding sales charges | | | | | | | 3.62 | | | | 10.09 | | | | 7.12 | | |
Including sales charges | | | | | | | 2.66 | | | | 10.09 | | | | 7.12 | | |
Class I* | | 09/27/10 | | | 4.88 | | | | 11.37 | | | | 8.31 | | |
Class R* | | 03/28/08 | | | 4.15 | | | | 10.64 | | | | 7.67 | | |
Class R4* | | 11/08/12 | | | 4.67 | | | | 11.19 | | | | 8.20 | | |
Class R5* | | 11/08/12 | | | 4.88 | | | | 11.31 | | | | 8.26 | | |
Class T | | 03/04/98 | | | | | | | | | | | | | |
Excluding sales charges | | | | | | | 4.42 | | | | 10.87 | | | | 7.89 | | |
Including sales charges | | | | | | | -1.57 | | | | 9.57 | | | | 7.25 | | |
Class W* | | 09/27/10 | | | 4.43 | | | | 10.92 | | | | 7.95 | | |
Class Y* | | 11/08/12 | | | 4.87 | | | | 11.34 | | | | 8.27 | | |
Class Z | | 03/04/98 | | | 4.69 | | | | 11.20 | | | | 8.20 | | |
Russell 1000 Index | | | | | | | 0.78 | | | | 11.44 | | | | 7.50 | | |
Returns for Class A and Class T are shown with and without the maximum initial sales charge of 5.75%. Returns for Class B are shown with and without the applicable contingent deferred sales charge (CDSC) of 5.00% in the first year, declining to 1.00% in the sixth year and eliminated thereafter. Returns for Class C are shown with and without the 1.00% CDSC for the first year only. The Fund's other classes are not subject to sales charges and have limited eligibility. Please see the Fund's prospectus for details. Performance for different share classes will vary based on differences in sales charges and fees associated with each class. All results shown assume reinvestment of distributions during the period. Returns do not reflect the deduction of taxes that a shareholder may pay on Fund distributions or on the redemption of Fund shares. Performance results reflect the effect of any fee waivers or reimbursements of Fund expenses by Columbia Management Investment Advisers, LLC and/or any of its affiliates. Absent these fee waivers or expense reimbursement arrangements, performance results would have been lower.
The performance information shown represents past performance and is not a guarantee of future results. The investment return and principal value of your investment will fluctuate so that your shares, when redeemed, may be worth more or less than their original cost. Current performance may be lower or higher than the performance information shown. You may obtain performance information current to the most recent month-end by contacting your financial intermediary, visiting columbiathreadneedle.com/us or calling 800.345.6611.
*The returns shown for periods prior to the share class inception date (including returns for the Life of the Fund, if shown, which are since Fund inception) include the returns of the Fund's oldest share class. Since the Fund launched more than one share class at its inception, Class Z shares were used. These returns are adjusted to reflect any higher class-related operating expenses of the newer share classes, as applicable. Please visit columbiathreadneedle.com/us/investment-products/mutual-funds/appended-performance for more information.
The Russell 1000 Index measures the performance of the large-cap segment of the U.S. equity universe. It is a subset of the Russell 3000 Index and includes approximately 1000 of the largest securities based on a combination of their market cap and current index membership. The Russell 1000 Index represents approximately 92% of the U.S. market.
Indices are not available for investment, are not professionally managed and do not reflect sales charges, fees, brokerage commissions, taxes or other expenses of investing. Securities in the Fund may not match those in an index.
Annual Report 2016
2
COLUMBIA DIVIDEND INCOME FUND
PERFORMANCE OVERVIEW (continued)
Performance of a Hypothetical $10,000 Investment (June 1, 2006 – May 31, 2016)
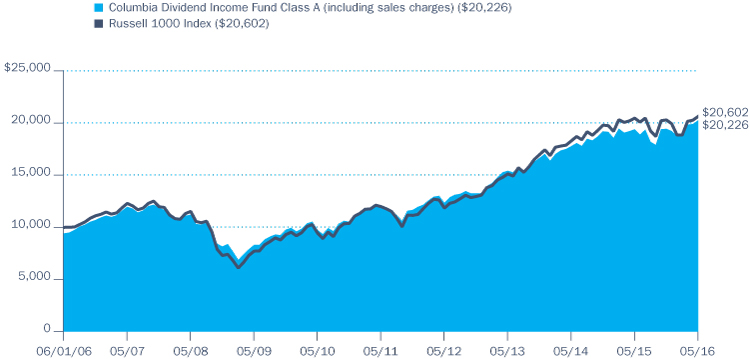
The chart above shows the change in value of a hypothetical $10,000 investment in Class A shares of Columbia Dividend Income Fund during the stated time period, and does not reflect the deduction of taxes that a shareholder may pay on Fund distributions or on the redemption of Fund shares.
Annual Report 2016
3
COLUMBIA DIVIDEND INCOME FUND
MANAGER DISCUSSION OF FUND PERFORMANCE
Portfolio Management
Scott Davis
Michael Barclay, CFA
Peter Santoro, CFA
Morningstar Style BoxTM

The Morningstar Style BoxTM is based on a fund's portfolio holdings. For equity funds, the vertical axis shows the market capitalization of the stocks owned, and the horizontal axis shows investment style (value, blend, or growth). Information shown is based on the most recent data provided by Morningstar.
© 2016 Morningstar, Inc. All rights reserved. The Morningstar information contained herein: (1) is proprietary to Morningstar and/or its content providers; (2) may not be copied or distributed; and (3) is not warranted to be accurate, complete or timely. Neither Morningstar nor its content providers are responsible for any damages or losses arising from any use of this information.
Top Ten Holdings (%)
(at May 31, 2016) | |
Microsoft Corp. | | | 4.1 | | |
Exxon Mobil Corp. | | | 3.6 | | |
Johnson & Johnson | | | 3.4 | | |
JPMorgan Chase & Co. | | | 2.9 | | |
Merck & Co., Inc. | | | 2.6 | | |
Home Depot, Inc. (The) | | | 2.6 | | |
Philip Morris International, Inc. | | | 2.5 | | |
Comcast Corp., Class A | | | 2.4 | | |
Verizon Communications, Inc. | | | 2.4 | | |
Pfizer, Inc. | | | 2.3 | | |
Percentages indicated are based upon total investments (excluding Money Market Funds).
For further detail about these holdings, please refer to the section entitled "Portfolio of Investments."
Fund holdings are as of the date given, are subject to change at any time, and are not recommendations to buy or sell any security.
For the 12-month period that ended May 31, 2016, the Fund's Class A shares returned 4.42% excluding sales charges. The Fund outperformed its benchmark, the Russell 1000 Index, which returned 0.78% over the same period. The Fund's emphasis on quality provided downside protection during two major market downdrafts and solid results relative to its benchmark. Stock selection was strong across all sectors. Financials, health care and consumer staples were the Fund's top contributors during the period.
Bad Start, Good Finish: Investor Sentiment Drove Markets
During the first half of the 12-month period ended May 31, 2016, lackluster economic growth, contentious geopolitical conflicts and a shift in U.S. monetary policy weighed on investor confidence. Subpar global economic growth continued for a fourth straight year, with China's slowdown heading the list of disappointments. Conflicts in the Middle East and terrorism, both at home and abroad, heightened security fears. Plummeting oil prices and a rising dollar rounded the list of mounting pressures in 2015.
However, both oil and the dollar reversed course in the first half of 2016. The U.S. economy continued to expand modestly, and economic growth in Europe picked up, if ever so slightly. The U.S. manufacturing sector regained some traction in the final months of the period, and the U.S. labor markets recovered to full employment for the first time since the Great Recession. In May, the unemployment rate fell to 4.7% (Source: U.S. Bureau of Labor Statistics) even though the number of new jobs added in May was surprisingly low. The lower unemployment figure reflected a significant fall-off in the number of workers seeking employment. The sharp fall-off in new jobs added in April and May likely reflected the difficulty employers have had in filling jobs that target skilled, highly educated workers. The Federal Reserve (the Fed) responded cautiously to the weak jobs reports. After raising the target range of its benchmark interest rate by a quarter of a point to between 0.25% and 0.50% in December 2015, it took no further action in the first half of 2016.
In a risk-adverse environment, stocks fell sharply in the first half of the period then rebounded as investors grew more confident in the second half. Despite two major downdrafts, the S&P 500 Index rose 1.72% for the 12 months ended May 31, 2016. Large-company stocks outperformed small- and mid-cap stocks while value stocks outperformed growth stocks for the period. Bonds generally outperformed stocks. The Barclays U.S. Aggregate Bond Index rose 2.99%.
Contributors and Detractors
In the financials sector, we did well to stay away from money center banks, which suffered in absence of higher rates as a catalyst for earnings growth and in the presence of volatile capital markets and concerns about exposure to energy-related credits. Instead, we emphasized non-bank financials, which included these significant gainers: Public Storage, a self-storage real estate investment trust and insurance companies Ace, Chubb
Annual Report 2016
4
COLUMBIA DIVIDEND INCOME FUND
MANAGER DISCUSSION OF FUND PERFORMANCE (continued)
and Marsh McLennan. Public Storage made a solid contribution to returns as it used its sizeable market share to raise prices. Early in the period, Ace announced its intention to buy Chubb. The market took a favorable view that the merger of the two companies with complimentary strengths has the potential to produce a strong, global franchise. We owned both names in the portfolio and both delivered strong gains after the announcement of the deal. Marsh McLennan's balanced business mix continued to produce solid top line growth and strong free cash flow, which the company has returned to shareholders via buybacks and an increasing dividend.
In the health care sector, the Fund was overweight relative to the benchmark in Johnson & Johnson, a solid dividend payer with an AAA-rated balance sheet. Pharmaceuticals drove earnings and sales for the company and helped it perform well in an uncertain market. Pharmaceutical giant Bristol-Myers Squibb did well as its immunotherapy cancer treatment Optiva received approval for lung cancer in the fourth quarter of 2015. Not owning Allergan also aided relative performance as Pfizer's termination of the planned merger with Allergan caused a decline in the market valuation of Allergan's shares. Our decision to sell Gilead and Amgen also aided relative performance given the weakness experienced in biotechnology stocks in the first quarter of 2016.
In the consumer staples sector, the Fund was overweight in tobacco stocks, which were attractive to investors looking for bond proxies in a low-rate environment. Altria and Phillip Morris, both high-yielding names, kept costs under control and benefited from pricing gains and continued innovation that led to market share gains. Altria had an added kicker: it owns a large stake of SABMiller, the world's second largest brewer of beer. SAB received a takeover bid from Anheuser Busch InBev, which bolstered Altria's gains. Also in the staples sector, Coca-Cola Enterprises and General Mills did well. Coca-Cola Enterprises announced a proposed merger with two other large Coca-Cola bottlers to create a new company, Coca-Cola European Partners. Investors were excited about the scale and synergies associated with covering the bottling needs for Coca-Cola in all of Western Europe. General Mills shares rose on positive execution. Although sales growth remained challenged, the company's margin improvement, through procurement and other cost cutting measures, was impressive.
The Fund had its share of disappointments in the energy sector, which was down for the period. However, our strategy of sticking with companies with strong balance sheets and free cash flow helped us avoid the companies most exposed to declining commodity prices. In fact, there were no major detractors from relative results for the period. The Fund gave up some ground by not owning Amazon, Facebook, Netflix and Google. However, it cannot own these stocks because they don't pay dividends. They were all big winners for the period. Yet, the Fund outperformed without them, which speaks well of the execution of our strategy.
Portfolio Breakdown (%)
(at May 31, 2016) | |
Common Stocks | | | 93.7 | | |
Convertible Preferred Stocks | | | 0.2 | | |
Exchange-Traded Funds | | | 1.9 | | |
Money Market Funds | | | 4.2 | | |
Total | | | 100.0 | | |
Percentages indicated are based upon total investments. The Fund's portfolio composition is subject to change.
Equity Sector Breakdown (%)
(at May 31, 2016) | |
Consumer Discretionary | | | 9.4 | | |
Consumer Staples | | | 12.8 | | |
Energy | | | 8.8 | | |
Financials | | | 20.1 | | |
Health Care | | | 12.5 | | |
Industrials | | | 12.5 | | |
Information Technology | | | 13.7 | | |
Materials | | | 2.4 | | |
Telecommunication Services | | | 2.4 | | |
Utilities | | | 5.4 | | |
Total | | | 100.0 | | |
Percentages indicated are based upon total equity investments. The Fund's portfolio composition is subject to change.
Annual Report 2016
5
COLUMBIA DIVIDEND INCOME FUND
MANAGER DISCUSSION OF FUND PERFORMANCE (continued)
Investment Risks
Market risk may affect a single issuer, sector of the economy, industry or the market as a whole. Value securities may be unprofitable if the market fails to recognize their intrinsic worth or the portfolio manager misgauged that worth. Foreign investments subject the Fund to risks, including political, economic, market, social and others within a particular country, as well as to currency instabilities and less stringent financial and accounting standards generally applicable to U.S. issuers. Dividend payments are not guaranteed and the amount, if any, can vary over time. A rise in interest rates may result in a price decline of fixed-income instruments held by the Fund, negatively impacting its performance and NAV. Falling rates may result in the Fund investing in lower yielding debt instruments, lowering the Fund's income and yield. These risks may be heightened for longer maturity and duration securities. The Fund may invest significantly in issuers within a particular sector, which may be negatively affected by market, economic or other conditions, making the Fund more vulnerable to unfavorable developments in the sector. See the Fund's prospectus for more information on these and other risks.
At Period's End
We believe that our consistent emphasis on quality and our focus on the longer term help us navigate in difficult times. Regardless of the environment, we emphasize higher quality companies, with healthy free cash flows and records of paying dividends. This is a relative conservative process that pays careful attention to risk as well as opportunity and has aided us in seeking good risk-adjusted terms over the longer term.
Annual Report 2016
6
COLUMBIA DIVIDEND INCOME FUND
UNDERSTANDING YOUR FUND'S EXPENSES
(Unaudited)
As an investor, you incur two types of costs. There are transaction costs, which generally include sales charges on purchases and may include redemption fees. There are also ongoing costs, which generally include management fees, distribution and/or service fees, and other fund expenses. The following information is intended to help you understand your ongoing costs (in dollars) of investing in the Fund and to help you compare these costs with the ongoing costs of investing in other mutual funds.
Analyzing Your Fund's Expenses
To illustrate these ongoing costs, we have provided examples and calculated the expenses paid by investors in each share class of the Fund during the period. The actual and hypothetical information in the table is based on an initial investment of $1,000 at the beginning of the period indicated and held for the entire period. Expense information is calculated two ways and each method provides you with different information. The amount listed in the "Actual" column is calculated using the Fund's actual operating expenses and total return for the period. You may use the Actual information, together with the amount invested, to estimate the expenses that you paid over the period. Simply divide your account value by $1,000 (for example, an $8,600 account value divided by $1,000 = 8.6), then multiply the results by the expenses paid during the period under the "Actual" column. The amount listed in the "Hypothetical" column assumes a 5% annual rate of return before expenses (which is not the Fund's actual return) and then applies the Fund's actual expense ratio for the period to the hypothetical return. You should not use the hypothetical account values and expenses to estimate either your actual account balance at the end of the period or the expenses you paid during the period. See "Compare With Other Funds" below for details on how to use the hypothetical data.
Compare With Other Funds
Since all mutual funds are required to include the same hypothetical calculations about expenses in shareholder reports, you can use this information to compare the ongoing cost of investing in the Fund with other funds. To do so, compare the hypothetical example with the 5% hypothetical examples that appear in the shareholder reports of other funds. As you compare hypothetical examples of other funds, it is important to note that hypothetical examples are meant to highlight the ongoing costs of investing in a fund only and do not reflect any transaction costs, such as sales charges, or redemption or exchange fees. Therefore, the hypothetical calculations are useful in comparing ongoing costs only, and will not help you determine the relative total costs of owning different funds. If transaction costs were included in these calculations, your costs would be higher.
December 1, 2015 – May 31, 2016
| | | Account Value at the Beginning
of the Period ($) | | Account Value at the End of the
Period ($) | | Expenses Paid During the
Period ($) | | Fund's Annualized
Expense Ratio (%) | |
| | | Actual | | Hypothetical | | Actual | | Hypothetical | | Actual | | Hypothetical | | Actual | |
Class A | | | 1,000.00 | | | | 1,000.00 | | | | 1,041.80 | | | | 1,019.90 | | | | 5.21 | | | | 5.15 | | | | 1.02 | | |
Class B | | | 1,000.00 | | | | 1,000.00 | | | | 1,037.80 | | | | 1,016.15 | | | | 9.02 | | | | 8.92 | | | | 1.77 | | |
Class C | | | 1,000.00 | | | | 1,000.00 | | | | 1,037.80 | | | | 1,016.15 | | | | 9.02 | | | | 8.92 | | | | 1.77 | | |
Class I | | | 1,000.00 | | | | 1,000.00 | | | | 1,043.90 | | | | 1,022.05 | | | | 3.01 | | | | 2.98 | | | | 0.59 | | |
Class R | | | 1,000.00 | | | | 1,000.00 | | | | 1,040.40 | | | | 1,018.65 | | | | 6.48 | | | | 6.41 | | | | 1.27 | | |
Class R4 | | | 1,000.00 | | | | 1,000.00 | | | | 1,043.00 | | | | 1,021.15 | | | | 3.93 | | | | 3.89 | | | | 0.77 | | |
Class R5 | | | 1,000.00 | | | | 1,000.00 | | | | 1,044.20 | | | | 1,021.80 | | | | 3.27 | | | | 3.23 | | | | 0.64 | | |
Class T | | | 1,000.00 | | | | 1,000.00 | | | | 1,041.70 | | | | 1,019.90 | | | | 5.21 | | | | 5.15 | | | | 1.02 | | |
Class W | | | 1,000.00 | | | | 1,000.00 | | | | 1,041.80 | | | | 1,019.90 | | | | 5.21 | | | | 5.15 | | | | 1.02 | | |
Class Y | | | 1,000.00 | | | | 1,000.00 | | | | 1,043.90 | | | | 1,022.05 | | | | 3.01 | | | | 2.98 | | | | 0.59 | | |
Class Z | | | 1,000.00 | | | | 1,000.00 | | | | 1,043.00 | | | | 1,021.15 | | | | 3.93 | | | | 3.89 | | | | 0.77 | | |
Expenses paid during the period are equal to the annualized expense ratio for each class as indicated above, multiplied by the average account value over the period and then multiplied by the number of days in the Fund's most recent fiscal half year and divided by 366.
Expenses do not include fees and expenses incurred indirectly by the Fund from its investment in underlying funds, including affiliated and non-affiliated pooled investment vehicles, such as mutual funds and exchange-traded funds.
Annual Report 2016
7
COLUMBIA DIVIDEND INCOME FUND
PORTFOLIO OF INVESTMENTS
May 31, 2016
(Percentages represent value of investments compared to net assets)
Common Stocks 94.3%
Issuer | | Shares | | Value ($) | |
CONSUMER DISCRETIONARY 8.9% | |
Distributors 0.6% | |
Genuine Parts Co. | | | 580,000 | | | | 56,213,600 | | |
Hotels, Restaurants & Leisure 0.9% | |
McDonald's Corp. | | | 688,500 | | | | 84,038,310 | | |
Media 3.5% | |
Comcast Corp., Class A | | | 3,328,800 | | | | 210,713,040 | | |
Interpublic Group of Companies, Inc. (The) | | | 145,385 | | | | 3,474,701 | | |
Time Warner, Inc. | | | 1,326,000 | | | | 100,325,160 | | |
Total | | | | | 314,512,901 | | |
Specialty Retail 3.4% | |
Foot Locker, Inc. | | | 522,000 | | | | 29,190,240 | | |
Home Depot, Inc. (The) | | | 1,700,000 | | | | 224,604,000 | | |
TJX Companies, Inc. (The) | | | 740,000 | | | | 56,328,800 | | |
Total | | | | | 310,123,040 | | |
Textiles, Apparel & Luxury Goods 0.5% | |
VF Corp. | | | 658,800 | | | | 41,056,416 | | |
Total Consumer Discretionary | | | | | 805,944,267 | | |
CONSUMER STAPLES 12.1% | |
Beverages 1.8% | |
Coca-Cola European Partners PLC | | | 805,000 | | | | 31,242,050 | | |
PepsiCo, Inc. | | | 1,338,500 | | | | 135,416,045 | | |
Total | | | | | 166,658,095 | | |
Food & Staples Retailing 2.7% | |
CVS Health Corp. | | | 1,852,000 | | | | 178,625,400 | | |
Wal-Mart Stores, Inc. | | | 922,000 | | | | 65,259,160 | | |
Total | | | | | 243,884,560 | | |
Food Products 1.1% | |
General Mills, Inc. | | | 1,570,000 | | | | 98,564,600 | | |
Household Products 2.0% | |
Kimberly-Clark Corp. | | | 620,000 | | | | 78,764,800 | | |
Procter & Gamble Co. (The) | | | 1,260,000 | | | | 102,110,400 | | |
Total | | | | | 180,875,200 | | |
Tobacco 4.5% | |
Altria Group, Inc. | | | 2,900,000 | | | | 184,556,000 | | |
Philip Morris International, Inc. | | | 2,230,000 | | | | 220,056,400 | | |
Total | | | | | 404,612,400 | | |
Total Consumer Staples | | | | | 1,094,594,855 | | |
Common Stocks (continued)
Issuer | | Shares | | Value ($) | |
ENERGY 8.1% | |
Energy Equipment & Services 1.6% | |
Schlumberger Ltd. | | | 1,898,800 | | | | 144,878,440 | | |
Oil, Gas & Consumable Fuels 6.5% | |
Chevron Corp. | | | 1,180,000 | | | | 119,180,000 | | |
Exxon Mobil Corp. | | | 3,500,000 | | | | 311,570,000 | | |
Occidental Petroleum Corp. | | | 1,025,000 | | | | 77,326,000 | | |
Suncor Energy, Inc. | | | 818,500 | | | | 22,631,525 | | |
Valero Energy Corp. | | | 1,042,000 | | | | 56,997,400 | | |
Total | | | | | 587,704,925 | | |
Total Energy | | | | | 732,583,365 | | |
FINANCIALS 19.0% | |
Banks 8.1% | |
Bank of America Corp. | | | 4,625,000 | | | | 68,403,750 | | |
JPMorgan Chase & Co. | | | 3,866,600 | | | | 252,372,982 | | |
PNC Financial Services Group, Inc. (The) | | | 1,312,825 | | | | 117,812,915 | | |
U.S. Bancorp | | | 2,162,000 | | | | 92,576,840 | | |
Wells Fargo & Co. | | | 3,940,000 | | | | 199,836,800 | | |
Total | | | | | 731,003,287 | | |
Capital Markets 2.7% | |
BlackRock, Inc. | | | 320,550 | | | | 116,632,118 | | |
Northern Trust Corp. | | | 1,036,000 | | | | 76,767,600 | | |
T. Rowe Price Group, Inc. | | | 709,000 | | | | 54,635,540 | | |
Total | | | | | 248,035,258 | | |
Diversified Financial Services 1.2% | |
CME Group, Inc. | | | 1,100,636 | | | | 107,741,258 | | |
Insurance 3.4% | |
Chubb Ltd. | | | 1,280,000 | | | | 162,060,800 | | |
Marsh & McLennan Companies, Inc. | | | 2,192,000 | | | | 144,825,440 | | |
Total | | | | | 306,886,240 | | |
Real Estate Investment Trusts (REITs) 3.6% | |
AvalonBay Communities, Inc. | | | 311,000 | | | | 55,942,680 | | |
Crown Castle International Corp. | | | 377,500 | | | | 34,280,775 | | |
Duke Realty Corp. | | | 1,206,500 | | | | 28,557,855 | | |
Essex Property Trust, Inc. | | | 146,675 | | | | 33,328,960 | | |
Public Storage | | | 455,000 | | | | 115,438,050 | | |
Simon Property Group, Inc. | | | 301,000 | | | | 59,489,640 | | |
Total | | | | | 327,037,960 | | |
Total Financials | | | | | 1,720,704,003 | | |
The accompanying Notes to Financial Statements are an integral part of this statement.
Annual Report 2016
8
COLUMBIA DIVIDEND INCOME FUND
PORTFOLIO OF INVESTMENTS (continued)
May 31, 2016
Common Stocks (continued)
Issuer | | Shares | | Value ($) | |
HEALTH CARE 11.9% | |
Biotechnology 1.2% | |
AbbVie, Inc. | | | 1,644,000 | | | | 103,456,920 | | |
Health Care Equipment & Supplies 0.5% | |
Medtronic PLC | | | 552,000 | | | | 44,424,960 | | |
Health Care Providers & Services 0.7% | |
Aetna, Inc. | | | 186,800 | | | | 21,151,364 | | |
UnitedHealth Group, Inc. | | | 338,500 | | | | 45,247,295 | | |
Total | | | | | 66,398,659 | | |
Pharmaceuticals 9.5% | |
Bristol-Myers Squibb Co. | | | 1,828,000 | | | | 131,067,600 | | |
Johnson & Johnson | | | 2,600,000 | | | | 292,994,000 | | |
Merck & Co., Inc. | | | 4,080,000 | | | | 229,540,800 | | |
Pfizer, Inc. | | | 5,895,000 | | | | 204,556,500 | | |
Total | | | | | 858,158,900 | | |
Total Health Care | | | | | 1,072,439,439 | | |
INDUSTRIALS 11.8% | |
Aerospace & Defense 6.0% | |
Boeing Co. (The) | | | 344,491 | | | | 43,457,540 | | |
General Dynamics Corp. | | | 837,889 | | | | 118,871,312 | | |
Honeywell International, Inc. | | | 1,630,397 | | | | 185,588,091 | | |
Lockheed Martin Corp. | | | 651,245 | | | | 153,843,606 | | |
United Technologies Corp. | | | 423,716 | | | | 42,617,355 | | |
Total | | | | | 544,377,904 | | |
Air Freight & Logistics 1.6% | |
United Parcel Service, Inc., Class B | | | 1,391,860 | | | | 143,486,847 | | |
Commercial Services & Supplies 0.9% | |
Waste Management, Inc. | | | 1,363,171 | | | | 83,085,272 | | |
Industrial Conglomerates 2.1% | |
General Electric Co. | | | 6,295,699 | | | | 190,318,981 | | |
Machinery 1.2% | |
Dover Corp. | | | 756,654 | | | | 50,506,655 | | |
Parker-Hannifin Corp. | | | 522,500 | | | | 60,003,900 | | |
Total | | | | | 110,510,555 | | |
Total Industrials | | | | | 1,071,779,559 | | |
INFORMATION TECHNOLOGY 12.9% | |
Communications Equipment 1.8% | |
Cisco Systems, Inc. | | | 5,800,000 | | | | 168,490,000 | | |
Common Stocks (continued)
Issuer | | Shares | | Value ($) | |
IT Services 1.2% | |
Automatic Data Processing, Inc. | | | 1,232,000 | | | | 108,218,880 | | |
Semiconductors & Semiconductor Equipment 3.2% | |
Intel Corp. | | | 2,840,000 | | | | 89,715,600 | | |
KLA-Tencor Corp. | | | 630,000 | | | | 45,945,900 | | |
Lam Research Corp. | | | 300,000 | | | | 24,843,000 | | |
Microchip Technology, Inc. | | | 515,000 | | | | 26,615,200 | | |
Texas Instruments, Inc. | | | 1,642,500 | | | | 99,535,500 | | |
Total | | | | | 286,655,200 | | |
Software 4.5% | |
Activision Blizzard, Inc. | | | 1,300,000 | | | | 51,038,000 | | |
Microsoft Corp. | | | 6,685,000 | | | | 354,305,000 | | |
Total | | | | | 405,343,000 | | |
Technology Hardware, Storage & Peripherals 2.2% | |
Apple, Inc. | | | 2,026,500 | | | | 202,366,290 | | |
Total Information Technology | | | | | 1,171,073,370 | | |
MATERIALS 2.2% | |
Chemicals 1.6% | |
Dow Chemical Co. (The) | | | 486,500 | | | | 24,986,640 | | |
LyondellBasell Industries NV, Class A | | | 675,000 | | | | 54,918,000 | | |
Sherwin-Williams Co. (The) | | | 228,650 | | | | 66,557,729 | | |
Total | | | | | 146,462,369 | | |
Containers & Packaging 0.6% | |
Sonoco Products Co. | | | 1,146,000 | | | | 54,629,820 | | |
Total Materials | | | | | 201,092,189 | | |
TELECOMMUNICATION SERVICES 2.3% | |
Diversified Telecommunication Services 2.3% | |
Verizon Communications, Inc. | | | 4,100,000 | | | | 208,690,000 | | |
Total Telecommunication Services | | | | | 208,690,000 | | |
UTILITIES 5.1% | |
Electric Utilities 2.6% | |
American Electric Power Co., Inc. | | | 892,500 | | | | 57,771,525 | | |
Eversource Energy | | | 1,049,500 | | | | 57,974,380 | | |
NextEra Energy, Inc. | | | 525,000 | | | | 63,063,000 | | |
PG&E Corp. | | | 848,225 | | | | 50,961,358 | | |
Total | | | | | 229,770,263 | | |
The accompanying Notes to Financial Statements are an integral part of this statement.
Annual Report 2016
9
COLUMBIA DIVIDEND INCOME FUND
PORTFOLIO OF INVESTMENTS (continued)
May 31, 2016
Common Stocks (continued)
Issuer | | Shares | | Value ($) | |
Multi-Utilities 2.5% | |
CMS Energy Corp. | | | 1,605,000 | | | | 67,121,100 | | |
Dominion Resources, Inc. | | | 705,000 | | | | 50,936,250 | | |
Sempra Energy | | | 438,000 | | | | 46,918,560 | | |
WEC Energy Group, Inc. | | | 1,042,500 | | | | 62,695,950 | | |
Total | | | | | 227,671,860 | | |
Total Utilities | | | | | 457,442,123 | | |
Total Common Stocks
(Cost: $5,900,950,877) | | | | | 8,536,343,170 | | |
Convertible Preferred Stocks 0.3%
ENERGY 0.3% | |
Oil, Gas & Consumable Fuels 0.3% | |
Hess Corp., 8.000% | | | 284,000 | | | | 21,603,880 | | |
Total Energy | | | | | 21,603,880 | | |
Total Convertible Preferred Stocks
(Cost: $16,010,572) | | | | | 21,603,880 | | |
Exchange-Traded Funds 1.9%
| | | Shares | | Value ($) | |
SPDR S&P 500 ETF Trust | | | 820,000 | | | | 172,265,600 | | |
Total Exchange-Traded Funds
(Cost: $168,946,376) | | | | | 172,265,600 | | |
Money Market Funds 4.2%
Columbia Short-Term Cash Fund,
0.434%(a)(b) | | | 383,359,315 | | | | 383,359,315 | | |
Total Money Market Funds
(Cost: $383,359,315) | | | | | 383,359,315 | | |
Total Investments
(Cost: $6,469,267,140) | | | | | 9,113,571,965 | | |
Other Assets & Liabilities, Net | | | | | (59,979,511 | ) | |
Net Assets | | | | | 9,053,592,454 | | |
Notes to Portfolio of Investments
(a) The rate shown is the seven-day current annualized yield at May 31, 2016.
(b) As defined in the Investment Company Act of 1940, an affiliated company is one in which the Fund owns 5% or more of the company's outstanding voting securities, or a company which is under common ownership or control with the Fund. Holdings and transactions in these affiliated companies during the year ended May 31, 2016 are as follows:
Issuer | | Beginning
Cost ($) | | Purchase
Cost ($) | | Proceeds
From Sales ($) | | Ending
Cost ($) | | Dividends —
Affiliated
Issuers ($) | | Value ($) | |
Columbia Short-Term Cash Fund | | | 173,397,626 | | | | 1,571,084,728 | | | | (1,361,123,039 | ) | | | 383,359,315 | | | | 719,287 | | | | 383,359,315 | | |
Fair Value Measurements
The Fund categorizes its fair value measurements according to a three-level hierarchy that maximizes the use of observable inputs and minimizes the use of unobservable inputs by prioritizing that the most observable input be used when available. Observable inputs are those that market participants would use in pricing an investment based on market data obtained from sources independent of the reporting entity. Unobservable inputs are those that reflect the Fund's assumptions about the information market participants would use in pricing an investment. An investment's level within the fair value hierarchy is based on the lowest level of any input that is deemed significant to the asset's or liability's fair value measurement. The input levels are not necessarily an indication of the risk or liquidity associated with investments at that level. For example, certain U.S. government securities are generally high quality and liquid, however, they are reflected as Level 2 because the inputs used to determine fair value may not always be quoted prices in an active market.
The accompanying Notes to Financial Statements are an integral part of this statement.
Annual Report 2016
10
COLUMBIA DIVIDEND INCOME FUND
PORTFOLIO OF INVESTMENTS (continued)
May 31, 2016
Fair Value Measurements (continued)
Fair value inputs are summarized in the three broad levels listed below:
> Level 1 — Valuations based on quoted prices for investments in active markets that the Fund has the ability to access at the measurement date (including NAV for open-end mutual funds). Valuation adjustments are not applied to Level 1 investments.
> Level 2 — Valuations based on other significant observable inputs (including quoted prices for similar securities, interest rates, prepayment speeds, credit risks, etc.).
> Level 3 — Valuations based on significant unobservable inputs (including the Fund's own assumptions and judgment in determining the fair value of investments).
Inputs that are used in determining fair value of an investment may include price information, credit data, volatility statistics, and other factors. These inputs can be either observable or unobservable. The availability of observable inputs can vary between investments, and is affected by various factors such as the type of investment, and the volume and level of activity for that investment or similar investments in the marketplace. The inputs will be considered by the Investment Manager, along with any other relevant factors in the calculation of an investment's fair value. The Fund uses prices and inputs that are current as of the measurement date, which may include periods of market dislocations. During these periods, the availability of prices and inputs may be reduced for many investments. This condition could cause an investment to be reclassified between the various levels within the hierarchy.
Certain investments that have been measured at fair value using the net asset value per share (or its equivalent) are not categorized in the fair value hierarchy. The fair value amounts presented in the table are intended to reconcile the fair value hierarchy to the amounts presented in the Portfolio of Investments. The Columbia Short-Term Cash Fund seeks to provide shareholders with maximum current income consistent with liquidity and stability of principal. Investments in Columbia Short-Term Cash Fund may be redeemed on a daily basis without restriction.
Investments falling into the Level 3 category are primarily supported by quoted prices from brokers and dealers participating in the market for those investments. However, these may be classified as Level 3 investments due to lack of market transparency and corroboration to support these quoted prices. Additionally, valuation models may be used as the pricing source for any remaining investments classified as Level 3. These models may rely on one or more significant unobservable inputs and/or significant assumptions by the Investment Manager. Inputs used in valuations may include, but are not limited to, financial statement analysis, capital account balances, discount rates and estimated cash flows, and comparable company data.
Under the direction of the Fund's Board of Trustees (the Board), the Investment Manager's Valuation Committee (the Committee) is responsible for overseeing the valuation procedures approved by the Board. The Committee consists of voting and non-voting members from various groups within the Investment Manager's organization, including operations and accounting, trading and investments, compliance, risk management and legal.
The Committee meets at least monthly to review and approve valuation matters, which may include a description of specific valuation determinations, data regarding pricing information received from approved pricing vendors and brokers and the results of Board-approved valuation control policies and procedures (the Policies). The Policies address, among other things, instances when market quotations are or are not readily available, including recommendations of third party pricing vendors and a determination of appropriate pricing methodologies; events that require specific valuation determinations and assessment of fair value techniques; securities with a potential for stale pricing, including those that are illiquid, restricted, or in default; and the effectiveness of third party pricing vendors, including periodic reviews of vendors. The Committee meets more frequently, as needed, to discuss additional valuation matters, which may include the need to review back-testing results, review time-sensitive information or approve related valuation actions. The Committee reports to the Board, with members of the Committee meeting with the Board at each of its regularly scheduled meetings to discuss valuation matters and actions during the period, similar to those described earlier.
For investments categorized as Level 3, the Committee monitors information similar to that described above, which may include: (i) data specific to the issuer or comparable issuers, (ii) general market or specific sector news and (iii) quoted prices and specific or similar security transactions. The Committee considers this data and any changes from prior periods in order to assess the reasonableness of observable and unobservable inputs, any assumptions or internal models used to value those securities and changes in fair value. This data is also used to corroborate, when available, information received from approved pricing vendors and brokers. Various factors impact the frequency of monitoring this information (which may occur as often as daily). However, the Committee may determine that changes to inputs, assumptions and models are not required as a result of the monitoring procedures performed.
The accompanying Notes to Financial Statements are an integral part of this statement.
Annual Report 2016
11
COLUMBIA DIVIDEND INCOME FUND
PORTFOLIO OF INVESTMENTS (continued)
May 31, 2016
Fair Value Measurements (continued)
The following table is a summary of the inputs used to value the Fund's investments at May 31, 2016:
| | | Level 1
Quoted Prices in Active
Markets for Identical
Assets ($) | | Level 2
Other Significant
Observable Inputs ($) | | Level 3
Significant
Unobservable Inputs ($) | | Total ($) | |
Investments | |
Common Stocks | |
Consumer Discretionary | | | 805,944,267 | | | | — | | | | — | | | | 805,944,267 | | |
Consumer Staples | | | 1,094,594,855 | | | | — | | | | — | | | | 1,094,594,855 | | |
Energy | | | 732,583,365 | | | | — | | | | — | | | | 732,583,365 | | |
Financials | | | 1,720,704,003 | | | | — | | | | — | | | | 1,720,704,003 | | |
Health Care | | | 1,072,439,439 | | | | — | | | | — | | | | 1,072,439,439 | | |
Industrials | | | 1,071,779,559 | | | | — | | | | — | | | | 1,071,779,559 | | |
Information Technology | | | 1,171,073,370 | | | | — | | | | — | | | | 1,171,073,370 | | |
Materials | | | 201,092,189 | | | | — | | | | — | | | | 201,092,189 | | |
Telecommunication Services | | | 208,690,000 | | | | — | | | | — | | | | 208,690,000 | | |
Utilities | | | 457,442,123 | | | | — | | | | — | | | | 457,442,123 | | |
Total Common Stocks | | | 8,536,343,170 | | | | — | | | | — | | | | 8,536,343,170 | | |
Convertible Preferred Stocks | |
Energy | | | 21,603,880 | | | | — | | | | — | | | | 21,603,880 | | |
Exchange-Traded Funds | | | 172,265,600 | | | | — | | | | — | | | | 172,265,600 | | |
Investments measured at net asset value | |
Money Market Funds | | | — | | | | — | | | | — | | | | 383,359,315 | | |
Total Investments | | | 8,730,212,650 | | | | — | | | | — | | | | 9,113,571,965 | | |
See the Portfolio of Investments for all investment classifications not indicated in the table.
There were no transfers of financial assets between levels during the period.
The accompanying Notes to Financial Statements are an integral part of this statement.
Annual Report 2016
12
COLUMBIA DIVIDEND INCOME FUND
STATEMENT OF ASSETS AND LIABILITIES
May 31, 2016
Assets | |
Investments, at value | |
Unaffiliated issuers (identified cost $6,085,907,825) | | $ | 8,730,212,650 | | |
Affiliated issuers (identified cost $383,359,315) | | | 383,359,315 | | |
Total investments (identified cost $6,469,267,140) | | | 9,113,571,965 | | |
Cash | | | 21,126 | | |
Receivable for: | |
Capital shares sold | | | 14,664,084 | | |
Dividends | | | 24,133,992 | | |
Prepaid expenses | | | 8,567 | | |
Trustees' deferred compensation plan | | | 219,175 | | |
Total assets | | | 9,152,618,909 | | |
Liabilities | |
Payable for: | |
Investments purchased | | | 79,098,033 | | |
Capital shares purchased | | | 17,379,246 | | |
Investment management fees | | | 561,342 | | |
Distribution and/or service fees | | | 148,168 | | |
Transfer agent fees | | | 1,403,181 | | |
Compensation of board members | | | 1,267 | | |
Chief compliance officer expenses | | | 666 | | |
Other expenses | | | 215,377 | | |
Trustees' deferred compensation plan | | | 219,175 | | |
Total liabilities | | | 99,026,455 | | |
Net assets applicable to outstanding capital stock | | $ | 9,053,592,454 | | |
Represented by | |
Paid-in capital | | $ | 6,236,765,837 | | |
Undistributed net investment income | | | 22,839,914 | | |
Accumulated net realized gain | | | 149,681,878 | | |
Unrealized appreciation (depreciation) on: | |
Investments | | | 2,644,304,825 | | |
Total — representing net assets applicable to outstanding capital stock | | $ | 9,053,592,454 | | |
The accompanying Notes to Financial Statements are an integral part of this statement.
Annual Report 2016
13
COLUMBIA DIVIDEND INCOME FUND
STATEMENT OF ASSETS AND LIABILITIES (continued)
May 31, 2016
Class A | |
Net assets | | $ | 2,380,537,611 | | |
Shares outstanding | | | 129,189,320 | | |
Net asset value per share | | $ | 18.43 | | |
Maximum offering price per share(a) | | $ | 19.55 | | |
Class B | |
Net assets | | $ | 4,727,606 | | |
Shares outstanding | | | 264,198 | | |
Net asset value per share | | $ | 17.89 | | |
Class C | |
Net assets | | $ | 692,229,486 | | |
Shares outstanding | | | 38,708,145 | | |
Net asset value per share | | $ | 17.88 | | |
Class I | |
Net assets | | $ | 174,386,745 | | |
Shares outstanding | | | 9,441,393 | | |
Net asset value per share | | $ | 18.47 | | |
Class R | |
Net assets | | $ | 85,065,758 | | |
Shares outstanding | | | 4,615,366 | | |
Net asset value per share | | $ | 18.43 | | |
Class R4 | |
Net assets | | $ | 230,892,586 | | |
Shares outstanding | | | 12,338,468 | | |
Net asset value per share | | $ | 18.71 | | |
Class R5 | |
Net assets | | $ | 416,310,332 | | |
Shares outstanding | | | 22,256,616 | | |
Net asset value per share | | $ | 18.71 | | |
Class T | |
Net assets | | $ | 75,218,078 | | |
Shares outstanding | | | 4,080,457 | | |
Net asset value per share | | $ | 18.43 | | |
Maximum offering price per share(a) | | $ | 19.55 | | |
Class W | |
Net assets | | $ | 97,839 | | |
Shares outstanding | | | 5,313 | | |
Net asset value per share | | $ | 18.42 | | |
Class Y | |
Net assets | | $ | 228,089,425 | | |
Shares outstanding | | | 12,183,177 | | |
Net asset value per share | | $ | 18.72 | | |
Class Z | |
Net assets | | $ | 4,766,036,988 | | |
Shares outstanding | | | 258,379,550 | | |
Net asset value per share | | $ | 18.45 | | |
(a) The maximum offering price per share is calculated by dividing the net asset value per share by 1.0 minus the maximum sales charge of 5.75%.
The accompanying Notes to Financial Statements are an integral part of this statement.
Annual Report 2016
14
COLUMBIA DIVIDEND INCOME FUND
STATEMENT OF OPERATIONS
Year Ended May 31, 2016
Net investment income | |
Income: | |
Dividends — unaffiliated issuers | | $ | 233,500,324 | | |
Dividends — affiliated issuers | | | 719,287 | | |
Foreign taxes withheld | | | (274,677 | ) | |
Total income | | | 233,944,934 | | |
Expenses: | |
Investment management fees | | | 48,163,224 | | |
Distribution and/or service fees | |
Class A | | | 5,647,307 | | |
Class B | | | 62,372 | | |
Class C | | | 6,478,551 | | |
Class R | | | 412,994 | | |
Class T | | | 187,690 | | |
Class W | | | 311 | | |
Transfer agent fees | |
Class A | | | 4,205,823 | | |
Class B | | | 11,663 | | |
Class C | | | 1,205,030 | | |
Class R | | | 153,758 | | |
Class R4 | | | 343,782 | | |
Class R5 | | | 181,926 | | |
Class T | | | 139,775 | | |
Class W | | | 233 | | |
Class Z | | | 8,310,350 | | |
Compensation of board members | | | 165,117 | | |
Custodian fees | | | 53,782 | | |
Printing and postage fees | | | 382,643 | | |
Registration fees | | | 297,358 | | |
Audit fees | | | 27,193 | | |
Legal fees | | | 249,667 | | |
Chief compliance officer expenses | | | 4,055 | | |
Other | | | 254,051 | | |
Total expenses | | | 76,938,655 | | |
Expense reductions | | | (3,749 | ) | |
Total net expenses | | | 76,934,906 | | |
Net investment income | | | 157,010,028 | | |
Realized and unrealized gain (loss) — net | |
Net realized gain (loss) on: | |
Investments | | | 208,460,952 | | |
Net realized gain | | | 208,460,952 | | |
Net change in unrealized appreciation (depreciation) on: | |
Investments | | | (3,768,566 | ) | |
Net change in unrealized depreciation | | | (3,768,566 | ) | |
Net realized and unrealized gain | | | 204,692,386 | | |
Net increase in net assets resulting from operations | | $ | 361,702,414 | | |
The accompanying Notes to Financial Statements are an integral part of this statement.
Annual Report 2016
15
COLUMBIA DIVIDEND INCOME FUND
STATEMENT OF CHANGES IN NET ASSETS
| | | Year Ended
May 31,
2016 | | Year Ended
May 31,
2015 | |
Operations | |
Net investment income | | $ | 157,010,028 | | | $ | 239,828,277 | | |
Net realized gain | | | 208,460,952 | | | | 651,310,209 | | |
Net change in unrealized appreciation (depreciation) | | | (3,768,566 | ) | | | (90,555,502 | ) | |
Net increase in net assets resulting from operations | | | 361,702,414 | | | | 800,582,984 | | |
Distributions to shareholders | |
Net investment income | |
Class A | | | (55,027,655 | ) | | | (52,103,253 | ) | |
Class B | | | (112,945 | ) | | | (146,007 | ) | |
Class C | | | (11,192,608 | ) | | | (8,413,803 | ) | |
Class I | | | (5,472,958 | ) | | | (5,374,544 | ) | |
Class R | | | (1,817,441 | ) | | | (1,578,399 | ) | |
Class R4 | | | (4,735,609 | ) | | | (3,402,520 | ) | |
Class R5 | | | (9,885,264 | ) | | | (5,457,400 | ) | |
Class T | | | (1,831,540 | ) | | | (1,686,034 | ) | |
Class W | | | (3,106 | ) | | | (3,667 | ) | |
Class Y | | | (5,350,267 | ) | | | (2,567,649 | ) | |
Class Z | | | (120,411,297 | ) | | | (113,681,632 | ) | |
Net realized gains | |
Class A | | | (111,629,908 | ) | | | (154,661,995 | ) | |
Class B | | | (323,970 | ) | | | (666,882 | ) | |
Class C | | | (33,162,014 | ) | | | (39,573,416 | ) | |
Class I | | | (8,564,828 | ) | | | (14,365,670 | ) | |
Class R | | | (4,164,077 | ) | | | (5,290,557 | ) | |
Class R4 | | | (9,046,224 | ) | | | (9,059,406 | ) | |
Class R5 | | | (17,781,173 | ) | | | (14,959,685 | ) | |
Class T | | | (3,737,695 | ) | | | (5,112,385 | ) | |
Class W | | | (5,560 | ) | | | (10,578 | ) | |
Class Y | | | (9,507,811 | ) | | | (6,207,198 | ) | |
Class Z | | | (223,233,007 | ) | | | (304,390,865 | ) | |
Total distributions to shareholders | | | (636,996,957 | ) | | | (748,713,545 | ) | |
Increase in net assets from capital stock activity | | | 266,419,122 | | | | 11,393,180 | | |
Total increase (decrease) in net assets | | | (8,875,421 | ) | | | 63,262,619 | | |
Net assets at beginning of year | | | 9,062,467,875 | | | | 8,999,205,256 | | |
Net assets at end of year | | $ | 9,053,592,454 | | | $ | 9,062,467,875 | | |
Undistributed net investment income | | $ | 22,839,914 | | | $ | 83,763,862 | | |
The accompanying Notes to Financial Statements are an integral part of this statement.
Annual Report 2016
16
COLUMBIA DIVIDEND INCOME FUND
STATEMENT OF CHANGES IN NET ASSETS (continued)
| | | Year Ended May 31, 2016 | | Year Ended May 31, 2015 | |
| | | Shares | | Dollars ($) | | Shares | | Dollars ($) | |
Capital stock activity | |
Class A shares | |
Subscriptions(a) | | | 30,044,947 | | | | 544,040,351 | | | | 26,269,621 | | | | 505,942,202 | | |
Distributions reinvested | | | 8,754,726 | | | | 153,461,192 | | | | 10,331,773 | | | | 190,253,019 | | |
Redemptions | | | (41,481,154 | ) | | | (747,383,055 | ) | | | (39,187,240 | ) | | | (752,695,905 | ) | |
Net decrease | | | (2,681,481 | ) | | | (49,881,512 | ) | | | (2,585,846 | ) | | | (56,500,684 | ) | |
Class B shares | |
Subscriptions | | | 10,472 | | | | 182,644 | | | | 21,032 | | | | 387,751 | | |
Distributions reinvested | | | 20,705 | | | | 352,479 | | | | 36,713 | | | | 657,089 | | |
Redemptions(a) | | | (221,027 | ) | | | (3,883,553 | ) | | | (299,285 | ) | | | (5,597,532 | ) | |
Net decrease | | | (189,850 | ) | | | (3,348,430 | ) | | | (241,540 | ) | | | (4,552,692 | ) | |
Class C shares | |
Subscriptions | | | 6,671,910 | | | | 116,143,870 | | | | 6,002,211 | | | | 111,952,235 | | |
Distributions reinvested | | | 2,118,177 | | | | 36,003,454 | | | | 2,170,132 | | | | 38,808,347 | | |
Redemptions | | | (6,072,143 | ) | | | (106,230,711 | ) | | | (4,643,608 | ) | | | (86,713,441 | ) | |
Net increase | | | 2,717,944 | | | | 45,916,613 | | | | 3,528,735 | | | | 64,047,141 | | |
Class I shares | |
Subscriptions | | | 6,746,241 | | | | 120,049,859 | | | | 5,594,689 | | | | 106,474,361 | | |
Distributions reinvested | | | 797,214 | | | | 14,037,585 | | | | 1,070,164 | | | | 19,739,985 | | |
Redemptions | | | (10,599,392 | ) | | | (194,815,866 | ) | | | (6,427,941 | ) | | | (125,559,466 | ) | |
Net increase (decrease) | | | (3,055,937 | ) | | | (60,728,422 | ) | | | 236,912 | | | | 654,880 | | |
Class R shares | |
Subscriptions | | | 1,304,089 | | | | 23,619,929 | | | | 1,140,625 | | | | 21,963,890 | | |
Distributions reinvested | | | 306,136 | | | | 5,366,096 | | | | 330,558 | | | | 6,085,152 | | |
Redemptions | | | (1,590,754 | ) | | | (28,645,921 | ) | | | (1,471,139 | ) | | | (28,422,039 | ) | |
Net increase (decrease) | | | 19,471 | | | | 340,104 | | | | 44 | | | | (372,997 | ) | |
Class R4 shares | |
Subscriptions | | | 7,215,555 | | | | 131,875,625 | | | | 5,530,539 | | | | 107,109,793 | | |
Distributions reinvested | | | 670,352 | | | | 11,918,272 | | | | 613,952 | | | | 11,465,118 | | |
Redemptions | | | (4,817,980 | ) | | | (88,710,635 | ) | | | (3,272,567 | ) | | | (63,374,156 | ) | |
Net increase | | | 3,067,927 | | | | 55,083,262 | | | | 2,871,924 | | | | 55,200,755 | | |
Class R5 shares | |
Subscriptions | | | 9,551,777 | | | | 176,029,543 | | | | 10,412,190 | | | | 200,727,748 | | |
Distributions reinvested | | | 1,516,893 | | | | 26,966,555 | | | | 1,070,135 | | | | 19,961,094 | | |
Redemptions | | | (5,003,726 | ) | | | (91,544,963 | ) | | | (3,417,656 | ) | | | (65,975,002 | ) | |
Net increase | | | 6,064,944 | | | | 111,451,135 | | | | 8,064,669 | | | | 154,713,840 | | |
The accompanying Notes to Financial Statements are an integral part of this statement.
Annual Report 2016
17
COLUMBIA DIVIDEND INCOME FUND
STATEMENT OF CHANGES IN NET ASSETS (continued)
| | | Year Ended May 31, 2016 | | Year Ended May 31, 2015 | |
| | | Shares | | Dollars ($) | | Shares | | Dollars ($) | |
Capital stock activity (continued) | |
Class T shares | |
Subscriptions | | | 68,236 | | | | 1,211,885 | | | | 66,333 | | | | 1,232,587 | | |
Distributions reinvested | | | 256,403 | | | | 4,495,643 | | | | 301,380 | | | | 5,551,683 | | |
Redemptions | | | (501,788 | ) | | | (9,216,770 | ) | | | (606,677 | ) | | | (11,668,345 | ) | |
Net decrease | | | (177,149 | ) | | | (3,509,242 | ) | | | (238,964 | ) | | | (4,884,075 | ) | |
Class W shares | |
Distributions reinvested | | | 483 | | | | 8,476 | | | | 762 | | | | 14,026 | | |
Redemptions | | | (3,772 | ) | | | (69,255 | ) | | | (2,314 | ) | | | (44,286 | ) | |
Net decrease | | | (3,289 | ) | | | (60,779 | ) | | | (1,552 | ) | | | (30,260 | ) | |
Class Y shares | |
Subscriptions | | | 4,479,377 | | | | 82,362,611 | | | | 7,596,631 | | | | 146,686,169 | | |
Distributions reinvested | | | 820,902 | | | | 14,606,163 | | | | 469,395 | | | | 8,774,622 | | |
Redemptions | | | (1,974,589 | ) | | | (36,311,263 | ) | | | (3,290,753 | ) | | | (63,347,250 | ) | |
Net increase | | | 3,325,690 | | | | 60,657,511 | | | | 4,775,273 | | | | 92,113,541 | | |
Class Z shares | |
Subscriptions | | | 52,334,824 | | | | 937,290,640 | | | | 38,193,664 | | | | 733,215,171 | | |
Distributions reinvested | | | 9,975,763 | | | | 175,050,909 | | | | 11,487,818 | | | | 211,842,271 | | |
Redemptions | | | (55,459,993 | ) | | | (1,001,842,667 | ) | | | (64,156,290 | ) | | | (1,234,053,711 | ) | |
Net increase (decrease) | | | 6,850,594 | | | | 110,498,882 | | | | (14,474,808 | ) | | | (288,996,269 | ) | |
Total net increase | | | 15,938,864 | | | | 266,419,122 | | | | 1,934,847 | | | | 11,393,180 | | |
(a) Includes conversions of Class B shares to Class A shares, if any.
The accompanying Notes to Financial Statements are an integral part of this statement.
Annual Report 2016
18
COLUMBIA DIVIDEND INCOME FUND
The following tables are intended to help you understand the Fund's financial performance. Certain information reflects financial results for a single share of a class held for the periods shown. Per share net investment income (loss) amounts are calculated based on average shares outstanding during the period. Total return assumes reinvestment of all dividends and distributions, if any. Total return does not reflect payment of sales charges, if any. Total return and portfolio turnover are not annualized for periods of less than one year. The portfolio turnover rate is calculated without regard to purchase and sales transactions of short-term instruments and certain derivatives, if any. If such transactions were included, the Fund's portfolio turnover rate may be higher.
| | | Year Ended May 31, | | Year Ended
September 30, | |
Class A | | 2016 | | 2015 | | 2014 | | 2013 | | 2012(a) | | 2011 | |
Per share data | |
Net asset value, beginning of period | | $ | 19.07 | | | $ | 19.02 | | | $ | 17.05 | | | $ | 13.96 | | | $ | 12.16 | | | $ | 12.12 | | |
Income from investment operations: | |
Net investment income | | | 0.32 | | | | 0.48 | | | | 0.35 | | | | 0.34 | | | | 0.25 | | | | 0.29 | | |
Net realized and unrealized gain | | | 0.43 | | | | 1.17 | | | | 2.20 | | | | 3.09 | | | | 1.73 | | | | 0.03 | (b) | |
Total from investment operations | | | 0.75 | | | | 1.65 | | | | 2.55 | | | | 3.43 | | | | 1.98 | | | | 0.32 | | |
Less distributions to shareholders: | |
Net investment income | | | (0.45 | ) | | | (0.40 | ) | | | (0.34 | ) | | | (0.34 | ) | | | (0.18 | ) | | | (0.28 | ) | |
Net realized gains | | | (0.94 | ) | | | (1.20 | ) | | | (0.24 | ) | | | — | | | | — | | | | — | | |
Total distributions to shareholders | | | (1.39 | ) | | | (1.60 | ) | | | (0.58 | ) | | | (0.34 | ) | | | (0.18 | ) | | | (0.28 | ) | |
Net asset value, end of period | | $ | 18.43 | | | $ | 19.07 | | | $ | 19.02 | | | $ | 17.05 | | | $ | 13.96 | | | $ | 12.16 | | |
Total return | | | 4.42 | % | | | 9.08 | % | | | 15.25 | % | | | 24.91 | % | | | 16.26 | % | | | 2.56 | % | |
Ratios to average net assets(c) | |
Total gross expenses | | | 1.02 | % | | | 1.02 | % | | | 1.02 | % | | | 1.04 | % | | | 1.06 | %(d) | | | 1.09 | % | |
Total net expenses(e) | | | 1.02 | %(f) | | | 1.02 | %(f) | | | 1.02 | %(f) | | | 1.03 | %(f) | | | 1.00 | %(d) | | | 1.03 | %(f) | |
Net investment income | | | 1.74 | % | | | 2.52 | % | | | 1.96 | % | | | 2.20 | % | | | 2.71 | %(d) | | | 2.23 | % | |
Supplemental data | |
Net assets, end of period (in thousands) | | $ | 2,380,538 | | | $ | 2,514,422 | | | $ | 2,556,782 | | | $ | 2,518,406 | | | $ | 1,729,495 | | | $ | 1,103,389 | | |
Portfolio turnover | | | 25 | % | | | 27 | % | | | 19 | % | | | 24 | % | | | 23 | % | | | 20 | % | |
Notes to Financial Highlights
(a) For the period from October 1, 2011 to May 31, 2012. During the period, the Fund's fiscal year end was changed from September 30 to May 31.
(b) Calculation of the net gain (loss) per share (both realized and unrealized) does not correlate to the aggregate realized and unrealized gain (loss) presented in the Statement of Operations due to the timing of subscriptions and redemptions of Fund shares in relation to fluctuations in the market value of the portfolio.
(c) In addition to the fees and expenses that the Fund bears directly, the Fund indirectly bears a pro rata share of the fees and expenses of any other funds in which it invests. Such indirect expenses are not included in the Fund's reported expense ratios.
(d) Annualized.
(e) Total net expenses include the impact of certain fee waivers/expense reimbursements made by the Investment Manager and certain of its affiliates, if applicable.
(f) The benefits derived from expense reductions had an impact of less than 0.01%.
The accompanying Notes to Financial Statements are an integral part of this statement.
Annual Report 2016
19
COLUMBIA DIVIDEND INCOME FUND
FINANCIAL HIGHLIGHTS (continued)
| | | Year Ended May 31, | | Year Ended
September 30, | |
Class B | | 2016 | | 2015 | | 2014 | | 2013 | | 2012(a) | | 2011 | |
Per share data | |
Net asset value, beginning of period | | $ | 18.55 | | | $ | 18.54 | | | $ | 16.64 | | | $ | 13.63 | | | $ | 11.89 | | | $ | 11.86 | | |
Income from investment operations: | |
Net investment income | | | 0.17 | | | | 0.30 | | | | 0.21 | | | | 0.22 | | | | 0.18 | | | | 0.19 | | |
Net realized and unrealized gain | | | 0.42 | | | | 1.16 | | | | 2.14 | | | | 3.02 | | | | 1.69 | | | | 0.03 | (b) | |
Total from investment operations | | | 0.59 | | | | 1.46 | | | | 2.35 | | | | 3.24 | | | | 1.87 | | | | 0.22 | | |
Less distributions to shareholders: | |
Net investment income | | | (0.31 | ) | | | (0.25 | ) | | | (0.21 | ) | | | (0.23 | ) | | | (0.13 | ) | | | (0.19 | ) | |
Net realized gains | | | (0.94 | ) | | | (1.20 | ) | | | (0.24 | ) | | | — | | | | — | | | | — | | |
Total distributions to shareholders | | | (1.25 | ) | | | (1.45 | ) | | | (0.45 | ) | | | (0.23 | ) | | | (0.13 | ) | | | (0.19 | ) | |
Net asset value, end of period | | $ | 17.89 | | | $ | 18.55 | | | $ | 18.54 | | | $ | 16.64 | | | $ | 13.63 | | | $ | 11.89 | | |
Total return | | | 3.62 | % | | | 8.26 | % | | | 14.33 | % | | | 23.99 | % | | | 15.69 | % | | | 1.74 | % | |
Ratios to average net assets(c) | |
Total gross expenses | | | 1.78 | % | | | 1.77 | % | | | 1.77 | % | | | 1.79 | % | | | 1.81 | %(d) | | | 1.85 | % | |
Total net expenses(e) | | | 1.78 | %(f) | | | 1.77 | %(f) | | | 1.77 | %(f) | | | 1.77 | %(f) | | | 1.75 | %(d) | | | 1.79 | %(f) | |
Net investment income | | | 0.98 | % | | | 1.60 | % | | | 1.22 | % | | | 1.47 | % | | | 1.96 | %(d) | | | 1.48 | % | |
Supplemental data | |
Net assets, end of period (in thousands) | | $ | 4,728 | | | $ | 8,423 | | | $ | 12,896 | | | $ | 15,034 | | | $ | 15,095 | | | $ | 15,659 | | |
Portfolio turnover | | | 25 | % | | | 27 | % | | | 19 | % | | | 24 | % | | | 23 | % | | | 20 | % | |
Notes to Financial Highlights
(a) For the period from October 1, 2011 to May 31, 2012. During the period, the Fund's fiscal year end was changed from September 30 to May 31.
(b) Calculation of the net gain (loss) per share (both realized and unrealized) does not correlate to the aggregate realized and unrealized gain (loss) presented in the Statement of Operations due to the timing of subscriptions and redemptions of Fund shares in relation to fluctuations in the market value of the portfolio.
(c) In addition to the fees and expenses that the Fund bears directly, the Fund indirectly bears a pro rata share of the fees and expenses of any other funds in which it invests. Such indirect expenses are not included in the Fund's reported expense ratios.
(d) Annualized.
(e) Total net expenses include the impact of certain fee waivers/expense reimbursements made by the Investment Manager and certain of its affiliates, if applicable.
(f) The benefits derived from expense reductions had an impact of less than 0.01%.
The accompanying Notes to Financial Statements are an integral part of this statement.
Annual Report 2016
20
COLUMBIA DIVIDEND INCOME FUND
FINANCIAL HIGHLIGHTS (continued)
| | | Year Ended May 31, | | Year Ended
September 30, | |
Class C | | 2016 | | 2015 | | 2014 | | 2013 | | 2012(a) | | 2011 | |
Per share data | |
Net asset value, beginning of period | | $ | 18.54 | | | $ | 18.53 | | | $ | 16.63 | | | $ | 13.62 | | | $ | 11.88 | | | $ | 11.85 | | |
Income from investment operations: | |
Net investment income | | | 0.18 | | | | 0.34 | | | | 0.21 | | | | 0.22 | | | | 0.18 | | | | 0.19 | | |
Net realized and unrealized gain | | | 0.41 | | | | 1.12 | | | | 2.13 | | | | 3.02 | | | | 1.69 | | | | 0.03 | (b) | |
Total from investment operations | | | 0.59 | | | | 1.46 | | | | 2.34 | | | | 3.24 | | | | 1.87 | | | | 0.22 | | |
Less distributions to shareholders: | |
Net investment income | | | (0.31 | ) | | | (0.25 | ) | | | (0.20 | ) | | | (0.23 | ) | | | (0.13 | ) | | | (0.19 | ) | |
Net realized gains | | | (0.94 | ) | | | (1.20 | ) | | | (0.24 | ) | | | — | | | | — | | | | — | | |
Total distributions to shareholders | | | (1.25 | ) | | | (1.45 | ) | | | (0.44 | ) | | | (0.23 | ) | | | (0.13 | ) | | | (0.19 | ) | |
Net asset value, end of period | | $ | 17.88 | | | $ | 18.54 | | | $ | 18.53 | | | $ | 16.63 | | | $ | 13.62 | | | $ | 11.88 | | |
Total return | | | 3.62 | % | | | 8.26 | % | | | 14.33 | % | | | 24.00 | % | | | 15.71 | % | | | 1.74 | % | |
Ratios to average net assets(c) | |
Total gross expenses | | | 1.78 | % | | | 1.77 | % | | | 1.77 | % | | | 1.79 | % | | | 1.81 | %(d) | | | 1.84 | % | |
Total net expenses(e) | | | 1.78 | %(f) | | | 1.77 | %(f) | | | 1.77 | %(f) | | | 1.78 | %(f) | | | 1.75 | %(d) | | | 1.78 | %(f) | |
Net investment income | | | 1.00 | % | | | 1.83 | % | | | 1.24 | % | | | 1.45 | % | | | 1.96 | %(d) | | | 1.49 | % | |
Supplemental data | |
Net assets, end of period (in thousands) | | $ | 692,229 | | | $ | 667,300 | | | $ | 601,468 | | | $ | 459,966 | | | $ | 279,093 | | | $ | 181,875 | | |
Portfolio turnover | | | 25 | % | | | 27 | % | | | 19 | % | | | 24 | % | | | 23 | % | | | 20 | % | |
Notes to Financial Highlights
(a) For the period from October 31, 2011 to May 31, 2012. During the period, the Fund's fiscal year end was changed from September 30 to May 31.
(b) Calculation of the net gain (loss) per share (both realized and unrealized) does not correlate to the aggregate realized and unrealized gain (loss) presented in the Statement of Operations due to the timing of subscriptions and redemptions of Fund shares in relation to fluctuations in the market value of the portfolio.
(c) In addition to the fees and expenses that the Fund bears directly, the Fund indirectly bears a pro rata share of the fees and expenses of any other funds in which it invests. Such indirect expenses are not included in the Fund's reported expense ratios.
(d) Annualized.
(e) Total net expenses include the impact of certain fee waivers/expense reimbursements made by the Investment Manager and certain of its affiliates, if applicable.
(f) The benefits derived from expense reductions had an impact of less than 0.01%.
The accompanying Notes to Financial Statements are an integral part of this statement.
Annual Report 2016
21
COLUMBIA DIVIDEND INCOME FUND
FINANCIAL HIGHLIGHTS (continued)
| | | Year Ended May 31, | | Year Ended
September 30, | |
Class I | | 2016 | | 2015 | | 2014 | | 2013 | | 2012(a) | | 2011 | |
Per share data | |
Net asset value, beginning of period | | $ | 19.11 | | | $ | 19.06 | | | $ | 17.09 | | | $ | 13.99 | | | $ | 12.18 | | | $ | 12.13 | | |
Income from investment operations: | |
Net investment income | | | 0.40 | | | | 0.58 | | | | 0.42 | | | | 0.41 | | | | 0.28 | | | | 0.35 | | |
Net realized and unrealized gain | | | 0.43 | | | | 1.15 | | | | 2.20 | | | | 3.09 | | | | 1.73 | | | | 0.03 | (b) | |
Total from investment operations | | | 0.83 | | | | 1.73 | | | | 2.62 | | | | 3.50 | | | | 2.01 | | | | 0.38 | | |
Less distributions to shareholders: | |
Net investment income | | | (0.53 | ) | | | (0.48 | ) | | | (0.41 | ) | | | (0.40 | ) | | | (0.20 | ) | | | (0.33 | ) | |
Net realized gains | | | (0.94 | ) | | | (1.20 | ) | | | (0.24 | ) | | | — | | | | — | | | | — | | |
Total distributions to shareholders | | | (1.47 | ) | | | (1.68 | ) | | | (0.65 | ) | | | (0.40 | ) | | | (0.20 | ) | | | (0.33 | ) | |
Net asset value, end of period | | $ | 18.47 | | | $ | 19.11 | | | $ | 19.06 | | | $ | 17.09 | | | $ | 13.99 | | | $ | 12.18 | | |
Total return | | | 4.88 | % | | | 9.54 | % | | | 15.72 | % | | | 25.42 | % | | | 16.53 | % | | | 3.02 | % | |
Ratios to average net assets(c) | |
Total gross expenses | | | 0.59 | % | | | 0.58 | % | | | 0.58 | % | | | 0.60 | % | | | 0.63 | %(d) | | | 0.67 | % | |
Total net expenses(e) | | | 0.59 | % | | | 0.58 | % | | | 0.58 | % | | | 0.60 | % | | | 0.63 | %(d) | | | 0.67 | %(f) | |
Net investment income | | | 2.19 | % | | | 3.04 | % | | | 2.35 | % | | | 2.64 | % | | | 3.08 | %(d) | | | 2.62 | % | |
Supplemental data | |
Net assets, end of period (in thousands) | | $ | 174,387 | | | $ | 238,825 | | | $ | 233,626 | | | $ | 320,524 | | | $ | 271,694 | | | $ | 249,778 | | |
Portfolio turnover | | | 25 | % | | | 27 | % | | | 19 | % | | | 24 | % | | | 23 | % | | | 20 | % | |
Notes to Financial Highlights
(a) For the period from October 1, 2011 to May 31, 2012. During the period, the Fund's fiscal year end was changed from September 30 to May 31.
(b) Calculation of the net gain (loss) per share (both realized and unrealized) does not correlate to the aggregate realized and unrealized gain (loss) presented in the Statement of Operations due to the timing of subscriptions and redemptions of Fund shares in relation to fluctuations in the market value of the portfolio.
(c) In addition to the fees and expenses that the Fund bears directly, the Fund indirectly bears a pro rata share of the fees and expenses of any other funds in which it invests. Such indirect expenses are not included in the Fund's reported expense ratios.
(d) Annualized.
(e) Total net expenses include the impact of certain fee waivers/expense reimbursements made by the Investment Manager and certain of its affiliates, if applicable.
(f) The benefits derived from expense reductions had an impact of less than 0.01%.
The accompanying Notes to Financial Statements are an integral part of this statement.
Annual Report 2016
22
COLUMBIA DIVIDEND INCOME FUND
FINANCIAL HIGHLIGHTS (continued)
| | | Year Ended May 31, | | Year Ended
September 30, | |
Class R | | 2016 | | 2015 | | 2014 | | 2013 | | 2012(a) | | 2011 | |
Per share data | |
Net asset value, beginning of period | | $ | 19.07 | | | $ | 19.02 | | | $ | 17.05 | | | $ | 13.96 | | | $ | 12.17 | | | $ | 12.13 | | |
Income from investment operations: | |
Net investment income | | | 0.27 | | | | 0.44 | | | | 0.31 | | | | 0.30 | | | | 0.23 | | | | 0.26 | | |
Net realized and unrealized gain | | | 0.43 | | | | 1.16 | | | | 2.19 | | | | 3.09 | | | | 1.72 | | | | 0.03 | (b) | |
Total from investment operations | | | 0.70 | | | | 1.60 | | | | 2.50 | | | | 3.39 | | | | 1.95 | | | | 0.29 | | |
Less distributions to shareholders: | |
Net investment income | | | (0.40 | ) | | | (0.35 | ) | | | (0.29 | ) | | | (0.30 | ) | | | (0.16 | ) | | | (0.25 | ) | |
Net realized gains | | | (0.94 | ) | | | (1.20 | ) | | | (0.24 | ) | | | — | | | | — | | | | — | | |
Total distributions to shareholders | | | (1.34 | ) | | | (1.55 | ) | | | (0.53 | ) | | | (0.30 | ) | | | (0.16 | ) | | | (0.25 | ) | |
Net asset value, end of period | | $ | 18.43 | | | $ | 19.07 | | | $ | 19.02 | | | $ | 17.05 | | | $ | 13.96 | | | $ | 12.17 | | |
Total return | | | 4.15 | % | | | 8.80 | % | | | 14.96 | % | | | 24.60 | % | | | 16.03 | % | | | 2.30 | % | |
Ratios to average net assets(c) | |
Total gross expenses | | | 1.27 | % | | | 1.27 | % | | | 1.27 | % | | | 1.29 | % | | | 1.31 | %(d) | | | 1.34 | % | |
Total net expenses(e) | | | 1.27 | %(f) | | | 1.27 | %(f) | | | 1.27 | %(f) | | | 1.28 | %(f) | | | 1.25 | %(d) | | | 1.28 | %(f) | |
Net investment income | | | 1.49 | % | | | 2.28 | % | | | 1.73 | % | | | 1.95 | % | | | 2.46 | %(d) | | | 1.98 | % | |
Supplemental data | |
Net assets, end of period (in thousands) | | $ | 85,066 | | | $ | 87,646 | | | $ | 87,406 | | | $ | 72,979 | | | $ | 32,183 | | | $ | 13,101 | | |
Portfolio turnover | | | 25 | % | | | 27 | % | | | 19 | % | | | 24 | % | | | 23 | % | | | 20 | % | |
Notes to Financial Highlights
(a) For the period from October 1, 2011 to May 31, 2012. During the period, the Fund's fiscal year end was changed from September 30 to May 31.
(b) Calculation of the net gain (loss) per share (both realized and unrealized) does not correlate to the aggregate realized and unrealized gain (loss) presented in the Statement of Operations due to the timing of subscriptions and redemptions of Fund shares in relation to fluctuations in the market value of the portfolio.
(c) In addition to the fees and expenses that the Fund bears directly, the Fund indirectly bears a pro rata share of the fees and expenses of any other funds in which it invests. Such indirect expenses are not included in the Fund's reported expense ratios.
(d) Annualized.
(e) Total net expenses include the impact of certain fee waivers/expense reimbursements made by the Investment Manager and certain of its affiliates, if applicable.
(f) The benefits derived from expense reductions had an impact of less than 0.01%.
The accompanying Notes to Financial Statements are an integral part of this statement.
Annual Report 2016
23
COLUMBIA DIVIDEND INCOME FUND
FINANCIAL HIGHLIGHTS (continued)
| | | Year Ended May 31, | |
Class R4 | | 2016 | | 2015 | | 2014 | | 2013(a) | |
Per share data | |
Net asset value, beginning of period | | $ | 19.34 | | | $ | 19.27 | | | $ | 17.27 | | | $ | 14.65 | | |
Income from investment operations: | |
Net investment income | | | 0.37 | | | | 0.57 | | | | 0.42 | | | | 0.20 | | |
Net realized and unrealized gain | | | 0.44 | | | | 1.14 | | | | 2.20 | | | | 2.60 | | |
Total from investment operations | | | 0.81 | | | | 1.71 | | | | 2.62 | | | | 2.80 | | |
Less distributions to shareholders: | |
Net investment income | | | (0.50 | ) | | | (0.44 | ) | | | (0.38 | ) | | | (0.18 | ) | |
Net realized gains | | | (0.94 | ) | | | (1.20 | ) | | | (0.24 | ) | | | — | | |
Total distributions to shareholders | | | (1.44 | ) | | | (1.64 | ) | | | (0.62 | ) | | | (0.18 | ) | |
Net asset value, end of period | | $ | 18.71 | | | $ | 19.34 | | | $ | 19.27 | | | $ | 17.27 | | |
Total return | | | 4.67 | % | | | 9.33 | % | | | 15.51 | % | | | 19.22 | % | |
Ratios to average net assets(b) | |
Total gross expenses | | | 0.77 | % | | | 0.77 | % | | | 0.77 | % | | | 0.82 | %(c) | |
Total net expenses(d) | | | 0.77 | %(e) | | | 0.77 | %(e) | | | 0.77 | %(e) | | | 0.82 | %(c) | |
Net investment income | | | 2.01 | % | | | 2.93 | % | | | 2.29 | % | | | 2.17 | %(c) | |
Supplemental data | |
Net assets, end of period (in thousands) | | $ | 230,893 | | | $ | 179,306 | | | $ | 123,274 | | | $ | 37,359 | | |
Portfolio turnover | | | 25 | % | | | 27 | % | | | 19 | % | | | 24 | % | |
Notes to Financial Highlights
(a) Based on operations from November 8, 2012 (commencement of operations) through the stated period end.
(b) In addition to the fees and expenses that the Fund bears directly, the Fund indirectly bears a pro rata share of the fees and expenses of any other funds in which it invests. Such indirect expenses are not included in the Fund's reported expense ratios.
(c) Annualized.
(d) Total net expenses include the impact of certain fee waivers/expense reimbursements made by the Investment Manager and certain of its affiliates, if applicable.
(e) The benefits derived from expense reductions had an impact of less than 0.01%.
The accompanying Notes to Financial Statements are an integral part of this statement.
Annual Report 2016
24
COLUMBIA DIVIDEND INCOME FUND
FINANCIAL HIGHLIGHTS (continued)
| | | Year Ended May 31, | |
Class R5 | | 2016 | | 2015 | | 2014 | | 2013(a) | |
Per share data | |
Net asset value, beginning of period | | $ | 19.33 | | | $ | 19.26 | | | $ | 17.26 | | | $ | 14.65 | | |
Income from investment operations: | |
Net investment income | | | 0.39 | | | | 0.62 | | | | 0.43 | | | | 0.22 | | |
Net realized and unrealized gain | | | 0.45 | | | | 1.12 | | | | 2.21 | | | | 2.58 | | |
Total from investment operations | | | 0.84 | | | | 1.74 | | | | 2.64 | | | | 2.80 | | |
Less distributions to shareholders: | |
Net investment income | | | (0.52 | ) | | | (0.47 | ) | | | (0.40 | ) | | | (0.19 | ) | |
Net realized gains | | | (0.94 | ) | | | (1.20 | ) | | | (0.24 | ) | | | — | | |
Total distributions to shareholders | | | (1.46 | ) | | | (1.67 | ) | | | (0.64 | ) | | | (0.19 | ) | |
Net asset value, end of period | | $ | 18.71 | | | $ | 19.33 | | | $ | 19.26 | | | $ | 17.26 | | |
Total return | | | 4.88 | % | | | 9.48 | % | | | 15.68 | % | | | 19.27 | % | |
Ratios to average net assets(b) | |
Total gross expenses | | | 0.64 | % | | | 0.63 | % | | | 0.64 | % | | | 0.65 | %(c) | |
Total net expenses(d) | | | 0.64 | % | | | 0.63 | % | | | 0.64 | % | | | 0.65 | %(c) | |
Net investment income | | | 2.14 | % | | | 3.19 | % | | | 2.41 | % | | | 2.41 | %(c) | |
Supplemental data | |
Net assets, end of period (in thousands) | | $ | 416,310 | | | $ | 313,051 | | | $ | 156,525 | | | $ | 64,986 | | |
Portfolio turnover | | | 25 | % | | | 27 | % | | | 19 | % | | | 24 | % | |
Notes to Financial Highlights
(a) Based on operations from November 8, 2012 (commencement of operations) through the stated period end.
(b) In addition to the fees and expenses that the Fund bears directly, the Fund indirectly bears a pro rata share of the fees and expenses of any other funds in which it invests. Such indirect expenses are not included in the Fund's reported expense ratios.
(c) Annualized.
(d) Total net expenses include the impact of certain fee waivers/expense reimbursements made by the Investment Manager and certain of its affiliates, if applicable.
The accompanying Notes to Financial Statements are an integral part of this statement.
Annual Report 2016
25
COLUMBIA DIVIDEND INCOME FUND
FINANCIAL HIGHLIGHTS (continued)
| | | Year Ended May 31, | | Year Ended
September 30, | |
Class T | | 2016 | | 2015 | | 2014 | | 2013 | | 2012(a) | | 2011 | |
Per share data | |
Net asset value, beginning of period | | $ | 19.07 | | | $ | 19.02 | | | $ | 17.05 | | | $ | 13.96 | | | $ | 12.17 | | | $ | 12.13 | | |
Income from investment operations: | |
Net investment income | | | 0.32 | | | | 0.48 | | | | 0.34 | | | | 0.33 | | | | 0.24 | | | | 0.29 | | |
Net realized and unrealized gain | | | 0.43 | | | | 1.16 | | | | 2.20 | | | | 3.09 | | | | 1.72 | | | | 0.03 | (b) | |
Total from investment operations | | | 0.75 | | | | 1.64 | | | | 2.54 | | | | 3.42 | | | | 1.96 | | | | 0.32 | | |
Less distributions to shareholders: | |
Net investment income | | | (0.45 | ) | | | (0.39 | ) | | | (0.33 | ) | | | (0.33 | ) | | | (0.17 | ) | | | (0.28 | ) | |
Net realized gains | | | (0.94 | ) | | | (1.20 | ) | | | (0.24 | ) | | | — | | | | — | | | | — | | |
Total distributions to shareholders | | | (1.39 | ) | | | (1.59 | ) | | | (0.57 | ) | | | (0.33 | ) | | | (0.17 | ) | | | (0.28 | ) | |
Net asset value, end of period | | $ | 18.43 | | | $ | 19.07 | | | $ | 19.02 | | | $ | 17.05 | | | $ | 13.96 | | | $ | 12.17 | | |
Total return | | | 4.42 | % | | | 9.03 | % | | | 15.19 | % | | | 24.85 | % | | | 16.14 | % | | | 2.51 | % | |
Ratios to average net assets(c) | |
Total gross expenses | | | 1.02 | % | | | 1.04 | % | | | 1.07 | % | | | 1.09 | % | | | 1.11 | %(d) | | | 1.15 | % | |
Total net expenses(e) | | | 1.02 | %(f) | | | 1.04 | %(f) | | | 1.07 | %(f) | | | 1.08 | %(f) | | | 1.05 | %(d) | | | 1.09 | %(f) | |
Net investment income | | | 1.74 | % | | | 2.49 | % | | | 1.92 | % | | | 2.16 | % | | | 2.65 | %(d) | | | 2.18 | % | |
Supplemental data | |
Net assets, end of period (in thousands) | | $ | 75,218 | | | $ | 81,206 | | | $ | 85,511 | | | $ | 84,342 | | | $ | 77,344 | | | $ | 72,421 | | |
Portfolio turnover | | | 25 | % | | | 27 | % | | | 19 | % | | | 24 | % | | | 23 | % | | | 20 | % | |
Notes to Financial Highlights
(a) For the period from October 1, 2011 to May 31, 2012. During the period, the Fund's fiscal year end was changed from September 30 to May 31.
(b) Calculation of the net gain (loss) per share (both realized and unrealized) does not correlate to the aggregate realized and unrealized gain (loss) presented in the Statement of Operations due to the timing of subscriptions and redemptions of Fund shares in relation to fluctuations in the market value of the portfolio.
(c) In addition to the fees and expenses that the Fund bears directly, the Fund indirectly bears a pro rata share of the fees and expenses of any other funds in which it invests. Such indirect expenses are not included in the Fund's reported expense ratios.
(d) Annualized.
(e) Total net expenses include the impact of certain fee waivers/expense reimbursements made by the Investment Manager and certain of its affiliates, if applicable.
(f) The benefits derived from expense reductions had an impact of less than 0.01%.
The accompanying Notes to Financial Statements are an integral part of this statement.
Annual Report 2016
26
COLUMBIA DIVIDEND INCOME FUND
FINANCIAL HIGHLIGHTS (continued)
| | | Year Ended May 31, | | Year Ended
September 30, | |
Class W | | 2016 | | 2015 | | 2014 | | 2013 | | 2012(a) | | 2011 | |
Per share data | |
Net asset value, beginning of period | | $ | 19.06 | | | $ | 19.01 | | | $ | 17.05 | | | $ | 13.96 | | | $ | 12.16 | | | $ | 12.12 | | |
Income from investment operations: | |
Net investment income | | | 0.32 | | | | 0.47 | | | | 0.31 | | | | 0.33 | | | | 0.25 | | | | 0.30 | | |
Net realized and unrealized gain | | | 0.43 | | | | 1.18 | | | | 2.23 | | | | 3.10 | | | | 1.73 | | | | 0.02 | (b) | |
Total from investment operations | | | 0.75 | | | | 1.65 | | | | 2.54 | | | | 3.43 | | | | 1.98 | | | | 0.32 | | |
Less distributions to shareholders: | |
Net investment income | | | (0.45 | ) | | | (0.40 | ) | | | (0.34 | ) | | | (0.34 | ) | | | (0.18 | ) | | | (0.28 | ) | |
Net realized gains | | | (0.94 | ) | | | (1.20 | ) | | | (0.24 | ) | | | — | | | | — | | | | — | | |
Total distributions to shareholders | | | (1.39 | ) | | | (1.60 | ) | | | (0.58 | ) | | | (0.34 | ) | | | (0.18 | ) | | | (0.28 | ) | |
Net asset value, end of period | | $ | 18.42 | | | $ | 19.06 | | | $ | 19.01 | | | $ | 17.05 | | | $ | 13.96 | | | $ | 12.16 | | |
Total return | | | 4.43 | % | | | 9.09 | % | | | 15.21 | % | | | 24.91 | % | | | 16.27 | % | | | 2.57 | % | |
Ratios to average net assets(c) | |
Total gross expenses | | | 1.02 | % | | | 1.02 | % | | | 1.00 | % | | | 1.04 | % | | | 1.05 | %(d) | | | 1.08 | % | |
Total net expenses(e) | | | 1.02 | %(f) | | | 1.02 | %(f) | | | 1.00 | %(f) | | | 1.02 | %(f) | | | 1.00 | %(d) | | | 1.00 | %(f) | |
Net investment income | | | 1.72 | % | | | 2.47 | % | | | 1.75 | % | | | 2.20 | % | | | 2.71 | %(d) | | | 2.28 | % | |
Supplemental data | |
Net assets, end of period (in thousands) | | $ | 98 | | | $ | 164 | | | $ | 193 | | | $ | 9,373 | | | $ | 47,647 | | | $ | 43,525 | | |
Portfolio turnover | | | 25 | % | | | 27 | % | | | 19 | % | | | 24 | % | | | 23 | % | | | 20 | % | |
Notes to Financial Highlights
(a) For the period from October 1, 2011 to May 31, 2012. During the period, the Fund's fiscal year end was changed from September 30 to May 31.
(b) Calculation of the net gain (loss) per share (both realized and unrealized) does not correlate to the aggregate realized and unrealized gain (loss) presented in the Statement of Operations due to the timing of subscriptions and redemptions of Fund shares in relation to fluctuations in the market value of the portfolio.
(c) In addition to the fees and expenses that the Fund bears directly, the Fund indirectly bears a pro rata share of the fees and expenses of any other funds in which it invests. Such indirect expenses are not included in the Fund's reported expense ratios.
(d) Annualized.
(e) Total net expenses include the impact of certain fee waivers/expense reimbursements made by the Investment Manager and certain of its affiliates, if applicable.
(f) The benefits derived from expense reductions had an impact of less than 0.01%.
The accompanying Notes to Financial Statements are an integral part of this statement.
Annual Report 2016
27
COLUMBIA DIVIDEND INCOME FUND
FINANCIAL HIGHLIGHTS (continued)
| | | Year Ended May 31, | |
Class Y | | 2016 | | 2015 | | 2014 | | 2013(a) | |
Per share data | |
Net asset value, beginning of period | | $ | 19.35 | | | $ | 19.27 | | | $ | 17.27 | | | $ | 14.66 | | |
Income from investment operations: | |
Net investment income | | | 0.40 | | | | 0.66 | | | | 0.47 | | | | 0.23 | | |
Net realized and unrealized gain | | | 0.44 | | | | 1.10 | | | | 2.18 | | | | 2.58 | | |
Total from investment operations | | | 0.84 | | | | 1.76 | | | | 2.65 | | | | 2.81 | | |
Less distributions to shareholders: | |
Net investment income | | | (0.53 | ) | | | (0.48 | ) | | | (0.41 | ) | | | (0.20 | ) | |
Net realized gains | | | (0.94 | ) | | | (1.20 | ) | | | (0.24 | ) | | | — | | |
Total distributions to shareholders | | | (1.47 | ) | | | (1.68 | ) | | | (0.65 | ) | | | (0.20 | ) | |
Net asset value, end of period | | $ | 18.72 | | | $ | 19.35 | | | $ | 19.27 | | | $ | 17.27 | | |
Total return | | | 4.87 | % | | | 9.59 | % | | | 15.72 | % | | | 19.29 | % | |
Ratios to average net assets(b) | |
Total gross expenses | | | 0.59 | % | | | 0.59 | % | | | 0.59 | % | | | 0.60 | %(c) | |
Total net expenses(d) | | | 0.59 | % | | | 0.59 | % | | | 0.59 | % | | | 0.60 | %(c) | |
Net investment income | | | 2.19 | % | | | 3.41 | % | | | 2.58 | % | | | 2.49 | %(c) | |
Supplemental data | |
Net assets, end of period (in thousands) | | $ | 228,089 | | | $ | 171,392 | | | $ | 78,674 | | | $ | 1,190 | | |
Portfolio turnover | | | 25 | % | | | 27 | % | | | 19 | % | | | 24 | % | |
Notes to Financial Highlights
(a) Based on operations from November 8, 2012 (commencement of operations) through the stated period end.
(b) In addition to the fees and expenses that the Fund bears directly, the Fund indirectly bears a pro rata share of the fees and expenses of any other funds in which it invests. Such indirect expenses are not included in the Fund's reported expense ratios.
(c) Annualized.
(d) Total net expenses include the impact of certain fee waivers/expense reimbursements made by the Investment Manager and certain of its affiliates, if applicable.
The accompanying Notes to Financial Statements are an integral part of this statement.
Annual Report 2016
28
COLUMBIA DIVIDEND INCOME FUND
FINANCIAL HIGHLIGHTS (continued)
| | | Year Ended May 31, | | Year Ended
September 30, | |
Class Z | | 2016 | | 2015 | | 2014 | | 2013 | | 2012(a) | | 2011 | |
Per share data | |
Net asset value, beginning of period | | $ | 19.09 | | | $ | 19.03 | | | $ | 17.07 | | | $ | 13.97 | | | $ | 12.17 | | | $ | 12.13 | | |
Income from investment operations: | |
Net investment income | | | 0.36 | | | | 0.53 | | | | 0.39 | | | | 0.38 | | | | 0.27 | | | | 0.33 | | |
Net realized and unrealized gain | | | 0.44 | | | | 1.18 | | | | 2.19 | | | | 3.10 | | | | 1.72 | | | | 0.03 | (b) | |
Total from investment operations | | | 0.80 | | | | 1.71 | | | | 2.58 | | | | 3.48 | | | | 1.99 | | | | 0.36 | | |
Less distributions to shareholders: | |
Net investment income | | | (0.50 | ) | | | (0.45 | ) | | | (0.38 | ) | | | (0.38 | ) | | | (0.19 | ) | | | (0.32 | ) | |
Net realized gains | | | (0.94 | ) | | | (1.20 | ) | | | (0.24 | ) | | | — | | | | — | | | | — | | |
Total distributions to shareholders | | | (1.44 | ) | | | (1.65 | ) | | | (0.62 | ) | | | (0.38 | ) | | | (0.19 | ) | | | (0.32 | ) | |
Net asset value, end of period | | $ | 18.45 | | | $ | 19.09 | | | $ | 19.03 | | | $ | 17.07 | | | $ | 13.97 | | | $ | 12.17 | | |
Total return | | | 4.69 | % | | | 9.40 | % | | | 15.46 | % | | | 25.27 | % | | | 16.39 | % | | | 2.82 | % | |
Ratios to average net assets(c) | |
Total gross expenses | | | 0.77 | % | | | 0.77 | % | | | 0.77 | % | | | 0.79 | % | | | 0.80 | %(d) | | | 0.84 | % | |
Total net expenses(e) | | | 0.77 | %(f) | | | 0.77 | %(f) | | | 0.77 | %(f) | | | 0.78 | %(f) | | | 0.75 | %(d) | | | 0.79 | %(f) | |
Net investment income | | | 2.00 | % | | | 2.76 | % | | | 2.22 | % | | | 2.46 | % | | | 2.96 | %(d) | | | 2.48 | % | |
Supplemental data | |
Net assets, end of period (in thousands) | | $ | 4,766,037 | | | $ | 4,800,733 | | | $ | 5,062,852 | | | $ | 4,846,586 | | | $ | 3,396,290 | | | $ | 2,227,757 | | |
Portfolio turnover | | | 25 | % | | | 27 | % | | | 19 | % | | | 24 | % | | | 23 | % | | | 20 | % | |
Notes to Financial Highlights
(a) For the period from October 1, 2011 to May 31, 2012. During the period, the Fund's fiscal year end was changed from September 30 to May 31.
(b) Calculation of the net gain (loss) per share (both realized and unrealized) does not correlate to the aggregate realized and unrealized gain (loss) presented in the Statement of Operations due to the timing of subscriptions and redemptions of Fund shares in relation to fluctuations in the market value of the portfolio.
(c) In addition to the fees and expenses that the Fund bears directly, the Fund indirectly bears a pro rata share of the fees and expenses of any other funds in which it invests. Such indirect expenses are not included in the Fund's reported expense ratios.
(d) Annualized.
(e) Total net expenses include the impact of certain fee waivers/expense reimbursements made by the Investment Manager and certain of its affiliates, if applicable.
(f) The benefits derived from expense reductions had an impact of less than 0.01%.
The accompanying Notes to Financial Statements are an integral part of this statement.
Annual Report 2016
29
COLUMBIA DIVIDEND INCOME FUND
NOTES TO FINANCIAL STATEMENTS
May 31, 2016
Note 1. Organization
Columbia Dividend Income Fund (the Fund), a series of Columbia Funds Series Trust I (the Trust), is a diversified fund. The Trust is registered under the Investment Company Act of 1940, as amended (the 1940 Act), as an open-end management investment company organized as a Massachusetts business trust.
Fund Shares
The Trust may issue an unlimited number of shares (without par value). The Fund offers Class A, Class B, Class C, Class I, Class R, Class R4, Class R5, Class T, Class W, Class Y and Class Z shares. Although all share classes generally have identical voting, dividend and liquidation rights, each share class votes separately when required by the Trust's organizational documents or by law. Different share classes pay different distribution amounts to the extent the expenses of such share classes differ, and distributions in liquidation will be proportional to the net asset value of each share class. Each share class has its own expense and sales charge structure.
Class A shares are subject to a maximum front-end sales charge of 5.75% based on the initial investment amount. Class A shares purchased without an initial sales charge in accounts aggregating $1 million to $50 million at the time of purchase are subject to a contingent deferred sales charge (CDSC) if the shares are sold within 18 months after purchase, charged as follows: 1.00% CDSC if redeemed within 12 months after purchase, and 0.50% CDSC if redeemed more than 12, but less than 18, months after purchase.
Class B shares may be subject to a maximum CDSC of 5.00% based upon the holding period after purchase. Class B shares will generally convert to Class A shares eight years after purchase. The Fund no longer accepts investments by new or existing investors in the Fund's Class B shares, except in connection with the reinvestment of any dividend and/or capital gain distributions in Class B shares of the Fund and exchanges by existing Class B shareholders of certain other funds within the Columbia Family of Funds.
Class C shares are subject to a 1.00% CDSC on shares redeemed within 12 months after purchase.
Class I shares are not subject to sales charges and are available only to the Columbia Family of Funds.
Class R shares are not subject to sales charges and are generally available only to certain retirement plans and other investors as described in the Fund's prospectus.
Class R4 shares are not subject to sales charges and are generally available only to omnibus retirement plans and certain investors as described in the Fund's prospectus.
Class R5 shares are not subject to sales charges and are generally available only to investors purchasing through authorized investment professionals and omnibus retirement plans.
Class T shares are subject to a maximum front-end sales charge of 5.75% based on the investment amount. Class T shares purchased without an initial sales charge in accounts aggregating $1 million to $50 million at the time of purchase are subject to a CDSC if the shares are sold within 18 months after purchase, charged as follows: 1.00% CDSC if redeemed within 12 months after purchase, and 0.50% CDSC if redeemed more than 12, but less than 18, months after purchase. Class T shares are available only to investors who received (and who have continuously held) Class T shares in connection with previous fund reorganizations.
Class W shares are not subject to sales charges and are available only to investors purchasing through authorized investment programs managed by investment professionals, including discretionary managed account programs.
Class Y shares are not subject to sales charges and are generally available only to certain retirement plans as described in the Fund's prospectus.
Class Z shares are not subject to sales charges and are available only to eligible investors, which are subject to different investment minimums as described in the Fund's prospectus.
Note 2. Summary of Significant Accounting Policies
Basis of Preparation
The Fund is an investment company that applies the accounting and reporting guidance in the Financial Accounting Standards Board (FASB) Accounting Standards Codification Topic 946, Financial Services — Investment Companies (ASC 946). The financial statements are prepared in accordance with U.S. generally accepted accounting principles (GAAP), which requires management to make certain estimates and assumptions that affect the reported amounts of assets and liabilities, the disclosure of contingent assets and liabilities at the date of the financial statements and the reported amounts of income and expenses during the reporting period. Actual results could differ from those estimates.
Annual Report 2016
30
COLUMBIA DIVIDEND INCOME FUND
NOTES TO FINANCIAL STATEMENTS (continued)
May 31, 2016
The following is a summary of significant accounting policies followed by the Fund in the preparation of its financial statements.
Security Valuation
All equity securities and exchange-traded funds are valued at the close of business of the New York Stock Exchange (NYSE). Equity securities and exchange-traded funds are valued at the last quoted sales price on the principal exchange or market on which they trade, except for securities traded on the NASDAQ Stock Market, which are valued at the NASDAQ official close price. Unlisted securities or listed securities for which there were no sales during the day are valued at the mean of the latest quoted bid and ask prices on such exchanges or markets.
Foreign equity securities are valued based on the closing price on the foreign exchange in which such securities are primarily traded. If any foreign equity security closing prices are not readily available, the securities are valued at the mean of the latest quoted bid and ask prices on such exchanges or markets. Foreign currency exchange rates are generally determined at 4:00 p.m. Eastern (U.S.) time. Many securities markets and exchanges outside the U.S. close prior to the close of the NYSE; therefore, the closing prices for securities in such markets or on such exchanges may not fully reflect events that occur after such close but before the close of the NYSE. In those situations, foreign securities will be fair valued pursuant to a policy adopted by the Board of Trustees (the Board), including, if available, utilizing a third party pricing service to determine these fair values. The third party pricing service takes into account multiple factors, including, but not limited to, movements in the U.S. securities markets, certain depositary receipts, futures contracts and foreign exchange rates that have occurred subsequent to the close of the foreign exchange or market, to determine a good faith estimate that reasonably reflects the current market conditions as of the close of the NYSE. The fair value of a security is likely to be different from the quoted or published price, if available.
Investments in open-end investment companies, including money market funds, are valued at their latest net asset value.
Investments for which market quotations are not readily available, or that have quotations which management believes are not reflective of market value or reliable, are valued at fair value as determined in good faith under procedures approved by and under the general supervision of the Board. If a security or class of
securities (such as foreign securities) is valued at fair value, such value is likely to be different from the quoted or published price for the security.
The determination of fair value often requires significant judgment. To determine fair value, management may use assumptions including but not limited to future cash flows and estimated risk premiums. Multiple inputs from various sources may be used to determine fair value.
GAAP requires disclosure regarding the inputs and valuation techniques used to measure fair value and any changes in valuation inputs or techniques. In addition, investments shall be disclosed by major category. This information is disclosed following the Fund's Portfolio of Investments.
Security Transactions
Security transactions are accounted for on the trade date. Cost is determined and gains (losses) are based upon the specific identification method for both financial statement and federal income tax purposes.
Income Recognition
Corporate actions and dividend income are generally recorded net of any non-reclaimable tax withholdings, on the ex-dividend date or upon receipt of ex-dividend notification in the case of certain foreign securities.
The Fund may receive distributions from holdings in equity securities, business development companies (BDCs), exchange-traded funds, other regulated investment companies (RICs), and real estate investment trusts (REITs), which report information on the tax character of their distributions annually. These distributions are allocated to dividend income, capital gain and return of capital based on actual information reported. Return of capital is recorded as a reduction of the cost basis of securities held. If the Fund no longer owns the applicable securities, return of capital is recorded as a realized gain. With respect to REITs, to the extent actual information has not yet been reported, estimates for return of capital are made by the Fund's management. Management's estimates are subsequently adjusted when the actual character of the distributions is disclosed by the REITs, which could result in a proportionate change in return of capital to shareholders.
Awards from class action litigation are recorded as a reduction of cost basis if the Fund still owns the applicable securities on the payment date. If the Fund no longer owns the applicable securities, the proceeds are recorded as realized gains.
Annual Report 2016
31
COLUMBIA DIVIDEND INCOME FUND
NOTES TO FINANCIAL STATEMENTS (continued)
May 31, 2016
Expenses
General expenses of the Trust are allocated to the Fund and other funds of the Trust based upon relative net assets or other expense allocation methodologies determined by the nature of the expense. Expenses directly attributable to the Fund are charged to the Fund. Expenses directly attributable to a specific class of shares are charged to that share class.
Determination of Class Net Asset Value
All income, expenses (other than class-specific expenses, which are charged to that share class, as shown in the Statement of Operations) and realized and unrealized gains (losses) are allocated to each class of the Fund on a daily basis, based on the relative net assets of each class, for purposes of determining the net asset value of each class.
Federal Income Tax Status
The Fund intends to qualify each year as a regulated investment company under Subchapter M of the Internal Revenue Code, as amended, and will distribute substantially all of its taxable income (including net short-term capital gains), if any, for its tax year, and as such will not be subject to federal income taxes. In addition, the Fund intends to distribute in each calendar year substantially all of its net investment income, capital gains and certain other amounts, if any, such that the Fund should not be subject to federal excise tax. Therefore, no federal income or excise tax provision is recorded.
Foreign Taxes
The Fund may be subject to foreign taxes on income, gains on investments or currency repatriation, a portion of which may be recoverable. The Fund will accrue such taxes and recoveries, as applicable, based upon its current interpretation of tax rules and regulations that exist in the markets in which it invests.
Realized gains in certain countries may be subject to foreign taxes at the Fund level, based on statutory rates. The Fund accrues for such foreign taxes on realized and unrealized gains at the appropriate rate for each jurisdiction, as applicable. The amount, if any, is disclosed as a liability on the Statement of Assets and Liabilities.
Distributions to Shareholders
Distributions from net investment income, if any, are declared and paid each calendar quarter. Net realized capital gains, if any, are distributed at least annually.
Income distributions and capital gain distributions are determined in accordance with federal income tax regulations, which may differ from GAAP.
Guarantees and Indemnifications
Under the Trust's organizational documents and, in some cases, by contract, its officers and trustees are indemnified against certain liabilities arising out of the performance of their duties to the Trust or its funds. In addition, certain of the Fund's contracts with its service providers contain general indemnification clauses. The Fund's maximum exposure under these arrangements is unknown since the amount of any future claims that may be made against the Fund cannot be determined, and the Fund has no historical basis for predicting the likelihood of any such claims.
Note 3. Fees and Other Transactions with Affiliates
Management Fees
Effective October 1, 2015, the Fund entered into a Management Agreement with Columbia Management Investment Advisers, LLC (the Investment Manager), a wholly-owned subsidiary of Ameriprise Financial, Inc. (Ameriprise Financial). Under the Management Agreement, the Investment Manager provides the Fund with investment research and advice, as well as administrative and accounting services. The management services fee is an annual fee that is equal to a percentage of the Fund's average daily net assets that declines from 0.72% to 0.52% as the Fund's net assets increase. The effective management services fee rate for the year ended May 31, 2016 was 0.57% of the Fund's average daily net assets.
Prior to October 1, 2015, the Fund paid the Investment Manager an annual fee for advisory services under an Investment Management Services Agreement and a separate annual fee for administrative and accounting services under an Administrative Services Agreement. For the period from June 1, 2015 through September 30, 2015, the investment advisory services fee paid to the Investment Manager was $15,277,338, and the administrative services fee paid to the Investment Manager was $1,293,409.
Compensation of Board Members
Board members, who are not officers or employees of the Investment Manager or Ameriprise Financial, are compensated for their services to the Fund as disclosed in the Statement of Operations. These Board members
Annual Report 2016
32
COLUMBIA DIVIDEND INCOME FUND
NOTES TO FINANCIAL STATEMENTS (continued)
May 31, 2016
may participate in a Deferred Compensation Plan (the Plan) which may be terminated at any time. Obligations of the Plan will be paid solely out of the Fund's assets, and all amounts payable under the Plan constitute a general unsecured obligation of the Fund.
Compensation of Chief Compliance Officer
The Board has appointed a Chief Compliance Officer to the Fund in accordance with federal securities regulations. The Fund is allocated a portion of the expenses associated with the Chief Compliance Officer based on relative net assets of the Trust.
Transfer Agency Fees
Under a Transfer and Dividend Disbursing Agent Agreement, Columbia Management Investment Services Corp. (the Transfer Agent), an affiliate of the Investment Manager and a wholly-owned subsidiary of Ameriprise Financial, is responsible for providing transfer agency services to the Fund. The Transfer Agent has contracted with Boston Financial Data Services (BFDS) to serve as sub-transfer agent.
The Transfer Agent receives a monthly transfer agency fee based on the number or the average value of accounts, depending on the type of account. In addition, the Transfer Agent also receives sub-transfer agency fees based on a percentage of the average aggregate value of the Fund's shares maintained in omnibus accounts (other than omnibus accounts for which American Enterprise Investment Services Inc. is the broker of record or accounts where the beneficial shareholder is a customer of Ameriprise Financial Services, Inc., for which the Transfer Agent receives a per account fee). The Transfer Agent pays the fees of BFDS for services as sub-transfer agent and is not entitled to reimbursement for such fees from the Fund (with the exception of out-of-pocket fees).
The Transfer Agent also receives compensation from the Fund for various shareholder services and reimbursements for certain out-of-pocket fees. Total transfer agency fees for Class R5 shares are subject to an annual limitation of not more than 0.05% of the average daily net assets attributable to Class R5 shares. Class I and Class Y shares do not pay transfer agency fees.
For the year ended May 31, 2016, the Fund's effective transfer agency fee rates as a percentage of average daily net assets of each class were as follows:
Class A | | | 0.19 | % | |
Class B | | | 0.19 | | |
Class C | | | 0.19 | | |
Class R | | | 0.19 | | |
Class R4 | | | 0.19 | | |
Class R5 | | | 0.05 | | |
Class T | | | 0.19 | | |
Class W | | | 0.19 | | |
Class Z | | | 0.19 | | |
An annual minimum account balance fee of $20 may apply to certain accounts with a value below the applicable share class's initial minimum investment requirements to reduce the impact of small accounts on transfer agency fees. These minimum account balance fees are remitted to the Fund and recorded as part of expense reductions in the Statement of Operations. For the year ended May 31, 2016, these minimum account balance fees reduced total expenses of the Fund by $3,749.
Distribution and Service Fees
The Fund has an agreement with Columbia Management Investment Distributors, Inc. (the Distributor), an affiliate of the Investment Manager and a wholly-owned subsidiary of Ameriprise Financial, for distribution and shareholder services. The Board has approved, and the Fund has adopted, distribution and shareholder service plans (the Plans) applicable to certain share classes, which set the distribution and service fees for the Fund. These fees are calculated daily and are intended to compensate the Distributor and/or eligible selling and/or servicing agents for selling shares of the Fund and providing services to investors.
Under the Plans, the Fund pays a monthly service fee to the Distributor at the maximum annual rate of 0.25% of the average daily net assets attributable to Class A, Class B, Class C and Class W shares of the Fund. Also under the Plans, the Fund pays a monthly distribution fee to the Distributor at the maximum annual rates of 0.10%, 0.75%, 0.75%, 0.50% and 0.25% of the average daily net assets attributable to Class A, Class B, Class C, Class R and Class W shares of the Fund, respectively.
Annual Report 2016
33
COLUMBIA DIVIDEND INCOME FUND
NOTES TO FINANCIAL STATEMENTS (continued)
May 31, 2016
Although the Fund may pay distribution and service fees up to a maximum annual rate of 0.35% of the Fund's average daily net assets attributable to Class A shares (comprised of up to 0.10% for distribution services and up to 0.25% for shareholder liaison services), the Fund currently limits such fees to an aggregate fee of not more than 0.25% of the Fund's average daily net assets attributable to Class A shares.
Although the Fund may pay a distribution fee up to 0.25% of the Fund's average daily net assets attributable to Class W shares and a service fee of up to 0.25% of the Fund's average daily net assets attributable to Class W shares, the aggregate fee shall not exceed 0.25% of the Fund's average daily net assets attributable to Class W shares.
Shareholder Services Fees
The Fund has adopted a shareholder services plan that permits it to pay for certain services provided to Class T shareholders by their selling and/or servicing agents. The Fund may pay shareholder servicing fees up to an aggregate annual rate of 0.50% of the Fund's average daily net assets attributable to Class T shares (comprised of up to 0.25% for shareholder liaison services and up to 0.25% for administrative support services). These fees are currently limited to an aggregate annual rate of not more than 0.25% of the Fund's average daily net assets attributable to Class T shares. In addition, if the Fund declares dividends on a daily basis, the servicing fee for Class T shares will be waived by selling and/or servicing agents to the extent necessary to prevent the net investment income for Class T shares from falling below 0.00% on a daily basis. The effective shareholder services fee rate for the year ended May 31, 2016 was 0.25% of the Fund's average daily net assets attributable to Class T shares.
Sales Charges
Sales charges, including front-end charges and CDSCs, received by the Distributor for distributing Fund shares were $1,808,504 for Class A, $275 for Class B, $33,493 for Class C and $2,836 for Class T shares for the year ended May 31, 2016.
Expenses Waived/Reimbursed by the Investment Manager and its Affiliates
The Fund's expense ratio is subject to an expense reimbursement arrangement pursuant to which fees will be waived and/or expenses reimbursed (excluding certain fees and expenses described below), so that the Fund's net operating expenses, after giving effect to fees
waived/expenses reimbursed and any balance credits and/or overdraft charges from the Fund's custodian, do not exceed the annual rates of:
| | | Contractual
Expense Cap
October 1, 2015
through
September 30, 2016 | | Voluntary
Expense Cap
Prior to
October 1, 2015 | |
Class A | | | 1.13 | % | | | 1.13 | % | |
Class B | | | 1.88 | | | | 1.88 | | |
Class C | | | 1.88 | | | | 1.88 | | |
Class I | | | 0.74 | | | | 0.75 | | |
Class R | | | 1.38 | | | | 1.38 | | |
Class R4 | | | 0.88 | | | | 0.88 | | |
Class R5 | | | 0.79 | | | | 0.80 | | |
Class T | | | 1.13 | | | | 1.13 | | |
Class W | | | 1.13 | | | | 1.13 | | |
Class Y | | | 0.74 | | | | 0.75 | | |
Class Z | | | 0.88 | | | | 0.88 | | |
The contractual agreement may be modified or amended only with approval from the Investment Manager, certain of its affiliates and the Fund. Under the arrangements, the following fees and expenses are excluded from the waiver/reimbursement commitment, and therefore will be paid by the Fund, if applicable: taxes (including foreign transaction taxes), expenses associated with investments in affiliated and non-affiliated pooled investment vehicles (including mutual funds and exchange-traded funds), transaction costs and brokerage commissions, costs related to any securities lending program, dividend and interest expenses associated with securities sold short, inverse floater program fees and expenses, transaction charges and interest on borrowed money, interest and extraordinary expenses. Any fees waived and/or expenses reimbursed under the expense reimbursement arrangements described above are not recoverable by the Investment Manager or its affiliates in future periods.
Note 4. Federal Tax Information
The timing and character of income and capital gain distributions are determined in accordance with income tax regulations, which may differ from GAAP because of temporary or permanent book to tax differences.
At May 31, 2016, these differences are primarily due to differing treatment for deferral/reversal of wash sale losses, Trustees' deferred compensation, distribution reclassifications and re-characterization of distributions for investments. To the extent these differences are
Annual Report 2016
34
COLUMBIA DIVIDEND INCOME FUND
NOTES TO FINANCIAL STATEMENTS (continued)
May 31, 2016
permanent, reclassifications are made among the components of the Fund's net assets in the Statement of Assets and Liabilities. Temporary differences do not require reclassifications.
In the Statement of Assets and Liabilities the following reclassifications were made:
Undistributed net investment income | | $ | (2,093,286 | ) | |
Accumulated net realized gain | | | 2,093,286 | | |
Net investment income (loss) and net realized gains (losses), as disclosed in the Statement of Operations, and net assets were not affected by this reclassification.
The tax character of distributions paid during the years indicated was as follows:
Year Ended May 31, | | 2016 | | 2015 | |
Ordinary income | | $ | 220,439,013 | | | $ | 194,414,908 | | |
Long-term capital gains | | | 416,557,944 | | | | 554,298,637 | | |
Total | | $ | 636,996,957 | | | $ | 748,713,545 | | |
Short-term capital gain distributions, if any, are considered ordinary income distributions for tax purposes.
At May 31, 2016, the components of distributable earnings on a tax basis were as follows:
Undistributed ordinary income | | $ | 22,910,531 | | |
Undistributed long-term capital gains | | | 152,584,165 | | |
Net unrealized appreciation | | | 2,641,551,096 | | |
At May 31, 2016, the cost of investments for federal income tax purposes was $6,472,020,869 and the aggregate gross unrealized appreciation and depreciation based on that cost was:
Unrealized appreciation | | $ | 2,659,750,124 | | |
Unrealized depreciation | | | (18,199,028 | ) | |
Net unrealized appreciation | | $ | 2,641,551,096 | | |
Management of the Fund has concluded that there are no significant uncertain tax positions in the Fund that would require recognition in the financial statements. However, management's conclusion may be subject to review and adjustment at a later date based on factors including, but not limited to, new tax laws, regulations, and administrative interpretations (including relevant court decisions). Generally, the Fund's federal tax returns for the prior three fiscal years remain subject to examination by the Internal Revenue Service.
Note 5. Portfolio Information
The cost of purchases and proceeds from sales of securities, excluding short-term investments and derivatives, if any, aggregated to $2,016,468,368 and $2,328,124,020, respectively, for the year ended May 31, 2016. The amount of purchase and sale activity impacts the portfolio turnover rate reported in the Financial Highlights.
Note 6. Affiliated Money Market Fund
The Fund invests in Columbia Short-Term Cash Fund, an affiliated money market fund established for the exclusive use by the Fund and other affiliated funds. The income earned by the Fund from such investments is included as Dividends — affiliated issuers in the Statement of Operations. As an investing fund, the Fund indirectly bears its proportionate share of the expenses of Columbia Short-Term Cash Fund.
Note 7. Line of Credit
The Fund has access to a revolving credit facility whereby the Fund may borrow for the temporary funding of shareholder redemptions or for other temporary or emergency purposes. Effective December 8, 2015, Citibank, N.A. and HSBC Bank USA, N.A. joined JPMorgan Chase Bank, N.A. (JPMorgan) as lead of a syndicate of banks under the credit facility, which is a collective agreement between the Fund and certain other funds managed by the Investment Manager, severally and not jointly, that permits collective borrowings up to $1 billion. Interest is charged to each participating fund based on its borrowings at a rate equal to the higher of (i) the overnight federal funds rate plus 1.00% or (ii) the one-month LIBOR rate plus 1.00%. Each borrowing under the credit facility matures no later than 60 days after the date of borrowing. The Fund also pays a commitment fee equal to its pro rata share of the amount of the credit facility at a rate of 0.15% per annum. The commitment fee is included in other expenses in the Statement of Operations. Prior to December 8, 2015, JPMorgan was the sole lead bank under the credit facility agreement that permitted borrowings up to $550 million under the same terms and interest rates as described above with the exception of the commitment fee which was charged at a rate of 0.075% per annum.
The Fund had no borrowings during the year ended May 31, 2016.
Annual Report 2016
35
COLUMBIA DIVIDEND INCOME FUND
NOTES TO FINANCIAL STATEMENTS (continued)
May 31, 2016
Note 8. Significant Risks
Shareholder Concentration Risk
At May 31, 2016, two unaffiliated shareholders of record owned 43.4% of the outstanding shares of the Fund in one or more accounts. The Fund has no knowledge about whether any portion of those shares was owned beneficially. Affiliated shareholders of record owned 14.3% of the outstanding shares of the Fund in one or more accounts. Subscription and redemption activity by concentrated accounts may have a significant effect on the operations of the Fund. In the case of a large redemption, the Fund may be forced to sell investments at inopportune times, including its liquid or more liquid positions, resulting in Fund losses and the Fund holding a higher percentage of less liquid or illiquid securities. Large redemptions could result in decreased economies of scale and increased operating expenses for non-redeeming Fund shareholders.
Financial Sector Risk
The Fund may be more susceptible to the particular risks that may affect companies in the financial services sector than if it were invested in a wider variety of companies in unrelated sectors. Companies in the financial services sector are subject to certain risks, including the risk of regulatory change, decreased liquidity in credit markets and unstable interest rates. Such companies may have concentrated portfolios, such as a high level of loans to real estate developers, which makes them vulnerable to economic conditions that affect that industry. Performance of such companies may be affected by competitive pressures and exposure to investments or agreements that, under certain circumstances, may lead to losses (e.g., subprime loans). Companies in the financial services sector are subject to extensive governmental regulation that may limit the amount and types of loans and other financial commitments they can make, and interest rates and fees that they may charge. In addition, profitability of such companies is largely dependent upon the availability and the cost of capital.
Note 9. Subsequent Events
Management has evaluated the events and transactions that have occurred through the date the financial statements were issued and noted no items requiring adjustment of the financial statements or additional disclosure.
Note 10. Information Regarding Pending and Settled Legal Proceedings
In December 2005, without admitting or denying the allegations, American Express Financial Corporation (AEFC, which is now known as Ameriprise Financial, Inc. (Ameriprise Financial)) entered into settlement agreements with the Securities and Exchange Commission (SEC) and Minnesota Department of Commerce (MDOC) related to market timing activities. As a result, AEFC was censured and ordered to cease and desist from committing or causing any violations of certain provisions of the Investment Advisers Act of 1940, the Investment Company Act of 1940, and various Minnesota laws. AEFC agreed to pay disgorgement of $10 million and civil money penalties of $7 million. AEFC also agreed to retain an independent distribution consultant to assist in developing a plan for distribution of all disgorgement and civil penalties ordered by the SEC in accordance with various undertakings detailed at http://www.sec.gov/litigation/admin/ia-2451.pdf. Ameriprise Financial and its affiliates have cooperated with the SEC and the MDOC in these legal proceedings, and have made regular reports to the Funds' Boards of Trustees.
Ameriprise Financial and certain of its affiliates have historically been involved in a number of legal, arbitration and regulatory proceedings, including routine litigation, class actions, and governmental actions, concerning matters arising in connection with the conduct of their business activities. Ameriprise Financial believes that the Funds are not currently the subject of, and that neither Ameriprise Financial nor any of its affiliates are the subject of, any pending legal, arbitration or regulatory proceedings that are likely to have a material adverse effect on the Funds or the ability of Ameriprise Financial or its affiliates to perform under their contracts with the Funds. Ameriprise Financial is required to make quarterly (10-Q), annual (10-K) and, as necessary, 8-K filings with the SEC on legal and regulatory matters that relate to Ameriprise Financial and its affiliates. Copies of these filings may be obtained by accessing the SEC website at www.sec.gov.
There can be no assurance that these matters, or the adverse publicity associated with them, will not result in increased fund redemptions, reduced sale of fund shares or other adverse consequences to the Funds. Further, although we believe proceedings are not likely to have a material adverse effect on the Funds or the ability of Ameriprise Financial or its affiliates to perform under their contracts with the Funds, these proceedings are
Annual Report 2016
36
COLUMBIA DIVIDEND INCOME FUND
NOTES TO FINANCIAL STATEMENTS (continued)
May 31, 2016
subject to uncertainties and, as such, we are unable to estimate the possible loss or range of loss that may result. An adverse outcome in one or more of these proceedings could result in adverse judgments, settlements, fines, penalties or other relief that could have a material adverse effect on the consolidated financial condition or results of operations of Ameriprise Financial.
Annual Report 2016
37
COLUMBIA DIVIDEND INCOME FUND
REPORT OF INDEPENDENT REGISTERED PUBLIC ACCOUNTING FIRM
To the Trustees of Columbia Funds Series Trust I and the Shareholders of
Columbia Dividend Income Fund
In our opinion, the accompanying statement of assets and liabilities, including the portfolio of investments, and the related statements of operations and of changes in net assets and the financial highlights present fairly, in all material respects, the financial position of Columbia Dividend Income Fund (the "Fund", a series of Columbia Funds Series Trust I) at May 31, 2016, and the results of its operations, the changes in its net assets and the financial highlights for each of the periods indicated, in conformity with accounting principles generally accepted in the United States of America. These financial statements and financial highlights (hereafter referred to as "financial statements") are the responsibility of the Fund's management. Our responsibility is to express an opinion on these financial statements based on our audits. We conducted our audits of these financial statements in accordance with the standards of the Public Company Accounting Oversight Board (United States). Those standards require that we plan and perform the audit to obtain reasonable assurance about whether the financial statements are free of material misstatement. An audit includes examining, on a test basis, evidence supporting the amounts and disclosures in the financial statements, assessing the accounting principles used and significant estimates made by management, and evaluating the overall financial statement presentation. We believe that our audits, which included confirmation of securities at May 31, 2016 by correspondence with the custodian, brokers and transfer agent, and the application of alternative auditing procedures where such confirmations had not been received, provide a reasonable basis for our opinion.
PricewaterhouseCoopers LLP
Minneapolis, MN
July 25, 2016
Annual Report 2016
38
COLUMBIA DIVIDEND INCOME FUND
FEDERAL INCOME TAX INFORMATION
(Unaudited)
The Fund hereby designates the following tax attributes for the fiscal year ended May 31, 2016. Shareholders will be notified in early 2017 of the amounts for use in preparing 2016 income tax returns.
Tax Designations
Qualified Dividend Income | | | 100.00 | % | |
Dividends Received Deduction | | | 100.00 | % | |
Capital Gain Dividend | | $ | 219,621,398 | | |
Qualified Dividend Income. For taxable, non-corporate shareholders, the percentage of ordinary income distributed during the fiscal year that represents qualified dividend income subject to reduced tax rates.
Dividends Received Deduction. The percentage of ordinary income distributed during the fiscal year that qualifies for the corporate dividends received deduction.
Capital Gain Dividend. The Fund designates as a capital gain dividend the amount reflected above, or if subsequently determined to be different, the net capital gain of such fiscal period.
Annual Report 2016
39
COLUMBIA DIVIDEND INCOME FUND
Shareholders elect the Board that oversees the Fund's operations. The Board appoints officers who are responsible for day-to-day business decisions based on policies set by the Board. The following table provides basic biographical information about the Fund's Trustees, including their principal occupations during the past five years, although specific titles for individuals may have varied over the period. The year set forth beneath Length of Service in the table below is the year in which the Trustee was first appointed or elected as Trustee to any Fund currently in the Columbia Funds Complex or a predecessor thereof. Under current Board policy, members serve terms of indefinite duration.
Trustees
Independent Trustees
Name,
Address,
Year of Birth | | Position Held With
the Trust and Length of
Service | | Principal Occupation(s)
During the Past Five Years
and Other Relevant
Professional Experience | | Number of
Funds in the
Columbia Funds
Complex
Overseen | | Other Directorships
Held by Trustee During
the Past Five Years | |
Janet Langford Carrig
c/o Columbia
Management Investment Advisers, LLC,
225 Franklin Street
Mail Drop BX32 05228,
Boston, MA 02110
1957 | | Trustee 1996 | | Senior Vice President, General Counsel and Corporate Secretary, ConocoPhillips (integrated energy company) since September 2007 | | | 57 | | | None | |
Douglas A. Hacker
c/o Columbia Management Investment Advisers, LLC,
225 Franklin Street
Mail Drop BX32 05228,
Boston, MA 02110
1955 | | Trustee and Chairman of the Board 1996 | | Independent business executive since May 2006; Executive Vice President — Strategy of United Airlines from December 2002 to May 2006; President of UAL Loyalty Services (airline marketing company) from September 2001 to December 2002; Executive Vice President and Chief Financial Officer of United Airlines from July 1999 to September 2001 | | | 57 | | | Spartan Nash Company (food distributor); Nash Finch Company (food distributor) from 2005 to 2013; Aircastle Limited (aircraft leasing); SeaCube Container Leasing Ltd. (container leasing) from 2010 to 2013; and Travelport Worldwide Limited (travel information technology) | |
Nancy T. Lukitsh
c/o Columbia Management Investment Advisers, LLC,
225 Franklin Street
Mail Drop BX32 05228,
Boston, MA 02110
1956 | | Trustee 2011 | | Senior Vice President, Partner and Director of Marketing, Wellington Management Company, LLP (investment adviser) from 1997 to 2010; Chair, Wellington Management Portfolios (commingled non-U.S. investment pools) from 2007 to 2010; Director, Wellington Trust Company, NA and other Wellington affiliates from 1997 to 2010 | | | 57 | | | None | |
Annual Report 2016
40
COLUMBIA DIVIDEND INCOME FUND
TRUSTEES AND OFFICERS (continued)
Independent Trustees (continued)
Name,
Address,
Year of Birth | | Position Held With
the Trust and Length of
Service | | Principal Occupation(s)
During the Past Five Years
and Other Relevant
Professional Experience | | Number of
Funds in the
Columbia Funds
Complex
Overseen | | Other Directorships
Held by Trustee During
the Past Five Years | |
William E. Mayer
c/o Columbia Management Investment Advisers, LLC,
225 Franklin Street
Mail Drop BX32 05228,
Boston, MA 02110
1940 | | Trustee 1991 | | Partner, Park Avenue Equity Partners (private equity) since February 1999 | | | 57 | | | DynaVox Inc. (speech creation); Lee Enterprises (print media); WR Hambrecht + Co. (financial service provider) from 2000 to 2012; BlackRock Capital Investment Corporation (investment company); and Premier, Inc. (healthcare) | |
David M. Moffett
c/o Columbia Management Investment Advisers, LLC,
225 Franklin Street
Mail Drop BX32 05228,
Boston, MA 02110
1952 | | Trustee 2011 | | Retired. Consultant to Bridgewater and Associates | | | 57 | | | Director of CIT Bank, CIT Group Inc. (commercial and consumer finance); eBay Inc. (online trading community); Genworth Financial, Inc. (financial and insurance products and services); Paypal Holdings Inc. (payment and data processing services); and Trustee University of Oklahoma Foundation | |
Charles R. Nelson
c/o Columbia Management Investment Advisers, LLC,
225 Franklin Street
Mail Drop BX32 05228,
Boston, MA 02110
1942 | | Trustee 1981 | | Retired. Professor Emeritus, University of Washington since 2011; Professor of Economics, University of Washington from 1976 to 2011; Ford and Louisa Van Voorhis Professor of Political Economy, University of Washington from 1993 to 2011; Adjunct Professor of Statistics, University of Washington from 1980 to 2011; Associate Editor, Journal of Money, Credit and Banking from September 1993 to 2008; consultant on econometric and statistical matters | | | 57 | | | None | |
John J. Neuhauser
c/o Columbia Management Investment Advisers, LLC,
225 Franklin Street
Mail Drop BX32 05228,
Boston, MA 02110
1943 | | Trustee 1984 | | President, Saint Michael's College since August 2007; Director or Trustee of several non-profit organizations, including University of Vermont Medical Center; Academic Vice President and Dean of Faculties, Boston College from August 1999 to October 2005; University Professor, Boston College from November 2005 to August 2007 | | | 57 | | | Liberty All-Star Equity Fund and Liberty All-Star Growth Fund (closed-end funds) | |
Annual Report 2016
41
COLUMBIA DIVIDEND INCOME FUND
TRUSTEES AND OFFICERS (continued)
Independent Trustees (continued)
Name,
Address,
Year of Birth | | Position Held With
the Trust and Length of
Service | | Principal Occupation(s)
During the Past Five Years
and Other Relevant
Professional Experience | | Number of
Funds in the
Columbia Funds
Complex
Overseen | | Other Directorships
Held by Trustee During
the Past Five Years | |
Patrick J. Simpson
c/o Columbia Management Investment Advisers, LLC,
225 Franklin Street
Mail Drop BX32 05228,
Boston, MA 02110
1944 | | Trustee 2000 | | Of Counsel, Perkins Coie LLP (law firm) since 2015; Partner, Perkins Coie LLP from 1988 to 2014 | | | 57 | | | None | |
Anne-Lee Verville
c/o Columbia Management Investment Advisers, LLC,
225 Franklin Street
Mail Drop BX32 05228,
Boston, MA 02110
1945 | | Trustee 1998 | | Retired. General Manager, Global Education Industry from 1994 to 1997, President — Application Systems Division from 1991 to 1994, Chief Financial Officer — US Marketing & Services from 1988 to 1991, and Chief Information Officer from 1987 to 1988, IBM Corporation (computer and technology) | | | 57 | | | Enesco Group, Inc. (producer of giftware and home and garden decor products) from 2001 to 2006 | |
Consultant to the Trustees*
Name,
Address,
Year of Birth | | Position Held With
the Trust and Length of
Service | | Principal Occupation(s)
During the Past Five Years
and Other Relevant
Professional Experience | | Number of
Funds in the
Columbia Funds
Complex
Overseen | | Other Directorships
Held by Trustee During
the Past Five Years | |
J. Kevin Connaughton
c/o Columbia
Management Investment Advisers, LLC,
225 Franklin Street
Mail Drop BX32 05228,
Boston, MA 02110
1964 | | Trustee Consultant 2016 | | Trustee Consultant, Columbia Funds since March 2016; Managing Director and General Manager of Mutual Fund Products, Columbia Management Investment Advisers, LLC from May 2010 to February 2015; President, Columbia Funds from 2009 to 2015; and senior officer of Columbia Funds and affiliated funds from 2003 to 2015 | | | 57 | | | Board of Governors, Gateway Healthcare since January 2016; Trustee, New Century Portfolios since March 2015; and Director, The Autism Project since March 2015 | |
* J. Kevin Connaughton was appointed consultant to the Trustees effective March 1, 2016. Shareholders of the Funds are expected to be asked to elect Mr. Connaughton as a Trustee at a future shareholder meeting.
Annual Report 2016
42
COLUMBIA DIVIDEND INCOME FUND
TRUSTEES AND OFFICERS (continued)
Interested Trustee Affiliated with Investment Manager*
Name,
Address,
Year of Birth | | Position Held With
the Trust and Length of
Service | | Principal Occupation(s)
During the Past Five Years
and Other Relevant
Professional Experience | | Number of
Funds in the
Columbia Funds
Complex
Overseen | | Other Directorships
Held by Trustee During
the Past Five Years | |
William F. Truscott
c/o Columbia Management Investment Advisers, LLC,
225 Franklin Street
Boston, MA 02110
1960 | | Trustee 2012 | | Chairman of the Board and President, Columbia Management Investment Advisers, LLC since May 2010 and February 2012, respectively; Chief Executive Officer, Global Asset Management, Ameriprise Financial, Inc. since September 2012 (previously Chief Executive Officer, U.S. Asset Management & President, Annuities, May 2010- September 2012); Director and Chief Executive Officer, Columbia Management Investment Distributors, Inc. since May 2010 and February 2012, respectively; Chairman of the Board and Chief Executive Officer, RiverSource Distributors, Inc. since 2006; Director, Threadneedle Asset Management Holdings, SARL since 2014; President and Chief Executive Officer, Ameriprise Certificate Company, 2006-August 2012. | | | 176 | | | Chairman of the Board, Columbia Management Investment Advisers, LLC since May 2010; Director, Columbia Management Investment Distributors, Inc. since May 2010; Former Director, Ameriprise Certificate Company, 2006-January 2013 | |
* Interested person (as defined under the 1940 Act) by reason of being an officer, director, security holder and/or employee of the Investment Manager or Ameriprise Financial.
The Statement of Additional Information has additional information about the Fund's Board members and is available, without charge, upon request by calling 800.345.6611; contacting your financial intermediary; or visiting columbiathreadneedle.com/us.
Annual Report 2016
43
COLUMBIA DIVIDEND INCOME FUND
TRUSTEES AND OFFICERS (continued)
The Board has appointed officers who are responsible for day-to-day business decisions based on policies it has established. The officers serve at the pleasure of the Board. The following table provides basic information about the Officers of the Fund, including principal occupations during the past five years, although their specific titles may have varied over the period. In addition to Mr. Truscott, who is Senior Vice President, the Fund's other officers are:
Fund Officers
Name,
Address and
Year of Birth | | Position and Year
First Appointed to
Position for any Fund
in the Columbia
Funds Complex or a
Predecessor Thereof | |
Principal Occupation(s) During Past Five Years | |
Christopher O. Petersen
5228 Ameriprise Financial Center
Minneapolis, MN 55474
Born 1970 | | President and Principal Executive Officer (2015) | | Vice President and Lead Chief Counsel, Ameriprise Financial, Inc. since January 2015 (previously, Vice President and Chief Counsel January 2010-December 2014; officer of Columbia Funds and affiliated funds since 2007. | |
Michael G. Clarke
225 Franklin Street
Boston, MA 02110
Born 1969 | | Treasurer (2011), Chief Financial Officer (2009) and Chief Accounting Officer (2015) | | Vice President — Mutual Fund Administration, Columbia Management Investment Advisers, LLC, since May 2010; senior officer of Columbia Funds and affiliated funds since 2002. | |
Paul B. Goucher
100 Park Avenue
New York, NY 10017
Born 1968 | | Senior Vice President (2011), Chief Legal Officer (2015) and Assistant Secretary (2008) | | Vice President and Lead Chief Counsel, Ameriprise Financial, Inc. since November 2008 and January 2013, respectively (previously Chief Counsel, January 2010-January 2013); Vice President, Chief Legal Officer and Assistant Secretary, Columbia Management Investment Advisers, LLC since May 2010. | |
Thomas P. McGuire
225 Franklin Street
Boston, MA 02110
Born 1972 | | Senior Vice President and Chief Compliance Officer (2012) | | Vice President — Asset Management Compliance, Ameriprise Financial, Inc., since May 2010; Chief Compliance Officer, Ameriprise Certificate Company since September 2010. | |
Colin Moore
225 Franklin Street
Boston, MA 02110
Born 1958 | | Senior Vice President (2010) | | Executive Vice President and Global Chief Investment Officer, Ameriprise Financial, Inc., since July 2013; Executive Vice President and Global Chief Investment Officer, Columbia Management Investment Advisers, LLC since July 2013 (previously Director and Global Chief Investment Officer, 2010-2013). | |
Michael E. DeFao
225 Franklin Street
Boston, MA 02110
Born 1968 | | Vice President (2011) and Assistant Secretary (2010) | | Vice President and Chief Counsel, Ameriprise Financial, Inc. since May 2010. | |
Amy Johnson
5228 Ameriprise Financial Center
Minneapolis, MN 55474
Born 1965 | | Vice President (2006) | | Managing Director and Global Head of Operations, Columbia Management Investment Advisers, LLC since April 2016 (previously Managing Director and Chief Operating Officer, 2010-2016). | |
Lyn Kephart-Strong
5228 Ameriprise
Financial Center
Minneapolis, MN 55474
Born 1960 | | Vice President (2015) | | President, Columbia Management Investment Services Corp. since October 2014; Vice President & Resolution Officer, Ameriprise Trust Company since August 2009. | |
Ryan C. Larrenaga
225 Franklin Street
Boston, MA 02110
Born 1970 | | Vice President and Secretary (2015) | | Vice President and Group Counsel, Ameriprise Financial, Inc. since August 2011 (previously, Counsel from May 2010 to August 2011); officer of Columbia Funds and affiliated funds since 2005. | |
Annual Report 2016
44
COLUMBIA DIVIDEND INCOME FUND
IMPORTANT INFORMATION ABOUT THIS REPORT
Each fund mails one shareholder report to each shareholder address. If you would like more than one report, please call shareholder services at 800.345.6611 and additional reports will be sent to you.
The policy of the Board is to vote the proxies of the companies in which each fund holds investments consistent with the procedures as stated in the Statement of Additional Information (SAI). You may obtain a copy of the SAI without charge by calling 800.345.6611; contacting your financial intermediary; visiting columbiathreadneedle.com/us; or searching the website of the Securities and Exchange Commission (SEC) at sec.gov. Information regarding how each fund voted proxies relating to portfolio securities is filed with the SEC by August 31st for the most recent 12-month period ending June 30th of that year, and is available without charge by visiting columbiathreadneedle.com/us, or searching the website of the SEC at sec.gov.
Each fund files a complete schedule of portfolio holdings with the SEC for the first and third quarters of each fiscal year on Form N-Q. Each fund's Form N-Q is available on the SEC's website at sec.gov and may be reviewed and copied at the SEC's Public Reference Room in Washington, D.C. Information on the operation of the Public Reference Room may be obtained by calling 800.SEC.0330. Each fund's complete schedule of portfolio holdings, as filed on Form N-Q, can also be obtained without charge, upon request, by calling 800.345.6611.
Annual Report 2016
45
Columbia Dividend Income Fund
P.O. Box 8081
Boston, MA 02266-8081

This information is for use with concurrent or prior delivery of a fund prospectus. Please read and consider the investment objectives, risks, charges and expenses for any fund carefully before investing. For a prospectus and summary prospectus, which contains this and other important information about the Fund, go to columbiathreadneedle.com/us. The Fund is distributed by Columbia Management Investment Distributors, Inc., member FINRA, and managed by Columbia Management Investment Advisers, LLC.
Columbia Threadneedle Investments (Columbia Threadneedle) is the global brand name of the Columbia and Threadneedle group of companies.
All rights reserved. Columbia Management Investment Distributors, Inc., 225 Franklin Street, Boston, MA 02110-2804
© 2016 Columbia Management Investment Advisers, LLC.
columbiathreadneedle.com/us
ANN139_05_F01_(07/16)
Item 2. Code of Ethics.
(a) The registrant has adopted a code of ethics that applies to the registrant’s principal executive officer, principal financial officer, principal accounting officer or controller, or persons performing similar functions, regardless of whether these individuals are employed by the registrant or a third party.
(b) During the period covered by this report, there were not any amendments to a provision of the code of ethics adopted in 2(a) above.
(c) During the period covered by this report, there were no waivers, including any implicit waivers, from a provision of the code of ethics described in 2(a) above that relates to one or more of the items set forth in paragraph (b) of this item’s instructions.
Item 3. Audit Committee Financial Expert.
The registrant’s Board of Trustees has determined that Douglas A. Hacker, David M. Moffett and Anne-Lee Verville, each of whom are members of the registrant’s Board of Trustees and Audit Committee, each qualify as an audit committee financial expert. Mr. Hacker, Mr. Moffett and Ms. Verville are each independent trustees, as defined in paragraph (a)(2) of this item’s instructions.
Item 4. Principal Accountant Fees and Services.
Fee information below is disclosed for the five series of the registrant whose reports to stockholders are included in this annual filing. One series liquidated on November 23, 2015 and the fees incurred by this series through its liquidation date are included in the response to this Item.
(a) Audit Fees. Aggregate Audit Fees billed by the principal accountant for professional services rendered during the fiscal years ended May 31, 2016 and May 31, 2015 are approximately as follows:
2016 | | 2015 | |
$ | 167,700 | | $ | 151,000 | |
| | | | | |
Audit Fees include amounts related to the audit of the registrant’s annual financial statements or services that are normally provided by the accountant in connection with statutory and regulatory filings or engagements for those fiscal years.
(b) Audit-Related Fees. Aggregate Audit-Related Fees billed to the registrant by the principal accountant for professional services rendered during the fiscal years ended May 31, 2016 and May 31, 2015 are approximately as follows:
Audit-Related Fees include amounts for assurance and related services by the principal accountant that are reasonably related to the performance of the audit of the registrant’s financial statements and are not reported in Audit Fees above. In fiscal years 2016 and 2015, Audit-Related Fees consist of agreed-upon procedures performed for semi-annual shareholder reports.
During the fiscal years ended May 31, 2016 and May 31, 2015, there were no Audit-Related Fees billed by the registrant’s principal accountant to the registrant’s investment adviser (not including any sub-adviser whose role is primarily portfolio management and is subcontracted with or overseen by another investment adviser) and any entity controlling, controlled by, or under common control with the adviser that provides ongoing services to the registrant for an engagement that related directly to the operations and financial reporting of the registrant.
(c) Tax Fees. Aggregate Tax Fees billed by the principal accountant to the registrant for professional services rendered during the fiscal years ended May 31, 2016 and May 31, 2015 are approximately as follows:
2016 | | 2015 | |
$ | 30,600 | | $ | 14,300 | |
| | | | | |
Tax Fees include amounts for the review of annual tax returns, the review of required shareholder distribution calculations and typically include amounts for professional services by the principal accountant for tax compliance, tax advice and tax planning.
During the fiscal years ended May 31, 2016 and May 31, 2015, there were no Tax Fees billed by the registrant’s principal accountant to the registrant’s investment adviser (not including any sub-adviser whose role is primarily portfolio management and is subcontracted with or overseen by another investment adviser) and any entity controlling, controlled by, or under common control with the adviser that provides ongoing services to the registrant for an engagement that related directly to the operations and financial reporting of the registrant.
(d) All Other Fees. Aggregate All Other Fees billed by the principal accountant to the registrant for professional services rendered during the fiscal years ended May 31, 2016 and May 31, 2015 are approximately as follows:
All Other Fees include amounts for products and services provided by the principal accountant, other than the services reported in paragraphs (a) through (c) above.
Aggregate All Other Fees billed by the registrant’s principal accountant to the registrant’s investment adviser (not including any sub-adviser whose role is primarily portfolio management and is subcontracted with or overseen by another investment adviser) and any entity controlling, controlled by, or under common control with the adviser that provides ongoing services to the registrant for an engagement that related directly to the operations and financial reporting of the registrant during the fiscal years ended May 31, 2016 and May 31, 2015 are approximately as follows:
2016 | | 2015 | |
$ | 335,000 | | $ | 115,000 | |
| | | | | |
In fiscal years 2016 and 2015, All Other Fees primarily consists of fees billed for internal control examinations of the registrant’s transfer agent and investment adviser.
(e)(1) Audit Committee Pre-Approval Policies and Procedures
The registrant’s Audit Committee is required to pre-approve the engagement of the registrant’s independent auditors to provide audit and non-audit services to the registrant and non-audit services to its investment adviser (excluding any sub-adviser whose role is primarily portfolio management and is sub-contracted or overseen by another investment adviser (the “Adviser”) or any entity controlling, controlled by or under common control with the Adviser that provides ongoing services to the Fund (a “Control Affiliate”) if the engagement relates directly to the operations and financial reporting of the registrant.
The Audit Committee has adopted a Policy for Engagement of Independent Auditors for Audit and Non-Audit Services (the “Policy”). The Policy sets forth the understanding of the Audit Committee regarding the engagement of the registrant’s independent accountants to provide (i) audit and permissible audit-related, tax and other services to the registrant (“Fund Services”); (ii) non-audit services to the registrant’s Adviser and any Control Affiliates, that relates directly to the operations and financial reporting of a Fund (“Fund-related Adviser Services”); and (iii) certain other audit and non-audit services to the registrant’s Adviser and its Control Affiliates. A service will require specific pre-approval by the Audit Committee if it is to be provided by the Fund’s independent auditor; provided, however, that pre-approval of non-audit services to the Fund, the Adviser or Control Affiliates may be waived if certain de minimis requirements set forth in the SEC’s rules are met.
Under the Policy, the Audit Committee may delegate pre-approval authority to any pre-designated member or members who are independent board members. The member(s) to whom such authority is delegated must report, for informational purposes only, any pre-approval decisions to the Audit Committee at its next regular meeting. The Audit Committee’s responsibilities with respect to the pre-approval of services performed by the independent auditor may not be delegated to management.
On an annual basis, at a regularly scheduled Audit Committee meeting, the Fund’s Treasurer or other Fund officer shall submit to the Audit Committee a schedule of the types of Fund Services and Fund-related Adviser Services that are subject to specific pre-approval. This schedule will provide a description of each type of service that is subject to specific pre-approval, along with total projected fees for each service. The pre-approval will generally cover a one-year period. The Audit Committee will review and approve the types of services and the projected fees for the next one-year period and may add to, or subtract from, the list of pre-approved services from time to time, based on subsequent determinations. This specific approval acknowledges that the Audit Committee is in agreement with the specific types of services that the independent auditor will be permitted to perform and the projected fees for each service.
The Fund’s Treasurer or other Fund officer shall report to the Audit Committee at each of its regular meetings regarding all Fund Services or Fund-related Adviser Services provided since the last such report was rendered, including a description of the services, by category, with forecasted fees for the annual reporting period, proposed changes requiring specific pre-approval and a description of services provided by the independent auditor, by category, with actual fees during the current reporting period.
*****
(e)(2) 100% of the services performed for items (b) through (d) above during 2016 and 2015 were pre-approved by the registrant’s Audit Committee.
(f) Not applicable.
(g) The aggregate non-audit fees billed by the registrant’s accountant for services rendered to the registrant, and rendered to the registrant’s investment adviser (not including any sub-adviser whose role is primarily portfolio management and is subcontracted with or overseen by another investment adviser), and any entity controlling, controlled by, or under common control with the adviser that provides ongoing services to the registrant during the fiscal years ended May 31, 2016 and May 31, 2015 are approximately as follows:
2016 | | 2015 | |
$ | 367,600 | | $ | 130,500 | |
| | | | | |
(h) The registrant’s Audit Committee of the Board of Directors has considered whether the provision of non-audit services that were rendered to the registrant’s adviser (not including any sub-adviser whose role is primarily portfolio management and is
subcontracted with or overseen by another investment adviser), and any entity controlling, controlled by, or under common control with the investment adviser that provides ongoing services to the registrant that were not pre-approved pursuant to paragraph (c)(7)(ii) of Rule 2-01 of Regulation S-X, is compatible with maintaining the principal accountant’s independence.
Item 5. Audit Committee of Listed Registrants.
Not applicable.
Item 6. Investments
(a) The registrant’s “Schedule I — Investments in securities of unaffiliated issuers” (as set forth in 17 CFR 210.12-12) is included in Item 1 of this Form N-CSR.
(b) Not applicable.
Item 7. Disclosure of Proxy Voting Policies and Procedures for Closed-End Management Investment Companies.
Not applicable.
Item 8. Portfolio Managers of Closed-End Management Investment Companies.
Not applicable.
Item 9. Purchases of Equity Securities by Closed-End Management Investment Company and Affiliated Purchasers.
Not applicable.
Item 10. Submission of Matters to a Vote of Security Holders.
There were no material changes to the procedures by which shareholders may recommend nominees to the registrant’s board of directors.
Item 11. Controls and Procedures.
(a) The registrant’s principal executive officer and principal financial officers, based on their evaluation of the registrant’s disclosure controls and procedures as of a date within 90 days of the filing of this report, have concluded that such controls and procedures are adequately designed to ensure that material information required to be disclosed by the registrant in Form N-CSR is accumulated and communicated to the registrant’s management, including the principal executive officer and principal financial officer, or persons performing similar functions, as appropriate to allow timely decisions regarding required disclosure.
(b) There was no change in the registrant’s internal control over financial reporting that occurred during the registrant’s second fiscal quarter of the period covered by this report that has materially affected, or is reasonably likely to materially affect, the registrant’s internal control over financial reporting.
Item 12. Exhibits.
(a)(1) Code of ethics required to be disclosed under Item 2 of Form N-CSR attached hereto as Exhibit 99.CODE ETH.
(a)(2) Certifications pursuant to Rule 30a-2(a) under the Investment Company Act of 1940 (17 CFR 270.30a-2(a)) attached hereto as Exhibit 99.CERT.
(a)(3) Not applicable.
(b) Certification pursuant to Rule 30a-2(b) under the Investment Company Act of 1940 (17 CFR 270.30a-2(b)) attached hereto as Exhibit 99.906CERT.
SIGNATURES
Pursuant to the requirements of the Securities Exchange Act of 1934 and the Investment Company Act of 1940, the registrant has duly caused this report to be signed on its behalf by the undersigned, thereunto duly authorized.
(registrant) | | Columbia Funds Series Trust I |
|
|
By (Signature and Title) | /s/ Christopher O. Petersen |
| Christopher O. Petersen, President and Principal Executive Officer |
|
|
Date | | July 26, 2016 |
| |
Pursuant to the requirements of the Securities Exchange Act of 1934 and the Investment Company Act of 1940, this report has been signed below by the following persons on behalf of the registrant and in the capacities and on the dates indicated. |
| |
By (Signature and Title) | /s/ Christopher O. Petersen |
| Christopher O. Petersen, President and Principal Executive Officer |
|
|
Date | | July 26, 2016 |
|
|
By (Signature and Title) | /s/ Michael G. Clarke |
| Michael G. Clarke, Treasurer and Chief Financial Officer |
|
|
Date | | July 26, 2016 |
| | | | | |